UNITED STATES
SECURITIES AND EXCHANGE COMMISSION
Washington, D.C. 20549
FORM N-CSR
CERTIFIED SHAREHOLDER REPORT OF REGISTERED
MANAGEMENT INVESTMENT COMPANIES
Investment Company Act file number 811-4008
Fidelity Investment Trust
(Exact name of registrant as specified in charter)
82 Devonshire St., Boston, Massachusetts 02109
(Address of principal executive offices) (Zip code)
Scott C. Goebel, Secretary
82 Devonshire St.
Boston, Massachusetts 02109
(Name and address of agent for service)
Registrant's telephone number, including area code: 617-563-7000
Date of fiscal year end: | October 31 |
| |
Date of reporting period: | October 31, 2011 |
Item 1. Reports to Stockholders
Fidelity's
Broadly Diversified International Equity
Funds
Fidelity® Diversified International Fund
Fidelity International Capital Appreciation Fund
Fidelity Overseas Fund
Fidelity Worldwide Fund
Annual Report
October 31, 2011

Contents
Annual Report
To view a fund's proxy voting guidelines and proxy voting record for the 12-month period ended June 30, visit http://www.fidelity.com/proxyvotingresults or visit the Securities and Exchange Commission's (SEC) web site at http://www.sec.gov. You may also call 1-800-544-8544 to request a free copy of the proxy voting guidelines.
Standard & Poor's, S&P and S&P 500 are registered service marks of The McGraw-Hill Companies, Inc. and have been licensed for use by Fidelity Distributors Corporation.
Other third party marks appearing herein are the property of their respective owners.
All other marks appearing herein are registered or unregistered trademarks or service marks of FMR LLC or an affiliated company.
This report and the financial statements contained herein are submitted for the general information of the shareholders of the funds. This report is not authorized for distribution to prospective investors in the funds unless preceded or accompanied by an effective prospectus.
A fund files its complete schedule of portfolio holdings with the SEC for the first and third quarters of each fiscal year on Form N-Q. Forms N-Q are available on the SEC's web site at http://www.sec.gov. A fund's Forms N-Q may be reviewed and copied at the SEC's Public Reference Room in Washington, DC. Information regarding the operation of the SEC's Public Reference Room may be obtained by calling 1-800-SEC-0330. For a complete list of a fund's portfolio holdings, view the most recent holdings listing, semiannual report, or annual report on Fidelity's web site at http://www.fidelity.com, http://www.advisor.fidelity.com, or http://www.401k.com, as applicable.
NOT FDIC INSURED • MAY LOSE VALUE • NO BANK GUARANTEE
Neither the funds nor Fidelity Distributors Corporation is a bank.
Annual Report
(The Acting Chairman's photo appears here.)
Dear Shareholder:
Global equity markets began the fourth quarter on a strong note, sharply reversing course in October amid strong corporate earnings, better-than-expected economic news and the promise of a resolution to the sovereign debt crisis in Europe. The mini rally followed a third quarter marked by a significant downturn in July and August, which heightened investor anxiety and set off a wave of volatility that hampered most major asset classes through the end of September. Financial markets are difficult to predict, of course, but you can help put the odds in your favor by following these time-tested investment principles.
One of the basic tenets is to invest according to your time horizon. For long-term investors, riding out the markets' inevitable ups and downs has proven much more effective than making decisions based on short-term developments. If your goal is approaching, you can also benefit from patience and restraint, rather than attempting to time the market. No matter your time horizon, missing only a few of the markets' best days can significantly diminish returns. Patience also affords the benefits of compounding - earning interest on additional income or reinvested dividends and capital gains. While staying the course doesn't eliminate risk, it can considerably lessen the negative impact of short-term downturns.
Asset allocation is another principle to manage risk. As you spread your portfolio among the asset classes, be sure to consider your time horizon, risk tolerance and investment objectives. Younger investors may be better served by emphasizing equities, which historically have been the best-performing asset class over time. Investors who are nearing a specific goal, such as retirement or sending a child to college, may choose to favor bonds and other investments that have tended to be more stable. Studies indicate that asset allocation is the single most important determinant of a portfolio's long-term success. After deciding on a suitable allocation strategy, make sure your portfolio is adequately diversified, with exposure to stocks of small-, mid- and large-cap companies in a range of sectors, for example. And today, more than ever, geographic diversification should be taken into account.
Lastly, investing a certain amount of money on a regular basis - a principle known as dollar-cost averaging - can help lower the average cost of your purchases, while also giving you the discipline to avoid selling weak performers just prior to an upswing, or chasing a hot performer just before a correction.
We invite you to learn more by visiting us on the Internet, dropping by one of our Investor Centers or calling us by phone. It is our privilege to provide the resources you need to choose investments that are right for you.
Sincerely,
(The Acting Chairman's signature appears here.)
James C. Curvey
Acting Chairman
Annual Report
Fidelity Diversified International Fund
As a shareholder of the Fund, you incur two types of costs: (1) transaction costs, including redemption fees, and (2) ongoing costs, including management fees and other Fund expenses. This Example is intended to help you understand your ongoing costs (in dollars) of investing in the Fund and to compare these costs with the ongoing costs of investing in other mutual funds.
The Example is based on an investment of $1,000 invested at the beginning of the period and held for the entire period (May 1, 2011 to October 31, 2011).
Actual Expenses
The first line of the accompanying table for each class of the Fund provides information about actual account values and actual expenses. You may use the information in this line, together with the amount you invested, to estimate the expenses that you paid over the period. Simply divide your account value by $1,000.00 (for example, an $8,600 account value divided by $1,000.00 = 8.6), then multiply the result by the number in the first line for a class of the Fund under the heading entitled "Expenses Paid During Period" to estimate the expenses you paid on your account during this period. A small balance maintenance fee of $12.00 that is charged once a year may apply for certain accounts with a value of less than $2,000. This fee is not included in the table below. If it was, the estimate of expenses you paid during the period would be higher, and your ending account value lower, by this amount. In addition, the Fund, as a shareholder in the underlying Fidelity Central Funds, will indirectly bear its pro-rata share of the fees and expenses incurred by the underlying Fidelity Central Funds. These fees and expenses are not included in the Fund's annualized expense ratio used to calculate the expense estimate in the table below.
Hypothetical Example for Comparison Purposes
The second line of the accompanying table for each class of the Fund provides information about hypothetical account values and hypothetical expenses based on a Class' actual expense ratio and an assumed rate of return of 5% per year before expenses, which is not the Class' actual return. The hypothetical account values and expenses may not be used to estimate the actual ending account balance or expenses you paid for the period. You may use this information to compare the ongoing costs of investing in the Fund and other funds. To do so, compare this 5% hypothetical example with the 5% hypothetical examples that appear in the shareholder reports of the other funds. A small balance maintenance fee of $12.00 that is charged once a year may apply for certain accounts with a value of less than $2,000. This fee is not included in the table below. If it was, the estimate of expenses you paid during the period would be higher, and your ending account value lower, by this amount. In addition, the Fund, as a shareholder in the underlying Fidelity Central Funds, will indirectly bear its pro-rata share of the fees and expenses incurred by the underlying Fidelity Central Funds. These fees and expenses are not included in the Fund's annualized expense ratio used to calculate the expense estimate in the table below.
Please note that the expenses shown in the table are meant to highlight your ongoing costs only and do not reflect any transaction costs. Therefore, the second line of the table is useful in comparing ongoing costs only, and will not help you determine the relative total costs of owning different funds. In addition, if these transactional costs were included, your costs would have been higher.
| Annualized Expense Ratio | Beginning
Account Value
May 1, 2011 | Ending
Account Value
October 31, 2011 | Expenses Paid
During Period*
May 1, 2011 to October 31, 2011 |
Diversified International | .87% | | | |
Actual | | $ 1,000.00 | $ 836.80 | $ 4.03 |
HypotheticalA | | $ 1,000.00 | $ 1,020.82 | $ 4.43 |
Class K | .70% | | | |
Actual | | $ 1,000.00 | $ 837.70 | $ 3.24 |
HypotheticalA | | $ 1,000.00 | $ 1,021.68 | $ 3.57 |
Class F | .64% | | | |
Actual | | $ 1,000.00 | $ 838.00 | $ 2.96 |
HypotheticalA | | $ 1,000.00 | $ 1,021.98 | $ 3.26 |
A 5% return per year before expenses
* Expenses are equal to each Class' annualized expense ratio, multiplied by the average account value over the period, multiplied by 184/365 (to reflect the one-half year period).
Annual Report
Fidelity Diversified International Fund
Performance: The Bottom Line
Average annual total return reflects the change in the value of an investment, assuming reinvestment of the class' distributions from dividend income and capital gains (the profits earned upon the sale of securities that have grown in value, if any) and assuming a constant rate of performance each year. The $10,000 table and the fund's returns do not reflect the deduction of taxes that a shareholder would pay on fund distributions or the redemption of fund shares. During periods of reimbursement by Fidelity, a fund's total return will be greater than it would be had the reimbursement not occurred. How a fund did yesterday is no guarantee of how it will do tomorrow.
Average Annual Total Returns
Periods ended October 31, 2011 | Past 1
year | Past 5
years | Past 10
years |
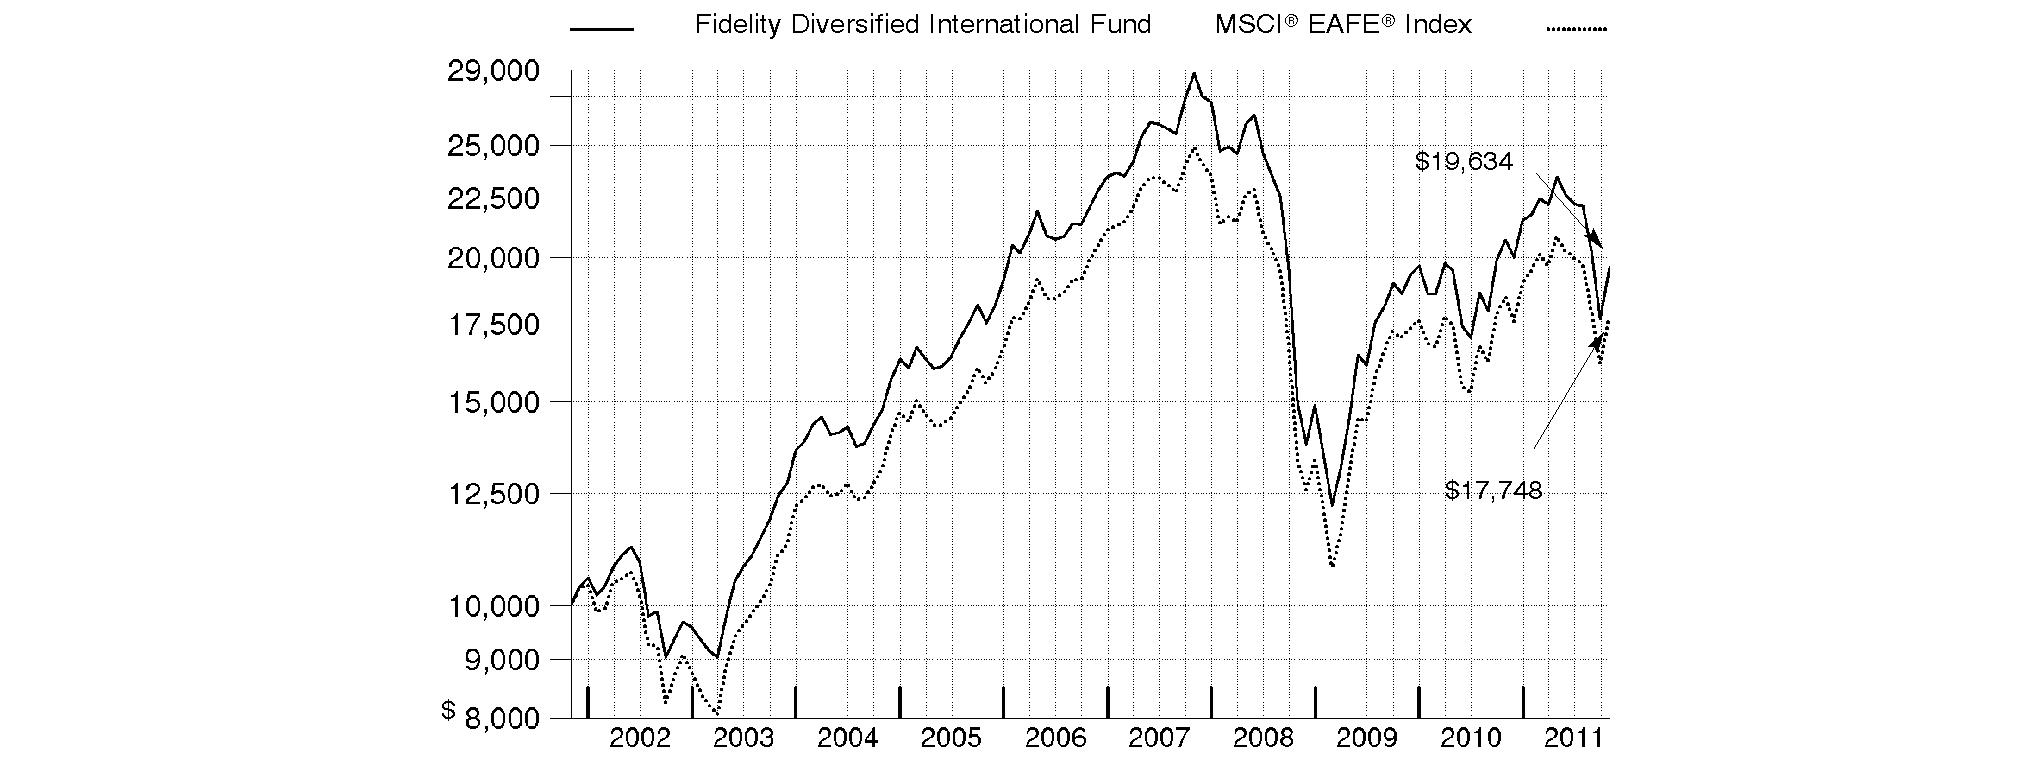
Fidelity® Diversified International Fund | -5.07% | -2.33% | 6.98% |
$10,000 Over 10 Years
Let's say hypothetically that $10,000 was invested in Fidelity® Diversified International Fund, a class of the fund, on October 31, 2001. The chart shows how the value of your investment would have changed, and also shows how the MSCI® EAFE ® (Europe, Australasia, Far East) Index performed over the same period.
Annual Report
Fidelity Diversified International Fund
Market Recap: International equities were rocked by a number of headline events during the year ending October 31, 2011. Stocks posted a solid advance for the first half of the period, despite concern about the sovereign debt crisis in Europe, a devastating earthquake and tsunami in Japan, and political upheaval in the Middle East and North Africa. Sentiment turned decidedly negative in the second half, however, as fresh worries about Europe, inflation in China and a dimmed outlook for global growth caused foreign markets to suffer declines that intensified in August and September. October brought with it yet another dramatic swing, as eurozone policymakers appeared near a resolution to the debt debacle and buyers stormed back onto the scene in search of bargains. Still, those gains - along with favorable currency fluctuations overall - weren't enough to offset prior losses, and the MSCI® ACWI® (All Country World Index) ex USA Index finished the period down 4.56%. Within the MSCI index, Europe and emerging markets suffered the biggest declines, with many countries in these areas sustaining steep losses. By contrast, Japan showed resilience in the wake of its natural disasters, falling only 2%. Australia (+4%), Switzerland (+3%), the U.K. (+2%) and Canada, which produced a nominal return, were among the few major benchmark components to break into positive territory.
Comments from William Bower, Portfolio Manager of Fidelity® Diversified International Fund: For the year, the fund's Retail Class shares returned -5.07%, underperforming the -3.97% return of the MSCI® EAFE® (Europe, Australasia, Far East) Index. Fund performance versus the index was held back by security selection in energy, positioning in consumer staples, stock selection in financials and an underweighting in pharmaceuticals. Geographically, performance was curtailed by stock selection in the Asia-Pacific ex Japan region, China and Canada. Individual detractors included U.K.-based Lloyds Banking Group; out-of-benchmark positions in Canadian energy companies Niko Resources and Petrobank Energy & Resources; and underweighting in Swiss drug company Roche Holding, since sold; Danish beer company Carlsberg; and Italy's Fiat Industrial. On the plus side, the fund benefited from an underweighting in the utilities sector, positioning in consumer discretionary and security selection in technology hardware/equipment. Regionally, positioning in continental Europe helped, as did stock picks in Japan. Top contributors included Japan Tobacco, U.K.-listed Royal Dutch Shell, Japanese online retailer Rakuten, a lack of exposure to index component Tokyo Electric Power and an out-of-benchmark stake in technology giant Apple.
The views expressed above reflect those of the portfolio manager(s) only through the end of the period as stated on the cover of this report and do not necessarily represent the views of Fidelity or any other person in the Fidelity organization. Any such views are subject to change at any time based upon market or other conditions and Fidelity disclaims any responsibility to update such views. These views may not be relied on as investment advice and, because investment decisions for a Fidelity fund are based on numerous factors, may not be relied on as an indication of trading intent on behalf of any Fidelity fund.
Annual Report
Fidelity Diversified International Fund
Investment Changes (Unaudited)
Geographic Diversification (% of fund's net assets) |
As of October 31, 2011 |
 | United Kingdom | 18.1% | |
 | Japan | 13.4% | |
 | Germany | 8.6% | |
 | United States of America | 8.4% | |
 | France | 7.1% | |
 | Canada | 5.6% | |
 | Switzerland | 4.4% | |
 | Australia | 3.6% | |
 | Netherlands | 2.7% | |
 | Other | 28.1% | |

Percentages are adjusted for the effect of futures contracts, if applicable. |
As of April 30, 2011 |
| United Kingdom | 17.6% | |
| Japan | 13.0% | |
| Germany | 8.4% | |
| France | 6.4% | |
| United States of America | 6.2% | |
| Switzerland | 5.4% | |
| Canada | 5.0% | |
| Australia | 3.8% | |
| Spain | 3.4% | |
| Other | 30.8% | |

Percentages are adjusted for the effect of futures contracts, if applicable. |
Asset Allocation |
| % of fund's
net assets | % of fund's net assets
6 months ago |
Stocks | 96.6 | 98.1 |
Short-Term Investments and Net Other Assets | 3.4 | 1.9 |
Top Ten Stocks as of October 31, 2011 |
| % of fund's
net assets | % of fund's net assets
6 months ago |
Royal Dutch Shell PLC Class B sponsored ADR (United Kingdom, Oil, Gas & Consumable Fuels) | 3.0 | 2.4 |
BHP Billiton Ltd. sponsored ADR (Australia, Metals & Mining) | 2.1 | 2.0 |
Novo Nordisk A/S Series B (Denmark, Pharmaceuticals) | 1.8 | 1.7 |
HSBC Holdings PLC sponsored ADR (United Kingdom, Commercial Banks) | 1.7 | 1.6 |
GlaxoSmithKline PLC (United Kingdom, Pharmaceuticals) | 1.6 | 1.1 |
Vodafone Group PLC sponsored ADR (United Kingdom, Wireless Telecommunication Services) | 1.6 | 1.2 |
Nestle SA (Switzerland, Food Products) | 1.4 | 1.1 |
Royal Dutch Shell PLC Class A sponsored ADR (United Kingdom, Oil, Gas & Consumable Fuels) | 1.4 | 1.1 |
ORIX Corp. (Japan, Diversified Financial Services) | 1.3 | 1.1 |
Reckitt Benckiser Group PLC (United Kingdom, Household Products) | 1.3 | 1.3 |
| 17.2 | |
Market Sectors as of October 31, 2011 |
| % of fund's
net assets | % of fund's net assets
6 months ago |
Financials | 15.5 | 20.5 |
Consumer Discretionary | 16.0 | 14.8 |
Energy | 11.4 | 11.3 |
Materials | 10.2 | 11.2 |
Consumer Staples | 10.1 | 6.7 |
Information Technology | 9.8 | 10.3 |
Industrials | 9.1 | 10.8 |
Health Care | 8.2 | 6.2 |
Telecommunication Services | 6.2 | 6.0 |
Utilities | 0.1 | 0.3 |
Annual Report
Fidelity Diversified International Fund
Investments October 31, 2011
Showing Percentage of Net Assets
Common Stocks - 95.1% |
| Shares | | Value |
Australia - 3.6% |
BHP Billiton Ltd. sponsored ADR (d) | 6,896,500 | | $ 538,478,720 |
Fortescue Metals Group Ltd. | 5,712,451 | | 28,695,469 |
Iluka Resources Ltd. | 2,245,282 | | 37,330,693 |
Newcrest Mining Ltd. | 7,469,169 | | 263,999,256 |
Paladin Energy Ltd. (Australia) (a) | 401,613 | | 613,372 |
QBE Insurance Group Ltd. | 2,851,820 | | 43,902,034 |
WorleyParsons Ltd. | 503,041 | | 14,602,027 |
TOTAL AUSTRALIA | | 927,621,571 |
Austria - 0.0% |
Osterreichische Elektrizitatswirtschafts AG | 6,000 | | 174,662 |
Bailiwick of Guernsey - 1.2% |
Amdocs Ltd. (a) | 1,849,800 | | 55,530,996 |
Ashmore Global Opportunities Ltd. (United Kingdom) | 767,088 | | 8,512,053 |
Resolution Ltd. | 52,410,500 | | 231,788,056 |
TOTAL BAILIWICK OF GUERNSEY | | 295,831,105 |
Bailiwick of Jersey - 1.9% |
Experian PLC | 14,652,572 | | 190,988,377 |
Randgold Resources Ltd. sponsored ADR | 855,700 | | 93,759,049 |
Shire PLC | 2,847,600 | | 89,390,276 |
WPP PLC | 11,475,509 | | 118,805,910 |
TOTAL BAILIWICK OF JERSEY | | 492,943,612 |
Belgium - 1.0% |
Anheuser-Busch InBev SA NV | 4,421,964 | | 245,260,547 |
Anheuser-Busch InBev SA NV (strip VVPR) (a) | 5,339,200 | | 7,389 |
TOTAL BELGIUM | | 245,267,936 |
Bermuda - 1.1% |
ARA Asset Management Ltd. | 693,000 | | 717,641 |
Assured Guaranty Ltd. | 3,044,700 | | 38,789,478 |
Cafe de Coral Holdings Ltd. | 314,000 | | 708,589 |
CNPC (Hong Kong) Ltd. | 17,870,000 | | 25,031,989 |
Huabao International Holdings Ltd. | 40,906,000 | | 25,985,857 |
Kosmos Energy Ltd. | 1,876,800 | | 29,090,400 |
Li & Fung Ltd. | 47,910,000 | | 92,331,883 |
Noble Group Ltd. | 62,626,000 | | 76,438,883 |
Pacific Basin Shipping Ltd. | 1,535,000 | | 699,915 |
Vtech Holdings Ltd. | 62,200 | | 580,780 |
TOTAL BERMUDA | | 290,375,415 |
Brazil - 2.0% |
All America Latina Logistica SA | 87,300 | | 434,670 |
Anhanguera Educacional Participacoes SA | 2,049,500 | | 30,136,196 |
Banco Bradesco SA | 111,400 | | 1,621,826 |
Banco Bradesco SA (PN) sponsored ADR | 3,400,000 | | 61,880,000 |
BM&F Bovespa SA | 181,100 | | 1,080,989 |
|
| Shares | | Value |
Droga Raia SA | 386,000 | | $ 5,473,503 |
Drogasil SA | 4,673,900 | | 29,395,598 |
Estacio Participacoes SA | 1,989,165 | | 23,213,875 |
Fleury SA | 46,700 | | 588,781 |
Hypermarcas SA | 96,700 | | 520,328 |
Itau Unibanco Banco Multiplo SA sponsored ADR | 6,775,800 | | 129,553,296 |
Klabin SA (PN) (non-vtg.) | 193,000 | | 710,319 |
Kroton Educacional SA unit (a) | 1,279,200 | | 14,302,725 |
Multiplus SA | 63,000 | | 1,063,941 |
Qualicorp SA | 3,366,000 | | 30,774,633 |
Souza Cruz Industria Comerico | 5,151,200 | | 63,175,094 |
T4F Entretenimento SA | 2,091,900 | | 14,618,449 |
Telefonica Brasil SA sponsored ADR (a) | 2,600,955 | | 75,479,714 |
Tractebel Energia SA | 1,917,200 | | 30,702,888 |
Usinas Siderurgicas de Minas Gerais SA - Usiminas (PN-A) (non-vtg.) | 80,000 | | 549,732 |
Valid Solucoes SA | 69,260 | | 830,862 |
Weg SA | 71,000 | | 787,649 |
Wilson Sons Ltd. unit | 57,500 | | 813,679 |
TOTAL BRAZIL | | 517,708,747 |
British Virgin Islands - 0.3% |
Arcos Dorados Holdings, Inc. | 1,737,100 | | 40,648,140 |
Camelot Information Systems, Inc. ADR (a)(d) | 1,840,603 | | 6,000,366 |
Mail.ru Group Ltd. GDR (Reg. S) | 1,065,100 | | 36,692,695 |
TOTAL BRITISH VIRGIN ISLANDS | | 83,341,201 |
Canada - 5.6% |
Agnico-Eagle Mines Ltd. (Canada) | 1,250,000 | | 54,220,796 |
Barrick Gold Corp. | 800,000 | | 39,492,401 |
Canadian Natural Resources Ltd. | 5,118,800 | | 180,545,727 |
Fairfax Financial Holdings Ltd. (sub. vtg.) | 170,000 | | 71,057,732 |
Goldcorp, Inc. | 1,859,800 | | 90,485,329 |
InterOil Corp. (a)(d) | 274,600 | | 13,046,246 |
Ivanhoe Mines Ltd. (a) | 3,235,460 | | 66,211,952 |
Niko Resources Ltd. | 2,237,500 | | 123,069,795 |
Open Text Corp. (a) | 1,440,400 | | 88,156,497 |
Osisko Mining Corp. (a) | 2,890,000 | | 34,847,570 |
Painted Pony Petroleum Ltd. (a)(f)(e) | 2,485,600 | | 30,395,209 |
Painted Pony Petroleum Ltd. Class A (a)(e) | 3,643,370 | | 44,553,022 |
Penn West Petroleum Ltd. | 754,400 | | 13,478,321 |
Petrobank Energy & Resources Ltd. | 5,356,000 | | 48,195,135 |
Petrominerales Ltd. | 3,121,175 | | 82,346,293 |
Potash Corp. of Saskatchewan, Inc. (d) | 2,589,500 | | 122,558,670 |
Silver Wheaton Corp. | 669,800 | | 23,127,367 |
Suncor Energy, Inc. | 2,661,700 | | 84,776,019 |
Talisman Energy, Inc. | 6,846,400 | | 97,114,005 |
Tourmaline Oil Corp. (a) | 1,440,000 | | 47,872,398 |
Tourmaline Oil Corp. (a)(f) | 310,100 | | 10,309,188 |
Common Stocks - continued |
| Shares | | Value |
Canada - continued |
Uranium One, Inc. | 11,314,400 | | $ 34,050,459 |
Valeant Pharmaceuticals International, Inc. (Canada) | 700,000 | | 27,639,063 |
TOTAL CANADA | | 1,427,549,194 |
Cayman Islands - 0.7% |
Boer Power Holdings Ltd. | 2,826,000 | | 1,037,408 |
China Automation Group Ltd. | 5,475,000 | | 1,900,663 |
China Lodging Group Ltd. ADR (a) | 50,100 | | 778,053 |
China ZhengTong Auto Services Holdings Ltd. | 24,761,500 | | 26,812,069 |
Geely Automobile Holdings Ltd. | 34,550,000 | | 8,833,647 |
Hengan International Group Co. Ltd. | 9,258,000 | | 80,251,579 |
HiSoft Technology International Ltd. ADR (a)(d) | 1,726,400 | | 21,372,832 |
Hutchison China Meditech Ltd. (a) | 124,800 | | 597,092 |
Mindray Medical International Ltd. sponsored ADR (d) | 48,000 | | 1,310,400 |
Minth Group Ltd. | 8,036,000 | | 8,337,881 |
NVC Lighting Holdings Ltd. | 41,380,000 | | 17,966,892 |
Samson Holding Ltd. | 6,041,000 | | 617,660 |
Sands China Ltd. (a) | 4,816,800 | | 14,475,389 |
SITC International Holdings Co. Ltd. | 2,881,000 | | 744,165 |
Xingda International Holdings Ltd. | 1,472,000 | | 843,327 |
Xueda Education Group sponsored ADR | 177,700 | | 589,964 |
TOTAL CAYMAN ISLANDS | | 186,469,021 |
Chile - 0.0% |
Compania Cervecerias Unidas SA sponsored ADR | 23,000 | | 1,317,440 |
Embotelladora Andina SA sponsored ADR | 40,000 | | 1,140,000 |
Empresa Nacional de Telecomunicaciones SA (ENTEL) | 48,876 | | 967,644 |
Inversiones Aguas Metropolitanas SA | 871,222 | | 1,369,203 |
Isapre CruzBlanca SA (a) | 868,719 | | 824,481 |
Quinenco SA | 363,717 | | 1,028,162 |
Sonda SA | 228,248 | | 557,168 |
TOTAL CHILE | | 7,204,098 |
China - 1.0% |
Baidu.com, Inc. sponsored ADR (a)(d) | 1,375,500 | | 192,817,590 |
Changsha Zoomlion Heavy Industry Science & Technology Development Co. Ltd. (H Shares) | 25,167,480 | | 36,411,889 |
China Bluechemical Ltd. (H shares) | 938,000 | | 735,046 |
China Communications Services Corp. Ltd. (H Shares) | 2,208,000 | | 1,018,299 |
China Construction Bank Corp. (H Shares) | 1,408,000 | | 1,034,507 |
Comba Telecom Systems Holdings Ltd. | 865,500 | | 730,793 |
|
| Shares | | Value |
Shandong Weigao Group Medical Polymer Co. Ltd. (H Shares) | 20,692,000 | | $ 21,505,759 |
SINA Corp. (a)(d) | 150,000 | | 12,193,500 |
TOTAL CHINA | | 266,447,383 |
Colombia - 0.0% |
Ecopetrol SA ADR | 18,000 | | 765,720 |
Curacao - 0.6% |
Schlumberger Ltd. | 2,104,800 | | 154,639,656 |
Denmark - 2.6% |
Carlsberg A/S Series B | 1,542,600 | | 105,006,110 |
Novo Nordisk A/S Series B | 4,408,339 | | 468,091,658 |
William Demant Holding A/S (a) | 1,096,698 | | 87,503,314 |
TOTAL DENMARK | | 660,601,082 |
Egypt - 0.0% |
Commercial International Bank Ltd. | 134,400 | | 598,985 |
JUHAYNA Food Industries (a) | 682,600 | | 558,111 |
TOTAL EGYPT | | 1,157,096 |
Finland - 0.1% |
Nokian Tyres PLC | 439,253 | | 16,139,273 |
France - 7.1% |
Alstom SA | 3,024,896 | | 113,444,762 |
Arkema SA | 345,300 | | 23,623,042 |
Atos Origin SA | 365,000 | | 17,689,425 |
AXA SA | 5,053,600 | | 82,315,579 |
BNP Paribas SA | 4,498,836 | | 204,522,102 |
Bureau Veritas SA | 493,400 | | 38,387,930 |
Danone | 2,707,950 | | 188,500,861 |
Dassault Aviation SA (d) | 36,265 | | 34,930,245 |
Essilor International SA | 1,754,728 | | 127,246,488 |
JC Decaux SA (a) | 990,200 | | 26,536,591 |
LVMH Moet Hennessy - Louis Vuitton | 1,827,964 | | 304,198,757 |
PPR SA | 2,051,100 | | 320,468,603 |
Publicis Groupe SA | 1,225,000 | | 59,394,047 |
Sanofi-aventis | 3,684,720 | | 263,639,409 |
TOTAL FRANCE | | 1,804,897,841 |
Germany - 7.1% |
adidas AG | 1,561,780 | | 110,574,530 |
Allianz AG | 827,462 | | 92,995,574 |
BASF AG | 2,293,559 | | 168,828,055 |
Bayer AG | 1,939,962 | | 124,288,808 |
Bayerische Motoren Werke AG (BMW) | 570,895 | | 46,661,038 |
Deutsche Boerse AG | 961,100 | | 53,202,652 |
ElringKlinger AG | 777,428 | | 21,549,929 |
Fresenius Medical Care AG & Co. KGaA | 2,737,800 | | 199,465,891 |
Fresenius SE | 2,037,100 | | 201,033,066 |
GFK AG | 1,496,500 | | 69,171,612 |
Infineon Technologies AG | 2,825,300 | | 25,527,951 |
Kabel Deutschland Holding AG (a) | 917,600 | | 52,394,698 |
Linde AG | 1,228,429 | | 195,417,632 |
Common Stocks - continued |
| Shares | | Value |
Germany - continued |
SAP AG | 2,904,790 | | $ 175,672,049 |
Siemens AG sponsored ADR (d) | 2,686,500 | | 282,001,905 |
TOTAL GERMANY | | 1,818,785,390 |
Hong Kong - 1.1% |
AIA Group Ltd. | 27,220,800 | | 83,234,101 |
China Everbright Ltd. | 470,000 | | 696,819 |
China Insurance International Holdings Co. Ltd. (a) | 314,800 | | 682,663 |
China Mobile (Hong Kong) Ltd. sponsored ADR | 1,335,275 | | 63,505,679 |
China Resources Enterprise Ltd. | 3,626,000 | | 13,242,327 |
Henderson Land Development Co. Ltd. | 9,664,155 | | 52,824,551 |
Hopewell Holdings Ltd. | 367,500 | | 954,394 |
Swire Pacific Ltd. (A Shares) | 4,577,000 | | 52,889,821 |
Television Broadcasts Ltd. | 184,000 | | 1,060,283 |
TOTAL HONG KONG | | 269,090,638 |
India - 2.2% |
Axis Bank Ltd. | 1,472,751 | | 34,807,954 |
Bajaj Auto Ltd. | 793,148 | | 28,053,344 |
Bharti Airtel Ltd. | 9,007,984 | | 72,142,424 |
Cipla Ltd. | 152,766 | | 923,047 |
CMC Ltd. | 50,598 | | 839,811 |
Cummins India Ltd. | 598,043 | | 4,879,115 |
Deccan Chronicle Holdings Ltd. (a) | 502,904 | | 531,886 |
Dr. Reddy's Laboratories Ltd. | 164,145 | | 5,561,788 |
HDFC Bank Ltd. | 12,995,695 | | 129,605,356 |
Housing Development Finance Corp. Ltd. | 6,539,994 | | 92,036,217 |
India Cements Ltd. | 419,168 | | 687,050 |
Indian Bank | 129,270 | | 572,409 |
Infrastructure Development Finance Co. Ltd. | 11,744,307 | | 31,706,496 |
ITC Ltd. | 5,213,498 | | 22,739,475 |
Jyothy Laboratories Ltd. | 196,188 | | 574,273 |
Lupin Ltd. | 513,210 | | 4,938,001 |
Mahindra & Mahindra Financial Services Ltd. | 2,226,876 | | 30,619,486 |
Max India Ltd. (a) | 159,846 | | 618,828 |
Piramal Healthcare Ltd. | 82,278 | | 606,698 |
Punjab National Bank | 47,106 | | 959,620 |
Redington India Ltd. | 285,486 | | 555,235 |
Shriram Transport Finance Co. Ltd. | 2,327,613 | | 29,139,567 |
State Bank of India | 1,273,075 | | 49,517,031 |
Tulip Telecom Ltd. | 216,760 | | 667,397 |
Wipro Ltd. | 1,388,041 | | 10,415,154 |
TOTAL INDIA | | 553,697,662 |
Ireland - 0.5% |
Accenture PLC Class A | 842,000 | | 50,738,920 |
|
| Shares | | Value |
CRH PLC | 2,294,300 | | $ 41,420,472 |
Elan Corp. PLC sponsored ADR (a) | 2,547,800 | | 30,548,122 |
TOTAL IRELAND | | 122,707,514 |
Italy - 1.8% |
ENI SpA | 914,500 | | 20,216,952 |
Fiat Industrial SpA (a) | 22,427,792 | | 195,693,464 |
Prada SpA | 7,151,000 | | 35,350,634 |
Saipem SpA | 4,438,007 | | 198,992,956 |
TOTAL ITALY | | 450,254,006 |
Japan - 13.4% |
ABC-Mart, Inc. | 1,300,200 | | 50,924,779 |
Aozora Bank Ltd. | 15,351,000 | | 38,812,684 |
Calbee, Inc. (d) | 1,161,000 | | 52,932,917 |
Denso Corp. | 1,928,200 | | 59,306,047 |
Dentsu, Inc. | 2,233,900 | | 67,271,842 |
Don Quijote Co. Ltd. | 1,603,200 | | 58,734,504 |
Fanuc Corp. | 849,100 | | 137,308,760 |
Hitachi Ltd. | 46,637,000 | | 249,926,411 |
Honda Motor Co. Ltd. | 7,721,500 | | 230,931,326 |
Hoya Corp. | 2,535,400 | | 55,397,394 |
Itochu Corp. | 13,063,600 | | 129,221,379 |
Japan Retail Fund Investment Corp. | 3,741 | | 5,791,709 |
Japan Tobacco, Inc. | 64,874 | | 324,292,254 |
JSR Corp. | 3,621,700 | | 69,147,467 |
KDDI Corp. | 27,429 | | 200,952,920 |
Keyence Corp. | 661,100 | | 168,080,270 |
Mitsubishi Corp. | 3,128,000 | | 64,341,694 |
Mitsubishi UFJ Financial Group, Inc. | 18,434,600 | | 80,125,863 |
Mitsui & Co. Ltd. | 3,506,800 | | 51,186,625 |
Nitori Holdings Co. Ltd. | 468,050 | | 44,768,217 |
NTT DoCoMo, Inc. | 63,713 | | 113,171,495 |
ORIX Corp. | 3,924,320 | | 342,539,945 |
OSAKA Titanium technologies Co. Ltd. | 120,200 | | 6,621,404 |
Rakuten, Inc. | 232,855 | | 255,296,560 |
Seven & i Holdings Co., Ltd. | 4,070,900 | | 108,648,886 |
Shimadzu Corp. | 1,668,000 | | 14,201,899 |
SHIMANO, Inc. | 1,088,100 | | 53,791,901 |
SMC Corp. | 814,700 | | 126,736,052 |
SOFTBANK CORP. | 4,765,000 | | 154,670,897 |
Sumitomo Mitsui Financial Group, Inc. | 970,800 | | 27,138,812 |
Yahoo! Japan Corp. | 268,168 | | 86,135,853 |
TOTAL JAPAN | | 3,428,408,766 |
Korea (South) - 2.1% |
Amorepacific Corp. | 90,308 | | 101,831,595 |
BS Financial Group, Inc. (a) | 84,020 | | 921,277 |
Korea Plant Service & Engineering Co. Ltd. | 23,570 | | 643,352 |
LG Corp. | 22,235 | | 1,296,413 |
LG Household & Health Care Ltd. | 59,158 | | 26,618,232 |
MegaStudy Co. Ltd. | 5,266 | | 580,249 |
Common Stocks - continued |
| Shares | | Value |
Korea (South) - continued |
NHN Corp. (a) | 518,772 | | $ 107,822,858 |
Orion Corp. | 134,404 | | 71,836,677 |
S1 Corp. | 20,993 | | 1,088,469 |
Samchully Co. Ltd. | 8,166 | | 701,699 |
Samsung Electronics Co. Ltd. | 199,807 | | 171,364,442 |
Shinhan Financial Group Co. Ltd. | 1,389,720 | | 55,155,939 |
Shinsegae Co. Ltd. | 2,714 | | 680,024 |
Sindoh Co. Ltd. | 11,340 | | 505,997 |
TOTAL KOREA (SOUTH) | | 541,047,223 |
Luxembourg - 0.3% |
Brait SA | 322,500 | | 772,085 |
Millicom International Cellular SA (depositary receipt) | 6,700 | | 738,387 |
Samsonite International SA | 26,313,700 | | 42,814,701 |
Ternium SA sponsored ADR | 1,411,261 | | 34,632,345 |
TOTAL LUXEMBOURG | | 78,957,518 |
Malaysia - 0.0% |
Parkson Holdings Bhd | 563,574 | | 1,023,070 |
Mexico - 0.8% |
America Movil SAB de CV Series L sponsored ADR | 3,033,400 | | 77,109,028 |
Grupo Televisa SA de CV (CPO) sponsored ADR | 2,180,600 | | 46,512,198 |
Urbi, Desarrollos Urbanos, SA de CV (a) | 422,300 | | 536,746 |
Wal-Mart de Mexico SA de CV Series V | 34,518,200 | | 89,171,013 |
TOTAL MEXICO | | 213,328,985 |
Netherlands - 2.7% |
AEGON NV (a) | 27,466,400 | | 131,004,746 |
ASML Holding NV (Netherlands) | 1,332,700 | | 55,913,481 |
Gemalto NV | 1,476,891 | | 67,386,376 |
ING Groep NV sponsored ADR (a)(d) | 19,501,500 | | 168,492,960 |
Koninklijke KPN NV | 10,983,331 | | 144,337,603 |
Koninklijke Philips Electronics NV (depositary receipt) (NY Reg.) | 4,051,300 | | 84,469,605 |
Unilever NV (Certificaten Van Aandelen) (Bearer) unit | 767,500 | | 26,500,744 |
Yandex NV | 450,000 | | 12,384,000 |
TOTAL NETHERLANDS | | 690,489,515 |
Norway - 1.5% |
DnB NOR ASA | 9,071,909 | | 105,830,248 |
Storebrand ASA (A Shares) | 4,980,000 | | 30,706,840 |
Telenor ASA | 14,310,000 | | 255,480,638 |
TOTAL NORWAY | | 392,017,726 |
Papua New Guinea - 0.0% |
Oil Search Ltd. | 140,611 | | 959,368 |
Philippines - 0.0% |
Banco de Oro Universal Bank | 677,000 | | 893,986 |
|
| Shares | | Value |
Manila Water Co., Inc. | 2,331,300 | | $ 1,060,800 |
Universal Robina Corp. | 899,000 | | 991,040 |
TOTAL PHILIPPINES | | 2,945,826 |
Poland - 0.0% |
Eurocash SA | 98,400 | | 788,957 |
Kruk SA (a) | 53,000 | | 706,578 |
Warsaw Stock Exchange | 44,200 | | 624,003 |
TOTAL POLAND | | 2,119,538 |
Qatar - 0.2% |
Commercial Bank of Qatar GDR (Reg. S) | 9,940,628 | | 45,591,071 |
Russia - 0.4% |
Sberbank of Russia | 20,189,400 | | 54,784,535 |
Uralkali JSC GDR (Reg. S) | 939,700 | | 40,782,980 |
TOTAL RUSSIA | | 95,567,515 |
Singapore - 0.0% |
Global Logistic Properties Ltd. | 523,000 | | 727,928 |
South Africa - 0.7% |
African Bank Investments Ltd. | 146,200 | | 634,443 |
AngloGold Ashanti Ltd. | 35,900 | | 1,622,469 |
AngloGold Ashanti Ltd. sponsored ADR | 1,750,000 | | 79,117,500 |
Aveng Ltd. | 120,300 | | 562,369 |
Foschini Ltd. | 1,702,800 | | 21,485,880 |
JSE Ltd. | 74,600 | | 660,621 |
Nampak Ltd. | 191,000 | | 524,653 |
Naspers Ltd. Class N | 860,200 | | 41,186,371 |
Sasol Ltd. | 23,900 | | 1,074,739 |
Shoprite Holdings Ltd. | 1,956,200 | | 28,668,979 |
Tiger Brands Ltd. | 408,600 | | 11,775,123 |
TOTAL SOUTH AFRICA | | 187,313,147 |
Spain - 2.6% |
Banco Bilbao Vizcaya Argentaria SA | 7,048,840 | | 63,448,157 |
Banco Santander SA (Spain) sponsored ADR (d) | 13,562,300 | | 116,093,288 |
Grifols SA ADR (a) | 9,784,300 | | 62,717,363 |
Inditex SA (d) | 3,264,772 | | 297,111,439 |
Prosegur Compania de Seguridad SA (Reg.) | 1,822,600 | | 90,928,776 |
Repsol YPF SA | 1,000,369 | | 30,318,594 |
TOTAL SPAIN | | 660,617,617 |
Sweden - 0.4% |
H&M Hennes & Mauritz AB (B Shares) | 1,292,285 | | 42,795,029 |
Swedbank AB (A Shares) | 4,284,600 | | 60,363,140 |
TOTAL SWEDEN | | 103,158,169 |
Switzerland - 4.4% |
Clariant AG (Reg.) (a) | 4,713,347 | | 51,535,029 |
Kuehne & Nagel International AG | 1,486,880 | | 185,192,848 |
Nestle SA | 6,034,542 | | 350,017,877 |
Noble Corp. | 742,700 | | 26,692,638 |
Partners Group Holding | 49,390 | | 9,258,339 |
Common Stocks - continued |
| Shares | | Value |
Switzerland - continued |
Schindler Holding AG (Reg.) | 1,278,570 | | $ 150,505,705 |
Transocean Ltd. (United States) | 1,650,300 | | 94,314,645 |
UBS AG (a) | 12,243,801 | | 154,783,795 |
Zurich Financial Services AG | 410,659 | | 95,370,411 |
TOTAL SWITZERLAND | | 1,117,671,287 |
Taiwan - 1.0% |
Chroma ATE, Inc. | 295,200 | | 588,987 |
CTCI Corp. | 544,000 | | 692,166 |
Giant Manufacturing Co. Ltd. | 195,000 | | 754,567 |
HTC Corp. | 4,228,000 | | 95,018,182 |
Motech Industries, Inc. | 381,000 | | 715,692 |
Pacific Hospital Supply Co. Ltd. | 219,064 | | 716,843 |
Powertech Technology, Inc. | 288,600 | | 702,614 |
SIMPLO Technology Co. Ltd. | 89,200 | | 524,868 |
St. Shine Optical Co. Ltd. | 53,000 | | 665,803 |
Ta Chong Bank (a) | 3,076,000 | | 885,512 |
Taiwan Fertilizer Co. Ltd. | 3,810,000 | | 9,820,065 |
Taiwan Semiconductor Manufacturing Co. Ltd. | 612,000 | | 1,491,368 |
Taiwan Semiconductor Manufacturing Co. Ltd. sponsored ADR | 10,407,200 | | 131,338,864 |
Unified-President Enterprises Corp. | 7,865,200 | | 10,815,919 |
TOTAL TAIWAN | | 254,731,450 |
Thailand - 0.0% |
Banpu PCL (For. Reg.) | 25,400 | | 515,630 |
Charoen Pokphand Foods PCL (For. Reg.) | 653,400 | | 636,326 |
PTT PCL (For. Reg.) | 93,000 | | 916,177 |
TOTAL THAILAND | | 2,068,133 |
United Arab Emirates - 0.0% |
Dubai Financial Market PJSC (a) | 2,045,195 | | 573,523 |
United Kingdom - 18.1% |
3Legs Resources PLC | 6,373,700 | | 13,837,749 |
Anglo American PLC (United Kingdom) | 3,427,600 | | 126,423,827 |
BG Group PLC | 11,701,879 | | 255,279,216 |
British American Tobacco PLC: | | | |
(United Kingdom) | 85,000 | | 3,898,004 |
sponsored ADR | 1,797,900 | | 165,856,275 |
Burberry Group PLC | 6,074,500 | | 131,002,436 |
Capita Group PLC | 7,638,800 | | 89,248,477 |
Carphone Warehouse Group PLC | 16,014,300 | | 90,397,232 |
Compass Group PLC | 150,000 | | 1,365,362 |
Filtrona PLC | 1,190,508 | | 7,602,777 |
GlaxoSmithKline PLC | 18,595,500 | | 417,404,751 |
HSBC Holdings PLC sponsored ADR | 9,939,900 | | 433,976,034 |
Imperial Tobacco Group PLC | 2,149,970 | | 78,625,409 |
Inchcape PLC | 17,114,619 | | 89,809,932 |
|
| Shares | | Value |
ITV PLC | 62,863,890 | | $ 64,753,082 |
Lloyds Banking Group PLC (a) | 229,626,800 | | 118,767,489 |
Misys PLC | 13,125,310 | | 61,593,504 |
National Grid PLC | 308,000 | | 3,062,719 |
Next PLC | 3,224,800 | | 132,557,312 |
Ocado Group PLC (a)(d) | 9,816,418 | | 14,784,304 |
Pan African Resources PLC | 3,344,300 | | 699,179 |
Pearson PLC | 10,425,200 | | 191,555,485 |
Pz Cussons PLC Class L | 1,957,500 | | 11,584,829 |
QinetiQ Group PLC | 12,165,700 | | 22,851,778 |
Reckitt Benckiser Group PLC | 6,620,100 | | 340,473,304 |
Rockhopper Exploration PLC (a) | 201,600 | | 693,816 |
Rolls-Royce Group PLC | 18,758,100 | | 211,921,603 |
Rolls-Royce Group PLC Class C | 1,294,308,900 | | 2,081,508 |
Royal Dutch Shell PLC: | | | |
Class A (United Kingdom) | 198,500 | | 7,033,114 |
Class A sponsored ADR | 4,900,000 | | 347,459,000 |
Class B sponsored ADR | 10,527,400 | | 755,867,323 |
Standard Chartered PLC (United Kingdom) | 105,587 | | 2,477,455 |
SuperGroup PLC (a)(d) | 1,516,200 | | 15,215,322 |
Vodafone Group PLC sponsored ADR | 14,974,100 | | 416,878,944 |
TOTAL UNITED KINGDOM | | 4,627,038,551 |
United States of America - 5.0% |
Anadarko Petroleum Corp. | 10,800 | | 847,800 |
Apple, Inc. (a) | 654,300 | | 264,847,554 |
CF Industries Holdings, Inc. | 470,800 | | 76,396,716 |
Citigroup, Inc. | 5,105,150 | | 161,271,689 |
Cognizant Technology Solutions Corp. Class A (a) | 658,900 | | 47,934,975 |
Facebook, Inc. Class B (g) | 1,288,142 | | 32,203,550 |
Green Mountain Coffee Roasters, Inc. (a) | 280,100 | | 18,212,102 |
Intuit, Inc. | 321,900 | | 17,276,373 |
Nabors Industries Ltd. (a) | 1,587,600 | | 29,100,708 |
Newmont Mining Corp. | 1,000,000 | | 66,830,000 |
Noble Energy, Inc. | 782,728 | | 69,928,920 |
Polycom, Inc. (a) | 2,900,000 | | 47,937,000 |
PriceSmart, Inc. | 43,700 | | 3,322,948 |
SanDisk Corp. (a) | 2,032,400 | | 102,981,708 |
Schweitzer-Mauduit International, Inc. (e) | 1,608,255 | | 113,092,492 |
The Mosaic Co. | 1,132,300 | | 66,307,488 |
Unisys Corp. (a) | 1,537,730 | | 39,965,603 |
Virgin Media, Inc. | 917,500 | | 22,368,650 |
Wells Fargo & Co. | 4,129,500 | | 106,995,345 |
TOTAL UNITED STATES OF AMERICA | | 1,287,821,621 |
TOTAL COMMON STOCKS (Cost $21,875,227,771) |
24,327,847,370
|
Nonconvertible Preferred Stocks - 1.5% |
| Shares | | Value |
Germany - 1.5% |
ProSiebenSat.1 Media AG | 3,507,000 | | $ 75,226,728 |
Volkswagen AG | 1,736,326 | | 304,687,918 |
TOTAL NONCONVERTIBLE PREFERRED STOCKS (Cost $221,929,530) |
379,914,646
|
Master Notes - 0.0% |
| Principal Amount | | |
Canada - 0.0% |
OZ Optics Ltd. 5% 11/5/14 (g)
(Cost $276,258) | | $ 270,994 | |
270,994
|
Money Market Funds - 6.3% |
| Shares | | |
Fidelity Cash Central Fund, 0.12% (b) | 725,272,617 | | 725,272,617 |
Fidelity Securities Lending Cash Central Fund, 0.11% (b)(c) | 886,536,637 | | 886,536,637 |
TOTAL MONEY MARKET FUNDS (Cost $1,611,809,254) |
1,611,809,254
|
TOTAL INVESTMENT
PORTFOLIO - 102.9% (Cost $23,709,242,813) | 26,319,842,264 |
NET OTHER ASSETS (LIABILITIES) - (2.9)% | (747,943,275) |
NET ASSETS - 100% | $ 25,571,898,989 |
Legend |
(a) Non-income producing |
(b) Affiliated fund that is available only to investment companies and other accounts managed by Fidelity Investments. The rate quoted is the annualized seven-day yield of the fund at period end. A complete unaudited listing of the fund's holdings as of its most recent quarter end is available upon request. In addition, each Fidelity Central Fund's financial statements, which are not covered by the Fund's Report of Independent Registered Public Accounting Firm, are available on the SEC's website or upon request. |
(c) Investment made with cash collateral received from securities on loan. |
(d) Security or a portion of the security is on loan at period end. |
(e) Affiliated company |
(f) Security exempt from registration under Rule 144A of the Securities Act of 1933. These securities may be resold in transactions exempt from registration, normally to qualified institutional buyers. At the end of the period, the value of these securities amounted to $40,704,397 or 0.2% of net assets. |
(g) Restricted securities - Investment in securities not registered under the Securities Act of 1933 (excluding 144A issues). At the end of the period, the value of restricted securities (excluding 144A issues) amounted to $32,474,544 or 0.1% of net assets. |
Additional information on each restricted holding is as follows: |
Security | Acquisition Date | Acquisition Cost |
Facebook, Inc. Class B | 3/31/11 | $ 32,203,550 |
OZ Optics Ltd. 5% 11/5/14 | 11/5/10 | $ 276,258 |
Affiliated Central Funds |
Information regarding fiscal year to date income earned by the Fund from investments in Fidelity Central Funds is as follows: |
Fund | Income earned |
Fidelity Cash Central Fund | $ 1,220,251 |
Fidelity Securities Lending Cash Central Fund | 20,356,167 |
Total | $ 21,576,418 |
Other Affiliated Issuers |
An affiliated company is a company in which the Fund has ownership of at least 5% of the voting securities. Fiscal year to date transactions with companies which are or were affiliates are as follows: |
Affiliate | Value,
beginning of period | Purchases | Sales
Proceeds | Dividend
Income | Value,
end of
period |
Ashmore Global Opportunities Ltd. (United States) | $ - | $ 9,748,350 | $ - | $ 240,285 | $ - |
Painted Pony Petroleum Ltd. | 9,544,006 | 11,945,802 | - | - | 30,395,209 |
Painted Pony Petroleum Ltd. Class A | 21,509,462 | 5,212,327 | - | - | 44,553,022 |
Petrobank Energy & Resources Ltd. | 223,863,859 | - | 1,729,615 | 108,873,999 | - |
Schweitzer-Mauduit International, Inc. | 83,300,121 | 17,267,467 | - | 907,782 | 113,092,492 |
Total | $ 338,217,448 | $ 44,173,946 | $ 1,729,615 | $ 110,022,066 | $ 188,040,723 |
Other Information |
The following is a summary of the inputs used, as of October 31, 2011, involving the Fund's assets and liabilities carried at fair value. The inputs or methodology used for valuing securities may not be an indication of the risk associated with investing in those securities. For more information on valuation inputs, and their aggregation into the levels used in the tables below, please refer to the Security Valuation section in the accompanying Notes to Financial Statements. |
Valuation Inputs at Reporting Date: |
Description | Total | Level 1 | Level 2 | Level 3 |
Investments in Securities: | | | | |
Equities: | | | | |
United Kingdom | $ 4,627,038,551 | $ 3,885,316,989 | $ 741,721,562 | $ - |
Japan | 3,428,408,766 | - | 3,428,408,766 | - |
Germany | 2,198,700,036 | 1,823,562,096 | 375,137,940 | - |
France | 1,804,897,841 | 1,541,258,432 | 263,639,409 | - |
Canada | 1,427,549,194 | 1,427,549,194 | - | - |
United States of America | 1,287,821,621 | 1,255,618,071 | - | 32,203,550 |
Switzerland | 1,117,671,287 | 962,887,492 | 154,783,795 | - |
Australia | 927,621,571 | 538,478,720 | 389,142,851 | - |
Netherlands | 690,489,515 | 477,070,544 | 213,418,971 | - |
Other | 7,197,563,634 | 4,195,813,680 | 3,001,749,954 | - |
Master Notes | 270,994 | - | - | 270,994 |
Money Market Funds | 1,611,809,254 | 1,611,809,254 | - | - |
Total Investments in Securities: | $ 26,319,842,264 | $ 17,719,364,472 | $ 8,568,003,248 | $ 32,474,544 |
The following is a reconciliation of Investments in Securities for which Level 3 inputs were used in determining value: |
Investments in Securities: | |
Beginning Balance | $ 451,860 |
Total Realized Gain (Loss) | (1,057,894) |
Total Unrealized Gain (Loss) | 1,048,395 |
Cost of Purchases | 32,666,617 |
Proceeds of Sales | (632,318) |
Amortization/Accretion | (2,116) |
Transfers in to Level 3 | - |
Transfers out of Level 3 | - |
Ending Balance | $ 32,474,544 |
The change in unrealized gain (loss) for the period attributable to Level 3 securities held at October 31, 2011 | $ (5,264) |
The information used in the above reconciliation represents fiscal year to date activity for any Investments in Securities identified as using Level 3 inputs at either the beginning or the end of the current fiscal period. Transfers in or out of Level 3 represent the beginning value of any Security or Instrument where a change in the pricing level occurred from the beginning to the end of the period. The cost of purchases and the proceeds of sales may include securities received or delivered through corporate actions or exchanges. Realized and unrealized gains (losses) disclosed in the reconciliation are included in Net Gain (Loss) on the Fund's Statement of Operations. |
Income Tax Information |
At October 31, 2011, the Fund had a capital loss carryforward of approximately $3,286,171,990 of which $2,666,600,138 and $619,571,852 will expire in fiscal 2017 and 2018, respectively. Capital loss carryforwards are only available to offset future capital gains of the Fund to the extent provided by regulations and may be limited. |
See accompanying notes which are an integral part of the financial statements.
Annual Report
Fidelity Diversified International Fund
Statement of Assets and Liabilities
| October 31, 2011 |
Assets | | |
Investment in securities, at value (including securities loaned of $813,313,897) - See accompanying schedule: Unaffiliated issuers (cost $21,967,898,714) | $ 24,519,992,287 | |
Fidelity Central Funds (cost $1,611,809,254) | 1,611,809,254 | |
Other affiliated issuers (cost $129,534,845) | 188,040,723 | |
Total Investments (cost $23,709,242,813) | | $ 26,319,842,264 |
Foreign currency held at value (cost $251,333) | | 251,333 |
Receivable for investments sold | | 234,571,947 |
Receivable for fund shares sold | | 74,623,129 |
Dividends receivable | | 62,708,309 |
Interest receivable | | 17,819 |
Distributions receivable from Fidelity Central Funds | | 360,288 |
Prepaid expenses | | 98,276 |
Other receivables | | 2,945,967 |
Total assets | | 26,695,419,332 |
Liabilities | | |
Payable for investments purchased | $ 100,359,104 | |
Payable for fund shares redeemed | 117,607,449 | |
Accrued management fee | 13,820,459 | |
Other affiliated payables | 3,926,570 | |
Other payables and accrued expenses | 1,270,124 | |
Collateral on securities loaned, at value | 886,536,637 | |
Total liabilities | | 1,123,520,343 |
Net Assets | | $ 25,571,898,989 |
Net Assets consist of: | | |
Paid in capital | | $ 25,969,888,803 |
Undistributed net investment income | | 418,909,977 |
Accumulated undistributed net realized gain (loss) on investments and foreign currency transactions | | (3,430,253,408) |
Net unrealized appreciation (depreciation) on investments and assets and liabilities in foreign currencies | | 2,613,353,617 |
Net Assets | | $ 25,571,898,989 |
Diversified International:
Net Asset Value, offering price and redemption price per share ($17,285,369,497 ÷ 628,706,658 shares) | | $ 27.49 |
| | |
Class K:
Net Asset Value, offering price and redemption price per share ($8,115,192,236 ÷ 295,039,055 shares) | | $ 27.51 |
| | |
Class F:
Net Asset Value, offering price and redemption price per share ($171,337,256 ÷ 6,228,258 shares) | | $ 27.51 |
Statement of Operations
| Year ended October 31, 2011 |
Investment Income | | |
Dividends (including $1,148,067 earned from other affiliated issuers) | | $ 775,256,545 |
Special dividends (earned from other affiliated issuers) | | 108,873,999 |
Interest | | 21,709 |
Income from Fidelity Central Funds | | 21,576,418 |
Income before foreign taxes withheld | | 905,728,671 |
Less foreign taxes withheld | | (61,260,298) |
Total income | | 844,468,373 |
| | |
Expenses | | |
Management fee
Basic fee | $ 225,204,522 | |
Performance adjustment | (17,677,656) | |
Transfer agent fees | 55,414,460 | |
Accounting and security lending fees | 2,636,921 | |
Custodian fees and expenses | 4,452,390 | |
Independent trustees' compensation | 179,973 | |
Depreciation in deferred trustee compensation account | (24) | |
Registration fees | 241,072 | |
Audit | 217,935 | |
Legal | 139,565 | |
Miscellaneous | 378,639 | |
Total expenses before reductions | 271,187,797 | |
Expense reductions | (8,678,523) | 262,509,274 |
Net investment income (loss) | | 581,959,099 |
Realized and Unrealized Gain (Loss) Net realized gain (loss) on: | | |
Investment securities: | | |
Unaffiliated issuers | 1,889,598,151 | |
Other affiliated issuers | (2,483,501) | |
Foreign currency transactions | (5,612,204) | |
Total net realized gain (loss) | | 1,881,502,446 |
Change in net unrealized appreciation (depreciation) on: Investment securities (net of decrease in deferred foreign taxes of $3,985,288) | (3,644,214,790) | |
Assets and liabilities in foreign currencies | (2,069,131) | |
Total change in net unrealized appreciation (depreciation) | | (3,646,283,921) |
Net gain (loss) | | (1,764,781,475) |
Net increase (decrease) in net assets resulting from operations | | $ (1,182,822,376) |
See accompanying notes which are an integral part of the financial statements.
Annual Report
Financial Statements - continued
Statement of Changes in Net Assets
| Year ended
October 31,
2011 | Year ended
October 31,
2010 |
Increase (Decrease) in Net Assets | | |
Operations | | |
Net investment income (loss) | $ 581,959,099 | $ 486,439,991 |
Net realized gain (loss) | 1,881,502,446 | (561,752,757) |
Change in net unrealized appreciation (depreciation) | (3,646,283,921) | 3,614,151,999 |
Net increase (decrease) in net assets resulting from operations | (1,182,822,376) | 3,538,839,233 |
Distributions to shareholders from net investment income | (554,171,382) | (474,506,693) |
Distributions to shareholders from net realized gain | (93,780,346) | - |
Total distributions | (647,951,728) | (474,506,693) |
Share transactions - net increase (decrease) | (7,417,526,738) | (3,995,252,806) |
Redemption fees | 964,713 | 822,251 |
Total increase (decrease) in net assets | (9,247,336,129) | (930,098,015) |
| | |
Net Assets | | |
Beginning of period | 34,819,235,118 | 35,749,333,133 |
End of period (including undistributed net investment income of $418,909,977 and undistributed net investment income of $424,022,673, respectively) | $ 25,571,898,989 | $ 34,819,235,118 |
Financial Highlights - Diversified International
Years ended October 31, | 2011 | 2010 | 2009 | 2008 | 2007 |
Selected Per-Share Data | | | | | |
Net asset value, beginning of period | $ 29.49 | $ 26.86 | $ 21.96 | $ 45.41 | $ 37.58 |
Income from Investment Operations | | | | | |
Net investment income (loss) B | .53 E | .37 | .35 | .55 | .47 |
Net realized and unrealized gain (loss) | (1.99) | 2.61 | 4.86 | (20.96) | 10.23 |
Total from investment operations | (1.46) | 2.98 | 5.21 | (20.41) | 10.70 |
Distributions from net investment income | (.46) | (.35) | (.31) | (.47) | (.36) |
Distributions from net realized gain | (.08) | - | - | (2.57) | (2.51) |
Total distributions | (.54) | (.35) | (.31) | (3.04) | (2.87) |
Redemption fees added to paid in capital B, G | - | - | - | - | - |
Net asset value, end of period | $ 27.49 | $ 29.49 | $ 26.86 | $ 21.96 | $ 45.41 |
Total Return A | (5.07)% | 11.15% | 24.32% | (48.04)% | 30.37% |
Ratios to Average Net Assets C,F | | | | | |
Expenses before reductions | .90% | .98% | 1.01% | 1.04% | .93% |
Expenses net of fee waivers, if any | .89% | .98% | 1.01% | 1.04% | .93% |
Expenses net of all reductions | .87% | .96% | .99% | 1.02% | .91% |
Net investment income (loss) | 1.78% E | 1.34% | 1.58% | 1.53% | 1.20% |
Supplemental Data | | | | | |
Net assets, end of period (000 omitted) | $ 17,285,369 | $ 26,527,229 | $ 30,998,270 | $ 28,274,961 | $ 59,929,942 |
Portfolio turnover rate D | 45% | 57% | 54% | 49% | 51% |
A Total returns would have been lower if certain expenses had not been reduced during the applicable periods shown.
B Calculated based on average shares outstanding during the period.
C Fees and expenses of any underlying Fidelity Central Funds are not included in the Fund's expense ratio. The Fund indirectly bears its proportionate share of the expenses of any underlying Fidelity Central Funds.
D Amount does not include the portfolio activity of any underlying Fidelity Central Funds.
E Investment income per share reflects a special dividend which amounted to $.10 per share. Excluding the special dividend, the ratio of net investment income (loss) to average net assets would have been 1.44%.
F Expense ratios reflect operating expenses of the class. Expenses before reductions do not reflect amounts reimbursed by the investment adviser or reductions from brokerage service arrangements or reductions from other expense offset arrangements and do not represent the amount paid by the class during periods when reimbursements or reductions occur. Expenses net of fee waivers reflect expenses after reimbursement by the investment adviser but prior to reductions from brokerage service arrangements or other expense offset arrangements. Expenses net of all reductions represent the net expenses paid by the class.
G Amount represents less than $.01 per share.
See accompanying notes which are an integral part of the financial statements.
Annual Report
Financial Highlights - Class K
Years ended October 31, | 2011 | 2010 | 2009 | 2008 H |
Selected Per-Share Data | | | | |
Net asset value, beginning of period | $ 29.51 | $ 26.89 | $ 21.98 | $ 38.39 |
Income from Investment Operations | | | | |
Net investment income (loss) D | .58 G | .42 | .42 | .16 |
Net realized and unrealized gain (loss) | (1.97) | 2.61 | 4.85 | (16.57) |
Total from investment operations | (1.39) | 3.03 | 5.27 | (16.41) |
Distributions from net investment income | (.53) | (.41) | (.36) | - |
Distributions from net realized gain | (.08) | - | - | - |
Total distributions | (.61) | (.41) | (.36) | - |
Redemption fees added to paid in capital D,J | - | - | - | - |
Net asset value, end of period | $ 27.51 | $ 29.51 | $ 26.89 | $ 21.98 |
Total Return B,C | (4.87)% | 11.33% | 24.64% | (42.75)% |
Ratios to Average Net Assets E,I | | | | |
Expenses before reductions | .73% | .79% | .77% | .88% A |
Expenses net of fee waivers, if any | .72% | .79% | .77% | .88% A |
Expenses net of all reductions | .70% | .77% | .76% | .87% A |
Net investment income (loss) | 1.95% G | 1.54% | 1.81% | 1.45% A |
Supplemental Data | | | | |
Net assets, end of period (000 omitted) | $ 8,115,192 | $ 7,697,405 | $ 4,713,909 | $ 932,275 |
Portfolio turnover rate F | 45% | 57% | 54% | 49% |
A Annualized
B Total returns for periods of less than one year are not annualized.
C Total returns would have been lower if certain expenses had not been reduced during the applicable periods shown.
D Calculated based on average shares outstanding during the period.
E Fees and expenses of any underlying Fidelity Central Funds are not included in the Fund's expense ratio. The Fund indirectly bears its proportionate share of the expenses of any underlying Fidelity Central Funds.
F Amount does not include the portfolio activity of any underlying Fidelity Central Funds.
G Investment income per share reflects a special dividend which amounted to $.10 per share. Excluding the special dividend, the ratio of net investment income (loss) to average net assets would have been 1.61%.
H For the period May 9, 2008 (commencement of sale of shares) to October 31, 2008.
I Expense ratios reflect operating expenses of the class. Expenses before reductions do not reflect amounts reimbursed by the investment adviser or reductions from brokerage service arrangements or reductions from other expense offset arrangements and do not represent the amount paid by the class during periods when reimbursements or reductions occur. Expense ratios before reductions for start-up periods may not be representative of longer-term operating periods. Expenses net of fee waivers reflect expenses after reimbursement by the investment adviser but prior to reductions from brokerage service arrangements or other expense offset arrangements. Expenses net of all reductions represent the net expenses paid by the class.
J Amount represents less than $.01 per share.
Financial Highlights - Class F
Years ended October 31, | 2011 | 2010 | 2009 H |
Selected Per-Share Data | | | |
Net asset value, beginning of period | $ 29.52 | $ 26.89 | $ 23.29 |
Income from Investment Operations | | | |
Net investment income (loss) D | .61 G | .43 | (.02) |
Net realized and unrealized gain (loss) | (2.00) | 2.62 | 3.62 |
Total from investment operations | (1.39) | 3.05 | 3.60 |
Distributions from net investment income | (.54) | (.42) | - |
Distributions from net realized gain | (.08) | - | - |
Total distributions | (.62) | (.42) | - |
Redemption fees added to paid in capital D,J | - | - | - |
Net asset value, end of period | $ 27.51 | $ 29.52 | $ 26.89 |
Total Return B,C | (4.86)% | 11.41% | 15.46% |
Ratios to Average Net Assets E,I | | | |
Expenses before reductions | .68% | .73% | .71% A |
Expenses net of fee waivers, if any | .67% | .73% | .71% A |
Expenses net of all reductions | .65% | .72% | .70% A |
Net investment income (loss) | 2.00% G | 1.59% | (.19)% A |
Supplemental Data | | | |
Net assets, end of period (000 omitted) | $ 171,337 | $ 594,602 | $ 37,155 |
Portfolio turnover rate F | 45% | 57% | 54% |
A Annualized
B Total returns for periods of less than one year are not annualized.
C Total returns would have been lower if certain expenses had not been reduced during the applicable periods shown.
D Calculated based on average shares outstanding during the period.
E Fees and expenses of any underlying Fidelity Central Funds are not included in the Fund's expense ratio. The Fund indirectly bears its proportionate share of the expenses of any underlying Fidelity Central Funds.
F Amount does not include the portfolio activity of any underlying Fidelity Central Funds.
G Investment income per share reflects a special dividend which amounted to $.10 per share. Excluding the special dividend, the ratio of net investment income (loss) to average net assets would have been 1.66%.
H For the period June 26, 2009 (commencement of sale of shares) to October 31, 2009.
I Expense ratios reflect operating expenses of the class. Expenses before reductions do not reflect amounts reimbursed by the investment adviser or reductions from brokerage service arrangements or reductions from other expense offset arrangements and do not represent the amount paid by the class during periods when reimbursements or reductions occur. Expense ratios before reductions for start-up periods may not be representative of longer-term operating periods. Expenses net of fee waivers reflect expenses after reimbursement by the investment adviser but prior to reductions from brokerage service arrangements or other expense offset arrangements. Expenses net of all reductions represent the net expenses paid by the class.
J Amount represents less than $.01 per share.
See accompanying notes which are an integral part of the financial statements.
Annual Report
Notes to Financial Statements
For the period ended October 31, 2011
1. Organization.
Fidelity Diversified International Fund (the Fund) is a fund of Fidelity Investment Trust (the Trust) and is authorized to issue an unlimited number of shares. The Trust is registered under the Investment Company Act of 1940, as amended (the 1940 Act), as an open-end management investment company organized as a Massachusetts business trust. The Fund offers Diversified International, Class K and Class F shares, each of which, has equal rights as to assets and voting privileges. Each class has exclusive voting rights with respect to matters that affect that class. Class F shares of the Fund are only available for purchase by mutual funds for which Fidelity Management & Research Company (FMR) or an affiliate serves as investment manager. Investment income, realized and unrealized capital gains and losses, the common expenses of the Fund, and certain fund-level expense reductions, if any, are allocated on a pro-rata basis to each class based on the relative net assets of each class to the total net assets of the Fund. Each class differs with respect to transfer agent fees incurred. Certain expense reductions may also differ by class. The Fund's investments in emerging markets can be subject to social, economic, regulatory, and political uncertainties and can be extremely volatile.
2. Investments in Fidelity Central Funds.
The Fund invests in Fidelity Central Funds, which are open-end investment companies available only to other investment companies and accounts managed by Fidelity Management & Research Company (FMR) and its affiliates. The Fund's Schedule of Investments lists each of the Fidelity Central Funds held as of period end, if any, as an investment of the Fund, but does not include the underlying holdings of each Fidelity Central Fund. As an Investing Fund, the Fund indirectly bears its proportionate share of the expenses of the underlying Fidelity Central Funds.
The Money Market Central Funds seek preservation of capital and current income and are managed by Fidelity Investments Money Management, Inc. (FIMM), an affiliate of FMR.
A complete unaudited list of holdings for each Fidelity Central Fund is available upon request or at the Securities and Exchange Commission (the SEC) web site at www.sec.gov. In addition, the financial statements of the Fidelity Central Funds, which are not covered by the Fund's Report of Independent Registered Public Accounting Firm are available on the SEC web site or upon request.
3. Significant Accounting Policies.
The financial statements have been prepared in conformity with accounting principles generally accepted in the United States of America (GAAP), which require management to make certain estimates and assumptions at the date of the financial statements. Actual results could differ from those estimates. Subsequent events, if any, through the date that the financial statements were issued have been evaluated in the preparation of the financial statements. The following summarizes the significant accounting policies of the Fund:
Security Valuation. Investments are valued as of 4:00 p.m. Eastern time on the last calendar day of the period. The Fund uses independent pricing services approved by the Board of Trustees to value its investments. When current market prices or quotations are not readily available or reliable, valuations may be determined in good faith in accordance with procedures adopted by the Board of Trustees. Factors used in determining value may include market or security specific events, changes in interest rates and credit quality. The frequency with which these procedures are used cannot be predicted and they may be utilized to a significant extent. The value used for net asset value (NAV) calculation under these procedures may differ from published prices for the same securities.
The Fund categorizes the inputs to valuation techniques used to value its investments into a disclosure hierarchy consisting of three levels as shown below:
Level 1 - quoted prices in active markets for identical investments
Level 2 - other significant observable inputs (including quoted prices for similar investments, interest rates, prepayment speeds, etc.)
Level 3 - unobservable inputs (including the Fund's own assumptions based on the best information available)
Changes in valuation techniques may result in transfers in or out of an assigned level within the disclosure hierarchy. The aggregate value of investments by input level, as of October 31, 2011, as well as a roll forward of Level 3 securities, is included at the end of the Fund's Schedule of Investments. Valuation techniques used to value the Fund's investments by major category are as follows:
Equity securities, including restricted securities, for which market quotations are readily available, are valued at the last reported sale price or official closing price as reported by an independent pricing service on the primary market or exchange on which they are traded and are categorized as Level 1 in the hierarchy. In the event there were no sales during the day or closing prices are not available, securities are valued at the last quoted bid price or may be valued using the last available price and are generally categorized as Level 2 in the hierarchy. For foreign equity securities, when significant market or security specific events arise, comparisons to the valuation of American Depositary Receipts (ADRs), futures contracts, Exchange-traded funds (ETFs) and certain indexes as well as quoted prices for similar securities are used and are categorized as Level 2 in the hierarchy in these circumstances. Utilizing these techniques may result in transfers between Level 1 and Level 2. For restricted equity securities and private placements where observable inputs are limited, assumptions about market activity and risk are used and are categorized as Level 3 in the hierarchy.
Annual Report
3. Significant Accounting Policies - continued
Security Valuation - continued
Debt securities, including restricted securities, are valued based on evaluated prices received from independent pricing services or from dealers who make markets in such securities. For master notes, pricing services utilize matrix pricing which considers yield or price of bonds of comparable quality, coupon, maturity and type as well as dealer supplied prices and are generally categorized as Level 2 in the hierarchy.
When independent prices are unavailable or unreliable, debt securities may be valued utilizing pricing matrices which consider similar factors that would be used by independent pricing services. These are generally categorized as Level 2 in the hierarchy but may be Level 3 depending on the circumstances.
Investments in open-end mutual funds, including the Fidelity Central Funds, are valued at their closing net asset value each business day and are categorized as Level 1 in the hierarchy.
Foreign Currency. The Fund may use foreign currency contracts to facilitate transactions in foreign-denominated securities. Gains and losses from these transactions may arise from changes in the value of the foreign currency or if the counterparties do not perform under the contracts' terms.
Foreign-denominated assets, including investment securities, and liabilities are translated into U.S. dollars at the exchange rate at period end. Purchases and sales of investment securities, income and dividends received and expenses denominated in foreign currencies are translated into U.S. dollars at the exchange rate in effect on the transaction date.
The effects of exchange rate fluctuations on investments are included with the net realized and unrealized gain (loss) on investment securities. Other foreign currency transactions resulting in realized and unrealized gain (loss) are disclosed separately.
Investment Transactions and Income. For financial reporting purposes, the Fund's investment holdings and NAV include trades executed through the end of the last business day of the period. The NAV per share for processing shareholder transactions is calculated as of the close of business of the New York Stock Exchange (NYSE), normally 4:00 p.m. Eastern time and includes trades executed through the end of the prior business day. Gains and losses on securities sold are determined on the basis of identified cost and may include proceeds received from litigation. Dividend income is recorded on the ex-dividend date, except for certain dividends from foreign securities where the ex-dividend date may have passed, which are recorded as soon as the Fund is informed of the ex-dividend date. Non-cash dividends included in dividend income, if any, are recorded at the fair market value of the securities received. Distributions received on securities that represent a return of capital or capital gain are recorded as a reduction of cost of investments and/or as a realized gain. The Fund estimates the components of distributions received that may be considered return of capital distributions or capital gain distributions. Large, non-recurring dividends recognized by the Fund are presented separately on the Statement of Operations as "Special Dividends" and the impact of these dividends is presented in the Financial Highlights. Interest income and distributions from the Fidelity Central Funds are accrued as earned. Interest income includes coupon interest and amortization of premium and accretion of discount on debt securities. Investment income is recorded net of foreign taxes withheld where recovery of such taxes is uncertain.
Expenses. Expenses directly attributable to a fund are charged to that fund. Expenses attributable to more than one fund are allocated among the respective funds on the basis of relative net assets or other appropriate methods. Expense estimates are accrued in the period to which they relate and adjustments are made when actual amounts are known.
Deferred Trustee Compensation. Under a Deferred Compensation Plan (the Plan), independent Trustees may elect to defer receipt of a portion of their annual compensation. Deferred amounts are invested in a cross-section of Fidelity funds, are marked-to-market and remain in the Fund until distributed in accordance with the Plan. The investment of deferred amounts and the offsetting payable to the Trustees are included in the accompanying Statement of Assets and Liabilities.
Income Tax Information and Distributions to Shareholders. Each year, the Fund intends to qualify as a regulated investment company, including distributing substantially all of its taxable income and realized gains under Subchapter M of the Internal Revenue Code and filing its U.S. federal tax return. As a result, no provision for income taxes is required. As of October 31, 2011, the Fund did not have any unrecognized tax benefits in the financial statements. A fund's federal tax return is subject to examination by the Internal Revenue Service (IRS) for a period of three years. Foreign taxes are provided for based on the Fund's understanding of the tax rules and rates that exist in the foreign markets in which it invests.
Distributions are declared and recorded on the ex-dividend date. Income dividends and capital gain distributions are declared separately for each class. Income and capital gain distributions are determined in accordance with income tax regulations, which may differ from GAAP.
Capital accounts within the financial statements are adjusted for permanent book-tax differences. These adjustments have no impact on net assets or the results of operations. Temporary book-tax differences will reverse in a subsequent period.
Annual Report
Notes to Financial Statements - continued
3. Significant Accounting Policies - continued
Income Tax Information and Distributions to Shareholders - continued
Book-tax differences are primarily due to foreign currency transactions, certain foreign taxes, passive foreign investment companies (PFIC), deferred trustees compensation, capital loss carryforwards and losses deferred due to wash sales.
The federal tax cost of investment securities and unrealized appreciation (depreciation) as of period end were as follows:
Gross unrealized appreciation | $ 4,524,622,015 |
Gross unrealized depreciation | (2,058,103,983) |
Net unrealized appreciation (depreciation) on securities and other investments | $ 2,466,518,032 |
| |
Tax Cost | $ 23,853,324,232 |
The tax-based components of distributable earnings as of period end were as follows:
Undistributed ordinary income | $ 419,615,619 |
Capital Loss Carryfoward | $ (3,286,171,990) |
Net unrealized appreciation (depreciation) | $ 2,469,263,889 |
Under the recently enacted Regulated Investment Company Modernization Act of 2010 (the Act), the Fund will be permitted to carry forward capital losses incurred in taxable years beginning after December 22, 2010 for an unlimited period. However, any losses incurred during those future taxable years will be required to be utilized prior to any losses incurred in pre-enactment taxable years, which generally expire after eight years from when they are incurred. Additionally, post-enactment capital losses that are carried forward will retain their character as either short-term or long-term capital losses rather than being considered all short-term as under previous law. The Fund's first fiscal year end subject to the Act will be October 31, 2012.
The tax character of distributions paid was as follows:
| October 31, 2011 | October 31, 2010 |
Ordinary Income | $ 647,951,728 | $ 474,506,693 |
Short-Term Trading (Redemption) Fees. Shares held by investors in the Fund less than 30 days are subject to a redemption fee equal to 1.00% of the net asset value of shares redeemed. All redemption fees, which reduce the proceeds of the shareholder redemption, are retained by the Fund and accounted for as an addition to paid in capital.
New Accounting Pronouncement. In May 2011, the Financial Accounting Standards Board issued Accounting Standard Update No. 2011-04, Fair Value Measurement (Topic 820) - Amendments to Achieve Common Fair Value Measurement and Disclosure Requirements in U.S. GAAP and IFRSs. The update changes the wording used to describe the requirements in GAAP for measuring fair value and for disclosing information about fair value measurements. The update is effective during interim and annual periods beginning after December 15, 2011. Management is currently evaluating the impact of the update's adoption on the Fund's financial statement disclosures.
4. Operating Policies.
Restricted Securities. The Fund may invest in securities that are subject to legal or contractual restrictions on resale. These securities generally may be resold in transactions exempt from registration or to the public if the securities are registered. Disposal of these securities may involve time-consuming negotiations and expense, and prompt sale at an acceptable price may be difficult. Information regarding restricted securities is included at the end of the Fund's Schedule of Investments.
5. Purchases and Sales of Investments.
Purchases and sales of securities, other than short-term securities, aggregated $13,875,962,686 and $20,794,928,294, respectively.
Annual Report
6. Fees and Other Transactions with Affiliates.
Management Fee. FMR and its affiliates provide the Fund with investment management related services for which the Fund pays a monthly management fee. The management fee is the sum of an individual fund fee rate that is based on an annual rate of .45% of the Fund's average net assets and a group fee rate that averaged .26% during the period. The group fee rate is based upon the average net assets of all the mutual funds advised by FMR. The group fee rate decreases as assets under management increase and increases as assets under management decrease. In addition, the management fee is subject to a performance adjustment (up to a maximum of ±.20% of the Fund's average net assets over a 36 month performance period). The upward or downward adjustment to the management fee is based on the relative investment performance of Diversified International as compared to an appropriate benchmark index. For the period, the total annual management fee rate, including the performance adjustment, was .65% of the Fund's average net assets.
Transfer Agent Fees. Fidelity Investments Institutional Operations Company, Inc. (FIIOC), an affiliate of FMR, is the transfer, dividend disbursing and shareholder servicing agent for each class of the Fund. FIIOC receives account fees and asset-based fees that vary according to the account size and type of account of the shareholders of Diversified International. FIIOC receives an asset-based fee of Class K's average net assets. FIIOC receives no fees for providing transfer agency services to Class F. FIIOC pays for typesetting, printing and mailing of shareholder reports, except proxy statements. For the period, transfer agent fees for each class were as follows:
| Amount | % of
Average
Net Assets |
Diversified International | $ 51,100,072 | .22 |
Class K | 4,314,388 | .05 |
| $ 55,414,460 | |
Accounting and Security Lending Fees. Fidelity Service Company, Inc. (FSC), an affiliate of FMR, maintains the Fund's accounting records. The accounting fee is based on the level of average net assets for the month. Under a separate contract, FSC administers the security lending program. The security lending fee is based on the number and duration of lending transactions.
Brokerage Commissions. The Fund placed a portion of its portfolio transactions with brokerage firms which are affiliates of the investment adviser. The commissions paid to these affiliated firms were $89,950 for the period.
7. Committed Line of Credit.
The Fund participates with other funds managed by FMR or an affiliate in a $4.0 billion credit facility (the "line of credit") to be utilized for temporary or emergency purposes to fund shareholder redemptions or for other short-term liquidity purposes. The Fund has agreed to pay commitment fees on its pro-rata portion of the line of credit, which amounted to $100,888 and is reflected in Miscellaneous expenses on the Statement of Operations. During the period, there were no borrowings on this line of credit.
8. Security Lending.
The Fund lends portfolio securities through a lending agent from time to time in order to earn additional income. For equity securities, a lending agent is used and may loan securities to certain qualified borrowers, including Fidelity Capital Markets (FCM), a broker-dealer affiliated with the Fund. On the settlement date of the loan, the Fund receives collateral (in the form of U.S. Treasury obligations, letters of credit and/or cash) against the loaned securities and maintains collateral in an amount not less than 100% of the market value of the loaned securities during the period of the loan. The market value of the loaned securities is determined at the close of business of the Fund and any additional required collateral is delivered to the Fund on the next business day. If the borrower defaults on its obligation to return the securities loaned because of insolvency or other reasons, a fund could experience delays and costs in recovering the securities loaned or in gaining access to the collateral. Any cash collateral received is invested in the Fidelity Securities Lending Cash Central Fund. The value of loaned securities and cash collateral at period end are disclosed on the Fund's Statement of Assets and Liabilities. The value of securities loaned to FCM at period end was $1,510,818. Security lending income represents the income earned on investing cash collateral, less rebates paid to borrowers and any lending agent fees associated with the loan, plus any premium payments received for lending certain types of securities. Security lending income is presented in the Statement of Operations as a component of income from Fidelity Central Funds. Total security lending income during the period amounted to $20,356,167, including $10,704 from securities loaned to FCM.
Annual Report
Notes to Financial Statements - continued
9. Expense Reductions.
FMR voluntarily agreed to reimburse a portion of its management fee. For the period, the amount of this reimbursement was $2,833,493.
Many of the brokers with whom FMR places trades on behalf of the Fund provided services in addition to trade execution. These services included payments of certain expenses on behalf of the Fund totaling $5,844,480 for the period. In addition, through arrangements with the Fund's custodian, credits realized as a result of uninvested cash balances were used to reduce the Fund's expenses. During the period, these credits reduced the Fund's custody expenses by $550.
10. Distributions to Shareholders.
Distributions to shareholders of each class were as follows:
Years ended October 31, | 2011 | 2010 |
From net investment income | | |
Diversified International | $ 404,459,076 | $ 398,456,259 |
Class K | 139,574,930 | 74,880,028 |
Class F | 10,137,376 | 1,170,406 |
Total | $ 554,171,382 | $ 474,506,693 |
From net realized gain | | |
Diversified International | $ 71,011,904 | $ - |
Class K | 21,272,351 | - |
Class F | 1,496,091 | - |
Total | $ 93,780,346 | $ - |
11. Share Transactions.
Transactions for each class of shares were as follows:
| Shares | Dollars |
Years ended October 31, | 2011 | 2010 | 2011 | 2010 |
Diversified International | | | | |
Shares sold | 95,789,996 | 179,662,935 | $ 2,861,192,033 | $ 4,893,668,837 |
Reinvestment of distributions | 15,446,133 | 13,627,007 | 459,413,511 | 384,281,814 |
Shares redeemed | (382,099,741) | (447,584,331) | (11,334,070,882) | (12,092,134,122) |
Net increase (decrease) | (270,863,612) | (254,294,389) | $ (8,013,465,338) | $ (6,814,183,471) |
Class K | | | | |
Shares sold | 125,231,374 | 151,794,829 | $ 3,707,928,503 | $ 4,125,917,772 |
Reinvestment of distributions | 5,413,899 | 2,657,205 | 160,847,281 | 74,880,028 |
Shares redeemed | (96,416,162) | (68,937,812) | (2,871,502,023) | (1,889,669,527) |
Net increase (decrease) | 34,229,111 | 85,514,222 | $ 997,273,761 | $ 2,311,128,273 |
Class F | | | | |
Shares sold | 13,012,404 | 24,587,499 | $ 389,423,461 | $ 664,182,809 |
Reinvestment of distributions | 391,673 | 41,548 | 11,633,466 | 1,170,406 |
Shares redeemed | (27,320,491) | (5,866,038) | (802,392,088) | (157,550,823) |
Net increase (decrease) | (13,916,414) | 18,763,009 | $ (401,335,161) | $ 507,802,392 |
12. Other.
The Fund's organizational documents provide former and current trustees and officers with a limited indemnification against liabilities arising in connection with the performance of their duties to the Fund. In the normal course of business, the Fund may also enter into contracts that provide general indemnifications. The Fund's maximum exposure under these arrangements is unknown as this would be dependent on future claims that may be made against the Fund. The risk of material loss from such claims is considered remote.
Annual Report
Report of Independent Registered Public Accounting Firm
To the Trustees of Fidelity Investment Trust and Shareholders of Fidelity Diversified International Fund:
We have audited the accompanying statement of assets and liabilities of Fidelity Diversified International Fund (the Fund), a fund of Fidelity Investment Trust, including the schedule of investments, as of October 31, 2011, and the related statement of operations for the year then ended, the statement of changes in net assets for each of the two years in the period then ended, and the financial highlights for each of the five years in the period then ended. These financial statements and financial highlights are the responsibility of the Fund's management. Our responsibility is to express an opinion on these financial statements and financial highlights based on our audits.
We conducted our audits in accordance with the standards of the Public Company Accounting Oversight Board (United States). Those standards require that we plan and perform the audit to obtain reasonable assurance about whether the financial statements and financial highlights are free of material misstatement. The Fund is not required to have, nor were we engaged to perform, an audit of its internal control over financial reporting. Our audits included consideration of internal control over financial reporting as a basis for designing audit procedures that are appropriate in the circumstances, but not for the purpose of expressing an opinion on the effectiveness of the Fund's internal control over financial reporting. Accordingly, we express no such opinion. An audit also includes examining, on a test basis, evidence supporting the amounts and disclosures in the financial statements, assessing the accounting principles used and significant estimates made by management, as well as evaluating the overall financial statement presentation. Our procedures included confirmation of securities owned as of October 31, 2011, by correspondence with the custodians and brokers; where replies were not received from brokers, we performed other auditing procedures. We believe that our audits provide a reasonable basis for our opinion.
In our opinion, the financial statements and financial highlights referred to above present fairly, in all material respects, the financial position of Fidelity Diversified International Fund as of October 31, 2011, the results of its operations for the year then ended, the changes in its net assets for each of the two years in the period then ended, and the financial highlights for each of the five years in the period then ended, in conformity with accounting principles generally accepted in the United States of America.
DELOITTE & TOUCHE LLP
Boston, Massachusetts
December 16, 2011
Annual Report
Fidelity International Capital Appreciation Fund
As a shareholder of the Fund, you incur two types of costs: (1) transaction costs, including redemption fees, and (2) ongoing costs, including management fees and other Fund expenses. This Example is intended to help you understand your ongoing costs (in dollars) of investing in the Fund and to compare these costs with the ongoing costs of investing in other mutual funds.
The Example is based on an investment of $1,000 invested at the beginning of the period and held for the entire period (May 1, 2011 to October 31, 2011).
Actual Expenses
The first line of the accompanying table provides information about actual account values and actual expenses. You may use the information in this line, together with the amount you invested, to estimate the expenses that you paid over the period. Simply divide your account value by $1,000.00 (for example, an $8,600 account value divided by $1,000.00 = 8.6), then multiply the result by the number in the first line under the heading entitled "Expenses Paid During Period" to estimate the expenses you paid on your account during this period. A small balance maintenance fee of $12.00 that is charged once a year may apply for certain accounts with a value of less than $2,000. This fee is not included in the table below. If it was, the estimate of expenses you paid during the period would be higher, and your ending account value lower, by this amount. In addition, the Fund, as a shareholder in the underlying Fidelity Central Funds, will indirectly bear its pro-rata share of the fees and expenses incurred by the underlying Fidelity Central Funds. These fees and expenses are not included in the Fund's annualized expense ratio used to calculate the expense estimate in the table below.
Hypothetical Example for Comparison Purposes
The second line of the accompanying table provides information about hypothetical account values and hypothetical expenses based on the Fund's actual expense ratio and an assumed rate of return of 5% per year before expenses, which is not the Fund's actual return. The hypothetical account values and expenses may not be used to estimate the actual ending account balance or expenses you paid for the period. You may use this information to compare the ongoing costs of investing in the Fund and other funds. To do so, compare this 5% hypothetical example with the 5% hypothetical examples that appear in the shareholder reports of the other funds. A small balance maintenance fee of $12.00 that is charged once a year may apply for certain accounts with a value of less than $2,000. This fee is not included in the table below. If it was, the estimate of expenses you paid during the period would be higher, and your ending account value lower, by this amount. In addition, the Fund, as a shareholder in the underlying Fidelity Central Funds, will indirectly bear its pro-rata share of the fees and expenses incurred by the underlying Fidelity Central Funds. These fees and expenses are not included in the Fund's annualized expense ratio used to calculate the expense estimate in the table below.
Please note that the expenses shown in the table are meant to highlight your ongoing costs only and do not reflect any transaction costs. Therefore, the second line of the table is useful in comparing ongoing costs only, and will not help you determine the relative total costs of owning different funds. In addition, if these transactional costs were included, your costs would have been higher.
| Annualized Expense Ratio | Beginning
Account Value
May 1, 2011 | Ending
Account Value
October 31, 2011 | Expenses Paid
During Period*
May 1, 2011 to October 31, 2011 |
Actual | 1.16% | $ 1,000.00 | $ 847.50 | $ 5.40 |
Hypothetical (5% return per year before expenses) | | $ 1,000.00 | $ 1,019.36 | $ 5.90 |
* Expenses are equal to the Fund's annualized expense ratio, multiplied by the average account value over the period, multiplied by 184/365 (to reflect the one-half year period).
Annual Report
Fidelity International Capital Appreciation Fund
Performance: The Bottom Line
Average annual total return reflects the change in the value of an investment, assuming reinvestment of the fund's distributions from dividend income and capital gains (the profits earned upon the sale of securities that have grown in value, if any) and assuming a constant rate of performance each year. The $10,000 table and the fund's returns do not reflect the deduction of taxes that a shareholder would pay on fund distributions or the redemption of fund shares. During periods of reimbursement by Fidelity, a fund's total return will be greater than it would be had the reimbursement not occurred. How a fund did yesterday is no guarantee of how it will do tomorrow.
Average Annual Total Returns
Periods ended October 31, 2011 | Past 1
year | Past 5
years | Past 10 years |
Fidelity International Capital Appreciation Fund | -4.03% | -1.42% | 5.96% |
$10,000 Over 10 Years
Let's say hypothetically that $10,000 was invested in Fidelity International Capital Appreciation Fund on October 31, 2001. The chart shows how the value of your investment would have changed, and also shows how the MSCI® ACWI® (All Country World Index) ex USA Index performed over the same period.
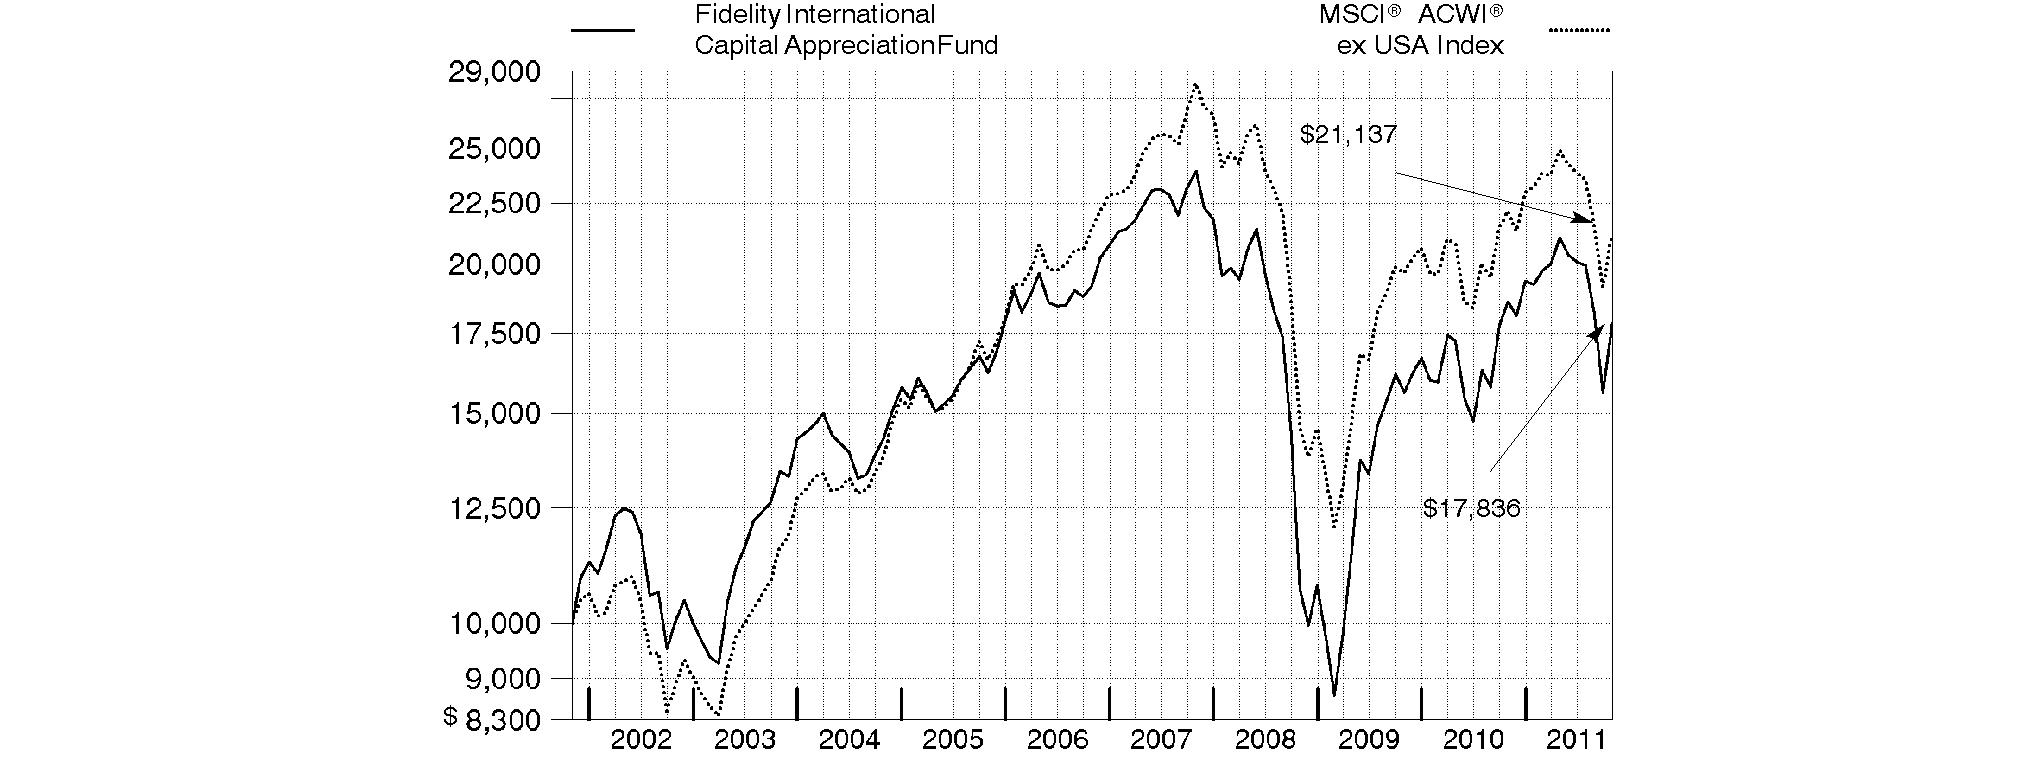
Annual Report
Fidelity International Capital Appreciation Fund
Market Recap: International equities were rocked by a number of headline events during the year ending October 31, 2011. Stocks posted a solid advance for the first half of the period, despite concern about the sovereign debt crisis in Europe, a devastating earthquake and tsunami in Japan, and political upheaval in the Middle East and North Africa. Sentiment turned decidedly negative in the second half, however, as fresh worries about Europe, inflation in China and a dimmed outlook for global growth caused foreign markets to suffer declines that intensified in August and September. October brought with it yet another dramatic swing, as eurozone policymakers appeared near a resolution to the debt debacle and buyers stormed back onto the scene in search of bargains. Still, those gains - along with favorable currency fluctuations overall - weren't enough to offset prior losses, and the MSCI® ACWI® (All Country World Index) ex USA Index finished the period down 4.56%. Within the MSCI index, Europe and emerging markets suffered the biggest declines, with many countries in these areas sustaining steep losses. By contrast, Japan showed resilience in the wake of its natural disasters, falling only 2%. Australia (+4%), Switzerland (+3%), the U.K. (+2%) and Canada, which produced a nominal return, were among the few major benchmark components to break into positive territory.
Comments from Sammy Simnegar, Portfolio Manager of Fidelity® International Capital Appreciation Fund: For the year, the fund returned -4.03%, ahead of the MSCI index. Stock picking in consumer discretionary and materials aided relative performance, as did underweighting utilities. Geographically, out-of-benchmark exposure to the United States and positioning in Indonesia, Brazil and Russia helped. The fund's top contributor, Canadian junior silver miner Aurcana, was lifted by surging silver prices and sold. Other notable contributors included two Indonesian holdings, retailer Mitra Adiperkasa and tobacco firm Gudang Garam. Conversely, positioning in health care detracted, as did stock selection in financials and underweighted telecommunication services exposure. Geographically, positioning in India, China and the United Kingdom hurt the fund. Swiss food and beverage maker Nestle - the fund's largest holding at period end - was its largest relative detractor, mainly due to untimely ownership. Other key detractors were India-based Jain Irrigation Systems and Vedanta Resources, a U.K. metals and mining firm. Aurcana, Mitra Adiperkasa and Jain Irrigation Systems were non-index holdings. I sold Jain and Vedanta by period end.
The views expressed above reflect those of the portfolio manager(s) only through the end of the period as stated on the cover of this report and do not necessarily represent the views of Fidelity or any other person in the Fidelity organization. Any such views are subject to change at any time based upon market or other conditions and Fidelity disclaims any responsibility to update such views. These views may not be relied on as investment advice and, because investment decisions for a Fidelity fund are based on numerous factors, may not be relied on as an indication of trading intent on behalf of any Fidelity fund.
Annual Report
Fidelity International Capital Appreciation Fund
Investment Changes (Unaudited)
Geographic Diversification (% of fund's net assets) |
As of October 31, 2011 |
| United States of America | 18.1% | |
| United Kingdom | 14.6% | |
| France | 7.8% | |
| Japan | 7.7% | |
| Switzerland | 5.7% | |
| Indonesia | 4.8% | |
| Brazil | 4.7% | |
| Germany | 4.3% | |
| India | 4.2% | |
| Other | 28.1% | |

Percentages are adjusted for the effect of futures contracts, if applicable. |
As of April 30, 2011 |
| United Kingdom | 14.6% | |
| Japan | 14.2% | |
| United States of America | 11.5% | |
| France | 7.3% | |
| Brazil | 5.2% | |
| India | 4.5% | |
| Switzerland | 4.2% | |
| Germany | 4.1% | |
| Canada | 4.1% | |
| Other | 30.3% | |

Percentages are adjusted for the effect of futures contracts, if applicable. |
Asset Allocation |
| % of fund's
net assets | % of fund's net assets
6 months ago |
Stocks | 97.7 | 97.9 |
Short-Term Investments and Net Other Assets | 2.3 | 2.1 |
Top Ten Stocks as of October 31, 2011 |
| % of fund's
net assets | % of fund's net assets
6 months ago |
Nestle SA (Switzerland, Food Products) | 2.3 | 0.0 |
Royal Dutch Shell PLC Class B (United Kingdom, Oil, Gas & Consumable Fuels) | 2.0 | 1.9 |
British American Tobacco PLC (United Kingdom) (United Kingdom, Tobacco) | 1.8 | 1.0 |
BHP Billiton PLC ADR (United Kingdom, Metals & Mining) | 1.7 | 2.0 |
Unilever PLC (United Kingdom, Food Products) | 1.2 | 0.0 |
Siemens AG sponsored ADR (Germany, Industrial Conglomerates) | 1.1 | 1.2 |
Philip Morris International, Inc. (United States of America, Tobacco) | 1.0 | 0.0 |
BG Group PLC (United Kingdom, Oil, Gas & Consumable Fuels) | 1.0 | 1.0 |
BASF AG (Germany, Chemicals) | 0.9 | 0.0 |
Standard Chartered PLC (United Kingdom) (United Kingdom, Commercial Banks) | 0.9 | 0.8 |
| 13.9 | |
Market Sectors as of October 31, 2011 |
| % of fund's
net assets | % of fund's net assets
6 months ago |
Consumer Discretionary | 22.1 | 23.1 |
Consumer Staples | 21.2 | 10.2 |
Financials | 16.1 | 20.3 |
Materials | 10.9 | 12.5 |
Industrials | 10.0 | 11.4 |
Information Technology | 9.2 | 9.6 |
Energy | 6.4 | 10.1 |
Health Care | 1.8 | 0.0 |
Telecommunication Services | 0.0 | 0.7 |
Annual Report
Fidelity International Capital Appreciation Fund
Investments October 31, 2011
Showing Percentage of Net Assets
Common Stocks - 95.9% |
| Shares | | Value |
Australia - 1.0% |
Atlas Iron Ltd. | 803,649 | | $ 2,606,788 |
Fortescue Metals Group Ltd. | 589,230 | | 2,959,891 |
TOTAL AUSTRALIA | | 5,566,679 |
Belgium - 0.8% |
Anheuser-Busch InBev SA NV | 80,019 | | 4,438,187 |
Bermuda - 1.1% |
Credicorp Ltd. (NY Shares) | 29,400 | | 3,198,132 |
Petra Diamonds Ltd. (a) | 1,413,818 | | 2,614,757 |
TOTAL BERMUDA | | 5,812,889 |
Brazil - 4.7% |
BR Malls Participacoes SA | 276,000 | | 2,981,481 |
Brasil Foods SA sponsored ADR (d) | 161,500 | | 3,399,575 |
Cia.Hering SA | 131,800 | | 2,943,472 |
Companhia de Bebidas das Americas (AmBev) (PN) sponsored ADR | 105,800 | | 3,567,576 |
Iguatemi Empresa de Shopping Centers SA | 141,900 | | 2,749,251 |
Itau Unibanco Banco Multiplo SA sponsored ADR | 238,200 | | 4,554,384 |
Multiplan Empreendimentos Imobiliarios SA | 145,600 | | 2,943,881 |
Souza Cruz Industria Comerico | 250,200 | | 3,068,491 |
TOTAL BRAZIL | | 26,208,111 |
Canada - 1.4% |
First Quantum Minerals Ltd. | 158,700 | | 3,328,903 |
Potash Corp. of Saskatchewan, Inc. | 88,500 | | 4,188,624 |
TOTAL CANADA | | 7,517,527 |
Cayman Islands - 3.2% |
Belle International Holdings Ltd. | 1,706,000 | | 3,345,853 |
China ZhengTong Auto Services Holdings Ltd. | 2,428,000 | | 2,629,069 |
Ctrip.com International Ltd. sponsored ADR (a)(d) | 74,000 | | 2,579,640 |
Hengdeli Holdings Ltd. | 7,252,000 | | 3,251,197 |
Intime Department Store Group Co. Ltd. | 2,073,500 | | 2,975,618 |
Maoye International Holdings Ltd. (a) | 11,341,000 | | 3,115,554 |
TOTAL CAYMAN ISLANDS | | 17,896,931 |
Chile - 0.5% |
Banco Santander Chile sponsored ADR | 35,500 | | 2,899,640 |
China - 1.6% |
Baidu.com, Inc. sponsored ADR (a) | 20,300 | | 2,845,654 |
Golden Eagle Retail Group Ltd. (H Shares) | 1,262,000 | | 3,171,639 |
SINA Corp. (a) | 31,700 | | 2,576,893 |
TOTAL CHINA | | 8,594,186 |
|
| Shares | | Value |
Colombia - 0.5% |
Grupo de Inversiones Surameric | 169,158 | | $ 2,971,598 |
Grupo de Inversiones Surameric rights 11/22/11 (a) | 43,277 | | 6,494 |
TOTAL COLOMBIA | | 2,978,092 |
Curacao - 0.5% |
Schlumberger Ltd. | 36,900 | | 2,711,043 |
Denmark - 1.3% |
Christian Hansen Holding AS | 128,746 | | 2,813,531 |
Novo Nordisk A/S Series B sponsored ADR | 42,600 | | 4,528,380 |
TOTAL DENMARK | | 7,341,911 |
Finland - 1.1% |
Kone Oyj (B Shares) | 57,800 | | 3,194,777 |
Nokian Tyres PLC | 83,000 | | 3,049,631 |
TOTAL FINLAND | | 6,244,408 |
France - 7.8% |
Air Liquide SA | 32,400 | | 4,203,596 |
Atos Origin SA | 56,917 | | 2,758,436 |
BNP Paribas SA | 88,391 | | 4,018,353 |
Casino Guichard Perrachon et Compagnie | 32,751 | | 3,078,413 |
Christian Dior SA | 24,612 | | 3,484,394 |
Danone | 65,200 | | 4,538,583 |
LVMH Moet Hennessy - Louis Vuitton | 27,998 | | 4,659,258 |
Pernod Ricard SA | 36,900 | | 3,446,949 |
PPR SA | 21,500 | | 3,359,210 |
Remy Cointreau SA | 37,000 | | 3,041,535 |
Schneider Electric SA | 62,894 | | 3,712,214 |
Technip SA | 34,400 | | 3,271,495 |
TOTAL FRANCE | | 43,572,436 |
Germany - 3.6% |
BASF AG | 72,072 | | 5,305,194 |
Bayerische Motoren Werke AG (BMW) | 50,246 | | 4,106,763 |
SAP AG | 82,069 | | 4,963,260 |
Siemens AG sponsored ADR | 55,900 | | 5,867,823 |
TOTAL GERMANY | | 20,243,040 |
India - 4.2% |
Bajaj Auto Ltd. | 85,494 | | 3,023,890 |
Gitanjali Gems Ltd. | 374,700 | | 2,663,961 |
HDFC Bank Ltd. | 328,642 | | 3,277,529 |
Housing Development Finance Corp. Ltd. | 263,505 | | 3,708,261 |
ITC Ltd. | 683,992 | | 2,983,337 |
Jubilant Foodworks Ltd. (a) | 155,631 | | 2,564,717 |
Smithkline Beecham Consumer Healthcare Ltd. | 53,717 | | 2,571,836 |
Titan Industries Ltd. | 571,901 | | 2,539,755 |
TOTAL INDIA | | 23,333,286 |
Common Stocks - continued |
| Shares | | Value |
Indonesia - 4.8% |
PT Ace Hardware Indonesia Tbk | 7,735,500 | | $ 2,936,378 |
PT Astra International Tbk | 453,000 | | 3,492,971 |
PT Bank Mandiri (Persero) Tbk | 4,179,500 | | 3,333,918 |
PT Bank Rakyat Indonesia Tbk | 4,317,000 | | 3,245,723 |
PT Global Mediacom Tbk | 29,110,000 | | 2,613,380 |
PT Gudang Garam Tbk | 450,000 | | 2,953,744 |
PT Indofood Sukses Makmur Tbk | 4,827,500 | | 2,865,601 |
PT Mitra Adiperkasa Tbk | 4,826,000 | | 2,657,974 |
PT Modern Internasional Tbk | 8,164,500 | | 2,736,294 |
TOTAL INDONESIA | | 26,835,983 |
Israel - 1.0% |
Check Point Software Technologies Ltd. (a) | 43,900 | | 2,529,957 |
Israel Chemicals Ltd. | 248,200 | | 2,986,616 |
TOTAL ISRAEL | | 5,516,573 |
Italy - 2.3% |
Prada SpA | 651,600 | | 3,221,154 |
Saipem SpA | 73,512 | | 3,296,158 |
Salvatore Ferragamo Italia SpA (a) | 193,400 | | 3,134,138 |
Tod's SpA | 30,558 | | 3,057,510 |
TOTAL ITALY | | 12,708,960 |
Japan - 7.7% |
Canon, Inc. sponsored ADR (d) | 98,209 | | 4,473,420 |
Fanuc Corp. | 26,100 | | 4,220,656 |
Japan Tobacco, Inc. | 695 | | 3,474,167 |
Kakaku.com, Inc. | 68,900 | | 2,728,445 |
Keyence Corp. | 11,500 | | 2,923,798 |
Komatsu Ltd. | 160,200 | | 3,961,422 |
Makita Corp. | 77,800 | | 2,904,922 |
Mitsubishi Corp. | 192,100 | | 3,951,419 |
Nabtesco Corp. | 144,900 | | 3,173,950 |
Rakuten, Inc. | 2,573 | | 2,820,975 |
Sysmex Corp. | 77,900 | | 2,560,906 |
THK Co. Ltd. | 162,900 | | 3,175,164 |
Unicharm Corp. | 59,200 | | 2,651,547 |
TOTAL JAPAN | | 43,020,791 |
Netherlands - 0.7% |
ING Groep NV sponsored ADR (a)(d) | 439,496 | | 3,797,245 |
Nigeria - 1.0% |
Guaranty Trust Bank PLC GDR (Reg. S) | 666,711 | | 3,066,871 |
Guinness Nigeria PLC | 2,106,095 | | 2,672,261 |
TOTAL NIGERIA | | 5,739,132 |
Norway - 0.6% |
DnB NOR ASA | 277,400 | | 3,236,068 |
Portugal - 0.5% |
Jeronimo Martins SGPS SA | 171,305 | | 2,963,362 |
Russia - 3.1% |
Magnit OJSC:
rights 11/29/11 (a) | 3,342 | | 0 |
GDR (Reg. S) | 137,505 | | 3,513,253 |
|
| Shares | | Value |
NOVATEK OAO GDR | 24,600 | | $ 3,453,840 |
Sberbank of Russia | 1,369,800 | | 3,716,993 |
TNK-BP Holding | 1,158,400 | | 3,169,410 |
Uralkali JSC GDR (Reg. S) | 75,400 | | 3,272,360 |
TOTAL RUSSIA | | 17,125,856 |
South Africa - 1.1% |
Mr Price Group Ltd. | 311,300 | | 2,996,777 |
Shoprite Holdings Ltd. | 198,200 | | 2,904,709 |
TOTAL SOUTH AFRICA | | 5,901,486 |
Spain - 0.7% |
Inditex SA | 39,590 | | 3,602,898 |
Sweden - 1.4% |
Atlas Copco AB (A Shares) | 155,800 | | 3,410,153 |
H&M Hennes & Mauritz AB (B Shares) | 124,921 | | 4,136,857 |
TOTAL SWEDEN | | 7,547,010 |
Switzerland - 5.7% |
Compagnie Financiere Richemont SA Series A | 74,478 | | 4,264,736 |
Credit Suisse Group sponsored ADR (d) | 130,700 | | 3,786,379 |
Dufry AG (a) | 25,880 | | 2,783,969 |
Nestle SA | 222,340 | | 12,896,254 |
The Swatch Group AG (Bearer) | 8,690 | | 3,679,795 |
UBS AG (NY Shares) (a) | 333,100 | | 4,203,722 |
TOTAL SWITZERLAND | | 31,614,855 |
Thailand - 1.6% |
C.P. Seven Eleven PCL (For. Reg.) | 1,786,900 | | 2,703,791 |
Kasikornbank PCL (For. Reg.) | 776,000 | | 3,136,968 |
Siam Makro PCL (For. Reg.) | 417,100 | | 2,793,049 |
TOTAL THAILAND | | 8,633,808 |
Turkey - 0.5% |
Turkiye Garanti Bankasi AS | 858,909 | | 3,031,015 |
United Kingdom - 14.6% |
Anglo American PLC (United Kingdom) | 121,800 | | 4,492,479 |
Antofagasta PLC | 161,500 | | 3,030,983 |
Barclays PLC sponsored ADR | 298,700 | | 3,736,737 |
BG Group PLC | 242,853 | | 5,297,895 |
BHP Billiton PLC ADR | 153,557 | | 9,669,484 |
British American Tobacco PLC (United Kingdom) | 215,200 | | 9,868,830 |
Burberry Group PLC | 158,300 | | 3,413,892 |
Imperial Tobacco Group PLC | 112,150 | | 4,101,378 |
Reckitt Benckiser Group PLC | 75,400 | | 3,877,840 |
Royal Dutch Shell PLC Class B | 305,278 | | 10,954,853 |
SABMiller PLC | 111,000 | | 4,054,859 |
Standard Chartered PLC (United Kingdom) | 214,591 | | 5,035,086 |
The Weir Group PLC | 99,800 | | 3,079,964 |
Common Stocks - continued |
| Shares | | Value |
United Kingdom - continued |
Unilever PLC | 193,100 | | $ 6,473,950 |
Xstrata PLC | 241,226 | | 4,055,909 |
TOTAL UNITED KINGDOM | | 81,144,139 |
United States of America - 15.3% |
Allergan, Inc. | 32,300 | | 2,717,076 |
Apple, Inc. (a) | 6,645 | | 2,689,763 |
Caterpillar, Inc. | 29,100 | | 2,748,786 |
Citigroup, Inc. | 80,700 | | 2,549,313 |
Citrix Systems, Inc. (a) | 36,500 | | 2,658,295 |
Coach, Inc. | 43,800 | | 2,850,066 |
Cummins, Inc. | 28,800 | | 2,863,584 |
EMC Corp. (a) | 112,307 | | 2,752,645 |
Freeport-McMoRan Copper & Gold, Inc. | 66,154 | | 2,663,360 |
Goldman Sachs Group, Inc. | 23,800 | | 2,607,290 |
Google, Inc. Class A (a) | 4,700 | | 2,785,408 |
Halliburton Co. | 70,000 | | 2,615,200 |
Joy Global, Inc. | 30,000 | | 2,616,000 |
JPMorgan Chase & Co. | 77,394 | | 2,690,215 |
Las Vegas Sands Corp. (a) | 62,885 | | 2,952,451 |
Lorillard, Inc. | 24,600 | | 2,722,236 |
MasterCard, Inc. Class A | 8,160 | | 2,833,478 |
Mead Johnson Nutrition Co. Class A | 36,100 | | 2,593,785 |
Oracle Corp. | 81,500 | | 2,670,755 |
Philip Morris International, Inc. | 80,500 | | 5,624,535 |
Rackspace Hosting, Inc. (a) | 69,283 | | 2,867,623 |
salesforce.com, Inc. (a) | 21,100 | | 2,809,887 |
The Coca-Cola Co. | 40,100 | | 2,739,632 |
The Mosaic Co. | 44,316 | | 2,595,145 |
Tiffany & Co., Inc. | 36,581 | | 2,916,603 |
TJX Companies, Inc. | 46,100 | | 2,716,673 |
United Technologies Corp. | 36,878 | | 2,875,746 |
Visa, Inc. Class A | 28,800 | | 2,685,888 |
Wells Fargo & Co. | 100,652 | | 2,607,893 |
Yum! Brands, Inc. | 53,900 | | 2,887,423 |
TOTAL UNITED STATES OF AMERICA | | 84,906,754 |
TOTAL COMMON STOCKS (Cost $511,894,330) |
532,684,301
|
Preferred Stocks - 1.8% |
| Shares | | Value |
Convertible Preferred Stocks - 0.5% |
United States of America - 0.5% |
Citigroup, Inc. 7.50% | 27,500 | | $ 2,613,600 |
Nonconvertible Preferred Stocks - 1.3% |
Germany - 0.7% |
Volkswagen AG | 23,300 | | 4,088,650 |
Italy - 0.6% |
Fiat Industrial SpA (a) | 538,233 | | 3,302,712 |
TOTAL NONCONVERTIBLE PREFERRED STOCKS | | 7,391,362 |
TOTAL PREFERRED STOCKS (Cost $10,028,088) |
10,004,962
|
Money Market Funds - 2.6% |
| | | |
Fidelity Securities Lending Cash Central Fund, 0.11% (b)(c)
(Cost $14,474,200) | 14,474,200 | |
14,474,200
|
TOTAL INVESTMENT PORTFOLIO - 100.3% (Cost $536,396,618) | 557,163,463 |
NET OTHER ASSETS (LIABILITIES) - (0.3)% | (1,595,071) |
NET ASSETS - 100% | $ 555,568,392 |
Legend |
(a) Non-income producing |
(b) Affiliated fund that is available only to investment companies and other accounts managed by Fidelity Investments. The rate quoted is the annualized seven-day yield of the fund at period end. A complete unaudited listing of the fund's holdings as of its most recent quarter end is available upon request. In addition, each Fidelity Central Fund's financial statements, which are not covered by the Fund's Report of Independent Registered Public Accounting Firm, are available on the SEC's website or upon request. |
(c) Investment made with cash collateral received from securities on loan. |
(d) Security or a portion of the security is on loan at period end. |
Affiliated Central Funds |
Information regarding fiscal year to date income earned by the Fund from investments in Fidelity Central Funds is as follows: |
Fund | Income earned |
Fidelity Cash Central Fund | $ 6,306 |
Fidelity Securities Lending Cash Central Fund | 272,960 |
Total | $ 279,266 |
Other Information |
The following is a summary of the inputs used, as of October 31, 2011, involving the Fund's assets and liabilities carried at fair value. The inputs or methodology used for valuing securities may not be an indication of the risk associated with investing in those securities. For more information on valuation inputs, and their aggregation into the levels used in the table below, please refer to the Security Valuation section in the accompanying Notes to Financial Statements. |
Valuation Inputs at Reporting Date: |
Description | Total | Level 1 | Level 2 | Level 3 |
Investments in Securities: | | | | |
Equities: | | | | |
United States of America | $ 87,520,354 | $ 87,520,354 | $ - | $ - |
United Kingdom | 81,144,139 | 53,846,506 | 27,297,633 | - |
France | 43,572,436 | 43,572,436 | - | - |
Japan | 43,020,791 | 4,473,420 | 38,547,371 | - |
Switzerland | 31,614,855 | 31,614,855 | - | - |
Indonesia | 26,835,983 | - | 26,835,983 | - |
Brazil | 26,208,111 | 26,208,111 | - | - |
Germany | 24,331,690 | 19,368,430 | 4,963,260 | - |
India | 23,333,286 | - | 23,333,286 | - |
Other | 155,107,618 | 114,752,366 | 40,355,252 | - |
Money Market Funds | 14,474,200 | 14,474,200 | - | - |
Total Investments in Securities: | $ 557,163,463 | $ 395,830,678 | $ 161,332,785 | $ - |
Income Tax Information |
At October 31, 2011, the Fund had a capital loss carryforward of approximately $136,212,537 of which $107,738,427 and $28,474,110 will expire in fiscal 2016 and 2017, respectively. Capital loss carryforwards are only available to offset future capital gains of the Fund to the extent provided by regulations and may be limited. |
See accompanying notes which are an integral part of the financial statements.
Annual Report
Fidelity International Capital Appreciation Fund
Statement of Assets and Liabilities
| October 31, 2011 |
| | |
Assets | | |
Investment in securities, at value (including securities loaned of $13,433,219) - See accompanying schedule: Unaffiliated issuers (cost $521,922,418) | $ 542,689,263 | |
Fidelity Central Funds (cost $14,474,200) | 14,474,200 | |
Total Investments (cost $536,396,618) | | $ 557,163,463 |
Foreign currency held at value (cost $2,579,665) | | 2,591,688 |
Receivable for investments sold | | 17,494,236 |
Receivable for fund shares sold | | 1,092,419 |
Dividends receivable | | 1,737,393 |
Distributions receivable from Fidelity Central Funds | | 3,404 |
Prepaid expenses | | 2,273 |
Other receivables | | 622,520 |
Total assets | | 580,707,396 |
| | |
Liabilities | | |
Payable to custodian bank | $ 1,588,608 | |
Payable for investments purchased | 7,927,500 | |
Payable for fund shares redeemed | 482,030 | |
Accrued management fee | 390,537 | |
Other affiliated payables | 137,426 | |
Other payables and accrued expenses | 138,703 | |
Collateral on securities loaned, at value | 14,474,200 | |
Total liabilities | | 25,139,004 |
| | |
Net Assets | | $ 555,568,392 |
Net Assets consist of: | | |
Paid in capital | | $ 673,505,786 |
Undistributed net investment income | | 5,512,022 |
Accumulated undistributed net realized gain (loss) on investments and foreign currency transactions | | (144,046,033) |
Net unrealized appreciation (depreciation) on investments and assets and liabilities in foreign currencies | | 20,596,617 |
Net Assets, for 46,721,596 shares outstanding | | $ 555,568,392 |
Net Asset Value, offering price and redemption price per share ($555,568,392 ÷ 46,721,596 shares) | | $ 11.89 |
Statement of Operations
| Year ended October 31, 2011 |
| | |
Investment Income | | |
Dividends | | $ 12,160,623 |
Special dividends | | 1,490,351 |
Interest | | 711 |
Income from Fidelity Central Funds | | 279,266 |
Income before foreign taxes withheld | | 13,930,951 |
Less foreign taxes withheld | | (901,136) |
Total income | | 13,029,815 |
| | |
Expenses | | |
Management fee
Basic fee | $ 4,371,310 | |
Performance adjustment | 432,652 | |
Transfer agent fees | 1,596,536 | |
Accounting and security lending fees | 311,964 | |
Custodian fees and expenses | 291,299 | |
Independent trustees' compensation | 3,486 | |
Registration fees | 38,456 | |
Audit | 83,417 | |
Legal | 2,590 | |
Interest | 3,399 | |
Miscellaneous | 6,496 | |
Total expenses before reductions | 7,141,605 | |
Expense reductions | (436,279) | 6,705,326 |
Net investment income (loss) | | 6,324,489 |
Realized and Unrealized Gain (Loss) Net realized gain (loss) on: | | |
Investment securities: | | |
Unaffiliated issuers | 26,199,769 | |
Foreign currency transactions | (630,556) | |
Total net realized gain (loss) | | 25,569,213 |
Change in net unrealized appreciation (depreciation) on: Investment securities (net of decrease in deferred foreign taxes of $882,795) | (54,301,580) | |
Assets and liabilities in foreign currencies | (89,797) | |
Total change in net unrealized appreciation (depreciation) | | (54,391,377) |
Net gain (loss) | | (28,822,164) |
Net increase (decrease) in net assets resulting from operations | | $ (22,497,675) |
See accompanying notes which are an integral part of the financial statements.
Annual Report
Fidelity International Capital Appreciation Fund
Financial Statements - continued
Statement of Changes in Net Assets
| Year ended
October 31,
2011 | Year ended
October 31,
2010 |
Increase (Decrease) in Net Assets | | |
Operations | | |
Net investment income (loss) | $ 6,324,489 | $ 5,868,930 |
Net realized gain (loss) | 25,569,213 | 32,223,756 |
Change in net unrealized appreciation (depreciation) | (54,391,377) | 58,849,867 |
Net increase (decrease) in net assets resulting from operations | (22,497,675) | 96,942,553 |
Distributions to shareholders from net investment income | (7,380,589) | (3,188,361) |
Distributions to shareholders from net realized gain | (4,973,519) | (5,465,762) |
Total distributions | (12,354,108) | (8,654,123) |
Share transactions
Proceeds from sales of shares | 171,547,780 | 275,756,138 |
Reinvestment of distributions | 9,861,670 | 8,469,995 |
Cost of shares redeemed | (218,161,559) | (201,747,591) |
Net increase (decrease) in net assets resulting from share transactions | (36,752,109) | 82,478,542 |
Redemption fees | 43,769 | 31,259 |
Total increase (decrease) in net assets | (71,560,123) | 170,798,231 |
| | |
Net Assets | | |
Beginning of period | 627,128,515 | 456,330,284 |
End of period (including undistributed net investment income of $5,512,022 and undistributed net investment income of $5,819,595, respectively) | $ 555,568,392 | $ 627,128,515 |
Other Information Shares | | |
Sold | 13,689,530 | 24,602,735 |
Issued in reinvestment of distributions | 769,704 | 746,913 |
Redeemed | (17,394,486) | (18,030,644) |
Net increase (decrease) | (2,935,252) | 7,319,004 |
Financial Highlights
Years ended October 31, | 2011 | 2010 | 2009 | 2008 | 2007 |
Selected Per-Share Data | | | | | |
Net asset value, beginning of period | $ 12.63 | $ 10.78 | $ 7.42 | $ 19.30 | $ 18.14 |
Income from Investment Operations | | | | | |
Net investment income (loss) B | .13 E | .12 | .13 | .19 | .20 |
Net realized and unrealized gain (loss) | (.62) | 1.92 | 3.26 | (9.54) | 3.80 |
Total from investment operations | (.49) | 2.04 | 3.39 | (9.35) | 4.00 |
Distributions from net investment income | (.15) | (.07) | (.03) | (.14) | (.20) |
Distributions from net realized gain | (.10) | (.12) | - | (2.39) | (2.64) |
Total distributions | (.25) | (.19) | (.03) | (2.53) | (2.84) |
Redemption fees added to paid in capital B, G | - | - | - | - | - |
Net asset value, end of period | $ 11.89 | $ 12.63 | $ 10.78 | $ 7.42 | $ 19.30 |
Total Return A | (4.03)% | 19.12% | 45.95% | (55.30)% | 24.81% |
Ratios to Average Net Assets C,F | | | | | |
Expenses before reductions | 1.16% | 1.04% | .84% | .89% | .85% |
Expenses net of fee waivers, if any | 1.16% | 1.04% | .84% | .89% | .85% |
Expenses net of all reductions | 1.09% | .87% | .72% | .72% | .79% |
Net investment income (loss) | 1.02% E | 1.07% | 1.49% | 1.39% | 1.11% |
Supplemental Data | | | | | |
Net assets, end of period (000 omitted) | $ 555,568 | $ 627,129 | $ 456,330 | $ 204,743 | $ 747,095 |
Portfolio turnover rate D | 254% | 480% | 387% | 387% | 138% |
A Total returns would have been lower if certain expenses had not been reduced during the applicable periods shown.
B Calculated based on average shares outstanding during the period.
C Fees and expenses of any underlying Fidelity Central Funds are not included in the Fund's expense ratio. The Fund indirectly bears its proportionate share of the expenses of any underlying Fidelity Central Funds.
D Amount does not include the portfolio activity of any underlying Fidelity Central Funds.
E Investment income per share reflects a special dividend which amounted to $.03 per share. Excluding the special dividend, the ratio of net investment income (loss) to average net assets would have been .78%.
F Expense ratios reflect operating expenses of the Fund. Expenses before reductions do not reflect amounts reimbursed by the investment adviser or reductions from brokerage service arrangements or reductions from other expense offset arrangements and do not represent the amount paid by the Fund during periods when reimbursements or reductions occur. Expenses net of fee waivers reflect expenses after reimbursement by the investment adviser but prior to reductions from brokerage service arrangements or other expense offset arrangements. Expenses net of all reductions represent the net expenses paid by the Fund.
G Amount represents less than $.01 per share.
See accompanying notes which are an integral part of the financial statements.
Annual Report
Notes to Financial Statements
For the period ended October 31, 2011
1. Organization.
Fidelity International Capital Appreciation Fund (the Fund) is a fund of Fidelity Investment Trust (the Trust) and is authorized to issue an unlimited number of shares. The Trust is registered under the Investment Company Act of 1940, as amended (the 1940 Act), as an open-end management investment company organized as a Massachusetts business trust. The Fund's investments in emerging markets can be subject to social, economic, regulatory, and political uncertainties and can be extremely volatile.
2. Investments in Fidelity Central Funds.
The Fund invests in Fidelity Central Funds, which are open-end investment companies available only to other investment companies and accounts managed by Fidelity Management & Research Company (FMR) and its affiliates. The Fund's Schedule of Investments lists each of the Fidelity Central Funds held as of period end, if any, as an investment of the Fund, but does not include the underlying holdings of each Fidelity Central Fund. As an Investing Fund, the Fund indirectly bears its proportionate share of the expenses of the underlying Fidelity Central Funds.
The Money Market Central Funds seek preservation of capital and current income and are managed by Fidelity Investments Money Management, Inc. (FIMM), an affiliate of FMR.
A complete unaudited list of holdings for each Fidelity Central Fund is available upon request or at the Securities and Exchange Commission (the SEC) web site at www.sec.gov. In addition, the financial statements of the Fidelity Central Funds, which are not covered by the Fund's Report of Independent Registered Public Accounting Firm are available on the SEC web site or upon request.
3. Significant Accounting Policies.
The financial statements have been prepared in conformity with accounting principles generally accepted in the United States of America (GAAP), which require management to make certain estimates and assumptions at the date of the financial statements. Actual results could differ from those estimates. Subsequent events, if any, through the date that the financial statements were issued have been evaluated in the preparation of the financial statements. The following summarizes the significant accounting policies of the Fund:
Security Valuation. Investments are valued as of 4:00 p.m. Eastern time on the last calendar day of the period. The Fund uses independent pricing services approved by the Board of Trustees to value its investments. When current market prices or quotations are not readily available or reliable, valuations may be determined in good faith in accordance with procedures adopted by the Board of Trustees. Factors used in determining value may include market or security specific events. The frequency with which these procedures are used cannot be predicted and they may be utilized to a significant extent. The value used for net asset value (NAV) calculation under these procedures may differ from published prices for the same securities.
The Fund categorizes the inputs to valuation techniques used to value its investments into a disclosure hierarchy consisting of three levels as shown below:
Level 1 - quoted prices in active markets for identical investments
Level 2 - other significant observable inputs (including quoted prices for similar investments, interest rates, prepayment speeds, etc.)
Level 3 - unobservable inputs (including the Fund's own assumptions based on the best information available)
Changes in valuation techniques may result in transfers in or out of an assigned level within the disclosure hierarchy. The aggregate value of investments by input level, as of October 31, 2011 is included at the end of the Fund's Schedule of Investments. Valuation techniques used to value the Fund's investments by major category are as follows:
Equity securities, including restricted securities, for which market quotations are readily available, are valued at the last reported sale price or official closing price as reported by an independent pricing service on the primary market or exchange on which they are traded and are categorized as Level 1 in the hierarchy. In the event there were no sales during the day or closing prices are not available, securities are valued at the last quoted bid price or may be valued using the last available price and are generally categorized as Level 2 in the hierarchy. For foreign equity securities, when significant market or security specific events arise, comparisons to the valuation of American Depositary Receipts (ADRs), futures contracts, Exchange-traded funds (ETFs) and certain indexes as well as quoted prices for similar securities are used and are categorized as Level 2 in the hierarchy in these circumstances. Utilizing these techniques may result in transfers between Level 1 and Level 2. For restricted equity securities and private placements where observable inputs are limited, assumptions about market activity and risk are used and are categorized as Level 3 in the hierarchy.
Investments in open-end mutual funds, including the Fidelity Central Funds, are valued at their closing net asset value each business day and are categorized as Level 1 in the hierarchy.
Annual Report
Notes to Financial Statements - continued
3. Significant Accounting Policies - continued
Foreign Currency. The Fund may use foreign currency contracts to facilitate transactions in foreign-denominated securities. Gains and losses from these transactions may arise from changes in the value of the foreign currency or if the counterparties do not perform under the contracts' terms.
Foreign-denominated assets, including investment securities, and liabilities are translated into U.S. dollars at the exchange rate at period end. Purchases and sales of investment securities, income and dividends received and expenses denominated in foreign currencies are translated into U.S. dollars at the exchange rate in effect on the transaction date.
The effects of exchange rate fluctuations on investments are included with the net realized and unrealized gain (loss) on investment securities. Other foreign currency transactions resulting in realized and unrealized gain (loss) are disclosed separately.
Investment Transactions and Income. For financial reporting purposes, the Fund's investment holdings and NAV include trades executed through the end of the last business day of the period. The NAV per share for processing shareholder transactions is calculated as of the close of business of the New York Stock Exchange (NYSE), normally 4:00 p.m. Eastern time and includes trades executed through the end of the prior business day. Gains and losses on securities sold are determined on the basis of identified cost and may include proceeds received from litigation. Dividend income is recorded on the ex-dividend date, except for certain dividends from foreign securities where the ex-dividend date may have passed, which are recorded as soon as the Fund is informed of the ex-dividend date. Non-cash dividends included in dividend income, if any, are recorded at the fair market value of the securities received. Distributions received on securities that represent a return of capital or capital gain are recorded as a reduction of cost of investments and/or as a realized gain. The Fund estimates the components of distributions received that may be considered return of capital distributions or capital gain distributions. Large, non-recurring dividends recognized by the Fund are presented separately on the Statement of Operations as "Special Dividends" and the impact of these dividends is presented in the Financial Highlights. Interest income and distributions from the Fidelity Central Funds are accrued as earned. Interest income includes coupon interest and amortization of premium and accretion of discount on debt securities. Investment income is recorded net of foreign taxes withheld where recovery of such taxes is uncertain.
Expenses. Expenses directly attributable to a fund are charged to that fund. Expenses attributable to more than one fund are allocated among the respective funds on the basis of relative net assets or other appropriate methods. Expense estimates are accrued in the period to which they relate and adjustments are made when actual amounts are known.
Income Tax Information and Distributions to Shareholders. Each year, the Fund intends to qualify as a regulated investment company, including distributing substantially all of its taxable income and realized gains under Subchapter M of the Internal Revenue Code and filing its U.S. federal tax return. As a result, no provision for income taxes is required. As of October 31, 2011, the Fund did not have any unrecognized tax benefits in the financial statements. A fund's federal tax return is subject to examination by the Internal Revenue Service (IRS) for a period of three years. Foreign taxes are provided for based on the Fund's understanding of the tax rules and rates that exist in the foreign markets in which it invests. The Fund is subject to a tax imposed on realized short term capital gains on securities of certain issuers domiciled in India. An estimated deferred tax liability for net unrealized gains on these securities is included in Other payables and accrued expenses on the Statement of Assets & Liabilities.
Distributions are declared and recorded on the ex-dividend date. Income and capital gain distributions are determined in accordance with income tax regulations, which may differ from GAAP.
Capital accounts within the financial statements are adjusted for permanent book-tax differences. These adjustments have no impact on net assets or the results of operations. Temporary book-tax differences will reverse in a subsequent period.
Book-tax differences are primarily due to foreign currency transactions, equity-debt classifications, certain foreign taxes, passive foreign investment companies (PFIC), deferred trustees compensation, capital loss carryforwards and losses deferred due to wash sales.
The federal tax cost of investment securities and unrealized appreciation (depreciation) as of period end were as follows:
Gross unrealized depreciation | $ 47,618,781 |
Gross unrealized depreciation | (35,059,742) |
Net unrealized appreciation (depreciation) on securities and other investments | $ 12,559,039 |
| |
Tax Cost | $ 544,604,424 |
The tax-based components of distributable earnings as of period end were as follows:
Undistributed ordinary income | $ 5,912,335 |
Capital Loss carryfoward | $ (136,212,537) |
Net unrealized appreciation (depreciation) | $ 12,443,133 |
Annual Report
3. Significant Accounting Policies - continued
Income Tax Information and Distributions to Shareholders - continued
Under the recently enacted Regulated Investment Company Modernization Act of 2010 (the Act), the Fund will be permitted to carry forward capital losses incurred in taxable years beginning after December 22, 2010 for an unlimited period. However, any losses incurred during those future taxable years will be required to be utilized prior to any losses incurred in pre-enactment taxable years, which generally expire after eight years from when they are incurred. Additionally, post-enactment capital losses that are carried forward will retain their character as either short-term or long-term capital losses rather than being considered all short-term as under previous law. The Fund's first fiscal year end subject to the Act will be October 31, 2012.
The tax character of distributions paid was as follows:
| October 31, 2011 | October 31, 2010 |
Ordinary Income | $ 12,354,108 | $ 8,654,123 |
Short-Term Trading (Redemption) Fees. Shares held by investors in the Fund less than 30 days are subject to a redemption fee equal to 1.00% of the net asset value of shares redeemed. All redemption fees, which reduce the proceeds of the shareholder redemption, are retained by the Fund and accounted for as an addition to paid in capital.
New Accounting Pronouncement. In May 2011, the Financial Accounting Standards Board issued Accounting Standard Update No. 2011-04, Fair Value Measurement (Topic 820) - Amendments to Achieve Common Fair Value Measurement and Disclosure Requirements in U.S. GAAP and IFRSs. The update changes the wording used to describe the requirements in GAAP for measuring fair value and for disclosing information about fair value measurements. The update is effective during interim and annual periods beginning after December 15, 2011. Management is currently evaluating the impact of the update's adoption on the Fund's financial statement disclosures.
4. Purchases and Sales of Investments.
Purchases and sales of securities, other than short-term securities, aggregated $1,550,445,143 and $1,599,960,144, respectively.
5. Fees and Other Transactions with Affiliates.
Management Fee. FMR and its affiliates provide the Fund with investment management related services for which the Fund pays a monthly management fee. The management fee is the sum of an individual fund fee rate that is based on an annual rate of .45% of the Fund's average net assets and a group fee rate that averaged .26% during the period. The group fee rate is based upon the average net assets of all the mutual funds advised by FMR. The group fee rate decreases as assets under management increase and increases as assets under management decrease. In addition, the management fee is subject to a performance adjustment (up to a maximum of ± .20% of the Fund's average net assets over a 36 month performance period). The upward or downward adjustment to the management fee is based on the Fund's relative investment performance as compared to an appropriate benchmark index. For the period, the total annual management fee rate, including the performance adjustment, was .78% of the Fund's average net assets.
Transfer Agent Fees. Fidelity Investments Institutional Operations Company, Inc. (FIIOC), an affiliate of FMR, is the Fund's transfer, dividend disbursing and shareholder servicing agent. FIIOC receives account fees and asset-based fees that vary according to account size and type of account. FIIOC pays for typesetting, printing and mailing of shareholder reports, except proxy statements. For the period, the transfer agent fees were equivalent to an annual rate of .26% of average net assets.
Accounting and Security Lending Fees. Fidelity Service Company, Inc. (FSC), an affiliate of FMR, maintains the Fund's accounting records. The accounting fee is based on the level of average net assets for the month. Under a separate contract, FSC administers the security lending program. The security lending fee is based on the number and duration of lending transactions.
Brokerage Commissions. The Fund placed a portion of its portfolio transactions with brokerage firms which are affiliates of the investment adviser. The commissions paid to these affiliated firms were $15,552 for the period.
Interfund Lending Program. Pursuant to an Exemptive Order issued by the SEC, the Fund, along with other registered investment companies having management contracts with FMR, may participate in an interfund lending program. This program provides an alternative credit facility allowing the funds to borrow from, or lend money to, other participating affiliated funds. At period end, there were no interfund loans outstanding. The Fund's activity in this program during the period for which loans were outstanding was as follows:
Borrower or Lender | Average Daily
Loan Balance | Weighted Average Interest Rate | Interest
Expense |
Borrower | $ 6,425,922 | .37% | $ 3,399 |
Annual Report
Notes to Financial Statements - continued
6. Committed Line of Credit.
The Fund participates with other funds managed by FMR or an affiliate in a $4.0 billion credit facility (the "line of credit") to be utilized for temporary or emergency purposes to fund shareholder redemptions or for other short-term liquidity purposes. The Fund has agreed to pay commitment fees on its pro-rata portion of the line of credit, which amounted to $1,927 and is reflected in Miscellaneous expenses on the Statement of Operations. During the period, there were no borrowings on this line of credit.
7. Security Lending.
The Fund lends portfolio securities through a lending agent from time to time in order to earn additional income. For equity securities, a lending agent is used and may loan securities to certain qualified borrowers, including Fidelity Capital Markets (FCM), a broker-dealer affiliated with the Fund. On the settlement date of the loan, the Fund receives collateral (in the form of U.S. Treasury obligations, letters of credit and/or cash) against the loaned securities and maintains collateral in an amount not less than 100% of the market value of the loaned securities during the period of the loan. The market value of the loaned securities is determined at the close of business of the Fund and any additional required collateral is delivered to the Fund on the next business day. If the borrower defaults on its obligation to return the securities loaned because of insolvency or other reasons, a fund could experience delays and costs in recovering the securities loaned or in gaining access to the collateral. Any cash collateral received is invested in the Fidelity Securities Lending Cash Central Fund. The value of loaned securities and cash collateral at period end are disclosed on the Fund's Statement of Assets and Liabilities. Security lending income represents the income earned on investing cash collateral, less rebates paid to borrowers and any lending agent fees associated with the loan, plus any premium payments received for lending certain types of securities. Security lending income is presented in the Statement of Operations as a component of income from Fidelity Central Funds. Total security lending income during the period amounted to $272,960, including $484 from securities loaned to FCM.
8. Expense Reductions.
FMR voluntarily agreed to reimburse a portion of its management fee. For the period, the amount of this reimbursement was $9,057.
Many of the brokers with whom FMR places trades on behalf of the Fund provided services to the Fund in addition to trade execution. These services included payments of certain expenses on behalf of the Fund totaling $427,222 for the period.
9. Other.
The Fund's organizational documents provide former and current trustees and officers with a limited indemnification against liabilities arising in connection with the performance of their duties to the Fund. In the normal course of business, the Fund may also enter into contracts that provide general indemnifications. The Fund's maximum exposure under these arrangements is unknown as this would be dependent on future claims that may be made against the Fund. The risk of material loss from such claims is considered remote.
At the end of the period, Strategic Advisers International Fund and Strategic Advisers International II Fund were the owners of record of approximately 10% and 12%, respectively, of the total outstanding shares of the Fund. Mutual Funds managed by FMR or its affiliates, were the owners of record, in the aggregate, of approximately 26% of the total outstanding shares of the Fund.
Annual Report
Report of Independent Registered Public Accounting Firm
To the Trustees of Fidelity Investment Trust and Shareholders of Fidelity International Capital Appreciation Fund:
We have audited the accompanying statement of assets and liabilities of Fidelity International Capital Appreciation Fund (the Fund), a fund of Fidelity Investment Trust, including the schedule of investments, as of October 31, 2011, and the related statement of operations for the year then ended, the statement of changes in net assets for each of the two years in the period then ended, and the financial highlights for each of the five years in the period then ended. These financial statements and financial highlights are the responsibility of the Fund's management. Our responsibility is to express an opinion on these financial statements and financial highlights based on our audits.
We conducted our audits in accordance with the standards of the Public Company Accounting Oversight Board (United States). Those standards require that we plan and perform the audit to obtain reasonable assurance about whether the financial statements and financial highlights are free of material misstatement. The Fund is not required to have, nor were we engaged to perform, an audit of its internal control over financial reporting. Our audits included consideration of internal control over financial reporting as a basis for designing audit procedures that are appropriate in the circumstances, but not for the purpose of expressing an opinion on the effectiveness of the Fund's internal control over financial reporting. Accordingly, we express no such opinion. An audit also includes examining, on a test basis, evidence supporting the amounts and disclosures in the financial statements, assessing the accounting principles used and significant estimates made by management, as well as evaluating the overall financial statement presentation. Our procedures included confirmation of securities owned as of October 31, 2011, by correspondence with the custodians and brokers; where replies were not received from brokers, we performed other auditing procedures. We believe that our audits provide a reasonable basis for our opinion.
In our opinion, the financial statements and financial highlights referred to above present fairly, in all material respects, the financial position of Fidelity International Capital Appreciation Fund as of October 31, 2011, the results of its operations for the year then ended, the changes in its net assets for each of the two years in the period then ended, and the financial highlights for each of the five years in the period then ended, in conformity with accounting principles generally accepted in the United States of America.
DELOITTE & TOUCHE LLP
Boston, Massachusetts
December 16, 2011
Annual Report
Fidelity Overseas Fund
As a shareholder of the Fund, you incur two types of costs: (1) transaction costs, including redemption fees, and (2) ongoing costs, including management fees and other Fund expenses. This Example is intended to help you understand your ongoing costs (in dollars) of investing in the Fund and to compare these costs with the ongoing costs of investing in other mutual funds.
The Example is based on an investment of $1,000 invested at the beginning of the period and held for the entire period (May 1, 2011 to October 31, 2011).
Actual Expenses
The first line of the accompanying table for each class of the Fund provides information about actual account values and actual expenses. You may use the information in this line, together with the amount you invested, to estimate the expenses that you paid over the period. Simply divide your account value by $1,000.00 (for example, an $8,600 account value divided by $1,000.00 = 8.6), then multiply the result by the number in the first line for a class of the Fund under the heading entitled "Expenses Paid During Period" to estimate the expenses you paid on your account during this period. A small balance maintenance fee of $12.00 that is charged once a year may apply for certain accounts with a value of less than $2,000. This fee is not included in the table below. If it was, the estimate of expenses you paid during the period would be higher, and your ending account value lower, by this amount. In addition, the Fund, as a shareholder in the underlying Fidelity Central Funds, will indirectly bear its pro-rata share of the fees and expenses incurred by the underlying Fidelity Central Funds. These fees and expenses are not included in the Fund's annualized expense ratio used to calculate the expense estimate in the table below.
Hypothetical Example for Comparison Purposes
The second line of the accompanying table for each class of the Fund provides information about hypothetical account values and hypothetical expenses based on a Class' actual expense ratio and an assumed rate of return of 5% per year before expenses, which is not the Class' actual return. The hypothetical account values and expenses may not be used to estimate the actual ending account balance or expenses you paid for the period. You may use this information to compare the ongoing costs of investing in the Fund and other funds. To do so, compare this 5% hypothetical example with the 5% hypothetical examples that appear in the shareholder reports of the other funds. A small balance maintenance fee of $12.00 that is charged once a year may apply for certain accounts with a value of less than $2,000. This fee is not included in the table below. If it was, the estimate of expenses you paid during the period would be higher, and your ending account value lower, by this amount. In addition, the Fund, as a shareholder in the underlying Fidelity Central Funds, will indirectly bear its pro-rata share of the fees and expenses incurred by the underlying Fidelity Central Funds. These fees and expenses are not included in the Fund's annualized expense ratio used to calculate the expense estimate in the table below.
Please note that the expenses shown in the table are meant to highlight your ongoing costs only and do not reflect any transaction costs. Therefore, the second line of the table is useful in comparing ongoing costs only, and will not help you determine the relative total costs of owning different funds. In addition, if these transactional costs were included, your costs would have been higher.
| Annualized Expense Ratio | Beginning
Account Value
May 1, 2011 | Ending
Account Value
October 31, 2011 | Expenses Paid
During Period*
May 1, 2011 to October 31, 2011 |
Overseas | .69% | | | |
Actual | | $ 1,000.00 | $ 823.40 | $ 3.17 |
HypotheticalA | | $ 1,000.00 | $ 1,021.73 | $ 3.52 |
Class K | .52% | | | |
Actual | | $ 1,000.00 | $ 823.90 | $ 2.39 |
HypotheticalA | | $ 1,000.00 | $ 1,022.58 | $ 2.65 |
Class F | .46% | | | |
Actual | | $ 1,000.00 | $ 824.10 | $ 2.11 |
HypotheticalA | | $ 1,000.00 | $ 1,022.89 | $ 2.35 |
A 5% return per year before expenses
* Expenses are equal to each Class' annualized expense ratio, multiplied by the average account value over the period, multiplied by 184/365 (to reflect the one-half year period).
Annual Report
Fidelity Overseas Fund
Performance: The Bottom Line
Average annual total return reflects the change in the value of an investment, assuming reinvestment of the class' distributions from dividend income and capital gains (the profits earned upon the sale of securities that have grown in value, if any) and assuming a constant rate of performance each year. The $10,000 table and the fund's returns do not reflect the deduction of taxes that a shareholder would pay on fund distributions or the redemption of fund shares. During periods of reimbursement by Fidelity, a fund's total return will be greater than it would be had the reimbursement not occurred. How a fund did yesterday is no guarantee of how it will do tomorrow.
Average Annual Total Returns
Periods ended October 31, 2011 | Past 1
year | Past 5
years | Past 10
years |
Fidelity Overseas Fund | -5.83% | -3.84% | 4.45% |
$10,000 Over 10 Years
Let's say hypothetically that $10,000 was invested in Fidelity Overseas Fund, a class of the fund, on October 31, 2001. The chart shows how the value of your investment would have changed, and also shows how the MSCI EAFE Index performed over the same period.
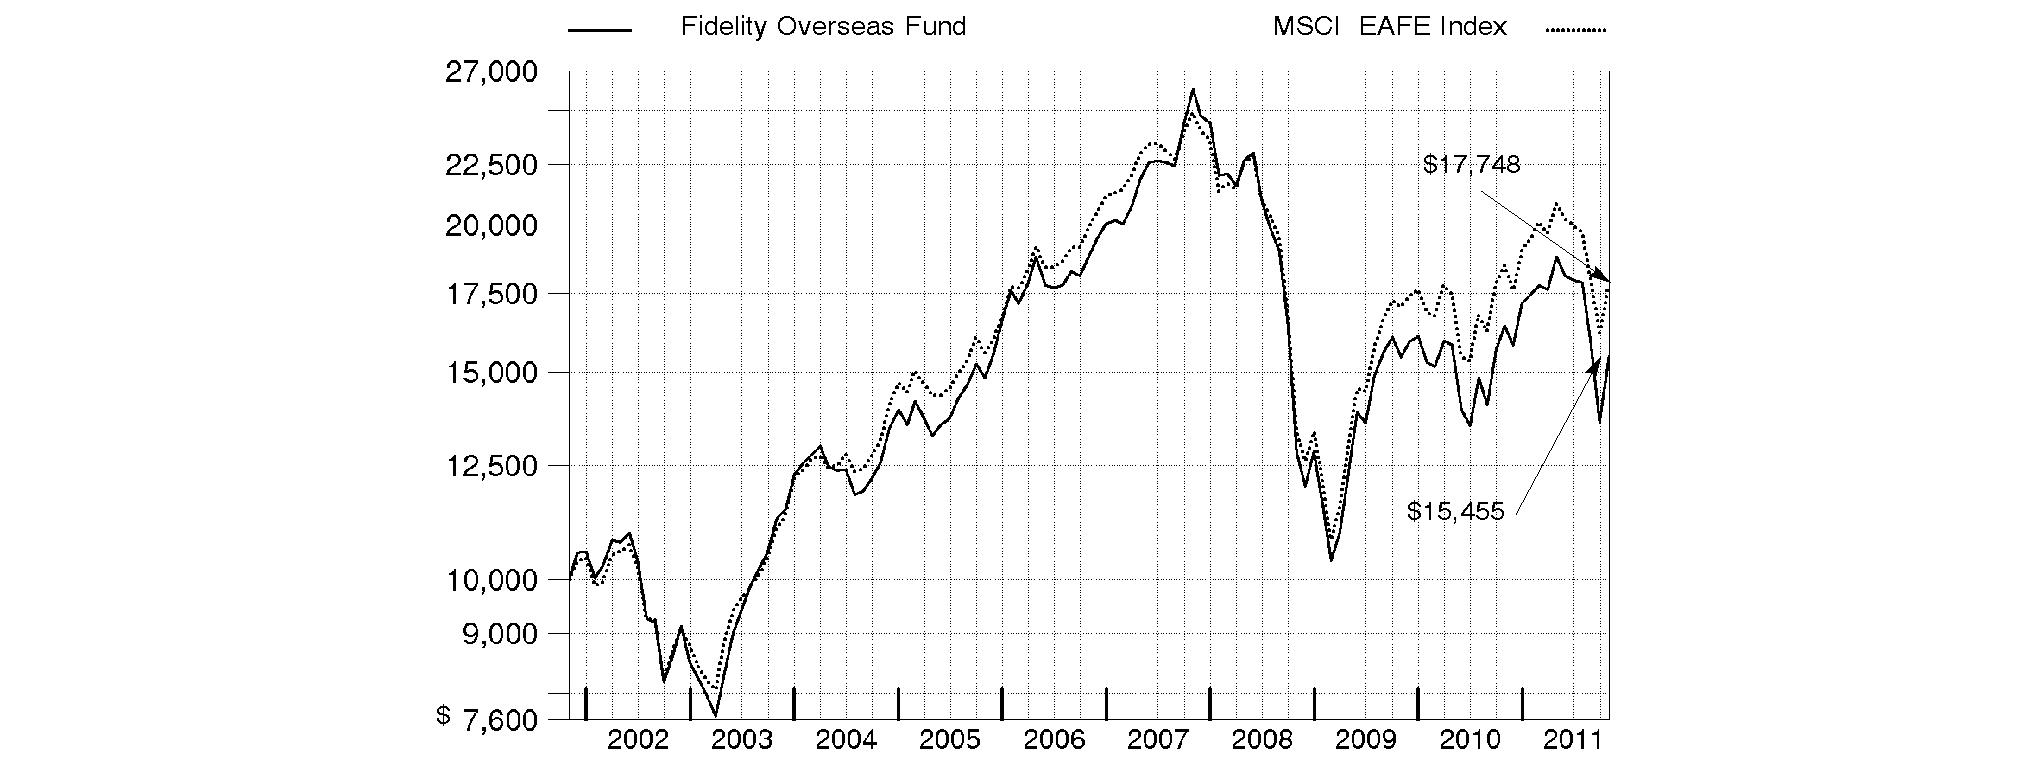
Annual Report
Fidelity Overseas Fund
Market Recap: International equities were rocked by a number of headline events during the year ending October 31, 2011. Stocks posted a solid advance for the first half of the period, despite concern about the sovereign debt crisis in Europe, a devastating earthquake and tsunami in Japan, and political upheaval in the Middle East and North Africa. Sentiment turned decidedly negative in the second half, however, as fresh worries about Europe, inflation in China and a dimmed outlook for global growth caused foreign markets to suffer declines that intensified in August and September. October brought with it yet another dramatic swing, as eurozone policymakers appeared near a resolution to the debt debacle and buyers stormed back onto the scene in search of bargains. Still, those gains - along with favorable currency fluctuations overall - weren't enough to offset prior losses, and the MSCI® ACWI® (All Country World Index) ex USA Index finished the period down 4.56%. Within the MSCI index, Europe and emerging markets suffered the biggest declines, with many countries in these areas sustaining steep losses. By contrast, Japan showed resilience in the wake of its natural disasters, falling only 2%. Australia (+4%), Switzerland (+3%), the U.K. (+2%) and Canada, which produced a nominal return, were among the few major benchmark components to break into positive territory.
Comments from Ian Hart, Portfolio Manager of Fidelity® Overseas Fund: For the year, the fund's Retail Class shares returned -5.83%, underperforming the -3.97% return of the MSCI® EAFE® (Europe, Australasia, Far East) Index. Stock picks in energy, information technology, telecommunication services and financials hurt, although my decision to underweight banks partially offset losses in the latter category. Geographically, security selection in the U.K. detracted, due in part to underweighting several mega-cap stocks such as oil producer and index component BP, which posted a double-digit gain. I sold BP by period end. Out-of-benchmark picks in emerging markets also held back performance. On an individual stock level, the fund was hurt by an overweighting in offshore drilling company Transocean, which owned the Deepwater Horizon rig that exploded in the Gulf of Mexico last year; NII Holdings, a U.S.-based operator of mobile networks in Latin America; and a small position in Norwegian oil-services company Sevan Marine, which I sold in June. Conversely, positioning in consumer discretionary aided performance, as did good stock picks and a sizable overweighting in food/beverage/tobacco. The fund's top relative contributor was Japan Tobacco, a strong defensive stock. In the luxury goods area, contributions included an out-of-index stake in luxury goods maker Bulgari, which was acquired in the period, and sold from the fund after the deal's March announcement, and stakes in spirits maker Pernod Ricard and luxury apparel maker Christian Dior, the fund's two largest holdings at period end. Strong security selection in Europe ex U.K. easily overshadowed the negative impact of various market weightings in some countries there.
The views expressed above reflect those of the portfolio manager(s) only through the end of the period as stated on the cover of this report and do not necessarily represent the views of Fidelity or any other person in the Fidelity organization. Any such views are subject to change at any time based upon market or other conditions and Fidelity disclaims any responsibility to update such views. These views may not be relied on as investment advice and, because investment decisions for a Fidelity fund are based on numerous factors, may not be relied on as an indication of trading intent on behalf of any Fidelity fund.
Annual Report
Fidelity Overseas Fund
Investment Changes (Unaudited)
Geographic Diversification (% of fund's net assets) |
As of October 31, 2011 |
| France | 21.4% | |
| Germany | 16.3% | |
| Japan | 11.7% | |
| United Kingdom | 11.6% | |
| United States of America | 8.6% | |
| Australia | 4.4% | |
| Switzerland | 4.1% | |
| Italy | 3.8% | |
| Spain | 2.6% | |
| Other | 15.5% | |

Percentages are adjusted for the effect of futures contracts, if applicable. |
As of April 30, 2011 |
| France | 21.7% | |
| Germany | 14.6% | |
| United Kingdom | 14.5% | |
| Japan | 14.2% | |
| Switzerland | 5.5% | |
| Italy | 3.9% | |
| United States of America | 3.4% | |
| Cayman Islands | 3.0% | |
| Norway | 2.4% | |
| Other | 16.8% | |

Percentages are adjusted for the effect of futures contracts, if applicable. |
Asset Allocation |
| % of fund's
net assets | % of fund's net assets
6 months ago |
Stocks | 91.8 | 97.6 |
Short-Term Investments and Net Other Assets | 8.2 | 2.4 |
Top Ten Stocks as of October 31, 2011 |
| % of fund's
net assets | % of fund's net assets
6 months ago |
Pernod Ricard SA (France, Beverages) | 7.0 | 5.7 |
Christian Dior SA (France, Textiles, Apparel & Luxury Goods) | 6.2 | 4.0 |
Porsche Automobil Holding SE (Germany) (Germany, Automobiles) | 5.6 | 1.3 |
SAP AG (Germany, Software) | 2.7 | 2.9 |
Mazda Motor Corp. (Japan, Automobiles) | 2.3 | 2.6 |
Saipem SpA (Italy, Energy Equipment & Services) | 1.5 | 2.3 |
The Swatch Group AG (Bearer) (Switzerland, Textiles, Apparel & Luxury Goods) | 1.5 | 1.5 |
Imperial Tobacco Group PLC (United Kingdom, Tobacco) | 1.5 | 1.9 |
BG Group PLC (United Kingdom, Oil, Gas & Consumable Fuels) | 1.4 | 1.0 |
WPP PLC (Bailiwick of Jersey, Media) | 1.4 | 1.2 |
| 31.1 | |
Market Sectors as of October 31, 2011 |
| % of fund's
net assets | % of fund's net assets
6 months ago |
Consumer Discretionary | 23.3 | 20.6 |
Financials | 15.4 | 13.7 |
Consumer Staples | 11.4 | 12.1 |
Materials | 10.1 | 12.6 |
Industrials | 7.5 | 10.8 |
Energy | 6.6 | 14.6 |
Information Technology | 6.6 | 7.6 |
Telecommunication Services | 5.9 | 2.2 |
Health Care | 3.1 | 2.1 |
Utilities | 1.9 | 1.3 |
Annual Report
Fidelity Overseas Fund
Investments October 31, 2011
Showing Percentage of Net Assets
Common Stocks - 85.5% |
| Shares | | Value |
Australia - 4.4% |
Australia & New Zealand Banking Group Ltd. | 1,214,597 | | $ 27,448,154 |
BHP Billiton Ltd. | 659,177 | | 25,805,692 |
Commonwealth Bank of Australia | 543,974 | | 27,946,636 |
Macquarie Group Ltd. | 439,886 | | 11,326,499 |
Newcrest Mining Ltd. | 667,135 | | 23,580,019 |
TOTAL AUSTRALIA | | 116,107,000 |
Bailiwick of Jersey - 1.6% |
Wolseley PLC | 189,900 | | 5,491,041 |
WPP PLC | 3,658,375 | | 37,875,145 |
TOTAL BAILIWICK OF JERSEY | | 43,366,186 |
Belgium - 2.5% |
Anheuser-Busch InBev SA NV | 557,112 | | 30,899,753 |
Groupe Bruxelles Lambert SA | 468,500 | | 36,204,263 |
TOTAL BELGIUM | | 67,104,016 |
Bermuda - 0.3% |
Li & Fung Ltd. | 4,008,000 | | 7,724,195 |
Brazil - 0.2% |
BM&F Bovespa SA | 1,062,400 | | 6,341,486 |
Canada - 0.6% |
Potash Corp. of Saskatchewan, Inc. | 320,200 | | 15,154,774 |
Cayman Islands - 2.3% |
3SBio, Inc. sponsored ADR (a) | 440,300 | | 5,067,853 |
China Medical System Holding Ltd. | 7,584,250 | | 5,568,755 |
Melco PBL Entertainment (Macau) Ltd. sponsored ADR (a)(d) | 2,693,500 | | 30,894,445 |
Minth Group Ltd. | 11,902,000 | | 12,349,112 |
Yingde Gases Group Co. Ltd. | 7,799,100 | | 8,317,251 |
TOTAL CAYMAN ISLANDS | | 62,197,416 |
Denmark - 0.9% |
Danske Bank A/S (a) | 493,663 | | 6,840,172 |
Novo Nordisk A/S Series B | 170,100 | | 18,061,767 |
TOTAL DENMARK | | 24,901,939 |
Finland - 0.5% |
Outotec Oyj | 258,300 | | 12,075,045 |
France - 21.4% |
Accor SA | 188,600 | | 6,200,139 |
Alcatel-Lucent SA sponsored ADR (a) | 4,144,600 | | 11,356,204 |
Alstom SA | 833,508 | | 31,259,626 |
Atos Origin SA | 205,351 | | 9,952,167 |
AXA SA | 882,837 | | 14,380,093 |
BNP Paribas SA | 387,126 | | 17,599,180 |
Cap Gemini SA | 253,800 | | 9,736,202 |
Christian Dior SA | 1,177,000 | | 166,631,386 |
Compagnie Generale de Geophysique SA (a) | 285,800 | | 6,245,460 |
EDF SA | 349,100 | | 10,488,524 |
GDF Suez | 272,000 | | 7,722,273 |
|
| Shares | | Value |
JC Decaux SA (a) | 289,800 | | $ 7,766,415 |
Laurent-Perrier Group | 100,819 | | 10,394,494 |
Pernod Ricard SA | 1,987,126 | | 185,623,904 |
Safran SA | 649,100 | | 21,262,512 |
Sanofi-aventis | 504,882 | | 36,123,991 |
Vivendi | 333,479 | | 7,499,401 |
Wendel SA | 152,300 | | 11,373,040 |
TOTAL FRANCE | | 571,615,011 |
Germany - 10.0% |
Allianz AG | 330,245 | | 37,115,086 |
BASF AG | 177,414 | | 13,059,381 |
Bayer AG | 305,997 | | 19,604,509 |
Deutsche Boerse AG | 201,492 | | 11,153,791 |
E.ON AG | 670,598 | | 16,249,990 |
HeidelbergCement AG | 325,329 | | 14,848,348 |
Linde AG | 181,207 | | 28,826,284 |
Metro AG | 118,700 | | 5,534,220 |
Munich Re Group | 120,668 | | 16,275,084 |
Puma AG | 34,100 | | 10,995,501 |
RWE AG | 171,000 | | 7,323,038 |
SAP AG | 1,175,607 | | 71,096,806 |
Siemens AG | 147,088 | | 15,420,124 |
TOTAL GERMANY | | 267,502,162 |
Hong Kong - 0.4% |
China Unicom (Hong Kong) Ltd. sponsored ADR (d) | 555,000 | | 11,161,050 |
India - 0.6% |
Bharti Airtel Ltd. | 1,886,222 | | 15,106,224 |
Ireland - 0.3% |
CRH PLC | 515,000 | | 9,319,038 |
Italy - 3.8% |
Ansaldo STS SpA | 334,000 | | 3,542,936 |
Assicurazioni Generali SpA | 327,500 | | 5,905,551 |
ENI SpA | 772,300 | | 17,073,321 |
Fiat Industrial SpA (a) | 1,326,000 | | 11,569,999 |
Intesa Sanpaolo SpA | 4,961,601 | | 8,864,470 |
Saipem SpA | 911,169 | | 40,855,324 |
Telecom Italia SpA | 10,512,400 | | 13,082,222 |
TOTAL ITALY | | 100,893,823 |
Japan - 11.7% |
Hitachi Ltd. | 4,459,000 | | 23,895,659 |
Honda Motor Co. Ltd. sponsored ADR | 918,500 | | 27,463,150 |
Japan Tobacco, Inc. | 5,295 | | 26,468,654 |
Keyence Corp. | 79,200 | | 20,136,072 |
Komatsu Ltd. | 448,400 | | 11,088,024 |
Kubota Corp. | 832,000 | | 6,853,386 |
Mazda Motor Corp. (a)(d) | 28,643,000 | | 60,213,771 |
Mitsubishi Corp. | 985,600 | | 20,273,393 |
Mitsubishi UFJ Financial Group, Inc. | 1,824,400 | | 7,929,742 |
Mitsui & Co. Ltd. | 629,200 | | 9,184,049 |
NTT DoCoMo, Inc. | 11,689 | | 20,762,821 |
Common Stocks - continued |
| Shares | | Value |
Japan - continued |
Rakuten, Inc. | 21,988 | | $ 24,107,109 |
SOFTBANK CORP. | 734,600 | | 23,844,961 |
Tokyo Electron Ltd. | 227,100 | | 12,079,516 |
Toshiba Corp. | 2,648,000 | | 11,550,453 |
Toto Ltd. | 727,000 | | 6,045,774 |
TOTAL JAPAN | | 311,896,534 |
Luxembourg - 0.5% |
ArcelorMittal SA Class A unit (d) | 585,300 | | 12,133,269 |
Mexico - 0.4% |
Cemex SA de CV sponsored ADR (d) | 2,631,800 | | 11,500,966 |
Netherlands - 0.8% |
AEGON NV (a) | 1,703,200 | | 8,123,645 |
ING Groep NV (Certificaten Van Aandelen) (a) | 1,512,300 | | 13,039,389 |
TOTAL NETHERLANDS | | 21,163,034 |
Norway - 1.3% |
Aker Solutions ASA | 1,572,717 | | 18,290,363 |
DnB NOR ASA | 752,800 | | 8,781,946 |
Kvaerner ASA (a) | 3,388,500 | | 6,530,391 |
TOTAL NORWAY | | 33,602,700 |
Spain - 2.6% |
Banco Bilbao Vizcaya Argentaria SA | 1,194,607 | | 10,752,920 |
Banco Santander SA: | | | |
rights 10/31/11 | 1,238,625 | | 214,267 |
(Spain) | 1,238,625 | | 10,485,066 |
Distribuidora Internacional de Alimentacion SA (a) | 377,987 | | 1,728,833 |
Iberdrola SA | 1,198,900 | | 8,723,851 |
Inditex SA | 142,852 | | 13,000,284 |
Telefonica SA sponsored ADR (d) | 1,113,900 | | 23,804,043 |
TOTAL SPAIN | | 68,709,264 |
Sweden - 0.8% |
Svenska Handelsbanken AB (A Shares) | 454,400 | | 13,096,266 |
Swedbank AB (A Shares) | 534,900 | | 7,535,883 |
TOTAL SWEDEN | | 20,632,149 |
Switzerland - 4.1% |
Credit Suisse Group | 318,706 | | 9,194,430 |
Julius Baer Group Ltd. | 125,480 | | 4,767,253 |
Pargesa Holding SA | 98,450 | | 7,724,098 |
The Swatch Group AG (Bearer) | 96,350 | | 40,799,567 |
Transocean Ltd. (United States) | 429,100 | | 24,523,065 |
UBS AG (a) | 894,783 | | 11,311,676 |
Zurich Financial Services AG | 47,010 | | 10,917,484 |
TOTAL SWITZERLAND | | 109,237,573 |
Taiwan - 0.2% |
HTC Corp. | 252,000 | | 5,663,335 |
|
| Shares | | Value |
Turkey - 1.3% |
Turkcell Iletisim Hizmet AS sponsored ADR (a) | 2,312,300 | | $ 28,487,536 |
Turkiye Garanti Bankasi AS | 1,580,000 | | 5,575,682 |
TOTAL TURKEY | | 34,063,218 |
United Kingdom - 11.6% |
AMEC PLC | 541,579 | | 8,060,803 |
Anglo American PLC (United Kingdom) | 421,000 | | 15,528,192 |
Barclays PLC | 6,045,110 | | 18,742,991 |
BG Group PLC | 1,749,782 | | 38,171,902 |
BHP Billiton PLC | 985,136 | | 31,027,214 |
British Sky Broadcasting Group PLC | 880,300 | | 9,966,517 |
Cairn Energy PLC (a) | 3,409,715 | | 16,154,402 |
Imperial Tobacco Group PLC | 1,081,219 | | 39,540,685 |
Lloyds Banking Group PLC (a) | 18,687,110 | | 9,665,340 |
Prudential PLC | 899,265 | | 9,290,341 |
Rio Tinto PLC | 623,310 | | 33,726,681 |
Rolls-Royce Group PLC | 2,829,400 | | 31,965,443 |
Rolls-Royce Group PLC Class C | 195,228,600 | | 313,967 |
Standard Chartered PLC (United Kingdom) | 952,374 | | 22,346,159 |
Xstrata PLC | 1,514,900 | | 25,471,121 |
TOTAL UNITED KINGDOM | | 309,971,758 |
United States of America - 0.4% |
NII Holdings, Inc. (a) | 420,700 | | 9,899,071 |
TOTAL COMMON STOCKS (Cost $2,415,469,001) |
2,279,042,236
|
Nonconvertible Preferred Stocks - 6.3% |
| | | |
Germany - 6.3% |
Porsche Automobil Holding SE (Germany) | 2,531,750 | | 148,503,851 |
Volkswagen AG | 115,668 | | 20,297,250 |
TOTAL NONCONVERTIBLE PREFERRED STOCKS (Cost $177,964,851) |
168,801,101
|
Money Market Funds - 6.2% |
| | | |
Fidelity Cash Central Fund, 0.12% (b) | 110,810,907 | | 110,810,907 |
Fidelity Securities Lending Cash Central Fund, 0.11% (b)(c) | 53,871,515 | | 53,871,515 |
TOTAL MONEY MARKET FUNDS (Cost $164,682,422) |
164,682,422
|
TOTAL INVESTMENT PORTFOLIO - 98.0% (Cost $2,758,116,274) | 2,612,525,759 |
NET OTHER ASSETS (LIABILITIES) - 2.0% | 53,129,568 |
NET ASSETS - 100% | $ 2,665,655,327 |
Legend |
(a) Non-income producing |
(b) Affiliated fund that is available only to investment companies and other accounts managed by Fidelity Investments. The rate quoted is the annualized seven-day yield of the fund at period end. A complete unaudited listing of the fund's holdings as of its most recent quarter end is available upon request. In addition, each Fidelity Central Fund's financial statements, which are not covered by the Fund's Report of Independent Registered Public Accounting Firm, are available on the SEC's website or upon request. |
(c) Investment made with cash collateral received from securities on loan. |
(d) Security or a portion of the security is on loan at period end. |
Affiliated Central Funds |
Information regarding fiscal year to date income earned by the Fund from investments in Fidelity Central Funds is as follows: |
Fund | Income earned |
Fidelity Cash Central Fund | $ 160,159 |
Fidelity Securities Lending Cash Central Fund | 5,191,463 |
Total | $ 5,351,622 |
Other Affiliated Issuers |
An affiliated company is a company in which the Fund has ownership of at least 5% of the voting securities. Fiscal year to date transactions with companies which are or were affiliates are as follows: |
Affiliate | Value,
beginning of period | Purchases | Sales
Proceeds | Dividend
Income | Value,
end of
period |
Bulgari SpA | $ 203,182,267 | $ - | $ 281,121,110 | $ - | $ - |
Other Information |
The following is a summary of the inputs used, as of October 31, 2011, involving the Fund's assets and liabilities carried at fair value. The inputs or methodology used for valuing securities may not be an indication of the risk associated with investing in those securities. For more information on valuation inputs, and their aggregation into the levels used in the table below, please refer to the Security Valuation section in the accompanying Notes to Financial Statements. |
Valuation Inputs at Reporting Date: |
Description | Total | Level 1 | Level 2 | Level 3 |
Investments in Securities: | | | | |
Equities: | | | | |
France | $ 571,615,011 | $ 529,245,560 | $ 42,369,451 | $ - |
Germany | 436,303,263 | 349,786,333 | 86,516,930 | - |
Japan | 311,896,534 | 27,463,150 | 284,433,384 | - |
United Kingdom | 309,971,758 | 207,519,191 | 102,452,567 | - |
Australia | 116,107,000 | - | 116,107,000 | - |
Switzerland | 109,237,573 | 88,731,467 | 20,506,106 | - |
Italy | 100,893,823 | 70,738,280 | 30,155,543 | - |
Spain | 68,709,264 | 47,471,278 | 21,237,986 | - |
Belgium | 67,104,016 | 36,204,263 | 30,899,753 | - |
Other | 356,005,095 | 214,857,239 | 141,147,856 | - |
Money Market Funds | 164,682,422 | 164,682,422 | - | - |
Total Investments in Securities: | $ 2,612,525,759 | $ 1,736,699,183 | $ 875,826,576 | $ - |
Income Tax Information |
At October 31, 2011, the Fund had a capital loss carryforward of approximately $1,404,099,728 of which $464,379,963 and $939,719,765 will expire in fiscal 2016 and 2017, respectively. Capital loss carryforwards are only available to offset future capital gains of the Fund to the extent provided by regulations and may be limited. |
See accompanying notes which are an integral part of the financial statements.
Annual Report
Fidelity Overseas Fund
Statement of Assets and Liabilities
| October 31, 2011 |
| | |
Assets | | |
Investment in securities, at value (including securities loaned of $50,400,053) - See accompanying schedule: Unaffiliated issuers (cost $2,593,433,852) | $ 2,447,843,337 | |
Fidelity Central Funds (cost $164,682,422) | 164,682,422 | |
Total Investments (cost $2,758,116,274) | | $ 2,612,525,759 |
Receivable for investments sold | | 110,952,123 |
Receivable for fund shares sold | | 1,634,900 |
Dividends receivable | | 5,965,239 |
Distributions receivable from Fidelity Central Funds | | 23,470 |
Prepaid expenses | | 9,074 |
Other receivables | | 678,463 |
Total assets | | 2,731,789,028 |
| | |
Liabilities | | |
Payable for investments purchased | $ 6,836,279 | |
Payable for fund shares redeemed | 3,967,436 | |
Accrued management fee | 600,742 | |
Other affiliated payables | 587,074 | |
Other payables and accrued expenses | 270,655 | |
Collateral on securities loaned, at value | 53,871,515 | |
Total liabilities | | 66,133,701 |
| | |
Net Assets | | $ 2,665,655,327 |
Net Assets consist of: | | |
Paid in capital | | $ 4,192,677,485 |
Undistributed net investment income | | 64,516,366 |
Accumulated undistributed net realized gain (loss) on investments and foreign currency transactions | | (1,445,970,878) |
Net unrealized appreciation (depreciation) on investments and assets and liabilities in foreign currencies | | (145,567,646) |
Net Assets | | $ 2,665,655,327 |
| | |
Overseas:
Net Asset Value, offering price and redemption price per share ($2,215,717,141 ÷ 75,674,848 shares) | | $ 29.28 |
| | |
Class K:
Net Asset Value, offering price and redemption price per share ($291,322,522 ÷ 9,945,947 shares) | | $ 29.29 |
| | |
Class F:
Net Asset Value, offering price and redemption price per share ($158,615,664 ÷ 5,416,305 shares) | | $ 29.28 |
Statement of Operations
| Year ended October 31, 2011 |
| | |
Investment Income | | |
Dividends | | $ 106,408,357 |
Interest | | 341 |
Income from Fidelity Central Funds (including $5,191,463 from security lending) | | 5,351,622 |
Income before foreign taxes withheld | | 111,760,320 |
Less foreign taxes withheld | | (10,352,518) |
Total income | | 101,407,802 |
| | |
Expenses | | |
Management fee
Basic fee | $ 33,992,894 | |
Performance adjustment | (12,048,698) | |
Transfer agent fees | 9,056,901 | |
Accounting and security lending fees | 1,552,334 | |
Custodian fees and expenses | 591,988 | |
Independent trustees' compensation | 28,317 | |
Depreciation in deferred trustee compensation account | (202) | |
Registration fees | 55,135 | |
Audit | 96,290 | |
Legal | 31,934 | |
Interest | 11,891 | |
Miscellaneous | 69,904 | |
Total expenses before reductions | 33,438,688 | |
Expense reductions | (2,850,941) | 30,587,747 |
Net investment income (loss) | | 70,820,055 |
Realized and Unrealized Gain (Loss) Net realized gain (loss) on: | | |
Investment securities: | | |
Unaffiliated issuers | 153,344,292 | |
Other affiliated issuers | 128,743,195 | |
Foreign currency transactions | 507,807 | |
Total net realized gain (loss) | | 282,595,294 |
Change in net unrealized appreciation (depreciation) on: Investment securities | (435,576,882) | |
Assets and liabilities in foreign currencies | (825,030) | |
Total change in net unrealized appreciation (depreciation) | | (436,401,912) |
Net gain (loss) | | (153,806,618) |
Net increase (decrease) in net assets resulting from operations | | $ (82,986,563) |
See accompanying notes which are an integral part of the financial statements.
Annual Report
Statement of Changes in Net Assets
| Year ended
October 31,
2011 | Year ended
October 31,
2010 |
Increase (Decrease) in Net Assets | | |
Operations | | |
Net investment income (loss) | $ 70,820,055 | $ 98,164,015 |
Net realized gain (loss) | 282,595,294 | 180,555,258 |
Change in net unrealized appreciation (depreciation) | (436,401,912) | 94,849,228 |
Net increase (decrease) in net assets resulting from operations | (82,986,563) | 373,568,501 |
Distributions to shareholders from net investment income | (92,196,839) | (108,455,793) |
Distributions to shareholders from net realized gain | - | (2,308,848) |
Total distributions | (92,196,839) | (110,764,641) |
Share transactions - net increase (decrease) | (3,671,962,139) | (771,649,789) |
Redemption fees | 112,180 | 54,523 |
Total increase (decrease) in net assets | (3,847,033,361) | (508,791,406) |
| | |
Net Assets | | |
Beginning of period | 6,512,688,688 | 7,021,480,094 |
End of period (including undistributed net investment income of $64,516,366 and undistributed net investment income of $85,893,161, respectively) | $ 2,665,655,327 | $ 6,512,688,688 |
Financial Highlights - Overseas
Years ended October 31, | 2011 | 2010 | 2009 | 2008 | 2007 |
Selected Per-Share Data | | | | | |
Net asset value, beginning of period | $ 31.56 | $ 30.13 | $ 25.43 | $ 58.39 | $ 47.08 |
Income from Investment Operations | | | | | |
Net investment income (loss) B | .47 | .42 | .52 | .55 | .70 |
Net realized and unrealized gain (loss) | (2.27) | 1.49 | 4.55 | (27.19) | 15.80 |
Total from investment operations | (1.80) | 1.91 | 5.07 | (26.64) | 16.50 |
Distributions from net investment income | (.48) | (.47) | (.37) | (.57) | (.55) |
Distributions from net realized gain | - | (.01) | - | (5.75) | (4.64) |
Total distributions | (.48) | (.48) | (.37) | (6.32) | (5.19) |
Redemption fees added to paid in capital B,F | - | - | - | - | - |
Net asset value, end of period | $ 29.28 | $ 31.56 | $ 30.13 | $ 25.43 | $ 58.39 |
Total Return A | (5.83)% | 6.33% | 20.44% | (50.88)% | 38.79% |
Ratios to Average Net Assets C,E | | | | | |
Expenses before reductions | .73% | .89% | 1.02% | 1.13% | .95% |
Expenses net of fee waivers, if any | .73% | .89% | 1.02% | 1.13% | .95% |
Expenses net of all reductions | .67% | .85% | .98% | 1.10% | .91% |
Net investment income (loss) | 1.44% | 1.41% | 2.01% | 1.33% | 1.43% |
Supplemental Data | | | | | |
Net assets, end of period (000 omitted) | $ 2,215,717 | $ 5,548,689 | $ 6,602,017 | $ 5,464,901 | $ 9,543,353 |
Portfolio turnover rate D | 77% | 111% | 115% | 113% | 87% |
A Total returns would have been lower if certain expenses had not been reduced during the applicable periods shown.
B Calculated based on average shares outstanding during the period.
C Fees and expenses of any underlying Fidelity Central Funds are not included in the Fund's expense ratio. The Fund indirectly bears its proportionate share of the expenses of any underlying Fidelity Central Funds.
D Amount does not include the portfolio activity of any underlying Fidelity Central Funds.
E Expense ratios reflect operating expenses of the class. Expenses before reductions do not reflect amounts reimbursed by the investment adviser or reductions from brokerage service arrangements or reductions from other expense offset arrangements and do not represent the amount paid by the class during periods when reimbursements or reductions occur. Expenses net of fee waivers reflect expenses after reimbursement by the investment adviser but prior to reductions from brokerage service arrangements or other expense offset arrangements. Expenses net of all reductions represent the net expenses paid by the class.
F Amount represents less than $.01 per share.
See accompanying notes which are an integral part of the financial statements.
Annual Report
Financial Highlights - Class K
Years ended October 31, | 2011 | 2010 | 2009 | 2008 G |
Selected Per-Share Data | | | | |
Net asset value, beginning of period | $ 31.59 | $ 30.16 | $ 25.45 | $ 45.00 |
Income from Investment Operations | | | | |
Net investment income (loss) D | .52 | .47 | .59 | .13 |
Net realized and unrealized gain (loss) | (2.27) | 1.50 | 4.54 | (19.68) |
Total from investment operations | (1.75) | 1.97 | 5.13 | (19.55) |
Distributions from net investment income | (.55) | (.53) | (.42) | - |
Distributions from net realized gain | - | (.01) | - | - |
Total distributions | (.55) | (.54) | (.42) | - |
Redemption fees added to paid in capital D,I | - | - | - | - |
Net asset value, end of period | $ 29.29 | $ 31.59 | $ 30.16 | $ 25.45 |
Total Return B,C | (5.67)% | 6.55% | 20.73% | (43.44)% |
Ratios to Average Net Assets E,H | | | | |
Expenses before reductions | .56% | .69% | .78% | .96% A |
Expenses net of fee waivers, if any | .55% | .69% | .78% | .96% A |
Expenses net of all reductions | .50% | .66% | .74% | .93% A |
Net investment income (loss) | 1.61% | 1.60% | 2.25% | 1.08% A |
Supplemental Data | | | | |
Net assets, end of period (000 omitted) | $ 291,323 | $ 368,004 | $ 383,048 | $ 44,277 |
Portfolio turnover rate F | 77% | 111% | 115% | 113% |
A Annualized
B Total returns for periods of less than one year are not annualized.
C Total returns would have been lower if certain expenses had not been reduced during the applicable periods shown.
D Calculated based on average shares outstanding during the period.
E Fees and expenses of any underlying Fidelity Central Funds are not included in the Fund's expense ratio. The Fund indirectly bears its proportionate share of the expenses of any underlying Fidelity Central Funds.
F Amount does not include the portfolio activity of any underlying Fidelity Central Funds.
G For the period May 9, 2008 (commencement of sale of shares) to October 31, 2008.
H Expense ratios reflect operating expenses of the class. Expenses before reductions do not reflect amounts reimbursed by the investment adviser or reductions from brokerage service arrangements or reductions from other expense offset arrangements and do not represent the amount paid by the class during periods when reimbursements or reductions occur. Expense ratios before reductions for start-up periods may not be representative of longer-term operating periods. Expenses net of fee waivers reflect expenses after reimbursement by the investment adviser but prior to reductions from brokerage service arrangements or other expense offset arrangements. Expenses net of all reductions represent the net expenses paid by the class.
I Amount represents less than $.01 per share.
Financial Highlights - Class F
Years ended October 31, | 2011 | 2010 | 2009 G |
Selected Per-Share Data | | | |
Net asset value, beginning of period | $ 31.58 | $ 30.15 | $ 26.62 |
Income from Investment Operations | | | |
Net investment income (loss) D | .54 | .48 | .07 |
Net realized and unrealized gain (loss) | (2.27) | 1.51 | 3.46 |
Total from investment operations | (1.73) | 1.99 | 3.53 |
Distributions from net investment income | (.57) | (.55) | - |
Distributions from net realized gain | - | (.01) | - |
Total distributions | (.57) | (.56) | - |
Redemption fees added to paid in capital D,I | - | - | - |
Net asset value, end of period | $ 29.28 | $ 31.58 | $ 30.15 |
Total Return B,C | (5.62)% | 6.60% | 13.26% |
Ratios to Average Net Assets E,H | | | |
Expenses before reductions | .51% | .64% | .68% A |
Expenses net of fee waivers, if any | .50% | .64% | .68% A |
Expenses net of all reductions | .45% | .60% | .64% A |
Net investment income (loss) | 1.67% | 1.66% | .70% A |
Supplemental Data | | | |
Net assets, end of period (000 omitted) | $ 158,616 | $ 595,995 | $ 36,415 |
Portfolio turnover rate F | 77% | 111% | 115% |
A Annualized
B Total returns for periods of less than one year are not annualized.
C Total returns would have been lower if certain expenses had not been reduced during the applicable periods shown.
D Calculated based on average shares outstanding during the period.
E Fees and expenses of any underlying Fidelity Central Funds are not included in the Fund's expense ratio. The Fund indirectly bears its proportionate share of the expenses of any underlying Fidelity Central Funds.
F Amount does not include the portfolio activity of any underlying Fidelity Central Funds.
G For the period June 26, 2009 (commencement of sale of shares) to October 31, 2009.
H Expense ratios reflect operating expenses of the class. Expenses before reductions do not reflect amounts reimbursed by the investment adviser or reductions from brokerage service arrangements or reductions from other expense offset arrangements and do not represent the amount paid by the class during periods when reimbursements or reductions occur. Expense ratios before reductions for start-up periods may not be representative of longer-term operating periods. Expenses net of fee waivers reflect expenses after reimbursement by the investment adviser but prior to reductions from brokerage service arrangements or other expense offset arrangements. Expenses net of all reductions represent the net expenses paid by the class.
I Amount represents less than $.01 per share.
See accompanying notes which are an integral part of the financial statements.
Annual Report
Notes to Financial Statements
For the period ended October 31, 2011
1. Organization.
Fidelity Overseas Fund (the Fund) is a fund of Fidelity Investment Trust (the Trust) and is authorized to issue an unlimited number of shares. The Trust is registered under the Investment Company Act of 1940, as amended (the 1940 Act), as an open-end management investment company organized as a Massachusetts business trust. The Fund offers Overseas, Class K and Class F shares, each of which has equal rights as to assets and voting privileges. Each class has exclusive voting rights with respect to matters that affect that class. Class F shares of the Fund are only available for purchase by mutual funds for which Fidelity Management & Research Company (FMR) or an affiliate serves as investment manager. Investment income, realized and unrealized capital gains and losses, the common expenses of the Fund, and certain fund-level expense reductions, if any, are allocated on a pro-rata basis to each class based on the relative net assets of each class to the total net assets of the Fund. Each class differs with respect to transfer agent fees incurred. Certain expense reductions may also differ by class. The Fund's investments in emerging markets can be subject to social, economic, regulatory, and political uncertainties and can be extremely volatile.
2. Investments in Fidelity Central Funds.
The Fund invests in Fidelity Central Funds, which are open-end investment companies available only to other investment companies and accounts managed by Fidelity Management & Research Company (FMR) and its affiliates. The Fund's Schedule of Investments lists each of the Fidelity Central Funds held as of period end, if any, as an investment of the Fund, but does not include the underlying holdings of each Fidelity Central Fund. As an Investing Fund, the Fund indirectly bears its proportionate share of the expenses of the underlying Fidelity Central Funds.
The Money Market Central Funds seek preservation of capital and current income and are managed by Fidelity Investments Money Management, Inc. (FIMM), an affiliate of FMR.
A complete unaudited list of holdings for each Fidelity Central Fund is available upon request or at the Securities and Exchange Commission (the SEC) web site at www.sec.gov. In addition, the financial statements of the Fidelity Central Funds, which are not covered by the Fund's Report of Independent Registered Public Accounting Firm are available on the SEC web site or upon request.
3. Significant Accounting Policies.
The financial statements have been prepared in conformity with accounting principles generally accepted in the United States of America (GAAP), which require management to make certain estimates and assumptions at the date of the financial statements. Actual results could differ from those estimates. Subsequent events, if any, through the date that the financial statements were issued have been evaluated in the preparation of the financial statements. The following summarizes the significant accounting policies of the Fund:
Security Valuation. Investments are valued as of 4:00 p.m. Eastern time on the last calendar day of the period. The Fund uses independent pricing services approved by the Board of Trustees to value its investments. When current market prices or quotations are not readily available or reliable, valuations may be determined in good faith in accordance with procedures adopted by the Board of Trustees. Factors used in determining value may include market or security specific events. The frequency with which these procedures are used cannot be predicted and they may be utilized to a significant extent. The value used for net asset value (NAV) calculation under these procedures may differ from published prices for the same securities.
The Fund categorizes the inputs to valuation techniques used to value its investments into a disclosure hierarchy consisting of three levels as shown below:
Level 1 - quoted prices in active markets for identical investments
Level 2 - other significant observable inputs (including quoted prices for similar investments, interest rates, prepayment speeds, etc.)
Level 3 - unobservable inputs (including the Fund's own assumptions based on the best information available)
Changes in valuation techniques may result in transfers in or out of an assigned level within the disclosure hierarchy. The aggregate value of investments by input level, as of October 31, 2011, is included at the end of the Fund's Schedule of Investments. Valuation techniques used to value the Fund's investments by major category are as follows:
Equity securities, including restricted securities, for which market quotations are readily available, are valued at the last reported sale price or official closing price as reported by an independent pricing service on the primary market or exchange on which they are traded and are categorized as Level 1 in the hierarchy. In the event there were no sales during the day or closing prices are not available, securities are valued at the last quoted bid price or may be valued using the last available price and are generally categorized as Level 2 in the hierarchy. For foreign equity securities, when significant market or security specific events arise, comparisons to the valuation of American Depositary Receipts (ADRs), futures contracts, Exchange-traded funds (ETFs) and certain indexes as well as quoted prices for similar securities are used and are categorized as Level 2 in the hierarchy in these circumstances. Utilizing these techniques may result in transfers between Level 1 and Level 2. For restricted equity securities and private placements where observable inputs are limited, assumptions about market activity and risk are used and are categorized as Level 3 in the hierarchy.
Annual Report
Notes to Financial Statements - continued
3. Significant Accounting Policies - continued
Security Valuation - continued
Investments in open-end mutual funds, including Fidelity Central Funds, are valued at their closing net asset value each business day and are categorized as Level 1 in the hierarchy.
Foreign Currency. The Fund may use foreign currency contracts to facilitate transactions in foreign-denominated securities. Gains and losses from these transactions may arise from changes in the value of the foreign currency or if the counterparties do not perform under the contracts' terms.
Foreign-denominated assets, including investment securities, and liabilities are translated into U.S. dollars at the exchange rate at period end. Purchases and sales of investment securities, income and dividends received and expenses denominated in foreign currencies are translated into U.S. dollars at the exchange rate in effect on the transaction date.
The effects of exchange rate fluctuations on investments are included with the net realized and unrealized gain (loss) on investment securities. Other foreign currency transactions resulting in realized and unrealized gain (loss) are disclosed separately.
Investment Transactions and Income. For financial reporting purposes, the Fund's investment holdings and NAV include trades executed through the end of the last business day of the period. The NAV per share for processing shareholder transactions is calculated as of the close of business of the New York Stock Exchange (NYSE), normally 4:00 p.m. Eastern time and includes trades executed through the end of the prior business day. Gains and losses on securities sold are determined on the basis of identified cost and may include proceeds received from litigation. Dividend income is recorded on the ex-dividend date, except for certain dividends from foreign securities where the ex-dividend date may have passed, which are recorded as soon as the Fund is informed of the ex-dividend date. Non-cash dividends included in dividend income, if any, are recorded at the fair market value of the securities received. Distributions received on securities that represent a return of capital or capital gain are recorded as a reduction of cost of investments and/or as a realized gain. The Fund estimates the components of distributions received that may be considered return of capital distributions or capital gain distributions. Interest income and distributions from the Fidelity Central Funds are accrued as earned. Interest income includes coupon interest and amortization of premium and accretion of discount on debt securities. Investment income is recorded net of foreign taxes withheld where recovery of such taxes is uncertain.
Expenses. Expenses directly attributable to a fund are charged to that fund. Expenses attributable to more than one fund are allocated among the respective funds on the basis of relative net assets or other appropriate methods. Expense estimates are accrued in the period to which they relate and adjustments are made when actual amounts are known.
Deferred Trustee Compensation. Under a Deferred Compensation Plan (the Plan), independent Trustees may elect to defer receipt of a portion of their annual compensation. Deferred amounts are invested in a cross-section of Fidelity funds, are marked-to-market and remain in the Fund until distributed in accordance with the Plan. The investment of deferred amounts and the offsetting payable to the Trustees are included in the accompanying Statement of Assets and Liabilities.
Income Tax Information and Distributions to Shareholders. Each year, the Fund intends to qualify as a regulated investment company, including distributing substantially all of its taxable income and realized gains under Subchapter M of the Internal Revenue Code and filing its U.S. federal tax return. As a result, no provision for income taxes is required. As of October 31, 2011, the Fund did not have any unrecognized tax benefits in the financial statements. A fund's federal tax return is subject to examination by the Internal Revenue Service (IRS) for a period of three years. Foreign taxes are provided for based on the Fund's understanding of the tax rules and rates that exist in the foreign markets in which it invests.
Distributions are declared and recorded on the ex-dividend date. Income dividends and capital gain distributions are declared separately for each class. Income and capital gain distributions are determined in accordance with income tax regulations, which may differ from GAAP.
Capital accounts within the financial statements are adjusted for permanent book-tax differences. These adjustments have no impact on net assets or the results of operations. Temporary book-tax differences will reverse in a subsequent period.
Book-tax differences are primarily due to foreign currency transactions, passive foreign investment companies (PFIC), deferred trustees compensation, capital loss carryforwards and losses deferred due to wash sales.
The federal tax cost of investment securities and unrealized appreciation (depreciation) as of period end were as follows:
Gross unrealized appreciation | $ 141,984,065 |
Gross unrealized depreciation | (330,927,046) |
Net unrealized appreciation (depreciation) on securities and other investments | $ (188,942,981) |
| |
Tax Cost | $ 2,801,468,740 |
Annual Report
3. Significant Accounting Policies - continued
Income Tax Information and Distributions to Shareholders - continued
The tax-based components of distributable earnings as of period end were as follows:
Undistributed ordinary income | $ 66,157,333 |
Capital Loss Carryfoward | $ (1,404,099,728) |
Net unrealized appreciation (depreciation) | $ (188,920,112) |
Under the recently enacted Regulated Investment Company Modernization Act of 2010 (the Act), the Fund will be permitted to carry forward capital losses incurred in taxable years beginning after December 22, 2010 for an unlimited period. However, any losses incurred during those future taxable years will be required to be utilized prior to any losses incurred in pre-enactment taxable years, which generally expire after eight years from when they are incurred. Additionally, post-enactment capital losses that are carried forward will retain their character as either short-term or long-term capital losses rather than being considered all short-term as under previous law. The Fund's first fiscal year end subject to the Act will be October 31, 2012.
The tax character of distributions paid was as follows:
| October 31, 2011 | October 31, 2010 |
Ordinary Income | $ 92,196,839 | $ 110,764,641 |
Short-Term Trading (Redemption) Fees. Shares held by investors in the Fund less than 30 days are subject to a redemption fee equal to 1.00% of the net asset value of shares redeemed. All redemption fees, which reduce the proceeds of the shareholder redemption, are retained by the Fund and accounted for as an addition to paid in capital.
New Accounting Pronouncement. In May 2011, the Financial Accounting Standards Board issued Accounting Standard Update No. 2011-04, Fair Value Measurement (Topic 820) - Amendments to Achieve Common Fair Value Measurement and Disclosure Requirements in U.S. GAAP and IFRSs. The update changes the wording used to describe the requirements in GAAP for measuring fair value and for disclosing information about fair value measurements. The update is effective during interim and annual periods beginning after December 15, 2011. Management is currently evaluating the impact of the update's adoption on the Fund's financial statement disclosures.
4. Purchases and Sales of Investments.
Purchases and sales of securities, other than short-term securities, aggregated $3,586,445,773 and $7,406,044,368, respectively.
5. Fees and Other Transactions with Affiliates.
Management Fee. FMR and its affiliates provide the Fund with investment management related services for which the Fund pays a monthly management fee. The management fee is the sum of an individual fund fee rate that is based on an annual rate of .45% of the Fund's average net assets and a group fee rate that averaged .26% during the period. The group fee rate is based upon the average net assets of all the mutual funds advised by FMR. The group fee rate decreases as assets under management increase and increases as assets under management decrease. In addition, the management fee is subject to a performance adjustment (up to a maximum of ± .20% of the Fund's average net assets over a 36 month performance period). The upward or downward adjustment to the management fee is based on the relative investment performance of Overseas as compared to an appropriate benchmark index. For the period, the total annual management fee rate, including the performance adjustment, was .46% of the Fund's average net assets.
Transfer Agent Fees. Fidelity Investments Institutional Operations Company, Inc. (FIIOC), an affiliate of FMR, is the transfer, dividend disbursing and shareholder servicing agent for each class of the Fund. FIIOC receives account fees and asset-based fees that vary according to the account size and type of account of the shareholders of Overseas. FIIOC receives an asset-based fee of Class K's average net assets. FIIOC receives no fees for providing transfer agency services to Class F. FIIOC pays for typesetting, printing and mailing of shareholder reports, except proxy statements. For the period, transfer agent fees for each class were as follows:
| Amount | % of
Average
Net Assets |
Overseas | $ 8,886,248 | .23 |
Class K | 170,653 | .05 |
| $ 9,056,901 | |
Annual Report
Notes to Financial Statements - continued
5. Fees and Other Transactions with Affiliates - continued
Accounting and Security Lending Fees. Fidelity Service Company, Inc. (FSC), an affiliate of FMR, maintains the Fund's accounting records. The accounting fee is based on the level of average net assets for the month. Under a separate contract, FSC administers the security lending program. The security lending fee is based on the number and duration of lending transactions.
Brokerage Commissions. The Fund placed a portion of its portfolio transactions with brokerage firms which are affiliates of the investment adviser. The commissions paid to these affiliated firms were $9,611 for the period.
Interfund Lending Program. Pursuant to an Exemptive Order issued by the SEC, the Fund, along with other registered investment companies having management contracts with FMR, may participate in an interfund lending program. This program provides an alternative credit facility allowing the funds to borrow from, or lend money to, other participating affiliated funds. At period end, there were no interfund loans outstanding. The Fund's activity in this program during the period for which loans were outstanding was as follows:
Borrower or Lender | Average Daily
Loan Balance | Weighted Average Interest Rate | Interest
Expense |
Borrower | $ 29,270,410 | .38% | $ 11,891 |
6. Committed Line of Credit.
The Fund participates with other funds managed by FMR or an affiliate in a $4.0 billion credit facility (the "line of credit") to be utilized for temporary or emergency purposes to fund shareholder redemptions or for other short-term liquidity purposes. The Fund has agreed to pay commitment fees on its pro-rata portion of the line of credit, which amounted to $16,069 and is reflected in Miscellaneous expenses on the Statement of Operations. During the period, there were no borrowings on this line of credit.
7. Security Lending.
The Fund lends portfolio securities through a lending agent from time to time in order to earn additional income. For equity securities, a lending agent is used and may loan securities to certain qualified borrowers, including Fidelity Capital Markets (FCM), a broker-dealer affiliated with the Fund. On the settlement date of the loan, the Fund receives collateral (in the form of U.S. Treasury obligations, letters of credit and/or cash) against the loaned securities and maintains collateral in an amount not less than 100% of the market value of the loaned securities during the period of the loan. The market value of the loaned securities is determined at the close of business of the Fund and any additional required collateral is delivered to the Fund on the next business day. If the borrower defaults on its obligation to return the securities loaned because of insolvency or other reasons, a fund could experience delays and costs in recovering the securities loaned or in gaining access to the collateral. Any cash collateral received is invested in the Fidelity Securities Lending Cash Central Fund. The value of loaned securities and cash collateral at period end are disclosed on the Fund's Statement of Assets and Liabilities. Security lending income represents the income earned on investing cash collateral, less rebates paid to borrowers and any lending agent fees associated with the loan, plus any premium payments received for lending certain types of securities. Security lending income is presented in the Statement of Operations as a component of income from Fidelity Central Funds and includes $7,328 from securities loaned to FCM.
8. Expense Reductions.
FMR voluntarily agreed to reimburse a portion of its management fee. For the period, the amount of this reimbursement was $375,674.
Many of the brokers with whom FMR places trades on behalf of the Fund provided services in addition to trade execution. These services included payments of certain expenses on behalf of the Fund totaling $2,474,743 for the period. In addition through arrangements with the Fund's custodian, credits realized as a result of uninvested cash balances were used to reduce the Fund's expenses. During the period, these credits reduced the Fund's custody expenses by $524.
Annual Report
9. Distributions to Shareholders.
Distributions to shareholders of each class were as follows:
Years ended October 31, | 2011 | 2010 |
From net investment income | | |
Overseas | $ 75,897,727 | $ 100,374,591 |
Class K | 6,408,873 | 6,711,130 |
Class F | 9,890,239 | 1,370,072 |
Total | $ 92,196,839 | $ 108,455,793 |
From net realized gain | | |
Overseas | $ - | $ 2,158,312 |
Class K | - | 126,111 |
Class F | - | 24,425 |
Total | $ - | $ 2,308,848 |
10. Share Transactions.
Transactions for each class of shares were as follows:
| Shares | Dollars |
Years ended October 31, | 2011 | 2010 | 2011 | 2010 |
Overseas | | | | |
Shares sold | 10,588,919 | 36,113,789 | $ 338,680,110 | $ 1,067,886,397 |
Reinvestment of distributions | 2,356,512 | 3,238,247 | 75,196,294 | 101,747,555 |
Shares redeemed | (113,084,725) | (82,678,886) | (3,611,089,764) | (2,430,908,864) |
Net increase (decrease) | (100,139,294) | (43,326,850) | $ (3,197,213,360) | $ (1,261,274,912) |
Class K | | | | |
Shares sold | 4,129,689 | 5,090,117 | $ 128,992,232 | $ 151,156,491 |
Reinvestment of distributions | 201,094 | 217,803 | 6,408,873 | 6,837,242 |
Shares redeemed | (6,034,878) | (6,358,836) | (198,074,826) | (189,093,826) |
Net increase (decrease) | (1,704,095) | (1,050,916) | $ (62,673,721) | $ (31,100,093) |
Class F | | | | |
Shares sold | 12,066,248 | 22,173,982 | $ 388,123,231 | $ 652,570,206 |
Reinvestment of distributions | 310,526 | 44,465 | 9,890,239 | 1,394,498 |
Shares redeemed | (25,830,866) | (4,555,729) | (810,088,528) | (133,239,488) |
Net increase (decrease) | (13,454,092) | 17,662,718 | $ (412,075,058) | $ 520,725,216 |
11. Other.
The Fund's organizational documents provide former and current trustees and officers with a limited indemnification against liabilities arising in connection with the performance of their duties to the Fund. In the normal course of business, the Fund may also enter into contracts that provide general indemnifications. The Fund's maximum exposure under these arrangements is unknown as this would be dependent on future claims that may be made against the Fund. The risk of material loss from such claims is considered remote.
Annual Report
Report of Independent Registered Public Accounting Firm
To the Trustees of Fidelity Investment Trust and the Shareholders of Fidelity Overseas Fund:
In our opinion, the accompanying statement of assets and liabilities, including the schedule of investments, and the related statements of operations and of changes in net assets and the financial highlights present fairly, in all material respects, the financial position of Fidelity Overseas Fund (a fund of Fidelity Investment Trust) at October 31, 2011, the results of its operations for the year then ended, the changes in its net assets for each of the two years in the period then ended and the financial highlights for each of the periods indicated, in conformity with accounting principles generally accepted in the United States of America. These financial statements and financial highlights (hereafter referred to as "financial statements") are the responsibility of the Fidelity Overseas Fund's management. Our responsibility is to express an opinion on these financial statements based on our audits. We conducted our audits of these financial statements in accordance with the standards of the Public Company Accounting Oversight Board (United States). Those standards require that we plan and perform the audit to obtain reasonable assurance about whether the financial statements are free of material misstatement. An audit includes examining, on a test basis, evidence supporting the amounts and disclosures in the financial statements, assessing the accounting principles used and significant estimates made by management, and evaluating the overall financial statement presentation. We believe that our audits, which included confirmation of securities at October 31, 2011 by correspondence with the custodian and brokers, provide a reasonable basis for our opinion.
PricewaterhouseCoopers LLP
Boston, Massachusetts
December 16, 2011
Annual Report
Fidelity Worldwide Fund
As a shareholder of the Fund, you incur two types of costs: (1) transaction costs, including sales charges (loads) on purchase payments or redemption proceeds, redemption fees, and (2) ongoing costs, including management fees, distribution and/or service (12b-1) fees and other Fund expenses. This Example is intended to help you understand your ongoing costs (in dollars) of investing in the Fund and to compare these costs with the ongoing costs of investing in other mutual funds.
The Example is based on an investment of $1,000 invested at the beginning of the period and held for the entire period (May 1, 2011 to October 31, 2011).
Actual Expenses
The first line of the accompanying table for each class of the Fund provides information about actual account values and actual expenses. You may use the information in this line, together with the amount you invested, to estimate the expenses that you paid over the period. Simply divide your account value by $1,000.00 (for example, an $8,600 account value divided by $1,000.00 = 8.6), then multiply the result by the number in the first line for a class of the Fund under the heading entitled "Expenses Paid During Period" to estimate the expenses you paid on your account during this period. A small balance maintenance fee of $12.00 that is charged once a year may apply for certain accounts with a value of less than $2,000. This fee is not included in the table below. If it was, the estimate of expenses you paid during the period would be higher, and your ending account value lower, by this amount. In addition, the Fund, as a shareholder in the underlying Fidelity Central Funds, will indirectly bear its pro-rata share of the fees and expenses incurred by the underlying Fidelity Central Funds. These fees and expenses are not included in the Fund's annualized expense ratio used to calculate the expense estimate in the table below.
Hypothetical Example for Comparison Purposes
The second line of the accompanying table for each class of the Fund provides information about hypothetical account values and hypothetical expenses based on a Class' actual expense ratio and an assumed rate of return of 5% per year before expenses, which is not the Class' actual return. The hypothetical account values and expenses may not be used to estimate the actual ending account balance or expenses you paid for the period. You may use this information to compare the ongoing costs of investing in the Fund and other funds. To do so, compare this 5% hypothetical example with the 5% hypothetical examples that appear in the shareholder reports of the other funds. A small balance maintenance fee of $12.00 that is charged once a year may apply for certain accounts with a value of less than $2,000. This fee is not included in the table below. If it was, the estimate of expenses you paid during the period would be higher, and your ending account value lower, by this amount. In addition, the Fund, as a shareholder in the underlying Fidelity Central Funds, will indirectly bear its pro-rata share of the fees and expenses incurred by the underlying Fidelity Central Funds. These fees and expenses are not included in the Fund's annualized expense ratio used to calculate the expense estimate in the table below.
Please note that the expenses shown in the table are meant to highlight your ongoing costs only and do not reflect any transaction costs. Therefore, the second line of the table is useful in comparing ongoing costs only, and will not help you determine the relative total costs of owning different funds. In addition, if these transactional costs were included, your costs would have been higher.
| Annualized
Expense Ratio | Beginning
Account Value
May 1, 2011 | Ending
Account Value
October 31, 2011 | Expenses Paid
During Period*
May 1, 2011
to October 31, 2011 |
Class A | 1.39% | | | |
Actual | | $ 1,000.00 | $ 874.80 | $ 6.57 |
HypotheticalA | | $ 1,000.00 | $ 1,018.20 | $ 7.07 |
Class T | 1.69% | | | |
Actual | | $ 1,000.00 | $ 873.20 | $ 7.98 |
HypotheticalA | | $ 1,000.00 | $ 1,016.69 | $ 8.59 |
Class B | 2.12% | | | |
Actual | | $ 1,000.00 | $ 871.50 | $ 10.00 |
HypotheticalA | | $ 1,000.00 | $ 1,014.52 | $ 10.76 |
Class C | 2.14% | | | |
Actual | | $ 1,000.00 | $ 871.70 | $ 10.10 |
HypotheticalA | | $ 1,000.00 | $ 1,014.42 | $ 10.87 |
Worldwide | 1.05% | | | |
Actual | | $ 1,000.00 | $ 876.50 | $ 4.97 |
HypotheticalA | | $ 1,000.00 | $ 1,019.91 | $ 5.35 |
Institutional Class | 1.11% | | | |
Actual | | $ 1,000.00 | $ 876.20 | $ 5.25 |
HypotheticalA | | $ 1,000.00 | $ 1,019.61 | $ 5.65 |
A 5% return per year before expenses
* Expenses are equal to each Class' annualized expense ratio, multiplied by the average account value over the period, multiplied by 184/365 (to reflect the one-half year period).
Annual Report
Fidelity Worldwide Fund
Performance: The Bottom Line
Average annual total return reflects the change in the value of an investment, assuming reinvestment of the class' distributions from dividend income and capital gains (the profits earned upon the sale of securities that have grown in value, if any) and assuming a constant rate of performance each year. The $10,000 table and the fund's returns do not reflect the deduction of taxes that a shareholder would pay on fund distributions or the redemption of fund shares. During periods of reimbursement by Fidelity, a fund's total return will be greater than it would be had the reimbursement not occurred. How a fund did yesterday is no guarantee of how it will do tomorrow.
Average Annual Total Returns
Periods ended October 31, 2011 | Past 1
year | Past 5
years | Past 10
years |
Fidelity Worldwide Fund | 3.32% | 1.61% | 6.52% |
$10,000 Over 10 Years
Let's say hypothetically that $10,000 was invested in Fidelity Worldwide Fund, a class of the fund, on October 31, 2001. The chart shows how the value of your investment would have changed, and also shows how the MSCI World Index performed over the same period.
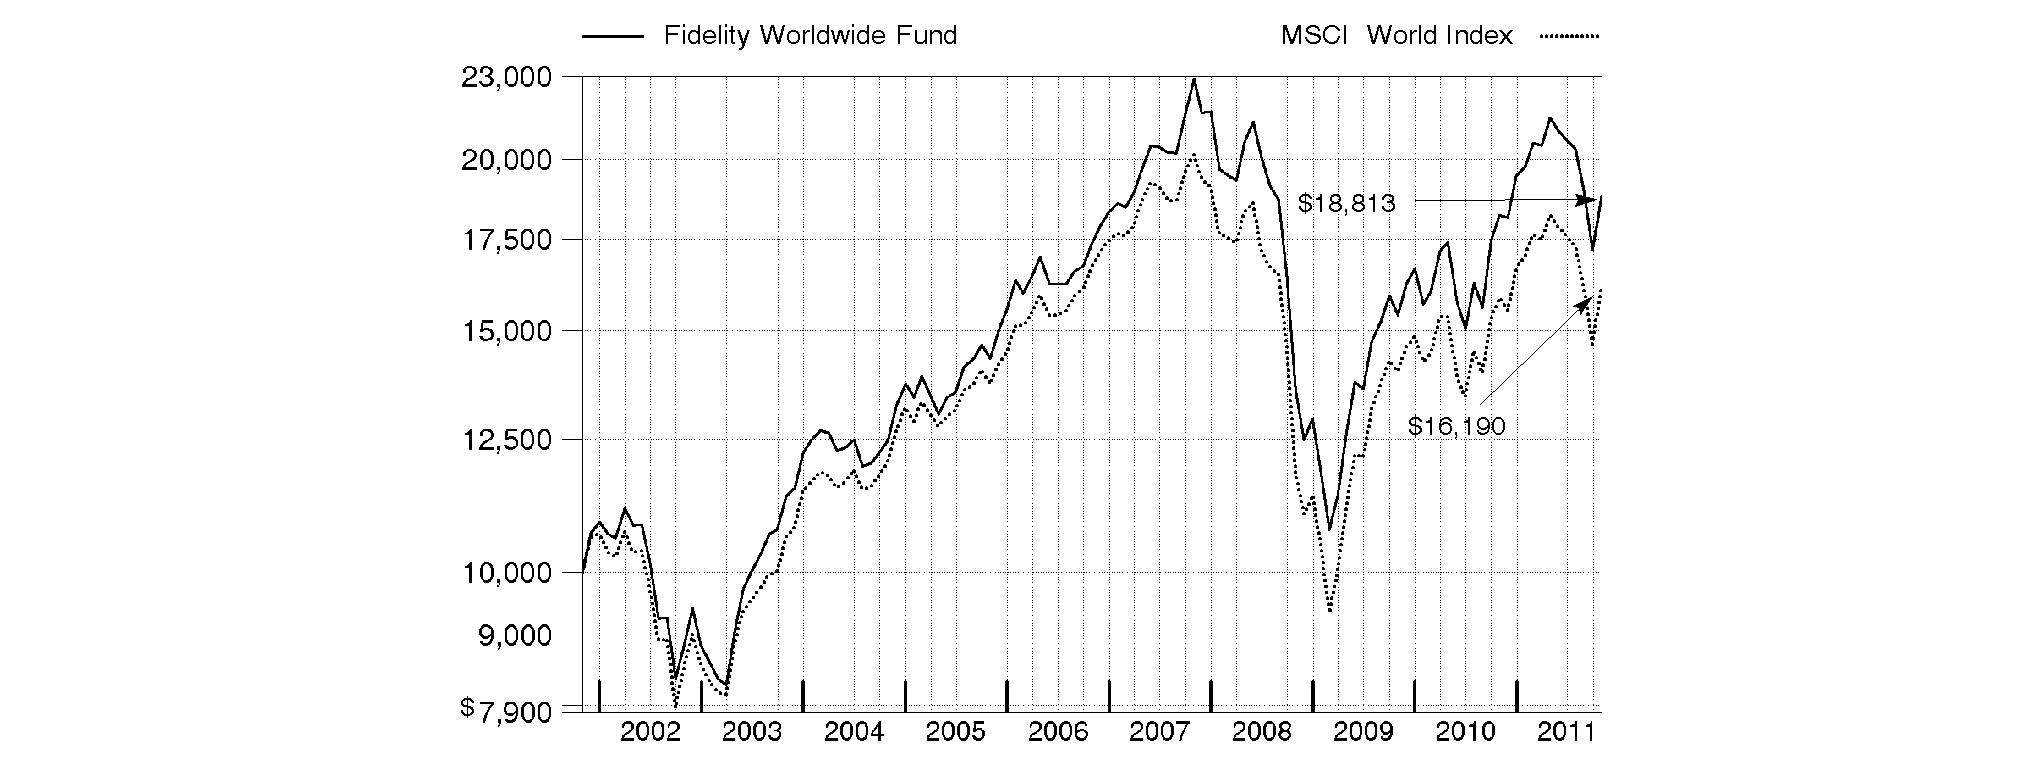
Annual Report
Fidelity Worldwide Fund
Market Recap: Global equities were rocked by a number of headline events during the year ending October 31, 2011. Stocks posted a solid advance for the first half of the period, despite concern about sovereign debt in Europe, a devastating earthquake/tsunami in Japan, and political upheaval in the Middle East and North Africa. Sentiment turned decidedly negative in the second half, however, as fresh worries about Europe, inflation in China, gridlock over raising the debt ceiling in the U.S.- along with Standard & Poor's downgrade of the nation's long-term sovereign credit rating - and a dimmed outlook for global growth caused markets to suffer declines that intensified in August and September. October brought with it yet another dramatic swing, as better-than-expected U.S. economic data and prospects for a resolution to the European debt debacle prompted buyers to storm back onto the scene in search of bargains. Those gains - along with favorable currency fluctuations overall - helped lift the MSCI® ACWI® (All Country World Index) Index 0.75% for the year. Within the index, Europe and emerging markets declined the most, with many countries in these areas sustaining steep losses. By contrast, the U.S. (+8%), which dominates the index, delivered a positive result, as did Australia (+4%) and Switzerland (+3%). Japan showed resilience in the wake of its natural disasters, falling only 2%.
Comments from William Kennedy, Lead Portfolio Manager of Fidelity® Worldwide Fund and manager of its non-U.S. equity subportfolio, and Co-Portfolio Manager Stephen DuFour, who manages the fund's U.S. equity subportfolio: For the 12 months ending October 31, 2011, the fund's Retail Class shares returned 3.32%, versus 2.12% for the MSCI® World Index. Stock selection aided relative results, particularly in the U.S., but also in Japan and Canada. Standouts included Green Mountain Coffee Roasters, maker of the Keurig® coffee system, whose stock rallied during our ownership, following the launch of a new machine and new brands. Shares of beauty products company Estee Lauder benefited from growing overseas demand, product introductions and improved operations. Card processor MasterCard saw a sizable share price gain, fueled by strong volume growth as more payments worldwide were made with plastic. Conversely, security selection and currency exposure in emerging markets detracted, as did positioning in Europe and Asia Pacific ex Japan. The fund's small cash position also hurt. Individual disappointments included France-based network equipment company Alcatel-Lucent, whose stock declined when the company failed to execute on its turnaround plan. Untimely ownership of commercial roofing supplier Carlisle Companies detracted, as did our lack of exposure to tech giant and index component International Business Machines, which rallied nicely. Some of the stocks mentioned were not in the index, and some were not in the portfolio at period end.
The views expressed above reflect those of the portfolio manager(s) only through the end of the period as stated on the cover of this report and do not necessarily represent the views of Fidelity or any other person in the Fidelity organization. Any such views are subject to change at any time based upon market or other conditions and Fidelity disclaims any responsibility to update such views. These views may not be relied on as investment advice and, because investment decisions for a Fidelity fund are based on numerous factors, may not be relied on as an indication of trading intent on behalf of any Fidelity fund.
Annual Report
Fidelity Worldwide Fund
Investment Changes (Unaudited)
Geographic Diversification (% of fund's net assets) |
As of October 31, 2011 |
| United States of America | 52.8% | |
| United Kingdom | 9.8% | |
| Japan | 7.0% | |
| France | 4.3% | |
| Switzerland | 3.2% | |
| Germany | 2.7% | |
| Canada | 2.1% | |
| Netherlands | 1.6% | |
| Australia | 1.5% | |
| Other | 15.0% | |

Percentages are adjusted for the effect of futures contracts, if applicable. |
As of April 30, 2011 |
| United States of America | 48.4% | |
| United Kingdom | 9.9% | |
| Japan | 7.4% | |
| France | 5.9% | |
| Germany | 4.1% | |
| Canada | 3.2% | |
| Switzerland | 2.4% | |
| Netherlands | 2.1% | |
| Australia | 1.9% | |
| Other | 14.7% | |

Percentages are adjusted for the effect of futures contracts, if applicable. |
Asset Allocation |
| % of fund's
net assets | % of fund's net assets
6 months ago |
Stocks | 96.6 | 94.8 |
Bonds | 0.0 | 0.1 |
Short-Term Investments and Net Other Assets | 3.4 | 5.1 |
Top Ten Stocks as of October 31, 2011 |
| % of fund's
net assets | % of fund's net assets
6 months ago |
Intuit, Inc. (United States of America, Software) | 2.7 | 1.1 |
Citigroup, Inc. (United States of America, Diversified Financial Services) | 2.6 | 0.0 |
Edwards Lifesciences Corp. (United States of America, Health Care Equipment & Supplies) | 2.2 | 1.1 |
Exxon Mobil Corp. (United States of America, Oil, Gas & Consumable Fuels) | 2.1 | 1.8 |
MasterCard, Inc. Class A (United States of America, IT Services) | 2.1 | 0.5 |
Prologis, Inc. (United States of America, Real Estate Investment Trusts) | 1.8 | 0.0 |
Union Pacific Corp. (United States of America, Road & Rail) | 1.8 | 0.0 |
Apple, Inc. (United States of America, Computers & Peripherals) | 1.8 | 1.3 |
Perrigo Co. (United States of America, Pharmaceuticals) | 1.6 | 1.2 |
British American Tobacco PLC | 1.6 | 0.3 |
| 20.3 | |
Market Sectors as of October 31, 2011 |
| % of fund's
net assets | % of fund's net assets
6 months ago |
Financials | 18.2 | 14.2 |
Consumer Discretionary | 14.7 | 14.7 |
Information Technology | 14.3 | 15.6 |
Energy | 11.4 | 12.6 |
Health Care | 10.7 | 12.1 |
Consumer Staples | 9.4 | 7.2 |
Industrials | 9.2 | 9.5 |
Materials | 4.3 | 5.0 |
Telecommunication Services | 3.0 | 3.0 |
Utilities | 1.4 | 1.0 |
Annual Report
Fidelity Worldwide Fund
Investments October 31, 2011
Showing Percentage of Net Assets
Common Stocks - 96.0% |
| Shares | | Value |
Australia - 1.5% |
Australia & New Zealand Banking Group Ltd. | 244,941 | | $ 5,535,316 |
carsales.com Ltd. (d) | 238,660 | | 1,233,872 |
Commonwealth Bank of Australia | 73,520 | | 3,777,086 |
Fortescue Metals Group Ltd. | 218,016 | | 1,095,164 |
Macquarie Group Ltd. | 17,973 | | 462,782 |
Newcrest Mining Ltd. | 92,133 | | 3,256,459 |
WorleyParsons Ltd. | 61,305 | | 1,779,531 |
TOTAL AUSTRALIA | | 17,140,210 |
Austria - 0.0% |
Osterreichische Elektrizitatswirtschafts AG | 6,500 | | 189,217 |
Bailiwick of Guernsey - 0.1% |
Ashmore Global Opportunities Ltd. (United Kingdom) | 49,599 | | 550,379 |
Bailiwick of Jersey - 0.9% |
Experian PLC | 176,600 | | 2,301,886 |
Shire PLC | 132,800 | | 4,168,784 |
Velti PLC (a) | 32,500 | | 273,650 |
Wolseley PLC | 106,760 | | 3,087,012 |
TOTAL BAILIWICK OF JERSEY | | 9,831,332 |
Belgium - 0.1% |
Anheuser-Busch InBev SA NV | 26,911 | | 1,492,596 |
Bermuda - 0.4% |
African Minerals Ltd. (a) | 177,200 | | 1,258,868 |
Cheung Kong Infrastructure Holdings Ltd. | 401,000 | | 2,148,044 |
Li & Fung Ltd. | 516,000 | | 994,432 |
Noble Group Ltd. | 529,363 | | 646,120 |
TOTAL BERMUDA | | 5,047,464 |
Brazil - 1.0% |
Anhanguera Educacional Participacoes SA | 113,300 | | 1,665,982 |
Arezzo Industria e Comercio SA | 51,200 | | 676,823 |
Itau Unibanco Banco Multiplo SA sponsored ADR | 78,300 | | 1,497,096 |
Qualicorp SA | 341,000 | | 3,117,692 |
Souza Cruz Industria Comerico | 199,500 | | 2,446,698 |
TIM Participacoes SA sponsored ADR | 82,378 | | 2,145,123 |
TOTAL BRAZIL | | 11,549,414 |
British Virgin Islands - 0.2% |
Arcos Dorados Holdings, Inc. | 45,500 | | 1,064,700 |
Mail.ru Group Ltd. GDR (Reg. S) | 43,800 | | 1,508,910 |
TOTAL BRITISH VIRGIN ISLANDS | | 2,573,610 |
Canada - 2.1% |
Canadian Natural Resources Ltd. | 34,200 | | 1,206,272 |
InterOil Corp. (a) | 10,500 | | 498,855 |
Keyera Corp. | 401,000 | | 18,291,087 |
|
| Shares | | Value |
Open Text Corp. (a) | 41,800 | | $ 2,558,277 |
Trinidad Drilling Ltd. | 206,900 | | 1,618,920 |
TOTAL CANADA | | 24,173,411 |
Cayman Islands - 1.3% |
Airtac International Group | 156,000 | | 873,143 |
Belle International Holdings Ltd. | 668,000 | | 1,310,100 |
Biostime International Holdings Ltd. | 496,500 | | 885,400 |
Bosideng International Holdings Ltd. | 2,392,000 | | 659,415 |
China Kanghui Holdings sponsored ADR (a)(d) | 105,800 | | 1,657,886 |
China Mengniu Dairy Co. Ltd. | 386,000 | | 1,229,987 |
China ZhengTong Auto Services Holdings Ltd. | 934,000 | | 1,011,347 |
Ctrip.com International Ltd. sponsored ADR (a)(d) | 52,800 | | 1,840,608 |
Hengdeli Holdings Ltd. | 1,388,000 | | 622,264 |
Microport Scientific Corp. | 738,000 | | 417,124 |
Sands China Ltd. (a) | 1,038,800 | | 3,121,789 |
Shenguan Holdings Group Ltd. | 1,912,000 | | 1,027,233 |
TOTAL CAYMAN ISLANDS | | 14,656,296 |
China - 0.7% |
Baidu.com, Inc. sponsored ADR (a) | 25,000 | | 3,504,500 |
China Telecom Corp. Ltd. (H Shares) | 2,586,000 | | 1,596,615 |
SINA Corp. (a)(d) | 18,600 | | 1,511,994 |
Zhaojin Mining Industry Co. Ltd. (H Shares) | 511,000 | | 912,331 |
TOTAL CHINA | | 7,525,440 |
Curacao - 0.5% |
Schlumberger Ltd. | 72,000 | | 5,289,840 |
Cyprus - 0.0% |
Aisi Realty Public Ltd. (a) | 12,322 | | 13,673 |
Denmark - 0.9% |
Novo Nordisk A/S Series B | 54,816 | | 5,820,540 |
William Demant Holding A/S (a) | 51,300 | | 4,093,123 |
TOTAL DENMARK | | 9,913,663 |
Finland - 0.4% |
Amer Group PLC (A Shares) | 79,900 | | 1,104,630 |
Nokian Tyres PLC | 78,500 | | 2,884,290 |
TOTAL FINLAND | | 3,988,920 |
France - 4.3% |
Air Liquide SA | 18,600 | | 2,413,176 |
Arkema SA | 26,330 | | 1,801,317 |
Atos Origin SA | 55,730 | | 2,700,909 |
AXA SA | 231,637 | | 3,773,020 |
BNP Paribas SA | 77,588 | | 3,527,237 |
Club Mediterranee SA (a) | 26,800 | | 508,484 |
Danone | 76,600 | | 5,332,139 |
Iliad SA | 38,014 | | 4,449,549 |
Ipsos SA | 3,300 | | 108,372 |
JC Decaux SA (a) | 37,500 | | 1,004,971 |
Common Stocks - continued |
| Shares | | Value |
France - continued |
LVMH Moet Hennessy - Louis Vuitton | 33,579 | | $ 5,588,015 |
Pernod-Ricard SA | 17,814 | | 1,664,064 |
PPR SA | 21,450 | | 3,351,398 |
Safran SA | 51,200 | | 1,677,154 |
Sanofi-aventis | 59,011 | | 4,222,200 |
Sanofi-aventis sponsored ADR | 70,000 | | 2,502,500 |
Schneider Electric SA | 24,592 | | 1,451,502 |
Societe Generale Series A | 55,400 | | 1,617,696 |
Unibail-Rodamco | 6,389 | | 1,277,631 |
TOTAL FRANCE | | 48,971,334 |
Germany - 2.2% |
Aareal Bank AG (a) | 69,248 | | 1,407,777 |
Allianz AG | 22,281 | | 2,504,084 |
Bayer AG | 46,647 | | 2,988,564 |
Bayerische Motoren Werke AG (BMW) | 42,702 | | 3,490,168 |
Commerzbank AG (a) | 260,100 | | 641,795 |
Deutsche Bank AG | 64,100 | | 2,650,826 |
Fresenius Medical Care AG & Co. KGaA | 52,700 | | 3,839,525 |
GEA Group AG | 52,982 | | 1,463,870 |
Gerry Weber International AG (Bearer) | 19,400 | | 604,072 |
Kabel Deutschland Holding AG (a) | 54,900 | | 3,134,774 |
Siemens AG | 20,658 | | 2,165,703 |
TOTAL GERMANY | | 24,891,158 |
Hong Kong - 0.7% |
AIA Group Ltd. | 1,010,800 | | 3,090,763 |
China Unicom (Hong Kong) Ltd. | 776,000 | | 1,560,238 |
I.T Ltd. | 798,000 | | 496,991 |
Techtronic Industries Co. Ltd. | 3,575,500 | | 3,093,641 |
TOTAL HONG KONG | | 8,241,633 |
India - 0.8% |
Apollo Hospitals Enterprise Ltd. | 164,788 | | 1,756,036 |
Bharti Airtel Ltd. | 350,401 | | 2,806,264 |
Housing Development Finance Corp. Ltd. | 166,070 | | 2,337,075 |
Larsen & Toubro Ltd. | 16,958 | | 489,178 |
Shriram Transport Finance Co. Ltd. | 41,265 | | 516,600 |
The Jammu & Kashmir Bank Ltd. | 30,114 | | 519,252 |
Titan Industries Ltd. | 175,420 | | 779,023 |
TOTAL INDIA | | 9,203,428 |
Indonesia - 0.3% |
PT Astra International Tbk | 82,000 | | 632,282 |
PT Sarana Menara Nusantara Tbk (a) | 913,000 | | 923,098 |
PT Tower Bersama Infrastructure Tbk | 3,992,500 | | 929,188 |
PT XL Axiata Tbk | 1,171,500 | | 655,208 |
TOTAL INDONESIA | | 3,139,776 |
Ireland - 0.6% |
Accenture PLC Class A | 43,600 | | 2,627,336 |
|
| Shares | | Value |
James Hardie Industries NV CDI (a) | 297,856 | | $ 1,929,373 |
Kenmare Resources PLC (a) | 321,500 | | 209,762 |
Paddy Power PLC (Ireland) | 45,700 | | 2,529,769 |
TOTAL IRELAND | | 7,296,240 |
Israel - 0.3% |
Check Point Software Technologies Ltd. (a) | 32,400 | | 1,867,212 |
Israel Chemicals Ltd. | 81,400 | | 979,495 |
TOTAL ISRAEL | | 2,846,707 |
Italy - 0.6% |
Intesa Sanpaolo SpA | 509,546 | | 910,362 |
Prada SpA | 144,900 | | 716,306 |
Prysmian SpA | 104,600 | | 1,585,078 |
Saipem SpA | 84,317 | | 3,780,636 |
TOTAL ITALY | | 6,992,382 |
Japan - 7.0% |
ABC-Mart, Inc. | 84,500 | | 3,309,601 |
Aozora Bank Ltd. | 566,000 | | 1,431,046 |
Asics Corp. | 200,000 | | 2,651,771 |
Calbee, Inc. (d) | 42,800 | | 1,951,360 |
Canon, Inc. | 94,450 | | 4,288,371 |
Cosmos Pharmaceutical Corp. | 47,300 | | 2,194,224 |
Credit Saison Co. Ltd. | 76,100 | | 1,485,195 |
DeNA Co. Ltd. | 46,400 | | 2,002,954 |
Denso Corp. | 69,500 | | 2,137,626 |
Digital Garage, Inc. (a) | 170 | | 556,650 |
Don Quijote Co. Ltd. | 84,700 | | 3,103,052 |
Fanuc Corp. | 21,200 | | 3,428,272 |
Honda Motor Co. Ltd. | 108,200 | | 3,235,999 |
Japan Retail Fund Investment Corp. | 157 | | 243,063 |
Japan Tobacco, Inc. | 1,306 | | 6,528,435 |
JS Group Corp. | 91,700 | | 1,923,116 |
JSR Corp. | 126,300 | | 2,411,388 |
Kakaku.com, Inc. | 43,300 | | 1,714,683 |
KDDI Corp. | 618 | | 4,527,650 |
Keyence Corp. | 10,400 | | 2,644,131 |
Misumi Group, Inc. | 70,500 | | 1,467,103 |
Mitsubishi Corp. | 136,300 | | 2,803,636 |
Mitsubishi Estate Co. Ltd. | 87,000 | | 1,473,711 |
Mitsubishi UFJ Financial Group, Inc. | 837,800 | | 3,641,492 |
ORIX Corp. | 73,700 | | 6,433,011 |
Rakuten, Inc. | 3,737 | | 4,097,156 |
So-net M3, Inc. | 320 | | 1,447,362 |
SOFTBANK CORP. | 59,800 | | 1,941,095 |
Start Today Co. Ltd. | 165,300 | | 3,497,242 |
Tokyo Electron Ltd. | 19,400 | | 1,031,892 |
TOTAL JAPAN | | 79,602,287 |
Korea (South) - 1.1% |
Hyundai Motor Co. | 11,637 | | 2,334,815 |
Kia Motors Corp. | 27,270 | | 1,741,809 |
Common Stocks - continued |
| Shares | | Value |
Korea (South) - continued |
LG Household & Health Care Ltd. | 3,087 | | $ 1,389,000 |
NHN Corp. (a) | 3,893 | | 809,131 |
Orion Corp. | 6,624 | | 3,540,417 |
Samsung Electronics Co. Ltd. | 1,927 | | 1,652,691 |
Shinhan Financial Group Co. Ltd. | 22,350 | | 887,039 |
TOTAL KOREA (SOUTH) | | 12,354,902 |
Luxembourg - 0.6% |
Brait SA | 516,600 | | 1,236,773 |
Millicom International Cellular SA | 11,500 | | 1,263,850 |
Millicom International Cellular SA (depositary receipt) | 27,200 | | 2,997,630 |
Samsonite International SA | 934,200 | | 1,520,025 |
TOTAL LUXEMBOURG | | 7,018,278 |
Mexico - 0.2% |
Wal-Mart de Mexico SA de CV Series V | 1,042,400 | | 2,692,836 |
Netherlands - 1.6% |
AEGON NV (a) | 292,700 | | 1,396,073 |
ASML Holding NV | 60,800 | | 2,549,344 |
Gemalto NV | 106,288 | | 4,849,622 |
ING Groep NV (Certificaten Van Aandelen) (a) | 654,400 | | 5,642,383 |
Koninklijke Philips Electronics NV | 77,500 | | 1,613,528 |
Randstad Holdings NV | 45,325 | | 1,616,744 |
TOTAL NETHERLANDS | | 17,667,694 |
Norway - 0.5% |
Aker Solutions ASA | 105,900 | | 1,231,594 |
DnB NOR ASA | 367,800 | | 4,290,648 |
TOTAL NORWAY | | 5,522,242 |
Philippines - 0.1% |
Alliance Global Group, Inc. | 6,500,000 | | 1,616,043 |
Poland - 0.2% |
Eurocash SA | 232,100 | | 1,860,945 |
Qatar - 0.1% |
Commercial Bank of Qatar GDR (Reg. S) | 279,659 | | 1,282,610 |
Singapore - 0.1% |
Avago Technologies Ltd. | 41,000 | | 1,384,570 |
South Africa - 0.4% |
AngloGold Ashanti Ltd. sponsored ADR | 44,700 | | 2,020,887 |
Sanlam Ltd. | 311,800 | | 1,164,884 |
Shoprite Holdings Ltd. | 125,400 | | 1,837,793 |
TOTAL SOUTH AFRICA | | 5,023,564 |
Spain - 0.7% |
Banco Bilbao Vizcaya Argentaria SA | 135,154 | | 1,216,551 |
Banco Santander SA: | | | |
rights 10/31/11 | 356,566 | | 61,681 |
(Spain) | 356,566 | | 3,018,362 |
Inditex SA | 17,582 | | 1,600,055 |
|
| Shares | | Value |
Prosegur Compania de Seguridad SA (Reg.) | 19,900 | | $ 992,803 |
Viscofan Envolturas Celulosicas SA | 31,300 | | 1,204,620 |
TOTAL SPAIN | | 8,094,072 |
Sweden - 0.6% |
Elekta AB (B Shares) | 13,000 | | 520,235 |
Intrum Justitia AB | 14,200 | | 233,597 |
Meda AB (A Shares) | 107,400 | | 1,097,137 |
Swedbank AB (A Shares) | 195,000 | | 2,747,237 |
Swedish Match Co. | 65,600 | | 2,269,997 |
TOTAL SWEDEN | | 6,868,203 |
Switzerland - 3.2% |
ACE Ltd. | 41,000 | | 2,958,150 |
Adecco SA (Reg.) | 34,229 | | 1,654,210 |
Compagnie Financiere Richemont SA Series A | 16,640 | | 952,835 |
Kuehne & Nagel International AG | 10,620 | | 1,322,735 |
Nestle SA | 164,083 | | 9,517,207 |
Partners Group Holding | 12,748 | | 2,389,660 |
Schindler Holding AG (participation certificate) | 31,036 | | 3,649,838 |
The Swatch Group AG (Bearer) | 5,440 | | 2,303,577 |
Transocean Ltd. (United States) | 47,100 | | 2,691,765 |
UBS AG (a) | 323,960 | | 4,095,441 |
Zurich Financial Services AG | 19,138 | | 4,444,561 |
TOTAL SWITZERLAND | | 35,979,979 |
Taiwan - 0.3% |
Catcher Technology Co. Ltd. | 317,000 | | 1,766,168 |
WPG Holding Co. Ltd. | 955,930 | | 1,154,290 |
TOTAL TAIWAN | | 2,920,458 |
Turkey - 0.1% |
Boyner Buyuk Magazacilik A/S (a) | 514,000 | | 863,328 |
United Arab Emirates - 0.1% |
First Gulf Bank PJSC | 130,740 | | 553,500 |
United Kingdom - 9.8% |
Aberdeen Asset Management PLC | 474,742 | | 1,469,699 |
Aggreko PLC | 30,300 | | 834,231 |
Anglo American PLC (United Kingdom) | 68,818 | | 2,538,288 |
Ashmore Group PLC | 187,900 | | 1,042,524 |
Aviva PLC | 363,200 | | 1,981,831 |
Barclays PLC | 1,257,259 | | 3,898,158 |
BG Group PLC | 291,563 | | 6,360,515 |
BHP Billiton PLC | 261,599 | | 8,239,155 |
BP PLC | 567,469 | | 4,176,690 |
British American Tobacco PLC: | | | |
(United Kingdom) | 222,000 | | 10,180,670 |
sponsored ADR | 92,400 | | 8,523,900 |
British Land Co. PLC | 332,855 | | 2,732,693 |
Burberry Group PLC | 106,200 | | 2,290,305 |
Carphone Warehouse Group PLC | 852,279 | | 4,810,929 |
Common Stocks - continued |
| Shares | | Value |
United Kingdom - continued |
Diageo PLC | 100,557 | | $ 2,081,493 |
GlaxoSmithKline PLC | 153,700 | | 3,450,034 |
HSBC Holdings PLC (United Kingdom) | 580,528 | | 5,066,231 |
Imperial Tobacco Group PLC | 85,378 | | 3,122,313 |
International Personal Finance PLC | 517,515 | | 2,282,078 |
Jazztel PLC (a) | 228,700 | | 1,322,961 |
Legal & General Group PLC | 1,800,381 | | 3,199,387 |
Lloyds Banking Group PLC (a) | 2,775,954 | | 1,435,778 |
Micro Focus International PLC | 116,800 | | 637,897 |
National Grid PLC | 273,500 | | 2,719,655 |
Ocado Group PLC (a)(d) | 898,900 | | 1,353,815 |
Reckitt Benckiser Group PLC | 19,141 | | 984,426 |
Royal Dutch Shell PLC Class B | 371,168 | | 13,319,306 |
Royalblue Group PLC | 15,700 | | 410,797 |
SuperGroup PLC (a)(d) | 65,400 | | 656,300 |
The Weir Group PLC | 37,100 | | 1,144,956 |
Ultra Electronics Holdings PLC | 32,400 | | 829,522 |
Vodafone Group PLC | 2,115,200 | | 5,874,342 |
Vodafone Group PLC sponsored ADR | 47,212 | | 1,314,382 |
Xstrata PLC | 81,600 | | 1,372,000 |
TOTAL UNITED KINGDOM | | 111,657,261 |
United States of America - 49.4% |
Alexion Pharmaceuticals, Inc. (a) | 173,000 | | 11,679,230 |
Amazon.com, Inc. (a) | 17,800 | | 3,800,478 |
American Express Co. | 182,100 | | 9,217,902 |
Ameriprise Financial, Inc. | 83,000 | | 3,874,440 |
Apple, Inc. (a) | 49,600 | | 20,077,088 |
BB&T Corp. | 38,000 | | 886,920 |
Beam, Inc. | 25,000 | | 1,235,750 |
Biogen Idec, Inc. (a) | 76,300 | | 8,878,268 |
Cabot Oil & Gas Corp. | 66,000 | | 5,129,520 |
Chevron Corp. | 143,000 | | 15,022,150 |
Citigroup, Inc. | 917,100 | | 28,971,189 |
Citrix Systems, Inc. (a) | 167,209 | | 12,177,831 |
Cognizant Technology Solutions Corp. Class A (a) | 61,600 | | 4,481,400 |
Collective Brands, Inc. (a) | 181,000 | | 2,644,410 |
CSX Corp. | 344,000 | | 7,640,240 |
Cummins, Inc. | 169,400 | | 16,843,442 |
Discover Financial Services | 384,100 | | 9,049,396 |
Duke Energy Corp. | 88,000 | | 1,796,960 |
Edwards Lifesciences Corp. (a) | 329,000 | | 24,813,180 |
El Paso Electric Co. | 60,750 | | 1,945,823 |
Elizabeth Arden, Inc. (a) | 76,000 | | 2,605,280 |
EQT Corp. | 257,000 | | 16,319,500 |
Estee Lauder Companies, Inc. Class A | 115,000 | | 11,321,750 |
Exxon Mobil Corp. | 309,000 | | 24,129,810 |
Fifth Third Bancorp | 381,000 | | 4,575,810 |
Fiserv, Inc. (a) | 7,000 | | 412,090 |
Fossil, Inc. (a) | 2,900 | | 300,614 |
|
| Shares | | Value |
Freeport-McMoRan Copper & Gold, Inc. | 112,000 | | $ 4,509,120 |
G-III Apparel Group Ltd. (a) | 189,600 | | 5,344,824 |
Gilead Sciences, Inc. (a) | 122,000 | | 5,082,520 |
Google, Inc. Class A (a) | 6,500 | | 3,852,160 |
Green Mountain Coffee Roasters, Inc. (a) | 8,900 | | 578,678 |
Informatica Corp. (a) | 144,100 | | 6,556,550 |
IntercontinentalExchange, Inc. (a) | 13,000 | | 1,688,440 |
InterMune, Inc. (a) | 37,000 | | 943,500 |
Intuit, Inc. | 576,000 | | 30,913,915 |
iRobot Corp. (a) | 177,000 | | 5,993,220 |
JCPenney Co., Inc. | 31,000 | | 994,480 |
JPMorgan Chase & Co. | 105,000 | | 3,649,800 |
Lincoln National Corp. | 367,000 | | 6,991,350 |
Lorillard, Inc. | 8,000 | | 885,280 |
MasterCard, Inc. Class A | 69,100 | | 23,994,284 |
McDonald's Corp. | 118,500 | | 11,002,725 |
Motorola Solutions, Inc. | 20,000 | | 938,200 |
National Oilwell Varco, Inc. | 82,000 | | 5,849,060 |
Nu Skin Enterprises, Inc. Class A | 132,000 | | 6,669,960 |
ONEOK, Inc. | 37,000 | | 2,813,850 |
Perrigo Co. | 207,000 | | 18,687,960 |
Polypore International, Inc. (a) | 139,100 | | 7,295,795 |
PPL Corp. | 145,000 | | 4,258,650 |
Prestige Brands Holdings, Inc. (a) | 296,120 | | 3,132,950 |
Priceline.com, Inc. (a) | 4,000 | | 2,030,880 |
Prologis, Inc. | 681,600 | | 20,284,416 |
PulteGroup, Inc. (a) | 807,000 | | 4,180,260 |
Ralph Lauren Corp. | 14,000 | | 2,223,060 |
RF Micro Devices, Inc. (a) | 991,700 | | 7,279,078 |
Riverbed Technology, Inc. (a) | 28,000 | | 772,240 |
salesforce.com, Inc. (a) | 56,000 | | 7,457,520 |
Sirius XM Radio, Inc. (a)(d) | 3,900,000 | | 6,981,000 |
Smithfield Foods, Inc. (a) | 186,000 | | 4,251,960 |
Starbucks Corp. | 281,000 | | 11,897,540 |
Target Corp. | 81,000 | | 4,434,750 |
TJX Companies, Inc. | 176,000 | | 10,371,680 |
Torchmark Corp. | 57,000 | | 2,333,010 |
Union Pacific Corp. | 202,000 | | 20,113,140 |
United Technologies Corp. | 65,000 | | 5,068,700 |
UnitedHealth Group, Inc. | 273,900 | | 13,144,461 |
Virgin Media, Inc. | 98,000 | | 2,389,240 |
W.R. Grace & Co. (a) | 323,000 | | 13,498,170 |
Wells Fargo & Co. | 246,000 | | 6,373,860 |
Williams Companies, Inc. | 85,000 | | 2,559,350 |
TOTAL UNITED STATES OF AMERICA | | 560,102,057 |
TOTAL COMMON STOCKS (Cost $1,032,697,154) |
1,088,582,952
|
Nonconvertible Preferred Stocks - 0.6% |
| Shares | | Value |
Germany - 0.5% |
ProSiebenSat.1 Media AG | 2,200 | | $ 47,191 |
Volkswagen AG | 34,600 | | 6,071,557 |
TOTAL GERMANY | | 6,118,748 |
Italy - 0.1% |
Fiat Industrial SpA (a) | 118,500 | | 727,141 |
TOTAL NONCONVERTIBLE PREFERRED STOCKS (Cost $5,541,680) |
6,845,889
|
Money Market Funds - 4.8% |
| | | |
Fidelity Cash Central Fund, 0.12% (b) | 41,886,340 | | 41,886,340 |
Fidelity Securities Lending Cash Central Fund, 0.11% (b)(c) | 12,725,485 | | 12,725,485 |
TOTAL MONEY MARKET FUNDS (Cost $54,611,825) |
54,611,825
|
TOTAL INVESTMENT PORTFOLIO - 101.4% (Cost $1,092,850,659) | | 1,150,040,666 |
NET OTHER ASSETS (LIABILITIES) - (1.4)% | | (15,367,874) |
NET ASSETS - 100% | $ 1,134,672,792 |
Legend |
(a) Non-income producing |
(b) Affiliated fund that is available only to investment companies and other accounts managed by Fidelity Investments. The rate quoted is the annualized seven-day yield of the fund at period end. A complete unaudited listing of the fund's holdings as of its most recent quarter end is available upon request. In addition, each Fidelity Central Fund's financial statements, which are not covered by the Fund's Report of Independent Registered Public Accounting Firm, are available on the SEC's website or upon request. |
(c) Investment made with cash collateral received from securities on loan. |
(d) Security or a portion of the security is on loan at period end. |
Affiliated Central Funds |
Information regarding fiscal year to date income earned by the Fund from investments in Fidelity Central Funds is as follows: |
Fund | Income earned |
Fidelity Cash Central Fund | $ 77,687 |
Fidelity Securities Lending Cash Central Fund | 199,692 |
Total | $ 277,379 |
Other Information |
The following is a summary of the inputs used, as of October 31, 2011, involving the Fund's assets and liabilities carried at fair value. The inputs or methodology used for valuing securities may not be an indication of the risk associated with investing in those securities. For more information on valuation inputs, and their aggregation into the levels used in the tables below, please refer to the Security Valuation section in the accompanying Notes to Financial Statements. |
Valuation Inputs at Reporting Date: |
Description | Total | Level 1 | Level 2 | Level 3 |
Investments in Securities: | | | | |
Equities: | | | | |
United States of America | $ 560,102,057 | $ 560,102,057 | $ - | $ - |
United Kingdom | 111,657,261 | 49,233,918 | 62,423,343 | - |
Japan | 79,602,287 | - | 79,602,287 | - |
France | 48,971,334 | 44,749,134 | 4,222,200 | - |
Switzerland | 35,979,979 | 31,884,538 | 4,095,441 | - |
Germany | 31,009,906 | 22,353,852 | 8,656,054 | - |
Canada | 24,173,411 | 24,173,411 | - | - |
Netherlands | 17,667,694 | 9,015,710 | 8,651,984 | - |
Australia | 17,140,210 | - | 17,140,210 | - |
Other | 169,124,702 | 95,926,624 | 73,198,078 | - |
Money Market Funds | 54,611,825 | 54,611,825 | - | - |
Total Investments in Securities: | $ 1,150,040,666 | $ 892,051,069 | $ 257,989,597 | $ - |
The following is a reconciliation of Investments in Securities for which Level 3 inputs were used in determining value: |
Investments in Securities: | |
Beginning Balance | $ 34,550 |
Total Realized Gain (Loss) | - |
Total Unrealized Gain (Loss) | - |
Cost of Purchases | - |
Proceeds of Sales | - |
Amortization/Accretion | - |
Transfers in to Level 3 | - |
Transfers out of Level 3 | (34,550) |
Ending Balance | $ - |
The change in unrealized gain (loss) for the period attributable to Level 3 securities held at October 31, 2011 | $ - |
The information used in the above reconciliation represents fiscal year to date activity for any Investments in Securities identified as using Level 3 inputs at either the beginning or the end of the current fiscal period. Transfers in or out of Level 3 represent the beginning value of any Security or Instrument where a change in the pricing level occurred from the beginning to the end of the period. The cost of purchases and the proceeds of sales may include securities received or delivered through corporate actions or exchanges. Realized and unrealized gains (losses) disclosed in the reconciliation are included in Net Gain (Loss) on the Fund's Statement of Operations. |
Income Tax Information |
At October 31, 2011, the Fund had a capital loss carryforward of approximately $43,909,944 all of which will expire in fiscal 2017. Capital loss carryforwards are only available to offset future capital gains of the Fund to the extent provided by regulations and may be limited. |
See accompanying notes which are an integral part of the financial statements.
Annual Report
Fidelity Worldwide Fund
Statement of Assets and Liabilities
| October 31, 2011 |
| | |
Assets | | |
Investment in securities, at value (including securities loaned of $11,527,651) - See accompanying schedule: Unaffiliated issuers (cost $1,038,238,834) | $ 1,095,428,841 | |
Fidelity Central Funds (cost $54,611,825) | 54,611,825 | |
Total Investments (cost $1,092,850,659) | | $ 1,150,040,666 |
Foreign currency held at value (cost $12) | | 12 |
Receivable for investments sold | | 36,476,232 |
Receivable for fund shares sold | | 974,697 |
Dividends receivable | | 1,205,767 |
Distributions receivable from Fidelity Central Funds | | 21,667 |
Prepaid expenses | | 4,726 |
Other receivables | | 381,445 |
Total assets | | 1,189,105,212 |
| | |
Liabilities | | |
Payable for investments purchased | $ 39,330,913 | |
Payable for fund shares redeemed | 1,365,409 | |
Accrued management fee | 671,958 | |
Distribution and service plan fees payable | 4,710 | |
Other affiliated payables | 262,119 | |
Other payables and accrued
expenses | 71,826 | |
Collateral on securities loaned, at value | 12,725,485 | |
Total liabilities | | 54,432,420 |
| | |
Net Assets | | $ 1,134,672,792 |
Net Assets consist of: | | |
Paid in capital | | $ 1,132,528,887 |
Undistributed net investment income | | 2,700,979 |
Accumulated undistributed net realized gain (loss) on investments and foreign currency transactions | | (57,762,431) |
Net unrealized appreciation (depreciation) on investments and assets and liabilities in foreign
currencies | | 57,205,357 |
Net Assets | | $ 1,134,672,792 |
| October 31, 2011 |
| | |
Calculation of Maximum Offering Price Class A:
Net Asset Value and redemption price per share ($13,153,433 ÷ 735,359 shares) | | $ 17.89 |
| | |
Maximum offering price per share (100/94.25 of $17.89) | | $ 18.98 |
Class T:
Net Asset Value and redemption price per share ($2,186,869 ÷ 122,631 shares) | | $ 17.83 |
| | |
Maximum offering price per share (100/96.50 of $17.83) | | $ 18.48 |
Class B:
Net Asset Value and offering price per share ($255,549 ÷ 14,383 shares)A | | $ 17.77 |
| | |
Class C:
Net Asset Value and offering price per share ($1,296,964 ÷ 73,124 shares)A | | $ 17.74 |
| | |
Worldwide:
Net Asset Value, offering price and redemption price per share ($1,114,693,586 ÷ 61,871,620 shares) | | $ 18.02 |
| | |
Institutional Class:
Net Asset Value, offering price and redemption price per share ($3,086,391 ÷ 171,674 shares) | | $ 17.98 |
A Redemption price per share is equal to net asset value less any applicable contingent deferred sales charge.
See accompanying notes which are an integral part of the financial statements.
Annual Report
Fidelity Worldwide Fund
Financial Statements - continued
Statement of Operations
| Year ended October 31, 2011 |
| | |
Investment Income | | |
Dividends | | $ 20,686,068 |
Interest | | 17,708 |
Income from Fidelity Central Funds | | 277,379 |
Income before foreign taxes withheld | | 20,981,155 |
Less foreign taxes withheld | | (1,097,612) |
Total income | | 19,883,543 |
| | |
Expenses | | |
Management fee
Basic fee | $ 8,486,454 | |
Performance adjustment | 729,662 | |
Transfer agent fees | 2,773,239 | |
Distribution and service plan fees | 54,064 | |
Accounting and security lending fees | 553,421 | |
Custodian fees and expenses | 257,965 | |
Independent trustees' compensation | 6,658 | |
Registration fees | 98,806 | |
Audit | 81,560 | |
Legal | 5,113 | |
Miscellaneous | 11,919 | |
Total expenses before reductions | 13,058,861 | |
Expense reductions | (357,517) | 12,701,344 |
Net investment income (loss) | | 7,182,199 |
Realized and Unrealized Gain (Loss) Net realized gain (loss) on: | | |
Investment securities: | | |
Unaffiliated issuers | 120,978,817 | |
Foreign currency transactions | (435,639) | |
Total net realized gain (loss) | | 120,543,178 |
Change in net unrealized appreciation (depreciation) on: Investment securities (net of decrease in deferred foreign taxes of $556,502) | (94,435,905) | |
Assets and liabilities in foreign currencies | (21,713) | |
Total change in net unrealized appreciation (depreciation) | | (94,457,618) |
Net gain (loss) | | 26,085,560 |
Net increase (decrease) in net assets resulting from operations | | $ 33,267,759 |
Statement of Changes in Net Assets
| Year ended
October 31,
2011 | Year ended
October 31,
2010 |
Increase (Decrease) in Net Assets | | |
Operations | | |
Net investment income (loss) | $ 7,182,199 | $ 5,168,785 |
Net realized gain (loss) | 120,543,178 | 100,330,002 |
Change in net unrealized appreciation (depreciation) | (94,457,618) | 66,991,246 |
Net increase (decrease) in net assets resulting from operations | 33,267,759 | 172,490,033 |
Distributions to shareholders from net investment income | (6,244,141) | (6,419,967) |
Distributions to shareholders from net realized gain | (2,870,519) | (993,213) |
Total distributions | (9,114,660) | (7,413,180) |
Share transactions - net increase (decrease) | 12,558,124 | (61,476,980) |
Redemption fees | 33,448 | 31,293 |
Total increase (decrease) in net assets | 36,744,671 | 103,631,166 |
| | |
Net Assets | | |
Beginning of period | 1,097,928,121 | 994,296,955 |
End of period (including undistributed net investment income of $2,700,979 and undistributed net investment income of $4,480,160, respectively) | $ 1,134,672,792 | $ 1,097,928,121 |
See accompanying notes which are an integral part of the financial statements.
Annual Report
Financial Highlights - Class A
Years ended October 31, | 2011 | 2010 | 2009H |
Selected Per-Share Data | | | |
Net asset value, beginning of period | $ 17.50 | $ 14.96 | $ 10.88 |
Income from Investment Operations | | | |
Net investment income (loss) E | .05 | .03 | (.01) |
Net realized and unrealized gain (loss) | .47 | 2.63 | 4.09 |
Total from investment operations | .52 | 2.66 | 4.08 |
Distributions from net investment income | (.08) | (.10) | - |
Distributions from net realized gain | (.05) | (.02) | - |
Total distributions | (.13) | (.12) | - |
Redemption fees added to paid in capital E,J | - | - | - |
Net asset value, end of period | $ 17.89 | $ 17.50 | $ 14.96 |
Total Return B,C,D | 2.94% | 17.85% | 37.50% |
Ratios to Average Net Assets F, I | | | |
Expenses before reductions | 1.41% | 1.43% | 1.52% A |
Expenses net of fee waivers, if any | 1.40% | 1.43% | 1.52% A |
Expenses net of all reductions | 1.38% | 1.41% | 1.49% A |
Net investment income (loss) | .28% | .21% | (.06)% A |
Supplemental Data | | | |
Net assets, end of period (000 omitted) | $ 13,153 | $ 7,530 | $ 993 |
Portfolio turnover rate G | 203% | 166% | 224% |
A Annualized
B Total returns for periods of less than one year are not annualized.
C Total returns would have been lower if certain expenses had not been reduced during the applicable periods shown.
D Total returns do not include the effect of the sales charges.
E Calculated based on average shares outstanding during the period.
F Fees and expenses of any underlying Fidelity Central Funds are not included in the Fund's expense ratio. The Fund indirectly bears its proportionate share of the expenses of any underlying Fidelity Central Funds.
G Amount does not include the portfolio activity of any underlying Fidelity Central Funds.
H For the period February 19, 2009 (commencement of sale of shares) to October 31, 2009.
I Expense ratios reflect operating expenses of the class. Expenses before reductions do not reflect amounts reimbursed by the investment adviser or reductions from brokerage service arrangements or reductions from other expense offset arrangements and do not represent the amount paid by the class during periods when reimbursements or reductions occur. Expense ratios before reductions for start-up periods may not be representative of longer-term operating periods. Expenses net of fee waivers reflect expenses after reimbursement by the investment adviser but prior to reductions from brokerage service arrangements or other expense offset arrangements. Expenses net of all reductions represent the net expenses paid by the class.
J Amount represents less than $.01 per share.
Financial Highlights - Class T
Years ended October 31, | 2011 | 2010 | 2009 H |
Selected Per-Share Data | | | |
Net asset value, beginning of period | $ 17.46 | $ 14.94 | $ 10.88 |
Income from Investment Operations | | | |
Net investment income (loss) E | .01 | (.01) | (.01) |
Net realized and unrealized gain (loss) | .45 | 2.62 | 4.07 |
Total from investment operations | .46 | 2.61 | 4.06 |
Distributions from net investment income | (.04) | (.08) | - |
Distributions from net realized gain | (.05) | (.02) | - |
Total distributions | (.09) | (.09) K | - |
Redemption fees added to paid in capital E,J | - | - | - |
Net asset value, end of period | $ 17.83 | $ 17.46 | $ 14.94 |
Total Return B,C,D | 2.61% | 17.53% | 37.32% |
Ratios to Average Net Assets F, I | | | |
Expenses before reductions | 1.66% | 1.70% | 1.73% A |
Expenses net of fee waivers, if any | 1.65% | 1.70% | 1.73% A |
Expenses net of all reductions | 1.63% | 1.68% | 1.70% A |
Net investment income (loss) | .03% | (.05)% | (.08)% A |
Supplemental Data | | | |
Net assets, end of period (000 omitted) | $ 2,187 | $ 1,120 | $ 458 |
Portfolio turnover rate G | 203% | 166% | 224% |
A Annualized
B Total returns for periods of less than one year are not annualized.
C Total returns would have been lower if certain expenses had not been reduced during the applicable periods shown.
D Total returns do not include the effect of the sales charges.
E Calculated based on average shares outstanding during the period.
F Fees and expenses of any underlying Fidelity Central Funds are not included in the Fund's expense ratio. The Fund indirectly bears its proportionate share of the expenses of any underlying Fidelity Central Funds.
G Amount does not include the portfolio activity of any underlying Fidelity Central Funds.
H For the period February 19, 2009 (commencement of sale of shares) to October 31, 2009.
I Expense ratios reflect operating expenses of the class. Expenses before reductions do not reflect amounts reimbursed by the investment adviser or reductions from brokerage service arrangements or reductions from other expense offset arrangements and do not represent the amount paid by the class during periods when reimbursements or reductions occur. Expense ratios before reductions for start-up periods may not be representative of longer-term operating periods. Expenses net of fee waivers reflect expenses after reimbursement by the investment adviser but prior to reductions from brokerage service arrangements or other expense offset arrangements. Expenses net of all reductions represent the net expenses paid by the class.
J Amount represents less than $.01 per share.
K Total distributions of $.09 per share is comprised of distributions from net investment income of $.075 and distributions from net realized gain of $.015 per share.
See accompanying notes which are an integral part of the financial statements.
Annual Report
Financial Highlights - Class B
Years ended October 31, | 2011 | 2010 | 2009 H |
Selected Per-Share Data | | | |
Net asset value, beginning of period | $ 17.39 | $ 14.89 | $ 10.88 |
Income from Investment Operations | | | |
Net investment income (loss) E | (.09) | (.09) | (.03) |
Net realized and unrealized gain (loss) | .47 | 2.61 | 4.04 |
Total from investment operations | .38 | 2.52 | 4.01 |
Distributions from net investment income | - | (.01) | - |
Distributions from net realized gain | - | (.01) | - |
Total distributions | - | (.02) | - |
Redemption fees added to paid in capital E,J | - | - | - |
Net asset value, end of period | $ 17.77 | $ 17.39 | $ 14.89 |
Total Return B,C,D | 2.19% | 16.92% | 36.86% |
Ratios to Average Net Assets F,I | | | |
Expenses before reductions | 2.16% | 2.19% | 2.20% A |
Expenses net of fee waivers, if any | 2.16% | 2.19% | 2.20% A |
Expenses net of all reductions | 2.13% | 2.17% | 2.17% A |
Net investment income (loss) | (.47)% | (.55)% | (.30)% A |
Supplemental Data | | | |
Net assets, end of period (000 omitted) | $ 256 | $ 305 | $ 224 |
Portfolio turnover rate G | 203% | 166% | 224% |
A Annualized
B Total returns for periods of less than one year are not annualized.
C Total returns would have been lower if certain expenses had not been reduced during the applicable periods shown.
D Total returns do not include the effect of the contingent deferred sales charge.
E Calculated based on average shares outstanding during the period.
F Fees and expenses of any underlying Fidelity Central Funds are not included in the Fund's expense ratio. The Fund indirectly bears its proportionate share of the expenses of any underlying Fidelity Central Funds.
G Amount does not include the portfolio activity of any underlying Fidelity Central Funds.
H For the period February 19, 2009 (commencement of sale of shares) to October 31, 2009.
I Expense ratios reflect operating expenses of the class. Expenses before reductions do not reflect amounts reimbursed by the investment adviser or reductions from brokerage service arrangements or reductions from other expense offset arrangements and do not represent the amount paid by the class during periods when reimbursements or reductions occur. Expense ratios before reductions for start-up periods may not be representative of longer-term operating periods. Expenses net of fee waivers reflect expenses after reimbursement by the investment adviser but prior to reductions from brokerage service arrangements or other expense offset arrangements. Expenses net of all reductions represent the net expenses paid by the class.
J Amount represents less than $.01 per share.
Financial Highlights - Class C
Years ended October 31, | 2011 | 2010 | 2009 H |
Selected Per-Share Data | | | |
Net asset value, beginning of period | $ 17.36 | $ 14.89 | $ 10.88 |
Income from Investment Operations | | | |
Net investment income (loss) E | (.09) | (.09) | (.04) |
Net realized and unrealized gain (loss) | .47 | 2.61 | 4.05 |
Total from investment operations | .38 | 2.52 | 4.01 |
Distributions from net investment income | - | (.03) | - |
Distributions from net realized gain | - | (.02) | - |
Total distributions | - | (.05) | - |
Redemption fees added to paid in capital E,J | - | - | - |
Net asset value, end of period | $ 17.74 | $ 17.36 | $ 14.89 |
Total Return B,C,D | 2.19% | 16.94% | 36.86% |
Ratios to Average Net Assets F,I | | | |
Expenses before reductions | 2.16% | 2.19% | 2.18% A |
Expenses net of fee waivers, if any | 2.15% | 2.19% | 2.18% A |
Expenses net of all reductions | 2.13% | 2.16% | 2.15% A |
Net investment income (loss) | (.47)% | (.54)% | (.39)% A |
Supplemental Data | | | |
Net assets, end of period (000 omitted) | $ 1,297 | $ 710 | $ 335 |
Portfolio turnover rate G | 203% | 166% | 224% |
A Annualized
B Total returns for periods of less than one year are not annualized.
C Total returns would have been lower if certain expenses had not been reduced during the applicable periods shown.
D Total returns do not include the effect of the contingent deferred sales charge.
E Calculated based on average shares outstanding during the period.
F Fees and expenses of any underlying Fidelity Central Funds are not included in the Fund's expense ratio. The Fund indirectly bears its proportionate share of the expenses of any underlying Fidelity Central Funds.
G Amount does not include the portfolio activity of any underlying Fidelity Central Funds.
H For the period February 19, 2009 (commencement of sale of shares) to October 31, 2009.
I Expense ratios reflect operating expenses of the class. Expenses before reductions do not reflect amounts reimbursed by the investment adviser or reductions from brokerage service arrangements or reductions from other expense offset arrangements and do not represent the amount paid by the class during periods when reimbursements or reductions occur. Expense ratios before reductions for start-up periods may not be representative of longer-term operating periods. Expenses net of fee waivers reflect expenses after reimbursement by the investment adviser but prior to reductions from brokerage service arrangements or other expense offset arrangements. Expenses net of all reductions represent the net expenses paid by the class.
J Amount represents less than $.01 per share.
See accompanying notes which are an integral part of the financial statements.
Annual Report
Financial Highlights - Worldwide
Years ended October 31, | 2011 | 2010 | 2009 | 2008 | 2007 |
Selected Per-Share Data | | | | | |
Net asset value, beginning of period | $ 17.58 | $ 14.98 | $ 13.40 | $ 25.18 | $ 21.82 |
Income from Investment Operations | | | | | |
Net investment income (loss) B | .11 | .08 | .12 | .16 | .14 |
Net realized and unrealized gain (loss) | .48 | 2.63 | 1.63 | (9.44) | 6.05 |
Total from investment operations | .59 | 2.71 | 1.75 | (9.28) | 6.19 |
Distributions from net investment income | (.10) | (.10) | (.17) | (.12) | (.17) |
Distributions from net realized gain | (.05) | (.02) | - | (2.38) | (2.66) |
Total distributions | (.15) | (.11) G | (.17) | (2.50) | (2.83) |
Redemption fees added to paid in capital B,F | - | - | - | - | - |
Net asset value, end of period | $ 18.02 | $ 17.58 | $ 14.98 | $ 13.40 | $ 25.18 |
Total Return A | 3.32% | 18.18% | 13.39% | (40.66)% | 31.87% |
Ratios to Average Net Assets C,E | | | | | |
Expenses before reductions | 1.08% | 1.15% | 1.27% | 1.21% | 1.04% |
Expenses net of fee waivers, if any | 1.08% | 1.15% | 1.27% | 1.21% | 1.04% |
Expenses net of all reductions | 1.05% | 1.12% | 1.24% | 1.19% | 1.02% |
Net investment income (loss) | .60% | .50% | .92% | .84% | .66% |
Supplemental Data | | | | | |
Net assets, end of period (000 omitted) | $ 1,114,694 | $ 1,087,928 | $ 991,996 | $ 934,885 | $ 1,773,603 |
Portfolio turnover rate D | 203% | 166% | 224% | 264% | 128% |
A Total returns would have been lower if certain expenses had not been reduced during the applicable periods shown.
B Calculated based on average shares outstanding during the period.
C Fees and expenses of any underlying Fidelity Central Funds are not included in the Fund's expense ratio. The Fund indirectly bears its proportionate share of the expenses of any underlying Fidelity Central Funds.
D Amount does not include the portfolio activity of any underlying Fidelity Central Funds.
E Expense ratios reflect operating expenses of the class. Expenses before reductions do not reflect amounts reimbursed by the investment adviser or reductions from brokerage service arrangements or reductions from other expense offset arrangements and do not represent the amount paid by the class during periods when reimbursements or reductions occur. Expenses net of fee waivers reflect expenses after reimbursement by the investment adviser but prior to reductions from brokerage service arrangements or other expense offset arrangements. Expenses net of all reductions represent the net expenses paid by the class.
F Amount represents less than $.01 per share.
G Total distributions of $.11 per share is comprised of distributions from net investment income of $.097 and distributions from net realized gain of $.015 per share.
Financial Highlights - Institutional Class
Years ended October 31, | 2011 | 2010 | 2009 G |
Selected Per-Share Data | | | |
Net asset value, beginning of period | $ 17.57 | $ 15.00 | $ 10.88 |
Income from Investment Operations | | | |
Net investment income (loss) D | .10 | .07 | .06 |
Net realized and unrealized gain (loss) | .47 | 2.63 | 4.06 |
Total from investment operations | .57 | 2.70 | 4.12 |
Distributions from net investment income | (.11) | (.11) | - |
Distributions from net realized gain | (.05) | (.02) | - |
Total distributions | (.16) | (.13) | - |
Redemption fees added to paid in capital D,I | - | - | - |
Net asset value, end of period | $ 17.98 | $ 17.57 | $ 15.00 |
Total Return B,C | 3.23% | 18.08% | 37.87% |
Ratios to Average Net Assets E,H | | | |
Expenses before reductions | 1.13% | 1.21% | 1.17% A |
Expenses net of fee waivers, if any | 1.13% | 1.21% | 1.17% A |
Expenses net of all reductions | 1.10% | 1.19% | 1.15% A |
Net investment income (loss) | .56% | .44% | .62% A |
Supplemental Data | | | |
Net assets, end of period (000 omitted) | $ 3,086 | $ 335 | $ 290 |
Portfolio turnover rate F | 203% | 166% | 224% |
A Annualized
B Total returns for periods of less than one year are not annualized.
C Total returns would have been lower if certain expenses had not been reduced during the applicable periods shown.
D Calculated based on average shares outstanding during the period.
E Fees and expenses of any underlying Fidelity Central Funds are not included in the Fund's expense ratio. The Fund indirectly bears its proportionate share of the expenses of any underlying Fidelity Central Funds.
F Amount does not include the portfolio activity of any underlying Fidelity Central Funds.
G For the period February 19, 2009 (commencement of sale of shares) to October 31, 2009.
H Expense ratios reflect operating expenses of the class. Expenses before reductions do not reflect amounts reimbursed by the investment adviser or reductions from brokerage service arrangements or reductions from other expense offset arrangements and do not represent the amount paid by the class during periods when reimbursements or reductions occur. Expense ratios before reductions for start-up periods may not be representative of longer-term operating periods. Expenses net of fee waivers reflect expenses after reimbursement by the investment adviser but prior to reductions from brokerage service arrangements or other expense offset arrangements. Expenses net of all reductions represent the net expenses paid by the class.
I Amount represents less than $.01 per share.
See accompanying notes which are an integral part of the financial statements.
Annual Report
Notes to Financial Statements
For the period ended October 31, 2011
1. Organization.
Fidelity Worldwide Fund (the Fund) is a fund of Fidelity Investment Trust (the Trust) and is authorized to issue an unlimited number of shares. The Trust is registered under the Investment Company Act of 1940, as amended (the 1940 Act), as an open-end management investment company organized as a Massachusetts business trust. The Fund offers Class A, Class T, Class C, Worldwide and Institutional class, each of which, along with class B shares has equal rights as to assets and voting privileges. Effective after the close of business on September 1, 2010, Class B shares were closed to new accounts and additional purchases, except for exchanges and reinvestments by existing shareholders. Each class has exclusive voting rights with respect to matters that affect that class. Class B shares will automatically convert to Class A shares after a holding period of seven years from the initial date of purchase. Investment income, realized and unrealized capital gains and losses, the common expenses of the Fund, and certain fund-level expense reductions, if any, are allocated on a pro-rata basis to each class based on the relative net assets of each class to the total net assets of the Fund. Each class differs with respect to transfer agent and distribution and service plan fees incurred. Certain expense reductions may also differ by class. The Fund's investments in emerging markets can be subject to social, economic, regulatory, and political uncertainties and can be extremely volatile.
2. Investments in Fidelity Central Funds.
The Fund invests in Fidelity Central Funds, which are open-end investment companies available only to other investment companies and accounts managed by Fidelity Management & Research Company (FMR) and its affiliates. The Fund's Schedule of Investments lists each of the Fidelity Central Funds held as of period end, if any, as an investment of the Fund, but does not include the underlying holdings of each Fidelity Central Fund. As an Investing Fund, the Fund indirectly bears its proportionate share of the expenses of the underlying Fidelity Central Funds.
The Money Market Central Funds seek preservation of capital and current income and are managed by Fidelity Investments Money Management, Inc. (FIMM), an affiliate of FMR.
A complete unaudited list of holdings for each Fidelity Central Fund is available upon request or at the Securities and Exchange Commission (the SEC) web site at www.sec.gov. In addition, the financial statements of the Fidelity Central Funds, which are not covered by the Fund's Report of Independent Registered Public Accounting Firm are available on the SEC web site or upon request.
3. Significant Accounting Policies.
The financial statements have been prepared in conformity with accounting principles generally accepted in the United States of America (GAAP), which require management to make certain estimates and assumptions at the date of the financial statements. Actual results could differ from those estimates. Subsequent events, if any, through the date that the financial statements were issued have been evaluated in the preparation of the financial statements. The following summarizes the significant accounting policies of the Fund:
Security Valuation. Investments are valued as of 4:00 p.m. Eastern time on the last calendar day of the period. The Fund uses independent pricing services approved by the Board of Trustees to value its investments. When current market prices or quotations are not readily available or reliable, valuations may be determined in good faith in accordance with procedures adopted by the Board of Trustees. Factors used in determining value may include market or security specific events. The frequency with which these procedures are used cannot be predicted and they may be utilized to a significant extent. The value used for net asset value (NAV) calculation under these procedures may differ from published prices for the same securities.
The Fund categorizes the inputs to valuation techniques used to value its investments into a disclosure hierarchy consisting of three levels as shown below:
Level 1 - quoted prices in active markets for identical investments
Level 2 - other significant observable inputs (including quoted prices for similar investments, interest rates, prepayment speeds, etc.)
Level 3 - unobservable inputs (including the Fund's own assumptions based on the best information available)
Changes in valuation techniques may result in transfers in or out of an assigned level within the disclosure hierarchy. The aggregate value of investments by input level, as of October 31, 2011 as well as a roll forward of Level 3 securities, is included at the end of the Fund's Schedule of Investments. Valuation techniques used to value the Fund's investments by major category are as follows:
Equity securities, including restricted securities, for which market quotations are readily available, are valued at the last reported sale price or official closing price as reported by an independent pricing service on the primary market or exchange on which they are traded and are categorized as Level 1 in the hierarchy. In the event there were no sales during the day or closing prices are not available, securities are valued at the last quoted bid price or may be valued using the last available price and are generally categorized as Level 2 in the hierarchy. For foreign equity securities, when significant market or security specific events arise, comparisons to the valuation of American Depositary Receipts (ADRs), futures contracts, Exchange-traded funds (ETFs) and certain indexes as well as quoted prices for similar securities are used and are categorized as Level 2 in the hierarchy in these
Annual Report
3. Significant Accounting Policies - continued
Security Valuation - continued
circumstances. Utilizing these techniques may result in transfers between Level 1 and Level 2. For restricted equity securities and private placements where observable inputs are limited, assumptions about market activity and risk are used and are categorized as Level 3 in the hierarchy.
Investments in open-end mutual funds, including the Fidelity Central Funds, are valued at their closing net asset value each business day and are categorized as Level 1 in the hierarchy.
Foreign Currency. The Fund may use foreign currency contracts to facilitate transactions in foreign-denominated securities. Gains and losses from these transactions may arise from changes in the value of the foreign currency or if the counterparties do not perform under the contracts' terms.
Foreign-denominated assets, including investment securities, and liabilities are translated into U.S. dollars at the exchange rate at period end. Purchases and sales of investment securities, income and dividends received and expenses denominated in foreign currencies are translated into U.S. dollars at the exchange rate in effect on the transaction date.
The effects of exchange rate fluctuations on investments are included with the net realized and unrealized gain (loss) on investment securities. Other foreign currency transactions resulting in realized and unrealized gain (loss) are disclosed separately.
Investment Transactions and Income. For financial reporting purposes, the Fund's investment holdings and NAV include trades executed through the end of the last business day of the period. The NAV per share for processing shareholder transactions is calculated as of the close of business of the New York Stock Exchange (NYSE) normally 4:00 p.m. Eastern time and includes trades executed through the end of the prior business day. Gains and losses on securities sold are determined on the basis of identified cost and may include proceeds received from litigation. Dividend income is recorded on the ex-dividend date, except for certain dividends from foreign securities where the ex-dividend date may have passed, which are recorded as soon as the Fund is informed of the ex-dividend date. Non-cash dividends included in dividend income, if any, are recorded at the fair market value of the securities received. Distributions received on securities that represent a return of capital or capital gain are recorded as a reduction of cost of investments and/or as a realized gain. The Fund estimates the components of distributions received that may be considered return of capital distributions or capital gain distributions. Interest income and distributions from the Fidelity Central Funds are accrued as earned. Interest income includes coupon interest and amortization of premium and accretion of discount on debt securities. Investment income is recorded net of foreign taxes withheld where recovery of such taxes is uncertain.
Expenses. Expenses directly attributable to a fund are charged to that fund. Expenses attributable to more than one fund are allocated among the respective funds on the basis of relative net assets or other appropriate methods. Expense estimates are accrued in the period to which they relate and adjustments are made when actual amounts are known.
Income Tax Information and Distributions to Shareholders. Each year, the Fund intends to qualify as a regulated investment company, including distributing substantially all of its taxable income and realized gains under Subchapter M of the Internal Revenue Code and filing its U.S. federal tax return. As a result, no provision for income taxes is required. As of October 31, 2011, the Fund did not have any unrecognized tax benefits in the financial statements. A fund's federal tax return is subject to examination by the Internal Revenue Service (IRS) for a period of three years. Foreign taxes are provided for based on the Fund's understanding of the tax rules and rates that exist in the foreign markets in which it invests.
Distributions are declared and recorded on the ex-dividend date. Income dividends and capital gain distributions are declared separately for each class. Income and capital gain distributions are determined in accordance with income tax regulations, which may differ from GAAP. In addition, the Fund claimed a portion of the payment made to redeeming shareholders as a distribution for income tax purposes.
Capital accounts within the financial statements are adjusted for permanent book-tax differences. These adjustments have no impact on net assets or the results of operations. Temporary book-tax differences will reverse in a subsequent period.
Book-tax differences are primarily due to foreign currency transactions, certain foreign taxes, passive foreign investment companies (PFIC), partnerships, equity-debt classifications, deferred trustees compensation, capital loss carryforwards and losses deferred due to wash sales.
The federal tax cost of investment securities and unrealized appreciation (depreciation) as of period end were as follows:
Gross unrealized appreciation | $ 107,207,788 |
Gross unrealized depreciation | (63,870,262) |
Net unrealized appreciation (depreciation) on securities and other investments | $ 43,337,526 |
| |
Tax Cost | $ 1,106,703,140 |
Annual Report
Notes to Financial Statements - continued
3. Significant Accounting Policies - continued
Income Tax Information and Distributions to Shareholders - continued
The tax-based components of distributable earnings as of period end were as follows:
Undistributed ordinary income | $ 2,701,313 |
Capital loss carryfoward | $ (43,909,944) |
Net unrealized appreciation (depreciation) | $ 43,352,876 |
Under the recently enacted Regulated Investment Company Modernization Act of 2010 (the Act), the Fund will be permitted to carry forward capital losses incurred in taxable years beginning after December 22, 2010 for an unlimited period. However, any losses incurred during those future taxable years will be required to be utilized prior to any losses incurred in pre-enactment taxable years, which generally expire after eight years from when they are incurred. Additionally, post-enactment capital losses that are carried forward will retain their character as either short-term or long-term capital losses rather than being considered all short-term as under previous law. The Fund's first fiscal year end subject to the Act will be October 31, 2012.
The tax character of distributions paid was as follows:
| October 31, 2011 | October 31, 2010 |
Ordinary Income | $ 9,114,660 | $ 7,413,180 |
Short-Term Trading (Redemption) Fees. Shares held by investors in the Fund less than 30 days are subject to a redemption fee equal to 1.00% of the net asset value of shares redeemed. All redemption fees, which reduce the proceeds of the shareholder redemption, are retained by the Fund and accounted for as an addition to paid in capital.
New Accounting Pronouncement. In May 2011, the Financial Accounting Standards Board issued Accounting Standard Update No. 2011-04, Fair Value Measurement (Topic 820) - Amendments to Achieve Common Fair Value Measurement and Disclosure Requirements in U.S. GAAP and IFRSs. The update changes the wording used to describe the requirements in GAAP for measuring fair value and for disclosing information about fair value measurements. The update is effective during interim and annual periods beginning after December 15, 2011. Management is currently evaluating the impact of the update's adoption on the Fund's financial statement disclosures.
4. Purchases and Sales of Investments.
Purchases and sales of securities, other than short-term securities, aggregated $2,331,452,718 and $2,340,625,824, respectively.
5. Fees and Other Transactions with Affiliates.
Management Fee. FMR and its affiliates provide the Fund with investment management related services for which the Fund pays a monthly management fee. The management fee is the sum of an individual fund fee rate that is based on an annual rate of .45% of the Fund's average net assets and a group fee rate that averaged .26% during the period. The group fee rate is based upon the average net assets of all the mutual funds advised by FMR. The group fee rate decreases as assets under management increase and increases as assets under management decrease. In addition, the management fee is subject to a performance adjustment (up to a maximum of ±.20% of the Fund's average net assets over a 36 month performance period). The upward or downward adjustment to the management fee is based on the relative investment performance of Worldwide as compared to an appropriate benchmark index. For the period, the total annual management fee rate, including the performance adjustment, was .77% of the Fund's average net assets.
Distribution and Service Plan Fees. In accordance with Rule 12b-1 of the 1940 Act, the Fund has adopted separate Distribution and Service Plans for each class of shares. Certain classes pay Fidelity Distributors Corporation (FDC), an affiliate of FMR, separate Distribution and Service Fees, each of which is based on an annual percentage of each class' average net assets. In addition, FDC may pay financial intermediaries for selling shares of the Fund and providing shareholder support services. For the period, the Distribution and Service Fee rates, total fees and amounts retained by FDC were as follows:
| Distribution
Fee | Service
Fee | Total
Fees | Retained
by FDC |
Class A | -% | .25% | $ 27,830 | $ 7,097 |
Class T | .25% | .25% | 12,334 | 6 |
Class B | .75% | .25% | 3,072 | 2,345 |
Class C | .75% | .25% | 10,828 | 4,607 |
| | | $ 54,064 | $ 14,055 |
Annual Report
5. Fees and Other Transactions with Affiliates - continued
Sales Load. FDC may receive a front-end sales charge of up to 5.75% for selling Class A shares, and 3.50% for selling Class T shares, some of which is paid to financial intermediaries for selling shares of the Fund. Depending on the holding period, FDC may receive contingent deferred sales charges levied on Class A, Class T, Class B, and Class C redemptions. The deferred sales charges range from 5% to 1% for Class B, 1% for Class C, 1.00% for certain purchases of Class A shares and .25% for certain purchases of Class T shares.
For the period, sales charge amounts retained by FDC were as follows:
| Retained
by FDC |
Class A | $ 12,873 |
Class T | 1,872 |
Class B* | 291 |
Class C* | 512 |
| $ 15,548 |
* When Class B and Class C shares are initially sold, FDC pays commissions from its own resources to financial intermediaries through which the sales are made.
Transfer Agent Fees. Fidelity Investments Institutional Operations Company, Inc. (FIIOC), an affiliate of FMR, is the transfer, dividend disbursing and shareholder servicing agent for each class of the Fund. FIIOC receives account fees and asset-based fees that vary according to the account size and type of account of the shareholders of the respective classes of the Fund. FIIOC pays for typesetting, printing and mailing of shareholder reports, except proxy statements. For the period, transfer agent fees for each class were as follows:
| Amount | % of
Average
Net Assets |
Class A | $ 33,823 | .30 |
Class T | 7,470 | .30 |
Class B | 941 | .31 |
Class C | 3,295 | .30 |
Worldwide | 2,724,210 | .23 |
Institutional Class | 3,500 | .28 |
| $ 2,773,239 | |
Accounting and Security Lending Fees. Fidelity Service Company, Inc. (FSC), an affiliate of FMR, maintains the Fund's accounting records. The accounting fee is based on the level of average net assets for the month. Under a separate contract, FSC administers the security lending program. The security lending fee is based on the number and duration of lending transactions.
Brokerage Commissions. The Fund placed a portion of its portfolio transactions with brokerage firms which are affiliates of the investment adviser. The commissions paid to these affiliated firms were $92,473 for the period.
6. Committed Line of Credit.
The Fund participates with other funds managed by FMR or an affiliate in a $4.0 billion credit facility (the "line of credit") to be utilized for temporary or emergency purposes to fund shareholder redemptions or for other short-term liquidity purposes. The Fund has agreed to pay commitment fees on its pro-rata portion of the line of credit, which amounted to $3,661 and is reflected in Miscellaneous expenses on the Statement of Operations. During the period, there were no borrowings on this line of credit.
7. Security Lending.
The Fund lends portfolio securities through a lending agent from time to time in order to earn additional income. For equity securities, a lending agent is used and may loan securities to certain qualified borrowers, including Fidelity Capital Markets (FCM), a broker-dealer affiliated with the Fund. On the settlement date of the loan, the Fund receives collateral (in the form of U.S. Treasury obligations, letters of credit and/or cash) against the loaned securities and maintains collateral in an amount not less than 100% of the market value of the loaned securities during the period of the loan. The market value of the loaned securities is determined at the close of business of the Fund and any additional required collateral is delivered to the Fund on the next business day. If the borrower defaults on its obligation to return the securities loaned because of insolvency or other reasons, a fund could experience delays and costs in recovering the securities loaned or in gaining access to the collateral. Any cash collateral received is invested in the Fidelity Securities Lending Cash Central Fund. The value of loaned securities and cash collateral at period end are disclosed on the Fund's Statement
Annual Report
Notes to Financial Statements - continued
7. Security Lending - continued
of Assets and Liabilities. Security lending income represents the income earned on investing cash collateral, less rebates paid to borrowers, and any lending agent fees associated with the loan, plus any premium payments received for lending certain types of securities. Security lending income is presented in the Statement of Operations as a component of income from Fidelity Central Funds. Total security lending income during the period amounted to $199,692. During the period, there were no securities loaned to FCM.
8. Expense Reductions.
FMR voluntarily agreed to reimburse a portion of its management fee. For the period, the amount of this reimbursement was $51,129.
Many of the brokers with whom FMR places trades on behalf of the Fund provided services to the Fund in addition to trade execution. These services included payments of certain expenses on behalf of the Fund totaling $306,388 for the period.
9. Distributions to Shareholders.
Distributions to shareholders of each class were as follows:
Years ended October 31, | 2011 | 2010 |
From net investment income | | |
Class A | $ 36,687 | $ 9,814 |
Class T | 3,024 | 2,409 |
Class B | - | 75 |
Class C | - | 827 |
Worldwide | 6,199,611 | 6,404,601 |
Institutional Class | 4,819 | 2,241 |
Total | $ 6,244,141 | $ 6,419,967 |
From net realized gain | | |
Class A | $ 20,664 | $ 1,404 |
Class T | 3,280 | 480 |
Class B | - | 191 |
Class C | - | 373 |
Worldwide | 2,844,643 | 990,471 |
Institutional Class | 1,932 | 294 |
Total | $ 2,870,519 | $ 993,213 |
10. Share Transactions.
Transactions for each class of shares were as follows:
| Shares | Dollars |
Years ended October 31, | 2011 | 2010 | 2011 | 2010 |
Class A | | | | |
Shares sold | 446,295 | 404,777 | $ 8,440,354 | $ 6,463,954 |
Reinvestment of distributions | 2,409 | 589 | 44,007 | 9,399 |
Shares redeemed | (143,732) | (41,328) | (2,654,718) | (668,935) |
Net increase (decrease) | 304,972 | 364,038 | $ 5,829,643 | $ 5,804,418 |
Class T | | | | |
Shares sold | 307,740 | 57,729 | $ 5,853,479 | $ 930,150 |
Reinvestment of distributions | 344 | 156 | 6,293 | 2,498 |
Shares redeemed | (249,620) | (24,377) | (4,835,753) | (385,540) |
Net increase (decrease) | 58,464 | 33,508 | $ 1,024,019 | $ 547,108 |
Class B | | | | |
Shares sold | 3,768 | 11,168 | $ 71,519 | $ 177,092 |
Reinvestment of distributions | - | 16 | - | 260 |
Shares redeemed | (6,939) | (8,709) | (128,598) | (138,098) |
Net increase (decrease) | (3,171) | 2,475 | $ (57,079) | $ 39,254 |
Annual Report
10. Share Transactions - continued
| Shares | Dollars |
Years ended October 31, | 2011 | 2010 | 2011 | 2010 |
Class C | | | | |
Shares sold | 41,472 | 34,028 | $ 784,669 | $ 543,674 |
Reinvestment of distributions | - | 68 | - | 1,087 |
Shares redeemed | (9,227) | (15,747) | (167,760) | (246,126) |
Net increase (decrease) | 32,245 | 18,349 | $ 616,909 | $ 298,635 |
Worldwide | | | | |
Shares sold | 12,255,493 | 8,421,228 | $ 231,984,939 | $ 135,177,567 |
Reinvestment of distributions | 480,262 | 449,494 | 8,805,760 | 7,194,622 |
Shares redeemed | (12,736,797) | (13,209,138) | (238,335,100) | (210,537,866) |
Net increase (decrease) | (1,042) | (4,338,416) | $ 2,455,599 | $ (68,165,677) |
Institutional Class | | | | |
Shares sold | 162,911 | 9,920 | $ 2,875,496 | $ 162,697 |
Reinvestment of distributions | 360 | 158 | 6,581 | 2,535 |
Shares redeemed | (10,647) | (10,397) | (193,044) | (165,950) |
Net increase (decrease) | 152,624 | (319) | $ 2,689,033 | $ (718) |
11. Other.
The Fund's organizational documents provide former and current trustees and officers with a limited indemnification against liabilities arising in connection with the performance of their duties to the Fund. In the normal course of business, the Fund may also enter into contracts that provide general indemnifications. The Fund's maximum exposure under these arrangements is unknown as this would be dependent on future claims that may be made against the Fund. The risk of material loss from such claims is considered remote.
Annual Report
Report of Independent Registered Public Accounting Firm
To the Trustees of Fidelity Investment Trust and Shareholders of Fidelity Worldwide Fund:
We have audited the accompanying statement of assets and liabilities of Fidelity Worldwide Fund (the Fund), a fund of Fidelity Investment Trust, including the schedule of investments, as of October 31, 2011, and the related statement of operations for the year then ended, the statement of changes in net assets for each of the two years in the period then ended, and the financial highlights for each of the five years in the period then ended. These financial statements and financial highlights are the responsibility of the Fund's management. Our responsibility is to express an opinion on these financial statements and financial highlights based on our audits.
We conducted our audits in accordance with the standards of the Public Company Accounting Oversight Board (United States). Those standards require that we plan and perform the audit to obtain reasonable assurance about whether the financial statements and financial highlights are free of material misstatement. The Fund is not required to have, nor were we engaged to perform, an audit of its internal control over financial reporting. Our audits included consideration of internal control over financial reporting as a basis for designing audit procedures that are appropriate in the circumstances, but not for the purpose of expressing an opinion on the effectiveness of the Fund's internal control over financial reporting. Accordingly, we express no such opinion. An audit also includes examining, on a test basis, evidence supporting the amounts and disclosures in the financial statements, assessing the accounting principles used and significant estimates made by management, as well as evaluating the overall financial statement presentation. Our procedures included confirmation of securities owned as of October 31, 2011, by correspondence with the custodians and brokers; where replies were not received from brokers, we performed other auditing procedures. We believe that our audits provide a reasonable basis for our opinion.
In our opinion, the financial statements and financial highlights referred to above present fairly, in all material respects, the financial position of Fidelity Worldwide Fund as of October 31, 2011, the results of its operations for the year then ended, the changes in its net assets for each of the two years in the period then ended, and the financial highlights for each of the five years in the period then ended, in conformity with accounting principles generally accepted in the United States of America.
DELOITTE & TOUCHE LLP
Boston, Massachusetts
December 16, 2011
Annual Report
The Trustees, Members of the Advisory Board, and executive officers of the trust and funds, as applicable, are listed below. The Board of Trustees governs each fund and is responsible for protecting the interests of shareholders. The Trustees are experienced executives who meet periodically throughout the year to oversee each fund's activities, review contractual arrangements with companies that provide services to each fund, oversee management of the risks associated with such activities and contractual arrangements, and review each fund's performance. Except for James C. Curvey, each of the Trustees oversees 226 funds advised by FMR or an affiliate. Mr. Curvey oversees 429 funds advised by FMR or an affiliate.
The Trustees hold office without limit in time except that (a) any Trustee may resign; (b) any Trustee may be removed by written instrument, signed by at least two-thirds of the number of Trustees prior to such removal; (c) any Trustee who requests to be retired or who has become incapacitated by illness or injury may be retired by written instrument signed by a majority of the other Trustees; and (d) any Trustee may be removed at any special meeting of shareholders by a two-thirds vote of the outstanding voting securities of the trust. Each Trustee who is not an interested person (as defined in the 1940 Act) (Independent Trustee), shall retire not later than the last day of the calendar year in which his or her 75th birthday occurs. The Independent Trustees may waive this mandatory retirement age policy with respect to individual Trustees. The executive officers and Advisory Board Members hold office without limit in time, except that any officer and Advisory Board Member may resign or may be removed by a vote of a majority of the Trustees at any regular meeting or any special meeting of the Trustees. Except as indicated, each individual has held the office shown or other offices in the same company for the past five years.
Experience, Skills, Attributes, and Qualifications of the Funds' Trustees. The Governance and Nominating Committee has adopted a statement of policy that describes the experience, qualifications, attributes, and skills that are necessary and desirable for potential Independent Trustee candidates (Statement of Policy). The Board believes that each Trustee satisfied at the time he or she was initially elected or appointed a Trustee, and continues to satisfy, the standards contemplated by the Statement of Policy. The Governance and Nominating Committee also engages professional search firms to help identify potential Independent Trustee candidates who have the experience, qualifications, attributes, and skills consistent with the Statement of Policy. From time to time, additional criteria based on the composition and skills of the current Independent Trustees, as well as experience or skills that may be appropriate in light of future changes to board composition, business conditions, and regulatory or other developments, have also been considered by the professional search firms and the Governance and Nominating Committee. In addition, the Board takes into account the Trustees' commitment and participation in Board and committee meetings, as well as their leadership of standing and ad hoc committees throughout their tenure.
In determining that a particular Trustee was and continues to be qualified to serve as a Trustee, the Board has considered a variety of criteria, none of which, in isolation, was controlling. The Board believes that, collectively, the Trustees have balanced and diverse experience, qualifications, attributes, and skills, which allow the Board to operate effectively in governing each fund and protecting the interests of shareholders. Information about the specific experience, skills, attributes, and qualifications of each Trustee, which in each case led to the Board's conclusion that the Trustee should serve (or continue to serve) as a trustee of the funds, is provided below.
Board Structure and Oversight Function. James C. Curvey is an interested person (as defined in the 1940 Act) and currently serves as Acting Chairman. The Trustees have determined that an interested Chairman is appropriate and benefits shareholders because an interested Chairman has a personal and professional stake in the quality and continuity of services provided to the funds. Independent Trustees exercise their informed business judgment to appoint an individual of their choosing to serve as Chairman, regardless of whether the Trustee happens to be independent or a member of management. The Independent Trustees have determined that they can act independently and effectively without having an Independent Trustee serve as Chairman and that a key structural component for assuring that they are in a position to do so is for the Independent Trustees to constitute a substantial majority for the Board. The Independent Trustees also regularly meet in executive session. Ned C. Lautenbach serves as Chairman of the Independent Trustees and as such (i) acts as a liaison between the Independent Trustees and management with respect to matters important to the Independent Trustees and (ii) with management prepares agendas for Board meetings.
Fidelity funds are overseen by different Boards of Trustees. The funds' Board oversees Fidelity's equity and high income funds and another Board oversees Fidelity's investment-grade bond, money market, and asset allocation funds. The asset allocation funds may invest in Fidelity funds overseen by the funds' Board. The use of separate Boards, each with its own committee structure, allows the Trustees of each group of Fidelity funds to focus on the unique issues of the funds they oversee, including common research, investment, and operational issues. On occasion, the separate Boards establish joint committees to address issues of overlapping consequences for the Fidelity funds overseen by each Board.
The Trustees operate using a system of committees to facilitate the timely and efficient consideration of all matters of importance to the Trustees, each fund, and fund shareholders and to facilitate compliance with legal and regulatory requirements and oversight of the funds' activities and associated risks. The Board, acting through its committees, has charged FMR and its affiliates with (i) identifying events or circumstances the occurrence of which could have demonstrably adverse effects on the funds' business and/or reputation; (ii) implementing processes and controls to lessen the possibility that such events or circumstances occur or to mitigate the effects of such events or circumstances if they do occur; and (iii) creating and maintaining a system designed to evaluate continuously business and market conditions in order to facilitate the identification and implementation processes described in (i) and (ii) above. Because the day-to-day operations and activities of the funds are carried out by or through FMR, its affiliates and other service providers, the funds' exposure to risks is mitigated but not eliminated by the processes overseen by the Trustees. While each of the Board's committees has responsibility for overseeing different aspects of the funds' activities, oversight is exercised primarily through the Operations, Audit, and Compliance Committees. In addition, the Independent Trustees have worked with FMR to enhance the Board's oversight of investment and financial risks, legal and regulatory risks, technology risks, and operational risks, including the development of additional risk reporting to the Board. For example, a working group comprised of Independent Trustees and FMR has worked and continues to work to review the Fidelity funds' valuation-related activities, reporting and risk management. Appropriate personnel, including but not limited to the funds' Chief Compliance Officer (CCO), FMR's internal auditor, the independent accountants, the funds' Treasurer and portfolio management personnel, make periodic reports to the Board's committees, as appropriate, including an annual review of FMR's risk management program for the Fidelity funds. The responsibilities of each standing committee, including their oversight responsibilities, are described further under "Standing Committees of the Funds' Trustees."
Annual Report
Trustees and Officers - continued
The funds' Statement of Additional Information (SAI) includes more information about the Trustees. To request a free copy, call Fidelity at 1-800-544-8544.
Interested Trustees*:
Correspondence intended for each Trustee who is an interested person may be sent to Fidelity Investments, 82 Devonshire Street, Boston, Massachusetts 02109.
Name, Age; Principal Occupations and Other Relevant Experience+ |
James C. Curvey (76) |
| Year of Election or Appointment: 2007 Mr. Curvey is Trustee and Acting Chairman of the Board of Trustees of certain Trusts. Mr. Curvey also serves as Trustee (2007-present) of other investment companies advised by FMR. Mr. Curvey is a Director of Fidelity Investments Money Management, Inc. (2009-present), Director of Fidelity Research & Analysis Co. (2009-present) and Director of FMR and FMR Co., Inc. (2007-present). Mr. Curvey is also Vice Chairman (2007-present) and Director of FMR LLC. In addition, Mr. Curvey serves as an Overseer for the Boston Symphony Orchestra and a member of the Trustees of Villanova University. Previously, Mr. Curvey was the Vice Chairman (2006-2007) and Director (2000-2007) of FMR Corp. |
Ronald P. O'Hanley (54) |
| Year of Election or Appointment: 2011 Mr. O'Hanley is Director of FMR Co., Inc. (2010-present), Director of Fidelity Investments Money Management, Inc. (2010-present), Director of Fidelity Research & Analysis Company (2010-present), President of Fidelity Asset Management and Corporate Services and a member of Fidelity's Executive Committee (2010-present). Previously, Mr. O'Hanley served as President and Chief Executive Officer of BNY Mellon Asset Management (2007-2010). Mr. O'Hanley also served as Vice Chairman of Bank New York Mellon Corp. and a member of that firm's Executive Committee. Prior to the 2007 merger of The Bank of New York and Mellon Financial Corporation, he was Vice Chairman of Mellon Financial Corporation and President and Chief Executive Officer of Mellon Asset Management. He joined Mellon in February 1997. Mr. O'Hanley currently serves as Chairman of the Boston Public Library Foundation Board of Directors and sits on the Board of Directors of Beth Israel Deaconess Medical Center, the Board of Trustees of the Marine Biological Laboratory and the Advisory Board of the Maxwell School of Citizenship and Public Administration at Syracuse University. Mr. O'Hanley also chairs the Council on Asset Management for the Financial Services Roundtable and is a member of the Board of Directors of Institutional Investor's U.S. Institute. |
* Trustees have been determined to be "Interested Trustees" by virtue of, among other things, their affiliation with the trust or various entities under common control with FMR.
+ The information above includes each Trustee's principal occupation during the last five years and other information relating to the experience, attributes, and skills relevant to each Trustee's qualifications to serve as a Trustee, which led to the conclusion that each Trustee should serve as a Trustee for each fund.
Independent Trustees:
Correspondence intended for each Independent Trustee (that is, the Trustees other than the Interested Trustees) may be sent to Fidelity Investments, P.O. Box 55235, Boston, Massachusetts 02205-5235.
Name, Age; Principal Occupations and Other Relevant Experience+ |
Dennis J. Dirks (63) |
| Year of Election or Appointment: 2005 Prior to his retirement in May 2003, Mr. Dirks was Chief Operating Officer and a member of the Board of The Depository Trust & Clearing Corporation (DTCC). He also served as President, Chief Operating Officer, and Board member of The Depository Trust Company (DTC) and President and Board member of the National Securities Clearing Corporation (NSCC). In addition, Mr. Dirks served as Chief Executive Officer and Board member of the Government Securities Clearing Corporation, Chief Executive Officer and Board member of the Mortgage-Backed Securities Clearing Corporation, as a Trustee and a member of the Finance Committee of Manhattan College (2005-2008), and as a Trustee and a member of the Finance Committee of AHRC of Nassau County (2006-2008). Mr. Dirks is a member of the Independent Directors Council (IDC) Governing Council (2010-Present) and Board of Directors for The Brookville Center for Children's Services, Inc. (2009-present). |
Alan J. Lacy (58) |
| Year of Election or Appointment: 2008 Mr. Lacy serves as Senior Adviser (2007-present) of Oak Hill Capital Partners, L.P. (private equity). Mr. Lacy also served as Chief Executive Officer (2000-2005) and Vice Chairman (2005-2006) of Sears Holdings Corporation and Sears, Roebuck and Co. (retail). In addition, Mr. Lacy serves as a member of the Board of Directors of Dave & Buster's, Inc. (restaurant and entertainment complexes, 2010-present), The Hillman Companies, Inc. (hardware wholesalers, 2010-present), and Bristol-Myers Squibb Company (global pharmaceuticals, 2007-present). Mr. Lacy is a member of the Board of Trustees of The National Parks Conservation Association (2006-Present). Previously, Mr. Lacy served as Chairman of the Board of Trustees of the National Parks Conservation Association (2008-2011) and as a member of the Board of Directors for the Western Union Company (global money transfer, 2006-2011). |
Ned C. Lautenbach (67) |
| Year of Election or Appointment: 2000 Mr. Lautenbach is Chairman of the Independent Trustees of the Equity and High Income Funds (2006-present). Mr. Lautenbach currently serves as the Lead Director of the Eaton Corporation Board of Directors (diversified industrial, 1997-present). Mr. Lautenbach is also a member of the Board of Directors of the Philharmonic Center for the Arts in Naples, Florida (1999-present); a member of the Board of Trustees of Fairfield University (2005-present); and a member of the Council on Foreign Relations (1994-present). Previously, Mr. Lautenbach was a Partner/Advisory Partner at Clayton, Dubilier & Rice, LLC (private equity investment, 1998-2010), as well as a Director of Sony Corporation (2006-2007). |
Joseph Mauriello (67) |
| Year of Election or Appointment: 2008 Prior to his retirement in January 2006, Mr. Mauriello served in numerous senior management positions including Deputy Chairman and Chief Operating Officer (2004-2005), and Vice Chairman of Financial Services (2002-2004) of KPMG LLP US (professional services, 1965-2005). Mr. Mauriello currently serves as a member of the Board of Directors of XL Group plc. (global insurance and re-insurance, 2006-present) and of Arcadia Resources Inc. (health care services and products, 2007-present). Previously, Mr. Mauriello served as a Director of the Hamilton Funds of the Bank of New York (2006-2007). |
Robert W. Selander (61) |
| Year of Election or Appointment: 2011 Previously, Mr. Selander served as a Member of the Advisory Board of Fidelity's Equity and High Income Funds (2011), Executive Vice Chairman (2010), Chief Executive Officer (2009-2010), and President and Chief Executive Officer (1997-2009) of Mastercard, Inc. |
Cornelia M. Small (67) |
| Year of Election or Appointment: 2005 Ms. Small is a member of the Board of Directors of the Teagle Foundation (2009-present). Ms. Small is also a member of the Investment Committee, and Chair (2008-present) and a member of the Board of Trustees of Smith College. In addition, Ms. Small serves on the Investment Committee of the Berkshire Taconic Community Foundation (2008-present). Previously, Ms. Small served as Chairperson of the Investment Committee (2002-2008) of Smith College. In addition, Ms. Small served as Chief Investment Officer, Director of Global Equity Investments, and a member of the Board of Directors of Scudder, Stevens & Clark and Scudder Kemper Investments. |
William S. Stavropoulos (72) |
| Year of Election or Appointment: 2001 Mr. Stavropoulos is Vice Chairman of the Independent Trustees of the Equity and High Income Funds (2006-present). Mr. Stavropoulos serves as President and Founder of the Michigan Baseball Foundation, the Great Lakes Loons (2007-present). Mr. Stavropoulos is Chairman Emeritus of the Board of Directors of The Dow Chemical Company, where he previously served in numerous senior management positions, including President, CEO (1995-2000; 2002-2004), Chairman of the Executive Committee (2000-2006), and as a member of the Board of Directors (1990-2006). Currently, Mr. Stavropoulos is Chairman of Univar (global distributor of commodity and specialty chemicals, 2010-present), a Director of Teradata Corporation (data warehousing and technology solutions, 2008-present), Chemical Financial Corporation, Maersk Inc. (industrial conglomerate), Tyco International, Inc. (multinational manufacturing and services, 2007-present), and a member of the Advisory Board for Metalmark Capital (private equity investment, 2005-present). Mr. Stavropoulos is a special advisor to Clayton, Dubilier & Rice, LLC (private equity investment). In addition, Mr. Stavropoulos is a member of the University of Notre Dame Advisory Council for the College of Science. |
David M. Thomas (62) |
| Year of Election or Appointment: 2008 Previously, Mr. Thomas served as Executive Chairman (2005-2006) and Chairman and Chief Executive Officer (2000-2005) of IMS Health, Inc. (pharmaceutical and healthcare information solutions). In addition, Mr. Thomas serves as a member of the Board of Directors of Fortune Brands, Inc. (consumer products), and Interpublic Group of Companies, Inc. (marketing communication, 2004-present). |
Michael E. Wiley (61) |
| Year of Election or Appointment: 2008 Mr. Wiley also serves as a Director of Asia Pacific Exploration Consolidated (international oil and gas exploration and production, 2008-present). Mr. Wiley serves as a Director of Tesoro Corporation (independent oil refiner and marketer, 2005-present), and a Director of Bill Barrett Corporation (exploration and production, 2005-present). In addition, Mr. Wiley also serves as a Director of Post Oak Bank (privately-held bank, 2004-present). Previously, Mr. Wiley served as a member of the Board of Trustees of the University of Tulsa (2000-2006; 2007-2010), as a Senior Energy Advisor of Katzenbach Partners, LLC (consulting, 2006-2007), as an Advisory Director of Riverstone Holdings (private investment), Chairman, President, and CEO of Baker Hughes, Inc. (oilfield services, 2000-2004), and as Director of Spinnaker Exploration Company (exploration and production, 2001-2005). |
+ The information above includes each Trustee's principal occupation during the last five years and other information relating to the experience, attributes, and skills relevant to each Trustee's qualifications to serve as a Trustee, which led to the conclusion that each Trustee should serve as a Trustee for each fund.
Advisory Board Members and Executive Officers:
Correspondence intended for each executive officer, Edward C. Johnson 3d, and Peter S. Lynch, may be sent to Fidelity Investments, 82 Devonshire Street, Boston, Massachusetts 02109.
Name, Age; Principal Occupation |
Edward C. Johnson 3d (81) |
| Year of Election or Appointment: 2011 Member of the Advisory Board of Fidelity's Equity and High Income Funds. Mr. Johnson serves as Chief Executive Officer, Chairman, and a Director of FMR LLC, and also serves as Chairman and Director of FIL Limited. Previously, Mr. Johnson served as a Trustee and Chairman of the Board of certain Fidelity Trusts, Chairman and a Director of FMR, Chairman and a Director of FMR Co., Inc., and President of FMR LLC (2006-2007). |
Peter S. Lynch (67) |
| Year of Election or Appointment: 2003 Member of the Advisory Board of Fidelity's Equity and High Income Funds. Mr. Lynch is Vice Chairman and a Director of FMR and FMR Co., Inc. In addition, Mr. Lynch serves as a Trustee of Boston College and as the Chairman of the Inner-City Scholarship Fund. Previously, Mr. Lynch served on the Special Olympics International Board of Directors (1997-2006). |
Kenneth B. Robins (42) |
| Year of Election or Appointment: 2008 President and Treasurer of Fidelity's Equity and High Income Funds. Mr. Robins also serves as President and Treasurer (2010-present) and Assistant Treasurer (2009-present) of other Fidelity funds and is an employee of Fidelity Investments (2004-present). Previously, Mr. Robins served as Deputy Treasurer of the Fidelity funds (2005-2008) and Treasurer and Chief Financial Officer of The North Carolina Capital Management Trust: Cash and Term Portfolios (2006-2008). |
Bruce T. Herring (46) |
| Year of Election or Appointment: 2006 Vice President of certain Equity Funds. Mr. Herring also serves as Chief Investment Officer and Director of Fidelity Management & Research (U.K.) Inc. (2010-present) and Group Chief Investments Officer of FMR. Previously, Mr. Herring served as Vice President (2005-2006) and Senior Vice President (2006-2007) of Fidelity Management & Research Company, Vice President of FMR Co., Inc. (2001-2007) and as a portfolio manager for Fidelity U.S. Equity Funds. |
Brian B. Hogan (47) |
| Year of Election or Appointment: 2009 Vice President of Equity and High Income Funds. Mr. Hogan also serves as President of FMR's Equity Division (2009-present). Previously, Mr. Hogan served as Senior Vice President, Equity Research of FMR (2006-2009) and as a portfolio manager. |
Scott C. Goebel (43) |
| Year of Election or Appointment: 2008 Secretary and Chief Legal Officer (CLO) of the Fidelity funds. Mr. Goebel also serves as Secretary of Fidelity Investments Money Management, Inc. (FIMM) (2010-present) and Fidelity Research and Analysis Company (FRAC) (2010-present); Secretary and CLO of The North Carolina Capital Management Trust: Cash and Term Portfolios (2008-present); General Counsel, Secretary, and Senior Vice President of FMR (2008-present) and FMR Co., Inc. (2008-present); employed by FMR LLC or an affiliate (2001-present); Chief Legal Officer of Fidelity Management & Research (Hong Kong) Limited (2008-present) and Assistant Secretary of Fidelity Management & Research (Japan) Inc. (2008-present), and Fidelity Management & Research (U.K.) Inc. (2008-present). Previously, Mr. Goebel served as Assistant Secretary of FIMM (2008-2010), FRAC (2008-2010), and the Funds (2007-2008) and as Vice President and Secretary of Fidelity Distributors Corporation (FDC) (2005-2007). |
William C. Coffey (42) |
| Year of Election or Appointment: 2009 Assistant Secretary of Fidelity's Equity and High Income Funds. Mr. Coffey also serves as Senior Vice President and Deputy General Counsel of FMR LLC (2010-present), and is an employee of Fidelity Investments. Previously, Mr. Coffey served as Vice President and Associate General Counsel of FMR LLC (2005-2009). |
Holly C. Laurent (57) |
| Year of Election or Appointment: 2008 Anti-Money Laundering (AML) Officer of the Fidelity funds. Ms. Laurent also serves as AML Officer of The North Carolina Capital Management Trust: Cash and Term Portfolios (2008-present) and is an employee of Fidelity Investments. Previously, Ms. Laurent was Senior Vice President and Head of Legal for Fidelity Business Services India Pvt. Ltd. (2006-2008), and Senior Vice President, Deputy General Counsel and Group Head for FMR LLC (2005-2006). |
Christine Reynolds (53) |
| Year of Election or Appointment: 2008 Chief Financial Officer of the Fidelity funds. Ms. Reynolds became President of Fidelity Pricing and Cash Management Services (FPCMS) in August 2008. Ms. Reynolds served as Chief Operating Officer of FPCMS (2007-2008). Previously, Ms. Reynolds served as President, Treasurer, and Anti-Money Laundering officer of the Fidelity funds (2004-2007). |
Kenneth A. Rathgeber (64) |
| Year of Election or Appointment: 2004 Chief Compliance Officer of Fidelity's Equity and High Income Funds. Mr. Rathgeber is Chief Compliance Officer of Fidelity Management & Research (Hong Kong) Limited (2008-present), Fidelity Management & Research (Japan) Inc. (2008-present), FMR (2005-present), FMR Co., Inc. (2005-present), Fidelity Management & Research (U.K.) Inc. (2005-present), Fidelity Research & Analysis Company (2005-present), Fidelity Investments Money Management, Inc. (2005-present), Pyramis Global Advisors, LLC (2005-present), and Strategic Advisers, Inc. (2005-present). |
Jeffrey S. Christian (50) |
| Year of Election or Appointment: 2009 Deputy Treasurer of the Fidelity funds. Mr. Christian is an employee of Fidelity Investments. Previously, Mr. Christian served as Chief Financial Officer (2008-2009) of certain Fidelity funds and Senior Vice President of Fidelity Pricing and Cash Management Services (FPCMS) (2004-2009). |
Joseph F. Zambello (54) |
| Year of Election or Appointment: 2011 Deputy Treasurer of the Fidelity funds. Mr. Zambello is an employee of Fidelity Investments. Previously, Mr. Zambello served as Vice President of FMR's Program Management Group (2009-2011) and Vice President of the Transfer Agent Oversight Group (2005-2009). |
Adrien E. Deberghes (44) |
| Year of Election or Appointment: 2008 Deputy Treasurer of Fidelity's Equity and High Income Funds. Mr. Deberghes also serves as Vice President and Assistant Treasurer of Fidelity Rutland Square Trust II and Fidelity Commonwealth Trust II (2011-present), Assistant Treasurer of other Fidelity funds (2010-present), and is an employee of Fidelity Investments (2008-present). Previously, Mr. Deberghes served as Senior Vice President of Mutual Fund Administration at State Street Corporation (2007-2008), Senior Director of Mutual Fund Administration at Investors Bank & Trust (2005-2007), and Director of Finance for Dunkin' Brands (2000-2005). |
Stephanie J. Dorsey (42) |
| Year of Election or Appointment: 2010 Assistant Treasurer of Fidelity's Equity and High Income Funds. Ms. Dorsey also serves as Deputy Treasurer of other Fidelity funds (2008-present) and is an employee of Fidelity Investments (2008-present). Previously, Ms. Dorsey served as Treasurer (2004-2008) of the JPMorgan Mutual Funds and Vice President (2004-2008) of JPMorgan Chase Bank. |
John R. Hebble (53) |
| Year of Election or Appointment: 2009 Assistant Treasurer of Fidelity's Equity and High Income Funds. Mr. Hebble also serves as President (2011-present), Treasurer, and Chief Financial Officer of The North Carolina Capital Management Trust: Cash and Term Portfolios (2008-present), President and Treasurer of other Fidelity funds (2008-present) and is an employee of Fidelity Investments. |
Gary W. Ryan (53) |
| Year of Election or Appointment: 2005 Assistant Treasurer of the Fidelity funds. Mr. Ryan is an employee of Fidelity Investments. Previously, Mr. Ryan served as Vice President of Fund Reporting in Fidelity Pricing and Cash Management Services (FPCMS) (1999-2005). |
Jonathan Davis (43) |
| Year of Election or Appointment: 2010 Assistant Treasurer of the Fidelity funds. Mr. Davis is also Assistant Treasurer of Fidelity Rutland Square Trust II and Fidelity Commonwealth Trust II. Mr. Davis is an employee of Fidelity Investments. Previously, Mr. Davis served as Vice President and Associate General Counsel of FMR LLC (2003-2010). |
Annual Report
The Board of Trustees of each fund voted to pay to shareholders of record at the opening of business on record date the following distributions per share derived from capital gains realized from sales of portfolio securities and dividends derived from net investment income:
| Pay Date | Record Date | Dividends | Capital Gains |
Fidelity Diversified International Fund | 12/05/11 | 12/02/11 | $0.488 | $0.000 |
Fidelity International Capital Appreciation Fund | 12/05/11 | 12/02/11 | $0.119 | $0.009 |
Fidelity Overseas Fund | 12/05/11 | 12/02/11 | $0.827 | $0.020 |
Fidelity Worldwide Fund | 12/05/11 | 12/02/11 | $0.065 | $0.000 |
A percentage of the dividends distributed during the fiscal year for the following funds may be taken into account as a dividend for purposes of the maximum rate under section 1(h) (11) of the Internal Revenue Code:
| December 3, 2010 | December 30, 2010 |
Fidelity Diversified International Fund | 99% | 100% |
Fidelity International Capital Appreciation Fund | 54% | 100% |
Fidelity Overseas Fund | 100% | - |
Fidelity Worldwide Fund | 100% | 100% |
A percentage of the dividends distributed during the fiscal year for the following funds qualifies for the dividends - received deduction for corporate shareholders:
| December 3, 2010 | December 30, 2010 |
Fidelity Worldwide Fund | 42% | 64% |
The amounts per share which represent income derived from sources within, and taxes paid to, foreign countries or possessions of the United States are as follows:
| Pay Date | Income | Taxes |
Fidelity Diversified International Fund | 12/06/2011 | 0.373 | 0.0414 |
Fidelity Diversified International Fund | 12/31/2011 | 0.072 | 0.0000 |
Fidelity International Capital Appreciation Fund | 12/06/2011 | 0.157 | 0.0219 |
Fidelity International Capital Appreciation Fund | 12/31/2011 | 0.018 | 0.0000 |
Fidelity Overseas Fund | 12/06/2011 | 0.470 | 0.0294 |
Fidelity Worldwide Fund | 12/06/2011 | 0.115 | 0.0105 |
Fidelity Worldwide Fund | 12/31/2011 | 0.019 | 0.0000 |
The funds will notify shareholders in January 2012 of amounts for use in preparing 2011 income tax returns.
Annual Report
Board Approval of Investment Advisory Contracts and Management Fees
Broadly Diversified International Equity Funds
Each year, the Board of Trustees, including the Independent Trustees (together, the Board), votes on the renewal of the management contract and sub-advisory agreements (together, the Advisory Contracts) for each fund. The Board, assisted by the advice of fund counsel and Independent Trustees' counsel, requests and considers a broad range of information relevant to the renewal of the Advisory Contracts throughout the year.
The Board meets regularly and considers at each of its meetings factors that are relevant to its annual consideration of the renewal of each fund's Advisory Contracts, including the services and support provided to each fund and its shareholders. The Board has established various standing committees, each composed of Independent Trustees with varying backgrounds, to which the Board has assigned specific subject matter responsibilities in order to enhance effective decision-making by the Board. The Board, acting directly and through its Committees, requests and receives information concerning the annual consideration of the renewal of each fund's Advisory Contracts. The Board also meets as needed to consider matters specifically related to the Board's annual consideration of the renewal of Advisory Contracts. Members of the Board may also meet with trustees of other Fidelity funds through ad hoc joint committees to discuss certain matters relevant to the Fidelity funds.
At its July 2011 meeting, the Board of Trustees, including the Independent Trustees, unanimously determined to renew each fund's Advisory Contracts. In reaching its determination, the Board considered all factors it believed relevant, including (i) the nature, extent, and quality of the services to be provided to each fund and its shareholders (including the investment performance of each fund); (ii) the competitiveness of each fund's management fee and total expense ratio; (iii) the total costs of the services to be provided by and the profits to be realized by Fidelity from its relationship with each fund; (iv) the extent to which economies of scale would be realized as each fund grows; and (v) whether fee levels reflect these economies of scale, if any, for the benefit of fund shareholders.
In considering whether to renew the Advisory Contracts for each fund, the Board reached a determination, with the assistance of fund counsel and Independent Trustees' counsel and through the exercise of its business judgment, that the renewal of the Advisory Contracts is in the best interests of each fund and its shareholders and that the compensation payable under the Advisory Contracts is fair and reasonable. The Board's decision to renew the Advisory Contracts was not based on any single factor, but rather was based on a comprehensive consideration of all the information provided to the Board at its meetings throughout the year. The Board, in reaching its determination to renew the Advisory Contracts, is aware that shareholders in each fund have a broad range of investment choices available to them, including a wide choice among mutual funds offered by Fidelity's competitors, and that each fund's shareholders, who have the opportunity to review and weigh the disclosure provided by the fund in its prospectus and other public disclosures, have chosen to invest in that fund, managed by Fidelity.
Nature, Extent, and Quality of Services Provided. The Board considered the staffing within the investment adviser, FMR, and the sub-advisers (together, the Investment Advisers), including the backgrounds of the funds' investment personnel and the funds' investment objectives and disciplines. The Independent Trustees also had discussions with senior management of Fidelity's investment operations and investment groups. The Board considered the structure of the portfolio manager compensation program and whether this structure provides appropriate incentives to act in the best interests of each fund.
Resources Dedicated to Investment Management and Support Services. The Board and the Fund Oversight and Research Committees reviewed the general qualifications and capabilities of the Investment Advisers' investment staff, including its size, education, experience, and resources, as well as the Investment Advisers' approach to recruiting, training, managing, and compensating investment personnel. The Board also noted that FMR has devoted increased resources to non-U.S. offices. The Board noted that Fidelity's analysts have extensive resources, tools and capabilities which allow them to conduct sophisticated quantitative and fundamental analysis, as well as credit analysis of issuers, counterparties and enhancers. The Board also believes that Fidelity's investment professionals have sufficient access to global information and data so as to provide competitive investment results over time, and that those professionals also have access to sophisticated tools which permit them to assess portfolio construction and risk and performance attribution characteristics continuously, as well as to transmit new information and research conclusions rapidly around the world. Additionally, in their deliberations, the Board considered the Investment Advisers' trading capabilities and resources which are an integral part of the investment management process.
Shareholder and Administrative Services. The Board considered (i) the nature, extent, quality, and cost of advisory, administrative, and shareholder services performed by the Investment Advisers and their affiliates under the Advisory Contracts and under separate agreements covering transfer agency, pricing and bookkeeping, and securities lending services for each fund; (ii) the nature and extent of the investment adviser's supervision of third party service providers, principally custodians and subcustodians; and (iii) the resources devoted to, and the record of compliance with, each fund's compliance policies and procedures. The Board also reviewed the allocation of fund brokerage, including allocations to brokers affiliated with the Investment Advisers, the use of brokerage commissions to pay fund expenses, and the use of "soft" commission dollars to pay for research services.
The Board noted that the growth of fund assets over time across the complex allows Fidelity to reinvest in the development of services designed to enhance the value or convenience of the Fidelity funds as investment vehicles. These services include 24-hour access to account information and market information through telephone representatives and over the Internet, investor education materials and asset allocation tools, and the expanded availability of Fidelity Investor Centers, with 35 new branches opening since 2010.
Annual Report
Investment in a Large Fund Family. The Board considered the benefits to shareholders of investing in a Fidelity fund, including the benefits of investing in a fund that is part of a large family of funds offering a variety of investment disciplines and providing a large variety of mutual fund investor services. The Board noted that Fidelity had taken, or had made recommendations that resulted in the Fidelity funds taking, a number of actions over the previous year that benefited particular funds, including (i) continuing to dedicate additional resources to investment research and support of the senior management team that oversees asset management; (ii) rationalizing product lines through the mergers of six funds into other funds; (iii) continuing to migrate the Freedom Funds to dedicated lower cost underlying funds; (iv) obtaining shareholder approval to broaden the investment strategies for Fidelity Consumer Finance Portfolio, Fidelity Emerging Asia Fund, and Fidelity Environment and Alternative Energy Portfolio; (v) contractually agreeing to reduce the management fees and impose other expense limitations on Spartan 500 Index Fund and U.S. Bond Index Fund in connection with launching new institutional classes of these funds; (vi) changing the name, primary and supplemental benchmarks, and investment policies of Fidelity Global Strategies Fund to support the fund's flexible investment mandate and global orientation; and (vii) reducing the transfer agency account fee rates on certain accounts.
Investment Performance (Diversified International Fund and Overseas Fund). The Board considered whether each fund has operated in accordance with its investment objective, as well as its record of compliance with its investment restrictions. It also reviewed each fund's absolute investment performance for each class, as well as each fund's relative investment performance for each class measured over multiple periods against (i) a broad-based securities market index, and (ii) a peer group of mutual funds deemed appropriate by Fidelity and reviewed by the Board. The following charts considered by the Board show, over the one-, three-, and five-year periods ended December 31, 2010, as available, the cumulative total returns of Class F and the retail class of the fund, the cumulative total returns of a broad-based securities market index ("benchmark"), and a range of cumulative total returns of a peer group of mutual funds identified by Morningstar, Inc. as having an investment style similar to that of the fund based on underlying portfolio holdings. The returns of Class F and the retail class show the performance of the highest and lowest performing classes, respectively (based on one-year performance). The box within each chart shows the 25th percentile return (bottom of box) and the 75th percentile return (top of box) of the peer group. Returns shown above the box are in the first quartile and returns shown below the box are in the fourth quartile. The percentage beaten numbers noted below each chart correspond to the percentile box and represent the percentage of funds in the peer group whose performance was equal to or lower than that of the class indicated.
Fidelity Diversified International Fund
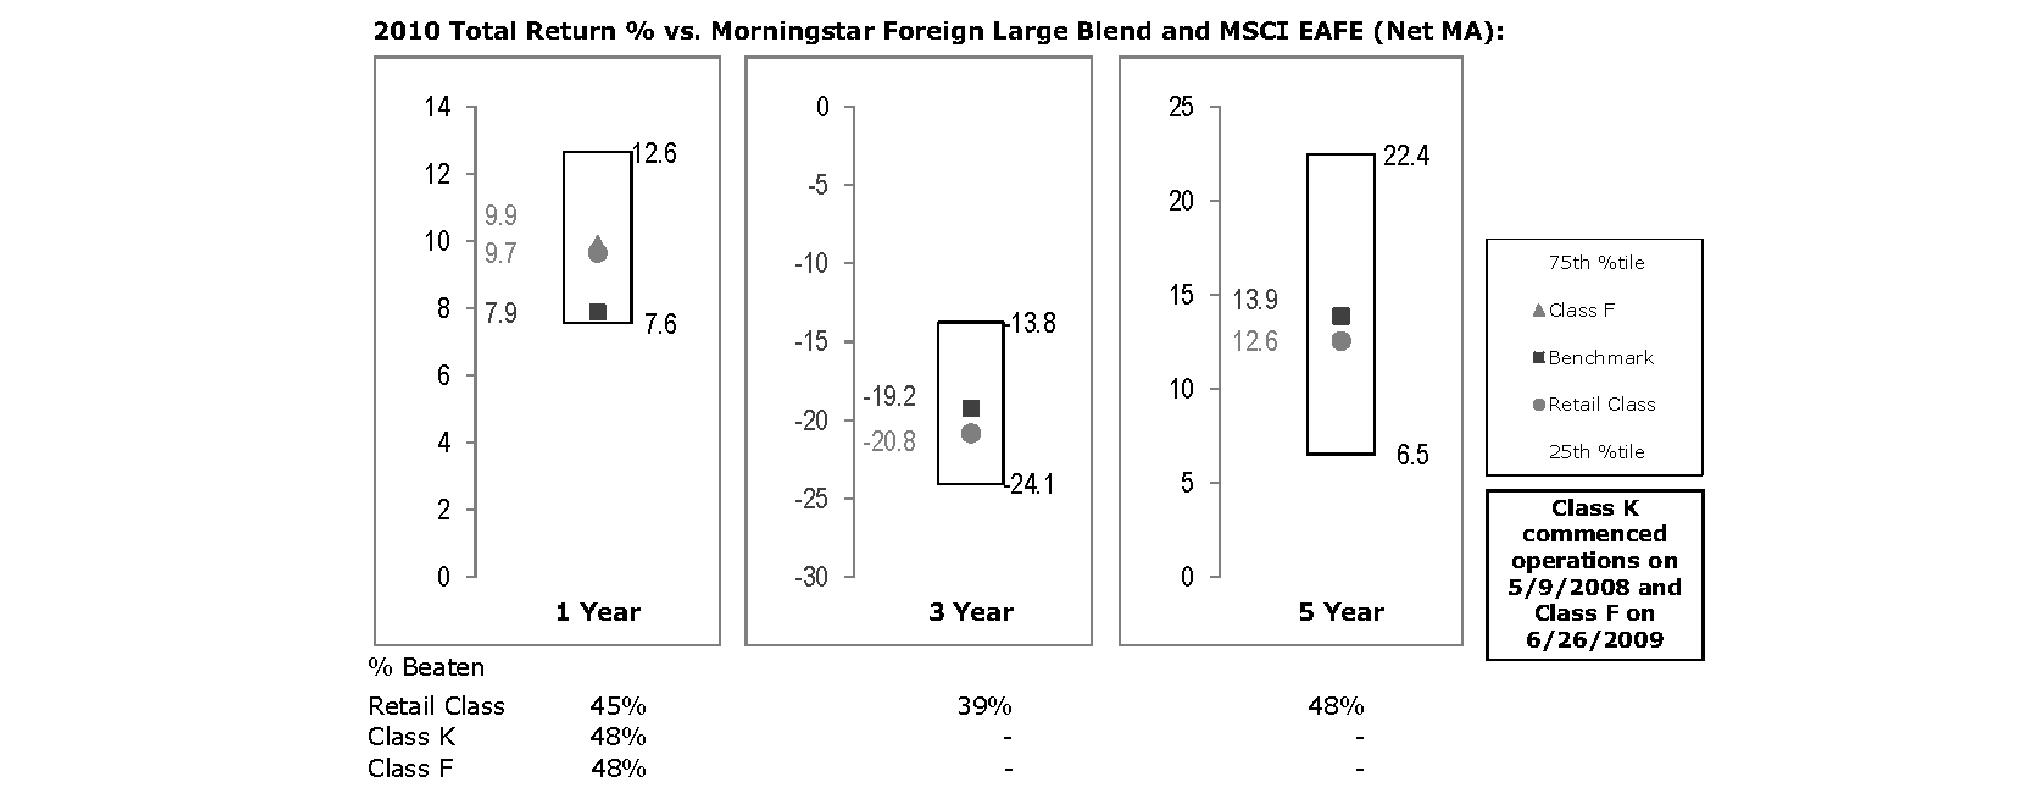
The Board reviewed the fund's relative investment performance against its peer group and noted that the performance of the retail class of the fund (the class with the longest performance record) was in the third quartile for all the periods shown. The Board also noted that the investment performance of the fund was lower than its benchmark for the three- and five-year periods, although the one-year total return of the retail class compared favorably to its benchmark. The Board considered that the variations in performance among the fund's classes reflect the variations in class expenses, which result in lower performance for higher expense classes. The Board discussed with FMR actions that have been taken by FMR to improve the fund's disappointing performance relative to its peer group. The Board also reviewed the fund's performance since inception as well as performance in the current year. The Board will continue to closely monitor the performance of the fund in the coming year and discuss with FMR other appropriate actions to address the performance of the fund.
Annual Report
Board Approval of Investment Advisory Contracts and Management Fees - continued
Fidelity Overseas Fund
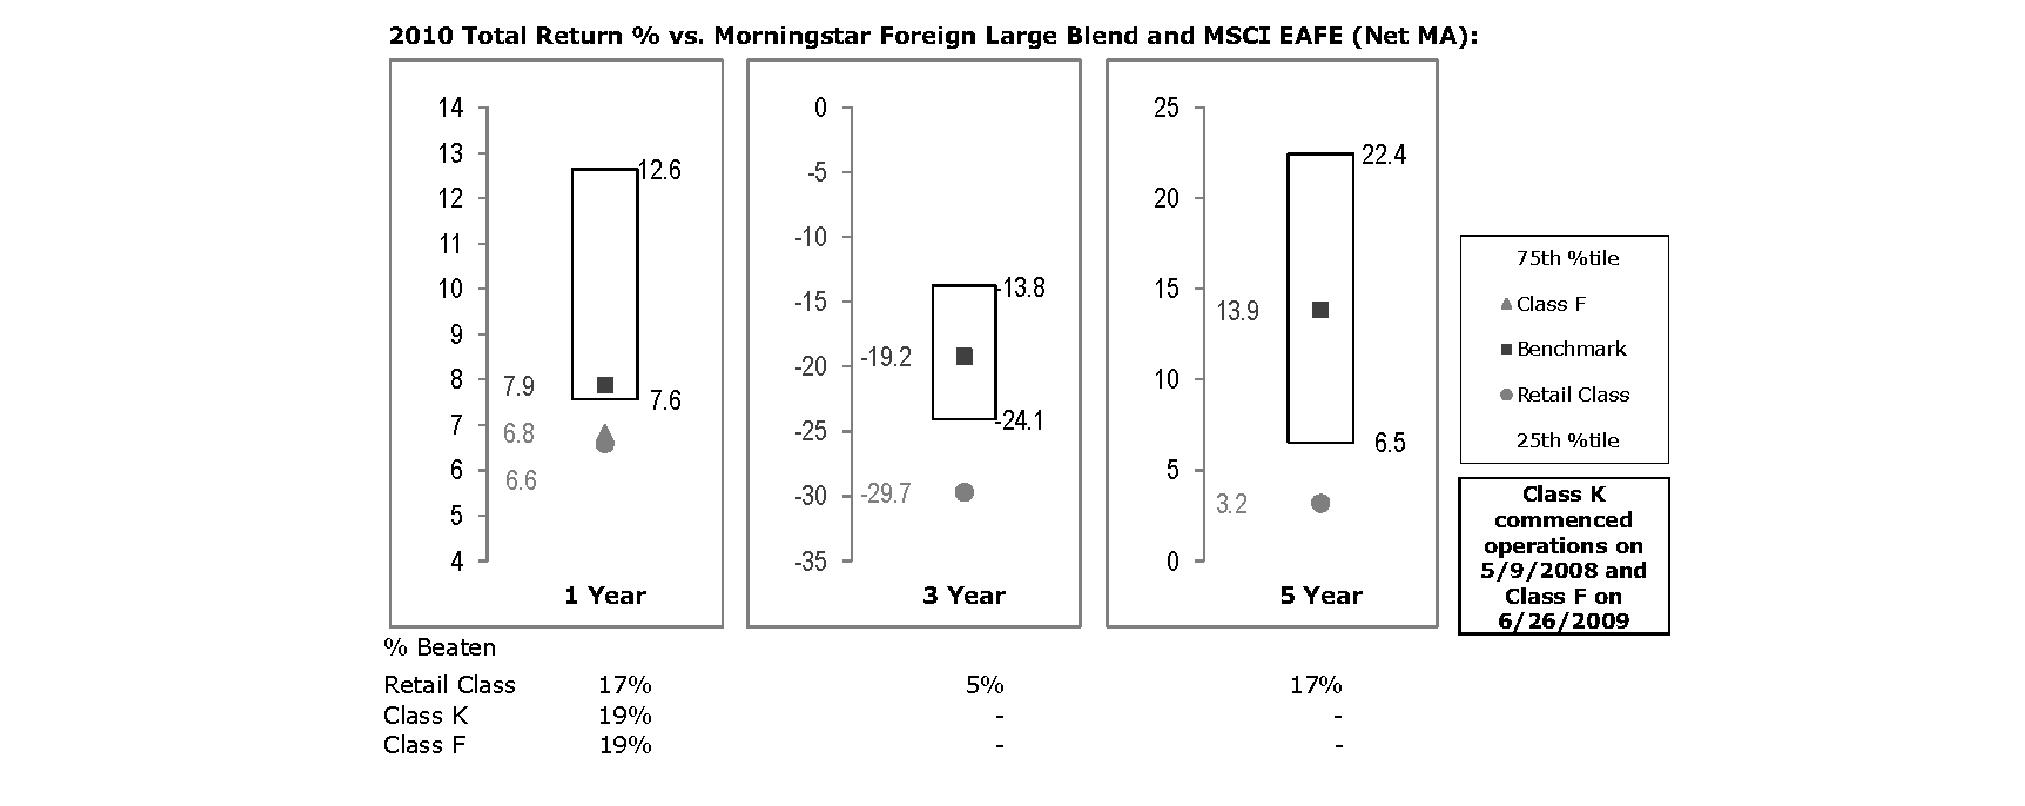
The Board reviewed the fund's relative investment performance against its peer group and noted that the performance of the retail class of the fund (the class with the longest performance record) was in the fourth quartile for all the periods shown. The Board also noted that the investment performance of the fund was lower than its benchmark for all the periods shown. The Board considered that the variations in performance among the fund's classes reflect the variations in class expenses, which result in lower performance for higher expense classes. The Board discussed with FMR actions that have been taken by FMR to improve the fund's disappointing performance relative to its peer group and benchmark. The Board noted that this fund had underperformed in 2009 and discussed with FMR its disappointment with the continued underperformance of the fund. The Board also reviewed the fund's performance since inception as well as performance in the current year. The Board will continue to closely monitor the performance of the fund in the coming year and discuss with FMR other appropriate actions to address the performance of the fund.
The Board also considered that each fund's management fee is subject to upward or downward adjustment depending upon whether, and to what extent, the fund's investment performance for the performance period exceeds, or is exceeded by, the record (over the same period) of a Board-approved performance adjustment index. The Board noted that the performance adjustment provides FMR with a strong economic incentive to seek to achieve superior performance for each fund's shareholders and helps to more closely align the interests of FMR and each fund's shareholders.
Based on its review, the Board concluded that the nature, extent, and quality of services provided to each fund under the Advisory Contracts should benefit each fund's shareholders.
Investment Performance (International Capital Appreciation Fund). The Board considered whether the fund has operated in accordance with its investment objective, as well as its record of compliance with its investment restrictions. It also reviewed the fund's absolute investment performance, as well as the fund's relative investment performance measured over multiple periods against (i) a broad-based securities market index, and (ii) a custom peer group of mutual funds deemed appropriate by Fidelity and reviewed by the Board. The following charts considered by the Board show, over the one-, three-, and five-year periods ended December 31, 2010, the fund's cumulative total returns, the cumulative total returns of a broad-based securities market index ("benchmark"), and a range of cumulative total returns of a custom peer group of mutual funds defined by FMR based on categories assigned by Morningstar, Inc. The fund's custom peer group, defined by FMR, is a peer group that FMR believes provides a more meaningful performance comparison than the peer group assigned by Morningstar, Inc., which assigns mutual funds to categories based on their investment styles as measured by their underlying portfolio holdings. The box within each chart shows the 25th percentile return (bottom of box) and the 75th percentile return (top of box) of the peer group. Returns shown above the box are in the first quartile and returns shown below the box are in the fourth quartile. The percentage beaten number noted below each chart corresponds to the percentile box and represents the percentage of funds in the peer group whose performance was equal to or lower than that of the fund.
Annual Report
Fidelity International Capital Appreciation Fund
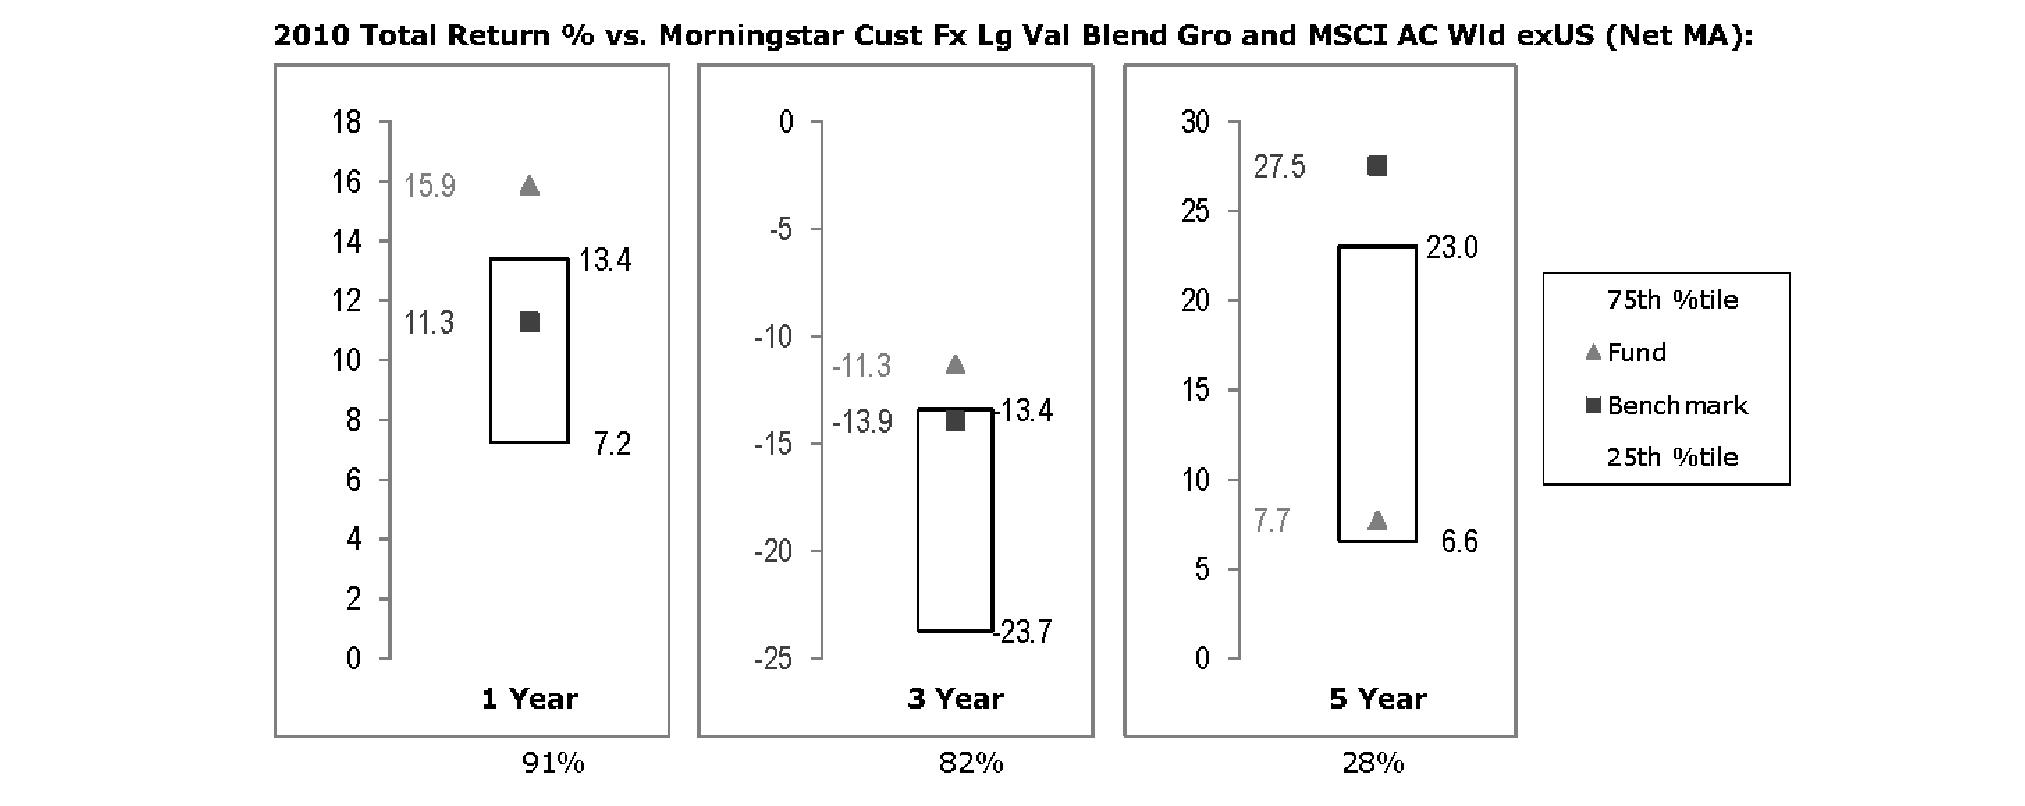
The Board reviewed the fund's relative investment performance against its peer group and noted that the performance of the fund was in the first quartile for the one- and three-year periods and the third quartile for the five-year period. The Board also noted that the investment performance of the fund compared favorably to its benchmark for the one- and three-year periods, although the fund's five-year cumulative total return was lower than its benchmark. The Board also reviewed the fund's performance since inception as well as performance in the current year.
The Board also considered that the fund's management fee is subject to upward or downward adjustment depending upon whether, and to what extent, the fund's investment performance for the performance period exceeds, or is exceeded by, the record (over the same period) of a Board-approved performance adjustment index. The Board noted that the performance adjustment provides FMR with a strong economic incentive to seek to achieve superior performance for the fund's shareholders and helps to more closely align the interests of FMR and the fund's shareholders.
Based on its review, the Board concluded that the nature, extent, and quality of services provided to the fund under the Advisory Contracts should benefit the fund's shareholders.
Investment Performance (Worldwide Fund). The Board considered whether the fund has operated in accordance with its investment objective, as well as its record of compliance with its investment restrictions. It also reviewed the fund's absolute investment performance for each class, as well as the fund's relative investment performance for each class measured over multiple periods against (i) a broad-based securities market index, and (ii) a peer group of mutual funds deemed appropriate by Fidelity and reviewed by the Board. The following charts considered by the Board show, over the one-, three-, and five-year periods ended December 31, 2010, as available, the cumulative total returns of the retail class and Class B of the fund, the cumulative total returns of a broad-based securities market index ("benchmark"), and a range of cumulative total returns of a peer group of mutual funds identified by Morningstar, Inc. as having an investment style similar to that of the fund based on underlying portfolio holdings. The returns of the retail class and Class B show the performance of the highest performing class (based on five-year performance) and the lowest performing class (based on one-year performance), respectively. The box within each chart shows the 25th percentile return (bottom of box) and the 75th percentile return (top of box) of the peer group. Returns shown above the box are in the first quartile and returns shown below the box are in the fourth quartile. The percentage beaten numbers noted below each chart correspond to the percentile box and represent the percentage of funds in the peer group whose performance was equal to or lower than that of the class indicated.
Annual Report
Board Approval of Investment Advisory Contracts and Management Fees - continued
Fidelity Worldwide Fund
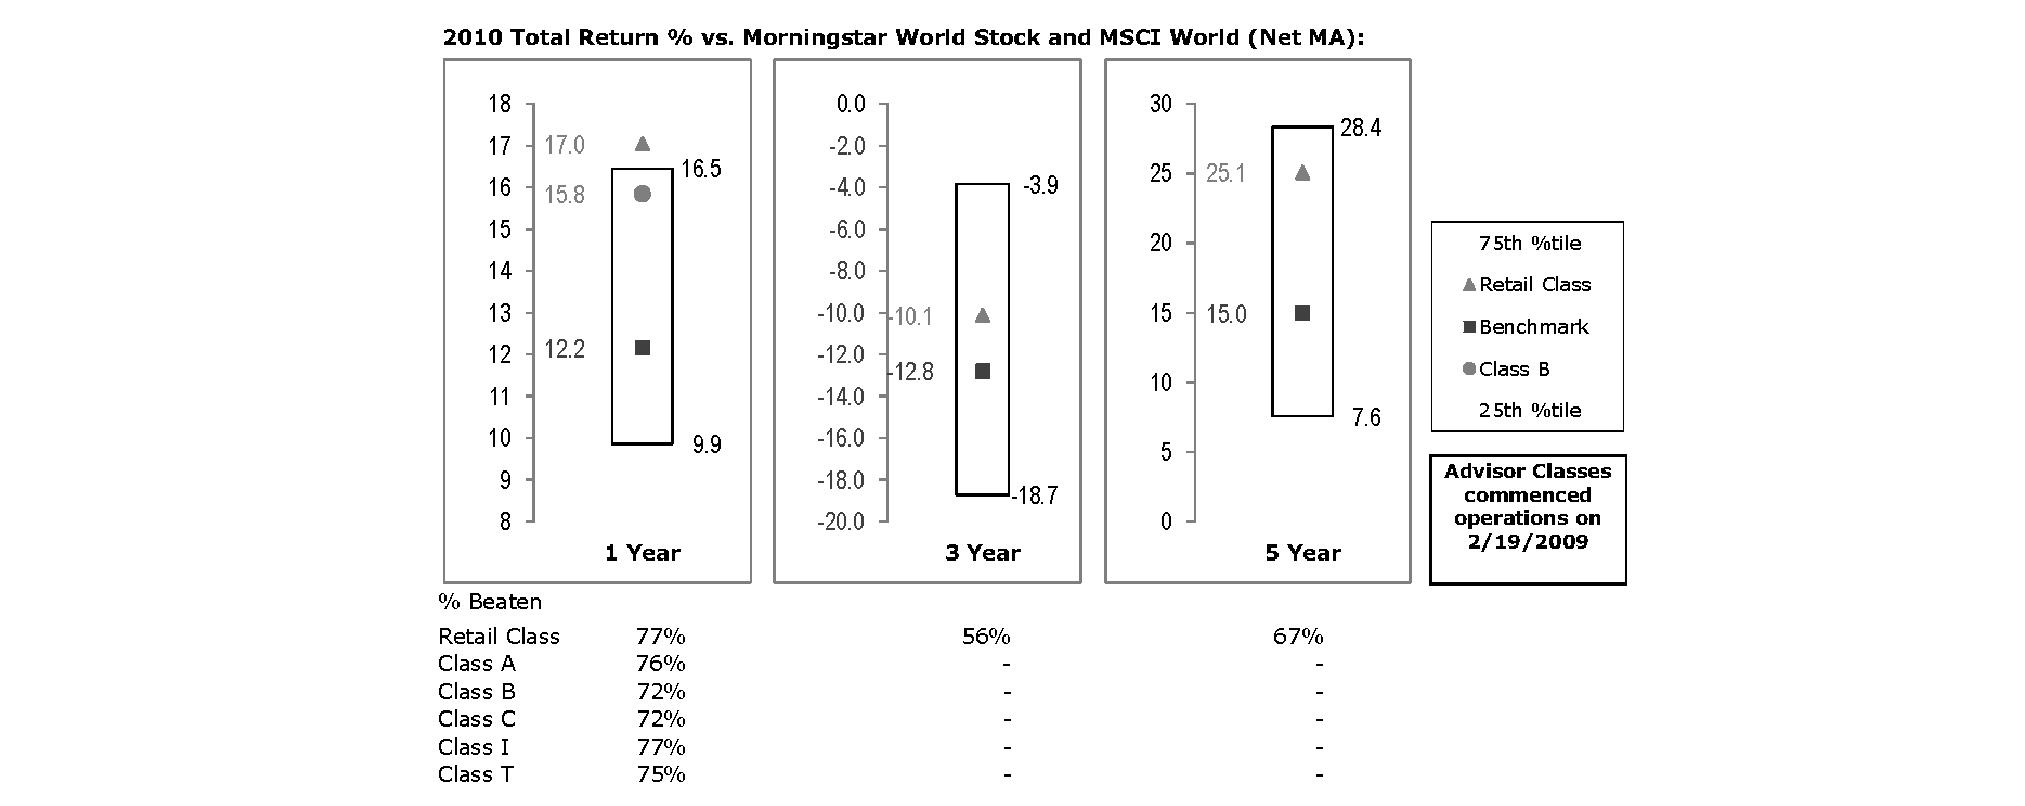
The Board reviewed the fund's relative investment performance against its peer group and noted that the performance of the retail class of the fund was in the first quartile for the one-year period and the second quartile for the three- and five-year periods. The Board also noted that the investment performance of the retail class of the fund compared favorably to its benchmark for all the periods shown. The Board considered that the variations in performance among the fund's classes reflect the variations in class expenses, which result in lower performance for higher expense classes. The Board also reviewed the fund's performance since inception as well as performance in the current year.
The Board also considered that the fund's management fee is subject to upward or downward adjustment depending upon whether, and to what extent, the fund's investment performance for the performance period exceeds, or is exceeded by, the record (over the same period) of a Board-approved performance adjustment index. The Board noted that the performance adjustment provides FMR with a strong economic incentive to seek to achieve superior performance for the fund's shareholders and helps to more closely align the interests of FMR and the fund's shareholders.
Based on its review, the Board concluded that the nature, extent, and quality of services provided to the fund under the Advisory Contracts should benefit the fund's shareholders.
Competitiveness of Management Fee and Total Expense Ratio. The Board considered each fund's management fee and total expense ratio compared to "mapped groups" of competitive funds and classes. Fidelity creates "mapped groups" by combining similar Lipper investment objective categories that have comparable management fee characteristics. Combining Lipper investment objective categories aids the Board's management fee and total expense ratio comparisons by broadening the competitive group used for comparison and by reducing the number of universes to which various Fidelity funds are compared.
Management Fee. The Board considered two proprietary management fee comparisons for the 12-month periods shown in the charts below. The group of Lipper funds used by the Board for management fee comparisons is referred to below as the "Total Mapped Group." The Total Mapped Group comparison focuses on a fund's standing relative to the total universe of comparable funds available to investors in terms of gross management fees before expense reimbursements or caps, and without giving effect to a fund's performance adjustment. "TMG %" represents the percentage of funds in the Total Mapped Group that had management fees that were lower than a fund's. For example, a TMG % of 16% means that 84% of the funds in the Total Mapped Group had higher management fees than a fund. The "Asset-Size Peer Group" (ASPG) comparison focuses on a fund's standing relative to non-Fidelity funds similar in size to the fund within the Total Mapped Group. The ASPG represents at least 15% of the funds in the Total Mapped Group with comparable asset size and management fee characteristics, subject to a minimum of 50 funds (or all funds in the Total Mapped Group if fewer than 50). Additional information, such as the ASPG quartile in which a fund's management fee ranked and the impact of a fund's performance adjustment, is also included in the charts and considered by the Board.
Annual Report
Fidelity Diversified International Fund

The Board noted that the fund's management fee ranked below the median of its Total Mapped Group and below the median of its ASPG for 2010. The Board also noted the effect of the fund's negative performance adjustment on the fund's management fee ranking. The Board noted that the performance adjustment for each year represents calculations for performance periods that differ from the periods shown in the performance charts above.
Fidelity International Capital Appreciation Fund
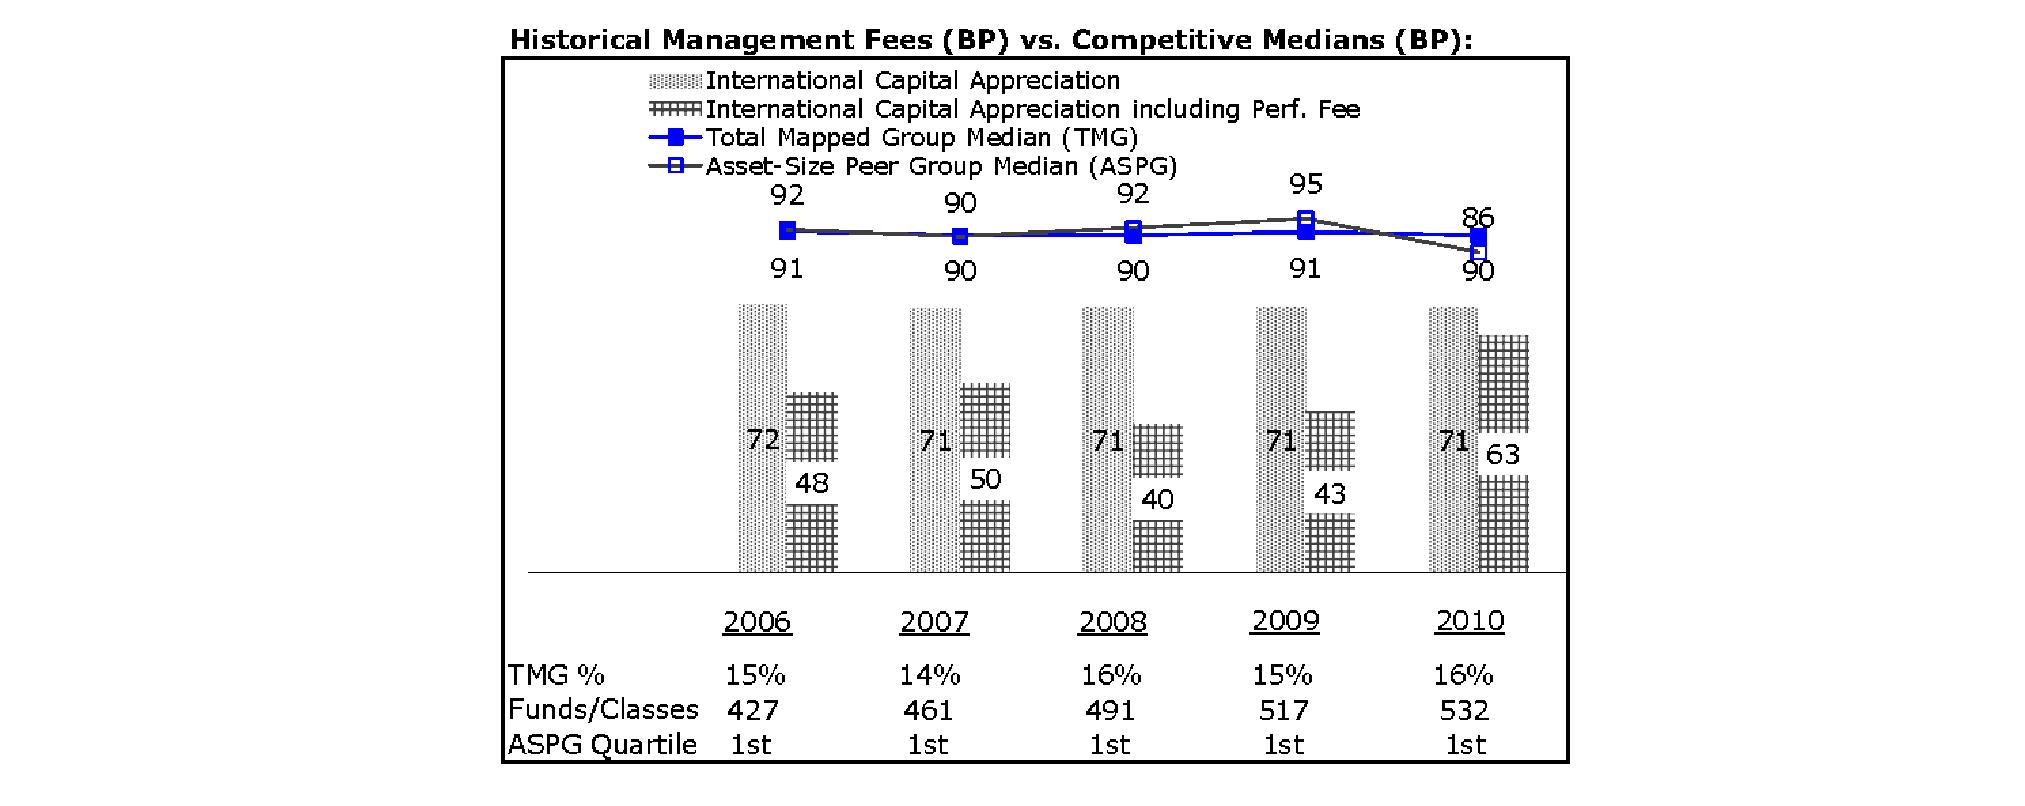
The Board noted that the fund's management fee ranked below the median of its Total Mapped Group and below the median of its ASPG for 2010. The Board also noted the effect of the fund's negative performance adjustment on the fund's management fee ranking. The Board noted that the performance adjustment for each year represents calculations for performance periods that differ from the periods shown in the performance charts above.
Annual Report
Board Approval of Investment Advisory Contracts and Management Fees - continued
Fidelity Overseas Fund
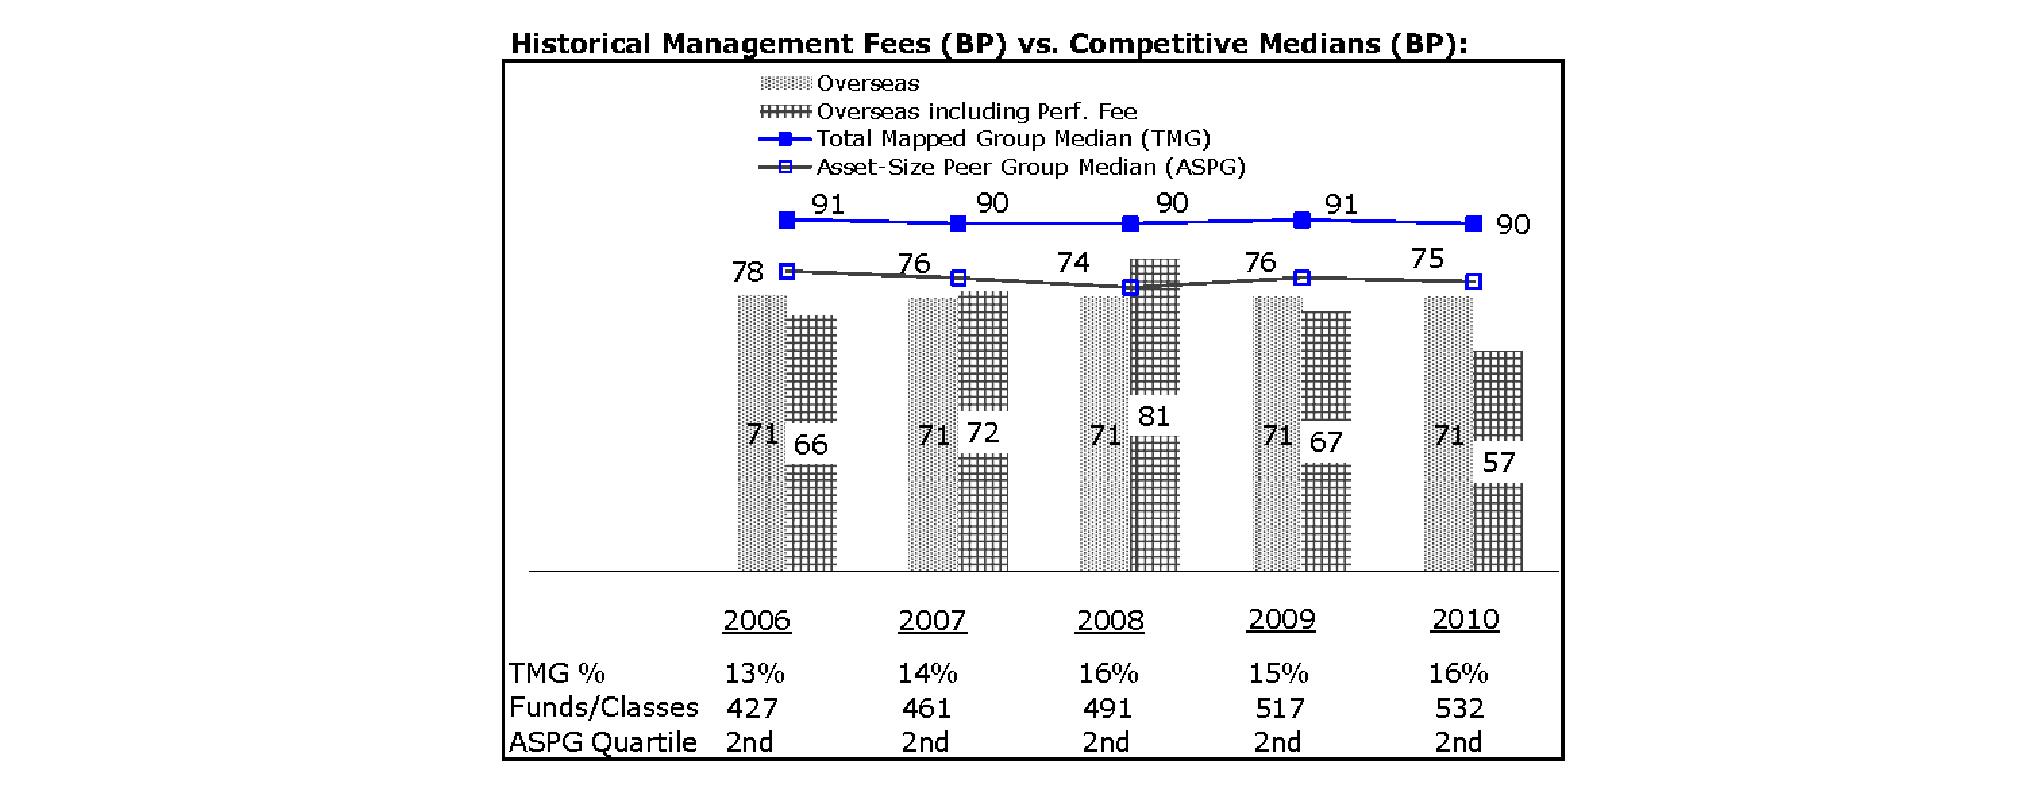
The Board noted that the fund's management fee ranked below the median of its Total Mapped Group and below the median of its ASPG for 2010. The Board also noted the effect of the fund's negative performance adjustment on the fund's management fee ranking. The Board noted that the performance adjustment for each year represents calculations for performance periods that differ from the periods shown in the performance charts above.
Fidelity Worldwide Fund

The Board noted that the fund's management fee ranked below the median of its Total Mapped Group and below the median of its ASPG for 2010. The Board also noted the effect of the fund's positive performance adjustment on the fund's management fee ranking. The Board noted that the performance adjustment for each year represents calculations for performance periods that differ from the periods shown in the performance charts above.
Based on its review, the Board concluded that each fund's management fee is fair and reasonable in light of the services that the fund receives and the other factors considered.
Total Expense Ratio. In its review of International Capital Appreciation Fund's total expense ratio, the Board considered the fund's management fee as well as other fund expenses, such as transfer agent fees, pricing and bookkeeping fees, and custodial, legal, and audit fees. The Board also noted the effects of any waivers and reimbursements on fees and expenses, as well as the impact of the fund's performance adjustment. As part of its review, the Board also considered the current and historical total expense ratios of the fund compared to competitive fund median expenses. The fund is compared to those funds and classes in the Total Mapped Group (used by the Board for management fee comparisons) that have a similar sales load structure.
Annual Report
In its review of the total expense ratio of each class of each of Diversified International Fund, Overseas Fund, and Worldwide Fund, the Board considered the fund's management fee as well as other fund or class expenses, as applicable, such as transfer agent fees, pricing and bookkeeping fees, fund-paid 12b-1 fees (in the case of Worldwide Fund), and custodial, legal, and audit fees. The Board also noted the effects of any waivers and reimbursements on fees and expenses, as well as the impact of each fund's performance adjustment. As part of its review, the Board also considered the current and historical total expense ratios of each class of each fund compared to competitive fund median expenses. Each class of each fund is compared to those funds and classes in the Total Mapped Group (used by the Board for management fee comparisons) that have a similar sales load structure.
The Board noted that the total expense ratio of each class of Diversified International Fund and Overseas Fund ranked below its competitive median for 2010. The Board considered that various factors, including 12b-1 fees, positive or negative performance adjustments, and relatively higher other expenses in the case of small fund size, can affect total expense ratios.
The Board noted that the total expense ratio of International Capital Appreciation Fund ranked below its competitive median for 2010. The Board considered that various factors, including 12b-1 fees, positive or negative performance adjustments, and relatively higher other expenses in the case of small fund size, can affect total expense ratios.
The Board noted that the total expense ratio of each of Class A, Class B, Class C, and the retail class of Worldwide Fund ranked below its competitive median for 2010 and the total expense ratio of each of Class T and Institutional Class ranked above its competitive median for 2010. The Board considered that various factors, including 12b-1 fees, positive or negative performance adjustments, and relatively higher other expenses in the case of small fund size, can affect total expense ratios. The Board noted that the total expense ratio of Class T was above the competitive median primarily because of higher 12b-1 fees on Class T. Class T has a higher 12b-1 fee, but a lower front-end sales charge, than traditionally priced front-end sales charge classes. The Board noted that the fund offers multiple classes, each of which has a different sales load and 12b-1 fee structure, and that the multiple structures are intended to offer a range of pricing options for the intermediary market. The Board also noted that the total expense ratios of the classes vary primarily by the level of their 12b-1 fees, although differences in transfer agent fees may also cause expenses to vary from class to class.
Fees Charged to Other Fidelity Clients. The Board also considered Fidelity fee structures and other information with respect to clients of FMR and its affiliates, such as other mutual funds advised or subadvised by FMR or its affiliates, pension plan clients, and other institutional clients. In March 2010, the Board created an ad hoc joint committee with the board of other Fidelity funds (the Committee) to review and compare Fidelity's institutional investment advisory business with its business of providing services to the Fidelity funds, including the differences in services provided, fees charged, and costs incurred, as well as competition in their respective marketplaces.
Based on its review of total expense ratios and fees charged to other Fidelity clients, the Board concluded that the total expense ratio of International Capital Appreciation Fund and the total expense ratio of each class of Diversified International Fund, Overseas Fund, and Worldwide Fund were reasonable, although in some cases above the median of the universe presented for comparison, in light of the services that each fund and its shareholders receive and the other factors considered, including the findings of the Committee.
Costs of the Services and Profitability. The Board considered the revenues earned and the expenses incurred by Fidelity in conducting the business of developing, marketing, distributing, managing, administering and servicing each fund and its shareholders. The Board also considered the level of Fidelity's profits in respect of all the Fidelity funds.
On an annual basis, FMR presents to the Board Fidelity's profitability for each fund. Fidelity calculates the profitability for each fund, as well as aggregate profitability for groups of Fidelity funds and all Fidelity funds, using a series of detailed revenue and cost allocation methodologies which originate with the books and records of Fidelity on which Fidelity's audited financial statements are based. The Audit Committee of the Board reviews any significant changes from the prior year's methodologies.
PricewaterhouseCoopers LLP (PwC), independent registered public accounting firm and auditor to Fidelity and certain Fidelity funds, has been engaged annually by the Board as part of the Board's assessment of Fidelity's profitability analysis. PwC's engagement includes the review and assessment of Fidelity's methodologies used in determining the revenues and expenses attributable to Fidelity's mutual fund business, and completion of agreed-upon procedures surrounding the mathematical accuracy of fund profitability and its conformity to allocation methodologies. After considering PwC's reports issued under the engagement and information provided by Fidelity, the Board concluded that while other allocation methods may also be reasonable, Fidelity's profitability methodologies are reasonable in all material respects.
The Board also reviewed Fidelity's non-fund businesses and fall-out benefits related to the mutual fund business as well as cases where Fidelity's affiliates may benefit from or be related to the funds' business.
The Board considered the costs of the services provided by and the profits realized by Fidelity in connection with the operation of each fund and was satisfied that the profitability was not excessive in the circumstances.
Economies of Scale. The Board considered whether there have been economies of scale in respect of the management of the Fidelity funds, whether the Fidelity funds (including each fund) have appropriately benefited from any such economies of scale, and whether there is potential for realization of any further economies of scale. The Board considered the extent to which each fund will benefit from economies of scale through increased services to the fund, through waivers or reimbursements, or through fee or expense reductions. The Board also noted that in 2009, it and the board of other Fidelity funds created an ad hoc committee (the Economies of Scale Committee) to analyze whether FMR attains economies of scale in respect of the management and servicing of the Fidelity funds, whether the Fidelity funds have appropriately benefited from such economies of scale, and whether there is potential for realization of any further economies of scale.
Annual Report
Board Approval of Investment Advisory Contracts and Management Fees - continued
The Board recognized that each fund's management contract incorporates a "group fee" structure, which provides for lower group fee rates as total fund assets under FMR's management increase, and for higher group fee rates as total fund assets under FMR's management decrease. FMR calculates the group fee rates based on a tiered asset "breakpoint" schedule that varies based on asset class. The Board considered that the group fee is designed to deliver the benefits of economies of scale to fund shareholders when total Fidelity fund assets increase, even if assets of any particular fund are unchanged or have declined, because some portion of Fidelity's costs are attributable to services provided to all Fidelity funds, and all funds benefit if those costs can be allocated among more assets. The Board concluded that, given the group fee structure, fund shareholders will benefit from lower management fees as assets under FMR's management increase at the fund complex level, regardless of whether Fidelity achieves any such economies of scale.
The Board concluded, taking into account the analysis of the Economies of Scale Committee, that any potential economies of scale are being appropriately shared between fund shareholders and Fidelity.
Additional Information Requested by the Board. In order to develop fully the factual basis for consideration of the Fidelity funds' Advisory Contracts, the Board requested and received additional information on certain topics, including (i) fund performance trends, actions to be taken by FMR to improve certain funds' overall performance, and Fidelity's long-term strategies for certain funds; (ii) portfolio manager changes that have occurred during the past year and length of portfolio manager tenure for different categories of funds over time; (iii) Fidelity's compensation structure for portfolio managers and other key personnel and strategies for attracting and retaining non-investment personnel; (iv) the amount of the investment that each portfolio manager has made in the Fidelity fund(s) that he or she manages; (v) historical trends in Fidelity's realization of fall-out benefits; (vi) Fidelity's group fee structures and the rationale for the individual fee rates of certain funds; (vii) fund profitability methodology and the impact of certain factors on fund profitability results; (viii) trends regarding industry use of performance fee structures and Fidelity's compliance practices with respect to performance adjustment calculations; (ix) the fee structures in place for certain other Fidelity clients; and (x) explanations regarding the relative total expense ratios of certain funds and classes, total expense competitive trends, and actions that might be taken by FMR to reduce total expense ratios for certain funds and classes.
Based on its evaluation of all of the conclusions noted above, and after considering all factors it believed relevant, the Board ultimately concluded that the advisory fee structures are fair and reasonable, and that each fund's Advisory Contracts should be renewed.
Annual Report
Annual Report
Investment Adviser
Fidelity Management & Research Company
Boston, MA
Investment Sub-Advisers
FMR Co., Inc.
Fidelity Management & Research
(U.K.) Inc.
Fidelity Management & Research
(Hong Kong) Limited
Fidelity Management & Research
(Japan) Inc.
FIL Investments (Japan) Limited
FIL Investment Advisors
FIL Investment Advisors
(UK) Limited
General Distributor
Fidelity Distributors Corporation
Boston, MA
Transfer and Service Agents
Fidelity Investments Institutional
Operations Company, Inc.
Boston, MA
Fidelity Service Company, Inc.
Boston, MA
Custodians
JPMorgan Chase Bank
New York, NY
Fidelity Diversified International Fund, Fidelity Overseas Fund, and Fidelity Worldwide Fund
The Northern Trust Company
Chicago, IL
Fidelity International Capital Appreciation Fund
Corporate Headquarters
82 Devonshire Street
Boston, MA 02109
www.fidelity.com
The Fidelity Telephone Connection
Mutual Fund 24-Hour Service
Exchanges/Redemptions
and Account Assistance 1-800-544-6666
Product Information 1-800-544-6666
Retirement Accounts 1-800-544-4774
(8 a.m. - 9 p.m.)
TDD Service 1-800-544-0118
for the deaf and hearing impaired
(9 a.m. - 9 p.m. Eastern time)
Fidelity Automated Service
Telephone (FAST®)
1-800-544-5555
Automated line for quickest service
IBD-UANNPRO-1211
1.784774.108
Fidelity®
Series Emerging Markets
Series International Growth
Series International Small Cap
Series International Value
Funds -
Fidelity Series Emerging Markets Fund
Fidelity Series International Growth Fund
Fidelity Series International Small Cap Fund
Fidelity Series International Value Fund
Class F
Annual Report
October 31, 2011
Contents
Shareholder Expense Example | (Click Here) | An example of shareholder expenses. |
Fidelity® Series Emerging Markets Fund |
Performance | (Click Here) | How the fund has done over time. |
Management's Discussion of Fund Performance | (Click Here) | The Portfolio Manager's review of fund performance and strategy. |
Investment Changes | (Click Here) | A summary of major shifts in the Fund's investments over the past six months. |
Investments | (Click Here) | A complete list of the fund's investments with their market values. |
Financial Statements | (Click Here) | Statements of assets and liabilities, operations, and changes in net assets, as well as financial highlights. |
Fidelity Series International Growth Fund |
Performance | (Click Here) | How the fund has done over time. |
Management's Discussion of Fund Performance | (Click Here) | The Portfolio Manager's review of fund performance and strategy. |
Investment Changes | (Click Here) | A summary of major shifts in the Fund's investments over the past six months. |
Investments | (Click Here) | A complete list of the fund's investments with their market values. |
Financial Statements | (Click Here) | Statements of assets and liabilities, operations, and changes in net assets, as well as financial highlights. |
Fidelity Series International Small Cap Fund |
Performance | (Click Here) | How the fund has done over time. |
Management's Discussion of Fund Performance | (Click Here) | The Portfolio Manager's review of fund performance and strategy. |
Investment Changes | (Click Here) | A summary of major shifts in the Fund's investments over the past six months. |
Investments | (Click Here) | A complete list of the fund's investments with their market values. |
Financial Statements | (Click Here) | Statements of assets and liabilities, operations, and changes in net assets, as well as financial highlights. |
Fidelity Series International Value Fund |
Performance | (Click Here) | How the fund has done over time. |
Management's Discussion of Fund Performance | (Click Here) | The Portfolio Manager's review of fund performance and strategy. |
Investment Changes | (Click Here) | A summary of major shifts in the Fund's investments over the past six months. |
Investments | (Click Here) | A complete list of the fund's investments with their market values. |
Financial Statements | (Click Here) | Statements of assets and liabilities, operations, and changes in net assets, as well as financial highlights. |
Notes | (Click Here) | Notes to the Financial Statements. |
Reports of Independent Registered Public Accounting Firms | (Click Here) | |
Trustees and Officers | (Click Here) | |
Distributions | (Click Here) | |
Board Approval of Investment Advisory Contracts and Management Fees | (Click Here) | |
To view a fund's proxy voting guidelines and proxy voting record for the 12-month period ended June 30, visit http://www.fidelity.com/proxyvotingresults or visit the Securities and Exchange Commission's (SEC) web site at http://www.sec.gov. You may also call 1-800-544-8544 for Fidelity Series International Growth Fund, Fidelity Series International Small Cap Fund, and Fidelity Series International Value Fund or 1-800-835-5092 for Class F of each fund to request a free copy of the proxy voting guidelines.
Standard & Poor's, S&P and S&P 500 are registered service marks of The McGraw-Hill Companies, Inc. and have been licensed for use by Fidelity Distributors Corporation.
Other third party marks appearing herein are the property of their respective owners.
All other marks appearing herein are registered or unregistered trademarks or service marks of FMR LLC or an affiliated company.
This report and the financial statements contained herein are submitted for the general information of the shareholders of the funds. This report is not authorized for distribution to prospective investors in the funds unless preceded or accompanied by an effective prospectus.
A fund files its complete schedule of portfolio holdings with the SEC for the first and third quarters of each fiscal year on Form N-Q. Forms N-Q are available on the SEC's web site at http://www.sec.gov. A fund's Forms N-Q may be reviewed and copied at the SEC's Public Reference Room in Washington, DC. Information regarding the operation of the SEC's Public Reference Room may be obtained by calling 1-800-SEC-0330. For a complete list of a fund's portfolio holdings, view the most recent holdings listing, semiannual report, or annual report on Fidelity's web site at http://www.fidelity.com, http://www.advisor.fidelity.com, or http://www.401k.com, as applicable.
NOT FDIC INSURED • MAY LOSE VALUE • NO BANK GUARANTEE
Neither the funds nor Fidelity Distributors Corporation is a bank.
Annual Report
Shareholder Expense Example
As a shareholder of a Fund, you incur two types of costs: (1) transaction costs, and (2) ongoing costs, including management fees and other Fund expenses. This Example is intended to help you understand your ongoing costs (in dollars) of investing in the Funds and to compare these costs with the ongoing costs of investing in other mutual funds.
The Example is based on an investment of $1,000 invested at the beginning of the period and held for the entire period (May 1, 2011 to October 31, 2011).
Actual Expenses
The first line of the accompanying table for each class of each fund provides information about actual account values and actual expenses. You may use the information in this line, together with the amount you invested, to estimate the expenses that you paid over the period. Simply divide your account value by $1,000.00 (for example, an $8,600 account value divided by $1,000.00 = 8.6), then multiply the result by the number in the first line for a class of the fund under the heading entitled "Expenses Paid During Period" to estimate the expenses you paid on your account during this period. In addition, each Fund, as a shareholder in the underlying Fidelity Central Funds, will indirectly bear its pro-rata share of the fees and expenses incurred by the underlying Fidelity Central Funds. These fees and expenses are not included in the Fund's annualized expense ratio used to calculate the expense estimate in the table below.
Hypothetical Example for Comparison Purposes
The second line of the accompanying table for each class of each fund provides information about hypothetical account values and hypothetical expenses based on a Class' actual expense ratio and an assumed rate of return of 5% per year before expenses, which is not the Class' actual return. The hypothetical account values and expenses may not be used to estimate the actual ending account balance or expenses you paid for the period. You may use this information to compare the ongoing costs of investing in the Fund and other funds. To do so, compare this 5% hypothetical example with the 5% hypothetical examples that appear in the shareholder reports of the other funds. In addition, each Fund, as a shareholder in the underlying Fidelity Central Funds, will indirectly bear its pro-rata share of the fees and expenses incurred by the underlying Fidelity Central Funds. These fees and expenses are not included in the Fund's annualized expense ratio used to calculate the expense estimate in the table below.
Annual Report
Shareholder Expense Example - continued
Please note that the expenses shown in the table are meant to highlight your ongoing costs only and do not reflect any transaction costs. Therefore, the second line of the table is useful in comparing ongoing costs only, and will not help you determine the relative total costs of owning different funds.
| Annualized
Expense Ratio | Beginning
Account Value
May 1, 2011 | Ending
Account Value
October 31, 2011 | Expenses Paid
During Period*
May 1, 2011 to October 31, 2011 |
Fidelity Series Emerging Markets Fund | | | | |
Series Emerging Markets | 1.12% | | | |
Actual | | $ 1,000.00 | $ 810.70 | $ 5.11 |
Hypothetical A | | $ 1,000.00 | $ 1,019.56 | $ 5.70 |
Class F | .92% | | | |
Actual | | $ 1,000.00 | $ 811.60 | $ 4.20 |
Hypothetical A | | $ 1,000.00 | $ 1,020.57 | $ 4.69 |
Fidelity Series International Growth Fund | | | | |
Series International Growth | 1.00% | | | |
Actual | | $ 1,000.00 | $ 858.90 | $ 4.69 |
Hypothetical A | | $ 1,000.00 | $ 1,020.16 | $ 5.09 |
Class F | .79% | | | |
Actual | | $ 1,000.00 | $ 860.00 | $ 3.70 |
Hypothetical A | | $ 1,000.00 | $ 1,021.22 | $ 4.02 |
Fidelity Series International Small Cap Fund | | | | |
Series International Small Cap | 1.15% | | | |
Actual | | $ 1,000.00 | $ 867.10 | $ 5.41 |
Hypothetical A | | $ 1,000.00 | $ 1,019.41 | $ 5.85 |
Class F | .94% | | | |
Actual | | $ 1,000.00 | $ 868.20 | $ 4.43 |
Hypothetical A | | $ 1,000.00 | $ 1,020.47 | $ 4.79 |
Fidelity Series International Value Fund | | | | |
Series International Value | .93% | | | |
Actual | | $ 1,000.00 | $ 779.50 | $ 4.17 |
| Annualized
Expense Ratio | Beginning
Account Value
May 1, 2011 | Ending
Account Value
October 31, 2011 | Expenses Paid
During Period*
May 1, 2011 to October 31, 2011 |
Hypothetical A | | $ 1,000.00 | $ 1,020.52 | $ 4.74 |
Class F | .73% | | | |
Actual | | $ 1,000.00 | $ 780.80 | $ 3.28 |
Hypothetical A | | $ 1,000.00 | $ 1,021.53 | $ 3.72 |
A 5% return per year before expenses
* Expenses are equal to each Class' annualized expense ratio, multiplied by the average account value over the period, multiplied by 184/365 (to reflect the one-half year period).
Annual Report
Fidelity Series Emerging Markets Fund
Average annual total return reflects the change in the value of an investment, assuming reinvestment of the class' distributions from dividend income and capital gains (the profits earned upon the sale of securities that have grown in value, if any) and assuming a constant rate of performance each year. The $10,000 table and the fund's returns do not reflect the deduction of taxes that a shareholder would pay on fund distributions or the redemption of fund shares. During periods of reimbursement by Fidelity, a fund's total return will be greater than it would be had the reimbursement not occurred. How a fund did yesterday is no guarantee of how it will do tomorrow.
Average Annual Total Returns
Periods ended October 31, 2011 | Past 1
year | Life of
fund A |
Fidelity® Series Emerging Markets Fund | -11.26% | 23.85% |
Class F B | -11.07% | 24.09% |
A From December 9, 2008.
B The initial offering of Class F shares took place on June 26, 2009. Returns prior to June 26, 2009 are those of Fidelity Series Emerging Markets Fund, the original class of the fund.
$10,000 Over Life of Fund
Let's say hypothetically that $10,000 was invested in Fidelity® Series Emerging Markets Fund, a class of the fund, on December 9, 2008, when the fund started. The chart shows how the value of your investment would have changed, and also shows how the MSCI® Emerging Markets (EM) Index performed over the same period.
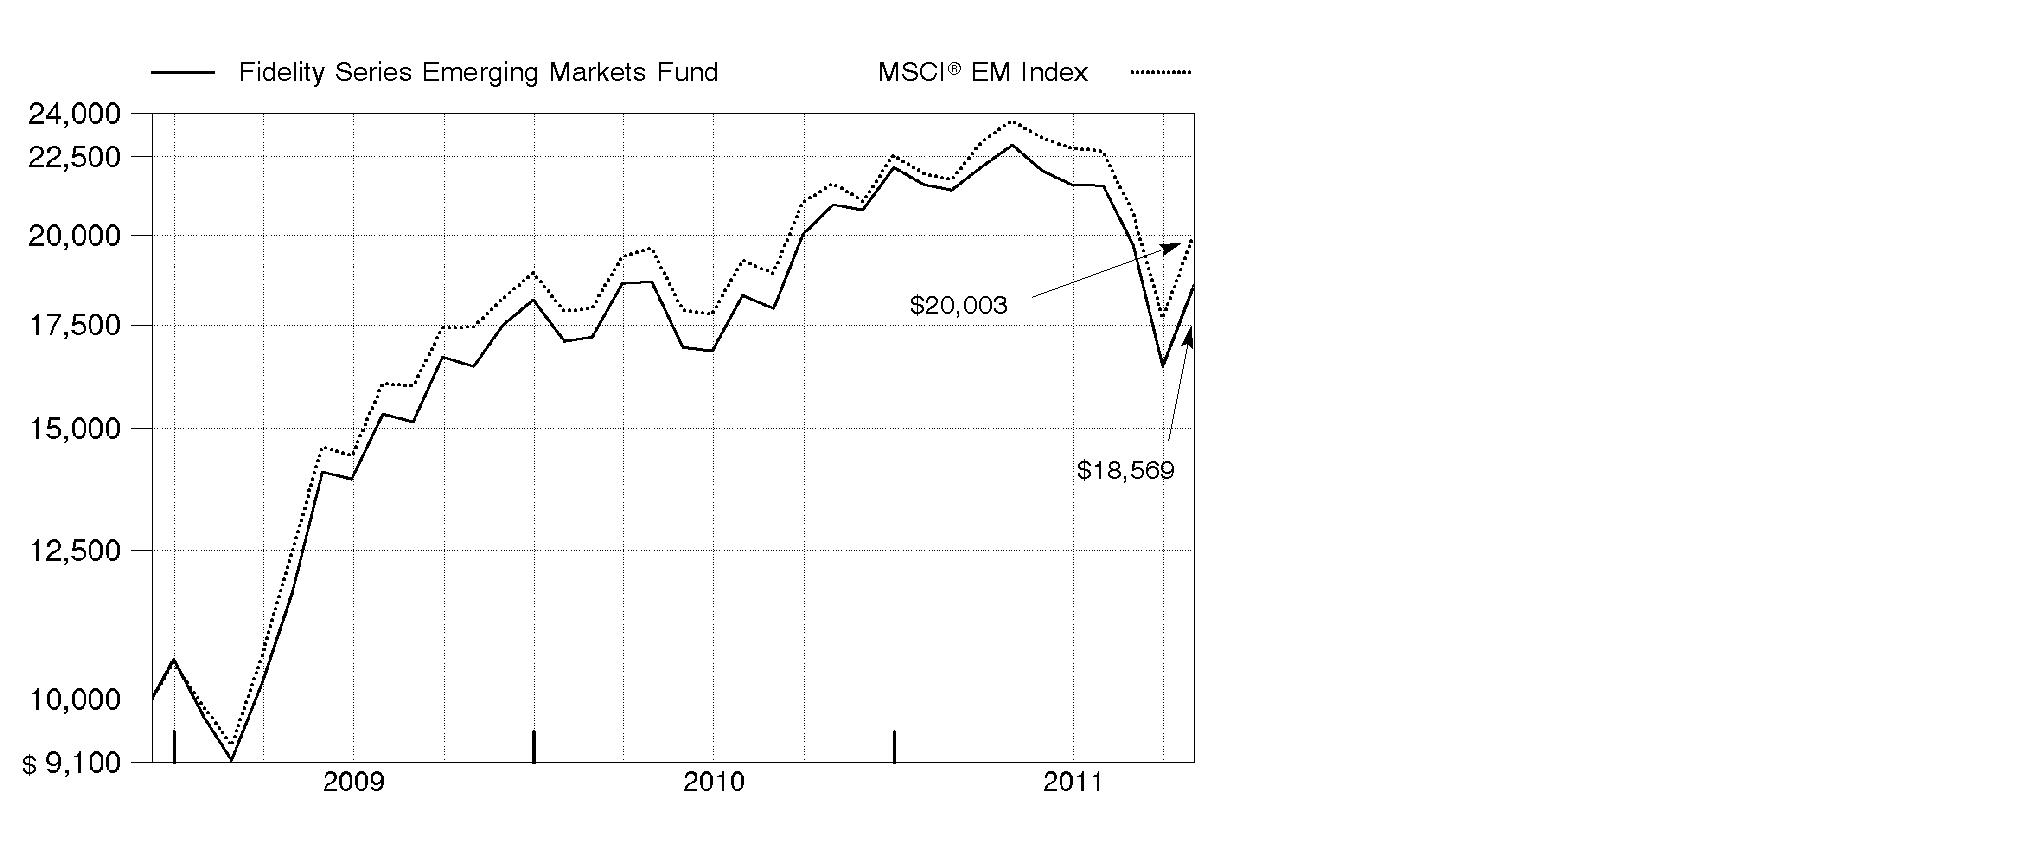
Annual Report
Fidelity Series Emerging Markets Fund
Market Recap: Emerging-markets stocks concluded the 12-month period ending October 31, 2011, on a strong note, reversing direction in October amid hope for a resolution to the sovereign debt crisis in Europe. The brief rally partially offset the negative impact of a five-month downturn that began in May and intensified in August and September, as investors began to flee riskier securities due to the debt debacle, concern the U.S. economy may contract and worry about a significant slowdown in China. For the year, the MSCI® Emerging Markets Index declined 7.44%, hampered in part by global currency fluctuation. The index gained roughly 13% in October, after falling 9% in August and about 15% in September. For the full year, returns across the individual country components of the emerging-markets index were decidedly negative. Several of the largest countries in the index struggled, especially India (-20%), China (-17%) and Brazil (-12%), as did Turkey (-34%). Conversely, South Korea had the strongest result, gaining about 7%, while another sizable index component, Russia, returned roughly 1%. Smaller constituents Indonesia (+5%) and Malaysia (+4%) also finished in positive territory. A trio of countries had negative returns but outpaced the index: Mexico (-1%), Taiwan (-2%) and South Africa (-3%).
Comments from Sam Polyak, Co-Portfolio Manager of Fidelity® Series Emerging Markets Fund, along with Per Johansson, Timothy Gannon, Douglas Chow and James Hayes: For the year, the fund's Series Emerging Markets and Class F shares returned -11.26% and -11.07%, respectively, trailing the MSCI index. Performance was primarily hampered by security selection, most notably in consumer discretionary, financials, energy and the software/services segment of information technology. The biggest boost came from our picks in materials, even though the largest individual detractor was an out-of-index stake in Russian steel producer EVRAZ Group, which struggled during the period due to a decline in demand for steel. In financials, shares of Turkish bank Turkiye Vakiflar Bankasi notably detracted. A non-index position in Chinese education company Xueda Education Group hurt, as did a stake in South Korea's Hynix Semiconductor and an underweighting in energy firm PetroChina, based in Beijing. Conversely, the top contributor was Russian potash producer Uralkali, followed by an out-of-index stake in uranium producer Uranium One, which is based in Canada but has major mining operations in Kazakhstan. In consumer staples, the fund was helped by South Korean food manufacturer Orion, which was not in the index. Also in materials, China Shanshui Cement Group contributed, while the fund's cash position in a down market provided another boost.
The views expressed above reflect those of the portfolio manager(s) only through the end of the period as stated on the cover of this report and do not necessarily represent the views of Fidelity or any other person in the Fidelity organization. Any such views are subject to change at any time based upon market or other conditions and Fidelity disclaims any responsibility to update such views. These views may not be relied on as investment advice and, because investment decisions for a Fidelity fund are based on numerous factors, may not be relied on as an indication of trading intent on behalf of any Fidelity fund.
Annual Report
Fidelity Series Emerging Markets Fund
Investment Changes (Unaudited)
Geographic Diversification (% of fund's net assets) |
As of October 31, 2011 |
 | Brazil 15.7% | |
 | Korea (South) 12.1% | |
 | China 8.8% | |
 | Russia 7.6% | |
 | Taiwan 6.7% | |
 | India 4.8% | |
 | United States of America 4.5% | |
 | Hong Kong 4.5% | |
 | South Africa 4.1% | |
 | Other 31.2% | |

Percentages are adjusted for the effect of futures contracts, if applicable. |
As of April 30, 2011 |
 | Brazil 13.8% | |
 | Korea (South) 13.0% | |
 | Taiwan 9.3% | |
 | India 9.3% | |
 | Russia 8.7% | |
 | China 8.1% | |
 | South Africa 5.0% | |
 | Mexico 4.9% | |
 | United States of America 4.2% | |
 | Other 23.7% | |

Percentages are adjusted for the effect of futures contracts, if applicable. |
Asset Allocation |
| % of fund's
net assets | % of fund's net assets
6 months ago |
Stocks | 97.1 | 96.7 |
Short-Term Investments and Net Other Assets | 2.9 | 3.3 |
Top Ten Stocks as of October 31, 2011 |
| % of fund's
net assets | % of fund's net assets
6 months ago |
Samsung Electronics Co. Ltd. (Korea (South), Semiconductors & Semiconductor Equipment) | 3.2 | 2.0 |
Industrial & Commercial Bank of China Ltd. (H Shares) (China, Commercial Banks) | 2.2 | 2.0 |
China Construction Bank Corp. (H Shares) (China, Commercial Banks) | 2.1 | 1.8 |
Taiwan Semiconductor Manufacturing Co. Ltd. (Taiwan, Semiconductors & Semiconductor Equipment) | 2.0 | 1.6 |
China Mobile (Hong Kong) Ltd. sponsored ADR (Hong Kong, Wireless Telecommunication Services) | 1.9 | 0.7 |
CNOOC Ltd. sponsored ADR (Hong Kong, Oil, Gas & Consumable Fuels) | 1.8 | 0.4 |
Petroleo Brasileiro SA - Petrobras sponsored ADR (Brazil, Oil, Gas & Consumable Fuels) | 1.6 | 1.6 |
NOVATEK OAO GDR (Russia, Oil, Gas & Consumable Fuels) | 1.4 | 0.6 |
Grupo Televisa SA de CV (CPO) sponsored ADR (Mexico, Media) | 1.4 | 1.1 |
Vale SA (PN-A) sponsored ADR (Brazil, Metals & Mining) | 1.3 | 0.9 |
| 18.9 | |
Market Sectors as of October 31, 2011 |
| % of fund's
net assets | % of fund's net assets
6 months ago |
Financials | 22.5 | 23.6 |
Energy | 14.6 | 14.7 |
Materials | 12.8 | 15.9 |
Information Technology | 11.9 | 11.6 |
Consumer Discretionary | 8.4 | 6.7 |
Industrials | 7.7 | 8.5 |
Consumer Staples | 7.4 | 5.5 |
Telecommunication Services | 7.2 | 5.7 |
Utilities | 3.6 | 3.3 |
Health Care | 1.0 | 1.2 |
Annual Report
Fidelity Series Emerging Markets Fund
Investments October 31, 2011
Showing Percentage of Net Assets
Common Stocks - 95.9% |
| Shares | | Value |
Australia - 0.3% |
Paladin Energy Ltd.: | | | |
(Australia) (a) | 1,412,610 | | $ 2,157,439 |
(Canada) (a) | 8,707,700 | | 13,626,937 |
TOTAL AUSTRALIA | | 15,784,376 |
Bailiwick of Guernsey - 0.2% |
Chariot Oil & Gas Ltd. (a) | 4,252,400 | | 9,522,903 |
Bermuda - 1.6% |
Aquarius Platinum Ltd. (Australia) | 4,722,760 | | 13,855,918 |
CNPC (Hong Kong) Ltd. | 17,404,000 | | 24,379,225 |
Cosco International Holdings Ltd. | 2,450,000 | | 1,046,776 |
GP Investments Ltd. (depositary receipt) (a) | 6,353,208 | | 16,796,858 |
Noble Group Ltd. | 17,684,000 | | 21,584,409 |
TOTAL BERMUDA | | 77,663,186 |
Brazil - 15.7% |
Anhanguera Educacional Participacoes SA | 2,270,916 | | 33,391,934 |
Arezzo Industria e Comercio SA | 1,342,800 | | 17,750,734 |
B2W Companhia Global do Varejo | 830,975 | | 6,750,583 |
Banco do Brasil SA | 4,120,457 | | 62,147,587 |
Banco do Estado do Rio Grande do Sul SA | 3,489,800 | | 36,783,939 |
BM&F Bovespa SA | 2,475,900 | | 14,778,695 |
BR Properties SA | 1,550,700 | | 15,622,589 |
Braskem SA (PN-A) | 2,340,200 | | 20,850,839 |
Centrais Eletricas Brasileiras SA (Electrobras) | 800,500 | | 8,013,391 |
Cia.Hering SA | 1,111,300 | | 24,818,516 |
Companhia de Bebidas das Americas (AmBev) (PN) sponsored ADR | 494,900 | | 16,688,028 |
Companhia de Saneamento de Minas Gerais | 581,800 | | 10,923,149 |
Companhia Paranaense de Energia-Copel: | | | |
(PN-B) | 200,900 | | 4,018,702 |
(PN-B) sponsored ADR (d) | 853,900 | | 17,231,702 |
Ecorodovias Infraestrutura e Logistica SA | 1,483,200 | | 11,228,512 |
Energias do Brasil SA | 648,800 | | 13,979,502 |
Fibria Celulose SA sponsored ADR (d) | 2,230,600 | | 19,785,422 |
Gafisa SA sponsored ADR | 584,700 | | 4,350,168 |
Gerdau SA sponsored ADR (d) | 3,772,700 | | 34,029,754 |
Gol Linhas Aereas Inteligentes SA sponsored ADR (d) | 1,969,700 | | 15,796,994 |
Itau Unibanco Banco Multiplo SA sponsored ADR | 1,902,160 | | 36,369,299 |
Localiza Rent A Car SA | 1,205,500 | | 18,217,287 |
Lojas Americanas SA (PN) | 4,707,541 | | 41,395,218 |
Mills Estruturas e Servicos de Engenharia SA | 1,104,700 | | 11,032,847 |
Common Stocks - continued |
| Shares | | Value |
Brazil - continued |
Multiplus SA | 922,800 | | $ 15,584,207 |
Natura Cosmeticos SA | 608,300 | | 11,831,598 |
Petroleo Brasileiro SA - Petrobras: | | | |
(PN) sponsored ADR (d) | 560,000 | | 14,162,400 |
sponsored ADR | 2,356,900 | | 63,659,869 |
Redecard SA | 615,200 | | 10,335,733 |
Santos Brasil Participacoes SA unit | 446,100 | | 6,614,085 |
Telefonica Brasil SA sponsored ADR (a) | 1,002,900 | | 29,104,158 |
Ultrapar Participacoes SA | 2,812,800 | | 50,123,270 |
Vale SA (PN-A) sponsored ADR | 2,745,400 | | 64,791,440 |
TOTAL BRAZIL | | 762,162,151 |
British Virgin Islands - 0.1% |
Camelot Information Systems, Inc. ADR (a) | 516,325 | | 1,683,220 |
Sable Mining Africa Ltd. (a) | 26,132,440 | | 3,858,004 |
TOTAL BRITISH VIRGIN ISLANDS | | 5,541,224 |
Canada - 2.6% |
Extorre Gold Mines Ltd. (a) | 1,946,089 | | 14,485,610 |
Extorre Gold Mines Ltd. (a)(f) | 61,000 | | 454,050 |
First Quantum Minerals Ltd. | 970,400 | | 20,355,183 |
Goldcorp, Inc. | 274,000 | | 13,330,993 |
Uranium One, Inc. | 13,579,600 | | 40,867,533 |
Yamana Gold, Inc. | 2,373,800 | | 35,433,760 |
TOTAL CANADA | | 124,927,129 |
Cayman Islands - 4.1% |
Ajisen (China) Holdings Ltd. | 7,176,000 | | 10,186,242 |
Biostime International Holdings Ltd. | 7,393,000 | | 13,183,808 |
China Shanshui Cement Group Ltd. | 10,552,000 | | 8,082,582 |
Ctrip.com International Ltd. sponsored ADR (a)(d) | 503,000 | | 17,534,580 |
Eurasia Drilling Co. Ltd. GDR (Reg. S) | 857,500 | | 20,237,000 |
Geely Automobile Holdings Ltd. | 76,720,000 | | 19,615,553 |
Greatview Aseptic Pack Co. Ltd. | 29,898,000 | | 11,102,324 |
Haitian International Holdings Ltd. | 3,174,000 | | 2,820,084 |
Hengan International Group Co. Ltd. | 4,193,500 | | 36,350,724 |
Minth Group Ltd. | 14,898,000 | | 15,457,660 |
Renhe Commercial Holdings Co. Ltd. | 91,688,000 | | 12,848,176 |
Shenguan Holdings Group Ltd. | 8,800,000 | | 4,727,849 |
Uni-President China Holdings Ltd. | 32,145,000 | | 19,105,627 |
Xueda Education Group sponsored ADR (d) | 2,045,200 | | 6,790,064 |
TOTAL CAYMAN ISLANDS | | 198,042,273 |
Common Stocks - continued |
| Shares | | Value |
Chile - 0.9% |
Aguas Andinas SA | 15,599,306 | | $ 9,424,218 |
Empresa Nacional de Telecomunicaciones SA (ENTEL) | 543,635 | | 10,762,854 |
Enersis SA | 54,202,946 | | 22,004,221 |
TOTAL CHILE | | 42,191,293 |
China - 8.8% |
Baidu.com, Inc. sponsored ADR (a) | 208,400 | | 29,213,512 |
China Communications Services Corp. Ltd. (H Shares) | 25,482,000 | | 11,751,943 |
China Construction Bank Corp. (H Shares) | 138,518,000 | | 101,774,059 |
China Pacific Insurance Group Co. Ltd. (H Shares) | 9,961,000 | | 30,567,216 |
China Railway Group Ltd. (H Shares) | 45,221,000 | | 15,014,090 |
China Suntien Green Energy Corp. Ltd. (H Shares) | 24,945,000 | | 5,673,154 |
China Telecom Corp. Ltd. (H Shares) | 26,156,000 | | 16,148,906 |
Dongfang Electric Corp. Ltd. (H Shares) | 3,844,200 | | 11,814,277 |
Focus Media Holding Ltd. ADR (a)(d) | 444,300 | | 12,076,074 |
Harbin Power Equipment Co. Ltd. (H Shares) | 19,004,000 | | 19,151,052 |
Industrial & Commercial Bank of China Ltd. (H Shares) | 172,834,000 | | 107,928,479 |
Maanshan Iron & Steel Ltd. (H Shares) | 71,270,000 | | 21,219,120 |
PetroChina Co. Ltd. (H Shares) | 15,866,000 | | 20,597,125 |
SINA Corp. (a)(d) | 166,100 | | 13,502,269 |
Weichai Power Co. Ltd. (H Shares) | 1,977,000 | | 9,947,983 |
TOTAL CHINA | | 426,379,259 |
Colombia - 1.1% |
Ecopetrol SA ADR (d) | 1,218,100 | | 51,817,974 |
Czech Republic - 0.3% |
Ceske Energeticke Zavody AS | 387,603 | | 16,391,869 |
Egypt - 0.1% |
Citadel Capital Corp. (a) | 6,369,000 | | 3,414,727 |
Hong Kong - 4.5% |
China Mobile (Hong Kong) Ltd. | 49,500 | | 470,465 |
China Mobile (Hong Kong) Ltd. sponsored ADR (d) | 1,907,100 | | 90,701,676 |
CNOOC Ltd. sponsored ADR | 457,100 | | 86,213,631 |
Lenovo Group Ltd. | 37,194,000 | | 25,005,692 |
Sinotruk Hong Kong Ltd. | 24,968,500 | | 14,682,863 |
TOTAL HONG KONG | | 217,074,327 |
India - 4.8% |
Bank of Baroda | 572,910 | | 9,033,414 |
Bharti Airtel Ltd. | 894,966 | | 7,167,532 |
Cummins India Ltd. | 932,730 | | 7,609,648 |
Grasim Industries Ltd. | 450,098 | | 23,902,993 |
Common Stocks - continued |
| Shares | | Value |
India - continued |
Hindustan Petroleum Corp. Ltd. | 1,081,691 | | $ 7,321,309 |
Housing Development and Infrastructure Ltd. (a) | 5,209,762 | | 10,592,069 |
Indiabulls Real Estate Ltd. | 4,217,549 | | 6,453,741 |
Infosys Ltd. sponsored ADR (d) | 153,400 | | 8,987,706 |
ITC Ltd. | 4,630,054 | | 20,194,694 |
Jain Irrigation Systems Ltd. | 3,239,499 | | 8,254,396 |
JK Cement Ltd. | 1,063,196 | | 2,356,572 |
Larsen & Toubro Ltd. | 820,352 | | 23,664,226 |
Lupin Ltd. | 1,192,321 | | 11,472,267 |
Power Grid Corp. of India Ltd. | 2,603,408 | | 5,580,211 |
SREI Infrastructure Finance Ltd. (e) | 31,463,321 | | 22,963,624 |
State Bank of India | 275,197 | | 10,703,956 |
Tata Consultancy Services Ltd. | 1,084,689 | | 24,674,285 |
Tata Motors Ltd. Class A | 1,733,501 | | 3,789,196 |
Ultratech Cement Ltd. | 747,140 | | 17,640,667 |
TOTAL INDIA | | 232,362,506 |
Indonesia - 3.0% |
PT Bakrieland Development Tbk (a) | 1,379,608,000 | | 17,795,906 |
PT Bank Tabungan Negara Tbk | 153,244,500 | | 24,667,809 |
PT Indo Tambangraya Megah Tbk | 4,243,000 | | 21,166,402 |
PT Indosat Tbk | 18,590,500 | | 11,134,333 |
PT Perusahaan Gas Negara Tbk Series B | 22,494,000 | | 7,419,791 |
PT Telkomunikasi Indonesia Tbk sponsored ADR (d) | 1,482,179 | | 50,097,650 |
PT Tower Bersama Infrastructure Tbk | 59,809,000 | | 13,919,551 |
TOTAL INDONESIA | | 146,201,442 |
Isle of Man - 0.0% |
Bahamas Petroleum Co. PLC (a) | 3,792,616 | | 440,368 |
Kazakhstan - 0.3% |
JSC Halyk Bank of Kazakhstan unit (a) | 2,372,580 | | 14,235,480 |
Kenya - 0.1% |
Equity Bank Ltd. | 23,063,300 | | 4,584,803 |
Safaricom Ltd. | 83,095,650 | | 2,509,179 |
TOTAL KENYA | | 7,093,982 |
Korea (South) - 11.2% |
Amoreg | 108,219 | | 23,584,040 |
Asia Pacific Systems, Inc. (a) | 669,105 | | 6,859,480 |
Daewoo Shipbuilding & Marine Engineering Co. Ltd. | 316,810 | | 7,761,494 |
E-Mart Co. Ltd. (a) | 113,404 | | 29,189,856 |
Common Stocks - continued |
| Shares | | Value |
Korea (South) - continued |
Hana Financial Group, Inc. | 928,830 | | $ 33,057,177 |
Hynix Semiconductor, Inc. | 1,389,240 | | 28,009,565 |
Hyundai Mipo Dockyard Co. Ltd. | 63,549 | | 6,880,364 |
ICD Co. Ltd. (a) | 146,613 | | 6,648,102 |
KB Financial Group, Inc. | 1,162,262 | | 44,860,221 |
Korea Electric Power Corp. (a) | 392,000 | | 8,745,096 |
KT&G Corp. | 340,464 | | 21,218,624 |
LG Corp. | 377,294 | | 21,998,150 |
Orion Corp. | 52,922 | | 28,285,919 |
S-Oil Corp. | 118 | | 12,200 |
Samsung Electronics Co. Ltd. | 178,767 | | 153,319,485 |
Samsung Engineering Co. Ltd. | 96,395 | | 19,615,186 |
Samsung Fire & Marine Insurance Co. Ltd. | 112,321 | | 23,794,298 |
Samsung Heavy Industries Ltd. | 793,710 | | 24,124,461 |
Shinhan Financial Group Co. Ltd. sponsored ADR (d) | 304,931 | | 24,272,508 |
Shinsegae Co. Ltd. | 56,569 | | 14,174,014 |
Tong Yang Life Insurance Co. Ltd. | 1,504,490 | | 17,962,762 |
TOTAL KOREA (SOUTH) | | 544,373,002 |
Luxembourg - 1.5% |
EVRAZ Group SA GDR | 1,496,100 | | 26,720,346 |
Millicom International Cellular SA (depositary receipt) | 91,900 | | 10,128,023 |
Samsonite International SA | 10,659,300 | | 17,343,617 |
Subsea 7 SA (a) | 938,700 | | 20,417,517 |
TOTAL LUXEMBOURG | | 74,609,503 |
Malaysia - 1.3% |
AirAsia Bhd | 14,397,400 | | 18,093,436 |
Axiata Group Bhd | 7,393,800 | | 11,686,315 |
Genting Bhd | 9,928,400 | | 34,580,663 |
TOTAL MALAYSIA | | 64,360,414 |
Mexico - 3.9% |
America Movil SAB de CV Series L sponsored ADR | 2,318,400 | | 58,933,728 |
Cemex SA de CV sponsored ADR (d) | 2,409,198 | | 10,528,195 |
Genomma Lab Internacional SA de CV (a) | 668,800 | | 1,394,322 |
Grupo Modelo SAB de CV Series C | 5,157,400 | | 32,713,500 |
Grupo Televisa SA de CV (CPO) sponsored ADR | 3,124,200 | | 66,639,186 |
Wal-Mart de Mexico SA de CV Series V | 7,599,800 | | 19,632,596 |
TOTAL MEXICO | | 189,841,527 |
Common Stocks - continued |
| Shares | | Value |
Nigeria - 0.8% |
Guaranty Trust Bank PLC GDR (Reg. S) | 4,690,314 | | $ 21,575,444 |
Zenith Bank PLC | 205,880,750 | | 16,677,311 |
TOTAL NIGERIA | | 38,252,755 |
Norway - 0.2% |
TGS Nopec Geophysical Co. ASA | 336,800 | | 7,688,641 |
Peru - 0.5% |
Compania de Minas Buenaventura SA sponsored ADR | 634,100 | | 25,953,713 |
Philippines - 1.0% |
Manila Water Co., Inc. | 11,591,300 | | 5,274,334 |
Metro Pacific Investments Corp. | 114,356,000 | | 8,770,825 |
Metropolitan Bank & Trust Co. | 7,716,588 | | 12,931,869 |
Robinsons Land Corp. | 83,288,450 | | 24,340,896 |
TOTAL PHILIPPINES | | 51,317,924 |
Poland - 0.7% |
Eurocash SA | 1,075,709 | | 8,624,884 |
Polska Grupa Energetyczna SA | 355,740 | | 2,192,336 |
Powszechny Zaklad Ubezpieczen SA | 237,500 | | 25,203,198 |
TOTAL POLAND | | 36,020,418 |
Qatar - 0.2% |
Commercial Bank of Qatar GDR (Reg. S) | 1,672,907 | | 7,672,515 |
Russia - 7.3% |
Bank St. Petersburg OJSC (a) | 2,821,494 | | 9,408,091 |
DIXY Group OJSC (a) | 184,270 | | 1,883,541 |
Interregional Distribution Grid Companies Holding JSC (a) | 41,148,900 | | 3,848,097 |
Interregional Distribution Grid Companies Holding JSC rights (a) | 5,214,373 | | 52 |
M Video OJSC (a) | 3,460,220 | | 25,702,693 |
Magnit OJCS: | | | |
rights 11/29/11 (a) | 3,503 | | 0 |
GDS (Reg. S) | 1,211,100 | | 30,943,605 |
Magnitogorsk Iron & Steel Works OJSC unit | 1,569,300 | | 9,721,814 |
Mobile TeleSystems OJSC sponsored ADR | 2,161,700 | | 30,890,693 |
Gazprom OAO sponsored ADR | 4,873,800 | | 56,584,818 |
NOVATEK OAO GDR | 483,000 | | 67,813,200 |
OGK-4 OJSC (a) | 52,275,500 | | 4,133,100 |
Sberbank of Russia | 23,386,100 | | 63,458,875 |
TNK-BP Holding | 8,348,100 | | 22,840,600 |
Uralkali JSC GDR (Reg. S) | 583,587 | | 25,327,676 |
TOTAL RUSSIA | | 352,556,855 |
Common Stocks - continued |
| Shares | | Value |
Singapore - 0.7% |
First Resources Ltd. | 20,051,000 | | $ 22,441,296 |
Global Logistic Properties Ltd. | 4,737,000 | | 6,593,107 |
Sound Global Ltd. | 10,910,000 | | 4,796,321 |
TOTAL SINGAPORE | | 33,830,724 |
South Africa - 4.1% |
Absa Group Ltd. | 2,973,761 | | 53,507,689 |
African Bank Investments Ltd. | 4,370,500 | | 18,966,019 |
AngloGold Ashanti Ltd. | 914,200 | | 41,316,455 |
Aspen Pharmacare Holdings Ltd. | 1,251,700 | | 15,022,671 |
Blue Label Telecoms Ltd. | 12,998,107 | | 9,302,729 |
Impala Platinum Holdings Ltd. | 1,519,400 | | 35,123,310 |
Life Healthcare Group Holdings Ltd. | 5,166,800 | | 12,571,464 |
Sanlam Ltd. | 3,805,300 | | 14,216,593 |
TOTAL SOUTH AFRICA | | 200,026,930 |
Sweden - 0.2% |
Lundin Petroleum AB (a) | 311,200 | | 7,637,337 |
Taiwan - 6.7% |
Advanced Semiconductor Engineering, Inc. | 16,089,801 | | 14,218,075 |
Asia Cement Corp. | 12,699,080 | | 15,296,733 |
Catcher Technology Co. Ltd. | 340,000 | | 1,894,312 |
Cheng Uei Precision Industries Co. Ltd. | 6,765,553 | | 15,201,609 |
Chinatrust Financial Holding Co. Ltd. | 21,742,000 | | 14,249,639 |
Chroma ATE, Inc. | 4,358,612 | | 8,696,361 |
Chunghwa Telecom Co. Ltd. | 5,811,000 | | 19,441,459 |
HIWIN Technologies Corp. | 2,083,830 | | 18,838,395 |
HTC Corp. | 1,722,200 | | 38,703,953 |
Kinsus Interconnect Technology Corp. | 2,628,000 | | 9,076,591 |
President Chain Store Corp. | 1,818,000 | | 10,109,420 |
Synnex Technology International Corp. | 6,370,739 | | 15,616,463 |
Taiwan Fertilizer Co. Ltd. | 10,568,000 | | 27,238,437 |
Taiwan Semiconductor Manufacturing Co. Ltd. | 18,059,284 | | 44,008,247 |
Taiwan Semiconductor Manufacturing Co. Ltd. sponsored ADR | 4,162,351 | | 52,528,870 |
Unified-President Enterprises Corp. | 4,249,000 | | 5,843,060 |
WPG Holding Co. Ltd. | 11,699,950 | | 14,127,740 |
TOTAL TAIWAN | | 325,089,364 |
Thailand - 2.6% |
Bangkok Bank Public Co. Ltd. (For. Reg.) | 5,978,600 | | 30,327,125 |
Banpu PCL (For. Reg.) | 763,600 | | 15,501,373 |
Electricity Generating PCL (For. Reg.) | 3,140,400 | | 8,492,574 |
Common Stocks - continued |
| Shares | | Value |
Thailand - continued |
PTT Global Chemical PCL (For. Reg.) (a) | 8,000,486 | | $ 16,870,686 |
PTT PCL (For. Reg.) | 3,492,500 | | 34,405,900 |
Siam Cement PCL (For. Reg.) | 1,929,200 | | 23,130,304 |
TOTAL THAILAND | | 128,727,962 |
Turkey - 1.5% |
Aygaz A/S | 2,382,143 | | 13,013,715 |
TAV Havalimanlari Holding AS (a) | 4,279,000 | | 20,714,401 |
Turkiye Is Bankasi AS Series C | 6,959,000 | | 16,253,737 |
Turkiye Vakiflar Bankasi Tao | 12,934,000 | | 22,090,021 |
TOTAL TURKEY | | 72,071,874 |
United Kingdom - 1.4% |
Antofagasta PLC | 841,900 | | 15,800,522 |
Hikma Pharmaceuticals PLC | 1,072,002 | | 11,628,337 |
Kazakhmys PLC | 2,754,600 | | 41,087,765 |
TOTAL UNITED KINGDOM | | 68,516,624 |
United States of America - 1.6% |
Cognizant Technology Solutions Corp. Class A (a) | 276,100 | | 20,086,275 |
Global Payments, Inc. | 547,600 | | 25,145,792 |
ION Geophysical Corp. (a) | 4,110,900 | | 31,325,058 |
TOTAL UNITED STATES OF AMERICA | | 76,557,125 |
TOTAL COMMON STOCKS (Cost $4,731,176,937) |
4,656,351,676
|
Nonconvertible Preferred Stocks - 1.2% |
| | | |
Korea (South) - 0.9% |
Hyundai Motor Co. Series 2 | 429,140 | | 28,629,832 |
Samsung Electronics Co. Ltd. | 27,920 | | 15,870,309 |
TOTAL KOREA (SOUTH) | | 44,500,141 |
Russia - 0.3% |
Sberbank (Savings Bank of the Russian Federation) (a) | 6,722,400 | | 14,196,428 |
TOTAL NONCONVERTIBLE PREFERRED STOCKS (Cost $55,877,854) |
58,696,569
|
Money Market Funds - 5.3% |
| Shares | | Value |
Fidelity Cash Central Fund, 0.12% (b) | 138,964,206 | | $ 138,964,206 |
Fidelity Securities Lending Cash Central Fund, 0.11% (b)(c) | 119,631,228 | | 119,631,228 |
TOTAL MONEY MARKET FUNDS (Cost $258,595,434) |
258,595,434
|
TOTAL INVESTMENT PORTFOLIO - 102.4% (Cost $5,045,650,225) | | 4,973,643,679 |
NET OTHER ASSETS (LIABILITIES) - (2.4)% | | (117,600,334) |
NET ASSETS - 100% | $ 4,856,043,345 |
Legend |
(a) Non-income producing |
(b) Affiliated fund that is available only to investment companies and other accounts managed by Fidelity Investments. The rate quoted is the annualized seven-day yield of the fund at period end. A complete unaudited listing of the fund's holdings as of its most recent quarter end is available upon request. In addition, each Fidelity Central Fund's financial statements, which are not covered by the Fund's Report of Independent Registered Public Accounting Firm, are available on the SEC's website or upon request. |
(c) Investment made with cash collateral received from securities on loan. |
(d) Security or a portion of the security is on loan at period end. |
(e) Affiliated company |
(f) Security exempt from registration under Rule 144A of the Securities Act of 1933. These securities may be resold in transactions exempt from registration, normally to qualified institutional buyers. At the end of the period, the value of these securities amounted to $454,050 or 0.0% of net assets. |
Affiliated Central Funds |
Information regarding fiscal year to date income earned by the Fund from investments in Fidelity Central Funds is as follows: |
Fund | Income earned |
Fidelity Cash Central Fund | $ 172,122 |
Fidelity Securities Lending Cash Central Fund | 1,354,601 |
Total | $ 1,526,723 |
Other Affiliated Issuers |
An affiliated company is a company in which the Fund has ownership of at least 5% of the voting securities. Fiscal year to date transactions with companies which are or were affiliates are as follows: |
Affiliate | Value, beginning of period | Purchases | Sales Proceeds | Dividend Income | Value,
end of
period |
SREI Infrastructure Finance Ltd. | $ - | $ 32,783,890 | $ 285,241 | $ 498,893 | $ 22,963,624 |
Other Information |
The following is a summary of the inputs used, as of October 31, 2011, involving the Fund's assets and liabilities carried at fair value. The inputs or methodology used for valuing securities may not be an indication of the risk associated with investing in those securities. For more information on valuation inputs, and their aggregation into the levels used in the tables below, please refer to the Security Valuation section in the accompanying Notes to Financial Statements. |
Valuation Inputs at Reporting Date: |
Description | Total | Level 1 | Level 2 | Level 3 |
Investments in Securities: | | | | |
Equities: | | | | |
Brazil | $ 762,162,151 | $ 762,162,151 | $ - | $ - |
Korea (South) | 588,873,143 | 24,272,508 | 564,600,635 | - |
China | 426,379,259 | 54,791,855 | 371,587,404 | - |
Russia | 366,753,283 | 366,753,231 | 52 | - |
Taiwan | 325,089,364 | 52,528,870 | 272,560,494 | - |
India | 232,362,506 | 8,987,706 | 223,374,800 | - |
Hong Kong | 217,074,327 | 176,915,307 | 40,159,020 | - |
South Africa | 200,026,930 | 158,710,475 | 41,316,455 | - |
Cayman Islands | 198,042,273 | 44,561,644 | 153,480,629 | - |
Other | 1,398,285,009 | 994,894,733 | 403,390,276 | - |
Money Market Funds | 258,595,434 | 258,595,434 | - | - |
Total Investments in Securities: | $ 4,973,643,679 | $ 2,903,173,914 | $ 2,070,469,765 | $ - |
The following is a reconciliation of Investments in Securities for which Level 3 inputs were used in determining value: |
Investments in Securities: | |
Beginning Balance | $ - |
Total Realized Gain (Loss) | 46,104 |
Total Unrealized Gain (Loss) | - |
Cost of Purchases | - |
Proceeds of Sales | (46,104) |
Amortization/Accretion | - |
Transfers in to Level 3 | - |
Transfers out of Level 3 | - |
Ending Balance | $ - |
The change in unrealized gain (loss) for the period attributable to Level 3 securities held at October 31, 2011 | $ - |
The information used in the above reconciliation represents fiscal year to date activity for any Investments in Securities identified as using Level 3 inputs at either the beginning or the end of the current fiscal period. Transfers in or out of Level 3 represent the beginning value of any Security or Instrument where a change in the pricing level occurred from the beginning to the end of the period. The cost of purchases and the proceeds of sales may include securities received or delivered through corporate actions or exchanges. Realized and unrealized gains (losses) disclosed in the reconciliation are included in Net Gain (Loss) on the Fund's Statement of Operations. |
See accompanying notes which are an integral part of the financial statements.
Annual Report
Fidelity Series Emerging Markets Fund
Statement of Assets and Liabilities
| October 31, 2011 |
| | |
Assets | | |
Investment in securities, at value (including securities loaned of $112,058,504) - See accompanying schedule: Unaffiliated issuers (cost $4,754,639,942) | $ 4,692,084,621 | |
Fidelity Central Funds (cost $258,595,434) | 258,595,434 | |
Other affiliated issuers (cost $32,414,849) | 22,963,624 | |
Total Investments (cost $5,045,650,225) | | $ 4,973,643,679 |
Foreign currency held at value (cost $5,158,411) | | 5,156,848 |
Receivable for investments sold | | 37,619,665 |
Receivable for fund shares sold | | 6,698,037 |
Dividends receivable | | 6,301,421 |
Distributions receivable from Fidelity Central Funds | | 34,145 |
Prepaid expenses | | 18,249 |
Other receivables | | 2,745,812 |
Total assets | | 5,032,217,856 |
| | |
Liabilities | | |
Payable to custodian bank | $ 2,867,812 | |
Payable for investments purchased | 49,409,874 | |
Payable for fund shares redeemed | 184,939 | |
Accrued management fee | 2,950,063 | |
Other affiliated payables | 665,766 | |
Other payables and accrued expenses | 464,829 | |
Collateral on securities loaned, at value | 119,631,228 | |
Total liabilities | | 176,174,511 |
| | |
Net Assets | | $ 4,856,043,345 |
Net Assets consist of: | | |
Paid in capital | | $ 4,785,568,373 |
Undistributed net investment income | | 28,150,121 |
Accumulated undistributed net realized gain (loss) on investments and foreign currency transactions | | 114,402,959 |
Net unrealized appreciation (depreciation) on investments and assets and liabilities in foreign currencies | | (72,078,108) |
Net Assets | | $ 4,856,043,345 |
See accompanying notes which are an integral part of the financial statements.
Annual Report
Fidelity Series Emerging Markets Fund
Financial Statements - continued
Statement of Assets and Liabilities - continued
| October 31, 2011 |
| | |
Series Emerging Markets:
Net Asset Value, offering price and redemption price per share ($3,384,616,101 ÷ 210,739,673 shares) | | $ 16.06 |
| | |
Class F:
Net Asset Value, offering price and redemption price per share ($1,471,427,244 ÷ 91,319,249 shares) | | $ 16.11 |
See accompanying notes which are an integral part of the financial statements.
Annual Report
Statement of Operations
| Year ended October 31, 2011 |
| | |
Investment Income | | |
Dividends (including $498,893 earned from other affiliated issuers) | | $ 85,346,118 |
Interest | | 6,980 |
Income from Fidelity Central Funds | | 1,526,723 |
Income before foreign taxes withheld | | 86,879,821 |
Less foreign taxes withheld | | (9,873,620) |
Total income | | 77,006,201 |
| | |
Expenses | | |
Management fee | $ 30,050,406 | |
Transfer agent fees | 5,935,004 | |
Accounting and security lending fees | 1,518,391 | |
Custodian fees and expenses | 2,323,877 | |
Independent trustees' compensation | 19,837 | |
Registration fees | 1,534 | |
Audit | 104,249 | |
Legal | 13,247 | |
Interest | 235 | |
Miscellaneous | 28,796 | |
Total expenses before reductions | 39,995,576 | |
Expense reductions | (1,982,868) | 38,012,708 |
Net investment income (loss) | | 38,993,493 |
Realized and Unrealized Gain (Loss) Net realized gain (loss) on: | | |
Investment securities: | | |
Unaffiliated issuers | 138,581,118 | |
Other affiliated issuers | (83,800) | |
Foreign currency transactions | (10,281,353) | |
Total net realized gain (loss) | | 128,215,965 |
Change in net unrealized appreciation (depreciation) on: Investment securities (net of decrease in deferred foreign taxes of $3,926,418) | (660,141,003) | |
Assets and liabilities in foreign currencies | (83,872) | |
Total change in net unrealized appreciation (depreciation) | | (660,224,875) |
Net gain (loss) | | (532,008,910) |
Net increase (decrease) in net assets resulting from operations | | $ (493,015,417) |
See accompanying notes which are an integral part of the financial statements.
Annual Report
Fidelity Series Emerging Markets Fund
Financial Statements - continued
Statement of Changes in Net Assets
| Year ended
October 31,
2011 | Year ended
October 31,
2010 |
Increase (Decrease) in Net Assets | | |
Operations | | |
Net investment income (loss) | $ 38,993,493 | $ 16,171,630 |
Net realized gain (loss) | 128,215,965 | 93,467,379 |
Change in net unrealized appreciation (depreciation) | (660,224,875) | 386,210,921 |
Net increase (decrease) in net assets resulting
from operations | (493,015,417) | 495,849,930 |
Distributions to shareholders from net investment income | (16,826,992) | (4,970,807) |
Distributions to shareholders from net realized gain | (109,835,879) | (92,304,978) |
Total distributions | (126,662,871) | (97,275,785) |
Share transactions - net increase (decrease) | 2,596,312,470 | 1,562,703,553 |
Total increase (decrease) in net assets | 1,976,634,182 | 1,961,277,698 |
| | |
Net Assets | | |
Beginning of period | 2,879,409,163 | 918,131,465 |
End of period (including undistributed net investment income of $28,150,121 and undistributed net investment income of $16,171,630, respectively) | $ 4,856,043,345 | $ 2,879,409,163 |
See accompanying notes which are an integral part of the financial statements.
Annual Report
Financial Highlights - Series Emerging Markets
Years ended October 31, | 2011 | 2010 | 2009 G |
Selected Per-Share Data | | | |
Net asset value, beginning of period | $ 18.85 | $ 16.38 | $ 10.00 |
Income from Investment Operations | | | |
Net investment income (loss) D | .18 | .15 | .15 |
Net realized and unrealized gain (loss) | (2.19) | 4.03 | 6.27 |
Total from investment operations | (2.01) | 4.18 | 6.42 |
Distributions from net investment income | (.10) | (.09) | (.04) |
Distributions from net realized gain | (.68) | (1.62) | - |
Total distributions | (.78) | (1.71) | (.04) |
Net asset value, end of period | $ 16.06 | $ 18.85 | $ 16.38 |
Total Return B,C | (11.26)% | 27.32% | 64.35% |
Ratios to Average Net Assets E,H | | | |
Expenses before reductions | 1.12% | 1.15% | 1.21% A |
Expenses net of fee waivers, if any | 1.12% | 1.15% | 1.21% A |
Expenses net of all reductions | 1.07% | 1.08% | 1.09% A |
Net investment income (loss) | 1.00% | .89% | 1.15% A |
Supplemental Data | | | |
Net assets, end of period (000 omitted) | $ 3,384,616 | $ 2,425,249 | $ 910,106 |
Portfolio turnover rate F | 104% | 92% | 109% A |
A Annualized
B Total returns for periods of less than one year are not annualized.
C Total returns would have been lower if certain expenses had not been reduced during the applicable periods shown.
D Calculated based on average shares outstanding during the period.
E Fees and expenses of any underlying Fidelity Central Funds are not included in the Fund's expense ratio. The Fund indirectly bears its proportionate share of the expenses of any underlying Fidelity Central Funds.
F Amount does not include the portfolio activity of any underlying Fidelity Central Funds.
G For the period December 9, 2008 (commencement of operations) to October 31, 2009.
H Expense ratios reflect operating expenses of the class. Expenses before reductions do not reflect amounts reimbursed by the investment adviser or reductions from brokerage service arrangements or reductions from other expense offset arrangements and do not represent the amount paid by the class during periods when reimbursements or reductions occur. Expense ratios before reductions for start-up periods may not be representative of longer-term operating periods. Expenses net of fee waivers reflect expenses after reimbursement by the investment adviser but prior to reductions from brokerage service arrangements or other expense offset arrangements. Expenses net of all reductions represent the net expenses paid by the class.
See accompanying notes which are an integral part of the financial statements.
Annual Report
Financial Highlights - Class F
Years ended October 31, | 2011 | 2010 | 2009 G |
Selected Per-Share Data | | | |
Net asset value, beginning of period | $ 18.90 | $ 16.40 | $ 13.91 |
Income from Investment Operations | | | |
Net investment income (loss) D | .21 | .19 | .02 |
Net realized and unrealized gain (loss) | (2.19) | 4.03 | 2.47 |
Total from investment operations | (1.98) | 4.22 | 2.49 |
Distributions from net investment income | (.13) | (.10) | - |
Distributions from net realized gain | (.68) | (1.62) | - |
Total distributions | (.81) | (1.72) | - |
Net asset value, end of period | $ 16.11 | $ 18.90 | $ 16.40 |
Total Return B,C | (11.07)% | 27.59% | 17.90% |
Ratios to Average Net Assets E,H | | | |
Expenses before reductions | .91% | .92% | .93% A |
Expenses net of fee waivers, if any | .91% | .92% | .93% A |
Expenses net of all reductions | .86% | .85% | .82% A |
Net investment income (loss) | 1.21% | 1.13% | .28% A |
Supplemental Data | | | |
Net assets, end of period (000 omitted) | $ 1,471,427 | $ 454,160 | $ 8,025 |
Portfolio turnover rate F | 104% | 92% | 109% A |
A Annualized
B Total returns for periods of less than one year are not annualized.
C Total returns would have been lower if certain expenses had not been reduced during the applicable periods shown.
D Calculated based on average shares outstanding during the period.
E Fees and expenses of any underlying Fidelity Central Funds are not included in the Fund's expense ratio. The Fund indirectly bears its proportionate share of the expenses of any underlying Fidelity Central Funds.
F Amount does not include the portfolio activity of any underlying Fidelity Central Funds.
G For the period June 26, 2009 (commencement of operations) to October 31, 2009.
H Expense ratios reflect operating expenses of the class. Expenses before reductions do not reflect amounts reimbursed by the investment adviser or reductions from brokerage service arrangements or reductions from other expense offset arrangements and do not represent the amount paid by the class during periods when reimbursements or reductions occur. Expense ratios before reductions for start-up periods may not be representative of longer-term operating periods. Expenses net of fee waivers reflect expenses after reimbursement by the investment adviser but prior to reductions from brokerage service arrangements or other expense offset arrangements. Expenses net of all reductions represent the net expenses paid by the class.
See accompanying notes which are an integral part of the financial statements.
Annual Report
Fidelity Series International Growth Fund
Average annual total return reflects the change in the value of an investment, assuming reinvestment of the class' distributions from dividend income and capital gains (the profits earned upon the sale of securities that have grown in value, if any) and assuming a constant rate of performance each year. The $10,000 table and the fund's returns do not reflect the deduction of taxes that a shareholder would pay on fund distributions or the redemption of fund shares. During periods of reimbursement by Fidelity, a fund's total return will be greater than it would be had the reimbursement not occurred. How a fund did yesterday is no guarantee of how it will do tomorrow.
Average Annual Total Returns
Periods ended October 31, 2011 | Past 1
year | Life of
fund A |
Fidelity Series International Growth Fund | -2.77% | 3.04% |
Class F | -2.50% | 3.29% |
A From December 3, 2009.
$10,000 Over Life of Fund
Let's say hypothetically that $10,000 was invested in Fidelity Series International Growth Fund, a class of the fund, on December 3, 2009, when the fund started. The chart shows how the value of your investment would have changed, and also shows how the MSCI ® EAFE ® (Europe, Australasia, Far East) Growth Index performed over the same period.
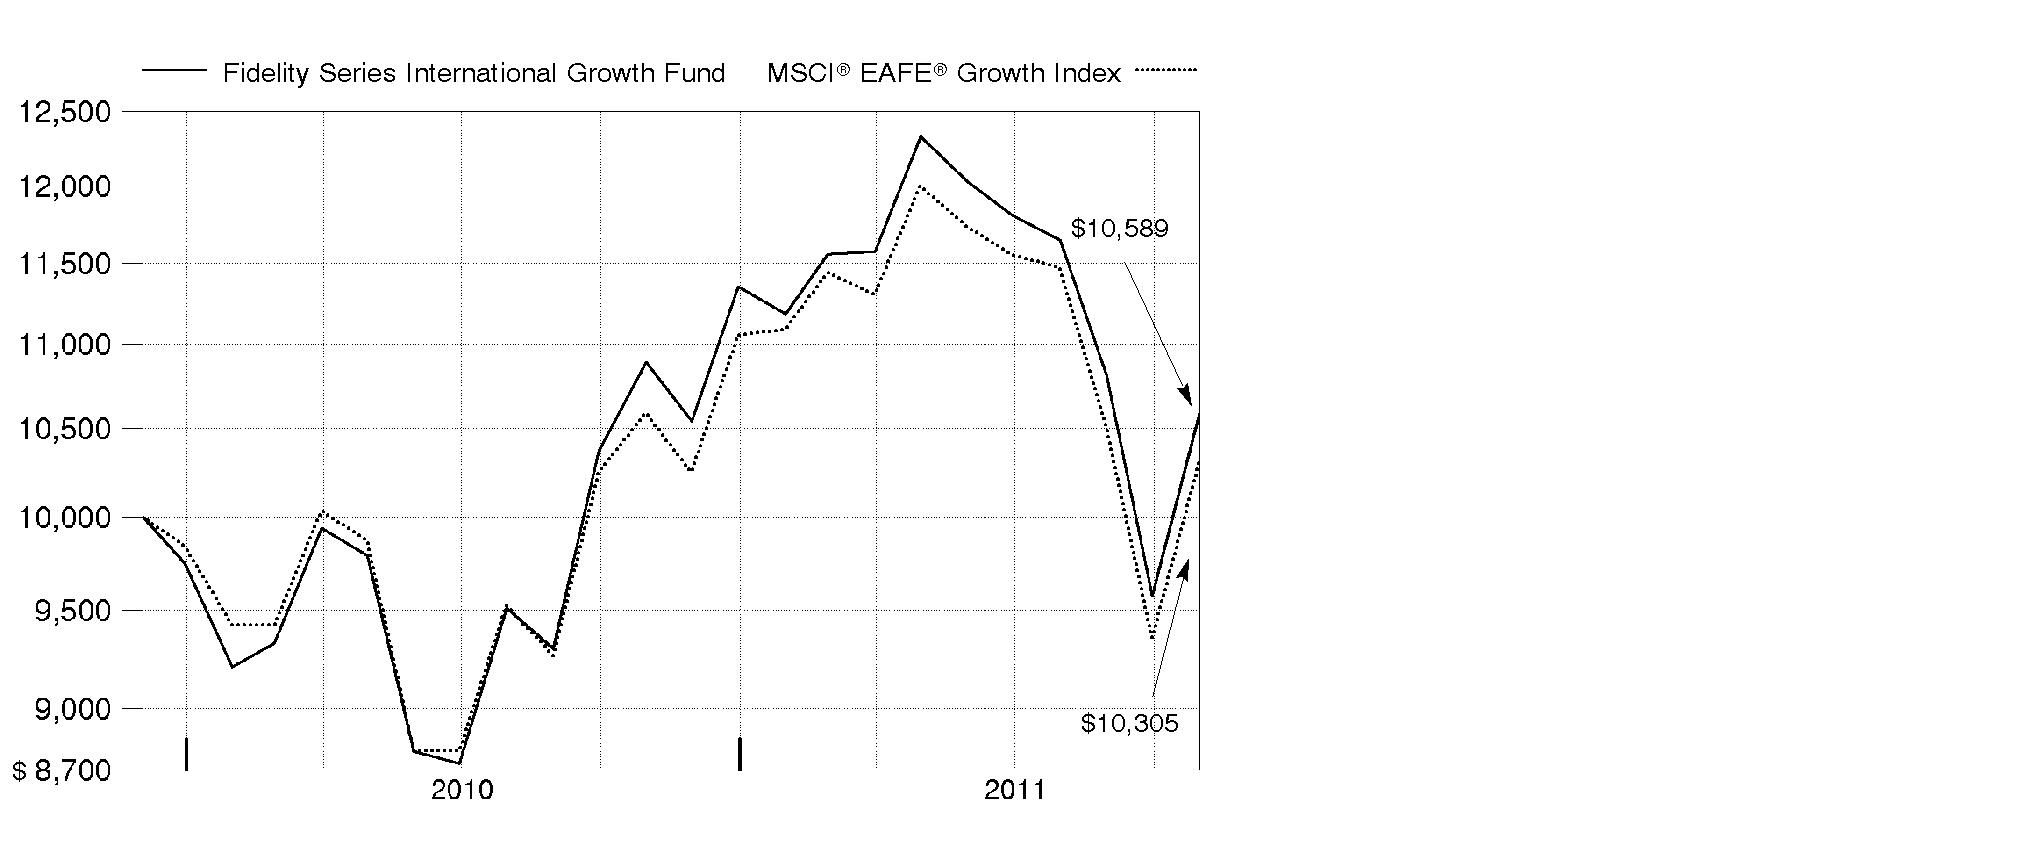
Annual Report
Fidelity Series International Growth Fund
Market Recap: International equities were rocked by a number of headline events during the year ending October 31, 2011. Stocks posted a solid advance for the first half of the period, despite concern about the sovereign debt crisis in Europe, a devastating earthquake and tsunami in Japan, and political upheaval in the Middle East and North Africa. Sentiment turned decidedly negative in the second half, however, as fresh worries about Europe, inflation in China and a dimmed outlook for global growth caused foreign markets to suffer declines that intensified in August and September. October brought with it yet another dramatic swing, as eurozone policymakers appeared near a resolution to the debt debacle and buyers stormed back onto the scene in search of bargains. Still, those gains - along with favorable currency fluctuations overall - weren't enough to offset prior losses, and the MSCI® ACWI® (All Country World Index) ex USA Index finished the period down 4.56%. Within the MSCI index, Europe and emerging markets suffered the biggest declines, with many countries in these areas sustaining steep losses. By contrast, Japan showed resilience in the wake of its natural disasters, falling only 2%. Australia (+4%), Switzerland (+3%), the U.K. (+2%) and Canada, which produced a nominal return, were among the few major benchmark components to break into positive territory.
Comments from Jed Weiss, Portfolio Manager of Fidelity® Series International Growth Fund: For the year, the fund's Series International Growth and Class F shares fell 2.77% and 2.50%, respectively, versus a 2.69% decline in the MSCI® EAFE® (Europe, Australasia, Far East) Growth Index. Stock picking in Europe (ex U.K.) and Japan was helpful, while an out-of-benchmark stake in the U.S. also contributed. However, my choices within non-index emerging markets were poor, notably Brazil and Turkey, while picks in the U.K., Canada and Australia further detracted. From a sector view, positioning in information technology, consumer discretionary and financials added value. In contrast, picks in health care equipment/services, capital goods and the food/beverage/tobacco segment of consumer staples notably detracted. On an individual security basis, lacking a position in weak-performing U.K.-based bank and benchmark component Lloyds Banking Group helped, as did out-of-benchmark stakes in U.S.-based credit card processors MasterCard and Visa. Conversely, not owning index constituent British American Tobacco hurt. I chose to own Philip Morris International instead - another of the fund's contributors. Non-index holdings in Turkish bank Turkiye Garanti Bankasi and Canadian energy company Niko Resources also detracted.
The views expressed above reflect those of the portfolio manager(s) only through the end of the period as stated on the cover of this report and do not necessarily represent the views of Fidelity or any other person in the Fidelity organization. Any such views are subject to change at any time based upon market or other conditions and Fidelity disclaims any responsibility to update such views. These views may not be relied on as investment advice and, because investment decisions for a Fidelity fund are based on numerous factors, may not be relied on as an indication of trading intent on behalf of any Fidelity fund.
Annual Report
Fidelity Series International Growth Fund
Investment Changes (Unaudited)
Geographic Diversification (% of fund's net assets) |
As of October 31, 2011 |
 | United Kingdom 18.6% | |
 | United States of America 17.3% | |
 | Switzerland 9.5% | |
 | Japan 7.3% | |
 | Australia 5.2% | |
 | Germany 4.7% | |
 | France 4.1% | |
 | Belgium 3.5% | |
 | Denmark 2.9% | |
 | Other 26.9% | |

Percentages are adjusted for the effect of futures contracts, if applicable. |
As of April 30, 2011 |
 | United Kingdom 20.6% | |
 | United States of America 11.9% | |
 | Switzerland 9.4% | |
 | Japan 7.7% | |
 | Australia 5.5% | |
 | Germany 5.3% | |
 | Belgium 3.5% | |
 | France 3.3% | |
 | Brazil 3.1% | |
 | Other 29.7% | |

Percentages are adjusted for the effect of futures contracts, if applicable. |
Asset Allocation |
| % of fund's
net assets | % of fund's net assets
6 months ago |
Stocks | 96.0 | 98.7 |
Short-Term Investments and Net Other Assets | 4.0 | 1.3 |
Top Ten Stocks as of October 31, 2011 |
| % of fund's
net assets | % of fund's net assets
6 months ago |
Nestle SA (Switzerland, Food Products) | 4.8 | 4.6 |
BHP Billiton PLC ADR (United Kingdom, Metals & Mining) | 3.6 | 4.5 |
Anheuser-Busch InBev SA NV (Belgium, Beverages) | 2.9 | 2.8 |
BG Group PLC (United Kingdom, Oil, Gas & Consumable Fuels) | 2.7 | 2.4 |
Novo Nordisk A/S Series B sponsored ADR (Denmark, Pharmaceuticals) | 2.2 | 2.1 |
Linde AG (Germany, Chemicals) | 2.1 | 1.8 |
Roche Holding AG (participation certificate) (Switzerland, Pharmaceuticals) | 1.8 | 1.3 |
Siemens AG sponsored ADR (Germany, Industrial Conglomerates) | 1.6 | 2.1 |
Danone (France, Food Products) | 1.6 | 0.9 |
Philip Morris International, Inc. (United States of America, Tobacco) | 1.5 | 0.7 |
| 24.8 | |
Market Sectors as of October 31, 2011 |
| % of fund's
net assets | % of fund's net assets
6 months ago |
Consumer Staples | 21.5 | 17.2 |
Materials | 15.8 | 18.6 |
Industrials | 13.1 | 14.7 |
Consumer Discretionary | 12.1 | 13.2 |
Financials | 10.3 | 13.5 |
Information Technology | 8.8 | 8.1 |
Health Care | 8.4 | 7.2 |
Energy | 5.3 | 5.4 |
Telecommunication Services | 0.7 | 0.8 |
Annual Report
Fidelity Series International Growth Fund
Investments October 31, 2011
Showing Percentage of Net Assets
Common Stocks - 96.0% |
| Shares | | Value |
Australia - 5.2% |
Coca-Cola Amatil Ltd. | 2,906,584 | | $ 37,524,235 |
CSL Ltd. | 2,761,208 | | 83,172,705 |
MAp Group unit | 5,804,419 | | 20,713,809 |
Newcrest Mining Ltd. | 1,661,826 | | 58,737,569 |
Newcrest Mining Ltd. sponsored ADR | 925,486 | | 32,530,833 |
OZ Minerals Ltd. | 2,825,388 | | 33,932,706 |
QBE Insurance Group Ltd. | 1,200,668 | | 18,483,553 |
Woolworths Ltd. | 1,132,002 | | 28,300,297 |
WorleyParsons Ltd. | 2,112,480 | | 61,320,034 |
TOTAL AUSTRALIA | | 374,715,741 |
Austria - 1.0% |
Andritz AG | 583,149 | | 51,673,484 |
Zumtobel AG | 932,900 | | 19,455,978 |
TOTAL AUSTRIA | | 71,129,462 |
Bailiwick of Guernsey - 0.3% |
Resolution Ltd. | 5,397,473 | | 23,870,594 |
Bailiwick of Jersey - 1.2% |
Informa PLC | 2,950,581 | | 17,196,331 |
Randgold Resources Ltd. sponsored ADR | 598,265 | | 65,551,896 |
TOTAL BAILIWICK OF JERSEY | | 82,748,227 |
Belgium - 3.5% |
Anheuser-Busch InBev SA NV | 3,680,181 | | 204,118,171 |
Umicore SA | 1,050,291 | | 45,225,582 |
TOTAL BELGIUM | | 249,343,753 |
Bermuda - 1.5% |
Lazard Ltd. Class A | 1,070,408 | | 29,264,955 |
Li & Fung Ltd. | 28,590,000 | | 55,098,488 |
Trinity Ltd. | 22,186,000 | | 20,108,508 |
TOTAL BERMUDA | | 104,471,951 |
Brazil - 2.6% |
Arezzo Industria e Comercio SA | 1,181,200 | | 15,614,512 |
BM&F Bovespa SA | 5,753,900 | | 34,345,140 |
BR Malls Participacoes SA | 1,609,200 | | 17,383,333 |
Braskem SA Class A sponsored ADR | 2,280,977 | | 41,148,825 |
Iguatemi Empresa de Shopping Centers SA | 913,500 | | 17,698,664 |
Common Stocks - continued |
| Shares | | Value |
Brazil - continued |
Itau Unibanco Banco Multiplo SA sponsored ADR | 1,734,700 | | $ 33,167,464 |
Multiplan Empreendimentos Imobiliarios SA | 1,345,200 | | 27,198,546 |
TOTAL BRAZIL | | 186,556,484 |
Canada - 2.7% |
Agnico-Eagle Mines Ltd. (Canada) | 860,900 | | 37,342,946 |
Fairfax Financial Holdings Ltd. (sub. vtg.) | 97,200 | | 40,628,303 |
Goldcorp, Inc. | 558,100 | | 27,153,383 |
Niko Resources Ltd. | 598,800 | | 32,935,952 |
Open Text Corp. (a) | 579,000 | | 35,436,415 |
Pan American Silver Corp. | 641,200 | | 17,927,955 |
TOTAL CANADA | | 191,424,954 |
Cayman Islands - 1.3% |
NVC Lighting Holdings Ltd. | 43,404,000 | | 18,845,698 |
Sands China Ltd. (a) | 10,435,600 | | 31,360,938 |
Wynn Macau Ltd. | 13,943,800 | | 39,068,824 |
TOTAL CAYMAN ISLANDS | | 89,275,460 |
Chile - 0.4% |
Banco Santander Chile sponsored ADR (d) | 389,600 | | 31,822,528 |
China - 0.6% |
Baidu.com, Inc. sponsored ADR (a) | 309,020 | | 43,318,424 |
Denmark - 2.9% |
Novo Nordisk A/S Series B sponsored ADR | 1,479,166 | | 157,235,346 |
William Demant Holding A/S (a) | 639,400 | | 51,016,432 |
TOTAL DENMARK | | 208,251,778 |
Finland - 1.7% |
Metso Corp. | 661,100 | | 25,745,182 |
Nokian Tyres PLC | 1,325,300 | | 48,694,895 |
Outotec Oyj | 1,055,218 | | 49,329,481 |
TOTAL FINLAND | | 123,769,558 |
France - 4.1% |
Alstom SA | 1,725,091 | | 64,697,278 |
Danone | 1,662,705 | | 115,741,178 |
Remy Cointreau SA | 428,103 | | 35,191,634 |
Safran SA | 2,291,786 | | 75,071,835 |
TOTAL FRANCE | | 290,701,925 |
Common Stocks - continued |
| Shares | | Value |
Germany - 4.7% |
alstria office REIT-AG | 714,423 | | $ 9,184,930 |
Bayerische Motoren Werke AG (BMW) | 342,616 | | 28,003,080 |
Linde AG | 944,219 | | 150,205,703 |
MAN SE | 357,130 | | 31,675,342 |
Siemens AG sponsored ADR (d) | 1,108,424 | | 116,351,267 |
TOTAL GERMANY | | 335,420,322 |
Hong Kong - 0.8% |
Hong Kong Exchanges and Clearing Ltd. | 3,486,700 | | 59,106,178 |
India - 0.5% |
Bharti Airtel Ltd. | 4,680,141 | | 37,481,940 |
Ireland - 1.1% |
CRH PLC sponsored ADR (d) | 2,085,200 | | 38,388,532 |
James Hardie Industries NV CDI (a) | 6,013,193 | | 38,950,668 |
TOTAL IRELAND | | 77,339,200 |
Israel - 0.2% |
Azrieli Group | 672,400 | | 17,300,620 |
Italy - 1.3% |
Fiat Industrial SpA (a) | 4,419,300 | | 38,560,556 |
Interpump Group SpA | 2,538,049 | | 16,346,738 |
Saipem SpA | 904,918 | | 40,575,039 |
TOTAL ITALY | | 95,482,333 |
Japan - 7.3% |
Autobacs Seven Co. Ltd. | 728,900 | | 33,381,333 |
Denso Corp. | 2,086,800 | | 64,184,140 |
Fanuc Corp. | 578,300 | | 93,517,437 |
Fast Retailing Co. Ltd. | 176,500 | | 31,709,700 |
Japan Tobacco, Inc. | 4,631 | | 23,149,450 |
Keyence Corp. | 259,200 | | 65,899,873 |
Kobayashi Pharmaceutical Co. Ltd. | 581,700 | | 28,838,124 |
Nippon Thompson Co. Ltd. | 703,000 | | 4,528,543 |
Osaka Securities Exchange Co. Ltd. | 6,007 | | 28,152,785 |
SHO-BOND Holdings Co. Ltd. | 616,900 | | 13,762,975 |
Unicharm Corp. | 1,049,800 | | 47,020,165 |
USS Co. Ltd. | 706,590 | | 58,420,693 |
Yamato Kogyo Co. Ltd. | 1,253,900 | | 31,720,863 |
TOTAL JAPAN | | 524,286,081 |
Mexico - 1.1% |
Wal-Mart de Mexico SA de CV Series V | 29,755,900 | | 76,868,543 |
Common Stocks - continued |
| Shares | | Value |
Netherlands - 1.4% |
ASML Holding NV | 1,875,400 | | $ 78,635,522 |
QIAGEN NV (a)(d) | 1,413,800 | | 19,482,164 |
TOTAL NETHERLANDS | | 98,117,686 |
Portugal - 0.9% |
Jeronimo Martins SGPS SA | 3,578,800 | | 61,908,767 |
Singapore - 0.1% |
Wing Tai Holdings Ltd. | 5,333,000 | | 5,407,877 |
South Africa - 1.7% |
African Rainbow Minerals Ltd. | 1,754,100 | | 40,539,927 |
Clicks Group Ltd. | 3,270,927 | | 17,165,947 |
JSE Ltd. | 2,760,635 | | 24,446,836 |
Mr Price Group Ltd. | 2,895,500 | | 27,873,971 |
MTN Group Ltd. | 829,000 | | 14,469,347 |
TOTAL SOUTH AFRICA | | 124,496,028 |
Spain - 1.2% |
Inditex SA (d) | 620,972 | | 56,511,721 |
Prosegur Compania de Seguridad SA (Reg.) | 608,500 | | 30,357,819 |
TOTAL SPAIN | | 86,869,540 |
Sweden - 1.7% |
Fagerhult AB | 319,870 | | 7,531,202 |
H&M Hennes & Mauritz AB (B Shares) | 2,342,730 | | 77,581,337 |
Swedish Match Co. | 1,112,800 | | 38,506,903 |
TOTAL SWEDEN | | 123,619,442 |
Switzerland - 9.5% |
Nestle SA | 5,901,748 | | 342,315,508 |
Novartis AG sponsored ADR | 529,891 | | 29,922,945 |
Roche Holding AG (participation certificate) | 775,805 | | 127,923,176 |
Schindler Holding AG: | | | |
(participation certificate) | 280,400 | | 32,975,078 |
(Reg.) | 73,700 | | 8,675,528 |
The Swatch Group AG (Bearer) | 245,360 | | 103,898,098 |
UBS AG (NY Shares) (a) | 2,989,313 | | 37,725,130 |
TOTAL SWITZERLAND | | 683,435,463 |
Turkey - 1.6% |
Anadolu Efes Biracilik ve Malt Sanayii AS | 1,375,623 | | 16,726,082 |
Coca-Cola Icecek AS | 2,225,191 | | 30,201,942 |
Common Stocks - continued |
| Shares | | Value |
Turkey - continued |
Tupras-Turkiye Petrol Rafinerileri AS | 764,000 | | $ 17,282,624 |
Turkiye Garanti Bankasi AS | 13,289,000 | | 46,895,722 |
TOTAL TURKEY | | 111,106,370 |
United Kingdom - 18.6% |
Anglo American PLC (United Kingdom) | 1,530,200 | | 56,439,999 |
Babcock International Group PLC | 3,884,900 | | 44,015,019 |
BG Group PLC | 8,985,172 | | 196,013,620 |
BHP Billiton PLC ADR (d) | 4,110,590 | | 258,843,852 |
GlaxoSmithKline PLC sponsored ADR | 1,201,450 | | 53,812,946 |
Imperial Tobacco Group PLC | 1,016,816 | | 37,185,437 |
InterContinental Hotel Group PLC ADR (d) | 2,634,615 | | 48,687,685 |
Johnson Matthey PLC | 1,639,500 | | 49,542,539 |
Reckitt Benckiser Group PLC | 1,448,500 | | 74,496,697 |
Rio Tinto PLC sponsored ADR (d) | 1,625,100 | | 87,852,906 |
Rolls-Royce Group PLC | 5,786,411 | | 65,372,586 |
Rolls-Royce Group PLC Class C | 399,262,359 | | 642,094 |
Rotork PLC | 1,058,497 | | 28,666,309 |
SABMiller PLC | 2,078,783 | | 75,938,489 |
Serco Group PLC | 4,963,002 | | 41,463,891 |
Shaftesbury PLC | 2,632,800 | | 21,339,707 |
Standard Chartered PLC (United Kingdom) | 4,522,010 | | 106,102,805 |
Tesco PLC | 9,201,929 | | 59,453,143 |
Unite Group PLC | 4,250,300 | | 12,084,868 |
Victrex PLC | 861,707 | | 17,599,624 |
TOTAL UNITED KINGDOM | | 1,335,554,216 |
United States of America - 13.3% |
Allergan, Inc. | 379,100 | | 31,889,892 |
Autoliv, Inc. (d) | 862,200 | | 49,809,294 |
Berkshire Hathaway, Inc. Class B (a) | 917,282 | | 71,419,577 |
Cymer, Inc. (a) | 375,800 | | 16,328,510 |
eBay, Inc. (a) | 1,053,600 | | 33,536,088 |
Google, Inc. Class A (a) | 68,300 | | 40,477,312 |
ION Geophysical Corp. (a) | 3,518,500 | | 26,810,970 |
JPMorgan Chase & Co. | 713,102 | | 24,787,426 |
Juniper Networks, Inc. (a) | 2,748,800 | | 67,263,136 |
Lam Research Corp. (a) | 596,334 | | 25,636,399 |
Martin Marietta Materials, Inc. (d) | 233,600 | | 16,858,912 |
MasterCard, Inc. Class A | 271,991 | | 94,446,155 |
Mead Johnson Nutrition Co. Class A | 1,097,200 | | 78,833,820 |
Mohawk Industries, Inc. (a) | 722,300 | | 38,029,095 |
Common Stocks - continued |
| Shares | | Value |
United States of America - continued |
Nuance Communications, Inc. (a) | 679,105 | | $ 17,982,700 |
Philip Morris International, Inc. | 1,576,692 | | 110,163,470 |
ResMed, Inc. (a) | 1,188,400 | | 33,631,720 |
Solera Holdings, Inc. | 309,941 | | 16,932,077 |
Union Pacific Corp. | 598,900 | | 59,632,473 |
Visa, Inc. Class A | 1,018,399 | | 94,975,891 |
TOTAL UNITED STATES OF AMERICA | | 949,444,917 |
TOTAL COMMON STOCKS (Cost $6,519,492,960) |
6,874,646,362
|
Money Market Funds - 7.5% |
| | | |
Fidelity Cash Central Fund, 0.12% (b) | 328,058,478 | | 328,058,478 |
Fidelity Securities Lending Cash Central Fund, 0.11% (b)(c) | 208,666,395 | | 208,666,395 |
TOTAL MONEY MARKET FUNDS (Cost $536,724,873) |
536,724,873
|
TOTAL INVESTMENT PORTFOLIO - 103.5% (Cost $7,056,217,833) | | 7,411,371,235 |
NET OTHER ASSETS (LIABILITIES) - (3.5)% | | (248,502,377) |
NET ASSETS - 100% | $ 7,162,868,858 |
Legend |
(a) Non-income producing |
(b) Affiliated fund that is available only to investment companies and other accounts managed by Fidelity Investments. The rate quoted is the annualized seven-day yield of the fund at period end. A complete unaudited listing of the fund's holdings as of its most recent quarter end is available upon request. In addition, each Fidelity Central Fund's financial statements, which are not covered by the Fund's Report of Independent Registered Public Accounting Firm, are available on the SEC's website or upon request. |
(c) Investment made with cash collateral received from securities on loan. |
(d) Security or a portion of the security is on loan at period end. |
Affiliated Central Funds |
Information regarding fiscal year to date income earned by the Fund from investments in Fidelity Central Funds is as follows: |
Fund | Income earned |
Fidelity Cash Central Fund | $ 177,254 |
Fidelity Securities Lending Cash Central Fund | 3,601,900 |
Total | $ 3,779,154 |
Other Information |
The following is a summary of the inputs used, as of October 31, 2011, involving the Fund's assets and liabilities carried at fair value. The inputs or methodology used for valuing securities may not be an indication of the risk associated with investing in those securities. For more information on valuation inputs, and their aggregation into the levels used in the table below, please refer to the Security Valuation section in the accompanying Notes to Financial Statements. |
Valuation Inputs at Reporting Date: |
Description | Total | Level 1 | Level 2 | Level 3 |
Investments in Securities: | | | | |
Equities: | | | | |
United Kingdom | $ 1,335,554,216 | $ 1,335,554,216 | $ - | $ - |
United States of America | 949,444,917 | 949,444,917 | - | - |
Switzerland | 683,435,463 | 683,435,463 | - | - |
Japan | 524,286,081 | - | 524,286,081 | - |
Australia | 374,715,741 | 32,530,833 | 342,184,908 | - |
Germany | 335,420,322 | 335,420,322 | - | - |
France | 290,701,925 | 290,701,925 | - | - |
Belgium | 249,343,753 | 45,225,582 | 204,118,171 | - |
Denmark | 208,251,778 | 208,251,778 | - | - |
Other | 1,923,492,166 | 1,618,063,047 | 305,429,119 | - |
Money Market Funds | 536,724,873 | 536,724,873 | - | - |
Total Investments in Securities: | $ 7,411,371,235 | $ 6,035,352,956 | $ 1,376,018,279 | $ - |
Income Tax Information |
At October 31, 2011, the Fund had a capital loss carryforward of approximately $155,978,028 of which $27,059,158 and $128,918,870 will expire in fiscal 2018 and 2019, respectively. Capital loss carryforwards are only available to offset future capital gains of the Fund to the extent provided by regulations and may be limited. |
See accompanying notes which are an integral part of the financial statements.
Annual Report
Fidelity Series International Growth Fund
Statement of Assets and Liabilities
| October 31, 2011 |
| | |
Assets | | |
Investment in securities, at value (including securities loaned of $191,985,059) - See accompanying schedule: Unaffiliated issuers (cost $6,519,492,960) | $ 6,874,646,362 | |
Fidelity Central Funds (cost $536,724,873) | 536,724,873 | |
Total Investments (cost $7,056,217,833) | | $ 7,411,371,235 |
Foreign currency held at value (cost $1,456) | | 1,456 |
Receivable for investments sold | | 2,577,331 |
Receivable for fund shares sold | | 11,353,331 |
Dividends receivable | | 7,915,020 |
Distributions receivable from Fidelity Central Funds | | 67,762 |
Prepaid expenses | | 62,664 |
Other receivables | | 293,386 |
Total assets | | 7,433,642,185 |
| | |
Liabilities | | |
Payable to custodian bank | $ 4,800 | |
Payable for investments purchased | 56,348,173 | |
Payable for fund shares redeemed | 317,162 | |
Accrued management fee | 4,262,144 | |
Other affiliated payables | 949,578 | |
Other payables and accrued expenses | 225,075 | |
Collateral on securities loaned, at value | 208,666,395 | |
Total liabilities | | 270,773,327 |
| | |
Net Assets | | $ 7,162,868,858 |
Net Assets consist of: | | |
Paid in capital | | $ 6,893,351,108 |
Undistributed net investment income | | 81,593,479 |
Accumulated undistributed net realized gain (loss) on investments and foreign currency transactions | | (167,217,207) |
Net unrealized appreciation (depreciation) on investments and assets and liabilities in foreign currencies | | 355,141,478 |
Net Assets | | $ 7,162,868,858 |
See accompanying notes which are an integral part of the financial statements.
Annual Report
Statement of Assets and Liabilities - continued
| October 31, 2011 |
| | |
Series International Growth:
Net Asset Value, offering price and redemption price per share ($4,996,927,321 ÷ 474,581,871 shares) | | $ 10.53 |
| | |
Class F:
Net Asset Value, offering price and redemption price per share ($2,165,941,537 ÷ 204,995,348 shares) | | $ 10.57 |
See accompanying notes which are an integral part of the financial statements.
Annual Report
Fidelity Series International Growth Fund
Financial Statements - continued
Statement of Operations
| Year ended October 31, 2011 |
| | |
Investment Income | | |
Dividends | | $ 150,676,718 |
Interest | | 2,187 |
Income from Fidelity Central Funds | | 3,779,154 |
Income before foreign taxes withheld | | 154,458,059 |
Less foreign taxes withheld | | (9,173,648) |
Total income | | 145,284,411 |
| | |
Expenses | | |
Management fee
Basic fee | $ 43,047,076 | |
Performance adjustment | 2,258,224 | |
Transfer agent fees | 9,794,786 | |
Accounting and security lending fees | 1,660,096 | |
Custodian fees and expenses | 784,341 | |
Independent trustees' compensation | 32,292 | |
Registration fees | 3,230 | |
Audit | 57,610 | |
Legal | 16,906 | |
Miscellaneous | 44,229 | |
Total expenses before reductions | 57,698,790 | |
Expense reductions | (946,455) | 56,752,335 |
Net investment income (loss) | | 88,532,076 |
Realized and Unrealized Gain (Loss) Net realized gain (loss) on: | | |
Investment securities: | | |
Unaffiliated issuers | (129,017,804) | |
Foreign currency transactions | (1,457,614) | |
Total net realized gain (loss) | | (130,475,418) |
Change in net unrealized appreciation (depreciation) on: Investment securities (net of increase in deferred foreign taxes of $37,564) | (207,523,465) | |
Assets and liabilities in foreign currencies | (187,531) | |
Total change in net unrealized appreciation (depreciation) | | (207,710,996) |
Net gain (loss) | | (338,186,414) |
Net increase (decrease) in net assets resulting from operations | | $ (249,654,338) |
See accompanying notes which are an integral part of the financial statements.
Annual Report
Statement of Changes in Net Assets
| Year ended
October 31,
2011 | For the period
December 3, 2009
(commencement of
operations) to
October 31,
2010 |
Increase (Decrease) in Net Assets | | |
Operations | | |
Net investment income (loss) | $ 88,532,076 | $ 18,331,035 |
Net realized gain (loss) | (130,475,418) | (32,051,803) |
Change in net unrealized appreciation (depreciation) | (207,710,996) | 562,852,474 |
Net increase (decrease) in net assets resulting
from operations | (249,654,338) | 549,131,706 |
Distributions to shareholders from net investment income | (25,269,633) | - |
Distributions to shareholders from net realized gain | (4,689,987) | - |
Total distributions | (29,959,620) | - |
Share transactions - net increase (decrease) | 2,754,034,772 | 4,139,316,338 |
Total increase (decrease) in net assets | 2,474,420,814 | 4,688,448,044 |
| | |
Net Assets | | |
Beginning of period | 4,688,448,044 | - |
End of period (including undistributed net investment income of $81,593,479 and undistributed net investment income of $18,331,035, respectively) | $ 7,162,868,858 | $ 4,688,448,044 |
See accompanying notes which are an integral part of the financial statements.
Annual Report
Financial Highlights - Series International Growth
Years ended October 31, | 2011 | 2010 G |
Selected Per-Share Data | | |
Net asset value, beginning of period | $ 10.89 | $ 10.00 |
Income from Investment Operations | | |
Net investment income (loss) D | .16 | .09 |
Net realized and unrealized gain (loss) | (.46) | .80 |
Total from investment operations | (.30) | .89 |
Distributions from net investment income | (.05) | - |
Distributions from net realized gain | (.01) | - |
Total distributions | (.06) | - |
Net asset value, end of period | $ 10.53 | $ 10.89 |
Total Return B,C | (2.77)% | 8.90% |
Ratios to Average Net Assets E,H | | |
Expenses before reductions | 1.00% | 1.01% A |
Expenses net of fee waivers, if any | 1.00% | 1.01% A |
Expenses net of all reductions | .98% | .99% A |
Net investment income (loss) | 1.40% | 1.06% A |
Supplemental Data | | |
Net assets, end of period (000 omitted) | $ 4,996,927 | $ 3,944,123 |
Portfolio turnover rate F | 23% | 63% A |
A Annualized
B Total returns for periods of less than one year are not annualized.
C Total returns would have been lower if certain expenses had not been reduced during the applicable periods shown.
D Calculated based on average shares outstanding during the period.
E Fees and expenses of any underlying Fidelity Central Funds are not included in the Fund's expense ratio. The Fund indirectly bears its proportionate share of the expenses of any underlying Fidelity Central Funds.
F Amount does not include the portfolio activity of any underlying Fidelity Central Funds.
G For the period December 3, 2009 (commencement of operations) to October 31, 2010.
H Expense ratios reflect operating expenses of the class. Expenses before reductions do not reflect amounts reimbursed by the investment adviser or reductions from brokerage service arrangements or reductions from other expense offset arrangements and do not represent the amount paid by the class during periods when reimbursements or reductions occur. Expense ratios before reductions for start-up periods may not be representative of longer-term operating periods. Expenses net of fee waivers reflect expenses after reimbursement by the investment adviser but prior to reductions from brokerage service arrangements or other expense offset arrangements. Expenses net of all reductions represent the net expenses paid by the class.
See accompanying notes which are an integral part of the financial statements.
Annual Report
Financial Highlights - Class F
Years ended October 31, | 2011 | 2010 G |
Selected Per-Share Data | | |
Net asset value, beginning of period | $ 10.91 | $ 10.00 |
Income from Investment Operations | | |
Net investment income (loss) D | .18 | .11 |
Net realized and unrealized gain (loss) | (.45) | .80 |
Total from investment operations | (.27) | .91 |
Distributions from net investment income | (.06) | - |
Distributions from net realized gain | (.01) | - |
Total distributions | (.07) | - |
Net asset value, end of period | $ 10.57 | $ 10.91 |
Total Return B,C | (2.50)% | 9.10% |
Ratios to Average Net Assets E,H | | |
Expenses before reductions | .79% | .78% A |
Expenses net of fee waivers, if any | .79% | .78% A |
Expenses net of all reductions | .77% | .75% A |
Net investment income (loss) | 1.62% | 1.29% A |
Supplemental Data | | |
Net assets, end of period (000 omitted) | $ 2,165,942 | $ 744,325 |
Portfolio turnover rate F | 23% | 63% A |
A Annualized
B Total returns for periods of less than one year are not annualized.
C Total returns would have been lower if certain expenses had not been reduced during the applicable periods shown.
D Calculated based on average shares outstanding during the period.
E Fees and expenses of any underlying Fidelity Central Funds are not included in the Fund's expense ratio. The Fund indirectly bears its proportionate share of the expenses of any underlying Fidelity Central Funds.
F Amount does not include the portfolio activity of any underlying Fidelity Central Funds.
G For the period December 3, 2009 (commencement of operations) to October 31, 2010.
H Expense ratios reflect operating expenses of the class. Expenses before reductions do not reflect amounts reimbursed by the investment adviser or reductions from brokerage service arrangements or reductions from other expense offset arrangements and do not represent the amount paid by the class during periods when reimbursements or reductions occur. Expense ratios before reductions for start-up periods may not be representative of longer-term operating periods. Expenses net of fee waivers reflect expenses after reimbursement by the investment adviser but prior to reductions from brokerage service arrangements or other expense offset arrangements. Expenses net of all reductions represent the net expenses paid by the class.
See accompanying notes which are an integral part of the financial statements.
Annual Report
Fidelity Series International Small Cap Fund
Average annual total return reflects the change in the value of an investment, assuming reinvestment of the class' distributions from dividend income and capital gains (the profits earned upon the sale of securities that have grown in value, if any) and assuming a constant rate of performance each year. The $10,000 table and the fund's returns do not reflect the deduction of taxes that a shareholder would pay on fund distributions or the redemption of fund shares. During periods of reimbursement by Fidelity, a fund's total return will be greater than it would be had the reimbursement not occurred. How a fund did yesterday is no guarantee of how it will do tomorrow.
Average Annual Total Returns
Periods ended October 31, 2011 | Past 1
year | Life of
fund A |
Fidelity Series International Small Cap Fund | -0.23% | 6.97% |
Class F | -0.03% | 7.23% |
A From December 3, 2009.
$10,000 Over Life of Fund
Let's say hypothetically that $10,000 was invested in Fidelity Series International Small Cap Fund, a class of the fund, on December 3, 2009, when the fund started. The chart shows how the value of your investment would have changed, and also shows how the MSCI® EAFE® (Europe, Australasia, Far East) Small Cap Index performed over the same period.
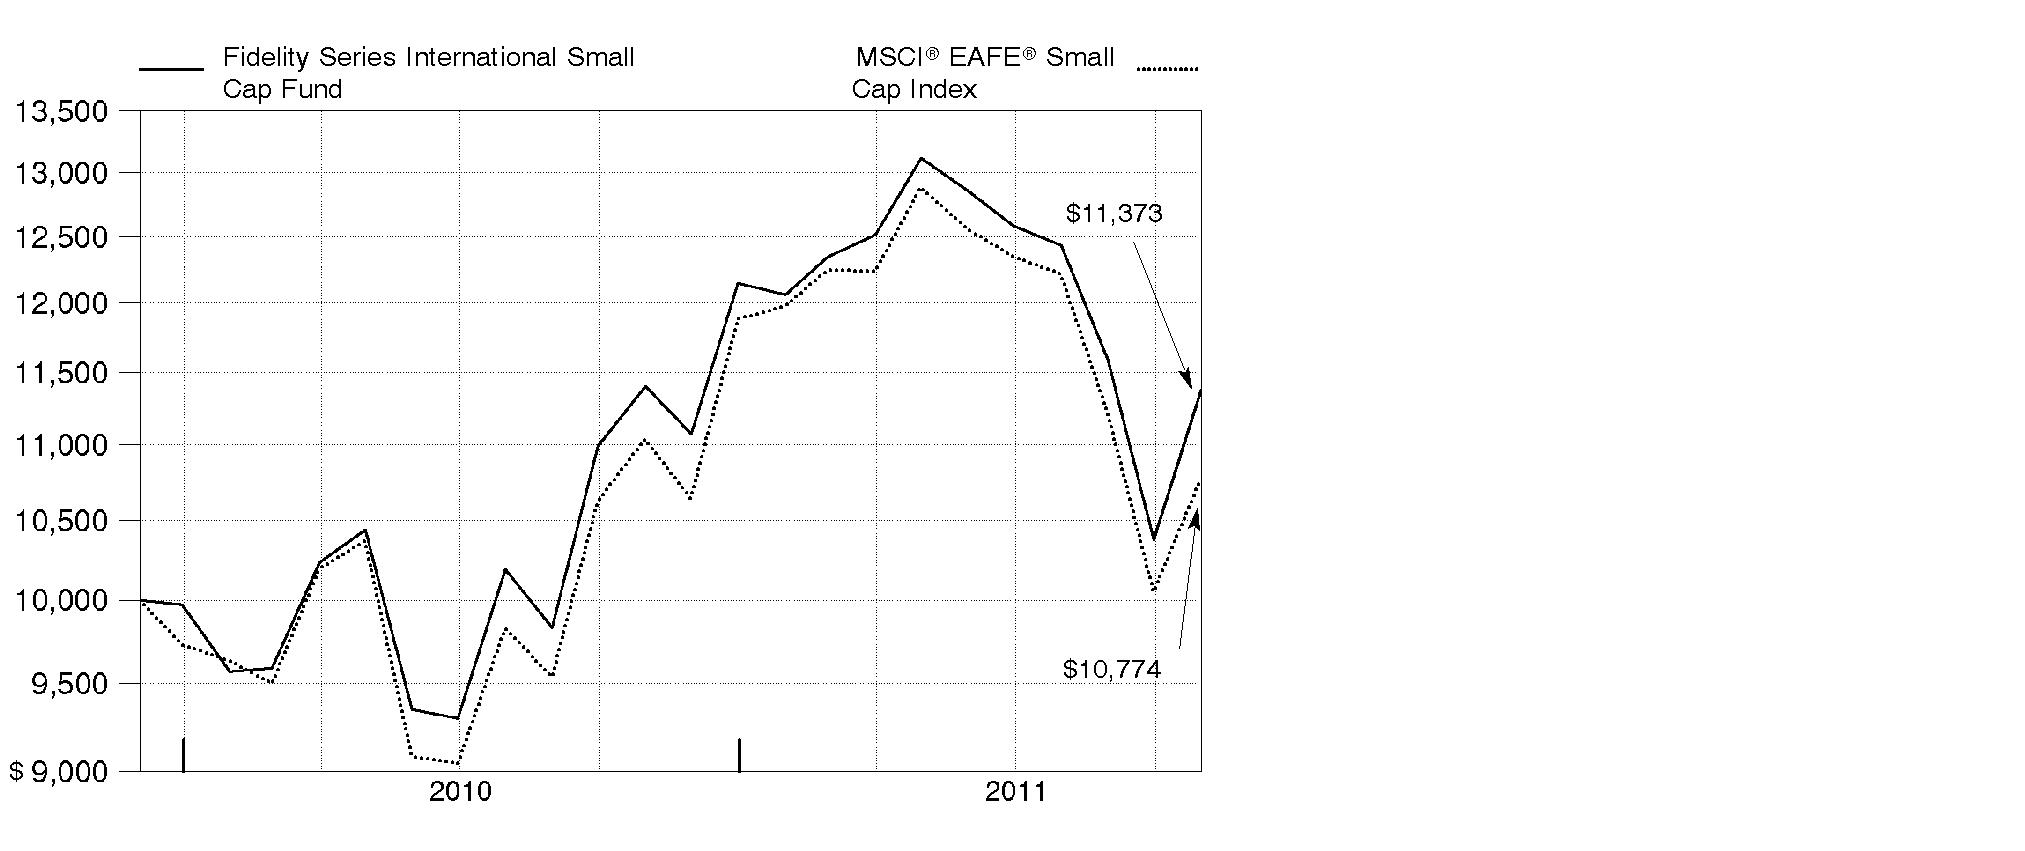
Annual Report
Fidelity Series International Small Cap Fund
Market Recap: International equities were rocked by a number of headline events during the year ending October 31, 2011. Stocks posted a solid advance for the first half of the period, despite concern about the sovereign debt crisis in Europe, a devastating earthquake and tsunami in Japan, and political upheaval in the Middle East and North Africa. Sentiment turned decidedly negative in the second half, however, as fresh worries about Europe, inflation in China and a dimmed outlook for global growth caused foreign markets to suffer declines that intensified in August and September. October brought with it yet another dramatic swing, as eurozone policymakers appeared near a resolution to the debt debacle and buyers stormed back onto the scene in search of bargains. Still, those gains - along with favorable currency fluctuations overall - weren't enough to offset prior losses, and the MSCI® ACWI® (All Country World Index) ex USA Index finished the period down 4.56%. Within the MSCI index, Europe and emerging markets suffered the biggest declines, with many countries in these areas sustaining steep losses. By contrast, Japan showed resilience in the wake of its natural disasters, falling only 2%. Australia (+4%), Switzerland (+3%), the U.K. (+2%) and Canada, which produced a nominal return, were among the few major benchmark components to break into positive territory.
Comments from Jed Weiss, Portfolio Manager of Fidelity® Series International Small Cap Fund: For the year, the fund's Series International Small Cap and Class F shares returned -0.23% and -0.03%, respectively, versus -2.39% for the MSCI® EAFE® (Europe, Australasia, Far East) Small Cap Index. Security selection in Europe - especially Finland and Germany - helped, as did stock picking in the United States, which is not in the index. Positioning in Japan and, within non-index emerging markets, Turkey and South Africa were notable detractors. Security selection in Canada, another non-index country, also was negative. In terms of sectors, good security selection in industrials and consumer discretionary, along with a favorable stance in consumer staples and information technology, helped, while relatively weak stock picking in energy and positioning in utilities hurt. The top individual contributor was U.S.-based PriceSmart, a dominant warehouse club retailer in Central America. Aozora Bank (Japan), railroad Kansas City Southern (U.S.) and used-car auctioneer USS (Japan) also helped. On the negative side, the fund was hurt by Canadian energy firms Niko Resources and Petrobank Energy & Resources, the latter of which I sold before period end. Italian asset manager Azimut Holding, the only index component I've mentioned, also hurt.
The views expressed above reflect those of the portfolio manager(s) only through the end of the period as stated on the cover of this report and do not necessarily represent the views of Fidelity or any other person in the Fidelity organization. Any such views are subject to change at any time based upon market or other conditions and Fidelity disclaims any responsibility to update such views. These views may not be relied on as investment advice and, because investment decisions for a Fidelity fund are based on numerous factors, may not be relied on as an indication of trading intent on behalf of any Fidelity fund.
Annual Report
Fidelity Series International Small Cap Fund
Investment Changes (Unaudited)
Geographic Diversification (% of fund's net assets) |
As of October 31, 2011 |
 | United States of America 19.4% | |
 | Japan 19.3% | |
 | United Kingdom 15.7% | |
 | Brazil 4.6% | |
 | Canada 4.6% | |
 | Germany 4.2% | |
 | France 3.0% | |
 | Finland 2.3% | |
 | South Africa 2.2% | |
 | Other 24.7% | |

Percentages are adjusted for the effect of futures contracts, if applicable. |
As of April 30, 2011 |
 | Japan 19.6% | |
 | United Kingdom 16.1% | |
 | United States of America 14.3% | |
 | Canada 5.1% | |
 | Brazil 4.8% | |
 | Germany 3.3% | |
 | France 3.2% | |
 | Finland 3.0% | |
 | Italy 2.8% | |
 | Other 27.8% | |

Percentages are adjusted for the effect of futures contracts, if applicable. |
Asset Allocation |
| % of fund's
net assets | % of fund's net assets
6 months ago |
Stocks | 93.1 | 96.7 |
Short-Term Investments and Net Other Assets | 6.9 | 3.3 |
Top Ten Stocks as of October 31, 2011 |
| % of fund's
net assets | % of fund's net assets
6 months ago |
PriceSmart, Inc. (United States of America, Food & Staples Retailing) | 2.3 | 1.7 |
USS Co. Ltd. (Japan, Specialty Retail) | 1.8 | 1.5 |
Osaka Securities Exchange Co. Ltd. (Japan, Diversified Financial Services) | 1.6 | 1.3 |
Kobayashi Pharmaceutical Co. Ltd. (Japan, Personal Products) | 1.6 | 1.3 |
Spirax-Sarco Engineering PLC (United Kingdom, Machinery) | 1.4 | 1.3 |
Prosegur Compania de Seguridad SA (Reg.) (Spain, Commercial Services & Supplies) | 1.3 | 1.3 |
Bank Sarasin & Co. Ltd. Series B (Reg.) (Switzerland, Capital Markets) | 1.3 | 0.9 |
Meggitt PLC (United Kingdom, Aerospace & Defense) | 1.3 | 1.2 |
Andritz AG (Austria, Machinery) | 1.3 | 1.2 |
Outotec Oyj (Finland, Construction & Engineering) | 1.3 | 1.3 |
| 15.2 | |
Market Sectors as of October 31, 2011 |
| % of fund's
net assets | % of fund's net assets
6 months ago |
Industrials | 21.4 | 23.0 |
Consumer Discretionary | 17.2 | 17.5 |
Financials | 15.3 | 17.2 |
Materials | 11.1 | 10.9 |
Consumer Staples | 9.6 | 8.3 |
Information Technology | 8.4 | 8.9 |
Health Care | 5.6 | 4.9 |
Energy | 4.5 | 5.7 |
Utilities | 0.0 | 0.3 |
Annual Report
Fidelity Series International Small Cap Fund
Investments October 31, 2011
Showing Percentage of Net Assets
Common Stocks - 93.1% |
| Shares | | Value |
Australia - 1.4% |
MAp Group unit | 3,440,823 | | $ 12,279,015 |
OZ Minerals Ltd. | 584,968 | | 7,025,424 |
Ramsay Health Care Ltd. | 186,035 | | 3,657,306 |
TOTAL AUSTRALIA | | 22,961,745 |
Austria - 1.9% |
Andritz AG | 226,762 | | 20,093,634 |
Zumtobel AG | 479,919 | | 10,008,890 |
TOTAL AUSTRIA | | 30,102,524 |
Bailiwick of Guernsey - 0.7% |
Resolution Ltd. | 2,552,521 | | 11,288,652 |
Bailiwick of Jersey - 1.5% |
Informa PLC | 1,963,442 | | 11,443,169 |
Randgold Resources Ltd. sponsored ADR | 112,600 | | 12,337,582 |
TOTAL BAILIWICK OF JERSEY | | 23,780,751 |
Belgium - 1.2% |
Gimv NV | 148,704 | | 7,603,995 |
Umicore SA | 267,281 | | 11,509,133 |
TOTAL BELGIUM | | 19,113,128 |
Bermuda - 1.3% |
Aquarius Platinum Ltd. (Australia) | 1,788,347 | | 5,246,760 |
Lazard Ltd. Class A | 152,001 | | 4,155,707 |
Trinity Ltd. | 12,532,000 | | 11,358,506 |
TOTAL BERMUDA | | 20,760,973 |
Brazil - 4.6% |
Arezzo Industria e Comercio SA | 562,000 | | 7,429,187 |
Banco ABC Brasil SA | 1,175,000 | | 7,834,702 |
Banco Pine SA | 591,600 | | 3,930,908 |
BR Malls Participacoes SA | 322,500 | | 3,483,796 |
Braskem SA Class A sponsored ADR (d) | 908,700 | | 16,392,948 |
Cia.Hering SA | 205,400 | | 4,587,171 |
Iguatemi Empresa de Shopping Centers SA | 202,900 | | 3,931,099 |
Multiplan Empreendimentos Imobiliarios SA | 367,700 | | 7,434,512 |
Odontoprev SA | 558,200 | | 8,783,231 |
Restoque Comercio e Confeccoes de Roupas SA | 112,600 | | 1,770,440 |
T4F Entretenimento SA | 574,500 | | 4,014,675 |
Totvs SA | 238,800 | | 3,963,312 |
TOTAL BRAZIL | | 73,555,981 |
Common Stocks - continued |
| Shares | | Value |
Canada - 4.6% |
Agnico-Eagle Mines Ltd. (Canada) | 179,340 | | $ 7,779,166 |
Eldorado Gold Corp. | 535,400 | | 10,059,730 |
Fairfax Financial Holdings Ltd. (sub. vtg.) | 30,868 | | 12,902,412 |
Niko Resources Ltd. (d) | 266,500 | | 14,658,369 |
Open Text Corp. (a) | 127,800 | | 7,821,716 |
Pan American Silver Corp. | 153,000 | | 4,277,881 |
Petrominerales Ltd. | 176,350 | | 4,652,661 |
Quadra FNX Mining Ltd. (a) | 329,400 | | 3,800,070 |
TAG Oil Ltd. (a) | 612,800 | | 3,799,071 |
Tuscany International Drilling, Inc. (a) | 3,425,400 | | 2,336,632 |
Tuscany International Drilling, Inc. (a)(e) | 538,700 | | 367,474 |
TOTAL CANADA | | 72,455,182 |
Cayman Islands - 1.5% |
China Lilang Ltd. | 5,810,000 | | 6,115,775 |
Intime Department Store Group Co. Ltd. | 2,822,000 | | 4,049,767 |
NVC Lighting Holdings Ltd. | 17,238,000 | | 7,484,613 |
Vantage Drilling Co. (a) | 1,748,469 | | 2,377,918 |
Wynn Macau Ltd. | 1,456,800 | | 4,081,776 |
TOTAL CAYMAN ISLANDS | | 24,109,849 |
Denmark - 0.8% |
William Demant Holding A/S (a) | 152,164 | | 12,140,858 |
Finland - 2.3% |
Metso Corp. | 124,600 | | 4,852,291 |
Nokian Tyres PLC | 323,600 | | 11,889,888 |
Outotec Oyj | 428,500 | | 20,031,579 |
TOTAL FINLAND | | 36,773,758 |
France - 3.0% |
Audika SA | 108,941 | | 2,409,200 |
Laurent-Perrier Group | 87,710 | | 9,042,949 |
Remy Cointreau SA | 135,773 | | 11,161,038 |
Saft Groupe SA | 391,949 | | 11,933,201 |
Vetoquinol SA | 118,141 | | 3,894,459 |
Virbac SA | 53,200 | | 9,208,825 |
TOTAL FRANCE | | 47,649,672 |
Germany - 4.2% |
alstria office REIT-AG | 552,700 | | 7,105,749 |
Bilfinger Berger AG | 146,898 | | 13,169,265 |
CompuGROUP Holding AG | 297,054 | | 3,823,165 |
Common Stocks - continued |
| Shares | | Value |
Germany - continued |
CTS Eventim AG | 583,104 | | $ 19,306,461 |
Fielmann AG | 128,695 | | 13,555,268 |
Software AG (Bearer) | 224,800 | | 9,339,244 |
TOTAL GERMANY | | 66,299,152 |
India - 0.5% |
Apollo Tyres Ltd. | 2,330,567 | | 2,733,160 |
Jyothy Laboratories Ltd. | 1,744,335 | | 5,105,939 |
TOTAL INDIA | | 7,839,099 |
Ireland - 0.9% |
James Hardie Industries NV CDI (a) | 2,316,724 | | 15,006,661 |
Israel - 0.9% |
Azrieli Group | 283,813 | | 7,302,411 |
Ituran Location & Control Ltd. | 552,995 | | 7,360,363 |
TOTAL ISRAEL | | 14,662,774 |
Italy - 1.6% |
Azimut Holding SpA | 1,373,464 | | 10,739,163 |
Interpump Group SpA | 2,212,917 | | 14,252,670 |
TOTAL ITALY | | 24,991,833 |
Japan - 19.3% |
Air Water, Inc. | 288,000 | | 3,656,395 |
Aozora Bank Ltd. (d) | 4,756,000 | | 12,024,827 |
Asahi Co. Ltd. (d) | 245,100 | | 5,430,663 |
Autobacs Seven Co. Ltd. | 321,700 | | 14,732,851 |
Daikoku Denki Co. Ltd. | 502,900 | | 4,503,494 |
Daikokutenbussan Co. Ltd. | 385,900 | | 11,076,607 |
FCC Co. Ltd. | 620,700 | | 13,115,932 |
GCA Savvian Group Corp. (d) | 4,113 | | 4,814,733 |
Glory Ltd. | 249,500 | | 5,340,994 |
Goldcrest Co. Ltd. | 233,000 | | 4,275,284 |
Kamigumi Co. Ltd. | 1,191,000 | | 10,401,037 |
Kobayashi Pharmaceutical Co. Ltd. | 498,800 | | 24,728,307 |
Kyoto Kimono Yuzen Co. Ltd. | 306,400 | | 3,564,724 |
Meiko Network Japan Co. Ltd. | 369,400 | | 3,059,053 |
Miraial Co. Ltd. | 102,000 | | 1,585,166 |
Nabtesco Corp. | 679,400 | | 14,881,861 |
Nagaileben Co. Ltd. | 304,200 | | 4,192,679 |
Nihon M&A Center, Inc. | 1,770 | | 9,991,974 |
Nihon Parkerizing Co. Ltd. | 656,000 | | 8,832,188 |
Common Stocks - continued |
| Shares | | Value |
Japan - continued |
Nippon Seiki Co. Ltd. | 468,000 | | $ 4,702,561 |
Nippon Thompson Co. Ltd. | 2,294,000 | | 14,777,352 |
Obic Co. Ltd. | 65,250 | | 12,337,757 |
Osaka Securities Exchange Co. Ltd. | 5,379 | | 25,209,560 |
OSG Corp. | 415,600 | | 5,326,264 |
Seven Bank Ltd. | 2,072 | | 3,687,728 |
SHO-BOND Holdings Co. Ltd. | 378,900 | | 8,453,219 |
Shoei Co. Ltd. | 277,100 | | 1,864,798 |
The Nippon Synthetic Chemical Industry Co. Ltd. | 1,330,000 | | 7,389,099 |
Tsumura & Co. | 368,000 | | 10,351,371 |
Tsutsumi Jewelry Co. Ltd. | 147,500 | | 3,437,521 |
USS Co. Ltd. | 339,890 | | 28,102,024 |
Yamatake Corp. | 279,900 | | 6,193,196 |
Yamato Kogyo Co. Ltd. | 549,900 | | 13,911,239 |
TOTAL JAPAN | | 305,952,458 |
Korea (South) - 0.2% |
NCsoft Corp. | 12,655 | | 3,963,553 |
Luxembourg - 0.5% |
GlobeOp Financial Services SA | 1,619,200 | | 7,421,393 |
Netherlands - 1.7% |
Aalberts Industries NV | 816,500 | | 14,457,766 |
ASM International NV unit (d) | 230,600 | | 6,507,532 |
QIAGEN NV (a)(d) | 460,300 | | 6,342,934 |
TOTAL NETHERLANDS | | 27,308,232 |
Papua New Guinea - 0.3% |
Oil Search Ltd. | 599,724 | | 4,091,827 |
Philippines - 0.4% |
Jollibee Food Corp. | 2,728,880 | | 5,798,910 |
Portugal - 0.7% |
Jeronimo Martins SGPS SA | 639,100 | | 11,055,631 |
Singapore - 0.3% |
Wing Tai Holdings Ltd. | 4,896,000 | | 4,964,742 |
South Africa - 2.2% |
African Rainbow Minerals Ltd. | 435,527 | | 10,065,693 |
City Lodge Hotels Ltd. | 20,311 | | 161,233 |
Clicks Group Ltd. | 1,700,371 | | 8,923,611 |
Common Stocks - continued |
| Shares | | Value |
South Africa - continued |
JSE Ltd. | 799,995 | | $ 7,084,365 |
Mr Price Group Ltd. | 890,600 | | 8,573,496 |
TOTAL SOUTH AFRICA | | 34,808,398 |
Spain - 1.5% |
Grifols SA (a) | 141,300 | | 2,636,925 |
Prosegur Compania de Seguridad SA (Reg.) | 432,000 | | 21,552,305 |
TOTAL SPAIN | | 24,189,230 |
Sweden - 2.0% |
Fagerhult AB | 266,395 | | 6,272,156 |
Intrum Justitia AB | 846,200 | | 13,920,432 |
Swedish Match Co. | 318,400 | | 11,017,791 |
TOTAL SWEDEN | | 31,210,379 |
Switzerland - 1.3% |
Bank Sarasin & Co. Ltd. Series B (Reg.) | 561,768 | | 21,445,192 |
Turkey - 1.4% |
Albaraka Turk Katilim Bankasi AS | 6,155,000 | | 6,509,176 |
Boyner Buyuk Magazacilik A/S (a) | 2,233,500 | | 3,751,446 |
Coca-Cola Icecek AS | 840,220 | | 11,404,089 |
TOTAL TURKEY | | 21,664,711 |
United Arab Emirates - 0.2% |
Dubai Financial Market PJSC (a) | 13,410,140 | | 3,760,535 |
United Kingdom - 15.7% |
AMEC PLC | 540,359 | | 8,042,644 |
Babcock International Group PLC | 1,248,800 | | 14,148,615 |
Bellway PLC | 835,600 | | 9,541,065 |
Britvic PLC | 2,333,200 | | 12,378,680 |
Dechra Pharmaceuticals PLC | 951,734 | | 7,499,835 |
Derwent London PLC | 248,500 | | 6,785,848 |
Great Portland Estates PLC | 1,787,500 | | 10,705,224 |
H&T Group PLC | 708,592 | | 3,544,024 |
InterContinental Hotel Group PLC ADR | 476,100 | | 8,798,328 |
Johnson Matthey PLC | 427,400 | | 12,915,207 |
Meggitt PLC | 3,405,482 | | 21,063,373 |
Micro Focus International PLC | 1,182,800 | | 6,459,800 |
Persimmon PLC | 828,700 | | 6,632,924 |
Rotork PLC | 425,100 | | 11,512,596 |
Serco Group PLC | 2,025,178 | | 16,919,550 |
Shaftesbury PLC | 1,352,900 | | 10,965,698 |
Common Stocks - continued |
| Shares | | Value |
United Kingdom - continued |
Spectris PLC | 601,707 | | $ 12,308,701 |
Spirax-Sarco Engineering PLC | 709,900 | | 21,897,061 |
Ted Baker PLC | 535,849 | | 6,646,265 |
Ultra Electronics Holdings PLC | 414,400 | | 10,609,694 |
Unite Group PLC | 4,939,825 | | 14,045,393 |
Victrex PLC | 780,300 | | 15,936,956 |
TOTAL UNITED KINGDOM | | 249,357,481 |
United States of America - 12.5% |
ANSYS, Inc. (a) | 84,815 | | 4,610,543 |
Autoliv, Inc. (d) | 222,900 | | 12,876,933 |
Broadridge Financial Solutions, Inc. | 188,395 | | 4,191,789 |
Cymer, Inc. (a) | 345,600 | | 15,016,320 |
Dril-Quip, Inc. (a) | 141,848 | | 9,234,305 |
Evercore Partners, Inc. Class A | 185,900 | | 5,101,096 |
Greenhill & Co., Inc. (d) | 94,605 | | 3,574,177 |
ION Geophysical Corp. (a) | 1,654,983 | | 12,610,970 |
Juniper Networks, Inc. (a) | 224,600 | | 5,495,962 |
Kansas City Southern (a) | 230,400 | | 14,554,368 |
Lam Research Corp. (a) | 138,900 | | 5,971,311 |
Martin Marietta Materials, Inc. (d) | 104,700 | | 7,556,199 |
Mohawk Industries, Inc. (a) | 343,962 | | 18,109,599 |
Oceaneering International, Inc. | 227,100 | | 9,499,593 |
PriceSmart, Inc. | 479,199 | | 36,438,294 |
ResMed, Inc. (a)(d) | 512,200 | | 14,495,260 |
Solera Holdings, Inc. | 203,149 | | 11,098,030 |
Solutia, Inc. (a) | 229,800 | | 3,734,250 |
SS&C Technologies Holdings, Inc. (a) | 248,646 | | 3,943,525 |
TOTAL UNITED STATES OF AMERICA | | 198,112,524 |
TOTAL COMMON STOCKS (Cost $1,419,942,710) |
1,478,597,788
|
Money Market Funds - 10.6% |
| Shares | | Value |
Fidelity Cash Central Fund, 0.12% (b) | 117,867,411 | | $ 117,867,411 |
Fidelity Securities Lending Cash Central Fund, 0.11% (b)(c) | 50,392,071 | | 50,392,071 |
TOTAL MONEY MARKET FUNDS (Cost $168,259,482) |
168,259,482
|
TOTAL INVESTMENT PORTFOLIO - 103.7% (Cost $1,588,202,192) | | 1,646,857,270 |
NET OTHER ASSETS (LIABILITIES) - (3.7)% | | (59,116,921) |
NET ASSETS - 100% | $ 1,587,740,349 |
Legend |
(a) Non-income producing |
(b) Affiliated fund that is available only to investment companies and other accounts managed by Fidelity Investments. The rate quoted is the annualized seven-day yield of the fund at period end. A complete unaudited listing of the fund's holdings as of its most recent quarter end is available upon request. In addition, each Fidelity Central Fund's financial statements, which are not covered by the Fund's Report of Independent Registered Public Accounting Firm, are available on the SEC's website or upon request. |
(c) Investment made with cash collateral received from securities on loan. |
(d) Security or a portion of the security is on loan at period end. |
(e) Security exempt from registration under Rule 144A of the Securities Act of 1933. These securities may be resold in transactions exempt from registration, normally to qualified institutional buyers. At the end of the period, the value of these securities amounted to $367,474 or 0.0% of net assets. |
Affiliated Central Funds |
Information regarding fiscal year to date income earned by the Fund from investments in Fidelity Central Funds is as follows: |
Fund | Income earned |
Fidelity Cash Central Fund | $ 67,234 |
Fidelity Securities Lending Cash Central Fund | 591,340 |
Total | $ 658,574 |
Other Information |
The following is a summary of the inputs used, as of October 31, 2011, involving the Fund's assets and liabilities carried at fair value. The inputs or methodology used for valuing securities may not be an indication of the risk associated with investing in those securities. For more information on valuation inputs, and their aggregation into the levels used in the table below, please refer to the Security Valuation section in the accompanying Notes to Financial Statements. |
Valuation Inputs at Reporting Date: |
Description | Total | Level 1 | Level 2 | Level 3 |
Investments in Securities: | | | | |
Equities: | | | | |
Japan | $ 305,952,458 | $ - | $ 305,952,458 | $ - |
United Kingdom | 249,357,481 | 249,357,481 | - | - |
United States of America | 198,112,524 | 198,112,524 | - | - |
Brazil | 73,555,981 | 73,555,981 | - | - |
Canada | 72,455,182 | 72,455,182 | - | - |
Germany | 66,299,152 | 66,299,152 | - | - |
France | 47,649,672 | 47,649,672 | - | - |
Finland | 36,773,758 | 36,773,758 | - | - |
South Africa | 34,808,398 | 34,808,398 | - | - |
Other | 393,633,182 | 296,468,358 | 97,164,824 | - |
Money Market Funds | 168,259,482 | 168,259,482 | - | - |
Total Investments in Securities: | $ 1,646,857,270 | $ 1,243,739,988 | $ 403,117,282 | $ - |
Income Tax Information |
At October 31, 2011, the Fund had a capital loss carryforward of approximately $9,938,109 all of which will expire in fiscal 2019. Capital loss carryforwards are only available to offset future capital gains of the Fund to the extent provided by regulations and may be limited. |
See accompanying notes which are an integral part of the financial statements.
Annual Report
Fidelity Series International Small Cap Fund
Statement of Assets and Liabilities
| October 31, 2011 |
| | |
Assets | | |
Investment in securities, at value (including securities loaned of $47,270,000) - See accompanying schedule: Unaffiliated issuers (cost $1,419,942,710) | $ 1,478,597,788 | |
Fidelity Central Funds (cost $168,259,482) | 168,259,482 | |
Total Investments (cost $1,588,202,192) | | $ 1,646,857,270 |
Cash | | 81,151 |
Receivable for fund shares sold | | 2,214,194 |
Dividends receivable | | 3,328,405 |
Distributions receivable from Fidelity Central Funds | | 21,623 |
Prepaid expenses | | 6,810 |
Other receivables | | 44,503 |
Total assets | | 1,652,553,956 |
| | |
Liabilities | | |
Payable to custodian bank | $ 59,124 | |
Payable for investments purchased | 12,863,108 | |
Payable for fund shares redeemed | 61,553 | |
Accrued management fee | 1,122,098 | |
Other affiliated payables | 233,842 | |
Other payables and accrued expenses | 81,811 | |
Collateral on securities loaned, at value | 50,392,071 | |
Total liabilities | | 64,813,607 |
| | |
Net Assets | | $ 1,587,740,349 |
Net Assets consist of: | | |
Paid in capital | | $ 1,531,525,647 |
Undistributed net investment income | | 13,229,687 |
Accumulated undistributed net realized gain (loss) on investments and foreign currency transactions | | (15,642,606) |
Net unrealized appreciation (depreciation) on investments and assets and liabilities in foreign currencies | | 58,627,621 |
Net Assets | | $ 1,587,740,349 |
See accompanying notes which are an integral part of the financial statements.
Annual Report
Fidelity Series International Small Cap Fund
Financial Statements - continued
Statement of Assets and Liabilities - continued
| October 31, 2011 |
| | |
Series International Small Cap:
Net Asset Value, offering price and redemption price per share ($1,107,241,874 ÷ 98,681,489 shares) | | $ 11.22 |
| | |
Class F:
Net Asset Value, offering price and redemption price per share ($480,498,475 ÷ 42,691,151 shares) | | $ 11.26 |
See accompanying notes which are an integral part of the financial statements.
Annual Report
Statement of Operations
| Year ended October 31, 2011 |
| | |
Investment Income | | |
Dividends | | $ 27,893,165 |
Special dividends | | 5,957,561 |
Interest | | 66 |
Income from Fidelity Central Funds | | 658,574 |
Income before foreign taxes withheld | | 34,509,366 |
Less foreign taxes withheld | | (1,871,425) |
Total income | | 32,637,941 |
| | |
Expenses | | |
Management fee
Basic fee | $ 10,761,271 | |
Performance adjustment | (1,088) | |
Transfer agent fees | 2,012,916 | |
Accounting and security lending fees | 581,133 | |
Custodian fees and expenses | 259,921 | |
Independent trustees' compensation | 6,597 | |
Registration fees | 573 | |
Audit | 68,609 | |
Legal | 3,447 | |
Miscellaneous | 8,662 | |
Total expenses before reductions | 13,702,041 | |
Expense reductions | (178,179) | 13,523,862 |
Net investment income (loss) | | 19,114,079 |
Realized and Unrealized Gain (Loss) Net realized gain (loss) on: | | |
Investment securities: | | |
Unaffiliated issuers (net of foreign taxes of $5,538) | (11,850,916) | |
Foreign currency transactions | (1,126,623) | |
Total net realized gain (loss) | | (12,977,539) |
Change in net unrealized appreciation (depreciation) on: Investment securities (net of decrease in deferred foreign taxes of $84,401) | (37,890,094) | |
Assets and liabilities in foreign currencies | (85,447) | |
Total change in net unrealized appreciation (depreciation) | | (37,975,541) |
Net gain (loss) | | (50,953,080) |
Net increase (decrease) in net assets resulting from operations | | $ (31,839,001) |
See accompanying notes which are an integral part of the financial statements.
Annual Report
Fidelity Series International Small Cap Fund
Financial Statements - continued
Statement of Changes in Net Assets
| Year ended
October 31,
2011 | For the period
December 3, 2009
(commencement of
operations) to
October 31,
2010 |
Increase (Decrease) in Net Assets | | |
Operations | | |
Net investment income (loss) | $ 19,114,079 | $ 2,308,288 |
Net realized gain (loss) | (12,977,539) | 3,459,115 |
Change in net unrealized appreciation (depreciation) | (37,975,541) | 96,603,162 |
Net increase (decrease) in net assets resulting
from operations | (31,839,001) | 102,370,565 |
Distributions to shareholders from net investment income | (8,192,680) | - |
Distributions to shareholders from net realized gain | (6,124,182) | - |
Total distributions | (14,316,862) | - |
Share transactions - net increase (decrease) | 801,569,467 | 729,956,180 |
Total increase (decrease) in net assets | 755,413,604 | 832,326,745 |
| | |
Net Assets | | |
Beginning of period | 832,326,745 | - |
End of period (including undistributed net investment income of $13,229,687 and undistributed net investment income of $2,308,288, respectively) | $ 1,587,740,349 | $ 832,326,745 |
See accompanying notes which are an integral part of the financial statements.
Annual Report
Financial Highlights - Series International Small Cap
Years ended October 31, | 2011 | 2010 H |
Selected Per-Share Data | | |
Net asset value, beginning of period | $ 11.40 | $ 10.00 |
Income from Investment Operations | | |
Net investment income (loss) D | .17 G | .06 |
Net realized and unrealized gain (loss) | (.19) | 1.34 |
Total from investment operations | (.02) | 1.40 |
Distributions from net investment income | (.09) | - |
Distributions from net realized gain | (.07) | - |
Total distributions | (.16) | - |
Net asset value, end of period | $ 11.22 | $ 11.40 |
Total Return B,C | (.23)% | 14.00% |
Ratios to Average Net Assets E,I | | |
Expenses before reductions | 1.14% | 1.21% A |
Expenses net of fee waivers, if any | 1.14% | 1.21% A |
Expenses net of all reductions | 1.13% | 1.18% A |
Net investment income (loss) | 1.47% G | .68% A |
Supplemental Data | | |
Net assets, end of period (000 omitted) | $ 1,107,242 | $ 701,814 |
Portfolio turnover rate F | 22% | 21% A |
A Annualized
B Total returns for periods of less than one year are not annualized.
C Total returns would have been lower if certain expenses had not been reduced during the applicable periods shown.
D Calculated based on average shares outstanding during the period.
E Fees and expenses of any underlying Fidelity Central Funds are not included in the Fund's expense ratio. The Fund indirectly bears its proportionate share of the expenses of any underlying Fidelity Central Funds.
F Amount does not include the portfolio activity of any underlying Fidelity Central Funds.
G Investment income per share reflects a special dividend which amounted to $.06 per share. Excluding the special dividend, the ratio of net investment income (loss) to average net assets would have been 1.00%.
H For the period December 3, 2009 (commencement of operations) to October 31, 2010.
I Expense ratios reflect operating expenses of the class. Expenses before reductions do not reflect amounts reimbursed by the investment adviser or reductions from brokerage service arrangements or reductions from other expense offset arrangements and do not represent the amount paid by the class during periods when reimbursements or reductions occur. Expense ratios before reductions for start-up periods may not be representative of longer-term operating periods. Expenses net of fee waivers reflect expenses after reimbursement by the investment adviser but prior to reductions from brokerage service arrangements or other expense offset arrangements. Expenses net of all reductions represent the net expenses paid by the class.
See accompanying notes which are an integral part of the financial statements.
Annual Report
Financial Highlights - Class F
Years ended October 31, | 2011 | 2010 H |
Selected Per-Share Data | | |
Net asset value, beginning of period | $ 11.43 | $ 10.00 |
Income from Investment Operations | | |
Net investment income (loss) D | .20 G | .09 |
Net realized and unrealized gain (loss) | (.20) | 1.34 |
Total from investment operations | - | 1.43 |
Distributions from net investment income | (.10) | - |
Distributions from net realized gain | (.07) | - |
Total distributions | (.17) | - |
Net asset value, end of period | $ 11.26 | $ 11.43 |
Total Return B,C | (.03)% | 14.30% |
Ratios to Average Net Assets E,I | | |
Expenses before reductions | .93% | .98% A |
Expenses net of fee waivers, if any | .93% | .98% A |
Expenses net of all reductions | .92% | .94% A |
Net investment income (loss) | 1.68% G | .92% A |
Supplemental Data | | |
Net assets, end of period (000 omitted) | $ 480,498 | $ 130,513 |
Portfolio turnover rate F | 22% | 21% A |
A Annualized
B Total returns for periods of less than one year are not annualized.
C Total returns would have been lower if certain expenses had not been reduced during the applicable periods shown.
D Calculated based on average shares outstanding during the period.
E Fees and expenses of any underlying Fidelity Central Funds are not included in the Fund's expense ratio. The Fund indirectly bears its proportionate share of the expenses of any underlying Fidelity Central Funds.
F Amount does not include the portfolio activity of any underlying Fidelity Central Funds.
G Investment income per share reflects a special dividend which amounted to $.06 per share. Excluding the special dividend, the ratio of net investment income (loss) to average net assets would have been 1.21%.
H For the period December 3, 2009 (commencement of operations) to October 31, 2010.
I Expense ratios reflect operating expenses of the class. Expenses before reductions do not reflect amounts reimbursed by the investment adviser or reductions from brokerage service arrangements or reductions from other expense offset arrangements and do not represent the amount paid by the class during periods when reimbursements or reductions occur. Expense ratios before reductions for start-up periods may not be representative of longer-term operating periods. Expenses net of fee waivers reflect expenses after reimbursement by the investment adviser but prior to reductions from brokerage service arrangements or other expense offset arrangements. Expenses net of all reductions represent the net expenses paid by the class.
See accompanying notes which are an integral part of the financial statements.
Annual Report
Fidelity Series International Value Fund
Average annual total return reflects the change in the value of an investment, assuming reinvestment of the class' distributions from dividend income and capital gains (the profits earned upon the sale of securities that have grown in value, if any) and assuming a constant rate of performance each year. The $10,000 table and the fund's returns do not reflect the deduction of taxes that a shareholder would pay on fund distributions or the redemption of fund shares. During periods of reimbursement by Fidelity, a fund's total return will be greater than it would be had the reimbursement not occurred. How a fund did yesterday is no guarantee of how it will do tomorrow.
Average Annual Total Returns
Periods ended October 31, 2011 | Past 1
year | Life of
fund A |
Fidelity Series International Value Fund | -11.84% | -6.82% |
Class F | -11.61% | -6.60% |
A From December 3, 2009.
$10,000 Over Life of Fund
Let's say hypothetically that $10,000 was invested in Fidelity Series International Value Fund, a class of the fund, on December 3, 2009, when the fund started. The chart shows how the value of your investment would have changed, and also shows how the MSCI® EAFE® (Europe, Australasia, Far East) Value Index performed over the same period.
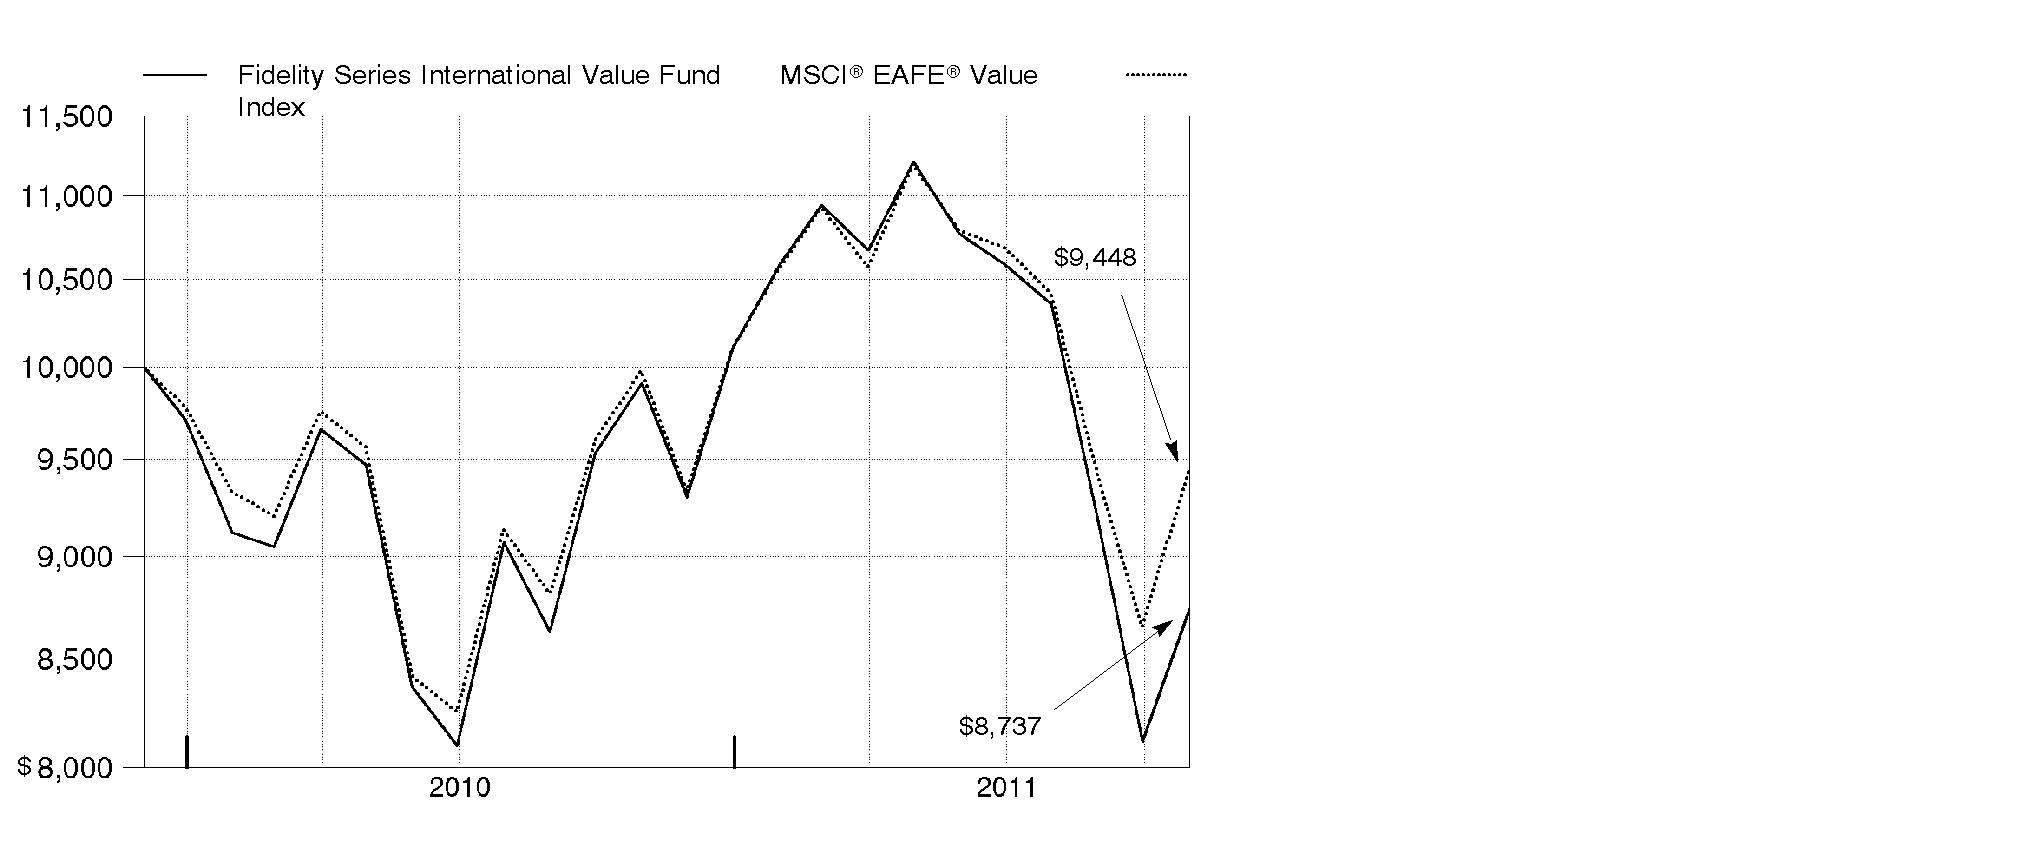
Annual Report
Fidelity Series International Value Fund
Market Recap: International equities were rocked by a number of headline events during the year ending October 31, 2011. Stocks posted a solid advance for the first half of the period, despite concern about the sovereign debt crisis in Europe, a devastating earthquake and tsunami in Japan, and political upheaval in the Middle East and North Africa. Sentiment turned decidedly negative in the second half, however, as fresh worries about Europe, inflation in China and a dimmed outlook for global growth caused foreign markets to suffer declines that intensified in August and September. October brought with it yet another dramatic swing, as eurozone policymakers appeared near a resolution to the debt debacle and buyers stormed back onto the scene in search of bargains. Still, those gains - along with favorable currency fluctuations overall - weren't enough to offset prior losses, and the MSCI® ACWI® (All Country World Index) ex USA Index finished the period down 4.56%. Within the MSCI index, Europe and emerging markets suffered the biggest declines, with many countries in these areas sustaining steep losses. By contrast, Japan showed resilience in the wake of its natural disasters, falling only 2%. Australia (+4%), Switzerland (+3%), the U.K. (+2%) and Canada, which produced a nominal return, were among the few major benchmark components to break into positive territory.
Comments from Alex Zavratsky, who became Portfolio Manager of Fidelity® Series International Value Fund on September 6, 2011: For the year, the fund's Series International Value and Class F shares fell 11.84% and 11.61%, respectively, trailing the 5.33% drop of the benchmark MSCI® EAFE® (Europe, Australasia, Far East) Value Index. In geographic terms, weak stock picking in and a lack of exposure to the comparatively healthy Asia Pacific ex Japan region, especially Australia, was detrimental to performance. Stock selection also was punitive in Europe - particularly the U.K. and France - and Japan. Sector-wise, the biggest source of weakness was the financials sector, where holdings in several European banks were among the biggest detractors, including France-based Societe Generale, Italy's Intesa Sanpaolo and an out-of-index stake in Lloyds Banking Group in the U.K. Elsewhere within financials, French insurance firm AXA and ING Groep, a diversified financials company in the Netherlands, hampered results. Picks in energy, consumer discretionary and industrials also hurt. However, positioning in utilities was a bright spot. Here, the fund's lack of exposure to Japanese utility Tokyo Electric Power, a benchmark component, was the biggest individual contributor, while out-of-index stakes in Swiss pharma firm Roche Holding and Canada-based miner Yamana Gold also aided results. Some of the stocks I've mentioned were sold from the fund by period end.
The views expressed above reflect those of the portfolio manager(s) only through the end of the period as stated on the cover of this report and do not necessarily represent the views of Fidelity or any other person in the Fidelity organization. Any such views are subject to change at any time based upon market or other conditions and Fidelity disclaims any responsibility to update such views. These views may not be relied on as investment advice and, because investment decisions for a Fidelity fund are based on numerous factors, may not be relied on as an indication of trading intent on behalf of any Fidelity fund.
Annual Report
Fidelity Series International Value Fund
Investment Changes (Unaudited)
Geographic Diversification (% of fund's net assets) |
As of October 31, 2011 |
 | United Kingdom 27.2% | |
 | Japan 21.4% | |
 | Germany 10.5% | |
 | France 8.4% | |
 | Switzerland 7.5% | |
 | Australia 6.2% | |
 | Italy 3.0% | |
 | Norway 2.9% | |
 | Netherlands 2.8% | |
 | Other 10.1% | |

Percentages are adjusted for the effect of futures contracts, if applicable. |
As of April 30, 2011 |
 | United Kingdom 20.4% | |
 | Japan 17.2% | |
 | France 10.0% | |
 | Germany 7.6% | |
 | Spain 6.4% | |
 | Switzerland 4.8% | |
 | Netherlands 4.0% | |
 | Canada 3.3% | |
 | Hong Kong 3.3% | |
 | Other 23.0% | |

Percentages are adjusted for the effect of futures contracts, if applicable. |
Asset Allocation |
| % of fund's
net assets | % of fund's net assets
6 months ago |
Stocks | 98.6 | 99.4 |
Short-Term Investments and Net Other Assets | 1.4 | 0.6 |
Top Ten Stocks as of October 31, 2011 |
| % of fund's
net assets | % of fund's net assets
6 months ago |
Royal Dutch Shell PLC Class A sponsored ADR (United Kingdom, Oil, Gas & Consumable Fuels) | 5.8 | 4.4 |
GlaxoSmithKline PLC sponsored ADR (United Kingdom, Pharmaceuticals) | 3.5 | 1.8 |
Vodafone Group PLC sponsored ADR (United Kingdom, Wireless Telecommunication Services) | 3.4 | 2.3 |
BP PLC sponsored ADR (United Kingdom, Oil, Gas & Consumable Fuels) | 3.0 | 2.5 |
Sanofi-aventis (France, Pharmaceuticals) | 2.9 | 0.0 |
Commonwealth Bank of Australia (Australia, Commercial Banks) | 2.9 | 0.3 |
Roche Holding AG (participation certificate) (Switzerland, Pharmaceuticals) | 2.8 | 2.0 |
Nestle SA (Switzerland, Food Products) | 2.2 | 0.0 |
Allianz AG (Germany, Insurance) | 2.0 | 0.4 |
Australia & New Zealand Banking Group Ltd. (Australia, Commercial Banks) | 1.9 | 0.0 |
| 30.4 | |
Market Sectors as of October 31, 2011 |
| % of fund's
net assets | % of fund's net assets
6 months ago |
Financials | 23.7 | 35.6 |
Energy | 13.4 | 12.8 |
Telecommunication Services | 11.6 | 6.2 |
Health Care | 11.6 | 5.4 |
Consumer Staples | 9.0 | 1.9 |
Utilities | 7.8 | 5.4 |
Consumer Discretionary | 7.5 | 10.7 |
Industrials | 6.4 | 8.8 |
Materials | 5.1 | 7.7 |
Information Technology | 2.5 | 4.9 |
Annual Report
Fidelity Series International Value Fund
Investments October 31, 2011
Showing Percentage of Net Assets
Common Stocks - 97.9% |
| Shares | | Value |
Australia - 6.2% |
Australia & New Zealand Banking Group Ltd. | 5,485,359 | | $ 123,961,265 |
Commonwealth Bank of Australia | 3,584,943 | | 184,176,264 |
Macquarie Group Ltd. | 1,125,175 | | 28,971,811 |
Telstra Corp. Ltd. | 20,153,739 | | 65,444,143 |
TOTAL AUSTRALIA | | 402,553,483 |
Bailiwick of Guernsey - 0.3% |
Resolution Ltd. | 4,440,500 | | 19,638,333 |
Bailiwick of Jersey - 0.5% |
Wolseley PLC | 1,155,000 | | 33,397,328 |
France - 8.4% |
Atos Origin SA | 527,702 | | 25,574,644 |
BNP Paribas SA | 1,827,675 | | 83,088,144 |
Casino Guichard Perrachon et Compagnie | 322,372 | | 30,301,191 |
Compagnie de St. Gobain | 519,711 | | 24,230,793 |
Euler Hermes SA | 174,326 | | 12,631,837 |
GDF Suez | 2,073,900 | | 58,879,491 |
Pernod-Ricard SA | 349,100 | | 32,610,566 |
PPR SA | 344,075 | | 53,759,073 |
Sanofi-aventis | 2,585,387 | | 184,982,821 |
Unibail-Rodamco | 180,054 | | 36,006,038 |
TOTAL FRANCE | | 542,064,598 |
Germany - 10.1% |
Allianz AG | 970,678 | | 109,091,122 |
Allianz AG sponsored ADR | 1,683,700 | | 18,857,440 |
BASF AG | 1,643,280 | | 120,961,251 |
Bayer AG | 1,232,246 | | 78,947,106 |
Daimler AG (United States) | 1,223,200 | | 62,187,488 |
Deutsche Telekom AG | 4,633,700 | | 58,957,237 |
E.ON AG | 2,876,357 | | 69,700,139 |
HeidelbergCement AG | 582,200 | | 26,572,203 |
Metro AG | 474,200 | | 22,108,907 |
Siemens AG | 593,760 | | 62,247,449 |
Volkswagen AG | 137,087 | | 21,589,533 |
TOTAL GERMANY | | 651,219,875 |
Hong Kong - 0.6% |
Henderson Land Development Co. Ltd. | 792,000 | | 4,329,095 |
Power Assets Holdings Ltd. | 4,515,500 | | 34,312,426 |
TOTAL HONG KONG | | 38,641,521 |
Common Stocks - continued |
| Shares | | Value |
Ireland - 0.7% |
CRH PLC sponsored ADR (d) | 2,253,796 | | $ 41,492,384 |
Italy - 2.7% |
ENI SpA | 5,465,800 | | 120,833,040 |
Intesa Sanpaolo SpA | 18,204,954 | | 32,525,242 |
Telecom Italia SpA | 14,457,900 | | 17,992,225 |
TOTAL ITALY | | 171,350,507 |
Japan - 21.4% |
ABC-Mart, Inc. | 527,600 | | 20,664,447 |
Aeon Credit Service Co. Ltd. | 2,042,100 | | 30,457,475 |
Air Water, Inc. | 2,354,000 | | 29,885,951 |
Aisin Seiki Co. Ltd. | 621,500 | | 19,658,677 |
Aozora Bank Ltd. | 19,005,000 | | 48,051,271 |
Asahi Glass Co. Ltd. | 2,312,000 | | 20,248,616 |
Canon, Inc. | 1,017,400 | | 46,193,634 |
Chubu Electric Power Co., Inc. | 1,684,400 | | 30,821,288 |
Credit Saison Co. Ltd. | 1,786,600 | | 34,867,932 |
Denso Corp. | 1,510,400 | | 46,455,686 |
Dentsu, Inc. | 898,900 | | 27,069,546 |
Fanuc Corp. | 196,200 | | 31,727,687 |
Honda Motor Co. Ltd. | 1,934,200 | | 57,847,228 |
INPEX Corp. | 5,915 | | 39,056,308 |
Itochu Corp. | 6,875,000 | | 68,005,525 |
Japan Retail Fund Investment Corp. | 39,909 | | 61,785,966 |
Japan Tobacco, Inc. | 20,349 | | 101,720,613 |
JSR Corp. | 1,603,900 | | 30,622,531 |
JX Holdings, Inc. | 7,910,900 | | 46,085,980 |
KDDI Corp. | 11,239 | | 82,340,219 |
Mitsubishi Corp. | 1,655,400 | | 34,050,908 |
Mitsubishi Tanabe Pharma Corp. | 2,894,600 | | 50,075,114 |
Nippon Telegraph & Telephone Corp. | 1,691,800 | | 86,793,397 |
Obic Co. Ltd. | 146,690 | | 27,736,791 |
ORIX Corp. | 376,220 | | 32,838,907 |
Santen Pharmaceutical Co. Ltd. | 772,100 | | 28,813,497 |
Seven & i Holdings Co., Ltd. | 1,549,800 | | 41,362,854 |
Tokio Marine Holdings, Inc. | 1,133,100 | | 27,021,642 |
Tokyo Gas Co. Ltd. | 12,171,000 | | 52,418,954 |
Toray Industries, Inc. | 5,015,000 | | 35,698,334 |
USS Co. Ltd. | 354,050 | | 29,272,770 |
West Japan Railway Co. | 1,460,600 | | 61,898,781 |
TOTAL JAPAN | | 1,381,548,529 |
Common Stocks - continued |
| Shares | | Value |
Korea (South) - 0.5% |
Samsung Electronics Co. Ltd. | 39,799 | | $ 34,133,606 |
Mexico - 0.6% |
Grupo Modelo SAB de CV Series C | 6,452,300 | | 40,927,079 |
Netherlands - 2.8% |
ING Groep NV: | | | |
(Certificaten Van Aandelen) (a) | 7,009,852 | | 60,440,514 |
sponsored ADR (a)(d) | 2,187,677 | | 18,901,529 |
Koninklijke KPN NV | 2,316,532 | | 30,442,739 |
Koninklijke Philips Electronics NV | 1,471,400 | | 30,634,132 |
Unilever NV (Certificaten Van Aandelen) (Bearer) unit | 1,150,600 | | 39,728,672 |
TOTAL NETHERLANDS | | 180,147,586 |
Norway - 2.9% |
Aker Solutions ASA | 1,497,323 | | 17,413,547 |
DnB NOR ASA | 4,345,800 | | 50,696,837 |
Orkla ASA (A Shares) (d) | 4,537,600 | | 39,527,552 |
Telenor ASA | 4,401,000 | | 78,572,347 |
TOTAL NORWAY | | 186,210,283 |
Portugal - 0.2% |
Energias de Portugal SA | 4,767,024 | | 15,074,338 |
Singapore - 1.9% |
Singapore Telecommunications Ltd. | 27,344,000 | | 69,109,399 |
United Overseas Bank Ltd. | 4,041,491 | | 54,793,247 |
TOTAL SINGAPORE | | 123,902,646 |
Spain - 2.6% |
Banco Bilbao Vizcaya Argentaria SA sponsored ADR (d) | 9,934,975 | | 89,812,174 |
Red Electrica Corporacion SA | 437,800 | | 21,190,353 |
Repsol YPF SA | 1,744,120 | | 52,859,760 |
TOTAL SPAIN | | 163,862,287 |
Sweden - 0.8% |
Tele2 AB (B Shares) | 1,101,850 | | 23,255,372 |
Telefonaktiebolaget LM Ericsson (B Shares) | 2,885,973 | | 30,072,331 |
TOTAL SWEDEN | | 53,327,703 |
Switzerland - 7.5% |
Nestle SA | 2,411,040 | | 139,846,090 |
Roche Holding AG (participation certificate) | 1,096,361 | | 180,779,940 |
Syngenta AG (Switzerland) | 114,360 | | 34,857,822 |
Transocean Ltd. (United States) | 305,818 | | 17,477,499 |
Common Stocks - continued |
| Shares | | Value |
Switzerland - continued |
UBS AG (NY Shares) (a) | 3,068,100 | | $ 38,719,422 |
Zurich Financial Services AG | 323,332 | | 75,089,809 |
TOTAL SWITZERLAND | | 486,770,582 |
United Kingdom - 27.2% |
Aegis Group PLC | 6,696,572 | | 14,775,654 |
Aviva PLC | 8,389,100 | | 45,775,812 |
Barclays PLC | 23,346,208 | | 72,385,411 |
BP PLC sponsored ADR | 4,343,070 | | 191,876,833 |
British American Tobacco PLC (United Kingdom) | 911,800 | | 41,814,121 |
British Land Co. PLC | 3,034,400 | | 24,912,002 |
Centrica PLC | 6,377,800 | | 30,431,860 |
Compass Group PLC | 3,568,400 | | 32,481,047 |
GlaxoSmithKline PLC sponsored ADR | 5,008,400 | | 224,326,236 |
HSBC Holdings PLC sponsored ADR | 1,173,984 | | 51,256,141 |
Imperial Tobacco Group PLC | 1,837,037 | | 67,181,303 |
International Power PLC | 7,996,335 | | 43,491,525 |
National Grid PLC | 8,183,503 | | 81,375,890 |
Next PLC | 457,600 | | 18,809,919 |
Prudential PLC | 6,790,280 | | 70,150,639 |
Reed Elsevier PLC | 6,479,300 | | 55,694,955 |
Royal Dutch Shell PLC Class A sponsored ADR (d) | 5,316,000 | | 376,957,563 |
Scottish & Southern Energy PLC | 2,668,821 | | 57,684,452 |
Tesco PLC | 5,122,700 | | 33,097,475 |
Vodafone Group PLC sponsored ADR | 8,019,899 | | 223,273,988 |
TOTAL UNITED KINGDOM | | 1,757,752,826 |
TOTAL COMMON STOCKS (Cost $6,127,926,004) |
6,324,015,494
|
Nonconvertible Preferred Stocks - 0.7% |
| | | |
Germany - 0.4% |
Volkswagen AG | 133,550 | | 23,435,156 |
Italy - 0.3% |
Telecom Italia SpA (Risparmio Shares) | 19,319,700 | | 20,278,147 |
TOTAL NONCONVERTIBLE PREFERRED STOCKS (Cost $44,689,294) |
43,713,303
|
Money Market Funds - 8.3% |
| Shares | | Value |
Fidelity Cash Central Fund, 0.12% (b) | 78,017,083 | | $ 78,017,083 |
Fidelity Securities Lending Cash Central Fund, 0.11% (b)(c) | 458,793,150 | | 458,793,150 |
TOTAL MONEY MARKET FUNDS (Cost $536,810,233) |
536,810,233
|
TOTAL INVESTMENT PORTFOLIO - 106.9% (Cost $6,709,425,531) | | 6,904,539,030 |
NET OTHER ASSETS (LIABILITIES) - (6.9)% | | (445,085,308) |
NET ASSETS - 100% | $ 6,459,453,722 |
Legend |
(a) Non-income producing |
(b) Affiliated fund that is available only to investment companies and other accounts managed by Fidelity Investments. The rate quoted is the annualized seven-day yield of the fund at period end. A complete unaudited listing of the fund's holdings as of its most recent quarter end is available upon request. In addition, each Fidelity Central Fund's financial statements, which are not covered by the Fund's Report of Independent Registered Public Accounting Firm, are available on the SEC's website or upon request. |
(c) Investment made with cash collateral received from securities on loan. |
(d) Security or a portion of the security is on loan at period end. |
Affiliated Central Funds |
Information regarding fiscal year to date income earned by the Fund from investments in Fidelity Central Funds is as follows: |
Fund | Income earned |
Fidelity Cash Central Fund | $ 86,610 |
Fidelity Securities Lending Cash Central Fund | 7,084,349 |
Total | $ 7,170,959 |
Other Information |
The following is a summary of the inputs used, as of October 31, 2011, involving the Fund's assets and liabilities carried at fair value. The inputs or methodology used for valuing securities may not be an indication of the risk associated with investing in those securities. For more information on valuation inputs, and their aggregation into the levels used in the table below, please refer to the Security Valuation section in the accompanying Notes to Financial Statements. |
Valuation Inputs at Reporting Date: |
Description | Total | Level 1 | Level 2 | Level 3 |
Investments in Securities: | | | | |
Equities: | | | | |
United Kingdom | $ 1,757,752,826 | $ 1,446,250,953 | $ 311,501,873 | $ - |
Japan | 1,381,548,529 | - | 1,381,548,529 | - |
Germany | 674,655,031 | 612,407,582 | 62,247,449 | - |
France | 542,064,598 | 357,081,777 | 184,982,821 | - |
Switzerland | 486,770,582 | 451,912,760 | 34,857,822 | - |
Australia | 402,553,483 | - | 402,553,483 | - |
Italy | 191,628,654 | 32,525,242 | 159,103,412 | - |
Norway | 186,210,283 | 186,210,283 | - | - |
Netherlands | 180,147,586 | 49,344,268 | 130,803,318 | - |
Other | 564,397,225 | 337,647,121 | 226,750,104 | - |
Money Market Funds | 536,810,233 | 536,810,233 | - | - |
Total Investments in Securities: | $ 6,904,539,030 | $ 4,010,190,219 | $ 2,894,348,811 | $ - |
Income Tax Information |
At October 31, 2011, the Fund had a capital loss carryforward of approximately $902,960,621 of which $6,804,041 and $896,156,580 will expire in fiscal 2018 and 2019, respectively. Capital loss carryforwards are only available to offset future capital gains of the Fund to the extent provided by regulations and may be limited. |
See accompanying notes which are an integral part of the financial statements.
Annual Report
Fidelity Series International Value Fund
Statement of Assets and Liabilities
| October 31, 2011 |
| | |
Assets | | |
Investment in securities, at value (including securities loaned of $441,287,939) - See accompanying schedule: Unaffiliated issuers (cost $6,172,615,298) | $ 6,367,728,797 | |
Fidelity Central Funds (cost $536,810,233) | 536,810,233 | |
Total Investments (cost $6,709,425,531) | | $ 6,904,539,030 |
Cash | | 2,155,482 |
Foreign currency held at value (cost $348) | | 348 |
Receivable for investments sold | | 78,852,175 |
Receivable for fund shares sold | | 11,353,331 |
Dividends receivable | | 22,668,726 |
Distributions receivable from Fidelity Central Funds | | 77,152 |
Prepaid expenses | | 61,584 |
Other receivables | | 939,314 |
Total assets | | 7,020,647,142 |
| | |
Liabilities | | |
Payable for investments purchased | $ 97,795,381 | |
Payable for fund shares redeemed | 317,162 | |
Accrued management fee | 3,196,460 | |
Other affiliated payables | 896,673 | |
Other payables and accrued expenses | 194,594 | |
Collateral on securities loaned, at value | 458,793,150 | |
Total liabilities | | 561,193,420 |
| | |
Net Assets | | $ 6,459,453,722 |
Net Assets consist of: | | |
Paid in capital | | $ 7,089,738,039 |
Undistributed net investment income | | 149,195,087 |
Accumulated undistributed net realized gain (loss) on investments and foreign currency transactions | | (974,451,115) |
Net unrealized appreciation (depreciation) on investments and assets and liabilities in foreign currencies | | 194,971,711 |
Net Assets | | $ 6,459,453,722 |
See accompanying notes which are an integral part of the financial statements.
Annual Report
Fidelity Series International Value Fund
Financial Statements - continued
Statement of Assets and Liabilities - continued
| October 31, 2011 |
| | |
Series International Value:
Net Asset Value, offering price and redemption price per share ($4,503,486,735 ÷ 524,009,130 shares) | | $ 8.59 |
| | |
Class F:
Net Asset Value, offering price and redemption price per share ($1,955,966,987 ÷ 226,859,015 shares) | | $ 8.62 |
See accompanying notes which are an integral part of the financial statements.
Annual Report
Statement of Operations
| Year ended October 31, 2011 |
| | |
Investment Income | | |
Dividends | | $ 248,338,815 |
Interest | | 3,393 |
Income from Fidelity Central Funds | | 7,170,959 |
Income before foreign taxes withheld | | 255,513,167 |
Less foreign taxes withheld | | (18,914,053) |
Total income | | 236,599,114 |
| | |
Expenses | | |
Management fee
Basic fee | $ 42,074,176 | |
Performance adjustment | (593,294) | |
Transfer agent fees | 9,609,326 | |
Accounting and security lending fees | 1,673,919 | |
Custodian fees and expenses | 818,732 | |
Independent trustees' compensation | 31,737 | |
Registration fees | 3,305 | |
Audit | 79,911 | |
Legal | 16,745 | |
Interest | 1,808 | |
Miscellaneous | 43,821 | |
Total expenses before reductions | 53,760,186 | |
Expense reductions | (1,422,343) | 52,337,843 |
Net investment income (loss) | | 184,261,271 |
Realized and Unrealized Gain (Loss) Net realized gain (loss) on: | | |
Investment securities: | | |
Unaffiliated issuers | (943,510,321) | |
Foreign currency transactions | (371,977) | |
Total net realized gain (loss) | | (943,882,298) |
Change in net unrealized appreciation (depreciation) on: Investment securities (net of decrease in deferred foreign taxes of $972,928) | (137,448,099) | |
Assets and liabilities in foreign currencies | (519,881) | |
Total change in net unrealized appreciation (depreciation) | | (137,967,980) |
Net gain (loss) | | (1,081,850,278) |
Net increase (decrease) in net assets resulting from operations | | $ (897,589,007) |
See accompanying notes which are an integral part of the financial statements.
Annual Report
Fidelity Series International Value Fund
Financial Statements - continued
Statement of Changes in Net Assets
| Year ended
October 31,
2011 | For the period
December 3, 2009
(commencement
of operations) to
October 31,
2010 |
Increase (Decrease) in Net Assets | | |
Operations | | |
Net investment income (loss) | $ 184,261,271 | $ 38,040,995 |
Net realized gain (loss) | (943,882,298) | (15,045,002) |
Change in net unrealized appreciation (depreciation) | (137,967,980) | 332,939,691 |
Net increase (decrease) in net assets resulting
from operations | (897,589,007) | 355,935,684 |
Distributions to shareholders from net investment income | (69,464,545) | - |
Distributions to shareholders from net realized gain | (19,166,449) | - |
Total distributions | (88,630,994) | - |
Share transactions - net increase (decrease) | 2,850,091,917 | 4,239,646,122 |
Total increase (decrease) in net assets | 1,863,871,916 | 4,595,581,806 |
| | |
Net Assets | | |
Beginning of period | 4,595,581,806 | - |
End of period (including undistributed net investment income of $149,195,087 and undistributed net investment income of $38,040,995, respectively) | $ 6,459,453,722 | $ 4,595,581,806 |
See accompanying notes which are an integral part of the financial statements.
Annual Report
Financial Highlights - Series International Value
Years ended October 31, | 2011 | 2010 H |
Selected Per-Share Data | | |
Net asset value, beginning of period | $ 9.91 | $ 10.00 |
Income from Investment Operations | | |
Net investment income (loss) D | .30 | .18 |
Net realized and unrealized gain (loss) | (1.45) | (.27) G |
Total from investment operations | (1.15) | (.09) |
Distributions from net investment income | (.13) | - |
Distributions from net realized gain | (.04) | - |
Total distributions | (.17) | - |
Net asset value, end of period | $ 8.59 | $ 9.91 |
Total Return B,C | (11.84)% | (.90)% |
Ratios to Average Net Assets E,I | | |
Expenses before reductions | .95% | 1.01% A |
Expenses net of fee waivers, if any | .95% | 1.01% A |
Expenses net of all reductions | .93% | .99% A |
Net investment income (loss) | 3.05% | 2.24% A |
Supplemental Data | | |
Net assets, end of period (000 omitted) | $ 4,503,487 | $ 3,865,058 |
Portfolio turnover rate F | 78% | 72% A |
A Annualized
B Total returns for periods of less than one year are not annualized.
C Total returns would have been lower if certain expenses had not been reduced during the applicable periods shown.
D Calculated based on average shares outstanding during the period.
E Fees and expenses of any underlying Fidelity Central Funds are not included in the Fund's expense ratio. The Fund indirectly bears its proportionate share of the expenses of any underlying Fidelity Central Funds.
F Amount does not include the portfolio activity of any underlying Fidelity Central Funds.
G The amount shown for a share outstanding does not correspond with the aggregate net gain (loss) on investments for the period due to the timing of sales and repurchases of shares in relation to fluctuating market values of the investments of the Fund.
H For the period December 3, 2009 (commencement of operations) to October 31, 2010.
I Expense ratios reflect operating expenses of the class. Expenses before reductions do not reflect amounts reimbursed by the investment adviser or reductions from brokerage service arrangements or reductions from other expense offset arrangements and do not represent the amount paid by the class during periods when reimbursements or reductions occur. Expense ratios before reductions for start-up periods may not be representative of longer-term operating periods. Expenses net of fee waivers reflect expenses after reimbursement by the investment adviser but prior to reductions from brokerage service arrangements or other expense offset arrangements. Expenses net of all reductions represent the net expenses paid by the class.
See accompanying notes which are an integral part of the financial statements.
Annual Report
Financial Highlights - Class F
Years ended October 31, | 2011 | 2010 H |
Selected Per-Share Data | | |
Net asset value, beginning of period | $ 9.93 | $ 10.00 |
Income from Investment Operations | | |
Net investment income (loss) D | .31 | .20 |
Net realized and unrealized gain (loss) | (1.44) | (.27) G |
Total from investment operations | (1.13) | (.07) |
Distributions from net investment income | (.14) | - |
Distributions from net realized gain | (.04) | - |
Total distributions | (.18) | - |
Net asset value, end of period | $ 8.62 | $ 9.93 |
Total Return B,C | (11.61)% | (.70)% |
Ratios to Average Net Assets E,I | | |
Expenses before reductions | .74% | .78% A |
Expenses net of fee waivers, if any | .74% | .78% A |
Expenses net of all reductions | .72% | .75% A |
Net investment income (loss) | 3.26% | 2.47% A |
Supplemental Data | | |
Net assets, end of period (000 omitted) | $ 1,955,967 | $ 730,524 |
Portfolio turnover rate F | 78% | 72% A |
A Annualized
B Total returns for periods of less than one year are not annualized.
C Total returns would have been lower if certain expenses had not been reduced during the applicable periods shown.
D Calculated based on average shares outstanding during the period.
E Fees and expenses of any underlying Fidelity Central Funds are not included in the Fund's expense ratio. The Fund indirectly bears its proportionate share of the expenses of any underlying Fidelity Central Funds.
F Amount does not include the portfolio activity of any underlying Fidelity Central Funds.
G The amount shown for a share outstanding does not correspond with the aggregate net gain (loss) on investments for the period due to the timing of sales and repurchases of shares in relation to fluctuating market values of the investments of the Fund.
H For the period December 3, 2009 (commencement of operations) to October 31, 2010.
I Expense ratios reflect operating expenses of the class. Expenses before reductions do not reflect amounts reimbursed by the investment adviser or reductions from brokerage service arrangements or reductions from other expense offset arrangements and do not represent the amount paid by the class during periods when reimbursements or reductions occur. Expense ratios before reductions for start-up periods may not be representative of longer-term operating periods. Expenses net of fee waivers reflect expenses after reimbursement by the investment adviser but prior to reductions from brokerage service arrangements or other expense offset arrangements. Expenses net of all reductions represent the net expenses paid by the class.
See accompanying notes which are an integral part of the financial statements.
Annual Report
Notes to Financial Statements
For the period ended October 31, 2011
1. Organization.
Fidelity Series Emerging Markets Fund, Fidelity Series International Growth Fund, Fidelity Series International Small Cap Fund and Fidelity Series International Value Fund (the Funds) are funds of Fidelity Investment Trust (the Trust). The Trust is registered under the Investment Company Act of 1940, as amended (the 1940 Act), as an open-end management investment company organized as a Massachusetts business trust. Each Fund is authorized to issue an unlimited number of shares. Shares of the Funds are only available for purchase by mutual funds for which Fidelity Management & Research Company (FMR) or an affiliate serves as an investment manager. Fidelity Series Emerging Markets Fund offers Series Emerging Markets shares and Class F shares. Fidelity Series International Growth Fund offers Series International Growth shares and Class F shares. Fidelity Series International Small Cap Fund offers Series International Small Cap shares and Class F shares. Fidelity Series International Value Fund offers Series International Value shares and Class F shares. All classes have equal rights as to assets and voting privileges. Each class has exclusive voting rights with respect to matters that affect that class. Investment income, realized and unrealized capital gains and losses, the common expenses of each Fund, and certain fund-level expense reductions, if any, are allocated on a pro-rata basis to each class based on the relative net assets of each class to the total net assets of each Fund. Each class differs with respect to transfer agent fees incurred and certain class-level expense reductions. Certain Funds' investments in emerging markets can be subject to social, economic, regulatory, and political uncertainties and can be extremely volatile.
2. Investments in Fidelity Central Funds.
The Funds invest in Fidelity Central Funds, which are open-end investment companies available only to other investment companies and accounts managed by FMR and its affiliates. The Funds' Schedules of Investments list each of the Fidelity Central Funds held as of period end, if any, as an investment of each Fund, but does not include the underlying holdings of each Fidelity Central Fund. As an Investing Fund, the Funds indirectly bear their proportionate share of the expenses of the underlying Fidelity Central Funds.
The Money Market Central Funds seek preservation of capital and current income and are managed by Fidelity Investments Money Management, Inc. (FIMM), an affiliate of FMR.
A complete unaudited list of holdings for each Fidelity Central Fund is available upon request or at the Securities and Exchange Commission (the SEC) web site at www.sec.gov. In addition, the financial statements of the Fidelity Central Funds, which are not covered by the Funds' Reports of Independent Registered Public Accounting Firms, are available on the SEC web site or upon request.
Annual Report
3. Significant Accounting Policies.
The financial statements have been prepared in conformity with accounting principles generally accepted in the United States of America (GAAP), which require management to make certain estimates and assumptions at the date of the financial statements. Actual results could differ from those estimates. Subsequent events, if any, through the date that the financial statements were issued have been evaluated in the preparation of the financial statements. The following summarizes the significant accounting policies of the Funds:
Security Valuation. Investments are valued as of 4:00 p.m. Eastern time on the last calendar day of the period. Each Fund uses independent pricing services approved by the Board of Trustees to value their investments. When current market prices or quotations are not readily available or reliable, valuations may be determined in good faith in accordance with procedures adopted by the Board of Trustees. Factors used in determining value may include market or security specific events. The frequency with which these procedures are used cannot be predicted and they may be utilized to a significant extent. The value used for net asset value (NAV) calculation under these procedures may differ from published prices for the same securities.
Each Fund categorizes the inputs to valuation techniques used to value their investments into a disclosure hierarchy consisting of three levels as shown below:
Level 1 - quoted prices in active markets for identical investments
Level 2 - other significant observable inputs (including quoted prices for similar investments, interest rates, prepayment speeds, etc.)
Level 3 - unobservable inputs (including the Fund's own assumptions based on the best information available)
Changes in valuation techniques may result in transfers in or out of an assigned level within the disclosure hierarchy. The aggregate value of investments by input level, as of October 31, 2011, as well as a roll forward of Level 3 securities, is included at the end of each Fund's Schedule of Investments. Valuation techniques used to value each Fund's investments by major category are as follows:
Equity securities, including restricted securities, for which market quotations are readily available, are valued at the last reported sale price or official closing price as reported by an independent pricing service on the primary market or exchange on which they are traded and are categorized as Level 1 in the hierarchy. In the event there were no sales during the day or closing prices are not available, securities are valued at the last quoted bid price or may be valued using the last available price and are generally categorized as Level 2 in the hierarchy. For foreign equity securities, when significant market or security specific events arise, comparisons to the valuation of American Depositary Receipts
Annual Report
Notes to Financial Statements - continued
3. Significant Accounting Policies - continued
Security Valuation - continued
(ADRs), futures contracts, Exchange-traded funds (ETFs) and certain indexes as well as quoted prices for similar securities are used and are categorized as Level 2 in the hierarchy in these circumstances. Utilizing these techniques may result in transfers between Level 1 and Level 2. For restricted equity securities and private placements where observable inputs are limited, assumptions about market activity and risk are used and are categorized as Level 3 in the hierarchy.
Investments in open-end mutual funds, including the Fidelity Central Funds, are valued at their closing net asset value each business day and are categorized as Level 1 in the hierarchy.
Foreign Currency. The Funds may use foreign currency contracts to facilitate transactions in foreign-denominated securities. Gains and losses from these transactions may arise from changes in the value of the foreign currency or if the counterparties do not perform under the contracts' terms.
Foreign-denominated assets, including investment securities, and liabilities are translated into U.S. dollars at the exchange rate at period end. Purchases and sales of investment securities, income and dividends received and expenses denominated in foreign currencies are translated into U.S. dollars at the exchange rate in effect on the transaction date.
The effects of exchange rate fluctuations on investments are included with the net realized and unrealized gain (loss) on investment securities. Other foreign currency transactions resulting in realized and unrealized gain (loss) are disclosed separately.
Investment Transactions and Income. For financial reporting purposes, the Funds' investment holdings and NAV include trades executed through the end of the last business day of the period. The NAV per share for processing shareholder transactions is calculated as of the close of business of the New York Stock Exchange (NYSE), normally 4:00 p.m. Eastern time and includes trades executed through the end of the prior business day. Gains and losses on securities sold are determined on the basis of identified cost. Dividend income is recorded on the ex-dividend date, except for certain dividends from foreign securities where the ex-dividend date may have passed, which are recorded as soon as the Funds are informed of the ex-dividend date. Non-cash dividends included in dividend income, if any, are recorded at the fair market value of the securities received. Distributions received on securities that represent a return of capital or capital gain are recorded as a reduction of cost of investments and/or as a realized gain. The Funds estimate the components of distributions received that may be considered return of capital distributions or capital gain distributions. Large, non-recurring dividends recognized by the Funds are presented separately on the Statement of Operations as
Annual Report
3. Significant Accounting Policies - continued
Investment Transactions and Income - continued
"Special Dividends" and the impact of these dividends is presented in the Financial Highlights. Interest income and distributions from the Fidelity Central Funds are accrued as earned. Interest income includes coupon interest and amortization of premium and accretion of discount on debt securities. Investment income is recorded net of foreign taxes withheld where recovery of such taxes is uncertain.
Expenses. Expenses directly attributable to a fund are charged to that fund. Expenses attributable to more than one fund are allocated among the respective funds on the basis of relative net assets or other appropriate methods. Expense estimates are accrued in the period to which they relate and adjustments are made when actual amounts are known.
Income Tax Information and Distributions to Shareholders. Each year, each Fund intends to qualify as a regulated investment company, including distributing substantially all of its taxable income and realized gains under Subchapter M of the Internal Revenue Code and filing its U.S. federal tax return. As a result, no provision for income taxes is required. As of October 31, 2011, each Fund did not have any unrecognized tax benefits in the financial statements. A fund's federal tax return is subject to examination by the Internal Revenue Service (IRS) for a period of three years. Foreign taxes are provided for based on each Fund's understanding of the tax rules and rates that exist in the foreign markets in which it invests. Fidelity Series International Growth Fund, and Fidelity Series International Small Cap Fund are subject to a tax imposed on realized short term capital gains on securities of certain issuers domiciled in India. An estimated deferred tax liability for net unrealized gains on these securities is included in Other payables and accrued expenses on the Statement of Assets & Liabilities.
Distributions are declared and recorded on the ex-dividend date. Income dividends and capital gain distributions are declared separately for each class. Income and capital gain distributions are determined in accordance with income tax regulations, which may differ from GAAP.
Capital accounts within the financial statements are adjusted for permanent book-tax differences. These adjustments have no impact on net assets or the results of operations. Temporary book-tax differences will reverse in a subsequent period.
Book-tax differences are primarily due to foreign currency transactions, certain foreign taxes, passive foreign investment companies (PFIC), partnerships,1 capital loss carryforwards, and losses deferred due to wash sales.
Annual Report
Notes to Financial Statements - continued
3. Significant Accounting Policies - continued
Income Tax Information and Distributions to Shareholders - continued
The federal tax cost of investment securities and unrealized appreciation (depreciation) as of period end were as follows for each Fund:
| Tax cost | Gross unrealized
appreciation | Gross unrealized
depreciation | Net unrealized
appreciation
(depreciation) on
securities and
other investments |
Fidelity Series Emerging Markets Fund | $ 5,088,939,573 | $ 386,605,171 | $ (501,901,065) | $ (115,295,894) |
Fidelity Series International Growth Fund | 7,070,774,694 | 689,983,550 | (349,387,009) | 340,596,541 |
Fidelity Series International Small Cap Fund | 1,594,808,540 | 165,973,327 | (113,924,597) | 52,048,730 |
Fidelity Series International Value Fund | 6,780,916,025 | 461,112,861 | (337,489,856) | 123,623,005 |
The tax-based components of distributable earnings as of period end were as follows for each Fund:
| Undistributed
ordinary
income | Undistributed
long-term
capital gain | Capital loss
carryforward | Net unrealized
appreciation
(depreciation) |
Fidelity Series Emerging Markets Fund | $ 33,778,339 | $ 152,064,089 | $ - | $ (115,374,239) |
Fidelity Series International Growth Fund | 84,911,160 | - | (155,978,028) | 340,622,181 |
Fidelity Series International Small Cap Fund | 14,131,539 | - | (9,938,109) | 52,021,273 |
Fidelity Series International Value Fund | 149,195,087 | - | (902,960,621) | 123,481,217 |
Annual Report
3. Significant Accounting Policies - continued
Income Tax Information and Distributions to Shareholders - continued
Under the recently enacted Regulated Investment Company Modernization Act of 2010 (the Act), the Funds will be permitted to carry forward capital losses incurred in taxable years beginning after December 22, 2010 for an unlimited period. However, any losses incurred during those future taxable years will be required to be utilized prior to any losses incurred in pre-enactment taxable years, which generally expire after eight years from when they are incurred. Additionally, post-enactment capital losses that are carried forward will retain their character as either short-term or long-term capital losses rather than being considered all short-term as under previous law. The Funds' first fiscal year end subject to the Act will be October 31, 2012.
The tax character of distributions paid was as follows:
October 31, 2011 | | | |
| Ordinary
Income | Long-term
Capital Gains | Total |
Fidelity Series Emerging Markets Fund | $ 65,102,939 | $ 61,559,932 | $ 126,662,871 |
Fidelity Series International Growth Fund | 29,959,620 | - | 29,959,620 |
Fidelity Series International Small Cap Fund | 14,316,862 | - | 14,316,862 |
Fidelity Series International Value Fund | 88,630,994 | - | 88,630,994 |
October 31, 2010 | | | |
| Ordinary
Income | Long-term
Capital Gains | Total |
Fidelity Series Emerging Markets Fund | $ 97,275,785 | $ - | $ 97,275,785 |
New Accounting Pronouncement. In May 2011, the Financial Accounting Standards Board issued Accounting Standard Update No. 2011-04, Fair Value Measurement (Topic 820) - Amendments to Achieve Common Fair Value Measurement and Disclosure Requirements in U.S. GAAP and IFRSs. The update changes the wording used to describe the requirements in GAAP for measuring fair value and for disclosing information about fair value measurements. The update is effective during interim and annual periods beginning after December 15, 2011. Management is currently evaluating the impact of the update's adoption on the Funds' financial statement disclosures.
4. Operating Policies.
Restricted Securities. The Funds may invest in securities that are subject to legal or contractual restrictions on resale. These securities generally may be resold in transactions exempt from registration or to the public if the securities are registered. Disposal of these securities may involve time-consuming negotiations and expense, and
Annual Report
Notes to Financial Statements - continued
4. Operating Policies - continued
Restricted Securities - continued
prompt sale at an acceptable price may be difficult. Information regarding restricted securities is included at the end of each applicable Fund's Schedule of Investments.
5. Purchases and Sales of Investments.
Purchases and sales of securities, other than short-term securities, are noted in the table below.
| Purchases ($) | Sales ($) |
Fidelity Series Emerging Markets Fund | 6,193,744,773 | 3,791,737,359 |
Fidelity Series International Growth Fund | 3,920,808,960 | 1,351,086,230 |
Fidelity Series International Small Cap Fund | 982,831,587 | 261,241,846 |
Fidelity Series International Value Fund | 7,525,772,641 | 4,630,736,976 |
6. Fees and Other Transactions with Affiliates.
Management Fee. FMR and its affiliates provide the Funds with investment management related services for which the Funds pay a monthly management fee. The management fee is the sum of an individual fund fee rate and a group fee rate. The individual fund fee rate is applied to each Fund's average net assets. The group fee rate is based upon the average net assets of all the mutual funds advised by FMR. The group fee rate decreases as assets under management increase and increases as assets under management decrease. In addition, the management fee for Fidelity Series International Growth Fund, Fidelity Series International Small Cap Fund and Fidelity Series International Value Fund is subject to a performance adjustment (up to a maximum ± .20% of each applicable Fund's average net assets over a 36 month performance period). The upward or downward adjustment to the management fee is based on each applicable Fund's relative investment performance of the asset-weighted return of all classes as compared to an appropriate benchmark index. Each applicable Fund's performance adjustment took effect in December 2010. Subsequent months will be added until the performance period includes 36 months.
For the period, each Fund's annual management fee rate expressed as a percentage of each Fund's average net assets, including the performance adjustment, if applicable, was as follows:
| Individual Rate | Group Rate | Total |
Fidelity Series Emerging Markets Fund | .55% | .26% | .81% |
Fidelity Series International Growth Fund | .45% | .26% | .74% |
Fidelity Series International Small Cap Fund | .60% | .26% | .86% |
Fidelity Series International Value Fund | .45% | .26% | .70% |
Annual Report
6. Fees and Other Transactions with Affiliates - continued
Transfer Agent Fees. Fidelity Investments Institutional Operations Company, Inc. (FIIOC), an affiliate of FMR, is the transfer, dividend disbursing and shareholder servicing agent for each class of the Funds. FIIOC receives account fees and asset-based fees that vary according to the account size and type of account of the shareholders of the respective classes of each Fund except for Class F. FIIOC receives no fees for providing transfer agency services to Class F. FIIOC pays for typesetting, printing and mailing of shareholder reports, except proxy statements. For the period, transfer agent fees for each class were as follows:
Fidelity Series Emerging Markets Fund | Amount | % of
Average
Net Assets |
Series Emerging Markets | $ 5,935,004 | .21 |
Fidelity Series International Growth Fund | | |
Series International Growth | $ 9,794,786 | .21 |
Fidelity Series International Small Cap Fund | | |
Series International Small Cap | $ 2,012,916 | .21 |
Fidelity Series International Value Fund | | |
Series International Value | $ 9,609,326 | .21 |
Accounting and Security Lending Fees. Fidelity Service Company, Inc. (FSC), an affiliate of FMR, maintains each Fund's accounting records. The accounting fee is based on the level of average net assets for the month. Under a separate contract, FSC administers the security lending program. The security lending fee is based on the number and duration of lending transactions.
Brokerage Commissions. Certain Funds placed a portion of their portfolio transactions with brokerage firms which are affiliates of the investment adviser. The commissions paid to these affiliated firms were as follows:
| Amount |
Fidelity Series Emerging Markets Fund | $ 4,195 |
Fidelity Series International Growth Fund | 8,675 |
Fidelity Series International Small Cap Fund | 4,277 |
Fidelity Series International Value Fund | 1,854 |
Annual Report
Notes to Financial Statements - continued
6. Fees and Other Transactions with Affiliates - continued
Interfund Lending Program. Pursuant to an Exemptive Order issued by the SEC, the Funds, along with other registered investment companies having management contracts with FMR, may participate in an interfund lending program. This program provides an alternative credit facility allowing the funds to borrow from, or lend money to, other participating affiliated funds. At period end there were no interfund loans outstanding. Each applicable fund's activity in this program during the period for which loans were outstanding was as follows:
| Borrower
or Lender | Average Daily Loan Balance | Weighted Average Interest Rate | Interest
Expense |
Fidelity Series Emerging Markets Fund | Borrower | $ 6,917,000 | .61% | $ 235 |
Fidelity Series International Value Fund | Borrower | 51,653,000 | .31% | 1,808 |
7. Committed Line of Credit.
Certain Funds participate with other funds managed by FMR or an affiliate in a $4.0 billion credit facility (the "line of credit") to be utilized for temporary or emergency purposes to fund shareholder redemptions or for other short-term liquidity purposes. The participating funds have agreed to pay commitment fees on their pro-rata portion of the line of credit, which are reflected in Miscellaneous expenses on the Statement of Operations, and are as follows:
Fidelity Series Emerging Markets Fund | $ 10,891 |
Fidelity Series International Growth Fund | 17,877 |
Fidelity Series International Small Cap Fund | 3,618 |
Fidelity Series International Value Fund | 17,614 |
During the period, there were no borrowings on this line of credit.
8. Security Lending.
Certain Funds lend portfolio securities through a lending agent from time to time in order to earn additional income. For equity securities, a lending agent is used and may loan securities to certain qualified borrowers, including Fidelity Capital Markets (FCM), a broker-dealer affiliated with the Funds. On the settlement date of the loan, each applicable Fund receives collateral (in the form of U.S. Treasury obligations, letters of credit and/or cash) against the loaned securities and maintains collateral in an amount not less than 100% of the market value of the loaned securities during the period of the loan. The market value of the loaned securities is determined at the close of business of
Annual Report
8. Security Lending - continued
the Funds and any additional required collateral is delivered to the Funds on the next business day. If the borrower defaults on its obligation to return the securities loaned because of insolvency or other reasons, a fund could experience delays and costs in recovering the securities loaned or in gaining access to the collateral. Any cash collateral received is invested in the Fidelity Securities Lending Cash Central Fund. The value of loaned securities and cash collateral at period end are disclosed on each applicable Fund's Statement of Assets and Liabilities. Security lending income represents the income earned on investing cash collateral, less rebates paid to borrowers and any lending agent fees associated with the loan, plus any premium payments received for lending certain types of securities. Security lending income is presented on each applicable Fund's Statement of Operations as a component of income from Fidelity Central Funds. Security lending activity as of and during the period was as follows:
| Total Security
Lending Income | Security Lending
Income From Securities Loaned to FCM |
Fidelity Series Emerging Markets Fund | $ 1,354,601 | $ - |
Fidelity Series International Growth Fund | 3,601,900 | 28 |
Fidelity Series International Small Cap Fund | 591,340 | 75 |
Fidelity Series International Value Fund | 7,084,349 | 512 |
9. Expense Reductions.
Many of the brokers with whom FMR places trades on behalf of certain Funds provided services to these Funds in addition to trade execution. These services included payments of expenses on behalf of each applicable Fund. In addition, through arrangements with each applicable Fund's custodian, credits realized as a result of uninvested cash balances were used to reduce the Fund's expenses. All of the applicable expense reductions are noted in the table below.
| Brokerage
Service reduction | Custody expense
reduction |
Fidelity Series Emerging Markets Fund | $ 1,982,868 | $ - |
Fidelity Series International Growth Fund | 946,455 | - |
Fidelity Series International Small Cap Fund | 178,132 | 47 |
Fidelity Series International Value Fund | 1,422,343 | - |
Annual Report
Notes to Financial Statements - continued
10. Distributions to Shareholders.
Distributions to shareholders of each class were as follows:
Years ended October 31, | 2011 | 2010A |
Fidelity Series Emerging Markets Fund | | |
From net investment income | | |
Series Emerging Markets | $ 12,963,515 | $ 4,872,057 |
Class F | 3,863,477 | 98,750 |
Total | $ 16,826,992 | $ 4,970,807 |
From net realized gain | | |
Series Emerging Markets | $ 89,686,359 | $ 90,721,075 |
Class F | 20,149,520 | 1,583,903 |
Total | $ 109,835,879 | $ 92,304,978 |
Fidelity Series International Growth Fund | | |
From net investment income | | |
Series International Growth | $ 20,001,889 | $ - |
Class F | 5,267,744 | - |
Total | $ 25,269,633 | $ - |
From net realized gain | | |
Series International Growth | $ 3,829,643 | $ - |
Class F | 860,344 | - |
Total | $ 4,689,987 | $ - |
Fidelity Series International Small Cap Fund | | |
From net investment income | | |
Series International Small Cap | $ 6,519,818 | $ - |
Class F | 1,672,862 | - |
Total | $ 8,192,680 | $ - |
From net realized gain | | |
Series International Small Cap | $ 5,000,638 | $ - |
Class F | 1,123,544 | - |
Total | $ 6,124,182 | $ - |
Fidelity Series International Value Fund | | |
From net investment income | | |
Series International Value | $ 55,879,024 | $ - |
Class F | 13,585,521 | - |
Total | $ 69,464,545 | $ - |
From net realized gain | | |
Series International Value | $ 15,652,284 | $ - |
Class F | 3,514,165 | - |
Total | $ 19,166,449 | $ - |
A Distributions for Fidelity Series International Growth Fund, Fidelity Series International Small Cap Fund and Fidelity Series International Value Fund are for the period December 3, 2009 to October 31, 2010.
Annual Report
11. Share Transactions.
Transactions for each class of shares were as follows:
| Shares | Dollars |
Years ended October 31, | 2011 | 2010A | 2011 | 2010A |
Fidelity Series Emerging Markets Fund | | | | |
Series Emerging Markets | | | | |
Shares sold | 110,983,487 | 79,991,131 | $ 1,927,221,177 | $ 1,291,962,481 |
Reinvestment of distributions | 5,501,065 | 5,955,958 | 102,649,874 | 95,593,132 |
Shares redeemed | (34,406,501) | (12,830,835) | (605,551,460) | (212,836,681) |
Net increase (decrease) | 82,078,051 | 73,116,254 | $ 1,424,319,591 | $ 1,174,718,932 |
Class F | | | | |
Shares sold | 70,265,019 | 23,518,400 | $ 1,219,851,930 | $ 387,691,188 |
Reinvestment of distributions | 1,285,492 | 104,773 | 24,012,997 | 1,682,653 |
Shares redeemed | (4,258,591) | (85,069) | (71,872,048) | (1,389,220) |
Net increase (decrease) | 67,291,920 | 23,538,104 | $ 1,171,992,879 | $ 387,984,621 |
Fidelity Series International Growth Fund | | | | |
Series International Growth | | | | |
Shares sold | 199,240,913 | 383,695,719 | $ 2,197,620,267 | $ 3,683,684,745 |
Reinvestment of distributions | 2,139,059 | - | 23,831,532 | - |
Shares redeemed | (89,024,200) | (21,469,620) | (974,623,034) | (207,462,670) |
Net increase (decrease) | 112,355,772 | 362,226,099 | $ 1,246,828,765 | $ 3,476,222,075 |
Class F | | | | |
Shares sold | 146,529,108 | 68,259,971 | $ 1,611,081,104 | $ 663,568,900 |
Reinvestment of distributions | 549,703 | - | 6,128,088 | - |
Shares redeemed | (10,293,869) | (49,565) | (110,003,185) | (474,637) |
Net increase (decrease) | 136,784,942 | 68,210,406 | $ 1,507,206,007 | $ 663,094,263 |
Annual Report
Notes to Financial Statements - continued
11. Share Transactions - continued
| Shares | Dollars |
Years ended October 31, | 2011 | 2010A | 2011 | 2010A |
Fidelity Series International Small Cap Fund | | | | |
Series International Small Cap | | | | |
Shares sold | 53,908,450 | 65,438,695 | $ 631,399,700 | $ 653,652,045 |
Reinvestment of distributions | 981,018 | - | 11,520,456 | - |
Shares redeemed | (17,761,732) | (3,884,942) | (206,339,970) | (39,646,565) |
Net increase (decrease) | 37,127,736 | 61,553,753 | $ 436,580,186 | $ 614,005,480 |
Class F | | | | |
Shares sold | 33,128,289 | 11,440,459 | $ 386,033,238 | $ 116,123,150 |
Reinvestment of distributions | 238,000 | - | 2,796,406 | - |
Shares redeemed | (2,098,084) | (17,513) | (23,840,363) | (172,450) |
Net increase (decrease) | 31,268,205 | 11,422,946 | $ 364,989,281 | $ 115,950,700 |
Fidelity Series International Value Fund | | | | |
Series International Value | | | | |
Shares sold | 234,577,356 | 412,641,187 | $ 2,316,609,509 | $ 3,772,955,102 |
Reinvestment of distributions | 7,268,202 | - | 71,531,308 | - |
Shares redeemed | (107,758,811) | (22,718,804) | (1,035,580,685) | (206,545,585) |
Net increase (decrease) | 134,086,747 | 389,922,383 | $ 1,352,560,132 | $ 3,566,409,517 |
Class F | | | | |
Shares sold | 165,152,487 | 73,576,238 | $ 1,606,189,266 | $ 673,595,109 |
Reinvestment of distributions | 1,734,189 | - | 17,099,686 | - |
Shares redeemed | (13,565,563) | (38,336) | (125,757,167) | (358,504) |
Net increase (decrease) | 153,321,113 | 73,537,902 | $ 1,497,531,785 | $ 673,236,605 |
A Share transactions for Fidelity Series International Growth Fund, Fidelity Series International Small Cap Fund and Fidelity Series International Value Fund are for the period December 3, 2009 to October 31, 2010.
Annual Report
12. Other.
The Funds' organizational documents provide former and current trustees and officers with a limited indemnification against liabilities arising in connection with the performance of their duties to the Funds. In the normal course of business, the Funds may also enter into contracts that provide general indemnifications. The Funds' maximum exposure under these arrangements is unknown as this would be dependent on future claims that may be made against the Funds. The risk of material loss from such claims is considered remote.
At the end of the period, mutual funds managed by FMR or an FMR affiliate were the owners of record of all of the outstanding shares of the Funds.
Annual Report
To the Trustees of Fidelity Investment Trust and Shareholders of Fidelity Series Emerging Markets Fund, Fidelity Series International Small Cap Fund, and Fidelity Series International Value Fund:
We have audited the accompanying statements of assets and liabilities of Fidelity Series Emerging Markets Fund, Fidelity Series International Small Cap Fund, and Fidelity Series International Value Fund (the Funds), each a fund of Fidelity Investment Trust, including the schedules of investments, as of October 31, 2011, the related statements of operations for the year then ended, the statements of changes in net assets and the financial highlights for each of the periods presented. These financial statements and financial highlights are the responsibility of the Funds' management. Our responsibility is to express an opinion on these financial statements and financial highlights based on our audits.
We conducted our audits in accordance with the standards of the Public Company Accounting Oversight Board (United States). Those standards require that we plan and perform the audit to obtain reasonable assurance about whether the financial statements and financial highlights are free of material misstatement. The Funds are not required to have, nor were we engaged to perform, an audit of their internal control over financial reporting. Our audits included consideration of internal control over financial reporting as a basis for designing audit procedures that are appropriate in the circumstances, but not for the purpose of expressing an opinion on the effectiveness of the Funds' internal control over financial reporting. Accordingly, we express no such opinion. An audit also includes examining, on a test basis, evidence supporting the amounts and disclosures in the financial statements, assessing the accounting principles used and significant estimates made by management, as well as evaluating the overall financial statement presentation. Our procedures included confirmation of securities owned as of October 31, 2011, by correspondence with the custodians and brokers; where replies were not received from brokers, we performed other auditing procedures. We believe that our audits provide a reasonable basis for our opinion.
In our opinion, the financial statements and financial highlights referred to above present fairly, in all material respects, the financial position of Fidelity Series Emerging Markets Fund, Fidelity Series International Small Cap Fund, and Fidelity Series International Value Fund as of October 31, 2011, the results of their operations for the year then ended, the changes in their net assets and their financial highlights for each of the periods presented, in conformity with accounting principles generally accepted in the United States of America.
DELOITTE & TOUCHE LLP
Boston, Massachusetts
December 15, 2011
Annual Report
Report of Independent Registered Public Accounting Firm
To the Trustees of Fidelity Investment Trust and the Shareholders of Fidelity Series International Growth Fund:
In our opinion, the accompanying statement of assets and liabilities, including the schedule of investments, and the related statements of operations and of changes in net assets and the financial highlights present fairly, in all material respects, the financial position of Fidelity Series International Growth Fund (a fund of Fidelity Investment Trust) at October 31, 2011, the results of its operations for the year then ended, the changes in its net assets for each of the periods indicated and the financial highlights for each of the periods indicated, in conformity with accounting principles generally accepted in the United States of America. These financial statements and financial highlights (hereafter referred to as "financial statements") are the responsibility of the Fidelity Series International Growth Fund's management. Our responsibility is to express an opinion on these financial statements based on our audits. We conducted our audits of these financial statements in accordance with the standards of the Public Company Accounting Oversight Board (United States). Those standards require that we plan and perform the audit to obtain reasonable assurance about whether the financial statements are free of material misstatement. An audit includes examining, on a test basis, evidence supporting the amounts and disclosures in the financial statements, assessing the accounting principles used and significant estimates made by management, and evaluating the overall financial statement presentation. We believe that our audits, which included confirmation of securities at October 31, 2011 by correspondence with the custodian and brokers, provide a reasonable basis for our opinion.
PricewaterhouseCoopers LLP
Boston, Massachusetts
December 15, 2011
Annual Report
The Trustees, Members of the Advisory Board, and executive officers of the trust and funds, as applicable, are listed below. The Board of Trustees governs each fund and is responsible for protecting the interests of shareholders. The Trustees are experienced executives who meet periodically throughout the year to oversee each fund's activities, review contractual arrangements with companies that provide services to each fund, oversee management of the risks associated with such activities and contractual arrangements, and review each fund's performance. Except for James C. Curvey, each of the Trustees oversees 226 funds advised by FMR or an affiliate. Mr. Curvey oversees 429 funds advised by FMR or an affiliate.
The Trustees hold office without limit in time except that (a) any Trustee may resign; (b) any Trustee may be removed by written instrument, signed by at least two-thirds of the number of Trustees prior to such removal; (c) any Trustee who requests to be retired or who has become incapacitated by illness or injury may be retired by written instrument signed by a majority of the other Trustees; and (d) any Trustee may be removed at any special meeting of shareholders by a two-thirds vote of the outstanding voting securities of the trust. Each Trustee who is not an interested person (as defined in the 1940 Act) (Independent Trustee), shall retire not later than the last day of the calendar year in which his or her 75th birthday occurs. The Independent Trustees may waive this mandatory retirement age policy with respect to individual Trustees. The executive officers and Advisory Board Members hold office without limit in time, except that any officer and Advisory Board Member may resign or may be removed by a vote of a majority of the Trustees at any regular meeting or any special meeting of the Trustees. Except as indicated, each individual has held the office shown or other offices in the same company for the past five years.
Experience, Skills, Attributes, and Qualifications of the Funds' Trustees. The Governance and Nominating Committee has adopted a statement of policy that describes the experience, qualifications, attributes, and skills that are necessary and desirable for potential Independent Trustee candidates (Statement of Policy). The Board believes that each Trustee satisfied at the time he or she was initially elected or appointed a Trustee, and continues to satisfy, the standards contemplated by the Statement of Policy. The Governance and Nominating Committee also engages professional search firms to help identify potential Independent Trustee candidates who have the experience, qualifications, attributes, and skills consistent with the Statement of Policy. From time to time, additional criteria based on the composition and skills of the current Independent Trustees, as well as experience or skills that may be appropriate in light of future changes to board composition, business conditions, and regulatory or other developments, have also been considered by the professional search firms and the Governance and Nominating Committee. In addition, the Board takes into account the Trustees' commitment and participation in Board and committee meetings, as well as their leadership of standing and ad hoc committees throughout their tenure.
In determining that a particular Trustee was and continues to be qualified to serve as a Trustee, the Board has considered a variety of criteria, none of which, in isolation, was controlling. The Board believes that, collectively, the Trustees have balanced and diverse experience, qualifications, attributes, and skills, which allow the Board to operate effectively in governing each fund and protecting the interests of shareholders. Information about the specific experience, skills, attributes, and qualifications of each Trustee, which in each case led to the Board's conclusion that the Trustee should serve (or continue to serve) as a trustee of the funds, is provided below.
Annual Report
Trustees and Officers - continued
Board Structure and Oversight Function. James C. Curvey is an interested person (as defined in the 1940 Act) and currently serves as Acting Chairman. The Trustees have determined that an interested Chairman is appropriate and benefits shareholders because an interested Chairman has a personal and professional stake in the quality and continuity of services provided to the funds. Independent Trustees exercise their informed business judgment to appoint an individual of their choosing to serve as Chairman, regardless of whether the Trustee happens to be independent or a member of management. The Independent Trustees have determined that they can act independently and effectively without having an Independent Trustee serve as Chairman and that a key structural component for assuring that they are in a position to do so is for the Independent Trustees to constitute a substantial majority for the Board. The Independent Trustees also regularly meet in executive session. Ned C. Lautenbach serves as Chairman of the Independent Trustees and as such (i) acts as a liaison between the Independent Trustees and management with respect to matters important to the Independent Trustees and (ii) with management prepares agendas for Board meetings.
Fidelity funds are overseen by different Boards of Trustees. The funds' Board oversees Fidelity's equity and high income funds and another Board oversees Fidelity's investment-grade bond, money market, and asset allocation funds. The asset allocation funds may invest in Fidelity funds overseen by the funds' Board. The use of separate Boards, each with its own committee structure, allows the Trustees of each group of Fidelity funds to focus on the unique issues of the funds they oversee, including common research, investment, and operational issues. On occasion, the separate Boards establish joint committees to address issues of overlapping consequences for the Fidelity funds overseen by each Board.
The Trustees operate using a system of committees to facilitate the timely and efficient consideration of all matters of importance to the Trustees, each fund, and fund shareholders and to facilitate compliance with legal and regulatory requirements and oversight of the funds' activities and associated risks. The Board, acting through its committees, has charged FMR and its affiliates with (i) identifying events or circumstances the occurrence of which could have demonstrably adverse effects on the funds' business and/or reputation; (ii) implementing processes and controls to lessen the possibility that such events or circumstances occur or to mitigate the effects of such events or circumstances if they do occur; and (iii) creating and maintaining a system designed to evaluate continuously business and market conditions in order to facilitate the identification and implementation processes described in (i) and (ii) above. Because the day-to-day operations and activities of the funds are carried out by or through FMR, its affiliates and other service providers, the funds' exposure to risks is mitigated but not eliminated by the processes overseen by the Trustees. While each of the Board's committees has responsibility for overseeing different aspects of the funds' activities, oversight is exercised primarily through the Operations, Audit, and Compliance Committees. In addition, the Independent Trustees have worked with FMR to enhance the Board's oversight of investment and financial risks, legal and regulatory risks, technology risks, and operational risks, including the development of additional risk reporting to the Board. For example, a working group comprised of Independent Trustees and FMR has worked and continues to work to review the Fidelity funds' valuation-related activities, reporting and risk management. Appropriate personnel, including but not limited to the funds' Chief Compliance Officer (CCO), FMR's internal auditor, the independent accountants, the funds' Treasurer and portfolio management personnel, make periodic reports to the Board's committees, as appropriate, including an annual review of FMR's risk management program for the Fidelity funds. The responsibilities of each standing committee, including their oversight responsibilities, are described further under "Standing Committees of the Funds' Trustees."
Annual Report
The funds' Statement of Additional Information (SAI) includes more information about the Trustees. To request a free copy, call Fidelity at 1-800-544-8544 for Series Class or 1-800-835-5092 for Class F.
Interested Trustees*:
Correspondence intended for each Trustee who is an interested person may be sent to Fidelity Investments, 82 Devonshire Street, Boston, Massachusetts 02109.
Name, Age; Principal Occupations and Other Relevant Experience+ |
James C. Curvey (76) |
| Year of Election or Appointment: 2007 Mr. Curvey is Trustee and Acting Chairman of the Board of Trustees of certain Trusts. Mr. Curvey also serves as Trustee (2007-present) of other investment companies advised by FMR. Mr. Curvey is a Director of Fidelity Investments Money Management, Inc. (2009-present), Director of Fidelity Research & Analysis Co. (2009-present) and Director of FMR and FMR Co., Inc. (2007-present). Mr. Curvey is also Vice Chairman (2007-present) and Director of FMR LLC. In addition, Mr. Curvey serves as an Overseer for the Boston Symphony Orchestra and a member of the Trustees of Villanova University. Previously, Mr. Curvey was the Vice Chairman (2006-2007) and Director (2000-2007) of FMR Corp. |
Ronald P. O'Hanley (54) |
| Year of Election or Appointment: 2011 Mr. O'Hanley is Director of FMR Co., Inc. (2010-present), Director of Fidelity Investments Money Management, Inc. (2010-present), Director of Fidelity Research & Analysis Company (2010-present), President of Fidelity Asset Management and Corporate Services and a member of Fidelity's Executive Committee (2010-present). Previously, Mr. O'Hanley served as President and Chief Executive Officer of BNY Mellon Asset Management (2007-2010). Mr. O'Hanley also served as Vice Chairman of Bank New York Mellon Corp. and a member of that firm's Executive Committee. Prior to the 2007 merger of The Bank of New York and Mellon Financial Corporation, he was Vice Chairman of Mellon Financial Corporation and President and Chief Executive Officer of Mellon Asset Management. He joined Mellon in February 1997. Mr. O'Hanley currently serves as Chairman of the Boston Public Library Foundation Board of Directors and sits on the Board of Directors of Beth Israel Deaconess Medical Center, the Board of Trustees of the Marine Biological Laboratory and the Advisory Board of the Maxwell School of Citizenship and Public Administration at Syracuse University. Mr. O'Hanley also chairs the Council on Asset Management for the Financial Services Roundtable and is a member of the Board of Directors of Institutional Investor's U.S. Institute. |
* Trustees have been determined to be "Interested Trustees" by virtue of, among other things, their affiliation with the trusts or various entities under common control with FMR.
+ The information above includes each Trustee's principal occupation during the last five years and other information relating to the experience, attributes, and skills relevant to each Trustee's qualifications to serve as a Trustee, which led to the conclusion that each Trustee should serve as a Trustee for each fund.
Annual Report
Independent Trustees:
Correspondence intended for each Independent Trustee (that is, the Trustees other than the Interested Trustees) may be sent to Fidelity Investments, P.O. Box 55235, Boston, Massachusetts 02205-5235.
Name, Age; Principal Occupations and Other Relevant Experience+ |
Dennis J. Dirks (63) |
| Year of Election or Appointment: 2005 Prior to his retirement in May 2003, Mr. Dirks was Chief Operating Officer and a member of the Board of The Depository Trust & Clearing Corporation (DTCC). He also served as President, Chief Operating Officer, and Board member of The Depository Trust Company (DTC) and President and Board member of the National Securities Clearing Corporation (NSCC). In addition, Mr. Dirks served as Chief Executive Officer and Board member of the Government Securities Clearing Corporation, Chief Executive Officer and Board member of the Mortgage-Backed Securities Clearing Corporation, as a Trustee and a member of the Finance Committee of Manhattan College (2005-2008), and as a Trustee and a member of the Finance Committee of AHRC of Nassau County (2006-2008). Mr. Dirks is a member of the Independent Directors Council (IDC) Governing Council (2010-Present) and Board of Directors for The Brookville Center for Children's Services, Inc. (2009-present). |
Alan J. Lacy (58) |
| Year of Election or Appointment: 2008 Mr. Lacy serves as Senior Adviser (2007-present) of Oak Hill Capital Partners, L.P. (private equity). Mr. Lacy also served as Chief Executive Officer (2000-2005) and Vice Chairman (2005-2006) of Sears Holdings Corporation and Sears, Roebuck and Co. (retail). In addition, Mr. Lacy serves as a member of the Board of Directors of Dave & Buster's, Inc. (restaurant and entertainment complexes, 2010-present), The Hillman Companies, Inc. (hardware wholesalers, 2010-present), and Bristol-Myers Squibb Company (global pharmaceuticals, 2007-present). Mr. Lacy is a member of the Board of Trustees of The National Parks Conservation Association (2006-Present). Previously, Mr. Lacy served as Chairman of the Board of Trustees of the National Parks Conservation Association (2008-2011) and as a member of the Board of Directors for the Western Union Company (global money transfer, 2006-2011). |
Ned C. Lautenbach (67) |
| Year of Election or Appointment: 2000 Mr. Lautenbach is Chairman of the Independent Trustees of the Equity and High Income Funds (2006-present). Mr. Lautenbach currently serves as the Lead Director of the Eaton Corporation Board of Directors (diversified industrial, 1997-present). Mr. Lautenbach is also a member of the Board of Directors of the Philharmonic Center for the Arts in Naples, Florida (1999-present); a member of the Board of Trustees of Fairfield University (2005-present); and a member of the Council on Foreign Relations (1994-present). Previously, Mr. Lautenbach was a Partner/Advisory Partner at Clayton, Dubilier & Rice, LLC (private equity investment, 1998-2010), as well as a Director of Sony Corporation (2006-2007). |
Joseph Mauriello (67) |
| Year of Election or Appointment: 2008 Prior to his retirement in January 2006, Mr. Mauriello served in numerous senior management positions including Deputy Chairman and Chief Operating Officer (2004-2005), and Vice Chairman of Financial Services (2002-2004) of KPMG LLP US (professional services, 1965-2005). Mr. Mauriello currently serves as a member of the Board of Directors of XL Group plc. (global insurance and re-insurance, 2006-present) and of Arcadia Resources Inc. (health care services and products, 2007-present). Previously, Mr. Mauriello served as a Director of the Hamilton Funds of the Bank of New York (2006-2007). |
Robert W. Selander (61) |
| Year of Election or Appointment: 2011 Previously, Mr. Selander served as a Member of the Advisory Board of Fidelity's Equity and High Income Funds (2011), Executive Vice Chairman (2010), Chief Executive Officer (2009-2010), and President and Chief Executive Officer (1997-2009) of Mastercard, Inc. |
Cornelia M. Small (67) |
| Year of Election or Appointment: 2005 Ms. Small is a member of the Board of Directors of the Teagle Foundation (2009-present). Ms. Small is also a member of the Investment Committee, and Chair (2008-present) and a member of the Board of Trustees of Smith College. In addition, Ms. Small serves on the Investment Committee of the Berkshire Taconic Community Foundation (2008-present). Previously, Ms. Small served as Chairperson of the Investment Committee (2002-2008) of Smith College. In addition, Ms. Small served as Chief Investment Officer, Director of Global Equity Investments, and a member of the Board of Directors of Scudder, Stevens & Clark and Scudder Kemper Investments. |
William S. Stavropoulos (72) |
| Year of Election or Appointment: 2001 Mr. Stavropoulos is Vice Chairman of the Independent Trustees of the Equity and High Income Funds (2006-present). Mr. Stavropoulos serves as President and Founder of the Michigan Baseball Foundation, the Great Lakes Loons (2007-present). Mr. Stavropoulos is Chairman Emeritus of the Board of Directors of The Dow Chemical Company, where he previously served in numerous senior management positions, including President, CEO (1995-2000; 2002-2004), Chairman of the Executive Committee (2000-2006), and as a member of the Board of Directors (1990-2006). Currently, Mr. Stavropoulos is Chairman of Univar (global distributor of commodity and specialty chemicals, 2010-present), a Director of Teradata Corporation (data warehousing and technology solutions, 2008-present), Chemical Financial Corporation, Maersk Inc. (industrial conglomerate), Tyco International, Inc. (multinational manufacturing and services, 2007-present), and a member of the Advisory Board for Metalmark Capital (private equity investment, 2005-present). Mr. Stavropoulos is a special advisor to Clayton, Dubilier & Rice, LLC (private equity investment). In addition, Mr. Stavropoulos is a member of the University of Notre Dame Advisory Council for the College of Science. |
David M. Thomas (62) |
| Year of Election or Appointment: 2008 Previously, Mr. Thomas served as Executive Chairman (2005-2006) and Chairman and Chief Executive Officer (2000-2005) of IMS Health, Inc. (pharmaceutical and healthcare information solutions). In addition, Mr. Thomas serves as a member of the Board of Directors of Fortune Brands, Inc. (consumer products), and Interpublic Group of Companies, Inc. (marketing communication, 2004-present). |
Michael E. Wiley (61) |
| Year of Election or Appointment: 2008 Mr. Wiley also serves as a Director of Asia Pacific Exploration Consolidated (international oil and gas exploration and production, 2008-present). Mr. Wiley serves as a Director of Tesoro Corporation (independent oil refiner and marketer, 2005-present), and a Director of Bill Barrett Corporation (exploration and production, 2005-present). In addition, Mr. Wiley also serves as a Director of Post Oak Bank (privately-held bank, 2004-present). Previously, Mr. Wiley served as a member of the Board of Trustees of the University of Tulsa (2000-2006; 2007-2010), as a Senior Energy Advisor of Katzenbach Partners, LLC (consulting, 2006-2007), as an Advisory Director of Riverstone Holdings (private investment), Chairman, President, and CEO of Baker Hughes, Inc. (oilfield services, 2000-2004), and as Director of Spinnaker Exploration Company (exploration and production, 2001-2005). |
Annual Report
Trustees and Officers - continued
+ The information above includes each Trustee's principal occupation during the last five years and other information relating to the experience, attributes, and skills relevant to each Trustee's qualifications to serve as a Trustee, which led to the conclusion that each Trustee should serve as a Trustee for each fund.
Advisory Board Members and Executive Officers:
Correspondence intended for each executive officer, Edward C. Johnson 3d, and Peter S. Lynch may be sent to Fidelity Investments, 82 Devonshire Street, Boston, Massachusetts 02109.
Name, Age; Principal Occupation |
Edward C. Johnson 3d (81) |
| Year of Election or Appointment: 2011 Member of the Advisory Board of Fidelity's Equity and High Income Funds. Mr. Johnson serves as Chief Executive Officer, Chairman, and a Director of FMR LLC, and also serves as Chairman and Director of FIL Limited. Previously, Mr. Johnson served as a Trustee and Chairman of the Board of certain Fidelity Trusts, Chairman and a Director of FMR, Chairman and a Director of FMR Co., Inc., and President of FMR LLC (2006-2007). |
Peter S. Lynch (67) |
| Year of Election or Appointment: 2003 Member of the Advisory Board of Fidelity's Equity and High Income Funds. Mr. Lynch is Vice Chairman and a Director of FMR and FMR Co., Inc. In addition, Mr. Lynch serves as a Trustee of Boston College and as the Chairman of the Inner-City Scholarship Fund. Previously, Mr. Lynch served on the Special Olympics International Board of Directors (1997-2006). |
Kenneth B. Robins (42) |
| Year of Election or Appointment: 2008 President and Treasurer of Fidelity's Equity and High Income Funds. Mr. Robins also serves as President and Treasurer (2010-present) and Assistant Treasurer (2009-present) of other Fidelity funds and is an employee of Fidelity Investments (2004-present). Previously, Mr. Robins served as Deputy Treasurer of the Fidelity funds (2005-2008) and Treasurer and Chief Financial Officer of The North Carolina Capital Management Trust: Cash and Term Portfolios (2006-2008). |
Bruce T. Herring (46) |
| Year of Election or Appointment: 2006 Vice President of certain Equity Funds. Mr. Herring also serves as Chief Investment Officer and Director of Fidelity Management & Research (U.K.) Inc. (2010-present) and Group Chief Investments Officer of FMR. Previously, Mr. Herring served as Vice President (2005-2006) and Senior Vice President (2006-2007) of Fidelity Management & Research Company, Vice President of FMR Co., Inc. (2001-2007) and as a portfolio manager for Fidelity U.S. Equity Funds. |
Brian B. Hogan (47) |
| Year of Election or Appointment: 2009 Vice President of Equity and High Income Funds. Mr. Hogan also serves as President of FMR's Equity Division (2009-present). Previously, Mr. Hogan served as Senior Vice President, Equity Research of FMR (2006-2009) and as a portfolio manager. |
Scott C. Goebel (43) |
| Year of Election or Appointment: 2008 Secretary and Chief Legal Officer (CLO) of the Fidelity funds. Mr. Goebel also serves as Secretary of Fidelity Investments Money Management, Inc. (FIMM) (2010-present) and Fidelity Research and Analysis Company (FRAC) (2010-present); Secretary and CLO of The North Carolina Capital Management Trust: Cash and Term Portfolios (2008-present); General Counsel, Secretary, and Senior Vice President of FMR (2008-present) and FMR Co., Inc. (2008-present); employed by FMR LLC or an affiliate (2001-present); Chief Legal Officer of Fidelity Management & Research (Hong Kong) Limited (2008-present) and Assistant Secretary of Fidelity Management & Research (Japan) Inc. (2008-present), and Fidelity Management & Research (U.K.) Inc. (2008-present). Previously, Mr. Goebel served as Assistant Secretary of FIMM (2008-2010), FRAC (2008-2010), and the Funds (2007-2008) and as Vice President and Secretary of Fidelity Distributors Corporation (FDC) (2005-2007). |
William C. Coffey (42) |
| Year of Election or Appointment: 2009 Assistant Secretary of Fidelity's Equity and High Income Funds. Mr. Coffey also serves as Senior Vice President and Deputy General Counsel of FMR LLC (2010-present), and is an employee of Fidelity Investments. Previously, Mr. Coffey served as Vice President and Associate General Counsel of FMR LLC (2005-2009). |
Holly C. Laurent (57) |
| Year of Election or Appointment: 2008 Anti-Money Laundering (AML) Officer of the Fidelity funds. Ms. Laurent also serves as AML Officer of The North Carolina Capital Management Trust: Cash and Term Portfolios (2008-present) and is an employee of Fidelity Investments. Previously, Ms. Laurent was Senior Vice President and Head of Legal for Fidelity Business Services India Pvt. Ltd. (2006-2008), and Senior Vice President, Deputy General Counsel and Group Head for FMR LLC (2005-2006). |
Christine Reynolds (53) |
| Year of Election or Appointment: 2008 Chief Financial Officer of the Fidelity funds. Ms. Reynolds became President of Fidelity Pricing and Cash Management Services (FPCMS) in August 2008. Ms. Reynolds served as Chief Operating Officer of FPCMS (2007-2008). Previously, Ms. Reynolds served as President, Treasurer, and Anti-Money Laundering officer of the Fidelity funds (2004-2007). |
Kenneth A. Rathgeber (64) |
| Year of Election or Appointment: 2004 Chief Compliance Officer of Fidelity's Equity and High Income Funds. Mr. Rathgeber is Chief Compliance Officer of Fidelity Management & Research (Hong Kong) Limited (2008-present), Fidelity Management & Research (Japan) Inc. (2008-present), FMR (2005-present), FMR Co., Inc. (2005-present), Fidelity Management & Research (U.K.) Inc. (2005-present), Fidelity Research & Analysis Company (2005-present), Fidelity Investments Money Management, Inc. (2005-present), Pyramis Global Advisors, LLC (2005-present), and Strategic Advisers, Inc. (2005-present). |
Jeffrey S. Christian (50) |
| Year of Election or Appointment: 2009 Deputy Treasurer of the Fidelity funds. Mr. Christian is an employee of Fidelity Investments. Previously, Mr. Christian served as Chief Financial Officer (2008-2009) of certain Fidelity funds and Senior Vice President of Fidelity Pricing and Cash Management Services (FPCMS) (2004-2009). |
Joseph F. Zambello (54) |
| Year of Election or Appointment: 2011 Deputy Treasurer of the Fidelity funds. Mr. Zambello is an employee of Fidelity Investments. Previously, Mr. Zambello served as Vice President of FMR's Program Management Group (2009-2011) and Vice President of the Transfer Agent Oversight Group (2005-2009). |
Adrien E. Deberghes (44) |
| Year of Election or Appointment: 2008 Deputy Treasurer of Fidelity's Equity and High Income Funds. Mr. Deberghes also serves as Vice President and Assistant Treasurer of Fidelity Rutland Square Trust II and Fidelity Commonwealth Trust II (2011-present), Assistant Treasurer of other Fidelity funds (2010-present), and is an employee of Fidelity Investments (2008-present). Previously, Mr. Deberghes served as Senior Vice President of Mutual Fund Administration at State Street Corporation (2007-2008), Senior Director of Mutual Fund Administration at Investors Bank & Trust (2005-2007), and Director of Finance for Dunkin' Brands (2000-2005). |
Stephanie J. Dorsey (42) |
| Year of Election or Appointment: 2010 Assistant Treasurer of Fidelity's Equity and High Income Funds. Ms. Dorsey also serves as Deputy Treasurer of other Fidelity funds (2008-present) and is an employee of Fidelity Investments (2008-present). Previously, Ms. Dorsey served as Treasurer (2004-2008) of the JPMorgan Mutual Funds and Vice President (2004-2008) of JPMorgan Chase Bank. |
John R. Hebble (53) |
| Year of Election or Appointment: 2009 Assistant Treasurer of Fidelity's Equity and High Income Funds. Mr. Hebble also serves as President (2011-present), Treasurer, and Chief Financial Officer of The North Carolina Capital Management Trust: Cash and Term Portfolios (2008-present), President and Treasurer of other Fidelity funds (2008-present) and is an employee of Fidelity Investments. |
Gary W. Ryan (53) |
| Year of Election or Appointment: 2005 Assistant Treasurer of the Fidelity funds. Mr. Ryan is an employee of Fidelity Investments. Previously, Mr. Ryan served as Vice President of Fund Reporting in Fidelity Pricing and Cash Management Services (FPCMS) (1999-2005). |
Jonathan Davis (43) |
| Year of Election or Appointment: 2010 Assistant Treasurer of the Fidelity funds. Mr. Davis is also Assistant Treasurer of Fidelity Rutland Square Trust II and Fidelity Commonwealth Trust II. Mr. Davis is an employee of Fidelity Investments. Previously, Mr. Davis served as Vice President and Associate General Counsel of FMR LLC (2003-2010). |
Annual Report
The Board of Trustees of each fund voted to pay to shareholders of record at the opening of business on record date, the following distributions per share derived from capital gains realized from sales of portfolio securities, and dividends derived from net investment income:
Fund | Pay Date | Record Date | Dividends | Capital Gains |
Series Emerging Markets | 12/12/11 | 12/09/11 | $0.093 | $0.519 |
Class F | 12/12/11 | 12/09/11 | $0.124 | $0.519 |
Series International Growth | 12/12/11 | 12/09/11 | $0.115 | $0.007 |
Class F | 12/12/11 | 12/09/11 | $0.140 | $0.007 |
Series International Small Cap | 12/12/11 | 12/09/11 | $0.106 | $0.009 |
Class F | 12/12/11 | 12/09/11 | $0.128 | $0.009 |
Series International Value | 12/12/11 | 12/09/11 | $0.224 | $0.000 |
Class F | 12/12/11 | 12/09/11 | $0.242 | $0.000 |
A percentage of the dividends distributed during the fiscal year for the following funds qualifies for the dividends-received deduction for corporate shareholders
Fund | December 30, 2010 |
Series Emerging Markets | 0% |
Class F | 0% |
Series International Growth | 12% |
Class F | 12% |
Series International Small Cap | 0% |
Class F | 0% |
Series International Value | 0% |
Class F | 0% |
A percentage of the dividends distributed during the fiscal year for the following funds may be taken into account as a dividend for purposes of the maximum rate under section 1(h)(11) of the Internal Revenue Code.
Fund | December 10, 2010 | December 30, 2010 |
Series Emerging Markets | 36% | 0% |
Class F | 33% | 0% |
Series International Growth | 100% | 100% |
Class F | 100% | 100% |
Series International Small Cap | 51% | 100% |
Class F | 45% | 100% |
Series International Value | 60% | 71% |
Class F | 55% | 71% |
Annual Report
The funds hereby designate as capital gain dividend the amounts noted below for the taxable year ended October 31, 2011, or, if subsequently determined to be different, the net capital gain of such year.
Fund |
|
Fidelity Series Emerging Markets Fund | $152,471,677 |
The fund will notify shareholders in January 2012 of amounts for use in preparing 2011 income tax returns.
Annual Report
Board Approval of Investment Advisory Contracts and Management Fees
Fidelity Series Emerging Markets Fund
Fidelity Series International Growth Fund
Fidelity Series International Small Cap Fund
Fidelity Series International Value Fund
Each year, the Board of Trustees, including the Independent Trustees (together, the Board), votes on the renewal of the management contract and sub-advisory agreements (together, the Advisory Contracts) for each fund. The Board, assisted by the advice of fund counsel and Independent Trustees' counsel, requests and considers a broad range of information relevant to the renewal of the Advisory Contracts throughout the year.
The Board meets regularly and considers at each of its meetings factors that are relevant to its annual consideration of the renewal of each fund's Advisory Contracts, including the services and support provided to each fund and its shareholders. The Board has established various standing committees, each composed of Independent Trustees with varying backgrounds, to which the Board has assigned specific subject matter responsibilities in order to enhance effective decision-making by the Board. The Board, acting directly and through its Committees, requests and receives information concerning the annual consideration of the renewal of each fund's Advisory Contracts. The Board also meets as needed to consider matters specifically related to the Board's annual consideration of the renewal of Advisory Contracts. Members of the Board may also meet with trustees of other Fidelity funds through ad hoc joint committees to discuss certain matters relevant to the Fidelity funds.
At its July 2011 meeting, the Board of Trustees, including the Independent Trustees, unanimously determined to renew each fund's Advisory Contracts. In reaching its determination, the Board considered all factors it believed relevant, including (i) the nature, extent, and quality of the services to be provided to each fund and its shareholders (including the investment performance of each fund); (ii) the competitiveness of each fund's management fee and total expense ratio; (iii) the total costs of the services to be provided by and the profits to be realized by Fidelity from its relationship with each fund; (iv) the extent to which economies of scale would be realized as each fund grows; and (v) whether fee levels reflect these economies of scale, if any, for the benefit of fund shareholders.
In considering whether to renew the Advisory Contracts for each fund, the Board reached a determination, with the assistance of fund counsel and Independent Trustees' counsel and through the exercise of its business judgment, that the renewal of the Advisory Contracts is in the best interests of each fund and its shareholders and that the compensation payable under the Advisory Contracts is fair and reasonable. The Board's decision to renew the Advisory Contracts was not based on any single factor, but rather was based on a comprehensive consideration of all the information provided to the Board at its meetings throughout the year. The Board, in reaching its determination to renew the Advisory Contracts, is aware that shareholders in each fund have a broad range of investment choices available to them, including a wide choice among mutual funds offered by Fidelity's competitors, and that each fund's shareholders, who have the opportunity to review and weigh the disclosure provided by the fund in its prospectus and other public disclosures, have chosen to invest in that fund, managed by Fidelity.
Annual Report
Nature, Extent, and Quality of Services Provided. The Board considered the staffing within the investment adviser, FMR, and the sub-advisers (together, the Investment Advisers), including the backgrounds of the funds' investment personnel and the funds' investment objectives and disciplines. The Independent Trustees also had discussions with senior management of Fidelity's investment operations and investment groups. The Board considered the structure of the portfolio manager compensation program and whether this structure provides appropriate incentives to act in the best interests of each fund.
Resources Dedicated to Investment Management and Support Services. The Board and the Fund Oversight and Research Committees reviewed the general qualifications and capabilities of the Investment Advisers' investment staff, including its size, education, experience, and resources, as well as the Investment Advisers' approach to recruiting, training, managing, and compensating investment personnel. The Board also noted that FMR has devoted increased resources to non-U.S. offices. The Board noted that Fidelity's analysts have extensive resources, tools and capabilities which allow them to conduct sophisticated quantitative and fundamental analysis, as well as credit analysis of issuers, counterparties and enhancers. The Board also believes that Fidelity's investment professionals have sufficient access to global information and data so as to provide competitive investment results over time, and that those professionals also have access to sophisticated tools which permit them to assess portfolio construction and risk and performance attribution characteristics continuously, as well as to transmit new information and research conclusions rapidly around the world. Additionally, in their deliberations, the Board considered the Investment Advisers' trading capabilities and resources which are an integral part of the investment management process.
Shareholder and Administrative Services. The Board considered (i) the nature, extent, quality, and cost of advisory, administrative, and shareholder services performed by the Investment Advisers and their affiliates under the Advisory Contracts and under separate agreements covering transfer agency, pricing and bookkeeping, and securities lending services for each fund; (ii) the nature and extent of the investment adviser's supervision of third party service providers, principally custodians and subcustodians; and (iii) the resources devoted to, and the record of compliance with, each fund's compliance policies and procedures. The Board also reviewed the allocation of fund brokerage, including allocations to brokers affiliated with the Investment Advisers, the use of brokerage commissions to pay fund expenses, and the use of "soft" commission dollars to pay for research services.
Annual Report
Board Approval of Investment Advisory Contracts and
Management Fees - continued
The Board noted that the growth of fund assets over time across the complex allows Fidelity to reinvest in the development of services designed to enhance the value or convenience of the Fidelity funds as investment vehicles. These services include 24-hour access to account information and market information through telephone representatives and over the Internet, investor education materials and asset allocation tools, and the expanded availability of Fidelity Investor Centers, with 35 new branches opening since 2010.
Investment in a Large Fund Family. The Board considered the benefits to shareholders of investing in a Fidelity fund, including the benefits of investing in a fund that is part of a large family of funds offering a variety of investment disciplines and providing a large variety of mutual fund investor services. The Board noted that Fidelity had taken, or had made recommendations that resulted in the Fidelity funds taking, a number of actions over the previous year that benefited particular funds, including (i) continuing to dedicate additional resources to investment research and support of the senior management team that oversees asset management; (ii) rationalizing product lines through the mergers of six funds into other funds; (iii) continuing to migrate the Freedom Funds to dedicated lower cost underlying funds; (iv) obtaining shareholder approval to broaden the investment strategies for Fidelity Consumer Finance Portfolio, Fidelity Emerging Asia Fund, and Fidelity Environment and Alternative Energy Portfolio; (v) contractually agreeing to reduce the management fees and impose other expense limitations on Spartan 500 Index Fund and U.S. Bond Index Fund in connection with launching new institutional classes of these funds; (vi) changing the name, primary and supplemental benchmarks, and investment policies of Fidelity Global Strategies Fund to support the fund's flexible investment mandate and global orientation; and (vii) reducing the transfer agency account fee rates on certain accounts.
Investment Performance (Fidelity Series Emerging Markets Fund). The Board considered whether the fund has operated in accordance with its investment objective, as well as its record of compliance with its investment restrictions. It also reviewed the fund's absolute investment performance for each class, as well as the fund's relative investment performance for each class measured against (i) a broad-based securities market index, and (ii) a peer group of mutual funds deemed appropriate by Fidelity and reviewed by the Board. Because the fund had been in existence less than three calendar years, the following chart considered by the Board shows, for the one-year period ended December 31, 2010, the total return of Class F and the retail class of the fund, the total return of a broad-based securities market index ("benchmark"), and a range of total returns of a peer group of mutual funds identified by Morningstar, Inc. as having an investment style similar to that of the fund based on underlying portfolio holdings. The box within the chart shows the 25th percentile return (bottom of box) and the 75th percentile return (top of box) of the peer group. Returns shown above the box are in the first quartile and returns shown below the box are in the fourth quartile. The percentage beaten numbers noted below the chart correspond to the percentile box and represent the percentage of funds in the peer group whose performance was equal to or lower than that of the class indicated.
Annual Report
Fidelity Series Emerging Markets Fund
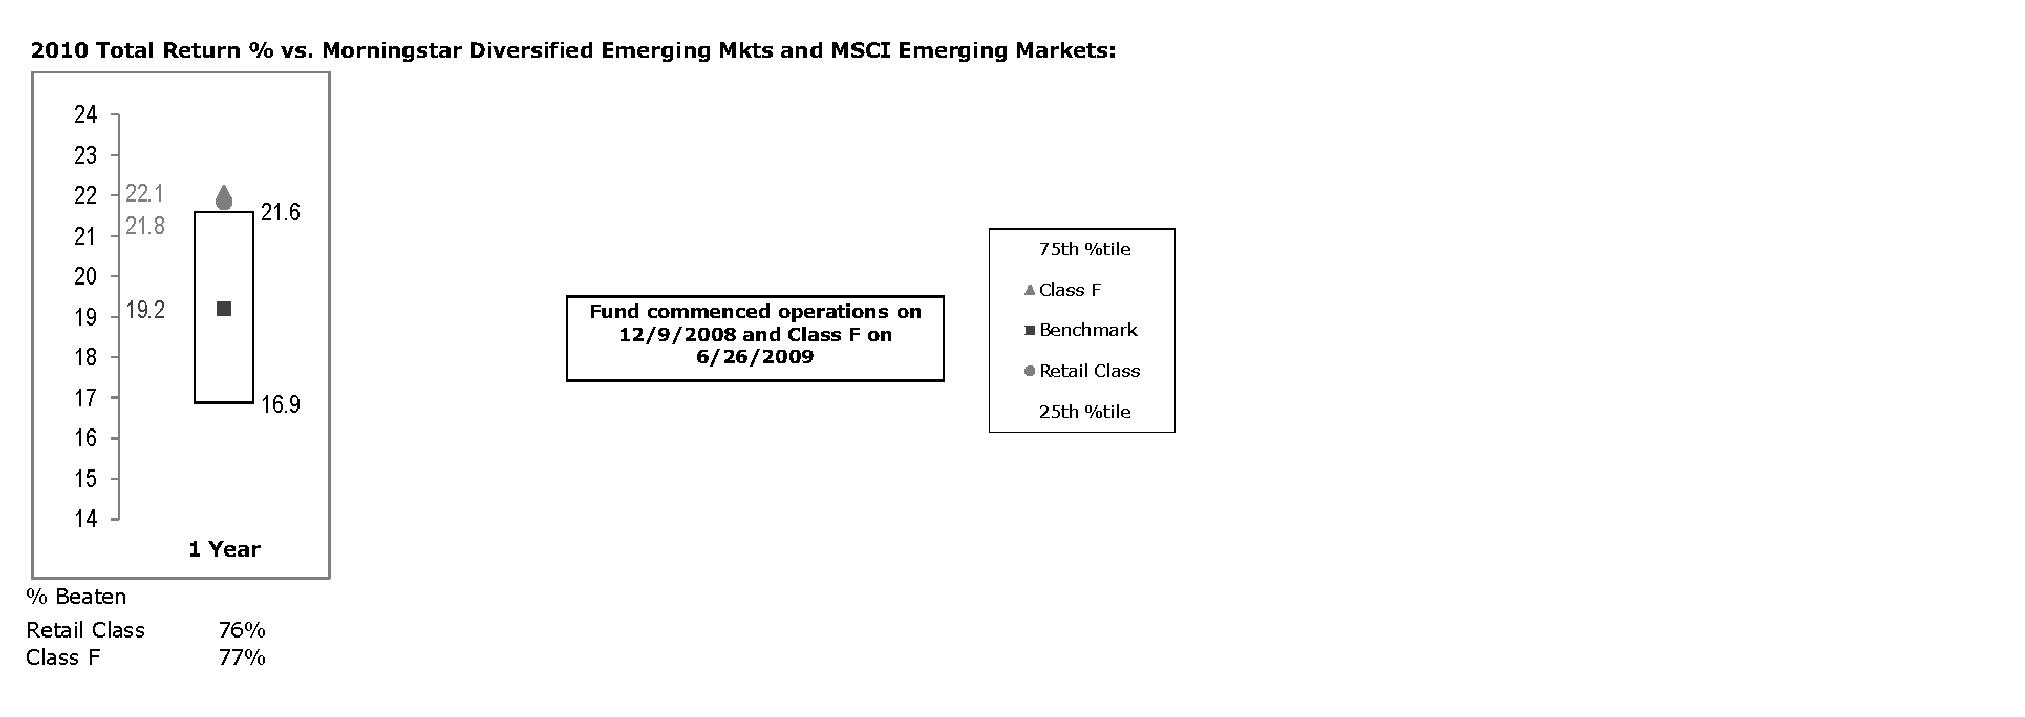
The Board reviewed the fund's relative investment performance against its peer group and noted that the performance of Class F of the fund was in the first quartile for the period shown. The Board also noted that the investment performance of Class F of the fund compared favorably to its benchmark for the period shown. The Board considered that the variations in performance between the fund's classes reflect the variations in class expenses, which result in lower performance for the higher expense class. The Board also reviewed the fund's performance since inception as well as performance in the current year. The Board noted that it is difficult to evaluate in any comprehensive fashion the performance of the fund, in light of its relatively recent commencement of operations.
Based on its review, the Board concluded that the nature, extent, and quality of services provided to the fund under the Advisory Contracts should benefit the fund's shareholders.
Investment Performance (Fidelity Series International Growth Fund, Fidelity Series International Small Cap Fund, and Fidelity Series International Value Fund). The Board considered whether each fund has operated in accordance with its investment objective, as well as its record of compliance with its investment restrictions. It also reviewed each fund's absolute investment performance for each class, as well as each fund's relative investment performance for each class measured over, as available, against (i) a broad-based securities market index, and (ii) a peer group of mutual funds deemed appropriate by Fidelity and reviewed by the Board. Because each fund had been in existence less than three calendar years, for each fund the following chart considered by the Board shows, for the one-year period ended December 31, 2010, the total returns of Class F and the retail class of the fund, the total return of a broad-based securities market index ("benchmark"), and a range of total returns of a custom peer group of mutual funds defined by FMR based on categories assigned by Morningstar, Inc (for Fidelity Series International Small Cap Fund, a peer group of mutual funds identified by Lipper Inc. as having an investment objective similar to that of the fund). The box within each chart shows the 25th percentile return (bottom of box) and the 75th percentile return (top of box) of the peer group. Returns shown above the box are in the first quartile and returns shown below the box are in the fourth quartile. The percentage beaten numbers noted below each chart correspond to the percentile box and represent the percentage of funds in the peer group whose performance was equal to or lower than that of the class indicated. Each of Fidelity Series International Growth Fund's and Fidelity Series International Value Fund's custom peer group, defined by FMR, is a peer group that FMR believes provides a more meaningful performance comparison than the peer group assigned by Morningstar, Inc., which assigns mutual funds to categories based on their investment styles as measured by their underlying portfolio holdings.
Annual Report
Board Approval of Investment Advisory Contracts and
Management Fees - continued
Fidelity Series International Growth Fund
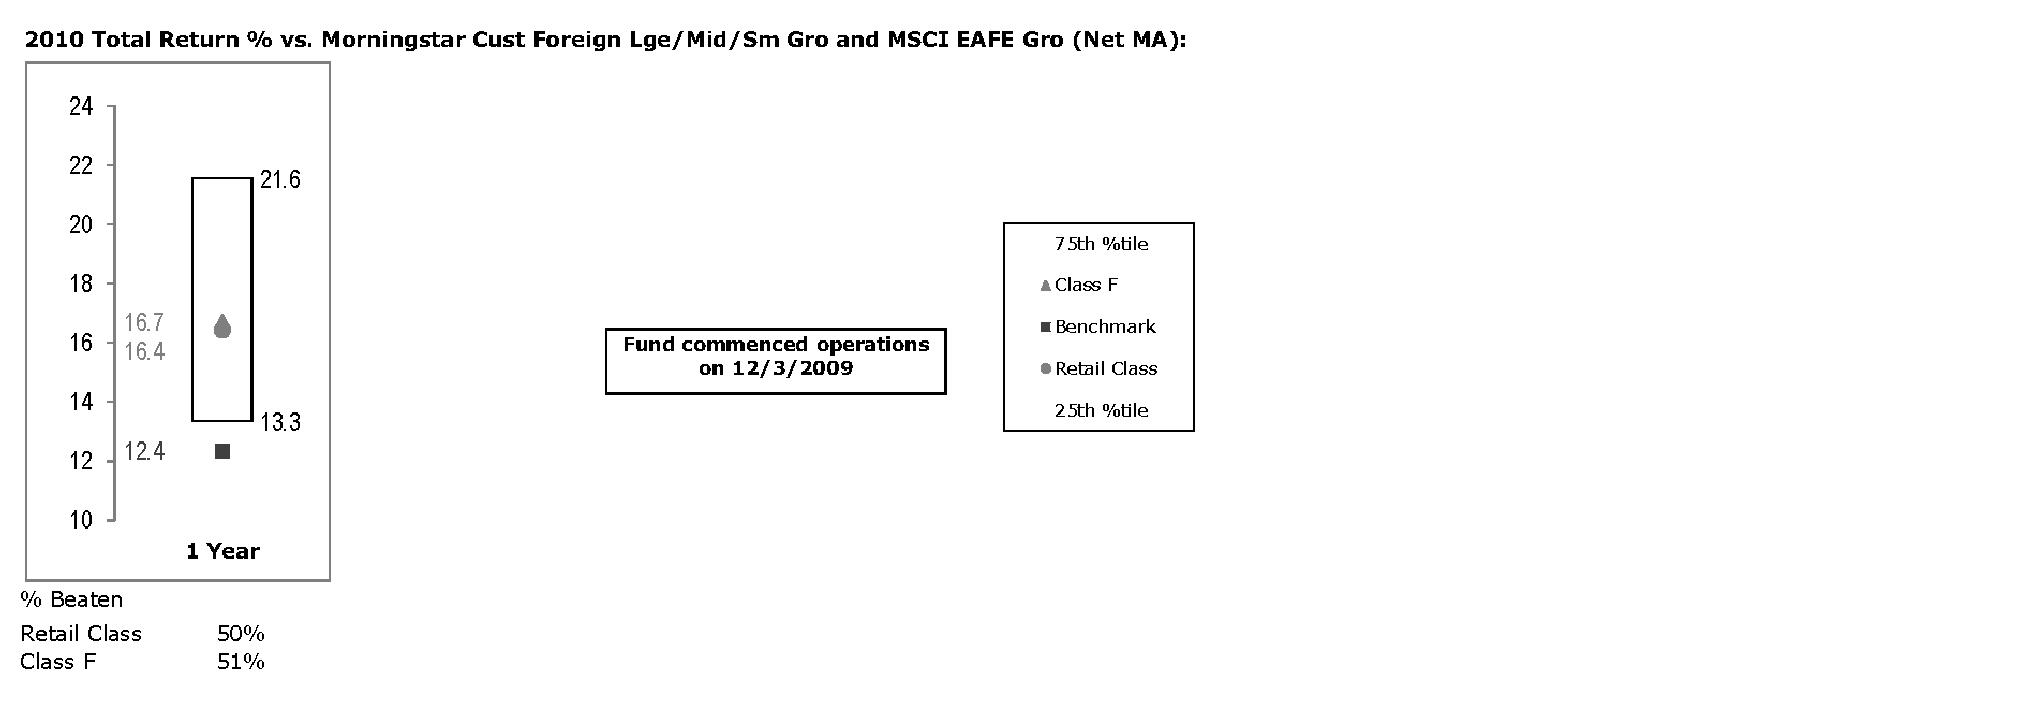
The Board reviewed the fund's relative investment performance against its peer group and noted that the performance of Class F of the fund was in the second quartile for the period shown. The Board also noted that the investment performance of Class F of the fund compared favorably to its benchmark for the period shown. The Board considered that the variations in performance between the fund's classes reflect the variations in class expenses, which result in lower performance for the higher expense class. The Board also reviewed the fund's performance since inception as well as performance in the current year. The Board noted that it is difficult to evaluate in any comprehensive fashion the performance of the fund, in light of its relatively recent commencement of operations.
Annual Report
Fidelity Series International Small Cap Fund
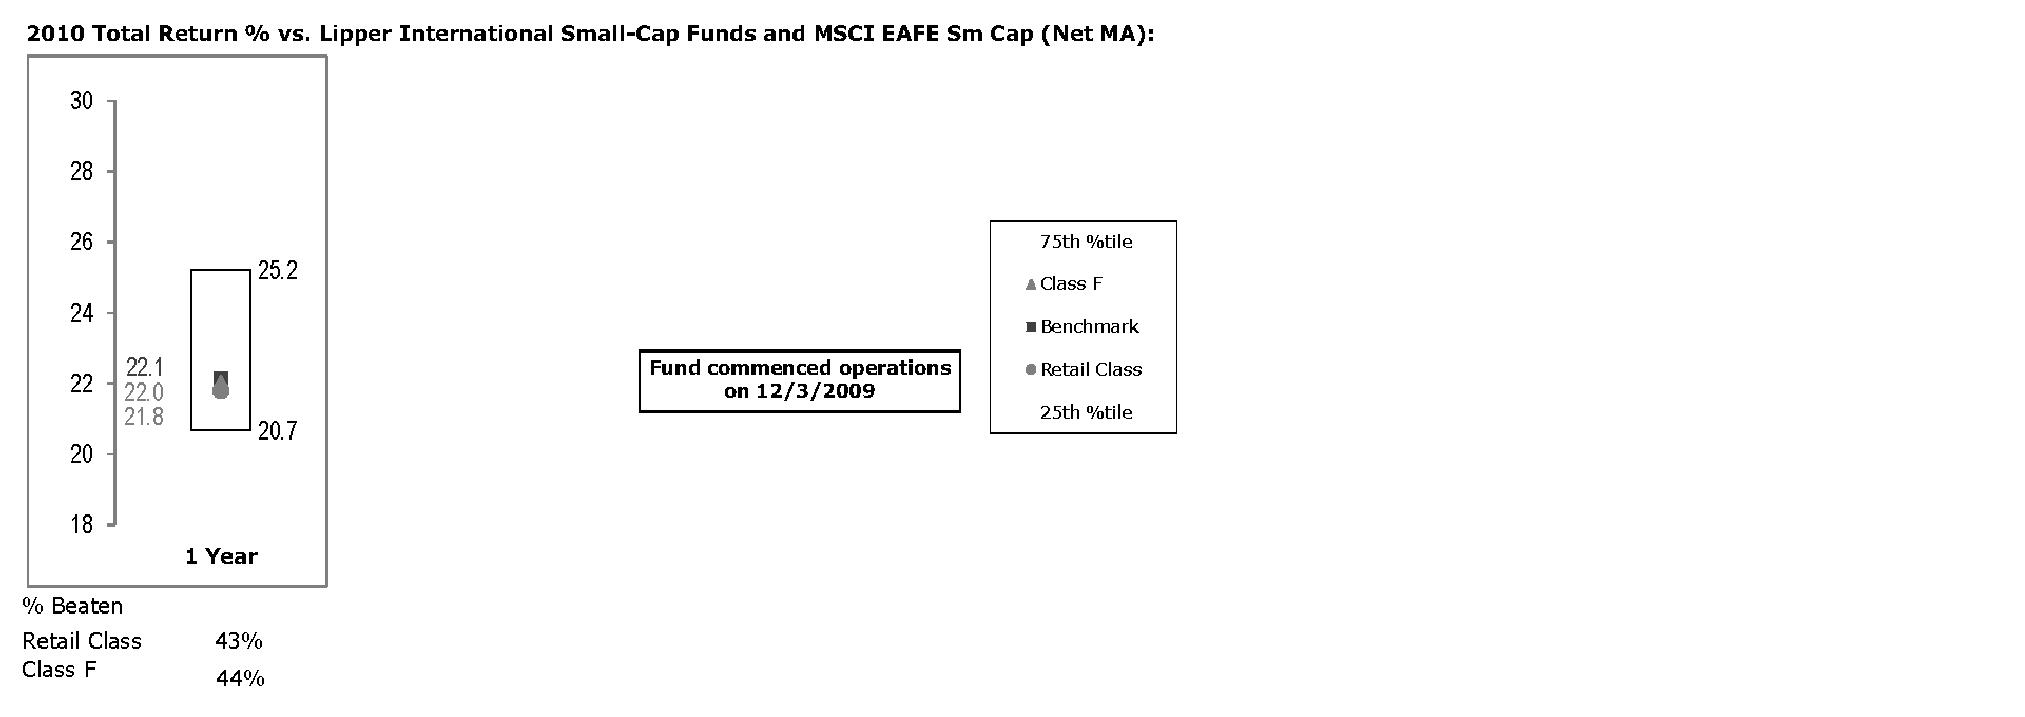
The Board reviewed the fund's relative investment performance against its peer group and noted that the performance of Class F of the fund was in the third quartile for the period shown. The Board also noted that the investment performance of the fund was lower than its benchmark for the period shown. The Board considered that the variations in performance between the fund's classes reflect the variations in class expenses, which result in lower performance for the higher expense class. The Board also reviewed the fund's performance since inception as well as performance in the current year. The Board noted that it is difficult to evaluate in any comprehensive fashion the performance of the fund, in light of its relatively recent commencement of operations.
Annual Report
Board Approval of Investment Advisory Contracts and
Management Fees - continued
Fidelity Series International Value Fund
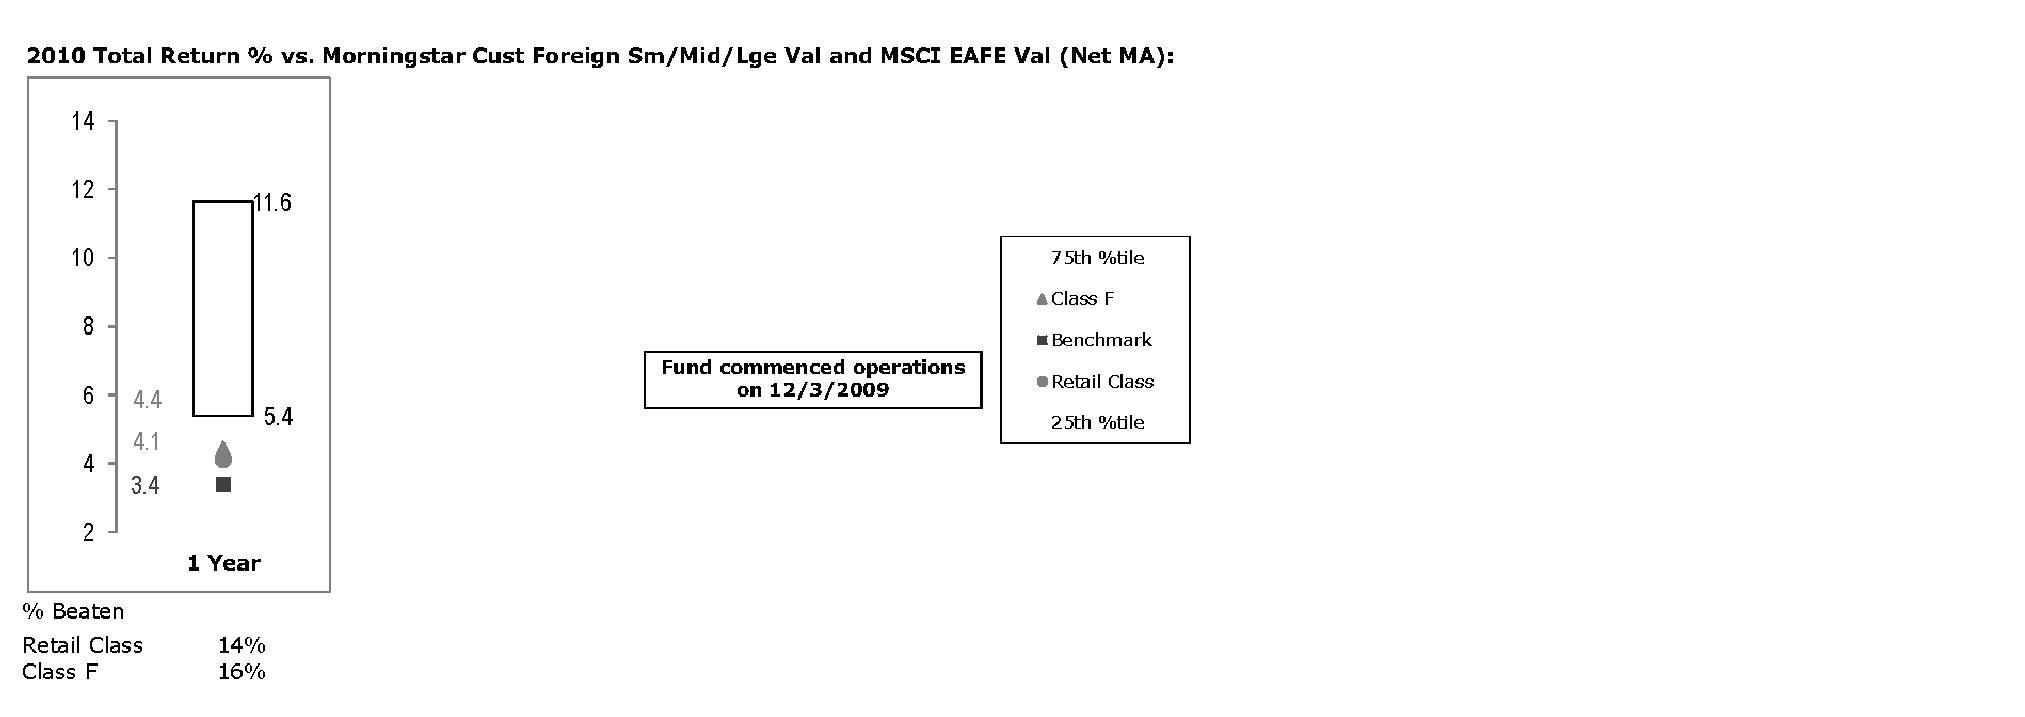
The Board reviewed the fund's relative investment performance against its peer group and noted that the performance of Class F of the fund was in the fourth quartile for the period shown. The Board also noted that the investment performance of Class F of the fund compared favorably to its benchmark for the period shown. The Board considered that the variations in performance between the fund's classes reflect the variations in class expenses, which result in lower performance for the higher expense class. The Board also reviewed the fund's performance since inception as well as performance in the current year. The Board noted that it is difficult to evaluate in any comprehensive fashion the performance of the fund, in light of its relatively recent commencement of operations.
The Board also considered that each fund's management fee is subject to upward or downward adjustment depending upon whether, and to what extent, the fund's investment performance for the performance period exceeds, or is exceeded by, the record (over the same period) of a Board-approved performance adjustment index. The Board noted that the performance adjustment provides FMR with a strong economic incentive to seek to achieve superior performance for each fund's shareholders and helps to more closely align the interests of FMR and each fund's shareholders.
Based on its review, the Board concluded that the nature, extent, and quality of services provided to each fund under the Advisory Contracts should benefit each fund's shareholders.
Competitiveness of Management Fee and Total Expense Ratio. The Board considered each fund's management fee and total expense ratio compared to "mapped groups" of competitive funds and classes. Fidelity creates "mapped groups" by combining similar Lipper investment objective categories that have comparable management fee characteristics. Combining Lipper investment objective categories aids the Board's management fee and total expense ratio comparisons by broadening the competitive group used for comparison and by reducing the number of universes to which various Fidelity funds are compared.
Annual Report
Management Fee. The Board considered two proprietary management fee comparisons for the 12-month (or shorter) periods shown in the charts below. The group of Lipper funds used by the Board for management fee comparisons is referred to below as the "Total Mapped Group." For Fidelity Series International Small Cap Fund, the Total Mapped Group is broader than the Lipper peer group used by the Board for performance comparisons because the Total Mapped Group combines several Lipper investment objective categories while the Lipper peer group does not. The Total Mapped Group comparison focuses on a fund's standing relative to the total universe of comparable funds available to investors in terms of gross management fees before expense reimbursements or caps, and without giving effect to a fund's performance adjustment (if applicable). "TMG %" represents the percentage of funds in the Total Mapped Group that had management fees that were lower than a fund's. For example, a TMG % of 19% would mean that 81% of the funds in the Total Mapped Group had higher management fees than a fund. The "Asset-Size Peer Group" (ASPG) comparison focuses on a fund's standing relative to non-Fidelity funds similar in size to the fund within the Total Mapped Group. The ASPG represents at least 15% of the funds in the Total Mapped Group with comparable asset size and management fee characteristics, subject to a minimum of 50 funds (or all funds in the Total Mapped Group if fewer than 50). Additional information, such as the ASPG quartile in which a fund's management fee ranked and the impact of a fund's performance adjustment (if applicable), is also included in the charts and considered by the Board.
Annual Report
Board Approval of Investment Advisory Contracts and
Management Fees - continued
Fidelity Series Emerging Markets Fund
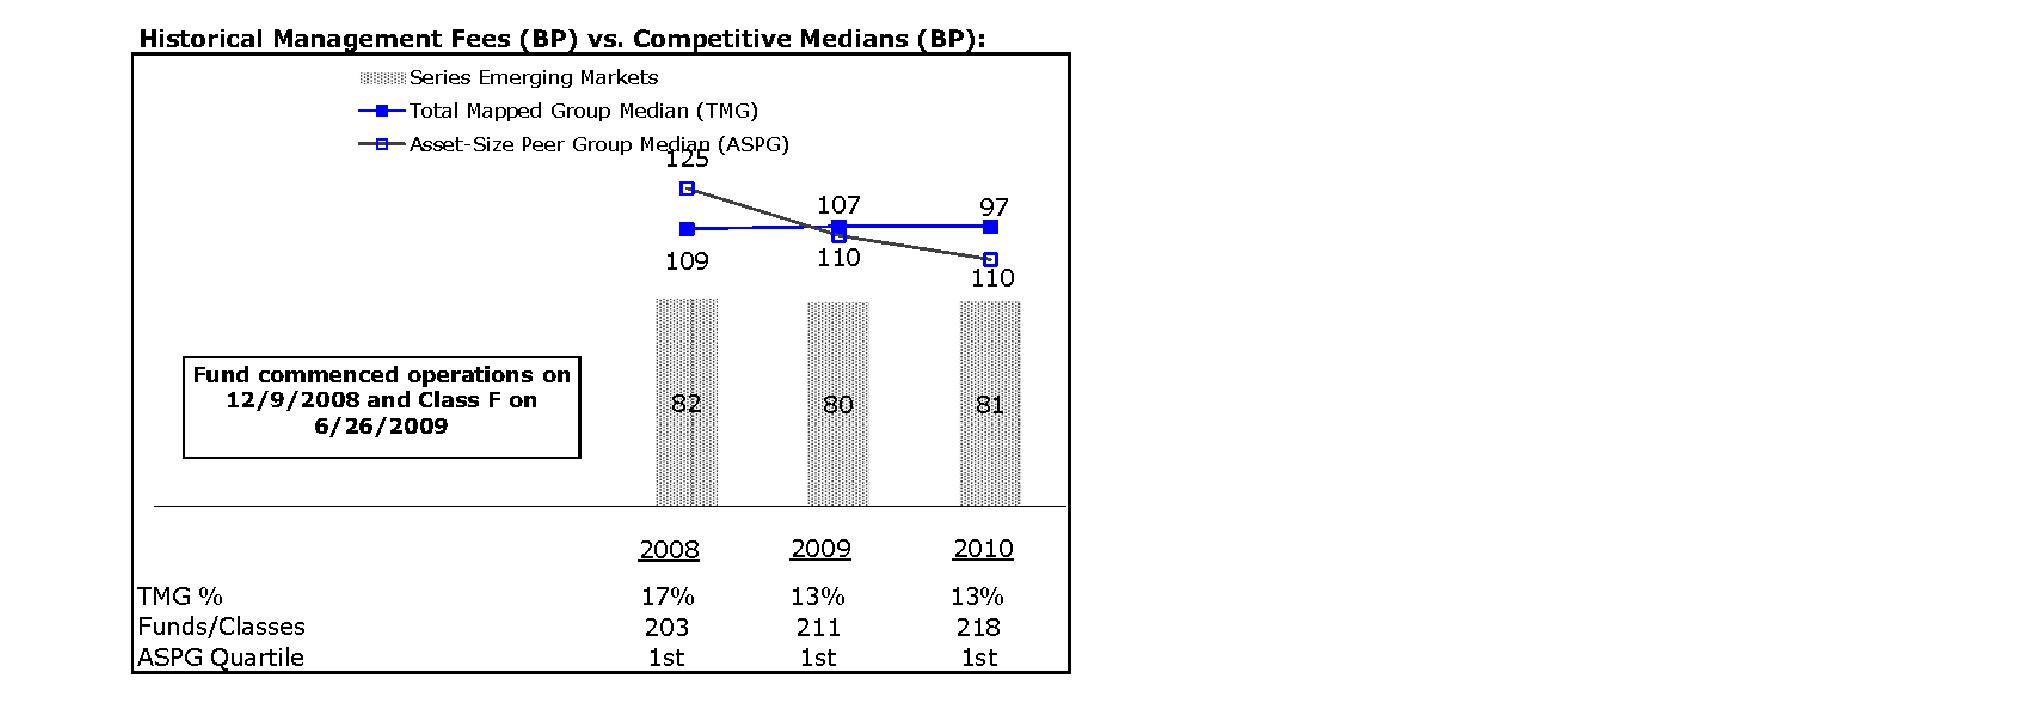
Fidelity Series International Growth Fund
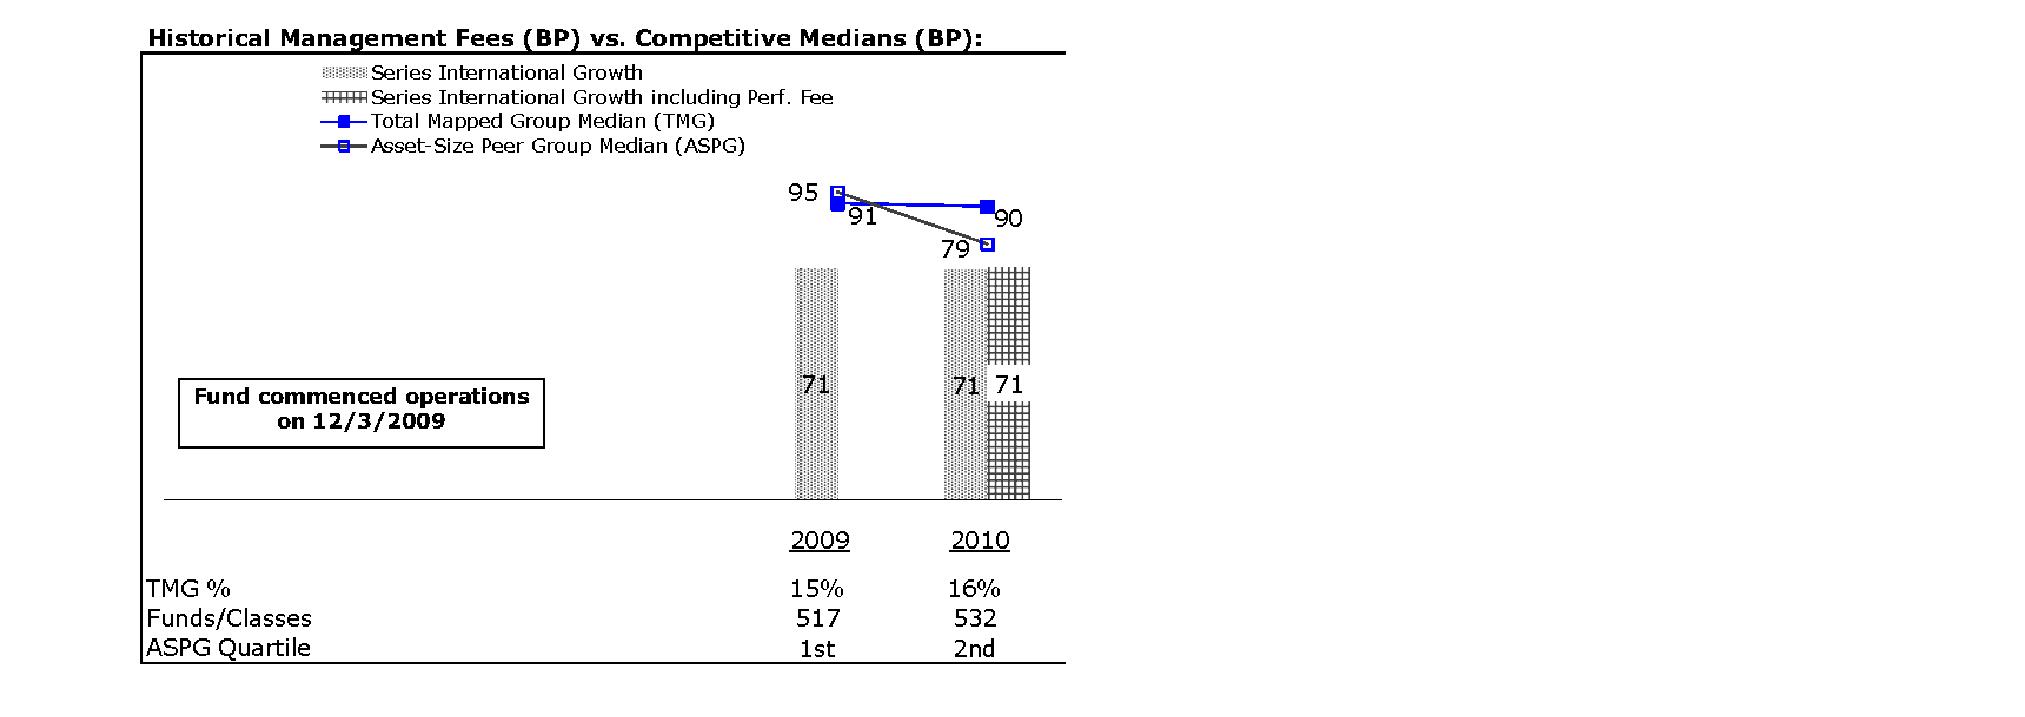
Annual Report
Fidelity Series International Small Cap Fund
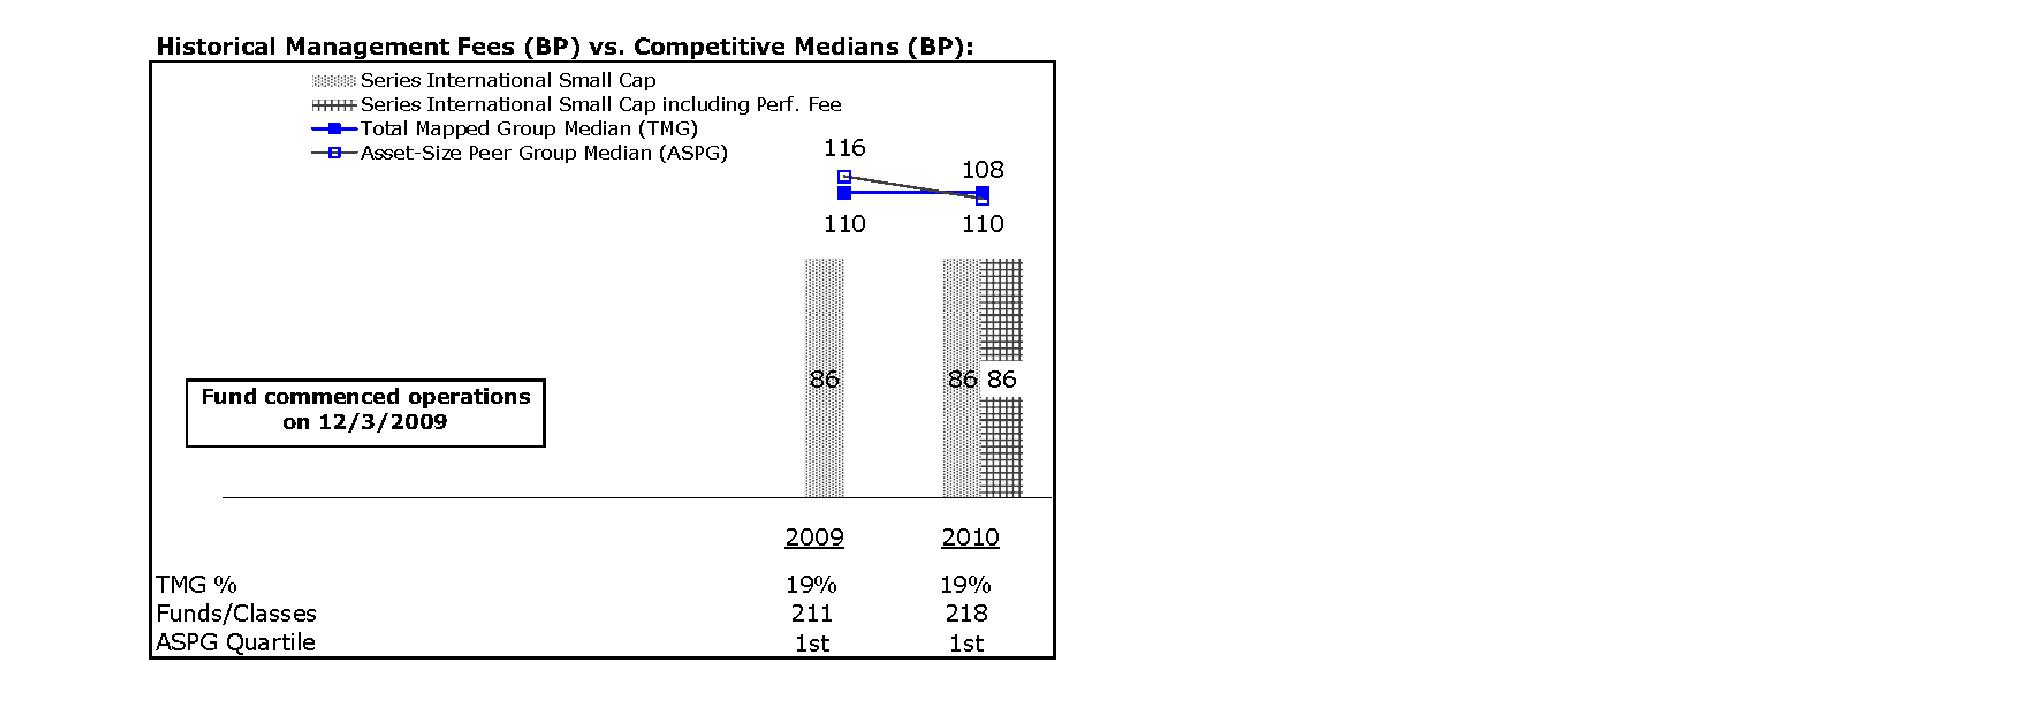
Fidelity Series International Value Fund
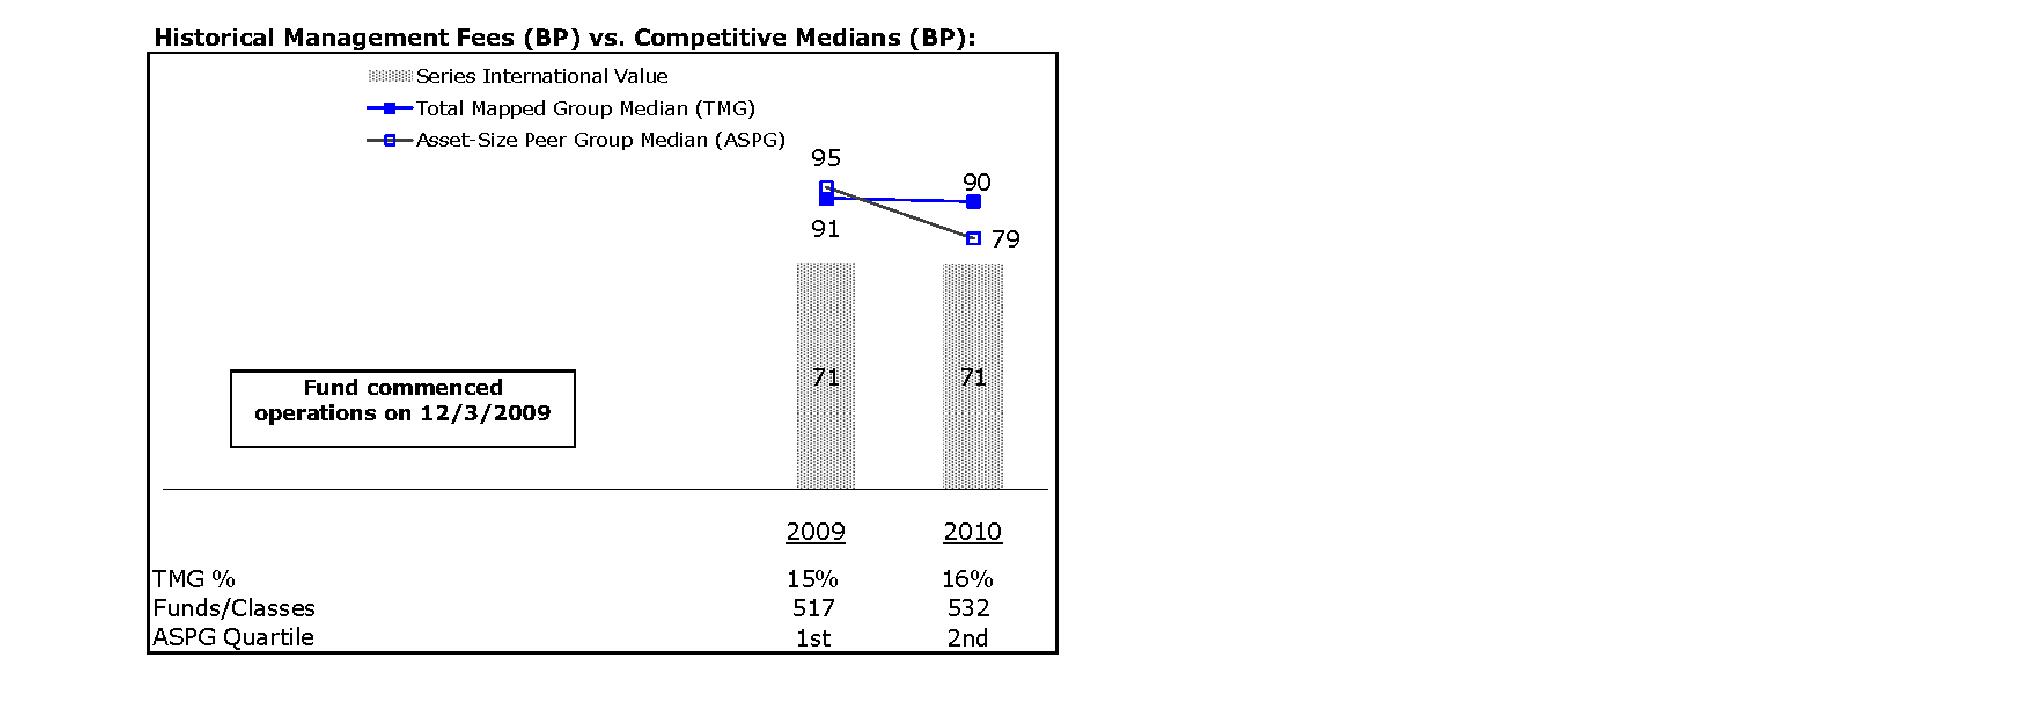
The Board noted that each fund's management fee ranked below the median of its Total Mapped Group and below the median of its ASPG for 2010. The Board also noted the effect of Fidelity Series International Growth Fund's, Fidelity Series International Small Cap Fund's and Fidelity Series International Value Fund's performance adjustment on the fund's management fee ranking. The Board noted that the performance adjustment for 2010 represents calculations for performance periods that differ from the period shown in the performance chart above.
Annual Report
Board Approval of Investment Advisory Contracts and
Management Fees - continued
Based on its review, the Board concluded that each fund's management fee is fair and reasonable in light of the services that the fund receives and the other factors considered.
Total Expense Ratio. In its review of the total expense ratio of each class of each fund, the Board considered the fund's management fee as well as other fund or class expenses, as applicable, such as transfer agent fees, pricing and bookkeeping fees, and custodial, legal, and audit fees. The Board also noted the effects of any waivers and reimbursements on fees and expenses, as well as the impact of each fund's performance adjustment. As part of its review, the Board also considered the current and historical total expense ratios of each class of each fund compared to competitive fund median expenses. Each class of each fund is compared to those funds and classes in the Total Mapped Group (used by the Board for management fee comparisons) that have a similar sales load structure.
The Board noted that the total expense ratio of each class of each fund ranked below its competitive median for 2010. The Board considered that various factors, including 12b-1 fees, positive or negative performance adjustments, and relatively higher other expenses in the case of small fund size, can affect total expense ratios.
Fees Charged to Other Fidelity Clients. The Board also considered Fidelity fee structures and other information with respect to clients of FMR and its affiliates, such as other mutual funds advised or subadvised by FMR or its affiliates, pension plan clients, and other institutional clients. In March 2010, the Board created an ad hoc joint committee with the board of other Fidelity funds (the Committee) to review and compare Fidelity's institutional investment advisory business with its business of providing services to the Fidelity funds, including the differences in services provided, fees charged, and costs incurred, as well as competition in their respective marketplaces.
Based on its review of total expense ratios and fees charged to other Fidelity clients, the Board concluded that the total expense ratio of each class of each fund was reasonable in light of the services that the fund and its shareholders receive and the other factors considered, including the findings of the Committee.
Costs of the Services and Profitability. The Board considered the revenues earned and the expenses incurred by Fidelity in conducting the business of developing, marketing, distributing, managing, administering and servicing each fund and its shareholders. The Board also considered the level of Fidelity's profits in respect of all the Fidelity funds.
On an annual basis, FMR presents to the Board Fidelity's profitability for each fund. Fidelity calculates the profitability for each fund, as well as aggregate profitability for groups of Fidelity funds and all Fidelity funds, using a series of detailed revenue and cost allocation methodologies which originate with the books and records of Fidelity on which Fidelity's audited financial statements are based. The Audit Committee of the Board reviews any significant changes from the prior year's methodologies.
Annual Report
PricewaterhouseCoopers LLP (PwC), independent registered public accounting firm and auditor to Fidelity and certain Fidelity funds, has been engaged annually by the Board as part of the Board's assessment of Fidelity's profitability analysis. PwC's engagement includes the review and assessment of Fidelity's methodologies used in determining the revenues and expenses attributable to Fidelity's mutual fund business, and completion of agreed-upon procedures surrounding the mathematical accuracy of fund profitability and its conformity to allocation methodologies. After considering PwC's reports issued under the engagement and information provided by Fidelity, the Board concluded that while other allocation methods may also be reasonable, Fidelity's profitability methodologies are reasonable in all material respects.
The Board also reviewed Fidelity's non-fund businesses and fall-out benefits related to the mutual fund business as well as cases where Fidelity's affiliates may benefit from or be related to the funds' business.
The Board considered the costs of the services provided by and the profits realized by Fidelity in connection with the operation of each fund and was satisfied that the profitability was not excessive in the circumstances.
Economies of Scale. The Board considered whether there have been economies of scale in respect of the management of the Fidelity funds, whether the Fidelity funds (including each fund) have appropriately benefited from any such economies of scale, and whether there is potential for realization of any further economies of scale. The Board considered the extent to which each fund will benefit from economies of scale through increased services to the fund, through waivers or reimbursements, or through fee or expense reductions. The Board also noted that in 2009, it and the board of other Fidelity funds created an ad hoc committee (the Economies of Scale Committee) to analyze whether FMR attains economies of scale in respect of the management and servicing of the Fidelity funds, whether the Fidelity funds have appropriately benefited from such economies of scale, and whether there is potential for realization of any further economies of scale.
The Board recognized that each fund's management contract incorporates a "group fee" structure, which provides for lower group fee rates as total fund assets under FMR's management increase, and for higher group fee rates as total fund assets under FMR's management decrease. FMR calculates the group fee rates based on a tiered asset "breakpoint" schedule that varies based on asset class. The Board considered that the group fee is designed to deliver the benefits of economies of scale to fund shareholders when total Fidelity fund assets increase, even if assets of any particular fund are unchanged or have declined, because some portion of Fidelity's costs are attributable to services provided to all Fidelity funds, and all funds benefit if those costs can be allocated among more assets. The Board also considered that although each fund is offered only to other funds advised by FMR or an affiliate, it continues to incur investment management expenses. The Board further noted that each fund may continue to realize benefits from the group fee structure, even though assets may not be expected to grow significantly at the fund level. The Board concluded that, given the group fee structure, fund shareholders will benefit from lower management fees as assets under FMR's management increase at the fund complex level, regardless of whether Fidelity achieves any such economies of scale.
Annual Report
Board Approval of Investment Advisory Contracts and
Management Fees - continued
The Board concluded, taking into account the analysis of the Economies of Scale Committee, that any potential economies of scale are being appropriately shared between fund shareholders and Fidelity.
Additional Information Requested by the Board. In order to develop fully the factual basis for consideration of the Fidelity funds' Advisory Contracts, the Board requested and received additional information on certain topics, including (i) fund performance trends, actions to be taken by FMR to improve certain funds' overall performance, and Fidelity's long-term strategies for certain funds; (ii) portfolio manager changes that have occurred during the past year and length of portfolio manager tenure for different categories of funds over time; (iii) Fidelity's compensation structure for portfolio managers and other key personnel and strategies for attracting and retaining non-investment personnel; (iv) the amount of the investment that each portfolio manager has made in the Fidelity fund(s) that he or she manages; (v) historical trends in Fidelity's realization of fall-out benefits; (vi) Fidelity's group fee structures and the rationale for the individual fee rates of certain funds; (vii) fund profitability methodology and the impact of certain factors on fund profitability results; (viii) trends regarding industry use of performance fee structures and Fidelity's compliance practices with respect to performance adjustment calculations; (ix) the fee structures in place for certain other Fidelity clients; and (x) explanations regarding the relative total expense ratios of certain funds and classes, total expense competitive trends, and actions that might be taken by FMR to reduce total expense ratios for certain funds and classes.
Based on its evaluation of all of the conclusions noted above, and after considering all factors it believed relevant, the Board ultimately concluded that the advisory fee structures are fair and reasonable, and that each fund's Advisory Contracts should be renewed.
Annual Report
Investment Adviser
Fidelity Management & Research Company
Boston, MA
Investment Sub-Advisers
FMR Co., Inc.
Fidelity Management & Research (U.K.) Inc.
FIL Investments (Japan) Limited
Fidelity Management & Research (Hong Kong) Limited
Fidelity Management & Research (Japan) Inc.
FIL Investment Advisors
FIL Investment Advisors (UK) Limited
General Distributor
Fidelity Distributors Corporation
Boston, MA
Transfer and Service Agents
Fidelity Investments Institutional Operations Company, Inc.
Boston, MA
Fidelity Service Company, Inc.
Boston, MA
Custodians
The Northern Trust Company
Chicago, IL
Fidelity Series Emerging Markets Fund
State Street Bank and Trust Company
Quincy, MA
Fidelity Series International Growth Fund, Fidelity Series International Small Cap Fund, Fidelity Series International Value Fund

GSV-S-ANN-1211
1.907943.101
Fidelity®
Diversified International
Fund -
Class K
Annual Report
October 31, 2011
(Fidelity Cover Art)
Contents
Chairman's Message | (Click Here) | The Chairman's message to shareholders. |
Performance | (Click Here) | How the fund has done over time. |
Management's Discussion of Fund Performance | (Click Here) | The Portfolio Manager's review of fundperformance and strategy. |
Shareholder Expense Example | (Click Here) | An example of shareholder expenses. |
Investment Changes | (Click Here) | A summary of major shifts in the fund's investments over the past six months. |
Investments | (Click Here) | A complete list of the fund's investments with their market values. |
Financial Statements | (Click Here) | Statements of assets and liabilities, operations, and changes in net assets, as well as financial highlights. |
Notes | (Click Here) | Notes to the financial statements. |
Report of Independent Registered Public Accounting Firm | (Click Here) | |
Trustees and Officers | (Click Here) | |
Distributions | (Click Here) | |
Board Approval of Investment Advisory Contracts and Management Fees | (Click Here) | |
To view a fund's proxy voting guidelines and proxy voting record for the 12-month period ended June 30, visit http://www.fidelity.com/proxyvotingresults or visit the Securities and Exchange Commission's (SEC) web site at http://www.sec.gov. You may also call 1-800-835-5092 to request a free copy of the proxy voting guidelines.
Standard & Poor's, S&P and S&P 500 are registered service marks of The McGraw-Hill Companies, Inc. and have been licensed for use by Fidelity Distributors Corporation.
Other third party marks appearing herein are the property of their respective owners.
All other marks appearing herein are registered or unregistered trademarks or service marks of FMR LLC or an affiliated company.
This report and the financial statements contained herein are submitted for the general information of the shareholders of the fund. This report is not authorized for distribution to prospective investors in the fund unless preceded or accompanied by an effective prospectus.
A fund files its complete schedule of portfolio holdings with the SEC for the first and third quarters of each fiscal year on Form N-Q. Forms N-Q are available on the SEC's web site at http://www.sec.gov. A fund's Forms N-Q may be reviewed and copied at the SEC's Public Reference Room in Washington, DC. Information regarding the operation of the SEC's Public Reference Room may be obtained by calling 1-800-SEC-0330. For a complete list of a fund's portfolio holdings, view the most recent holdings listing, semiannual report, or annual report on Fidelity's web site at http://www.fidelity.com, http://www.advisor.fidelity.com, or http://www.401k.com, as applicable.
NOT FDIC INSURED • MAY LOSE VALUE • NO BANK GUARANTEE
Neither the fund nor Fidelity Distributors Corporation is a bank.
Annual Report
(Acting Chairman's Photograph)
Dear Shareholder:
Global equity markets began the fourth quarter on a strong note, sharply reversing course in October amid strong corporate earnings, better-than-expected economic news and the promise of a resolution to the sovereign debt crisis in Europe. The mini rally followed a third quarter marked by a significant downturn in July and August, which heightened investor anxiety and set off a wave of volatility that hampered most major asset classes through the end of September. Financial markets are difficult to predict, of course, but you can help put the odds in your favor by following these time-tested investment principles.
One of the basic tenets is to invest according to your time horizon. For long-term investors, riding out the markets' inevitable ups and downs has proven much more effective than making decisions based on short-term developments. If your goal is approaching, you can also benefit from patience and restraint, rather than attempting to time the market. No matter your time horizon, missing only a few of the markets' best days can significantly diminish returns. Patience also affords the benefits of compounding - earning interest on additional income or reinvested dividends and capital gains. While staying the course doesn't eliminate risk, it can considerably lessen the negative impact of short-term downturns.
Asset allocation is another principle to manage risk. As you spread your portfolio among the asset classes, be sure to consider your time horizon, risk tolerance and investment objectives. Younger investors may be better served by emphasizing equities, which historically have been the best-performing asset class over time. Investors who are nearing a specific goal, such as retirement or sending a child to college, may choose to favor bonds and other investments that have tended to be more stable. Studies indicate that asset allocation is the single most important determinant of a portfolio's long-term success. After deciding on a suitable allocation strategy, make sure your portfolio is adequately diversified, with exposure to stocks of small-, mid- and large-cap companies in a range of sectors, for example. And today, more than ever, geographic diversification should be taken into account.
Lastly, investing a certain amount of money on a regular basis - a principle known as dollar-cost averaging - can help lower the average cost of your purchases, while also giving you the discipline to avoid selling weak performers just prior to an upswing, or chasing a hot performer just before a correction.
We invite you to learn more by visiting us on the Internet, dropping by one of our Investor Centers or calling us by phone. It is our privilege to provide the resources you need to choose investments that are right for you.
Sincerely,
(Acting Chairman's Signature)
James C. Curvey
Acting Chairman
Annual Report
Average annual total return reflects the change in the value of an investment, assuming reinvestment of the class' distributions from dividend income and capital gains (the profits earned upon the sale of securities that have grown in value, if any) and assuming a constant rate of performance each year. The $10,000 table and the fund's returns do not reflect the deduction of taxes that a shareholder would pay on fund distributions or the redemption of fund shares. During periods of reimbursement by Fidelity, a fund's total return will be greater than it would be had the reimbursement not occurred. How a fund did yesterday is no guarantee of how it will do tomorrow.
Average Annual Total Returns
Periods ended October 31, 2011 | Past 1
year | Past 5
years | Past 10
years |
Class K A | -4.87% | -2.19% | 7.06% |
A The initial offering of Class K shares took place on May 9, 2008. Returns prior to May 9, 2008, are those of Fidelity® Diversified International Fund, the original class of the fund.
$10,000 Over 10 Years
Let's say hypothetically that $10,000 was invested in Fidelity® Diversified International Fund - Class K on October 31, 2001. The chart shows how the value of your investment would have changed, and also shows how the MSCI® EAFE® (Europe, Australasia, Far East) Index performed over the same period. The initial offering of Class K took place on May 9, 2008. See above for additional information regarding the performance of Class K.
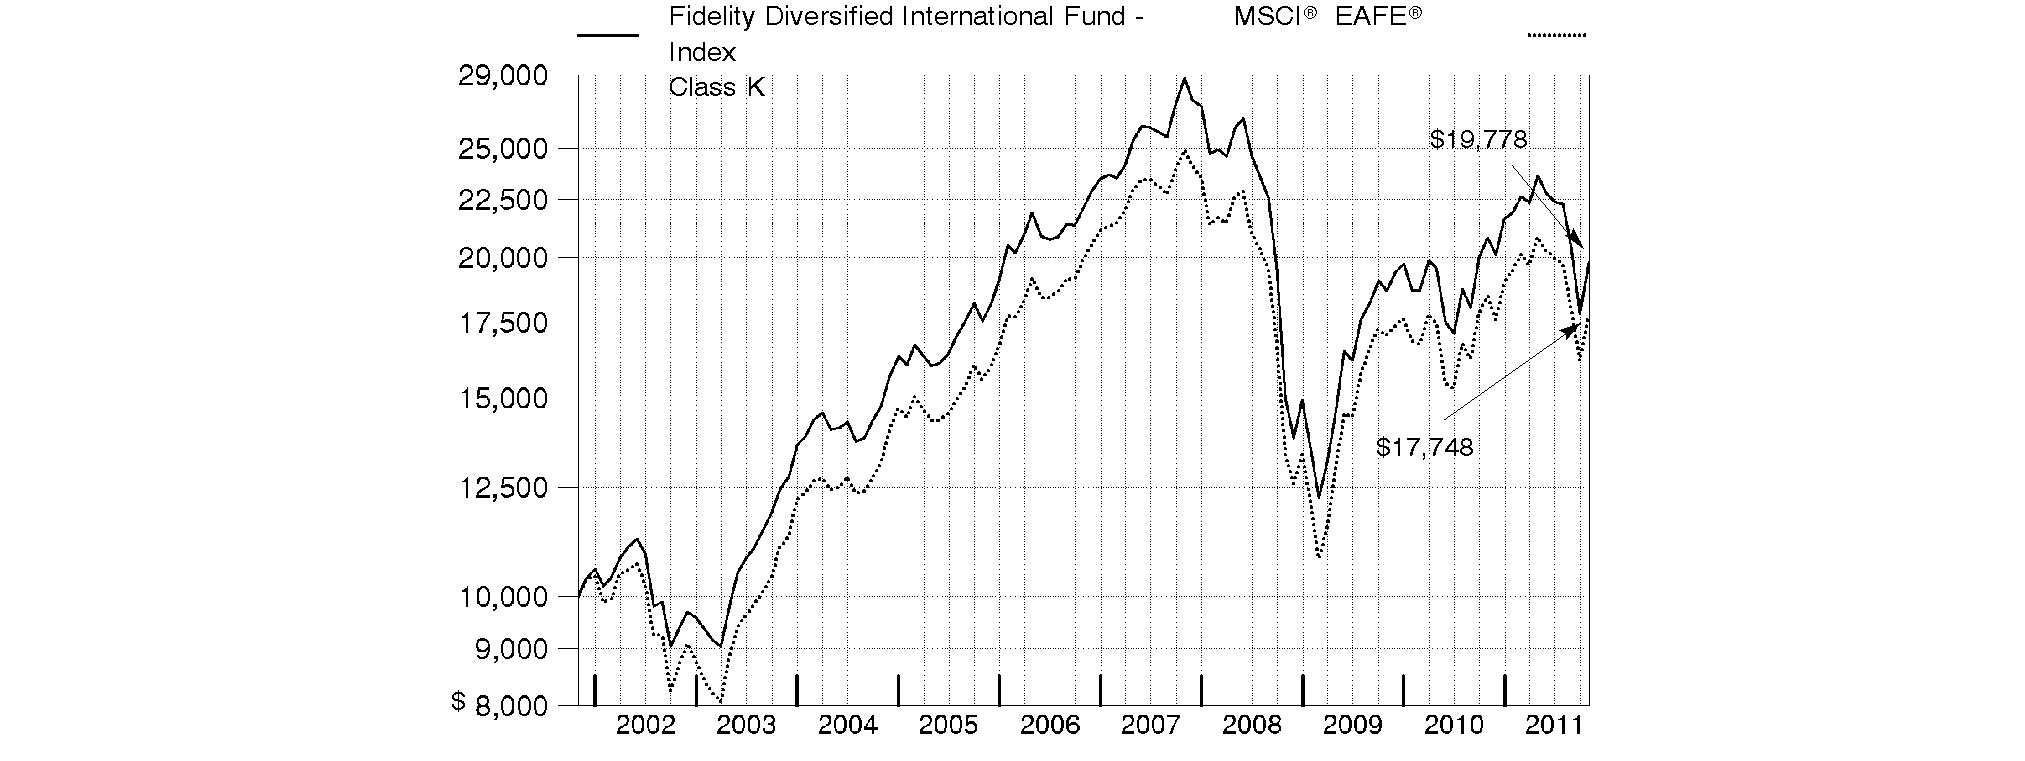
Annual Report
Market Recap: International equities were rocked by a number of headline events during the year ending October 31, 2011. Stocks posted a solid advance for the first half of the period, despite concern about the sovereign debt crisis in Europe, a devastating earthquake and tsunami in Japan, and political upheaval in the Middle East and North Africa. Sentiment turned decidedly negative in the second half, however, as fresh worries about Europe, inflation in China and a dimmed outlook for global growth caused foreign markets to suffer declines that intensified in August and September. October brought with it yet another dramatic swing, as eurozone policymakers appeared near a resolution to the debt debacle and buyers stormed back onto the scene in search of bargains. Still, those gains - along with favorable currency fluctuations overall - weren't enough to offset prior losses, and the MSCI® ACWI® (All Country World Index) ex USA Index finished the period down 4.56%. Within the MSCI index, Europe and emerging markets suffered the biggest declines, with many countries in these areas sustaining steep losses. By contrast, Japan showed resilience in the wake of its natural disasters, falling only 2%. Australia (+4%), Switzerland (+3%), the U.K. (+2%) and Canada, which produced a nominal return, were among the few major benchmark components to break into positive territory.
Comments from William Bower, Portfolio Manager of Fidelity® Diversified International Fund: For the year, the fund's Class K shares returned -4.87%, underperforming the -3.97% return of the MSCI® EAFE® (Europe, Australasia, Far East) Index. Fund performance versus the index was held back by security selection in energy, positioning in consumer staples, stock selection in financials and an underweighting in pharmaceuticals. Geographically, performance was curtailed by stock selection in the Asia-Pacific ex Japan region, China and Canada. Individual detractors included U.K.-based Lloyds Banking Group; out-of-benchmark positions in Canadian energy companies Niko Resources and Petrobank Energy & Resources; an underweighting in Swiss drug company Roche Holding, since sold; Danish beer company Carlsberg; and Italy's Fiat Industrial. On the plus side, the fund benefited from an underweighting in the utilities sector, positioning in consumer discretionary and security selection in technology hardware/equipment. Regionally, positioning in continental Europe helped, as did stock picks in Japan. Top contributors included Japan Tobacco, U.K.-listed Royal Dutch Shell, Japanese online retailer Rakuten, a lack of exposure to index component Tokyo Electric Power and an out-of-benchmark stake in technology giant Apple.
The views expressed above reflect those of the portfolio manager(s) only through the end of the period as stated on the cover of this report and do not necessarily represent the views of Fidelity or any other person in the Fidelity organization. Any such views are subject to change at any time based upon market or other conditions and Fidelity disclaims any responsibility to update such views. These views may not be relied on as investment advice and, because investment decisions for a Fidelity fund are based on numerous factors, may not be relied on as an indication of trading intent on behalf of any Fidelity fund.
Annual Report
Fidelity Diversified International Fund
As a shareholder of the Fund, you incur two types of costs: (1) transaction costs, including redemption fees, and (2) ongoing costs, including management fees and other Fund expenses. This Example is intended to help you understand your ongoing costs (in dollars) of investing in the Fund and to compare these costs with the ongoing costs of investing in other mutual funds.
The Example is based on an investment of $1,000 invested at the beginning of the period and held for the entire period (May 1, 2011 to October 31, 2011).
Actual Expenses
The first line of the accompanying table for each class of the Fund provides information about actual account values and actual expenses. You may use the information in this line, together with the amount you invested, to estimate the expenses that you paid over the period. Simply divide your account value by $1,000.00 (for example, an $8,600 account value divided by $1,000.00 = 8.6), then multiply the result by the number in the first line for a class of the Fund under the heading entitled "Expenses Paid During Period" to estimate the expenses you paid on your account during this period. A small balance maintenance fee of $12.00 that is charged once a year may apply for certain accounts with a value of less than $2,000. This fee is not included in the table below. If it was, the estimate of expenses you paid during the period would be higher, and your ending account value lower, by this amount. In addition, the Fund, as a shareholder in the underlying Fidelity Central Funds, will indirectly bear its pro-rata share of the fees and expenses incurred by the underlying Fidelity Central Funds. These fees and expenses are not included in the Fund's annualized expense ratio used to calculate the expense estimate in the table below.
Hypothetical Example for Comparison Purposes
The second line of the accompanying table for each class of the Fund provides information about hypothetical account values and hypothetical expenses based on a Class' actual expense ratio and an assumed rate of return of 5% per year before expenses, which is not the Class' actual return. The hypothetical account values and expenses may not be used to estimate the actual ending account balance or expenses you paid for the period. You may use this information to compare the ongoing costs of investing in the Fund and other funds. To do so, compare this 5% hypothetical example with the 5% hypothetical examples that appear in the shareholder reports of the other funds. A small balance maintenance fee of $12.00 that is charged once a year may apply for certain accounts with a value of less than $2,000. This fee is not included in the table below. If it was, the estimate of expenses you paid during the period would be higher, and your ending account value lower, by this amount. In addition, the Fund, as a shareholder in the underlying Fidelity Central Funds, will indirectly bear its pro-rata share of the fees and expenses incurred by the underlying Fidelity Central Funds. These fees and expenses are not included in the Fund's annualized expense ratio used to calculate the expense estimate in the table below.
Please note that the expenses shown in the table are meant to highlight your ongoing costs only and do not reflect any transaction costs. Therefore, the second line of the table is useful in comparing ongoing costs only, and will not help you determine the relative total costs of owning different funds. In addition, if these transactional costs were included, your costs would have been higher.
| Annualized Expense Ratio | Beginning
Account Value
May 1, 2011 | Ending
Account Value
October 31, 2011 | Expenses Paid
During Period*
May 1, 2011 to October 31, 2011 |
Diversified International | .87% | | | |
Actual | | $ 1,000.00 | $ 836.80 | $ 4.03 |
HypotheticalA | | $ 1,000.00 | $ 1,020.82 | $ 4.43 |
Class K | .70% | | | |
Actual | | $ 1,000.00 | $ 837.70 | $ 3.24 |
HypotheticalA | | $ 1,000.00 | $ 1,021.68 | $ 3.57 |
Class F | .64% | | | |
Actual | | $ 1,000.00 | $ 838.00 | $ 2.96 |
HypotheticalA | | $ 1,000.00 | $ 1,021.98 | $ 3.26 |
A 5% return per year before expenses
* Expenses are equal to each Class' annualized expense ratio, multiplied by the average account value over the period, multiplied by 184/365 (to reflect the one-half year period).
Annual Report
Fidelity Diversified International Fund
Investment Changes (Unaudited)
Geographic Diversification (% of fund's net assets) |
As of October 31, 2011 |
 | United Kingdom | 18.1% | |
 | Japan | 13.4% | |
 | Germany | 8.6% | |
 | United States of America | 8.4% | |
 | France | 7.1% | |
 | Canada | 5.6% | |
 | Switzerland | 4.4% | |
 | Australia | 3.6% | |
 | Netherlands | 2.7% | |
 | Other | 28.1% | |

Percentages are adjusted for the effect of futures contracts, if applicable. |
As of April 30, 2011 |
| United Kingdom | 17.6% | |
| Japan | 13.0% | |
| Germany | 8.4% | |
| France | 6.4% | |
| United States of America | 6.2% | |
| Switzerland | 5.4% | |
| Canada | 5.0% | |
| Australia | 3.8% | |
| Spain | 3.4% | |
| Other | 30.8% | |

Percentages are adjusted for the effect of futures contracts, if applicable. |
Asset Allocation |
| % of fund's
net assets | % of fund's net assets
6 months ago |
Stocks | 96.6 | 98.1 |
Short-Term Investments and Net Other Assets | 3.4 | 1.9 |
Top Ten Stocks as of October 31, 2011 |
| % of fund's
net assets | % of fund's net assets
6 months ago |
Royal Dutch Shell PLC Class B sponsored ADR (United Kingdom, Oil, Gas & Consumable Fuels) | 3.0 | 2.4 |
BHP Billiton Ltd. sponsored ADR (Australia, Metals & Mining) | 2.1 | 2.0 |
Novo Nordisk A/S Series B (Denmark, Pharmaceuticals) | 1.8 | 1.7 |
HSBC Holdings PLC sponsored ADR (United Kingdom, Commercial Banks) | 1.7 | 1.6 |
GlaxoSmithKline PLC (United Kingdom, Pharmaceuticals) | 1.6 | 1.1 |
Vodafone Group PLC sponsored ADR (United Kingdom, Wireless Telecommunication Services) | 1.6 | 1.2 |
Nestle SA (Switzerland, Food Products) | 1.4 | 1.1 |
Royal Dutch Shell PLC Class A sponsored ADR (United Kingdom, Oil, Gas & Consumable Fuels) | 1.4 | 1.1 |
ORIX Corp. (Japan, Diversified Financial Services) | 1.3 | 1.1 |
Reckitt Benckiser Group PLC (United Kingdom, Household Products) | 1.3 | 1.3 |
| 17.2 | |
Market Sectors as of October 31, 2011 |
| % of fund's
net assets | % of fund's net assets
6 months ago |
Financials | 15.5 | 20.5 |
Consumer Discretionary | 16.0 | 14.8 |
Energy | 11.4 | 11.3 |
Materials | 10.2 | 11.2 |
Consumer Staples | 10.1 | 6.7 |
Information Technology | 9.8 | 10.3 |
Industrials | 9.1 | 10.8 |
Health Care | 8.2 | 6.2 |
Telecommunication Services | 6.2 | 6.0 |
Utilities | 0.1 | 0.3 |
Annual Report
Fidelity Diversified International Fund
Investments October 31, 2011
Showing Percentage of Net Assets
Common Stocks - 95.1% |
| Shares | | Value |
Australia - 3.6% |
BHP Billiton Ltd. sponsored ADR (d) | 6,896,500 | | $ 538,478,720 |
Fortescue Metals Group Ltd. | 5,712,451 | | 28,695,469 |
Iluka Resources Ltd. | 2,245,282 | | 37,330,693 |
Newcrest Mining Ltd. | 7,469,169 | | 263,999,256 |
Paladin Energy Ltd. (Australia) (a) | 401,613 | | 613,372 |
QBE Insurance Group Ltd. | 2,851,820 | | 43,902,034 |
WorleyParsons Ltd. | 503,041 | | 14,602,027 |
TOTAL AUSTRALIA | | 927,621,571 |
Austria - 0.0% |
Osterreichische Elektrizitatswirtschafts AG | 6,000 | | 174,662 |
Bailiwick of Guernsey - 1.2% |
Amdocs Ltd. (a) | 1,849,800 | | 55,530,996 |
Ashmore Global Opportunities Ltd. (United Kingdom) | 767,088 | | 8,512,053 |
Resolution Ltd. | 52,410,500 | | 231,788,056 |
TOTAL BAILIWICK OF GUERNSEY | | 295,831,105 |
Bailiwick of Jersey - 1.9% |
Experian PLC | 14,652,572 | | 190,988,377 |
Randgold Resources Ltd. sponsored ADR | 855,700 | | 93,759,049 |
Shire PLC | 2,847,600 | | 89,390,276 |
WPP PLC | 11,475,509 | | 118,805,910 |
TOTAL BAILIWICK OF JERSEY | | 492,943,612 |
Belgium - 1.0% |
Anheuser-Busch InBev SA NV | 4,421,964 | | 245,260,547 |
Anheuser-Busch InBev SA NV (strip VVPR) (a) | 5,339,200 | | 7,389 |
TOTAL BELGIUM | | 245,267,936 |
Bermuda - 1.1% |
ARA Asset Management Ltd. | 693,000 | | 717,641 |
Assured Guaranty Ltd. | 3,044,700 | | 38,789,478 |
Cafe de Coral Holdings Ltd. | 314,000 | | 708,589 |
CNPC (Hong Kong) Ltd. | 17,870,000 | | 25,031,989 |
Huabao International Holdings Ltd. | 40,906,000 | | 25,985,857 |
Kosmos Energy Ltd. | 1,876,800 | | 29,090,400 |
Li & Fung Ltd. | 47,910,000 | | 92,331,883 |
Noble Group Ltd. | 62,626,000 | | 76,438,883 |
Pacific Basin Shipping Ltd. | 1,535,000 | | 699,915 |
Vtech Holdings Ltd. | 62,200 | | 580,780 |
TOTAL BERMUDA | | 290,375,415 |
Brazil - 2.0% |
All America Latina Logistica SA | 87,300 | | 434,670 |
Anhanguera Educacional Participacoes SA | 2,049,500 | | 30,136,196 |
Banco Bradesco SA | 111,400 | | 1,621,826 |
Banco Bradesco SA (PN) sponsored ADR | 3,400,000 | | 61,880,000 |
BM&F Bovespa SA | 181,100 | | 1,080,989 |
|
| Shares | | Value |
Droga Raia SA | 386,000 | | $ 5,473,503 |
Drogasil SA | 4,673,900 | | 29,395,598 |
Estacio Participacoes SA | 1,989,165 | | 23,213,875 |
Fleury SA | 46,700 | | 588,781 |
Hypermarcas SA | 96,700 | | 520,328 |
Itau Unibanco Banco Multiplo SA sponsored ADR | 6,775,800 | | 129,553,296 |
Klabin SA (PN) (non-vtg.) | 193,000 | | 710,319 |
Kroton Educacional SA unit (a) | 1,279,200 | | 14,302,725 |
Multiplus SA | 63,000 | | 1,063,941 |
Qualicorp SA | 3,366,000 | | 30,774,633 |
Souza Cruz Industria Comerico | 5,151,200 | | 63,175,094 |
T4F Entretenimento SA | 2,091,900 | | 14,618,449 |
Telefonica Brasil SA sponsored ADR (a) | 2,600,955 | | 75,479,714 |
Tractebel Energia SA | 1,917,200 | | 30,702,888 |
Usinas Siderurgicas de Minas Gerais SA - Usiminas (PN-A) (non-vtg.) | 80,000 | | 549,732 |
Valid Solucoes SA | 69,260 | | 830,862 |
Weg SA | 71,000 | | 787,649 |
Wilson Sons Ltd. unit | 57,500 | | 813,679 |
TOTAL BRAZIL | | 517,708,747 |
British Virgin Islands - 0.3% |
Arcos Dorados Holdings, Inc. | 1,737,100 | | 40,648,140 |
Camelot Information Systems, Inc. ADR (a)(d) | 1,840,603 | | 6,000,366 |
Mail.ru Group Ltd. GDR (Reg. S) | 1,065,100 | | 36,692,695 |
TOTAL BRITISH VIRGIN ISLANDS | | 83,341,201 |
Canada - 5.6% |
Agnico-Eagle Mines Ltd. (Canada) | 1,250,000 | | 54,220,796 |
Barrick Gold Corp. | 800,000 | | 39,492,401 |
Canadian Natural Resources Ltd. | 5,118,800 | | 180,545,727 |
Fairfax Financial Holdings Ltd. (sub. vtg.) | 170,000 | | 71,057,732 |
Goldcorp, Inc. | 1,859,800 | | 90,485,329 |
InterOil Corp. (a)(d) | 274,600 | | 13,046,246 |
Ivanhoe Mines Ltd. (a) | 3,235,460 | | 66,211,952 |
Niko Resources Ltd. | 2,237,500 | | 123,069,795 |
Open Text Corp. (a) | 1,440,400 | | 88,156,497 |
Osisko Mining Corp. (a) | 2,890,000 | | 34,847,570 |
Painted Pony Petroleum Ltd. (a)(f)(e) | 2,485,600 | | 30,395,209 |
Painted Pony Petroleum Ltd. Class A (a)(e) | 3,643,370 | | 44,553,022 |
Penn West Petroleum Ltd. | 754,400 | | 13,478,321 |
Petrobank Energy & Resources Ltd. | 5,356,000 | | 48,195,135 |
Petrominerales Ltd. | 3,121,175 | | 82,346,293 |
Potash Corp. of Saskatchewan, Inc. (d) | 2,589,500 | | 122,558,670 |
Silver Wheaton Corp. | 669,800 | | 23,127,367 |
Suncor Energy, Inc. | 2,661,700 | | 84,776,019 |
Talisman Energy, Inc. | 6,846,400 | | 97,114,005 |
Tourmaline Oil Corp. (a) | 1,440,000 | | 47,872,398 |
Tourmaline Oil Corp. (a)(f) | 310,100 | | 10,309,188 |
Common Stocks - continued |
| Shares | | Value |
Canada - continued |
Uranium One, Inc. | 11,314,400 | | $ 34,050,459 |
Valeant Pharmaceuticals International, Inc. (Canada) | 700,000 | | 27,639,063 |
TOTAL CANADA | | 1,427,549,194 |
Cayman Islands - 0.7% |
Boer Power Holdings Ltd. | 2,826,000 | | 1,037,408 |
China Automation Group Ltd. | 5,475,000 | | 1,900,663 |
China Lodging Group Ltd. ADR (a) | 50,100 | | 778,053 |
China ZhengTong Auto Services Holdings Ltd. | 24,761,500 | | 26,812,069 |
Geely Automobile Holdings Ltd. | 34,550,000 | | 8,833,647 |
Hengan International Group Co. Ltd. | 9,258,000 | | 80,251,579 |
HiSoft Technology International Ltd. ADR (a)(d) | 1,726,400 | | 21,372,832 |
Hutchison China Meditech Ltd. (a) | 124,800 | | 597,092 |
Mindray Medical International Ltd. sponsored ADR (d) | 48,000 | | 1,310,400 |
Minth Group Ltd. | 8,036,000 | | 8,337,881 |
NVC Lighting Holdings Ltd. | 41,380,000 | | 17,966,892 |
Samson Holding Ltd. | 6,041,000 | | 617,660 |
Sands China Ltd. (a) | 4,816,800 | | 14,475,389 |
SITC International Holdings Co. Ltd. | 2,881,000 | | 744,165 |
Xingda International Holdings Ltd. | 1,472,000 | | 843,327 |
Xueda Education Group sponsored ADR | 177,700 | | 589,964 |
TOTAL CAYMAN ISLANDS | | 186,469,021 |
Chile - 0.0% |
Compania Cervecerias Unidas SA sponsored ADR | 23,000 | | 1,317,440 |
Embotelladora Andina SA sponsored ADR | 40,000 | | 1,140,000 |
Empresa Nacional de Telecomunicaciones SA (ENTEL) | 48,876 | | 967,644 |
Inversiones Aguas Metropolitanas SA | 871,222 | | 1,369,203 |
Isapre CruzBlanca SA (a) | 868,719 | | 824,481 |
Quinenco SA | 363,717 | | 1,028,162 |
Sonda SA | 228,248 | | 557,168 |
TOTAL CHILE | | 7,204,098 |
China - 1.0% |
Baidu.com, Inc. sponsored ADR (a)(d) | 1,375,500 | | 192,817,590 |
Changsha Zoomlion Heavy Industry Science & Technology Development Co. Ltd. (H Shares) | 25,167,480 | | 36,411,889 |
China Bluechemical Ltd. (H shares) | 938,000 | | 735,046 |
China Communications Services Corp. Ltd. (H Shares) | 2,208,000 | | 1,018,299 |
China Construction Bank Corp. (H Shares) | 1,408,000 | | 1,034,507 |
Comba Telecom Systems Holdings Ltd. | 865,500 | | 730,793 |
|
| Shares | | Value |
Shandong Weigao Group Medical Polymer Co. Ltd. (H Shares) | 20,692,000 | | $ 21,505,759 |
SINA Corp. (a)(d) | 150,000 | | 12,193,500 |
TOTAL CHINA | | 266,447,383 |
Colombia - 0.0% |
Ecopetrol SA ADR | 18,000 | | 765,720 |
Curacao - 0.6% |
Schlumberger Ltd. | 2,104,800 | | 154,639,656 |
Denmark - 2.6% |
Carlsberg A/S Series B | 1,542,600 | | 105,006,110 |
Novo Nordisk A/S Series B | 4,408,339 | | 468,091,658 |
William Demant Holding A/S (a) | 1,096,698 | | 87,503,314 |
TOTAL DENMARK | | 660,601,082 |
Egypt - 0.0% |
Commercial International Bank Ltd. | 134,400 | | 598,985 |
JUHAYNA Food Industries (a) | 682,600 | | 558,111 |
TOTAL EGYPT | | 1,157,096 |
Finland - 0.1% |
Nokian Tyres PLC | 439,253 | | 16,139,273 |
France - 7.1% |
Alstom SA | 3,024,896 | | 113,444,762 |
Arkema SA | 345,300 | | 23,623,042 |
Atos Origin SA | 365,000 | | 17,689,425 |
AXA SA | 5,053,600 | | 82,315,579 |
BNP Paribas SA | 4,498,836 | | 204,522,102 |
Bureau Veritas SA | 493,400 | | 38,387,930 |
Danone | 2,707,950 | | 188,500,861 |
Dassault Aviation SA (d) | 36,265 | | 34,930,245 |
Essilor International SA | 1,754,728 | | 127,246,488 |
JC Decaux SA (a) | 990,200 | | 26,536,591 |
LVMH Moet Hennessy - Louis Vuitton | 1,827,964 | | 304,198,757 |
PPR SA | 2,051,100 | | 320,468,603 |
Publicis Groupe SA | 1,225,000 | | 59,394,047 |
Sanofi-aventis | 3,684,720 | | 263,639,409 |
TOTAL FRANCE | | 1,804,897,841 |
Germany - 7.1% |
adidas AG | 1,561,780 | | 110,574,530 |
Allianz AG | 827,462 | | 92,995,574 |
BASF AG | 2,293,559 | | 168,828,055 |
Bayer AG | 1,939,962 | | 124,288,808 |
Bayerische Motoren Werke AG (BMW) | 570,895 | | 46,661,038 |
Deutsche Boerse AG | 961,100 | | 53,202,652 |
ElringKlinger AG | 777,428 | | 21,549,929 |
Fresenius Medical Care AG & Co. KGaA | 2,737,800 | | 199,465,891 |
Fresenius SE | 2,037,100 | | 201,033,066 |
GFK AG | 1,496,500 | | 69,171,612 |
Infineon Technologies AG | 2,825,300 | | 25,527,951 |
Kabel Deutschland Holding AG (a) | 917,600 | | 52,394,698 |
Linde AG | 1,228,429 | | 195,417,632 |
Common Stocks - continued |
| Shares | | Value |
Germany - continued |
SAP AG | 2,904,790 | | $ 175,672,049 |
Siemens AG sponsored ADR (d) | 2,686,500 | | 282,001,905 |
TOTAL GERMANY | | 1,818,785,390 |
Hong Kong - 1.1% |
AIA Group Ltd. | 27,220,800 | | 83,234,101 |
China Everbright Ltd. | 470,000 | | 696,819 |
China Insurance International Holdings Co. Ltd. (a) | 314,800 | | 682,663 |
China Mobile (Hong Kong) Ltd. sponsored ADR | 1,335,275 | | 63,505,679 |
China Resources Enterprise Ltd. | 3,626,000 | | 13,242,327 |
Henderson Land Development Co. Ltd. | 9,664,155 | | 52,824,551 |
Hopewell Holdings Ltd. | 367,500 | | 954,394 |
Swire Pacific Ltd. (A Shares) | 4,577,000 | | 52,889,821 |
Television Broadcasts Ltd. | 184,000 | | 1,060,283 |
TOTAL HONG KONG | | 269,090,638 |
India - 2.2% |
Axis Bank Ltd. | 1,472,751 | | 34,807,954 |
Bajaj Auto Ltd. | 793,148 | | 28,053,344 |
Bharti Airtel Ltd. | 9,007,984 | | 72,142,424 |
Cipla Ltd. | 152,766 | | 923,047 |
CMC Ltd. | 50,598 | | 839,811 |
Cummins India Ltd. | 598,043 | | 4,879,115 |
Deccan Chronicle Holdings Ltd. (a) | 502,904 | | 531,886 |
Dr. Reddy's Laboratories Ltd. | 164,145 | | 5,561,788 |
HDFC Bank Ltd. | 12,995,695 | | 129,605,356 |
Housing Development Finance Corp. Ltd. | 6,539,994 | | 92,036,217 |
India Cements Ltd. | 419,168 | | 687,050 |
Indian Bank | 129,270 | | 572,409 |
Infrastructure Development Finance Co. Ltd. | 11,744,307 | | 31,706,496 |
ITC Ltd. | 5,213,498 | | 22,739,475 |
Jyothy Laboratories Ltd. | 196,188 | | 574,273 |
Lupin Ltd. | 513,210 | | 4,938,001 |
Mahindra & Mahindra Financial Services Ltd. | 2,226,876 | | 30,619,486 |
Max India Ltd. (a) | 159,846 | | 618,828 |
Piramal Healthcare Ltd. | 82,278 | | 606,698 |
Punjab National Bank | 47,106 | | 959,620 |
Redington India Ltd. | 285,486 | | 555,235 |
Shriram Transport Finance Co. Ltd. | 2,327,613 | | 29,139,567 |
State Bank of India | 1,273,075 | | 49,517,031 |
Tulip Telecom Ltd. | 216,760 | | 667,397 |
Wipro Ltd. | 1,388,041 | | 10,415,154 |
TOTAL INDIA | | 553,697,662 |
Ireland - 0.5% |
Accenture PLC Class A | 842,000 | | 50,738,920 |
|
| Shares | | Value |
CRH PLC | 2,294,300 | | $ 41,420,472 |
Elan Corp. PLC sponsored ADR (a) | 2,547,800 | | 30,548,122 |
TOTAL IRELAND | | 122,707,514 |
Italy - 1.8% |
ENI SpA | 914,500 | | 20,216,952 |
Fiat Industrial SpA (a) | 22,427,792 | | 195,693,464 |
Prada SpA | 7,151,000 | | 35,350,634 |
Saipem SpA | 4,438,007 | | 198,992,956 |
TOTAL ITALY | | 450,254,006 |
Japan - 13.4% |
ABC-Mart, Inc. | 1,300,200 | | 50,924,779 |
Aozora Bank Ltd. | 15,351,000 | | 38,812,684 |
Calbee, Inc. (d) | 1,161,000 | | 52,932,917 |
Denso Corp. | 1,928,200 | | 59,306,047 |
Dentsu, Inc. | 2,233,900 | | 67,271,842 |
Don Quijote Co. Ltd. | 1,603,200 | | 58,734,504 |
Fanuc Corp. | 849,100 | | 137,308,760 |
Hitachi Ltd. | 46,637,000 | | 249,926,411 |
Honda Motor Co. Ltd. | 7,721,500 | | 230,931,326 |
Hoya Corp. | 2,535,400 | | 55,397,394 |
Itochu Corp. | 13,063,600 | | 129,221,379 |
Japan Retail Fund Investment Corp. | 3,741 | | 5,791,709 |
Japan Tobacco, Inc. | 64,874 | | 324,292,254 |
JSR Corp. | 3,621,700 | | 69,147,467 |
KDDI Corp. | 27,429 | | 200,952,920 |
Keyence Corp. | 661,100 | | 168,080,270 |
Mitsubishi Corp. | 3,128,000 | | 64,341,694 |
Mitsubishi UFJ Financial Group, Inc. | 18,434,600 | | 80,125,863 |
Mitsui & Co. Ltd. | 3,506,800 | | 51,186,625 |
Nitori Holdings Co. Ltd. | 468,050 | | 44,768,217 |
NTT DoCoMo, Inc. | 63,713 | | 113,171,495 |
ORIX Corp. | 3,924,320 | | 342,539,945 |
OSAKA Titanium technologies Co. Ltd. | 120,200 | | 6,621,404 |
Rakuten, Inc. | 232,855 | | 255,296,560 |
Seven & i Holdings Co., Ltd. | 4,070,900 | | 108,648,886 |
Shimadzu Corp. | 1,668,000 | | 14,201,899 |
SHIMANO, Inc. | 1,088,100 | | 53,791,901 |
SMC Corp. | 814,700 | | 126,736,052 |
SOFTBANK CORP. | 4,765,000 | | 154,670,897 |
Sumitomo Mitsui Financial Group, Inc. | 970,800 | | 27,138,812 |
Yahoo! Japan Corp. | 268,168 | | 86,135,853 |
TOTAL JAPAN | | 3,428,408,766 |
Korea (South) - 2.1% |
Amorepacific Corp. | 90,308 | | 101,831,595 |
BS Financial Group, Inc. (a) | 84,020 | | 921,277 |
Korea Plant Service & Engineering Co. Ltd. | 23,570 | | 643,352 |
LG Corp. | 22,235 | | 1,296,413 |
LG Household & Health Care Ltd. | 59,158 | | 26,618,232 |
MegaStudy Co. Ltd. | 5,266 | | 580,249 |
Common Stocks - continued |
| Shares | | Value |
Korea (South) - continued |
NHN Corp. (a) | 518,772 | | $ 107,822,858 |
Orion Corp. | 134,404 | | 71,836,677 |
S1 Corp. | 20,993 | | 1,088,469 |
Samchully Co. Ltd. | 8,166 | | 701,699 |
Samsung Electronics Co. Ltd. | 199,807 | | 171,364,442 |
Shinhan Financial Group Co. Ltd. | 1,389,720 | | 55,155,939 |
Shinsegae Co. Ltd. | 2,714 | | 680,024 |
Sindoh Co. Ltd. | 11,340 | | 505,997 |
TOTAL KOREA (SOUTH) | | 541,047,223 |
Luxembourg - 0.3% |
Brait SA | 322,500 | | 772,085 |
Millicom International Cellular SA (depositary receipt) | 6,700 | | 738,387 |
Samsonite International SA | 26,313,700 | | 42,814,701 |
Ternium SA sponsored ADR | 1,411,261 | | 34,632,345 |
TOTAL LUXEMBOURG | | 78,957,518 |
Malaysia - 0.0% |
Parkson Holdings Bhd | 563,574 | | 1,023,070 |
Mexico - 0.8% |
America Movil SAB de CV Series L sponsored ADR | 3,033,400 | | 77,109,028 |
Grupo Televisa SA de CV (CPO) sponsored ADR | 2,180,600 | | 46,512,198 |
Urbi, Desarrollos Urbanos, SA de CV (a) | 422,300 | | 536,746 |
Wal-Mart de Mexico SA de CV Series V | 34,518,200 | | 89,171,013 |
TOTAL MEXICO | | 213,328,985 |
Netherlands - 2.7% |
AEGON NV (a) | 27,466,400 | | 131,004,746 |
ASML Holding NV (Netherlands) | 1,332,700 | | 55,913,481 |
Gemalto NV | 1,476,891 | | 67,386,376 |
ING Groep NV sponsored ADR (a)(d) | 19,501,500 | | 168,492,960 |
Koninklijke KPN NV | 10,983,331 | | 144,337,603 |
Koninklijke Philips Electronics NV (depositary receipt) (NY Reg.) | 4,051,300 | | 84,469,605 |
Unilever NV (Certificaten Van Aandelen) (Bearer) unit | 767,500 | | 26,500,744 |
Yandex NV | 450,000 | | 12,384,000 |
TOTAL NETHERLANDS | | 690,489,515 |
Norway - 1.5% |
DnB NOR ASA | 9,071,909 | | 105,830,248 |
Storebrand ASA (A Shares) | 4,980,000 | | 30,706,840 |
Telenor ASA | 14,310,000 | | 255,480,638 |
TOTAL NORWAY | | 392,017,726 |
Papua New Guinea - 0.0% |
Oil Search Ltd. | 140,611 | | 959,368 |
Philippines - 0.0% |
Banco de Oro Universal Bank | 677,000 | | 893,986 |
|
| Shares | | Value |
Manila Water Co., Inc. | 2,331,300 | | $ 1,060,800 |
Universal Robina Corp. | 899,000 | | 991,040 |
TOTAL PHILIPPINES | | 2,945,826 |
Poland - 0.0% |
Eurocash SA | 98,400 | | 788,957 |
Kruk SA (a) | 53,000 | | 706,578 |
Warsaw Stock Exchange | 44,200 | | 624,003 |
TOTAL POLAND | | 2,119,538 |
Qatar - 0.2% |
Commercial Bank of Qatar GDR (Reg. S) | 9,940,628 | | 45,591,071 |
Russia - 0.4% |
Sberbank of Russia | 20,189,400 | | 54,784,535 |
Uralkali JSC GDR (Reg. S) | 939,700 | | 40,782,980 |
TOTAL RUSSIA | | 95,567,515 |
Singapore - 0.0% |
Global Logistic Properties Ltd. | 523,000 | | 727,928 |
South Africa - 0.7% |
African Bank Investments Ltd. | 146,200 | | 634,443 |
AngloGold Ashanti Ltd. | 35,900 | | 1,622,469 |
AngloGold Ashanti Ltd. sponsored ADR | 1,750,000 | | 79,117,500 |
Aveng Ltd. | 120,300 | | 562,369 |
Foschini Ltd. | 1,702,800 | | 21,485,880 |
JSE Ltd. | 74,600 | | 660,621 |
Nampak Ltd. | 191,000 | | 524,653 |
Naspers Ltd. Class N | 860,200 | | 41,186,371 |
Sasol Ltd. | 23,900 | | 1,074,739 |
Shoprite Holdings Ltd. | 1,956,200 | | 28,668,979 |
Tiger Brands Ltd. | 408,600 | | 11,775,123 |
TOTAL SOUTH AFRICA | | 187,313,147 |
Spain - 2.6% |
Banco Bilbao Vizcaya Argentaria SA | 7,048,840 | | 63,448,157 |
Banco Santander SA (Spain) sponsored ADR (d) | 13,562,300 | | 116,093,288 |
Grifols SA ADR (a) | 9,784,300 | | 62,717,363 |
Inditex SA (d) | 3,264,772 | | 297,111,439 |
Prosegur Compania de Seguridad SA (Reg.) | 1,822,600 | | 90,928,776 |
Repsol YPF SA | 1,000,369 | | 30,318,594 |
TOTAL SPAIN | | 660,617,617 |
Sweden - 0.4% |
H&M Hennes & Mauritz AB (B Shares) | 1,292,285 | | 42,795,029 |
Swedbank AB (A Shares) | 4,284,600 | | 60,363,140 |
TOTAL SWEDEN | | 103,158,169 |
Switzerland - 4.4% |
Clariant AG (Reg.) (a) | 4,713,347 | | 51,535,029 |
Kuehne & Nagel International AG | 1,486,880 | | 185,192,848 |
Nestle SA | 6,034,542 | | 350,017,877 |
Noble Corp. | 742,700 | | 26,692,638 |
Partners Group Holding | 49,390 | | 9,258,339 |
Common Stocks - continued |
| Shares | | Value |
Switzerland - continued |
Schindler Holding AG (Reg.) | 1,278,570 | | $ 150,505,705 |
Transocean Ltd. (United States) | 1,650,300 | | 94,314,645 |
UBS AG (a) | 12,243,801 | | 154,783,795 |
Zurich Financial Services AG | 410,659 | | 95,370,411 |
TOTAL SWITZERLAND | | 1,117,671,287 |
Taiwan - 1.0% |
Chroma ATE, Inc. | 295,200 | | 588,987 |
CTCI Corp. | 544,000 | | 692,166 |
Giant Manufacturing Co. Ltd. | 195,000 | | 754,567 |
HTC Corp. | 4,228,000 | | 95,018,182 |
Motech Industries, Inc. | 381,000 | | 715,692 |
Pacific Hospital Supply Co. Ltd. | 219,064 | | 716,843 |
Powertech Technology, Inc. | 288,600 | | 702,614 |
SIMPLO Technology Co. Ltd. | 89,200 | | 524,868 |
St. Shine Optical Co. Ltd. | 53,000 | | 665,803 |
Ta Chong Bank (a) | 3,076,000 | | 885,512 |
Taiwan Fertilizer Co. Ltd. | 3,810,000 | | 9,820,065 |
Taiwan Semiconductor Manufacturing Co. Ltd. | 612,000 | | 1,491,368 |
Taiwan Semiconductor Manufacturing Co. Ltd. sponsored ADR | 10,407,200 | | 131,338,864 |
Unified-President Enterprises Corp. | 7,865,200 | | 10,815,919 |
TOTAL TAIWAN | | 254,731,450 |
Thailand - 0.0% |
Banpu PCL (For. Reg.) | 25,400 | | 515,630 |
Charoen Pokphand Foods PCL (For. Reg.) | 653,400 | | 636,326 |
PTT PCL (For. Reg.) | 93,000 | | 916,177 |
TOTAL THAILAND | | 2,068,133 |
United Arab Emirates - 0.0% |
Dubai Financial Market PJSC (a) | 2,045,195 | | 573,523 |
United Kingdom - 18.1% |
3Legs Resources PLC | 6,373,700 | | 13,837,749 |
Anglo American PLC (United Kingdom) | 3,427,600 | | 126,423,827 |
BG Group PLC | 11,701,879 | | 255,279,216 |
British American Tobacco PLC: | | | |
(United Kingdom) | 85,000 | | 3,898,004 |
sponsored ADR | 1,797,900 | | 165,856,275 |
Burberry Group PLC | 6,074,500 | | 131,002,436 |
Capita Group PLC | 7,638,800 | | 89,248,477 |
Carphone Warehouse Group PLC | 16,014,300 | | 90,397,232 |
Compass Group PLC | 150,000 | | 1,365,362 |
Filtrona PLC | 1,190,508 | | 7,602,777 |
GlaxoSmithKline PLC | 18,595,500 | | 417,404,751 |
HSBC Holdings PLC sponsored ADR | 9,939,900 | | 433,976,034 |
Imperial Tobacco Group PLC | 2,149,970 | | 78,625,409 |
Inchcape PLC | 17,114,619 | | 89,809,932 |
|
| Shares | | Value |
ITV PLC | 62,863,890 | | $ 64,753,082 |
Lloyds Banking Group PLC (a) | 229,626,800 | | 118,767,489 |
Misys PLC | 13,125,310 | | 61,593,504 |
National Grid PLC | 308,000 | | 3,062,719 |
Next PLC | 3,224,800 | | 132,557,312 |
Ocado Group PLC (a)(d) | 9,816,418 | | 14,784,304 |
Pan African Resources PLC | 3,344,300 | | 699,179 |
Pearson PLC | 10,425,200 | | 191,555,485 |
Pz Cussons PLC Class L | 1,957,500 | | 11,584,829 |
QinetiQ Group PLC | 12,165,700 | | 22,851,778 |
Reckitt Benckiser Group PLC | 6,620,100 | | 340,473,304 |
Rockhopper Exploration PLC (a) | 201,600 | | 693,816 |
Rolls-Royce Group PLC | 18,758,100 | | 211,921,603 |
Rolls-Royce Group PLC Class C | 1,294,308,900 | | 2,081,508 |
Royal Dutch Shell PLC: | | | |
Class A (United Kingdom) | 198,500 | | 7,033,114 |
Class A sponsored ADR | 4,900,000 | | 347,459,000 |
Class B sponsored ADR | 10,527,400 | | 755,867,323 |
Standard Chartered PLC (United Kingdom) | 105,587 | | 2,477,455 |
SuperGroup PLC (a)(d) | 1,516,200 | | 15,215,322 |
Vodafone Group PLC sponsored ADR | 14,974,100 | | 416,878,944 |
TOTAL UNITED KINGDOM | | 4,627,038,551 |
United States of America - 5.0% |
Anadarko Petroleum Corp. | 10,800 | | 847,800 |
Apple, Inc. (a) | 654,300 | | 264,847,554 |
CF Industries Holdings, Inc. | 470,800 | | 76,396,716 |
Citigroup, Inc. | 5,105,150 | | 161,271,689 |
Cognizant Technology Solutions Corp. Class A (a) | 658,900 | | 47,934,975 |
Facebook, Inc. Class B (g) | 1,288,142 | | 32,203,550 |
Green Mountain Coffee Roasters, Inc. (a) | 280,100 | | 18,212,102 |
Intuit, Inc. | 321,900 | | 17,276,373 |
Nabors Industries Ltd. (a) | 1,587,600 | | 29,100,708 |
Newmont Mining Corp. | 1,000,000 | | 66,830,000 |
Noble Energy, Inc. | 782,728 | | 69,928,920 |
Polycom, Inc. (a) | 2,900,000 | | 47,937,000 |
PriceSmart, Inc. | 43,700 | | 3,322,948 |
SanDisk Corp. (a) | 2,032,400 | | 102,981,708 |
Schweitzer-Mauduit International, Inc. (e) | 1,608,255 | | 113,092,492 |
The Mosaic Co. | 1,132,300 | | 66,307,488 |
Unisys Corp. (a) | 1,537,730 | | 39,965,603 |
Virgin Media, Inc. | 917,500 | | 22,368,650 |
Wells Fargo & Co. | 4,129,500 | | 106,995,345 |
TOTAL UNITED STATES OF AMERICA | | 1,287,821,621 |
TOTAL COMMON STOCKS (Cost $21,875,227,771) |
24,327,847,370
|
Nonconvertible Preferred Stocks - 1.5% |
| Shares | | Value |
Germany - 1.5% |
ProSiebenSat.1 Media AG | 3,507,000 | | $ 75,226,728 |
Volkswagen AG | 1,736,326 | | 304,687,918 |
TOTAL NONCONVERTIBLE PREFERRED STOCKS (Cost $221,929,530) |
379,914,646
|
Master Notes - 0.0% |
| Principal Amount | | |
Canada - 0.0% |
OZ Optics Ltd. 5% 11/5/14 (g)
(Cost $276,258) | | $ 270,994 | |
270,994
|
Money Market Funds - 6.3% |
| Shares | | |
Fidelity Cash Central Fund, 0.12% (b) | 725,272,617 | | 725,272,617 |
Fidelity Securities Lending Cash Central Fund, 0.11% (b)(c) | 886,536,637 | | 886,536,637 |
TOTAL MONEY MARKET FUNDS (Cost $1,611,809,254) |
1,611,809,254
|
TOTAL INVESTMENT
PORTFOLIO - 102.9% (Cost $23,709,242,813) | 26,319,842,264 |
NET OTHER ASSETS (LIABILITIES) - (2.9)% | (747,943,275) |
NET ASSETS - 100% | $ 25,571,898,989 |
Legend |
(a) Non-income producing |
(b) Affiliated fund that is available only to investment companies and other accounts managed by Fidelity Investments. The rate quoted is the annualized seven-day yield of the fund at period end. A complete unaudited listing of the fund's holdings as of its most recent quarter end is available upon request. In addition, each Fidelity Central Fund's financial statements, which are not covered by the Fund's Report of Independent Registered Public Accounting Firm, are available on the SEC's website or upon request. |
(c) Investment made with cash collateral received from securities on loan. |
(d) Security or a portion of the security is on loan at period end. |
(e) Affiliated company |
(f) Security exempt from registration under Rule 144A of the Securities Act of 1933. These securities may be resold in transactions exempt from registration, normally to qualified institutional buyers. At the end of the period, the value of these securities amounted to $40,704,397 or 0.2% of net assets. |
(g) Restricted securities - Investment in securities not registered under the Securities Act of 1933 (excluding 144A issues). At the end of the period, the value of restricted securities (excluding 144A issues) amounted to $32,474,544 or 0.1% of net assets. |
Additional information on each restricted holding is as follows: |
Security | Acquisition Date | Acquisition Cost |
Facebook, Inc. Class B | 3/31/11 | $ 32,203,550 |
OZ Optics Ltd. 5% 11/5/14 | 11/5/10 | $ 276,258 |
Affiliated Central Funds |
Information regarding fiscal year to date income earned by the Fund from investments in Fidelity Central Funds is as follows: |
Fund | Income earned |
Fidelity Cash Central Fund | $ 1,220,251 |
Fidelity Securities Lending Cash Central Fund | 20,356,167 |
Total | $ 21,576,418 |
Other Affiliated Issuers |
An affiliated company is a company in which the Fund has ownership of at least 5% of the voting securities. Fiscal year to date transactions with companies which are or were affiliates are as follows: |
Affiliate | Value,
beginning of period | Purchases | Sales
Proceeds | Dividend
Income | Value,
end of
period |
Ashmore Global Opportunities Ltd. (United States) | $ - | $ 9,748,350 | $ - | $ 240,285 | $ - |
Painted Pony Petroleum Ltd. | 9,544,006 | 11,945,802 | - | - | 30,395,209 |
Painted Pony Petroleum Ltd. Class A | 21,509,462 | 5,212,327 | - | - | 44,553,022 |
Petrobank Energy & Resources Ltd. | 223,863,859 | - | 1,729,615 | 108,873,999 | - |
Schweitzer-Mauduit International, Inc. | 83,300,121 | 17,267,467 | - | 907,782 | 113,092,492 |
Total | $ 338,217,448 | $ 44,173,946 | $ 1,729,615 | $ 110,022,066 | $ 188,040,723 |
Other Information |
The following is a summary of the inputs used, as of October 31, 2011, involving the Fund's assets and liabilities carried at fair value. The inputs or methodology used for valuing securities may not be an indication of the risk associated with investing in those securities. For more information on valuation inputs, and their aggregation into the levels used in the tables below, please refer to the Security Valuation section in the accompanying Notes to Financial Statements. |
Valuation Inputs at Reporting Date: |
Description | Total | Level 1 | Level 2 | Level 3 |
Investments in Securities: | | | | |
Equities: | | | | |
United Kingdom | $ 4,627,038,551 | $ 3,885,316,989 | $ 741,721,562 | $ - |
Japan | 3,428,408,766 | - | 3,428,408,766 | - |
Germany | 2,198,700,036 | 1,823,562,096 | 375,137,940 | - |
France | 1,804,897,841 | 1,541,258,432 | 263,639,409 | - |
Canada | 1,427,549,194 | 1,427,549,194 | - | - |
United States of America | 1,287,821,621 | 1,255,618,071 | - | 32,203,550 |
Switzerland | 1,117,671,287 | 962,887,492 | 154,783,795 | - |
Australia | 927,621,571 | 538,478,720 | 389,142,851 | - |
Netherlands | 690,489,515 | 477,070,544 | 213,418,971 | - |
Other | 7,197,563,634 | 4,195,813,680 | 3,001,749,954 | - |
Master Notes | 270,994 | - | - | 270,994 |
Money Market Funds | 1,611,809,254 | 1,611,809,254 | - | - |
Total Investments in Securities: | $ 26,319,842,264 | $ 17,719,364,472 | $ 8,568,003,248 | $ 32,474,544 |
The following is a reconciliation of Investments in Securities for which Level 3 inputs were used in determining value: |
Investments in Securities: | |
Beginning Balance | $ 451,860 |
Total Realized Gain (Loss) | (1,057,894) |
Total Unrealized Gain (Loss) | 1,048,395 |
Cost of Purchases | 32,666,617 |
Proceeds of Sales | (632,318) |
Amortization/Accretion | (2,116) |
Transfers in to Level 3 | - |
Transfers out of Level 3 | - |
Ending Balance | $ 32,474,544 |
The change in unrealized gain (loss) for the period attributable to Level 3 securities held at October 31, 2011 | $ (5,264) |
The information used in the above reconciliation represents fiscal year to date activity for any Investments in Securities identified as using Level 3 inputs at either the beginning or the end of the current fiscal period. Transfers in or out of Level 3 represent the beginning value of any Security or Instrument where a change in the pricing level occurred from the beginning to the end of the period. The cost of purchases and the proceeds of sales may include securities received or delivered through corporate actions or exchanges. Realized and unrealized gains (losses) disclosed in the reconciliation are included in Net Gain (Loss) on the Fund's Statement of Operations. |
Income Tax Information |
At October 31, 2011, the Fund had a capital loss carryforward of approximately $3,286,171,990 of which $2,666,600,138 and $619,571,852 will expire in fiscal 2017 and 2018, respectively. Capital loss carryforwards are only available to offset future capital gains of the Fund to the extent provided by regulations and may be limited. |
See accompanying notes which are an integral part of the financial statements.
Annual Report
Fidelity Diversified International Fund
Statement of Assets and Liabilities
| October 31, 2011 |
Assets | | |
Investment in securities, at value (including securities loaned of $813,313,897) - See accompanying schedule: Unaffiliated issuers (cost $21,967,898,714) | $ 24,519,992,287 | |
Fidelity Central Funds (cost $1,611,809,254) | 1,611,809,254 | |
Other affiliated issuers (cost $129,534,845) | 188,040,723 | |
Total Investments (cost $23,709,242,813) | | $ 26,319,842,264 |
Foreign currency held at value (cost $251,333) | | 251,333 |
Receivable for investments sold | | 234,571,947 |
Receivable for fund shares sold | | 74,623,129 |
Dividends receivable | | 62,708,309 |
Interest receivable | | 17,819 |
Distributions receivable from Fidelity Central Funds | | 360,288 |
Prepaid expenses | | 98,276 |
Other receivables | | 2,945,967 |
Total assets | | 26,695,419,332 |
Liabilities | | |
Payable for investments purchased | $ 100,359,104 | |
Payable for fund shares redeemed | 117,607,449 | |
Accrued management fee | 13,820,459 | |
Other affiliated payables | 3,926,570 | |
Other payables and accrued expenses | 1,270,124 | |
Collateral on securities loaned, at value | 886,536,637 | |
Total liabilities | | 1,123,520,343 |
Net Assets | | $ 25,571,898,989 |
Net Assets consist of: | | |
Paid in capital | | $ 25,969,888,803 |
Undistributed net investment income | | 418,909,977 |
Accumulated undistributed net realized gain (loss) on investments and foreign currency transactions | | (3,430,253,408) |
Net unrealized appreciation (depreciation) on investments and assets and liabilities in foreign currencies | | 2,613,353,617 |
Net Assets | | $ 25,571,898,989 |
Diversified International:
Net Asset Value, offering price and redemption price per share ($17,285,369,497 ÷ 628,706,658 shares) | | $ 27.49 |
| | |
Class K:
Net Asset Value, offering price and redemption price per share ($8,115,192,236 ÷ 295,039,055 shares) | | $ 27.51 |
| | |
Class F:
Net Asset Value, offering price and redemption price per share ($171,337,256 ÷ 6,228,258 shares) | | $ 27.51 |
Statement of Operations
| Year ended October 31, 2011 |
Investment Income | | |
Dividends (including $1,148,067 earned from other affiliated issuers) | | $ 775,256,545 |
Special dividends (earned from other affiliated issuers) | | 108,873,999 |
Interest | | 21,709 |
Income from Fidelity Central Funds | | 21,576,418 |
Income before foreign taxes withheld | | 905,728,671 |
Less foreign taxes withheld | | (61,260,298) |
Total income | | 844,468,373 |
| | |
Expenses | | |
Management fee
Basic fee | $ 225,204,522 | |
Performance adjustment | (17,677,656) | |
Transfer agent fees | 55,414,460 | |
Accounting and security lending fees | 2,636,921 | |
Custodian fees and expenses | 4,452,390 | |
Independent trustees' compensation | 179,973 | |
Depreciation in deferred trustee compensation account | (24) | |
Registration fees | 241,072 | |
Audit | 217,935 | |
Legal | 139,565 | |
Miscellaneous | 378,639 | |
Total expenses before reductions | 271,187,797 | |
Expense reductions | (8,678,523) | 262,509,274 |
Net investment income (loss) | | 581,959,099 |
Realized and Unrealized Gain (Loss) Net realized gain (loss) on: | | |
Investment securities: | | |
Unaffiliated issuers | 1,889,598,151 | |
Other affiliated issuers | (2,483,501) | |
Foreign currency transactions | (5,612,204) | |
Total net realized gain (loss) | | 1,881,502,446 |
Change in net unrealized appreciation (depreciation) on: Investment securities (net of decrease in deferred foreign taxes of $3,985,288) | (3,644,214,790) | |
Assets and liabilities in foreign currencies | (2,069,131) | |
Total change in net unrealized appreciation (depreciation) | | (3,646,283,921) |
Net gain (loss) | | (1,764,781,475) |
Net increase (decrease) in net assets resulting from operations | | $ (1,182,822,376) |
See accompanying notes which are an integral part of the financial statements.
Annual Report
Statement of Changes in Net Assets
| Year ended
October 31,
2011 | Year ended
October 31,
2010 |
Increase (Decrease) in Net Assets | | |
Operations | | |
Net investment income (loss) | $ 581,959,099 | $ 486,439,991 |
Net realized gain (loss) | 1,881,502,446 | (561,752,757) |
Change in net unrealized appreciation (depreciation) | (3,646,283,921) | 3,614,151,999 |
Net increase (decrease) in net assets resulting from operations | (1,182,822,376) | 3,538,839,233 |
Distributions to shareholders from net investment income | (554,171,382) | (474,506,693) |
Distributions to shareholders from net realized gain | (93,780,346) | - |
Total distributions | (647,951,728) | (474,506,693) |
Share transactions - net increase (decrease) | (7,417,526,738) | (3,995,252,806) |
Redemption fees | 964,713 | 822,251 |
Total increase (decrease) in net assets | (9,247,336,129) | (930,098,015) |
| | |
Net Assets | | |
Beginning of period | 34,819,235,118 | 35,749,333,133 |
End of period (including undistributed net investment income of $418,909,977 and undistributed net investment income of $424,022,673, respectively) | $ 25,571,898,989 | $ 34,819,235,118 |
Financial Highlights - Diversified International
Years ended October 31, | 2011 | 2010 | 2009 | 2008 | 2007 |
Selected Per-Share Data | | | | | |
Net asset value, beginning of period | $ 29.49 | $ 26.86 | $ 21.96 | $ 45.41 | $ 37.58 |
Income from Investment Operations | | | | | |
Net investment income (loss) B | .53 E | .37 | .35 | .55 | .47 |
Net realized and unrealized gain (loss) | (1.99) | 2.61 | 4.86 | (20.96) | 10.23 |
Total from investment operations | (1.46) | 2.98 | 5.21 | (20.41) | 10.70 |
Distributions from net investment income | (.46) | (.35) | (.31) | (.47) | (.36) |
Distributions from net realized gain | (.08) | - | - | (2.57) | (2.51) |
Total distributions | (.54) | (.35) | (.31) | (3.04) | (2.87) |
Redemption fees added to paid in capital B, G | - | - | - | - | - |
Net asset value, end of period | $ 27.49 | $ 29.49 | $ 26.86 | $ 21.96 | $ 45.41 |
Total Return A | (5.07)% | 11.15% | 24.32% | (48.04)% | 30.37% |
Ratios to Average Net Assets C,F | | | | | |
Expenses before reductions | .90% | .98% | 1.01% | 1.04% | .93% |
Expenses net of fee waivers, if any | .89% | .98% | 1.01% | 1.04% | .93% |
Expenses net of all reductions | .87% | .96% | .99% | 1.02% | .91% |
Net investment income (loss) | 1.78% E | 1.34% | 1.58% | 1.53% | 1.20% |
Supplemental Data | | | | | |
Net assets, end of period (000 omitted) | $ 17,285,369 | $ 26,527,229 | $ 30,998,270 | $ 28,274,961 | $ 59,929,942 |
Portfolio turnover rate D | 45% | 57% | 54% | 49% | 51% |
A Total returns would have been lower if certain expenses had not been reduced during the applicable periods shown.
B Calculated based on average shares outstanding during the period.
C Fees and expenses of any underlying Fidelity Central Funds are not included in the Fund's expense ratio. The Fund indirectly bears its proportionate share of the expenses of any underlying Fidelity Central Funds.
D Amount does not include the portfolio activity of any underlying Fidelity Central Funds.
E Investment income per share reflects a special dividend which amounted to $.10 per share. Excluding the special dividend, the ratio of net investment income (loss) to average net assets would have been 1.44%.
F Expense ratios reflect operating expenses of the class. Expenses before reductions do not reflect amounts reimbursed by the investment adviser or reductions from brokerage service arrangements or reductions from other expense offset arrangements and do not represent the amount paid by the class during periods when reimbursements or reductions occur. Expenses net of fee waivers reflect expenses after reimbursement by the investment adviser but prior to reductions from brokerage service arrangements or other expense offset arrangements. Expenses net of all reductions represent the net expenses paid by the class.
G Amount represents less than $.01 per share.
See accompanying notes which are an integral part of the financial statements.
Annual Report
Financial Highlights - Class K
Years ended October 31, | 2011 | 2010 | 2009 | 2008 H |
Selected Per-Share Data | | | | |
Net asset value, beginning of period | $ 29.51 | $ 26.89 | $ 21.98 | $ 38.39 |
Income from Investment Operations | | | | |
Net investment income (loss) D | .58 G | .42 | .42 | .16 |
Net realized and unrealized gain (loss) | (1.97) | 2.61 | 4.85 | (16.57) |
Total from investment operations | (1.39) | 3.03 | 5.27 | (16.41) |
Distributions from net investment income | (.53) | (.41) | (.36) | - |
Distributions from net realized gain | (.08) | - | - | - |
Total distributions | (.61) | (.41) | (.36) | - |
Redemption fees added to paid in capital D,J | - | - | - | - |
Net asset value, end of period | $ 27.51 | $ 29.51 | $ 26.89 | $ 21.98 |
Total Return B,C | (4.87)% | 11.33% | 24.64% | (42.75)% |
Ratios to Average Net Assets E,I | | | | |
Expenses before reductions | .73% | .79% | .77% | .88% A |
Expenses net of fee waivers, if any | .72% | .79% | .77% | .88% A |
Expenses net of all reductions | .70% | .77% | .76% | .87% A |
Net investment income (loss) | 1.95% G | 1.54% | 1.81% | 1.45% A |
Supplemental Data | | | | |
Net assets, end of period (000 omitted) | $ 8,115,192 | $ 7,697,405 | $ 4,713,909 | $ 932,275 |
Portfolio turnover rate F | 45% | 57% | 54% | 49% |
A Annualized
B Total returns for periods of less than one year are not annualized.
C Total returns would have been lower if certain expenses had not been reduced during the applicable periods shown.
D Calculated based on average shares outstanding during the period.
E Fees and expenses of any underlying Fidelity Central Funds are not included in the Fund's expense ratio. The Fund indirectly bears its proportionate share of the expenses of any underlying Fidelity Central Funds.
F Amount does not include the portfolio activity of any underlying Fidelity Central Funds.
G Investment income per share reflects a special dividend which amounted to $.10 per share. Excluding the special dividend, the ratio of net investment income (loss) to average net assets would have been 1.61%.
H For the period May 9, 2008 (commencement of sale of shares) to October 31, 2008.
I Expense ratios reflect operating expenses of the class. Expenses before reductions do not reflect amounts reimbursed by the investment adviser or reductions from brokerage service arrangements or reductions from other expense offset arrangements and do not represent the amount paid by the class during periods when reimbursements or reductions occur. Expense ratios before reductions for start-up periods may not be representative of longer-term operating periods. Expenses net of fee waivers reflect expenses after reimbursement by the investment adviser but prior to reductions from brokerage service arrangements or other expense offset arrangements. Expenses net of all reductions represent the net expenses paid by the class.
J Amount represents less than $.01 per share.
Financial Highlights - Class F
Years ended October 31, | 2011 | 2010 | 2009 H |
Selected Per-Share Data | | | |
Net asset value, beginning of period | $ 29.52 | $ 26.89 | $ 23.29 |
Income from Investment Operations | | | |
Net investment income (loss) D | .61 G | .43 | (.02) |
Net realized and unrealized gain (loss) | (2.00) | 2.62 | 3.62 |
Total from investment operations | (1.39) | 3.05 | 3.60 |
Distributions from net investment income | (.54) | (.42) | - |
Distributions from net realized gain | (.08) | - | - |
Total distributions | (.62) | (.42) | - |
Redemption fees added to paid in capital D,J | - | - | - |
Net asset value, end of period | $ 27.51 | $ 29.52 | $ 26.89 |
Total Return B,C | (4.86)% | 11.41% | 15.46% |
Ratios to Average Net Assets E,I | | | |
Expenses before reductions | .68% | .73% | .71% A |
Expenses net of fee waivers, if any | .67% | .73% | .71% A |
Expenses net of all reductions | .65% | .72% | .70% A |
Net investment income (loss) | 2.00% G | 1.59% | (.19)% A |
Supplemental Data | | | |
Net assets, end of period (000 omitted) | $ 171,337 | $ 594,602 | $ 37,155 |
Portfolio turnover rate F | 45% | 57% | 54% |
A Annualized
B Total returns for periods of less than one year are not annualized.
C Total returns would have been lower if certain expenses had not been reduced during the applicable periods shown.
D Calculated based on average shares outstanding during the period.
E Fees and expenses of any underlying Fidelity Central Funds are not included in the Fund's expense ratio. The Fund indirectly bears its proportionate share of the expenses of any underlying Fidelity Central Funds.
F Amount does not include the portfolio activity of any underlying Fidelity Central Funds.
G Investment income per share reflects a special dividend which amounted to $.10 per share. Excluding the special dividend, the ratio of net investment income (loss) to average net assets would have been 1.66%.
H For the period June 26, 2009 (commencement of sale of shares) to October 31, 2009.
I Expense ratios reflect operating expenses of the class. Expenses before reductions do not reflect amounts reimbursed by the investment adviser or reductions from brokerage service arrangements or reductions from other expense offset arrangements and do not represent the amount paid by the class during periods when reimbursements or reductions occur. Expense ratios before reductions for start-up periods may not be representative of longer-term operating periods. Expenses net of fee waivers reflect expenses after reimbursement by the investment adviser but prior to reductions from brokerage service arrangements or other expense offset arrangements. Expenses net of all reductions represent the net expenses paid by the class.
J Amount represents less than $.01 per share.
See accompanying notes which are an integral part of the financial statements.
Annual Report
Notes to Financial Statements
For the period ended October 31, 2011
1. Organization.
Fidelity Diversified International Fund (the Fund) is a fund of Fidelity Investment Trust (the Trust) and is authorized to issue an unlimited number of shares. The Trust is registered under the Investment Company Act of 1940, as amended (the 1940 Act), as an open-end management investment company organized as a Massachusetts business trust. The Fund offers Diversified International, Class K and Class F shares, each of which, has equal rights as to assets and voting privileges. Each class has exclusive voting rights with respect to matters that affect that class. Class F shares of the Fund are only available for purchase by mutual funds for which Fidelity Management & Research Company (FMR) or an affiliate serves as investment manager. Investment income, realized and unrealized capital gains and losses, the common expenses of the Fund, and certain fund-level expense reductions, if any, are allocated on a pro-rata basis to each class based on the relative net assets of each class to the total net assets of the Fund. Each class differs with respect to transfer agent fees incurred. Certain expense reductions may also differ by class. The Fund's investments in emerging markets can be subject to social, economic, regulatory, and political uncertainties and can be extremely volatile.
2. Investments in Fidelity Central Funds.
The Fund invests in Fidelity Central Funds, which are open-end investment companies available only to other investment companies and accounts managed by Fidelity Management & Research Company (FMR) and its affiliates. The Fund's Schedule of Investments lists each of the Fidelity Central Funds held as of period end, if any, as an investment of the Fund, but does not include the underlying holdings of each Fidelity Central Fund. As an Investing Fund, the Fund indirectly bears its proportionate share of the expenses of the underlying Fidelity Central Funds.
The Money Market Central Funds seek preservation of capital and current income and are managed by Fidelity Investments Money Management, Inc. (FIMM), an affiliate of FMR.
A complete unaudited list of holdings for each Fidelity Central Fund is available upon request or at the Securities and Exchange Commission (the SEC) web site at www.sec.gov. In addition, the financial statements of the Fidelity Central Funds, which are not covered by the Fund's Report of Independent Registered Public Accounting Firm are available on the SEC web site or upon request.
3. Significant Accounting Policies.
The financial statements have been prepared in conformity with accounting principles generally accepted in the United States of America (GAAP), which require management to make certain estimates and assumptions at the date of the financial statements. Actual results could differ from those estimates. Subsequent events, if any, through the date that the financial statements were issued have been evaluated in the preparation of the financial statements. The following summarizes the significant accounting policies of the Fund:
Security Valuation. Investments are valued as of 4:00 p.m. Eastern time on the last calendar day of the period. The Fund uses independent pricing services approved by the Board of Trustees to value its investments. When current market prices or quotations are not readily available or reliable, valuations may be determined in good faith in accordance with procedures adopted by the Board of Trustees. Factors used in determining value may include market or security specific events, changes in interest rates and credit quality. The frequency with which these procedures are used cannot be predicted and they may be utilized to a significant extent. The value used for net asset value (NAV) calculation under these procedures may differ from published prices for the same securities.
The Fund categorizes the inputs to valuation techniques used to value its investments into a disclosure hierarchy consisting of three levels as shown below:
Level 1 - quoted prices in active markets for identical investments
Level 2 - other significant observable inputs (including quoted prices for similar investments, interest rates, prepayment speeds, etc.)
Level 3 - unobservable inputs (including the Fund's own assumptions based on the best information available)
Changes in valuation techniques may result in transfers in or out of an assigned level within the disclosure hierarchy. The aggregate value of investments by input level, as of October 31, 2011, as well as a roll forward of Level 3 securities, is included at the end of the Fund's Schedule of Investments. Valuation techniques used to value the Fund's investments by major category are as follows:
Equity securities, including restricted securities, for which market quotations are readily available, are valued at the last reported sale price or official closing price as reported by an independent pricing service on the primary market or exchange on which they are traded and are categorized as Level 1 in the hierarchy. In the event there were no sales during the day or closing prices are not available, securities are valued at the last quoted bid price or may be valued using the last available price and are generally categorized as Level 2 in the hierarchy. For foreign equity securities, when significant market or security specific events arise, comparisons to the valuation of American Depositary Receipts (ADRs), futures contracts, Exchange-traded funds (ETFs) and certain indexes as well as quoted prices for similar securities are used and are categorized as Level 2 in the hierarchy in these circumstances. Utilizing these techniques may result in transfers between Level 1 and Level 2. For restricted equity securities and private placements where observable inputs are limited, assumptions about market activity and risk are used and are categorized as Level 3 in the hierarchy.
Annual Report
Notes to Financial Statements - continued
3. Significant Accounting Policies - continued
Security Valuation - continued
Debt securities, including restricted securities, are valued based on evaluated prices received from independent pricing services or from dealers who make markets in such securities. For master notes, pricing services utilize matrix pricing which considers yield or price of bonds of comparable quality, coupon, maturity and type as well as dealer supplied prices and are generally categorized as Level 2 in the hierarchy.
When independent prices are unavailable or unreliable, debt securities may be valued utilizing pricing matrices which consider similar factors that would be used by independent pricing services. These are generally categorized as Level 2 in the hierarchy but may be Level 3 depending on the circumstances.
Investments in open-end mutual funds, including the Fidelity Central Funds, are valued at their closing net asset value each business day and are categorized as Level 1 in the hierarchy.
Foreign Currency. The Fund may use foreign currency contracts to facilitate transactions in foreign-denominated securities. Gains and losses from these transactions may arise from changes in the value of the foreign currency or if the counterparties do not perform under the contracts' terms.
Foreign-denominated assets, including investment securities, and liabilities are translated into U.S. dollars at the exchange rate at period end. Purchases and sales of investment securities, income and dividends received and expenses denominated in foreign currencies are translated into U.S. dollars at the exchange rate in effect on the transaction date.
The effects of exchange rate fluctuations on investments are included with the net realized and unrealized gain (loss) on investment securities. Other foreign currency transactions resulting in realized and unrealized gain (loss) are disclosed separately.
Investment Transactions and Income. For financial reporting purposes, the Fund's investment holdings and NAV include trades executed through the end of the last business day of the period. The NAV per share for processing shareholder transactions is calculated as of the close of business of the New York Stock Exchange (NYSE), normally 4:00 p.m. Eastern time and includes trades executed through the end of the prior business day. Gains and losses on securities sold are determined on the basis of identified cost and may include proceeds received from litigation. Dividend income is recorded on the ex-dividend date, except for certain dividends from foreign securities where the ex-dividend date may have passed, which are recorded as soon as the Fund is informed of the ex-dividend date. Non-cash dividends included in dividend income, if any, are recorded at the fair market value of the securities received. Distributions received on securities that represent a return of capital or capital gain are recorded as a reduction of cost of investments and/or as a realized gain. The Fund estimates the components of distributions received that may be considered return of capital distributions or capital gain distributions. Large, non-recurring dividends recognized by the Fund are presented separately on the Statement of Operations as "Special Dividends" and the impact of these dividends is presented in the Financial Highlights. Interest income and distributions from the Fidelity Central Funds are accrued as earned. Interest income includes coupon interest and amortization of premium and accretion of discount on debt securities. Investment income is recorded net of foreign taxes withheld where recovery of such taxes is uncertain.
Expenses. Expenses directly attributable to a fund are charged to that fund. Expenses attributable to more than one fund are allocated among the respective funds on the basis of relative net assets or other appropriate methods. Expense estimates are accrued in the period to which they relate and adjustments are made when actual amounts are known.
Deferred Trustee Compensation. Under a Deferred Compensation Plan (the Plan), independent Trustees may elect to defer receipt of a portion of their annual compensation. Deferred amounts are invested in a cross-section of Fidelity funds, are marked-to-market and remain in the Fund until distributed in accordance with the Plan. The investment of deferred amounts and the offsetting payable to the Trustees are included in the accompanying Statement of Assets and Liabilities.
Income Tax Information and Distributions to Shareholders. Each year, the Fund intends to qualify as a regulated investment company, including distributing substantially all of its taxable income and realized gains under Subchapter M of the Internal Revenue Code and filing its U.S. federal tax return. As a result, no provision for income taxes is required. As of October 31, 2011, the Fund did not have any unrecognized tax benefits in the financial statements. A fund's federal tax return is subject to examination by the Internal Revenue Service (IRS) for a period of three years. Foreign taxes are provided for based on the Fund's understanding of the tax rules and rates that exist in the foreign markets in which it invests.
Distributions are declared and recorded on the ex-dividend date. Income dividends and capital gain distributions are declared separately for each class. Income and capital gain distributions are determined in accordance with income tax regulations, which may differ from GAAP.
Capital accounts within the financial statements are adjusted for permanent book-tax differences. These adjustments have no impact on net assets or the results of operations. Temporary book-tax differences will reverse in a subsequent period.
Annual Report
3. Significant Accounting Policies - continued
Income Tax Information and Distributions to Shareholders - continued
Book-tax differences are primarily due to foreign currency transactions, certain foreign taxes, passive foreign investment companies (PFIC), deferred trustees compensation, capital loss carryforwards and losses deferred due to wash sales.
The federal tax cost of investment securities and unrealized appreciation (depreciation) as of period end were as follows:
Gross unrealized appreciation | $ 4,524,622,015 |
Gross unrealized depreciation | (2,058,103,983) |
Net unrealized appreciation (depreciation) on securities and other investments | $ 2,466,518,032 |
| |
Tax Cost | $ 23,853,324,232 |
The tax-based components of distributable earnings as of period end were as follows:
Undistributed ordinary income | $ 419,615,619 |
Capital Loss Carryfoward | $ (3,286,171,990) |
Net unrealized appreciation (depreciation) | $ 2,469,263,889 |
Under the recently enacted Regulated Investment Company Modernization Act of 2010 (the Act), the Fund will be permitted to carry forward capital losses incurred in taxable years beginning after December 22, 2010 for an unlimited period. However, any losses incurred during those future taxable years will be required to be utilized prior to any losses incurred in pre-enactment taxable years, which generally expire after eight years from when they are incurred. Additionally, post-enactment capital losses that are carried forward will retain their character as either short-term or long-term capital losses rather than being considered all short-term as under previous law. The Fund's first fiscal year end subject to the Act will be October 31, 2012.
The tax character of distributions paid was as follows:
| October 31, 2011 | October 31, 2010 |
Ordinary Income | $ 647,951,728 | $ 474,506,693 |
Short-Term Trading (Redemption) Fees. Shares held by investors in the Fund less than 30 days are subject to a redemption fee equal to 1.00% of the net asset value of shares redeemed. All redemption fees, which reduce the proceeds of the shareholder redemption, are retained by the Fund and accounted for as an addition to paid in capital.
New Accounting Pronouncement. In May 2011, the Financial Accounting Standards Board issued Accounting Standard Update No. 2011-04, Fair Value Measurement (Topic 820) - Amendments to Achieve Common Fair Value Measurement and Disclosure Requirements in U.S. GAAP and IFRSs. The update changes the wording used to describe the requirements in GAAP for measuring fair value and for disclosing information about fair value measurements. The update is effective during interim and annual periods beginning after December 15, 2011. Management is currently evaluating the impact of the update's adoption on the Fund's financial statement disclosures.
4. Operating Policies.
Restricted Securities. The Fund may invest in securities that are subject to legal or contractual restrictions on resale. These securities generally may be resold in transactions exempt from registration or to the public if the securities are registered. Disposal of these securities may involve time-consuming negotiations and expense, and prompt sale at an acceptable price may be difficult. Information regarding restricted securities is included at the end of the Fund's Schedule of Investments.
5. Purchases and Sales of Investments.
Purchases and sales of securities, other than short-term securities, aggregated $13,875,962,686 and $20,794,928,294, respectively.
Annual Report
Notes to Financial Statements - continued
6. Fees and Other Transactions with Affiliates.
Management Fee. FMR and its affiliates provide the Fund with investment management related services for which the Fund pays a monthly management fee. The management fee is the sum of an individual fund fee rate that is based on an annual rate of .45% of the Fund's average net assets and a group fee rate that averaged .26% during the period. The group fee rate is based upon the average net assets of all the mutual funds advised by FMR. The group fee rate decreases as assets under management increase and increases as assets under management decrease. In addition, the management fee is subject to a performance adjustment (up to a maximum of ±.20% of the Fund's average net assets over a 36 month performance period). The upward or downward adjustment to the management fee is based on the relative investment performance of Diversified International as compared to an appropriate benchmark index. For the period, the total annual management fee rate, including the performance adjustment, was .65% of the Fund's average net assets.
Transfer Agent Fees. Fidelity Investments Institutional Operations Company, Inc. (FIIOC), an affiliate of FMR, is the transfer, dividend disbursing and shareholder servicing agent for each class of the Fund. FIIOC receives account fees and asset-based fees that vary according to the account size and type of account of the shareholders of Diversified International. FIIOC receives an asset-based fee of Class K's average net assets. FIIOC receives no fees for providing transfer agency services to Class F. FIIOC pays for typesetting, printing and mailing of shareholder reports, except proxy statements. For the period, transfer agent fees for each class were as follows:
| Amount | % of
Average
Net Assets |
Diversified International | $ 51,100,072 | .22 |
Class K | 4,314,388 | .05 |
| $ 55,414,460 | |
Accounting and Security Lending Fees. Fidelity Service Company, Inc. (FSC), an affiliate of FMR, maintains the Fund's accounting records. The accounting fee is based on the level of average net assets for the month. Under a separate contract, FSC administers the security lending program. The security lending fee is based on the number and duration of lending transactions.
Brokerage Commissions. The Fund placed a portion of its portfolio transactions with brokerage firms which are affiliates of the investment adviser. The commissions paid to these affiliated firms were $89,950 for the period.
7. Committed Line of Credit.
The Fund participates with other funds managed by FMR or an affiliate in a $4.0 billion credit facility (the "line of credit") to be utilized for temporary or emergency purposes to fund shareholder redemptions or for other short-term liquidity purposes. The Fund has agreed to pay commitment fees on its pro-rata portion of the line of credit, which amounted to $100,888 and is reflected in Miscellaneous expenses on the Statement of Operations. During the period, there were no borrowings on this line of credit.
8. Security Lending.
The Fund lends portfolio securities through a lending agent from time to time in order to earn additional income. For equity securities, a lending agent is used and may loan securities to certain qualified borrowers, including Fidelity Capital Markets (FCM), a broker-dealer affiliated with the Fund. On the settlement date of the loan, the Fund receives collateral (in the form of U.S. Treasury obligations, letters of credit and/or cash) against the loaned securities and maintains collateral in an amount not less than 100% of the market value of the loaned securities during the period of the loan. The market value of the loaned securities is determined at the close of business of the Fund and any additional required collateral is delivered to the Fund on the next business day. If the borrower defaults on its obligation to return the securities loaned because of insolvency or other reasons, a fund could experience delays and costs in recovering the securities loaned or in gaining access to the collateral. Any cash collateral received is invested in the Fidelity Securities Lending Cash Central Fund. The value of loaned securities and cash collateral at period end are disclosed on the Fund's Statement of Assets and Liabilities. The value of securities loaned to FCM at period end was $1,510,818. Security lending income represents the income earned on investing cash collateral, less rebates paid to borrowers and any lending agent fees associated with the loan, plus any premium payments received for lending certain types of securities. Security lending income is presented in the Statement of Operations as a component of income from Fidelity Central Funds. Total security lending income during the period amounted to $20,356,167, including $10,704 from securities loaned to FCM.
Annual Report
9. Expense Reductions.
FMR voluntarily agreed to reimburse a portion of its management fee. For the period, the amount of this reimbursement was $2,833,493.
Many of the brokers with whom FMR places trades on behalf of the Fund provided services in addition to trade execution. These services included payments of certain expenses on behalf of the Fund totaling $5,844,480 for the period. In addition, through arrangements with the Fund's custodian, credits realized as a result of uninvested cash balances were used to reduce the Fund's expenses. During the period, these credits reduced the Fund's custody expenses by $550.
10. Distributions to Shareholders.
Distributions to shareholders of each class were as follows:
Years ended October 31, | 2011 | 2010 |
From net investment income | | |
Diversified International | $ 404,459,076 | $ 398,456,259 |
Class K | 139,574,930 | 74,880,028 |
Class F | 10,137,376 | 1,170,406 |
Total | $ 554,171,382 | $ 474,506,693 |
From net realized gain | | |
Diversified International | $ 71,011,904 | $ - |
Class K | 21,272,351 | - |
Class F | 1,496,091 | - |
Total | $ 93,780,346 | $ - |
11. Share Transactions.
Transactions for each class of shares were as follows:
| Shares | Dollars |
Years ended October 31, | 2011 | 2010 | 2011 | 2010 |
Diversified International | | | | |
Shares sold | 95,789,996 | 179,662,935 | $ 2,861,192,033 | $ 4,893,668,837 |
Reinvestment of distributions | 15,446,133 | 13,627,007 | 459,413,511 | 384,281,814 |
Shares redeemed | (382,099,741) | (447,584,331) | (11,334,070,882) | (12,092,134,122) |
Net increase (decrease) | (270,863,612) | (254,294,389) | $ (8,013,465,338) | $ (6,814,183,471) |
Class K | | | | |
Shares sold | 125,231,374 | 151,794,829 | $ 3,707,928,503 | $ 4,125,917,772 |
Reinvestment of distributions | 5,413,899 | 2,657,205 | 160,847,281 | 74,880,028 |
Shares redeemed | (96,416,162) | (68,937,812) | (2,871,502,023) | (1,889,669,527) |
Net increase (decrease) | 34,229,111 | 85,514,222 | $ 997,273,761 | $ 2,311,128,273 |
Class F | | | | |
Shares sold | 13,012,404 | 24,587,499 | $ 389,423,461 | $ 664,182,809 |
Reinvestment of distributions | 391,673 | 41,548 | 11,633,466 | 1,170,406 |
Shares redeemed | (27,320,491) | (5,866,038) | (802,392,088) | (157,550,823) |
Net increase (decrease) | (13,916,414) | 18,763,009 | $ (401,335,161) | $ 507,802,392 |
12. Other.
The Fund's organizational documents provide former and current trustees and officers with a limited indemnification against liabilities arising in connection with the performance of their duties to the Fund. In the normal course of business, the Fund may also enter into contracts that provide general indemnifications. The Fund's maximum exposure under these arrangements is unknown as this would be dependent on future claims that may be made against the Fund. The risk of material loss from such claims is considered remote.
Annual Report
Report of Independent Registered Public Accounting Firm
To the Trustees of Fidelity Investment Trust and Shareholders of Fidelity Diversified International Fund:
We have audited the accompanying statement of assets and liabilities of Fidelity Diversified International Fund (the Fund), a fund of Fidelity Investment Trust, including the schedule of investments, as of October 31, 2011, and the related statement of operations for the year then ended, the statement of changes in net assets for each of the two years in the period then ended, and the financial highlights for each of the five years in the period then ended. These financial statements and financial highlights are the responsibility of the Fund's management. Our responsibility is to express an opinion on these financial statements and financial highlights based on our audits.
We conducted our audits in accordance with the standards of the Public Company Accounting Oversight Board (United States). Those standards require that we plan and perform the audit to obtain reasonable assurance about whether the financial statements and financial highlights are free of material misstatement. The Fund is not required to have, nor were we engaged to perform, an audit of its internal control over financial reporting. Our audits included consideration of internal control over financial reporting as a basis for designing audit procedures that are appropriate in the circumstances, but not for the purpose of expressing an opinion on the effectiveness of the Fund's internal control over financial reporting. Accordingly, we express no such opinion. An audit also includes examining, on a test basis, evidence supporting the amounts and disclosures in the financial statements, assessing the accounting principles used and significant estimates made by management, as well as evaluating the overall financial statement presentation. Our procedures included confirmation of securities owned as of October 31, 2011, by correspondence with the custodians and brokers; where replies were not received from brokers, we performed other auditing procedures. We believe that our audits provide a reasonable basis for our opinion.
In our opinion, the financial statements and financial highlights referred to above present fairly, in all material respects, the financial position of Fidelity Diversified International Fund as of October 31, 2011, the results of its operations for the year then ended, the changes in its net assets for each of the two years in the period then ended, and the financial highlights for each of the five years in the period then ended, in conformity with accounting principles generally accepted in the United States of America.
DELOITTE & TOUCHE LLP
Boston, Massachusetts
December 16, 2011
Annual Report
The Trustees, Members of the Advisory Board, and executive officers of the trust and fund, as applicable, are listed below. The Board of Trustees governs the fund and is responsible for protecting the interests of shareholders. The Trustees are experienced executives who meet periodically throughout the year to oversee the fund's activities, review contractual arrangements with companies that provide services to the fund, oversee management of the risks associated with such activities and contractual arrangements, and review the fund's performance. Except for James C. Curvey, each of the Trustees oversees 226 funds advised by FMR or an affiliate. Mr. Curvey oversees 429 funds advised by FMR or an affiliate.
The Trustees hold office without limit in time except that (a) any Trustee may resign; (b) any Trustee may be removed by written instrument, signed by at least two-thirds of the number of Trustees prior to such removal; (c) any Trustee who requests to be retired or who has become incapacitated by illness or injury may be retired by written instrument signed by a majority of the other Trustees; and (d) any Trustee may be removed at any special meeting of shareholders by a two-thirds vote of the outstanding voting securities of the trust. Each Trustee who is not an interested person (as defined in the 1940 Act) (Independent Trustee), shall retire not later than the last day of the calendar year in which his or her 75th birthday occurs. The Independent Trustees may waive this mandatory retirement age policy with respect to individual Trustees. The executive officers and Advisory Board Members hold office without limit in time, except that any officer and Advisory Board Member may resign or may be removed by a vote of a majority of the Trustees at any regular meeting or any special meeting of the Trustees. Except as indicated, each individual has held the office shown or other offices in the same company for the past five years.
Experience, Skills, Attributes, and Qualifications of the Fund's Trustees. The Governance and Nominating Committee has adopted a statement of policy that describes the experience, qualifications, attributes, and skills that are necessary and desirable for potential Independent Trustee candidates (Statement of Policy). The Board believes that each Trustee satisfied at the time he or she was initially elected or appointed a Trustee, and continues to satisfy, the standards contemplated by the Statement of Policy. The Governance and Nominating Committee also engages professional search firms to help identify potential Independent Trustee candidates who have the experience, qualifications, attributes, and skills consistent with the Statement of Policy. From time to time, additional criteria based on the composition and skills of the current Independent Trustees, as well as experience or skills that may be appropriate in light of future changes to board composition, business conditions, and regulatory or other developments, have also been considered by the professional search firms and the Governance and Nominating Committee. In addition, the Board takes into account the Trustees' commitment and participation in Board and committee meetings, as well as their leadership of standing and ad hoc committees throughout their tenure.
In determining that a particular Trustee was and continues to be qualified to serve as a Trustee, the Board has considered a variety of criteria, none of which, in isolation, was controlling. The Board believes that, collectively, the Trustees have balanced and diverse experience, qualifications, attributes, and skills, which allow the Board to operate effectively in governing the fund and protecting the interests of shareholders. Information about the specific experience, skills, attributes, and qualifications of each Trustee, which in each case led to the Board's conclusion that the Trustee should serve (or continue to serve) as a trustee of the fund, is provided below.
Board Structure and Oversight Function. James C. Curvey is an interested person (as defined in the 1940 Act) and currently serves as Acting Chairman. The Trustees have determined that an interested Chairman is appropriate and benefits shareholders because an interested Chairman has a personal and professional stake in the quality and continuity of services provided to the fund. Independent Trustees exercise their informed business judgment to appoint an individual of their choosing to serve as Chairman, regardless of whether the Trustee happens to be independent or a member of management. The Independent Trustees have determined that they can act independently and effectively without having an Independent Trustee serve as Chairman and that a key structural component for assuring that they are in a position to do so is for the Independent Trustees to constitute a substantial majority for the Board. The Independent Trustees also regularly meet in executive session. Ned C. Lautenbach serves as Chairman of the Independent Trustees and as such (i) acts as a liaison between the Independent Trustees and management with respect to matters important to the Independent Trustees and (ii) with management prepares agendas for Board meetings.
Fidelity funds are overseen by different Boards of Trustees. The fund's Board oversees Fidelity's equity and high income funds and another Board oversees Fidelity's investment-grade bond, money market, and asset allocation funds. The asset allocation funds may invest in Fidelity funds overseen by the fund's Board. The use of separate Boards, each with its own committee structure, allows the Trustees of each group of Fidelity funds to focus on the unique issues of the funds they oversee, including common research, investment, and operational issues. On occasion, the separate Boards establish joint committees to address issues of overlapping consequences for the Fidelity funds overseen by each Board.
The Trustees operate using a system of committees to facilitate the timely and efficient consideration of all matters of importance to the Trustees, the fund, and fund shareholders and to facilitate compliance with legal and regulatory requirements and oversight of the fund's activities and associated risks. The Board, acting through its committees, has charged FMR and its affiliates with (i) identifying events or circumstances the occurrence of which could have demonstrably adverse effects on the fund's business and/or reputation; (ii) implementing processes and controls to lessen the possibility that such events or circumstances occur or to mitigate the effects of such events or circumstances if they do occur; and (iii) creating and maintaining a system designed to evaluate continuously business and market conditions in order to facilitate the identification and implementation processes described in (i) and (ii) above. Because the day-to-day operations and activities of the fund are carried out by or through FMR, its affiliates and other service providers, the fund's exposure to risks is mitigated but not eliminated by the processes overseen by the Trustees. While each of the Board's committees has responsibility for overseeing different aspects of the fund's activities, oversight is exercised primarily through the Operations, Audit, and Compliance Committees. In addition, the Independent Trustees have worked with FMR to enhance the Board's oversight of investment and financial risks, legal and regulatory risks, technology risks, and operational risks, including the development of additional risk reporting to the Board. For example, a working group comprised of Independent Trustees and FMR has worked and continues to work to review the Fidelity funds' valuation-related activities, reporting and risk management. Appropriate personnel, including but not limited to the fund's Chief Compliance Officer (CCO), FMR's internal auditor, the independent accountants, the fund's Treasurer and portfolio management personnel, make periodic reports to the Board's committees, as appropriate, including an annual review of FMR's risk management program for the Fidelity funds. The responsibilities of each standing committee, including their oversight responsibilities, are described further under "Standing Committees of the Fund's Trustees."
Annual Report
The fund's Statement of Additional Information (SAI) includes more information about the Trustees. To request a free copy, call Fidelity at 1-800-835-5092.
Interested Trustees*:
Correspondence intended for each Trustee who is an interested person may be sent to Fidelity Investments, 82 Devonshire Street, Boston, Massachusetts 02109.
Name, Age; Principal Occupations and Other Relevant Experience+ |
James C. Curvey (76) |
| Year of Election or Appointment: 2007 Mr. Curvey is Trustee and Acting Chairman of the Board of Trustees of certain Trusts. Mr. Curvey also serves as Trustee (2007-present) of other investment companies advised by FMR. Mr. Curvey is a Director of Fidelity Investments Money Management, Inc. (2009-present), Director of Fidelity Research & Analysis Co. (2009-present) and Director of FMR and FMR Co., Inc. (2007-present). Mr. Curvey is also Vice Chairman (2007-present) and Director of FMR LLC. In addition, Mr. Curvey serves as an Overseer for the Boston Symphony Orchestra and a member of the Trustees of Villanova University. Previously, Mr. Curvey was the Vice Chairman (2006-2007) and Director (2000-2007) of FMR Corp. |
Ronald P. O'Hanley (54) |
| Year of Election or Appointment: 2011 Mr. O'Hanley is Director of FMR Co., Inc. (2010-present), Director of Fidelity Investments Money Management, Inc. (2010-present), Director of Fidelity Research & Analysis Company (2010-present), President of Fidelity Asset Management and Corporate Services and a member of Fidelity's Executive Committee (2010-present). Previously, Mr. O'Hanley served as President and Chief Executive Officer of BNY Mellon Asset Management (2007-2010). Mr. O'Hanley also served as Vice Chairman of Bank New York Mellon Corp. and a member of that firm's Executive Committee. Prior to the 2007 merger of The Bank of New York and Mellon Financial Corporation, he was Vice Chairman of Mellon Financial Corporation and President and Chief Executive Officer of Mellon Asset Management. He joined Mellon in February 1997. Mr. O'Hanley currently serves as Chairman of the Boston Public Library Foundation Board of Directors and sits on the Board of Directors of Beth Israel Deaconess Medical Center, the Board of Trustees of the Marine Biological Laboratory and the Advisory Board of the Maxwell School of Citizenship and Public Administration at Syracuse University. Mr. O'Hanley also chairs the Council on Asset Management for the Financial Services Roundtable and is a member of the Board of Directors of Institutional Investor's U.S. Institute. |
* Trustees have been determined to be "Interested Trustees" by virtue of, among other things, their affiliation with the trust or various entities under common control with FMR.
+ The information above includes each Trustee's principal occupation during the last five years and other information relating to the experience, attributes, and skills relevant to each Trustee's qualifications to serve as a Trustee, which led to the conclusion that each Trustee should serve as a Trustee for the fund.
Independent Trustees:
Correspondence intended for each Independent Trustee (that is, the Trustees other than the Interested Trustees) may be sent to Fidelity Investments, P.O. Box 55235, Boston, Massachusetts 02205-5235.
Name, Age; Principal Occupations and Other Relevant Experience+ |
Dennis J. Dirks (63) |
| Year of Election or Appointment: 2005 Prior to his retirement in May 2003, Mr. Dirks was Chief Operating Officer and a member of the Board of The Depository Trust & Clearing Corporation (DTCC). He also served as President, Chief Operating Officer, and Board member of The Depository Trust Company (DTC) and President and Board member of the National Securities Clearing Corporation (NSCC). In addition, Mr. Dirks served as Chief Executive Officer and Board member of the Government Securities Clearing Corporation, Chief Executive Officer and Board member of the Mortgage-Backed Securities Clearing Corporation, as a Trustee and a member of the Finance Committee of Manhattan College (2005-2008), and as a Trustee and a member of the Finance Committee of AHRC of Nassau County (2006-2008). Mr. Dirks is a member of the Independent Directors Council (IDC) Governing Council (2010-Present) and Board of Directors for The Brookville Center for Children's Services, Inc. (2009-present). |
Alan J. Lacy (58) |
| Year of Election or Appointment: 2008 Mr. Lacy serves as Senior Adviser (2007-present) of Oak Hill Capital Partners, L.P. (private equity). Mr. Lacy also served as Chief Executive Officer (2000-2005) and Vice Chairman (2005-2006) of Sears Holdings Corporation and Sears, Roebuck and Co. (retail). In addition, Mr. Lacy serves as a member of the Board of Directors of Dave & Buster's, Inc. (restaurant and entertainment complexes, 2010-present), The Hillman Companies, Inc. (hardware wholesalers, 2010-present), and Bristol-Myers Squibb Company (global pharmaceuticals, 2007-present). Mr. Lacy is a member of the Board of Trustees of The National Parks Conservation Association (2006-Present). Previously, Mr. Lacy served as Chairman of the Board of Trustees of the National Parks Conservation Association (2008-2011) and as a member of the Board of Directors for the Western Union Company (global money transfer, 2006-2011). |
Ned C. Lautenbach (67) |
| Year of Election or Appointment: 2000 Mr. Lautenbach is Chairman of the Independent Trustees of the Equity and High Income Funds (2006-present). Mr. Lautenbach currently serves as the Lead Director of the Eaton Corporation Board of Directors (diversified industrial, 1997-present). Mr. Lautenbach is also a member of the Board of Directors of the Philharmonic Center for the Arts in Naples, Florida (1999-present); a member of the Board of Trustees of Fairfield University (2005-present); and a member of the Council on Foreign Relations (1994-present). Previously, Mr. Lautenbach was a Partner/Advisory Partner at Clayton, Dubilier & Rice, LLC (private equity investment, 1998-2010), as well as a Director of Sony Corporation (2006-2007). |
Joseph Mauriello (67) |
| Year of Election or Appointment: 2008 Prior to his retirement in January 2006, Mr. Mauriello served in numerous senior management positions including Deputy Chairman and Chief Operating Officer (2004-2005), and Vice Chairman of Financial Services (2002-2004) of KPMG LLP US (professional services, 1965-2005). Mr. Mauriello currently serves as a member of the Board of Directors of XL Group plc. (global insurance and re-insurance, 2006-present) and of Arcadia Resources Inc. (health care services and products, 2007-present). Previously, Mr. Mauriello served as a Director of the Hamilton Funds of the Bank of New York (2006-2007). |
Robert W. Selander (61) |
| Year of Election or Appointment: 2011 Previously, Mr. Selander served as a Member of the Advisory Board of Fidelity's Equity and High Income Funds (2011), Executive Vice Chairman (2010), Chief Executive Officer (2009-2010), and President and Chief Executive Officer (1997-2009) of Mastercard, Inc. |
Cornelia M. Small (67) |
| Year of Election or Appointment: 2005 Ms. Small is a member of the Board of Directors of the Teagle Foundation (2009-present). Ms. Small is also a member of the Investment Committee, and Chair (2008-present) and a member of the Board of Trustees of Smith College. In addition, Ms. Small serves on the Investment Committee of the Berkshire Taconic Community Foundation (2008-present). Previously, Ms. Small served as Chairperson of the Investment Committee (2002-2008) of Smith College. In addition, Ms. Small served as Chief Investment Officer, Director of Global Equity Investments, and a member of the Board of Directors of Scudder, Stevens & Clark and Scudder Kemper Investments. |
William S. Stavropoulos (72) |
| Year of Election or Appointment: 2001 Mr. Stavropoulos is Vice Chairman of the Independent Trustees of the Equity and High Income Funds (2006-present). Mr. Stavropoulos serves as President and Founder of the Michigan Baseball Foundation, the Great Lakes Loons (2007-present). Mr. Stavropoulos is Chairman Emeritus of the Board of Directors of The Dow Chemical Company, where he previously served in numerous senior management positions, including President, CEO (1995-2000; 2002-2004), Chairman of the Executive Committee (2000-2006), and as a member of the Board of Directors (1990-2006). Currently, Mr. Stavropoulos is Chairman of Univar (global distributor of commodity and specialty chemicals, 2010-present), a Director of Teradata Corporation (data warehousing and technology solutions, 2008-present), Chemical Financial Corporation, Maersk Inc. (industrial conglomerate), Tyco International, Inc. (multinational manufacturing and services, 2007-present), and a member of the Advisory Board for Metalmark Capital (private equity investment, 2005-present). Mr. Stavropoulos is a special advisor to Clayton, Dubilier & Rice, LLC (private equity investment). In addition, Mr. Stavropoulos is a member of the University of Notre Dame Advisory Council for the College of Science. |
David M. Thomas (62) |
| Year of Election or Appointment: 2008 Previously, Mr. Thomas served as Executive Chairman (2005-2006) and Chairman and Chief Executive Officer (2000-2005) of IMS Health, Inc. (pharmaceutical and healthcare information solutions). In addition, Mr. Thomas serves as a member of the Board of Directors of Fortune Brands, Inc. (consumer products), and Interpublic Group of Companies, Inc. (marketing communication, 2004-present). |
Michael E. Wiley (61) |
| Year of Election or Appointment: 2008 Mr. Wiley also serves as a Director of Asia Pacific Exploration Consolidated (international oil and gas exploration and production, 2008-present). Mr. Wiley serves as a Director of Tesoro Corporation (independent oil refiner and marketer, 2005-present), and a Director of Bill Barrett Corporation (exploration and production, 2005-present). In addition, Mr. Wiley also serves as a Director of Post Oak Bank (privately-held bank, 2004-present). Previously, Mr. Wiley served as a member of the Board of Trustees of the University of Tulsa (2000-2006; 2007-2010), as a Senior Energy Advisor of Katzenbach Partners, LLC (consulting, 2006-2007), as an Advisory Director of Riverstone Holdings (private investment), Chairman, President, and CEO of Baker Hughes, Inc. (oilfield services, 2000-2004), and as Director of Spinnaker Exploration Company (exploration and production, 2001-2005). |
+ The information above includes each Trustee's principal occupation during the last five years and other information relating to the experience, attributes, and skills relevant to each Trustee's qualifications to serve as a Trustee, which led to the conclusion that each Trustee should serve as a Trustee for the fund.
Advisory Board Members and Executive Officers:
Correspondence intended for each executive officer, Edward C. Johnson 3d, and Peter S. Lynch may be sent to Fidelity Investments, 82 Devonshire Street, Boston, Massachusetts 02109.
Name, Age; Principal Occupation |
Edward C. Johnson 3d (81) |
| Year of Election or Appointment: 2011 Member of the Advisory Board of Fidelity's Equity and High Income Funds. Mr. Johnson serves as Chief Executive Officer, Chairman, and a Director of FMR LLC, and also serves as Chairman and Director of FIL Limited. Previously, Mr. Johnson served as a Trustee and Chairman of the Board of certain Fidelity Trusts, Chairman and a Director of FMR, Chairman and a Director of FMR Co., Inc., and President of FMR LLC (2006-2007). |
Peter S. Lynch (67) |
| Year of Election or Appointment: 2003 Member of the Advisory Board of Fidelity's Equity and High Income Funds. Mr. Lynch is Vice Chairman and a Director of FMR and FMR Co., Inc. In addition, Mr. Lynch serves as a Trustee of Boston College and as the Chairman of the Inner-City Scholarship Fund. Previously, Mr. Lynch served on the Special Olympics International Board of Directors (1997-2006). |
Kenneth B. Robins (42) |
| Year of Election or Appointment: 2008 President and Treasurer of Fidelity's Equity and High Income Funds. Mr. Robins also serves as President and Treasurer (2010-present) and Assistant Treasurer (2009-present) of other Fidelity funds and is an employee of Fidelity Investments (2004-present). Previously, Mr. Robins served as Deputy Treasurer of the Fidelity funds (2005-2008) and Treasurer and Chief Financial Officer of The North Carolina Capital Management Trust: Cash and Term Portfolios (2006-2008). |
Bruce T. Herring (46) |
| Year of Election or Appointment: 2006 Vice President of certain Equity Funds. Mr. Herring also serves as Chief Investment Officer and Director of Fidelity Management & Research (U.K.) Inc. (2010-present) and Group Chief Investments Officer of FMR. Previously, Mr. Herring served as Vice President (2005-2006) and Senior Vice President (2006-2007) of Fidelity Management & Research Company, Vice President of FMR Co., Inc. (2001-2007) and as a portfolio manager for Fidelity U.S. Equity Funds. |
Brian B. Hogan (47) |
| Year of Election or Appointment: 2009 Vice President of Equity and High Income Funds. Mr. Hogan also serves as President of FMR's Equity Division (2009-present). Previously, Mr. Hogan served as Senior Vice President, Equity Research of FMR (2006-2009) and as a portfolio manager. |
Scott C. Goebel (43) |
| Year of Election or Appointment: 2008 Secretary and Chief Legal Officer (CLO) of the Fidelity funds. Mr. Goebel also serves as Secretary of Fidelity Investments Money Management, Inc. (FIMM) (2010-present) and Fidelity Research and Analysis Company (FRAC) (2010-present); Secretary and CLO of The North Carolina Capital Management Trust: Cash and Term Portfolios (2008-present); General Counsel, Secretary, and Senior Vice President of FMR (2008-present) and FMR Co., Inc. (2008-present); employed by FMR LLC or an affiliate (2001-present); Chief Legal Officer of Fidelity Management & Research (Hong Kong) Limited (2008-present) and Assistant Secretary of Fidelity Management & Research (Japan) Inc. (2008-present), and Fidelity Management & Research (U.K.) Inc. (2008-present). Previously, Mr. Goebel served as Assistant Secretary of FIMM (2008-2010), FRAC (2008-2010), and the Funds (2007-2008) and as Vice President and Secretary of Fidelity Distributors Corporation (FDC) (2005-2007). |
William C. Coffey (42) |
| Year of Election or Appointment: 2009 Assistant Secretary of Fidelity's Equity and High Income Funds. Mr. Coffey also serves as Senior Vice President and Deputy General Counsel of FMR LLC (2010-present), and is an employee of Fidelity Investments. Previously, Mr. Coffey served as Vice President and Associate General Counsel of FMR LLC (2005-2009). |
Holly C. Laurent (57) |
| Year of Election or Appointment: 2008 Anti-Money Laundering (AML) Officer of the Fidelity funds. Ms. Laurent also serves as AML Officer of The North Carolina Capital Management Trust: Cash and Term Portfolios (2008-present) and is an employee of Fidelity Investments. Previously, Ms. Laurent was Senior Vice President and Head of Legal for Fidelity Business Services India Pvt. Ltd. (2006-2008), and Senior Vice President, Deputy General Counsel and Group Head for FMR LLC (2005-2006). |
Christine Reynolds (53) |
| Year of Election or Appointment: 2008 Chief Financial Officer of the Fidelity funds. Ms. Reynolds became President of Fidelity Pricing and Cash Management Services (FPCMS) in August 2008. Ms. Reynolds served as Chief Operating Officer of FPCMS (2007-2008). Previously, Ms. Reynolds served as President, Treasurer, and Anti-Money Laundering officer of the Fidelity funds (2004-2007). |
Kenneth A. Rathgeber (64) |
| Year of Election or Appointment: 2004 Chief Compliance Officer of Fidelity's Equity and High Income Funds. Mr. Rathgeber is Chief Compliance Officer of Fidelity Management & Research (Hong Kong) Limited (2008-present), Fidelity Management & Research (Japan) Inc. (2008-present), FMR (2005-present), FMR Co., Inc. (2005-present), Fidelity Management & Research (U.K.) Inc. (2005-present), Fidelity Research & Analysis Company (2005-present), Fidelity Investments Money Management, Inc. (2005-present), Pyramis Global Advisors, LLC (2005-present), and Strategic Advisers, Inc. (2005-present). |
Jeffrey S. Christian (50) |
| Year of Election or Appointment: 2009 Deputy Treasurer of the Fidelity funds. Mr. Christian is an employee of Fidelity Investments. Previously, Mr. Christian served as Chief Financial Officer (2008-2009) of certain Fidelity funds and Senior Vice President of Fidelity Pricing and Cash Management Services (FPCMS) (2004-2009). |
Joseph F. Zambello (54) |
| Year of Election or Appointment: 2011 Deputy Treasurer of the Fidelity funds. Mr. Zambello is an employee of Fidelity Investments. Previously, Mr. Zambello served as Vice President of FMR's Program Management Group (2009-2011) and Vice President of the Transfer Agent Oversight Group (2005-2009). |
Adrien E. Deberghes (44) |
| Year of Election or Appointment: 2008 Deputy Treasurer of Fidelity's Equity and High Income Funds. Mr. Deberghes also serves as Vice President and Assistant Treasurer of Fidelity Rutland Square Trust II and Fidelity Commonwealth Trust II (2011-present), Assistant Treasurer of other Fidelity funds (2010-present), and is an employee of Fidelity Investments (2008-present). Previously, Mr. Deberghes served as Senior Vice President of Mutual Fund Administration at State Street Corporation (2007-2008), Senior Director of Mutual Fund Administration at Investors Bank & Trust (2005-2007), and Director of Finance for Dunkin' Brands (2000-2005). |
Stephanie J. Dorsey (42) |
| Year of Election or Appointment: 2010 Assistant Treasurer of Fidelity's Equity and High Income Funds. Ms. Dorsey also serves as Deputy Treasurer of other Fidelity funds (2008-present) and is an employee of Fidelity Investments (2008-present). Previously, Ms. Dorsey served as Treasurer (2004-2008) of the JPMorgan Mutual Funds and Vice President (2004-2008) of JPMorgan Chase Bank. |
John R. Hebble (53) |
| Year of Election or Appointment: 2009 Assistant Treasurer of Fidelity's Equity and High Income Funds. Mr. Hebble also serves as President (2011-present), Treasurer, and Chief Financial Officer of The North Carolina Capital Management Trust: Cash and Term Portfolios (2008-present), President and Treasurer of other Fidelity funds (2008-present) and is an employee of Fidelity Investments. |
Gary W. Ryan (53) |
| Year of Election or Appointment: 2005 Assistant Treasurer of the Fidelity funds. Mr. Ryan is an employee of Fidelity Investments. Previously, Mr. Ryan served as Vice President of Fund Reporting in Fidelity Pricing and Cash Management Services (FPCMS) (1999-2005). |
Jonathan Davis (43) |
| Year of Election or Appointment: 2010 Assistant Treasurer of the Fidelity funds. Mr. Davis is also Assistant Treasurer of Fidelity Rutland Square Trust II and Fidelity Commonwealth Trust II. Mr. Davis is an employee of Fidelity Investments. Previously, Mr. Davis served as Vice President and Associate General Counsel of FMR LLC (2003-2010). |
Annual Report
Class K designates 88% and 100% of the dividends distributed on December 3, 2010 and December 30, 2010, respectively during the fiscal year as amounts which may be taken into account as a dividend for the purposes of the maximum rate under section 1(h)(11) of the Internal Revenue Code.
The amounts per share which represent income derived from sources within, and taxes paid to, foreign countries or possessions of the United States are as follows:
| Pay Date | Income | Taxes |
Class K | 12/06/2010 | 0.421 | 0.0414 |
Class K | 12/31/2010 | 0.072 | 0.000 |
The fund will notify shareholders in January 2012 of amounts for use in preparing 2011 income tax returns.
Annual Report
Board Approval of Investment Advisory Contracts and Management Fees
Fidelity Diversified International Fund
Each year, the Board of Trustees, including the Independent Trustees (together, the Board), votes on the renewal of the management contract and sub-advisory agreements (together, the Advisory Contracts) for the fund. The Board, assisted by the advice of fund counsel and Independent Trustees' counsel, requests and considers a broad range of information relevant to the renewal of the Advisory Contracts throughout the year.
The Board meets regularly and considers at each of its meetings factors that are relevant to its annual consideration of the renewal of the fund's Advisory Contracts, including the services and support provided to the fund and its shareholders. The Board has established various standing committees, each composed of Independent Trustees with varying backgrounds, to which the Board has assigned specific subject matter responsibilities in order to enhance effective decision-making by the Board. The Board, acting directly and through its Committees, requests and receives information concerning the annual consideration of the renewal of the fund's Advisory Contracts. The Board also meets as needed to consider matters specifically related to the Board's annual consideration of the renewal of Advisory Contracts. Members of the Board may also meet with trustees of other Fidelity funds through ad hoc joint committees to discuss certain matters relevant to the Fidelity funds.
At its July 2011 meeting, the Board of Trustees, including the Independent Trustees, unanimously determined to renew the fund's Advisory Contracts. In reaching its determination, the Board considered all factors it believed relevant, including (i) the nature, extent, and quality of the services to be provided to the fund and its shareholders (including the investment performance of the fund); (ii) the competitiveness of the fund's management fee and total expense ratio; (iii) the total costs of the services to be provided by and the profits to be realized by Fidelity from its relationship with the fund; (iv) the extent to which economies of scale would be realized as the fund grows; and (v) whether fee levels reflect these economies of scale, if any, for the benefit of fund shareholders.
In considering whether to renew the Advisory Contracts for the fund, the Board reached a determination, with the assistance of fund counsel and Independent Trustees' counsel and through the exercise of its business judgment, that the renewal of the Advisory Contracts is in the best interests of the fund and its shareholders and that the compensation payable under the Advisory Contracts is fair and reasonable. The Board's decision to renew the Advisory Contracts was not based on any single factor, but rather was based on a comprehensive consideration of all the information provided to the Board at its meetings throughout the year. The Board, in reaching its determination to renew the Advisory Contracts, is aware that shareholders in the fund have a broad range of investment choices available to them, including a wide choice among mutual funds offered by Fidelity's competitors, and that the fund's shareholders, who have the opportunity to review and weigh the disclosure provided by the fund in its prospectus and other public disclosures, have chosen to invest in this fund, managed by Fidelity.
Nature, Extent, and Quality of Services Provided. The Board considered the staffing within the investment adviser, FMR, and the sub-advisers (together, the Investment Advisers), including the backgrounds of the fund's investment personnel and the fund's investment objective and discipline. The Independent Trustees also had discussions with senior management of Fidelity's investment operations and investment groups. The Board considered the structure of the portfolio manager compensation program and whether this structure provides appropriate incentives to act in the best interests of the fund.
Resources Dedicated to Investment Management and Support Services. The Board and the Fund Oversight and Research Committees reviewed the general qualifications and capabilities of the Investment Advisers' investment staff, including its size, education, experience, and resources, as well as the Investment Advisers' approach to recruiting, training, managing, and compensating investment personnel. The Board also noted that FMR has devoted increased resources to non-U.S. offices. The Board noted that Fidelity's analysts have extensive resources, tools and capabilities which allow them to conduct sophisticated quantitative and fundamental analysis, as well as credit analysis of issuers, counterparties and enhancers. The Board also believes that Fidelity's investment professionals have sufficient access to global information and data so as to provide competitive investment results over time, and that those professionals also have access to sophisticated tools which permit them to assess portfolio construction and risk and performance attribution characteristics continuously, as well as to transmit new information and research conclusions rapidly around the world. Additionally, in their deliberations, the Board considered the Investment Advisers' trading capabilities and resources which are an integral part of the investment management process.
Shareholder and Administrative Services. The Board considered (i) the nature, extent, quality, and cost of advisory, administrative, and shareholder services performed by the Investment Advisers and their affiliates under the Advisory Contracts and under separate agreements covering transfer agency, pricing and bookkeeping, and securities lending services for the fund; (ii) the nature and extent of the investment adviser's supervision of third party service providers, principally custodians and subcustodians; and (iii) the resources devoted to, and the record of compliance with, the fund's compliance policies and procedures. The Board also reviewed the allocation of fund brokerage, including allocations to brokers affiliated with the Investment Advisers, the use of brokerage commissions to pay fund expenses, and the use of "soft" commission dollars to pay for research services.
The Board noted that the growth of fund assets over time across the complex allows Fidelity to reinvest in the development of services designed to enhance the value or convenience of the Fidelity funds as investment vehicles. These services include 24-hour access to account information and market information through telephone representatives and over the Internet, investor education materials and asset allocation tools, and the expanded availability of Fidelity Investor Centers, with 35 new branches opening since 2010.
Annual Report
Board Approval of Investment Advisory Contracts and Management Fees - continued
Investment in a Large Fund Family. The Board considered the benefits to shareholders of investing in a Fidelity fund, including the benefits of investing in a fund that is part of a large family of funds offering a variety of investment disciplines and providing a large variety of mutual fund investor services. The Board noted that Fidelity had taken, or had made recommendations that resulted in the Fidelity funds taking, a number of actions over the previous year that benefited particular funds, including (i) continuing to dedicate additional resources to investment research and support of the senior management team that oversees asset management; (ii) rationalizing product lines through the mergers of six funds into other funds; (iii) continuing to migrate the Freedom Funds to dedicated lower cost underlying funds; (iv) obtaining shareholder approval to broaden the investment strategies for Fidelity Consumer Finance Portfolio, Fidelity Emerging Asia Fund, and Fidelity Environment and Alternative Energy Portfolio; (v) contractually agreeing to reduce the management fees and impose other expense limitations on Spartan 500 Index Fund and U.S. Bond Index Fund in connection with launching new institutional classes of these funds; (vi) changing the name, primary and supplemental benchmarks, and investment policies of Fidelity Global Strategies Fund to support the fund's flexible investment mandate and global orientation; and (vii) reducing the transfer agency account fee rates on certain accounts.
Investment Performance. The Board considered whether the fund has operated in accordance with its investment objective, as well as its record of compliance with its investment restrictions. It also reviewed the fund's absolute investment performance for each class, as well as the fund's relative investment performance for each class measured over multiple periods against (i) a broad-based securities market index, and (ii) a peer group of mutual funds deemed appropriate by Fidelity and reviewed by the Board. The following charts considered by the Board show, over the one-, three-, and five-year periods ended December 31, 2010, as available, the cumulative total returns of Class F and the retail class of the fund, the cumulative total returns of a broad-based securities market index ("benchmark"), and a range of cumulative total returns of a peer group of mutual funds identified by Morningstar, Inc. as having an investment style similar to that of the fund based on underlying portfolio holdings. The returns of Class F and the retail class show the performance of the highest and lowest performing classes, respectively (based on one-year performance). The box within each chart shows the 25th percentile return (bottom of box) and the 75th percentile return (top of box) of the peer group. Returns shown above the box are in the first quartile and returns shown below the box are in the fourth quartile. The percentage beaten numbers noted below each chart correspond to the percentile box and represent the percentage of funds in the peer group whose performance was equal to or lower than that of the class indicated.
Fidelity Diversified International Fund

The Board reviewed the fund's relative investment performance against its peer group and noted that the performance of the retail class of the fund (the class with the longest performance record) was in the third quartile for all the periods shown. The Board also noted that the investment performance of the fund was lower than its benchmark for the three- and five-year periods, although the one-year total return of the retail class compared favorably to its benchmark. The Board considered that the variations in performance among the fund's classes reflect the variations in class expenses, which result in lower performance for higher expense classes. The Board discussed with FMR actions that have been taken by FMR to improve the fund's disappointing performance relative to its peer group. The Board also reviewed the fund's performance since inception as well as performance in the current year. The Board will continue to closely monitor the performance of the fund in the coming year and discuss with FMR other appropriate actions to address the performance of the fund.
The Board also considered that the fund's management fee is subject to upward or downward adjustment depending upon whether, and to what extent, the fund's investment performance for the performance period exceeds, or is exceeded by, the record (over the same period) of a Board-approved performance adjustment index. The Board noted that the performance adjustment provides FMR with a strong economic incentive to seek to achieve superior performance for the fund's shareholders and helps to more closely align the interests of FMR and the fund's shareholders.
Annual Report
Based on its review, the Board concluded that the nature, extent, and quality of services provided to the fund under the Advisory Contracts should benefit the fund's shareholders.
Competitiveness of Management Fee and Total Expense Ratio. The Board considered the fund's management fee and total expense ratio compared to "mapped groups" of competitive funds and classes. Fidelity creates "mapped groups" by combining similar Lipper investment objective categories that have comparable management fee characteristics. Combining Lipper investment objective categories aids the Board's management fee and total expense ratio comparisons by broadening the competitive group used for comparison and by reducing the number of universes to which various Fidelity funds are compared.
Management Fee. The Board considered two proprietary management fee comparisons for the 12-month periods shown in the chart below. The group of Lipper funds used by the Board for management fee comparisons is referred to below as the "Total Mapped Group." The Total Mapped Group comparison focuses on a fund's standing relative to the total universe of comparable funds available to investors in terms of gross management fees before expense reimbursements or caps, and without giving effect to the fund's performance adjustment. "TMG %" represents the percentage of funds in the Total Mapped Group that had management fees that were lower than the fund's. For example, a TMG % of 16% means that 84% of the funds in the Total Mapped Group had higher management fees than the fund. The "Asset-Size Peer Group" (ASPG) comparison focuses on a fund's standing relative to non-Fidelity funds similar in size to the fund within the Total Mapped Group. The ASPG represents at least 15% of the funds in the Total Mapped Group with comparable asset size and management fee characteristics, subject to a minimum of 50 funds (or all funds in the Total Mapped Group if fewer than 50). Additional information, such as the ASPG quartile in which the fund's management fee ranked and the impact of the fund's performance adjustment, is also included in the chart and considered by the Board.
Fidelity Diversified International Fund
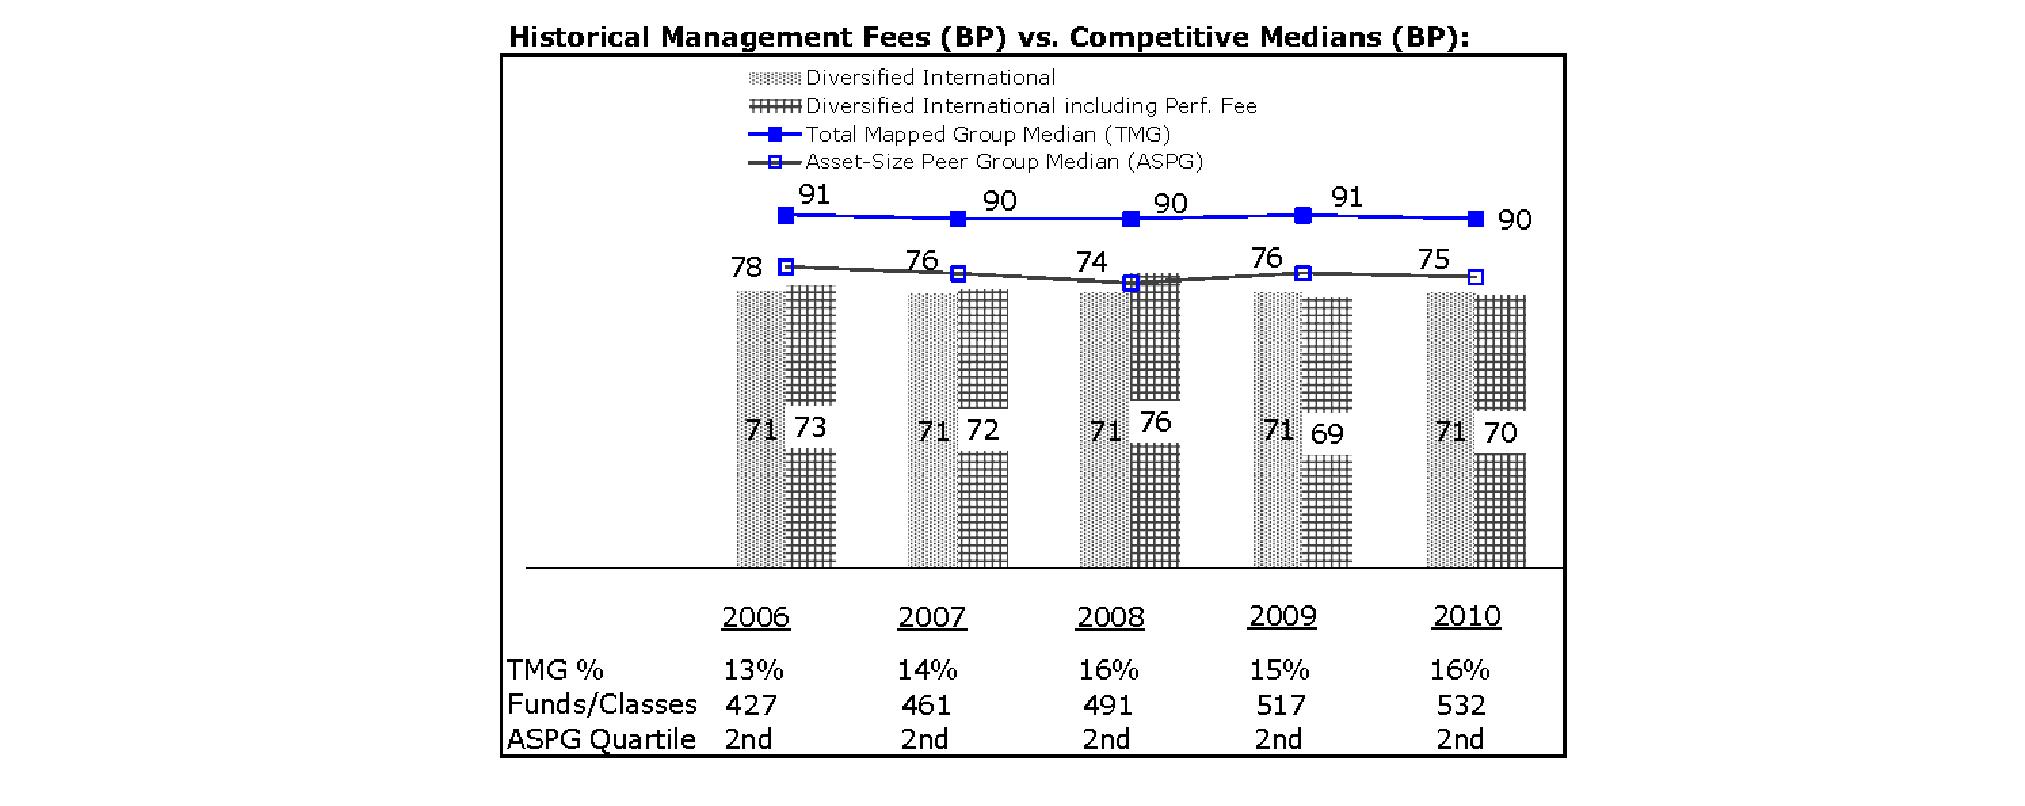
The Board noted that the fund's management fee ranked below the median of its Total Mapped Group and below the median of its ASPG for 2010. The Board also noted the effect of the fund's negative performance adjustment on the fund's management fee ranking. The Board noted that the performance adjustment for each year represents calculations for performance periods that differ from the periods shown in the performance charts above.
Based on its review, the Board concluded that the fund's management fee is fair and reasonable in light of the services that the fund receives and the other factors considered.
Total Expense Ratio. In its review of each class's total expense ratio, the Board considered the fund's management fee as well as other fund or class expenses, as applicable, such as transfer agent fees, pricing and bookkeeping fees, and custodial, legal, and audit fees. The Board also noted the effects of any waivers and reimbursements on fees and expenses, as well as the impact of the fund's performance adjustment. As part of its review, the Board also considered the current and historical total expense ratios of each class of the fund compared to competitive fund median expenses. Each class of the fund is compared to those funds and classes in the Total Mapped Group (used by the Board for management fee comparisons) that have a similar sales load structure.
Annual Report
Board Approval of Investment Advisory Contracts and Management Fees - continued
The Board noted that the total expense ratio of each class ranked below its competitive median for 2010. The Board considered that various factors, including 12b-1 fees, positive or negative performance adjustments, and relatively higher other expenses in the case of small fund size, can affect total expense ratios.
Fees Charged to Other Fidelity Clients. The Board also considered Fidelity fee structures and other information with respect to clients of FMR and its affiliates, such as other mutual funds advised or subadvised by FMR or its affiliates, pension plan clients, and other institutional clients. In March 2010, the Board created an ad hoc joint committee with the board of other Fidelity funds (the Committee) to review and compare Fidelity's institutional investment advisory business with its business of providing services to the Fidelity funds, including the differences in services provided, fees charged, and costs incurred, as well as competition in their respective marketplaces.
Based on its review of total expense ratios and fees charged to other Fidelity clients, the Board concluded that the total expense ratio of each class of the fund was reasonable in light of the services that the fund and its shareholders receive and the other factors considered, including the findings of the Committee.
Costs of the Services and Profitability. The Board considered the revenues earned and the expenses incurred by Fidelity in conducting the business of developing, marketing, distributing, managing, administering and servicing the fund and its shareholders. The Board also considered the level of Fidelity's profits in respect of all the Fidelity funds.
On an annual basis, FMR presents to the Board Fidelity's profitability for the fund. Fidelity calculates the profitability for each fund, as well as aggregate profitability for groups of Fidelity funds and all Fidelity funds, using a series of detailed revenue and cost allocation methodologies which originate with the books and records of Fidelity on which Fidelity's audited financial statements are based. The Audit Committee of the Board reviews any significant changes from the prior year's methodologies.
PricewaterhouseCoopers LLP (PwC), independent registered public accounting firm and auditor to Fidelity and certain Fidelity funds, has been engaged annually by the Board as part of the Board's assessment of Fidelity's profitability analysis. PwC's engagement includes the review and assessment of Fidelity's methodologies used in determining the revenues and expenses attributable to Fidelity's mutual fund business, and completion of agreed-upon procedures surrounding the mathematical accuracy of fund profitability and its conformity to allocation methodologies. After considering PwC's reports issued under the engagement and information provided by Fidelity, the Board concluded that while other allocation methods may also be reasonable, Fidelity's profitability methodologies are reasonable in all material respects.
The Board also reviewed Fidelity's non-fund businesses and fall-out benefits related to the mutual fund business as well as cases where Fidelity's affiliates may benefit from or be related to the fund's business.
The Board considered the costs of the services provided by and the profits realized by Fidelity in connection with the operation of the fund and was satisfied that the profitability was not excessive in the circumstances.
Economies of Scale. The Board considered whether there have been economies of scale in respect of the management of the Fidelity funds, whether the Fidelity funds (including the fund) have appropriately benefited from any such economies of scale, and whether there is potential for realization of any further economies of scale. The Board considered the extent to which the fund will benefit from economies of scale through increased services to the fund, through waivers or reimbursements, or through fee or expense reductions. The Board also noted that in 2009, it and the board of other Fidelity funds created an ad hoc committee (the Economies of Scale Committee) to analyze whether FMR attains economies of scale in respect of the management and servicing of the Fidelity funds, whether the Fidelity funds have appropriately benefited from such economies of scale, and whether there is potential for realization of any further economies of scale.
The Board recognized that the fund's management contract incorporates a "group fee" structure, which provides for lower group fee rates as total fund assets under FMR's management increase, and for higher group fee rates as total fund assets under FMR's management decrease. FMR calculates the group fee rates based on a tiered asset "breakpoint" schedule that varies based on asset class. The Board considered that the group fee is designed to deliver the benefits of economies of scale to fund shareholders when total Fidelity fund assets increase, even if assets of any particular fund are unchanged or have declined, because some portion of Fidelity's costs are attributable to services provided to all Fidelity funds, and all funds benefit if those costs can be allocated among more assets. The Board concluded that, given the group fee structure, fund shareholders will benefit from lower management fees as assets under FMR's management increase at the fund complex level, regardless of whether Fidelity achieves any such economies of scale.
The Board concluded, taking into account the analysis of the Economies of Scale Committee, that any potential economies of scale are being appropriately shared between fund shareholders and Fidelity.
Additional Information Requested by the Board. In order to develop fully the factual basis for consideration of the Fidelity funds' Advisory Contracts, the Board requested and received additional information on certain topics, including (i) fund performance trends, actions to be taken by FMR to improve certain funds' overall performance, and Fidelity's long-term strategies for certain funds; (ii) portfolio manager changes that have occurred during the past year and length of portfolio manager tenure for different categories of funds over time; (iii) Fidelity's compensation structure for portfolio managers and other key personnel and strategies for attracting and retaining non-investment personnel; (iv) the amount of the investment that each portfolio manager has made in the Fidelity fund(s) that he or she manages; (v) historical trends in Fidelity's realization of fall-out benefits; (vi) Fidelity's group fee structures and the rationale for the individual fee rates of certain funds; (vii) fund profitability methodology and the impact of certain factors on fund profitability results; (viii) trends regarding industry use of performance fee structures and Fidelity's compliance practices with respect to performance adjustment calculations; (ix) the fee structures in place for certain other Fidelity clients; and (x) explanations regarding the relative total expense ratios of certain funds and classes, total expense competitive trends, and actions that might be taken by FMR to reduce total expense ratios for certain funds and classes.
Annual Report
Based on its evaluation of all of the conclusions noted above, and after considering all factors it believed relevant, the Board ultimately concluded that the advisory fee structures are fair and reasonable, and that the fund's Advisory Contracts should be renewed.
Annual Report
Managing Your Investments
Fidelity offers several ways to conveniently manage your workplace benefits (including your workplace savings plan, investments, and additional services) via your telephone or PC. You can access your plan and account information and research your investments 24 hours a day.
By Phone
Fidelity provides a single toll-free number to access plan information, account balances, positions, and quotes*. It's easy to navigate the service, and on your first call, the system will help you create a personal identification number (PIN) for security.
(phone graphic)Fidelity Workplace Investing
1-800-835-5092
By PC
Fidelity's web site on the Internet provides a wide range of information, including plan information, daily financial news, fund performance, interactive planning tools, and news about Fidelity products and services.
(computer graphic)Fidelity's Web Site
www.401k.com
* When you call the quotes line, please remember that a fund's yield and return will vary and, except for money market funds, share price will also vary. This means that you may have a gain or loss when you sell your shares. There is no assurance that money market funds will be able to maintain a stable $1 share price; an investment in a money market fund is not insured or guaranteed by the U.S. government. Total returns are historical and include changes in share price, reinvestment of dividends and capital gains distributions, and the effects of any sales charges.
Annual Report
To Write Fidelity
We'll give your correspondence immediate attention and send you written confirmation upon completion of your request.
(letter graphic)For Non-Retirement
Accounts
Buying shares
Fidelity Investments
P.O. Box 770001
Cincinnati, OH 45277-0003
Overnight Express
Fidelity Investments
Attn: Distribution Services
100 Crosby Parkway - KC1H
Covington, KY 41015
Selling shares
Fidelity Investments
P.O. Box 770001
Cincinnati, OH 45277-0035
Overnight Express
Fidelity Investments
Attn: Distribution Services
100 Crosby Parkway - KC1H
Covington, KY 41015
General Correspondence
Fidelity Investments
P.O. Box 500
Merrimack, NH 03054-0500
(letter graphic)For Retirement
Accounts
Buying shares
Fidelity Investments
P.O. Box 770001
Cincinnati, OH 45277-0003
Selling shares
Fidelity Investments
P.O. Box 770001
Cincinnati, OH 45277-0035
Overnight Express
Fidelity Investments
Attn: Distribution Services
100 Crosby Parkway - KC1H
Covington, KY 41015
General Correspondence
Fidelity Investments
P.O. Box 500
Merrimack, NH 03054-0500
Annual Report
Investment Adviser
Fidelity Management & Research Company
Boston, MA
Investment Sub-Advisers
FMR Co., Inc.
Fidelity Management & Research (U.K.) Inc.
Fidelity Management & Research
(Hong Kong) Limited
Fidelity Management & Research
(Japan) Inc.
FIL Investment Advisors
FIL Investment Advisors (UK) Limited
FIL Investments (Japan) Limited
General Distributor
Fidelity Distributors Corporation
Boston, MA
Transfer and Service Agents
Fidelity Investments Institutional
Operations Company, Inc.
Boston, MA
Fidelity Service Company, Inc.
Boston, MA
Custodian
JPMorgan Chase Bank
New York, NY
(Fidelity Logo)
Corporate Headquarters
82 Devonshire St., Boston, MA 02109
www.fidelity.com
DIF-K-UANN-1211
1.863004.103
Fidelity®
Diversified International
Fund -
Class F
Annual Report
October 31, 2011
(Fidelity Cover Art)
Contents
Performance | (Click Here) | How the fund has done over time. |
Management's Discussion of Fund Performance | (Click Here) | The Portfolio Manager's review of fundperformance and strategy. |
Shareholder Expense Example | (Click Here) | An example of shareholder expenses. |
Investment Changes | (Click Here) | A summary of major shifts in the fund's investments over the past six months. |
Investments | (Click Here) | A complete list of the fund's investments with their market values. |
Financial Statements | (Click Here) | Statements of assets and liabilities, operations, and changes in net assets, as well as financial highlights. |
Notes | (Click Here) | Notes to the financial statements. |
Report of Independent Registered Public Accounting Firm | (Click Here) | |
Trustees and Officers | (Click Here) | |
Distributions | (Click Here) | |
Board Approval of Investment Advisory Contracts and Management Fees | (Click Here) | |
To view a fund's proxy voting guidelines and proxy voting record for the 12-month period ended June 30, visit http://www.fidelity.com/proxyvotingresults or visit the Securities and Exchange Commission's (SEC) web site at http://www.sec.gov. You may also call 1-800-835-5092 to request a free copy of the proxy voting guidelines.
Standard & Poor's, S&P and S&P 500 are registered service marks of The McGraw-Hill Companies, Inc. and have been licensed for use by Fidelity Distributors Corporation.
Other third party marks appearing herein are the property of their respective owners.
All other marks appearing herein are registered or unregistered trademarks or service marks of FMR LLC or an affiliated company.
This report and the financial statements contained herein are submitted for the general information of the shareholders of the fund. This report is not authorized for distribution to prospective investors in the fund unless preceded or accompanied by an effective prospectus.
A fund files its complete schedule of portfolio holdings with the SEC for the first and third quarters of each fiscal year on Form N-Q. Forms N-Q are available on the SEC's web site at http://www.sec.gov. A fund's Forms N-Q may be reviewed and copied at the SEC's Public Reference Room in Washington, DC. Information regarding the operation of the SEC's Public Reference Room may be obtained by calling 1-800-SEC-0330. For a complete list of a fund's portfolio holdings, view the most recent holdings listing, semiannual report, or annual report on Fidelity's web site at http://www.fidelity.com, http://www.advisor.fidelity.com, or http://www.401k.com, as applicable.
NOT FDIC INSURED • MAY LOSE VALUE • NO BANK GUARANTEE
Neither the fund nor Fidelity Distributors Corporation is a bank.
Annual Report
Average annual total return reflects the change in the value of an investment, assuming reinvestment of the class' distributions from dividend income and capital gains (the profits earned upon the sale of securities that have grown in value, if any) and assuming a constant rate of performance each year. The $10,000 table and the fund's returns do not reflect the deduction of taxes that a shareholder would pay on fund distributions or the redemption of fund shares. During periods of reimbursement by Fidelity, a fund's total return will be greater than it would be had the reimbursement not occurred. How a fund did yesterday is no guarantee of how it will do tomorrow.
Average Annual Total Returns
Periods ended October 31, 2011 | Past 1
year | Past 5
years | Past 10
years |
Class F A | -4.86% | -2.22% | 7.04% |
A The initial offering of Class F shares took place on June 26, 2009. Returns prior to June 26, 2009, are those of Fidelity® Diversified International Fund, the original class of the fund.
$10,000 Over 10 Years
Let's say hypothetically that $10,000 was invested in Fidelity® Diversified International Fund - Class F on October 31, 2001. The chart shows how the value of your investment would have changed, and also shows how the MSCI® EAFE® (Europe, Australasia, Far East) Index performed over the same period. The initial offering of Class F took place on June 26, 2009. See above for additional information regarding the performance of Class F.
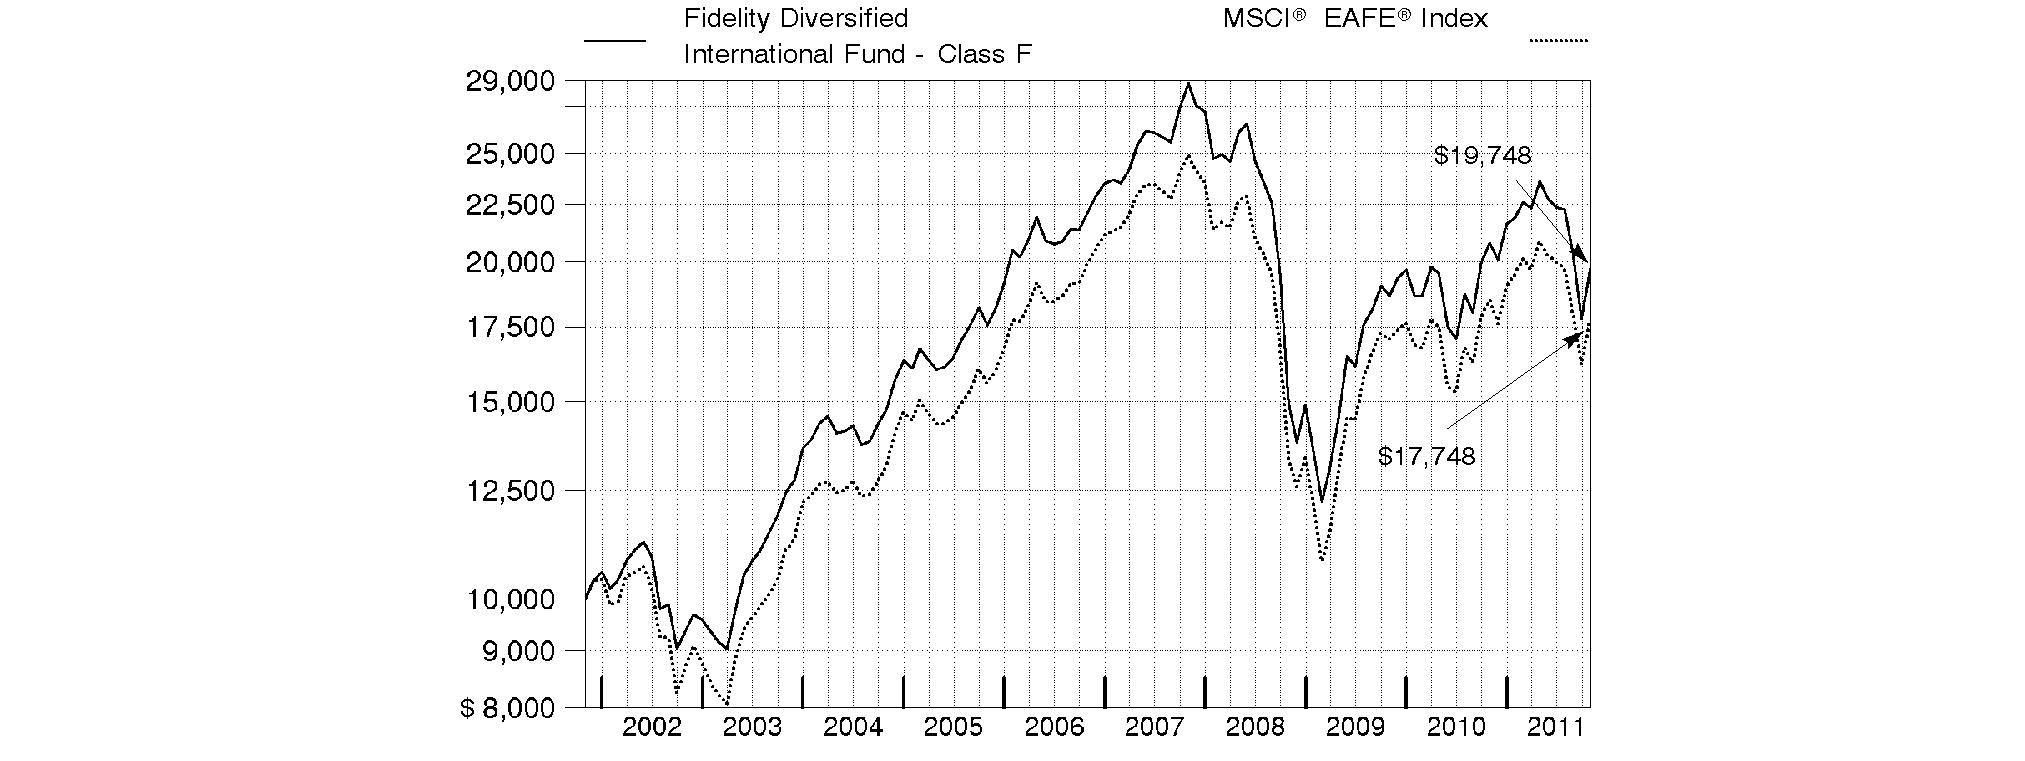
Annual Report
Market Recap: International equities were rocked by a number of headline events during the year ending October 31, 2011. Stocks posted a solid advance for the first half of the period, despite concern about the sovereign debt crisis in Europe, a devastating earthquake and tsunami in Japan, and political upheaval in the Middle East and North Africa. Sentiment turned decidedly negative in the second half, however, as fresh worries about Europe, inflation in China and a dimmed outlook for global growth caused foreign markets to suffer declines that intensified in August and September. October brought with it yet another dramatic swing, as eurozone policymakers appeared near a resolution to the debt debacle and buyers stormed back onto the scene in search of bargains. Still, those gains - along with favorable currency fluctuations overall - weren't enough to offset prior losses, and the MSCI® ACWI® (All Country World Index) ex USA Index finished the period down 4.56%. Within the MSCI index, Europe and emerging markets suffered the biggest declines, with many countries in these areas sustaining steep losses. By contrast, Japan showed resilience in the wake of its natural disasters, falling only 2%. Australia (+4%), Switzerland (+3%), the U.K. (+2%) and Canada, which produced a nominal return, were among the few major benchmark components to break into positive territory.
Comments from William Bower, Portfolio Manager of Fidelity® Diversified International Fund: For the year, the fund's Class F shares returned -4.86%, underperforming the -3.97% return of the MSCI® EAFE® (Europe, Australasia, Far East) Index. Fund performance versus the index was held back by security selection in energy, positioning in consumer staples, stock selection in financials and an underweighting in pharmaceuticals. Geographically, fund performance was curtailed by stock selection in the Asia-Pacific ex Japan region, China and Canada. Individual detractors included U.K.-based Lloyds Banking Group; out-of-benchmark positions in Canadian energy companies Niko Resources and Petrobank Energy & Resources; an underweighting in Swiss drug company Roche Holding, since sold; Danish beer company Carlsberg; and Italy's Fiat Industrial. On the plus side, the fund benefited from an underweighting in the utilities sector, positioning in consumer discretionary and security selection in technology hardware/equipment. Regionally, positioning in continental Europe helped, as did stock picks in Japan. Top contributors included Japan Tobacco, U.K.-listed Royal Dutch Shell, Japanese online retailer Rakuten, a lack of exposure to index component Tokyo Electric Power and an out-of-benchmark stake in technology giant Apple.
The views expressed above reflect those of the portfolio manager(s) only through the end of the period as stated on the cover of this report and do not necessarily represent the views of Fidelity or any other person in the Fidelity organization. Any such views are subject to change at any time based upon market or other conditions and Fidelity disclaims any responsibility to update such views. These views may not be relied on as investment advice and, because investment decisions for a Fidelity fund are based on numerous factors, may not be relied on as an indication of trading intent on behalf of any Fidelity fund.
Annual Report
Fidelity Diversified International Fund
As a shareholder of the Fund, you incur two types of costs: (1) transaction costs, including redemption fees, and (2) ongoing costs, including management fees and other Fund expenses. This Example is intended to help you understand your ongoing costs (in dollars) of investing in the Fund and to compare these costs with the ongoing costs of investing in other mutual funds.
The Example is based on an investment of $1,000 invested at the beginning of the period and held for the entire period (May 1, 2011 to October 31, 2011).
Actual Expenses
The first line of the accompanying table for each class of the Fund provides information about actual account values and actual expenses. You may use the information in this line, together with the amount you invested, to estimate the expenses that you paid over the period. Simply divide your account value by $1,000.00 (for example, an $8,600 account value divided by $1,000.00 = 8.6), then multiply the result by the number in the first line for a class of the Fund under the heading entitled "Expenses Paid During Period" to estimate the expenses you paid on your account during this period. A small balance maintenance fee of $12.00 that is charged once a year may apply for certain accounts with a value of less than $2,000. This fee is not included in the table below. If it was, the estimate of expenses you paid during the period would be higher, and your ending account value lower, by this amount. In addition, the Fund, as a shareholder in the underlying Fidelity Central Funds, will indirectly bear its pro-rata share of the fees and expenses incurred by the underlying Fidelity Central Funds. These fees and expenses are not included in the Fund's annualized expense ratio used to calculate the expense estimate in the table below.
Hypothetical Example for Comparison Purposes
The second line of the accompanying table for each class of the Fund provides information about hypothetical account values and hypothetical expenses based on a Class' actual expense ratio and an assumed rate of return of 5% per year before expenses, which is not the Class' actual return. The hypothetical account values and expenses may not be used to estimate the actual ending account balance or expenses you paid for the period. You may use this information to compare the ongoing costs of investing in the Fund and other funds. To do so, compare this 5% hypothetical example with the 5% hypothetical examples that appear in the shareholder reports of the other funds. A small balance maintenance fee of $12.00 that is charged once a year may apply for certain accounts with a value of less than $2,000. This fee is not included in the table below. If it was, the estimate of expenses you paid during the period would be higher, and your ending account value lower, by this amount. In addition, the Fund, as a shareholder in the underlying Fidelity Central Funds, will indirectly bear its pro-rata share of the fees and expenses incurred by the underlying Fidelity Central Funds. These fees and expenses are not included in the Fund's annualized expense ratio used to calculate the expense estimate in the table below.
Please note that the expenses shown in the table are meant to highlight your ongoing costs only and do not reflect any transaction costs. Therefore, the second line of the table is useful in comparing ongoing costs only, and will not help you determine the relative total costs of owning different funds. In addition, if these transactional costs were included, your costs would have been higher.
| Annualized Expense Ratio | Beginning
Account Value
May 1, 2011 | Ending
Account Value
October 31, 2011 | Expenses Paid
During Period*
May 1, 2011 to October 31, 2011 |
Diversified International | .87% | | | |
Actual | | $ 1,000.00 | $ 836.80 | $ 4.03 |
HypotheticalA | | $ 1,000.00 | $ 1,020.82 | $ 4.43 |
Class K | .70% | | | |
Actual | | $ 1,000.00 | $ 837.70 | $ 3.24 |
HypotheticalA | | $ 1,000.00 | $ 1,021.68 | $ 3.57 |
Class F | .64% | | | |
Actual | | $ 1,000.00 | $ 838.00 | $ 2.96 |
HypotheticalA | | $ 1,000.00 | $ 1,021.98 | $ 3.26 |
A 5% return per year before expenses
* Expenses are equal to each Class' annualized expense ratio, multiplied by the average account value over the period, multiplied by 184/365 (to reflect the one-half year period).
Annual Report
Fidelity Diversified International Fund
Investment Changes (Unaudited)
Geographic Diversification (% of fund's net assets) |
As of October 31, 2011 |
 | United Kingdom | 18.1% | |
 | Japan | 13.4% | |
 | Germany | 8.6% | |
 | United States of America | 8.4% | |
 | France | 7.1% | |
 | Canada | 5.6% | |
 | Switzerland | 4.4% | |
 | Australia | 3.6% | |
 | Netherlands | 2.7% | |
 | Other | 28.1% | |
Percentages are adjusted for the effect of futures contracts, if applicable. |
As of April 30, 2011 |
| United Kingdom | 17.6% | |
| Japan | 13.0% | |
| Germany | 8.4% | |
| France | 6.4% | |
| United States of America | 6.2% | |
| Switzerland | 5.4% | |
| Canada | 5.0% | |
| Australia | 3.8% | |
| Spain | 3.4% | |
| Other | 30.8% | |
Percentages are adjusted for the effect of futures contracts, if applicable. |
Asset Allocation |
| % of fund's
net assets | % of fund's net assets
6 months ago |
Stocks | 96.6 | 98.1 |
Short-Term Investments and Net Other Assets | 3.4 | 1.9 |
Top Ten Stocks as of October 31, 2011 |
| % of fund's
net assets | % of fund's net assets
6 months ago |
Royal Dutch Shell PLC Class B sponsored ADR (United Kingdom, Oil, Gas & Consumable Fuels) | 3.0 | 2.4 |
BHP Billiton Ltd. sponsored ADR (Australia, Metals & Mining) | 2.1 | 2.0 |
Novo Nordisk A/S Series B (Denmark, Pharmaceuticals) | 1.8 | 1.7 |
HSBC Holdings PLC sponsored ADR (United Kingdom, Commercial Banks) | 1.7 | 1.6 |
GlaxoSmithKline PLC (United Kingdom, Pharmaceuticals) | 1.6 | 1.1 |
Vodafone Group PLC sponsored ADR (United Kingdom, Wireless Telecommunication Services) | 1.6 | 1.2 |
Nestle SA (Switzerland, Food Products) | 1.4 | 1.1 |
Royal Dutch Shell PLC Class A sponsored ADR (United Kingdom, Oil, Gas & Consumable Fuels) | 1.4 | 1.1 |
ORIX Corp. (Japan, Diversified Financial Services) | 1.3 | 1.1 |
Reckitt Benckiser Group PLC (United Kingdom, Household Products) | 1.3 | 1.3 |
| 17.2 | |
Market Sectors as of October 31, 2011 |
| % of fund's
net assets | % of fund's net assets
6 months ago |
Financials | 15.5 | 20.5 |
Consumer Discretionary | 16.0 | 14.8 |
Energy | 11.4 | 11.3 |
Materials | 10.2 | 11.2 |
Consumer Staples | 10.1 | 6.7 |
Information Technology | 9.8 | 10.3 |
Industrials | 9.1 | 10.8 |
Health Care | 8.2 | 6.2 |
Telecommunication Services | 6.2 | 6.0 |
Utilities | 0.1 | 0.3 |
Annual Report
Fidelity Diversified International Fund
Investments October 31, 2011
Showing Percentage of Net Assets
Common Stocks - 95.1% |
| Shares | | Value |
Australia - 3.6% |
BHP Billiton Ltd. sponsored ADR (d) | 6,896,500 | | $ 538,478,720 |
Fortescue Metals Group Ltd. | 5,712,451 | | 28,695,469 |
Iluka Resources Ltd. | 2,245,282 | | 37,330,693 |
Newcrest Mining Ltd. | 7,469,169 | | 263,999,256 |
Paladin Energy Ltd. (Australia) (a) | 401,613 | | 613,372 |
QBE Insurance Group Ltd. | 2,851,820 | | 43,902,034 |
WorleyParsons Ltd. | 503,041 | | 14,602,027 |
TOTAL AUSTRALIA | | 927,621,571 |
Austria - 0.0% |
Osterreichische Elektrizitatswirtschafts AG | 6,000 | | 174,662 |
Bailiwick of Guernsey - 1.2% |
Amdocs Ltd. (a) | 1,849,800 | | 55,530,996 |
Ashmore Global Opportunities Ltd. (United Kingdom) | 767,088 | | 8,512,053 |
Resolution Ltd. | 52,410,500 | | 231,788,056 |
TOTAL BAILIWICK OF GUERNSEY | | 295,831,105 |
Bailiwick of Jersey - 1.9% |
Experian PLC | 14,652,572 | | 190,988,377 |
Randgold Resources Ltd. sponsored ADR | 855,700 | | 93,759,049 |
Shire PLC | 2,847,600 | | 89,390,276 |
WPP PLC | 11,475,509 | | 118,805,910 |
TOTAL BAILIWICK OF JERSEY | | 492,943,612 |
Belgium - 1.0% |
Anheuser-Busch InBev SA NV | 4,421,964 | | 245,260,547 |
Anheuser-Busch InBev SA NV (strip VVPR) (a) | 5,339,200 | | 7,389 |
TOTAL BELGIUM | | 245,267,936 |
Bermuda - 1.1% |
ARA Asset Management Ltd. | 693,000 | | 717,641 |
Assured Guaranty Ltd. | 3,044,700 | | 38,789,478 |
Cafe de Coral Holdings Ltd. | 314,000 | | 708,589 |
CNPC (Hong Kong) Ltd. | 17,870,000 | | 25,031,989 |
Huabao International Holdings Ltd. | 40,906,000 | | 25,985,857 |
Kosmos Energy Ltd. | 1,876,800 | | 29,090,400 |
Li & Fung Ltd. | 47,910,000 | | 92,331,883 |
Noble Group Ltd. | 62,626,000 | | 76,438,883 |
Pacific Basin Shipping Ltd. | 1,535,000 | | 699,915 |
Vtech Holdings Ltd. | 62,200 | | 580,780 |
TOTAL BERMUDA | | 290,375,415 |
Brazil - 2.0% |
All America Latina Logistica SA | 87,300 | | 434,670 |
Anhanguera Educacional Participacoes SA | 2,049,500 | | 30,136,196 |
Banco Bradesco SA | 111,400 | | 1,621,826 |
Banco Bradesco SA (PN) sponsored ADR | 3,400,000 | | 61,880,000 |
BM&F Bovespa SA | 181,100 | | 1,080,989 |
|
| Shares | | Value |
Droga Raia SA | 386,000 | | $ 5,473,503 |
Drogasil SA | 4,673,900 | | 29,395,598 |
Estacio Participacoes SA | 1,989,165 | | 23,213,875 |
Fleury SA | 46,700 | | 588,781 |
Hypermarcas SA | 96,700 | | 520,328 |
Itau Unibanco Banco Multiplo SA sponsored ADR | 6,775,800 | | 129,553,296 |
Klabin SA (PN) (non-vtg.) | 193,000 | | 710,319 |
Kroton Educacional SA unit (a) | 1,279,200 | | 14,302,725 |
Multiplus SA | 63,000 | | 1,063,941 |
Qualicorp SA | 3,366,000 | | 30,774,633 |
Souza Cruz Industria Comerico | 5,151,200 | | 63,175,094 |
T4F Entretenimento SA | 2,091,900 | | 14,618,449 |
Telefonica Brasil SA sponsored ADR (a) | 2,600,955 | | 75,479,714 |
Tractebel Energia SA | 1,917,200 | | 30,702,888 |
Usinas Siderurgicas de Minas Gerais SA - Usiminas (PN-A) (non-vtg.) | 80,000 | | 549,732 |
Valid Solucoes SA | 69,260 | | 830,862 |
Weg SA | 71,000 | | 787,649 |
Wilson Sons Ltd. unit | 57,500 | | 813,679 |
TOTAL BRAZIL | | 517,708,747 |
British Virgin Islands - 0.3% |
Arcos Dorados Holdings, Inc. | 1,737,100 | | 40,648,140 |
Camelot Information Systems, Inc. ADR (a)(d) | 1,840,603 | | 6,000,366 |
Mail.ru Group Ltd. GDR (Reg. S) | 1,065,100 | | 36,692,695 |
TOTAL BRITISH VIRGIN ISLANDS | | 83,341,201 |
Canada - 5.6% |
Agnico-Eagle Mines Ltd. (Canada) | 1,250,000 | | 54,220,796 |
Barrick Gold Corp. | 800,000 | | 39,492,401 |
Canadian Natural Resources Ltd. | 5,118,800 | | 180,545,727 |
Fairfax Financial Holdings Ltd. (sub. vtg.) | 170,000 | | 71,057,732 |
Goldcorp, Inc. | 1,859,800 | | 90,485,329 |
InterOil Corp. (a)(d) | 274,600 | | 13,046,246 |
Ivanhoe Mines Ltd. (a) | 3,235,460 | | 66,211,952 |
Niko Resources Ltd. | 2,237,500 | | 123,069,795 |
Open Text Corp. (a) | 1,440,400 | | 88,156,497 |
Osisko Mining Corp. (a) | 2,890,000 | | 34,847,570 |
Painted Pony Petroleum Ltd. (a)(f)(e) | 2,485,600 | | 30,395,209 |
Painted Pony Petroleum Ltd. Class A (a)(e) | 3,643,370 | | 44,553,022 |
Penn West Petroleum Ltd. | 754,400 | | 13,478,321 |
Petrobank Energy & Resources Ltd. | 5,356,000 | | 48,195,135 |
Petrominerales Ltd. | 3,121,175 | | 82,346,293 |
Potash Corp. of Saskatchewan, Inc. (d) | 2,589,500 | | 122,558,670 |
Silver Wheaton Corp. | 669,800 | | 23,127,367 |
Suncor Energy, Inc. | 2,661,700 | | 84,776,019 |
Talisman Energy, Inc. | 6,846,400 | | 97,114,005 |
Tourmaline Oil Corp. (a) | 1,440,000 | | 47,872,398 |
Tourmaline Oil Corp. (a)(f) | 310,100 | | 10,309,188 |
Common Stocks - continued |
| Shares | | Value |
Canada - continued |
Uranium One, Inc. | 11,314,400 | | $ 34,050,459 |
Valeant Pharmaceuticals International, Inc. (Canada) | 700,000 | | 27,639,063 |
TOTAL CANADA | | 1,427,549,194 |
Cayman Islands - 0.7% |
Boer Power Holdings Ltd. | 2,826,000 | | 1,037,408 |
China Automation Group Ltd. | 5,475,000 | | 1,900,663 |
China Lodging Group Ltd. ADR (a) | 50,100 | | 778,053 |
China ZhengTong Auto Services Holdings Ltd. | 24,761,500 | | 26,812,069 |
Geely Automobile Holdings Ltd. | 34,550,000 | | 8,833,647 |
Hengan International Group Co. Ltd. | 9,258,000 | | 80,251,579 |
HiSoft Technology International Ltd. ADR (a)(d) | 1,726,400 | | 21,372,832 |
Hutchison China Meditech Ltd. (a) | 124,800 | | 597,092 |
Mindray Medical International Ltd. sponsored ADR (d) | 48,000 | | 1,310,400 |
Minth Group Ltd. | 8,036,000 | | 8,337,881 |
NVC Lighting Holdings Ltd. | 41,380,000 | | 17,966,892 |
Samson Holding Ltd. | 6,041,000 | | 617,660 |
Sands China Ltd. (a) | 4,816,800 | | 14,475,389 |
SITC International Holdings Co. Ltd. | 2,881,000 | | 744,165 |
Xingda International Holdings Ltd. | 1,472,000 | | 843,327 |
Xueda Education Group sponsored ADR | 177,700 | | 589,964 |
TOTAL CAYMAN ISLANDS | | 186,469,021 |
Chile - 0.0% |
Compania Cervecerias Unidas SA sponsored ADR | 23,000 | | 1,317,440 |
Embotelladora Andina SA sponsored ADR | 40,000 | | 1,140,000 |
Empresa Nacional de Telecomunicaciones SA (ENTEL) | 48,876 | | 967,644 |
Inversiones Aguas Metropolitanas SA | 871,222 | | 1,369,203 |
Isapre CruzBlanca SA (a) | 868,719 | | 824,481 |
Quinenco SA | 363,717 | | 1,028,162 |
Sonda SA | 228,248 | | 557,168 |
TOTAL CHILE | | 7,204,098 |
China - 1.0% |
Baidu.com, Inc. sponsored ADR (a)(d) | 1,375,500 | | 192,817,590 |
Changsha Zoomlion Heavy Industry Science & Technology Development Co. Ltd. (H Shares) | 25,167,480 | | 36,411,889 |
China Bluechemical Ltd. (H shares) | 938,000 | | 735,046 |
China Communications Services Corp. Ltd. (H Shares) | 2,208,000 | | 1,018,299 |
China Construction Bank Corp. (H Shares) | 1,408,000 | | 1,034,507 |
Comba Telecom Systems Holdings Ltd. | 865,500 | | 730,793 |
|
| Shares | | Value |
Shandong Weigao Group Medical Polymer Co. Ltd. (H Shares) | 20,692,000 | | $ 21,505,759 |
SINA Corp. (a)(d) | 150,000 | | 12,193,500 |
TOTAL CHINA | | 266,447,383 |
Colombia - 0.0% |
Ecopetrol SA ADR | 18,000 | | 765,720 |
Curacao - 0.6% |
Schlumberger Ltd. | 2,104,800 | | 154,639,656 |
Denmark - 2.6% |
Carlsberg A/S Series B | 1,542,600 | | 105,006,110 |
Novo Nordisk A/S Series B | 4,408,339 | | 468,091,658 |
William Demant Holding A/S (a) | 1,096,698 | | 87,503,314 |
TOTAL DENMARK | | 660,601,082 |
Egypt - 0.0% |
Commercial International Bank Ltd. | 134,400 | | 598,985 |
JUHAYNA Food Industries (a) | 682,600 | | 558,111 |
TOTAL EGYPT | | 1,157,096 |
Finland - 0.1% |
Nokian Tyres PLC | 439,253 | | 16,139,273 |
France - 7.1% |
Alstom SA | 3,024,896 | | 113,444,762 |
Arkema SA | 345,300 | | 23,623,042 |
Atos Origin SA | 365,000 | | 17,689,425 |
AXA SA | 5,053,600 | | 82,315,579 |
BNP Paribas SA | 4,498,836 | | 204,522,102 |
Bureau Veritas SA | 493,400 | | 38,387,930 |
Danone | 2,707,950 | | 188,500,861 |
Dassault Aviation SA (d) | 36,265 | | 34,930,245 |
Essilor International SA | 1,754,728 | | 127,246,488 |
JC Decaux SA (a) | 990,200 | | 26,536,591 |
LVMH Moet Hennessy - Louis Vuitton | 1,827,964 | | 304,198,757 |
PPR SA | 2,051,100 | | 320,468,603 |
Publicis Groupe SA | 1,225,000 | | 59,394,047 |
Sanofi-aventis | 3,684,720 | | 263,639,409 |
TOTAL FRANCE | | 1,804,897,841 |
Germany - 7.1% |
adidas AG | 1,561,780 | | 110,574,530 |
Allianz AG | 827,462 | | 92,995,574 |
BASF AG | 2,293,559 | | 168,828,055 |
Bayer AG | 1,939,962 | | 124,288,808 |
Bayerische Motoren Werke AG (BMW) | 570,895 | | 46,661,038 |
Deutsche Boerse AG | 961,100 | | 53,202,652 |
ElringKlinger AG | 777,428 | | 21,549,929 |
Fresenius Medical Care AG & Co. KGaA | 2,737,800 | | 199,465,891 |
Fresenius SE | 2,037,100 | | 201,033,066 |
GFK AG | 1,496,500 | | 69,171,612 |
Infineon Technologies AG | 2,825,300 | | 25,527,951 |
Kabel Deutschland Holding AG (a) | 917,600 | | 52,394,698 |
Linde AG | 1,228,429 | | 195,417,632 |
Common Stocks - continued |
| Shares | | Value |
Germany - continued |
SAP AG | 2,904,790 | | $ 175,672,049 |
Siemens AG sponsored ADR (d) | 2,686,500 | | 282,001,905 |
TOTAL GERMANY | | 1,818,785,390 |
Hong Kong - 1.1% |
AIA Group Ltd. | 27,220,800 | | 83,234,101 |
China Everbright Ltd. | 470,000 | | 696,819 |
China Insurance International Holdings Co. Ltd. (a) | 314,800 | | 682,663 |
China Mobile (Hong Kong) Ltd. sponsored ADR | 1,335,275 | | 63,505,679 |
China Resources Enterprise Ltd. | 3,626,000 | | 13,242,327 |
Henderson Land Development Co. Ltd. | 9,664,155 | | 52,824,551 |
Hopewell Holdings Ltd. | 367,500 | | 954,394 |
Swire Pacific Ltd. (A Shares) | 4,577,000 | | 52,889,821 |
Television Broadcasts Ltd. | 184,000 | | 1,060,283 |
TOTAL HONG KONG | | 269,090,638 |
India - 2.2% |
Axis Bank Ltd. | 1,472,751 | | 34,807,954 |
Bajaj Auto Ltd. | 793,148 | | 28,053,344 |
Bharti Airtel Ltd. | 9,007,984 | | 72,142,424 |
Cipla Ltd. | 152,766 | | 923,047 |
CMC Ltd. | 50,598 | | 839,811 |
Cummins India Ltd. | 598,043 | | 4,879,115 |
Deccan Chronicle Holdings Ltd. (a) | 502,904 | | 531,886 |
Dr. Reddy's Laboratories Ltd. | 164,145 | | 5,561,788 |
HDFC Bank Ltd. | 12,995,695 | | 129,605,356 |
Housing Development Finance Corp. Ltd. | 6,539,994 | | 92,036,217 |
India Cements Ltd. | 419,168 | | 687,050 |
Indian Bank | 129,270 | | 572,409 |
Infrastructure Development Finance Co. Ltd. | 11,744,307 | | 31,706,496 |
ITC Ltd. | 5,213,498 | | 22,739,475 |
Jyothy Laboratories Ltd. | 196,188 | | 574,273 |
Lupin Ltd. | 513,210 | | 4,938,001 |
Mahindra & Mahindra Financial Services Ltd. | 2,226,876 | | 30,619,486 |
Max India Ltd. (a) | 159,846 | | 618,828 |
Piramal Healthcare Ltd. | 82,278 | | 606,698 |
Punjab National Bank | 47,106 | | 959,620 |
Redington India Ltd. | 285,486 | | 555,235 |
Shriram Transport Finance Co. Ltd. | 2,327,613 | | 29,139,567 |
State Bank of India | 1,273,075 | | 49,517,031 |
Tulip Telecom Ltd. | 216,760 | | 667,397 |
Wipro Ltd. | 1,388,041 | | 10,415,154 |
TOTAL INDIA | | 553,697,662 |
Ireland - 0.5% |
Accenture PLC Class A | 842,000 | | 50,738,920 |
|
| Shares | | Value |
CRH PLC | 2,294,300 | | $ 41,420,472 |
Elan Corp. PLC sponsored ADR (a) | 2,547,800 | | 30,548,122 |
TOTAL IRELAND | | 122,707,514 |
Italy - 1.8% |
ENI SpA | 914,500 | | 20,216,952 |
Fiat Industrial SpA (a) | 22,427,792 | | 195,693,464 |
Prada SpA | 7,151,000 | | 35,350,634 |
Saipem SpA | 4,438,007 | | 198,992,956 |
TOTAL ITALY | | 450,254,006 |
Japan - 13.4% |
ABC-Mart, Inc. | 1,300,200 | | 50,924,779 |
Aozora Bank Ltd. | 15,351,000 | | 38,812,684 |
Calbee, Inc. (d) | 1,161,000 | | 52,932,917 |
Denso Corp. | 1,928,200 | | 59,306,047 |
Dentsu, Inc. | 2,233,900 | | 67,271,842 |
Don Quijote Co. Ltd. | 1,603,200 | | 58,734,504 |
Fanuc Corp. | 849,100 | | 137,308,760 |
Hitachi Ltd. | 46,637,000 | | 249,926,411 |
Honda Motor Co. Ltd. | 7,721,500 | | 230,931,326 |
Hoya Corp. | 2,535,400 | | 55,397,394 |
Itochu Corp. | 13,063,600 | | 129,221,379 |
Japan Retail Fund Investment Corp. | 3,741 | | 5,791,709 |
Japan Tobacco, Inc. | 64,874 | | 324,292,254 |
JSR Corp. | 3,621,700 | | 69,147,467 |
KDDI Corp. | 27,429 | | 200,952,920 |
Keyence Corp. | 661,100 | | 168,080,270 |
Mitsubishi Corp. | 3,128,000 | | 64,341,694 |
Mitsubishi UFJ Financial Group, Inc. | 18,434,600 | | 80,125,863 |
Mitsui & Co. Ltd. | 3,506,800 | | 51,186,625 |
Nitori Holdings Co. Ltd. | 468,050 | | 44,768,217 |
NTT DoCoMo, Inc. | 63,713 | | 113,171,495 |
ORIX Corp. | 3,924,320 | | 342,539,945 |
OSAKA Titanium technologies Co. Ltd. | 120,200 | | 6,621,404 |
Rakuten, Inc. | 232,855 | | 255,296,560 |
Seven & i Holdings Co., Ltd. | 4,070,900 | | 108,648,886 |
Shimadzu Corp. | 1,668,000 | | 14,201,899 |
SHIMANO, Inc. | 1,088,100 | | 53,791,901 |
SMC Corp. | 814,700 | | 126,736,052 |
SOFTBANK CORP. | 4,765,000 | | 154,670,897 |
Sumitomo Mitsui Financial Group, Inc. | 970,800 | | 27,138,812 |
Yahoo! Japan Corp. | 268,168 | | 86,135,853 |
TOTAL JAPAN | | 3,428,408,766 |
Korea (South) - 2.1% |
Amorepacific Corp. | 90,308 | | 101,831,595 |
BS Financial Group, Inc. (a) | 84,020 | | 921,277 |
Korea Plant Service & Engineering Co. Ltd. | 23,570 | | 643,352 |
LG Corp. | 22,235 | | 1,296,413 |
LG Household & Health Care Ltd. | 59,158 | | 26,618,232 |
MegaStudy Co. Ltd. | 5,266 | | 580,249 |
Common Stocks - continued |
| Shares | | Value |
Korea (South) - continued |
NHN Corp. (a) | 518,772 | | $ 107,822,858 |
Orion Corp. | 134,404 | | 71,836,677 |
S1 Corp. | 20,993 | | 1,088,469 |
Samchully Co. Ltd. | 8,166 | | 701,699 |
Samsung Electronics Co. Ltd. | 199,807 | | 171,364,442 |
Shinhan Financial Group Co. Ltd. | 1,389,720 | | 55,155,939 |
Shinsegae Co. Ltd. | 2,714 | | 680,024 |
Sindoh Co. Ltd. | 11,340 | | 505,997 |
TOTAL KOREA (SOUTH) | | 541,047,223 |
Luxembourg - 0.3% |
Brait SA | 322,500 | | 772,085 |
Millicom International Cellular SA (depositary receipt) | 6,700 | | 738,387 |
Samsonite International SA | 26,313,700 | | 42,814,701 |
Ternium SA sponsored ADR | 1,411,261 | | 34,632,345 |
TOTAL LUXEMBOURG | | 78,957,518 |
Malaysia - 0.0% |
Parkson Holdings Bhd | 563,574 | | 1,023,070 |
Mexico - 0.8% |
America Movil SAB de CV Series L sponsored ADR | 3,033,400 | | 77,109,028 |
Grupo Televisa SA de CV (CPO) sponsored ADR | 2,180,600 | | 46,512,198 |
Urbi, Desarrollos Urbanos, SA de CV (a) | 422,300 | | 536,746 |
Wal-Mart de Mexico SA de CV Series V | 34,518,200 | | 89,171,013 |
TOTAL MEXICO | | 213,328,985 |
Netherlands - 2.7% |
AEGON NV (a) | 27,466,400 | | 131,004,746 |
ASML Holding NV (Netherlands) | 1,332,700 | | 55,913,481 |
Gemalto NV | 1,476,891 | | 67,386,376 |
ING Groep NV sponsored ADR (a)(d) | 19,501,500 | | 168,492,960 |
Koninklijke KPN NV | 10,983,331 | | 144,337,603 |
Koninklijke Philips Electronics NV (depositary receipt) (NY Reg.) | 4,051,300 | | 84,469,605 |
Unilever NV (Certificaten Van Aandelen) (Bearer) unit | 767,500 | | 26,500,744 |
Yandex NV | 450,000 | | 12,384,000 |
TOTAL NETHERLANDS | | 690,489,515 |
Norway - 1.5% |
DnB NOR ASA | 9,071,909 | | 105,830,248 |
Storebrand ASA (A Shares) | 4,980,000 | | 30,706,840 |
Telenor ASA | 14,310,000 | | 255,480,638 |
TOTAL NORWAY | | 392,017,726 |
Papua New Guinea - 0.0% |
Oil Search Ltd. | 140,611 | | 959,368 |
Philippines - 0.0% |
Banco de Oro Universal Bank | 677,000 | | 893,986 |
|
| Shares | | Value |
Manila Water Co., Inc. | 2,331,300 | | $ 1,060,800 |
Universal Robina Corp. | 899,000 | | 991,040 |
TOTAL PHILIPPINES | | 2,945,826 |
Poland - 0.0% |
Eurocash SA | 98,400 | | 788,957 |
Kruk SA (a) | 53,000 | | 706,578 |
Warsaw Stock Exchange | 44,200 | | 624,003 |
TOTAL POLAND | | 2,119,538 |
Qatar - 0.2% |
Commercial Bank of Qatar GDR (Reg. S) | 9,940,628 | | 45,591,071 |
Russia - 0.4% |
Sberbank of Russia | 20,189,400 | | 54,784,535 |
Uralkali JSC GDR (Reg. S) | 939,700 | | 40,782,980 |
TOTAL RUSSIA | | 95,567,515 |
Singapore - 0.0% |
Global Logistic Properties Ltd. | 523,000 | | 727,928 |
South Africa - 0.7% |
African Bank Investments Ltd. | 146,200 | | 634,443 |
AngloGold Ashanti Ltd. | 35,900 | | 1,622,469 |
AngloGold Ashanti Ltd. sponsored ADR | 1,750,000 | | 79,117,500 |
Aveng Ltd. | 120,300 | | 562,369 |
Foschini Ltd. | 1,702,800 | | 21,485,880 |
JSE Ltd. | 74,600 | | 660,621 |
Nampak Ltd. | 191,000 | | 524,653 |
Naspers Ltd. Class N | 860,200 | | 41,186,371 |
Sasol Ltd. | 23,900 | | 1,074,739 |
Shoprite Holdings Ltd. | 1,956,200 | | 28,668,979 |
Tiger Brands Ltd. | 408,600 | | 11,775,123 |
TOTAL SOUTH AFRICA | | 187,313,147 |
Spain - 2.6% |
Banco Bilbao Vizcaya Argentaria SA | 7,048,840 | | 63,448,157 |
Banco Santander SA (Spain) sponsored ADR (d) | 13,562,300 | | 116,093,288 |
Grifols SA ADR (a) | 9,784,300 | | 62,717,363 |
Inditex SA (d) | 3,264,772 | | 297,111,439 |
Prosegur Compania de Seguridad SA (Reg.) | 1,822,600 | | 90,928,776 |
Repsol YPF SA | 1,000,369 | | 30,318,594 |
TOTAL SPAIN | | 660,617,617 |
Sweden - 0.4% |
H&M Hennes & Mauritz AB (B Shares) | 1,292,285 | | 42,795,029 |
Swedbank AB (A Shares) | 4,284,600 | | 60,363,140 |
TOTAL SWEDEN | | 103,158,169 |
Switzerland - 4.4% |
Clariant AG (Reg.) (a) | 4,713,347 | | 51,535,029 |
Kuehne & Nagel International AG | 1,486,880 | | 185,192,848 |
Nestle SA | 6,034,542 | | 350,017,877 |
Noble Corp. | 742,700 | | 26,692,638 |
Partners Group Holding | 49,390 | | 9,258,339 |
Common Stocks - continued |
| Shares | | Value |
Switzerland - continued |
Schindler Holding AG (Reg.) | 1,278,570 | | $ 150,505,705 |
Transocean Ltd. (United States) | 1,650,300 | | 94,314,645 |
UBS AG (a) | 12,243,801 | | 154,783,795 |
Zurich Financial Services AG | 410,659 | | 95,370,411 |
TOTAL SWITZERLAND | | 1,117,671,287 |
Taiwan - 1.0% |
Chroma ATE, Inc. | 295,200 | | 588,987 |
CTCI Corp. | 544,000 | | 692,166 |
Giant Manufacturing Co. Ltd. | 195,000 | | 754,567 |
HTC Corp. | 4,228,000 | | 95,018,182 |
Motech Industries, Inc. | 381,000 | | 715,692 |
Pacific Hospital Supply Co. Ltd. | 219,064 | | 716,843 |
Powertech Technology, Inc. | 288,600 | | 702,614 |
SIMPLO Technology Co. Ltd. | 89,200 | | 524,868 |
St. Shine Optical Co. Ltd. | 53,000 | | 665,803 |
Ta Chong Bank (a) | 3,076,000 | | 885,512 |
Taiwan Fertilizer Co. Ltd. | 3,810,000 | | 9,820,065 |
Taiwan Semiconductor Manufacturing Co. Ltd. | 612,000 | | 1,491,368 |
Taiwan Semiconductor Manufacturing Co. Ltd. sponsored ADR | 10,407,200 | | 131,338,864 |
Unified-President Enterprises Corp. | 7,865,200 | | 10,815,919 |
TOTAL TAIWAN | | 254,731,450 |
Thailand - 0.0% |
Banpu PCL (For. Reg.) | 25,400 | | 515,630 |
Charoen Pokphand Foods PCL (For. Reg.) | 653,400 | | 636,326 |
PTT PCL (For. Reg.) | 93,000 | | 916,177 |
TOTAL THAILAND | | 2,068,133 |
United Arab Emirates - 0.0% |
Dubai Financial Market PJSC (a) | 2,045,195 | | 573,523 |
United Kingdom - 18.1% |
3Legs Resources PLC | 6,373,700 | | 13,837,749 |
Anglo American PLC (United Kingdom) | 3,427,600 | | 126,423,827 |
BG Group PLC | 11,701,879 | | 255,279,216 |
British American Tobacco PLC: | | | |
(United Kingdom) | 85,000 | | 3,898,004 |
sponsored ADR | 1,797,900 | | 165,856,275 |
Burberry Group PLC | 6,074,500 | | 131,002,436 |
Capita Group PLC | 7,638,800 | | 89,248,477 |
Carphone Warehouse Group PLC | 16,014,300 | | 90,397,232 |
Compass Group PLC | 150,000 | | 1,365,362 |
Filtrona PLC | 1,190,508 | | 7,602,777 |
GlaxoSmithKline PLC | 18,595,500 | | 417,404,751 |
HSBC Holdings PLC sponsored ADR | 9,939,900 | | 433,976,034 |
Imperial Tobacco Group PLC | 2,149,970 | | 78,625,409 |
Inchcape PLC | 17,114,619 | | 89,809,932 |
|
| Shares | | Value |
ITV PLC | 62,863,890 | | $ 64,753,082 |
Lloyds Banking Group PLC (a) | 229,626,800 | | 118,767,489 |
Misys PLC | 13,125,310 | | 61,593,504 |
National Grid PLC | 308,000 | | 3,062,719 |
Next PLC | 3,224,800 | | 132,557,312 |
Ocado Group PLC (a)(d) | 9,816,418 | | 14,784,304 |
Pan African Resources PLC | 3,344,300 | | 699,179 |
Pearson PLC | 10,425,200 | | 191,555,485 |
Pz Cussons PLC Class L | 1,957,500 | | 11,584,829 |
QinetiQ Group PLC | 12,165,700 | | 22,851,778 |
Reckitt Benckiser Group PLC | 6,620,100 | | 340,473,304 |
Rockhopper Exploration PLC (a) | 201,600 | | 693,816 |
Rolls-Royce Group PLC | 18,758,100 | | 211,921,603 |
Rolls-Royce Group PLC Class C | 1,294,308,900 | | 2,081,508 |
Royal Dutch Shell PLC: | | | |
Class A (United Kingdom) | 198,500 | | 7,033,114 |
Class A sponsored ADR | 4,900,000 | | 347,459,000 |
Class B sponsored ADR | 10,527,400 | | 755,867,323 |
Standard Chartered PLC (United Kingdom) | 105,587 | | 2,477,455 |
SuperGroup PLC (a)(d) | 1,516,200 | | 15,215,322 |
Vodafone Group PLC sponsored ADR | 14,974,100 | | 416,878,944 |
TOTAL UNITED KINGDOM | | 4,627,038,551 |
United States of America - 5.0% |
Anadarko Petroleum Corp. | 10,800 | | 847,800 |
Apple, Inc. (a) | 654,300 | | 264,847,554 |
CF Industries Holdings, Inc. | 470,800 | | 76,396,716 |
Citigroup, Inc. | 5,105,150 | | 161,271,689 |
Cognizant Technology Solutions Corp. Class A (a) | 658,900 | | 47,934,975 |
Facebook, Inc. Class B (g) | 1,288,142 | | 32,203,550 |
Green Mountain Coffee Roasters, Inc. (a) | 280,100 | | 18,212,102 |
Intuit, Inc. | 321,900 | | 17,276,373 |
Nabors Industries Ltd. (a) | 1,587,600 | | 29,100,708 |
Newmont Mining Corp. | 1,000,000 | | 66,830,000 |
Noble Energy, Inc. | 782,728 | | 69,928,920 |
Polycom, Inc. (a) | 2,900,000 | | 47,937,000 |
PriceSmart, Inc. | 43,700 | | 3,322,948 |
SanDisk Corp. (a) | 2,032,400 | | 102,981,708 |
Schweitzer-Mauduit International, Inc. (e) | 1,608,255 | | 113,092,492 |
The Mosaic Co. | 1,132,300 | | 66,307,488 |
Unisys Corp. (a) | 1,537,730 | | 39,965,603 |
Virgin Media, Inc. | 917,500 | | 22,368,650 |
Wells Fargo & Co. | 4,129,500 | | 106,995,345 |
TOTAL UNITED STATES OF AMERICA | | 1,287,821,621 |
TOTAL COMMON STOCKS (Cost $21,875,227,771) |
24,327,847,370
|
Nonconvertible Preferred Stocks - 1.5% |
| Shares | | Value |
Germany - 1.5% |
ProSiebenSat.1 Media AG | 3,507,000 | | $ 75,226,728 |
Volkswagen AG | 1,736,326 | | 304,687,918 |
TOTAL NONCONVERTIBLE PREFERRED STOCKS (Cost $221,929,530) |
379,914,646
|
Master Notes - 0.0% |
| Principal Amount | | |
Canada - 0.0% |
OZ Optics Ltd. 5% 11/5/14 (g)
(Cost $276,258) | | $ 270,994 | |
270,994
|
Money Market Funds - 6.3% |
| Shares | | |
Fidelity Cash Central Fund, 0.12% (b) | 725,272,617 | | 725,272,617 |
Fidelity Securities Lending Cash Central Fund, 0.11% (b)(c) | 886,536,637 | | 886,536,637 |
TOTAL MONEY MARKET FUNDS (Cost $1,611,809,254) |
1,611,809,254
|
TOTAL INVESTMENT
PORTFOLIO - 102.9% (Cost $23,709,242,813) | 26,319,842,264 |
NET OTHER ASSETS (LIABILITIES) - (2.9)% | (747,943,275) |
NET ASSETS - 100% | $ 25,571,898,989 |
Legend |
(a) Non-income producing |
(b) Affiliated fund that is available only to investment companies and other accounts managed by Fidelity Investments. The rate quoted is the annualized seven-day yield of the fund at period end. A complete unaudited listing of the fund's holdings as of its most recent quarter end is available upon request. In addition, each Fidelity Central Fund's financial statements, which are not covered by the Fund's Report of Independent Registered Public Accounting Firm, are available on the SEC's website or upon request. |
(c) Investment made with cash collateral received from securities on loan. |
(d) Security or a portion of the security is on loan at period end. |
(e) Affiliated company |
(f) Security exempt from registration under Rule 144A of the Securities Act of 1933. These securities may be resold in transactions exempt from registration, normally to qualified institutional buyers. At the end of the period, the value of these securities amounted to $40,704,397 or 0.2% of net assets. |
(g) Restricted securities - Investment in securities not registered under the Securities Act of 1933 (excluding 144A issues). At the end of the period, the value of restricted securities (excluding 144A issues) amounted to $32,474,544 or 0.1% of net assets. |
Additional information on each restricted holding is as follows: |
Security | Acquisition Date | Acquisition Cost |
Facebook, Inc. Class B | 3/31/11 | $ 32,203,550 |
OZ Optics Ltd. 5% 11/5/14 | 11/5/10 | $ 276,258 |
Affiliated Central Funds |
Information regarding fiscal year to date income earned by the Fund from investments in Fidelity Central Funds is as follows: |
Fund | Income earned |
Fidelity Cash Central Fund | $ 1,220,251 |
Fidelity Securities Lending Cash Central Fund | 20,356,167 |
Total | $ 21,576,418 |
Other Affiliated Issuers |
An affiliated company is a company in which the Fund has ownership of at least 5% of the voting securities. Fiscal year to date transactions with companies which are or were affiliates are as follows: |
Affiliate | Value,
beginning of period | Purchases | Sales
Proceeds | Dividend
Income | Value,
end of
period |
Ashmore Global Opportunities Ltd. (United States) | $ - | $ 9,748,350 | $ - | $ 240,285 | $ - |
Painted Pony Petroleum Ltd. | 9,544,006 | 11,945,802 | - | - | 30,395,209 |
Painted Pony Petroleum Ltd. Class A | 21,509,462 | 5,212,327 | - | - | 44,553,022 |
Petrobank Energy & Resources Ltd. | 223,863,859 | - | 1,729,615 | 108,873,999 | - |
Schweitzer-Mauduit International, Inc. | 83,300,121 | 17,267,467 | - | 907,782 | 113,092,492 |
Total | $ 338,217,448 | $ 44,173,946 | $ 1,729,615 | $ 110,022,066 | $ 188,040,723 |
Other Information |
The following is a summary of the inputs used, as of October 31, 2011, involving the Fund's assets and liabilities carried at fair value. The inputs or methodology used for valuing securities may not be an indication of the risk associated with investing in those securities. For more information on valuation inputs, and their aggregation into the levels used in the tables below, please refer to the Security Valuation section in the accompanying Notes to Financial Statements. |
Valuation Inputs at Reporting Date: |
Description | Total | Level 1 | Level 2 | Level 3 |
Investments in Securities: | | | | |
Equities: | | | | |
United Kingdom | $ 4,627,038,551 | $ 3,885,316,989 | $ 741,721,562 | $ - |
Japan | 3,428,408,766 | - | 3,428,408,766 | - |
Germany | 2,198,700,036 | 1,823,562,096 | 375,137,940 | - |
France | 1,804,897,841 | 1,541,258,432 | 263,639,409 | - |
Canada | 1,427,549,194 | 1,427,549,194 | - | - |
United States of America | 1,287,821,621 | 1,255,618,071 | - | 32,203,550 |
Switzerland | 1,117,671,287 | 962,887,492 | 154,783,795 | - |
Australia | 927,621,571 | 538,478,720 | 389,142,851 | - |
Netherlands | 690,489,515 | 477,070,544 | 213,418,971 | - |
Other | 7,197,563,634 | 4,195,813,680 | 3,001,749,954 | - |
Master Notes | 270,994 | - | - | 270,994 |
Money Market Funds | 1,611,809,254 | 1,611,809,254 | - | - |
Total Investments in Securities: | $ 26,319,842,264 | $ 17,719,364,472 | $ 8,568,003,248 | $ 32,474,544 |
The following is a reconciliation of Investments in Securities for which Level 3 inputs were used in determining value: |
Investments in Securities: | |
Beginning Balance | $ 451,860 |
Total Realized Gain (Loss) | (1,057,894) |
Total Unrealized Gain (Loss) | 1,048,395 |
Cost of Purchases | 32,666,617 |
Proceeds of Sales | (632,318) |
Amortization/Accretion | (2,116) |
Transfers in to Level 3 | - |
Transfers out of Level 3 | - |
Ending Balance | $ 32,474,544 |
The change in unrealized gain (loss) for the period attributable to Level 3 securities held at October 31, 2011 | $ (5,264) |
The information used in the above reconciliation represents fiscal year to date activity for any Investments in Securities identified as using Level 3 inputs at either the beginning or the end of the current fiscal period. Transfers in or out of Level 3 represent the beginning value of any Security or Instrument where a change in the pricing level occurred from the beginning to the end of the period. The cost of purchases and the proceeds of sales may include securities received or delivered through corporate actions or exchanges. Realized and unrealized gains (losses) disclosed in the reconciliation are included in Net Gain (Loss) on the Fund's Statement of Operations. |
Income Tax Information |
At October 31, 2011, the Fund had a capital loss carryforward of approximately $3,286,171,990 of which $2,666,600,138 and $619,571,852 will expire in fiscal 2017 and 2018, respectively. Capital loss carryforwards are only available to offset future capital gains of the Fund to the extent provided by regulations and may be limited. |
See accompanying notes which are an integral part of the financial statements.
Annual Report
Fidelity Diversified International Fund
Statement of Assets and Liabilities
| October 31, 2011 |
Assets | | |
Investment in securities, at value (including securities loaned of $813,313,897) - See accompanying schedule: Unaffiliated issuers (cost $21,967,898,714) | $ 24,519,992,287 | |
Fidelity Central Funds (cost $1,611,809,254) | 1,611,809,254 | |
Other affiliated issuers (cost $129,534,845) | 188,040,723 | |
Total Investments (cost $23,709,242,813) | | $ 26,319,842,264 |
Foreign currency held at value (cost $251,333) | | 251,333 |
Receivable for investments sold | | 234,571,947 |
Receivable for fund shares sold | | 74,623,129 |
Dividends receivable | | 62,708,309 |
Interest receivable | | 17,819 |
Distributions receivable from Fidelity Central Funds | | 360,288 |
Prepaid expenses | | 98,276 |
Other receivables | | 2,945,967 |
Total assets | | 26,695,419,332 |
Liabilities | | |
Payable for investments purchased | $ 100,359,104 | |
Payable for fund shares redeemed | 117,607,449 | |
Accrued management fee | 13,820,459 | |
Other affiliated payables | 3,926,570 | |
Other payables and accrued expenses | 1,270,124 | |
Collateral on securities loaned, at value | 886,536,637 | |
Total liabilities | | 1,123,520,343 |
Net Assets | | $ 25,571,898,989 |
Net Assets consist of: | | |
Paid in capital | | $ 25,969,888,803 |
Undistributed net investment income | | 418,909,977 |
Accumulated undistributed net realized gain (loss) on investments and foreign currency transactions | | (3,430,253,408) |
Net unrealized appreciation (depreciation) on investments and assets and liabilities in foreign currencies | | 2,613,353,617 |
Net Assets | | $ 25,571,898,989 |
Diversified International:
Net Asset Value, offering price and redemption price per share ($17,285,369,497 ÷ 628,706,658 shares) | | $ 27.49 |
| | |
Class K:
Net Asset Value, offering price and redemption price per share ($8,115,192,236 ÷ 295,039,055 shares) | | $ 27.51 |
| | |
Class F:
Net Asset Value, offering price and redemption price per share ($171,337,256 ÷ 6,228,258 shares) | | $ 27.51 |
Statement of Operations
| Year ended October 31, 2011 |
Investment Income | | |
Dividends (including $1,148,067 earned from other affiliated issuers) | | $ 775,256,545 |
Special dividends (earned from other affiliated issuers) | | 108,873,999 |
Interest | | 21,709 |
Income from Fidelity Central Funds | | 21,576,418 |
Income before foreign taxes withheld | | 905,728,671 |
Less foreign taxes withheld | | (61,260,298) |
Total income | | 844,468,373 |
| | |
Expenses | | |
Management fee
Basic fee | $ 225,204,522 | |
Performance adjustment | (17,677,656) | |
Transfer agent fees | 55,414,460 | |
Accounting and security lending fees | 2,636,921 | |
Custodian fees and expenses | 4,452,390 | |
Independent trustees' compensation | 179,973 | |
Depreciation in deferred trustee compensation account | (24) | |
Registration fees | 241,072 | |
Audit | 217,935 | |
Legal | 139,565 | |
Miscellaneous | 378,639 | |
Total expenses before reductions | 271,187,797 | |
Expense reductions | (8,678,523) | 262,509,274 |
Net investment income (loss) | | 581,959,099 |
Realized and Unrealized Gain (Loss) Net realized gain (loss) on: | | |
Investment securities: | | |
Unaffiliated issuers | 1,889,598,151 | |
Other affiliated issuers | (2,483,501) | |
Foreign currency transactions | (5,612,204) | |
Total net realized gain (loss) | | 1,881,502,446 |
Change in net unrealized appreciation (depreciation) on: Investment securities (net of decrease in deferred foreign taxes of $3,985,288) | (3,644,214,790) | |
Assets and liabilities in foreign currencies | (2,069,131) | |
Total change in net unrealized appreciation (depreciation) | | (3,646,283,921) |
Net gain (loss) | | (1,764,781,475) |
Net increase (decrease) in net assets resulting from operations | | $ (1,182,822,376) |
See accompanying notes which are an integral part of the financial statements.
Annual Report
Financial Statements - continued
Statement of Changes in Net Assets
| Year ended
October 31,
2011 | Year ended
October 31,
2010 |
Increase (Decrease) in Net Assets | | |
Operations | | |
Net investment income (loss) | $ 581,959,099 | $ 486,439,991 |
Net realized gain (loss) | 1,881,502,446 | (561,752,757) |
Change in net unrealized appreciation (depreciation) | (3,646,283,921) | 3,614,151,999 |
Net increase (decrease) in net assets resulting from operations | (1,182,822,376) | 3,538,839,233 |
Distributions to shareholders from net investment income | (554,171,382) | (474,506,693) |
Distributions to shareholders from net realized gain | (93,780,346) | - |
Total distributions | (647,951,728) | (474,506,693) |
Share transactions - net increase (decrease) | (7,417,526,738) | (3,995,252,806) |
Redemption fees | 964,713 | 822,251 |
Total increase (decrease) in net assets | (9,247,336,129) | (930,098,015) |
| | |
Net Assets | | |
Beginning of period | 34,819,235,118 | 35,749,333,133 |
End of period (including undistributed net investment income of $418,909,977 and undistributed net investment income of $424,022,673, respectively) | $ 25,571,898,989 | $ 34,819,235,118 |
Financial Highlights - Diversified International
Years ended October 31, | 2011 | 2010 | 2009 | 2008 | 2007 |
Selected Per-Share Data | | | | | |
Net asset value, beginning of period | $ 29.49 | $ 26.86 | $ 21.96 | $ 45.41 | $ 37.58 |
Income from Investment Operations | | | | | |
Net investment income (loss) B | .53 E | .37 | .35 | .55 | .47 |
Net realized and unrealized gain (loss) | (1.99) | 2.61 | 4.86 | (20.96) | 10.23 |
Total from investment operations | (1.46) | 2.98 | 5.21 | (20.41) | 10.70 |
Distributions from net investment income | (.46) | (.35) | (.31) | (.47) | (.36) |
Distributions from net realized gain | (.08) | - | - | (2.57) | (2.51) |
Total distributions | (.54) | (.35) | (.31) | (3.04) | (2.87) |
Redemption fees added to paid in capital B, G | - | - | - | - | - |
Net asset value, end of period | $ 27.49 | $ 29.49 | $ 26.86 | $ 21.96 | $ 45.41 |
Total Return A | (5.07)% | 11.15% | 24.32% | (48.04)% | 30.37% |
Ratios to Average Net Assets C,F | | | | | |
Expenses before reductions | .90% | .98% | 1.01% | 1.04% | .93% |
Expenses net of fee waivers, if any | .89% | .98% | 1.01% | 1.04% | .93% |
Expenses net of all reductions | .87% | .96% | .99% | 1.02% | .91% |
Net investment income (loss) | 1.78% E | 1.34% | 1.58% | 1.53% | 1.20% |
Supplemental Data | | | | | |
Net assets, end of period (000 omitted) | $ 17,285,369 | $ 26,527,229 | $ 30,998,270 | $ 28,274,961 | $ 59,929,942 |
Portfolio turnover rate D | 45% | 57% | 54% | 49% | 51% |
A Total returns would have been lower if certain expenses had not been reduced during the applicable periods shown.
B Calculated based on average shares outstanding during the period.
C Fees and expenses of any underlying Fidelity Central Funds are not included in the Fund's expense ratio. The Fund indirectly bears its proportionate share of the expenses of any underlying Fidelity Central Funds.
D Amount does not include the portfolio activity of any underlying Fidelity Central Funds.
E Investment income per share reflects a special dividend which amounted to $.10 per share. Excluding the special dividend, the ratio of net investment income (loss) to average net assets would have been 1.44%.
F Expense ratios reflect operating expenses of the class. Expenses before reductions do not reflect amounts reimbursed by the investment adviser or reductions from brokerage service arrangements or reductions from other expense offset arrangements and do not represent the amount paid by the class during periods when reimbursements or reductions occur. Expenses net of fee waivers reflect expenses after reimbursement by the investment adviser but prior to reductions from brokerage service arrangements or other expense offset arrangements. Expenses net of all reductions represent the net expenses paid by the class.
G Amount represents less than $.01 per share.
See accompanying notes which are an integral part of the financial statements.
Annual Report
Financial Highlights - Class K
Years ended October 31, | 2011 | 2010 | 2009 | 2008 H |
Selected Per-Share Data | | | | |
Net asset value, beginning of period | $ 29.51 | $ 26.89 | $ 21.98 | $ 38.39 |
Income from Investment Operations | | | | |
Net investment income (loss) D | .58 G | .42 | .42 | .16 |
Net realized and unrealized gain (loss) | (1.97) | 2.61 | 4.85 | (16.57) |
Total from investment operations | (1.39) | 3.03 | 5.27 | (16.41) |
Distributions from net investment income | (.53) | (.41) | (.36) | - |
Distributions from net realized gain | (.08) | - | - | - |
Total distributions | (.61) | (.41) | (.36) | - |
Redemption fees added to paid in capital D,J | - | - | - | - |
Net asset value, end of period | $ 27.51 | $ 29.51 | $ 26.89 | $ 21.98 |
Total Return B,C | (4.87)% | 11.33% | 24.64% | (42.75)% |
Ratios to Average Net Assets E,I | | | | |
Expenses before reductions | .73% | .79% | .77% | .88% A |
Expenses net of fee waivers, if any | .72% | .79% | .77% | .88% A |
Expenses net of all reductions | .70% | .77% | .76% | .87% A |
Net investment income (loss) | 1.95% G | 1.54% | 1.81% | 1.45% A |
Supplemental Data | | | | |
Net assets, end of period (000 omitted) | $ 8,115,192 | $ 7,697,405 | $ 4,713,909 | $ 932,275 |
Portfolio turnover rate F | 45% | 57% | 54% | 49% |
A Annualized
B Total returns for periods of less than one year are not annualized.
C Total returns would have been lower if certain expenses had not been reduced during the applicable periods shown.
D Calculated based on average shares outstanding during the period.
E Fees and expenses of any underlying Fidelity Central Funds are not included in the Fund's expense ratio. The Fund indirectly bears its proportionate share of the expenses of any underlying Fidelity Central Funds.
F Amount does not include the portfolio activity of any underlying Fidelity Central Funds.
G Investment income per share reflects a special dividend which amounted to $.10 per share. Excluding the special dividend, the ratio of net investment income (loss) to average net assets would have been 1.61%.
H For the period May 9, 2008 (commencement of sale of shares) to October 31, 2008.
I Expense ratios reflect operating expenses of the class. Expenses before reductions do not reflect amounts reimbursed by the investment adviser or reductions from brokerage service arrangements or reductions from other expense offset arrangements and do not represent the amount paid by the class during periods when reimbursements or reductions occur. Expense ratios before reductions for start-up periods may not be representative of longer-term operating periods. Expenses net of fee waivers reflect expenses after reimbursement by the investment adviser but prior to reductions from brokerage service arrangements or other expense offset arrangements. Expenses net of all reductions represent the net expenses paid by the class.
J Amount represents less than $.01 per share.
Financial Highlights - Class F
Years ended October 31, | 2011 | 2010 | 2009 H |
Selected Per-Share Data | | | |
Net asset value, beginning of period | $ 29.52 | $ 26.89 | $ 23.29 |
Income from Investment Operations | | | |
Net investment income (loss) D | .61 G | .43 | (.02) |
Net realized and unrealized gain (loss) | (2.00) | 2.62 | 3.62 |
Total from investment operations | (1.39) | 3.05 | 3.60 |
Distributions from net investment income | (.54) | (.42) | - |
Distributions from net realized gain | (.08) | - | - |
Total distributions | (.62) | (.42) | - |
Redemption fees added to paid in capital D,J | - | - | - |
Net asset value, end of period | $ 27.51 | $ 29.52 | $ 26.89 |
Total Return B,C | (4.86)% | 11.41% | 15.46% |
Ratios to Average Net Assets E,I | | | |
Expenses before reductions | .68% | .73% | .71% A |
Expenses net of fee waivers, if any | .67% | .73% | .71% A |
Expenses net of all reductions | .65% | .72% | .70% A |
Net investment income (loss) | 2.00% G | 1.59% | (.19)% A |
Supplemental Data | | | |
Net assets, end of period (000 omitted) | $ 171,337 | $ 594,602 | $ 37,155 |
Portfolio turnover rate F | 45% | 57% | 54% |
A Annualized
B Total returns for periods of less than one year are not annualized.
C Total returns would have been lower if certain expenses had not been reduced during the applicable periods shown.
D Calculated based on average shares outstanding during the period.
E Fees and expenses of any underlying Fidelity Central Funds are not included in the Fund's expense ratio. The Fund indirectly bears its proportionate share of the expenses of any underlying Fidelity Central Funds.
F Amount does not include the portfolio activity of any underlying Fidelity Central Funds.
G Investment income per share reflects a special dividend which amounted to $.10 per share. Excluding the special dividend, the ratio of net investment income (loss) to average net assets would have been 1.66%.
H For the period June 26, 2009 (commencement of sale of shares) to October 31, 2009.
I Expense ratios reflect operating expenses of the class. Expenses before reductions do not reflect amounts reimbursed by the investment adviser or reductions from brokerage service arrangements or reductions from other expense offset arrangements and do not represent the amount paid by the class during periods when reimbursements or reductions occur. Expense ratios before reductions for start-up periods may not be representative of longer-term operating periods. Expenses net of fee waivers reflect expenses after reimbursement by the investment adviser but prior to reductions from brokerage service arrangements or other expense offset arrangements. Expenses net of all reductions represent the net expenses paid by the class.
J Amount represents less than $.01 per share.
See accompanying notes which are an integral part of the financial statements.
Annual Report
Notes to Financial Statements
For the period ended October 31, 2011
1. Organization.
Fidelity Diversified International Fund (the Fund) is a fund of Fidelity Investment Trust (the Trust) and is authorized to issue an unlimited number of shares. The Trust is registered under the Investment Company Act of 1940, as amended (the 1940 Act), as an open-end management investment company organized as a Massachusetts business trust. The Fund offers Diversified International, Class K and Class F shares, each of which, has equal rights as to assets and voting privileges. Each class has exclusive voting rights with respect to matters that affect that class. Class F shares of the Fund are only available for purchase by mutual funds for which Fidelity Management & Research Company (FMR) or an affiliate serves as investment manager. Investment income, realized and unrealized capital gains and losses, the common expenses of the Fund, and certain fund-level expense reductions, if any, are allocated on a pro-rata basis to each class based on the relative net assets of each class to the total net assets of the Fund. Each class differs with respect to transfer agent fees incurred. Certain expense reductions may also differ by class. The Fund's investments in emerging markets can be subject to social, economic, regulatory, and political uncertainties and can be extremely volatile.
2. Investments in Fidelity Central Funds.
The Fund invests in Fidelity Central Funds, which are open-end investment companies available only to other investment companies and accounts managed by Fidelity Management & Research Company (FMR) and its affiliates. The Fund's Schedule of Investments lists each of the Fidelity Central Funds held as of period end, if any, as an investment of the Fund, but does not include the underlying holdings of each Fidelity Central Fund. As an Investing Fund, the Fund indirectly bears its proportionate share of the expenses of the underlying Fidelity Central Funds.
The Money Market Central Funds seek preservation of capital and current income and are managed by Fidelity Investments Money Management, Inc. (FIMM), an affiliate of FMR.
A complete unaudited list of holdings for each Fidelity Central Fund is available upon request or at the Securities and Exchange Commission (the SEC) web site at www.sec.gov. In addition, the financial statements of the Fidelity Central Funds, which are not covered by the Fund's Report of Independent Registered Public Accounting Firm are available on the SEC web site or upon request.
3. Significant Accounting Policies.
The financial statements have been prepared in conformity with accounting principles generally accepted in the United States of America (GAAP), which require management to make certain estimates and assumptions at the date of the financial statements. Actual results could differ from those estimates. Subsequent events, if any, through the date that the financial statements were issued have been evaluated in the preparation of the financial statements. The following summarizes the significant accounting policies of the Fund:
Security Valuation. Investments are valued as of 4:00 p.m. Eastern time on the last calendar day of the period. The Fund uses independent pricing services approved by the Board of Trustees to value its investments. When current market prices or quotations are not readily available or reliable, valuations may be determined in good faith in accordance with procedures adopted by the Board of Trustees. Factors used in determining value may include market or security specific events, changes in interest rates and credit quality. The frequency with which these procedures are used cannot be predicted and they may be utilized to a significant extent. The value used for net asset value (NAV) calculation under these procedures may differ from published prices for the same securities.
The Fund categorizes the inputs to valuation techniques used to value its investments into a disclosure hierarchy consisting of three levels as shown below:
Level 1 - quoted prices in active markets for identical investments
Level 2 - other significant observable inputs (including quoted prices for similar investments, interest rates, prepayment speeds, etc.)
Level 3 - unobservable inputs (including the Fund's own assumptions based on the best information available)
Changes in valuation techniques may result in transfers in or out of an assigned level within the disclosure hierarchy. The aggregate value of investments by input level, as of October 31, 2011, as well as a roll forward of Level 3 securities, is included at the end of the Fund's Schedule of Investments. Valuation techniques used to value the Fund's investments by major category are as follows:
Equity securities, including restricted securities, for which market quotations are readily available, are valued at the last reported sale price or official closing price as reported by an independent pricing service on the primary market or exchange on which they are traded and are categorized as Level 1 in the hierarchy. In the event there were no sales during the day or closing prices are not available, securities are valued at the last quoted bid price or may be valued using the last available price and are generally categorized as Level 2 in the hierarchy. For foreign equity securities, when significant market or security specific events arise, comparisons to the valuation of American Depositary Receipts (ADRs), futures contracts, Exchange-traded funds (ETFs) and certain indexes as well as quoted prices for similar securities are used and are categorized as Level 2 in the hierarchy in these circumstances. Utilizing these techniques may result in transfers between Level 1 and Level 2. For restricted equity securities and private placements where observable inputs are limited, assumptions about market activity and risk are used and are categorized as Level 3 in the hierarchy.
Annual Report
3. Significant Accounting Policies - continued
Security Valuation - continued
Debt securities, including restricted securities, are valued based on evaluated prices received from independent pricing services or from dealers who make markets in such securities. For master notes, pricing services utilize matrix pricing which considers yield or price of bonds of comparable quality, coupon, maturity and type as well as dealer supplied prices and are generally categorized as Level 2 in the hierarchy.
When independent prices are unavailable or unreliable, debt securities may be valued utilizing pricing matrices which consider similar factors that would be used by independent pricing services. These are generally categorized as Level 2 in the hierarchy but may be Level 3 depending on the circumstances.
Investments in open-end mutual funds, including the Fidelity Central Funds, are valued at their closing net asset value each business day and are categorized as Level 1 in the hierarchy.
Foreign Currency. The Fund may use foreign currency contracts to facilitate transactions in foreign-denominated securities. Gains and losses from these transactions may arise from changes in the value of the foreign currency or if the counterparties do not perform under the contracts' terms.
Foreign-denominated assets, including investment securities, and liabilities are translated into U.S. dollars at the exchange rate at period end. Purchases and sales of investment securities, income and dividends received and expenses denominated in foreign currencies are translated into U.S. dollars at the exchange rate in effect on the transaction date.
The effects of exchange rate fluctuations on investments are included with the net realized and unrealized gain (loss) on investment securities. Other foreign currency transactions resulting in realized and unrealized gain (loss) are disclosed separately.
Investment Transactions and Income. For financial reporting purposes, the Fund's investment holdings and NAV include trades executed through the end of the last business day of the period. The NAV per share for processing shareholder transactions is calculated as of the close of business of the New York Stock Exchange (NYSE), normally 4:00 p.m. Eastern time and includes trades executed through the end of the prior business day. Gains and losses on securities sold are determined on the basis of identified cost and may include proceeds received from litigation. Dividend income is recorded on the ex-dividend date, except for certain dividends from foreign securities where the ex-dividend date may have passed, which are recorded as soon as the Fund is informed of the ex-dividend date. Non-cash dividends included in dividend income, if any, are recorded at the fair market value of the securities received. Distributions received on securities that represent a return of capital or capital gain are recorded as a reduction of cost of investments and/or as a realized gain. The Fund estimates the components of distributions received that may be considered return of capital distributions or capital gain distributions. Large, non-recurring dividends recognized by the Fund are presented separately on the Statement of Operations as "Special Dividends" and the impact of these dividends is presented in the Financial Highlights. Interest income and distributions from the Fidelity Central Funds are accrued as earned. Interest income includes coupon interest and amortization of premium and accretion of discount on debt securities. Investment income is recorded net of foreign taxes withheld where recovery of such taxes is uncertain.
Expenses. Expenses directly attributable to a fund are charged to that fund. Expenses attributable to more than one fund are allocated among the respective funds on the basis of relative net assets or other appropriate methods. Expense estimates are accrued in the period to which they relate and adjustments are made when actual amounts are known.
Deferred Trustee Compensation. Under a Deferred Compensation Plan (the Plan), independent Trustees may elect to defer receipt of a portion of their annual compensation. Deferred amounts are invested in a cross-section of Fidelity funds, are marked-to-market and remain in the Fund until distributed in accordance with the Plan. The investment of deferred amounts and the offsetting payable to the Trustees are included in the accompanying Statement of Assets and Liabilities.
Income Tax Information and Distributions to Shareholders. Each year, the Fund intends to qualify as a regulated investment company, including distributing substantially all of its taxable income and realized gains under Subchapter M of the Internal Revenue Code and filing its U.S. federal tax return. As a result, no provision for income taxes is required. As of October 31, 2011, the Fund did not have any unrecognized tax benefits in the financial statements. A fund's federal tax return is subject to examination by the Internal Revenue Service (IRS) for a period of three years. Foreign taxes are provided for based on the Fund's understanding of the tax rules and rates that exist in the foreign markets in which it invests.
Distributions are declared and recorded on the ex-dividend date. Income dividends and capital gain distributions are declared separately for each class. Income and capital gain distributions are determined in accordance with income tax regulations, which may differ from GAAP.
Capital accounts within the financial statements are adjusted for permanent book-tax differences. These adjustments have no impact on net assets or the results of operations. Temporary book-tax differences will reverse in a subsequent period.
Annual Report
Notes to Financial Statements - continued
3. Significant Accounting Policies - continued
Income Tax Information and Distributions to Shareholders - continued
Book-tax differences are primarily due to foreign currency transactions, certain foreign taxes, passive foreign investment companies (PFIC), deferred trustees compensation, capital loss carryforwards and losses deferred due to wash sales.
The federal tax cost of investment securities and unrealized appreciation (depreciation) as of period end were as follows:
Gross unrealized appreciation | $ 4,524,622,015 |
Gross unrealized depreciation | (2,058,103,983) |
Net unrealized appreciation (depreciation) on securities and other investments | $ 2,466,518,032 |
| |
Tax Cost | $ 23,853,324,232 |
The tax-based components of distributable earnings as of period end were as follows:
Undistributed ordinary income | $ 419,615,619 |
Capital Loss Carryfoward | $ (3,286,171,990) |
Net unrealized appreciation (depreciation) | $ 2,469,263,889 |
Under the recently enacted Regulated Investment Company Modernization Act of 2010 (the Act), the Fund will be permitted to carry forward capital losses incurred in taxable years beginning after December 22, 2010 for an unlimited period. However, any losses incurred during those future taxable years will be required to be utilized prior to any losses incurred in pre-enactment taxable years, which generally expire after eight years from when they are incurred. Additionally, post-enactment capital losses that are carried forward will retain their character as either short-term or long-term capital losses rather than being considered all short-term as under previous law. The Fund's first fiscal year end subject to the Act will be October 31, 2012.
The tax character of distributions paid was as follows:
| October 31, 2011 | October 31, 2010 |
Ordinary Income | $ 647,951,728 | $ 474,506,693 |
Short-Term Trading (Redemption) Fees. Shares held by investors in the Fund less than 30 days are subject to a redemption fee equal to 1.00% of the net asset value of shares redeemed. All redemption fees, which reduce the proceeds of the shareholder redemption, are retained by the Fund and accounted for as an addition to paid in capital.
New Accounting Pronouncement. In May 2011, the Financial Accounting Standards Board issued Accounting Standard Update No. 2011-04, Fair Value Measurement (Topic 820) - Amendments to Achieve Common Fair Value Measurement and Disclosure Requirements in U.S. GAAP and IFRSs. The update changes the wording used to describe the requirements in GAAP for measuring fair value and for disclosing information about fair value measurements. The update is effective during interim and annual periods beginning after December 15, 2011. Management is currently evaluating the impact of the update's adoption on the Fund's financial statement disclosures.
4. Operating Policies.
Restricted Securities. The Fund may invest in securities that are subject to legal or contractual restrictions on resale. These securities generally may be resold in transactions exempt from registration or to the public if the securities are registered. Disposal of these securities may involve time-consuming negotiations and expense, and prompt sale at an acceptable price may be difficult. Information regarding restricted securities is included at the end of the Fund's Schedule of Investments.
5. Purchases and Sales of Investments.
Purchases and sales of securities, other than short-term securities, aggregated $13,875,962,686 and $20,794,928,294, respectively.
Annual Report
6. Fees and Other Transactions with Affiliates.
Management Fee. FMR and its affiliates provide the Fund with investment management related services for which the Fund pays a monthly management fee. The management fee is the sum of an individual fund fee rate that is based on an annual rate of .45% of the Fund's average net assets and a group fee rate that averaged .26% during the period. The group fee rate is based upon the average net assets of all the mutual funds advised by FMR. The group fee rate decreases as assets under management increase and increases as assets under management decrease. In addition, the management fee is subject to a performance adjustment (up to a maximum of ±.20% of the Fund's average net assets over a 36 month performance period). The upward or downward adjustment to the management fee is based on the relative investment performance of Diversified International as compared to an appropriate benchmark index. For the period, the total annual management fee rate, including the performance adjustment, was .65% of the Fund's average net assets.
Transfer Agent Fees. Fidelity Investments Institutional Operations Company, Inc. (FIIOC), an affiliate of FMR, is the transfer, dividend disbursing and shareholder servicing agent for each class of the Fund. FIIOC receives account fees and asset-based fees that vary according to the account size and type of account of the shareholders of Diversified International. FIIOC receives an asset-based fee of Class K's average net assets. FIIOC receives no fees for providing transfer agency services to Class F. FIIOC pays for typesetting, printing and mailing of shareholder reports, except proxy statements. For the period, transfer agent fees for each class were as follows:
| Amount | % of
Average
Net Assets |
Diversified International | $ 51,100,072 | .22 |
Class K | 4,314,388 | .05 |
| $ 55,414,460 | |
Accounting and Security Lending Fees. Fidelity Service Company, Inc. (FSC), an affiliate of FMR, maintains the Fund's accounting records. The accounting fee is based on the level of average net assets for the month. Under a separate contract, FSC administers the security lending program. The security lending fee is based on the number and duration of lending transactions.
Brokerage Commissions. The Fund placed a portion of its portfolio transactions with brokerage firms which are affiliates of the investment adviser. The commissions paid to these affiliated firms were $89,950 for the period.
7. Committed Line of Credit.
The Fund participates with other funds managed by FMR or an affiliate in a $4.0 billion credit facility (the "line of credit") to be utilized for temporary or emergency purposes to fund shareholder redemptions or for other short-term liquidity purposes. The Fund has agreed to pay commitment fees on its pro-rata portion of the line of credit, which amounted to $100,888 and is reflected in Miscellaneous expenses on the Statement of Operations. During the period, there were no borrowings on this line of credit.
8. Security Lending.
The Fund lends portfolio securities through a lending agent from time to time in order to earn additional income. For equity securities, a lending agent is used and may loan securities to certain qualified borrowers, including Fidelity Capital Markets (FCM), a broker-dealer affiliated with the Fund. On the settlement date of the loan, the Fund receives collateral (in the form of U.S. Treasury obligations, letters of credit and/or cash) against the loaned securities and maintains collateral in an amount not less than 100% of the market value of the loaned securities during the period of the loan. The market value of the loaned securities is determined at the close of business of the Fund and any additional required collateral is delivered to the Fund on the next business day. If the borrower defaults on its obligation to return the securities loaned because of insolvency or other reasons, a fund could experience delays and costs in recovering the securities loaned or in gaining access to the collateral. Any cash collateral received is invested in the Fidelity Securities Lending Cash Central Fund. The value of loaned securities and cash collateral at period end are disclosed on the Fund's Statement of Assets and Liabilities. The value of securities loaned to FCM at period end was $1,510,818. Security lending income represents the income earned on investing cash collateral, less rebates paid to borrowers and any lending agent fees associated with the loan, plus any premium payments received for lending certain types of securities. Security lending income is presented in the Statement of Operations as a component of income from Fidelity Central Funds. Total security lending income during the period amounted to $20,356,167, including $10,704 from securities loaned to FCM.
Annual Report
Notes to Financial Statements - continued
9. Expense Reductions.
FMR voluntarily agreed to reimburse a portion of its management fee. For the period, the amount of this reimbursement was $2,833,493.
Many of the brokers with whom FMR places trades on behalf of the Fund provided services in addition to trade execution. These services included payments of certain expenses on behalf of the Fund totaling $5,844,480 for the period. In addition, through arrangements with the Fund's custodian, credits realized as a result of uninvested cash balances were used to reduce the Fund's expenses. During the period, these credits reduced the Fund's custody expenses by $550.
10. Distributions to Shareholders.
Distributions to shareholders of each class were as follows:
Years ended October 31, | 2011 | 2010 |
From net investment income | | |
Diversified International | $ 404,459,076 | $ 398,456,259 |
Class K | 139,574,930 | 74,880,028 |
Class F | 10,137,376 | 1,170,406 |
Total | $ 554,171,382 | $ 474,506,693 |
From net realized gain | | |
Diversified International | $ 71,011,904 | $ - |
Class K | 21,272,351 | - |
Class F | 1,496,091 | - |
Total | $ 93,780,346 | $ - |
11. Share Transactions.
Transactions for each class of shares were as follows:
| Shares | Dollars |
Years ended October 31, | 2011 | 2010 | 2011 | 2010 |
Diversified International | | | | |
Shares sold | 95,789,996 | 179,662,935 | $ 2,861,192,033 | $ 4,893,668,837 |
Reinvestment of distributions | 15,446,133 | 13,627,007 | 459,413,511 | 384,281,814 |
Shares redeemed | (382,099,741) | (447,584,331) | (11,334,070,882) | (12,092,134,122) |
Net increase (decrease) | (270,863,612) | (254,294,389) | $ (8,013,465,338) | $ (6,814,183,471) |
Class K | | | | |
Shares sold | 125,231,374 | 151,794,829 | $ 3,707,928,503 | $ 4,125,917,772 |
Reinvestment of distributions | 5,413,899 | 2,657,205 | 160,847,281 | 74,880,028 |
Shares redeemed | (96,416,162) | (68,937,812) | (2,871,502,023) | (1,889,669,527) |
Net increase (decrease) | 34,229,111 | 85,514,222 | $ 997,273,761 | $ 2,311,128,273 |
Class F | | | | |
Shares sold | 13,012,404 | 24,587,499 | $ 389,423,461 | $ 664,182,809 |
Reinvestment of distributions | 391,673 | 41,548 | 11,633,466 | 1,170,406 |
Shares redeemed | (27,320,491) | (5,866,038) | (802,392,088) | (157,550,823) |
Net increase (decrease) | (13,916,414) | 18,763,009 | $ (401,335,161) | $ 507,802,392 |
12. Other.
The Fund's organizational documents provide former and current trustees and officers with a limited indemnification against liabilities arising in connection with the performance of their duties to the Fund. In the normal course of business, the Fund may also enter into contracts that provide general indemnifications. The Fund's maximum exposure under these arrangements is unknown as this would be dependent on future claims that may be made against the Fund. The risk of material loss from such claims is considered remote.
Annual Report
Report of Independent Registered Public Accounting Firm
To the Trustees of Fidelity Investment Trust and Shareholders of Fidelity Diversified International Fund:
We have audited the accompanying statement of assets and liabilities of Fidelity Diversified International Fund (the Fund), a fund of Fidelity Investment Trust, including the schedule of investments, as of October 31, 2011, and the related statement of operations for the year then ended, the statement of changes in net assets for each of the two years in the period then ended, and the financial highlights for each of the five years in the period then ended. These financial statements and financial highlights are the responsibility of the Fund's management. Our responsibility is to express an opinion on these financial statements and financial highlights based on our audits.
We conducted our audits in accordance with the standards of the Public Company Accounting Oversight Board (United States). Those standards require that we plan and perform the audit to obtain reasonable assurance about whether the financial statements and financial highlights are free of material misstatement. The Fund is not required to have, nor were we engaged to perform, an audit of its internal control over financial reporting. Our audits included consideration of internal control over financial reporting as a basis for designing audit procedures that are appropriate in the circumstances, but not for the purpose of expressing an opinion on the effectiveness of the Fund's internal control over financial reporting. Accordingly, we express no such opinion. An audit also includes examining, on a test basis, evidence supporting the amounts and disclosures in the financial statements, assessing the accounting principles used and significant estimates made by management, as well as evaluating the overall financial statement presentation. Our procedures included confirmation of securities owned as of October 31, 2011, by correspondence with the custodians and brokers; where replies were not received from brokers, we performed other auditing procedures. We believe that our audits provide a reasonable basis for our opinion.
In our opinion, the financial statements and financial highlights referred to above present fairly, in all material respects, the financial position of Fidelity Diversified International Fund as of October 31, 2011, the results of its operations for the year then ended, the changes in its net assets for each of the two years in the period then ended, and the financial highlights for each of the five years in the period then ended, in conformity with accounting principles generally accepted in the United States of America.
DELOITTE & TOUCHE LLP
Boston, Massachusetts
December 16, 2011
Annual Report
The Trustees, Members of the Advisory Board, and executive officers of the trust and fund, as applicable, are listed below. The Board of Trustees governs the fund and is responsible for protecting the interests of shareholders. The Trustees are experienced executives who meet periodically throughout the year to oversee the fund's activities, review contractual arrangements with companies that provide services to the fund, oversee management of the risks associated with such activities and contractual arrangements, and review the fund's performance. Except for James C. Curvey, each of the Trustees oversees 226 funds advised by FMR or an affiliate. Mr. Curvey oversees 429 funds advised by FMR or an affiliate.
The Trustees hold office without limit in time except that (a) any Trustee may resign; (b) any Trustee may be removed by written instrument, signed by at least two-thirds of the number of Trustees prior to such removal; (c) any Trustee who requests to be retired or who has become incapacitated by illness or injury may be retired by written instrument signed by a majority of the other Trustees; and (d) any Trustee may be removed at any special meeting of shareholders by a two-thirds vote of the outstanding voting securities of the trust. Each Trustee who is not an interested person (as defined in the 1940 Act) (Independent Trustee), shall retire not later than the last day of the calendar year in which his or her 75th birthday occurs. The Independent Trustees may waive this mandatory retirement age policy with respect to individual Trustees. The executive officers and Advisory Board Members hold office without limit in time, except that any officer and Advisory Board Member may resign or may be removed by a vote of a majority of the Trustees at any regular meeting or any special meeting of the Trustees. Except as indicated, each individual has held the office shown or other offices in the same company for the past five years.
Experience, Skills, Attributes, and Qualifications of the Fund's Trustees. The Governance and Nominating Committee has adopted a statement of policy that describes the experience, qualifications, attributes, and skills that are necessary and desirable for potential Independent Trustee candidates (Statement of Policy). The Board believes that each Trustee satisfied at the time he or she was initially elected or appointed a Trustee, and continues to satisfy, the standards contemplated by the Statement of Policy. The Governance and Nominating Committee also engages professional search firms to help identify potential Independent Trustee candidates who have the experience, qualifications, attributes, and skills consistent with the Statement of Policy. From time to time, additional criteria based on the composition and skills of the current Independent Trustees, as well as experience or skills that may be appropriate in light of future changes to board composition, business conditions, and regulatory or other developments, have also been considered by the professional search firms and the Governance and Nominating Committee. In addition, the Board takes into account the Trustees' commitment and participation in Board and committee meetings, as well as their leadership of standing and ad hoc committees throughout their tenure.
In determining that a particular Trustee was and continues to be qualified to serve as a Trustee, the Board has considered a variety of criteria, none of which, in isolation, was controlling. The Board believes that, collectively, the Trustees have balanced and diverse experience, qualifications, attributes, and skills, which allow the Board to operate effectively in governing the fund and protecting the interests of shareholders. Information about the specific experience, skills, attributes, and qualifications of each Trustee, which in each case led to the Board's conclusion that the Trustee should serve (or continue to serve) as a trustee of the fund, is provided below.
Board Structure and Oversight Function. James C. Curvey is an interested person (as defined in the 1940 Act) and currently serves as Acting Chairman. The Trustees have determined that an interested Chairman is appropriate and benefits shareholders because an interested Chairman has a personal and professional stake in the quality and continuity of services provided to the fund. Independent Trustees exercise their informed business judgment to appoint an individual of their choosing to serve as Chairman, regardless of whether the Trustee happens to be independent or a member of management. The Independent Trustees have determined that they can act independently and effectively without having an Independent Trustee serve as Chairman and that a key structural component for assuring that they are in a position to do so is for the Independent Trustees to constitute a substantial majority for the Board. The Independent Trustees also regularly meet in executive session. Ned C. Lautenbach serves as Chairman of the Independent Trustees and as such (i) acts as a liaison between the Independent Trustees and management with respect to matters important to the Independent Trustees and (ii) with management prepares agendas for Board meetings.
Fidelity funds are overseen by different Boards of Trustees. The fund's Board oversees Fidelity's equity and high income funds and another Board oversees Fidelity's investment-grade bond, money market, and asset allocation funds. The asset allocation funds may invest in Fidelity funds overseen by the fund's Board. The use of separate Boards, each with its own committee structure, allows the Trustees of each group of Fidelity funds to focus on the unique issues of the funds they oversee, including common research, investment, and operational issues. On occasion, the separate Boards establish joint committees to address issues of overlapping consequences for the Fidelity funds overseen by each Board.
The Trustees operate using a system of committees to facilitate the timely and efficient consideration of all matters of importance to the Trustees, the fund, and fund shareholders and to facilitate compliance with legal and regulatory requirements and oversight of the fund's activities and associated risks. The Board, acting through its committees, has charged FMR and its affiliates with (i) identifying events or circumstances the occurrence of which could have demonstrably adverse effects on the fund's business and/or reputation; (ii) implementing processes and controls to lessen the possibility that such events or circumstances occur or to mitigate the effects of such events or circumstances if they do occur; and (iii) creating and maintaining a system designed to evaluate continuously business and market conditions in order to facilitate the identification and implementation processes described in (i) and (ii) above. Because the day-to-day operations and activities of the fund are carried out by or through FMR, its affiliates and other service providers, the fund's exposure to risks is mitigated but not eliminated by the processes overseen by the Trustees. While each of the Board's committees has responsibility for overseeing different aspects of the fund's activities, oversight is exercised primarily through the Operations, Audit, and Compliance Committees. In addition, the Independent Trustees have worked with FMR to enhance the Board's oversight of investment and financial risks, legal and regulatory risks, technology risks, and operational risks, including the development of additional risk reporting to the Board. For example, a working group comprised of Independent Trustees and FMR has worked and continues to work to review the Fidelity funds' valuation-related activities, reporting and risk management. Appropriate personnel, including but not limited to the fund's Chief Compliance Officer (CCO), FMR's internal auditor, the independent accountants, the fund's Treasurer and portfolio management personnel, make periodic reports to the Board's committees, as appropriate, including an annual review of FMR's risk management program for the Fidelity funds. The responsibilities of each standing committee, including their oversight responsibilities, are described further under "Standing Committees of the Fund's Trustees."
Annual Report
Trustees and Officers - continued
The fund's Statement of Additional Information (SAI) includes more information about the Trustees. To request a free copy, call Fidelity at 1-800-835-5092.
Interested Trustees*:
Correspondence intended for each Trustee who is an interested person may be sent to Fidelity Investments, 82 Devonshire Street, Boston, Massachusetts 02109.
Name, Age; Principal Occupations and Other Relevant Experience+ |
James C. Curvey (76) |
| Year of Election or Appointment: 2007 Mr. Curvey is Trustee and Acting Chairman of the Board of Trustees of certain Trusts. Mr. Curvey also serves as Trustee (2007-present) of other investment companies advised by FMR. Mr. Curvey is a Director of Fidelity Investments Money Management, Inc. (2009-present), Director of Fidelity Research & Analysis Co. (2009-present) and Director of FMR and FMR Co., Inc. (2007-present). Mr. Curvey is also Vice Chairman (2007-present) and Director of FMR LLC. In addition, Mr. Curvey serves as an Overseer for the Boston Symphony Orchestra and a member of the Trustees of Villanova University. Previously, Mr. Curvey was the Vice Chairman (2006-2007) and Director (2000-2007) of FMR Corp. |
Ronald P. O'Hanley (54) |
| Year of Election or Appointment: 2011 Mr. O'Hanley is Director of FMR Co., Inc. (2010-present), Director of Fidelity Investments Money Management, Inc. (2010-present), Director of Fidelity Research & Analysis Company (2010-present), President of Fidelity Asset Management and Corporate Services and a member of Fidelity's Executive Committee (2010-present). Previously, Mr. O'Hanley served as President and Chief Executive Officer of BNY Mellon Asset Management (2007-2010). Mr. O'Hanley also served as Vice Chairman of Bank New York Mellon Corp. and a member of that firm's Executive Committee. Prior to the 2007 merger of The Bank of New York and Mellon Financial Corporation, he was Vice Chairman of Mellon Financial Corporation and President and Chief Executive Officer of Mellon Asset Management. He joined Mellon in February 1997. Mr. O'Hanley currently serves as Chairman of the Boston Public Library Foundation Board of Directors and sits on the Board of Directors of Beth Israel Deaconess Medical Center, the Board of Trustees of the Marine Biological Laboratory and the Advisory Board of the Maxwell School of Citizenship and Public Administration at Syracuse University. Mr. O'Hanley also chairs the Council on Asset Management for the Financial Services Roundtable and is a member of the Board of Directors of Institutional Investor's U.S. Institute. |
* Trustees have been determined to be "Interested Trustees" by virtue of, among other things, their affiliation with the trust or various entities under common control with FMR.
+ The information above includes each Trustee's principal occupation during the last five years and other information relating to the experience, attributes, and skills relevant to each Trustee's qualifications to serve as a Trustee, which led to the conclusion that each Trustee should serve as a Trustee for the fund.
Independent Trustees:
Correspondence intended for each Independent Trustee (that is, the Trustees other than the Interested Trustees) may be sent to Fidelity Investments, P.O. Box 55235, Boston, Massachusetts 02205-5235.
Name, Age; Principal Occupations and Other Relevant Experience+ |
Dennis J. Dirks (63) |
| Year of Election or Appointment: 2005 Prior to his retirement in May 2003, Mr. Dirks was Chief Operating Officer and a member of the Board of The Depository Trust & Clearing Corporation (DTCC). He also served as President, Chief Operating Officer, and Board member of The Depository Trust Company (DTC) and President and Board member of the National Securities Clearing Corporation (NSCC). In addition, Mr. Dirks served as Chief Executive Officer and Board member of the Government Securities Clearing Corporation, Chief Executive Officer and Board member of the Mortgage-Backed Securities Clearing Corporation, as a Trustee and a member of the Finance Committee of Manhattan College (2005-2008), and as a Trustee and a member of the Finance Committee of AHRC of Nassau County (2006-2008). Mr. Dirks is a member of the Independent Directors Council (IDC) Governing Council (2010-Present) and Board of Directors for The Brookville Center for Children's Services, Inc. (2009-present). |
Alan J. Lacy (58) |
| Year of Election or Appointment: 2008 Mr. Lacy serves as Senior Adviser (2007-present) of Oak Hill Capital Partners, L.P. (private equity). Mr. Lacy also served as Chief Executive Officer (2000-2005) and Vice Chairman (2005-2006) of Sears Holdings Corporation and Sears, Roebuck and Co. (retail). In addition, Mr. Lacy serves as a member of the Board of Directors of Dave & Buster's, Inc. (restaurant and entertainment complexes, 2010-present), The Hillman Companies, Inc. (hardware wholesalers, 2010-present), and Bristol-Myers Squibb Company (global pharmaceuticals, 2007-present). Mr. Lacy is a member of the Board of Trustees of The National Parks Conservation Association (2006-Present). Previously, Mr. Lacy served as Chairman of the Board of Trustees of the National Parks Conservation Association (2008-2011) and as a member of the Board of Directors for the Western Union Company (global money transfer, 2006-2011). |
Ned C. Lautenbach (67) |
| Year of Election or Appointment: 2000 Mr. Lautenbach is Chairman of the Independent Trustees of the Equity and High Income Funds (2006-present). Mr. Lautenbach currently serves as the Lead Director of the Eaton Corporation Board of Directors (diversified industrial, 1997-present). Mr. Lautenbach is also a member of the Board of Directors of the Philharmonic Center for the Arts in Naples, Florida (1999-present); a member of the Board of Trustees of Fairfield University (2005-present); and a member of the Council on Foreign Relations (1994-present). Previously, Mr. Lautenbach was a Partner/Advisory Partner at Clayton, Dubilier & Rice, LLC (private equity investment, 1998-2010), as well as a Director of Sony Corporation (2006-2007). |
Joseph Mauriello (67) |
| Year of Election or Appointment: 2008 Prior to his retirement in January 2006, Mr. Mauriello served in numerous senior management positions including Deputy Chairman and Chief Operating Officer (2004-2005), and Vice Chairman of Financial Services (2002-2004) of KPMG LLP US (professional services, 1965-2005). Mr. Mauriello currently serves as a member of the Board of Directors of XL Group plc. (global insurance and re-insurance, 2006-present) and of Arcadia Resources Inc. (health care services and products, 2007-present). Previously, Mr. Mauriello served as a Director of the Hamilton Funds of the Bank of New York (2006-2007). |
Robert W. Selander (61) |
| Year of Election or Appointment: 2011 Previously, Mr. Selander served as a Member of the Advisory Board of Fidelity's Equity and High Income Funds (2011), Executive Vice Chairman (2010), Chief Executive Officer (2009-2010), and President and Chief Executive Officer (1997-2009) of Mastercard, Inc. |
Cornelia M. Small (67) |
| Year of Election or Appointment: 2005 Ms. Small is a member of the Board of Directors of the Teagle Foundation (2009-present). Ms. Small is also a member of the Investment Committee, and Chair (2008-present) and a member of the Board of Trustees of Smith College. In addition, Ms. Small serves on the Investment Committee of the Berkshire Taconic Community Foundation (2008-present). Previously, Ms. Small served as Chairperson of the Investment Committee (2002-2008) of Smith College. In addition, Ms. Small served as Chief Investment Officer, Director of Global Equity Investments, and a member of the Board of Directors of Scudder, Stevens & Clark and Scudder Kemper Investments. |
William S. Stavropoulos (72) |
| Year of Election or Appointment: 2001 Mr. Stavropoulos is Vice Chairman of the Independent Trustees of the Equity and High Income Funds (2006-present). Mr. Stavropoulos serves as President and Founder of the Michigan Baseball Foundation, the Great Lakes Loons (2007-present). Mr. Stavropoulos is Chairman Emeritus of the Board of Directors of The Dow Chemical Company, where he previously served in numerous senior management positions, including President, CEO (1995-2000; 2002-2004), Chairman of the Executive Committee (2000-2006), and as a member of the Board of Directors (1990-2006). Currently, Mr. Stavropoulos is Chairman of Univar (global distributor of commodity and specialty chemicals, 2010-present), a Director of Teradata Corporation (data warehousing and technology solutions, 2008-present), Chemical Financial Corporation, Maersk Inc. (industrial conglomerate), Tyco International, Inc. (multinational manufacturing and services, 2007-present), and a member of the Advisory Board for Metalmark Capital (private equity investment, 2005-present). Mr. Stavropoulos is a special advisor to Clayton, Dubilier & Rice, LLC (private equity investment). In addition, Mr. Stavropoulos is a member of the University of Notre Dame Advisory Council for the College of Science. |
David M. Thomas (62) |
| Year of Election or Appointment: 2008 Previously, Mr. Thomas served as Executive Chairman (2005-2006) and Chairman and Chief Executive Officer (2000-2005) of IMS Health, Inc. (pharmaceutical and healthcare information solutions). In addition, Mr. Thomas serves as a member of the Board of Directors of Fortune Brands, Inc. (consumer products), and Interpublic Group of Companies, Inc. (marketing communication, 2004-present). |
Michael E. Wiley (61) |
| Year of Election or Appointment: 2008 Mr. Wiley also serves as a Director of Asia Pacific Exploration Consolidated (international oil and gas exploration and production, 2008-present). Mr. Wiley serves as a Director of Tesoro Corporation (independent oil refiner and marketer, 2005-present), and a Director of Bill Barrett Corporation (exploration and production, 2005-present). In addition, Mr. Wiley also serves as a Director of Post Oak Bank (privately-held bank, 2004-present). Previously, Mr. Wiley served as a member of the Board of Trustees of the University of Tulsa (2000-2006; 2007-2010), as a Senior Energy Advisor of Katzenbach Partners, LLC (consulting, 2006-2007), as an Advisory Director of Riverstone Holdings (private investment), Chairman, President, and CEO of Baker Hughes, Inc. (oilfield services, 2000-2004), and as Director of Spinnaker Exploration Company (exploration and production, 2001-2005). |
+ The information above includes each Trustee's principal occupation during the last five years and other information relating to the experience, attributes, and skills relevant to each Trustee's qualifications to serve as a Trustee, which led to the conclusion that each Trustee should serve as a Trustee for the fund.
Advisory Board Members and Executive Officers:
Correspondence intended for each executive officer, Edward C. Johnson 3d, and Peter S. Lynch may be sent to Fidelity Investments, 82 Devonshire Street, Boston, Massachusetts 02109.
Name, Age; Principal Occupation |
Edward C. Johnson 3d (81) |
| Year of Election or Appointment: 2011 Member of the Advisory Board of Fidelity's Equity and High Income Funds. Mr. Johnson serves as Chief Executive Officer, Chairman, and a Director of FMR LLC, and also serves as Chairman and Director of FIL Limited. Previously, Mr. Johnson served as a Trustee and Chairman of the Board of certain Fidelity Trusts, Chairman and a Director of FMR, Chairman and a Director of FMR Co., Inc., and President of FMR LLC (2006-2007). |
Peter S. Lynch (67) |
| Year of Election or Appointment: 2003 Member of the Advisory Board of Fidelity's Equity and High Income Funds. Mr. Lynch is Vice Chairman and a Director of FMR and FMR Co., Inc. In addition, Mr. Lynch serves as a Trustee of Boston College and as the Chairman of the Inner-City Scholarship Fund. Previously, Mr. Lynch served on the Special Olympics International Board of Directors (1997-2006). |
Kenneth B. Robins (42) |
| Year of Election or Appointment: 2008 President and Treasurer of Fidelity's Equity and High Income Funds. Mr. Robins also serves as President and Treasurer (2010-present) and Assistant Treasurer (2009-present) of other Fidelity funds and is an employee of Fidelity Investments (2004-present). Previously, Mr. Robins served as Deputy Treasurer of the Fidelity funds (2005-2008) and Treasurer and Chief Financial Officer of The North Carolina Capital Management Trust: Cash and Term Portfolios (2006-2008). |
Bruce T. Herring (46) |
| Year of Election or Appointment: 2006 Vice President of certain Equity Funds. Mr. Herring also serves as Chief Investment Officer and Director of Fidelity Management & Research (U.K.) Inc. (2010-present) and Group Chief Investments Officer of FMR. Previously, Mr. Herring served as Vice President (2005-2006) and Senior Vice President (2006-2007) of Fidelity Management & Research Company, Vice President of FMR Co., Inc. (2001-2007) and as a portfolio manager for Fidelity U.S. Equity Funds. |
Brian B. Hogan (47) |
| Year of Election or Appointment: 2009 Vice President of Equity and High Income Funds. Mr. Hogan also serves as President of FMR's Equity Division (2009-present). Previously, Mr. Hogan served as Senior Vice President, Equity Research of FMR (2006-2009) and as a portfolio manager. |
Scott C. Goebel (43) |
| Year of Election or Appointment: 2008 Secretary and Chief Legal Officer (CLO) of the Fidelity funds. Mr. Goebel also serves as Secretary of Fidelity Investments Money Management, Inc. (FIMM) (2010-present) and Fidelity Research and Analysis Company (FRAC) (2010-present); Secretary and CLO of The North Carolina Capital Management Trust: Cash and Term Portfolios (2008-present); General Counsel, Secretary, and Senior Vice President of FMR (2008-present) and FMR Co., Inc. (2008-present); employed by FMR LLC or an affiliate (2001-present); Chief Legal Officer of Fidelity Management & Research (Hong Kong) Limited (2008-present) and Assistant Secretary of Fidelity Management & Research (Japan) Inc. (2008-present), and Fidelity Management & Research (U.K.) Inc. (2008-present). Previously, Mr. Goebel served as Assistant Secretary of FIMM (2008-2010), FRAC (2008-2010), and the Funds (2007-2008) and as Vice President and Secretary of Fidelity Distributors Corporation (FDC) (2005-2007). |
William C. Coffey (42) |
| Year of Election or Appointment: 2009 Assistant Secretary of Fidelity's Equity and High Income Funds. Mr. Coffey also serves as Senior Vice President and Deputy General Counsel of FMR LLC (2010-present), and is an employee of Fidelity Investments. Previously, Mr. Coffey served as Vice President and Associate General Counsel of FMR LLC (2005-2009). |
Holly C. Laurent (57) |
| Year of Election or Appointment: 2008 Anti-Money Laundering (AML) Officer of the Fidelity funds. Ms. Laurent also serves as AML Officer of The North Carolina Capital Management Trust: Cash and Term Portfolios (2008-present) and is an employee of Fidelity Investments. Previously, Ms. Laurent was Senior Vice President and Head of Legal for Fidelity Business Services India Pvt. Ltd. (2006-2008), and Senior Vice President, Deputy General Counsel and Group Head for FMR LLC (2005-2006). |
Christine Reynolds (53) |
| Year of Election or Appointment: 2008 Chief Financial Officer of the Fidelity funds. Ms. Reynolds became President of Fidelity Pricing and Cash Management Services (FPCMS) in August 2008. Ms. Reynolds served as Chief Operating Officer of FPCMS (2007-2008). Previously, Ms. Reynolds served as President, Treasurer, and Anti-Money Laundering officer of the Fidelity funds (2004-2007). |
Kenneth A. Rathgeber (64) |
| Year of Election or Appointment: 2004 Chief Compliance Officer of Fidelity's Equity and High Income Funds. Mr. Rathgeber is Chief Compliance Officer of Fidelity Management & Research (Hong Kong) Limited (2008-present), Fidelity Management & Research (Japan) Inc. (2008-present), FMR (2005-present), FMR Co., Inc. (2005-present), Fidelity Management & Research (U.K.) Inc. (2005-present), Fidelity Research & Analysis Company (2005-present), Fidelity Investments Money Management, Inc. (2005-present), Pyramis Global Advisors, LLC (2005-present), and Strategic Advisers, Inc. (2005-present). |
Jeffrey S. Christian (50) |
| Year of Election or Appointment: 2009 Deputy Treasurer of the Fidelity funds. Mr. Christian is an employee of Fidelity Investments. Previously, Mr. Christian served as Chief Financial Officer (2008-2009) of certain Fidelity funds and Senior Vice President of Fidelity Pricing and Cash Management Services (FPCMS) (2004-2009). |
Joseph F. Zambello (54) |
| Year of Election or Appointment: 2011 Deputy Treasurer of the Fidelity funds. Mr. Zambello is an employee of Fidelity Investments. Previously, Mr. Zambello served as Vice President of FMR's Program Management Group (2009-2011) and Vice President of the Transfer Agent Oversight Group (2005-2009). |
Adrien E. Deberghes (44) |
| Year of Election or Appointment: 2008 Deputy Treasurer of Fidelity's Equity and High Income Funds. Mr. Deberghes also serves as Vice President and Assistant Treasurer of Fidelity Rutland Square Trust II and Fidelity Commonwealth Trust II (2011-present), Assistant Treasurer of other Fidelity funds (2010-present), and is an employee of Fidelity Investments (2008-present). Previously, Mr. Deberghes served as Senior Vice President of Mutual Fund Administration at State Street Corporation (2007-2008), Senior Director of Mutual Fund Administration at Investors Bank & Trust (2005-2007), and Director of Finance for Dunkin' Brands (2000-2005). |
Stephanie J. Dorsey (42) |
| Year of Election or Appointment: 2010 Assistant Treasurer of Fidelity's Equity and High Income Funds. Ms. Dorsey also serves as Deputy Treasurer of other Fidelity funds (2008-present) and is an employee of Fidelity Investments (2008-present). Previously, Ms. Dorsey served as Treasurer (2004-2008) of the JPMorgan Mutual Funds and Vice President (2004-2008) of JPMorgan Chase Bank. |
John R. Hebble (53) |
| Year of Election or Appointment: 2009 Assistant Treasurer of Fidelity's Equity and High Income Funds. Mr. Hebble also serves as President (2011-present), Treasurer, and Chief Financial Officer of The North Carolina Capital Management Trust: Cash and Term Portfolios (2008-present), President and Treasurer of other Fidelity funds (2008-present) and is an employee of Fidelity Investments. |
Gary W. Ryan (53) |
| Year of Election or Appointment: 2005 Assistant Treasurer of the Fidelity funds. Mr. Ryan is an employee of Fidelity Investments. Previously, Mr. Ryan served as Vice President of Fund Reporting in Fidelity Pricing and Cash Management Services (FPCMS) (1999-2005). |
Jonathan Davis (43) |
| Year of Election or Appointment: 2010 Assistant Treasurer of the Fidelity funds. Mr. Davis is also Assistant Treasurer of Fidelity Rutland Square Trust II and Fidelity Commonwealth Trust II. Mr. Davis is an employee of Fidelity Investments. Previously, Mr. Davis served as Vice President and Associate General Counsel of FMR LLC (2003-2010). |
Annual Report
Class F designates 86% and 100% of the dividends distributed on December 3, 2010 and December 30, 2010, respectively during the fiscal year as amounts which may be taken into account as a dividend for the purposes of the maximum rate under section 1(h)(11) of the Internal Revenue Code.
The amounts per share which represent income derived from sources within, and taxes paid to, foreign countries or possessions of the United States are as follows:
| Pay Date | Income | Taxes |
Class F | 12/06/2011 | 0.431 | 0.0414 |
Class F | 12/31/2010 | 0.072 | 0.000 |
The fund will notify shareholders in January 2012 of amounts for use in preparing 2011 income tax returns.
Annual Report
Board Approval of Investment Advisory Contracts and Management Fees
Fidelity Diversified International Fund
Each year, the Board of Trustees, including the Independent Trustees (together, the Board), votes on the renewal of the management contract and sub-advisory agreements (together, the Advisory Contracts) for the fund. The Board, assisted by the advice of fund counsel and Independent Trustees' counsel, requests and considers a broad range of information relevant to the renewal of the Advisory Contracts throughout the year.
The Board meets regularly and considers at each of its meetings factors that are relevant to its annual consideration of the renewal of the fund's Advisory Contracts, including the services and support provided to the fund and its shareholders. The Board has established various standing committees, each composed of Independent Trustees with varying backgrounds, to which the Board has assigned specific subject matter responsibilities in order to enhance effective decision-making by the Board. The Board, acting directly and through its Committees, requests and receives information concerning the annual consideration of the renewal of the fund's Advisory Contracts. The Board also meets as needed to consider matters specifically related to the Board's annual consideration of the renewal of Advisory Contracts. Members of the Board may also meet with trustees of other Fidelity funds through ad hoc joint committees to discuss certain matters relevant to the Fidelity funds.
At its July 2011 meeting, the Board of Trustees, including the Independent Trustees, unanimously determined to renew the fund's Advisory Contracts. In reaching its determination, the Board considered all factors it believed relevant, including (i) the nature, extent, and quality of the services to be provided to the fund and its shareholders (including the investment performance of the fund); (ii) the competitiveness of the fund's management fee and total expense ratio; (iii) the total costs of the services to be provided by and the profits to be realized by Fidelity from its relationship with the fund; (iv) the extent to which economies of scale would be realized as the fund grows; and (v) whether fee levels reflect these economies of scale, if any, for the benefit of fund shareholders.
In considering whether to renew the Advisory Contracts for the fund, the Board reached a determination, with the assistance of fund counsel and Independent Trustees' counsel and through the exercise of its business judgment, that the renewal of the Advisory Contracts is in the best interests of the fund and its shareholders and that the compensation payable under the Advisory Contracts is fair and reasonable. The Board's decision to renew the Advisory Contracts was not based on any single factor, but rather was based on a comprehensive consideration of all the information provided to the Board at its meetings throughout the year. The Board, in reaching its determination to renew the Advisory Contracts, is aware that shareholders in the fund have a broad range of investment choices available to them, including a wide choice among mutual funds offered by Fidelity's competitors, and that the fund's shareholders, who have the opportunity to review and weigh the disclosure provided by the fund in its prospectus and other public disclosures, have chosen to invest in this fund, managed by Fidelity.
Nature, Extent, and Quality of Services Provided. The Board considered the staffing within the investment adviser, FMR, and the sub-advisers (together, the Investment Advisers), including the backgrounds of the fund's investment personnel and the fund's investment objective and discipline. The Independent Trustees also had discussions with senior management of Fidelity's investment operations and investment groups. The Board considered the structure of the portfolio manager compensation program and whether this structure provides appropriate incentives to act in the best interests of the fund.
Resources Dedicated to Investment Management and Support Services. The Board and the Fund Oversight and Research Committees reviewed the general qualifications and capabilities of the Investment Advisers' investment staff, including its size, education, experience, and resources, as well as the Investment Advisers' approach to recruiting, training, managing, and compensating investment personnel. The Board also noted that FMR has devoted increased resources to non-U.S. offices. The Board noted that Fidelity's analysts have extensive resources, tools and capabilities which allow them to conduct sophisticated quantitative and fundamental analysis, as well as credit analysis of issuers, counterparties and enhancers. The Board also believes that Fidelity's investment professionals have sufficient access to global information and data so as to provide competitive investment results over time, and that those professionals also have access to sophisticated tools which permit them to assess portfolio construction and risk and performance attribution characteristics continuously, as well as to transmit new information and research conclusions rapidly around the world. Additionally, in their deliberations, the Board considered the Investment Advisers' trading capabilities and resources which are an integral part of the investment management process.
Shareholder and Administrative Services. The Board considered (i) the nature, extent, quality, and cost of advisory, administrative, and shareholder services performed by the Investment Advisers and their affiliates under the Advisory Contracts and under separate agreements covering transfer agency, pricing and bookkeeping, and securities lending services for the fund; (ii) the nature and extent of the investment adviser's supervision of third party service providers, principally custodians and subcustodians; and (iii) the resources devoted to, and the record of compliance with, the fund's compliance policies and procedures. The Board also reviewed the allocation of fund brokerage, including allocations to brokers affiliated with the Investment Advisers, the use of brokerage commissions to pay fund expenses, and the use of "soft" commission dollars to pay for research services.
The Board noted that the growth of fund assets over time across the complex allows Fidelity to reinvest in the development of services designed to enhance the value or convenience of the Fidelity funds as investment vehicles. These services include 24-hour access to account information and market information through telephone representatives and over the Internet, investor education materials and asset allocation tools, and the expanded availability of Fidelity Investor Centers, with 35 new branches opening since 2010.
Annual Report
Investment in a Large Fund Family. The Board considered the benefits to shareholders of investing in a Fidelity fund, including the benefits of investing in a fund that is part of a large family of funds offering a variety of investment disciplines and providing a large variety of mutual fund investor services. The Board noted that Fidelity had taken, or had made recommendations that resulted in the Fidelity funds taking, a number of actions over the previous year that benefited particular funds, including (i) continuing to dedicate additional resources to investment research and support of the senior management team that oversees asset management; (ii) rationalizing product lines through the mergers of six funds into other funds; (iii) continuing to migrate the Freedom Funds to dedicated lower cost underlying funds; (iv) obtaining shareholder approval to broaden the investment strategies for Fidelity Consumer Finance Portfolio, Fidelity Emerging Asia Fund, and Fidelity Environment and Alternative Energy Portfolio; (v) contractually agreeing to reduce the management fees and impose other expense limitations on Spartan 500 Index Fund and U.S. Bond Index Fund in connection with launching new institutional classes of these funds; (vi) changing the name, primary and supplemental benchmarks, and investment policies of Fidelity Global Strategies Fund to support the fund's flexible investment mandate and global orientation; and (vii) reducing the transfer agency account fee rates on certain accounts.
Investment Performance. The Board considered whether the fund has operated in accordance with its investment objective, as well as its record of compliance with its investment restrictions. It also reviewed the fund's absolute investment performance for each class, as well as the fund's relative investment performance for each class measured over multiple periods against (i) a broad-based securities market index, and (ii) a peer group of mutual funds deemed appropriate by Fidelity and reviewed by the Board. The following charts considered by the Board show, over the one-, three-, and five-year periods ended December 31, 2010, as available, the cumulative total returns of Class F and the retail class of the fund, the cumulative total returns of a broad-based securities market index ("benchmark"), and a range of cumulative total returns of a peer group of mutual funds identified by Morningstar, Inc. as having an investment style similar to that of the fund based on underlying portfolio holdings. The returns of Class F and the retail class show the performance of the highest and lowest performing classes, respectively (based on one-year performance). The box within each chart shows the 25th percentile return (bottom of box) and the 75th percentile return (top of box) of the peer group. Returns shown above the box are in the first quartile and returns shown below the box are in the fourth quartile. The percentage beaten numbers noted below each chart correspond to the percentile box and represent the percentage of funds in the peer group whose performance was equal to or lower than that of the class indicated.
Fidelity Diversified International Fund
The Board reviewed the fund's relative investment performance against its peer group and noted that the performance of the retail class of the fund (the class with the longest performance record) was in the third quartile for all the periods shown. The Board also noted that the investment performance of the fund was lower than its benchmark for the three- and five-year periods, although the one-year total return of the retail class compared favorably to its benchmark. The Board considered that the variations in performance among the fund's classes reflect the variations in class expenses, which result in lower performance for higher expense classes. The Board discussed with FMR actions that have been taken by FMR to improve the fund's disappointing performance relative to its peer group. The Board also reviewed the fund's performance since inception as well as performance in the current year. The Board will continue to closely monitor the performance of the fund in the coming year and discuss with FMR other appropriate actions to address the performance of the fund.
The Board also considered that the fund's management fee is subject to upward or downward adjustment depending upon whether, and to what extent, the fund's investment performance for the performance period exceeds, or is exceeded by, the record (over the same period) of a Board-approved performance adjustment index. The Board noted that the performance adjustment provides FMR with a strong economic incentive to seek to achieve superior performance for the fund's shareholders and helps to more closely align the interests of FMR and the fund's shareholders.
Annual Report
Board Approval of Investment Advisory Contracts and Management Fees - continued
Based on its review, the Board concluded that the nature, extent, and quality of services provided to the fund under the Advisory Contracts should benefit the fund's shareholders.
Competitiveness of Management Fee and Total Expense Ratio. The Board considered the fund's management fee and total expense ratio compared to "mapped groups" of competitive funds and classes. Fidelity creates "mapped groups" by combining similar Lipper investment objective categories that have comparable management fee characteristics. Combining Lipper investment objective categories aids the Board's management fee and total expense ratio comparisons by broadening the competitive group used for comparison and by reducing the number of universes to which various Fidelity funds are compared.
Management Fee. The Board considered two proprietary management fee comparisons for the 12-month periods shown in the chart below. The group of Lipper funds used by the Board for management fee comparisons is referred to below as the "Total Mapped Group." The Total Mapped Group comparison focuses on a fund's standing relative to the total universe of comparable funds available to investors in terms of gross management fees before expense reimbursements or caps, and without giving effect to the fund's performance adjustment. "TMG %" represents the percentage of funds in the Total Mapped Group that had management fees that were lower than the fund's. For example, a TMG % of 16% means that 84% of the funds in the Total Mapped Group had higher management fees than the fund. The "Asset-Size Peer Group" (ASPG) comparison focuses on a fund's standing relative to non-Fidelity funds similar in size to the fund within the Total Mapped Group. The ASPG represents at least 15% of the funds in the Total Mapped Group with comparable asset size and management fee characteristics, subject to a minimum of 50 funds (or all funds in the Total Mapped Group if fewer than 50). Additional information, such as the ASPG quartile in which the fund's management fee ranked and the impact of the fund's performance adjustment, is also included in the chart and considered by the Board.
Fidelity Diversified International Fund
The Board noted that the fund's management fee ranked below the median of its Total Mapped Group and below the median of its ASPG for 2010. The Board also noted the effect of the fund's negative performance adjustment on the fund's management fee ranking. The Board noted that the performance adjustment for each year represents calculations for performance periods that differ from the periods shown in the performance charts above.
Based on its review, the Board concluded that the fund's management fee is fair and reasonable in light of the services that the fund receives and the other factors considered.
Total Expense Ratio. In its review of each class's total expense ratio, the Board considered the fund's management fee as well as other fund or class expenses, as applicable, such as transfer agent fees, pricing and bookkeeping fees, and custodial, legal, and audit fees. The Board also noted the effects of any waivers and reimbursements on fees and expenses, as well as the impact of the fund's performance adjustment. As part of its review, the Board also considered the current and historical total expense ratios of each class of the fund compared to competitive fund median expenses. Each class of the fund is compared to those funds and classes in the Total Mapped Group (used by the Board for management fee comparisons) that have a similar sales load structure.
Annual Report
The Board noted that the total expense ratio of each class ranked below its competitive median for 2010. The Board considered that various factors, including 12b-1 fees, positive or negative performance adjustments, and relatively higher other expenses in the case of small fund size, can affect total expense ratios.
Fees Charged to Other Fidelity Clients. The Board also considered Fidelity fee structures and other information with respect to clients of FMR and its affiliates, such as other mutual funds advised or subadvised by FMR or its affiliates, pension plan clients, and other institutional clients. In March 2010, the Board created an ad hoc joint committee with the board of other Fidelity funds (the Committee) to review and compare Fidelity's institutional investment advisory business with its business of providing services to the Fidelity funds, including the differences in services provided, fees charged, and costs incurred, as well as competition in their respective marketplaces.
Based on its review of total expense ratios and fees charged to other Fidelity clients, the Board concluded that the total expense ratio of each class of the fund was reasonable in light of the services that the fund and its shareholders receive and the other factors considered, including the findings of the Committee.
Costs of the Services and Profitability. The Board considered the revenues earned and the expenses incurred by Fidelity in conducting the business of developing, marketing, distributing, managing, administering and servicing the fund and its shareholders. The Board also considered the level of Fidelity's profits in respect of all the Fidelity funds.
On an annual basis, FMR presents to the Board Fidelity's profitability for the fund. Fidelity calculates the profitability for each fund, as well as aggregate profitability for groups of Fidelity funds and all Fidelity funds, using a series of detailed revenue and cost allocation methodologies which originate with the books and records of Fidelity on which Fidelity's audited financial statements are based. The Audit Committee of the Board reviews any significant changes from the prior year's methodologies.
PricewaterhouseCoopers LLP (PwC), independent registered public accounting firm and auditor to Fidelity and certain Fidelity funds, has been engaged annually by the Board as part of the Board's assessment of Fidelity's profitability analysis. PwC's engagement includes the review and assessment of Fidelity's methodologies used in determining the revenues and expenses attributable to Fidelity's mutual fund business, and completion of agreed-upon procedures surrounding the mathematical accuracy of fund profitability and its conformity to allocation methodologies. After considering PwC's reports issued under the engagement and information provided by Fidelity, the Board concluded that while other allocation methods may also be reasonable, Fidelity's profitability methodologies are reasonable in all material respects.
The Board also reviewed Fidelity's non-fund businesses and fall-out benefits related to the mutual fund business as well as cases where Fidelity's affiliates may benefit from or be related to the fund's business.
The Board considered the costs of the services provided by and the profits realized by Fidelity in connection with the operation of the fund and was satisfied that the profitability was not excessive in the circumstances.
Economies of Scale. The Board considered whether there have been economies of scale in respect of the management of the Fidelity funds, whether the Fidelity funds (including the fund) have appropriately benefited from any such economies of scale, and whether there is potential for realization of any further economies of scale. The Board considered the extent to which the fund will benefit from economies of scale through increased services to the fund, through waivers or reimbursements, or through fee or expense reductions. The Board also noted that in 2009, it and the board of other Fidelity funds created an ad hoc committee (the Economies of Scale Committee) to analyze whether FMR attains economies of scale in respect of the management and servicing of the Fidelity funds, whether the Fidelity funds have appropriately benefited from such economies of scale, and whether there is potential for realization of any further economies of scale.
The Board recognized that the fund's management contract incorporates a "group fee" structure, which provides for lower group fee rates as total fund assets under FMR's management increase, and for higher group fee rates as total fund assets under FMR's management decrease. FMR calculates the group fee rates based on a tiered asset "breakpoint" schedule that varies based on asset class. The Board considered that the group fee is designed to deliver the benefits of economies of scale to fund shareholders when total Fidelity fund assets increase, even if assets of any particular fund are unchanged or have declined, because some portion of Fidelity's costs are attributable to services provided to all Fidelity funds, and all funds benefit if those costs can be allocated among more assets. The Board concluded that, given the group fee structure, fund shareholders will benefit from lower management fees as assets under FMR's management increase at the fund complex level, regardless of whether Fidelity achieves any such economies of scale.
The Board concluded, taking into account the analysis of the Economies of Scale Committee, that any potential economies of scale are being appropriately shared between fund shareholders and Fidelity.
Additional Information Requested by the Board. In order to develop fully the factual basis for consideration of the Fidelity funds' Advisory Contracts, the Board requested and received additional information on certain topics, including (i) fund performance trends, actions to be taken by FMR to improve certain funds' overall performance, and Fidelity's long-term strategies for certain funds; (ii) portfolio manager changes that have occurred during the past year and length of portfolio manager tenure for different categories of funds over time; (iii) Fidelity's compensation structure for portfolio managers and other key personnel and strategies for attracting and retaining non-investment personnel; (iv) the amount of the investment that each portfolio manager has made in the Fidelity fund(s) that he or she manages; (v) historical trends in Fidelity's realization of fall-out benefits; (vi) Fidelity's group fee structures and the rationale for the individual fee rates of certain funds; (vii) fund profitability methodology and the impact of certain factors on fund profitability results; (viii) trends regarding industry use of performance fee structures and Fidelity's compliance practices with respect to performance adjustment calculations; (ix) the fee structures in place for certain other Fidelity clients; and (x) explanations regarding the relative total expense ratios of certain funds and classes, total expense competitive trends, and actions that might be taken by FMR to reduce total expense ratios for certain funds and classes.
Annual Report
Board Approval of Investment Advisory Contracts and Management Fees - continued
Based on its evaluation of all of the conclusions noted above, and after considering all factors it believed relevant, the Board ultimately concluded that the advisory fee structures are fair and reasonable, and that the fund's Advisory Contracts should be renewed.
Annual Report
Managing Your Investments
Fidelity offers several ways to conveniently manage your workplace benefits (including your workplace savings plan, investments, and additional services) via your telephone or PC. You can access your plan and account information and research your investments 24 hours a day.
By Phone
Fidelity provides a single toll-free number to access plan information, account balances, positions, and quotes*. It's easy to navigate the service, and on your first call, the system will help you create a personal identification number (PIN) for security.
(phone graphic)
Fidelity Workplace Investing
1-800-835-5092
By PC
Fidelity's web site on the Internet provides a wide range of information, including plan information, daily financial news, fund performance, interactive planning tools, and news about Fidelity products and services.
(computer graphic)
Fidelity's Web Site
www.401k.com
* When you call the quotes line, please remember that a fund's yield and return will vary and, except for money market funds, share price will also vary. This means that you may have a gain or loss when you sell your shares. There is no assurance that money market funds will be able to maintain a stable $1 share price; an investment in a money market fund is not insured or guaranteed by the U.S. government. Total returns are historical and include changes in share price, reinvestment of dividends and capital gains distributions, and the effects of any sales charges.
Annual Report
Investment Adviser
Fidelity Management & Research Company
Boston, MA
Investment Sub-Advisers
FMR Co., Inc.
Fidelity Management & Research (U.K.) Inc.
Fidelity Management & Research
(Hong Kong) Limited
Fidelity Management & Research
(Japan) Inc.
FIL Investment Advisors
FIL Investment Advisors (UK) Limited
FIL Investments (Japan) Limited
General Distributor
Fidelity Distributors Corporation
Boston, MA
Transfer and Service Agents
Fidelity Investments Institutional
Operations Company, Inc.
Boston, MA
Fidelity Service Company, Inc.
Boston, MA
Custodian
JPMorgan Chase Bank
New York, NY
(Fidelity Logo)
Corporate Headquarters
82 Devonshire St., Boston, MA 02109
www.fidelity.com
DIF-F-ANN-1211
1.891706.102
Fidelity®
Emerging Europe,
Middle East, Africa (EMEA)
Fund
Annual Report
October 31, 2011
(Fidelity Cover Art)
Contents
Chairman's Message | (Click Here) | The Chairman's message to shareholders. |
Performance | (Click Here) | How the fund has done over time. |
Management's Discussion of Fund Performance | (Click Here) | The Portfolio Manager's review of fund performance and strategy. |
Shareholder Expense Example | (Click Here) | An example of shareholder expenses. |
Investment Changes | (Click Here) | A summary of major shifts in the fund's investments over the past six months. |
Investments | (Click Here) | A complete list of the fund's investments with their market values. |
Financial Statements | (Click Here) | Statements of assets and liabilities, operations, and changes in net assets, as well as financial highlights. |
Notes | (Click Here) | Notes to the financial statements. |
Report of Independent Registered Public Accounting Firm | (Click Here) | |
Trustees and Officers | (Click Here) | |
Distributions | (Click Here) | |
Board Approval of Investment Advisory Contracts and Management Fees | (Click Here) | |
To view a fund's proxy voting guidelines and proxy voting record for the 12-month period ended June 30, visit http://www.fidelity.com/proxyvotingresults or visit the Securities and Exchange Commission's (SEC) web site at http://www.sec.gov. You may also call 1-800-544-8544 to request a free copy of the proxy voting guidelines.
Standard & Poor's, S&P and S&P 500 are registered service marks of The McGraw-Hill Companies, Inc. and have been licensed for use by Fidelity Distributors Corporation.
Other third party marks appearing herein are the property of their respective owners.
All other marks appearing herein are registered or unregistered trademarks or service marks of FMR LLC or an affiliated company.
Annual Report
This report and the financial statements contained herein are submitted for the general information of the shareholders of the fund. This report is not authorized for distribution to prospective investors in the fund unless preceded or accompanied by an effective prospectus.
A fund files its complete schedule of portfolio holdings with the SEC for the first and third quarters of each fiscal year on Form N-Q. Forms N-Q are available on the SEC's web site at http://www.sec.gov. A fund's Forms N-Q may be reviewed and copied at the SEC's Public Reference Room in Washington, DC. Information regarding the operation of the SEC's Public Reference Room may be obtained by calling 1-800-SEC-0330. For a complete list of a fund's portfolio holdings, view the most recent holdings listing, semiannual report, or annual report on Fidelity's web site at http://www.fidelity.com, http://www.advisor.fidelity.com, or http://www.401k.com, as applicable.
NOT FDIC INSURED • MAY LOSE VALUE • NO BANK GUARANTEE
Neither the fund nor Fidelity Distributors Corporation is a bank.
Annual Report
(Acting Chairman's Photograph)
Dear Shareholder:
Global equity markets began the fourth quarter on a strong note, sharply reversing course in October amid strong corporate earnings, better-than-expected economic news and the promise of a resolution to the sovereign debt crisis in Europe. The mini rally followed a third quarter marked by a significant downturn in July and August, which heightened investor anxiety and set off a wave of volatility that hampered most major asset classes through the end of September. Financial markets are difficult to predict, of course, but you can help put the odds in your favor by following these time-tested investment principles.
One of the basic tenets is to invest according to your time horizon. For long-term investors, riding out the markets' inevitable ups and downs has proven much more effective than making decisions based on short-term developments. If your goal is approaching, you can also benefit from patience and restraint, rather than attempting to time the market. No matter your time horizon, missing only a few of the markets' best days can significantly diminish returns. Patience also affords the benefits of compounding - earning interest on additional income or reinvested dividends and capital gains. While staying the course doesn't eliminate risk, it can considerably lessen the negative impact of short-term downturns.
Asset allocation is another principle to manage risk. As you spread your portfolio among the asset classes, be sure to consider your time horizon, risk tolerance and investment objectives. Younger investors may be better served by emphasizing equities, which historically have been the best-performing asset class over time. Investors who are nearing a specific goal, such as retirement or sending a child to college, may choose to favor bonds and other investments that have tended to be more stable. Studies indicate that asset allocation is the single most important determinant of a portfolio's long-term success. After deciding on a suitable allocation strategy, make sure your portfolio is adequately diversified, with exposure to stocks of small-, mid- and large-cap companies in a range of sectors, for example. And today, more than ever, geographic diversification should be taken into account.
Lastly, investing a certain amount of money on a regular basis - a principle known as dollar-cost averaging - can help lower the average cost of your purchases, while also giving you the discipline to avoid selling weak performers just prior to an upswing, or chasing a hot performer just before a correction.
We invite you to learn more by visiting us on the Internet, dropping by one of our Investor Centers or calling us by phone. It is our privilege to provide the resources you need to choose investments that are right for you.
Sincerely,
(Acting Chairman's Signature)
James C. Curvey
Acting Chairman
Annual Report
Average annual total return reflects the change in the value of an investment, assuming reinvestment of the class' distributions from dividend income and capital gains (the profits earned upon the sale of securities that have grown in value, if any) and assuming a constant rate of performance each year. The $10,000 table and the fund's returns do not reflect the deduction of taxes that a shareholder would pay on fund distributions or the redemption of fund shares. During periods of reimbursement by Fidelity, a fund's total return will be greater than it would be had the reimbursement not occurred. How a fund did yesterday is no guarantee of how it will do tomorrow.
Average Annual Total Returns
Periods ended October 31, 2011 | Past 1
year | Life of
fund A |
Fidelity® Emerging Europe, Middle East, Africa (EMEA) Fund | -5.91% | -4.16% |
A From May 8, 2008.
$10,000 Over Life of Fund
Let's say hypothetically that $10,000 was invested in Fidelity® Emerging Europe, Middle East, Africa (EMEA) Fund, a class of the fund, on May 8, 2008, when the fund started. The chart shows how the value of your investment would have changed, and also shows how the MSCI® EM (Emerging Markets) Europe, Middle East and Africa Index performed over the same period.
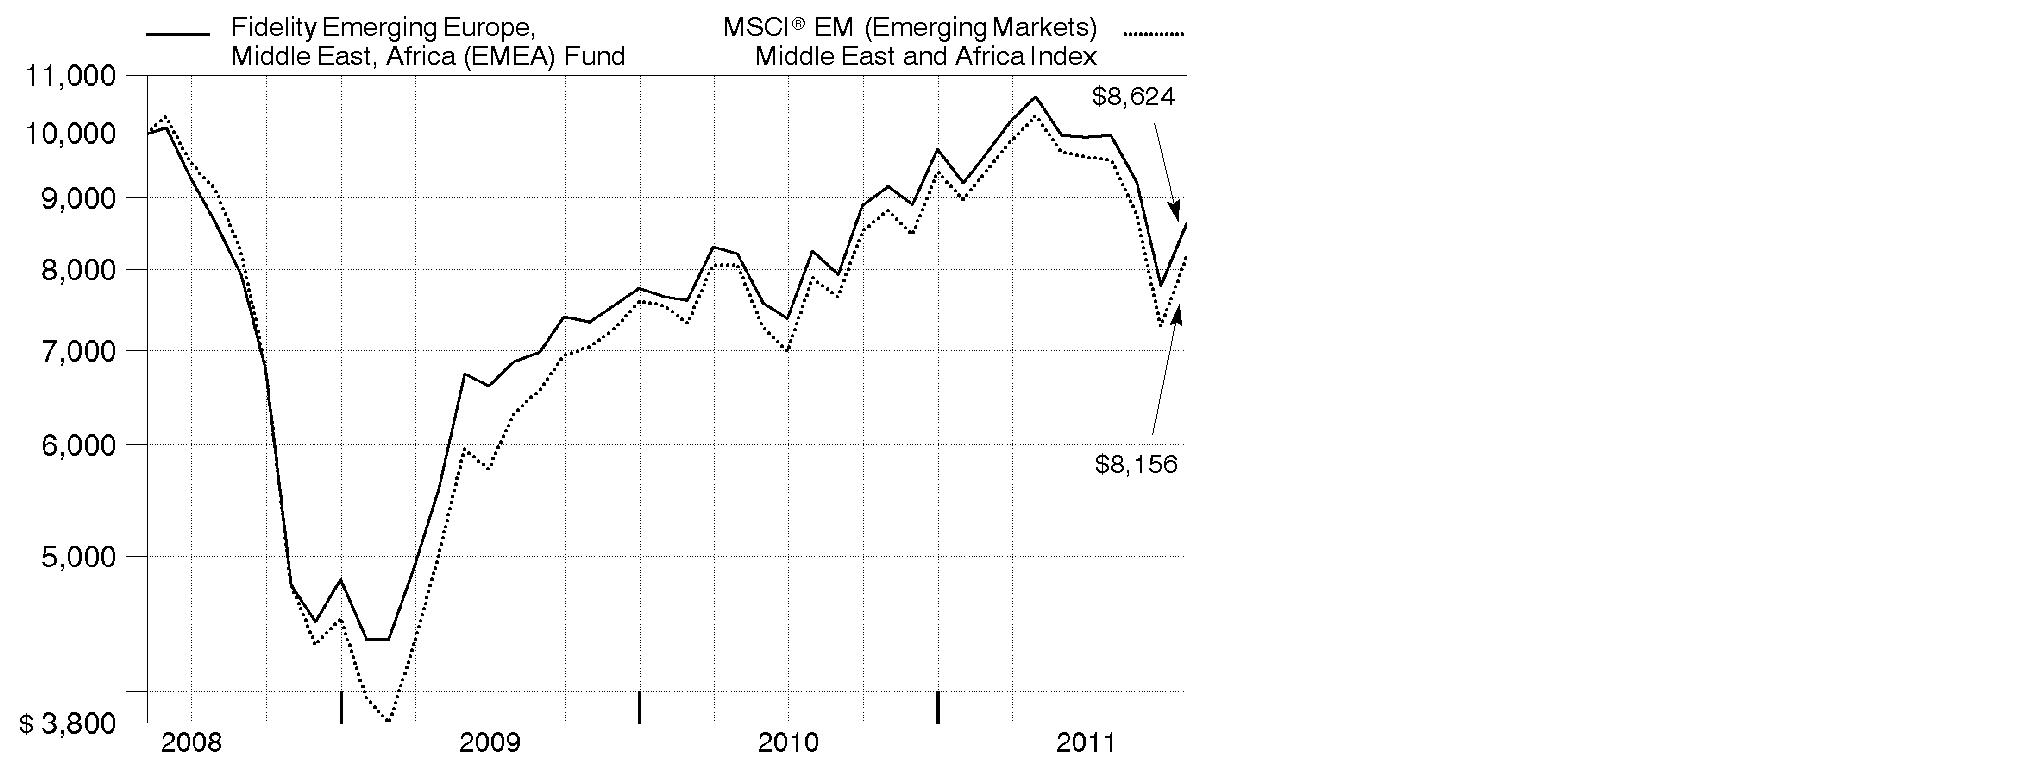
Annual Report
Market Recap: Emerging-markets stocks concluded the 12-month period ending October 31, 2011, on a strong note, reversing direction in October amid hope for a resolution to the sovereign debt crisis in Europe. The brief rally, on top of a robust first half of the period, could only partially offset the negative impact of a five-month downturn that began in May and intensified in August and September, as investors began to flee riskier securities due to the debt debacle, concern the U.S. economy may contract and worry about a significant slowdown in China. For the year, the MSCI® Emerging Markets Index declined 7.44%, hampered in part by global currency fluctuation. The index gained roughly 13% in October, after falling 9% in August and about 15% in September. For the full year, returns across the individual country components of the emerging-markets index were decidedly negative. Several of the largest countries in the index struggled, especially India (-20%), China (-17%) and Brazil (-12%), as did Turkey (-34%). Conversely, South Korea had the strongest result, gaining about 7%, while another sizable index component, Russia, returned roughly 1%. Smaller constituents Indonesia (+5%) and Malaysia (+4%) also finished in positive territory. A trio of countries had negative returns but outpaced the index: Mexico (-1%), Taiwan (-2%) and South Africa (-3%).
Comments from Adam Kutas, Portfolio Manager of Fidelity® Emerging Europe, Middle East, Africa (EMEA) Fund: For the year, the fund's Retail Class shares returned -5.91%, outperforming the -7.42% return of the MSCI® EM (Emerging Markets) Europe, Middle East and Africa Index. Stock selection within materials and telecommunication services helped, as did picks in Russia and an overweighting in South Africa. Individual contributors included Russian natural gas producer Novatek, three South African firms - coal company Exxaro Resources, Harmony Gold Mining and supermarket company Shoprite Holdings - and not owning underperforming index constituent OTP Bank, based in Hungary. On the down side, poor stock selection in consumer discretionary hurt, particularly in retailing. On a regional basis, the fund lost ground due to the negative currency effects of our South African investments and unfavorable security selection in Poland. Among the main individual detractors were Turkish banks Turkiye Garanti Bankasi and Turkiye Halk Bankasi - the latter of which was sold from the fund by period end - and underweighting Russian oil company and outperforming major index component Gazprom.
Note to shareholders: The fund may invest up to 35% of its total assets in any industry that represents more than 20% of the emerging Europe, Middle East and African markets. As of October 31, 2011, the fund did not have more than 25% of its total assets invested in any one industry.
The views expressed above reflect those of the portfolio manager(s) only through the end of the period as stated on the cover of this report and do not necessarily represent the views of Fidelity or any other person in the Fidelity organization. Any such views are subject to change at any time based upon market or other conditions and Fidelity disclaims any responsibility to update such views. These views may not be relied on as investment advice and, because investment decisions for a Fidelity fund are based on numerous factors, may not be relied on as an indication of trading intent on behalf of any Fidelity fund.
Annual Report
Shareholder Expense Example
As a shareholder of the Fund, you incur two types of costs: (1) transaction costs, including sales charges (loads) on purchase payments or redemption proceeds, redemption fees, and (2) ongoing costs, including management fees, distribution and/or service (12b-1) fees and other Fund expenses. This Example is intended to help you understand your ongoing costs (in dollars) of investing in the Fund and to compare these costs with the ongoing costs of investing in other mutual funds.
The Example is based on an investment of $1,000 invested at the beginning of the period and held for the entire period (May 1, 2011 to October 31, 2011).
Actual Expenses
The first line of the accompanying table for each class of the Fund provides information about actual account values and actual expenses. You may use the information in this line, together with the amount you invested, to estimate the expenses that you paid over the period. Simply divide your account value by $1,000.00 (for example, an $8,600 account value divided by $1,000.00 = 8.6), then multiply the result by the number in the first line for a class of the Fund under the heading entitled "Expenses Paid During Period" to estimate the expenses you paid on your account during this period. A small balance maintenance fee of $12.00 that is charged once a year may apply for certain accounts with a value of less than $2,000. This fee is not included in the table below. If it was, the estimate of expenses you paid during the period would be higher, and your ending account value lower, by this amount. In addition, the Fund, as a shareholder in the underlying Fidelity Central Funds, will indirectly bear its pro-rata share of the fees and expenses incurred by the underlying Fidelity Central Funds. These fees and expenses are not included in the Fund's annualized expense ratio used to calculate the expense estimate in the table below.
Hypothetical Example for Comparison Purposes
The second line of the accompanying table for each class of the Fund provides information about hypothetical account values and hypothetical expenses based on a Class' actual expense ratio and an assumed rate of return of 5% per year before expenses, which is not the Class' actual return. The hypothetical account values and expenses may not be used to estimate the actual ending account balance or expenses you paid for the period. You may use this information to compare the ongoing costs of investing in the Fund and other funds. To do so, compare this 5% hypothetical example with the 5% hypothetical examples that appear in the shareholder reports of the other funds. A small balance maintenance fee of $12.00 that is charged once a year may apply for certain accounts with a value of less than $2,000. This fee is not included in the table below. If it was, the estimate of expenses you paid during the period would be higher, and your ending account value lower, by this amount. In addition, the Fund, as a shareholder in the underlying Fidelity Central Funds, will indirectly bear its pro-rata share of the fees and expenses incurred by the underlying Fidelity Central Funds. These fees and expenses are not included in the Fund's annualized expense ratio used to calculate the expense estimate in the table below.
Please note that the expenses shown in the table are meant to highlight your ongoing costs only and do not reflect any transaction costs. Therefore, the second line of the table is useful in comparing ongoing costs only, and will not help you determine the relative total costs of owning different funds. In addition, if these transactional costs were included, your costs would have been higher.
Annual Report
| Annualized
Expense Ratio | Beginning
Account Value
May 1, 2011 | Ending
Account Value
October 31, 2011 | Expenses Paid
During Period*
May 1, 2011 to
October 31, 2011 |
Class A | 1.56% | | | |
Actual | | $ 1,000.00 | $ 811.30 | $ 7.12 |
HypotheticalA | | $ 1,000.00 | $ 1,017.34 | $ 7.93 |
Class T | 1.84% | | | |
Actual | | $ 1,000.00 | $ 809.90 | $ 8.39 |
HypotheticalA | | $ 1,000.00 | $ 1,015.93 | $ 9.35 |
Class B | 2.32% | | | |
Actual | | $ 1,000.00 | $ 808.00 | $ 10.57 |
HypotheticalA | | $ 1,000.00 | $ 1,013.51 | $ 11.77 |
Class C | 2.33% | | | |
Actual | | $ 1,000.00 | $ 807.80 | $ 10.62 |
HypotheticalA | | $ 1,000.00 | $ 1,013.46 | $ 11.82 |
Emerging Europe, Middle East, Africa (EMEA) | 1.31% | | | |
Actual | | $ 1,000.00 | $ 811.80 | $ 5.98 |
HypotheticalA | | $ 1,000.00 | $ 1,018.60 | $ 6.67 |
Institutional Class | 1.23% | | | |
Actual | | $ 1,000.00 | $ 811.80 | $ 5.62 |
HypotheticalA | | $ 1,000.00 | $ 1,019.00 | $ 6.26 |
A 5% return per year before expenses
* Expenses are equal to each Class' annualized expense ratio, multiplied by the average account value over the period, multiplied by 184/365 (to reflect the one-half year period).
Annual Report
Investment Changes (Unaudited)
Geographic Diversification (% of fund's net assets) |
As of October 31, 2011 |
 | South Africa 46.7% | |
 | Russia 33.6% | |
 | Turkey 5.8% | |
 | Poland 3.3% | |
 | United Arab Emirates 2.3% | |
 | Nigeria 1.6% | |
 | Morocco 1.2% | |
 | Kenya 1.2% | |
 | Qatar 1.1% | |
 | Other* 3.2% | |

* Includes short-term investments and net other assets. |
As of April 30, 2011 |
| South Africa 45.0% | |
| Russia 32.4% | |
| Turkey 8.3% | |
| United States of America* 3.6% | |
| Poland 3.1% | |
| United Arab Emirates 1.4% | |
| Morocco 1.0% | |
| Nigeria 1.0% | |
| Kenya 0.9% | |
| Other 3.3% | |

* Includes short-term investments and net other assets. |
Asset Allocation |
| % of fund's
net assets | % of fund's net assets
6 months ago |
Stocks | 98.9 | 96.1 |
Bonds | 0.7 | 0.3 |
Short-Term Investments and Net Other Assets | 0.4 | 3.6 |
Top Ten Stocks as of October 31, 2011 |
| % of fund's
net assets | % of fund's net assets
6 months ago |
OAO Gazprom (Russia, Oil, Gas & Consumable Fuels) | 8.7 | 9.3 |
MTN Group Ltd. (South Africa, Wireless Telecommunication Services) | 7.9 | 6.2 |
Lukoil Oil Co. sponsored ADR (United Kingdom) (Russia, Oil, Gas & Consumable Fuels) | 6.0 | 5.7 |
Sberbank of Russia (Russia, Commercial Banks) | 5.6 | 5.1 |
Standard Bank Group Ltd. (South Africa, Commercial Banks) | 4.3 | 3.8 |
OAO NOVATEK (Russia, Oil, Gas & Consumable Fuels) | 4.0 | 3.3 |
Harmony Gold Mining Co. Ltd. (South Africa, Metals & Mining) | 3.7 | 3.3 |
FirstRand Ltd. (South Africa, Diversified Financial Services) | 3.3 | 2.9 |
Vodacom Group (Pty) Ltd. (South Africa, Wireless Telecommunication Services) | 3.1 | 1.8 |
Shoprite Holdings Ltd. (South Africa, Food & Staples Retailing) | 3.0 | 3.5 |
| 49.6 | |
Market Sectors as of October 31, 2011 |
| % of fund's
net assets | % of fund's net assets
6 months ago |
Energy | 26.7 | 27.5 |
Financials | 23.4 | 24.0 |
Materials | 14.9 | 14.7 |
Telecommunication Services | 14.3 | 10.5 |
Consumer Staples | 9.2 | 8.8 |
Consumer Discretionary | 6.3 | 6.8 |
Industrials | 1.7 | 1.9 |
Utilities | 1.7 | 1.0 |
Health Care | 0.7 | 0.7 |
Information Technology | 0.3 | 0.2 |
Annual Report
Investments October 31, 2011
Showing Percentage of Net Assets
Common Stocks - 97.1% |
| Shares | | Value |
Bailiwick of Jersey - 0.8% |
Randgold Resources Ltd. | 9,700 | | $ 1,061,062 |
Canada - 0.3% |
Silver Wheaton Corp. | 13,000 | | 448,874 |
Czech Republic - 0.6% |
Philip Morris CR A/S | 1,370 | | 899,560 |
Kenya - 1.2% |
British American Tobacco Kenya Ltd. | 185,900 | | 439,723 |
East African Breweries Ltd. | 379,106 | | 591,459 |
Safaricom Ltd. | 15,803,616 | | 477,210 |
Uchumi Supermarket Ltd. (a) | 2,000,000 | | 180,171 |
TOTAL KENYA | | 1,688,563 |
Morocco - 1.2% |
Maroc Telecom SA | 99,500 | | 1,746,011 |
Nigeria - 1.6% |
Guaranty Trust Bank PLC | 3,807,451 | | 349,066 |
Nigerian Breweries PLC | 1,441,779 | | 828,491 |
Skye Bank PLC | 14,371,010 | | 450,307 |
Zenith Bank PLC | 7,356,200 | | 595,887 |
TOTAL NIGERIA | | 2,223,751 |
Poland - 3.3% |
Bank Polska Kasa Opieki SA | 48,900 | | 2,275,563 |
Eurocash SA | 136,400 | | 1,093,636 |
Polska Grupa Energetyczna SA | 225,000 | | 1,386,618 |
TOTAL POLAND | | 4,755,817 |
Qatar - 1.1% |
Qatar National Bank SAQ | 26,129 | | 1,051,977 |
Vodafone Qatar QSC (a) | 244,891 | | 501,720 |
TOTAL QATAR | | 1,553,697 |
Russia - 31.8% |
DIXY Group OJSC (a) | 123,300 | | 1,260,327 |
Lukoil Oil Co. sponsored ADR (United Kingdom) | 147,895 | | 8,607,489 |
Magnit OJSC | 10,400 | | 1,124,528 |
Magnit OJSC right 11/29/11 (a) | 1,263 | | 0 |
Novolipetsk Steel OJSC GDR (Reg. S) | 30,600 | | 832,932 |
OAO Gazprom | 2,093,600 | | 12,421,011 |
OAO NOVATEK | 39,500 | | 518,896 |
NOVATEK OAO GDR | 37,100 | | 5,208,840 |
Rosneft Oil Co. OJSC | 32,800 | | 236,696 |
Rosneft Oil Co. OJSC GDR (Reg. S) | 247,700 | | 1,762,386 |
Common Stocks - continued |
| Shares | | Value |
Russia - continued |
Sberbank of Russia | 2,921,500 | | $ 7,927,577 |
Sistema JSFC sponsored GDR | 26,300 | | 450,782 |
TNK-BP Holding | 786,500 | | 2,151,883 |
Uralkali JSC | 329,300 | | 2,928,842 |
TOTAL RUSSIA | | 45,432,189 |
South Africa - 46.7% |
Africa Cellular Towers Ltd. (a) | 5,335,800 | | 60,510 |
African Rainbow Minerals Ltd. | 67,600 | | 1,562,339 |
AngloGold Ashanti Ltd. | 95,400 | | 4,311,518 |
Aveng Ltd. | 143,700 | | 671,758 |
Cashbuild Ltd. | 80,500 | | 1,044,756 |
Clicks Group Ltd. | 779,024 | | 4,088,347 |
DRDGOLD Ltd. | 1,024,814 | | 675,744 |
Exxaro Resources Ltd. | 125,700 | | 2,843,031 |
FirstRand Ltd. | 1,907,200 | | 4,743,788 |
Foschini Ltd. | 61,700 | | 778,529 |
Harmony Gold Mining Co. Ltd. | 404,700 | | 5,290,930 |
Life Healthcare Group Holdings Ltd. | 383,900 | | 934,076 |
Mr Price Group Ltd. | 153,400 | | 1,476,728 |
MTN Group Ltd. | 642,350 | | 11,211,562 |
Nampak Ltd. | 317,600 | | 872,407 |
Naspers Ltd. Class N | 28,200 | | 1,350,216 |
Northam Platinum Ltd. | 111,600 | | 432,406 |
Paracon Holdings Ltd. | 1,828,728 | | 414,766 |
Pioneer Foods Ltd. | 148,700 | | 1,189,967 |
Raubex Group Ltd. | 719,200 | | 1,179,893 |
RMB Holdings Ltd. | 258,400 | | 815,609 |
Sanlam Ltd. | 432,100 | | 1,614,325 |
Sasol Ltd. | 87,900 | | 3,952,702 |
Shoprite Holdings Ltd. | 296,200 | | 4,340,942 |
Spur Corp. Ltd. | 162,800 | | 277,956 |
Standard Bank Group Ltd. | 496,363 | | 6,116,742 |
Vodacom Group (Pty) Ltd. | 385,300 | | 4,364,562 |
TOTAL SOUTH AFRICA | | 66,616,109 |
Turkey - 5.8% |
Aygaz A/S | 178,000 | | 972,419 |
Bim Birlesik Magazalar A/S JSC | 29,000 | | 885,621 |
Koc Holding AS | 159,000 | | 568,291 |
Tupras-Turkiye Petrol Rafinerileri AS | 32,000 | | 723,880 |
Common Stocks - continued |
| Shares | | Value |
Turkey - continued |
Turk Telekomunikasyon AS | 346,000 | | $ 1,467,553 |
Turkiye Garanti Bankasi AS | 1,027,000 | | 3,624,193 |
TOTAL TURKEY | | 8,241,957 |
United Arab Emirates - 2.3% |
Dubai Financial Market PJSC (a) | 4,758,417 | | 1,334,378 |
Emirates NBD Bank PJSC (a) | 418,373 | | 389,555 |
First Gulf Bank PJSC | 349,523 | | 1,479,739 |
TOTAL UNITED ARAB EMIRATES | | 3,203,672 |
Zambia - 0.4% |
Zambeef Products PLC | 984,233 | | 601,979 |
TOTAL COMMON STOCKS (Cost $130,573,013) | 138,473,241 |
Nonconvertible Preferred Stocks - 1.8% |
| | | |
Russia - 1.8% |
Surgutneftegaz JSC
(Cost $2,598,642) | 5,104,100 | | 2,577,377 |
Nonconvertible Bonds - 0.3% |
| Principal Amount | | |
Multi-National - 0.3% |
International Bank for Reconstruction & Development 8.2% 12/12/12
(Cost $511,604) | NGN | 80,000,000 | | 477,237 |
Government Obligations - 0.4% |
|
Ghana - 0.4% |
Ghana Republic 14.99% 3/11/13
(Cost $672,328) | GHS | 950,000 | | 599,847 |
Money Market Funds - 0.5% |
| Shares | | Value |
Fidelity Cash Central Fund, 0.12% (b)
(Cost $745,166) | 745,166 | | $ 745,166 |
TOTAL INVESTMENT PORTFOLIO - 100.1% (Cost $135,100,753) | | 142,872,868 |
NET OTHER ASSETS (LIABILITIES) - (0.1)% | | (170,558) |
NET ASSETS - 100% | $ 142,702,310 |
Currency Abbreviations |
GHS | - | Ghana Cedi |
NGN | - | Nigerian naira |
Legend |
(a) Non-income producing |
(b) Affiliated fund that is available only to investment companies and other accounts managed by Fidelity Investments. The rate quoted is the annualized seven-day yield of the fund at period end. A complete unaudited listing of the fund's holdings as of its most recent quarter end is available upon request. In addition, each Fidelity Central Fund's financial statements, which are not covered by the Fund's Report of Independent Registered Public Accounting Firm, are available on the SEC's website or upon request. |
Affiliated Central Funds |
Information regarding fiscal year to date income earned by the Fund from investments in Fidelity Central Funds is as follows: |
Fund | Income earned |
Fidelity Cash Central Fund | $ 5,615 |
Fidelity Securities Lending Cash Central Fund | 25 |
Total | $ 5,640 |
Other Information |
The following is a summary of the inputs used, as of October 31, 2011, involving the Fund's assets and liabilities carried at fair value. The inputs or methodology used for valuing securities may not be an indication of the risk associated with investing in those securities. For more information on valuation inputs, and their aggregation into the levels used in the table below, please refer to the Investment Security Valuation section in the accompanying Notes to Financial Statements. |
Valuation Inputs at Reporting Date: |
Description | Total | Level 1 | Level 2 | Level 3 |
Investments in Securities: | | | | |
Equities: | | | | |
South Africa | $ 66,616,109 | $ 52,385,215 | $ 14,230,894 | $ - |
Russia | 48,009,566 | 48,009,566 | - | - |
Turkey | 8,241,957 | 8,241,957 | - | - |
Poland | 4,755,817 | 4,755,817 | - | - |
United Arab Emirates | 3,203,672 | 3,203,672 | - | - |
Nigeria | 2,223,751 | 2,223,751 | - | - |
Morocco | 1,746,011 | 1,746,011 | - | - |
Kenya | 1,688,563 | 1,688,563 | - | - |
Qatar | 1,553,697 | 1,553,697 | - | - |
Other | 3,011,475 | 1,950,413 | 1,061,062 | - |
Corporate Bonds | 477,237 | - | 477,237 | - |
Government Obligations | 599,847 | - | 599,847 | - |
Money Market Funds | 745,166 | 745,166 | - | - |
Total Investments in Securities: | $ 142,872,868 | $ 126,503,828 | $ 16,369,040 | $ - |
Income Tax Information |
At October 31, 2011, the Fund had a capital loss carryforward of approximately $11,266,491 of which $7,410,645, $579,836 and $3,276,010 will expire in fiscal 2016, 2017 and 2018, respectively. Capital loss carryforwards are only available to offset future capital gains of the Fund to the extent provided by regulations and may be limited. |
See accompanying notes which are an integral part of the financial statements.
Annual Report
Statement of Assets and Liabilities
| October 31, 2011 |
Assets | | |
Investment in securities, at value - See accompanying schedule: Unaffiliated issuers (cost $134,355,587) | $ 142,127,702 | |
Fidelity Central Funds (cost $745,166) | 745,166 | |
Total Investments (cost $135,100,753) | | $ 142,872,868 |
Cash | | 160,278 |
Foreign currency held at value (cost $61) | | 61 |
Receivable for fund shares sold | | 148,502 |
Dividends receivable | | 179,461 |
Interest receivable | | 43,184 |
Distributions receivable from Fidelity Central Funds | | 66 |
Prepaid expenses | | 716 |
Other receivables | | 20,392 |
Total assets | | 143,425,528 |
| | |
Liabilities | | |
Payable for investments purchased | $ 160,278 | |
Payable for fund shares redeemed | 349,022 | |
Accrued management fee | 91,946 | |
Distribution and service plan fees payable | 9,109 | |
Other affiliated payables | 41,379 | |
Other payables and accrued expenses | 71,484 | |
Total liabilities | | 723,218 |
| | |
Net Assets | | $ 142,702,310 |
Net Assets consist of: | | |
Paid in capital | | $ 144,186,805 |
Undistributed net investment income | | 2,747,743 |
Accumulated undistributed net realized gain (loss) on investments and foreign currency transactions | | (12,001,894) |
Net unrealized appreciation (depreciation) on investments and assets and liabilities in foreign currencies | | 7,769,656 |
Net Assets | | $ 142,702,310 |
See accompanying notes which are an integral part of the financial statements.
Annual Report
Financial Statements - continued
Statement of Assets and Liabilities - continued
| October 31, 2011 |
Calculation of Maximum Offering Price Class A:
Net Asset Value and redemption price per share ($10,260,374 ÷ 1,230,909 shares) | | $ 8.34 |
| | |
Maximum offering price per share (100/94.25 of $8.34) | | $ 8.85 |
Class T:
Net Asset Value and redemption price per share ($3,502,217 ÷ 421,495 shares) | | $ 8.31 |
| | |
Maximum offering price per share (100/96.50 of $8.31) | | $ 8.61 |
Class B:
Net Asset Value and offering price per share ($538,949 ÷ 65,051 shares)A | | $ 8.29 |
| | |
Class C:
Net Asset Value and offering price per share ($6,650,468 ÷ 807,272 shares)A | | $ 8.24 |
| | |
Emerging Europe, Middle East, Africa (EMEA):
Net Asset Value, offering price and redemption price per share ($114,117,343 ÷ 13,632,396 shares) | | $ 8.37 |
| | |
Institutional Class:
Net Asset Value, offering price and redemption price per share ($7,632,959 ÷ 911,487 shares) | | $ 8.37 |
A Redemption price per share is equal to net asset value less any applicable contingent deferred sales charge.
See accompanying notes which are an integral part of the financial statements.
Annual Report
Statement of Operations
| Year ended October 31, 2011 |
Investment Income | | |
Dividends | | $ 5,132,884 |
Special dividends | | 786,604 |
Interest | | 112,169 |
Income from Fidelity Central Funds | | 5,640 |
Income before foreign taxes withheld | | 6,037,297 |
Less foreign taxes withheld | | (341,837) |
Total income | | 5,695,460 |
| | |
Expenses | | |
Management fee | $ 1,436,460 | |
Transfer agent fees | 498,396 | |
Distribution and service plan fees | 128,171 | |
Accounting and security lending fees | 92,187 | |
Custodian fees and expenses | 211,210 | |
Independent trustees' compensation | 978 | |
Registration fees | 81,995 | |
Audit | 62,082 | |
Legal | 658 | |
Miscellaneous | 1,418 | |
Total expenses before reductions | 2,513,555 | |
Expense reductions | (160,094) | 2,353,461 |
Net investment income (loss) | | 3,341,999 |
Realized and Unrealized Gain (Loss) Net realized gain (loss) on: | | |
Investment securities: | | |
Unaffiliated issuers | 3,530,080 | |
Foreign currency transactions | (102,414) | |
Total net realized gain (loss) | | 3,427,666 |
Change in net unrealized appreciation (depreciation) on: Investment securities | (17,515,193) | |
Assets and liabilities in foreign currencies | (8,519) | |
Total change in net unrealized appreciation (depreciation) | | (17,523,712) |
Net gain (loss) | | (14,096,046) |
Net increase (decrease) in net assets resulting from operations | | $ (10,754,047) |
See accompanying notes which are an integral part of the financial statements.
Annual Report
Financial Statements - continued
Statement of Changes in Net Assets
| Year ended
October 31,
2011 | Year ended
October 31,
2010 |
Increase (Decrease) in Net Assets | | |
Operations | | |
Net investment income (loss) | $ 3,341,999 | $ 1,510,417 |
Net realized gain (loss) | 3,427,666 | (3,213,726) |
Change in net unrealized appreciation (depreciation) | (17,523,712) | 29,135,993 |
Net increase (decrease) in net assets resulting
from operations | (10,754,047) | 27,432,684 |
Distributions to shareholders from net investment income | (1,835,361) | (816,015) |
Distributions to shareholders from net realized gain | (302,617) | (391,419) |
Total distributions | (2,137,978) | (1,207,434) |
Share transactions - net increase (decrease) | (11,096,734) | 22,045,599 |
Redemption fees | 119,309 | 89,745 |
Total increase (decrease) in net assets | (23,869,450) | 48,360,594 |
| | |
Net Assets | | |
Beginning of period | 166,571,760 | 118,211,166 |
End of period (including undistributed net investment income of $2,747,743 and undistributed net investment income of $1,374,218, respectively) | $ 142,702,310 | $ 166,571,760 |
See accompanying notes which are an integral part of the financial statements.
Annual Report
Financial Highlights - Class A
Years ended October 31, | 2011 | 2010 | 2009 | 2008 I |
Selected Per-Share Data | | | | |
Net asset value, beginning of period | $ 8.97 | $ 7.26 | $ 4.75 | $ 10.00 |
Income from Investment Operations | | | | |
Net investment income (loss) E | .16 H | .07 | .05 | .04 |
Net realized and unrealized gain (loss) | (.70) | 1.70 | 2.48 | (5.31) |
Total from investment operations | (.54) | 1.77 | 2.53 | (5.27) |
Distributions from net investment income | (.08) | (.04) | (.03) | - |
Distributions from net realized gain | (.02) | (.02) | - | - |
Total distributions | (.10) | (.07) K | (.03) | - |
Redemption fees added to paid in capital E | .01 | .01 | .01 | .02 |
Net asset value, end of period | $ 8.34 | $ 8.97 | $ 7.26 | $ 4.75 |
Total Return B, C, D | (6.05)% | 24.66% | 53.78% | (52.50)% |
Ratios to Average Net Assets F, J | | | | |
Expenses before reductions | 1.60% | 1.69% | 1.87% | 2.50% A |
Expenses net of fee waivers, if any | 1.56% | 1.50% | 1.50% | 1.50% A |
Expenses net of all reductions | 1.51% | 1.38% | 1.39% | 1.23% A |
Net investment income (loss) | 1.70% H | .95% | .84% | 1.20% A |
Supplemental Data | | | | |
Net assets, end of period (000 omitted) | $ 10,260 | $ 10,045 | $ 4,817 | $ 1,368 |
Portfolio turnover rate G | 53% | 96% | 58% | 68% |
A Annualized
B Total returns for periods of less than one year are not annualized.
C Total returns would have been lower if certain expenses had not been reduced during the applicable periods shown.
D Total returns do not include the effect of the sales charges.
E Calculated based on average shares outstanding during the period.
F Fees and expenses of any underlying Fidelity Central Funds are not included in the Fund's expense ratio. The Fund indirectly bears its proportionate share of the expenses of any underlying Fidelity Central Funds.
G Amount does not include the portfolio activity of any underlying Fidelity Central Funds.
H Investment income per share reflects a special dividend which amounted to $.04 per share. Excluding the special dividend, the ratio of net investment income (loss) to average net assets would have been 1.25%.
I For the period May 8, 2008 (commencement of operations) to October 31, 2008.
J Expense ratios reflect operating expenses of the class. Expenses before reductions do not reflect amounts reimbursed by the investment adviser or reductions from brokerage service arrangements or reductions from other expense offset arrangements and do not represent the amount paid by the class during periods when reimbursements or reductions occur. Expense ratios before reductions for start-up periods may not be representative of longer-term operating periods. Expenses net of fee waivers reflect expenses after reimbursement by the investment adviser but prior to reductions from brokerage service arrangements or other expense offset arrangements. Expenses net of all reductions represent the net expenses paid by the class.
K Total distributions of $.07 per share is comprised of distributions from net investment income of $.041 and distributions from net realized gain of $.024 per share.
See accompanying notes which are an integral part of the financial statements.
Annual Report
Financial Highlights - Class T
Years ended October 31, | 2011 | 2010 | 2009 | 2008 I |
Selected Per-Share Data | | | | |
Net asset value, beginning of period | $ 8.96 | $ 7.25 | $ 4.75 | $ 10.00 |
Income from Investment Operations | | | | |
Net investment income (loss) E | .13 H | .06 | .04 | .04 |
Net realized and unrealized gain (loss) | (.71) | 1.69 | 2.47 | (5.31) |
Total from investment operations | (.58) | 1.75 | 2.51 | (5.27) |
Distributions from net investment income | (.07) | (.03) | (.02) | - |
Distributions from net realized gain | (.02) | (.02) | - | - |
Total distributions | (.08) K | (.05) | (.02) | - |
Redemption fees added to paid in capital E | .01 | .01 | .01 | .02 |
Net asset value, end of period | $ 8.31 | $ 8.96 | $ 7.25 | $ 4.75 |
Total Return B, C, D | (6.42)% | 24.44% | 53.20% | (52.50)% |
Ratios to Average Net Assets F, J | | | | |
Expenses before reductions | 1.87% | 1.95% | 2.15% | 2.78% A |
Expenses net of fee waivers, if any | 1.84% | 1.75% | 1.75% | 1.75% A |
Expenses net of all reductions | 1.78% | 1.62% | 1.64% | 1.49% A |
Net investment income (loss) | 1.42% H | .70% | .59% | .95% A |
Supplemental Data | | | | |
Net assets, end of period (000 omitted) | $ 3,502 | $ 3,114 | $ 1,560 | $ 568 |
Portfolio turnover rate G | 53% | 96% | 58% | 68% |
A Annualized
B Total returns for periods of less than one year are not annualized.
C Total returns would have been lower if certain expenses had not been reduced during the applicable periods shown.
D Total returns do not include the effect of the sales charges.
E Calculated based on average shares outstanding during the period.
F Fees and expenses of any underlying Fidelity Central Funds are not included in the Fund's expense ratio. The Fund indirectly bears its proportionate share of the expenses of any underlying Fidelity Central Funds.
G Amount does not include the portfolio activity of any underlying Fidelity Central Funds.
H Investment income per share reflects a special dividend which amounted to $.04 per share. Excluding the special dividend, the ratio of net investment income (loss) to average net assets would have been .98%.
I For the period May 8, 2008 (commencement of operations) to October 31, 2008.
J Expense ratios reflect operating expenses of the class. Expenses before reductions do not reflect amounts reimbursed by the investment adviser or reductions from brokerage service arrangements or reductions from other expense offset arrangements and do not represent the amount paid by the class during periods when reimbursements or reductions occur. Expense ratios before reductions for start-up periods may not be representative of longer-term operating periods. Expenses net of fee waivers reflect expenses after reimbursement by the investment adviser but prior to reductions from brokerage service arrangements or other expense offset arrangements. Expenses net of all reductions represent the net expenses paid by the class.
K Total distributions of $.08 per share is comprised of distributions from net investment income of $.068 and distributions from net realized gain of $.015 per share.
See accompanying notes which are an integral part of the financial statements.
Annual Report
Financial Highlights - Class B
Years ended October 31, | 2011 | 2010 | 2009 | 2008 I |
Selected Per-Share Data | | | | |
Net asset value, beginning of period | $ 8.93 | $ 7.23 | $ 4.73 | $ 10.00 |
Income from Investment Operations | | | | |
Net investment income (loss) E | .09 H | .02 | .01 | .02 |
Net realized and unrealized gain (loss) | (.71) | 1.68 | 2.48 | (5.31) |
Total from investment operations | (.62) | 1.70 | 2.49 | (5.29) |
Distributions from net investment income | (.02) | - | - | - |
Distributions from net realized gain | (.01) | (.01) | - | - |
Total distributions | (.03) | (.01) | - | - |
Redemption fees added to paid in capital E | .01 | .01 | .01 | .02 |
Net asset value, end of period | $ 8.29 | $ 8.93 | $ 7.23 | $ 4.73 |
Total Return B, C, D | (6.85)% | 23.72% | 52.85% | (52.70)% |
Ratios to Average Net Assets F, J | | | | |
Expenses before reductions | 2.37% | 2.47% | 2.68% | 3.32% A |
Expenses net of fee waivers, if any | 2.33% | 2.25% | 2.25% | 2.25% A |
Expenses net of all reductions | 2.27% | 2.12% | 2.14% | 1.99% A |
Net investment income (loss) | .93% H | .20% | .09% | .45% A |
Supplemental Data | | | | |
Net assets, end of period (000 omitted) | $ 539 | $ 822 | $ 782 | $ 487 |
Portfolio turnover rate G | 53% | 96% | 58% | 68% |
A Annualized
B Total returns for periods of less than one year are not annualized.
C Total returns would have been lower if certain expenses had not been reduced during the applicable periods shown.
D Total returns do not include the effect of the contingent deferred sales charge.
E Calculated based on average shares outstanding during the period.
F Fees and expenses of any underlying Fidelity Central Funds are not included in the Fund's expense ratio. The Fund indirectly bears its proportionate share of the expenses of any underlying Fidelity Central Funds.
G Amount does not include the portfolio activity of any underlying Fidelity Central Funds.
H Investment income per share reflects a special dividend which amounted to $.04 per share. Excluding the special dividend, the ratio of net investment income (loss) to average net assets would have been .49%.
I For the period May 8, 2008 (commencement of operations) to October 31, 2008.
J Expense ratios reflect operating expenses of the class. Expenses before reductions do not reflect amounts reimbursed by the investment adviser or reductions from brokerage service arrangements or reductions from other expense offset arrangements and do not represent the amount paid by the class during periods when reimbursements or reductions occur. Expense ratios before reductions for start-up periods may not be representative of longer-term operating periods. Expenses net of fee waivers reflect expenses after reimbursement by the investment adviser but prior to reductions from brokerage service arrangements or other expense offset arrangements. Expenses net of all reductions represent the net expenses paid by the class.
See accompanying notes which are an integral part of the financial statements.
Annual Report
Financial Highlights - Class C
Years ended October 31, | 2011 | 2010 | 2009 | 2008 I |
Selected Per-Share Data | | | | |
Net asset value, beginning of period | $ 8.90 | $ 7.23 | $ 4.73 | $ 10.00 |
Income from Investment Operations | | | | |
Net investment income (loss) E | .08 H | .02 | .01 | .02 |
Net realized and unrealized gain (loss) | (.69) | 1.67 | 2.48 | (5.31) |
Total from investment operations | (.61) | 1.69 | 2.49 | (5.29) |
Distributions from net investment income | (.05) | (.01) | - | - |
Distributions from net realized gain | (.02) | (.02) | - | - |
Total distributions | (.06) K | (.03) | - | - |
Redemption fees added to paid in capital E | .01 | .01 | .01 | .02 |
Net asset value, end of period | $ 8.24 | $ 8.90 | $ 7.23 | $ 4.73 |
Total Return B, C, D | (6.79)% | 23.61% | 52.85% | (52.70)% |
Ratios to Average Net Assets F, J | | | | |
Expenses before reductions | 2.36% | 2.45% | 2.61% | 3.28% A |
Expenses net of fee waivers, if any | 2.33% | 2.25% | 2.25% | 2.25% A |
Expenses net of all reductions | 2.27% | 2.13% | 2.14% | 1.99% A |
Net investment income (loss) | .93% H | .20% | .09% | .45% A |
Supplemental Data | | | | |
Net assets, end of period (000 omitted) | $ 6,650 | $ 5,151 | $ 2,677 | $ 741 |
Portfolio turnover rate G | 53% | 96% | 58% | 68% |
A Annualized
B Total returns for periods of less than one year are not annualized.
C Total returns would have been lower if certain expenses had not been reduced during the applicable periods shown.
D Total returns do not include the effect of the contingent deferred sales charge.
E Calculated based on average shares outstanding during the period.
F Fees and expenses of any underlying Fidelity Central Funds are not included in the Fund's expense ratio. The Fund indirectly bears its proportionate share of the expenses of any underlying Fidelity Central Funds.
G Amount does not include the portfolio activity of any underlying Fidelity Central Funds.
H Investment income per share reflects a special dividend which amounted to $.04 per share. Excluding the special dividend, the ratio of net investment income (loss) to average net assets would have been .49%.
I For the period May 8, 2008 (commencement of operations) to October 31, 2008.
J Expense ratios reflect operating expenses of the class. Expenses before reductions do not reflect amounts reimbursed by the investment adviser or reductions from brokerage service arrangements or reductions from other expense offset arrangements and do not represent the amount paid by the class during periods when reimbursements or reductions occur. Expense ratios before reductions for start-up periods may not be representative of longer-term operating periods. Expenses net of fee waivers reflect expenses after reimbursement by the investment adviser but prior to reductions from brokerage service arrangements or other expense offset arrangements. Expenses net of all reductions represent the net expenses paid by the class.
K Total distributions of $.06 per share is comprised of distributions from net investment income of $.047 and distributions from net realized gain of $.015 per share.
See accompanying notes which are an integral part of the financial statements.
Annual Report
Financial Highlights - Emerging Europe, Middle East, Africa (EMEA)
Years ended October 31, | 2011 | 2010 | 2009 | 2008 H |
Selected Per-Share Data | | | | |
Net asset value, beginning of period | $ 9.00 | $ 7.28 | $ 4.76 | $ 10.00 |
Income from Investment Operations | | | | |
Net investment income (loss) D | .18 G | .09 | .07 | .05 |
Net realized and unrealized gain (loss) | (.71) | 1.70 | 2.48 | (5.31) |
Total from investment operations | (.53) | 1.79 | 2.55 | (5.26) |
Distributions from net investment income | (.09) | (.05) | (.04) | - |
Distributions from net realized gain | (.02) | (.02) | - | - |
Total distributions | (.11) | (.08) J | (.04) | - |
Redemption fees added to paid in capital D | .01 | .01 | .01 | .02 |
Net asset value, end of period | $ 8.37 | $ 9.00 | $ 7.28 | $ 4.76 |
Total Return B, C | (5.91)% | 24.92% | 54.15% | (52.40)% |
Ratios to Average Net Assets E, I | | | | |
Expenses before reductions | 1.35% | 1.45% | 1.61% | 2.19% A |
Expenses net of fee waivers, if any | 1.31% | 1.25% | 1.25% | 1.25% A |
Expenses net of all reductions | 1.25% | 1.12% | 1.14% | .98% A |
Net investment income (loss) | 1.95% G | 1.21% | 1.09% | 1.45% A |
Supplemental Data | | | | |
Net assets, end of period (000 omitted) | $ 114,117 | $ 140,270 | $ 104,141 | $ 32,535 |
Portfolio turnover rate F | 53% | 96% | 58% | 68% |
A Annualized
B Total returns for periods of less than one year are not annualized.
C Total returns would have been lower if certain expenses had not been reduced during the applicable periods shown.
D Calculated based on average shares outstanding during the period.
E Fees and expenses of any underlying Fidelity Central Funds are not included in the Fund's expense ratio. The Fund indirectly bears its proportionate share of the expenses of any underlying Fidelity Central Funds.
F Amount does not include the portfolio activity of any underlying Fidelity Central Funds.
G Investment income per share reflects a special dividend which amounted to $.04 per share. Excluding the special dividend, the ratio of net investment income (loss) to average net assets would have been 1.51%.
H For the period May 8, 2008 (commencement of operations) to October 31, 2008.
I Expense ratios reflect operating expenses of the class. Expenses before reductions do not reflect amounts reimbursed by the investment adviser or reductions from brokerage service arrangements or reductions from other expense offset arrangements and do not represent the amount paid by the class during periods when reimbursements or reductions occur. Expense ratios before reductions for start-up periods may not be representative of longer-term operating periods. Expenses net of fee waivers reflect expenses after reimbursement by the investment adviser but prior to reductions from brokerage service arrangements or other expense offset arrangements. Expenses net of all reductions represent the net expenses paid by the class.
J Total distributions of $.08 per share is comprised of distributions from net investment income of $.052 and distributions from net realized gain of $.024 per share.
See accompanying notes which are an integral part of the financial statements.
Annual Report
Financial Highlights - Institutional Class
Years ended October 31, | 2011 | 2010 | 2009 | 2008 H |
Selected Per-Share Data | | | | |
Net asset value, beginning of period | $ 9.00 | $ 7.28 | $ 4.76 | $ 10.00 |
Income from Investment Operations | | | | |
Net investment income (loss) D | .19 G | .09 | .06 | .05 |
Net realized and unrealized gain (loss) | (.72) | 1.70 | 2.49 | (5.31) |
Total from investment operations | (.53) | 1.79 | 2.55 | (5.26) |
Distributions from net investment income | (.09) | (.05) | (.04) | - |
Distributions from net realized gain | (.02) | (.02) | - | - |
Total distributions | (.11) | (.08) J | (.04) | - |
Redemption fees added to paid in capital D | .01 | .01 | .01 | .02 |
Net asset value, end of period | $ 8.37 | $ 9.00 | $ 7.28 | $ 4.76 |
Total Return B, C | (5.91)% | 24.95% | 54.15% | (52.40)% |
Ratios to Average Net Assets E, I | | | | |
Expenses before reductions | 1.26% | 1.34% | 1.60% | 2.12% A |
Expenses net of fee waivers, if any | 1.24% | 1.25% | 1.25% | 1.25% A |
Expenses net of all reductions | 1.19% | 1.13% | 1.14% | .98% A |
Net investment income (loss) | 2.02% G | 1.20% | 1.09% | 1.46% A |
Supplemental Data | | | | |
Net assets, end of period (000 omitted) | $ 7,633 | $ 7,171 | $ 4,235 | $ 2,695 |
Portfolio turnover rate F | 53% | 96% | 58% | 68% |
A Annualized
B Total returns for periods of less than one year are not annualized.
C Total returns would have been lower if certain expenses had not been reduced during the applicable periods shown.
D Calculated based on average shares outstanding during the period.
E Fees and expenses of any underlying Fidelity Central Funds are not included in the Fund's expense ratio. The Fund indirectly bears its proportionate share of the expenses of any underlying Fidelity Central Funds.
F Amount does not include the portfolio activity of any underlying Fidelity Central Funds.
G Investment income per share reflects a special dividend which amounted to $.04 per share. Excluding the special dividend, the ratio of net investment income (loss) to average net assets would have been 1.58%.
H For the period May 8, 2008 (commencement of operations) to October 31, 2008.
I Expense ratios reflect operating expenses of the class. Expenses before reductions do not reflect amounts reimbursed by the investment adviser or reductions from brokerage service arrangements or reductions from other expense offset arrangements and do not represent the amount paid by the class during periods when reimbursements or reductions occur. Expense ratios before reductions for start-up periods may not be representative of longer-term operating periods. Expenses net of fee waivers reflect expenses after reimbursement by the investment adviser but prior to reductions from brokerage service arrangements or other expense offset arrangements. Expenses net of all reductions represent the net expenses paid by the class.
J Total distributions of $.08 per share is comprised of distributions from net investment income of $.054 and distributions from net realized gain of $.024 per share.
See accompanying notes which are an integral part of the financial statements.
Annual Report
Notes to Financial Statements
For the period ended October 31, 2011
1. Organization.
Fidelity Emerging Europe, Middle East, Africa (EMEA) Fund (the Fund) is a non-diversified fund of Fidelity Investment Trust (the Trust) and is authorized to issue an unlimited number of shares. The Trust is registered under the Investment Company Act of 1940, as amended (the 1940 Act), as an open-end management investment company organized as a Massachusetts business trust. The Fund offers Class A, Class T, Class C, Emerging Europe, Middle East, Africa (EMEA) and Institutional Class shares, each of which, along with Class B shares, has equal rights as to assets and voting privileges. Effective after the close of business on September 1, 2010, Class B shares were closed to new accounts and additional purchases, except for exchanges and reinvestments by existing shareholders. Each class has exclusive voting rights with respect to matters that affect that class. Class B shares will automatically convert to Class A shares after a holding period of seven years from the initial date of purchase. Investment income, realized and unrealized capital gains and losses, the common expenses of the Fund, and certain fund-level expense reductions, if any, are allocated on a pro-rata basis to each class based on the relative net assets of each class to the total net assets of the Fund. Each class differs with respect to transfer agent and distribution and service plan fees incurred. Certain expense reductions may also differ by class. The Fund's investments in emerging markets can be subject to social, economic, regulatory, and political uncertainties and can be extremely volatile.
2. Investments in Fidelity Central Funds.
The Fund invests in Fidelity Central Funds, which are open-end investment companies available only to other investment companies and accounts managed by Fidelity Management & Research Company (FMR) and its affiliates. The Fund's Schedule of Investments lists each of the Fidelity Central Funds held as of period end, if any, as an investment of the Fund, but does not include the underlying holdings of each Fidelity Central Fund. As an Investing Fund, the Fund indirectly bears its proportionate share of the expenses of the underlying Fidelity Central Funds.
The Money Market Central Funds seek preservation of capital and current income and are managed by Fidelity Investments Money Management, Inc. (FIMM), an affiliate of FMR.
A complete unaudited list of holdings for each Fidelity Central Fund is available upon request or at the Securities and Exchange Commission (the SEC) web site at www.sec.gov. In addition, the financial statements of the Fidelity Central Funds, which are not covered by the Fund's Report of Independent Registered Public Accounting Firm are available on the SEC web site or upon request.
Annual Report
Notes to Financial Statements - continued
3. Significant Accounting Policies.
The financial statements have been prepared in conformity with accounting principles generally accepted in the United States of America (GAAP), which require management to make certain estimates and assumptions at the date of the financial statements. Actual results could differ from those estimates. Subsequent events, if any, through the date that the financial statements were issued have been evaluated in the preparation of the financial statements. The following summarizes the significant accounting policies of the Fund:
Security Valuation. Investments are valued as of 4:00 p.m. Eastern time on the last calendar day of the period. The Fund uses independent pricing services approved by the Board of Trustees to value its investments. When current market prices or quotations are not readily available or reliable, valuations may be determined in good faith in accordance with procedures adopted by the Board of Trustees. Factors used in determining value may include market or security specific events, changes in interest rates and credit quality. The frequency with which these procedures are used cannot be predicted and they may be utilized to a significant extent. The value used for net asset value (NAV) calculation under these procedures may differ from published prices for the same securities.
The Fund categorizes the inputs to valuation techniques used to value its investments into a disclosure hierarchy consisting of three levels as shown below:
Level 1 - quoted prices in active markets for identical investments
Level 2 - other significant observable inputs (including quoted prices for similar investments, interest rates, prepayment speeds, etc.)
Level 3 - unobservable inputs (including the Fund's own assumptions based on the best information available)
Changes in valuation techniques may result in transfers in or out of an assigned level within the disclosure hierarchy. The aggregate value of investments by input level, as of October 31, 2011, is included at the end of the Fund's Schedule of Investments. Valuation techniques used to value the Fund's investments by major category are as follows:
Equity securities, including restricted securities, for which market quotations are readily available, are valued at the last reported sale price or official closing price as reported by an independent pricing service on the primary market or exchange on which they are traded and are categorized as Level 1 in the hierarchy. In the event there were no sales during the day or closing prices are not available, securities are valued at the last quoted bid price or may be valued using the last available price and are generally categorized as Level 2 in the hierarchy. For foreign equity securities, when significant market or security specific events arise, comparisons to the valuation of American Depositary Receipts
Annual Report
3. Significant Accounting Policies - continued
Security Valuation - continued
(ADRs), futures contracts, Exchange-traded funds (ETFs) and certain indexes as well as quoted prices for similar securities are used and are categorized as Level 2 in the hierarchy in these circumstances. Utilizing these techniques may result in transfers between Level 1 and Level 2. For restricted equity securities and private placements where observable inputs are limited, assumptions about market activity and risk are used and are categorized as Level 3 in the hierarchy.
Debt securities, including restricted securities, are valued based on evaluated prices received from independent pricing services or from dealers who make markets in such securities. For corporate bonds and foreign government and government agency obligations, pricing services utilize matrix pricing which considers yield or price of bonds of comparable quality, coupon, maturity and type as well as dealer supplied prices and are generally categorized as Level 2 in the hierarchy.
When independent prices are unavailable or unreliable, debt securities may be valued utilizing pricing matrices which consider similar factors that would be used by independent pricing services. These are generally categorized as Level 2 in the hierarchy but may be Level 3 depending on the circumstances.
Investments in open-end mutual funds, including Fidelity Central Funds, are valued at their closing net asset value each business day and are categorized as Level 1 in the hierarchy.
Foreign Currency. The Fund may use foreign currency contracts to facilitate transactions in foreign-denominated securities. Gains and losses from these transactions may arise from changes in the value of the foreign currency or if the counterparties do not perform under the contracts' terms.
Foreign-denominated assets, including investment securities, and liabilities are translated into U.S. dollars at the exchange rate at period end. Purchases and sales of investment securities, income and dividends received and expenses denominated in foreign currencies are translated into U.S. dollars at the exchange rate in effect on the transaction date.
The effects of exchange rate fluctuations on investments are included with the net realized and unrealized gain (loss) on investment securities. Other foreign currency transactions resulting in realized and unrealized gain (loss) are disclosed separately.
Investment Transactions and Income. For financial reporting purposes, the Fund's investment holdings and NAV include trades executed through the end of the last business day of the period. The NAV per share for processing shareholder transactions is calculated as of the close of business of the New York Stock Exchange (NYSE) normally
Annual Report
Notes to Financial Statements - continued
3. Significant Accounting Policies - continued
Investment Transactions and Income - continued
4:00 p.m. Eastern time and includes trades executed through the end of the prior business day. Gains and losses on securities sold are determined on the basis of identified cost. Dividend income is recorded on the ex-dividend date, except for certain dividends from foreign securities where the ex-dividend date may have passed, which are recorded as soon as the Fund is informed of the ex-dividend date. Non-cash dividends included in dividend income, if any, are recorded at the fair market value of the securities received. Distributions received on securities that represent a return of capital or capital gain are recorded as a reduction of cost of investments and/or as a realized gain. The Fund estimates the components of distributions received that may be considered return of capital distributions or capital gain distributions. Large, non-recurring dividends recognized by the Fund are presented separately on the Statement of Operations as "Special Dividends" and the impact of these dividends is presented in the Financial Highlights. Interest income and distributions from the Fidelity Central Funds are accrued as earned. Interest income includes coupon interest and amortization of premium and accretion of discount on debt securities. Investment income is recorded net of foreign taxes withheld where recovery of such taxes is uncertain.
Expenses. Expenses directly attributable to a fund are charged to that fund. Expenses attributable to more than one fund are allocated among the respective funds on the basis of relative net assets or other appropriate methods. Expense estimates are accrued in the period to which they relate and adjustments are made when actual amounts are known.
Income Tax Information and Distributions to Shareholders. Each year, the Fund intends to qualify as a regulated investment company, including distributing substantially all of its taxable income and realized gains under Subchapter M of the Internal Revenue Code and filing its U.S. federal tax return. As a result, no provision for income taxes is required. As of October 31, 2011, the Fund did not have any unrecognized tax benefits in the financial statements. A fund's federal tax return is subject to examination by the Internal Revenue Service (IRS) for a period of three years. Foreign taxes are provided for based on the Fund's understanding of the tax rules and rates that exist in the foreign markets in which it invests.
Distributions are declared and recorded on the ex-dividend date. Income dividends and capital gain distributions are declared separately for each class. Income and capital gain distributions are determined in accordance with income tax regulations, which may differ from GAAP.
Capital accounts within the financial statements are adjusted for permanent book-tax differences. These adjustments have no impact on net assets or the results of operations. Temporary book-tax differences will reverse in a subsequent period.
Annual Report
3. Significant Accounting Policies - continued
Income Tax Information and Distributions to Shareholders - continued
Book-tax differences are primarily due to foreign currency transactions, passive foreign investment companies (PFIC), capital loss carry forwards and losses deferred due to wash sales.
The federal tax cost of investment securities and unrealized appreciation (depreciation) as of period end were as follows:
Gross unrealized appreciation | $ 21,839,274 |
Gross unrealized depreciation | (14,802,561) |
Net unrealized appreciation (depreciation) on securities and other investments | $ 7,036,713 |
| |
Tax Cost | $ 135,836,155 |
The tax-based components of distributable earnings as of period end were as follows:
Undistributed ordinary income | $ 2,747,743 |
Capital loss carryforward | $ (11,266,491) |
Net unrealized appreciation (depreciation) | $ 7,034,254 |
Under the recently enacted Regulated Investment Company Modernization Act of 2010 (the Act), the Fund will be permitted to carry forward capital losses incurred in taxable years beginning after December 22, 2010 for an unlimited period. However, any losses incurred during those future taxable years will be required to be utilized prior to any losses incurred in pre-enactment taxable years, which generally expire after eight years from when they are incurred. Additionally, post-enactment capital losses that are carried forward will retain their character as either short-term or long-term capital losses rather than being considered all short-term as under previous law. The Fund's first fiscal year end subject to the Act will be October 31, 2012.
The tax character of distributions paid was as follows:
| October 31, 2011 | October 31, 2010 |
Ordinary Income | $ 2,137,978 | $ 1,207,434 |
Short-Term Trading (Redemption) Fees. Shares held by investors in the Fund less than 90 days are subject to a redemption fee equal to 1.50% of the net asset value of shares redeemed. All redemption fees, which reduce the proceeds of the shareholder redemption, are retained by the Fund and accounted for as an addition to paid in capital.
Annual Report
Notes to Financial Statements - continued
3. Significant Accounting Policies - continued
New Accounting Pronouncement. In May 2011, the Financial Accounting Standards Board issued Accounting Standard Update No. 2011-04, Fair Value Measurement (Topic 820) - Amendments to Achieve Common Fair Value Measurement and Disclosure Requirements in U.S. GAAP and IFRSs. The update changes the wording used to describe the requirements in GAAP for measuring fair value and for disclosing information about fair value measurements. The update is effective during interim and annual periods beginning after December 15, 2011. Management is currently evaluating the impact of the update's adoption on the Fund's financial statement disclosures.
4. Purchases and Sales of Investments.
Purchases and sales of securities other than short-term securities, aggregated $91,399,924 and $94,303,247, respectively.
5. Fees and Other Transactions with Affiliates.
Management Fee. FMR and its affiliates provide the Fund with investment management related services for which the Fund pays a monthly management fee. The management fee is the sum of an individual fund fee rate that is based on an annual rate of .55% of the Fund's average net assets and a group fee rate that averaged .26% during the period. The group fee rate is based upon the average net assets of all the mutual funds advised by FMR. The group fee rate decreases as assets under management increase and increases as assets under management decrease. For the period, the total annual management fee rate was .81% of the Fund's average net assets.
Distribution and Service Plan Fees. In accordance with Rule 12b-1 of the 1940 Act, the Fund has adopted separate Distribution and Service Plans for each class of shares. Certain classes pay Fidelity Distributors Corporation (FDC), an affiliate of FMR, separate Distribution and Service Fees, each of which is based on an annual percentage of each class' average net assets. In addition, FDC may pay financial intermediaries for selling shares of the Fund and providing shareholder support services. For the period, the Distribution and Service Fee rates, total fees and amounts retained by FDC were as follows:
| Distribution
Fee | Service
Fee | Total Fees | Retained
by FDC |
Class A | -% | .25% | $ 30,466 | $ 2,908 |
Class T | .25% | .25% | 18,756 | 28 |
Class B | .75% | .25% | 7,308 | 5,498 |
Class C | .75% | .25% | 71,641 | 32,384 |
| | | $ 128,171 | $ 40,818 |
Annual Report
5. Fees and Other Transactions with Affiliates - continued
Sales Load. FDC may receive a front-end sales charge of up to 5.75% for selling Class A shares, and 3.50% for selling Class T shares, some of which is paid to financial intermediaries for selling shares of the Fund. Depending on the holding period, FDC may receive contingent deferred sales charges levied on Class A, Class T, Class B, and Class C redemptions. The deferred sales charges range from 5% to 1% for Class B, 1% for Class C, 1.00% for certain purchases of Class A shares and .25% for certain purchases of Class T shares.
For the period, sales charge amounts retained by FDC were as follows:
| Retained
by FDC |
Class A | $ 11,710 |
Class T | 2,792 |
Class B* | 2,575 |
Class C* | 1,417 |
| $ 18,494 |
* When Class B and Class C shares are initially sold, FDC pays commissions from its own resources to financial intermediaries through which the sales are made.
Transfer Agent Fees. Fidelity Investments Institutional Operations Company, Inc. (FIIOC), an affiliate of FMR, is the transfer, dividend disbursing and shareholder servicing agent for each class of the Fund. FIIOC receives account fees and asset-based fees that vary according to the account size and type of account of the shareholders of the respective classes of the Fund. FIIOC pays for typesetting, printing and mailing of shareholder reports, except proxy statements. For the period, transfer agent fees for each class were as follows:
| Amount | % of
Average
Net Assets |
Class A | $ 34,413 | .28 |
Class T | 11,646 | .31 |
Class B | 2,238 | .31 |
Class C | 20,980 | .29 |
Emerging Europe, Middle East, Africa (EMEA) | 410,243 | .28 |
Institutional Class | 18,876 | .20 |
| $ 498,396 | |
Accounting and Security Lending Fees. Fidelity Service Company, Inc. (FSC), an affiliate of FMR, maintains the Fund's accounting records. The accounting fee is based on the level of average net assets for the month. Under a separate contract, FSC administers the security lending program. The security lending fee is based on the number and duration of lending transactions.
Annual Report
Notes to Financial Statements - continued
5. Fees and Other Transactions with Affiliates - continued
Brokerage Commissions. The Fund placed a portion of its portfolio transactions with brokerage firms which are affiliates of the investment adviser. The commissions paid to these affiliated firms were $145 for the period.
6. Committed Line of Credit.
The Fund participates with other funds managed by FMR or an affiliate in a $4.0 billion credit facility (the "line of credit") to be utilized for temporary or emergency purposes to fund shareholder redemptions or for other short-term liquidity purposes. The Fund has agreed to pay commitment fees on its pro-rata portion of the line of credit, which amounted to $554 and is reflected in Miscellaneous expenses on the Statement of Operations. During the period, there were no borrowings on this line of credit.
7. Security Lending.
The Fund lends portfolio securities through a lending agent from time to time in order to earn additional income. For equity securities, a lending agent is used and may loan securities to certain qualified borrowers, including Fidelity Capital Markets (FCM), a broker-dealer affiliated with the Fund. On the settlement date of the loan, the Fund receives collateral (in the form of U.S. Treasury obligations, letters of credit and/or cash) against the loaned securities and maintains collateral in an amount not less than 100% of the market value of the loaned securities during the period of the loan. The market value of the loaned securities is determined at the close of business of the Fund and any additional required collateral is delivered to the Fund on the next business day. If the borrower defaults on its obligation to return the securities loaned because of insolvency or other reasons, a fund could experience delays and costs in recovering the securities loaned or in gaining access to the collateral. Any cash collateral received is invested in the Fidelity Securities Lending Cash Central Fund. At period end, there were no security loans outstanding. Security lending income represents the income earned on investing cash collateral, less rebates paid to borrowers and any lending agent fees associated with the loan, plus any premium payments received for lending certain types of securities. Security lending income is presented in the Statement of Operations as a component of income from Fidelity Central Funds. Total security lending income during the period amounted to $25. During the period, there were no securities loaned to FCM.
8. Expense Reductions.
FMR voluntarily agreed to reimburse each class to the extent annual operating expenses exceeded certain levels of average net assets as noted in the table below. Some expenses, for example interest expense, including commitment fees, are excluded from this reimbursement.
Annual Report
8. Expense Reductions - continued
The following classes were in reimbursement during the period:
| Expense
Limitations | Reimbursement
from adviser |
Class A | 1.50%-1.65%* | $ 4,071 |
Class T | 1.75%-1.90%* | 1,321 |
Class B | 2.25%-2.40%* | 321 |
Class C | 2.25%-2.40%* | 2,211 |
Emerging Europe, Middle East, Africa (EMEA) | 1.25%-1.40%* | 56,199 |
Institutional Class | 1.25%-1.40%* | 1,658 |
| | $ 65,781 |
* Expense limitation in effect at period end.
Many of the brokers with whom FMR places trades on behalf of the Fund provided services to the Fund in addition to trade execution. These services included payments of certain expenses on behalf of the Fund totaling $94,313 for the period.
9. Distributions to Shareholders.
Distributions to shareholders of each class were as follows:
Years ended October 31, | 2011 | 2010 |
From net investment income | | |
Class A | $ 97,896 | $ 26,924 |
Class T | 26,168 | 5,586 |
Class B | 1,907 | - |
Class C | 32,267 | 2,308 |
Emerging Europe, Middle East, Africa (EMEA) | 1,585,636 | 748,050 |
Institutional Class | 91,487 | 33,147 |
Total | $ 1,835,361 | $ 816,015 |
From net realized gain | | |
Class A | $ 18,012 | $ 15,761 |
Class T | 5,690 | 5,156 |
Class B | 902 | 1,284 |
Class C | 9,924 | 9,232 |
Emerging Europe, Middle East, Africa (EMEA) | 253,422 | 345,254 |
Institutional Class | 14,667 | 14,732 |
Total | $ 302,617 | $ 391,419 |
Annual Report
Notes to Financial Statements - continued
10. Share Transactions.
Transactions for each class of shares were as follows:
| Shares | Dollars |
Years ended October 31, | 2011 | 2010 | 2011 | 2010 |
Class A | | | | |
Shares sold | 827,297 | 750,400 | $ 7,697,437 | $ 5,978,580 |
Reinvestment of distributions | 10,020 | 5,604 | 92,483 | 40,683 |
Shares redeemed | (725,856) | (299,775) | (6,651,188) | (2,302,163) |
Net increase (decrease) | 111,461 | 456,229 | $ 1,138,732 | $ 3,717,100 |
Class T | | | | |
Shares sold | 164,342 | 258,490 | $ 1,527,510 | $ 2,070,251 |
Reinvestment of distributions | 3,447 | 1,476 | 31,848 | 10,717 |
Shares redeemed | (94,003) | (127,308) | (862,784) | (967,322) |
Net increase (decrease) | 73,786 | 132,658 | $ 696,574 | $ 1,113,646 |
Class B | | | | |
Shares sold | 9,372 | 50,154 | $ 87,632 | $ 403,463 |
Reinvestment of distributions | 285 | 173 | 2,673 | 1,261 |
Shares redeemed | (36,653) | (66,507) | (325,442) | (516,486) |
Net increase (decrease) | (26,996) | (16,180) | $ (235,137) | $ (111,762) |
Class C | | | | |
Shares sold | 438,284 | 353,916 | $ 4,066,195 | $ 2,814,751 |
Reinvestment of distributions | 4,100 | 1,559 | 37,820 | 11,306 |
Shares redeemed | (213,656) | (147,366) | (1,892,778) | (1,102,603) |
Net increase (decrease) | 228,728 | 208,109 | $ 2,211,237 | $ 1,723,454 |
Emerging Europe, Middle East, Africa (EMEA) | | | | |
Shares sold | 7,381,313 | 10,587,461 | $ 68,910,601 | $ 85,331,520 |
Reinvestment of distributions | 187,137 | 144,800 | 1,730,170 | 1,051,250 |
Shares redeemed | (9,520,946) | (9,457,558) | (86,802,311) | (72,517,018) |
Net increase (decrease) | (1,952,496) | 1,274,703 | $ (16,161,540) | $ 13,865,752 |
Institutional Class | | | | |
Shares sold | 597,666 | 319,437 | $ 5,560,036 | $ 2,551,378 |
Reinvestment of distributions | 1,263 | 825 | 11,681 | 5,986 |
Shares redeemed | (484,423) | (105,236) | (4,318,317) | (819,955) |
Net increase (decrease) | 114,506 | 215,026 | $ 1,253,400 | $ 1,737,409 |
Annual Report
11. Other.
The Fund's organizational documents provide former and current trustees and officers with a limited indemnification against liabilities arising in connection with the performance of their duties to the Fund. In the normal course of business, the Fund may also enter into contracts that provide general indemnifications. The Fund's maximum exposure under these arrangements is unknown as this would be dependent on future claims that may be made against the Fund. The risk of material loss from such claims is considered remote.
At the end of the period, FMR or its affiliates were the owners of record of 10% of the total outstanding shares of the Fund.
Annual Report
To the Trustees of Fidelity Investment Trust and Shareholders of Fidelity Emerging Europe, Middle East, Africa (EMEA) Fund:
We have audited the accompanying statement of assets and liabilities of Fidelity Emerging Europe, Middle East, Africa (EMEA) Fund (the Fund), a fund of Fidelity Investment Trust, including the schedule of investments, as of October 31, 2011, and the related statement of operations for the year then ended, the statement of changes in net assets for each of the two years in the period then ended, and the financial highlights for each of the three years in the period then ended and the period May 8, 2008 (commencement of operations) to October 31, 2008. These financial statements and financial highlights are the responsibility of the Fund's management. Our responsibility is to express an opinion on these financial statements and financial highlights based on our audits.
We conducted our audits in accordance with the standards of the Public Company Accounting Oversight Board (United States). Those standards require that we plan and perform the audit to obtain reasonable assurance about whether the financial statements and financial highlights are free of material misstatement. The Fund is not required to have, nor were we engaged to perform, an audit of its internal control over financial reporting. Our audits included consideration of internal control over financial reporting as a basis for designing audit procedures that are appropriate in the circumstances, but not for the purpose of expressing an opinion on the effectiveness of the Fund's internal control over financial reporting. Accordingly, we express no such opinion. An audit also includes examining, on a test basis, evidence supporting the amounts and disclosures in the financial statements, assessing the accounting principles used and significant estimates made by management, as well as evaluating the overall financial statement presentation. Our procedures included confirmation of securities owned as of October 31, 2011, by correspondence with the custodians and brokers; where replies were not received from brokers, we performed other auditing procedures. We believe that our audits provide a reasonable basis for our opinion.
In our opinion, the financial statements and financial highlights referred to above present fairly, in all material respects, the financial position of Fidelity Emerging Europe, Middle East, Africa (EMEA) Fund as of October 31, 2011, the results of its operations for the year then ended, the changes in its net assets for each of the two years in the period then ended, and the financial highlights for each of the three years in the period then ended and the period May 8, 2008 (commencement of operations) to October 31, 2008, in conformity with accounting principles generally accepted in the United States of America.
DELOITTE & TOUCHE LLP
Boston, Massachusetts
December 15, 2011
Annual Report
The Trustees, Members of the Advisory Board, and executive officers of the trust and fund, as applicable, are listed below. The Board of Trustees governs the fund and is responsible for protecting the interests of shareholders. The Trustees are experienced executives who meet periodically throughout the year to oversee the fund's activities, review contractual arrangements with companies that provide services to the fund, oversee management of the risks associated with such activities and contractual arrangements, and review the fund's performance. Except for James C. Curvey, each of the Trustees oversees 226 funds advised by FMR or an affiliate. Mr. Curvey oversees 429 funds advised by FMR or an affiliate.
The Trustees hold office without limit in time except that (a) any Trustee may resign; (b) any Trustee may be removed by written instrument, signed by at least two-thirds of the number of Trustees prior to such removal; (c) any Trustee who requests to be retired or who has become incapacitated by illness or injury may be retired by written instrument signed by a majority of the other Trustees; and (d) any Trustee may be removed at any special meeting of shareholders by a two-thirds vote of the outstanding voting securities of the trust. Each Trustee who is not an interested person (as defined in the 1940 Act) (Independent Trustee), shall retire not later than the last day of the calendar year in which his or her 75th birthday occurs. The Independent Trustees may waive this mandatory retirement age policy with respect to individual Trustees. The executive officers and Advisory Board Members hold office without limit in time, except that any officer and Advisory Board Member may resign or may be removed by a vote of a majority of the Trustees at any regular meeting or any special meeting of the Trustees. Except as indicated, each individual has held the office shown or other offices in the same company for the past five years.
Experience, Skills, Attributes, and Qualifications of the Fund's Trustees. The Governance and Nominating Committee has adopted a statement of policy that describes the experience, qualifications, attributes, and skills that are necessary and desirable for potential Independent Trustee candidates (Statement of Policy). The Board believes that each Trustee satisfied at the time he or she was initially elected or appointed a Trustee, and continues to satisfy, the standards contemplated by the Statement of Policy. The Governance and Nominating Committee also engages professional search firms to help identify potential Independent Trustee candidates who have the experience, qualifications, attributes, and skills consistent with the Statement of Policy. From time to time, additional criteria based on the composition and skills of the current Independent Trustees, as well as experience or skills that may be appropriate in light of future changes to board composition, business conditions, and regulatory or other developments, have also been considered by the professional search firms and the Governance and Nominating Committee. In addition, the Board takes into account the Trustees' commitment and participation in Board and committee meetings, as well as their leadership of standing and ad hoc committees throughout their tenure.
In determining that a particular Trustee was and continues to be qualified to serve as a Trustee, the Board has considered a variety of criteria, none of which, in isolation, was controlling. The Board believes that, collectively, the Trustees have balanced and diverse experience, qualifications, attributes, and skills, which allow the Board to operate effectively in governing the fund and protecting the interests of shareholders. Information about the specific experience, skills, attributes, and qualifications of each Trustee, which in each case led to the Board's conclusion that the Trustee should serve (or continue to serve) as a trustee of the fund, is provided below.
Annual Report
Trustees and Officers - continued
Board Structure and Oversight Function. James C. Curvey is an interested person (as defined in the 1940 Act) and currently serves as Acting Chairman. The Trustees have determined that an interested Chairman is appropriate and benefits shareholders because an interested Chairman has a personal and professional stake in the quality and continuity of services provided to the fund. Independent Trustees exercise their informed business judgment to appoint an individual of their choosing to serve as Chairman, regardless of whether the Trustee happens to be independent or a member of management. The Independent Trustees have determined that they can act independently and effectively without having an Independent Trustee serve as Chairman and that a key structural component for assuring that they are in a position to do so is for the Independent Trustees to constitute a substantial majority for the Board. The Independent Trustees also regularly meet in executive session. Ned C. Lautenbach serves as Chairman of the Independent Trustees and as such (i) acts as a liaison between the Independent Trustees and management with respect to matters important to the Independent Trustees and (ii) with management prepares agendas for Board meetings.
Fidelity funds are overseen by different Boards of Trustees. The fund's Board oversees Fidelity's equity and high income funds and another Board oversees Fidelity's investment-grade bond, money market, and asset allocation funds. The asset allocation funds may invest in Fidelity funds overseen by the fund's Board. The use of separate Boards, each with its own committee structure, allows the Trustees of each group of Fidelity funds to focus on the unique issues of the funds they oversee, including common research, investment, and operational issues. On occasion, the separate Boards establish joint committees to address issues of overlapping consequences for the Fidelity funds overseen by each Board.
The Trustees operate using a system of committees to facilitate the timely and efficient consideration of all matters of importance to the Trustees, the fund, and fund shareholders and to facilitate compliance with legal and regulatory requirements and oversight of the fund's activities and associated risks. The Board, acting through its committees, has charged FMR and its affiliates with (i) identifying events or circumstances the occurrence of which could have demonstrably adverse effects on the fund's business and/or reputation; (ii) implementing processes and controls to lessen the possibility that such events or circumstances occur or to mitigate the effects of such events or circumstances if they do occur; and (iii) creating and maintaining a system designed to evaluate continuously business and market conditions in order to facilitate the identification and implementation processes described in (i) and (ii) above. Because the day-to-day operations and activities of the fund are carried out by or through FMR, its affiliates and other service providers, the fund's exposure to risks is mitigated but not eliminated by the processes overseen by the Trustees. While each of the Board's committees has responsibility for overseeing different aspects of the fund's activities, oversight is exercised primarily through the Operations, Audit, and Compliance Committees. In addition, the Independent Trustees have worked with FMR to enhance the Board's oversight of investment and financial risks, legal and regulatory risks, technology risks, and operational risks, including the development of additional risk reporting to the Board. For example, a working group comprised of Independent Trustees and FMR has worked and continues to work to review the Fidelity funds' valuation-related activities, reporting and risk management. Appropriate personnel, including but not limited to the fund's Chief Compliance Officer (CCO), FMR's internal auditor, the independent accountants, the fund's Treasurer and portfolio management personnel, make periodic reports to the Board's committees, as appropriate, including an annual review of FMR's risk management program for the Fidelity funds. The responsibilities of each standing committee, including their oversight responsibilities, are described further under "Standing Committees of the Fund's Trustees."
Annual Report
The fund's Statement of Additional Information (SAI) includes more information about the Trustees. To request a free copy, call Fidelity at 1-800-544-8544.
Interested Trustees*:
Correspondence intended for each Trustee who is an interested person may be sent to Fidelity Investments, 82 Devonshire Street, Boston, Massachusetts 02109.
Name, Age; Principal Occupations and Other Relevant Experience+ |
James C. Curvey (76) |
| Year of Election or Appointment: 2007 Mr. Curvey is Trustee and Acting Chairman of the Board of Trustees of certain Trusts. Mr. Curvey also serves as Trustee (2007-present) of other investment companies advised by FMR. Mr. Curvey is a Director of Fidelity Investments Money Management, Inc. (2009-present), Director of Fidelity Research & Analysis Co. (2009-present) and Director of FMR and FMR Co., Inc. (2007-present). Mr. Curvey is also Vice Chairman (2007-present) and Director of FMR LLC. In addition, Mr. Curvey serves as an Overseer for the Boston Symphony Orchestra and a member of the Trustees of Villanova University. Previously, Mr. Curvey was the Vice Chairman (2006-2007) and Director (2000-2007) of FMR Corp. |
Ronald P. O'Hanley (54) |
| Year of Election or Appointment: 2011 Mr. O'Hanley is Director of FMR Co., Inc. (2010-present), Director of Fidelity Investments Money Management, Inc. (2010-present), Director of Fidelity Research & Analysis Company (2010-present), President of Fidelity Asset Management and Corporate Services and a member of Fidelity's Executive Committee (2010-present). Previously, Mr. O'Hanley served as President and Chief Executive Officer of BNY Mellon Asset Management (2007-2010). Mr. O'Hanley also served as Vice Chairman of Bank New York Mellon Corp. and a member of that firm's Executive Committee. Prior to the 2007 merger of The Bank of New York and Mellon Financial Corporation, he was Vice Chairman of Mellon Financial Corporation and President and Chief Executive Officer of Mellon Asset Management. He joined Mellon in February 1997. Mr. O'Hanley currently serves as Chairman of the Boston Public Library Foundation Board of Directors and sits on the Board of Directors of Beth Israel Deaconess Medical Center, the Board of Trustees of the Marine Biological Laboratory and the Advisory Board of the Maxwell School of Citizenship and Public Administration at Syracuse University. Mr. O'Hanley also chairs the Council on Asset Management for the Financial Services Roundtable and is a member of the Board of Directors of Institutional Investor's U.S. Institute. |
* Trustees have been determined to be "Interested Trustees" by virtue of, among other things, their affiliation with the trust or various entities under common control with FMR.
+ The information above includes each Trustee's principal occupation during the last five years and other information relating to the experience, attributes, and skills relevant to each Trustee's qualifications to serve as a Trustee, which led to the conclusion that each Trustee should serve as a Trustee for the fund.
Annual Report
Independent Trustees:
Correspondence intended for each Independent Trustee (that is, the Trustees other than the Interested Trustees) may be sent to Fidelity Investments, P.O. Box 55235, Boston, Massachusetts 02205-5235.
Name, Age; Principal Occupations and Other Relevant Experience+ |
Dennis J. Dirks (63) |
| Year of Election or Appointment: 2005 Prior to his retirement in May 2003, Mr. Dirks was Chief Operating Officer and a member of the Board of The Depository Trust & Clearing Corporation (DTCC). He also served as President, Chief Operating Officer, and Board member of The Depository Trust Company (DTC) and President and Board member of the National Securities Clearing Corporation (NSCC). In addition, Mr. Dirks served as Chief Executive Officer and Board member of the Government Securities Clearing Corporation, Chief Executive Officer and Board member of the Mortgage-Backed Securities Clearing Corporation, as a Trustee and a member of the Finance Committee of Manhattan College (2005-2008), and as a Trustee and a member of the Finance Committee of AHRC of Nassau County (2006-2008). Mr. Dirks is a member of the Independent Directors Council (IDC) Governing Council (2010-Present) and Board of Directors for The Brookville Center for Children's Services, Inc. (2009-present). |
Alan J. Lacy (58) |
| Year of Election or Appointment: 2008 Mr. Lacy serves as Senior Adviser (2007-present) of Oak Hill Capital Partners, L.P. (private equity). Mr. Lacy also served as Chief Executive Officer (2000-2005) and Vice Chairman (2005-2006) of Sears Holdings Corporation and Sears, Roebuck and Co. (retail). In addition, Mr. Lacy serves as a member of the Board of Directors of Dave & Buster's, Inc. (restaurant and entertainment complexes, 2010-present), The Hillman Companies, Inc. (hardware wholesalers, 2010-present), and Bristol-Myers Squibb Company (global pharmaceuticals, 2007-present). Mr. Lacy is a member of the Board of Trustees of The National Parks Conservation Association (2006-Present). Previously, Mr. Lacy served as Chairman of the Board of Trustees of the National Parks Conservation Association (2008-2011) and as a member of the Board of Directors for the Western Union Company (global money transfer, 2006-2011). |
Ned C. Lautenbach (67) |
| Year of Election or Appointment: 2000 Mr. Lautenbach is Chairman of the Independent Trustees of the Equity and High Income Funds (2006-present). Mr. Lautenbach currently serves as the Lead Director of the Eaton Corporation Board of Directors (diversified industrial, 1997-present). Mr. Lautenbach is also a member of the Board of Directors of the Philharmonic Center for the Arts in Naples, Florida (1999-present); a member of the Board of Trustees of Fairfield University (2005-present); and a member of the Council on Foreign Relations (1994-present). Previously, Mr. Lautenbach was a Partner/Advisory Partner at Clayton, Dubilier & Rice, LLC (private equity investment, 1998-2010), as well as a Director of Sony Corporation (2006-2007). |
Joseph Mauriello (67) |
| Year of Election or Appointment: 2008 Prior to his retirement in January 2006, Mr. Mauriello served in numerous senior management positions including Deputy Chairman and Chief Operating Officer (2004-2005), and Vice Chairman of Financial Services (2002-2004) of KPMG LLP US (professional services, 1965-2005). Mr. Mauriello currently serves as a member of the Board of Directors of XL Group plc. (global insurance and re-insurance, 2006-present) and of Arcadia Resources Inc. (health care services and products, 2007-present). Previously, Mr. Mauriello served as a Director of the Hamilton Funds of the Bank of New York (2006-2007). |
Robert W. Selander (61) |
| Year of Election or Appointment: 2011 Previously, Mr. Selander served as a Member of the Advisory Board of Fidelity's Equity and High Income Funds (2011), Executive Vice Chairman (2010), Chief Executive Officer (2009-2010), and President and Chief Executive Officer (1997-2009) of Mastercard, Inc. |
Cornelia M. Small (67) |
| Year of Election or Appointment: 2005 Ms. Small is a member of the Board of Directors of the Teagle Foundation (2009-present). Ms. Small is also a member of the Investment Committee, and Chair (2008-present) and a member of the Board of Trustees of Smith College. In addition, Ms. Small serves on the Investment Committee of the Berkshire Taconic Community Foundation (2008-present). Previously, Ms. Small served as Chairperson of the Investment Committee (2002-2008) of Smith College. In addition, Ms. Small served as Chief Investment Officer, Director of Global Equity Investments, and a member of the Board of Directors of Scudder, Stevens & Clark and Scudder Kemper Investments. |
William S. Stavropoulos (72) |
| Year of Election or Appointment: 2001 Mr. Stavropoulos is Vice Chairman of the Independent Trustees of the Equity and High Income Funds (2006-present). Mr. Stavropoulos serves as President and Founder of the Michigan Baseball Foundation, the Great Lakes Loons (2007-present). Mr. Stavropoulos is Chairman Emeritus of the Board of Directors of The Dow Chemical Company, where he previously served in numerous senior management positions, including President, CEO (1995-2000; 2002-2004), Chairman of the Executive Committee (2000-2006), and as a member of the Board of Directors (1990-2006). Currently, Mr. Stavropoulos is Chairman of Univar (global distributor of commodity and specialty chemicals, 2010-present), a Director of Teradata Corporation (data warehousing and technology solutions, 2008-present), Chemical Financial Corporation, Maersk Inc. (industrial conglomerate), Tyco International, Inc. (multinational manufacturing and services, 2007-present), and a member of the Advisory Board for Metalmark Capital (private equity investment, 2005-present). Mr. Stavropoulos is a special advisor to Clayton, Dubilier & Rice, LLC (private equity investment). In addition, Mr. Stavropoulos is a member of the University of Notre Dame Advisory Council for the College of Science. |
David M. Thomas (62) |
| Year of Election or Appointment: 2008 Previously, Mr. Thomas served as Executive Chairman (2005-2006) and Chairman and Chief Executive Officer (2000-2005) of IMS Health, Inc. (pharmaceutical and healthcare information solutions). In addition, Mr. Thomas serves as a member of the Board of Directors of Fortune Brands, Inc. (consumer products), and Interpublic Group of Companies, Inc. (marketing communication, 2004-present). |
Michael E. Wiley (61) |
| Year of Election or Appointment: 2008 Mr. Wiley also serves as a Director of Asia Pacific Exploration Consolidated (international oil and gas exploration and production, 2008-present). Mr. Wiley serves as a Director of Tesoro Corporation (independent oil refiner and marketer, 2005-present), and a Director of Bill Barrett Corporation (exploration and production, 2005-present). In addition, Mr. Wiley also serves as a Director of Post Oak Bank (privately-held bank, 2004-present). Previously, Mr. Wiley served as a member of the Board of Trustees of the University of Tulsa (2000-2006; 2007-2010), as a Senior Energy Advisor of Katzenbach Partners, LLC (consulting, 2006-2007), as an Advisory Director of Riverstone Holdings (private investment), Chairman, President, and CEO of Baker Hughes, Inc. (oilfield services, 2000-2004), and as Director of Spinnaker Exploration Company (exploration and production, 2001-2005). |
Annual Report
Trustees and Officers - continued
+ The information above includes each Trustee's principal occupation during the last five years and other information relating to the experience, attributes, and skills relevant to each Trustee's qualifications to serve as a Trustee, which led to the conclusion that each Trustee should serve as a Trustee for the fund.
Advisory Board Members and Executive Officers:
Correspondence intended for each executive officer, Edward C. Johnson 3d, and Peter S. Lynch may be sent to Fidelity Investments, 82 Devonshire Street, Boston, Massachusetts 02109.
Name, Age; Principal Occupation |
Edward C. Johnson 3d (81) |
| Year of Election or Appointment: 2011 Member of the Advisory Board of Fidelity's Equity and High Income Funds. Mr. Johnson serves as Chief Executive Officer, Chairman, and a Director of FMR LLC, and also serves as Chairman and Director of FIL Limited. Previously, Mr. Johnson served as a Trustee and Chairman of the Board of certain Fidelity Trusts, Chairman and a Director of FMR, Chairman and a Director of FMR Co., Inc., and President of FMR LLC (2006-2007). |
Peter S. Lynch (67) |
| Year of Election or Appointment: 2003 Member of the Advisory Board of Fidelity's Equity and High Income Funds. Mr. Lynch is Vice Chairman and a Director of FMR and FMR Co., Inc. In addition, Mr. Lynch serves as a Trustee of Boston College and as the Chairman of the Inner-City Scholarship Fund. Previously, Mr. Lynch served on the Special Olympics International Board of Directors (1997-2006). |
Kenneth B. Robins (42) |
| Year of Election or Appointment: 2008 President and Treasurer of Fidelity's Equity and High Income Funds. Mr. Robins also serves as President and Treasurer (2010-present) and Assistant Treasurer (2009-present) of other Fidelity funds and is an employee of Fidelity Investments (2004-present). Previously, Mr. Robins served as Deputy Treasurer of the Fidelity funds (2005-2008) and Treasurer and Chief Financial Officer of The North Carolina Capital Management Trust: Cash and Term Portfolios (2006-2008). |
Bruce T. Herring (46) |
| Year of Election or Appointment: 2006 Vice President of certain Equity Funds. Mr. Herring also serves as Chief Investment Officer and Director of Fidelity Management & Research (U.K.) Inc. (2010-present) and Group Chief Investments Officer of FMR. Previously, Mr. Herring served as Vice President (2005-2006) and Senior Vice President (2006-2007) of Fidelity Management & Research Company, Vice President of FMR Co., Inc. (2001-2007) and as a portfolio manager for Fidelity U.S. Equity Funds. |
Brian B. Hogan (47) |
| Year of Election or Appointment: 2009 Vice President of Equity and High Income Funds. Mr. Hogan also serves as President of FMR's Equity Division (2009-present). Previously, Mr. Hogan served as Senior Vice President, Equity Research of FMR (2006-2009) and as a portfolio manager. |
Scott C. Goebel (43) |
| Year of Election or Appointment: 2008 Secretary and Chief Legal Officer (CLO) of the Fidelity funds. Mr. Goebel also serves as Secretary of Fidelity Investments Money Management, Inc. (FIMM) (2010-present) and Fidelity Research and Analysis Company (FRAC) (2010-present); Secretary and CLO of The North Carolina Capital Management Trust: Cash and Term Portfolios (2008-present); General Counsel, Secretary, and Senior Vice President of FMR (2008-present) and FMR Co., Inc. (2008-present); employed by FMR LLC or an affiliate (2001-present); Chief Legal Officer of Fidelity Management & Research (Hong Kong) Limited (2008-present) and Assistant Secretary of Fidelity Management & Research (Japan) Inc. (2008-present), and Fidelity Management & Research (U.K.) Inc. (2008-present). Previously, Mr. Goebel served as Assistant Secretary of FIMM (2008-2010), FRAC (2008-2010), and the Funds (2007-2008) and as Vice President and Secretary of Fidelity Distributors Corporation (FDC) (2005-2007). |
William C. Coffey (42) |
| Year of Election or Appointment: 2009 Assistant Secretary of Fidelity's Equity and High Income Funds. Mr. Coffey also serves as Senior Vice President and Deputy General Counsel of FMR LLC (2010-present), and is an employee of Fidelity Investments. Previously, Mr. Coffey served as Vice President and Associate General Counsel of FMR LLC (2005-2009). |
Holly C. Laurent (57) |
| Year of Election or Appointment: 2008 Anti-Money Laundering (AML) Officer of the Fidelity funds. Ms. Laurent also serves as AML Officer of The North Carolina Capital Management Trust: Cash and Term Portfolios (2008-present) and is an employee of Fidelity Investments. Previously, Ms. Laurent was Senior Vice President and Head of Legal for Fidelity Business Services India Pvt. Ltd. (2006-2008), and Senior Vice President, Deputy General Counsel and Group Head for FMR LLC (2005-2006). |
Christine Reynolds (53) |
| Year of Election or Appointment: 2008 Chief Financial Officer of the Fidelity funds. Ms. Reynolds became President of Fidelity Pricing and Cash Management Services (FPCMS) in August 2008. Ms. Reynolds served as Chief Operating Officer of FPCMS (2007-2008). Previously, Ms. Reynolds served as President, Treasurer, and Anti-Money Laundering officer of the Fidelity funds (2004-2007). |
Kenneth A. Rathgeber (64) |
| Year of Election or Appointment: 2004 Chief Compliance Officer of Fidelity's Equity and High Income Funds. Mr. Rathgeber is Chief Compliance Officer of Fidelity Management & Research (Hong Kong) Limited (2008-present), Fidelity Management & Research (Japan) Inc. (2008-present), FMR (2005-present), FMR Co., Inc. (2005-present), Fidelity Management & Research (U.K.) Inc. (2005-present), Fidelity Research & Analysis Company (2005-present), Fidelity Investments Money Management, Inc. (2005-present), Pyramis Global Advisors, LLC (2005-present), and Strategic Advisers, Inc. (2005-present). |
Jeffrey S. Christian (50) |
| Year of Election or Appointment: 2009 Deputy Treasurer of the Fidelity funds. Mr. Christian is an employee of Fidelity Investments. Previously, Mr. Christian served as Chief Financial Officer (2008-2009) of certain Fidelity funds and Senior Vice President of Fidelity Pricing and Cash Management Services (FPCMS) (2004-2009). |
Joseph F. Zambello (54) |
| Year of Election or Appointment: 2011 Deputy Treasurer of the Fidelity funds. Mr. Zambello is an employee of Fidelity Investments. Previously, Mr. Zambello served as Vice President of FMR's Program Management Group (2009-2011) and Vice President of the Transfer Agent Oversight Group (2005-2009). |
Adrien E. Deberghes (44) |
| Year of Election or Appointment: 2008 Deputy Treasurer of Fidelity's Equity and High Income Funds. Mr. Deberghes also serves as Vice President and Assistant Treasurer of Fidelity Rutland Square Trust II and Fidelity Commonwealth Trust II (2011-present), Assistant Treasurer of other Fidelity funds (2010-present), and is an employee of Fidelity Investments (2008-present). Previously, Mr. Deberghes served as Senior Vice President of Mutual Fund Administration at State Street Corporation (2007-2008), Senior Director of Mutual Fund Administration at Investors Bank & Trust (2005-2007), and Director of Finance for Dunkin' Brands (2000-2005). |
Stephanie J. Dorsey (42) |
| Year of Election or Appointment: 2010 Assistant Treasurer of Fidelity's Equity and High Income Funds. Ms. Dorsey also serves as Deputy Treasurer of other Fidelity funds (2008-present) and is an employee of Fidelity Investments (2008-present). Previously, Ms. Dorsey served as Treasurer (2004-2008) of the JPMorgan Mutual Funds and Vice President (2004-2008) of JPMorgan Chase Bank. |
John R. Hebble (53) |
| Year of Election or Appointment: 2009 Assistant Treasurer of Fidelity's Equity and High Income Funds. Mr. Hebble also serves as President (2011-present), Treasurer, and Chief Financial Officer of The North Carolina Capital Management Trust: Cash and Term Portfolios (2008-present), President and Treasurer of other Fidelity funds (2008-present) and is an employee of Fidelity Investments. |
Gary W. Ryan (53) |
| Year of Election or Appointment: 2005 Assistant Treasurer of the Fidelity funds. Mr. Ryan is an employee of Fidelity Investments. Previously, Mr. Ryan served as Vice President of Fund Reporting in Fidelity Pricing and Cash Management Services (FPCMS) (1999-2005). |
Jonathan Davis (43) |
| Year of Election or Appointment: 2010 Assistant Treasurer of the Fidelity funds. Mr. Davis is also Assistant Treasurer of Fidelity Rutland Square Trust II and Fidelity Commonwealth Trust II. Mr. Davis is an employee of Fidelity Investments. Previously, Mr. Davis served as Vice President and Associate General Counsel of FMR LLC (2003-2010). |
Annual Report
Fidelity Emerging Europe, Middle East, Africa (EMEA) Fund designates 100% of the dividend distributed during the fiscal year, as amounts which may be taken into account as a dividend for purposes of the maximum rate under section 1 (h) (11) of the Internal Revenue Code.
The amounts per share which represent income derived from sources within, and taxes paid to, foreign countries or possessions of the United States are as follows:
| Pay Date | Income | Taxes |
Fidelity Emerging Europe, | 12/13/2010 | $0.050 | $0.0115 |
Middle East, Africa (EMEA) Fund | 12/31/2010 | $0.011 | $0.0000 |
The fund will notify shareholders in January 2012 of amounts for use in preparing 2011 income tax returns.
Annual Report
Board Approval of Investment Advisory Contracts and Management Fees
Fidelity Emerging Europe, Middle East, Africa (EMEA) Fund
Each year, the Board of Trustees, including the Independent Trustees (together, the Board), votes on the renewal of the management contract and sub-advisory agreements (together, the Advisory Contracts) for the fund. The Board, assisted by the advice of fund counsel and Independent Trustees' counsel, requests and considers a broad range of information relevant to the renewal of the Advisory Contracts throughout the year.
The Board meets regularly and considers at each of its meetings factors that are relevant to its annual consideration of the renewal of the fund's Advisory Contracts, including the services and support provided to the fund and its shareholders. The Board has established various standing committees, each composed of Independent Trustees with varying backgrounds, to which the Board has assigned specific subject matter responsibilities in order to enhance effective decision-making by the Board. The Board, acting directly and through its Committees, requests and receives information concerning the annual consideration of the renewal of the fund's Advisory Contracts. The Board also meets as needed to consider matters specifically related to the Board's annual consideration of the renewal of Advisory Contracts. Members of the Board may also meet with trustees of other Fidelity funds through ad hoc joint committees to discuss certain matters relevant to the Fidelity funds.
At its July 2011 meeting, the Board of Trustees, including the Independent Trustees, unanimously determined to renew the fund's Advisory Contracts. In reaching its determination, the Board considered all factors it believed relevant, including (i) the nature, extent, and quality of the services to be provided to the fund and its shareholders (including the investment performance of the fund); (ii) the competitiveness of the fund's management fee and total expense ratio; (iii) the total costs of the services to be provided by and the profits to be realized by Fidelity from its relationship with the fund; (iv) the extent to which economies of scale would be realized as the fund grows; and (v) whether fee levels reflect these economies of scale, if any, for the benefit of fund shareholders.
In considering whether to renew the Advisory Contracts for the fund, the Board reached a determination, with the assistance of fund counsel and Independent Trustees' counsel and through the exercise of its business judgment, that the renewal of the Advisory Contracts is in the best interests of the fund and its shareholders and that the compensation payable under the Advisory Contracts is fair and reasonable. The Board's decision to renew the Advisory Contracts was not based on any single factor, but rather was based on a comprehensive consideration of all the information provided to the Board at its meetings throughout the year. The Board, in reaching its determination to renew the Advisory Contracts, is aware that shareholders in the fund have a broad range of investment choices available to them, including a wide choice among mutual funds offered by Fidelity's competitors, and that the fund's shareholders, who have the opportunity to review and weigh the disclosure provided by the fund in its prospectus and other public disclosures, have chosen to invest in this fund, managed by Fidelity.
Annual Report
Board Approval of Investment Advisory Contracts and
Management Fees - continued
Nature, Extent, and Quality of Services Provided. The Board considered the staffing within the investment adviser, FMR, and the sub-advisers (together, the Investment Advisers), including the backgrounds of the fund's investment personnel and the fund's investment objective and discipline. The Independent Trustees also had discussions with senior management of Fidelity's investment operations and investment groups. The Board considered the structure of the portfolio manager compensation program and whether this structure provides appropriate incentives to act in the best interests of the fund.
Resources Dedicated to Investment Management and Support Services. The Board and the Fund Oversight and Research Committees reviewed the general qualifications and capabilities of the Investment Advisers' investment staff, including its size, education, experience, and resources, as well as the Investment Advisers' approach to recruiting, training, managing, and compensating investment personnel. The Board also noted that FMR has devoted increased resources to non-U.S. offices. The Board noted that Fidelity's analysts have extensive resources, tools and capabilities which allow them to conduct sophisticated quantitative and fundamental analysis, as well as credit analysis of issuers, counterparties and enhancers. The Board also believes that Fidelity's investment professionals have sufficient access to global information and data so as to provide competitive investment results over time, and that those professionals also have access to sophisticated tools which permit them to assess portfolio construction and risk and performance attribution characteristics continuously, as well as to transmit new information and research conclusions rapidly around the world. Additionally, in their deliberations, the Board considered the Investment Advisers' trading capabilities and resources which are an integral part of the investment management process.
Shareholder and Administrative Services. The Board considered (i) the nature, extent, quality, and cost of advisory, administrative, and shareholder services performed by the Investment Advisers and their affiliates under the Advisory Contracts and under separate agreements covering transfer agency, pricing and bookkeeping, and securities lending services for the fund; (ii) the nature and extent of the investment adviser's supervision of third party service providers, principally custodians and subcustodians; and (iii) the resources devoted to, and the record of compliance with, the fund's compliance policies and procedures. The Board also reviewed the allocation of fund brokerage, including allocations to brokers affiliated with the Investment Advisers, the use of brokerage commissions to pay fund expenses, and the use of "soft" commission dollars to pay for research services.
The Board noted that the growth of fund assets over time across the complex allows Fidelity to reinvest in the development of services designed to enhance the value or convenience of the Fidelity funds as investment vehicles. These services include 24-hour access to account information and market information through telephone representatives and over the Internet, investor education materials and asset allocation tools, and the expanded availability of Fidelity Investor Centers, with 35 new branches opening since 2010.
Annual Report
Investment in a Large Fund Family. The Board considered the benefits to shareholders of investing in a Fidelity fund, including the benefits of investing in a fund that is part of a large family of funds offering a variety of investment disciplines and providing a large variety of mutual fund investor services. The Board noted that Fidelity had taken, or had made recommendations that resulted in the Fidelity funds taking, a number of actions over the previous year that benefited particular funds, including (i) continuing to dedicate additional resources to investment research and support of the senior management team that oversees asset management; (ii) rationalizing product lines through the mergers of six funds into other funds; (iii) continuing to migrate the Freedom Funds to dedicated lower cost underlying funds; (iv) obtaining shareholder approval to broaden the investment strategies for Fidelity Consumer Finance Portfolio, Fidelity Emerging Asia Fund, and Fidelity Environment and Alternative Energy Portfolio; (v) contractually agreeing to reduce the management fees and impose other expense limitations on Spartan 500 Index Fund and U.S. Bond Index Fund in connection with launching new institutional classes of these funds; (vi) changing the name, primary and supplemental benchmarks, and investment policies of Fidelity Global Strategies Fund to support the fund's flexible investment mandate and global orientation; and (vii) reducing the transfer agency account fee rates on certain accounts.
Investment Performance. The Board considered whether the fund has operated in accordance with its investment objective, as well as its record of compliance with its investment restrictions. It also reviewed the fund's absolute investment performance for each class, as well as the fund's relative investment performance for each class measured against a broad-based securities market index. The Board noted that FMR does not believe that a meaningful peer group exists against which to compare the fund's performance. Because the fund had been in existence less than three calendar years, the following chart considered by the Board shows, for the one-year period ended December 31, 2010, the total returns of the retail class and Class B of the fund and the total returns of a broad-based securities market index ("benchmark").
Annual Report
Board Approval of Investment Advisory Contracts and
Management Fees - continued
Fidelity Emerging Europe, Middle East, Africa (EMEA) Fund
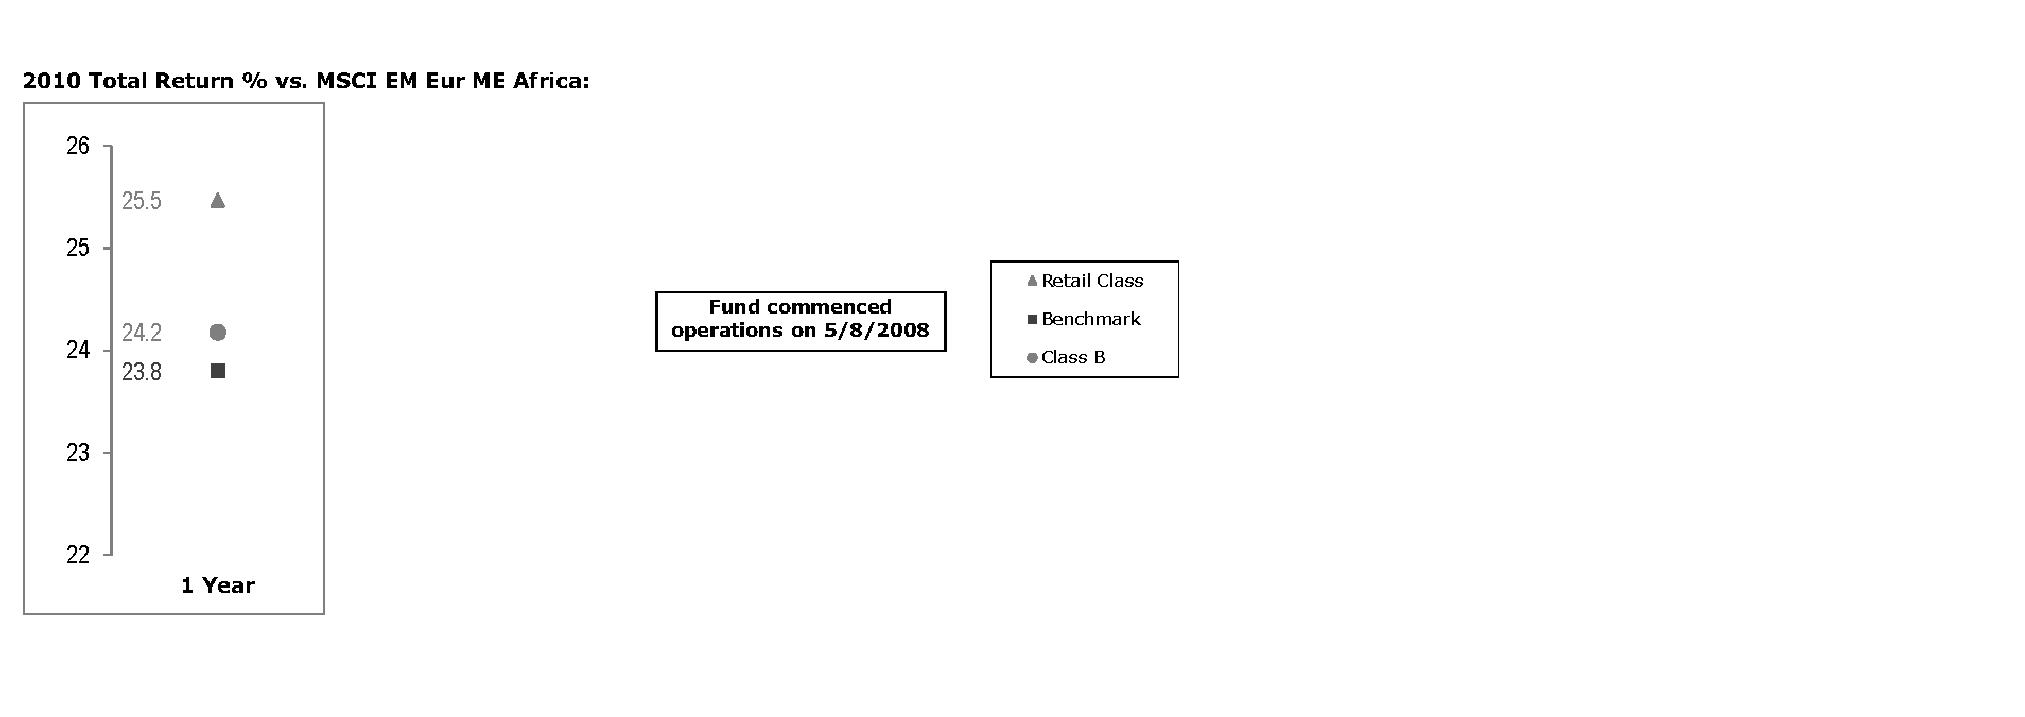
The Board noted that the investment performance of the retail class of the fund compared favorably to its benchmark for the period shown. The Board considered that the variations in performance among the fund's classes reflect the variations in class expenses, which result in lower performance for higher expense classes. The Board also reviewed the fund's performance since inception as well as performance in the current year. The Board noted that it is difficult to evaluate in any comprehensive fashion the performance of the fund, in light of its relatively recent commencement of operations.
Based on its review, the Board concluded that the nature, extent, and quality of services provided to the fund under the Advisory Contracts should benefit the fund's shareholders.
Competitiveness of Management Fee and Total Expense Ratio. The Board considered the fund's management fee and total expense ratio compared to "mapped groups" of competitive funds and classes. Fidelity creates "mapped groups" by combining similar Lipper investment objective categories that have comparable management fee characteristics. Combining Lipper investment objective categories aids the Board's management fee and total expense ratio comparisons by broadening the competitive group used for comparison and by reducing the number of universes to which various Fidelity funds are compared.
Management Fee. The Board considered two proprietary management fee comparisons for the 12-month (or shorter) periods shown in the chart below. The group of Lipper funds used by the Board for management fee comparisons is referred to below as the "Total Mapped Group." The Total Mapped Group comparison focuses on a fund's standing relative to the total universe of comparable funds available to investors in terms of gross management fees before expense reimbursements or caps. "TMG %" represents the percentage of funds in the Total Mapped Group that had management fees that were lower than the fund's. For example, a TMG % of 13% means that 87% of the funds in the Total Mapped Group had higher management fees than the fund. The "Asset-Size Peer Group" (ASPG) comparison focuses on a fund's standing relative to non-Fidelity funds similar in size to the fund within the Total Mapped Group. The ASPG represents at least 15% of the funds in the Total Mapped Group with comparable asset size and management fee characteristics, subject to a minimum of 50 funds (or all funds in the Total Mapped Group if fewer than 50). Additional information, such as the ASPG quartile in which the fund's management fee ranked, is also included in the chart and considered by the Board.
Annual Report
Fidelity Emerging Europe, Middle East, Africa (EMEA) Fund
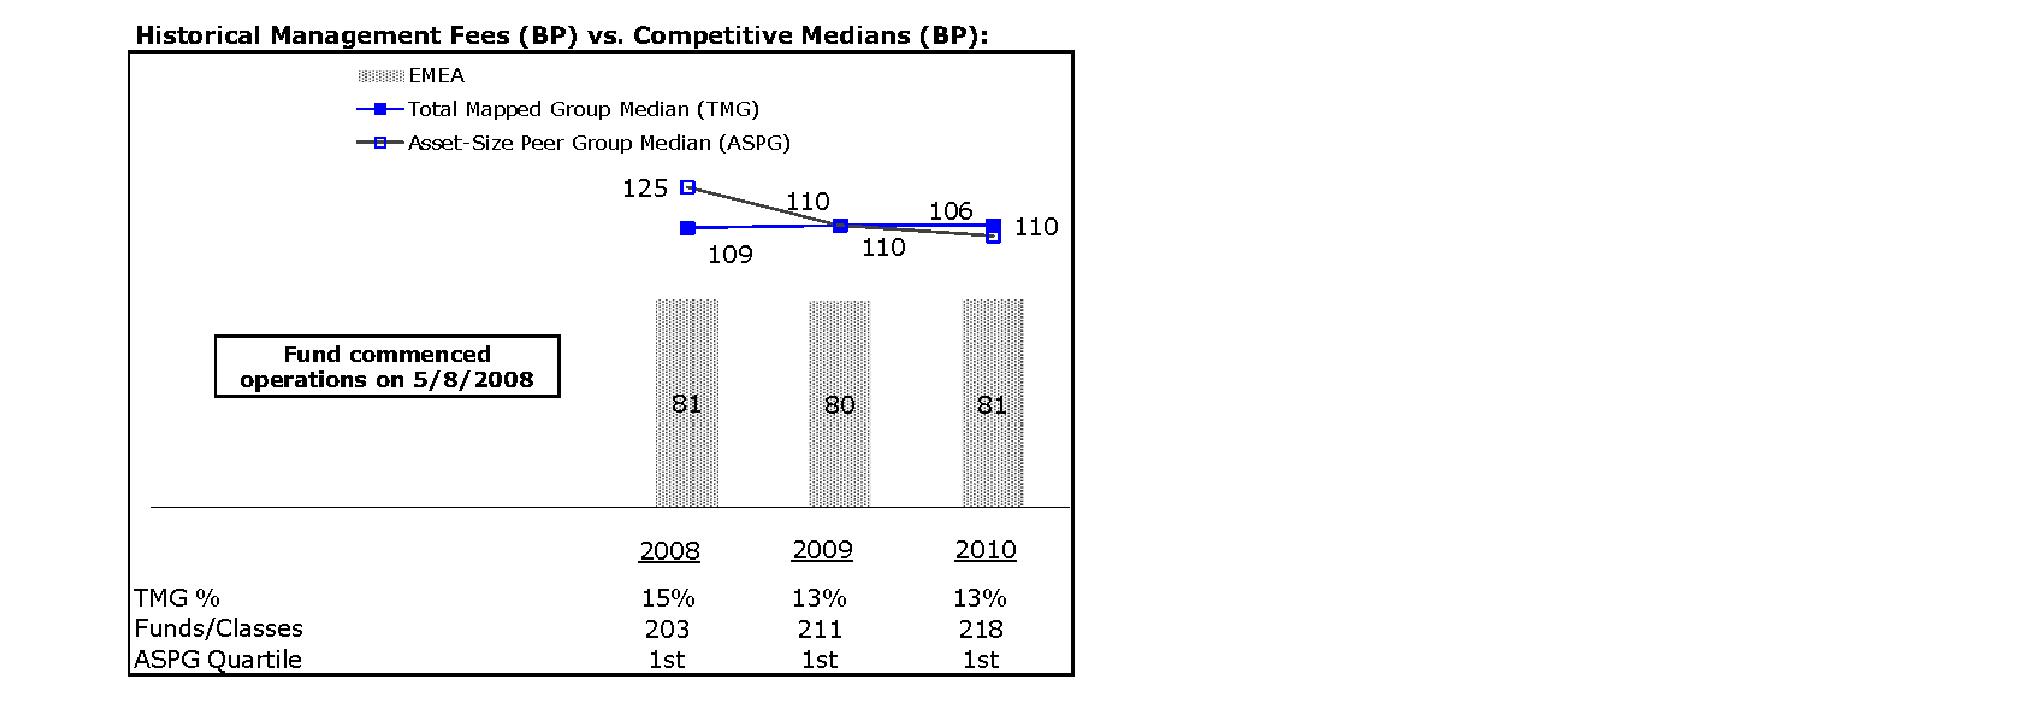
The Board noted that the fund's management fee ranked below the median of its Total Mapped Group and below the median of its ASPG for 2010.
Based on its review, the Board concluded that the fund's management fee is fair and reasonable in light of the services that the fund receives and the other factors considered.
Total Expense Ratio. In its review of each class's total expense ratio, the Board considered the fund's management fee as well as other fund or class expenses, as applicable, such as transfer agent fees, pricing and bookkeeping fees, fund-paid 12b-1 fees, and custodial, legal, and audit fees. The Board also noted the effects of any waivers and reimbursements on fees and expenses. As part of its review, the Board also considered the current and historical total expense ratios of each class of the fund compared to competitive fund median expenses. Each class of the fund is compared to those funds and classes in the Total Mapped Group (used by the Board for management fee comparisons) that have a similar sales load structure.
Annual Report
Board Approval of Investment Advisory Contracts and
Management Fees - continued
The Board noted that the total expense ratio of each class ranked below its competitive median for 2010. The Board considered that various factors, including 12b-1 fees, positive or negative performance adjustments, and relatively higher other expenses in the case of small fund size, can affect total expense ratios.
Fees Charged to Other Fidelity Clients. The Board also considered Fidelity fee structures and other information with respect to clients of FMR and its affiliates, such as other mutual funds advised or subadvised by FMR or its affiliates, pension plan clients, and other institutional clients. In March 2010, the Board created an ad hoc joint committee with the board of other Fidelity funds (the Committee) to review and compare Fidelity's institutional investment advisory business with its business of providing services to the Fidelity funds, including the differences in services provided, fees charged, and costs incurred, as well as competition in their respective marketplaces.
Based on its review of total expense ratios and fees charged to other Fidelity clients, the Board concluded that the total expense ratio of each class of the fund was reasonable in light of the services that the fund and its shareholders receive and the other factors considered, including the findings of the Committee.
Costs of the Services and Profitability. The Board considered the revenues earned and the expenses incurred by Fidelity in conducting the business of developing, marketing, distributing, managing, administering and servicing the fund and its shareholders. The Board also considered the level of Fidelity's profits in respect of all the Fidelity funds.
On an annual basis, FMR presents to the Board Fidelity's profitability for the fund. Fidelity calculates the profitability for each fund, as well as aggregate profitability for groups of Fidelity funds and all Fidelity funds, using a series of detailed revenue and cost allocation methodologies which originate with the books and records of Fidelity on which Fidelity's audited financial statements are based. The Audit Committee of the Board reviews any significant changes from the prior year's methodologies.
PricewaterhouseCoopers LLP (PwC), independent registered public accounting firm and auditor to Fidelity and certain Fidelity funds, has been engaged annually by the Board as part of the Board's assessment of Fidelity's profitability analysis. PwC's engagement includes the review and assessment of Fidelity's methodologies used in determining the revenues and expenses attributable to Fidelity's mutual fund business, and completion of agreed-upon procedures surrounding the mathematical accuracy of fund profitability and its conformity to allocation methodologies. After considering PwC's reports issued under the engagement and information provided by Fidelity, the Board concluded that while other allocation methods may also be reasonable, Fidelity's profitability methodologies are reasonable in all material respects.
Annual Report
The Board also reviewed Fidelity's non-fund businesses and fall-out benefits related to the mutual fund business as well as cases where Fidelity's affiliates may benefit from or be related to the fund's business.
The Board considered the costs of the services provided by and the profits realized by Fidelity in connection with the operation of the fund and was satisfied that the profitability was not excessive in the circumstances.
Economies of Scale. The Board considered whether there have been economies of scale in respect of the management of the Fidelity funds, whether the Fidelity funds (including the fund) have appropriately benefited from any such economies of scale, and whether there is potential for realization of any further economies of scale. The Board considered the extent to which the fund will benefit from economies of scale through increased services to the fund, through waivers or reimbursements, or through fee or expense reductions. The Board also noted that in 2009, it and the board of other Fidelity funds created an ad hoc committee (the Economies of Scale Committee) to analyze whether FMR attains economies of scale in respect of the management and servicing of the Fidelity funds, whether the Fidelity funds have appropriately benefited from such economies of scale, and whether there is potential for realization of any further economies of scale.
The Board recognized that the fund's management contract incorporates a "group fee" structure, which provides for lower group fee rates as total fund assets under FMR's management increase, and for higher group fee rates as total fund assets under FMR's management decrease. FMR calculates the group fee rates based on a tiered asset "breakpoint" schedule that varies based on asset class. The Board considered that the group fee is designed to deliver the benefits of economies of scale to fund shareholders when total Fidelity fund assets increase, even if assets of any particular fund are unchanged or have declined, because some portion of Fidelity's costs are attributable to services provided to all Fidelity funds, and all funds benefit if those costs can be allocated among more assets. The Board concluded that, given the group fee structure, fund shareholders will benefit from lower management fees as assets under FMR's management increase at the fund complex level, regardless of whether Fidelity achieves any such economies of scale.
The Board concluded, taking into account the analysis of the Economies of Scale Committee, that any potential economies of scale are being appropriately shared between fund shareholders and Fidelity.
Annual Report
Board Approval of Investment Advisory Contracts and
Management Fees - continued
Additional Information Requested by the Board. In order to develop fully the factual basis for consideration of the Fidelity funds' Advisory Contracts, the Board requested and received additional information on certain topics, including (i) fund performance trends, actions to be taken by FMR to improve certain funds' overall performance, and Fidelity's long-term strategies for certain funds; (ii) portfolio manager changes that have occurred during the past year and length of portfolio manager tenure for different categories of funds over time; (iii) Fidelity's compensation structure for portfolio managers and other key personnel and strategies for attracting and retaining non-investment personnel; (iv) the amount of the investment that each portfolio manager has made in the Fidelity fund(s) that he or she manages; (v) historical trends in Fidelity's realization of fall-out benefits; (vi) Fidelity's group fee structures and the rationale for the individual fee rates of certain funds; (vii) fund profitability methodology and the impact of certain factors on fund profitability results; (viii) trends regarding industry use of performance fee structures and Fidelity's compliance practices with respect to performance adjustment calculations; (ix) the fee structures in place for certain other Fidelity clients; and (x) explanations regarding the relative total expense ratios of certain funds and classes, total expense competitive trends, and actions that might be taken by FMR to reduce total expense ratios for certain funds and classes.
Based on its evaluation of all of the conclusions noted above, and after considering all factors it believed relevant, the Board ultimately concluded that the advisory fee structures are fair and reasonable, and that the fund's Advisory Contracts should be renewed.
Annual Report
Managing Your Investments
Fidelity offers several ways to conveniently manage your personal investments via your telephone or PC. You can access your account information, conduct trades and research your investments 24 hours a day.
By Phone
Fidelity Automated Service Telephone provides a single toll-free number to access account balances, positions, quotes and trading. It's easy to navigate the service, and on your first call, the system will help you create a personal identification number (PIN) for security.
(phone graphic)
Fidelity Automated
Service Telephone (FAST®)
1-800-544-5555
Press
1 For mutual fund and brokerage trading.
2 For quotes.*
3 For account balances and holdings.
4 To review orders and mutual
fund activity.
5 To change your PIN.
* 0 To speak to a Fidelity representative.
By PC
Fidelity's web site on the Internet provides a wide range of information, including daily financial news, fund performance, interactive planning tools and news about Fidelity products and services.
(computer graphic)
Fidelity's Web Site
www.fidelity.com
* When you call the quotes line, please remember that a fund's yield and return will vary and, except for money market funds, share price will also vary. This means that you may have a gain or loss when you sell your shares. There is no assurance that money market funds will be able to maintain a stable $1 share price; an investment in a money market fund is not insured or guaranteed by the U.S. government. Total returns are historical and include changes in share price, reinvestment of dividends and capital gains distributions, and the effects of any sales charges.
Annual Report
To Write Fidelity
We'll give your correspondence immediate attention and send you written confirmation upon completion of your request.
(letter graphic)
Making Changes
To Your Account
(such as changing name, address, bank, etc.)
Fidelity Investments
P.O. Box 770001
Cincinnati, OH 45277-0002
(letter graphic)
For Non-Retirement
Accounts
Buying shares
Fidelity Investments
P.O. Box 770001
Cincinnati, OH 45277-0003
Overnight Express
Fidelity Investments
Attn: Distribution Services
100 Crosby Parkway - KC1H
Covington, KY 41015
Selling shares
Fidelity Investments
P.O. Box 770001
Cincinnati, OH 45277-0035
Overnight Express
Fidelity Investments
Attn: Distribution Services
100 Crosby Parkway - KC1H
Covington, KY 41015
General Correspondence
Fidelity Investments
P.O. Box 500
Merrimack, NH 03054-0500
(letter graphic)
For Retirement
Accounts
Buying shares
Fidelity Investments
P.O. Box 770001
Cincinnati, OH 45277-0003
Selling shares
Fidelity Investments
P.O. Box 770001
Cincinnati, OH 45277-0035
Overnight Express
Fidelity Investments
Attn: Distribution Services
100 Crosby Parkway - KC1H
Covington, KY 41015
General Correspondence
Fidelity Investments
P.O. Box 500
Merrimack, NH 03054-0500
Annual Report
To Visit Fidelity
For directions and hours,
please call 1-800-544-9797.
Arizona
7001 West Ray Road
Chandler, AZ
15445 N. Scottsdale Road
Scottsdale, AZ
17550 North 75th Avenue
Glendale, AZ
5330 E. Broadway Blvd
Tucson, AZ
California
815 East Birch Street
Brea, CA
1411 Chapin Avenue
Burlingame, CA
851 East Hamilton Avenue
Campbell, CA
601 Larkspur Landing Circle
Larkspur, CA
2000 Avenue of the Stars
Los Angeles, CA
27101 Puerta Real
Mission Viejo, CA
73575 El Paseo
Palm Desert, CA
251 University Avenue
Palo Alto, CA
123 South Lake Avenue
Pasadena, CA
16656 Bernardo Ctr. Drive
Rancho Bernardo, CA
1220 Roseville Parkway
Roseville, CA
1740 Arden Way
Sacramento, CA
7676 Hazard Center Drive
San Diego, CA
11943 El Camino Real
San Diego, CA
8 Montgomery Street
San Francisco, CA
3793 State Street
Santa Barbara, CA
1200 Wilshire Boulevard
Santa Monica, CA
398 West El Camino Real
Sunnyvale, CA
111 South Westlake Blvd
Thousand Oaks, CA
21701 Hawthorne Boulevard
Torrance, CA
2001 North Main Street
Walnut Creek, CA
6326 Canoga Avenue
Woodland Hills, CA
2211 Michelson Drive
Irvine, CA
Colorado
281 East Flatiron Circle
Broomfield, CO
1625 Broadway
Denver, CO
9185 Westview Road
Lone Tree, CO
Connecticut
48 West Putnam Avenue
Greenwich, CT
265 Church Street
New Haven, CT
300 Atlantic Street
Stamford, CT
29 South Main Street
West Hartford, CT
1261 Post Road
Fairfield, CT
Delaware
400 Delaware Avenue
Wilmington, DE
Florida
175 East Altamonte Drive
Altamonte Springs, FL
1400 Glades Road
Boca Raton, FL
121 Alhambra Plaza
Coral Gables, FL
2948 N. Federal Highway
Ft. Lauderdale, FL
4671 Town Center Parkway
Jacksonville, FL
8880 Tamiami Trail, North
Naples, FL
230 Royal Palm Way
Palm Beach, FL
3501 PGA Boulevard
Palm Beach Gardens, FL
3550 Tamiami Trail, South
Sarasota, FL
1502 N. Westshore Blvd.
Tampa, FL
2465 State Road 7
Wellington, FL
Georgia
3242 Peachtree Road
Atlanta, GA
1000 Abernathy Road
Atlanta, GA
Illinois
One North LaSalle Street
Chicago, IL
401 North Michigan Avenue
Chicago, IL
One Skokie Valley Road
Highland Park, IL
1415 West 22nd Street
Oak Brook, IL
15105 S LaGrange Road
Orland Park, IL
1572 East Golf Road
Schaumburg, IL
1823 Freedom Drive
Naperville, IL
Indiana
8480 Keystone Crossing
Indianapolis, IN
Kansas
5400 College Boulevard
Overland Park, KS
Maine
Three Canal Plaza
Portland, ME
Maryland
7315 Wisconsin Avenue
Bethesda, MD
610 York Road
Towson, MD
Massachusetts
801 Boylston Street
Boston, MA
155 Congress Street
Boston, MA
300 Granite Street
Braintree, MA
44 Mall Road
Burlington, MA
238 Main Street
Cambridge, MA
200 Endicott Street
Danvers, MA
Fidelity Brokerage Services, Inc., 100 Summer St., Boston, MA 02110 Member NYSE/SIPC
Annual Report
405 Cochituate Road
Framingham, MA
551 Boston Turnpike
Shrewsbury, MA
Michigan
500 E. Eisenhower Pkwy.
Ann Arbor, MI
280 N. Old Woodward Ave.
Birmingham, MI
30200 Northwestern Hwy.
Farmington Hills, MI
43420 Grand River Avenue
Novi, MI
3480 28th Street
Grand Rapids, MI
2425 S. Linden Road STE E
Flint, MI
Minnesota
7740 France Avenue South
Edina, MN
8342 3rd Street North
Oakdale, MN
Missouri
1524 South Lindbergh Blvd.
St. Louis, MO
Nevada
2225 Village Walk Drive
Henderson, NV
New Jersey
501 Route 73 South
Marlton, NJ
150 Essex Street
Millburn, NJ
35 Morris Street
Morristown, NJ
396 Route 17, North
Paramus, NJ
3518 Route 1 North
Princeton, NJ
530 Broad Street
Shrewsbury, NJ
New Mexico
2261 Q Street NE
Albuquerque, NM
New York
1130 Franklin Avenue
Garden City, NY
37 West Jericho Turnpike
Huntington Station, NY
1271 Avenue of the Americas
New York, NY
980 Madison Avenue
New York, NY
61 Broadway
New York, NY
350 Park Avenue
New York, NY
200 Fifth Avenue
New York, NY
733 Third Avenue
New York, NY
2070 Broadway
New York, NY
1075 Northern Blvd.
Roslyn, NY
799 Central Park Avenue
Scarsdale, NY
3349 Monroe Avenue
Rochester, NY
North Carolina
4611 Sharon Road
Charlotte, NC
7011 Fayetteville Road
Durham, NC
Ohio
3805 Edwards Road
Cincinnati, OH
1324 Polaris Parkway
Columbus, OH
1800 Crocker Road
Westlake, OH
28699 Chagrin Boulevard
Woodmere Village, OH
Oregon
7493 SW Bridgeport Road
Tigard, OR
Pennsylvania
600 West DeKalb Pike
King of Prussia, PA
1735 Market Street
Philadelphia, PA
12001 Perry Highway
Wexford, PA
Rhode Island
10 Memorial Boulevard
Providence, RI
Tennessee
3018 Peoples Street
Johnson City, TN
7628 West Farmington Blvd.
Germantown, TN
2035 Mallory Lane
Franklin, TN
Texas
10000 Research Boulevard
Austin, TX
4001 Northwest Parkway
Dallas, TX
12532 Memorial Drive
Houston, TX
2701 Drexel Drive
Houston, TX
6560 Fannin Street
Houston, TX
1701 Lake Robbins Drive
The Woodlands, TX
6500 N. MacArthur Blvd.
Irving, TX
6005 West Park Boulevard
Plano, TX
1576 East Southlake Blvd.
Southlake, TX
15600 Southwest Freeway
Sugar Land, TX
139 N. Loop 1604 East
San Antonio, TX
Utah
279 West South Temple
Salt Lake City, UT
Virginia
1861 International Drive
McLean, VA
11957 Democracy Drive
Reston, VA
Washington
10500 NE 8th Street
Bellevue, WA
1518 6th Avenue
Seattle, WA
304 Strander Blvd
Tukwila, WA
Washington, DC
1900 K Street, N.W.
Washington, DC
Wisconsin
16020 West Bluemound Road
Brookfield, WI
Annual Report
Investment Adviser
Fidelity Management &
Research Company
Boston, MA
Investment Sub-Advisers
FMR Co., Inc.
Fidelity Management & Research
(U.K.) Inc.
FIL Investments (Japan) Limited
FIL Investment Advisors
FIL Investment Advisors
(U.K.) Limited
Fidelity Management & Research
(Hong Kong) Limited
Fidelity Management & Research
(Japan) Inc.
General Distributor
Fidelity Distributors Corporation
Boston, MA
Transfer and Service Agents
Fidelity Investments Institutional
Operations Company, Inc.
Boston, MA
Fidelity Service Company, Inc.
Boston, MA
Custodian
State Street Bank & Trust Company
Quincy, MA
The Fidelity Telephone Connection
Mutual Fund 24-Hour Service
Exchanges/Redemptions
and Account Assistance 1-800-544-6666
Product Information 1-800-544-6666
Retirement Accounts 1-800-544-4774
(8 a.m. - 9 p.m.)
TDD Service 1-800-544-0118
for the deaf and hearing impaired
(9 a.m. - 9 p.m. Eastern time)
Fidelity Automated Service
Telephone (FAST®)(automated service graphic) 1-800-544-5555
(automated service graphic) Automated line for quickest service
(Fidelity Logo)
Corporate Headquarters
82 Devonshire St., Boston, MA 02109
www.fidelity.com
EME-UANN-1211
1.861971.103
(Fidelity Logo)
Fidelity Advisor®
Emerging Europe,
Middle East, Africa (EMEA)
Fund - Class A, Class T, Class B
and Class C
Annual Report
October 31, 2011
(Fidelity Cover Art)
Class A, Class T, Class B, and Class C are classes of Fidelity® Emerging Europe,
Middle East, Africa (EMEA) Fund
Contents
Chairman's Message | (Click Here) | The Chairman's message to shareholders. |
Performance | (Click Here) | How the fund has done over time. |
Management's Discussion of Fund Performance | (Click Here) | The Portfolio Manager's review of fund performance and strategy. |
Shareholder Expense Example | (Click Here) | An example of shareholder expenses. |
Investment Changes | (Click Here) | A summary of major shifts in the fund's investments over the past six months. |
Investments | (Click Here) | A complete list of the fund's investments with their market values. |
Financial Statements | (Click Here) | Statements of assets and liabilities, operations, and changes in net assets, as well as financial highlights. |
Notes | (Click Here) | Notes to the financial statements. |
Report of Independent Registered Public Accounting Firm | (Click Here) | |
Trustees and Officers | (Click Here) | |
Distributions | (Click Here) | |
Board Approval of Investment Advisory Contracts and Management Fees | (Click Here) | |
To view a fund's proxy voting guidelines and proxy voting record for the 12-month period ended June 30, visit http://www.fidelity.com/proxyvotingresults or visit the Securities and Exchange Commission's (SEC) web site at http://www.sec.gov. You may also call 1-877-208-0098 to request a free copy of the proxy voting guidelines.
Standard & Poor's, S&P and S&P 500 are registered service marks of The McGraw-Hill Companies, Inc. and have been licensed for use by Fidelity Distributors Corporation.
Other third party marks appearing herein are the property of their respective owners.
All other marks appearing herein are registered or unregistered trademarks or service marks of FMR LLC or an affiliated company.
Annual Report
This report and the financial statements contained herein are submitted for the general information of the shareholders of the fund. This report is not authorized for distribution to prospective investors in the fund unless preceded or accompanied by an effective prospectus.
A fund files its complete schedule of portfolio holdings with the SEC for the first and third quarters of each fiscal year on Form N-Q. Forms N-Q are available on the SEC's web site at http://www.sec.gov. A fund's Forms N-Q may be reviewed and copied at the SEC's Public Reference Room in Washington, DC. Information regarding the operation of the SEC's Public Reference Room may be obtained by calling 1-800-SEC-0330. For a complete list of a fund's portfolio holdings, view the most recent holdings listing, semiannual report, or annual report on Fidelity's web site at http://www.fidelity.com, http://www.advisor.fidelity.com, or http://www.401k.com, as applicable.
NOT FDIC INSURED • MAY LOSE VALUE • NO BANK GUARANTEE
Neither the fund nor Fidelity Distributors Corporation is a bank.
Annual Report
(Acting Chairman's Photograph)
Dear Shareholder:
Global equity markets began the fourth quarter on a strong note, sharply reversing course in October amid strong corporate earnings, better-than-expected economic news and the promise of a resolution to the sovereign debt crisis in Europe. The mini rally followed a third quarter marked by a significant downturn in July and August, which heightened investor anxiety and set off a wave of volatility that hampered most major asset classes through the end of September. Financial markets are difficult to predict, of course, but you can help put the odds in your favor by following these time-tested investment principles.
One of the basic tenets is to invest according to your time horizon. For long-term investors, riding out the markets' inevitable ups and downs has proven much more effective than making decisions based on short-term developments. If your goal is approaching, you can also benefit from patience and restraint, rather than attempting to time the market. No matter your time horizon, missing only a few of the markets' best days can significantly diminish returns. Patience also affords the benefits of compounding - earning interest on additional income or reinvested dividends and capital gains. While staying the course doesn't eliminate risk, it can considerably lessen the negative impact of short-term downturns.
Asset allocation is another principle to manage risk. As you spread your portfolio among the asset classes, be sure to consider your time horizon, risk tolerance and investment objectives. Younger investors may be better served by emphasizing equities, which historically have been the best-performing asset class over time. Investors who are nearing a specific goal, such as retirement or sending a child to college, may choose to favor bonds and other investments that have tended to be more stable. Studies indicate that asset allocation is the single most important determinant of a portfolio's long-term success. After deciding on a suitable allocation strategy, make sure your portfolio is adequately diversified, with exposure to stocks of small-, mid- and large-cap companies in a range of sectors, for example. And today, more than ever, geographic diversification should be taken into account.
Lastly, investing a certain amount of money on a regular basis - a principle known as dollar-cost averaging - can help lower the average cost of your purchases, while also giving you the discipline to avoid selling weak performers just prior to an upswing, or chasing a hot performer just before a correction.
We invite you to learn more by visiting us on the Internet, dropping by one of our Investor Centers or calling us by phone. It is our privilege to provide the resources you need to choose investments that are right for you.
Sincerely,
(Acting Chairman's Signature)
James C. Curvey
Acting Chairman
Annual Report
Average annual total return reflects the change in the value of an investment, assuming reinvestment of the class' distributions from dividend income and capital gains (the profits earned upon the sale of securities that have grown in value, if any) and assuming a constant rate of performance each year. The $10,000 table and the fund's returns do not reflect the deduction of taxes that a shareholder would pay on fund distributions or the redemption of fund shares. During periods of reimbursement by Fidelity, a fund's total return will be greater than it would be had the reimbursement not occurred. How a fund did yesterday is no guarantee of how it will do tomorrow.
Average Annual Total Returns
Periods ended October 31, 2011 | | Past 1
year | Life of
fundA |
Class A (incl. 5.75% sales charge) | | -11.46% | -6.00% |
Class T (incl. 3.50% sales charge) | | -9.70% | -5.61% |
Class B (incl. contingent deferred sales charge) B | | -11.49% | -5.93% |
Class C (incl. contingent deferred sales charge) C | | -7.72% | -5.11% |
A From May 8, 2008.
B Class B shares' contingent deferred sales charges included in the past one year and life of fund total return figures are 5% and 3%, respectively.
C Class C shares' contingent deferred sales charges included the past one year and life of fund total return figures are 1% and 0%, respectively.
Annual Report
$10,000 Over Life of Fund
Let's say hypothetically that $10,000 was invested in Fidelity Advisor® Emerging Europe, Middle East, Africa (EMEA) Fund - Class A on May 8, 2008, when the fund started, and the current 5.75% sales charge was paid. The chart shows how the value of your investment would have changed, and also shows how the MSCI® EM (Emerging Markets) Europe, Middle East and Africa Index performed over the same period.
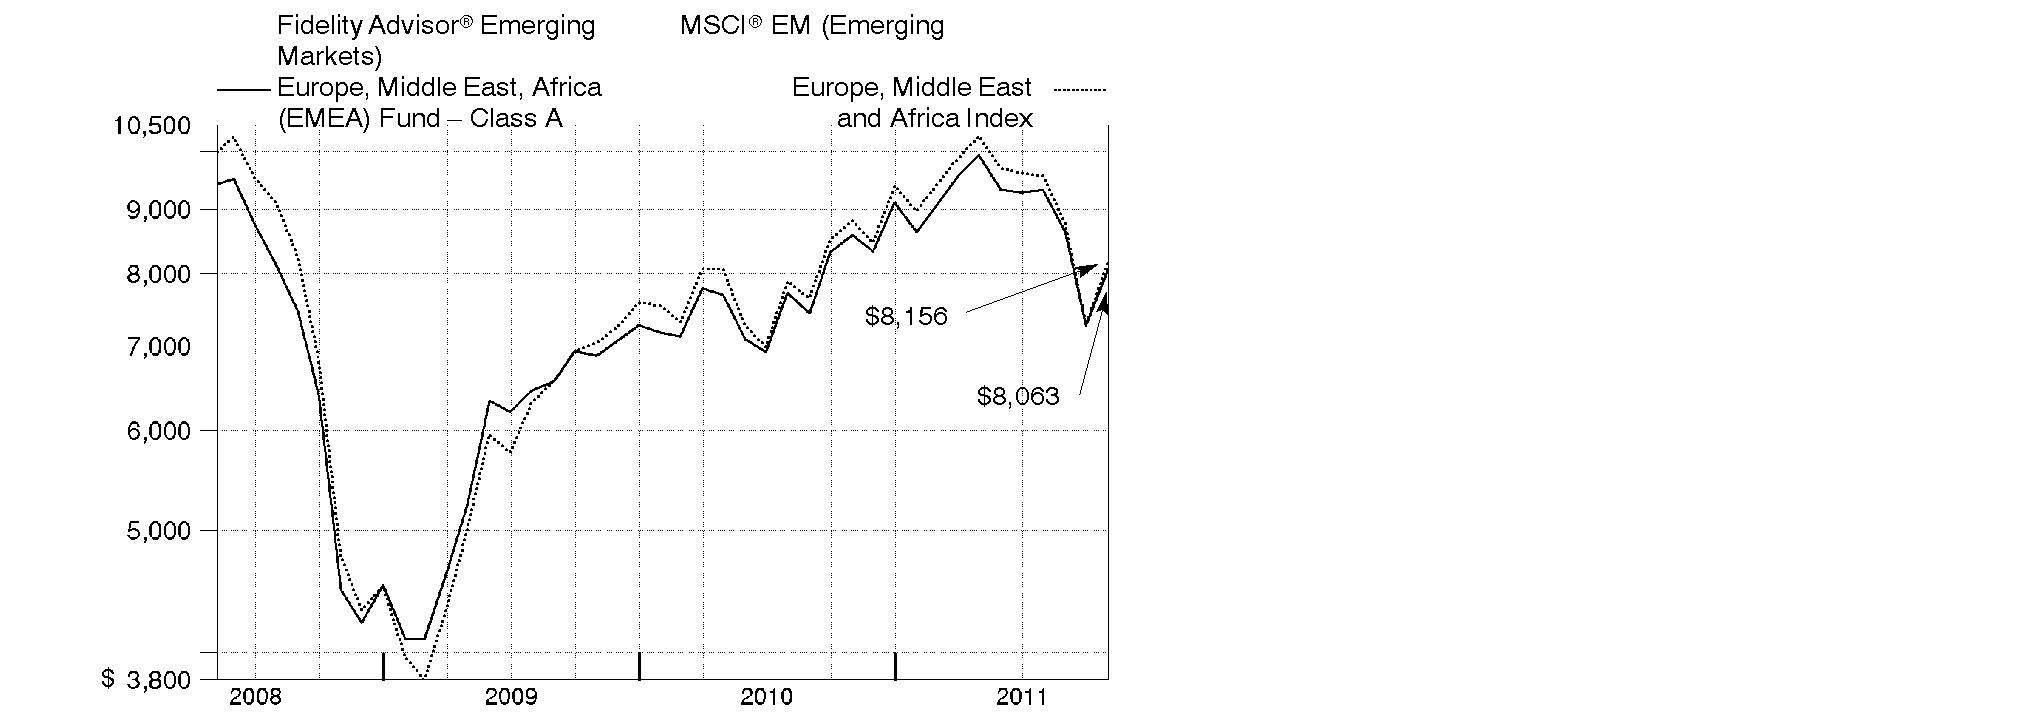
Annual Report
Market Recap: Emerging-markets stocks concluded the 12-month period ending October 31, 2011, on a strong note, reversing direction in October amid hope for a resolution to the sovereign debt crisis in Europe. The brief rally, on top of a robust first half of the period, could only partially offset the negative impact of a five-month downturn that began in May and intensified in August and September, as investors began to flee riskier securities due to the debt debacle, concern the U.S. economy may contract and worry about a significant slowdown in China. For the year, the MSCI® Emerging Markets Index declined 7.44%, hampered in part by global currency fluctuation. The index gained roughly 13% in October, after falling 9% in August and about 15% in September. For the full year, returns across the individual country components of the emerging-markets index were decidedly negative. Several of the largest countries in the index struggled, especially India (-20%), China (-17%) and Brazil (-12%), as did Turkey (-34%). Conversely, South Korea had the strongest result, gaining about 7%, while another sizable index component, Russia, returned roughly 1%. Smaller constituents Indonesia (+5%) and Malaysia (+4%) also finished in positive territory. A trio of countries had negative returns but outpaced the index: Mexico (-1%), Taiwan (-2%) and South Africa (-3%).
Comments from Adam Kutas, Portfolio Manager of Fidelity Advisor® Emerging Europe, Middle East, Africa (EMEA) Fund: For the year, the fund's Class A, Class T, Class B and Class C shares returned -6.05%, -6.42%, -6.85% and -6.79%, respectively (excluding sales charges), outperforming the -7.42% return of the MSCI® EM (Emerging Markets) Europe, Middle East and Africa Index. Stock selection within materials and telecommunication services helped, as did picks in Russia and an overweighting in South Africa. Individual contributors included Russian natural gas producer Novatek, three South African firms - coal company Exxaro Resources, Harmony Gold Mining and supermarket company Shoprite Holdings - and not owning underperforming index constituent OTP Bank, based in Hungary. On the down side, poor stock selection in consumer discretionary hurt, particularly in retailing. On a regional basis, the fund lost ground due to the negative currency effects of our South African investments and unfavorable security selection in Poland. Among the main individual detractors were Turkish banks Turkiye Garanti Bankasi and Turkiye Halk Bankasi - the latter of which was sold from the fund by period end - and underweighting Russian oil company and outperforming major index component Gazprom.
Note to shareholders: The fund may invest up to 35% of its total assets in any industry that represents more than 20% of the emerging Europe, Middle East and African markets. As of October 31, 2011, the fund did not have more than 25% of its total assets invested in any one industry.
The views expressed above reflect those of the portfolio manager(s) only through the end of the period as stated on the cover of this report and do not necessarily represent the views of Fidelity or any other person in the Fidelity organization. Any such views are subject to change at any time based upon market or other conditions and Fidelity disclaims any responsibility to update such views. These views may not be relied on as investment advice and, because investment decisions for a Fidelity fund are based on numerous factors, may not be relied on as an indication of trading intent on behalf of any Fidelity fund.
Annual Report
Shareholder Expense Example
As a shareholder of the Fund, you incur two types of costs: (1) transaction costs, including sales charges (loads) on purchase payments or redemption proceeds, redemption fees, and (2) ongoing costs, including management fees, distribution and/or service (12b-1) fees and other Fund expenses. This Example is intended to help you understand your ongoing costs (in dollars) of investing in the Fund and to compare these costs with the ongoing costs of investing in other mutual funds.
The Example is based on an investment of $1,000 invested at the beginning of the period and held for the entire period (May 1, 2011 to October 31, 2011).
Actual Expenses
The first line of the accompanying table for each class of the Fund provides information about actual account values and actual expenses. You may use the information in this line, together with the amount you invested, to estimate the expenses that you paid over the period. Simply divide your account value by $1,000.00 (for example, an $8,600 account value divided by $1,000.00 = 8.6), then multiply the result by the number in the first line for a class of the Fund under the heading entitled "Expenses Paid During Period" to estimate the expenses you paid on your account during this period. A small balance maintenance fee of $12.00 that is charged once a year may apply for certain accounts with a value of less than $2,000. This fee is not included in the table below. If it was, the estimate of expenses you paid during the period would be higher, and your ending account value lower, by this amount. In addition, the Fund, as a shareholder in the underlying Fidelity Central Funds, will indirectly bear its pro-rata share of the fees and expenses incurred by the underlying Fidelity Central Funds. These fees and expenses are not included in the Fund's annualized expense ratio used to calculate the expense estimate in the table below.
Hypothetical Example for Comparison Purposes
The second line of the accompanying table for each class of the Fund provides information about hypothetical account values and hypothetical expenses based on a Class' actual expense ratio and an assumed rate of return of 5% per year before expenses, which is not the Class' actual return. The hypothetical account values and expenses may not be used to estimate the actual ending account balance or expenses you paid for the period. You may use this information to compare the ongoing costs of investing in the Fund and other funds. To do so, compare this 5% hypothetical example with the 5% hypothetical examples that appear in the shareholder reports of the other funds. A small balance maintenance fee of $12.00 that is charged once a year may apply for certain accounts with a value of less than $2,000. This fee is not included in the table below. If it was, the estimate of expenses you paid during the period would be higher, and your ending account value lower, by this amount. In addition, the Fund, as a shareholder in the underlying Fidelity Central Funds, will indirectly bear its pro-rata share of the fees and expenses incurred by the underlying Fidelity Central Funds. These fees and expenses are not included in the Fund's annualized expense ratio used to calculate the expense estimate in the table below.
Please note that the expenses shown in the table are meant to highlight your ongoing costs only and do not reflect any transaction costs. Therefore, the second line of the table is useful in comparing ongoing costs only, and will not help you determine the relative total costs of owning different funds. In addition, if these transactional costs were included, your costs would have been higher.
Annual Report
| Annualized
Expense Ratio | Beginning
Account Value
May 1, 2011 | Ending
Account Value
October 31, 2011 | Expenses Paid
During Period*
May 1, 2011 to
October 31, 2011 |
Class A | 1.56% | | | |
Actual | | $ 1,000.00 | $ 811.30 | $ 7.12 |
HypotheticalA | | $ 1,000.00 | $ 1,017.34 | $ 7.93 |
Class T | 1.84% | | | |
Actual | | $ 1,000.00 | $ 809.90 | $ 8.39 |
HypotheticalA | | $ 1,000.00 | $ 1,015.93 | $ 9.35 |
Class B | 2.32% | | | |
Actual | | $ 1,000.00 | $ 808.00 | $ 10.57 |
HypotheticalA | | $ 1,000.00 | $ 1,013.51 | $ 11.77 |
Class C | 2.33% | | | |
Actual | | $ 1,000.00 | $ 807.80 | $ 10.62 |
HypotheticalA | | $ 1,000.00 | $ 1,013.46 | $ 11.82 |
Emerging Europe, Middle East, Africa (EMEA) | 1.31% | | | |
Actual | | $ 1,000.00 | $ 811.80 | $ 5.98 |
HypotheticalA | | $ 1,000.00 | $ 1,018.60 | $ 6.67 |
Institutional Class | 1.23% | | | |
Actual | | $ 1,000.00 | $ 811.80 | $ 5.62 |
HypotheticalA | | $ 1,000.00 | $ 1,019.00 | $ 6.26 |
A 5% return per year before expenses
* Expenses are equal to each Class' annualized expense ratio, multiplied by the average account value over the period, multiplied by 184/365 (to reflect the one-half year period).
Annual Report
Investment Changes (Unaudited)
Geographic Diversification (% of fund's net assets) |
As of October 31, 2011 |
| South Africa 46.7% | |
| Russia 33.6% | |
| Turkey 5.8% | |
| Poland 3.3% | |
| United Arab Emirates 2.3% | |
| Nigeria 1.6% | |
| Morocco 1.2% | |
| Kenya 1.2% | |
| Qatar 1.1% | |
| Other* 3.2% | |

* Includes short-term investments and net other assets. |
As of April 30, 2011 |
| South Africa 45.0% | |
| Russia 32.4% | |
| Turkey 8.3% | |
| United States of America* 3.6% | |
| Poland 3.1% | |
| United Arab Emirates 1.4% | |
| Morocco 1.0% | |
| Nigeria 1.0% | |
| Kenya 0.9% | |
| Other 3.3% | |

* Includes short-term investments and net other assets. |
Asset Allocation |
| % of fund's
net assets | % of fund's net assets
6 months ago |
Stocks | 98.9 | 96.1 |
Bonds | 0.7 | 0.3 |
Short-Term Investments and Net Other Assets | 0.4 | 3.6 |
Top Ten Stocks as of October 31, 2011 |
| % of fund's
net assets | % of fund's net assets
6 months ago |
OAO Gazprom (Russia, Oil, Gas & Consumable Fuels) | 8.7 | 9.3 |
MTN Group Ltd. (South Africa, Wireless Telecommunication Services) | 7.9 | 6.2 |
Lukoil Oil Co. sponsored ADR (United Kingdom) (Russia, Oil, Gas & Consumable Fuels) | 6.0 | 5.7 |
Sberbank of Russia (Russia, Commercial Banks) | 5.6 | 5.1 |
Standard Bank Group Ltd. (South Africa, Commercial Banks) | 4.3 | 3.8 |
OAO NOVATEK (Russia, Oil, Gas & Consumable Fuels) | 4.0 | 3.3 |
Harmony Gold Mining Co. Ltd. (South Africa, Metals & Mining) | 3.7 | 3.3 |
FirstRand Ltd. (South Africa, Diversified Financial Services) | 3.3 | 2.9 |
Vodacom Group (Pty) Ltd. (South Africa, Wireless Telecommunication Services) | 3.1 | 1.8 |
Shoprite Holdings Ltd. (South Africa, Food & Staples Retailing) | 3.0 | 3.5 |
| 49.6 | |
Market Sectors as of October 31, 2011 |
| % of fund's
net assets | % of fund's net assets
6 months ago |
Energy | 26.7 | 27.5 |
Financials | 23.4 | 24.0 |
Materials | 14.9 | 14.7 |
Telecommunication Services | 14.3 | 10.5 |
Consumer Staples | 9.2 | 8.8 |
Consumer Discretionary | 6.3 | 6.8 |
Industrials | 1.7 | 1.9 |
Utilities | 1.7 | 1.0 |
Health Care | 0.7 | 0.7 |
Information Technology | 0.3 | 0.2 |
Annual Report
Investments October 31, 2011
Showing Percentage of Net Assets
Common Stocks - 97.1% |
| Shares | | Value |
Bailiwick of Jersey - 0.8% |
Randgold Resources Ltd. | 9,700 | | $ 1,061,062 |
Canada - 0.3% |
Silver Wheaton Corp. | 13,000 | | 448,874 |
Czech Republic - 0.6% |
Philip Morris CR A/S | 1,370 | | 899,560 |
Kenya - 1.2% |
British American Tobacco Kenya Ltd. | 185,900 | | 439,723 |
East African Breweries Ltd. | 379,106 | | 591,459 |
Safaricom Ltd. | 15,803,616 | | 477,210 |
Uchumi Supermarket Ltd. (a) | 2,000,000 | | 180,171 |
TOTAL KENYA | | 1,688,563 |
Morocco - 1.2% |
Maroc Telecom SA | 99,500 | | 1,746,011 |
Nigeria - 1.6% |
Guaranty Trust Bank PLC | 3,807,451 | | 349,066 |
Nigerian Breweries PLC | 1,441,779 | | 828,491 |
Skye Bank PLC | 14,371,010 | | 450,307 |
Zenith Bank PLC | 7,356,200 | | 595,887 |
TOTAL NIGERIA | | 2,223,751 |
Poland - 3.3% |
Bank Polska Kasa Opieki SA | 48,900 | | 2,275,563 |
Eurocash SA | 136,400 | | 1,093,636 |
Polska Grupa Energetyczna SA | 225,000 | | 1,386,618 |
TOTAL POLAND | | 4,755,817 |
Qatar - 1.1% |
Qatar National Bank SAQ | 26,129 | | 1,051,977 |
Vodafone Qatar QSC (a) | 244,891 | | 501,720 |
TOTAL QATAR | | 1,553,697 |
Russia - 31.8% |
DIXY Group OJSC (a) | 123,300 | | 1,260,327 |
Lukoil Oil Co. sponsored ADR (United Kingdom) | 147,895 | | 8,607,489 |
Magnit OJSC | 10,400 | | 1,124,528 |
Magnit OJSC right 11/29/11 (a) | 1,263 | | 0 |
Novolipetsk Steel OJSC GDR (Reg. S) | 30,600 | | 832,932 |
OAO Gazprom | 2,093,600 | | 12,421,011 |
OAO NOVATEK | 39,500 | | 518,896 |
NOVATEK OAO GDR | 37,100 | | 5,208,840 |
Rosneft Oil Co. OJSC | 32,800 | | 236,696 |
Rosneft Oil Co. OJSC GDR (Reg. S) | 247,700 | | 1,762,386 |
Common Stocks - continued |
| Shares | | Value |
Russia - continued |
Sberbank of Russia | 2,921,500 | | $ 7,927,577 |
Sistema JSFC sponsored GDR | 26,300 | | 450,782 |
TNK-BP Holding | 786,500 | | 2,151,883 |
Uralkali JSC | 329,300 | | 2,928,842 |
TOTAL RUSSIA | | 45,432,189 |
South Africa - 46.7% |
Africa Cellular Towers Ltd. (a) | 5,335,800 | | 60,510 |
African Rainbow Minerals Ltd. | 67,600 | | 1,562,339 |
AngloGold Ashanti Ltd. | 95,400 | | 4,311,518 |
Aveng Ltd. | 143,700 | | 671,758 |
Cashbuild Ltd. | 80,500 | | 1,044,756 |
Clicks Group Ltd. | 779,024 | | 4,088,347 |
DRDGOLD Ltd. | 1,024,814 | | 675,744 |
Exxaro Resources Ltd. | 125,700 | | 2,843,031 |
FirstRand Ltd. | 1,907,200 | | 4,743,788 |
Foschini Ltd. | 61,700 | | 778,529 |
Harmony Gold Mining Co. Ltd. | 404,700 | | 5,290,930 |
Life Healthcare Group Holdings Ltd. | 383,900 | | 934,076 |
Mr Price Group Ltd. | 153,400 | | 1,476,728 |
MTN Group Ltd. | 642,350 | | 11,211,562 |
Nampak Ltd. | 317,600 | | 872,407 |
Naspers Ltd. Class N | 28,200 | | 1,350,216 |
Northam Platinum Ltd. | 111,600 | | 432,406 |
Paracon Holdings Ltd. | 1,828,728 | | 414,766 |
Pioneer Foods Ltd. | 148,700 | | 1,189,967 |
Raubex Group Ltd. | 719,200 | | 1,179,893 |
RMB Holdings Ltd. | 258,400 | | 815,609 |
Sanlam Ltd. | 432,100 | | 1,614,325 |
Sasol Ltd. | 87,900 | | 3,952,702 |
Shoprite Holdings Ltd. | 296,200 | | 4,340,942 |
Spur Corp. Ltd. | 162,800 | | 277,956 |
Standard Bank Group Ltd. | 496,363 | | 6,116,742 |
Vodacom Group (Pty) Ltd. | 385,300 | | 4,364,562 |
TOTAL SOUTH AFRICA | | 66,616,109 |
Turkey - 5.8% |
Aygaz A/S | 178,000 | | 972,419 |
Bim Birlesik Magazalar A/S JSC | 29,000 | | 885,621 |
Koc Holding AS | 159,000 | | 568,291 |
Tupras-Turkiye Petrol Rafinerileri AS | 32,000 | | 723,880 |
Common Stocks - continued |
| Shares | | Value |
Turkey - continued |
Turk Telekomunikasyon AS | 346,000 | | $ 1,467,553 |
Turkiye Garanti Bankasi AS | 1,027,000 | | 3,624,193 |
TOTAL TURKEY | | 8,241,957 |
United Arab Emirates - 2.3% |
Dubai Financial Market PJSC (a) | 4,758,417 | | 1,334,378 |
Emirates NBD Bank PJSC (a) | 418,373 | | 389,555 |
First Gulf Bank PJSC | 349,523 | | 1,479,739 |
TOTAL UNITED ARAB EMIRATES | | 3,203,672 |
Zambia - 0.4% |
Zambeef Products PLC | 984,233 | | 601,979 |
TOTAL COMMON STOCKS (Cost $130,573,013) | 138,473,241 |
Nonconvertible Preferred Stocks - 1.8% |
| | | |
Russia - 1.8% |
Surgutneftegaz JSC
(Cost $2,598,642) | 5,104,100 | | 2,577,377 |
Nonconvertible Bonds - 0.3% |
| Principal Amount | | |
Multi-National - 0.3% |
International Bank for Reconstruction & Development 8.2% 12/12/12
(Cost $511,604) | NGN | 80,000,000 | | 477,237 |
Government Obligations - 0.4% |
|
Ghana - 0.4% |
Ghana Republic 14.99% 3/11/13
(Cost $672,328) | GHS | 950,000 | | 599,847 |
Money Market Funds - 0.5% |
| Shares | | Value |
Fidelity Cash Central Fund, 0.12% (b)
(Cost $745,166) | 745,166 | | $ 745,166 |
TOTAL INVESTMENT PORTFOLIO - 100.1% (Cost $135,100,753) | | 142,872,868 |
NET OTHER ASSETS (LIABILITIES) - (0.1)% | | (170,558) |
NET ASSETS - 100% | $ 142,702,310 |
Currency Abbreviations |
GHS | - | Ghana Cedi |
NGN | - | Nigerian naira |
Legend |
(a) Non-income producing |
(b) Affiliated fund that is available only to investment companies and other accounts managed by Fidelity Investments. The rate quoted is the annualized seven-day yield of the fund at period end. A complete unaudited listing of the fund's holdings as of its most recent quarter end is available upon request. In addition, each Fidelity Central Fund's financial statements, which are not covered by the Fund's Report of Independent Registered Public Accounting Firm, are available on the SEC's website or upon request. |
Affiliated Central Funds |
Information regarding fiscal year to date income earned by the Fund from investments in Fidelity Central Funds is as follows: |
Fund | Income earned |
Fidelity Cash Central Fund | $ 5,615 |
Fidelity Securities Lending Cash Central Fund | 25 |
Total | $ 5,640 |
Other Information |
The following is a summary of the inputs used, as of October 31, 2011, involving the Fund's assets and liabilities carried at fair value. The inputs or methodology used for valuing securities may not be an indication of the risk associated with investing in those securities. For more information on valuation inputs, and their aggregation into the levels used in the table below, please refer to the Investment Security Valuation section in the accompanying Notes to Financial Statements. |
Valuation Inputs at Reporting Date: |
Description | Total | Level 1 | Level 2 | Level 3 |
Investments in Securities: | | | | |
Equities: | | | | |
South Africa | $ 66,616,109 | $ 52,385,215 | $ 14,230,894 | $ - |
Russia | 48,009,566 | 48,009,566 | - | - |
Turkey | 8,241,957 | 8,241,957 | - | - |
Poland | 4,755,817 | 4,755,817 | - | - |
United Arab Emirates | 3,203,672 | 3,203,672 | - | - |
Nigeria | 2,223,751 | 2,223,751 | - | - |
Morocco | 1,746,011 | 1,746,011 | - | - |
Kenya | 1,688,563 | 1,688,563 | - | - |
Qatar | 1,553,697 | 1,553,697 | - | - |
Other | 3,011,475 | 1,950,413 | 1,061,062 | - |
Corporate Bonds | 477,237 | - | 477,237 | - |
Government Obligations | 599,847 | - | 599,847 | - |
Money Market Funds | 745,166 | 745,166 | - | - |
Total Investments in Securities: | $ 142,872,868 | $ 126,503,828 | $ 16,369,040 | $ - |
Income Tax Information |
At October 31, 2011, the Fund had a capital loss carryforward of approximately $11,266,491 of which $7,410,645, $579,836 and $3,276,010 will expire in fiscal 2016, 2017 and 2018, respectively. Capital loss carryforwards are only available to offset future capital gains of the Fund to the extent provided by regulations and may be limited. |
See accompanying notes which are an integral part of the financial statements.
Annual Report
Statement of Assets and Liabilities
| October 31, 2011 |
Assets | | |
Investment in securities, at value - See accompanying schedule: Unaffiliated issuers (cost $134,355,587) | $ 142,127,702 | |
Fidelity Central Funds (cost $745,166) | 745,166 | |
Total Investments (cost $135,100,753) | | $ 142,872,868 |
Cash | | 160,278 |
Foreign currency held at value (cost $61) | | 61 |
Receivable for fund shares sold | | 148,502 |
Dividends receivable | | 179,461 |
Interest receivable | | 43,184 |
Distributions receivable from Fidelity Central Funds | | 66 |
Prepaid expenses | | 716 |
Other receivables | | 20,392 |
Total assets | | 143,425,528 |
| | |
Liabilities | | |
Payable for investments purchased | $ 160,278 | |
Payable for fund shares redeemed | 349,022 | |
Accrued management fee | 91,946 | |
Distribution and service plan fees payable | 9,109 | |
Other affiliated payables | 41,379 | |
Other payables and accrued expenses | 71,484 | |
Total liabilities | | 723,218 |
| | |
Net Assets | | $ 142,702,310 |
Net Assets consist of: | | |
Paid in capital | | $ 144,186,805 |
Undistributed net investment income | | 2,747,743 |
Accumulated undistributed net realized gain (loss) on investments and foreign currency transactions | | (12,001,894) |
Net unrealized appreciation (depreciation) on investments and assets and liabilities in foreign currencies | | 7,769,656 |
Net Assets | | $ 142,702,310 |
See accompanying notes which are an integral part of the financial statements.
Annual Report
Financial Statements - continued
Statement of Assets and Liabilities - continued
| October 31, 2011 |
Calculation of Maximum Offering Price Class A:
Net Asset Value and redemption price per share ($10,260,374 ÷ 1,230,909 shares) | | $ 8.34 |
| | |
Maximum offering price per share (100/94.25 of $8.34) | | $ 8.85 |
Class T:
Net Asset Value and redemption price per share ($3,502,217 ÷ 421,495 shares) | | $ 8.31 |
| | |
Maximum offering price per share (100/96.50 of $8.31) | | $ 8.61 |
Class B:
Net Asset Value and offering price per share ($538,949 ÷ 65,051 shares)A | | $ 8.29 |
| | |
Class C:
Net Asset Value and offering price per share ($6,650,468 ÷ 807,272 shares)A | | $ 8.24 |
| | |
Emerging Europe, Middle East, Africa (EMEA):
Net Asset Value, offering price and redemption price per share ($114,117,343 ÷ 13,632,396 shares) | | $ 8.37 |
| | |
Institutional Class:
Net Asset Value, offering price and redemption price per share ($7,632,959 ÷ 911,487 shares) | | $ 8.37 |
A Redemption price per share is equal to net asset value less any applicable contingent deferred sales charge.
See accompanying notes which are an integral part of the financial statements.
Annual Report
Statement of Operations
| Year ended October 31, 2011 |
Investment Income | | |
Dividends | | $ 5,132,884 |
Special dividends | | 786,604 |
Interest | | 112,169 |
Income from Fidelity Central Funds | | 5,640 |
Income before foreign taxes withheld | | 6,037,297 |
Less foreign taxes withheld | | (341,837) |
Total income | | 5,695,460 |
| | |
Expenses | | |
Management fee | $ 1,436,460 | |
Transfer agent fees | 498,396 | |
Distribution and service plan fees | 128,171 | |
Accounting and security lending fees | 92,187 | |
Custodian fees and expenses | 211,210 | |
Independent trustees' compensation | 978 | |
Registration fees | 81,995 | |
Audit | 62,082 | |
Legal | 658 | |
Miscellaneous | 1,418 | |
Total expenses before reductions | 2,513,555 | |
Expense reductions | (160,094) | 2,353,461 |
Net investment income (loss) | | 3,341,999 |
Realized and Unrealized Gain (Loss) Net realized gain (loss) on: | | |
Investment securities: | | |
Unaffiliated issuers | 3,530,080 | |
Foreign currency transactions | (102,414) | |
Total net realized gain (loss) | | 3,427,666 |
Change in net unrealized appreciation (depreciation) on: Investment securities | (17,515,193) | |
Assets and liabilities in foreign currencies | (8,519) | |
Total change in net unrealized appreciation (depreciation) | | (17,523,712) |
Net gain (loss) | | (14,096,046) |
Net increase (decrease) in net assets resulting from operations | | $ (10,754,047) |
See accompanying notes which are an integral part of the financial statements.
Annual Report
Financial Statements - continued
Statement of Changes in Net Assets
| Year ended
October 31,
2011 | Year ended
October 31,
2010 |
Increase (Decrease) in Net Assets | | |
Operations | | |
Net investment income (loss) | $ 3,341,999 | $ 1,510,417 |
Net realized gain (loss) | 3,427,666 | (3,213,726) |
Change in net unrealized appreciation (depreciation) | (17,523,712) | 29,135,993 |
Net increase (decrease) in net assets resulting
from operations | (10,754,047) | 27,432,684 |
Distributions to shareholders from net investment income | (1,835,361) | (816,015) |
Distributions to shareholders from net realized gain | (302,617) | (391,419) |
Total distributions | (2,137,978) | (1,207,434) |
Share transactions - net increase (decrease) | (11,096,734) | 22,045,599 |
Redemption fees | 119,309 | 89,745 |
Total increase (decrease) in net assets | (23,869,450) | 48,360,594 |
| | |
Net Assets | | |
Beginning of period | 166,571,760 | 118,211,166 |
End of period (including undistributed net investment income of $2,747,743 and undistributed net investment income of $1,374,218, respectively) | $ 142,702,310 | $ 166,571,760 |
See accompanying notes which are an integral part of the financial statements.
Annual Report
Financial Highlights - Class A
Years ended October 31, | 2011 | 2010 | 2009 | 2008 I |
Selected Per-Share Data | | | | |
Net asset value, beginning of period | $ 8.97 | $ 7.26 | $ 4.75 | $ 10.00 |
Income from Investment Operations | | | | |
Net investment income (loss) E | .16 H | .07 | .05 | .04 |
Net realized and unrealized gain (loss) | (.70) | 1.70 | 2.48 | (5.31) |
Total from investment operations | (.54) | 1.77 | 2.53 | (5.27) |
Distributions from net investment income | (.08) | (.04) | (.03) | - |
Distributions from net realized gain | (.02) | (.02) | - | - |
Total distributions | (.10) | (.07) K | (.03) | - |
Redemption fees added to paid in capital E | .01 | .01 | .01 | .02 |
Net asset value, end of period | $ 8.34 | $ 8.97 | $ 7.26 | $ 4.75 |
Total Return B, C, D | (6.05)% | 24.66% | 53.78% | (52.50)% |
Ratios to Average Net Assets F, J | | | | |
Expenses before reductions | 1.60% | 1.69% | 1.87% | 2.50% A |
Expenses net of fee waivers, if any | 1.56% | 1.50% | 1.50% | 1.50% A |
Expenses net of all reductions | 1.51% | 1.38% | 1.39% | 1.23% A |
Net investment income (loss) | 1.70% H | .95% | .84% | 1.20% A |
Supplemental Data | | | | |
Net assets, end of period (000 omitted) | $ 10,260 | $ 10,045 | $ 4,817 | $ 1,368 |
Portfolio turnover rate G | 53% | 96% | 58% | 68% |
A Annualized
B Total returns for periods of less than one year are not annualized.
C Total returns would have been lower if certain expenses had not been reduced during the applicable periods shown.
D Total returns do not include the effect of the sales charges.
E Calculated based on average shares outstanding during the period.
F Fees and expenses of any underlying Fidelity Central Funds are not included in the Fund's expense ratio. The Fund indirectly bears its proportionate share of the expenses of any underlying Fidelity Central Funds.
G Amount does not include the portfolio activity of any underlying Fidelity Central Funds.
H Investment income per share reflects a special dividend which amounted to $.04 per share. Excluding the special dividend, the ratio of net investment income (loss) to average net assets would have been 1.25%.
I For the period May 8, 2008 (commencement of operations) to October 31, 2008.
J Expense ratios reflect operating expenses of the class. Expenses before reductions do not reflect amounts reimbursed by the investment adviser or reductions from brokerage service arrangements or reductions from other expense offset arrangements and do not represent the amount paid by the class during periods when reimbursements or reductions occur. Expense ratios before reductions for start-up periods may not be representative of longer-term operating periods. Expenses net of fee waivers reflect expenses after reimbursement by the investment adviser but prior to reductions from brokerage service arrangements or other expense offset arrangements. Expenses net of all reductions represent the net expenses paid by the class.
K Total distributions of $.07 per share is comprised of distributions from net investment income of $.041 and distributions from net realized gain of $.024 per share.
See accompanying notes which are an integral part of the financial statements.
Annual Report
Financial Highlights - Class T
Years ended October 31, | 2011 | 2010 | 2009 | 2008 I |
Selected Per-Share Data | | | | |
Net asset value, beginning of period | $ 8.96 | $ 7.25 | $ 4.75 | $ 10.00 |
Income from Investment Operations | | | | |
Net investment income (loss) E | .13 H | .06 | .04 | .04 |
Net realized and unrealized gain (loss) | (.71) | 1.69 | 2.47 | (5.31) |
Total from investment operations | (.58) | 1.75 | 2.51 | (5.27) |
Distributions from net investment income | (.07) | (.03) | (.02) | - |
Distributions from net realized gain | (.02) | (.02) | - | - |
Total distributions | (.08) K | (.05) | (.02) | - |
Redemption fees added to paid in capital E | .01 | .01 | .01 | .02 |
Net asset value, end of period | $ 8.31 | $ 8.96 | $ 7.25 | $ 4.75 |
Total Return B, C, D | (6.42)% | 24.44% | 53.20% | (52.50)% |
Ratios to Average Net Assets F, J | | | | |
Expenses before reductions | 1.87% | 1.95% | 2.15% | 2.78% A |
Expenses net of fee waivers, if any | 1.84% | 1.75% | 1.75% | 1.75% A |
Expenses net of all reductions | 1.78% | 1.62% | 1.64% | 1.49% A |
Net investment income (loss) | 1.42% H | .70% | .59% | .95% A |
Supplemental Data | | | | |
Net assets, end of period (000 omitted) | $ 3,502 | $ 3,114 | $ 1,560 | $ 568 |
Portfolio turnover rate G | 53% | 96% | 58% | 68% |
A Annualized
B Total returns for periods of less than one year are not annualized.
C Total returns would have been lower if certain expenses had not been reduced during the applicable periods shown.
D Total returns do not include the effect of the sales charges.
E Calculated based on average shares outstanding during the period.
F Fees and expenses of any underlying Fidelity Central Funds are not included in the Fund's expense ratio. The Fund indirectly bears its proportionate share of the expenses of any underlying Fidelity Central Funds.
G Amount does not include the portfolio activity of any underlying Fidelity Central Funds.
H Investment income per share reflects a special dividend which amounted to $.04 per share. Excluding the special dividend, the ratio of net investment income (loss) to average net assets would have been .98%.
I For the period May 8, 2008 (commencement of operations) to October 31, 2008.
J Expense ratios reflect operating expenses of the class. Expenses before reductions do not reflect amounts reimbursed by the investment adviser or reductions from brokerage service arrangements or reductions from other expense offset arrangements and do not represent the amount paid by the class during periods when reimbursements or reductions occur. Expense ratios before reductions for start-up periods may not be representative of longer-term operating periods. Expenses net of fee waivers reflect expenses after reimbursement by the investment adviser but prior to reductions from brokerage service arrangements or other expense offset arrangements. Expenses net of all reductions represent the net expenses paid by the class.
K Total distributions of $.08 per share is comprised of distributions from net investment income of $.068 and distributions from net realized gain of $.015 per share.
See accompanying notes which are an integral part of the financial statements.
Annual Report
Financial Highlights - Class B
Years ended October 31, | 2011 | 2010 | 2009 | 2008 I |
Selected Per-Share Data | | | | |
Net asset value, beginning of period | $ 8.93 | $ 7.23 | $ 4.73 | $ 10.00 |
Income from Investment Operations | | | | |
Net investment income (loss) E | .09 H | .02 | .01 | .02 |
Net realized and unrealized gain (loss) | (.71) | 1.68 | 2.48 | (5.31) |
Total from investment operations | (.62) | 1.70 | 2.49 | (5.29) |
Distributions from net investment income | (.02) | - | - | - |
Distributions from net realized gain | (.01) | (.01) | - | - |
Total distributions | (.03) | (.01) | - | - |
Redemption fees added to paid in capital E | .01 | .01 | .01 | .02 |
Net asset value, end of period | $ 8.29 | $ 8.93 | $ 7.23 | $ 4.73 |
Total Return B, C, D | (6.85)% | 23.72% | 52.85% | (52.70)% |
Ratios to Average Net Assets F, J | | | | |
Expenses before reductions | 2.37% | 2.47% | 2.68% | 3.32% A |
Expenses net of fee waivers, if any | 2.33% | 2.25% | 2.25% | 2.25% A |
Expenses net of all reductions | 2.27% | 2.12% | 2.14% | 1.99% A |
Net investment income (loss) | .93% H | .20% | .09% | .45% A |
Supplemental Data | | | | |
Net assets, end of period (000 omitted) | $ 539 | $ 822 | $ 782 | $ 487 |
Portfolio turnover rate G | 53% | 96% | 58% | 68% |
A Annualized
B Total returns for periods of less than one year are not annualized.
C Total returns would have been lower if certain expenses had not been reduced during the applicable periods shown.
D Total returns do not include the effect of the contingent deferred sales charge.
E Calculated based on average shares outstanding during the period.
F Fees and expenses of any underlying Fidelity Central Funds are not included in the Fund's expense ratio. The Fund indirectly bears its proportionate share of the expenses of any underlying Fidelity Central Funds.
G Amount does not include the portfolio activity of any underlying Fidelity Central Funds.
H Investment income per share reflects a special dividend which amounted to $.04 per share. Excluding the special dividend, the ratio of net investment income (loss) to average net assets would have been .49%.
I For the period May 8, 2008 (commencement of operations) to October 31, 2008.
J Expense ratios reflect operating expenses of the class. Expenses before reductions do not reflect amounts reimbursed by the investment adviser or reductions from brokerage service arrangements or reductions from other expense offset arrangements and do not represent the amount paid by the class during periods when reimbursements or reductions occur. Expense ratios before reductions for start-up periods may not be representative of longer-term operating periods. Expenses net of fee waivers reflect expenses after reimbursement by the investment adviser but prior to reductions from brokerage service arrangements or other expense offset arrangements. Expenses net of all reductions represent the net expenses paid by the class.
See accompanying notes which are an integral part of the financial statements.
Annual Report
Financial Highlights - Class C
Years ended October 31, | 2011 | 2010 | 2009 | 2008 I |
Selected Per-Share Data | | | | |
Net asset value, beginning of period | $ 8.90 | $ 7.23 | $ 4.73 | $ 10.00 |
Income from Investment Operations | | | | |
Net investment income (loss) E | .08 H | .02 | .01 | .02 |
Net realized and unrealized gain (loss) | (.69) | 1.67 | 2.48 | (5.31) |
Total from investment operations | (.61) | 1.69 | 2.49 | (5.29) |
Distributions from net investment income | (.05) | (.01) | - | - |
Distributions from net realized gain | (.02) | (.02) | - | - |
Total distributions | (.06) K | (.03) | - | - |
Redemption fees added to paid in capital E | .01 | .01 | .01 | .02 |
Net asset value, end of period | $ 8.24 | $ 8.90 | $ 7.23 | $ 4.73 |
Total Return B, C, D | (6.79)% | 23.61% | 52.85% | (52.70)% |
Ratios to Average Net Assets F, J | | | | |
Expenses before reductions | 2.36% | 2.45% | 2.61% | 3.28% A |
Expenses net of fee waivers, if any | 2.33% | 2.25% | 2.25% | 2.25% A |
Expenses net of all reductions | 2.27% | 2.13% | 2.14% | 1.99% A |
Net investment income (loss) | .93% H | .20% | .09% | .45% A |
Supplemental Data | | | | |
Net assets, end of period (000 omitted) | $ 6,650 | $ 5,151 | $ 2,677 | $ 741 |
Portfolio turnover rate G | 53% | 96% | 58% | 68% |
A Annualized
B Total returns for periods of less than one year are not annualized.
C Total returns would have been lower if certain expenses had not been reduced during the applicable periods shown.
D Total returns do not include the effect of the contingent deferred sales charge.
E Calculated based on average shares outstanding during the period.
F Fees and expenses of any underlying Fidelity Central Funds are not included in the Fund's expense ratio. The Fund indirectly bears its proportionate share of the expenses of any underlying Fidelity Central Funds.
G Amount does not include the portfolio activity of any underlying Fidelity Central Funds.
H Investment income per share reflects a special dividend which amounted to $.04 per share. Excluding the special dividend, the ratio of net investment income (loss) to average net assets would have been .49%.
I For the period May 8, 2008 (commencement of operations) to October 31, 2008.
J Expense ratios reflect operating expenses of the class. Expenses before reductions do not reflect amounts reimbursed by the investment adviser or reductions from brokerage service arrangements or reductions from other expense offset arrangements and do not represent the amount paid by the class during periods when reimbursements or reductions occur. Expense ratios before reductions for start-up periods may not be representative of longer-term operating periods. Expenses net of fee waivers reflect expenses after reimbursement by the investment adviser but prior to reductions from brokerage service arrangements or other expense offset arrangements. Expenses net of all reductions represent the net expenses paid by the class.
K Total distributions of $.06 per share is comprised of distributions from net investment income of $.047 and distributions from net realized gain of $.015 per share.
See accompanying notes which are an integral part of the financial statements.
Annual Report
Financial Highlights - Emerging Europe, Middle East, Africa (EMEA)
Years ended October 31, | 2011 | 2010 | 2009 | 2008 H |
Selected Per-Share Data | | | | |
Net asset value, beginning of period | $ 9.00 | $ 7.28 | $ 4.76 | $ 10.00 |
Income from Investment Operations | | | | |
Net investment income (loss) D | .18 G | .09 | .07 | .05 |
Net realized and unrealized gain (loss) | (.71) | 1.70 | 2.48 | (5.31) |
Total from investment operations | (.53) | 1.79 | 2.55 | (5.26) |
Distributions from net investment income | (.09) | (.05) | (.04) | - |
Distributions from net realized gain | (.02) | (.02) | - | - |
Total distributions | (.11) | (.08) J | (.04) | - |
Redemption fees added to paid in capital D | .01 | .01 | .01 | .02 |
Net asset value, end of period | $ 8.37 | $ 9.00 | $ 7.28 | $ 4.76 |
Total Return B, C | (5.91)% | 24.92% | 54.15% | (52.40)% |
Ratios to Average Net Assets E, I | | | | |
Expenses before reductions | 1.35% | 1.45% | 1.61% | 2.19% A |
Expenses net of fee waivers, if any | 1.31% | 1.25% | 1.25% | 1.25% A |
Expenses net of all reductions | 1.25% | 1.12% | 1.14% | .98% A |
Net investment income (loss) | 1.95% G | 1.21% | 1.09% | 1.45% A |
Supplemental Data | | | | |
Net assets, end of period (000 omitted) | $ 114,117 | $ 140,270 | $ 104,141 | $ 32,535 |
Portfolio turnover rate F | 53% | 96% | 58% | 68% |
A Annualized
B Total returns for periods of less than one year are not annualized.
C Total returns would have been lower if certain expenses had not been reduced during the applicable periods shown.
D Calculated based on average shares outstanding during the period.
E Fees and expenses of any underlying Fidelity Central Funds are not included in the Fund's expense ratio. The Fund indirectly bears its proportionate share of the expenses of any underlying Fidelity Central Funds.
F Amount does not include the portfolio activity of any underlying Fidelity Central Funds.
G Investment income per share reflects a special dividend which amounted to $.04 per share. Excluding the special dividend, the ratio of net investment income (loss) to average net assets would have been 1.51%.
H For the period May 8, 2008 (commencement of operations) to October 31, 2008.
I Expense ratios reflect operating expenses of the class. Expenses before reductions do not reflect amounts reimbursed by the investment adviser or reductions from brokerage service arrangements or reductions from other expense offset arrangements and do not represent the amount paid by the class during periods when reimbursements or reductions occur. Expense ratios before reductions for start-up periods may not be representative of longer-term operating periods. Expenses net of fee waivers reflect expenses after reimbursement by the investment adviser but prior to reductions from brokerage service arrangements or other expense offset arrangements. Expenses net of all reductions represent the net expenses paid by the class.
J Total distributions of $.08 per share is comprised of distributions from net investment income of $.052 and distributions from net realized gain of $.024 per share.
See accompanying notes which are an integral part of the financial statements.
Annual Report
Financial Highlights - Institutional Class
Years ended October 31, | 2011 | 2010 | 2009 | 2008 H |
Selected Per-Share Data | | | | |
Net asset value, beginning of period | $ 9.00 | $ 7.28 | $ 4.76 | $ 10.00 |
Income from Investment Operations | | | | |
Net investment income (loss) D | .19 G | .09 | .06 | .05 |
Net realized and unrealized gain (loss) | (.72) | 1.70 | 2.49 | (5.31) |
Total from investment operations | (.53) | 1.79 | 2.55 | (5.26) |
Distributions from net investment income | (.09) | (.05) | (.04) | - |
Distributions from net realized gain | (.02) | (.02) | - | - |
Total distributions | (.11) | (.08) J | (.04) | - |
Redemption fees added to paid in capital D | .01 | .01 | .01 | .02 |
Net asset value, end of period | $ 8.37 | $ 9.00 | $ 7.28 | $ 4.76 |
Total Return B, C | (5.91)% | 24.95% | 54.15% | (52.40)% |
Ratios to Average Net Assets E, I | | | | |
Expenses before reductions | 1.26% | 1.34% | 1.60% | 2.12% A |
Expenses net of fee waivers, if any | 1.24% | 1.25% | 1.25% | 1.25% A |
Expenses net of all reductions | 1.19% | 1.13% | 1.14% | .98% A |
Net investment income (loss) | 2.02% G | 1.20% | 1.09% | 1.46% A |
Supplemental Data | | | | |
Net assets, end of period (000 omitted) | $ 7,633 | $ 7,171 | $ 4,235 | $ 2,695 |
Portfolio turnover rate F | 53% | 96% | 58% | 68% |
A Annualized
B Total returns for periods of less than one year are not annualized.
C Total returns would have been lower if certain expenses had not been reduced during the applicable periods shown.
D Calculated based on average shares outstanding during the period.
E Fees and expenses of any underlying Fidelity Central Funds are not included in the Fund's expense ratio. The Fund indirectly bears its proportionate share of the expenses of any underlying Fidelity Central Funds.
F Amount does not include the portfolio activity of any underlying Fidelity Central Funds.
G Investment income per share reflects a special dividend which amounted to $.04 per share. Excluding the special dividend, the ratio of net investment income (loss) to average net assets would have been 1.58%.
H For the period May 8, 2008 (commencement of operations) to October 31, 2008.
I Expense ratios reflect operating expenses of the class. Expenses before reductions do not reflect amounts reimbursed by the investment adviser or reductions from brokerage service arrangements or reductions from other expense offset arrangements and do not represent the amount paid by the class during periods when reimbursements or reductions occur. Expense ratios before reductions for start-up periods may not be representative of longer-term operating periods. Expenses net of fee waivers reflect expenses after reimbursement by the investment adviser but prior to reductions from brokerage service arrangements or other expense offset arrangements. Expenses net of all reductions represent the net expenses paid by the class.
J Total distributions of $.08 per share is comprised of distributions from net investment income of $.054 and distributions from net realized gain of $.024 per share.
See accompanying notes which are an integral part of the financial statements.
Annual Report
Notes to Financial Statements
For the period ended October 31, 2011
1. Organization.
Fidelity Emerging Europe, Middle East, Africa (EMEA) Fund (the Fund) is a non-diversified fund of Fidelity Investment Trust (the Trust) and is authorized to issue an unlimited number of shares. The Trust is registered under the Investment Company Act of 1940, as amended (the 1940 Act), as an open-end management investment company organized as a Massachusetts business trust. The Fund offers Class A, Class T, Class C, Emerging Europe, Middle East, Africa (EMEA) and Institutional Class shares, each of which, along with Class B shares, has equal rights as to assets and voting privileges. Effective after the close of business on September 1, 2010, Class B shares were closed to new accounts and additional purchases, except for exchanges and reinvestments by existing shareholders. Each class has exclusive voting rights with respect to matters that affect that class. Class B shares will automatically convert to Class A shares after a holding period of seven years from the initial date of purchase. Investment income, realized and unrealized capital gains and losses, the common expenses of the Fund, and certain fund-level expense reductions, if any, are allocated on a pro-rata basis to each class based on the relative net assets of each class to the total net assets of the Fund. Each class differs with respect to transfer agent and distribution and service plan fees incurred. Certain expense reductions may also differ by class. The Fund's investments in emerging markets can be subject to social, economic, regulatory, and political uncertainties and can be extremely volatile.
2. Investments in Fidelity Central Funds.
The Fund invests in Fidelity Central Funds, which are open-end investment companies available only to other investment companies and accounts managed by Fidelity Management & Research Company (FMR) and its affiliates. The Fund's Schedule of Investments lists each of the Fidelity Central Funds held as of period end, if any, as an investment of the Fund, but does not include the underlying holdings of each Fidelity Central Fund. As an Investing Fund, the Fund indirectly bears its proportionate share of the expenses of the underlying Fidelity Central Funds.
The Money Market Central Funds seek preservation of capital and current income and are managed by Fidelity Investments Money Management, Inc. (FIMM), an affiliate of FMR.
A complete unaudited list of holdings for each Fidelity Central Fund is available upon request or at the Securities and Exchange Commission (the SEC) web site at www.sec.gov. In addition, the financial statements of the Fidelity Central Funds, which are not covered by the Fund's Report of Independent Registered Public Accounting Firm are available on the SEC web site or upon request.
Annual Report
Notes to Financial Statements - continued
3. Significant Accounting Policies.
The financial statements have been prepared in conformity with accounting principles generally accepted in the United States of America (GAAP), which require management to make certain estimates and assumptions at the date of the financial statements. Actual results could differ from those estimates. Subsequent events, if any, through the date that the financial statements were issued have been evaluated in the preparation of the financial statements. The following summarizes the significant accounting policies of the Fund:
Security Valuation. Investments are valued as of 4:00 p.m. Eastern time on the last calendar day of the period. The Fund uses independent pricing services approved by the Board of Trustees to value its investments. When current market prices or quotations are not readily available or reliable, valuations may be determined in good faith in accordance with procedures adopted by the Board of Trustees. Factors used in determining value may include market or security specific events, changes in interest rates and credit quality. The frequency with which these procedures are used cannot be predicted and they may be utilized to a significant extent. The value used for net asset value (NAV) calculation under these procedures may differ from published prices for the same securities.
The Fund categorizes the inputs to valuation techniques used to value its investments into a disclosure hierarchy consisting of three levels as shown below:
Level 1 - quoted prices in active markets for identical investments
Level 2 - other significant observable inputs (including quoted prices for similar investments, interest rates, prepayment speeds, etc.)
Level 3 - unobservable inputs (including the Fund's own assumptions based on the best information available)
Changes in valuation techniques may result in transfers in or out of an assigned level within the disclosure hierarchy. The aggregate value of investments by input level, as of October 31, 2011, is included at the end of the Fund's Schedule of Investments. Valuation techniques used to value the Fund's investments by major category are as follows:
Equity securities, including restricted securities, for which market quotations are readily available, are valued at the last reported sale price or official closing price as reported by an independent pricing service on the primary market or exchange on which they are traded and are categorized as Level 1 in the hierarchy. In the event there were no sales during the day or closing prices are not available, securities are valued at the last quoted bid price or may be valued using the last available price and are generally categorized as Level 2 in the hierarchy. For foreign equity securities, when significant market or security specific events arise, comparisons to the valuation of American Depositary Receipts
Annual Report
3. Significant Accounting Policies - continued
Security Valuation - continued
(ADRs), futures contracts, Exchange-traded funds (ETFs) and certain indexes as well as quoted prices for similar securities are used and are categorized as Level 2 in the hierarchy in these circumstances. Utilizing these techniques may result in transfers between Level 1 and Level 2. For restricted equity securities and private placements where observable inputs are limited, assumptions about market activity and risk are used and are categorized as Level 3 in the hierarchy.
Debt securities, including restricted securities, are valued based on evaluated prices received from independent pricing services or from dealers who make markets in such securities. For corporate bonds and foreign government and government agency obligations, pricing services utilize matrix pricing which considers yield or price of bonds of comparable quality, coupon, maturity and type as well as dealer supplied prices and are generally categorized as Level 2 in the hierarchy.
When independent prices are unavailable or unreliable, debt securities may be valued utilizing pricing matrices which consider similar factors that would be used by independent pricing services. These are generally categorized as Level 2 in the hierarchy but may be Level 3 depending on the circumstances.
Investments in open-end mutual funds, including Fidelity Central Funds, are valued at their closing net asset value each business day and are categorized as Level 1 in the hierarchy.
Foreign Currency. The Fund may use foreign currency contracts to facilitate transactions in foreign-denominated securities. Gains and losses from these transactions may arise from changes in the value of the foreign currency or if the counterparties do not perform under the contracts' terms.
Foreign-denominated assets, including investment securities, and liabilities are translated into U.S. dollars at the exchange rate at period end. Purchases and sales of investment securities, income and dividends received and expenses denominated in foreign currencies are translated into U.S. dollars at the exchange rate in effect on the transaction date.
The effects of exchange rate fluctuations on investments are included with the net realized and unrealized gain (loss) on investment securities. Other foreign currency transactions resulting in realized and unrealized gain (loss) are disclosed separately.
Investment Transactions and Income. For financial reporting purposes, the Fund's investment holdings and NAV include trades executed through the end of the last business day of the period. The NAV per share for processing shareholder transactions is calculated as of the close of business of the New York Stock Exchange (NYSE) normally
Annual Report
Notes to Financial Statements - continued
3. Significant Accounting Policies - continued
Investment Transactions and Income - continued
4:00 p.m. Eastern time and includes trades executed through the end of the prior business day. Gains and losses on securities sold are determined on the basis of identified cost. Dividend income is recorded on the ex-dividend date, except for certain dividends from foreign securities where the ex-dividend date may have passed, which are recorded as soon as the Fund is informed of the ex-dividend date. Non-cash dividends included in dividend income, if any, are recorded at the fair market value of the securities received. Distributions received on securities that represent a return of capital or capital gain are recorded as a reduction of cost of investments and/or as a realized gain. The Fund estimates the components of distributions received that may be considered return of capital distributions or capital gain distributions. Large, non-recurring dividends recognized by the Fund are presented separately on the Statement of Operations as "Special Dividends" and the impact of these dividends is presented in the Financial Highlights. Interest income and distributions from the Fidelity Central Funds are accrued as earned. Interest income includes coupon interest and amortization of premium and accretion of discount on debt securities. Investment income is recorded net of foreign taxes withheld where recovery of such taxes is uncertain.
Expenses. Expenses directly attributable to a fund are charged to that fund. Expenses attributable to more than one fund are allocated among the respective funds on the basis of relative net assets or other appropriate methods. Expense estimates are accrued in the period to which they relate and adjustments are made when actual amounts are known.
Income Tax Information and Distributions to Shareholders. Each year, the Fund intends to qualify as a regulated investment company, including distributing substantially all of its taxable income and realized gains under Subchapter M of the Internal Revenue Code and filing its U.S. federal tax return. As a result, no provision for income taxes is required. As of October 31, 2011, the Fund did not have any unrecognized tax benefits in the financial statements. A fund's federal tax return is subject to examination by the Internal Revenue Service (IRS) for a period of three years. Foreign taxes are provided for based on the Fund's understanding of the tax rules and rates that exist in the foreign markets in which it invests.
Distributions are declared and recorded on the ex-dividend date. Income dividends and capital gain distributions are declared separately for each class. Income and capital gain distributions are determined in accordance with income tax regulations, which may differ from GAAP.
Capital accounts within the financial statements are adjusted for permanent book-tax differences. These adjustments have no impact on net assets or the results of operations. Temporary book-tax differences will reverse in a subsequent period.
Annual Report
3. Significant Accounting Policies - continued
Income Tax Information and Distributions to Shareholders - continued
Book-tax differences are primarily due to foreign currency transactions, passive foreign investment companies (PFIC), capital loss carry forwards and losses deferred due to wash sales.
The federal tax cost of investment securities and unrealized appreciation (depreciation) as of period end were as follows:
Gross unrealized appreciation | $ 21,839,274 |
Gross unrealized depreciation | (14,802,561) |
Net unrealized appreciation (depreciation) on securities and other investments | $ 7,036,713 |
| |
Tax Cost | $ 135,836,155 |
The tax-based components of distributable earnings as of period end were as follows:
Undistributed ordinary income | $ 2,747,743 |
Capital loss carryforward | $ (11,266,491) |
Net unrealized appreciation (depreciation) | $ 7,034,254 |
Under the recently enacted Regulated Investment Company Modernization Act of 2010 (the Act), the Fund will be permitted to carry forward capital losses incurred in taxable years beginning after December 22, 2010 for an unlimited period. However, any losses incurred during those future taxable years will be required to be utilized prior to any losses incurred in pre-enactment taxable years, which generally expire after eight years from when they are incurred. Additionally, post-enactment capital losses that are carried forward will retain their character as either short-term or long-term capital losses rather than being considered all short-term as under previous law. The Fund's first fiscal year end subject to the Act will be October 31, 2012.
The tax character of distributions paid was as follows:
| October 31, 2011 | October 31, 2010 |
Ordinary Income | $ 2,137,978 | $ 1,207,434 |
Short-Term Trading (Redemption) Fees. Shares held by investors in the Fund less than 90 days are subject to a redemption fee equal to 1.50% of the net asset value of shares redeemed. All redemption fees, which reduce the proceeds of the shareholder redemption, are retained by the Fund and accounted for as an addition to paid in capital.
Annual Report
Notes to Financial Statements - continued
3. Significant Accounting Policies - continued
New Accounting Pronouncement. In May 2011, the Financial Accounting Standards Board issued Accounting Standard Update No. 2011-04, Fair Value Measurement (Topic 820) - Amendments to Achieve Common Fair Value Measurement and Disclosure Requirements in U.S. GAAP and IFRSs. The update changes the wording used to describe the requirements in GAAP for measuring fair value and for disclosing information about fair value measurements. The update is effective during interim and annual periods beginning after December 15, 2011. Management is currently evaluating the impact of the update's adoption on the Fund's financial statement disclosures.
4. Purchases and Sales of Investments.
Purchases and sales of securities other than short-term securities, aggregated $91,399,924 and $94,303,247, respectively.
5. Fees and Other Transactions with Affiliates.
Management Fee. FMR and its affiliates provide the Fund with investment management related services for which the Fund pays a monthly management fee. The management fee is the sum of an individual fund fee rate that is based on an annual rate of .55% of the Fund's average net assets and a group fee rate that averaged .26% during the period. The group fee rate is based upon the average net assets of all the mutual funds advised by FMR. The group fee rate decreases as assets under management increase and increases as assets under management decrease. For the period, the total annual management fee rate was .81% of the Fund's average net assets.
Distribution and Service Plan Fees. In accordance with Rule 12b-1 of the 1940 Act, the Fund has adopted separate Distribution and Service Plans for each class of shares. Certain classes pay Fidelity Distributors Corporation (FDC), an affiliate of FMR, separate Distribution and Service Fees, each of which is based on an annual percentage of each class' average net assets. In addition, FDC may pay financial intermediaries for selling shares of the Fund and providing shareholder support services. For the period, the Distribution and Service Fee rates, total fees and amounts retained by FDC were as follows:
| Distribution
Fee | Service
Fee | Total Fees | Retained
by FDC |
Class A | -% | .25% | $ 30,466 | $ 2,908 |
Class T | .25% | .25% | 18,756 | 28 |
Class B | .75% | .25% | 7,308 | 5,498 |
Class C | .75% | .25% | 71,641 | 32,384 |
| | | $ 128,171 | $ 40,818 |
Annual Report
5. Fees and Other Transactions with Affiliates - continued
Sales Load. FDC may receive a front-end sales charge of up to 5.75% for selling Class A shares, and 3.50% for selling Class T shares, some of which is paid to financial intermediaries for selling shares of the Fund. Depending on the holding period, FDC may receive contingent deferred sales charges levied on Class A, Class T, Class B, and Class C redemptions. The deferred sales charges range from 5% to 1% for Class B, 1% for Class C, 1.00% for certain purchases of Class A shares and .25% for certain purchases of Class T shares.
For the period, sales charge amounts retained by FDC were as follows:
| Retained
by FDC |
Class A | $ 11,710 |
Class T | 2,792 |
Class B* | 2,575 |
Class C* | 1,417 |
| $ 18,494 |
* When Class B and Class C shares are initially sold, FDC pays commissions from its own resources to financial intermediaries through which the sales are made.
Transfer Agent Fees. Fidelity Investments Institutional Operations Company, Inc. (FIIOC), an affiliate of FMR, is the transfer, dividend disbursing and shareholder servicing agent for each class of the Fund. FIIOC receives account fees and asset-based fees that vary according to the account size and type of account of the shareholders of the respective classes of the Fund. FIIOC pays for typesetting, printing and mailing of shareholder reports, except proxy statements. For the period, transfer agent fees for each class were as follows:
| Amount | % of
Average
Net Assets |
Class A | $ 34,413 | .28 |
Class T | 11,646 | .31 |
Class B | 2,238 | .31 |
Class C | 20,980 | .29 |
Emerging Europe, Middle East, Africa (EMEA) | 410,243 | .28 |
Institutional Class | 18,876 | .20 |
| $ 498,396 | |
Accounting and Security Lending Fees. Fidelity Service Company, Inc. (FSC), an affiliate of FMR, maintains the Fund's accounting records. The accounting fee is based on the level of average net assets for the month. Under a separate contract, FSC administers the security lending program. The security lending fee is based on the number and duration of lending transactions.
Annual Report
Notes to Financial Statements - continued
5. Fees and Other Transactions with Affiliates - continued
Brokerage Commissions. The Fund placed a portion of its portfolio transactions with brokerage firms which are affiliates of the investment adviser. The commissions paid to these affiliated firms were $145 for the period.
6. Committed Line of Credit.
The Fund participates with other funds managed by FMR or an affiliate in a $4.0 billion credit facility (the "line of credit") to be utilized for temporary or emergency purposes to fund shareholder redemptions or for other short-term liquidity purposes. The Fund has agreed to pay commitment fees on its pro-rata portion of the line of credit, which amounted to $554 and is reflected in Miscellaneous expenses on the Statement of Operations. During the period, there were no borrowings on this line of credit.
7. Security Lending.
The Fund lends portfolio securities through a lending agent from time to time in order to earn additional income. For equity securities, a lending agent is used and may loan securities to certain qualified borrowers, including Fidelity Capital Markets (FCM), a broker-dealer affiliated with the Fund. On the settlement date of the loan, the Fund receives collateral (in the form of U.S. Treasury obligations, letters of credit and/or cash) against the loaned securities and maintains collateral in an amount not less than 100% of the market value of the loaned securities during the period of the loan. The market value of the loaned securities is determined at the close of business of the Fund and any additional required collateral is delivered to the Fund on the next business day. If the borrower defaults on its obligation to return the securities loaned because of insolvency or other reasons, a fund could experience delays and costs in recovering the securities loaned or in gaining access to the collateral. Any cash collateral received is invested in the Fidelity Securities Lending Cash Central Fund. At period end, there were no security loans outstanding. Security lending income represents the income earned on investing cash collateral, less rebates paid to borrowers and any lending agent fees associated with the loan, plus any premium payments received for lending certain types of securities. Security lending income is presented in the Statement of Operations as a component of income from Fidelity Central Funds. Total security lending income during the period amounted to $25. During the period, there were no securities loaned to FCM.
8. Expense Reductions.
FMR voluntarily agreed to reimburse each class to the extent annual operating expenses exceeded certain levels of average net assets as noted in the table below. Some expenses, for example interest expense, including commitment fees, are excluded from this reimbursement.
Annual Report
8. Expense Reductions - continued
The following classes were in reimbursement during the period:
| Expense
Limitations | Reimbursement
from adviser |
Class A | 1.50%-1.65%* | $ 4,071 |
Class T | 1.75%-1.90%* | 1,321 |
Class B | 2.25%-2.40%* | 321 |
Class C | 2.25%-2.40%* | 2,211 |
Emerging Europe, Middle East, Africa (EMEA) | 1.25%-1.40%* | 56,199 |
Institutional Class | 1.25%-1.40%* | 1,658 |
| | $ 65,781 |
* Expense limitation in effect at period end.
Many of the brokers with whom FMR places trades on behalf of the Fund provided services to the Fund in addition to trade execution. These services included payments of certain expenses on behalf of the Fund totaling $94,313 for the period.
9. Distributions to Shareholders.
Distributions to shareholders of each class were as follows:
Years ended October 31, | 2011 | 2010 |
From net investment income | | |
Class A | $ 97,896 | $ 26,924 |
Class T | 26,168 | 5,586 |
Class B | 1,907 | - |
Class C | 32,267 | 2,308 |
Emerging Europe, Middle East, Africa (EMEA) | 1,585,636 | 748,050 |
Institutional Class | 91,487 | 33,147 |
Total | $ 1,835,361 | $ 816,015 |
From net realized gain | | |
Class A | $ 18,012 | $ 15,761 |
Class T | 5,690 | 5,156 |
Class B | 902 | 1,284 |
Class C | 9,924 | 9,232 |
Emerging Europe, Middle East, Africa (EMEA) | 253,422 | 345,254 |
Institutional Class | 14,667 | 14,732 |
Total | $ 302,617 | $ 391,419 |
Annual Report
Notes to Financial Statements - continued
10. Share Transactions.
Transactions for each class of shares were as follows:
| Shares | Dollars |
Years ended October 31, | 2011 | 2010 | 2011 | 2010 |
Class A | | | | |
Shares sold | 827,297 | 750,400 | $ 7,697,437 | $ 5,978,580 |
Reinvestment of distributions | 10,020 | 5,604 | 92,483 | 40,683 |
Shares redeemed | (725,856) | (299,775) | (6,651,188) | (2,302,163) |
Net increase (decrease) | 111,461 | 456,229 | $ 1,138,732 | $ 3,717,100 |
Class T | | | | |
Shares sold | 164,342 | 258,490 | $ 1,527,510 | $ 2,070,251 |
Reinvestment of distributions | 3,447 | 1,476 | 31,848 | 10,717 |
Shares redeemed | (94,003) | (127,308) | (862,784) | (967,322) |
Net increase (decrease) | 73,786 | 132,658 | $ 696,574 | $ 1,113,646 |
Class B | | | | |
Shares sold | 9,372 | 50,154 | $ 87,632 | $ 403,463 |
Reinvestment of distributions | 285 | 173 | 2,673 | 1,261 |
Shares redeemed | (36,653) | (66,507) | (325,442) | (516,486) |
Net increase (decrease) | (26,996) | (16,180) | $ (235,137) | $ (111,762) |
Class C | | | | |
Shares sold | 438,284 | 353,916 | $ 4,066,195 | $ 2,814,751 |
Reinvestment of distributions | 4,100 | 1,559 | 37,820 | 11,306 |
Shares redeemed | (213,656) | (147,366) | (1,892,778) | (1,102,603) |
Net increase (decrease) | 228,728 | 208,109 | $ 2,211,237 | $ 1,723,454 |
Emerging Europe, Middle East, Africa (EMEA) | | | | |
Shares sold | 7,381,313 | 10,587,461 | $ 68,910,601 | $ 85,331,520 |
Reinvestment of distributions | 187,137 | 144,800 | 1,730,170 | 1,051,250 |
Shares redeemed | (9,520,946) | (9,457,558) | (86,802,311) | (72,517,018) |
Net increase (decrease) | (1,952,496) | 1,274,703 | $ (16,161,540) | $ 13,865,752 |
Institutional Class | | | | |
Shares sold | 597,666 | 319,437 | $ 5,560,036 | $ 2,551,378 |
Reinvestment of distributions | 1,263 | 825 | 11,681 | 5,986 |
Shares redeemed | (484,423) | (105,236) | (4,318,317) | (819,955) |
Net increase (decrease) | 114,506 | 215,026 | $ 1,253,400 | $ 1,737,409 |
Annual Report
11. Other.
The Fund's organizational documents provide former and current trustees and officers with a limited indemnification against liabilities arising in connection with the performance of their duties to the Fund. In the normal course of business, the Fund may also enter into contracts that provide general indemnifications. The Fund's maximum exposure under these arrangements is unknown as this would be dependent on future claims that may be made against the Fund. The risk of material loss from such claims is considered remote.
At the end of the period, FMR or its affiliates were the owners of record of 10% of the total outstanding shares of the Fund.
Annual Report
To the Trustees of Fidelity Investment Trust and Shareholders of Fidelity Emerging Europe, Middle East, Africa (EMEA) Fund:
We have audited the accompanying statement of assets and liabilities of Fidelity Emerging Europe, Middle East, Africa (EMEA) Fund (the Fund), a fund of Fidelity Investment Trust, including the schedule of investments, as of October 31, 2011, and the related statement of operations for the year then ended, the statement of changes in net assets for each of the two years in the period then ended, and the financial highlights for each of the three years in the period then ended and the period May 8, 2008 (commencement of operations) to October 31, 2008. These financial statements and financial highlights are the responsibility of the Fund's management. Our responsibility is to express an opinion on these financial statements and financial highlights based on our audits.
We conducted our audits in accordance with the standards of the Public Company Accounting Oversight Board (United States). Those standards require that we plan and perform the audit to obtain reasonable assurance about whether the financial statements and financial highlights are free of material misstatement. The Fund is not required to have, nor were we engaged to perform, an audit of its internal control over financial reporting. Our audits included consideration of internal control over financial reporting as a basis for designing audit procedures that are appropriate in the circumstances, but not for the purpose of expressing an opinion on the effectiveness of the Fund's internal control over financial reporting. Accordingly, we express no such opinion. An audit also includes examining, on a test basis, evidence supporting the amounts and disclosures in the financial statements, assessing the accounting principles used and significant estimates made by management, as well as evaluating the overall financial statement presentation. Our procedures included confirmation of securities owned as of October 31, 2011, by correspondence with the custodians and brokers; where replies were not received from brokers, we performed other auditing procedures. We believe that our audits provide a reasonable basis for our opinion.
In our opinion, the financial statements and financial highlights referred to above present fairly, in all material respects, the financial position of Fidelity Emerging Europe, Middle East, Africa (EMEA) Fund as of October 31, 2011, the results of its operations for the year then ended, the changes in its net assets for each of the two years in the period then ended, and the financial highlights for each of the three years in the period then ended and the period May 8, 2008 (commencement of operations) to October 31, 2008, in conformity with accounting principles generally accepted in the United States of America.
DELOITTE & TOUCHE LLP
Boston, Massachusetts
December 15, 2011
Annual Report
The Trustees, Members of the Advisory Board, and executive officers of the trust and fund, as applicable, are listed below. The Board of Trustees governs the fund and is responsible for protecting the interests of shareholders. The Trustees are experienced executives who meet periodically throughout the year to oversee the fund's activities, review contractual arrangements with companies that provide services to the fund, oversee management of the risks associated with such activities and contractual arrangements, and review the fund's performance. Except for James C. Curvey, each of the Trustees oversees 226 funds advised by FMR or an affiliate. Mr. Curvey oversees 429 funds advised by FMR or an affiliate.
The Trustees hold office without limit in time except that (a) any Trustee may resign; (b) any Trustee may be removed by written instrument, signed by at least two-thirds of the number of Trustees prior to such removal; (c) any Trustee who requests to be retired or who has become incapacitated by illness or injury may be retired by written instrument signed by a majority of the other Trustees; and (d) any Trustee may be removed at any special meeting of shareholders by a two-thirds vote of the outstanding voting securities of the trust. Each Trustee who is not an interested person (as defined in the 1940 Act) (Independent Trustee), shall retire not later than the last day of the calendar year in which his or her 75th birthday occurs. The Independent Trustees may waive this mandatory retirement age policy with respect to individual Trustees. The executive officers and Advisory Board Members hold office without limit in time, except that any officer and Advisory Board Member may resign or may be removed by a vote of a majority of the Trustees at any regular meeting or any special meeting of the Trustees. Except as indicated, each individual has held the office shown or other offices in the same company for the past five years.
Experience, Skills, Attributes, and Qualifications of the Fund's Trustees. The Governance and Nominating Committee has adopted a statement of policy that describes the experience, qualifications, attributes, and skills that are necessary and desirable for potential Independent Trustee candidates (Statement of Policy). The Board believes that each Trustee satisfied at the time he or she was initially elected or appointed a Trustee, and continues to satisfy, the standards contemplated by the Statement of Policy. The Governance and Nominating Committee also engages professional search firms to help identify potential Independent Trustee candidates who have the experience, qualifications, attributes, and skills consistent with the Statement of Policy. From time to time, additional criteria based on the composition and skills of the current Independent Trustees, as well as experience or skills that may be appropriate in light of future changes to board composition, business conditions, and regulatory or other developments, have also been considered by the professional search firms and the Governance and Nominating Committee. In addition, the Board takes into account the Trustees' commitment and participation in Board and committee meetings, as well as their leadership of standing and ad hoc committees throughout their tenure.
In determining that a particular Trustee was and continues to be qualified to serve as a Trustee, the Board has considered a variety of criteria, none of which, in isolation, was controlling. The Board believes that, collectively, the Trustees have balanced and diverse experience, qualifications, attributes, and skills, which allow the Board to operate effectively in governing the fund and protecting the interests of shareholders. Information about the specific experience, skills, attributes, and qualifications of each Trustee, which in each case led to the Board's conclusion that the Trustee should serve (or continue to serve) as a trustee of the fund, is provided below.
Annual Report
Trustees and Officers - continued
Board Structure and Oversight Function. James C. Curvey is an interested person (as defined in the 1940 Act) and currently serves as Acting Chairman. The Trustees have determined that an interested Chairman is appropriate and benefits shareholders because an interested Chairman has a personal and professional stake in the quality and continuity of services provided to the fund. Independent Trustees exercise their informed business judgment to appoint an individual of their choosing to serve as Chairman, regardless of whether the Trustee happens to be independent or a member of management. The Independent Trustees have determined that they can act independently and effectively without having an Independent Trustee serve as Chairman and that a key structural component for assuring that they are in a position to do so is for the Independent Trustees to constitute a substantial majority for the Board. The Independent Trustees also regularly meet in executive session. Ned C. Lautenbach serves as Chairman of the Independent Trustees and as such (i) acts as a liaison between the Independent Trustees and management with respect to matters important to the Independent Trustees and (ii) with management prepares agendas for Board meetings.
Fidelity funds are overseen by different Boards of Trustees. The fund's Board oversees Fidelity's equity and high income funds and another Board oversees Fidelity's investment-grade bond, money market, and asset allocation funds. The asset allocation funds may invest in Fidelity funds overseen by the fund's Board. The use of separate Boards, each with its own committee structure, allows the Trustees of each group of Fidelity funds to focus on the unique issues of the funds they oversee, including common research, investment, and operational issues. On occasion, the separate Boards establish joint committees to address issues of overlapping consequences for the Fidelity funds overseen by each Board.
The Trustees operate using a system of committees to facilitate the timely and efficient consideration of all matters of importance to the Trustees, the fund, and fund shareholders and to facilitate compliance with legal and regulatory requirements and oversight of the fund's activities and associated risks. The Board, acting through its committees, has charged FMR and its affiliates with (i) identifying events or circumstances the occurrence of which could have demonstrably adverse effects on the fund's business and/or reputation; (ii) implementing processes and controls to lessen the possibility that such events or circumstances occur or to mitigate the effects of such events or circumstances if they do occur; and (iii) creating and maintaining a system designed to evaluate continuously business and market conditions in order to facilitate the identification and implementation processes described in (i) and (ii) above. Because the day-to-day operations and activities of the fund are carried out by or through FMR, its affiliates and other service providers, the fund's exposure to risks is mitigated but not eliminated by the processes overseen by the Trustees. While each of the Board's committees has responsibility for overseeing different aspects of the fund's activities, oversight is exercised primarily through the Operations, Audit, and Compliance Committees. In addition, the Independent Trustees have worked with FMR to enhance the Board's oversight of investment and financial risks, legal and regulatory risks, technology risks, and operational risks, including the development of additional risk reporting to the Board. For example, a working group comprised of Independent Trustees and FMR has worked and continues to work to review the Fidelity funds' valuation-related activities, reporting and risk management. Appropriate personnel, including but not limited to the fund's Chief Compliance Officer (CCO), FMR's internal auditor, the independent accountants, the fund's Treasurer and portfolio management personnel, make periodic reports to the Board's committees, as appropriate, including an annual review of FMR's risk management program for the Fidelity funds. The responsibilities of each standing committee, including their oversight responsibilities, are described further under "Standing Committees of the Fund's Trustees."
Annual Report
The fund's Statement of Additional Information (SAI) includes more information about the Trustees. To request a free copy, call Fidelity at 1-877-208-0098.
Interested Trustees*:
Correspondence intended for each Trustee who is an interested person may be sent to Fidelity Investments, 82 Devonshire Street, Boston, Massachusetts 02109.
Name, Age; Principal Occupations and Other Relevant Experience+ |
James C. Curvey (76) |
| Year of Election or Appointment: 2007 Mr. Curvey is Trustee and Acting Chairman of the Board of Trustees of certain Trusts. Mr. Curvey also serves as Trustee (2007-present) of other investment companies advised by FMR. Mr. Curvey is a Director of Fidelity Investments Money Management, Inc. (2009-present), Director of Fidelity Research & Analysis Co. (2009-present) and Director of FMR and FMR Co., Inc. (2007-present). Mr. Curvey is also Vice Chairman (2007-present) and Director of FMR LLC. In addition, Mr. Curvey serves as an Overseer for the Boston Symphony Orchestra and a member of the Trustees of Villanova University. Previously, Mr. Curvey was the Vice Chairman (2006-2007) and Director (2000-2007) of FMR Corp. |
Ronald P. O'Hanley (54) |
| Year of Election or Appointment: 2011 Mr. O'Hanley is Director of FMR Co., Inc. (2010-present), Director of Fidelity Investments Money Management, Inc. (2010-present), Director of Fidelity Research & Analysis Company (2010-present), President of Fidelity Asset Management and Corporate Services and a member of Fidelity's Executive Committee (2010-present). Previously, Mr. O'Hanley served as President and Chief Executive Officer of BNY Mellon Asset Management (2007-2010). Mr. O'Hanley also served as Vice Chairman of Bank New York Mellon Corp. and a member of that firm's Executive Committee. Prior to the 2007 merger of The Bank of New York and Mellon Financial Corporation, he was Vice Chairman of Mellon Financial Corporation and President and Chief Executive Officer of Mellon Asset Management. He joined Mellon in February 1997. Mr. O'Hanley currently serves as Chairman of the Boston Public Library Foundation Board of Directors and sits on the Board of Directors of Beth Israel Deaconess Medical Center, the Board of Trustees of the Marine Biological Laboratory and the Advisory Board of the Maxwell School of Citizenship and Public Administration at Syracuse University. Mr. O'Hanley also chairs the Council on Asset Management for the Financial Services Roundtable and is a member of the Board of Directors of Institutional Investor's U.S. Institute. |
* Trustees have been determined to be "Interested Trustees" by virtue of, among other things, their affiliation with the trust or various entities under common control with FMR.
+ The information above includes each Trustee's principal occupation during the last five years and other information relating to the experience, attributes, and skills relevant to each Trustee's qualifications to serve as a Trustee, which led to the conclusion that each Trustee should serve as a Trustee for the fund.
Annual Report
Independent Trustees:
Correspondence intended for each Independent Trustee (that is, the Trustees other than the Interested Trustees) may be sent to Fidelity Investments, P.O. Box 55235, Boston, Massachusetts 02205-5235.
Name, Age; Principal Occupations and Other Relevant Experience+ |
Dennis J. Dirks (63) |
| Year of Election or Appointment: 2005 Prior to his retirement in May 2003, Mr. Dirks was Chief Operating Officer and a member of the Board of The Depository Trust & Clearing Corporation (DTCC). He also served as President, Chief Operating Officer, and Board member of The Depository Trust Company (DTC) and President and Board member of the National Securities Clearing Corporation (NSCC). In addition, Mr. Dirks served as Chief Executive Officer and Board member of the Government Securities Clearing Corporation, Chief Executive Officer and Board member of the Mortgage-Backed Securities Clearing Corporation, as a Trustee and a member of the Finance Committee of Manhattan College (2005-2008), and as a Trustee and a member of the Finance Committee of AHRC of Nassau County (2006-2008). Mr. Dirks is a member of the Independent Directors Council (IDC) Governing Council (2010-Present) and Board of Directors for The Brookville Center for Children's Services, Inc. (2009-present). |
Alan J. Lacy (58) |
| Year of Election or Appointment: 2008 Mr. Lacy serves as Senior Adviser (2007-present) of Oak Hill Capital Partners, L.P. (private equity). Mr. Lacy also served as Chief Executive Officer (2000-2005) and Vice Chairman (2005-2006) of Sears Holdings Corporation and Sears, Roebuck and Co. (retail). In addition, Mr. Lacy serves as a member of the Board of Directors of Dave & Buster's, Inc. (restaurant and entertainment complexes, 2010-present), The Hillman Companies, Inc. (hardware wholesalers, 2010-present), and Bristol-Myers Squibb Company (global pharmaceuticals, 2007-present). Mr. Lacy is a member of the Board of Trustees of The National Parks Conservation Association (2006-Present). Previously, Mr. Lacy served as Chairman of the Board of Trustees of the National Parks Conservation Association (2008-2011) and as a member of the Board of Directors for the Western Union Company (global money transfer, 2006-2011). |
Ned C. Lautenbach (67) |
| Year of Election or Appointment: 2000 Mr. Lautenbach is Chairman of the Independent Trustees of the Equity and High Income Funds (2006-present). Mr. Lautenbach currently serves as the Lead Director of the Eaton Corporation Board of Directors (diversified industrial, 1997-present). Mr. Lautenbach is also a member of the Board of Directors of the Philharmonic Center for the Arts in Naples, Florida (1999-present); a member of the Board of Trustees of Fairfield University (2005-present); and a member of the Council on Foreign Relations (1994-present). Previously, Mr. Lautenbach was a Partner/Advisory Partner at Clayton, Dubilier & Rice, LLC (private equity investment, 1998-2010), as well as a Director of Sony Corporation (2006-2007). |
Joseph Mauriello (67) |
| Year of Election or Appointment: 2008 Prior to his retirement in January 2006, Mr. Mauriello served in numerous senior management positions including Deputy Chairman and Chief Operating Officer (2004-2005), and Vice Chairman of Financial Services (2002-2004) of KPMG LLP US (professional services, 1965-2005). Mr. Mauriello currently serves as a member of the Board of Directors of XL Group plc. (global insurance and re-insurance, 2006-present) and of Arcadia Resources Inc. (health care services and products, 2007-present). Previously, Mr. Mauriello served as a Director of the Hamilton Funds of the Bank of New York (2006-2007). |
Robert W. Selander (61) |
| Year of Election or Appointment: 2011 Previously, Mr. Selander served as a Member of the Advisory Board of Fidelity's Equity and High Income Funds (2011), Executive Vice Chairman (2010), Chief Executive Officer (2009-2010), and President and Chief Executive Officer (1997-2009) of Mastercard, Inc. |
Cornelia M. Small (67) |
| Year of Election or Appointment: 2005 Ms. Small is a member of the Board of Directors of the Teagle Foundation (2009-present). Ms. Small is also a member of the Investment Committee, and Chair (2008-present) and a member of the Board of Trustees of Smith College. In addition, Ms. Small serves on the Investment Committee of the Berkshire Taconic Community Foundation (2008-present). Previously, Ms. Small served as Chairperson of the Investment Committee (2002-2008) of Smith College. In addition, Ms. Small served as Chief Investment Officer, Director of Global Equity Investments, and a member of the Board of Directors of Scudder, Stevens & Clark and Scudder Kemper Investments. |
William S. Stavropoulos (72) |
| Year of Election or Appointment: 2001 Mr. Stavropoulos is Vice Chairman of the Independent Trustees of the Equity and High Income Funds (2006-present). Mr. Stavropoulos serves as President and Founder of the Michigan Baseball Foundation, the Great Lakes Loons (2007-present). Mr. Stavropoulos is Chairman Emeritus of the Board of Directors of The Dow Chemical Company, where he previously served in numerous senior management positions, including President, CEO (1995-2000; 2002-2004), Chairman of the Executive Committee (2000-2006), and as a member of the Board of Directors (1990-2006). Currently, Mr. Stavropoulos is Chairman of Univar (global distributor of commodity and specialty chemicals, 2010-present), a Director of Teradata Corporation (data warehousing and technology solutions, 2008-present), Chemical Financial Corporation, Maersk Inc. (industrial conglomerate), Tyco International, Inc. (multinational manufacturing and services, 2007-present), and a member of the Advisory Board for Metalmark Capital (private equity investment, 2005-present). Mr. Stavropoulos is a special advisor to Clayton, Dubilier & Rice, LLC (private equity investment). In addition, Mr. Stavropoulos is a member of the University of Notre Dame Advisory Council for the College of Science. |
David M. Thomas (62) |
| Year of Election or Appointment: 2008 Previously, Mr. Thomas served as Executive Chairman (2005-2006) and Chairman and Chief Executive Officer (2000-2005) of IMS Health, Inc. (pharmaceutical and healthcare information solutions). In addition, Mr. Thomas serves as a member of the Board of Directors of Fortune Brands, Inc. (consumer products), and Interpublic Group of Companies, Inc. (marketing communication, 2004-present). |
Michael E. Wiley (61) |
| Year of Election or Appointment: 2008 Mr. Wiley also serves as a Director of Asia Pacific Exploration Consolidated (international oil and gas exploration and production, 2008-present). Mr. Wiley serves as a Director of Tesoro Corporation (independent oil refiner and marketer, 2005-present), and a Director of Bill Barrett Corporation (exploration and production, 2005-present). In addition, Mr. Wiley also serves as a Director of Post Oak Bank (privately-held bank, 2004-present). Previously, Mr. Wiley served as a member of the Board of Trustees of the University of Tulsa (2000-2006; 2007-2010), as a Senior Energy Advisor of Katzenbach Partners, LLC (consulting, 2006-2007), as an Advisory Director of Riverstone Holdings (private investment), Chairman, President, and CEO of Baker Hughes, Inc. (oilfield services, 2000-2004), and as Director of Spinnaker Exploration Company (exploration and production, 2001-2005). |
Annual Report
Trustees and Officers - continued
+ The information above includes each Trustee's principal occupation during the last five years and other information relating to the experience, attributes, and skills relevant to each Trustee's qualifications to serve as a Trustee, which led to the conclusion that each Trustee should serve as a Trustee for the fund.
Advisory Board Members and Executive Officers:
Correspondence intended for each executive officer, Edward C. Johnson 3d, and Peter S. Lynch may be sent to Fidelity Investments, 82 Devonshire Street, Boston, Massachusetts 02109.
Name, Age; Principal Occupation |
Edward C. Johnson 3d (81) |
| Year of Election or Appointment: 2011 Member of the Advisory Board of Fidelity's Equity and High Income Funds. Mr. Johnson serves as Chief Executive Officer, Chairman, and a Director of FMR LLC, and also serves as Chairman and Director of FIL Limited. Previously, Mr. Johnson served as a Trustee and Chairman of the Board of certain Fidelity Trusts, Chairman and a Director of FMR, Chairman and a Director of FMR Co., Inc., and President of FMR LLC (2006-2007). |
Peter S. Lynch (67) |
| Year of Election or Appointment: 2003 Member of the Advisory Board of Fidelity's Equity and High Income Funds. Mr. Lynch is Vice Chairman and a Director of FMR and FMR Co., Inc. In addition, Mr. Lynch serves as a Trustee of Boston College and as the Chairman of the Inner-City Scholarship Fund. Previously, Mr. Lynch served on the Special Olympics International Board of Directors (1997-2006). |
Kenneth B. Robins (42) |
| Year of Election or Appointment: 2008 President and Treasurer of Fidelity's Equity and High Income Funds. Mr. Robins also serves as President and Treasurer (2010-present) and Assistant Treasurer (2009-present) of other Fidelity funds and is an employee of Fidelity Investments (2004-present). Previously, Mr. Robins served as Deputy Treasurer of the Fidelity funds (2005-2008) and Treasurer and Chief Financial Officer of The North Carolina Capital Management Trust: Cash and Term Portfolios (2006-2008). |
Bruce T. Herring (46) |
| Year of Election or Appointment: 2006 Vice President of certain Equity Funds. Mr. Herring also serves as Chief Investment Officer and Director of Fidelity Management & Research (U.K.) Inc. (2010-present) and Group Chief Investments Officer of FMR. Previously, Mr. Herring served as Vice President (2005-2006) and Senior Vice President (2006-2007) of Fidelity Management & Research Company, Vice President of FMR Co., Inc. (2001-2007) and as a portfolio manager for Fidelity U.S. Equity Funds. |
Brian B. Hogan (47) |
| Year of Election or Appointment: 2009 Vice President of Equity and High Income Funds. Mr. Hogan also serves as President of FMR's Equity Division (2009-present). Previously, Mr. Hogan served as Senior Vice President, Equity Research of FMR (2006-2009) and as a portfolio manager. |
Scott C. Goebel (43) |
| Year of Election or Appointment: 2008 Secretary and Chief Legal Officer (CLO) of the Fidelity funds. Mr. Goebel also serves as Secretary of Fidelity Investments Money Management, Inc. (FIMM) (2010-present) and Fidelity Research and Analysis Company (FRAC) (2010-present); Secretary and CLO of The North Carolina Capital Management Trust: Cash and Term Portfolios (2008-present); General Counsel, Secretary, and Senior Vice President of FMR (2008-present) and FMR Co., Inc. (2008-present); employed by FMR LLC or an affiliate (2001-present); Chief Legal Officer of Fidelity Management & Research (Hong Kong) Limited (2008-present) and Assistant Secretary of Fidelity Management & Research (Japan) Inc. (2008-present), and Fidelity Management & Research (U.K.) Inc. (2008-present). Previously, Mr. Goebel served as Assistant Secretary of FIMM (2008-2010), FRAC (2008-2010), and the Funds (2007-2008) and as Vice President and Secretary of Fidelity Distributors Corporation (FDC) (2005-2007). |
William C. Coffey (42) |
| Year of Election or Appointment: 2009 Assistant Secretary of Fidelity's Equity and High Income Funds. Mr. Coffey also serves as Senior Vice President and Deputy General Counsel of FMR LLC (2010-present), and is an employee of Fidelity Investments. Previously, Mr. Coffey served as Vice President and Associate General Counsel of FMR LLC (2005-2009). |
Holly C. Laurent (57) |
| Year of Election or Appointment: 2008 Anti-Money Laundering (AML) Officer of the Fidelity funds. Ms. Laurent also serves as AML Officer of The North Carolina Capital Management Trust: Cash and Term Portfolios (2008-present) and is an employee of Fidelity Investments. Previously, Ms. Laurent was Senior Vice President and Head of Legal for Fidelity Business Services India Pvt. Ltd. (2006-2008), and Senior Vice President, Deputy General Counsel and Group Head for FMR LLC (2005-2006). |
Christine Reynolds (53) |
| Year of Election or Appointment: 2008 Chief Financial Officer of the Fidelity funds. Ms. Reynolds became President of Fidelity Pricing and Cash Management Services (FPCMS) in August 2008. Ms. Reynolds served as Chief Operating Officer of FPCMS (2007-2008). Previously, Ms. Reynolds served as President, Treasurer, and Anti-Money Laundering officer of the Fidelity funds (2004-2007). |
Kenneth A. Rathgeber (64) |
| Year of Election or Appointment: 2004 Chief Compliance Officer of Fidelity's Equity and High Income Funds. Mr. Rathgeber is Chief Compliance Officer of Fidelity Management & Research (Hong Kong) Limited (2008-present), Fidelity Management & Research (Japan) Inc. (2008-present), FMR (2005-present), FMR Co., Inc. (2005-present), Fidelity Management & Research (U.K.) Inc. (2005-present), Fidelity Research & Analysis Company (2005-present), Fidelity Investments Money Management, Inc. (2005-present), Pyramis Global Advisors, LLC (2005-present), and Strategic Advisers, Inc. (2005-present). |
Jeffrey S. Christian (50) |
| Year of Election or Appointment: 2009 Deputy Treasurer of the Fidelity funds. Mr. Christian is an employee of Fidelity Investments. Previously, Mr. Christian served as Chief Financial Officer (2008-2009) of certain Fidelity funds and Senior Vice President of Fidelity Pricing and Cash Management Services (FPCMS) (2004-2009). |
Joseph F. Zambello (54) |
| Year of Election or Appointment: 2011 Deputy Treasurer of the Fidelity funds. Mr. Zambello is an employee of Fidelity Investments. Previously, Mr. Zambello served as Vice President of FMR's Program Management Group (2009-2011) and Vice President of the Transfer Agent Oversight Group (2005-2009). |
Adrien E. Deberghes (44) |
| Year of Election or Appointment: 2008 Deputy Treasurer of Fidelity's Equity and High Income Funds. Mr. Deberghes also serves as Vice President and Assistant Treasurer of Fidelity Rutland Square Trust II and Fidelity Commonwealth Trust II (2011-present), Assistant Treasurer of other Fidelity funds (2010-present), and is an employee of Fidelity Investments (2008-present). Previously, Mr. Deberghes served as Senior Vice President of Mutual Fund Administration at State Street Corporation (2007-2008), Senior Director of Mutual Fund Administration at Investors Bank & Trust (2005-2007), and Director of Finance for Dunkin' Brands (2000-2005). |
Stephanie J. Dorsey (42) |
| Year of Election or Appointment: 2010 Assistant Treasurer of Fidelity's Equity and High Income Funds. Ms. Dorsey also serves as Deputy Treasurer of other Fidelity funds (2008-present) and is an employee of Fidelity Investments (2008-present). Previously, Ms. Dorsey served as Treasurer (2004-2008) of the JPMorgan Mutual Funds and Vice President (2004-2008) of JPMorgan Chase Bank. |
John R. Hebble (53) |
| Year of Election or Appointment: 2009 Assistant Treasurer of Fidelity's Equity and High Income Funds. Mr. Hebble also serves as President (2011-present), Treasurer, and Chief Financial Officer of The North Carolina Capital Management Trust: Cash and Term Portfolios (2008-present), President and Treasurer of other Fidelity funds (2008-present) and is an employee of Fidelity Investments. |
Gary W. Ryan (53) |
| Year of Election or Appointment: 2005 Assistant Treasurer of the Fidelity funds. Mr. Ryan is an employee of Fidelity Investments. Previously, Mr. Ryan served as Vice President of Fund Reporting in Fidelity Pricing and Cash Management Services (FPCMS) (1999-2005). |
Jonathan Davis (43) |
| Year of Election or Appointment: 2010 Assistant Treasurer of the Fidelity funds. Mr. Davis is also Assistant Treasurer of Fidelity Rutland Square Trust II and Fidelity Commonwealth Trust II. Mr. Davis is an employee of Fidelity Investments. Previously, Mr. Davis served as Vice President and Associate General Counsel of FMR LLC (2003-2010). |
Annual Report
Class A, T, B and C designate 100% of the dividend distributed during the fiscal year, as amounts which may be taken into account as a dividend for purposes of the maximum rate under section 1(h)(11) of the Internal Revenue Code.
The amounts per share which represent income derived from sources within, and taxes paid to, foreign countries or possessions of the United States are as follows:
| Pay Date | Income | Taxes |
Class A | 12/13/2010 | $0.044 | $0.0115 |
| 12/31/2010 | $0.011 | $0.0000 |
Class T | 12/13/2010 | $0.037 | $0.0115 |
| 12/31/2010 | $0.011 | $0.0000 |
Class B | 12/13/2010 | $0.011 | $0.0115 |
| 12/31/2010 | $0.011 | $0.0000 |
Class C | 12/13/2010 | $0.026 | $0.0115 |
| 12/31/2010 | $0.011 | $0.0000 |
The fund will notify shareholders in January 2012 of amounts for use in preparing 2011 income tax returns.
Annual Report
Board Approval of Investment Advisory Contracts and Management Fees
Fidelity Emerging Europe, Middle East, Africa (EMEA) Fund
Each year, the Board of Trustees, including the Independent Trustees (together, the Board), votes on the renewal of the management contract and sub-advisory agreements (together, the Advisory Contracts) for the fund. The Board, assisted by the advice of fund counsel and Independent Trustees' counsel, requests and considers a broad range of information relevant to the renewal of the Advisory Contracts throughout the year.
The Board meets regularly and considers at each of its meetings factors that are relevant to its annual consideration of the renewal of the fund's Advisory Contracts, including the services and support provided to the fund and its shareholders. The Board has established various standing committees, each composed of Independent Trustees with varying backgrounds, to which the Board has assigned specific subject matter responsibilities in order to enhance effective decision-making by the Board. The Board, acting directly and through its Committees, requests and receives information concerning the annual consideration of the renewal of the fund's Advisory Contracts. The Board also meets as needed to consider matters specifically related to the Board's annual consideration of the renewal of Advisory Contracts. Members of the Board may also meet with trustees of other Fidelity funds through ad hoc joint committees to discuss certain matters relevant to the Fidelity funds.
At its July 2011 meeting, the Board of Trustees, including the Independent Trustees, unanimously determined to renew the fund's Advisory Contracts. In reaching its determination, the Board considered all factors it believed relevant, including (i) the nature, extent, and quality of the services to be provided to the fund and its shareholders (including the investment performance of the fund); (ii) the competitiveness of the fund's management fee and total expense ratio; (iii) the total costs of the services to be provided by and the profits to be realized by Fidelity from its relationship with the fund; (iv) the extent to which economies of scale would be realized as the fund grows; and (v) whether fee levels reflect these economies of scale, if any, for the benefit of fund shareholders.
In considering whether to renew the Advisory Contracts for the fund, the Board reached a determination, with the assistance of fund counsel and Independent Trustees' counsel and through the exercise of its business judgment, that the renewal of the Advisory Contracts is in the best interests of the fund and its shareholders and that the compensation payable under the Advisory Contracts is fair and reasonable. The Board's decision to renew the Advisory Contracts was not based on any single factor, but rather was based on a comprehensive consideration of all the information provided to the Board at its meetings throughout the year. The Board, in reaching its determination to renew the Advisory Contracts, is aware that shareholders in the fund have a broad range of investment choices available to them, including a wide choice among mutual funds offered by Fidelity's competitors, and that the fund's shareholders, who have the opportunity to review and weigh the disclosure provided by the fund in its prospectus and other public disclosures, have chosen to invest in this fund, managed by Fidelity.
Annual Report
Board Approval of Investment Advisory Contracts and
Management Fees - continued
Nature, Extent, and Quality of Services Provided. The Board considered the staffing within the investment adviser, FMR, and the sub-advisers (together, the Investment Advisers), including the backgrounds of the fund's investment personnel and the fund's investment objective and discipline. The Independent Trustees also had discussions with senior management of Fidelity's investment operations and investment groups. The Board considered the structure of the portfolio manager compensation program and whether this structure provides appropriate incentives to act in the best interests of the fund.
Resources Dedicated to Investment Management and Support Services. The Board and the Fund Oversight and Research Committees reviewed the general qualifications and capabilities of the Investment Advisers' investment staff, including its size, education, experience, and resources, as well as the Investment Advisers' approach to recruiting, training, managing, and compensating investment personnel. The Board also noted that FMR has devoted increased resources to non-U.S. offices. The Board noted that Fidelity's analysts have extensive resources, tools and capabilities which allow them to conduct sophisticated quantitative and fundamental analysis, as well as credit analysis of issuers, counterparties and enhancers. The Board also believes that Fidelity's investment professionals have sufficient access to global information and data so as to provide competitive investment results over time, and that those professionals also have access to sophisticated tools which permit them to assess portfolio construction and risk and performance attribution characteristics continuously, as well as to transmit new information and research conclusions rapidly around the world. Additionally, in their deliberations, the Board considered the Investment Advisers' trading capabilities and resources which are an integral part of the investment management process.
Shareholder and Administrative Services. The Board considered (i) the nature, extent, quality, and cost of advisory, administrative, and shareholder services performed by the Investment Advisers and their affiliates under the Advisory Contracts and under separate agreements covering transfer agency, pricing and bookkeeping, and securities lending services for the fund; (ii) the nature and extent of the investment adviser's supervision of third party service providers, principally custodians and subcustodians; and (iii) the resources devoted to, and the record of compliance with, the fund's compliance policies and procedures. The Board also reviewed the allocation of fund brokerage, including allocations to brokers affiliated with the Investment Advisers, the use of brokerage commissions to pay fund expenses, and the use of "soft" commission dollars to pay for research services.
The Board noted that the growth of fund assets over time across the complex allows Fidelity to reinvest in the development of services designed to enhance the value or convenience of the Fidelity funds as investment vehicles. These services include 24-hour access to account information and market information through telephone representatives and over the Internet, investor education materials and asset allocation tools, and the expanded availability of Fidelity Investor Centers, with 35 new branches opening since 2010.
Annual Report
Investment in a Large Fund Family. The Board considered the benefits to shareholders of investing in a Fidelity fund, including the benefits of investing in a fund that is part of a large family of funds offering a variety of investment disciplines and providing a large variety of mutual fund investor services. The Board noted that Fidelity had taken, or had made recommendations that resulted in the Fidelity funds taking, a number of actions over the previous year that benefited particular funds, including (i) continuing to dedicate additional resources to investment research and support of the senior management team that oversees asset management; (ii) rationalizing product lines through the mergers of six funds into other funds; (iii) continuing to migrate the Freedom Funds to dedicated lower cost underlying funds; (iv) obtaining shareholder approval to broaden the investment strategies for Fidelity Consumer Finance Portfolio, Fidelity Emerging Asia Fund, and Fidelity Environment and Alternative Energy Portfolio; (v) contractually agreeing to reduce the management fees and impose other expense limitations on Spartan 500 Index Fund and U.S. Bond Index Fund in connection with launching new institutional classes of these funds; (vi) changing the name, primary and supplemental benchmarks, and investment policies of Fidelity Global Strategies Fund to support the fund's flexible investment mandate and global orientation; and (vii) reducing the transfer agency account fee rates on certain accounts.
Investment Performance. The Board considered whether the fund has operated in accordance with its investment objective, as well as its record of compliance with its investment restrictions. It also reviewed the fund's absolute investment performance for each class, as well as the fund's relative investment performance for each class measured against a broad-based securities market index. The Board noted that FMR does not believe that a meaningful peer group exists against which to compare the fund's performance. Because the fund had been in existence less than three calendar years, the following chart considered by the Board shows, for the one-year period ended December 31, 2010, the total returns of the retail class and Class B of the fund and the total returns of a broad-based securities market index ("benchmark").
Annual Report
Board Approval of Investment Advisory Contracts and
Management Fees - continued
Fidelity Emerging Europe, Middle East, Africa (EMEA) Fund

The Board noted that the investment performance of the retail class of the fund compared favorably to its benchmark for the period shown. The Board considered that the variations in performance among the fund's classes reflect the variations in class expenses, which result in lower performance for higher expense classes. The Board also reviewed the fund's performance since inception as well as performance in the current year. The Board noted that it is difficult to evaluate in any comprehensive fashion the performance of the fund, in light of its relatively recent commencement of operations.
Based on its review, the Board concluded that the nature, extent, and quality of services provided to the fund under the Advisory Contracts should benefit the fund's shareholders.
Competitiveness of Management Fee and Total Expense Ratio. The Board considered the fund's management fee and total expense ratio compared to "mapped groups" of competitive funds and classes. Fidelity creates "mapped groups" by combining similar Lipper investment objective categories that have comparable management fee characteristics. Combining Lipper investment objective categories aids the Board's management fee and total expense ratio comparisons by broadening the competitive group used for comparison and by reducing the number of universes to which various Fidelity funds are compared.
Management Fee. The Board considered two proprietary management fee comparisons for the 12-month (or shorter) periods shown in the chart below. The group of Lipper funds used by the Board for management fee comparisons is referred to below as the "Total Mapped Group." The Total Mapped Group comparison focuses on a fund's standing relative to the total universe of comparable funds available to investors in terms of gross management fees before expense reimbursements or caps. "TMG %" represents the percentage of funds in the Total Mapped Group that had management fees that were lower than the fund's. For example, a TMG % of 13% means that 87% of the funds in the Total Mapped Group had higher management fees than the fund. The "Asset-Size Peer Group" (ASPG) comparison focuses on a fund's standing relative to non-Fidelity funds similar in size to the fund within the Total Mapped Group. The ASPG represents at least 15% of the funds in the Total Mapped Group with comparable asset size and management fee characteristics, subject to a minimum of 50 funds (or all funds in the Total Mapped Group if fewer than 50). Additional information, such as the ASPG quartile in which the fund's management fee ranked, is also included in the chart and considered by the Board.
Annual Report
Fidelity Emerging Europe, Middle East, Africa (EMEA) Fund

The Board noted that the fund's management fee ranked below the median of its Total Mapped Group and below the median of its ASPG for 2010.
Based on its review, the Board concluded that the fund's management fee is fair and reasonable in light of the services that the fund receives and the other factors considered.
Total Expense Ratio. In its review of each class's total expense ratio, the Board considered the fund's management fee as well as other fund or class expenses, as applicable, such as transfer agent fees, pricing and bookkeeping fees, fund-paid 12b-1 fees, and custodial, legal, and audit fees. The Board also noted the effects of any waivers and reimbursements on fees and expenses. As part of its review, the Board also considered the current and historical total expense ratios of each class of the fund compared to competitive fund median expenses. Each class of the fund is compared to those funds and classes in the Total Mapped Group (used by the Board for management fee comparisons) that have a similar sales load structure.
Annual Report
Board Approval of Investment Advisory Contracts and
Management Fees - continued
The Board noted that the total expense ratio of each class ranked below its competitive median for 2010. The Board considered that various factors, including 12b-1 fees, positive or negative performance adjustments, and relatively higher other expenses in the case of small fund size, can affect total expense ratios.
Fees Charged to Other Fidelity Clients. The Board also considered Fidelity fee structures and other information with respect to clients of FMR and its affiliates, such as other mutual funds advised or subadvised by FMR or its affiliates, pension plan clients, and other institutional clients. In March 2010, the Board created an ad hoc joint committee with the board of other Fidelity funds (the Committee) to review and compare Fidelity's institutional investment advisory business with its business of providing services to the Fidelity funds, including the differences in services provided, fees charged, and costs incurred, as well as competition in their respective marketplaces.
Based on its review of total expense ratios and fees charged to other Fidelity clients, the Board concluded that the total expense ratio of each class of the fund was reasonable in light of the services that the fund and its shareholders receive and the other factors considered, including the findings of the Committee.
Costs of the Services and Profitability. The Board considered the revenues earned and the expenses incurred by Fidelity in conducting the business of developing, marketing, distributing, managing, administering and servicing the fund and its shareholders. The Board also considered the level of Fidelity's profits in respect of all the Fidelity funds.
On an annual basis, FMR presents to the Board Fidelity's profitability for the fund. Fidelity calculates the profitability for each fund, as well as aggregate profitability for groups of Fidelity funds and all Fidelity funds, using a series of detailed revenue and cost allocation methodologies which originate with the books and records of Fidelity on which Fidelity's audited financial statements are based. The Audit Committee of the Board reviews any significant changes from the prior year's methodologies.
PricewaterhouseCoopers LLP (PwC), independent registered public accounting firm and auditor to Fidelity and certain Fidelity funds, has been engaged annually by the Board as part of the Board's assessment of Fidelity's profitability analysis. PwC's engagement includes the review and assessment of Fidelity's methodologies used in determining the revenues and expenses attributable to Fidelity's mutual fund business, and completion of agreed-upon procedures surrounding the mathematical accuracy of fund profitability and its conformity to allocation methodologies. After considering PwC's reports issued under the engagement and information provided by Fidelity, the Board concluded that while other allocation methods may also be reasonable, Fidelity's profitability methodologies are reasonable in all material respects.
Annual Report
The Board also reviewed Fidelity's non-fund businesses and fall-out benefits related to the mutual fund business as well as cases where Fidelity's affiliates may benefit from or be related to the fund's business.
The Board considered the costs of the services provided by and the profits realized by Fidelity in connection with the operation of the fund and was satisfied that the profitability was not excessive in the circumstances.
Economies of Scale. The Board considered whether there have been economies of scale in respect of the management of the Fidelity funds, whether the Fidelity funds (including the fund) have appropriately benefited from any such economies of scale, and whether there is potential for realization of any further economies of scale. The Board considered the extent to which the fund will benefit from economies of scale through increased services to the fund, through waivers or reimbursements, or through fee or expense reductions. The Board also noted that in 2009, it and the board of other Fidelity funds created an ad hoc committee (the Economies of Scale Committee) to analyze whether FMR attains economies of scale in respect of the management and servicing of the Fidelity funds, whether the Fidelity funds have appropriately benefited from such economies of scale, and whether there is potential for realization of any further economies of scale.
The Board recognized that the fund's management contract incorporates a "group fee" structure, which provides for lower group fee rates as total fund assets under FMR's management increase, and for higher group fee rates as total fund assets under FMR's management decrease. FMR calculates the group fee rates based on a tiered asset "breakpoint" schedule that varies based on asset class. The Board considered that the group fee is designed to deliver the benefits of economies of scale to fund shareholders when total Fidelity fund assets increase, even if assets of any particular fund are unchanged or have declined, because some portion of Fidelity's costs are attributable to services provided to all Fidelity funds, and all funds benefit if those costs can be allocated among more assets. The Board concluded that, given the group fee structure, fund shareholders will benefit from lower management fees as assets under FMR's management increase at the fund complex level, regardless of whether Fidelity achieves any such economies of scale.
The Board concluded, taking into account the analysis of the Economies of Scale Committee, that any potential economies of scale are being appropriately shared between fund shareholders and Fidelity.
Annual Report
Board Approval of Investment Advisory Contracts and
Management Fees - continued
Additional Information Requested by the Board. In order to develop fully the factual basis for consideration of the Fidelity funds' Advisory Contracts, the Board requested and received additional information on certain topics, including (i) fund performance trends, actions to be taken by FMR to improve certain funds' overall performance, and Fidelity's long-term strategies for certain funds; (ii) portfolio manager changes that have occurred during the past year and length of portfolio manager tenure for different categories of funds over time; (iii) Fidelity's compensation structure for portfolio managers and other key personnel and strategies for attracting and retaining non-investment personnel; (iv) the amount of the investment that each portfolio manager has made in the Fidelity fund(s) that he or she manages; (v) historical trends in Fidelity's realization of fall-out benefits; (vi) Fidelity's group fee structures and the rationale for the individual fee rates of certain funds; (vii) fund profitability methodology and the impact of certain factors on fund profitability results; (viii) trends regarding industry use of performance fee structures and Fidelity's compliance practices with respect to performance adjustment calculations; (ix) the fee structures in place for certain other Fidelity clients; and (x) explanations regarding the relative total expense ratios of certain funds and classes, total expense competitive trends, and actions that might be taken by FMR to reduce total expense ratios for certain funds and classes.
Based on its evaluation of all of the conclusions noted above, and after considering all factors it believed relevant, the Board ultimately concluded that the advisory fee structures are fair and reasonable, and that the fund's Advisory Contracts should be renewed.
Annual Report
Investment Adviser
Fidelity Management & Research Company
Boston, MA
Investment Sub-Advisers
FMR Co., Inc.
Fidelity Management & Research
(U.K.) Inc.
FIL Investments (Japan) Limited
FIL Investment Advisors
FIL Investment Advisors
(U.K.) Limited
Fidelity Management & Research
(Hong Kong) Limited
Fidelity Management & Research
(Japan) Inc.
General Distributor
Fidelity Distributors Corporation
Boston, MA
Transfer and Service Agents
Fidelity Investments Institutional
Operations Company, Inc.
Boston, MA
Fidelity Service Company, Inc.
Boston, MA
Custodian
State Street Bank & Trust Company
Quincy, MA

AEME-UANN-1211
1.861988.103
(Fidelity Logo)
Fidelity Advisor®
Emerging Europe,
Middle East, Africa (EMEA)
Fund - Institutional Class
Annual Report
October 31, 2011
(Fidelity Cover Art)
Institutional Class is a
class of Fidelity® Emerging Europe, Middle East, Africa (EMEA) Fund
Contents
Chairman's Message | (Click Here) | The Chairman's message to shareholders. |
Performance | (Click Here) | How the fund has done over time. |
Management's Discussion of Fund Performance | (Click Here) | The Portfolio Manager's review of fund performance and strategy. |
Shareholder Expense Example | (Click Here) | An example of shareholder expenses. |
Investment Changes | (Click Here) | A summary of major shifts in the fund's investments over the past six months. |
Investments | (Click Here) | A complete list of the fund's investments with their market values. |
Financial Statements | (Click Here) | Statements of assets and liabilities, operations, and changes in net assets, as well as financial highlights. |
Notes | (Click Here) | Notes to the financial statements. |
Report of Independent Registered Public Accounting Firm | (Click Here) | |
Trustees and Officers | (Click Here) | |
Distributions | (Click Here) | |
Board Approval of Investment Advisory Contracts and Management Fees | (Click Here) | |
To view a fund's proxy voting guidelines and proxy voting record for the 12-month period ended June 30, visit http://www.fidelity.com/proxyvotingresults or visit the Securities and Exchange Commission's (SEC) web site at http://www.sec.gov. You may also call 1-877-208-0098 to request a free copy of the proxy voting guidelines.
Standard & Poor's, S&P and S&P 500 are registered service marks of The McGraw-Hill Companies, Inc. and have been licensed for use by Fidelity Distributors Corporation.
Other third party marks appearing herein are the property of their respective owners.
All other marks appearing herein are registered or unregistered trademarks or service marks of FMR LLC or an affiliated company.
Annual Report
This report and the financial statements contained herein are submitted for the general information of the shareholders of the fund. This report is not authorized for distribution to prospective investors in the fund unless preceded or accompanied by an effective prospectus.
A fund files its complete schedule of portfolio holdings with the SEC for the first and third quarters of each fiscal year on Form N-Q. Forms N-Q are available on the SEC's web site at http://www.sec.gov. A fund's Forms N-Q may be reviewed and copied at the SEC's Public Reference Room in Washington, DC. Information regarding the operation of the SEC's Public Reference Room may be obtained by calling 1-800-SEC-0330. For a complete list of a fund's portfolio holdings, view the most recent holdings listing, semiannual report, or annual report on Fidelity's web site at http://www.fidelity.com, http://www.advisor.fidelity.com, or http://www.401k.com, as applicable.
NOT FDIC INSURED • MAY LOSE VALUE • NO BANK GUARANTEE
Neither the fund nor Fidelity Distributors Corporation is a bank.
Annual Report
(Acting Chairman's Photograph)
Dear Shareholder:
Global equity markets began the fourth quarter on a strong note, sharply reversing course in October amid strong corporate earnings, better-than-expected economic news and the promise of a resolution to the sovereign debt crisis in Europe. The mini rally followed a third quarter marked by a significant downturn in July and August, which heightened investor anxiety and set off a wave of volatility that hampered most major asset classes through the end of September. Financial markets are difficult to predict, of course, but you can help put the odds in your favor by following these time-tested investment principles.
One of the basic tenets is to invest according to your time horizon. For long-term investors, riding out the markets' inevitable ups and downs has proven much more effective than making decisions based on short-term developments. If your goal is approaching, you can also benefit from patience and restraint, rather than attempting to time the market. No matter your time horizon, missing only a few of the markets' best days can significantly diminish returns. Patience also affords the benefits of compounding - earning interest on additional income or reinvested dividends and capital gains. While staying the course doesn't eliminate risk, it can considerably lessen the negative impact of short-term downturns.
Asset allocation is another principle to manage risk. As you spread your portfolio among the asset classes, be sure to consider your time horizon, risk tolerance and investment objectives. Younger investors may be better served by emphasizing equities, which historically have been the best-performing asset class over time. Investors who are nearing a specific goal, such as retirement or sending a child to college, may choose to favor bonds and other investments that have tended to be more stable. Studies indicate that asset allocation is the single most important determinant of a portfolio's long-term success. After deciding on a suitable allocation strategy, make sure your portfolio is adequately diversified, with exposure to stocks of small-, mid- and large-cap companies in a range of sectors, for example. And today, more than ever, geographic diversification should be taken into account.
Lastly, investing a certain amount of money on a regular basis - a principle known as dollar-cost averaging - can help lower the average cost of your purchases, while also giving you the discipline to avoid selling weak performers just prior to an upswing, or chasing a hot performer just before a correction.
We invite you to learn more by visiting us on the Internet, dropping by one of our Investor Centers or calling us by phone. It is our privilege to provide the resources you need to choose investments that are right for you.
Sincerely,
(Acting Chairman's Signature)
James C. Curvey
Acting Chairman
Annual Report
Average annual total return reflects the change in the value of an investment, assuming reinvestment of the class' distributions from dividend income and capital gains (the profits earned upon the sale of securities that have grown in value, if any) and assuming a constant rate of performance each year. The $10,000 table and the fund's returns do not reflect the deduction of taxes that a shareholder would pay on fund distributions or the redemption of fund shares. During periods of reimbursement by Fidelity, a fund's total return will be greater than it would be had the reimbursement not occurred. How a fund did yesterday is no guarantee of how it will do tomorrow.
Average Annual Total Returns
Periods ended October 31, 2011 | | Past 1
year | Life of
fund A |
Institutional Class | | -5.91% | -4.15% |
A From May 8, 2008.
$10,000 Over Life of Fund
Let's say hypothetically that $10,000 was invested in Fidelity Advisor® Emerging Europe, Middle East, Africa (EMEA) Fund - Institutional Class on May 8, 2008, when the fund started. The chart shows how the value of your investment would have changed, and also shows how the MSCI® EM (Emerging Markets) Europe, Middle East and Africa Index performed over the same period.
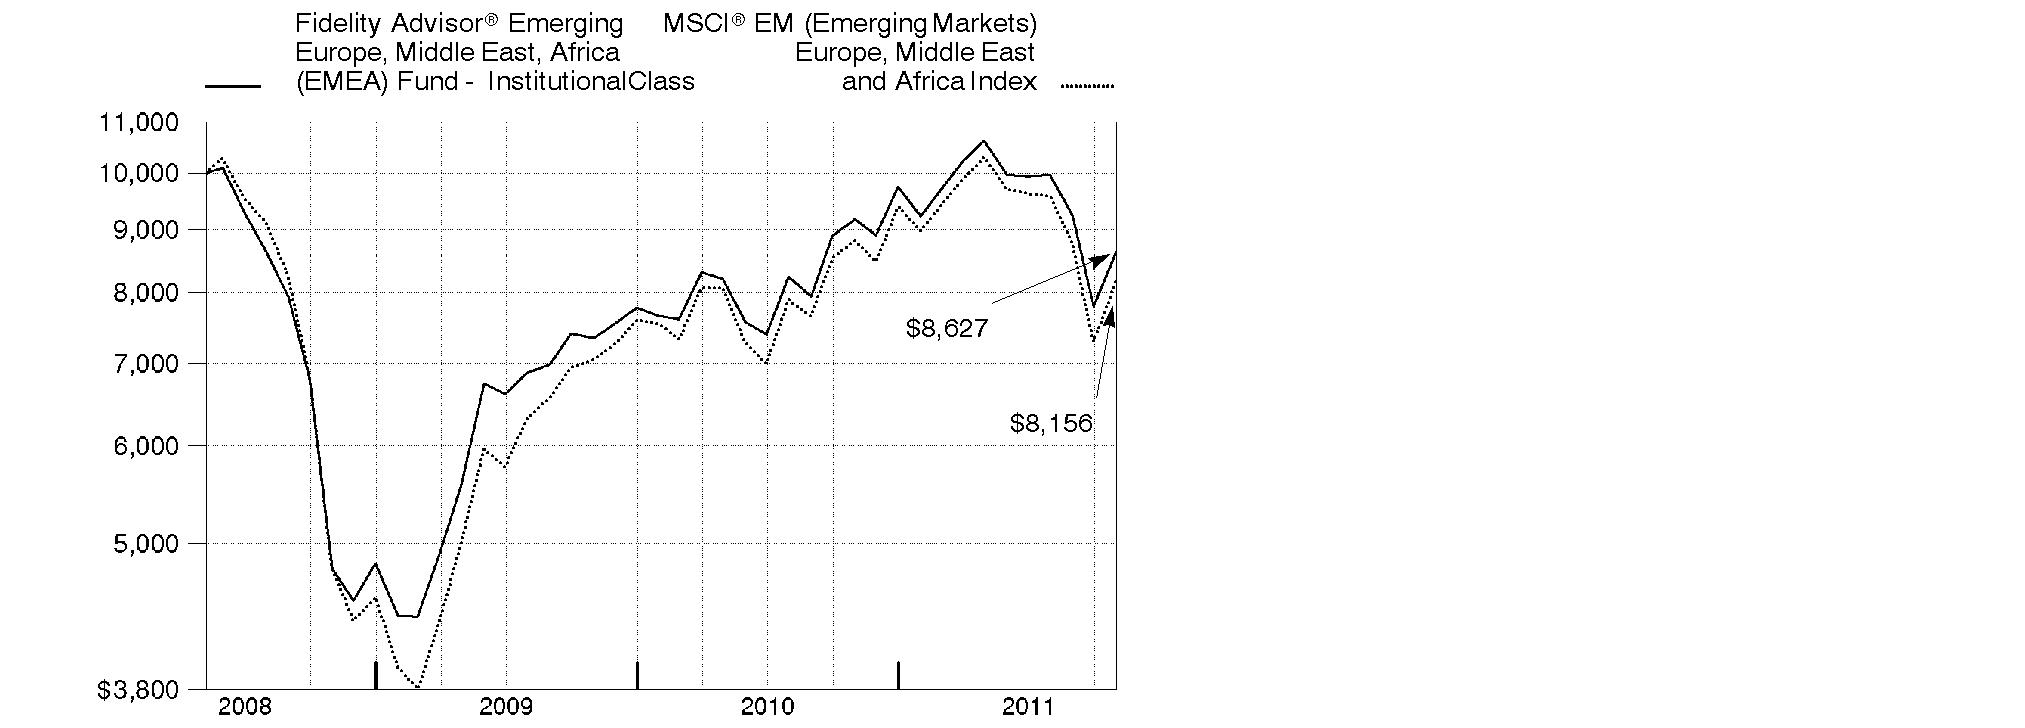
Annual Report
Market Recap: Emerging-markets stocks concluded the 12-month period ending October 31, 2011, on a strong note, reversing direction in October amid hope for a resolution to the sovereign debt crisis in Europe. The brief rally, on top of a robust first half of the period, could only partially offset the negative impact of a five-month downturn that began in May and intensified in August and September, as investors began to flee riskier securities due to the debt debacle, concern the U.S. economy may contract and worry about a significant slowdown in China. For the year, the MSCI® Emerging Markets Index declined 7.44%, hampered in part by global currency fluctuation. The index gained roughly 13% in October, after falling 9% in August and about 15% in September. For the full year, returns across the individual country components of the emerging-markets index were decidedly negative. Several of the largest countries in the index struggled, especially India (-20%), China (-17%) and Brazil (-12%), as did Turkey (-34%). Conversely, South Korea had the strongest result, gaining about 7%, while another sizable index component, Russia, returned roughly 1%. Smaller constituents Indonesia (+5%) and Malaysia (+4%) also finished in positive territory. A trio of countries had negative returns but outpaced the index: Mexico (-1%), Taiwan (-2%) and South Africa (-3%).
Comments from Adam Kutas, Portfolio Manager of Fidelity Advisor® Emerging Europe, Middle East, Africa (EMEA) Fund: For the year, the fund's Institutional Class shares returned -5.91%, outperforming the -7.42% return of the MSCI® EM (Emerging Markets) Europe, Middle East and Africa Index. Stock selection within materials and telecommunication services helped, as did picks in Russia and an overweighting in South Africa. Individual contributors included Russian natural gas producer Novatek, three South African firms - coal company Exxaro Resources, Harmony Gold Mining and supermarket company Shoprite Holdings - and not owning underperforming index constituent OTP Bank, based in Hungary. On the down side, poor stock selection in consumer discretionary hurt, particularly in retailing. On a regional basis, the fund lost ground due to the negative currency effects of our South African investments and unfavorable security selection in Poland. Among the main individual detractors were Turkish banks Turkiye Garanti Bankasi and Turkiye Halk Bankasi - the latter of which was sold from the fund by period end - and underweighting Russian oil company and outperforming major index component Gazprom.
Note to shareholders: The fund may invest up to 35% of its total assets in any industry that represents more than 20% of the emerging Europe, Middle East and African markets. As of October 31, 2011, the fund did not have more than 25% of its total assets invested in any one industry.
The views expressed above reflect those of the portfolio manager(s) only through the end of the period as stated on the cover of this report and do not necessarily represent the views of Fidelity or any other person in the Fidelity organization. Any such views are subject to change at any time based upon market or other conditions and Fidelity disclaims any responsibility to update such views. These views may not be relied on as investment advice and, because investment decisions for a Fidelity fund are based on numerous factors, may not be relied on as an indication of trading intent on behalf of any Fidelity fund.
Annual Report
Shareholder Expense Example
As a shareholder of the Fund, you incur two types of costs: (1) transaction costs, including sales charges (loads) on purchase payments or redemption proceeds, redemption fees, and (2) ongoing costs, including management fees, distribution and/or service (12b-1) fees and other Fund expenses. This Example is intended to help you understand your ongoing costs (in dollars) of investing in the Fund and to compare these costs with the ongoing costs of investing in other mutual funds.
The Example is based on an investment of $1,000 invested at the beginning of the period and held for the entire period (May 1, 2011 to October 31, 2011).
Actual Expenses
The first line of the accompanying table for each class of the Fund provides information about actual account values and actual expenses. You may use the information in this line, together with the amount you invested, to estimate the expenses that you paid over the period. Simply divide your account value by $1,000.00 (for example, an $8,600 account value divided by $1,000.00 = 8.6), then multiply the result by the number in the first line for a class of the Fund under the heading entitled "Expenses Paid During Period" to estimate the expenses you paid on your account during this period. A small balance maintenance fee of $12.00 that is charged once a year may apply for certain accounts with a value of less than $2,000. This fee is not included in the table below. If it was, the estimate of expenses you paid during the period would be higher, and your ending account value lower, by this amount. In addition, the Fund, as a shareholder in the underlying Fidelity Central Funds, will indirectly bear its pro-rata share of the fees and expenses incurred by the underlying Fidelity Central Funds. These fees and expenses are not included in the Fund's annualized expense ratio used to calculate the expense estimate in the table below.
Hypothetical Example for Comparison Purposes
The second line of the accompanying table for each class of the Fund provides information about hypothetical account values and hypothetical expenses based on a Class' actual expense ratio and an assumed rate of return of 5% per year before expenses, which is not the Class' actual return. The hypothetical account values and expenses may not be used to estimate the actual ending account balance or expenses you paid for the period. You may use this information to compare the ongoing costs of investing in the Fund and other funds. To do so, compare this 5% hypothetical example with the 5% hypothetical examples that appear in the shareholder reports of the other funds. A small balance maintenance fee of $12.00 that is charged once a year may apply for certain accounts with a value of less than $2,000. This fee is not included in the table below. If it was, the estimate of expenses you paid during the period would be higher, and your ending account value lower, by this amount. In addition, the Fund, as a shareholder in the underlying Fidelity Central Funds, will indirectly bear its pro-rata share of the fees and expenses incurred by the underlying Fidelity Central Funds. These fees and expenses are not included in the Fund's annualized expense ratio used to calculate the expense estimate in the table below.
Please note that the expenses shown in the table are meant to highlight your ongoing costs only and do not reflect any transaction costs. Therefore, the second line of the table is useful in comparing ongoing costs only, and will not help you determine the relative total costs of owning different funds. In addition, if these transactional costs were included, your costs would have been higher.
Annual Report
Shareholder Expense Example - continued
| Annualized
Expense Ratio | Beginning
Account Value
May 1, 2011 | Ending
Account Value
October 31, 2011 | Expenses Paid
During Period*
May 1, 2011 to
October 31, 2011 |
Class A | 1.56% | | | |
Actual | | $ 1,000.00 | $ 811.30 | $ 7.12 |
HypotheticalA | | $ 1,000.00 | $ 1,017.34 | $ 7.93 |
Class T | 1.84% | | | |
Actual | | $ 1,000.00 | $ 809.90 | $ 8.39 |
HypotheticalA | | $ 1,000.00 | $ 1,015.93 | $ 9.35 |
Class B | 2.32% | | | |
Actual | | $ 1,000.00 | $ 808.00 | $ 10.57 |
HypotheticalA | | $ 1,000.00 | $ 1,013.51 | $ 11.77 |
Class C | 2.33% | | | |
Actual | | $ 1,000.00 | $ 807.80 | $ 10.62 |
HypotheticalA | | $ 1,000.00 | $ 1,013.46 | $ 11.82 |
Emerging Europe, Middle East, Africa (EMEA) | 1.31% | | | |
Actual | | $ 1,000.00 | $ 811.80 | $ 5.98 |
HypotheticalA | | $ 1,000.00 | $ 1,018.60 | $ 6.67 |
Institutional Class | 1.23% | | | |
Actual | | $ 1,000.00 | $ 811.80 | $ 5.62 |
HypotheticalA | | $ 1,000.00 | $ 1,019.00 | $ 6.26 |
A 5% return per year before expenses
* Expenses are equal to each Class' annualized expense ratio, multiplied by the average account value over the period, multiplied by 184/365 (to reflect the one-half year period).
Annual Report
Investment Changes (Unaudited)
Geographic Diversification (% of fund's net assets) |
As of October 31, 2011 |
| South Africa 46.7% | |
| Russia 33.6% | |
| Turkey 5.8% | |
| Poland 3.3% | |
| United Arab Emirates 2.3% | |
| Nigeria 1.6% | |
| Morocco 1.2% | |
| Kenya 1.2% | |
| Qatar 1.1% | |
| Other* 3.2% | |

* Includes short-term investments and net other assets. |
As of April 30, 2011 |
| South Africa 45.0% | |
| Russia 32.4% | |
| Turkey 8.3% | |
| United States of America* 3.6% | |
| Poland 3.1% | |
| United Arab Emirates 1.4% | |
| Morocco 1.0% | |
| Nigeria 1.0% | |
| Kenya 0.9% | |
| Other 3.3% | |

* Includes short-term investments and net other assets. |
Asset Allocation |
| % of fund's
net assets | % of fund's net assets
6 months ago |
Stocks | 98.9 | 96.1 |
Bonds | 0.7 | 0.3 |
Short-Term Investments and Net Other Assets | 0.4 | 3.6 |
Top Ten Stocks as of October 31, 2011 |
| % of fund's
net assets | % of fund's net assets
6 months ago |
OAO Gazprom (Russia, Oil, Gas & Consumable Fuels) | 8.7 | 9.3 |
MTN Group Ltd. (South Africa, Wireless Telecommunication Services) | 7.9 | 6.2 |
Lukoil Oil Co. sponsored ADR (United Kingdom) (Russia, Oil, Gas & Consumable Fuels) | 6.0 | 5.7 |
Sberbank of Russia (Russia, Commercial Banks) | 5.6 | 5.1 |
Standard Bank Group Ltd. (South Africa, Commercial Banks) | 4.3 | 3.8 |
OAO NOVATEK (Russia, Oil, Gas & Consumable Fuels) | 4.0 | 3.3 |
Harmony Gold Mining Co. Ltd. (South Africa, Metals & Mining) | 3.7 | 3.3 |
FirstRand Ltd. (South Africa, Diversified Financial Services) | 3.3 | 2.9 |
Vodacom Group (Pty) Ltd. (South Africa, Wireless Telecommunication Services) | 3.1 | 1.8 |
Shoprite Holdings Ltd. (South Africa, Food & Staples Retailing) | 3.0 | 3.5 |
| 49.6 | |
Market Sectors as of October 31, 2011 |
| % of fund's
net assets | % of fund's net assets
6 months ago |
Energy | 26.7 | 27.5 |
Financials | 23.4 | 24.0 |
Materials | 14.9 | 14.7 |
Telecommunication Services | 14.3 | 10.5 |
Consumer Staples | 9.2 | 8.8 |
Consumer Discretionary | 6.3 | 6.8 |
Industrials | 1.7 | 1.9 |
Utilities | 1.7 | 1.0 |
Health Care | 0.7 | 0.7 |
Information Technology | 0.3 | 0.2 |
Annual Report
Investments October 31, 2011
Showing Percentage of Net Assets
Common Stocks - 97.1% |
| Shares | | Value |
Bailiwick of Jersey - 0.8% |
Randgold Resources Ltd. | 9,700 | | $ 1,061,062 |
Canada - 0.3% |
Silver Wheaton Corp. | 13,000 | | 448,874 |
Czech Republic - 0.6% |
Philip Morris CR A/S | 1,370 | | 899,560 |
Kenya - 1.2% |
British American Tobacco Kenya Ltd. | 185,900 | | 439,723 |
East African Breweries Ltd. | 379,106 | | 591,459 |
Safaricom Ltd. | 15,803,616 | | 477,210 |
Uchumi Supermarket Ltd. (a) | 2,000,000 | | 180,171 |
TOTAL KENYA | | 1,688,563 |
Morocco - 1.2% |
Maroc Telecom SA | 99,500 | | 1,746,011 |
Nigeria - 1.6% |
Guaranty Trust Bank PLC | 3,807,451 | | 349,066 |
Nigerian Breweries PLC | 1,441,779 | | 828,491 |
Skye Bank PLC | 14,371,010 | | 450,307 |
Zenith Bank PLC | 7,356,200 | | 595,887 |
TOTAL NIGERIA | | 2,223,751 |
Poland - 3.3% |
Bank Polska Kasa Opieki SA | 48,900 | | 2,275,563 |
Eurocash SA | 136,400 | | 1,093,636 |
Polska Grupa Energetyczna SA | 225,000 | | 1,386,618 |
TOTAL POLAND | | 4,755,817 |
Qatar - 1.1% |
Qatar National Bank SAQ | 26,129 | | 1,051,977 |
Vodafone Qatar QSC (a) | 244,891 | | 501,720 |
TOTAL QATAR | | 1,553,697 |
Russia - 31.8% |
DIXY Group OJSC (a) | 123,300 | | 1,260,327 |
Lukoil Oil Co. sponsored ADR (United Kingdom) | 147,895 | | 8,607,489 |
Magnit OJSC | 10,400 | | 1,124,528 |
Magnit OJSC right 11/29/11 (a) | 1,263 | | 0 |
Novolipetsk Steel OJSC GDR (Reg. S) | 30,600 | | 832,932 |
OAO Gazprom | 2,093,600 | | 12,421,011 |
OAO NOVATEK | 39,500 | | 518,896 |
NOVATEK OAO GDR | 37,100 | | 5,208,840 |
Rosneft Oil Co. OJSC | 32,800 | | 236,696 |
Rosneft Oil Co. OJSC GDR (Reg. S) | 247,700 | | 1,762,386 |
Common Stocks - continued |
| Shares | | Value |
Russia - continued |
Sberbank of Russia | 2,921,500 | | $ 7,927,577 |
Sistema JSFC sponsored GDR | 26,300 | | 450,782 |
TNK-BP Holding | 786,500 | | 2,151,883 |
Uralkali JSC | 329,300 | | 2,928,842 |
TOTAL RUSSIA | | 45,432,189 |
South Africa - 46.7% |
Africa Cellular Towers Ltd. (a) | 5,335,800 | | 60,510 |
African Rainbow Minerals Ltd. | 67,600 | | 1,562,339 |
AngloGold Ashanti Ltd. | 95,400 | | 4,311,518 |
Aveng Ltd. | 143,700 | | 671,758 |
Cashbuild Ltd. | 80,500 | | 1,044,756 |
Clicks Group Ltd. | 779,024 | | 4,088,347 |
DRDGOLD Ltd. | 1,024,814 | | 675,744 |
Exxaro Resources Ltd. | 125,700 | | 2,843,031 |
FirstRand Ltd. | 1,907,200 | | 4,743,788 |
Foschini Ltd. | 61,700 | | 778,529 |
Harmony Gold Mining Co. Ltd. | 404,700 | | 5,290,930 |
Life Healthcare Group Holdings Ltd. | 383,900 | | 934,076 |
Mr Price Group Ltd. | 153,400 | | 1,476,728 |
MTN Group Ltd. | 642,350 | | 11,211,562 |
Nampak Ltd. | 317,600 | | 872,407 |
Naspers Ltd. Class N | 28,200 | | 1,350,216 |
Northam Platinum Ltd. | 111,600 | | 432,406 |
Paracon Holdings Ltd. | 1,828,728 | | 414,766 |
Pioneer Foods Ltd. | 148,700 | | 1,189,967 |
Raubex Group Ltd. | 719,200 | | 1,179,893 |
RMB Holdings Ltd. | 258,400 | | 815,609 |
Sanlam Ltd. | 432,100 | | 1,614,325 |
Sasol Ltd. | 87,900 | | 3,952,702 |
Shoprite Holdings Ltd. | 296,200 | | 4,340,942 |
Spur Corp. Ltd. | 162,800 | | 277,956 |
Standard Bank Group Ltd. | 496,363 | | 6,116,742 |
Vodacom Group (Pty) Ltd. | 385,300 | | 4,364,562 |
TOTAL SOUTH AFRICA | | 66,616,109 |
Turkey - 5.8% |
Aygaz A/S | 178,000 | | 972,419 |
Bim Birlesik Magazalar A/S JSC | 29,000 | | 885,621 |
Koc Holding AS | 159,000 | | 568,291 |
Tupras-Turkiye Petrol Rafinerileri AS | 32,000 | | 723,880 |
Common Stocks - continued |
| Shares | | Value |
Turkey - continued |
Turk Telekomunikasyon AS | 346,000 | | $ 1,467,553 |
Turkiye Garanti Bankasi AS | 1,027,000 | | 3,624,193 |
TOTAL TURKEY | | 8,241,957 |
United Arab Emirates - 2.3% |
Dubai Financial Market PJSC (a) | 4,758,417 | | 1,334,378 |
Emirates NBD Bank PJSC (a) | 418,373 | | 389,555 |
First Gulf Bank PJSC | 349,523 | | 1,479,739 |
TOTAL UNITED ARAB EMIRATES | | 3,203,672 |
Zambia - 0.4% |
Zambeef Products PLC | 984,233 | | 601,979 |
TOTAL COMMON STOCKS (Cost $130,573,013) | 138,473,241 |
Nonconvertible Preferred Stocks - 1.8% |
| | | |
Russia - 1.8% |
Surgutneftegaz JSC
(Cost $2,598,642) | 5,104,100 | | 2,577,377 |
Nonconvertible Bonds - 0.3% |
| Principal Amount | | |
Multi-National - 0.3% |
International Bank for Reconstruction & Development 8.2% 12/12/12
(Cost $511,604) | NGN | 80,000,000 | | 477,237 |
Government Obligations - 0.4% |
|
Ghana - 0.4% |
Ghana Republic 14.99% 3/11/13
(Cost $672,328) | GHS | 950,000 | | 599,847 |
Money Market Funds - 0.5% |
| Shares | | Value |
Fidelity Cash Central Fund, 0.12% (b)
(Cost $745,166) | 745,166 | | $ 745,166 |
TOTAL INVESTMENT PORTFOLIO - 100.1% (Cost $135,100,753) | | 142,872,868 |
NET OTHER ASSETS (LIABILITIES) - (0.1)% | | (170,558) |
NET ASSETS - 100% | $ 142,702,310 |
Currency Abbreviations |
GHS | - | Ghana Cedi |
NGN | - | Nigerian naira |
Legend |
(a) Non-income producing |
(b) Affiliated fund that is available only to investment companies and other accounts managed by Fidelity Investments. The rate quoted is the annualized seven-day yield of the fund at period end. A complete unaudited listing of the fund's holdings as of its most recent quarter end is available upon request. In addition, each Fidelity Central Fund's financial statements, which are not covered by the Fund's Report of Independent Registered Public Accounting Firm, are available on the SEC's website or upon request. |
Affiliated Central Funds |
Information regarding fiscal year to date income earned by the Fund from investments in Fidelity Central Funds is as follows: |
Fund | Income earned |
Fidelity Cash Central Fund | $ 5,615 |
Fidelity Securities Lending Cash Central Fund | 25 |
Total | $ 5,640 |
Other Information |
The following is a summary of the inputs used, as of October 31, 2011, involving the Fund's assets and liabilities carried at fair value. The inputs or methodology used for valuing securities may not be an indication of the risk associated with investing in those securities. For more information on valuation inputs, and their aggregation into the levels used in the table below, please refer to the Investment Security Valuation section in the accompanying Notes to Financial Statements. |
Valuation Inputs at Reporting Date: |
Description | Total | Level 1 | Level 2 | Level 3 |
Investments in Securities: | | | | |
Equities: | | | | |
South Africa | $ 66,616,109 | $ 52,385,215 | $ 14,230,894 | $ - |
Russia | 48,009,566 | 48,009,566 | - | - |
Turkey | 8,241,957 | 8,241,957 | - | - |
Poland | 4,755,817 | 4,755,817 | - | - |
United Arab Emirates | 3,203,672 | 3,203,672 | - | - |
Nigeria | 2,223,751 | 2,223,751 | - | - |
Morocco | 1,746,011 | 1,746,011 | - | - |
Kenya | 1,688,563 | 1,688,563 | - | - |
Qatar | 1,553,697 | 1,553,697 | - | - |
Other | 3,011,475 | 1,950,413 | 1,061,062 | - |
Corporate Bonds | 477,237 | - | 477,237 | - |
Government Obligations | 599,847 | - | 599,847 | - |
Money Market Funds | 745,166 | 745,166 | - | - |
Total Investments in Securities: | $ 142,872,868 | $ 126,503,828 | $ 16,369,040 | $ - |
Income Tax Information |
At October 31, 2011, the Fund had a capital loss carryforward of approximately $11,266,491 of which $7,410,645, $579,836 and $3,276,010 will expire in fiscal 2016, 2017 and 2018, respectively. Capital loss carryforwards are only available to offset future capital gains of the Fund to the extent provided by regulations and may be limited. |
See accompanying notes which are an integral part of the financial statements.
Annual Report
Statement of Assets and Liabilities
| October 31, 2011 |
Assets | | |
Investment in securities, at value - See accompanying schedule: Unaffiliated issuers (cost $134,355,587) | $ 142,127,702 | |
Fidelity Central Funds (cost $745,166) | 745,166 | |
Total Investments (cost $135,100,753) | | $ 142,872,868 |
Cash | | 160,278 |
Foreign currency held at value (cost $61) | | 61 |
Receivable for fund shares sold | | 148,502 |
Dividends receivable | | 179,461 |
Interest receivable | | 43,184 |
Distributions receivable from Fidelity Central Funds | | 66 |
Prepaid expenses | | 716 |
Other receivables | | 20,392 |
Total assets | | 143,425,528 |
| | |
Liabilities | | |
Payable for investments purchased | $ 160,278 | |
Payable for fund shares redeemed | 349,022 | |
Accrued management fee | 91,946 | |
Distribution and service plan fees payable | 9,109 | |
Other affiliated payables | 41,379 | |
Other payables and accrued expenses | 71,484 | |
Total liabilities | | 723,218 |
| | |
Net Assets | | $ 142,702,310 |
Net Assets consist of: | | |
Paid in capital | | $ 144,186,805 |
Undistributed net investment income | | 2,747,743 |
Accumulated undistributed net realized gain (loss) on investments and foreign currency transactions | | (12,001,894) |
Net unrealized appreciation (depreciation) on investments and assets and liabilities in foreign currencies | | 7,769,656 |
Net Assets | | $ 142,702,310 |
See accompanying notes which are an integral part of the financial statements.
Annual Report
Statement of Assets and Liabilities - continued
| October 31, 2011 |
Calculation of Maximum Offering Price Class A:
Net Asset Value and redemption price per share ($10,260,374 ÷ 1,230,909 shares) | | $ 8.34 |
| | |
Maximum offering price per share (100/94.25 of $8.34) | | $ 8.85 |
Class T:
Net Asset Value and redemption price per share ($3,502,217 ÷ 421,495 shares) | | $ 8.31 |
| | |
Maximum offering price per share (100/96.50 of $8.31) | | $ 8.61 |
Class B:
Net Asset Value and offering price per share ($538,949 ÷ 65,051 shares)A | | $ 8.29 |
| | |
Class C:
Net Asset Value and offering price per share ($6,650,468 ÷ 807,272 shares)A | | $ 8.24 |
| | |
Emerging Europe, Middle East, Africa (EMEA):
Net Asset Value, offering price and redemption price per share ($114,117,343 ÷ 13,632,396 shares) | | $ 8.37 |
| | |
Institutional Class:
Net Asset Value, offering price and redemption price per share ($7,632,959 ÷ 911,487 shares) | | $ 8.37 |
A Redemption price per share is equal to net asset value less any applicable contingent deferred sales charge.
See accompanying notes which are an integral part of the financial statements.
Annual Report
Financial Statements - continued
Statement of Operations
| Year ended October 31, 2011 |
Investment Income | | |
Dividends | | $ 5,132,884 |
Special dividends | | 786,604 |
Interest | | 112,169 |
Income from Fidelity Central Funds | | 5,640 |
Income before foreign taxes withheld | | 6,037,297 |
Less foreign taxes withheld | | (341,837) |
Total income | | 5,695,460 |
| | |
Expenses | | |
Management fee | $ 1,436,460 | |
Transfer agent fees | 498,396 | |
Distribution and service plan fees | 128,171 | |
Accounting and security lending fees | 92,187 | |
Custodian fees and expenses | 211,210 | |
Independent trustees' compensation | 978 | |
Registration fees | 81,995 | |
Audit | 62,082 | |
Legal | 658 | |
Miscellaneous | 1,418 | |
Total expenses before reductions | 2,513,555 | |
Expense reductions | (160,094) | 2,353,461 |
Net investment income (loss) | | 3,341,999 |
Realized and Unrealized Gain (Loss) Net realized gain (loss) on: | | |
Investment securities: | | |
Unaffiliated issuers | 3,530,080 | |
Foreign currency transactions | (102,414) | |
Total net realized gain (loss) | | 3,427,666 |
Change in net unrealized appreciation (depreciation) on: Investment securities | (17,515,193) | |
Assets and liabilities in foreign currencies | (8,519) | |
Total change in net unrealized appreciation (depreciation) | | (17,523,712) |
Net gain (loss) | | (14,096,046) |
Net increase (decrease) in net assets resulting from operations | | $ (10,754,047) |
See accompanying notes which are an integral part of the financial statements.
Annual Report
Statement of Changes in Net Assets
| Year ended
October 31,
2011 | Year ended
October 31,
2010 |
Increase (Decrease) in Net Assets | | |
Operations | | |
Net investment income (loss) | $ 3,341,999 | $ 1,510,417 |
Net realized gain (loss) | 3,427,666 | (3,213,726) |
Change in net unrealized appreciation (depreciation) | (17,523,712) | 29,135,993 |
Net increase (decrease) in net assets resulting
from operations | (10,754,047) | 27,432,684 |
Distributions to shareholders from net investment income | (1,835,361) | (816,015) |
Distributions to shareholders from net realized gain | (302,617) | (391,419) |
Total distributions | (2,137,978) | (1,207,434) |
Share transactions - net increase (decrease) | (11,096,734) | 22,045,599 |
Redemption fees | 119,309 | 89,745 |
Total increase (decrease) in net assets | (23,869,450) | 48,360,594 |
| | |
Net Assets | | |
Beginning of period | 166,571,760 | 118,211,166 |
End of period (including undistributed net investment income of $2,747,743 and undistributed net investment income of $1,374,218, respectively) | $ 142,702,310 | $ 166,571,760 |
See accompanying notes which are an integral part of the financial statements.
Annual Report
Financial Highlights - Class A
Years ended October 31, | 2011 | 2010 | 2009 | 2008 I |
Selected Per-Share Data | | | | |
Net asset value, beginning of period | $ 8.97 | $ 7.26 | $ 4.75 | $ 10.00 |
Income from Investment Operations | | | | |
Net investment income (loss) E | .16 H | .07 | .05 | .04 |
Net realized and unrealized gain (loss) | (.70) | 1.70 | 2.48 | (5.31) |
Total from investment operations | (.54) | 1.77 | 2.53 | (5.27) |
Distributions from net investment income | (.08) | (.04) | (.03) | - |
Distributions from net realized gain | (.02) | (.02) | - | - |
Total distributions | (.10) | (.07) K | (.03) | - |
Redemption fees added to paid in capital E | .01 | .01 | .01 | .02 |
Net asset value, end of period | $ 8.34 | $ 8.97 | $ 7.26 | $ 4.75 |
Total Return B, C, D | (6.05)% | 24.66% | 53.78% | (52.50)% |
Ratios to Average Net Assets F, J | | | | |
Expenses before reductions | 1.60% | 1.69% | 1.87% | 2.50% A |
Expenses net of fee waivers, if any | 1.56% | 1.50% | 1.50% | 1.50% A |
Expenses net of all reductions | 1.51% | 1.38% | 1.39% | 1.23% A |
Net investment income (loss) | 1.70% H | .95% | .84% | 1.20% A |
Supplemental Data | | | | |
Net assets, end of period (000 omitted) | $ 10,260 | $ 10,045 | $ 4,817 | $ 1,368 |
Portfolio turnover rate G | 53% | 96% | 58% | 68% |
A Annualized
B Total returns for periods of less than one year are not annualized.
C Total returns would have been lower if certain expenses had not been reduced during the applicable periods shown.
D Total returns do not include the effect of the sales charges.
E Calculated based on average shares outstanding during the period.
F Fees and expenses of any underlying Fidelity Central Funds are not included in the Fund's expense ratio. The Fund indirectly bears its proportionate share of the expenses of any underlying Fidelity Central Funds.
G Amount does not include the portfolio activity of any underlying Fidelity Central Funds.
H Investment income per share reflects a special dividend which amounted to $.04 per share. Excluding the special dividend, the ratio of net investment income (loss) to average net assets would have been 1.25%.
I For the period May 8, 2008 (commencement of operations) to October 31, 2008.
J Expense ratios reflect operating expenses of the class. Expenses before reductions do not reflect amounts reimbursed by the investment adviser or reductions from brokerage service arrangements or reductions from other expense offset arrangements and do not represent the amount paid by the class during periods when reimbursements or reductions occur. Expense ratios before reductions for start-up periods may not be representative of longer-term operating periods. Expenses net of fee waivers reflect expenses after reimbursement by the investment adviser but prior to reductions from brokerage service arrangements or other expense offset arrangements. Expenses net of all reductions represent the net expenses paid by the class.
K Total distributions of $.07 per share is comprised of distributions from net investment income of $.041 and distributions from net realized gain of $.024 per share.
See accompanying notes which are an integral part of the financial statements.
Annual Report
Financial Highlights - Class T
Years ended October 31, | 2011 | 2010 | 2009 | 2008 I |
Selected Per-Share Data | | | | |
Net asset value, beginning of period | $ 8.96 | $ 7.25 | $ 4.75 | $ 10.00 |
Income from Investment Operations | | | | |
Net investment income (loss) E | .13 H | .06 | .04 | .04 |
Net realized and unrealized gain (loss) | (.71) | 1.69 | 2.47 | (5.31) |
Total from investment operations | (.58) | 1.75 | 2.51 | (5.27) |
Distributions from net investment income | (.07) | (.03) | (.02) | - |
Distributions from net realized gain | (.02) | (.02) | - | - |
Total distributions | (.08) K | (.05) | (.02) | - |
Redemption fees added to paid in capital E | .01 | .01 | .01 | .02 |
Net asset value, end of period | $ 8.31 | $ 8.96 | $ 7.25 | $ 4.75 |
Total Return B, C, D | (6.42)% | 24.44% | 53.20% | (52.50)% |
Ratios to Average Net Assets F, J | | | | |
Expenses before reductions | 1.87% | 1.95% | 2.15% | 2.78% A |
Expenses net of fee waivers, if any | 1.84% | 1.75% | 1.75% | 1.75% A |
Expenses net of all reductions | 1.78% | 1.62% | 1.64% | 1.49% A |
Net investment income (loss) | 1.42% H | .70% | .59% | .95% A |
Supplemental Data | | | | |
Net assets, end of period (000 omitted) | $ 3,502 | $ 3,114 | $ 1,560 | $ 568 |
Portfolio turnover rate G | 53% | 96% | 58% | 68% |
A Annualized
B Total returns for periods of less than one year are not annualized.
C Total returns would have been lower if certain expenses had not been reduced during the applicable periods shown.
D Total returns do not include the effect of the sales charges.
E Calculated based on average shares outstanding during the period.
F Fees and expenses of any underlying Fidelity Central Funds are not included in the Fund's expense ratio. The Fund indirectly bears its proportionate share of the expenses of any underlying Fidelity Central Funds.
G Amount does not include the portfolio activity of any underlying Fidelity Central Funds.
H Investment income per share reflects a special dividend which amounted to $.04 per share. Excluding the special dividend, the ratio of net investment income (loss) to average net assets would have been .98%.
I For the period May 8, 2008 (commencement of operations) to October 31, 2008.
J Expense ratios reflect operating expenses of the class. Expenses before reductions do not reflect amounts reimbursed by the investment adviser or reductions from brokerage service arrangements or reductions from other expense offset arrangements and do not represent the amount paid by the class during periods when reimbursements or reductions occur. Expense ratios before reductions for start-up periods may not be representative of longer-term operating periods. Expenses net of fee waivers reflect expenses after reimbursement by the investment adviser but prior to reductions from brokerage service arrangements or other expense offset arrangements. Expenses net of all reductions represent the net expenses paid by the class.
K Total distributions of $.08 per share is comprised of distributions from net investment income of $.068 and distributions from net realized gain of $.015 per share.
See accompanying notes which are an integral part of the financial statements.
Annual Report
Financial Highlights - Class B
Years ended October 31, | 2011 | 2010 | 2009 | 2008 I |
Selected Per-Share Data | | | | |
Net asset value, beginning of period | $ 8.93 | $ 7.23 | $ 4.73 | $ 10.00 |
Income from Investment Operations | | | | |
Net investment income (loss) E | .09 H | .02 | .01 | .02 |
Net realized and unrealized gain (loss) | (.71) | 1.68 | 2.48 | (5.31) |
Total from investment operations | (.62) | 1.70 | 2.49 | (5.29) |
Distributions from net investment income | (.02) | - | - | - |
Distributions from net realized gain | (.01) | (.01) | - | - |
Total distributions | (.03) | (.01) | - | - |
Redemption fees added to paid in capital E | .01 | .01 | .01 | .02 |
Net asset value, end of period | $ 8.29 | $ 8.93 | $ 7.23 | $ 4.73 |
Total Return B, C, D | (6.85)% | 23.72% | 52.85% | (52.70)% |
Ratios to Average Net Assets F, J | | | | |
Expenses before reductions | 2.37% | 2.47% | 2.68% | 3.32% A |
Expenses net of fee waivers, if any | 2.33% | 2.25% | 2.25% | 2.25% A |
Expenses net of all reductions | 2.27% | 2.12% | 2.14% | 1.99% A |
Net investment income (loss) | .93% H | .20% | .09% | .45% A |
Supplemental Data | | | | |
Net assets, end of period (000 omitted) | $ 539 | $ 822 | $ 782 | $ 487 |
Portfolio turnover rate G | 53% | 96% | 58% | 68% |
A Annualized
B Total returns for periods of less than one year are not annualized.
C Total returns would have been lower if certain expenses had not been reduced during the applicable periods shown.
D Total returns do not include the effect of the contingent deferred sales charge.
E Calculated based on average shares outstanding during the period.
F Fees and expenses of any underlying Fidelity Central Funds are not included in the Fund's expense ratio. The Fund indirectly bears its proportionate share of the expenses of any underlying Fidelity Central Funds.
G Amount does not include the portfolio activity of any underlying Fidelity Central Funds.
H Investment income per share reflects a special dividend which amounted to $.04 per share. Excluding the special dividend, the ratio of net investment income (loss) to average net assets would have been .49%.
I For the period May 8, 2008 (commencement of operations) to October 31, 2008.
J Expense ratios reflect operating expenses of the class. Expenses before reductions do not reflect amounts reimbursed by the investment adviser or reductions from brokerage service arrangements or reductions from other expense offset arrangements and do not represent the amount paid by the class during periods when reimbursements or reductions occur. Expense ratios before reductions for start-up periods may not be representative of longer-term operating periods. Expenses net of fee waivers reflect expenses after reimbursement by the investment adviser but prior to reductions from brokerage service arrangements or other expense offset arrangements. Expenses net of all reductions represent the net expenses paid by the class.
See accompanying notes which are an integral part of the financial statements.
Annual Report
Financial Highlights - Class C
Years ended October 31, | 2011 | 2010 | 2009 | 2008 I |
Selected Per-Share Data | | | | |
Net asset value, beginning of period | $ 8.90 | $ 7.23 | $ 4.73 | $ 10.00 |
Income from Investment Operations | | | | |
Net investment income (loss) E | .08 H | .02 | .01 | .02 |
Net realized and unrealized gain (loss) | (.69) | 1.67 | 2.48 | (5.31) |
Total from investment operations | (.61) | 1.69 | 2.49 | (5.29) |
Distributions from net investment income | (.05) | (.01) | - | - |
Distributions from net realized gain | (.02) | (.02) | - | - |
Total distributions | (.06) K | (.03) | - | - |
Redemption fees added to paid in capital E | .01 | .01 | .01 | .02 |
Net asset value, end of period | $ 8.24 | $ 8.90 | $ 7.23 | $ 4.73 |
Total Return B, C, D | (6.79)% | 23.61% | 52.85% | (52.70)% |
Ratios to Average Net Assets F, J | | | | |
Expenses before reductions | 2.36% | 2.45% | 2.61% | 3.28% A |
Expenses net of fee waivers, if any | 2.33% | 2.25% | 2.25% | 2.25% A |
Expenses net of all reductions | 2.27% | 2.13% | 2.14% | 1.99% A |
Net investment income (loss) | .93% H | .20% | .09% | .45% A |
Supplemental Data | | | | |
Net assets, end of period (000 omitted) | $ 6,650 | $ 5,151 | $ 2,677 | $ 741 |
Portfolio turnover rate G | 53% | 96% | 58% | 68% |
A Annualized
B Total returns for periods of less than one year are not annualized.
C Total returns would have been lower if certain expenses had not been reduced during the applicable periods shown.
D Total returns do not include the effect of the contingent deferred sales charge.
E Calculated based on average shares outstanding during the period.
F Fees and expenses of any underlying Fidelity Central Funds are not included in the Fund's expense ratio. The Fund indirectly bears its proportionate share of the expenses of any underlying Fidelity Central Funds.
G Amount does not include the portfolio activity of any underlying Fidelity Central Funds.
H Investment income per share reflects a special dividend which amounted to $.04 per share. Excluding the special dividend, the ratio of net investment income (loss) to average net assets would have been .49%.
I For the period May 8, 2008 (commencement of operations) to October 31, 2008.
J Expense ratios reflect operating expenses of the class. Expenses before reductions do not reflect amounts reimbursed by the investment adviser or reductions from brokerage service arrangements or reductions from other expense offset arrangements and do not represent the amount paid by the class during periods when reimbursements or reductions occur. Expense ratios before reductions for start-up periods may not be representative of longer-term operating periods. Expenses net of fee waivers reflect expenses after reimbursement by the investment adviser but prior to reductions from brokerage service arrangements or other expense offset arrangements. Expenses net of all reductions represent the net expenses paid by the class.
K Total distributions of $.06 per share is comprised of distributions from net investment income of $.047 and distributions from net realized gain of $.015 per share.
See accompanying notes which are an integral part of the financial statements.
Annual Report
Financial Highlights - Emerging Europe, Middle East, Africa (EMEA)
Years ended October 31, | 2011 | 2010 | 2009 | 2008 H |
Selected Per-Share Data | | | | |
Net asset value, beginning of period | $ 9.00 | $ 7.28 | $ 4.76 | $ 10.00 |
Income from Investment Operations | | | | |
Net investment income (loss) D | .18 G | .09 | .07 | .05 |
Net realized and unrealized gain (loss) | (.71) | 1.70 | 2.48 | (5.31) |
Total from investment operations | (.53) | 1.79 | 2.55 | (5.26) |
Distributions from net investment income | (.09) | (.05) | (.04) | - |
Distributions from net realized gain | (.02) | (.02) | - | - |
Total distributions | (.11) | (.08) J | (.04) | - |
Redemption fees added to paid in capital D | .01 | .01 | .01 | .02 |
Net asset value, end of period | $ 8.37 | $ 9.00 | $ 7.28 | $ 4.76 |
Total Return B, C | (5.91)% | 24.92% | 54.15% | (52.40)% |
Ratios to Average Net Assets E, I | | | | |
Expenses before reductions | 1.35% | 1.45% | 1.61% | 2.19% A |
Expenses net of fee waivers, if any | 1.31% | 1.25% | 1.25% | 1.25% A |
Expenses net of all reductions | 1.25% | 1.12% | 1.14% | .98% A |
Net investment income (loss) | 1.95% G | 1.21% | 1.09% | 1.45% A |
Supplemental Data | | | | |
Net assets, end of period (000 omitted) | $ 114,117 | $ 140,270 | $ 104,141 | $ 32,535 |
Portfolio turnover rate F | 53% | 96% | 58% | 68% |
A Annualized
B Total returns for periods of less than one year are not annualized.
C Total returns would have been lower if certain expenses had not been reduced during the applicable periods shown.
D Calculated based on average shares outstanding during the period.
E Fees and expenses of any underlying Fidelity Central Funds are not included in the Fund's expense ratio. The Fund indirectly bears its proportionate share of the expenses of any underlying Fidelity Central Funds.
F Amount does not include the portfolio activity of any underlying Fidelity Central Funds.
G Investment income per share reflects a special dividend which amounted to $.04 per share. Excluding the special dividend, the ratio of net investment income (loss) to average net assets would have been 1.51%.
H For the period May 8, 2008 (commencement of operations) to October 31, 2008.
I Expense ratios reflect operating expenses of the class. Expenses before reductions do not reflect amounts reimbursed by the investment adviser or reductions from brokerage service arrangements or reductions from other expense offset arrangements and do not represent the amount paid by the class during periods when reimbursements or reductions occur. Expense ratios before reductions for start-up periods may not be representative of longer-term operating periods. Expenses net of fee waivers reflect expenses after reimbursement by the investment adviser but prior to reductions from brokerage service arrangements or other expense offset arrangements. Expenses net of all reductions represent the net expenses paid by the class.
J Total distributions of $.08 per share is comprised of distributions from net investment income of $.052 and distributions from net realized gain of $.024 per share.
See accompanying notes which are an integral part of the financial statements.
Annual Report
Financial Highlights - Institutional Class
Years ended October 31, | 2011 | 2010 | 2009 | 2008 H |
Selected Per-Share Data | | | | |
Net asset value, beginning of period | $ 9.00 | $ 7.28 | $ 4.76 | $ 10.00 |
Income from Investment Operations | | | | |
Net investment income (loss) D | .19 G | .09 | .06 | .05 |
Net realized and unrealized gain (loss) | (.72) | 1.70 | 2.49 | (5.31) |
Total from investment operations | (.53) | 1.79 | 2.55 | (5.26) |
Distributions from net investment income | (.09) | (.05) | (.04) | - |
Distributions from net realized gain | (.02) | (.02) | - | - |
Total distributions | (.11) | (.08) J | (.04) | - |
Redemption fees added to paid in capital D | .01 | .01 | .01 | .02 |
Net asset value, end of period | $ 8.37 | $ 9.00 | $ 7.28 | $ 4.76 |
Total Return B, C | (5.91)% | 24.95% | 54.15% | (52.40)% |
Ratios to Average Net Assets E, I | | | | |
Expenses before reductions | 1.26% | 1.34% | 1.60% | 2.12% A |
Expenses net of fee waivers, if any | 1.24% | 1.25% | 1.25% | 1.25% A |
Expenses net of all reductions | 1.19% | 1.13% | 1.14% | .98% A |
Net investment income (loss) | 2.02% G | 1.20% | 1.09% | 1.46% A |
Supplemental Data | | | | |
Net assets, end of period (000 omitted) | $ 7,633 | $ 7,171 | $ 4,235 | $ 2,695 |
Portfolio turnover rate F | 53% | 96% | 58% | 68% |
A Annualized
B Total returns for periods of less than one year are not annualized.
C Total returns would have been lower if certain expenses had not been reduced during the applicable periods shown.
D Calculated based on average shares outstanding during the period.
E Fees and expenses of any underlying Fidelity Central Funds are not included in the Fund's expense ratio. The Fund indirectly bears its proportionate share of the expenses of any underlying Fidelity Central Funds.
F Amount does not include the portfolio activity of any underlying Fidelity Central Funds.
G Investment income per share reflects a special dividend which amounted to $.04 per share. Excluding the special dividend, the ratio of net investment income (loss) to average net assets would have been 1.58%.
H For the period May 8, 2008 (commencement of operations) to October 31, 2008.
I Expense ratios reflect operating expenses of the class. Expenses before reductions do not reflect amounts reimbursed by the investment adviser or reductions from brokerage service arrangements or reductions from other expense offset arrangements and do not represent the amount paid by the class during periods when reimbursements or reductions occur. Expense ratios before reductions for start-up periods may not be representative of longer-term operating periods. Expenses net of fee waivers reflect expenses after reimbursement by the investment adviser but prior to reductions from brokerage service arrangements or other expense offset arrangements. Expenses net of all reductions represent the net expenses paid by the class.
J Total distributions of $.08 per share is comprised of distributions from net investment income of $.054 and distributions from net realized gain of $.024 per share.
See accompanying notes which are an integral part of the financial statements.
Annual Report
Notes to Financial Statements
For the period ended October 31, 2011
1. Organization.
Fidelity Emerging Europe, Middle East, Africa (EMEA) Fund (the Fund) is a non-diversified fund of Fidelity Investment Trust (the Trust) and is authorized to issue an unlimited number of shares. The Trust is registered under the Investment Company Act of 1940, as amended (the 1940 Act), as an open-end management investment company organized as a Massachusetts business trust. The Fund offers Class A, Class T, Class C, Emerging Europe, Middle East, Africa (EMEA) and Institutional Class shares, each of which, along with Class B shares, has equal rights as to assets and voting privileges. Effective after the close of business on September 1, 2010, Class B shares were closed to new accounts and additional purchases, except for exchanges and reinvestments by existing shareholders. Each class has exclusive voting rights with respect to matters that affect that class. Class B shares will automatically convert to Class A shares after a holding period of seven years from the initial date of purchase. Investment income, realized and unrealized capital gains and losses, the common expenses of the Fund, and certain fund-level expense reductions, if any, are allocated on a pro-rata basis to each class based on the relative net assets of each class to the total net assets of the Fund. Each class differs with respect to transfer agent and distribution and service plan fees incurred. Certain expense reductions may also differ by class. The Fund's investments in emerging markets can be subject to social, economic, regulatory, and political uncertainties and can be extremely volatile.
2. Investments in Fidelity Central Funds.
The Fund invests in Fidelity Central Funds, which are open-end investment companies available only to other investment companies and accounts managed by Fidelity Management & Research Company (FMR) and its affiliates. The Fund's Schedule of Investments lists each of the Fidelity Central Funds held as of period end, if any, as an investment of the Fund, but does not include the underlying holdings of each Fidelity Central Fund. As an Investing Fund, the Fund indirectly bears its proportionate share of the expenses of the underlying Fidelity Central Funds.
The Money Market Central Funds seek preservation of capital and current income and are managed by Fidelity Investments Money Management, Inc. (FIMM), an affiliate of FMR.
A complete unaudited list of holdings for each Fidelity Central Fund is available upon request or at the Securities and Exchange Commission (the SEC) web site at www.sec.gov. In addition, the financial statements of the Fidelity Central Funds, which are not covered by the Fund's Report of Independent Registered Public Accounting Firm are available on the SEC web site or upon request.
Annual Report
Notes to Financial Statements - continued
3. Significant Accounting Policies.
The financial statements have been prepared in conformity with accounting principles generally accepted in the United States of America (GAAP), which require management to make certain estimates and assumptions at the date of the financial statements. Actual results could differ from those estimates. Subsequent events, if any, through the date that the financial statements were issued have been evaluated in the preparation of the financial statements. The following summarizes the significant accounting policies of the Fund:
Security Valuation. Investments are valued as of 4:00 p.m. Eastern time on the last calendar day of the period. The Fund uses independent pricing services approved by the Board of Trustees to value its investments. When current market prices or quotations are not readily available or reliable, valuations may be determined in good faith in accordance with procedures adopted by the Board of Trustees. Factors used in determining value may include market or security specific events, changes in interest rates and credit quality. The frequency with which these procedures are used cannot be predicted and they may be utilized to a significant extent. The value used for net asset value (NAV) calculation under these procedures may differ from published prices for the same securities.
The Fund categorizes the inputs to valuation techniques used to value its investments into a disclosure hierarchy consisting of three levels as shown below:
Level 1 - quoted prices in active markets for identical investments
Level 2 - other significant observable inputs (including quoted prices for similar investments, interest rates, prepayment speeds, etc.)
Level 3 - unobservable inputs (including the Fund's own assumptions based on the best information available)
Changes in valuation techniques may result in transfers in or out of an assigned level within the disclosure hierarchy. The aggregate value of investments by input level, as of October 31, 2011, is included at the end of the Fund's Schedule of Investments. Valuation techniques used to value the Fund's investments by major category are as follows:
Equity securities, including restricted securities, for which market quotations are readily available, are valued at the last reported sale price or official closing price as reported by an independent pricing service on the primary market or exchange on which they are traded and are categorized as Level 1 in the hierarchy. In the event there were no sales during the day or closing prices are not available, securities are valued at the last quoted bid price or may be valued using the last available price and are generally categorized as Level 2 in the hierarchy. For foreign equity securities, when significant market or security specific events arise, comparisons to the valuation of American Depositary Receipts
Annual Report
3. Significant Accounting Policies - continued
Security Valuation - continued
(ADRs), futures contracts, Exchange-traded funds (ETFs) and certain indexes as well as quoted prices for similar securities are used and are categorized as Level 2 in the hierarchy in these circumstances. Utilizing these techniques may result in transfers between Level 1 and Level 2. For restricted equity securities and private placements where observable inputs are limited, assumptions about market activity and risk are used and are categorized as Level 3 in the hierarchy.
Debt securities, including restricted securities, are valued based on evaluated prices received from independent pricing services or from dealers who make markets in such securities. For corporate bonds and foreign government and government agency obligations, pricing services utilize matrix pricing which considers yield or price of bonds of comparable quality, coupon, maturity and type as well as dealer supplied prices and are generally categorized as Level 2 in the hierarchy.
When independent prices are unavailable or unreliable, debt securities may be valued utilizing pricing matrices which consider similar factors that would be used by independent pricing services. These are generally categorized as Level 2 in the hierarchy but may be Level 3 depending on the circumstances.
Investments in open-end mutual funds, including Fidelity Central Funds, are valued at their closing net asset value each business day and are categorized as Level 1 in the hierarchy.
Foreign Currency. The Fund may use foreign currency contracts to facilitate transactions in foreign-denominated securities. Gains and losses from these transactions may arise from changes in the value of the foreign currency or if the counterparties do not perform under the contracts' terms.
Foreign-denominated assets, including investment securities, and liabilities are translated into U.S. dollars at the exchange rate at period end. Purchases and sales of investment securities, income and dividends received and expenses denominated in foreign currencies are translated into U.S. dollars at the exchange rate in effect on the transaction date.
The effects of exchange rate fluctuations on investments are included with the net realized and unrealized gain (loss) on investment securities. Other foreign currency transactions resulting in realized and unrealized gain (loss) are disclosed separately.
Investment Transactions and Income. For financial reporting purposes, the Fund's investment holdings and NAV include trades executed through the end of the last business day of the period. The NAV per share for processing shareholder transactions is calculated as of the close of business of the New York Stock Exchange (NYSE) normally
Annual Report
Notes to Financial Statements - continued
3. Significant Accounting Policies - continued
Investment Transactions and Income - continued
4:00 p.m. Eastern time and includes trades executed through the end of the prior business day. Gains and losses on securities sold are determined on the basis of identified cost. Dividend income is recorded on the ex-dividend date, except for certain dividends from foreign securities where the ex-dividend date may have passed, which are recorded as soon as the Fund is informed of the ex-dividend date. Non-cash dividends included in dividend income, if any, are recorded at the fair market value of the securities received. Distributions received on securities that represent a return of capital or capital gain are recorded as a reduction of cost of investments and/or as a realized gain. The Fund estimates the components of distributions received that may be considered return of capital distributions or capital gain distributions. Large, non-recurring dividends recognized by the Fund are presented separately on the Statement of Operations as "Special Dividends" and the impact of these dividends is presented in the Financial Highlights. Interest income and distributions from the Fidelity Central Funds are accrued as earned. Interest income includes coupon interest and amortization of premium and accretion of discount on debt securities. Investment income is recorded net of foreign taxes withheld where recovery of such taxes is uncertain.
Expenses. Expenses directly attributable to a fund are charged to that fund. Expenses attributable to more than one fund are allocated among the respective funds on the basis of relative net assets or other appropriate methods. Expense estimates are accrued in the period to which they relate and adjustments are made when actual amounts are known.
Income Tax Information and Distributions to Shareholders. Each year, the Fund intends to qualify as a regulated investment company, including distributing substantially all of its taxable income and realized gains under Subchapter M of the Internal Revenue Code and filing its U.S. federal tax return. As a result, no provision for income taxes is required. As of October 31, 2011, the Fund did not have any unrecognized tax benefits in the financial statements. A fund's federal tax return is subject to examination by the Internal Revenue Service (IRS) for a period of three years. Foreign taxes are provided for based on the Fund's understanding of the tax rules and rates that exist in the foreign markets in which it invests.
Distributions are declared and recorded on the ex-dividend date. Income dividends and capital gain distributions are declared separately for each class. Income and capital gain distributions are determined in accordance with income tax regulations, which may differ from GAAP.
Capital accounts within the financial statements are adjusted for permanent book-tax differences. These adjustments have no impact on net assets or the results of operations. Temporary book-tax differences will reverse in a subsequent period.
Annual Report
3. Significant Accounting Policies - continued
Income Tax Information and Distributions to Shareholders - continued
Book-tax differences are primarily due to foreign currency transactions, passive foreign investment companies (PFIC), capital loss carry forwards and losses deferred due to wash sales.
The federal tax cost of investment securities and unrealized appreciation (depreciation) as of period end were as follows:
Gross unrealized appreciation | $ 21,839,274 |
Gross unrealized depreciation | (14,802,561) |
Net unrealized appreciation (depreciation) on securities and other investments | $ 7,036,713 |
| |
Tax Cost | $ 135,836,155 |
The tax-based components of distributable earnings as of period end were as follows:
Undistributed ordinary income | $ 2,747,743 |
Capital loss carryforward | $ (11,266,491) |
Net unrealized appreciation (depreciation) | $ 7,034,254 |
Under the recently enacted Regulated Investment Company Modernization Act of 2010 (the Act), the Fund will be permitted to carry forward capital losses incurred in taxable years beginning after December 22, 2010 for an unlimited period. However, any losses incurred during those future taxable years will be required to be utilized prior to any losses incurred in pre-enactment taxable years, which generally expire after eight years from when they are incurred. Additionally, post-enactment capital losses that are carried forward will retain their character as either short-term or long-term capital losses rather than being considered all short-term as under previous law. The Fund's first fiscal year end subject to the Act will be October 31, 2012.
The tax character of distributions paid was as follows:
| October 31, 2011 | October 31, 2010 |
Ordinary Income | $ 2,137,978 | $ 1,207,434 |
Short-Term Trading (Redemption) Fees. Shares held by investors in the Fund less than 90 days are subject to a redemption fee equal to 1.50% of the net asset value of shares redeemed. All redemption fees, which reduce the proceeds of the shareholder redemption, are retained by the Fund and accounted for as an addition to paid in capital.
Annual Report
Notes to Financial Statements - continued
3. Significant Accounting Policies - continued
New Accounting Pronouncement. In May 2011, the Financial Accounting Standards Board issued Accounting Standard Update No. 2011-04, Fair Value Measurement (Topic 820) - Amendments to Achieve Common Fair Value Measurement and Disclosure Requirements in U.S. GAAP and IFRSs. The update changes the wording used to describe the requirements in GAAP for measuring fair value and for disclosing information about fair value measurements. The update is effective during interim and annual periods beginning after December 15, 2011. Management is currently evaluating the impact of the update's adoption on the Fund's financial statement disclosures.
4. Purchases and Sales of Investments.
Purchases and sales of securities other than short-term securities, aggregated $91,399,924 and $94,303,247, respectively.
5. Fees and Other Transactions with Affiliates.
Management Fee. FMR and its affiliates provide the Fund with investment management related services for which the Fund pays a monthly management fee. The management fee is the sum of an individual fund fee rate that is based on an annual rate of .55% of the Fund's average net assets and a group fee rate that averaged .26% during the period. The group fee rate is based upon the average net assets of all the mutual funds advised by FMR. The group fee rate decreases as assets under management increase and increases as assets under management decrease. For the period, the total annual management fee rate was .81% of the Fund's average net assets.
Distribution and Service Plan Fees. In accordance with Rule 12b-1 of the 1940 Act, the Fund has adopted separate Distribution and Service Plans for each class of shares. Certain classes pay Fidelity Distributors Corporation (FDC), an affiliate of FMR, separate Distribution and Service Fees, each of which is based on an annual percentage of each class' average net assets. In addition, FDC may pay financial intermediaries for selling shares of the Fund and providing shareholder support services. For the period, the Distribution and Service Fee rates, total fees and amounts retained by FDC were as follows:
| Distribution
Fee | Service
Fee | Total Fees | Retained
by FDC |
Class A | -% | .25% | $ 30,466 | $ 2,908 |
Class T | .25% | .25% | 18,756 | 28 |
Class B | .75% | .25% | 7,308 | 5,498 |
Class C | .75% | .25% | 71,641 | 32,384 |
| | | $ 128,171 | $ 40,818 |
Annual Report
5. Fees and Other Transactions with Affiliates - continued
Sales Load. FDC may receive a front-end sales charge of up to 5.75% for selling Class A shares, and 3.50% for selling Class T shares, some of which is paid to financial intermediaries for selling shares of the Fund. Depending on the holding period, FDC may receive contingent deferred sales charges levied on Class A, Class T, Class B, and Class C redemptions. The deferred sales charges range from 5% to 1% for Class B, 1% for Class C, 1.00% for certain purchases of Class A shares and .25% for certain purchases of Class T shares.
For the period, sales charge amounts retained by FDC were as follows:
| Retained
by FDC |
Class A | $ 11,710 |
Class T | 2,792 |
Class B* | 2,575 |
Class C* | 1,417 |
| $ 18,494 |
* When Class B and Class C shares are initially sold, FDC pays commissions from its own resources to financial intermediaries through which the sales are made.
Transfer Agent Fees. Fidelity Investments Institutional Operations Company, Inc. (FIIOC), an affiliate of FMR, is the transfer, dividend disbursing and shareholder servicing agent for each class of the Fund. FIIOC receives account fees and asset-based fees that vary according to the account size and type of account of the shareholders of the respective classes of the Fund. FIIOC pays for typesetting, printing and mailing of shareholder reports, except proxy statements. For the period, transfer agent fees for each class were as follows:
| Amount | % of
Average
Net Assets |
Class A | $ 34,413 | .28 |
Class T | 11,646 | .31 |
Class B | 2,238 | .31 |
Class C | 20,980 | .29 |
Emerging Europe, Middle East, Africa (EMEA) | 410,243 | .28 |
Institutional Class | 18,876 | .20 |
| $ 498,396 | |
Accounting and Security Lending Fees. Fidelity Service Company, Inc. (FSC), an affiliate of FMR, maintains the Fund's accounting records. The accounting fee is based on the level of average net assets for the month. Under a separate contract, FSC administers the security lending program. The security lending fee is based on the number and duration of lending transactions.
Annual Report
Notes to Financial Statements - continued
5. Fees and Other Transactions with Affiliates - continued
Brokerage Commissions. The Fund placed a portion of its portfolio transactions with brokerage firms which are affiliates of the investment adviser. The commissions paid to these affiliated firms were $145 for the period.
6. Committed Line of Credit.
The Fund participates with other funds managed by FMR or an affiliate in a $4.0 billion credit facility (the "line of credit") to be utilized for temporary or emergency purposes to fund shareholder redemptions or for other short-term liquidity purposes. The Fund has agreed to pay commitment fees on its pro-rata portion of the line of credit, which amounted to $554 and is reflected in Miscellaneous expenses on the Statement of Operations. During the period, there were no borrowings on this line of credit.
7. Security Lending.
The Fund lends portfolio securities through a lending agent from time to time in order to earn additional income. For equity securities, a lending agent is used and may loan securities to certain qualified borrowers, including Fidelity Capital Markets (FCM), a broker-dealer affiliated with the Fund. On the settlement date of the loan, the Fund receives collateral (in the form of U.S. Treasury obligations, letters of credit and/or cash) against the loaned securities and maintains collateral in an amount not less than 100% of the market value of the loaned securities during the period of the loan. The market value of the loaned securities is determined at the close of business of the Fund and any additional required collateral is delivered to the Fund on the next business day. If the borrower defaults on its obligation to return the securities loaned because of insolvency or other reasons, a fund could experience delays and costs in recovering the securities loaned or in gaining access to the collateral. Any cash collateral received is invested in the Fidelity Securities Lending Cash Central Fund. At period end, there were no security loans outstanding. Security lending income represents the income earned on investing cash collateral, less rebates paid to borrowers and any lending agent fees associated with the loan, plus any premium payments received for lending certain types of securities. Security lending income is presented in the Statement of Operations as a component of income from Fidelity Central Funds. Total security lending income during the period amounted to $25. During the period, there were no securities loaned to FCM.
8. Expense Reductions.
FMR voluntarily agreed to reimburse each class to the extent annual operating expenses exceeded certain levels of average net assets as noted in the table below. Some expenses, for example interest expense, including commitment fees, are excluded from this reimbursement.
Annual Report
8. Expense Reductions - continued
The following classes were in reimbursement during the period:
| Expense
Limitations | Reimbursement
from adviser |
Class A | 1.50%-1.65%* | $ 4,071 |
Class T | 1.75%-1.90%* | 1,321 |
Class B | 2.25%-2.40%* | 321 |
Class C | 2.25%-2.40%* | 2,211 |
Emerging Europe, Middle East, Africa (EMEA) | 1.25%-1.40%* | 56,199 |
Institutional Class | 1.25%-1.40%* | 1,658 |
| | $ 65,781 |
* Expense limitation in effect at period end.
Many of the brokers with whom FMR places trades on behalf of the Fund provided services to the Fund in addition to trade execution. These services included payments of certain expenses on behalf of the Fund totaling $94,313 for the period.
9. Distributions to Shareholders.
Distributions to shareholders of each class were as follows:
Years ended October 31, | 2011 | 2010 |
From net investment income | | |
Class A | $ 97,896 | $ 26,924 |
Class T | 26,168 | 5,586 |
Class B | 1,907 | - |
Class C | 32,267 | 2,308 |
Emerging Europe, Middle East, Africa (EMEA) | 1,585,636 | 748,050 |
Institutional Class | 91,487 | 33,147 |
Total | $ 1,835,361 | $ 816,015 |
From net realized gain | | |
Class A | $ 18,012 | $ 15,761 |
Class T | 5,690 | 5,156 |
Class B | 902 | 1,284 |
Class C | 9,924 | 9,232 |
Emerging Europe, Middle East, Africa (EMEA) | 253,422 | 345,254 |
Institutional Class | 14,667 | 14,732 |
Total | $ 302,617 | $ 391,419 |
Annual Report
Notes to Financial Statements - continued
10. Share Transactions.
Transactions for each class of shares were as follows:
| Shares | Dollars |
Years ended October 31, | 2011 | 2010 | 2011 | 2010 |
Class A | | | | |
Shares sold | 827,297 | 750,400 | $ 7,697,437 | $ 5,978,580 |
Reinvestment of distributions | 10,020 | 5,604 | 92,483 | 40,683 |
Shares redeemed | (725,856) | (299,775) | (6,651,188) | (2,302,163) |
Net increase (decrease) | 111,461 | 456,229 | $ 1,138,732 | $ 3,717,100 |
Class T | | | | |
Shares sold | 164,342 | 258,490 | $ 1,527,510 | $ 2,070,251 |
Reinvestment of distributions | 3,447 | 1,476 | 31,848 | 10,717 |
Shares redeemed | (94,003) | (127,308) | (862,784) | (967,322) |
Net increase (decrease) | 73,786 | 132,658 | $ 696,574 | $ 1,113,646 |
Class B | | | | |
Shares sold | 9,372 | 50,154 | $ 87,632 | $ 403,463 |
Reinvestment of distributions | 285 | 173 | 2,673 | 1,261 |
Shares redeemed | (36,653) | (66,507) | (325,442) | (516,486) |
Net increase (decrease) | (26,996) | (16,180) | $ (235,137) | $ (111,762) |
Class C | | | | |
Shares sold | 438,284 | 353,916 | $ 4,066,195 | $ 2,814,751 |
Reinvestment of distributions | 4,100 | 1,559 | 37,820 | 11,306 |
Shares redeemed | (213,656) | (147,366) | (1,892,778) | (1,102,603) |
Net increase (decrease) | 228,728 | 208,109 | $ 2,211,237 | $ 1,723,454 |
Emerging Europe, Middle East, Africa (EMEA) | | | | |
Shares sold | 7,381,313 | 10,587,461 | $ 68,910,601 | $ 85,331,520 |
Reinvestment of distributions | 187,137 | 144,800 | 1,730,170 | 1,051,250 |
Shares redeemed | (9,520,946) | (9,457,558) | (86,802,311) | (72,517,018) |
Net increase (decrease) | (1,952,496) | 1,274,703 | $ (16,161,540) | $ 13,865,752 |
Institutional Class | | | | |
Shares sold | 597,666 | 319,437 | $ 5,560,036 | $ 2,551,378 |
Reinvestment of distributions | 1,263 | 825 | 11,681 | 5,986 |
Shares redeemed | (484,423) | (105,236) | (4,318,317) | (819,955) |
Net increase (decrease) | 114,506 | 215,026 | $ 1,253,400 | $ 1,737,409 |
Annual Report
11. Other.
The Fund's organizational documents provide former and current trustees and officers with a limited indemnification against liabilities arising in connection with the performance of their duties to the Fund. In the normal course of business, the Fund may also enter into contracts that provide general indemnifications. The Fund's maximum exposure under these arrangements is unknown as this would be dependent on future claims that may be made against the Fund. The risk of material loss from such claims is considered remote.
At the end of the period, FMR or its affiliates were the owners of record of 10% of the total outstanding shares of the Fund.
Annual Report
To the Trustees of Fidelity Investment Trust and Shareholders of Fidelity Emerging Europe, Middle East, Africa (EMEA) Fund:
We have audited the accompanying statement of assets and liabilities of Fidelity Emerging Europe, Middle East, Africa (EMEA) Fund (the Fund), a fund of Fidelity Investment Trust, including the schedule of investments, as of October 31, 2011, and the related statement of operations for the year then ended, the statement of changes in net assets for each of the two years in the period then ended, and the financial highlights for each of the three years in the period then ended and the period May 8, 2008 (commencement of operations) to October 31, 2008. These financial statements and financial highlights are the responsibility of the Fund's management. Our responsibility is to express an opinion on these financial statements and financial highlights based on our audits.
We conducted our audits in accordance with the standards of the Public Company Accounting Oversight Board (United States). Those standards require that we plan and perform the audit to obtain reasonable assurance about whether the financial statements and financial highlights are free of material misstatement. The Fund is not required to have, nor were we engaged to perform, an audit of its internal control over financial reporting. Our audits included consideration of internal control over financial reporting as a basis for designing audit procedures that are appropriate in the circumstances, but not for the purpose of expressing an opinion on the effectiveness of the Fund's internal control over financial reporting. Accordingly, we express no such opinion. An audit also includes examining, on a test basis, evidence supporting the amounts and disclosures in the financial statements, assessing the accounting principles used and significant estimates made by management, as well as evaluating the overall financial statement presentation. Our procedures included confirmation of securities owned as of October 31, 2011, by correspondence with the custodians and brokers; where replies were not received from brokers, we performed other auditing procedures. We believe that our audits provide a reasonable basis for our opinion.
In our opinion, the financial statements and financial highlights referred to above present fairly, in all material respects, the financial position of Fidelity Emerging Europe, Middle East, Africa (EMEA) Fund as of October 31, 2011, the results of its operations for the year then ended, the changes in its net assets for each of the two years in the period then ended, and the financial highlights for each of the three years in the period then ended and the period May 8, 2008 (commencement of operations) to October 31, 2008, in conformity with accounting principles generally accepted in the United States of America.
DELOITTE & TOUCHE LLP
Boston, Massachusetts
December 15, 2011
Annual Report
The Trustees, Members of the Advisory Board, and executive officers of the trust and fund, as applicable, are listed below. The Board of Trustees governs the fund and is responsible for protecting the interests of shareholders. The Trustees are experienced executives who meet periodically throughout the year to oversee the fund's activities, review contractual arrangements with companies that provide services to the fund, oversee management of the risks associated with such activities and contractual arrangements, and review the fund's performance. Except for James C. Curvey, each of the Trustees oversees 226 funds advised by FMR or an affiliate. Mr. Curvey oversees 429 funds advised by FMR or an affiliate.
The Trustees hold office without limit in time except that (a) any Trustee may resign; (b) any Trustee may be removed by written instrument, signed by at least two-thirds of the number of Trustees prior to such removal; (c) any Trustee who requests to be retired or who has become incapacitated by illness or injury may be retired by written instrument signed by a majority of the other Trustees; and (d) any Trustee may be removed at any special meeting of shareholders by a two-thirds vote of the outstanding voting securities of the trust. Each Trustee who is not an interested person (as defined in the 1940 Act) (Independent Trustee), shall retire not later than the last day of the calendar year in which his or her 75th birthday occurs. The Independent Trustees may waive this mandatory retirement age policy with respect to individual Trustees. The executive officers and Advisory Board Members hold office without limit in time, except that any officer and Advisory Board Member may resign or may be removed by a vote of a majority of the Trustees at any regular meeting or any special meeting of the Trustees. Except as indicated, each individual has held the office shown or other offices in the same company for the past five years.
Experience, Skills, Attributes, and Qualifications of the Fund's Trustees. The Governance and Nominating Committee has adopted a statement of policy that describes the experience, qualifications, attributes, and skills that are necessary and desirable for potential Independent Trustee candidates (Statement of Policy). The Board believes that each Trustee satisfied at the time he or she was initially elected or appointed a Trustee, and continues to satisfy, the standards contemplated by the Statement of Policy. The Governance and Nominating Committee also engages professional search firms to help identify potential Independent Trustee candidates who have the experience, qualifications, attributes, and skills consistent with the Statement of Policy. From time to time, additional criteria based on the composition and skills of the current Independent Trustees, as well as experience or skills that may be appropriate in light of future changes to board composition, business conditions, and regulatory or other developments, have also been considered by the professional search firms and the Governance and Nominating Committee. In addition, the Board takes into account the Trustees' commitment and participation in Board and committee meetings, as well as their leadership of standing and ad hoc committees throughout their tenure.
In determining that a particular Trustee was and continues to be qualified to serve as a Trustee, the Board has considered a variety of criteria, none of which, in isolation, was controlling. The Board believes that, collectively, the Trustees have balanced and diverse experience, qualifications, attributes, and skills, which allow the Board to operate effectively in governing the fund and protecting the interests of shareholders. Information about the specific experience, skills, attributes, and qualifications of each Trustee, which in each case led to the Board's conclusion that the Trustee should serve (or continue to serve) as a trustee of the fund, is provided below.
Annual Report
Trustees and Officers - continued
Board Structure and Oversight Function. James C. Curvey is an interested person (as defined in the 1940 Act) and currently serves as Acting Chairman. The Trustees have determined that an interested Chairman is appropriate and benefits shareholders because an interested Chairman has a personal and professional stake in the quality and continuity of services provided to the fund. Independent Trustees exercise their informed business judgment to appoint an individual of their choosing to serve as Chairman, regardless of whether the Trustee happens to be independent or a member of management. The Independent Trustees have determined that they can act independently and effectively without having an Independent Trustee serve as Chairman and that a key structural component for assuring that they are in a position to do so is for the Independent Trustees to constitute a substantial majority for the Board. The Independent Trustees also regularly meet in executive session. Ned C. Lautenbach serves as Chairman of the Independent Trustees and as such (i) acts as a liaison between the Independent Trustees and management with respect to matters important to the Independent Trustees and (ii) with management prepares agendas for Board meetings.
Fidelity funds are overseen by different Boards of Trustees. The fund's Board oversees Fidelity's equity and high income funds and another Board oversees Fidelity's investment-grade bond, money market, and asset allocation funds. The asset allocation funds may invest in Fidelity funds overseen by the fund's Board. The use of separate Boards, each with its own committee structure, allows the Trustees of each group of Fidelity funds to focus on the unique issues of the funds they oversee, including common research, investment, and operational issues. On occasion, the separate Boards establish joint committees to address issues of overlapping consequences for the Fidelity funds overseen by each Board.
The Trustees operate using a system of committees to facilitate the timely and efficient consideration of all matters of importance to the Trustees, the fund, and fund shareholders and to facilitate compliance with legal and regulatory requirements and oversight of the fund's activities and associated risks. The Board, acting through its committees, has charged FMR and its affiliates with (i) identifying events or circumstances the occurrence of which could have demonstrably adverse effects on the fund's business and/or reputation; (ii) implementing processes and controls to lessen the possibility that such events or circumstances occur or to mitigate the effects of such events or circumstances if they do occur; and (iii) creating and maintaining a system designed to evaluate continuously business and market conditions in order to facilitate the identification and implementation processes described in (i) and (ii) above. Because the day-to-day operations and activities of the fund are carried out by or through FMR, its affiliates and other service providers, the fund's exposure to risks is mitigated but not eliminated by the processes overseen by the Trustees. While each of the Board's committees has responsibility for overseeing different aspects of the fund's activities, oversight is exercised primarily through the Operations, Audit, and Compliance Committees. In addition, the Independent Trustees have worked with FMR to enhance the Board's oversight of investment and financial risks, legal and regulatory risks, technology risks, and operational risks, including the development of additional risk reporting to the Board. For example, a working group comprised of Independent Trustees and FMR has worked and continues to work to review the Fidelity funds' valuation-related activities, reporting and risk management. Appropriate personnel, including but not limited to the fund's Chief Compliance Officer (CCO), FMR's internal auditor, the independent accountants, the fund's Treasurer and portfolio management personnel, make periodic reports to the Board's committees, as appropriate, including an annual review of FMR's risk management program for the Fidelity funds. The responsibilities of each standing committee, including their oversight responsibilities, are described further under "Standing Committees of the Fund's Trustees."
Annual Report
The fund's Statement of Additional Information (SAI) includes more information about the Trustees. To request a free copy, call Fidelity at 1-877-208-0098.
Interested Trustees*:
Correspondence intended for each Trustee who is an interested person may be sent to Fidelity Investments, 82 Devonshire Street, Boston, Massachusetts 02109.
Name, Age; Principal Occupations and Other Relevant Experience+ |
James C. Curvey (76) |
| Year of Election or Appointment: 2007 Mr. Curvey is Trustee and Acting Chairman of the Board of Trustees of certain Trusts. Mr. Curvey also serves as Trustee (2007-present) of other investment companies advised by FMR. Mr. Curvey is a Director of Fidelity Investments Money Management, Inc. (2009-present), Director of Fidelity Research & Analysis Co. (2009-present) and Director of FMR and FMR Co., Inc. (2007-present). Mr. Curvey is also Vice Chairman (2007-present) and Director of FMR LLC. In addition, Mr. Curvey serves as an Overseer for the Boston Symphony Orchestra and a member of the Trustees of Villanova University. Previously, Mr. Curvey was the Vice Chairman (2006-2007) and Director (2000-2007) of FMR Corp. |
Ronald P. O'Hanley (54) |
| Year of Election or Appointment: 2011 Mr. O'Hanley is Director of FMR Co., Inc. (2010-present), Director of Fidelity Investments Money Management, Inc. (2010-present), Director of Fidelity Research & Analysis Company (2010-present), President of Fidelity Asset Management and Corporate Services and a member of Fidelity's Executive Committee (2010-present). Previously, Mr. O'Hanley served as President and Chief Executive Officer of BNY Mellon Asset Management (2007-2010). Mr. O'Hanley also served as Vice Chairman of Bank New York Mellon Corp. and a member of that firm's Executive Committee. Prior to the 2007 merger of The Bank of New York and Mellon Financial Corporation, he was Vice Chairman of Mellon Financial Corporation and President and Chief Executive Officer of Mellon Asset Management. He joined Mellon in February 1997. Mr. O'Hanley currently serves as Chairman of the Boston Public Library Foundation Board of Directors and sits on the Board of Directors of Beth Israel Deaconess Medical Center, the Board of Trustees of the Marine Biological Laboratory and the Advisory Board of the Maxwell School of Citizenship and Public Administration at Syracuse University. Mr. O'Hanley also chairs the Council on Asset Management for the Financial Services Roundtable and is a member of the Board of Directors of Institutional Investor's U.S. Institute. |
* Trustees have been determined to be "Interested Trustees" by virtue of, among other things, their affiliation with the trust or various entities under common control with FMR.
+ The information above includes each Trustee's principal occupation during the last five years and other information relating to the experience, attributes, and skills relevant to each Trustee's qualifications to serve as a Trustee, which led to the conclusion that each Trustee should serve as a Trustee for the fund.
Annual Report
Independent Trustees:
Correspondence intended for each Independent Trustee (that is, the Trustees other than the Interested Trustees) may be sent to Fidelity Investments, P.O. Box 55235, Boston, Massachusetts 02205-5235.
Name, Age; Principal Occupations and Other Relevant Experience+ |
Dennis J. Dirks (63) |
| Year of Election or Appointment: 2005 Prior to his retirement in May 2003, Mr. Dirks was Chief Operating Officer and a member of the Board of The Depository Trust & Clearing Corporation (DTCC). He also served as President, Chief Operating Officer, and Board member of The Depository Trust Company (DTC) and President and Board member of the National Securities Clearing Corporation (NSCC). In addition, Mr. Dirks served as Chief Executive Officer and Board member of the Government Securities Clearing Corporation, Chief Executive Officer and Board member of the Mortgage-Backed Securities Clearing Corporation, as a Trustee and a member of the Finance Committee of Manhattan College (2005-2008), and as a Trustee and a member of the Finance Committee of AHRC of Nassau County (2006-2008). Mr. Dirks is a member of the Independent Directors Council (IDC) Governing Council (2010-Present) and Board of Directors for The Brookville Center for Children's Services, Inc. (2009-present). |
Alan J. Lacy (58) |
| Year of Election or Appointment: 2008 Mr. Lacy serves as Senior Adviser (2007-present) of Oak Hill Capital Partners, L.P. (private equity). Mr. Lacy also served as Chief Executive Officer (2000-2005) and Vice Chairman (2005-2006) of Sears Holdings Corporation and Sears, Roebuck and Co. (retail). In addition, Mr. Lacy serves as a member of the Board of Directors of Dave & Buster's, Inc. (restaurant and entertainment complexes, 2010-present), The Hillman Companies, Inc. (hardware wholesalers, 2010-present), and Bristol-Myers Squibb Company (global pharmaceuticals, 2007-present). Mr. Lacy is a member of the Board of Trustees of The National Parks Conservation Association (2006-Present). Previously, Mr. Lacy served as Chairman of the Board of Trustees of the National Parks Conservation Association (2008-2011) and as a member of the Board of Directors for the Western Union Company (global money transfer, 2006-2011). |
Ned C. Lautenbach (67) |
| Year of Election or Appointment: 2000 Mr. Lautenbach is Chairman of the Independent Trustees of the Equity and High Income Funds (2006-present). Mr. Lautenbach currently serves as the Lead Director of the Eaton Corporation Board of Directors (diversified industrial, 1997-present). Mr. Lautenbach is also a member of the Board of Directors of the Philharmonic Center for the Arts in Naples, Florida (1999-present); a member of the Board of Trustees of Fairfield University (2005-present); and a member of the Council on Foreign Relations (1994-present). Previously, Mr. Lautenbach was a Partner/Advisory Partner at Clayton, Dubilier & Rice, LLC (private equity investment, 1998-2010), as well as a Director of Sony Corporation (2006-2007). |
Joseph Mauriello (67) |
| Year of Election or Appointment: 2008 Prior to his retirement in January 2006, Mr. Mauriello served in numerous senior management positions including Deputy Chairman and Chief Operating Officer (2004-2005), and Vice Chairman of Financial Services (2002-2004) of KPMG LLP US (professional services, 1965-2005). Mr. Mauriello currently serves as a member of the Board of Directors of XL Group plc. (global insurance and re-insurance, 2006-present) and of Arcadia Resources Inc. (health care services and products, 2007-present). Previously, Mr. Mauriello served as a Director of the Hamilton Funds of the Bank of New York (2006-2007). |
Robert W. Selander (61) |
| Year of Election or Appointment: 2011 Previously, Mr. Selander served as a Member of the Advisory Board of Fidelity's Equity and High Income Funds (2011), Executive Vice Chairman (2010), Chief Executive Officer (2009-2010), and President and Chief Executive Officer (1997-2009) of Mastercard, Inc. |
Cornelia M. Small (67) |
| Year of Election or Appointment: 2005 Ms. Small is a member of the Board of Directors of the Teagle Foundation (2009-present). Ms. Small is also a member of the Investment Committee, and Chair (2008-present) and a member of the Board of Trustees of Smith College. In addition, Ms. Small serves on the Investment Committee of the Berkshire Taconic Community Foundation (2008-present). Previously, Ms. Small served as Chairperson of the Investment Committee (2002-2008) of Smith College. In addition, Ms. Small served as Chief Investment Officer, Director of Global Equity Investments, and a member of the Board of Directors of Scudder, Stevens & Clark and Scudder Kemper Investments. |
William S. Stavropoulos (72) |
| Year of Election or Appointment: 2001 Mr. Stavropoulos is Vice Chairman of the Independent Trustees of the Equity and High Income Funds (2006-present). Mr. Stavropoulos serves as President and Founder of the Michigan Baseball Foundation, the Great Lakes Loons (2007-present). Mr. Stavropoulos is Chairman Emeritus of the Board of Directors of The Dow Chemical Company, where he previously served in numerous senior management positions, including President, CEO (1995-2000; 2002-2004), Chairman of the Executive Committee (2000-2006), and as a member of the Board of Directors (1990-2006). Currently, Mr. Stavropoulos is Chairman of Univar (global distributor of commodity and specialty chemicals, 2010-present), a Director of Teradata Corporation (data warehousing and technology solutions, 2008-present), Chemical Financial Corporation, Maersk Inc. (industrial conglomerate), Tyco International, Inc. (multinational manufacturing and services, 2007-present), and a member of the Advisory Board for Metalmark Capital (private equity investment, 2005-present). Mr. Stavropoulos is a special advisor to Clayton, Dubilier & Rice, LLC (private equity investment). In addition, Mr. Stavropoulos is a member of the University of Notre Dame Advisory Council for the College of Science. |
David M. Thomas (62) |
| Year of Election or Appointment: 2008 Previously, Mr. Thomas served as Executive Chairman (2005-2006) and Chairman and Chief Executive Officer (2000-2005) of IMS Health, Inc. (pharmaceutical and healthcare information solutions). In addition, Mr. Thomas serves as a member of the Board of Directors of Fortune Brands, Inc. (consumer products), and Interpublic Group of Companies, Inc. (marketing communication, 2004-present). |
Michael E. Wiley (61) |
| Year of Election or Appointment: 2008 Mr. Wiley also serves as a Director of Asia Pacific Exploration Consolidated (international oil and gas exploration and production, 2008-present). Mr. Wiley serves as a Director of Tesoro Corporation (independent oil refiner and marketer, 2005-present), and a Director of Bill Barrett Corporation (exploration and production, 2005-present). In addition, Mr. Wiley also serves as a Director of Post Oak Bank (privately-held bank, 2004-present). Previously, Mr. Wiley served as a member of the Board of Trustees of the University of Tulsa (2000-2006; 2007-2010), as a Senior Energy Advisor of Katzenbach Partners, LLC (consulting, 2006-2007), as an Advisory Director of Riverstone Holdings (private investment), Chairman, President, and CEO of Baker Hughes, Inc. (oilfield services, 2000-2004), and as Director of Spinnaker Exploration Company (exploration and production, 2001-2005). |
Annual Report
Trustees and Officers - continued
+ The information above includes each Trustee's principal occupation during the last five years and other information relating to the experience, attributes, and skills relevant to each Trustee's qualifications to serve as a Trustee, which led to the conclusion that each Trustee should serve as a Trustee for the fund.
Advisory Board Members and Executive Officers:
Correspondence intended for each executive officer, Edward C. Johnson 3d, and Peter S. Lynch may be sent to Fidelity Investments, 82 Devonshire Street, Boston, Massachusetts 02109.
Name, Age; Principal Occupation |
Edward C. Johnson 3d (81) |
| Year of Election or Appointment: 2011 Member of the Advisory Board of Fidelity's Equity and High Income Funds. Mr. Johnson serves as Chief Executive Officer, Chairman, and a Director of FMR LLC, and also serves as Chairman and Director of FIL Limited. Previously, Mr. Johnson served as a Trustee and Chairman of the Board of certain Fidelity Trusts, Chairman and a Director of FMR, Chairman and a Director of FMR Co., Inc., and President of FMR LLC (2006-2007). |
Peter S. Lynch (67) |
| Year of Election or Appointment: 2003 Member of the Advisory Board of Fidelity's Equity and High Income Funds. Mr. Lynch is Vice Chairman and a Director of FMR and FMR Co., Inc. In addition, Mr. Lynch serves as a Trustee of Boston College and as the Chairman of the Inner-City Scholarship Fund. Previously, Mr. Lynch served on the Special Olympics International Board of Directors (1997-2006). |
Kenneth B. Robins (42) |
| Year of Election or Appointment: 2008 President and Treasurer of Fidelity's Equity and High Income Funds. Mr. Robins also serves as President and Treasurer (2010-present) and Assistant Treasurer (2009-present) of other Fidelity funds and is an employee of Fidelity Investments (2004-present). Previously, Mr. Robins served as Deputy Treasurer of the Fidelity funds (2005-2008) and Treasurer and Chief Financial Officer of The North Carolina Capital Management Trust: Cash and Term Portfolios (2006-2008). |
Bruce T. Herring (46) |
| Year of Election or Appointment: 2006 Vice President of certain Equity Funds. Mr. Herring also serves as Chief Investment Officer and Director of Fidelity Management & Research (U.K.) Inc. (2010-present) and Group Chief Investments Officer of FMR. Previously, Mr. Herring served as Vice President (2005-2006) and Senior Vice President (2006-2007) of Fidelity Management & Research Company, Vice President of FMR Co., Inc. (2001-2007) and as a portfolio manager for Fidelity U.S. Equity Funds. |
Brian B. Hogan (47) |
| Year of Election or Appointment: 2009 Vice President of Equity and High Income Funds. Mr. Hogan also serves as President of FMR's Equity Division (2009-present). Previously, Mr. Hogan served as Senior Vice President, Equity Research of FMR (2006-2009) and as a portfolio manager. |
Scott C. Goebel (43) |
| Year of Election or Appointment: 2008 Secretary and Chief Legal Officer (CLO) of the Fidelity funds. Mr. Goebel also serves as Secretary of Fidelity Investments Money Management, Inc. (FIMM) (2010-present) and Fidelity Research and Analysis Company (FRAC) (2010-present); Secretary and CLO of The North Carolina Capital Management Trust: Cash and Term Portfolios (2008-present); General Counsel, Secretary, and Senior Vice President of FMR (2008-present) and FMR Co., Inc. (2008-present); employed by FMR LLC or an affiliate (2001-present); Chief Legal Officer of Fidelity Management & Research (Hong Kong) Limited (2008-present) and Assistant Secretary of Fidelity Management & Research (Japan) Inc. (2008-present), and Fidelity Management & Research (U.K.) Inc. (2008-present). Previously, Mr. Goebel served as Assistant Secretary of FIMM (2008-2010), FRAC (2008-2010), and the Funds (2007-2008) and as Vice President and Secretary of Fidelity Distributors Corporation (FDC) (2005-2007). |
William C. Coffey (42) |
| Year of Election or Appointment: 2009 Assistant Secretary of Fidelity's Equity and High Income Funds. Mr. Coffey also serves as Senior Vice President and Deputy General Counsel of FMR LLC (2010-present), and is an employee of Fidelity Investments. Previously, Mr. Coffey served as Vice President and Associate General Counsel of FMR LLC (2005-2009). |
Holly C. Laurent (57) |
| Year of Election or Appointment: 2008 Anti-Money Laundering (AML) Officer of the Fidelity funds. Ms. Laurent also serves as AML Officer of The North Carolina Capital Management Trust: Cash and Term Portfolios (2008-present) and is an employee of Fidelity Investments. Previously, Ms. Laurent was Senior Vice President and Head of Legal for Fidelity Business Services India Pvt. Ltd. (2006-2008), and Senior Vice President, Deputy General Counsel and Group Head for FMR LLC (2005-2006). |
Christine Reynolds (53) |
| Year of Election or Appointment: 2008 Chief Financial Officer of the Fidelity funds. Ms. Reynolds became President of Fidelity Pricing and Cash Management Services (FPCMS) in August 2008. Ms. Reynolds served as Chief Operating Officer of FPCMS (2007-2008). Previously, Ms. Reynolds served as President, Treasurer, and Anti-Money Laundering officer of the Fidelity funds (2004-2007). |
Kenneth A. Rathgeber (64) |
| Year of Election or Appointment: 2004 Chief Compliance Officer of Fidelity's Equity and High Income Funds. Mr. Rathgeber is Chief Compliance Officer of Fidelity Management & Research (Hong Kong) Limited (2008-present), Fidelity Management & Research (Japan) Inc. (2008-present), FMR (2005-present), FMR Co., Inc. (2005-present), Fidelity Management & Research (U.K.) Inc. (2005-present), Fidelity Research & Analysis Company (2005-present), Fidelity Investments Money Management, Inc. (2005-present), Pyramis Global Advisors, LLC (2005-present), and Strategic Advisers, Inc. (2005-present). |
Jeffrey S. Christian (50) |
| Year of Election or Appointment: 2009 Deputy Treasurer of the Fidelity funds. Mr. Christian is an employee of Fidelity Investments. Previously, Mr. Christian served as Chief Financial Officer (2008-2009) of certain Fidelity funds and Senior Vice President of Fidelity Pricing and Cash Management Services (FPCMS) (2004-2009). |
Joseph F. Zambello (54) |
| Year of Election or Appointment: 2011 Deputy Treasurer of the Fidelity funds. Mr. Zambello is an employee of Fidelity Investments. Previously, Mr. Zambello served as Vice President of FMR's Program Management Group (2009-2011) and Vice President of the Transfer Agent Oversight Group (2005-2009). |
Adrien E. Deberghes (44) |
| Year of Election or Appointment: 2008 Deputy Treasurer of Fidelity's Equity and High Income Funds. Mr. Deberghes also serves as Vice President and Assistant Treasurer of Fidelity Rutland Square Trust II and Fidelity Commonwealth Trust II (2011-present), Assistant Treasurer of other Fidelity funds (2010-present), and is an employee of Fidelity Investments (2008-present). Previously, Mr. Deberghes served as Senior Vice President of Mutual Fund Administration at State Street Corporation (2007-2008), Senior Director of Mutual Fund Administration at Investors Bank & Trust (2005-2007), and Director of Finance for Dunkin' Brands (2000-2005). |
Stephanie J. Dorsey (42) |
| Year of Election or Appointment: 2010 Assistant Treasurer of Fidelity's Equity and High Income Funds. Ms. Dorsey also serves as Deputy Treasurer of other Fidelity funds (2008-present) and is an employee of Fidelity Investments (2008-present). Previously, Ms. Dorsey served as Treasurer (2004-2008) of the JPMorgan Mutual Funds and Vice President (2004-2008) of JPMorgan Chase Bank. |
John R. Hebble (53) |
| Year of Election or Appointment: 2009 Assistant Treasurer of Fidelity's Equity and High Income Funds. Mr. Hebble also serves as President (2011-present), Treasurer, and Chief Financial Officer of The North Carolina Capital Management Trust: Cash and Term Portfolios (2008-present), President and Treasurer of other Fidelity funds (2008-present) and is an employee of Fidelity Investments. |
Gary W. Ryan (53) |
| Year of Election or Appointment: 2005 Assistant Treasurer of the Fidelity funds. Mr. Ryan is an employee of Fidelity Investments. Previously, Mr. Ryan served as Vice President of Fund Reporting in Fidelity Pricing and Cash Management Services (FPCMS) (1999-2005). |
Jonathan Davis (43) |
| Year of Election or Appointment: 2010 Assistant Treasurer of the Fidelity funds. Mr. Davis is also Assistant Treasurer of Fidelity Rutland Square Trust II and Fidelity Commonwealth Trust II. Mr. Davis is an employee of Fidelity Investments. Previously, Mr. Davis served as Vice President and Associate General Counsel of FMR LLC (2003-2010). |
Annual Report
Institutional Class designates 100% of the dividend distributed during the fiscal year, as amounts which may be taken into account as a dividend for purposes of the maximum rate under section 1(h)(11) of the Internal Revenue Code.
The amounts per share which represent income derived from sources within, and taxes paid to, foreign countries or possessions of the United States are as follows:
| Pay Date | Income | Taxes |
Institutional Class | 12/13/2010 | $0.050 | $0.0115 |
| 12/31/2010 | $0.011 | $0.0000 |
The fund will notify shareholders in January 2012 of amounts for use in preparing 2011 income tax returns.
Annual Report
Board Approval of Investment Advisory Contracts and Management Fees
Fidelity Emerging Europe, Middle East, Africa (EMEA) Fund
Each year, the Board of Trustees, including the Independent Trustees (together, the Board), votes on the renewal of the management contract and sub-advisory agreements (together, the Advisory Contracts) for the fund. The Board, assisted by the advice of fund counsel and Independent Trustees' counsel, requests and considers a broad range of information relevant to the renewal of the Advisory Contracts throughout the year.
The Board meets regularly and considers at each of its meetings factors that are relevant to its annual consideration of the renewal of the fund's Advisory Contracts, including the services and support provided to the fund and its shareholders. The Board has established various standing committees, each composed of Independent Trustees with varying backgrounds, to which the Board has assigned specific subject matter responsibilities in order to enhance effective decision-making by the Board. The Board, acting directly and through its Committees, requests and receives information concerning the annual consideration of the renewal of the fund's Advisory Contracts. The Board also meets as needed to consider matters specifically related to the Board's annual consideration of the renewal of Advisory Contracts. Members of the Board may also meet with trustees of other Fidelity funds through ad hoc joint committees to discuss certain matters relevant to the Fidelity funds.
At its July 2011 meeting, the Board of Trustees, including the Independent Trustees, unanimously determined to renew the fund's Advisory Contracts. In reaching its determination, the Board considered all factors it believed relevant, including (i) the nature, extent, and quality of the services to be provided to the fund and its shareholders (including the investment performance of the fund); (ii) the competitiveness of the fund's management fee and total expense ratio; (iii) the total costs of the services to be provided by and the profits to be realized by Fidelity from its relationship with the fund; (iv) the extent to which economies of scale would be realized as the fund grows; and (v) whether fee levels reflect these economies of scale, if any, for the benefit of fund shareholders.
In considering whether to renew the Advisory Contracts for the fund, the Board reached a determination, with the assistance of fund counsel and Independent Trustees' counsel and through the exercise of its business judgment, that the renewal of the Advisory Contracts is in the best interests of the fund and its shareholders and that the compensation payable under the Advisory Contracts is fair and reasonable. The Board's decision to renew the Advisory Contracts was not based on any single factor, but rather was based on a comprehensive consideration of all the information provided to the Board at its meetings throughout the year. The Board, in reaching its determination to renew the Advisory Contracts, is aware that shareholders in the fund have a broad range of investment choices available to them, including a wide choice among mutual funds offered by Fidelity's competitors, and that the fund's shareholders, who have the opportunity to review and weigh the disclosure provided by the fund in its prospectus and other public disclosures, have chosen to invest in this fund, managed by Fidelity.
Annual Report
Board Approval of Investment Advisory Contracts and
Management Fees - continued
Nature, Extent, and Quality of Services Provided. The Board considered the staffing within the investment adviser, FMR, and the sub-advisers (together, the Investment Advisers), including the backgrounds of the fund's investment personnel and the fund's investment objective and discipline. The Independent Trustees also had discussions with senior management of Fidelity's investment operations and investment groups. The Board considered the structure of the portfolio manager compensation program and whether this structure provides appropriate incentives to act in the best interests of the fund.
Resources Dedicated to Investment Management and Support Services. The Board and the Fund Oversight and Research Committees reviewed the general qualifications and capabilities of the Investment Advisers' investment staff, including its size, education, experience, and resources, as well as the Investment Advisers' approach to recruiting, training, managing, and compensating investment personnel. The Board also noted that FMR has devoted increased resources to non-U.S. offices. The Board noted that Fidelity's analysts have extensive resources, tools and capabilities which allow them to conduct sophisticated quantitative and fundamental analysis, as well as credit analysis of issuers, counterparties and enhancers. The Board also believes that Fidelity's investment professionals have sufficient access to global information and data so as to provide competitive investment results over time, and that those professionals also have access to sophisticated tools which permit them to assess portfolio construction and risk and performance attribution characteristics continuously, as well as to transmit new information and research conclusions rapidly around the world. Additionally, in their deliberations, the Board considered the Investment Advisers' trading capabilities and resources which are an integral part of the investment management process.
Shareholder and Administrative Services. The Board considered (i) the nature, extent, quality, and cost of advisory, administrative, and shareholder services performed by the Investment Advisers and their affiliates under the Advisory Contracts and under separate agreements covering transfer agency, pricing and bookkeeping, and securities lending services for the fund; (ii) the nature and extent of the investment adviser's supervision of third party service providers, principally custodians and subcustodians; and (iii) the resources devoted to, and the record of compliance with, the fund's compliance policies and procedures. The Board also reviewed the allocation of fund brokerage, including allocations to brokers affiliated with the Investment Advisers, the use of brokerage commissions to pay fund expenses, and the use of "soft" commission dollars to pay for research services.
The Board noted that the growth of fund assets over time across the complex allows Fidelity to reinvest in the development of services designed to enhance the value or convenience of the Fidelity funds as investment vehicles. These services include 24-hour access to account information and market information through telephone representatives and over the Internet, investor education materials and asset allocation tools, and the expanded availability of Fidelity Investor Centers, with 35 new branches opening since 2010.
Annual Report
Investment in a Large Fund Family. The Board considered the benefits to shareholders of investing in a Fidelity fund, including the benefits of investing in a fund that is part of a large family of funds offering a variety of investment disciplines and providing a large variety of mutual fund investor services. The Board noted that Fidelity had taken, or had made recommendations that resulted in the Fidelity funds taking, a number of actions over the previous year that benefited particular funds, including (i) continuing to dedicate additional resources to investment research and support of the senior management team that oversees asset management; (ii) rationalizing product lines through the mergers of six funds into other funds; (iii) continuing to migrate the Freedom Funds to dedicated lower cost underlying funds; (iv) obtaining shareholder approval to broaden the investment strategies for Fidelity Consumer Finance Portfolio, Fidelity Emerging Asia Fund, and Fidelity Environment and Alternative Energy Portfolio; (v) contractually agreeing to reduce the management fees and impose other expense limitations on Spartan 500 Index Fund and U.S. Bond Index Fund in connection with launching new institutional classes of these funds; (vi) changing the name, primary and supplemental benchmarks, and investment policies of Fidelity Global Strategies Fund to support the fund's flexible investment mandate and global orientation; and (vii) reducing the transfer agency account fee rates on certain accounts.
Investment Performance. The Board considered whether the fund has operated in accordance with its investment objective, as well as its record of compliance with its investment restrictions. It also reviewed the fund's absolute investment performance for each class, as well as the fund's relative investment performance for each class measured against a broad-based securities market index. The Board noted that FMR does not believe that a meaningful peer group exists against which to compare the fund's performance. Because the fund had been in existence less than three calendar years, the following chart considered by the Board shows, for the one-year period ended December 31, 2010, the total returns of the retail class and Class B of the fund and the total returns of a broad-based securities market index ("benchmark").
Annual Report
Board Approval of Investment Advisory Contracts and
Management Fees - continued
Fidelity Emerging Europe, Middle East, Africa (EMEA) Fund

The Board noted that the investment performance of the retail class of the fund compared favorably to its benchmark for the period shown. The Board considered that the variations in performance among the fund's classes reflect the variations in class expenses, which result in lower performance for higher expense classes. The Board also reviewed the fund's performance since inception as well as performance in the current year. The Board noted that it is difficult to evaluate in any comprehensive fashion the performance of the fund, in light of its relatively recent commencement of operations.
Based on its review, the Board concluded that the nature, extent, and quality of services provided to the fund under the Advisory Contracts should benefit the fund's shareholders.
Competitiveness of Management Fee and Total Expense Ratio. The Board considered the fund's management fee and total expense ratio compared to "mapped groups" of competitive funds and classes. Fidelity creates "mapped groups" by combining similar Lipper investment objective categories that have comparable management fee characteristics. Combining Lipper investment objective categories aids the Board's management fee and total expense ratio comparisons by broadening the competitive group used for comparison and by reducing the number of universes to which various Fidelity funds are compared.
Management Fee. The Board considered two proprietary management fee comparisons for the 12-month (or shorter) periods shown in the chart below. The group of Lipper funds used by the Board for management fee comparisons is referred to below as the "Total Mapped Group." The Total Mapped Group comparison focuses on a fund's standing relative to the total universe of comparable funds available to investors in terms of gross management fees before expense reimbursements or caps. "TMG %" represents the percentage of funds in the Total Mapped Group that had management fees that were lower than the fund's. For example, a TMG % of 13% means that 87% of the funds in the Total Mapped Group had higher management fees than the fund. The "Asset-Size Peer Group" (ASPG) comparison focuses on a fund's standing relative to non-Fidelity funds similar in size to the fund within the Total Mapped Group. The ASPG represents at least 15% of the funds in the Total Mapped Group with comparable asset size and management fee characteristics, subject to a minimum of 50 funds (or all funds in the Total Mapped Group if fewer than 50). Additional information, such as the ASPG quartile in which the fund's management fee ranked, is also included in the chart and considered by the Board.
Annual Report
Fidelity Emerging Europe, Middle East, Africa (EMEA) Fund
The Board noted that the fund's management fee ranked below the median of its Total Mapped Group and below the median of its ASPG for 2010.
Based on its review, the Board concluded that the fund's management fee is fair and reasonable in light of the services that the fund receives and the other factors considered.
Total Expense Ratio. In its review of each class's total expense ratio, the Board considered the fund's management fee as well as other fund or class expenses, as applicable, such as transfer agent fees, pricing and bookkeeping fees, fund-paid 12b-1 fees, and custodial, legal, and audit fees. The Board also noted the effects of any waivers and reimbursements on fees and expenses. As part of its review, the Board also considered the current and historical total expense ratios of each class of the fund compared to competitive fund median expenses. Each class of the fund is compared to those funds and classes in the Total Mapped Group (used by the Board for management fee comparisons) that have a similar sales load structure.
Annual Report
Board Approval of Investment Advisory Contracts and
Management Fees - continued
The Board noted that the total expense ratio of each class ranked below its competitive median for 2010. The Board considered that various factors, including 12b-1 fees, positive or negative performance adjustments, and relatively higher other expenses in the case of small fund size, can affect total expense ratios.
Fees Charged to Other Fidelity Clients. The Board also considered Fidelity fee structures and other information with respect to clients of FMR and its affiliates, such as other mutual funds advised or subadvised by FMR or its affiliates, pension plan clients, and other institutional clients. In March 2010, the Board created an ad hoc joint committee with the board of other Fidelity funds (the Committee) to review and compare Fidelity's institutional investment advisory business with its business of providing services to the Fidelity funds, including the differences in services provided, fees charged, and costs incurred, as well as competition in their respective marketplaces.
Based on its review of total expense ratios and fees charged to other Fidelity clients, the Board concluded that the total expense ratio of each class of the fund was reasonable in light of the services that the fund and its shareholders receive and the other factors considered, including the findings of the Committee.
Costs of the Services and Profitability. The Board considered the revenues earned and the expenses incurred by Fidelity in conducting the business of developing, marketing, distributing, managing, administering and servicing the fund and its shareholders. The Board also considered the level of Fidelity's profits in respect of all the Fidelity funds.
On an annual basis, FMR presents to the Board Fidelity's profitability for the fund. Fidelity calculates the profitability for each fund, as well as aggregate profitability for groups of Fidelity funds and all Fidelity funds, using a series of detailed revenue and cost allocation methodologies which originate with the books and records of Fidelity on which Fidelity's audited financial statements are based. The Audit Committee of the Board reviews any significant changes from the prior year's methodologies.
PricewaterhouseCoopers LLP (PwC), independent registered public accounting firm and auditor to Fidelity and certain Fidelity funds, has been engaged annually by the Board as part of the Board's assessment of Fidelity's profitability analysis. PwC's engagement includes the review and assessment of Fidelity's methodologies used in determining the revenues and expenses attributable to Fidelity's mutual fund business, and completion of agreed-upon procedures surrounding the mathematical accuracy of fund profitability and its conformity to allocation methodologies. After considering PwC's reports issued under the engagement and information provided by Fidelity, the Board concluded that while other allocation methods may also be reasonable, Fidelity's profitability methodologies are reasonable in all material respects.
Annual Report
The Board also reviewed Fidelity's non-fund businesses and fall-out benefits related to the mutual fund business as well as cases where Fidelity's affiliates may benefit from or be related to the fund's business.
The Board considered the costs of the services provided by and the profits realized by Fidelity in connection with the operation of the fund and was satisfied that the profitability was not excessive in the circumstances.
Economies of Scale. The Board considered whether there have been economies of scale in respect of the management of the Fidelity funds, whether the Fidelity funds (including the fund) have appropriately benefited from any such economies of scale, and whether there is potential for realization of any further economies of scale. The Board considered the extent to which the fund will benefit from economies of scale through increased services to the fund, through waivers or reimbursements, or through fee or expense reductions. The Board also noted that in 2009, it and the board of other Fidelity funds created an ad hoc committee (the Economies of Scale Committee) to analyze whether FMR attains economies of scale in respect of the management and servicing of the Fidelity funds, whether the Fidelity funds have appropriately benefited from such economies of scale, and whether there is potential for realization of any further economies of scale.
The Board recognized that the fund's management contract incorporates a "group fee" structure, which provides for lower group fee rates as total fund assets under FMR's management increase, and for higher group fee rates as total fund assets under FMR's management decrease. FMR calculates the group fee rates based on a tiered asset "breakpoint" schedule that varies based on asset class. The Board considered that the group fee is designed to deliver the benefits of economies of scale to fund shareholders when total Fidelity fund assets increase, even if assets of any particular fund are unchanged or have declined, because some portion of Fidelity's costs are attributable to services provided to all Fidelity funds, and all funds benefit if those costs can be allocated among more assets. The Board concluded that, given the group fee structure, fund shareholders will benefit from lower management fees as assets under FMR's management increase at the fund complex level, regardless of whether Fidelity achieves any such economies of scale.
The Board concluded, taking into account the analysis of the Economies of Scale Committee, that any potential economies of scale are being appropriately shared between fund shareholders and Fidelity.
Annual Report
Board Approval of Investment Advisory Contracts and
Management Fees - continued
Additional Information Requested by the Board. In order to develop fully the factual basis for consideration of the Fidelity funds' Advisory Contracts, the Board requested and received additional information on certain topics, including (i) fund performance trends, actions to be taken by FMR to improve certain funds' overall performance, and Fidelity's long-term strategies for certain funds; (ii) portfolio manager changes that have occurred during the past year and length of portfolio manager tenure for different categories of funds over time; (iii) Fidelity's compensation structure for portfolio managers and other key personnel and strategies for attracting and retaining non-investment personnel; (iv) the amount of the investment that each portfolio manager has made in the Fidelity fund(s) that he or she manages; (v) historical trends in Fidelity's realization of fall-out benefits; (vi) Fidelity's group fee structures and the rationale for the individual fee rates of certain funds; (vii) fund profitability methodology and the impact of certain factors on fund profitability results; (viii) trends regarding industry use of performance fee structures and Fidelity's compliance practices with respect to performance adjustment calculations; (ix) the fee structures in place for certain other Fidelity clients; and (x) explanations regarding the relative total expense ratios of certain funds and classes, total expense competitive trends, and actions that might be taken by FMR to reduce total expense ratios for certain funds and classes.
Based on its evaluation of all of the conclusions noted above, and after considering all factors it believed relevant, the Board ultimately concluded that the advisory fee structures are fair and reasonable, and that the fund's Advisory Contracts should be renewed.
Annual Report
Investment Adviser
Fidelity Management & Research Company
Boston, MA
Investment Sub-Advisers
FMR Co., Inc.
Fidelity Management & Research
(U.K.) Inc.
FIL Investments (Japan) Limited
FIL Investment Advisors
FIL Investment Advisors
(U.K.) Limited
Fidelity Management & Research
(Hong Kong) Limited
Fidelity Management & Research
(Japan) Inc.
General Distributor
Fidelity Distributors Corporation
Boston, MA
Transfer and Service Agents
Fidelity Investments Institutional
Operations Company, Inc.
Boston, MA
Fidelity Service Company, Inc.
Boston, MA
Custodian
State Street Bank & Trust Company
Quincy, MA
AEMEI-UANN-1211
1.861980.103
Fidelity®
Global Commodity Stock
Fund
Annual Report
October 31, 2011
Contents
Chairman's Message | (Click Here) | The Chairman's message to shareholders. |
Performance | (Click Here) | How the fund has done over time. |
Management's Discussion of Fund Performance | (Click Here) | The Portfolio Manager's review of fund performance and strategy. |
Shareholder Expense Example | (Click Here) | An example of shareholder expenses. |
Investment Changes | (Click Here) | A summary of major shifts in the fund's investments over the past six months. |
Investments | (Click Here) | A complete list of the fund's investments with their market values. |
Financial Statements | (Click Here) | Statements of assets and liabilities, operations, and changes in net assets, as well as financial highlights. |
Notes | (Click Here) | Notes to the financial statements. |
Report of Independent Registered Public Accounting Firm | (Click Here) | |
Trustees and Officers | (Click Here) | |
Distributions | (Click Here) | |
Board Approval of Investment Advisory Contracts and Management Fees | (Click Here) | |
To view a fund's proxy voting guidelines and proxy voting record for the 12-month period ended June 30, visit http://www.fidelity.com/proxyvotingresults or visit the Securities and Exchange Commission's (SEC) web site at http://www.sec.gov. You may also call 1-800-544-8544 to request a free copy of the proxy voting guidelines.
Standard & Poor's, S&P and S&P 500 are registered service marks of The McGraw-Hill Companies, Inc. and have been licensed for use by Fidelity Distributors Corporation.
Other third party marks appearing herein are the property of their respective owners.
All other marks appearing herein are registered or unregistered trademarks or service marks of FMR LLC or an affiliated company.
Annual Report
This report and the financial statements contained herein are submitted for the general information of the shareholders of the fund. This report is not authorized for distribution to prospective investors in the fund unless preceded or accompanied by an effective prospectus.
A fund files its complete schedule of portfolio holdings with the SEC for the first and third quarters of each fiscal year on Form N-Q. Forms N-Q are available on the SEC's web site at http://www.sec.gov. A fund's Forms N-Q may be reviewed and copied at the SEC's Public Reference Room in Washington, DC. Information regarding the operation of the SEC's Public Reference Room may be obtained by calling 1-800-SEC-0330. For a complete list of a fund's portfolio holdings, view the most recent holdings listing, semiannual report, or annual report on Fidelity's web site at http://www.fidelity.com, http://www.advisor.fidelity.com, or http://www.401k.com, as applicable.
NOT FDIC INSURED • MAY LOSE VALUE • NO BANK GUARANTEE
Neither the fund nor Fidelity Distributors Corporation is a bank.
Annual Report
(Acting Chairman's Photograph)
Dear Shareholder:
Global equity markets began the fourth quarter on a strong note, sharply reversing course in October amid strong corporate earnings, better-than-expected economic news and the promise of a resolution to the sovereign debt crisis in Europe. The mini rally followed a third quarter marked by a significant downturn in July and August, which heightened investor anxiety and set off a wave of volatility that hampered most major asset classes through the end of September. Financial markets are difficult to predict, of course, but you can help put the odds in your favor by following these time-tested investment principles.
One of the basic tenets is to invest according to your time horizon. For long-term investors, riding out the markets' inevitable ups and downs has proven much more effective than making decisions based on short-term developments. If your goal is approaching, you can also benefit from patience and restraint, rather than attempting to time the market. No matter your time horizon, missing only a few of the markets' best days can significantly diminish returns. Patience also affords the benefits of compounding - earning interest on additional income or reinvested dividends and capital gains. While staying the course doesn't eliminate risk, it can considerably lessen the negative impact of short-term downturns.
Asset allocation is another principle to manage risk. As you spread your portfolio among the asset classes, be sure to consider your time horizon, risk tolerance and investment objectives. Younger investors may be better served by emphasizing equities, which historically have been the best-performing asset class over time. Investors who are nearing a specific goal, such as retirement or sending a child to college, may choose to favor bonds and other investments that have tended to be more stable. Studies indicate that asset allocation is the single most important determinant of a portfolio's long-term success. After deciding on a suitable allocation strategy, make sure your portfolio is adequately diversified, with exposure to stocks of small-, mid- and large-cap companies in a range of sectors, for example. And today, more than ever, geographic diversification should be taken into account.
Lastly, investing a certain amount of money on a regular basis - a principle known as dollar-cost averaging - can help lower the average cost of your purchases, while also giving you the discipline to avoid selling weak performers just prior to an upswing, or chasing a hot performer just before a correction.
We invite you to learn more by visiting us on the Internet, dropping by one of our Investor Centers or calling us by phone. It is our privilege to provide the resources you need to choose investments that are right for you.
Sincerely,
(Acting Chairman's Signature)
James C. Curvey
Acting Chairman
Annual Report
Average annual total return reflects the change in the value of an investment, assuming reinvestment of the class' dividend income and capital gains (the profits earned upon the sale of securities that have grown in value, if any) and assuming a constant rate of performance each year. The $10,000 table and the fund's returns do not reflect the deduction of taxes that a shareholder would pay on fund distributions or the redemption of fund shares. During periods of reimbursement by Fidelity, a fund's total return will be greater than it would be had the reimbursement not occurred. How a fund did yesterday is no guarantee of how it will do tomorrow.
Average Annual Total Returns
Periods ended October 31, 2011 | Past 1
year | Life of
fund A |
Fidelity® Global Commodity Stock Fund | -1.59% | 18.35% |
A From March 25, 2009
$10,000 Over Life of Fund
Let's say hypothetically that $10,000 was invested in Fidelity® Global Commodity Stock Fund, a class of the fund, on March 25, 2009, when the fund started. The chart shows how the value of your investment would have changed, and also shows how the MSCI® ACWI® (All Country World Index) Index performed over the same period.
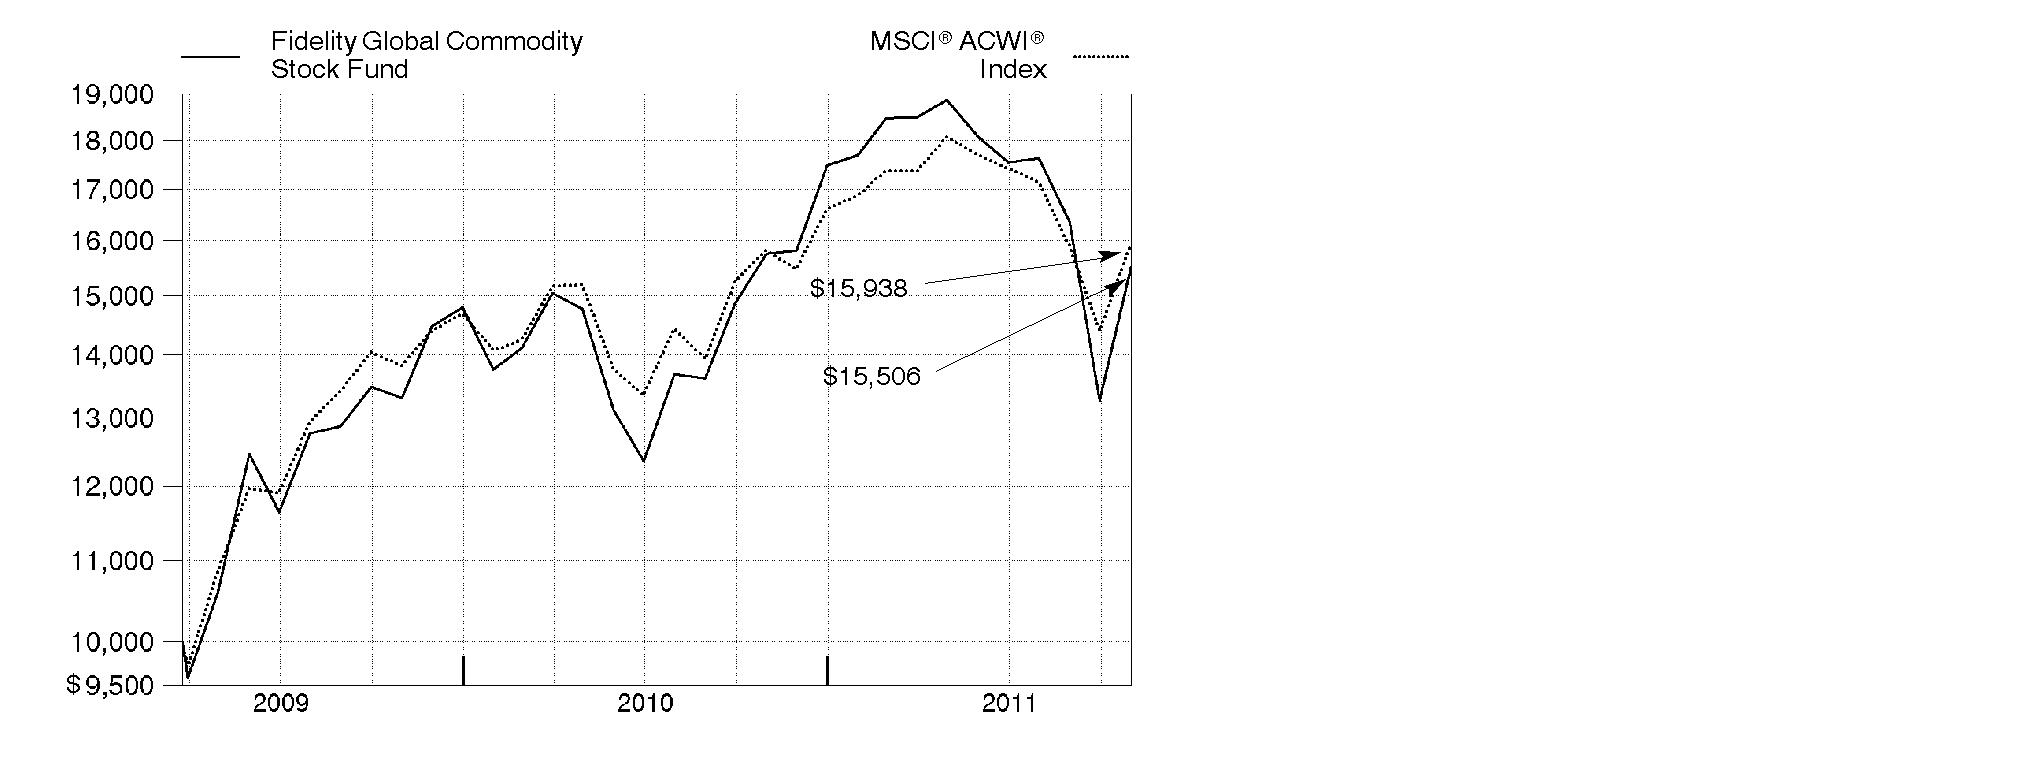
Annual Report
Market Recap: International equities were rocked by a number of headline events during the year ending October 31, 2011. Stocks posted a solid advance for the first half of the period, despite concern about the sovereign debt crisis in Europe, a devastating earthquake and tsunami in Japan, and political upheaval in the Middle East and North Africa. Sentiment turned decidedly negative in the second half, however, as fresh worries about Europe, inflation in China and a dimmed outlook for global growth caused foreign markets to suffer declines that intensified in August and September. October brought with it yet another dramatic swing, as eurozone policymakers appeared near a resolution to the debt debacle and buyers stormed back onto the scene in search of bargains. Still, those gains - along with favorable currency fluctuations overall - weren't enough to offset prior losses, and the MSCI® ACWI® (All Country World Index) ex USA Index finished the period down 4.56%. Within the MSCI index, Europe and emerging markets suffered the biggest declines, with many countries in these areas sustaining steep losses. By contrast, Japan showed resilience in the wake of its natural disasters, falling only 2%. Australia (+4%), Switzerland (+3%), the U.K. (+2%) and Canada, which produced a nominal return, were among the few major benchmark components to break into positive territory.
Comments from S. Joseph Wickwire II, Portfolio Manager of Fidelity® Global Commodity Stock Fund: For the year, the fund's Retail Class shares returned -1.59%, lagging the -1.10% result of the MSCI® ACWI® (All Country World Index) Commodity Producers Sector Capped Index. Stock picking in coal/consumable fuels and oil/gas exploration and production (E&P) detracted, as did positioning in integrated oil/gas. Detractors included coal-producer Alpha Natural Resources and Australian uranium company Paladin Energy. Underweightings in strong-performing integrated oil/gas companies ConocoPhillips and Royal Dutch Shell and overweightings in E&P companies Niko Resources and Petrobank Energy & Resources also hurt. Conversely, the fund benefited from an overweighting in the outperforming gold group, including Barrick Gold and Newmont Mining. Oil/gas equipment and services stocks, such as ION Geophysical, Halliburton and C&J Energy Services also helped, as did oil/gas refining and marketing names CVR Energy, Frontier Oil, Tesoro, Holly and Valero Energy. Frontier Oil and Holly merged during the period. Several of the stocks I've mentioned were not in the index or were sold by period end.
The views expressed above reflect those of the portfolio manager(s) only through the end of the period as stated on the cover of this report and do not necessarily represent the views of Fidelity or any other person in the Fidelity organization. Any such views are subject to change at any time based upon market or other conditions and Fidelity disclaims any responsibility to update such views. These views may not be relied on as investment advice and, because investment decisions for a Fidelity fund are based on numerous factors, may not be relied on as an indication of trading intent on behalf of any Fidelity fund.
Annual Report
Shareholder Expense Example
As a shareholder of the Fund, you incur two types of costs: (1) transaction costs, including sales charges (loads) on purchase payments or redemption proceeds, redemption fees, and (2) ongoing costs, including management fees, distribution and/or service (12b-1) fees and other Fund expenses. This Example is intended to help you understand your ongoing costs (in dollars) of investing in the Fund and to compare these costs with the ongoing costs of investing in other mutual funds.
The Example is based on an investment of $1,000 invested at the beginning of the period and held for the entire period (May 1, 2011 to October 31, 2011).
Actual Expenses
The first line of the accompanying table for each class of the Fund provides information about actual account values and actual expenses. You may use the information in this line, together with the amount you invested, to estimate the expenses that you paid over the period. Simply divide your account value by $1,000.00 (for example, an $8,600 account value divided by $1,000.00 = 8.6), then multiply the result by the number in the first line for a class of the Fund under the heading entitled "Expenses Paid During Period" to estimate the expenses you paid on your account during this period. A small balance maintenance fee of $12.00 that is charged once a year may apply for certain accounts with a value of less than $2,000. This fee is not included in the table below. If it was, the estimate of expenses you paid during the period would be higher, and your ending account value lower, by this amount. In addition, the Fund, as a shareholder in the underlying Fidelity Central Funds, will indirectly bear its pro-rata share of the fees and expenses incurred by the underlying Fidelity Central Funds. These fees and expenses are not included in the Fund's annualized expense ratio used to calculate the expense estimate in the table below.
Hypothetical Example for Comparison Purposes
The second line of the accompanying table for each class of the Fund provides information about hypothetical account values and hypothetical expenses based on a Class' actual expense ratio and an assumed rate of return of 5% per year before expenses, which is not the Class' actual return. The hypothetical account values and expenses may not be used to estimate the actual ending account balance or expenses you paid for the period. You may use this information to compare the ongoing costs of investing in the Fund and other funds. To do so, compare this 5% hypothetical example with the 5% hypothetical examples that appear in the shareholder reports of the other funds. A small balance maintenance fee of $12.00 that is charged once a year may apply for certain accounts with a value of less than $2,000. This fee is not included in the table below. If it was, the estimate of expenses you paid during the period would be higher, and your ending account value lower, by this amount. In addition, the Fund, as a shareholder in the underlying Fidelity Central Funds, will indirectly bear its pro-rata share of the fees and expenses incurred by the underlying Fidelity Central Funds. These fees and expenses are not included in the Fund's annualized expense ratio used to calculate the expense estimate in the table below.
Please note that the expenses shown in the table are meant to highlight your ongoing costs only and do not reflect any transaction costs. Therefore, the second line of the table is useful in comparing ongoing costs only, and will not help you determine the relative total costs of owning different funds. In addition, if these transactional costs were included, your costs would have been higher.
Annual Report
| Annualized Expense Ratio | Beginning
Account Value
May 1, 2011 | Ending
Account Value
October 31, 2011 | Expenses Paid
During Period*
May 1, 2011 to
October 31, 2011 |
Class A | 1.31% | | | |
Actual | | $ 1,000.00 | $ 821.50 | $ 6.01 |
HypotheticalA | | $ 1,000.00 | $ 1,018.60 | $ 6.67 |
Class T | 1.60% | | | |
Actual | | $ 1,000.00 | $ 820.00 | $ 7.34 |
HypotheticalA | | $ 1,000.00 | $ 1,017.14 | $ 8.13 |
Class B | 2.09% | | | |
Actual | | $ 1,000.00 | $ 817.90 | $ 9.58 |
HypotheticalA | | $ 1,000.00 | $ 1,014.67 | $ 10.61 |
Class C | 2.09% | | | |
Actual | | $ 1,000.00 | $ 817.80 | $ 9.58 |
HypotheticalA | | $ 1,000.00 | $ 1,014.67 | $ 10.61 |
Global Commodity Stock | 1.06% | | | |
Actual | | $ 1,000.00 | $ 822.20 | $ 4.87 |
HypotheticalA | | $ 1,000.00 | $ 1,019.86 | $ 5.40 |
Institutional Class | 1.02% | | | |
Actual | | $ 1,000.00 | $ 822.70 | $ 4.69 |
HypotheticalA | | $ 1,000.00 | $ 1,020.06 | $ 5.19 |
A 5% return per year before expenses
* Expenses are equal to each Class' annualized expense ratio, multiplied by the average account value over the period, multiplied by 184/365 (to reflect the one-half year period).
Annual Report
Investment Changes (Unaudited)
Top Ten Stocks as of October 31, 2011 |
| % of fund's
net assets | % of fund's net assets
6 months ago |
Exxon Mobil Corp. | 5.3 | 4.9 |
BHP Billiton PLC | 5.0 | 5.1 |
Potash Corp. of Saskatchewan, Inc. | 4.1 | 3.8 |
Royal Dutch Shell PLC Class A (United Kingdom) | 3.1 | 2.8 |
Chevron Corp. | 2.9 | 2.4 |
Syngenta AG (Switzerland) | 2.8 | 2.3 |
Rio Tinto PLC | 2.7 | 3.1 |
Monsanto Co. | 2.6 | 1.7 |
Goldcorp, Inc. | 2.0 | 1.2 |
Barrick Gold Corp. | 2.0 | 1.3 |
| 32.5 | |
Top Sectors (% of fund's net assets) |
As of October 31, 2011 |
| Energy 37.9% | |
| Metals 31.8% | |
| Agriculture 22.8% | |
 | Other 6.2% | |
| Short-Term
Investments and
Net Other Assets 1.3% | |

As of April 30, 2011 |
| Energy 36.2% | |
| Metals 34.3% | |
| Agriculture 23.8% | |
| Other 5.2% | |
| Short-Term
Investments and
Net Other Assets 0.5% | |

Annual Report
Investments October 31, 2011
Showing Percentage of Net Assets
Common Stocks - 98.7% |
| Shares | | Value |
CHEMICALS - 18.0% |
Commodity Chemicals - 0.0% |
Braskem SA (PN-A) | 26,500 | | $ 236,111 |
Grasim Industries Ltd. | 734 | | 38,980 |
| | 275,091 |
Fertilizers & Agricultural Chemicals - 17.9% |
Agrium, Inc. | 121,200 | | 9,991,690 |
CF Industries Holdings, Inc. | 58,772 | | 9,536,932 |
China Bluechemical Ltd. (H shares) | 1,122,000 | | 879,234 |
Incitec Pivot Ltd. | 411,186 | | 1,489,514 |
Israel Chemicals Ltd. | 443,600 | | 5,337,885 |
Israel Corp. Ltd. (Class A) | 1,000 | | 736,552 |
K&S AG | 129,907 | | 8,268,903 |
Monsanto Co. | 278,300 | | 20,246,325 |
Potash Corp. of Saskatchewan, Inc. | 669,700 | | 31,696,289 |
Sinofert Holdings Ltd. | 2,060,000 | | 676,070 |
Sociedad Quimica y Minera de Chile SA (PN-B) sponsored ADR | 8,400 | | 491,400 |
Syngenta AG (Switzerland) | 72,182 | | 22,001,638 |
Taiwan Fertilizer Co. Ltd. | 161,000 | | 414,969 |
The Mosaic Co. | 242,300 | | 14,189,088 |
United Phosphorous Ltd. | 66,056 | | 197,668 |
Uralkali JSC GDR (Reg. S) | 137,900 | | 5,984,860 |
Yara International ASA | 153,500 | | 7,311,624 |
| | 139,450,641 |
Specialty Chemicals - 0.1% |
LyondellBasell Industries NV Class A | 13,700 | | 450,182 |
OMNOVA Solutions, Inc. (a) | 113,301 | | 501,923 |
| | 952,105 |
TOTAL CHEMICALS | | 140,677,837 |
CONSTRUCTION & ENGINEERING - 1.4% |
Construction & Engineering - 1.4% |
Fluor Corp. | 59,100 | | 3,359,835 |
Foster Wheeler AG (a) | 302,700 | | 6,453,564 |
Shaw Group, Inc. (a) | 36,300 | | 844,338 |
| | 10,657,737 |
CONTAINERS & PACKAGING - 0.4% |
Paper Packaging - 0.4% |
Greatview Aseptic Pack Co. Ltd. | 2,810,000 | | 1,043,465 |
Common Stocks - continued |
| Shares | | Value |
CONTAINERS & PACKAGING - CONTINUED |
Paper Packaging - continued |
Rock-Tenn Co. Class A | 18,900 | | $ 1,118,691 |
Smurfit Kappa Group PLC (a) | 98,000 | | 678,247 |
| | 2,840,403 |
DIVERSIFIED FINANCIAL SERVICES - 0.0% |
Other Diversified Financial Services - 0.0% |
Polymetal International PLC | 1,350 | | 19,974 |
ELECTRICAL EQUIPMENT - 0.4% |
Electrical Components & Equipment - 0.4% |
Regal-Beloit Corp. | 59,202 | | 3,145,402 |
ENERGY EQUIPMENT & SERVICES - 5.3% |
Oil & Gas Drilling - 2.9% |
Cathedral Energy Services Ltd. | 96,370 | | 647,719 |
Ensco International Ltd. ADR | 16,700 | | 829,322 |
Helmerich & Payne, Inc. | 2,000 | | 106,360 |
Nabors Industries Ltd. (a) | 43,100 | | 790,023 |
Noble Corp. | 66,700 | | 2,397,198 |
PHX Energy Services Corp. | 3,600 | | 37,017 |
Transocean Ltd. (United States) | 212,800 | | 12,161,520 |
Trinidad Drilling Ltd. | 302,171 | | 2,364,382 |
Tuscany International Drilling, Inc. (a) | 415,000 | | 283,092 |
Unit Corp. (a) | 4,400 | | 215,864 |
Vantage Drilling Co. (a) | 2,135,982 | | 2,904,936 |
| | 22,737,433 |
Oil & Gas Equipment & Services - 2.4% |
Aker Solutions ASA | 67,800 | | 788,500 |
Baker Hughes, Inc. | 37,080 | | 2,150,269 |
Cal Dive International, Inc. (a) | 87,700 | | 196,448 |
Cameron International Corp. (a) | 700 | | 34,398 |
Compagnie Generale de Geophysique SA (a) | 81,600 | | 1,783,169 |
Halliburton Co. | 83,500 | | 3,119,560 |
ION Geophysical Corp. (a) | 1,237,600 | | 9,430,512 |
McDermott International, Inc. (a) | 17,500 | | 192,150 |
Saipem SpA | 18,781 | | 842,109 |
Schlumberger Ltd. | 700 | | 51,429 |
| | 18,588,544 |
TOTAL ENERGY EQUIPMENT & SERVICES | | 41,325,977 |
Common Stocks - continued |
| Shares | | Value |
FOOD PRODUCTS - 3.4% |
Agricultural Products - 3.4% |
Archer Daniels Midland Co. | 502,800 | | $ 14,551,032 |
Bunge Ltd. | 113,500 | | 7,010,895 |
Chaoda Modern Agriculture (Holdings) Ltd. | 2,320,000 | | 328,493 |
China Agri-Industries Holding Ltd. | 1,295,000 | | 1,032,374 |
Corn Products International, Inc. | 6,400 | | 310,400 |
Cosan Ltd. Class A | 66,400 | | 796,800 |
Golden Agri-Resources Ltd. | 1,700,000 | | 869,958 |
PT Charoen Pokphand Indonesia Tbk | 85,000 | | 25,312 |
Suedzucker AG (Bearer) | 1,100 | | 32,265 |
Viterra, Inc. | 9,900 | | 101,895 |
Wilmar International Ltd. | 273,000 | | 1,178,344 |
| | 26,237,768 |
MACHINERY - 1.6% |
Construction & Farm Machinery & Heavy Trucks - 1.6% |
Caterpillar, Inc. | 2,800 | | 264,488 |
Cummins, Inc. | 11,200 | | 1,113,616 |
Fiat Industrial SpA (a) | 817,500 | | 7,133,088 |
Jain Irrigation Systems Ltd. | 1,197,816 | | 3,052,091 |
Joy Global, Inc. | 8,900 | | 776,080 |
| | 12,339,363 |
Industrial Machinery - 0.0% |
Sandvik AB | 32,000 | | 442,485 |
TOTAL MACHINERY | | 12,781,848 |
METALS & MINING - 31.8% |
Aluminum - 0.3% |
Alcoa, Inc. | 204,400 | | 2,199,344 |
Diversified Metals & Mining - 13.7% |
Anglo American PLC (United Kingdom) | 276,251 | | 10,189,260 |
Antofagasta PLC | 1,100 | | 20,644 |
BHP Billiton PLC | 1,228,316 | | 38,686,256 |
Copper Mountain Mining Corp. (a) | 721,400 | | 3,849,975 |
Eurasian Natural Resources Corp. PLC | 31,500 | | 333,332 |
First Quantum Minerals Ltd. | 158,500 | | 3,324,708 |
Freeport-McMoRan Copper & Gold, Inc. | 209,500 | | 8,434,470 |
Glencore International PLC (e) | 5,300 | | 37,333 |
Grupo Mexico SA de CV Series B | 89,182 | | 247,792 |
Iluka Resources Ltd. | 10,483 | | 174,293 |
Common Stocks - continued |
| Shares | | Value |
METALS & MINING - CONTINUED |
Diversified Metals & Mining - continued |
Ivanhoe Australia Ltd. (a) | 478,448 | | $ 532,063 |
Ivanhoe Mines Ltd. (a) | 84,540 | | 1,730,066 |
Kazakhmys PLC | 116,700 | | 1,740,704 |
Lynas Corp. Ltd. (a) | 385,000 | | 476,413 |
Major Drilling Group International, Inc. | 3,600 | | 48,140 |
Mitsubishi Materials Corp. | 123,000 | | 326,992 |
OJSC MMC Norilsk Nickel sponsored ADR | 1,700 | | 32,725 |
Rio Tinto PLC | 382,987 | | 20,723,044 |
Sterlite Industries (India) Ltd. | 148,488 | | 384,181 |
Sumitomo Metal Mining Co. Ltd. | 101,000 | | 1,390,494 |
Teck Resources Ltd. Class B (sub. vtg.) | 118,800 | | 4,762,249 |
Vedanta Resources PLC | 3,500 | | 71,935 |
Walter Energy, Inc. | 22,800 | | 1,724,820 |
Xstrata PLC | 480,391 | | 8,077,165 |
| | 107,319,054 |
Gold - 11.0% |
Agnico-Eagle Mines Ltd. (Canada) | 109,400 | | 4,745,404 |
AngloGold Ashanti Ltd. sponsored ADR | 147,800 | | 6,682,038 |
Barrick Gold Corp. | 320,500 | | 15,821,643 |
Centerra Gold, Inc. | 33,200 | | 658,105 |
Compania de Minas Buenaventura SA sponsored ADR | 39,300 | | 1,608,549 |
Eldorado Gold Corp. | 117,400 | | 2,205,850 |
Franco-Nevada Corp. | 7,300 | | 289,188 |
Gold Fields Ltd. sponsored ADR | 167,100 | | 2,912,553 |
Goldcorp, Inc. | 325,700 | | 15,846,366 |
Harmony Gold Mining Co. Ltd. sponsored ADR | 158,500 | | 2,081,105 |
IAMGOLD Corp. | 85,100 | | 1,829,456 |
Kingsgate Consolidated NL | 309,515 | | 2,440,465 |
Kinross Gold Corp. | 482,005 | | 6,870,934 |
Kinross Gold Corp. warrants 9/17/14 (a) | 2,772 | | 6,729 |
New Gold, Inc. (a) | 38,800 | | 480,694 |
Newcrest Mining Ltd. | 212,457 | | 7,509,335 |
Newmont Mining Corp. | 132,000 | | 8,821,560 |
Osisko Mining Corp. (a) | 65,500 | | 789,798 |
Randgold Resources Ltd. sponsored ADR | 20,100 | | 2,202,357 |
Yamana Gold, Inc. | 137,700 | | 2,055,451 |
| | 85,857,580 |
Precious Metals & Minerals - 1.2% |
African Minerals Ltd. (a) | 521,600 | | 3,705,563 |
Anglo Platinum Ltd. | 11,100 | | 803,447 |
Common Stocks - continued |
| Shares | | Value |
METALS & MINING - CONTINUED |
Precious Metals & Minerals - continued |
Aquarius Platinum Ltd. (United Kingdom) | 147,000 | | $ 439,714 |
Impala Platinum Holdings Ltd. | 14,300 | | 330,567 |
Lonmin PLC | 10,422 | | 182,356 |
Northam Platinum Ltd. | 30,500 | | 118,175 |
Pan American Silver Corp. | 19,600 | | 548,016 |
Silver Standard Resources, Inc. (a) | 37,500 | | 734,625 |
Silver Wheaton Corp. | 73,400 | | 2,534,411 |
| | 9,396,874 |
Steel - 5.6% |
Allegheny Technologies, Inc. | 26,800 | | 1,243,520 |
ArcelorMittal SA Class A unit (e) | 166,200 | | 3,445,326 |
BlueScope Steel Ltd. | 338,804 | | 296,424 |
China Steel Corp. | 1,160,260 | | 1,154,352 |
Cliffs Natural Resources, Inc. | 31,300 | | 2,135,286 |
Fortescue Metals Group Ltd. | 706,010 | | 3,546,514 |
Gerdau SA sponsored ADR | 194,200 | | 1,751,684 |
Hyundai Steel Co. | 2,003 | | 181,084 |
JFE Holdings, Inc. | 41,600 | | 791,856 |
Jindal Steel & Power Ltd. | 91,751 | | 1,051,587 |
JSW Steel Ltd. | 14,016 | | 187,130 |
Kobe Steel Ltd. | 160,000 | | 267,628 |
London Mining PLC (a) | 75,300 | | 386,604 |
Maanshan Iron & Steel Ltd. (H Shares) | 4,285,000 | | 1,275,767 |
Magnitogorsk Iron & Steel Works OJSC unit | 47,700 | | 295,502 |
Nippon Steel Corp. | 196,000 | | 511,080 |
Nucor Corp. | 900 | | 34,002 |
OneSteel Ltd. | 396,960 | | 504,893 |
POSCO | 11,540 | | 3,983,560 |
Reliance Steel & Aluminum Co. | 19,000 | | 839,610 |
Tata Steel Ltd. | 53,417 | | 526,019 |
Ternium SA sponsored ADR | 10,900 | | 267,486 |
Thyssenkrupp AG | 69,200 | | 1,997,197 |
United States Steel Corp. (e) | 28,800 | | 730,368 |
Usinas Siderurgicas de Minas Gerais SA - Usiminas (PN-A) (non-vtg.) | 37,700 | | 259,061 |
Vale SA (PN-A) sponsored ADR (e) | 631,200 | | 14,896,320 |
Common Stocks - continued |
| Shares | | Value |
METALS & MINING - CONTINUED |
Steel - continued |
Voestalpine AG | 16,400 | | $ 567,399 |
Yamato Kogyo Co. Ltd. | 9,100 | | 230,210 |
| | 43,357,469 |
TOTAL METALS & MINING | | 248,130,321 |
OIL, GAS & CONSUMABLE FUELS - 32.6% |
Coal & Consumable Fuels - 1.9% |
Alpha Natural Resources, Inc. (a) | 280,237 | | 6,736,897 |
Arch Coal, Inc. | 10,800 | | 196,776 |
Banpu PCL (For. Reg.) | 8,950 | | 181,688 |
Bumi PLC | 12,573 | | 149,627 |
China Coal Energy Co. Ltd. (H Shares) | 61,000 | | 75,977 |
CONSOL Energy, Inc. | 2,200 | | 94,072 |
Paladin Energy Ltd.: | | | |
(Australia) (a) | 731,842 | | 1,117,722 |
(Canada) (a) | 271,500 | | 424,878 |
Peabody Energy Corp. | 108,800 | | 4,718,656 |
Uranium One, Inc. | 424,900 | | 1,278,728 |
| | 14,975,021 |
Integrated Oil & Gas - 22.3% |
BG Group PLC | 366,250 | | 7,989,829 |
BP PLC | 1,946,900 | | 14,329,588 |
Cenovus Energy, Inc. | 4,700 | | 160,965 |
Chevron Corp. | 215,100 | | 22,596,255 |
China Petroleum & Chemical Corp. (H Shares) | 359,000 | | 339,517 |
ConocoPhillips | 88,700 | | 6,177,955 |
ENI SpA | 248,427 | | 5,492,003 |
Exxon Mobil Corp. | 530,061 | | 41,392,467 |
Gazprom OAO sponsored ADR | 575,000 | | 6,675,750 |
Hess Corp. | 52,800 | | 3,303,168 |
Imperial Oil Ltd. | 600 | | 24,846 |
InterOil Corp. (a)(e) | 84,400 | | 4,009,844 |
Lukoil Oil Co. sponsored ADR | 39,900 | | 2,302,230 |
Murphy Oil Corp. | 14,500 | | 802,865 |
Occidental Petroleum Corp. | 90,000 | | 8,364,600 |
Origin Energy Ltd. | 121,659 | | 1,833,505 |
Petroleo Brasileiro SA - Petrobras (PN) sponsored ADR (e) | 431,500 | | 10,912,635 |
PTT PCL (For. Reg.) | 3,100 | | 30,539 |
Repsol YPF SA | 60,117 | | 1,821,991 |
Common Stocks - continued |
| Shares | | Value |
OIL, GAS & CONSUMABLE FUELS - CONTINUED |
Integrated Oil & Gas - continued |
Royal Dutch Shell PLC Class A (United Kingdom) | 673,450 | | $ 23,861,212 |
Suncor Energy, Inc. | 208,432 | | 6,638,628 |
Total SA | 89,955 | | 4,694,282 |
| | 173,754,674 |
Oil & Gas Exploration & Production - 7.4% |
Anadarko Petroleum Corp. | 58,700 | | 4,607,950 |
Apache Corp. | 65,500 | | 6,525,765 |
Cabot Oil & Gas Corp. | 13,600 | | 1,056,992 |
Cairn Energy PLC (a) | 91,316 | | 432,633 |
Canadian Natural Resources Ltd. | 164,500 | | 5,802,097 |
Chesapeake Energy Corp. | 75,100 | | 2,111,812 |
Cimarex Energy Co. | 13,900 | | 889,600 |
CNOOC Ltd. | 120,000 | | 226,843 |
CNOOC Ltd. sponsored ADR | 16,000 | | 3,017,760 |
Concho Resources, Inc. (a) | 3,500 | | 331,520 |
Denbury Resources, Inc. (a) | 41,000 | | 643,700 |
Devon Energy Corp. | 17,100 | | 1,110,645 |
Double Eagle Petroleum Co. (a) | 94,370 | | 838,006 |
Encana Corp. | 1,000 | | 21,688 |
EOG Resources, Inc. | 3,600 | | 321,948 |
EXCO Resources, Inc. | 43,800 | | 552,318 |
Gran Tierra Energy, Inc. (Canada) (a) | 7,600 | | 46,583 |
INPEX Corp. | 23 | | 151,867 |
Japan Petroleum Exploration Co. Ltd. | 30,000 | | 1,185,050 |
Marathon Oil Corp. | 77,300 | | 2,012,119 |
Newfield Exploration Co. (a) | 13,700 | | 551,562 |
Nexen, Inc. | 70,200 | | 1,192,242 |
Niko Resources Ltd. | 39,100 | | 2,150,628 |
Noble Energy, Inc. | 16,000 | | 1,429,440 |
Northern Oil & Gas, Inc. (a)(e) | 227,900 | | 5,508,343 |
NOVATEK OAO GDR | 2,000 | | 280,800 |
Oasis Petroleum, Inc. (a) | 500 | | 14,670 |
OGX Petroleo e Gas Participacoes SA (a) | 155,900 | | 1,289,180 |
Pacific Rubiales Energy Corp. | 3,400 | | 79,266 |
Painted Pony Petroleum Ltd. (a)(f) | 15,000 | | 183,428 |
Painted Pony Petroleum Ltd. Class A (a) | 24,500 | | 299,599 |
PetroBakken Energy Ltd. Class A (e) | 7,748 | | 70,574 |
Petrobank Energy & Resources Ltd. | 83,900 | | 754,961 |
Petrominerales Ltd. | 16,526 | | 436,007 |
Pioneer Natural Resources Co. | 11,500 | | 964,850 |
Common Stocks - continued |
| Shares | | Value |
OIL, GAS & CONSUMABLE FUELS - CONTINUED |
Oil & Gas Exploration & Production - continued |
PTT Exploration and Production PCL (For. Reg.) | 6,500 | | $ 33,691 |
QEP Resources, Inc. | 31,600 | | 1,123,380 |
Santos Ltd. | 19,000 | | 256,631 |
Southwestern Energy Co. (a) | 40,600 | | 1,706,824 |
Stone Energy Corp. (a) | 12,900 | | 313,341 |
Talisman Energy, Inc. | 410,100 | | 5,817,138 |
Tullow Oil PLC | 1,600 | | 36,101 |
Ultra Petroleum Corp. (a) | 15,900 | | 506,574 |
Whiting Petroleum Corp. (a) | 12,500 | | 581,875 |
Woodside Petroleum Ltd. | 14,001 | | 533,168 |
| | 58,001,169 |
Oil & Gas Refining & Marketing - 0.9% |
CVR Energy, Inc. (a) | 21,200 | | 524,912 |
Marathon Petroleum Corp. | 95,700 | | 3,435,630 |
Tesoro Corp. (a) | 600 | | 15,564 |
Valero Energy Corp. | 110,900 | | 2,728,140 |
Western Refining, Inc. (a)(e) | 600 | | 9,588 |
| | 6,713,834 |
Oil & Gas Storage & Transport - 0.1% |
Atlas Pipeline Partners, LP | 22,600 | | 786,480 |
TOTAL OIL, GAS & CONSUMABLE FUELS | | 254,231,178 |
PAPER & FOREST PRODUCTS - 1.5% |
Forest Products - 0.1% |
China Forestry Holdings Co. Ltd. (a) | 3,302,000 | | 626,924 |
Duratex SA | 39,000 | | 211,216 |
| | 838,140 |
Paper Products - 1.4% |
Empresas CMPC SA | 848,910 | | 3,534,599 |
Fibria Celulose SA sponsored ADR (e) | 149,889 | | 1,329,515 |
International Paper Co. | 2,300 | | 63,710 |
MeadWestvaco Corp. | 1,000 | | 27,910 |
Nine Dragons Paper (Holdings) Ltd. | 854,000 | | 581,353 |
Nippon Paper Group, Inc. (e) | 34,400 | | 788,501 |
Oji Paper Co. Ltd. | 110,000 | | 544,158 |
Sappi Ltd. (a) | 24,704 | | 72,528 |
Stora Enso Oyj (R Shares) | 298,300 | | 1,898,134 |
Suzano Papel e Celulose SA | 38,725 | | 189,430 |
Common Stocks - continued |
| Shares | | Value |
PAPER & FOREST PRODUCTS - CONTINUED |
Paper Products - continued |
Svenska Cellulosa AB (SCA) (B Shares) | 41,900 | | $ 612,476 |
UPM-Kymmene Corp. | 130,200 | | 1,527,958 |
| | 11,170,272 |
TOTAL PAPER & FOREST PRODUCTS | | 12,008,412 |
REAL ESTATE INVESTMENT TRUSTS - 0.0% |
Specialized REITs - 0.0% |
Weyerhaeuser Co. | 1,685 | | 30,296 |
SPECIALTY RETAIL - 0.3% |
Specialty Stores - 0.3% |
Tsutsumi Jewelry Co. Ltd. | 95,500 | | 2,225,649 |
TRADING COMPANIES & DISTRIBUTORS - 2.0% |
Trading Companies & Distributors - 2.0% |
Marubeni Corp. | 448,000 | | 2,607,949 |
Mitsubishi Corp. | 276,900 | | 5,695,721 |
Noble Group Ltd. | 6,162,090 | | 7,521,210 |
| | 15,824,880 |
TOTAL COMMON STOCKS (Cost $788,765,973) | 770,137,682 |
Convertible Bonds - 0.0% |
| Principal Amount (d) | | |
PAPER & FOREST PRODUCTS - 0.0% |
Paper Products - 0.0% |
Suzano Papel e Celulose SA 4.5% 12/16/13
(Cost $377,129) | BRL | 572,000 | | 316,612 |
Money Market Funds - 4.7% |
| Shares | | Value |
Fidelity Cash Central Fund, 0.12% (b) | 2,670,024 | | $ 2,670,024 |
Fidelity Securities Lending Cash Central Fund, 0.11% (b)(c) | 33,626,672 | | 33,626,672 |
TOTAL MONEY MARKET FUNDS (Cost $36,296,696) | 36,296,696 |
TOTAL INVESTMENT PORTFOLIO - 103.4% (Cost $825,439,798) | 806,750,990 |
NET OTHER ASSETS (LIABILITIES) - (3.4)% | (26,283,091) |
NET ASSETS - 100% | $ 780,467,899 |
Currency Abbreviations |
BRL | - | Brazilian real |
Legend |
(a) Non-income producing |
(b) Affiliated fund that is available only to investment companies and other accounts managed by Fidelity Investments. The rate quoted is the annualized seven-day yield of the fund at period end. A complete unaudited listing of the fund's holdings as of its most recent quarter end is available upon request. In addition, each Fidelity Central Fund's financial statements, which are not covered by the Fund's Report of Independent Registered Public Accounting Firm, are available on the SEC's website or upon request. |
(c) Investment made with cash collateral received from securities on loan. |
(d) Principal amount is stated in United States dollars unless otherwise noted. |
(e) Security or a portion of the security is on loan at period end. |
(f) Security exempt from registration under Rule 144A of the Securities Act of 1933. These securities may be resold in transactions exempt from registration, normally to qualified institutional buyers. At the end of the period, the value of these securities amounted to $183,428 or 0.0% of net assets. |
Affiliated Central Funds |
Information regarding fiscal year to date income earned by the Fund from investments in Fidelity Central Funds is as follows: |
Fund | Income earned |
Fidelity Cash Central Fund | $ 15,302 |
Fidelity Securities Lending Cash Central Fund | 351,340 |
Total | $ 366,642 |
Other Information |
The following is a summary of the inputs used, as of October 31, 2011, involving the Fund's assets and liabilities carried at fair value. The inputs or methodology used for valuing securities may not be an indication of the risk associated with investing in those securities. For more information on valuation inputs, and their aggregation into the levels used in the tables below, please refer to the Security Valuation section in the accompanying Notes to Financial Statements. |
Valuation Inputs at Reporting Date: |
Description | Total | Level 1 | Level 2 | Level 3 |
Investments in Securities: | | | | |
Common Stocks | $ 770,137,682 | $ 573,040,015 | $ 196,142,250 | $ 955,417 |
Convertible Bonds | 316,612 | - | - | 316,612 |
Money Market Funds | 36,296,696 | 36,296,696 | - | - |
Total Investments in Securities: | $ 806,750,990 | $ 609,336,711 | $ 196,142,250 | $ 1,272,029 |
The following is a reconciliation of Investments in Securities for which Level 3 inputs were used in determining value: |
Investments in Securities: | |
Beginning Balance | $ - |
Total Realized Gain (Loss) | (399,873) |
Total Unrealized Gain (Loss) | (2,251,071) |
Cost of Purchases | 3,323,106 |
Proceeds of Sales | (353,517) |
Amortization/Accretion | - |
Transfers in to Level 3 | 953,384 |
Transfers out of Level 3 | - |
Ending Balance | $ 1,272,029 |
The change in unrealized gain (loss) for the period attributable to Level 3 securities held at October 31, 2011 | $ (2,251,071) |
The information used in the above reconciliation represents fiscal year to date activity for any Investments in Securities identified as using Level 3 inputs at either the beginning or the end of the current fiscal period. Transfers in or out of Level 3 represent the beginning value of any Security or Instrument where a change in the pricing level occurred from the beginning to the end of the period. The cost of purchases and the proceeds of sales may include securities received or delivered through corporate actions or exchanges. Realized and unrealized gains (losses) disclosed in the reconciliation are included in Net Gain (Loss) on the Fund's Statement of Operations. |
Distribution of investments by country of issue, as a percentage of total net assets, is as follows: (Unaudited) |
United States of America | 33.0% |
Canada | 18.5% |
United Kingdom | 16.4% |
Switzerland | 5.5% |
Brazil | 3.9% |
Australia | 2.8% |
Bermuda | 2.7% |
Japan | 2.1% |
Russia | 2.0% |
Italy | 1.7% |
South Africa | 1.6% |
Germany | 1.4% |
Norway | 1.0% |
Others (Individually Less Than 1%) | 7.4% |
| 100.0% |
Income Tax Information |
At October 31, 2011, the Fund had a capital loss carryforward of approximately $6,966,394 all of which will expire in fiscal 2019. Capital loss carryforwards are only available to offset future capital gains of the Fund to the extent provided by regulations and may be limited. |
See accompanying notes which are an integral part of the financial statements.
Annual Report
Statement of Assets and Liabilities
| October 31, 2011 |
Assets | | |
Investment in securities, at value (including securities loaned of $31,452,952) - See accompanying schedule: Unaffiliated issuers (cost $789,143,102) | $ 770,454,294 | |
Fidelity Central Funds (cost $36,296,696) | 36,296,696 | |
Total Investments (cost $825,439,798) | | $ 806,750,990 |
Foreign currency held at value (cost $4,098,833) | | 3,857,396 |
Receivable for investments sold | | 13,143,082 |
Receivable for fund shares sold | | 1,319,439 |
Dividends receivable | | 819,567 |
Interest receivable | | 13,133 |
Distributions receivable from Fidelity Central Funds | | 26,123 |
Prepaid expenses | | 4,397 |
Other receivables | | 22,094 |
Total assets | | 825,956,221 |
| | |
Liabilities | | |
Payable for investments purchased | $ 8,978,037 | |
Payable for fund shares redeemed | 2,105,156 | |
Accrued management fee | 436,053 | |
Distribution and service plan fees payable | 65,847 | |
Other affiliated payables | 214,270 | |
Other payables and accrued expenses | 62,287 | |
Collateral on securities loaned, at value | 33,626,672 | |
Total liabilities | | 45,488,322 |
| | |
Net Assets | | $ 780,467,899 |
Net Assets consist of: | | |
Paid in capital | | $ 809,500,953 |
Undistributed net investment income | | 2,852,890 |
Accumulated undistributed net realized gain (loss) on investments and foreign currency transactions | | (12,954,172) |
Net unrealized appreciation (depreciation) on investments and assets and liabilities in foreign currencies | | (18,931,772) |
Net Assets | | $ 780,467,899 |
See accompanying notes which are an integral part of the financial statements.
Annual Report
Financial Statements - continued
Statement of Assets and Liabilities - continued
| October 31, 2011 |
| | |
Calculation of Maximum Offering Price Class A:
Net Asset Value and redemption price per share ($127,978,760 ÷ 8,452,805 shares) | | $ 15.14 |
| | |
Maximum offering price per share (100/94.25 of $15.14) | | $ 16.06 |
Class T:
Net Asset Value and redemption price per share ($20,831,272 ÷ 1,380,984 shares) | | $ 15.08 |
| | |
Maximum offering price per share (100/96.50 of $15.08) | | $ 15.63 |
Class B:
Net Asset Value and offering price per share ($4,323,549 ÷ 288,202 shares)A | | $ 15.00 |
| | |
Class C:
Net Asset Value and offering price per share ($37,184,669 ÷ 2,486,493 shares)A | | $ 14.95 |
| | |
| | |
Global Commodity Stock:
Net Asset Value, offering price and redemption price per share ($531,224,376 ÷ 34,921,133 shares) | | $ 15.21 |
| | |
Institutional Class:
Net Asset Value, offering price and redemption price per share ($58,925,273 ÷ 3,872,564 shares) | | $ 15.22 |
A Redemption price per share is equal to net asset value less any applicable contingent deferred sales charge.
See accompanying notes which are an integral part of the financial statements.
Annual Report
Statement of Operations
| Year ended October 31, 2011 |
Investment Income | | |
Dividends | | $ 16,946,155 |
Interest | | 5,904 |
Income from Fidelity Central Funds | | 366,642 |
Income before foreign taxes withheld | | 17,318,701 |
Less foreign taxes withheld | | (1,108,723) |
Total income | | 16,209,978 |
| | |
Expenses | | |
Management fee | $ 5,689,907 | |
Transfer agent fees | 2,134,136 | |
Distribution and service plan fees | 777,366 | |
Accounting and security lending fees | 389,213 | |
Custodian fees and expenses | 182,573 | |
Independent trustees' compensation | 4,268 | |
Registration fees | 153,780 | |
Audit | 61,648 | |
Legal | 2,692 | |
Interest | 2,456 | |
Miscellaneous | 5,236 | |
Total expenses before reductions | 9,403,275 | |
Expense reductions | (62,747) | 9,340,528 |
Net investment income (loss) | | 6,869,450 |
Realized and Unrealized Gain (Loss) Net realized gain (loss) on: | | |
Investment securities: | | |
Unaffiliated issuers (net of foreign taxes of $8,021) | (6,689,458) | |
Foreign currency transactions | (208,574) | |
Total net realized gain (loss) | | (6,898,032) |
Change in net unrealized appreciation (depreciation) on: Investment securities (net of decrease in deferred foreign taxes of $77,622) | (67,470,576) | |
Assets and liabilities in foreign currencies | (249,333) | |
Total change in net unrealized appreciation (depreciation) | | (67,719,909) |
Net gain (loss) | | (74,617,941) |
Net increase (decrease) in net assets resulting from operations | | $ (67,748,491) |
See accompanying notes which are an integral part of the financial statements.
Annual Report
Financial Statements - continued
Statement of Changes in Net Assets
| Year ended
October 31,
2011 | Year ended
October 31,
2010 |
Increase (Decrease) in Net Assets | | |
Operations | | |
Net investment income (loss) | $ 6,869,450 | $ 5,290,077 |
Net realized gain (loss) | (6,898,032) | (2,643,429) |
Change in net unrealized appreciation (depreciation) | (67,719,909) | 40,356,160 |
Net increase (decrease) in net assets resulting
from operations | (67,748,491) | 43,002,808 |
Distributions to shareholders from net investment income | (5,045,313) | (188,424) |
Distributions to shareholders from net realized gain | (2,104,800) | (1,358,291) |
Total distributions | (7,150,113) | (1,546,715) |
Share transactions - net increase (decrease) | 418,528,912 | 198,095,255 |
Redemption fees | 94,436 | 48,090 |
Total increase (decrease) in net assets | 343,724,744 | 239,599,438 |
| | |
Net Assets | | |
Beginning of period | 436,743,155 | 197,143,717 |
End of period (including undistributed net investment income of $2,852,890 and undistributed net investment income of $4,074,073, respectively) | $ 780,467,899 | $ 436,743,155 |
See accompanying notes which are an integral part of the financial statements.
Annual Report
Financial Highlights - Class A
Years ended October 31, | 2011 | 2010 | 2009 I |
Selected Per-Share Data | | | |
Net asset value, beginning of period | $ 15.60 | $ 13.29 | $ 10.00 |
Income from Investment Operations | | | |
Net investment income (loss) E | .12 | .19 H | (.01) |
Net realized and unrealized gain (loss) | (.38) | 2.20 | 3.29 |
Total from investment operations | (.26) | 2.39 | 3.28 |
Distributions from net investment income | (.13) | - K | - |
Distributions from net realized gain | (.06) | (.08) | - |
Total distributions | (.20) L | (.08) | - |
Redemption fees added to paid in capital E | - K | - K | .01 |
Net asset value, end of period | $ 15.14 | $ 15.60 | $ 13.29 |
Total Return B,C,D | (1.80)% | 18.04% | 32.90% |
Ratios to Average Net Assets F,J | | | |
Expenses before reductions | 1.32% | 1.37% | 1.65% A |
Expenses net of fee waivers, if any | 1.32% | 1.37% | 1.50% A |
Expenses net of all reductions | 1.31% | 1.36% | 1.48% A |
Net investment income (loss) | .71% | 1.35% H | (.15)% A |
Supplemental Data | | | |
Net assets, end of period (000 omitted) | $ 127,979 | $ 60,370 | $ 15,705 |
Portfolio turnover rate G | 71% | 54% | 25% A |
A Annualized
B Total returns for periods of less than one year are not annualized.
C Total returns would have been lower if certain expenses had not been reduced during the applicable periods shown.
D Total returns do not include the effect of the sales charges.
E Calculated based on average shares outstanding during the period.
F Fees and expenses of any underlying Fidelity Central Funds are not included in the Fund's expense ratio. The Fund indirectly bears its proportionate share of the expenses of any underlying Fidelity Central Funds.
G Amount does not include the portfolio activity of any underlying Fidelity Central Funds.
H Investment income per share reflects a special dividend which amounted to $.13 per share. Excluding the special dividend, the ratio of net investment income (loss) to average net assets would have been .42%.
I For the period March 25, 2009 (commencement of operations) to October 31, 2009.
J Expense ratios reflect operating expenses of the class. Expenses before reductions do not reflect amounts reimbursed by the investment adviser or reductions from brokerage service arrangements or reductions from other expense offset arrangements and do not represent the amount paid by the class during periods when reimbursements or reductions occur. Expense ratios before reductions for start-up periods may not be representative of longer-term operating periods. Expenses net of fee waivers reflect expenses after reimbursement by the investment adviser but prior to reductions from brokerage service arrangements or other expense offset arrangements. Expenses net of all reductions represent the net expenses paid by the class.
K Amount represents less than $.01 per share.
L Total distributions of $.20 per share is comprised of distributions from net investment income of $.133 and distributions from net realized gain of $.062 per share.
See accompanying notes which are an integral part of the financial statements.
Annual Report
Financial Highlights - Class T
Years ended October 31, | 2011 | 2010 | 2009 I |
Selected Per-Share Data | | | |
Net asset value, beginning of period | $ 15.55 | $ 13.27 | $ 10.00 |
Income from Investment Operations | | | |
Net investment income (loss) E | .07 | .16 H | (.03) |
Net realized and unrealized gain (loss) | (.38) | 2.19 | 3.29 |
Total from investment operations | (.31) | 2.35 | 3.26 |
Distributions from net investment income | (.10) | - | - |
Distributions from net realized gain | (.06) | (.07) | - |
Total distributions | (.16) | (.07) | - |
Redemption fees added to paid in capital E | - K | - K | .01 |
Net asset value, end of period | $ 15.08 | $ 15.55 | $ 13.27 |
Total Return B,C,D | (2.09)% | 17.73% | 32.70% |
Ratios to Average Net Assets F,J | | | |
Expenses before reductions | 1.60% | 1.63% | 2.04% A |
Expenses net of fee waivers, if any | 1.60% | 1.63% | 1.75% A |
Expenses net of all reductions | 1.59% | 1.61% | 1.73% A |
Net investment income (loss) | .43% | 1.10% H | (.40)% A |
Supplemental Data | | | |
Net assets, end of period (000 omitted) | $ 20,831 | $ 11,762 | $ 4,665 |
Portfolio turnover rate G | 71% | 54% | 25% A |
A Annualized
B Total returns for periods of less than one year are not annualized.
C Total returns would have been lower if certain expenses had not been reduced during the applicable periods shown.
D Total returns do not include the effect of the sales charges.
E Calculated based on average shares outstanding during the period.
F Fees and expenses of any underlying Fidelity Central Funds are not included in the Fund's expense ratio. The Fund indirectly bears its proportionate share of the expenses of any underlying Fidelity Central Funds.
G Amount does not include the portfolio activity of any underlying Fidelity Central Funds.
H Investment income per share reflects a special dividend which amounted to $.13 per share. Excluding the special dividend, the ratio of net investment income (loss) to average net assets would have been .17%.
I For the period March 25, 2009 (commencement of operations) to October 31, 2009.
J Expense ratios reflect operating expenses of the class. Expenses before reductions do not reflect amounts reimbursed by the investment adviser or reductions from brokerage service arrangements or reductions from other expense offset arrangements and do not represent the amount paid by the class during periods when reimbursements or reductions occur. Expense ratios before reductions for start-up periods may not be representative of longer-term operating periods. Expenses net of fee waivers reflect expenses after reimbursement by the investment adviser but prior to reductions from brokerage service arrangements or other expense offset arrangements. Expenses net of all reductions represent the net expenses paid by the class.
K Amount represents less than $.01 per share.
See accompanying notes which are an integral part of the financial statements.
Annual Report
Financial Highlights - Class B
Years ended October 31, | 2011 | 2010 | 2009 I |
Selected Per-Share Data | | | |
Net asset value, beginning of period | $ 15.46 | $ 13.22 | $ 10.00 |
Income from Investment Operations | | | |
Net investment income (loss) E | (.01) | .08 H | (.07) |
Net realized and unrealized gain (loss) | (.39) | 2.20 | 3.28 |
Total from investment operations | (.40) | 2.28 | 3.21 |
Distributions from net realized gain | (.06) | (.04) | - |
Redemption fees added to paid in capital E | - K | - K | .01 |
Net asset value, end of period | $ 15.00 | $ 15.46 | $ 13.22 |
Total Return B,C,D | (2.62)% | 17.23% | 32.20% |
Ratios to Average Net Assets F,J | | | |
Expenses before reductions | 2.11% | 2.16% | 2.66% A |
Expenses net of fee waivers, if any | 2.11% | 2.16% | 2.25% A |
Expenses net of all reductions | 2.10% | 2.15% | 2.23% A |
Net investment income (loss) | (.09)% | .56% H | (.90)% A |
Supplemental Data | | | |
Net assets, end of period (000 omitted) | $ 4,324 | $ 4,348 | $ 2,726 |
Portfolio turnover rate G | 71% | 54% | 25% A |
A Annualized
B Total returns for periods of less than one year are not annualized.
C Total returns would have been lower if certain expenses had not been reduced during the applicable periods shown.
D Total returns do not include the effect of the contingent deferred sales charge.
E Calculated based on average shares outstanding during the period.
F Fees and expenses of any underlying Fidelity Central Funds are not included in the Fund's expense ratio. The Fund indirectly bears its proportionate share of the expenses of any underlying Fidelity Central Funds.
G Amount does not include the portfolio activity of any underlying Fidelity Central Funds.
H Investment income per share reflects a special dividend which amounted to $.13 per share. Excluding the special dividend, the ratio of net investment income (loss) to average net assets would have been (.37)%.
I For the period March 25, 2009 (commencement of operations) to October 31, 2009.
J Expense ratios reflect operating expenses of the class. Expenses before reductions do not reflect amounts reimbursed by the investment adviser or reductions from brokerage service arrangements or reductions from other expense offset arrangements and do not represent the amount paid by the class during periods when reimbursements or reductions occur. Expense ratios before reductions for start-up periods may not be representative of longer-term operating periods. Expenses net of fee waivers reflect expenses after reimbursement by the investment adviser but prior to reductions from brokerage service arrangements or other expense offset arrangements. Expenses net of all reductions represent the net expenses paid by the class.
K Amount represents less than $.01 per share.
See accompanying notes which are an integral part of the financial statements.
Annual Report
Financial Highlights - Class C
Years ended October 31, | 2011 | 2010 | 2009 I |
Selected Per-Share Data | | | |
Net asset value, beginning of period | $ 15.45 | $ 13.22 | $ 10.00 |
Income from Investment Operations | | | |
Net investment income (loss) E | (.01) | .08 H | (.07) |
Net realized and unrealized gain (loss) | (.38) | 2.19 | 3.28 |
Total from investment operations | (.39) | 2.27 | 3.21 |
Distributions from net investment income | (.05) | - | - |
Distributions from net realized gain | (.06) | (.04) | - |
Total distributions | (.11) | (.04) | - |
Redemption fees added to paid in capital E | - K | - K | .01 |
Net asset value, end of period | $ 14.95 | $ 15.45 | $ 13.22 |
Total Return B,C,D | (2.58)% | 17.21% | 32.20% |
Ratios to Average Net Assets F,J | | | |
Expenses before reductions | 2.09% | 2.14% | 2.53% A |
Expenses net of fee waivers, if any | 2.09% | 2.14% | 2.25% A |
Expenses net of all reductions | 2.08% | 2.13% | 2.23% A |
Net investment income (loss) | (.07)% | .58% H | (.90)% A |
Supplemental Data | | | |
Net assets, end of period (000 omitted) | $ 37,185 | $ 14,338 | $ 4,798 |
Portfolio turnover rate G | 71% | 54% | 25% A |
A Annualized
B Total returns for periods of less than one year are not annualized.
C Total returns would have been lower if certain expenses had not been reduced during the applicable periods shown.
D Total returns do not include the effect of the contingent deferred sales charge.
E Calculated based on average shares outstanding during the period.
F Fees and expenses of any underlying Fidelity Central Funds are not included in the Fund's expense ratio. The Fund indirectly bears its proportionate share of the expenses of any underlying Fidelity Central Funds.
G Amount does not include the portfolio activity of any underlying Fidelity Central Funds.
H Investment income per share reflects a special dividend which amounted to $.13 per share. Excluding the special dividend, the ratio of net investment income (loss) to average net assets would have been (.34)%.
I For the period March 25, 2009 (commencement of operations) to October 31, 2009.
J Expense ratios reflect operating expenses of the class. Expenses before reductions do not reflect amounts reimbursed by the investment adviser or reductions from brokerage service arrangements or reductions from other expense offset arrangements and do not represent the amount paid by the class during periods when reimbursements or reductions occur. Expense ratios before reductions for start-up periods may not be representative of longer-term operating periods. Expenses net of fee waivers reflect expenses after reimbursement by the investment adviser but prior to reductions from brokerage service arrangements or other expense offset arrangements. Expenses net of all reductions represent the net expenses paid by the class.
K Amount represents less than $.01 per share.
See accompanying notes which are an integral part of the financial statements.
Annual Report
Financial Highlights - Global Commodity Stock
Years ended October 31, | 2011 | 2010 | 2009 H |
Selected Per-Share Data | | | |
Net asset value, beginning of period | $ 15.66 | $ 13.31 | $ 10.00 |
Income from Investment Operations | | | |
Net investment income (loss) D | .16 | .23 G | .01 |
Net realized and unrealized gain (loss) | (.39) | 2.21 | 3.29 |
Total from investment operations | (.23) | 2.44 | 3.30 |
Distributions from net investment income | (.16) | (.01) | - |
Distributions from net realized gain | (.06) | (.08) | - |
Total distributions | (.22) | (.09) | - |
Redemption fees added to paid in capital D | - J | - J | .01 |
Net asset value, end of period | $ 15.21 | $ 15.66 | $ 13.31 |
Total Return B,C | (1.59)% | 18.38% | 33.10% |
Ratios to Average Net Assets E,I | | | |
Expenses before reductions | 1.08% | 1.10% | 1.42% A |
Expenses net of fee waivers, if any | 1.08% | 1.10% | 1.25% A |
Expenses net of all reductions | 1.07% | 1.09% | 1.23% A |
Net investment income (loss) | .95% | 1.62% G | .10% A |
Supplemental Data | | | |
Net assets, end of period (000 omitted) | $ 531,224 | $ 310,186 | $ 159,439 |
Portfolio turnover rate F | 71% | 54% | 25% A |
A Annualized
B Total returns for periods of less than one year are not annualized.
C Total returns would have been lower if certain expenses had not been reduced during the applicable periods shown.
D Calculated based on average shares outstanding during the period.
E Fees and expenses of any underlying Fidelity Central Funds are not included in the Fund's expense ratio. The Fund indirectly bears its proportionate share of the expenses of any underlying Fidelity Central Funds.
F Amount does not include the portfolio activity of any underlying Fidelity Central Funds.
G Investment income per share reflects a special dividend which amounted to $.13 per share. Excluding the special dividend, the ratio of net investment income (loss) to average net assets would have been .69%.
H For the period March 25, 2009 (commencement of operations) to October 31, 2009.
I Expense ratios reflect operating expenses of the class. Expenses before reductions do not reflect amounts reimbursed by the investment adviser or reductions from brokerage service arrangements or reductions from other expense offset arrangements and do not represent the amount paid by the class during periods when reimbursements or reductions occur. Expense ratios before reductions for start-up periods may not be representative of longer-term operating periods. Expenses net of fee waivers reflect expenses after reimbursement by the investment adviser but prior to reductions from brokerage service arrangements or other expense offset arrangements. Expenses net of all reductions represent the net expenses paid by the class.
J Amount represents less than $.01 per share.
See accompanying notes which are an integral part of the financial statements.
Annual Report
Financial Highlights - Institutional Class
Years ended October 31, | 2011 | 2010 | 2009 H |
Selected Per-Share Data | | | |
Net asset value, beginning of period | $ 15.66 | $ 13.31 | $ 10.00 |
Income from Investment Operations | | | |
Net investment income (loss) D | .16 | .23 G | .01 |
Net realized and unrealized gain (loss) | (.38) | 2.21 | 3.29 |
Total from investment operations | (.22) | 2.44 | 3.30 |
Distributions from net investment income | (.16) | (.01) | - |
Distributions from net realized gain | (.06) | (.08) | - |
Total distributions | (.22) | (.09) | - |
Redemption fees added to paid in capital D | - J | - J | .01 |
Net asset value, end of period | $ 15.22 | $ 15.66 | $ 13.31 |
Total Return B,C | (1.50)% | 18.39% | 33.10% |
Ratios to Average Net Assets E,I | | | |
Expenses before reductions | 1.03% | 1.09% | 1.36% A |
Expenses net of fee waivers, if any | 1.03% | 1.09% | 1.25% A |
Expenses net of all reductions | 1.03% | 1.07% | 1.23% A |
Net investment income (loss) | .99% | 1.64% G | .10% A |
Supplemental Data | | | |
Net assets, end of period (000 omitted) | $ 58,925 | $ 35,739 | $ 9,811 |
Portfolio turnover rate F | 71% | 54% | 25% A |
A Annualized
B Total returns for periods of less than one year are not annualized.
C Total returns would have been lower if certain expenses had not been reduced during the applicable periods shown.
D Calculated based on average shares outstanding during the period.
E Fees and expenses of any underlying Fidelity Central Funds are not included in the Fund's expense ratio. The Fund indirectly bears its proportionate share of the expenses of any underlying Fidelity Central Funds.
F Amount does not include the portfolio activity of any underlying Fidelity Central Funds.
G Investment income per share reflects a special dividend which amounted to $.13 per share. Excluding the special dividend, the ratio of net investment income (loss) to average net assets would have been .71%.
H For the period March 25, 2009 (commencement of operations) to October 31, 2009.
I Expense ratios reflect operating expenses of the class. Expenses before reductions do not reflect amounts reimbursed by the investment adviser or reductions from brokerage service arrangements or reductions from other expense offset arrangements and do not represent the amount paid by the class during periods when reimbursements or reductions occur. Expense ratios before reductions for start-up periods may not be representative of longer-term operating periods. Expenses net of fee waivers reflect expenses after reimbursement by the investment adviser but prior to reductions from brokerage service arrangements or other expense offset arrangements. Expenses net of all reductions represent the net expenses paid by the class.
J Amount represents less than $.01 per share.
See accompanying notes which are an integral part of the financial statements.
Annual Report
Notes to Financial Statements
For the period ended October 31, 2011
1. Organization.
Fidelity® Global Commodity Stock Fund (the Fund) is a non-diversified fund of Fidelity Investment Trust (the Trust) and is authorized to issue an unlimited number of shares. The Trust is registered under the Investment Company Act of 1940, as amended (the 1940 Act), as an open-end management investment company organized as a Massachusetts business trust. The Fund offers Class A, Class T, Class C, Global Commodity Stock and Institutional Class shares, each of which, along with Class B shares, has equal rights as to assets and voting privileges. Effective after the close of business on September 1, 2010, Class B shares were closed to new accounts and additional purchases, except for exchanges and reinvestments by existing shareholders. Each class has exclusive voting rights with respect to matters that affect that class. Class B shares will automatically convert to Class A shares after a holding period of seven years from the initial date of purchase. Investment income, realized and unrealized capital gains and losses, the common expenses of the Fund, and certain fund-level expense reductions, if any, are allocated on a pro-rata basis to each class based on the relative net assets of each class to the total net assets of the Fund. Each class differs with respect to transfer agent and distribution and service plan fees incurred. Certain expense reductions may also differ by class. The Fund's investments in emerging markets can be subject to social, economic, regulatory and political uncertainties and can be extremely volatile.
2. Investments in Fidelity Central Funds.
The Fund invests in Fidelity Central Funds, which are open-end investment companies available only to other investment companies and accounts managed by Fidelity Management & Research Company (FMR) and its affiliates. The Fund's Schedule of Investments lists each of the Fidelity Central Funds held as of period end, if any, as an investment of the Fund, but does not include the underlying holdings of each Fidelity Central Fund. As an Investing Fund, the Fund indirectly bears its proportionate share of the expenses of the underlying Fidelity Central Funds.
The Money Market Central Funds seek preservation of capital and current income and are managed by Fidelity Investments Money Management, Inc. (FIMM), an affiliate of FMR.
A complete unaudited list of holdings for each Fidelity Central Fund is available upon request or at the Securities and Exchange Commission (the SEC) web site at www.sec.gov. In addition, the financial statements of the Fidelity Central Funds, which are not covered by the Fund's Report of Independent Registered Public Accounting Firm, are available on the SEC web site or upon request.
Annual Report
3. Significant Accounting Policies.
The financial statements have been prepared in conformity with accounting principles generally accepted in the United States of America (GAAP), which require management to make certain estimates and assumptions at the date of the financial statements. Actual results could differ from those estimates. Subsequent events, if any, through the date that the financial statements were issued have been evaluated in the preparation of the financial statements. The following summarizes the significant accounting policies of the Fund:
Security Valuation. Investments are valued as of 4:00 p.m. Eastern time on the last calendar day of the period. The Fund uses independent pricing services approved by the Board of Trustees to value its investments. When current market prices or quotations are not readily available or reliable, valuations may be determined in good faith in accordance with procedures adopted by the Board of Trustees. Factors used in determining value may include market or security specific events, changes in interest rates and credit quality. The frequency with which these procedures are used cannot be predicted and they may be utilized to a significant extent. The value used for net asset value (NAV) calculation under these procedures may differ from published prices for the same securities.
The Fund categorizes the inputs to valuation techniques used to value its investments into a disclosure hierarchy consisting of three levels as shown below:
Level 1 - quoted prices in active markets for identical investments
Level 2 - other significant observable inputs (including quoted prices for similar investments, interest rates, prepayment speeds, etc.)
Level 3 - unobservable inputs (including the Fund's own assumptions based on the best information available)
Changes in valuation techniques may result in transfers in or out of an assigned level within the disclosure hierarchy. The aggregate value of investments by input level, as of October 31, 2011, as well as a roll forward of Level 3 securities, is included at the end of the Fund's Schedule of Investments. Valuation techniques used to value the Fund's investments by major category are as follows:
Equity securities, including restricted securities, for which market quotations are readily available, are valued at the last reported sale price or official closing price as reported by an independent pricing service on the primary market or exchange on which they are traded and are categorized as Level 1 in the hierarchy. In the event there were no sales during the day or closing prices are not available, securities are valued at the last quoted bid price or may be valued using the last available price and are generally categorized as Level 2 in the hierarchy. For foreign equity securities, when significant market or security
Annual Report
Notes to Financial Statements - continued
3. Significant Accounting Policies - continued
Security Valuation - continued
specific events arise, comparisons to the valuation of American Depositary Receipts (ADRs), futures contracts, Exchange-traded funds (ETFs) and certain indexes as well as quoted prices for similar securities are used and are categorized as Level 2 in the hierarchy in these circumstances. Utilizing these techniques may result in transfers between Level 1 and Level 2. For restricted equity securities and private placements where observable inputs are limited, assumptions about market activity and risk are used and are categorized as Level 3 in the hierarchy.
Debt securities, including restricted securities, are valued based on evaluated prices received from independent pricing services or from dealers who make markets in such securities. For corporate bonds, pricing services utilize matrix pricing which considers yield or price of bonds of comparable quality, coupon, maturity and type as well as dealer supplied prices and are generally categorized as Level 2 in the hierarchy. When independent prices are unavailable or unreliable, debt securities may be valued utilizing pricing matrices which consider similar factors that would be used by independent pricing services. These are generally categorized as Level 2 in the hierarchy but may be Level 3 depending on the circumstances.
Investments in open-end mutual funds, including the Fidelity Central Funds, are valued at their closing net asset value each business day and are categorized as Level 1 in the hierarchy.
Foreign Currency. The Fund may use foreign currency contracts to facilitate transactions in foreign-denominated securities. Gains and losses from these transactions may arise from changes in the value of the foreign currency or if the counterparties do not perform under the contracts' terms.
Foreign-denominated assets, including investment securities, and liabilities are translated into U.S. dollars at the exchange rate at period end. Purchases and sales of investment securities, income and dividends received and expenses denominated in foreign currencies are translated into U.S. dollars at the exchange rate in effect on the transaction date.
The effects of exchange rate fluctuations on investments are included with the net realized and unrealized gain (loss) on investment securities. Other foreign currency transactions resulting in realized and unrealized gain (loss) are disclosed separately.
Investment Transactions and Income. For financial reporting purposes, the Fund's investment holdings and NAV include trades executed through the end of the last business day of the period. The NAV per share for processing shareholder transactions is calculated as of the close of business of the New York Stock Exchange (NYSE), normally 4:00 p.m. Eastern time and includes trades executed through the end of the prior
Annual Report
3. Significant Accounting Policies - continued
Investment Transactions and Income - continued
business day. Gains and losses on securities sold are determined on the basis of identified cost. Dividend income is recorded on the ex-dividend date, except for certain dividends from foreign securities where the ex-dividend date may have passed, which are recorded as soon as the Fund is informed of the ex-dividend date. Non-cash dividends included in dividend income, if any, are recorded at the fair market value of the securities received. Distributions received on securities that represent a return of capital or capital gain are recorded as a reduction of cost of investments and/or as a realized gain. The Fund estimates the components of distributions received that may be considered return of capital distributions or capital gain distributions. Interest income and distributions from the Fidelity Central Funds are accrued as earned. Interest income includes coupon interest and amortization of premium and accretion of discount on debt securities. Investment income is recorded net of foreign taxes withheld where recovery of such taxes is uncertain.
Expenses. Expenses directly attributable to a fund are charged to that fund. Expenses attributable to more than one fund are allocated among the respective funds on the basis of relative net assets or other appropriate methods. Expense estimates are accrued in the period to which they relate and adjustments are made when actual amounts are known.
Income Tax Information and Distributions to Shareholders. Each year, the Fund intends to qualify as a regulated investment company, including distributing substantially all of its taxable income and realized gains under Subchapter M of the Internal Revenue Code and filing its U.S. federal tax return. As a result, no provision for income taxes is required. As of October 31, 2011, the Fund did not have any unrecognized tax benefits in the financial statements. A fund's federal tax return is subject to examination by the Internal Revenue Service (IRS) for a period of three years. Foreign taxes are provided for based on the Fund's understanding of the tax rules and rates that exist in the foreign markets in which it invests.
Distributions are declared and recorded on the ex-dividend date. Income dividends and capital gain distributions are declared separately for each class. Income and capital gain distributions are determined in accordance with income tax regulations, which may differ from GAAP. In addition, the Fund claimed a portion of the payment made to redeeming shareholders as a distribution for income tax purposes
Capital accounts within the financial statements are adjusted for permanent book-tax differences. These adjustments have no impact on net assets or the results of operations. Temporary book-tax differences will reverse in a subsequent period.
Annual Report
Notes to Financial Statements - continued
3. Significant Accounting Policies - continued
Income Tax Information and Distributions to Shareholders - continued
Book-tax differences are primarily due to foreign currency transactions, certain foreign taxes, passive foreign investment companies (PFIC), partnerships, capital loss carryforwards and losses deferred due to wash sales.
The federal tax cost of investment securities and unrealized appreciation (depreciation) as of period end were as follows:
Gross unrealized appreciation | $ 64,157,893 |
Gross unrealized depreciation | (89,393,208) |
Net unrealized appreciation (depreciation) on securities and other investments | $ (25,235,315) |
| |
Tax Cost | $ 831,986,305 |
The tax-based components of distributable earnings as of period end were as follows:
Undistributed ordinary income | $ 3,411,620 |
Capital loss carryforward | $ (6,966,394) |
Net unrealized appreciation (depreciation) | $ (25,483,446) |
Under the recently enacted Regulated Investment Company Modernization Act of 2010 (the Act), the Fund will be permitted to carry forward capital losses incurred in taxable years beginning after December 22, 2010 for an unlimited period. However, any losses incurred during those future taxable years will be required to be utilized prior to any losses incurred in pre-enactment taxable years, which generally expire after eight years from when they are incurred. Additionally, post-enactment capital losses that are carried forward will retain their character as either short-term or long-term capital losses rather than being considered all short-term as under previous law. The Fund's first fiscal year end subject to the Act will be October 31, 2012.
The tax character of distributions paid was as follows:
| October 31, 2011 | October 31, 2010 |
Ordinary Income | $ 5,112,665 | $ 1,546,715 |
Long-Term Capital Gains | 2,037,448 | - |
Total | $ 7,150,113 | $ 1,546,715 |
Short-Term Trading (Redemption) Fees. Shares held by investors in the Fund less than 30 days are subject to a redemption fee equal to 1.00% of the net asset value of shares redeemed. All redemption fees, which reduce the proceeds of the shareholder redemption, are retained by the Fund and accounted for as an addition to paid in capital.
Annual Report
3. Significant Accounting Policies - continued
New Accounting Pronouncement. In May 2011, the Financial Accounting Standards Board issued Accounting Standard Update No. 2011-04, Fair Value Measurement (Topic 820) - Amendments to Achieve Common Fair Value Measurement and Disclosure Requirements in U.S. GAAP and IFRSs. The update changes the wording used to describe the requirements in GAAP for measuring fair value and for disclosing information about fair value measurements. The update is effective during interim and annual periods beginning after December 15, 2011. Management is currently evaluating the impact of the update's adoption on the Fund's financial statement disclosures.
4. Operating Policies.
Restricted Securities. The Fund may invest in securities that are subject to legal or contractual restrictions on resale. These securities generally may be resold in transactions exempt from registration or to the public if the securities are registered. Disposal of these securities may involve time-consuming negotiations and expense, and prompt sale at an acceptable price may be difficult. Information regarding restricted securities is included at the end of the Fund's Schedule of Investments.
5. Purchases and Sales of Investments.
Purchases and sales of securities, other than short-term securities, aggregated $977,644,235 and $565,928,394, respectively.
6. Fees and Other Transactions with Affiliates.
Management Fee. FMR and its affiliates provide the Fund with investment management related services for which the Fund pays a monthly management fee. The management fee is the sum of an individual fund fee rate that is based on an annual rate of .45% of the Fund's average net assets and a group fee rate that averaged .26% during the period. The group fee rate is based upon the average net assets of all the mutual funds advised by FMR. The group fee rate decreases as assets under management increase and increases as assets under management decrease. For the period, the total annual management fee rate was .71% of the Fund's average net assets.
Distribution and Service Plan Fees. In accordance with Rule 12b-1 of the 1940 Act, the Fund has adopted separate Distribution and Service Plans for each class of shares. Certain classes pay Fidelity Distributors Corporation (FDC), an affiliate of FMR, separate Distribution and Service Fees, each of which is based on an annual percentage of each class' average net assets. In addition, FDC may pay financial intermediaries for selling shares of the Fund and providing shareholder support services. For the period, the Distribution and Service Fee rates, total fees and amounts retained by FDC were as follows:
Annual Report
Notes to Financial Statements - continued
6. Fees and Other Transactions with Affiliates - continued
Distribution and Service Plan Fees - continued
| Distribution
Fee | Service
Fee | Total Fees | Retained
by FDC |
Class A | -% | .25% | $ 294,482 | $ 11,535 |
Class T | .25% | .25% | 97,025 | 1 |
Class B | .75% | .25% | 48,554 | 36,421 |
Class C | .75% | .25% | 337,305 | 182,256 |
| | | $ 777,366 | $ 230,213 |
Sales Load. FDC may receive a front-end sales charge of up to 5.75% for selling Class A shares, and 3.50% for selling Class T shares, some of which is paid to financial intermediaries for selling shares of the Fund. Depending on the holding period, FDC may receive contingent deferred sales charges levied on Class A, Class T, Class B, and Class C redemptions. The deferred sales charges range from 5% to 1% for Class B, 1% for Class C, 1.00% for certain purchases of Class A shares and .25% for certain purchases of Class T shares.
For the period, sales charge amounts retained by FDC were as follows:
| Retained
by FDC |
Class A | $ 203,267 |
Class T | 23,029 |
Class B* | 73,574 |
Class C* | 12,313 |
| $ 312,183 |
* When Class B and Class C shares are initially sold, FDC pays commissions from its own resources to financial intermediaries through which the sales are made.
Transfer Agent Fees. Fidelity Investments Institutional Operations Company, Inc. (FIIOC), an affiliate of FMR, is the transfer, dividend disbursing and shareholder servicing agent for each class of the Fund. FIIOC receives account fees and asset-based fees that vary according to the account size and type of account of the shareholders of the respective classes of the Fund. FIIOC pays for typesetting, printing and mailing of shareholder reports, except proxy statements. For the period, transfer agent fees for each class were as follows:
Annual Report
6. Fees and Other Transactions with Affiliates - continued
Transfer Agent Fees - continued
| Amount | % of
Average
Net Assets |
Class A | $ 306,688 | .26 |
Class T | 56,044 | .29 |
Class B | 14,667 | .30 |
Class C | 96,930 | .29 |
Global Commodity Stock | 1,516,249 | .27 |
Institutional Class | 143,558 | .23 |
| $ 2,134,136 | |
Accounting and Security Lending Fees. Fidelity Service Company, Inc. (FSC), an affiliate of FMR, maintains the Fund's accounting records. The accounting fee is based on the level of average net assets for the month. Under a separate contract, FSC administers the security lending program. The security lending fee is based on the number and duration of lending transactions.
Brokerage Commissions. The Fund placed a portion of its portfolio transactions with brokerage firms which are affiliates of the investment adviser. The commissions paid to these affiliated firms were $20,462 for the period.
Interfund Lending Program. Pursuant to an Exemptive Order issued by the SEC, the Fund, along with other registered investment companies having management contracts with FMR, may participate in an interfund lending program. This program provides an alternative credit facility allowing the funds to borrow from, or lend money to, other participating affiliated funds. At period end, there were no interfund loans outstanding. The Fund's activity in this program during the period for which loans were outstanding was as follows:
Borrower or Lender | Average Daily
Loan Balance | Weighted Average Interest Rate | Interest
Expense |
Borrower | $ 5,072,574 | .35% | $ 2,323 |
7. Committed Line of Credit.
The Fund participates with other funds managed by FMR or an affiliate in a $4.0 billion credit facility (the "line of credit") to be utilized for temporary or emergency purposes to fund shareholder redemptions or for other short-term liquidity purposes. The Fund has agreed to pay commitment fees on its pro-rata portion of the line of credit, which amounted to $2,313 and is reflected in Miscellaneous expenses on the Statement of Operations. During the period, there were no borrowings on this line of credit.
Annual Report
Notes to Financial Statements - continued
8. Security Lending.
The Fund lends portfolio securities through a lending agent from time to time in order to earn additional income. For equity securities, a lending agent is used and may loan securities to certain qualified borrowers, including Fidelity Capital Markets (FCM), a broker-dealer affiliated with the Fund. On the settlement date of the loan, the Fund receives collateral (in the form of U.S. Treasury obligations, letters of credit and/or cash) against the loaned securities and maintains collateral in an amount not less than 100% of the market value of the loaned securities during the period of the loan. The market value of the loaned securities is determined at the close of business of the Fund and any additional required collateral is delivered to the Fund on the next business day. If the borrower defaults on its obligation to return the securities loaned because of insolvency or other reasons, a fund could experience delays and costs in recovering the securities loaned or in gaining access to the collateral. Any cash collateral received is invested in the Fidelity Securities Lending Cash Central Fund. The value of loaned securities and cash collateral at period end are disclosed on the Fund's Statement of Assets and Liabilities. Security lending income represents the income earned on investing cash collateral, less rebates paid to borrowers and any lending agent fees associated with the loan, plus any premium payments received for lending certain types of securities. Security lending income is presented in the Statement of Operations as a component of income from Fidelity Central Funds. Total security lending income during the period amounted to $351,340. During the period, there were no securities loaned to FCM.
9. Bank Borrowings.
The Fund is permitted to have bank borrowings for temporary or emergency purposes to fund shareholder redemptions or for other short-term liquidity requirements. The Fund has established borrowing arrangements with certain banks. The interest rate on the borrowings is the bank's base rate, as revised from time to time. The average daily loan balance during the period for which loans were outstanding amounted to $2,705,000. The weighted average interest rate was .59%. The interest expense amounted to $133 under the bank borrowing program. At period end, there were no bank borrowings outstanding.
10. Expense Reductions.
Many of the brokers with whom FMR places trades on behalf of the Fund provided services to the Fund in addition to trade execution. These services included payments of certain expenses on behalf of the Fund totaling $62,747 for the period.
Annual Report
11. Distributions to Shareholders.
Distributions to shareholders of each class were as follows:
Years ended October 31, | 2011 | 2010 |
From net investment income | | |
Class A | $ 597,144 | $ 7,432 |
Class T | 82,038 | - |
Class C | 56,214 | - |
Global Commodity Stock | 3,895,270 | 168,019 |
Institutional Class | 414,647 | 12,973 |
Total | $ 5,045,313 | $ 188,424 |
From net realized gain | | |
Class A | $ 275,211 | $ 143,058 |
Class T | 52,381 | 30,137 |
Class B | 16,866 | 9,302 |
Class C | 68,717 | 20,828 |
Global Commodity Stock | 1,532,256 | 1,078,126 |
Institutional Class | 159,369 | 76,840 |
Total | $ 2,104,800 | $ 1,358,291 |
12. Share Transactions.
Transactions for each class of shares were as follows:
| Shares | Dollars |
Years ended October 31, | 2011 | 2010 | 2011 | 2010 |
Class A | | | | |
Shares sold | 7,297,574 | 3,636,511 | $ 124,882,197 | $ 52,113,230 |
Reinvestment of distributions | 39,060 | 8,310 | 643,900 | 119,911 |
Shares redeemed | (2,752,883) | (957,806) | (44,565,640) | (13,354,681) |
Net increase (decrease) | 4,583,751 | 2,687,015 | $ 80,960,457 | $ 38,878,460 |
Class T | | | | |
Shares sold | 866,549 | 635,625 | $ 14,740,169 | $ 9,055,849 |
Reinvestment of distributions | 7,294 | 2,006 | 120,226 | 28,921 |
Shares redeemed | (249,100) | (233,090) | (4,030,489) | (3,190,490) |
Net increase (decrease) | 624,743 | 404,541 | $ 10,829,906 | $ 5,894,280 |
Class B | | | | |
Shares sold | 82,231 | 275,613 | $ 1,397,980 | $ 3,943,173 |
Reinvestment of distributions | 917 | 543 | 14,988 | 7,824 |
Shares redeemed | (76,244) | (200,985) | (1,237,701) | (2,763,660) |
Net increase (decrease) | 6,904 | 75,171 | $ 175,267 | $ 1,187,337 |
Annual Report
Notes to Financial Statements - continued
12. Share Transactions - continued
| Shares | Dollars |
Years ended October 31, | 2011 | 2010 | 2011 | 2010 |
Class C | | | | |
Shares sold | 2,215,036 | 869,321 | $ 37,885,797 | $ 12,506,411 |
Reinvestment of distributions | 6,435 | 1,339 | 105,874 | 19,266 |
Shares redeemed | (662,765) | (305,685) | (10,246,197) | (4,197,936) |
Net increase (decrease) | 1,558,706 | 564,975 | $ 27,745,474 | $ 8,327,741 |
Global Commodity Stock | | | | |
Shares sold | 32,339,719 | 19,122,952 | $ 553,926,075 | $ 278,892,729 |
Reinvestment of distributions | 293,921 | 81,765 | 4,855,462 | 1,181,498 |
Shares redeemed | (17,519,084) | (11,379,620) | (288,860,403) | (158,960,668) |
Net increase (decrease) | 15,114,556 | 7,825,097 | $ 269,921,134 | $ 121,113,559 |
Institutional Class | | | | |
Shares sold | 4,225,113 | 1,969,025 | $ 72,109,877 | $ 28,672,948 |
Reinvestment of distributions | 16,850 | 2,588 | 278,352 | 37,397 |
Shares redeemed | (2,651,317) | (426,975) | (43,491,555) | (6,016,467) |
Net increase (decrease) | 1,590,646 | 1,544,638 | $ 28,896,674 | $ 22,693,878 |
13. Other.
The Fund's organizational documents provide former and current trustees and officers with a limited indemnification against liabilities arising in connection with the performance of their duties to the Fund. In the normal course of business, the Fund may also enter into contracts that provide general indemnifications. The Fund's maximum exposure under these arrangements is unknown as this would be dependent on future claims that may be made against the Fund. The risk of material loss from such claims is considered remote.
Annual Report
To the Trustees of Fidelity Investment Trust and the Shareholders of Fidelity Global Commodity Stock Fund:
In our opinion, the accompanying statement of assets and liabilities, including the schedule of investments, and the related statements of operations and of changes in net assets and the financial highlights present fairly, in all material respects, the financial position of Fidelity Global Commodity Stock Fund (a fund of Fidelity Investment Trust) at October 31, 2011, the results of its operations for the year then ended, the changes in its net assets for each of the two years in the period then ended and the financial highlights for each of the periods indicated, in conformity with accounting principles generally accepted in the United States of America. These financial statements and financial highlights (hereafter referred to as "financial statements") are the responsibility of the Fidelity Global Commodity Stock Fund's management. Our responsibility is to express an opinion on these financial statements based on our audits. We conducted our audits of these financial statements in accordance with the standards of the Public Company Accounting Oversight Board (United States). Those standards require that we plan and perform the audit to obtain reasonable assurance about whether the financial statements are free of material misstatement. An audit includes examining, on a test basis, evidence supporting the amounts and disclosures in the financial statements, assessing the accounting principles used and significant estimates made by management, and evaluating the overall financial statement presentation. We believe that our audits, which included confirmation of securities at October 31, 2011 by correspondence with the custodian and brokers, provide a reasonable basis for our opinion.
PricewaterhouseCoopers LLP
Boston, Massachusetts
December 16, 2011
Annual Report
The Trustees, Members of the Advisory Board, and executive officers of the trust and fund, as applicable, are listed below. The Board of Trustees governs the fund and is responsible for protecting the interests of shareholders. The Trustees are experienced executives who meet periodically throughout the year to oversee the fund's activities, review contractual arrangements with companies that provide services to the fund, oversee management of the risks associated with such activities and contractual arrangements, and review the fund's performance. Except for James C. Curvey, each of the Trustees oversees 226 funds advised by FMR or an affiliate. Mr. Curvey oversees 429 funds advised by FMR or an affiliate.
The Trustees hold office without limit in time except that (a) any Trustee may resign; (b) any Trustee may be removed by written instrument, signed by at least two-thirds of the number of Trustees prior to such removal; (c) any Trustee who requests to be retired or who has become incapacitated by illness or injury may be retired by written instrument signed by a majority of the other Trustees; and (d) any Trustee may be removed at any special meeting of shareholders by a two-thirds vote of the outstanding voting securities of the trust. Each Trustee who is not an interested person (as defined in the 1940 Act) (Independent Trustee), shall retire not later than the last day of the calendar year in which his or her 75th birthday occurs. The Independent Trustees may waive this mandatory retirement age policy with respect to individual Trustees. The executive officers and Advisory Board Members hold office without limit in time, except that any officer and Advisory Board Member may resign or may be removed by a vote of a majority of the Trustees at any regular meeting or any special meeting of the Trustees. Except as indicated, each individual has held the office shown or other offices in the same company for the past five years.
Experience, Skills, Attributes, and Qualifications of the Fund's Trustees. The Governance and Nominating Committee has adopted a statement of policy that describes the experience, qualifications, attributes, and skills that are necessary and desirable for potential Independent Trustee candidates (Statement of Policy). The Board believes that each Trustee satisfied at the time he or she was initially elected or appointed a Trustee, and continues to satisfy, the standards contemplated by the Statement of Policy. The Governance and Nominating Committee also engages professional search firms to help identify potential Independent Trustee candidates who have the experience, qualifications, attributes, and skills consistent with the Statement of Policy. From time to time, additional criteria based on the composition and skills of the current Independent Trustees, as well as experience or skills that may be appropriate in light of future changes to board composition, business conditions, and regulatory or other developments, have also been considered by the professional search firms and the Governance and Nominating Committee. In addition, the Board takes into account the Trustees' commitment and participation in Board and committee meetings, as well as their leadership of standing and ad hoc committees throughout their tenure.
In determining that a particular Trustee was and continues to be qualified to serve as a Trustee, the Board has considered a variety of criteria, none of which, in isolation, was controlling. The Board believes that, collectively, the Trustees have balanced and diverse experience, qualifications, attributes, and skills, which allow the Board to operate effectively in governing the fund and protecting the interests of shareholders. Information about the specific experience, skills, attributes, and qualifications of each Trustee, which in each case led to the Board's conclusion that the Trustee should serve (or continue to serve) as a trustee of the fund, is provided below.
Annual Report
Trustees and Officers - continued
Board Structure and Oversight Function. James C. Curvey is an interested person (as defined in the 1940 Act) and currently serves as Acting Chairman. The Trustees have determined that an interested Chairman is appropriate and benefits shareholders because an interested Chairman has a personal and professional stake in the quality and continuity of services provided to the fund. Independent Trustees exercise their informed business judgment to appoint an individual of their choosing to serve as Chairman, regardless of whether the Trustee happens to be independent or a member of management. The Independent Trustees have determined that they can act independently and effectively without having an Independent Trustee serve as Chairman and that a key structural component for assuring that they are in a position to do so is for the Independent Trustees to constitute a substantial majority for the Board. The Independent Trustees also regularly meet in executive session. Ned C. Lautenbach serves as Chairman of the Independent Trustees and as such (i) acts as a liaison between the Independent Trustees and management with respect to matters important to the Independent Trustees and (ii) with management prepares agendas for Board meetings.
Fidelity funds are overseen by different Boards of Trustees. The fund's Board oversees Fidelity's equity and high income funds and another Board oversees Fidelity's investment-grade bond, money market, and asset allocation funds. The asset allocation funds may invest in Fidelity funds overseen by the fund's Board. The use of separate Boards, each with its own committee structure, allows the Trustees of each group of Fidelity funds to focus on the unique issues of the funds they oversee, including common research, investment, and operational issues. On occasion, the separate Boards establish joint committees to address issues of overlapping consequences for the Fidelity funds overseen by each Board.
The Trustees operate using a system of committees to facilitate the timely and efficient consideration of all matters of importance to the Trustees, the fund, and fund shareholders and to facilitate compliance with legal and regulatory requirements and oversight of the fund's activities and associated risks. The Board, acting through its committees, has charged FMR and its affiliates with (i) identifying events or circumstances the occurrence of which could have demonstrably adverse effects on the fund's business and/or reputation; (ii) implementing processes and controls to lessen the possibility that such events or circumstances occur or to mitigate the effects of such events or circumstances if they do occur; and (iii) creating and maintaining a system designed to evaluate continuously business and market conditions in order to facilitate the identification and implementation processes described in (i) and (ii) above. Because the day-to-day operations and activities of the fund are carried out by or through FMR, its affiliates and other service providers, the fund's exposure to risks is mitigated but not eliminated by the processes overseen by the Trustees. While each of the Board's committees has responsibility for overseeing different aspects of the fund's activities, oversight is exercised primarily through the Operations, Audit, and Compliance Committees. In addition, the Independent Trustees have worked with FMR to enhance the Board's oversight of investment and financial risks, legal and regulatory risks, technology risks, and operational risks, including the development of additional risk reporting to the Board. For example, a working group comprised of Independent Trustees and FMR has worked and continues to work to review the Fidelity funds' valuation-related activities, reporting and risk management. Appropriate personnel, including but not limited to the fund's Chief Compliance Officer (CCO), FMR's internal auditor, the independent accountants, the fund's Treasurer and portfolio management personnel, make periodic reports to the Board's committees, as appropriate, including an annual review of FMR's risk management program for the Fidelity funds. The responsibilities of each standing committee, including their oversight responsibilities, are described further under "Standing Committees of the Fund's Trustees."
Annual Report
The fund's Statement of Additional Information (SAI) includes more information about the Trustees. To request a free copy, call Fidelity at 1-800-544-8544.
Interested Trustees*:
Correspondence intended for each Trustee who is an interested person may be sent to Fidelity Investments, 82 Devonshire Street, Boston, Massachusetts 02109.
Name, Age; Principal Occupations and Other Relevant Experience+ |
James C. Curvey (76) |
| Year of Election or Appointment: 2007 Mr. Curvey is Trustee and Acting Chairman of the Board of Trustees of certain Trusts. Mr. Curvey also serves as Trustee (2007-present) of other investment companies advised by FMR. Mr. Curvey is a Director of Fidelity Investments Money Management, Inc. (2009-present), Director of Fidelity Research & Analysis Co. (2009-present) and Director of FMR and FMR Co., Inc. (2007-present). Mr. Curvey is also Vice Chairman (2007-present) and Director of FMR LLC. In addition, Mr. Curvey serves as an Overseer for the Boston Symphony Orchestra and a member of the Trustees of Villanova University. Previously, Mr. Curvey was the Vice Chairman (2006-2007) and Director (2000-2007) of FMR Corp. |
Ronald P. O'Hanley (54) |
| Year of Election or Appointment: 2011 Mr. O'Hanley is Director of FMR Co., Inc. (2010-present), Director of Fidelity Investments Money Management, Inc. (2010-present), Director of Fidelity Research & Analysis Company (2010-present), President of Fidelity Asset Management and Corporate Services and a member of Fidelity's Executive Committee (2010-present). Previously, Mr. O'Hanley served as President and Chief Executive Officer of BNY Mellon Asset Management (2007-2010). Mr. O'Hanley also served as Vice Chairman of Bank New York Mellon Corp. and a member of that firm's Executive Committee. Prior to the 2007 merger of The Bank of New York and Mellon Financial Corporation, he was Vice Chairman of Mellon Financial Corporation and President and Chief Executive Officer of Mellon Asset Management. He joined Mellon in February 1997. Mr. O'Hanley currently serves as Chairman of the Boston Public Library Foundation Board of Directors and sits on the Board of Directors of Beth Israel Deaconess Medical Center, the Board of Trustees of the Marine Biological Laboratory and the Advisory Board of the Maxwell School of Citizenship and Public Administration at Syracuse University. Mr. O'Hanley also chairs the Council on Asset Management for the Financial Services Roundtable and is a member of the Board of Directors of Institutional Investor's U.S. Institute. |
* Trustees have been determined to be "Interested Trustees" by virtue of, among other things, their affiliation with the trust or various entities under common control with FMR.
+ The information above includes each Trustee's principal occupation during the last five years and other information relating to the experience, attributes, and skills relevant to each Trustee's qualifications to serve as a Trustee, which led to the conclusion that each Trustee should serve as a Trustee for the fund.
Annual Report
Independent Trustees:
Correspondence intended for each Independent Trustee (that is, the Trustees other than the Interested Trustees) may be sent to Fidelity Investments, P.O. Box 55235, Boston, Massachusetts 02205-5235.
Name, Age; Principal Occupations and Other Relevant Experience+ |
Dennis J. Dirks (63) |
| Year of Election or Appointment: 2005 Prior to his retirement in May 2003, Mr. Dirks was Chief Operating Officer and a member of the Board of The Depository Trust & Clearing Corporation (DTCC). He also served as President, Chief Operating Officer, and Board member of The Depository Trust Company (DTC) and President and Board member of the National Securities Clearing Corporation (NSCC). In addition, Mr. Dirks served as Chief Executive Officer and Board member of the Government Securities Clearing Corporation, Chief Executive Officer and Board member of the Mortgage-Backed Securities Clearing Corporation, as a Trustee and a member of the Finance Committee of Manhattan College (2005-2008), and as a Trustee and a member of the Finance Committee of AHRC of Nassau County (2006-2008). Mr. Dirks is a member of the Independent Directors Council (IDC) Governing Council (2010-Present) and Board of Directors for The Brookville Center for Children's Services, Inc. (2009-present). |
Alan J. Lacy (58) |
| Year of Election or Appointment: 2008 Mr. Lacy serves as Senior Adviser (2007-present) of Oak Hill Capital Partners, L.P. (private equity). Mr. Lacy also served as Chief Executive Officer (2000-2005) and Vice Chairman (2005-2006) of Sears Holdings Corporation and Sears, Roebuck and Co. (retail). In addition, Mr. Lacy serves as a member of the Board of Directors of Dave & Buster's, Inc. (restaurant and entertainment complexes, 2010-present), The Hillman Companies, Inc. (hardware wholesalers, 2010-present), and Bristol-Myers Squibb Company (global pharmaceuticals, 2007-present). Mr. Lacy is a member of the Board of Trustees of The National Parks Conservation Association (2006-Present). Previously, Mr. Lacy served as Chairman of the Board of Trustees of the National Parks Conservation Association (2008-2011) and as a member of the Board of Directors for the Western Union Company (global money transfer, 2006-2011). |
Ned C. Lautenbach (67) |
| Year of Election or Appointment: 2000 Mr. Lautenbach is Chairman of the Independent Trustees of the Equity and High Income Funds (2006-present). Mr. Lautenbach currently serves as the Lead Director of the Eaton Corporation Board of Directors (diversified industrial, 1997-present). Mr. Lautenbach is also a member of the Board of Directors of the Philharmonic Center for the Arts in Naples, Florida (1999-present); a member of the Board of Trustees of Fairfield University (2005-present); and a member of the Council on Foreign Relations (1994-present). Previously, Mr. Lautenbach was a Partner/Advisory Partner at Clayton, Dubilier & Rice, LLC (private equity investment, 1998-2010), as well as a Director of Sony Corporation (2006-2007). |
Joseph Mauriello (67) |
| Year of Election or Appointment: 2008 Prior to his retirement in January 2006, Mr. Mauriello served in numerous senior management positions including Deputy Chairman and Chief Operating Officer (2004-2005), and Vice Chairman of Financial Services (2002-2004) of KPMG LLP US (professional services, 1965-2005). Mr. Mauriello currently serves as a member of the Board of Directors of XL Group plc. (global insurance and re-insurance, 2006-present) and of Arcadia Resources Inc. (health care services and products, 2007-present). Previously, Mr. Mauriello served as a Director of the Hamilton Funds of the Bank of New York (2006-2007). |
Robert W. Selander (61) |
| Year of Election or Appointment: 2011 Previously, Mr. Selander served as a Member of the Advisory Board of Fidelity's Equity and High Income Funds (2011), Executive Vice Chairman (2010), Chief Executive Officer (2009-2010), and President and Chief Executive Officer (1997-2009) of Mastercard, Inc. |
Cornelia M. Small (67) |
| Year of Election or Appointment: 2005 Ms. Small is a member of the Board of Directors of the Teagle Foundation (2009-present). Ms. Small is also a member of the Investment Committee, and Chair (2008-present) and a member of the Board of Trustees of Smith College. In addition, Ms. Small serves on the Investment Committee of the Berkshire Taconic Community Foundation (2008-present). Previously, Ms. Small served as Chairperson of the Investment Committee (2002-2008) of Smith College. In addition, Ms. Small served as Chief Investment Officer, Director of Global Equity Investments, and a member of the Board of Directors of Scudder, Stevens & Clark and Scudder Kemper Investments. |
William S. Stavropoulos (72) |
| Year of Election or Appointment: 2001 Mr. Stavropoulos is Vice Chairman of the Independent Trustees of the Equity and High Income Funds (2006-present). Mr. Stavropoulos serves as President and Founder of the Michigan Baseball Foundation, the Great Lakes Loons (2007-present). Mr. Stavropoulos is Chairman Emeritus of the Board of Directors of The Dow Chemical Company, where he previously served in numerous senior management positions, including President, CEO (1995-2000; 2002-2004), Chairman of the Executive Committee (2000-2006), and as a member of the Board of Directors (1990-2006). Currently, Mr. Stavropoulos is Chairman of Univar (global distributor of commodity and specialty chemicals, 2010-present), a Director of Teradata Corporation (data warehousing and technology solutions, 2008-present), Chemical Financial Corporation, Maersk Inc. (industrial conglomerate), Tyco International, Inc. (multinational manufacturing and services, 2007-present), and a member of the Advisory Board for Metalmark Capital (private equity investment, 2005-present). Mr. Stavropoulos is a special advisor to Clayton, Dubilier & Rice, LLC (private equity investment). In addition, Mr. Stavropoulos is a member of the University of Notre Dame Advisory Council for the College of Science. |
David M. Thomas (62) |
| Year of Election or Appointment: 2008 Previously, Mr. Thomas served as Executive Chairman (2005-2006) and Chairman and Chief Executive Officer (2000-2005) of IMS Health, Inc. (pharmaceutical and healthcare information solutions). In addition, Mr. Thomas serves as a member of the Board of Directors of Fortune Brands, Inc. (consumer products), and Interpublic Group of Companies, Inc. (marketing communication, 2004-present). |
Michael E. Wiley (61) |
| Year of Election or Appointment: 2008 Mr. Wiley also serves as a Director of Asia Pacific Exploration Consolidated (international oil and gas exploration and production, 2008-present). Mr. Wiley serves as a Director of Tesoro Corporation (independent oil refiner and marketer, 2005-present), and a Director of Bill Barrett Corporation (exploration and production, 2005-present). In addition, Mr. Wiley also serves as a Director of Post Oak Bank (privately-held bank, 2004-present). Previously, Mr. Wiley served as a member of the Board of Trustees of the University of Tulsa (2000-2006; 2007-2010), as a Senior Energy Advisor of Katzenbach Partners, LLC (consulting, 2006-2007), as an Advisory Director of Riverstone Holdings (private investment), Chairman, President, and CEO of Baker Hughes, Inc. (oilfield services, 2000-2004), and as Director of Spinnaker Exploration Company (exploration and production, 2001-2005). |
Annual Report
Trustees and Officers - continued
+ The information above includes each Trustee's principal occupation during the last five years and other information relating to the experience, attributes, and skills relevant to each Trustee's qualifications to serve as a Trustee, which led to the conclusion that each Trustee should serve as a Trustee for the fund.
Advisory Board Members and Executive Officers:
Correspondence intended for each executive officer, Edward C. Johnson 3d, and Peter S. Lynch may be sent to Fidelity Investments, 82 Devonshire Street, Boston, Massachusetts 02109.
Name, Age; Principal Occupation |
Edward C. Johnson 3d (81) |
| Year of Election or Appointment: 2011 Member of the Advisory Board of Fidelity's Equity and High Income Funds. Mr. Johnson serves as Chief Executive Officer, Chairman, and a Director of FMR LLC, and also serves as Chairman and Director of FIL Limited. Previously, Mr. Johnson served as a Trustee and Chairman of the Board of certain Fidelity Trusts, Chairman and a Director of FMR, Chairman and a Director of FMR Co., Inc., and President of FMR LLC (2006-2007). |
Peter S. Lynch (67) |
| Year of Election or Appointment: 2003 Member of the Advisory Board of Fidelity's Equity and High Income Funds. Mr. Lynch is Vice Chairman and a Director of FMR and FMR Co., Inc. In addition, Mr. Lynch serves as a Trustee of Boston College and as the Chairman of the Inner-City Scholarship Fund. Previously, Mr. Lynch served on the Special Olympics International Board of Directors (1997-2006). |
Kenneth B. Robins (42) |
| Year of Election or Appointment: 2008 President and Treasurer of Fidelity's Equity and High Income Funds. Mr. Robins also serves as President and Treasurer (2010-present) and Assistant Treasurer (2009-present) of other Fidelity funds and is an employee of Fidelity Investments (2004-present). Previously, Mr. Robins served as Deputy Treasurer of the Fidelity funds (2005-2008) and Treasurer and Chief Financial Officer of The North Carolina Capital Management Trust: Cash and Term Portfolios (2006-2008). |
Bruce T. Herring (46) |
| Year of Election or Appointment: 2006 Vice President of certain Equity Funds. Mr. Herring also serves as Chief Investment Officer and Director of Fidelity Management & Research (U.K.) Inc. (2010-present) and Group Chief Investments Officer of FMR. Previously, Mr. Herring served as Vice President (2005-2006) and Senior Vice President (2006-2007) of Fidelity Management & Research Company, Vice President of FMR Co., Inc. (2001-2007) and as a portfolio manager for Fidelity U.S. Equity Funds. |
Brian B. Hogan (47) |
| Year of Election or Appointment: 2009 Vice President of Equity and High Income Funds. Mr. Hogan also serves as President of FMR's Equity Division (2009-present). Previously, Mr. Hogan served as Senior Vice President, Equity Research of FMR (2006-2009) and as a portfolio manager. |
Scott C. Goebel (43) |
| Year of Election or Appointment: 2008 Secretary and Chief Legal Officer (CLO) of the Fidelity funds. Mr. Goebel also serves as Secretary of Fidelity Investments Money Management, Inc. (FIMM) (2010-present) and Fidelity Research and Analysis Company (FRAC) (2010-present); Secretary and CLO of The North Carolina Capital Management Trust: Cash and Term Portfolios (2008-present); General Counsel, Secretary, and Senior Vice President of FMR (2008-present) and FMR Co., Inc. (2008-present); employed by FMR LLC or an affiliate (2001-present); Chief Legal Officer of Fidelity Management & Research (Hong Kong) Limited (2008-present) and Assistant Secretary of Fidelity Management & Research (Japan) Inc. (2008-present), and Fidelity Management & Research (U.K.) Inc. (2008-present). Previously, Mr. Goebel served as Assistant Secretary of FIMM (2008-2010), FRAC (2008-2010), and the Funds (2007-2008) and as Vice President and Secretary of Fidelity Distributors Corporation (FDC) (2005-2007). |
William C. Coffey (42) |
| Year of Election or Appointment: 2009 Assistant Secretary of Fidelity's Equity and High Income Funds. Mr. Coffey also serves as Senior Vice President and Deputy General Counsel of FMR LLC (2010-present), and is an employee of Fidelity Investments. Previously, Mr. Coffey served as Vice President and Associate General Counsel of FMR LLC (2005-2009). |
Holly C. Laurent (57) |
| Year of Election or Appointment: 2008 Anti-Money Laundering (AML) Officer of the Fidelity funds. Ms. Laurent also serves as AML Officer of The North Carolina Capital Management Trust: Cash and Term Portfolios (2008-present) and is an employee of Fidelity Investments. Previously, Ms. Laurent was Senior Vice President and Head of Legal for Fidelity Business Services India Pvt. Ltd. (2006-2008), and Senior Vice President, Deputy General Counsel and Group Head for FMR LLC (2005-2006). |
Christine Reynolds (53) |
| Year of Election or Appointment: 2008 Chief Financial Officer of the Fidelity funds. Ms. Reynolds became President of Fidelity Pricing and Cash Management Services (FPCMS) in August 2008. Ms. Reynolds served as Chief Operating Officer of FPCMS (2007-2008). Previously, Ms. Reynolds served as President, Treasurer, and Anti-Money Laundering officer of the Fidelity funds (2004-2007). |
Kenneth A. Rathgeber (64) |
| Year of Election or Appointment: 2004 Chief Compliance Officer of Fidelity's Equity and High Income Funds. Mr. Rathgeber is Chief Compliance Officer of Fidelity Management & Research (Hong Kong) Limited (2008-present), Fidelity Management & Research (Japan) Inc. (2008-present), FMR (2005-present), FMR Co., Inc. (2005-present), Fidelity Management & Research (U.K.) Inc. (2005-present), Fidelity Research & Analysis Company (2005-present), Fidelity Investments Money Management, Inc. (2005-present), Pyramis Global Advisors, LLC (2005-present), and Strategic Advisers, Inc. (2005-present). |
Jeffrey S. Christian (50) |
| Year of Election or Appointment: 2009 Deputy Treasurer of the Fidelity funds. Mr. Christian is an employee of Fidelity Investments. Previously, Mr. Christian served as Chief Financial Officer (2008-2009) of certain Fidelity funds and Senior Vice President of Fidelity Pricing and Cash Management Services (FPCMS) (2004-2009). |
Joseph F. Zambello (54) |
| Year of Election or Appointment: 2011 Deputy Treasurer of the Fidelity funds. Mr. Zambello is an employee of Fidelity Investments. Previously, Mr. Zambello served as Vice President of FMR's Program Management Group (2009-2011) and Vice President of the Transfer Agent Oversight Group (2005-2009). |
Adrien E. Deberghes (44) |
| Year of Election or Appointment: 2008 Deputy Treasurer of Fidelity's Equity and High Income Funds. Mr. Deberghes also serves as Vice President and Assistant Treasurer of Fidelity Rutland Square Trust II and Fidelity Commonwealth Trust II (2011-present), Assistant Treasurer of other Fidelity funds (2010-present), and is an employee of Fidelity Investments (2008-present). Previously, Mr. Deberghes served as Senior Vice President of Mutual Fund Administration at State Street Corporation (2007-2008), Senior Director of Mutual Fund Administration at Investors Bank & Trust (2005-2007), and Director of Finance for Dunkin' Brands (2000-2005). |
Stephanie J. Dorsey (42) |
| Year of Election or Appointment: 2010 Assistant Treasurer of Fidelity's Equity and High Income Funds. Ms. Dorsey also serves as Deputy Treasurer of other Fidelity funds (2008-present) and is an employee of Fidelity Investments (2008-present). Previously, Ms. Dorsey served as Treasurer (2004-2008) of the JPMorgan Mutual Funds and Vice President (2004-2008) of JPMorgan Chase Bank. |
John R. Hebble (53) |
| Year of Election or Appointment: 2009 Assistant Treasurer of Fidelity's Equity and High Income Funds. Mr. Hebble also serves as President (2011-present), Treasurer, and Chief Financial Officer of The North Carolina Capital Management Trust: Cash and Term Portfolios (2008-present), President and Treasurer of other Fidelity funds (2008-present) and is an employee of Fidelity Investments. |
Gary W. Ryan (53) |
| Year of Election or Appointment: 2005 Assistant Treasurer of the Fidelity funds. Mr. Ryan is an employee of Fidelity Investments. Previously, Mr. Ryan served as Vice President of Fund Reporting in Fidelity Pricing and Cash Management Services (FPCMS) (1999-2005). |
Jonathan Davis (43) |
| Year of Election or Appointment: 2010 Assistant Treasurer of the Fidelity funds. Mr. Davis is also Assistant Treasurer of Fidelity Rutland Square Trust II and Fidelity Commonwealth Trust II. Mr. Davis is an employee of Fidelity Investments. Previously, Mr. Davis served as Vice President and Associate General Counsel of FMR LLC (2003-2010). |
Annual Report
The Board of Trustees of Fidelity Global Commodity Stock Fund voted to pay to shareholders of record at the opening of business on record date, the following distributions per share derived from capital gains realized from sales of portfolio securities, and dividends derived from net investment income:
| Pay Date | Record Date | Dividends | Capital Gains |
Fidelity Global Commodity Stock Fund | 12/12/11 | 12/09/11 | $0.084 | $0.014 |
The fund designates 99% and 54% of the dividends distributed on December 10th and December 30th, respectively during the fiscal year as qualifying for the dividends-received deduction for corporate shareholders.
The fund designates 100% of the dividends distributed during the fiscal year as amounts which may be taken into account as a dividend for the purposes of the maximum rate under section 1(h)(11) of the Internal Revenue Code.
The amounts per share which represent income derived from sources within, and taxes paid to, foreign countries or possessions of the United States are as follows:
| Pay Date | Income | Taxes |
Fidelity Global Commodity Stock Fund | 12/13/10 | $0.063 | $0.0095 |
| 12/31/10 | $0.010 | - |
The fund will notify shareholders in January 2012 of amounts for use in preparing 2011 income tax returns.
Annual Report
Board Approval of Investment Advisory Contracts and Management Fees
Fidelity Global Commodity Stock Fund
Each year, the Board of Trustees, including the Independent Trustees (together, the Board), votes on the renewal of the management contract and sub-advisory agreements (together, the Advisory Contracts) for the fund. The Board, assisted by the advice of fund counsel and Independent Trustees' counsel, requests and considers a broad range of information relevant to the renewal of the Advisory Contracts throughout the year.
The Board meets regularly and considers at each of its meetings factors that are relevant to its annual consideration of the renewal of the fund's Advisory Contracts, including the services and support provided to the fund and its shareholders. The Board has established various standing committees, each composed of Independent Trustees with varying backgrounds, to which the Board has assigned specific subject matter responsibilities in order to enhance effective decision-making by the Board. The Board, acting directly and through its Committees, requests and receives information concerning the annual consideration of the renewal of the fund's Advisory Contracts. The Board also meets as needed to consider matters specifically related to the Board's annual consideration of the renewal of Advisory Contracts. Members of the Board may also meet with trustees of other Fidelity funds through ad hoc joint committees to discuss certain matters relevant to the Fidelity funds.
At its July 2011 meeting, the Board of Trustees, including the Independent Trustees, unanimously determined to renew the fund's Advisory Contracts. In reaching its determination, the Board considered all factors it believed relevant, including (i) the nature, extent, and quality of the services to be provided to the fund and its shareholders (including the investment performance of the fund); (ii) the competitiveness of the fund's management fee and total expense ratio; (iii) the total costs of the services to be provided by and the profits to be realized by Fidelity from its relationship with the fund; (iv) the extent to which economies of scale would be realized as the fund grows; and (v) whether fee levels reflect these economies of scale, if any, for the benefit of fund shareholders.
In considering whether to renew the Advisory Contracts for the fund, the Board reached a determination, with the assistance of fund counsel and Independent Trustees' counsel and through the exercise of its business judgment, that the renewal of the Advisory Contracts is in the best interests of the fund and its shareholders and that the compensation payable under the Advisory Contracts is fair and reasonable. The Board's decision to renew the Advisory Contracts was not based on any single factor, but rather was based on a comprehensive consideration of all the information provided to the Board at its meetings throughout the year. The Board, in reaching its determination to renew the Advisory Contracts, is aware that shareholders in the fund have a broad range of investment choices available to them, including a wide choice among mutual funds offered by Fidelity's competitors, and that the fund's shareholders, who have the opportunity to review and weigh the disclosure provided by the fund in its prospectus and other public disclosures, have chosen to invest in this fund, managed by Fidelity.
Annual Report
Board Approval of Investment Advisory Contracts and
Management Fees - continued
Nature, Extent, and Quality of Services Provided. The Board considered the staffing within the investment adviser, FMR, and the sub-advisers (together, the Investment Advisers), including the backgrounds of the fund's investment personnel and the fund's investment objective and discipline. The Independent Trustees also had discussions with senior management of Fidelity's investment operations and investment groups. The Board considered the structure of the portfolio manager compensation program and whether this structure provides appropriate incentives to act in the best interests of the fund.
Resources Dedicated to Investment Management and Support Services. The Board and the Fund Oversight and Research Committees reviewed the general qualifications and capabilities of the Investment Advisers' investment staff, including its size, education, experience, and resources, as well as the Investment Advisers' approach to recruiting, training, managing, and compensating investment personnel. The Board also noted that FMR has devoted increased resources to non-U.S. offices. The Board noted that Fidelity's analysts have extensive resources, tools and capabilities which allow them to conduct sophisticated quantitative and fundamental analysis, as well as credit analysis of issuers, counterparties and enhancers. The Board also believes that Fidelity's investment professionals have sufficient access to global information and data so as to provide competitive investment results over time, and that those professionals also have access to sophisticated tools which permit them to assess portfolio construction and risk and performance attribution characteristics continuously, as well as to transmit new information and research conclusions rapidly around the world. Additionally, in their deliberations, the Board considered the Investment Advisers' trading capabilities and resources which are an integral part of the investment management process.
Shareholder and Administrative Services. The Board considered (i) the nature, extent, quality, and cost of advisory, administrative, and shareholder services performed by the Investment Advisers and their affiliates under the Advisory Contracts and under separate agreements covering transfer agency, pricing and bookkeeping, and securities lending services for the fund; (ii) the nature and extent of the investment adviser's supervision of third party service providers, principally custodians and subcustodians; and (iii) the resources devoted to, and the record of compliance with, the fund's compliance policies and procedures. The Board also reviewed the allocation of fund brokerage, including allocations to brokers affiliated with the Investment Advisers, the use of brokerage commissions to pay fund expenses, and the use of "soft" commission dollars to pay for research services.
The Board noted that the growth of fund assets over time across the complex allows Fidelity to reinvest in the development of services designed to enhance the value or convenience of the Fidelity funds as investment vehicles. These services include 24-hour access to account information and market information through telephone representatives and over the Internet, investor education materials and asset allocation tools, and the expanded availability of Fidelity Investor Centers, with 35 new branches opening since 2010.
Annual Report
Investment in a Large Fund Family. The Board considered the benefits to shareholders of investing in a Fidelity fund, including the benefits of investing in a fund that is part of a large family of funds offering a variety of investment disciplines and providing a large variety of mutual fund investor services. The Board noted that Fidelity had taken, or had made recommendations that resulted in the Fidelity funds taking, a number of actions over the previous year that benefited particular funds, including (i) continuing to dedicate additional resources to investment research and support of the senior management team that oversees asset management; (ii) rationalizing product lines through the mergers of six funds into other funds; (iii) continuing to migrate the Freedom Funds to dedicated lower cost underlying funds; (iv) obtaining shareholder approval to broaden the investment strategies for Fidelity Consumer Finance Portfolio, Fidelity Emerging Asia Fund, and Fidelity Environment and Alternative Energy Portfolio; (v) contractually agreeing to reduce the management fees and impose other expense limitations on Spartan 500 Index Fund and U.S. Bond Index Fund in connection with launching new institutional classes of these funds; (vi) changing the name, primary and supplemental benchmarks, and investment policies of Fidelity Global Strategies Fund to support the fund's flexible investment mandate and global orientation; and (vii) reducing the transfer agency account fee rates on certain accounts.
Investment Performance. The Board considered whether the fund has operated in accordance with its investment objective, as well as its record of compliance with its investment restrictions. It also reviewed the fund's absolute investment performance for each class, as well as the fund's relative investment performance for each class measured against a third-party-sponsored index that reflects the market sector in which the fund invests. The Board noted that FMR does not believe that a meaningful peer group exists against which to compare the fund's performance. Because the fund had been in existence less than three calendar years, the following chart considered by the Board shows, for the one-year period ended December 31, 2010, the total returns of the retail class and Class B of the fund and the total return of a third-party-sponsored index ("benchmark").
Annual Report
Board Approval of Investment Advisory Contracts and
Management Fees - continued
Fidelity Global Commodity Stock Fund
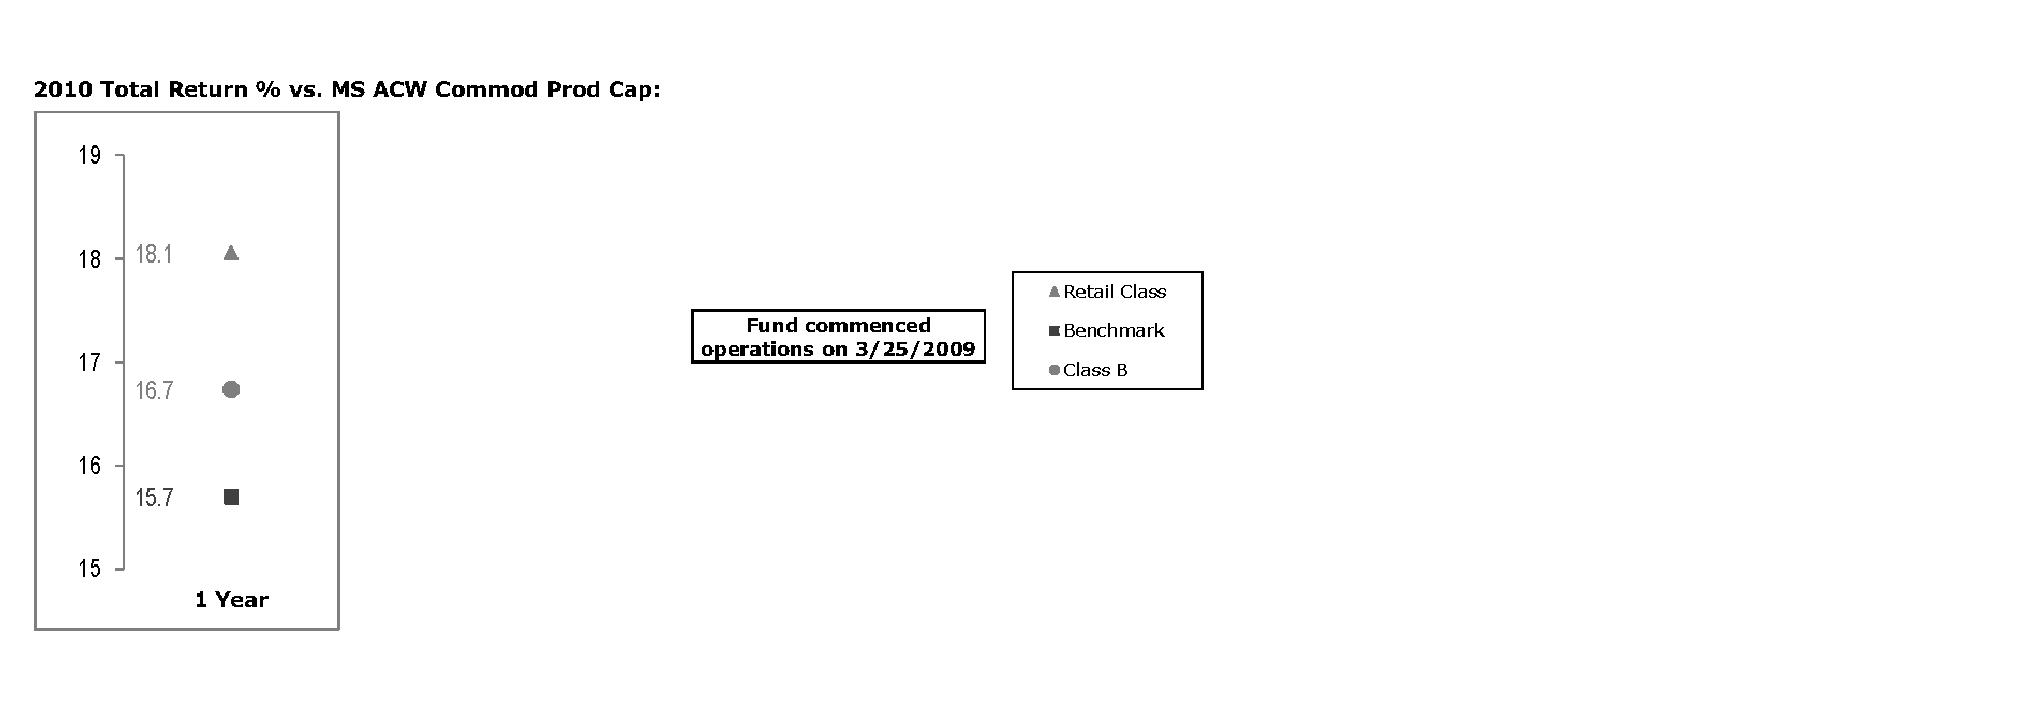
The Board noted that the investment performance of the retail class of the fund compared favorably to its benchmark for the period shown. The Board considered that the variations in performance among the fund's classes reflect the variations in class expenses, which result in lower performance for higher expense classes. The Board also reviewed the fund's performance since inception as well as performance in the current year. The Board noted that it is difficult to evaluate in any comprehensive fashion the performance of the fund, in light of its relatively recent commencement of operations.
Based on its review, the Board concluded that the nature, extent, and quality of services provided to the fund under the Advisory Contracts should benefit the fund's shareholders.
Competitiveness of Management Fee and Total Expense Ratio. The Board considered the fund's management fee and total expense ratio compared to "mapped groups" of competitive funds and classes. Fidelity creates "mapped groups" by combining similar Lipper investment objective categories that have comparable management fee characteristics. Combining Lipper investment objective categories aids the Board's management fee and total expense ratio comparisons by broadening the competitive group used for comparison and by reducing the number of universes to which various Fidelity funds are compared.
Management Fee. The Board considered two proprietary management fee comparisons for the 12-month (or shorter) periods shown in the chart below. The group of Lipper funds used by the Board for management fee comparisons is referred to below as the "Total Mapped Group." The Total Mapped Group comparison focuses on a fund's standing relative to the total universe of comparable funds available to investors in terms of gross management fees before expense reimbursements or caps. "TMG %" represents the percentage of funds in the Total Mapped Group that had management fees that were lower than the fund's. For example, a TMG % of 30% means that 70% of the funds in the Total Mapped Group had higher management fees than the fund. The "Asset-Size Peer Group" (ASPG) comparison focuses on a fund's standing relative to non-Fidelity funds similar in size to the fund within the Total Mapped Group. The ASPG represents at least 15% of the funds in the Total Mapped Group with comparable asset size and management fee characteristics, subject to a minimum of 50 funds (or all funds in the Total Mapped Group if fewer than 50). Additional information, such as the ASPG quartile in which the fund's management fee ranked, is also included in the chart and considered by the Board.
Annual Report
Fidelity Global Commodity Stock Fund
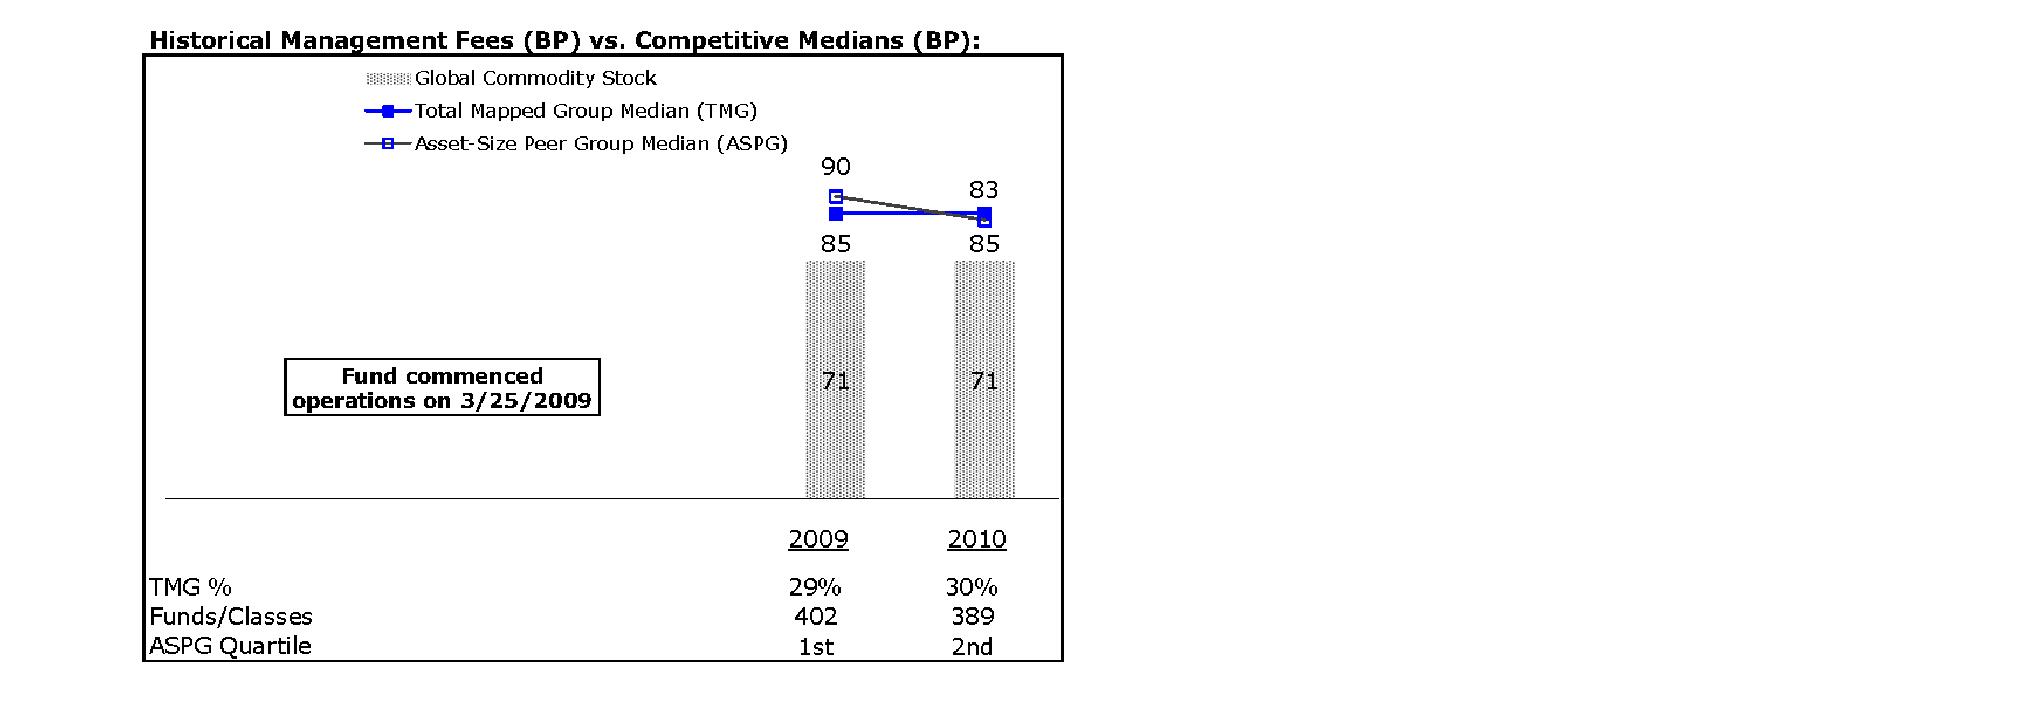
The Board noted that the fund's management fee ranked below the median of its Total Mapped Group and below the median of its ASPG for 2010.
Based on its review, the Board concluded that the fund's management fee is fair and reasonable in light of the services that the fund receives and the other factors considered.
Total Expense Ratio. In its review of each class's total expense ratio, the Board considered the fund's management fee as well as other fund or class expenses, as applicable, such as transfer agent fees, pricing and bookkeeping fees, fund-paid 12b-1 fees, and custodial, legal, and audit fees. The Board also noted the effects of any waivers and reimbursements on fees and expenses. As part of its review, the Board also considered the current and historical total expense ratios of each class of the fund compared to competitive fund median expenses. Each class of the fund is compared to those funds and classes in the Total Mapped Group (used by the Board for management fee comparisons) that have a similar sales load structure.
Annual Report
Board Approval of Investment Advisory Contracts and
Management Fees - continued
The Board noted that the total expense ratio of each of Class A, Class B, Class C, Institutional Class, and the retail class ranked below its competitive median for 2010 and the total expense ratio of Class T ranked above its competitive median for 2010. The Board considered that various factors, including 12b-1 fees, positive or negative performance adjustments, and relatively higher other expenses in the case of small fund size, can affect total expense ratios. The Board noted that the total expense ratio of Class T was above the competitive median primarily because of higher 12b-1 fees on Class T. Class T has a higher 12b-1 fee, but a lower front-end sales charge, than traditionally priced front-end sales charge classes. The Board noted that the fund offers multiple classes, each of which has a different sales load and 12b-1 fee structure, and that the multiple structures are intended to offer a range of pricing options for the intermediary market. The Board also noted that the total expense ratios of the classes vary primarily by the level of their 12b-1 fees, although differences in transfer agent fees may also cause expenses to vary from class to class.
Fees Charged to Other Fidelity Clients. The Board also considered Fidelity fee structures and other information with respect to clients of FMR and its affiliates, such as other mutual funds advised or subadvised by FMR or its affiliates, pension plan clients, and other institutional clients. In March 2010, the Board created an ad hoc joint committee with the board of other Fidelity funds (the Committee) to review and compare Fidelity's institutional investment advisory business with its business of providing services to the Fidelity funds, including the differences in services provided, fees charged, and costs incurred, as well as competition in their respective marketplaces.
Based on its review of total expense ratios and fees charged to other Fidelity clients, the Board concluded that the total expense ratio of each class of the fund was reasonable, although Class T was above the median of the universe presented for comparison, in light of the services that the fund and its shareholders receive and the other factors considered, including the findings of the Committee.
Costs of the Services and Profitability. The Board considered the revenues earned and the expenses incurred by Fidelity in conducting the business of developing, marketing, distributing, managing, administering and servicing the fund and its shareholders. The Board also considered the level of Fidelity's profits in respect of all the Fidelity funds.
On an annual basis, FMR presents to the Board Fidelity's profitability for the fund. Fidelity calculates the profitability for each fund, as well as aggregate profitability for groups of Fidelity funds and all Fidelity funds, using a series of detailed revenue and cost allocation methodologies which originate with the books and records of Fidelity on which Fidelity's audited financial statements are based. The Audit Committee of the Board reviews any significant changes from the prior year's methodologies.
Annual Report
PricewaterhouseCoopers LLP (PwC), independent registered public accounting firm and auditor to Fidelity and certain Fidelity funds, has been engaged annually by the Board as part of the Board's assessment of Fidelity's profitability analysis. PwC's engagement includes the review and assessment of Fidelity's methodologies used in determining the revenues and expenses attributable to Fidelity's mutual fund business, and completion of agreed-upon procedures surrounding the mathematical accuracy of fund profitability and its conformity to allocation methodologies. After considering PwC's reports issued under the engagement and information provided by Fidelity, the Board concluded that while other allocation methods may also be reasonable, Fidelity's profitability methodologies are reasonable in all material respects.
The Board also reviewed Fidelity's non-fund businesses and fall-out benefits related to the mutual fund business as well as cases where Fidelity's affiliates may benefit from or be related to the fund's business.
The Board considered the costs of the services provided by and the profits realized by Fidelity in connection with the operation of the fund and was satisfied that the profitability was not excessive in the circumstances.
Economies of Scale. The Board considered whether there have been economies of scale in respect of the management of the Fidelity funds, whether the Fidelity funds (including the fund) have appropriately benefited from any such economies of scale, and whether there is potential for realization of any further economies of scale. The Board considered the extent to which the fund will benefit from economies of scale through increased services to the fund, through waivers or reimbursements, or through fee or expense reductions. The Board also noted that in 2009, it and the board of other Fidelity funds created an ad hoc committee (the Economies of Scale Committee) to analyze whether FMR attains economies of scale in respect of the management and servicing of the Fidelity funds, whether the Fidelity funds have appropriately benefited from such economies of scale, and whether there is potential for realization of any further economies of scale.
The Board recognized that the fund's management contract incorporates a "group fee" structure, which provides for lower group fee rates as total fund assets under FMR's management increase, and for higher group fee rates as total fund assets under FMR's management decrease. FMR calculates the group fee rates based on a tiered asset "breakpoint" schedule that varies based on asset class. The Board considered that the group fee is designed to deliver the benefits of economies of scale to fund shareholders when total Fidelity fund assets increase, even if assets of any particular fund are unchanged or have declined, because some portion of Fidelity's costs are attributable to services provided to all Fidelity funds, and all funds benefit if those costs can be allocated among more assets. The Board concluded that, given the group fee structure, fund shareholders will benefit from lower management fees as assets under FMR's management increase at the fund complex level, regardless of whether Fidelity achieves any such economies of scale.
Annual Report
Board Approval of Investment Advisory Contracts and
Management Fees - continued
The Board concluded, taking into account the analysis of the Economies of Scale Committee, that any potential economies of scale are being appropriately shared between fund shareholders and Fidelity.
Additional Information Requested by the Board. In order to develop fully the factual basis for consideration of the Fidelity funds' Advisory Contracts, the Board requested and received additional information on certain topics, including (i) fund performance trends, actions to be taken by FMR to improve certain funds' overall performance, and Fidelity's long-term strategies for certain funds; (ii) portfolio manager changes that have occurred during the past year and length of portfolio manager tenure for different categories of funds over time; (iii) Fidelity's compensation structure for portfolio managers and other key personnel and strategies for attracting and retaining non-investment personnel; (iv) the amount of the investment that each portfolio manager has made in the Fidelity fund(s) that he or she manages; (v) historical trends in Fidelity's realization of fall-out benefits; (vi) Fidelity's group fee structures and the rationale for the individual fee rates of certain funds; (vii) fund profitability methodology and the impact of certain factors on fund profitability results; (viii) trends regarding industry use of performance fee structures and Fidelity's compliance practices with respect to performance adjustment calculations; (ix) the fee structures in place for certain other Fidelity clients; and (x) explanations regarding the relative total expense ratios of certain funds and classes, total expense competitive trends, and actions that might be taken by FMR to reduce total expense ratios for certain funds and classes.
Based on its evaluation of all of the conclusions noted above, and after considering all factors it believed relevant, the Board ultimately concluded that the advisory fee structures are fair and reasonable, and that the fund's Advisory Contracts should be renewed.
Annual Report
Investment Adviser
Fidelity Management & Research Company
Boston, MA
Investment Sub-Advisers
FMR Co., Inc.
Fidelity Management &
Research (U.K.) Inc.
FIL Investments (Japan) Limited
FIL Investment Advisors
FIL Investment Advisors
(U.K.) Limited
Fidelity Management & Research
(Hong Kong) Limited
Fidelity Management & Research
(Japan) Inc.
General Distributor
Fidelity Distributors Corporation
Boston, MA
Transfer and Service Agents
Fidelity Investments Institutional
Operations Company, Inc.
Boston, MA
Fidelity Service Company, Inc.
Boston, MA
Custodian
State Street Bank and Trust Company
Quincy, MA
The Fidelity Telephone Connection
Mutual Fund 24-Hour Service
Exchanges/Redemptions
and Account Assistance 1-800-544-6666
Product Information 1-800-544-6666
Retirement Accounts 1-800-544-4774
(8 a.m. - 9 p.m.)
TDD Service 1-800-544-0118
for the deaf and hearing impaired
(9 a.m. - 9 p.m. Eastern time)
Fidelity Automated Service
Telephone (FAST®)(automated service graphic) 1-800-544-5555
(automated service graphic) Automated line for quickest service
(Fidelity Logo)
Corporate Headquarters
82 Devonshire St., Boston, MA 02109
www.fidelity.com
GCS-UANN-1211
1.879379.102
(Fidelity Logo)
Fidelity Advisor®
Global Commodity Stock
Fund - Class A, Class T, Class B
and Class C
Annual Report
October 31, 2011
(Fidelity Cover Art)
Class A, Class T, Class B,
and Class C are classes
of Fidelity® Global Commodity
Stock Fund
Contents
Chairman's Message | (Click Here) | The Chairman's message to shareholders. |
Performance | (Click Here) | How the fund has done over time. |
Management's Discussion of Fund Performance | (Click Here) | The Portfolio Manager's review of fund performance and strategy. |
Shareholder Expense Example | (Click Here) | An example of shareholder expenses. |
Investment Changes | (Click Here) | A summary of major shifts in the fund's investments over the past six months. |
Investments | (Click Here) | A complete list of the fund's investments with their market values. |
Financial Statements | (Click Here) | Statements of assets and liabilities, operations, and changes in net assets, as well as financial highlights. |
Notes | (Click Here) | Notes to the financial statements. |
Report of Independent Registered Public Accounting Firm | (Click Here) | |
Trustees and Officers | (Click Here) | |
Distributions | (Click Here) | |
Board Approval of Investment Advisory Contracts and Management Fees | (Click Here) | |
To view a fund's proxy voting guidelines and proxy voting record for the 12-month period ended June 30, visit http://www.fidelity.com/proxyvotingresults or visit the Securities and Exchange Commission's (SEC) web site at http://www.sec.gov. You may also call 1-877-208-0098 to request a free copy of the proxy voting guidelines.
Standard & Poor's, S&P and S&P 500 are registered service marks of The McGraw-Hill Companies, Inc. and have been licensed for use by Fidelity Distributors Corporation.
Other third party marks appearing herein are the property of their respective owners.
All other marks appearing herein are registered or unregistered trademarks or service marks of FMR LLC or an affiliated company.
Annual Report
This report and the financial statements contained herein are submitted for the general information of the shareholders of the fund. This report is not authorized for distribution to prospective investors in the fund unless preceded or accompanied by an effective prospectus.
A fund files its complete schedule of portfolio holdings with the SEC for the first and third quarters of each fiscal year on Form N-Q. Forms N-Q are available on the SEC's web site at http://www.sec.gov. A fund's Forms N-Q may be reviewed and copied at the SEC's Public Reference Room in Washington, DC. Information regarding the operation of the SEC's Public Reference Room may be obtained by calling 1-800-SEC-0330. For a complete list of a fund's portfolio holdings, view the most recent holdings listing, semiannual report, or annual report on Fidelity's web site at http://www.fidelity.com, http://www.advisor.fidelity.com, or http://www.401k.com, as applicable.
NOT FDIC INSURED • MAY LOSE VALUE • NO BANK GUARANTEE
Neither the fund nor Fidelity Distributors Corporation is a bank.
Annual Report
(Acting Chairman's Photograph)
Dear Shareholder:
Global equity markets began the fourth quarter on a strong note, sharply reversing course in October amid strong corporate earnings, better-than-expected economic news and the promise of a resolution to the sovereign debt crisis in Europe. The mini rally followed a third quarter marked by a significant downturn in July and August, which heightened investor anxiety and set off a wave of volatility that hampered most major asset classes through the end of September. Financial markets are difficult to predict, of course, but you can help put the odds in your favor by following these time-tested investment principles.
One of the basic tenets is to invest according to your time horizon. For long-term investors, riding out the markets' inevitable ups and downs has proven much more effective than making decisions based on short-term developments. If your goal is approaching, you can also benefit from patience and restraint, rather than attempting to time the market. No matter your time horizon, missing only a few of the markets' best days can significantly diminish returns. Patience also affords the benefits of compounding - earning interest on additional income or reinvested dividends and capital gains. While staying the course doesn't eliminate risk, it can considerably lessen the negative impact of short-term downturns.
Asset allocation is another principle to manage risk. As you spread your portfolio among the asset classes, be sure to consider your time horizon, risk tolerance and investment objectives. Younger investors may be better served by emphasizing equities, which historically have been the best-performing asset class over time. Investors who are nearing a specific goal, such as retirement or sending a child to college, may choose to favor bonds and other investments that have tended to be more stable. Studies indicate that asset allocation is the single most important determinant of a portfolio's long-term success. After deciding on a suitable allocation strategy, make sure your portfolio is adequately diversified, with exposure to stocks of small-, mid- and large-cap companies in a range of sectors, for example. And today, more than ever, geographic diversification should be taken into account.
Lastly, investing a certain amount of money on a regular basis - a principle known as dollar-cost averaging - can help lower the average cost of your purchases, while also giving you the discipline to avoid selling weak performers just prior to an upswing, or chasing a hot performer just before a correction.
We invite you to learn more by visiting us on the Internet, dropping by one of our Investor Centers or calling us by phone. It is our privilege to provide the resources you need to choose investments that are right for you.
Sincerely,
(Acting Chairman's Signature)
James C. Curvey
Acting Chairman
Annual Report
Average annual total return reflects the change in the value of an investment, assuming reinvestment of the class' distributions from dividend income and capital gains (the profits earned upon the sale of securities that have grown in value, if any) and assuming a constant rate of performance each year. The $10,000 table and the fund's returns do not reflect the deduction of taxes that a shareholder would pay on fund distributions or the redemption of fund shares. During periods of reimbursement by Fidelity, a fund's total return will be greater than it would be had the reimbursement not occurred. How a fund did yesterday is no guarantee of how it will do tomorrow.
Average Annual Total Returns
Periods ended October 31, 2011 | Past 1
year | Life of
fund A |
Class A (incl. 5.75% sales charge) | -7.45% | 15.40% |
Class T (incl. 3.50% sales charge) | -5.52% | 16.13% |
Class B (incl. contingent deferred sales charge) B | -7.47% | 16.23% |
Class C (incl. contingent deferred sales charge) C | -3.55% | 17.14% |
A From March 25, 2009.
B Class B shares' contingent deferred sales charges included in the past one year and life of fund total return figures are 5% and 3%, respectively.
C Class C shares' contingent deferred sales charges included in the past one year and life of fund total return figures are 1% and 0%, respectively.
Annual Report
$10,000 Over Life of Fund
Let's say hypothetically that $10,000 was invested in Fidelity Advisor® Global Commodity Stock Fund - Class A on March 25, 2009, when the fund started, and the current 5.75% sales charge was paid. The chart shows how the value of your investment would have changed, and also shows how the MSCI® ACWI® (All Country World Index) Index performed over the same period.
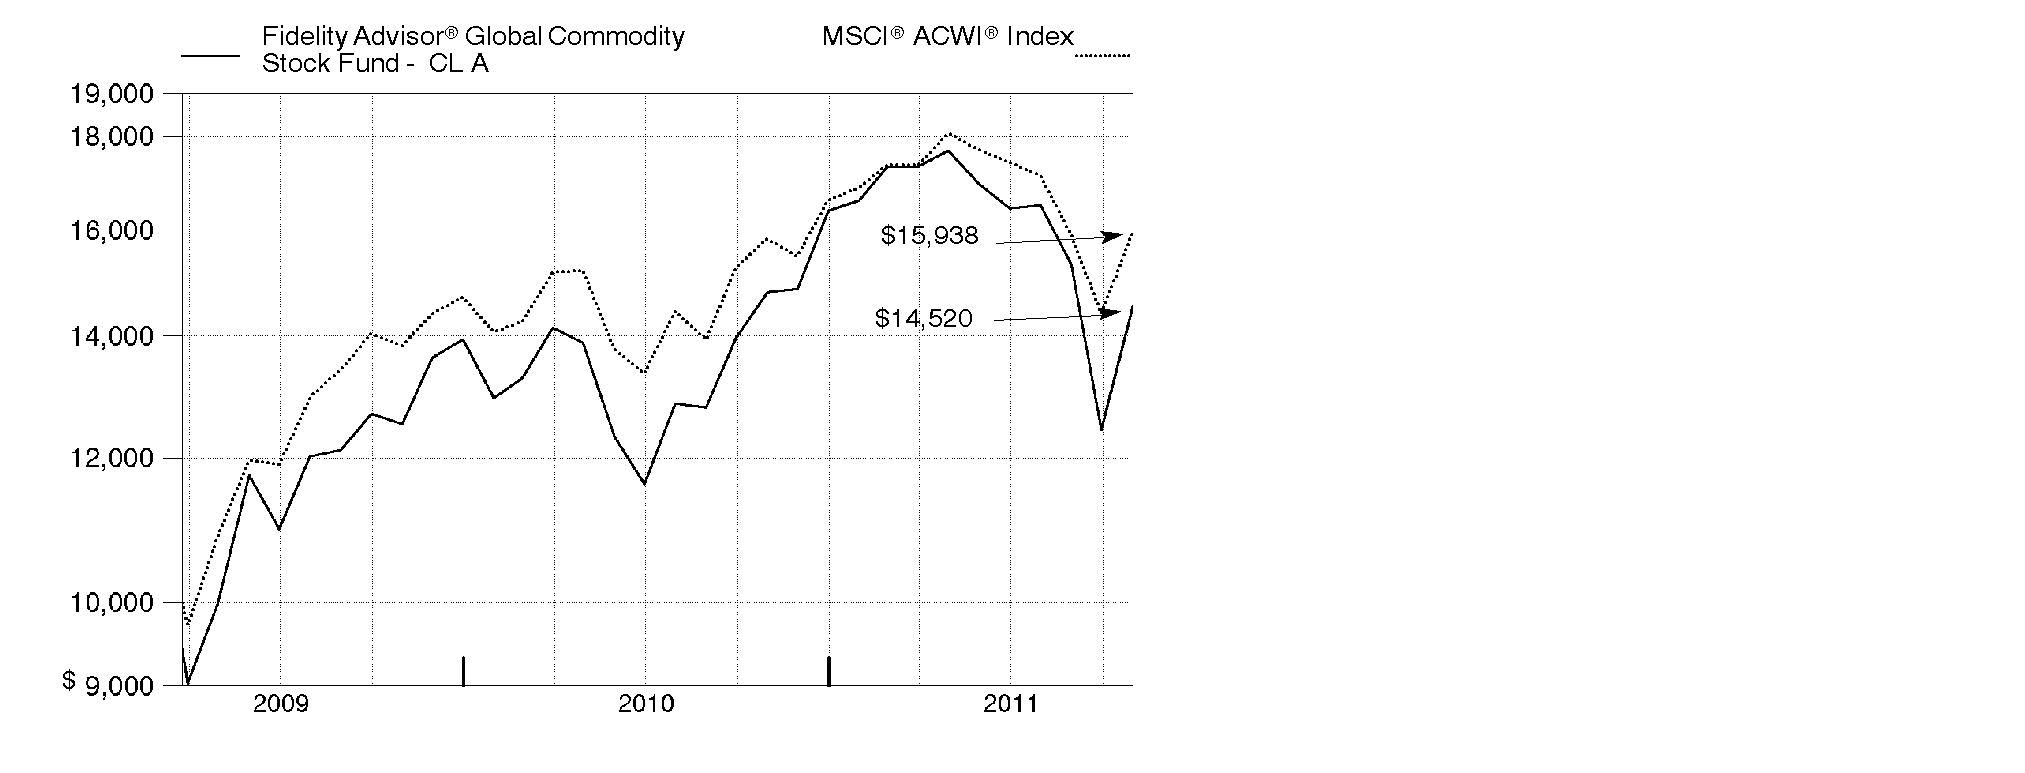
Annual Report
Market Recap: International equities were rocked by a number of headline events during the year ending October 31, 2011. Stocks posted a solid advance for the first half of the period, despite concern about the sovereign debt crisis in Europe, a devastating earthquake and tsunami in Japan, and political upheaval in the Middle East and North Africa. Sentiment turned decidedly negative in the second half, however, as fresh worries about Europe, inflation in China and a dimmed outlook for global growth caused foreign markets to suffer declines that intensified in August and September. October brought with it yet another dramatic swing, as eurozone policymakers appeared near a resolution to the debt debacle and buyers stormed back onto the scene in search of bargains. Still, those gains - along with favorable currency fluctuations overall - weren't enough to offset prior losses, and the MSCI® ACWI® (All Country World Index) ex USA Index finished the period down 4.56%. Within the MSCI index, Europe and emerging markets suffered the biggest declines, with many countries in these areas sustaining steep losses. By contrast, Japan showed resilience in the wake of its natural disasters, falling only 2%. Australia (+4%), Switzerland (+3%), the U.K. (+2%) and Canada, which produced a nominal return, were among the few major benchmark components to break into positive territory.
Comments from S. Joseph Wickwire II, Portfolio Manager of Fidelity Advisor® Global Commodity Stock Fund: For the year, the fund's Class A, Class T, Class B and Class C shares returned -1.80%, -2.09%, -2.62% and -2.58%, respectively (excluding sales charges), lagging the -1.10% result of the MSCI® ACWI® (All Country World Index) Commodity Producers Sector Capped Index. Stock picking in coal/consumable fuels and oil/gas exploration and production (E&P) detracted, as did positioning in integrated oil/gas. Detractors included coal-producer Alpha Natural Resources and Australian uranium company Paladin Energy. Underweightings in integrated oil/gas companies ConocoPhillips and Royal Dutch Shell and overweightings in E&P companies Niko Resources and Petrobank Energy & Resources also hurt. Conversely, the fund benefited from an overweighting in the outperforming gold group, including Barrick Gold and Newmont Mining. Oil/gas equipment and services stocks, such as ION Geophysical, Halliburton and C&J Energy Services also helped, as did oil/gas refining and marketing names CVR Energy, Frontier Oil, Tesoro, Holly and Valero Energy. Frontier Oil and Holly merged during the period. Several of the stocks I've mentioned were not in the index or were sold by period end.
The views expressed above reflect those of the portfolio manager(s) only through the end of the period as stated on the cover of this report and do not necessarily represent the views of Fidelity or any other person in the Fidelity organization. Any such views are subject to change at any time based upon market or other conditions and Fidelity disclaims any responsibility to update such views. These views may not be relied on as investment advice and, because investment decisions for a Fidelity fund are based on numerous factors, may not be relied on as an indication of trading intent on behalf of any Fidelity fund.
Annual Report
Shareholder Expense Example
As a shareholder of the Fund, you incur two types of costs: (1) transaction costs, including sales charges (loads) on purchase payments or redemption proceeds, redemption fees, and (2) ongoing costs, including management fees, distribution and/or service (12b-1) fees and other Fund expenses. This Example is intended to help you understand your ongoing costs (in dollars) of investing in the Fund and to compare these costs with the ongoing costs of investing in other mutual funds.
The Example is based on an investment of $1,000 invested at the beginning of the period and held for the entire period (May 1, 2011 to October 31, 2011).
Actual Expenses
The first line of the accompanying table for each class of the Fund provides information about actual account values and actual expenses. You may use the information in this line, together with the amount you invested, to estimate the expenses that you paid over the period. Simply divide your account value by $1,000.00 (for example, an $8,600 account value divided by $1,000.00 = 8.6), then multiply the result by the number in the first line for a class of the Fund under the heading entitled "Expenses Paid During Period" to estimate the expenses you paid on your account during this period. A small balance maintenance fee of $12.00 that is charged once a year may apply for certain accounts with a value of less than $2,000. This fee is not included in the table below. If it was, the estimate of expenses you paid during the period would be higher, and your ending account value lower, by this amount. In addition, the Fund, as a shareholder in the underlying Fidelity Central Funds, will indirectly bear its pro-rata share of the fees and expenses incurred by the underlying Fidelity Central Funds. These fees and expenses are not included in the Fund's annualized expense ratio used to calculate the expense estimate in the table below.
Hypothetical Example for Comparison Purposes
The second line of the accompanying table for each class of the Fund provides information about hypothetical account values and hypothetical expenses based on a Class' actual expense ratio and an assumed rate of return of 5% per year before expenses, which is not the Class' actual return. The hypothetical account values and expenses may not be used to estimate the actual ending account balance or expenses you paid for the period. You may use this information to compare the ongoing costs of investing in the Fund and other funds. To do so, compare this 5% hypothetical example with the 5% hypothetical examples that appear in the shareholder reports of the other funds. A small balance maintenance fee of $12.00 that is charged once a year may apply for certain accounts with a value of less than $2,000. This fee is not included in the table below. If it was, the estimate of expenses you paid during the period would be higher, and your ending account value lower, by this amount. In addition, the Fund, as a shareholder in the underlying Fidelity Central Funds, will indirectly bear its pro-rata share of the fees and expenses incurred by the underlying Fidelity Central Funds. These fees and expenses are not included in the Fund's annualized expense ratio used to calculate the expense estimate in the table below.
Please note that the expenses shown in the table are meant to highlight your ongoing costs only and do not reflect any transaction costs. Therefore, the second line of the table is useful in comparing ongoing costs only, and will not help you determine the relative total costs of owning different funds. In addition, if these transactional costs were included, your costs would have been higher.
Annual Report
| Annualized Expense Ratio | Beginning
Account Value
May 1, 2011 | Ending
Account Value
October 31, 2011 | Expenses Paid
During Period*
May 1, 2011 to
October 31, 2011 |
Class A | 1.31% | | | |
Actual | | $ 1,000.00 | $ 821.50 | $ 6.01 |
HypotheticalA | | $ 1,000.00 | $ 1,018.60 | $ 6.67 |
Class T | 1.60% | | | |
Actual | | $ 1,000.00 | $ 820.00 | $ 7.34 |
HypotheticalA | | $ 1,000.00 | $ 1,017.14 | $ 8.13 |
Class B | 2.09% | | | |
Actual | | $ 1,000.00 | $ 817.90 | $ 9.58 |
HypotheticalA | | $ 1,000.00 | $ 1,014.67 | $ 10.61 |
Class C | 2.09% | | | |
Actual | | $ 1,000.00 | $ 817.80 | $ 9.58 |
HypotheticalA | | $ 1,000.00 | $ 1,014.67 | $ 10.61 |
Global Commodity Stock | 1.06% | | | |
Actual | | $ 1,000.00 | $ 822.20 | $ 4.87 |
HypotheticalA | | $ 1,000.00 | $ 1,019.86 | $ 5.40 |
Institutional Class | 1.02% | | | |
Actual | | $ 1,000.00 | $ 822.70 | $ 4.69 |
HypotheticalA | | $ 1,000.00 | $ 1,020.06 | $ 5.19 |
A 5% return per year before expenses
* Expenses are equal to each Class' annualized expense ratio, multiplied by the average account value over the period, multiplied by 184/365 (to reflect the one-half year period).
Annual Report
Investment Changes (Unaudited)
Top Ten Stocks as of October 31, 2011 |
| % of fund's
net assets | % of fund's net assets
6 months ago |
Exxon Mobil Corp. | 5.3 | 4.9 |
BHP Billiton PLC | 5.0 | 5.1 |
Potash Corp. of Saskatchewan, Inc. | 4.1 | 3.8 |
Royal Dutch Shell PLC Class A (United Kingdom) | 3.1 | 2.8 |
Chevron Corp. | 2.9 | 2.4 |
Syngenta AG (Switzerland) | 2.8 | 2.3 |
Rio Tinto PLC | 2.7 | 3.1 |
Monsanto Co. | 2.6 | 1.7 |
Goldcorp, Inc. | 2.0 | 1.2 |
Barrick Gold Corp. | 2.0 | 1.3 |
| 32.5 | |
Top Sectors (% of fund's net assets) |
As of October 31, 2011 |
| Energy 37.9% | |
| Metals 31.8% | |
| Agriculture 22.8% | |
| Other 6.2% | |
| Short-Term
Investments and
Net Other Assets 1.3% | |

As of April 30, 2011 |
| Energy 36.2% | |
| Metals 34.3% | |
| Agriculture 23.8% | |
| Other 5.2% | |
| Short-Term
Investments and
Net Other Assets 0.5% | |

Annual Report
Investments October 31, 2011
Showing Percentage of Net Assets
Common Stocks - 98.7% |
| Shares | | Value |
CHEMICALS - 18.0% |
Commodity Chemicals - 0.0% |
Braskem SA (PN-A) | 26,500 | | $ 236,111 |
Grasim Industries Ltd. | 734 | | 38,980 |
| | 275,091 |
Fertilizers & Agricultural Chemicals - 17.9% |
Agrium, Inc. | 121,200 | | 9,991,690 |
CF Industries Holdings, Inc. | 58,772 | | 9,536,932 |
China Bluechemical Ltd. (H shares) | 1,122,000 | | 879,234 |
Incitec Pivot Ltd. | 411,186 | | 1,489,514 |
Israel Chemicals Ltd. | 443,600 | | 5,337,885 |
Israel Corp. Ltd. (Class A) | 1,000 | | 736,552 |
K&S AG | 129,907 | | 8,268,903 |
Monsanto Co. | 278,300 | | 20,246,325 |
Potash Corp. of Saskatchewan, Inc. | 669,700 | | 31,696,289 |
Sinofert Holdings Ltd. | 2,060,000 | | 676,070 |
Sociedad Quimica y Minera de Chile SA (PN-B) sponsored ADR | 8,400 | | 491,400 |
Syngenta AG (Switzerland) | 72,182 | | 22,001,638 |
Taiwan Fertilizer Co. Ltd. | 161,000 | | 414,969 |
The Mosaic Co. | 242,300 | | 14,189,088 |
United Phosphorous Ltd. | 66,056 | | 197,668 |
Uralkali JSC GDR (Reg. S) | 137,900 | | 5,984,860 |
Yara International ASA | 153,500 | | 7,311,624 |
| | 139,450,641 |
Specialty Chemicals - 0.1% |
LyondellBasell Industries NV Class A | 13,700 | | 450,182 |
OMNOVA Solutions, Inc. (a) | 113,301 | | 501,923 |
| | 952,105 |
TOTAL CHEMICALS | | 140,677,837 |
CONSTRUCTION & ENGINEERING - 1.4% |
Construction & Engineering - 1.4% |
Fluor Corp. | 59,100 | | 3,359,835 |
Foster Wheeler AG (a) | 302,700 | | 6,453,564 |
Shaw Group, Inc. (a) | 36,300 | | 844,338 |
| | 10,657,737 |
CONTAINERS & PACKAGING - 0.4% |
Paper Packaging - 0.4% |
Greatview Aseptic Pack Co. Ltd. | 2,810,000 | | 1,043,465 |
Common Stocks - continued |
| Shares | | Value |
CONTAINERS & PACKAGING - CONTINUED |
Paper Packaging - continued |
Rock-Tenn Co. Class A | 18,900 | | $ 1,118,691 |
Smurfit Kappa Group PLC (a) | 98,000 | | 678,247 |
| | 2,840,403 |
DIVERSIFIED FINANCIAL SERVICES - 0.0% |
Other Diversified Financial Services - 0.0% |
Polymetal International PLC | 1,350 | | 19,974 |
ELECTRICAL EQUIPMENT - 0.4% |
Electrical Components & Equipment - 0.4% |
Regal-Beloit Corp. | 59,202 | | 3,145,402 |
ENERGY EQUIPMENT & SERVICES - 5.3% |
Oil & Gas Drilling - 2.9% |
Cathedral Energy Services Ltd. | 96,370 | | 647,719 |
Ensco International Ltd. ADR | 16,700 | | 829,322 |
Helmerich & Payne, Inc. | 2,000 | | 106,360 |
Nabors Industries Ltd. (a) | 43,100 | | 790,023 |
Noble Corp. | 66,700 | | 2,397,198 |
PHX Energy Services Corp. | 3,600 | | 37,017 |
Transocean Ltd. (United States) | 212,800 | | 12,161,520 |
Trinidad Drilling Ltd. | 302,171 | | 2,364,382 |
Tuscany International Drilling, Inc. (a) | 415,000 | | 283,092 |
Unit Corp. (a) | 4,400 | | 215,864 |
Vantage Drilling Co. (a) | 2,135,982 | | 2,904,936 |
| | 22,737,433 |
Oil & Gas Equipment & Services - 2.4% |
Aker Solutions ASA | 67,800 | | 788,500 |
Baker Hughes, Inc. | 37,080 | | 2,150,269 |
Cal Dive International, Inc. (a) | 87,700 | | 196,448 |
Cameron International Corp. (a) | 700 | | 34,398 |
Compagnie Generale de Geophysique SA (a) | 81,600 | | 1,783,169 |
Halliburton Co. | 83,500 | | 3,119,560 |
ION Geophysical Corp. (a) | 1,237,600 | | 9,430,512 |
McDermott International, Inc. (a) | 17,500 | | 192,150 |
Saipem SpA | 18,781 | | 842,109 |
Schlumberger Ltd. | 700 | | 51,429 |
| | 18,588,544 |
TOTAL ENERGY EQUIPMENT & SERVICES | | 41,325,977 |
Common Stocks - continued |
| Shares | | Value |
FOOD PRODUCTS - 3.4% |
Agricultural Products - 3.4% |
Archer Daniels Midland Co. | 502,800 | | $ 14,551,032 |
Bunge Ltd. | 113,500 | | 7,010,895 |
Chaoda Modern Agriculture (Holdings) Ltd. | 2,320,000 | | 328,493 |
China Agri-Industries Holding Ltd. | 1,295,000 | | 1,032,374 |
Corn Products International, Inc. | 6,400 | | 310,400 |
Cosan Ltd. Class A | 66,400 | | 796,800 |
Golden Agri-Resources Ltd. | 1,700,000 | | 869,958 |
PT Charoen Pokphand Indonesia Tbk | 85,000 | | 25,312 |
Suedzucker AG (Bearer) | 1,100 | | 32,265 |
Viterra, Inc. | 9,900 | | 101,895 |
Wilmar International Ltd. | 273,000 | | 1,178,344 |
| | 26,237,768 |
MACHINERY - 1.6% |
Construction & Farm Machinery & Heavy Trucks - 1.6% |
Caterpillar, Inc. | 2,800 | | 264,488 |
Cummins, Inc. | 11,200 | | 1,113,616 |
Fiat Industrial SpA (a) | 817,500 | | 7,133,088 |
Jain Irrigation Systems Ltd. | 1,197,816 | | 3,052,091 |
Joy Global, Inc. | 8,900 | | 776,080 |
| | 12,339,363 |
Industrial Machinery - 0.0% |
Sandvik AB | 32,000 | | 442,485 |
TOTAL MACHINERY | | 12,781,848 |
METALS & MINING - 31.8% |
Aluminum - 0.3% |
Alcoa, Inc. | 204,400 | | 2,199,344 |
Diversified Metals & Mining - 13.7% |
Anglo American PLC (United Kingdom) | 276,251 | | 10,189,260 |
Antofagasta PLC | 1,100 | | 20,644 |
BHP Billiton PLC | 1,228,316 | | 38,686,256 |
Copper Mountain Mining Corp. (a) | 721,400 | | 3,849,975 |
Eurasian Natural Resources Corp. PLC | 31,500 | | 333,332 |
First Quantum Minerals Ltd. | 158,500 | | 3,324,708 |
Freeport-McMoRan Copper & Gold, Inc. | 209,500 | | 8,434,470 |
Glencore International PLC (e) | 5,300 | | 37,333 |
Grupo Mexico SA de CV Series B | 89,182 | | 247,792 |
Iluka Resources Ltd. | 10,483 | | 174,293 |
Common Stocks - continued |
| Shares | | Value |
METALS & MINING - CONTINUED |
Diversified Metals & Mining - continued |
Ivanhoe Australia Ltd. (a) | 478,448 | | $ 532,063 |
Ivanhoe Mines Ltd. (a) | 84,540 | | 1,730,066 |
Kazakhmys PLC | 116,700 | | 1,740,704 |
Lynas Corp. Ltd. (a) | 385,000 | | 476,413 |
Major Drilling Group International, Inc. | 3,600 | | 48,140 |
Mitsubishi Materials Corp. | 123,000 | | 326,992 |
OJSC MMC Norilsk Nickel sponsored ADR | 1,700 | | 32,725 |
Rio Tinto PLC | 382,987 | | 20,723,044 |
Sterlite Industries (India) Ltd. | 148,488 | | 384,181 |
Sumitomo Metal Mining Co. Ltd. | 101,000 | | 1,390,494 |
Teck Resources Ltd. Class B (sub. vtg.) | 118,800 | | 4,762,249 |
Vedanta Resources PLC | 3,500 | | 71,935 |
Walter Energy, Inc. | 22,800 | | 1,724,820 |
Xstrata PLC | 480,391 | | 8,077,165 |
| | 107,319,054 |
Gold - 11.0% |
Agnico-Eagle Mines Ltd. (Canada) | 109,400 | | 4,745,404 |
AngloGold Ashanti Ltd. sponsored ADR | 147,800 | | 6,682,038 |
Barrick Gold Corp. | 320,500 | | 15,821,643 |
Centerra Gold, Inc. | 33,200 | | 658,105 |
Compania de Minas Buenaventura SA sponsored ADR | 39,300 | | 1,608,549 |
Eldorado Gold Corp. | 117,400 | | 2,205,850 |
Franco-Nevada Corp. | 7,300 | | 289,188 |
Gold Fields Ltd. sponsored ADR | 167,100 | | 2,912,553 |
Goldcorp, Inc. | 325,700 | | 15,846,366 |
Harmony Gold Mining Co. Ltd. sponsored ADR | 158,500 | | 2,081,105 |
IAMGOLD Corp. | 85,100 | | 1,829,456 |
Kingsgate Consolidated NL | 309,515 | | 2,440,465 |
Kinross Gold Corp. | 482,005 | | 6,870,934 |
Kinross Gold Corp. warrants 9/17/14 (a) | 2,772 | | 6,729 |
New Gold, Inc. (a) | 38,800 | | 480,694 |
Newcrest Mining Ltd. | 212,457 | | 7,509,335 |
Newmont Mining Corp. | 132,000 | | 8,821,560 |
Osisko Mining Corp. (a) | 65,500 | | 789,798 |
Randgold Resources Ltd. sponsored ADR | 20,100 | | 2,202,357 |
Yamana Gold, Inc. | 137,700 | | 2,055,451 |
| | 85,857,580 |
Precious Metals & Minerals - 1.2% |
African Minerals Ltd. (a) | 521,600 | | 3,705,563 |
Anglo Platinum Ltd. | 11,100 | | 803,447 |
Common Stocks - continued |
| Shares | | Value |
METALS & MINING - CONTINUED |
Precious Metals & Minerals - continued |
Aquarius Platinum Ltd. (United Kingdom) | 147,000 | | $ 439,714 |
Impala Platinum Holdings Ltd. | 14,300 | | 330,567 |
Lonmin PLC | 10,422 | | 182,356 |
Northam Platinum Ltd. | 30,500 | | 118,175 |
Pan American Silver Corp. | 19,600 | | 548,016 |
Silver Standard Resources, Inc. (a) | 37,500 | | 734,625 |
Silver Wheaton Corp. | 73,400 | | 2,534,411 |
| | 9,396,874 |
Steel - 5.6% |
Allegheny Technologies, Inc. | 26,800 | | 1,243,520 |
ArcelorMittal SA Class A unit (e) | 166,200 | | 3,445,326 |
BlueScope Steel Ltd. | 338,804 | | 296,424 |
China Steel Corp. | 1,160,260 | | 1,154,352 |
Cliffs Natural Resources, Inc. | 31,300 | | 2,135,286 |
Fortescue Metals Group Ltd. | 706,010 | | 3,546,514 |
Gerdau SA sponsored ADR | 194,200 | | 1,751,684 |
Hyundai Steel Co. | 2,003 | | 181,084 |
JFE Holdings, Inc. | 41,600 | | 791,856 |
Jindal Steel & Power Ltd. | 91,751 | | 1,051,587 |
JSW Steel Ltd. | 14,016 | | 187,130 |
Kobe Steel Ltd. | 160,000 | | 267,628 |
London Mining PLC (a) | 75,300 | | 386,604 |
Maanshan Iron & Steel Ltd. (H Shares) | 4,285,000 | | 1,275,767 |
Magnitogorsk Iron & Steel Works OJSC unit | 47,700 | | 295,502 |
Nippon Steel Corp. | 196,000 | | 511,080 |
Nucor Corp. | 900 | | 34,002 |
OneSteel Ltd. | 396,960 | | 504,893 |
POSCO | 11,540 | | 3,983,560 |
Reliance Steel & Aluminum Co. | 19,000 | | 839,610 |
Tata Steel Ltd. | 53,417 | | 526,019 |
Ternium SA sponsored ADR | 10,900 | | 267,486 |
Thyssenkrupp AG | 69,200 | | 1,997,197 |
United States Steel Corp. (e) | 28,800 | | 730,368 |
Usinas Siderurgicas de Minas Gerais SA - Usiminas (PN-A) (non-vtg.) | 37,700 | | 259,061 |
Vale SA (PN-A) sponsored ADR (e) | 631,200 | | 14,896,320 |
Common Stocks - continued |
| Shares | | Value |
METALS & MINING - CONTINUED |
Steel - continued |
Voestalpine AG | 16,400 | | $ 567,399 |
Yamato Kogyo Co. Ltd. | 9,100 | | 230,210 |
| | 43,357,469 |
TOTAL METALS & MINING | | 248,130,321 |
OIL, GAS & CONSUMABLE FUELS - 32.6% |
Coal & Consumable Fuels - 1.9% |
Alpha Natural Resources, Inc. (a) | 280,237 | | 6,736,897 |
Arch Coal, Inc. | 10,800 | | 196,776 |
Banpu PCL (For. Reg.) | 8,950 | | 181,688 |
Bumi PLC | 12,573 | | 149,627 |
China Coal Energy Co. Ltd. (H Shares) | 61,000 | | 75,977 |
CONSOL Energy, Inc. | 2,200 | | 94,072 |
Paladin Energy Ltd.: | | | |
(Australia) (a) | 731,842 | | 1,117,722 |
(Canada) (a) | 271,500 | | 424,878 |
Peabody Energy Corp. | 108,800 | | 4,718,656 |
Uranium One, Inc. | 424,900 | | 1,278,728 |
| | 14,975,021 |
Integrated Oil & Gas - 22.3% |
BG Group PLC | 366,250 | | 7,989,829 |
BP PLC | 1,946,900 | | 14,329,588 |
Cenovus Energy, Inc. | 4,700 | | 160,965 |
Chevron Corp. | 215,100 | | 22,596,255 |
China Petroleum & Chemical Corp. (H Shares) | 359,000 | | 339,517 |
ConocoPhillips | 88,700 | | 6,177,955 |
ENI SpA | 248,427 | | 5,492,003 |
Exxon Mobil Corp. | 530,061 | | 41,392,467 |
Gazprom OAO sponsored ADR | 575,000 | | 6,675,750 |
Hess Corp. | 52,800 | | 3,303,168 |
Imperial Oil Ltd. | 600 | | 24,846 |
InterOil Corp. (a)(e) | 84,400 | | 4,009,844 |
Lukoil Oil Co. sponsored ADR | 39,900 | | 2,302,230 |
Murphy Oil Corp. | 14,500 | | 802,865 |
Occidental Petroleum Corp. | 90,000 | | 8,364,600 |
Origin Energy Ltd. | 121,659 | | 1,833,505 |
Petroleo Brasileiro SA - Petrobras (PN) sponsored ADR (e) | 431,500 | | 10,912,635 |
PTT PCL (For. Reg.) | 3,100 | | 30,539 |
Repsol YPF SA | 60,117 | | 1,821,991 |
Common Stocks - continued |
| Shares | | Value |
OIL, GAS & CONSUMABLE FUELS - CONTINUED |
Integrated Oil & Gas - continued |
Royal Dutch Shell PLC Class A (United Kingdom) | 673,450 | | $ 23,861,212 |
Suncor Energy, Inc. | 208,432 | | 6,638,628 |
Total SA | 89,955 | | 4,694,282 |
| | 173,754,674 |
Oil & Gas Exploration & Production - 7.4% |
Anadarko Petroleum Corp. | 58,700 | | 4,607,950 |
Apache Corp. | 65,500 | | 6,525,765 |
Cabot Oil & Gas Corp. | 13,600 | | 1,056,992 |
Cairn Energy PLC (a) | 91,316 | | 432,633 |
Canadian Natural Resources Ltd. | 164,500 | | 5,802,097 |
Chesapeake Energy Corp. | 75,100 | | 2,111,812 |
Cimarex Energy Co. | 13,900 | | 889,600 |
CNOOC Ltd. | 120,000 | | 226,843 |
CNOOC Ltd. sponsored ADR | 16,000 | | 3,017,760 |
Concho Resources, Inc. (a) | 3,500 | | 331,520 |
Denbury Resources, Inc. (a) | 41,000 | | 643,700 |
Devon Energy Corp. | 17,100 | | 1,110,645 |
Double Eagle Petroleum Co. (a) | 94,370 | | 838,006 |
Encana Corp. | 1,000 | | 21,688 |
EOG Resources, Inc. | 3,600 | | 321,948 |
EXCO Resources, Inc. | 43,800 | | 552,318 |
Gran Tierra Energy, Inc. (Canada) (a) | 7,600 | | 46,583 |
INPEX Corp. | 23 | | 151,867 |
Japan Petroleum Exploration Co. Ltd. | 30,000 | | 1,185,050 |
Marathon Oil Corp. | 77,300 | | 2,012,119 |
Newfield Exploration Co. (a) | 13,700 | | 551,562 |
Nexen, Inc. | 70,200 | | 1,192,242 |
Niko Resources Ltd. | 39,100 | | 2,150,628 |
Noble Energy, Inc. | 16,000 | | 1,429,440 |
Northern Oil & Gas, Inc. (a)(e) | 227,900 | | 5,508,343 |
NOVATEK OAO GDR | 2,000 | | 280,800 |
Oasis Petroleum, Inc. (a) | 500 | | 14,670 |
OGX Petroleo e Gas Participacoes SA (a) | 155,900 | | 1,289,180 |
Pacific Rubiales Energy Corp. | 3,400 | | 79,266 |
Painted Pony Petroleum Ltd. (a)(f) | 15,000 | | 183,428 |
Painted Pony Petroleum Ltd. Class A (a) | 24,500 | | 299,599 |
PetroBakken Energy Ltd. Class A (e) | 7,748 | | 70,574 |
Petrobank Energy & Resources Ltd. | 83,900 | | 754,961 |
Petrominerales Ltd. | 16,526 | | 436,007 |
Pioneer Natural Resources Co. | 11,500 | | 964,850 |
Common Stocks - continued |
| Shares | | Value |
OIL, GAS & CONSUMABLE FUELS - CONTINUED |
Oil & Gas Exploration & Production - continued |
PTT Exploration and Production PCL (For. Reg.) | 6,500 | | $ 33,691 |
QEP Resources, Inc. | 31,600 | | 1,123,380 |
Santos Ltd. | 19,000 | | 256,631 |
Southwestern Energy Co. (a) | 40,600 | | 1,706,824 |
Stone Energy Corp. (a) | 12,900 | | 313,341 |
Talisman Energy, Inc. | 410,100 | | 5,817,138 |
Tullow Oil PLC | 1,600 | | 36,101 |
Ultra Petroleum Corp. (a) | 15,900 | | 506,574 |
Whiting Petroleum Corp. (a) | 12,500 | | 581,875 |
Woodside Petroleum Ltd. | 14,001 | | 533,168 |
| | 58,001,169 |
Oil & Gas Refining & Marketing - 0.9% |
CVR Energy, Inc. (a) | 21,200 | | 524,912 |
Marathon Petroleum Corp. | 95,700 | | 3,435,630 |
Tesoro Corp. (a) | 600 | | 15,564 |
Valero Energy Corp. | 110,900 | | 2,728,140 |
Western Refining, Inc. (a)(e) | 600 | | 9,588 |
| | 6,713,834 |
Oil & Gas Storage & Transport - 0.1% |
Atlas Pipeline Partners, LP | 22,600 | | 786,480 |
TOTAL OIL, GAS & CONSUMABLE FUELS | | 254,231,178 |
PAPER & FOREST PRODUCTS - 1.5% |
Forest Products - 0.1% |
China Forestry Holdings Co. Ltd. (a) | 3,302,000 | | 626,924 |
Duratex SA | 39,000 | | 211,216 |
| | 838,140 |
Paper Products - 1.4% |
Empresas CMPC SA | 848,910 | | 3,534,599 |
Fibria Celulose SA sponsored ADR (e) | 149,889 | | 1,329,515 |
International Paper Co. | 2,300 | | 63,710 |
MeadWestvaco Corp. | 1,000 | | 27,910 |
Nine Dragons Paper (Holdings) Ltd. | 854,000 | | 581,353 |
Nippon Paper Group, Inc. (e) | 34,400 | | 788,501 |
Oji Paper Co. Ltd. | 110,000 | | 544,158 |
Sappi Ltd. (a) | 24,704 | | 72,528 |
Stora Enso Oyj (R Shares) | 298,300 | | 1,898,134 |
Suzano Papel e Celulose SA | 38,725 | | 189,430 |
Common Stocks - continued |
| Shares | | Value |
PAPER & FOREST PRODUCTS - CONTINUED |
Paper Products - continued |
Svenska Cellulosa AB (SCA) (B Shares) | 41,900 | | $ 612,476 |
UPM-Kymmene Corp. | 130,200 | | 1,527,958 |
| | 11,170,272 |
TOTAL PAPER & FOREST PRODUCTS | | 12,008,412 |
REAL ESTATE INVESTMENT TRUSTS - 0.0% |
Specialized REITs - 0.0% |
Weyerhaeuser Co. | 1,685 | | 30,296 |
SPECIALTY RETAIL - 0.3% |
Specialty Stores - 0.3% |
Tsutsumi Jewelry Co. Ltd. | 95,500 | | 2,225,649 |
TRADING COMPANIES & DISTRIBUTORS - 2.0% |
Trading Companies & Distributors - 2.0% |
Marubeni Corp. | 448,000 | | 2,607,949 |
Mitsubishi Corp. | 276,900 | | 5,695,721 |
Noble Group Ltd. | 6,162,090 | | 7,521,210 |
| | 15,824,880 |
TOTAL COMMON STOCKS (Cost $788,765,973) | 770,137,682 |
Convertible Bonds - 0.0% |
| Principal Amount (d) | | |
PAPER & FOREST PRODUCTS - 0.0% |
Paper Products - 0.0% |
Suzano Papel e Celulose SA 4.5% 12/16/13
(Cost $377,129) | BRL | 572,000 | | 316,612 |
Money Market Funds - 4.7% |
| Shares | | Value |
Fidelity Cash Central Fund, 0.12% (b) | 2,670,024 | | $ 2,670,024 |
Fidelity Securities Lending Cash Central Fund, 0.11% (b)(c) | 33,626,672 | | 33,626,672 |
TOTAL MONEY MARKET FUNDS (Cost $36,296,696) | 36,296,696 |
TOTAL INVESTMENT PORTFOLIO - 103.4% (Cost $825,439,798) | 806,750,990 |
NET OTHER ASSETS (LIABILITIES) - (3.4)% | (26,283,091) |
NET ASSETS - 100% | $ 780,467,899 |
Currency Abbreviations |
BRL | - | Brazilian real |
Legend |
(a) Non-income producing |
(b) Affiliated fund that is available only to investment companies and other accounts managed by Fidelity Investments. The rate quoted is the annualized seven-day yield of the fund at period end. A complete unaudited listing of the fund's holdings as of its most recent quarter end is available upon request. In addition, each Fidelity Central Fund's financial statements, which are not covered by the Fund's Report of Independent Registered Public Accounting Firm, are available on the SEC's website or upon request. |
(c) Investment made with cash collateral received from securities on loan. |
(d) Principal amount is stated in United States dollars unless otherwise noted. |
(e) Security or a portion of the security is on loan at period end. |
(f) Security exempt from registration under Rule 144A of the Securities Act of 1933. These securities may be resold in transactions exempt from registration, normally to qualified institutional buyers. At the end of the period, the value of these securities amounted to $183,428 or 0.0% of net assets. |
Affiliated Central Funds |
Information regarding fiscal year to date income earned by the Fund from investments in Fidelity Central Funds is as follows: |
Fund | Income earned |
Fidelity Cash Central Fund | $ 15,302 |
Fidelity Securities Lending Cash Central Fund | 351,340 |
Total | $ 366,642 |
Other Information |
The following is a summary of the inputs used, as of October 31, 2011, involving the Fund's assets and liabilities carried at fair value. The inputs or methodology used for valuing securities may not be an indication of the risk associated with investing in those securities. For more information on valuation inputs, and their aggregation into the levels used in the tables below, please refer to the Security Valuation section in the accompanying Notes to Financial Statements. |
Valuation Inputs at Reporting Date: |
Description | Total | Level 1 | Level 2 | Level 3 |
Investments in Securities: | | | | |
Common Stocks | $ 770,137,682 | $ 573,040,015 | $ 196,142,250 | $ 955,417 |
Convertible Bonds | 316,612 | - | - | 316,612 |
Money Market Funds | 36,296,696 | 36,296,696 | - | - |
Total Investments in Securities: | $ 806,750,990 | $ 609,336,711 | $ 196,142,250 | $ 1,272,029 |
The following is a reconciliation of Investments in Securities for which Level 3 inputs were used in determining value: |
Investments in Securities: | |
Beginning Balance | $ - |
Total Realized Gain (Loss) | (399,873) |
Total Unrealized Gain (Loss) | (2,251,071) |
Cost of Purchases | 3,323,106 |
Proceeds of Sales | (353,517) |
Amortization/Accretion | - |
Transfers in to Level 3 | 953,384 |
Transfers out of Level 3 | - |
Ending Balance | $ 1,272,029 |
The change in unrealized gain (loss) for the period attributable to Level 3 securities held at October 31, 2011 | $ (2,251,071) |
The information used in the above reconciliation represents fiscal year to date activity for any Investments in Securities identified as using Level 3 inputs at either the beginning or the end of the current fiscal period. Transfers in or out of Level 3 represent the beginning value of any Security or Instrument where a change in the pricing level occurred from the beginning to the end of the period. The cost of purchases and the proceeds of sales may include securities received or delivered through corporate actions or exchanges. Realized and unrealized gains (losses) disclosed in the reconciliation are included in Net Gain (Loss) on the Fund's Statement of Operations. |
Distribution of investments by country of issue, as a percentage of total net assets, is as follows: (Unaudited) |
United States of America | 33.0% |
Canada | 18.5% |
United Kingdom | 16.4% |
Switzerland | 5.5% |
Brazil | 3.9% |
Australia | 2.8% |
Bermuda | 2.7% |
Japan | 2.1% |
Russia | 2.0% |
Italy | 1.7% |
South Africa | 1.6% |
Germany | 1.4% |
Norway | 1.0% |
Others (Individually Less Than 1%) | 7.4% |
| 100.0% |
Income Tax Information |
At October 31, 2011, the Fund had a capital loss carryforward of approximately $6,966,394 all of which will expire in fiscal 2019. Capital loss carryforwards are only available to offset future capital gains of the Fund to the extent provided by regulations and may be limited. |
See accompanying notes which are an integral part of the financial statements.
Annual Report
Statement of Assets and Liabilities
| October 31, 2011 |
Assets | | |
Investment in securities, at value (including securities loaned of $31,452,952) - See accompanying schedule: Unaffiliated issuers (cost $789,143,102) | $ 770,454,294 | |
Fidelity Central Funds (cost $36,296,696) | 36,296,696 | |
Total Investments (cost $825,439,798) | | $ 806,750,990 |
Foreign currency held at value (cost $4,098,833) | | 3,857,396 |
Receivable for investments sold | | 13,143,082 |
Receivable for fund shares sold | | 1,319,439 |
Dividends receivable | | 819,567 |
Interest receivable | | 13,133 |
Distributions receivable from Fidelity Central Funds | | 26,123 |
Prepaid expenses | | 4,397 |
Other receivables | | 22,094 |
Total assets | | 825,956,221 |
| | |
Liabilities | | |
Payable for investments purchased | $ 8,978,037 | |
Payable for fund shares redeemed | 2,105,156 | |
Accrued management fee | 436,053 | |
Distribution and service plan fees payable | 65,847 | |
Other affiliated payables | 214,270 | |
Other payables and accrued expenses | 62,287 | |
Collateral on securities loaned, at value | 33,626,672 | |
Total liabilities | | 45,488,322 |
| | |
Net Assets | | $ 780,467,899 |
Net Assets consist of: | | |
Paid in capital | | $ 809,500,953 |
Undistributed net investment income | | 2,852,890 |
Accumulated undistributed net realized gain (loss) on investments and foreign currency transactions | | (12,954,172) |
Net unrealized appreciation (depreciation) on investments and assets and liabilities in foreign currencies | | (18,931,772) |
Net Assets | | $ 780,467,899 |
See accompanying notes which are an integral part of the financial statements.
Annual Report
Financial Statements - continued
Statement of Assets and Liabilities - continued
| October 31, 2011 |
| | |
Calculation of Maximum Offering Price Class A:
Net Asset Value and redemption price per share ($127,978,760 ÷ 8,452,805 shares) | | $ 15.14 |
| | |
Maximum offering price per share (100/94.25 of $15.14) | | $ 16.06 |
Class T:
Net Asset Value and redemption price per share ($20,831,272 ÷ 1,380,984 shares) | | $ 15.08 |
| | |
Maximum offering price per share (100/96.50 of $15.08) | | $ 15.63 |
Class B:
Net Asset Value and offering price per share ($4,323,549 ÷ 288,202 shares)A | | $ 15.00 |
| | |
Class C:
Net Asset Value and offering price per share ($37,184,669 ÷ 2,486,493 shares)A | | $ 14.95 |
| | |
| | |
Global Commodity Stock:
Net Asset Value, offering price and redemption price per share ($531,224,376 ÷ 34,921,133 shares) | | $ 15.21 |
| | |
Institutional Class:
Net Asset Value, offering price and redemption price per share ($58,925,273 ÷ 3,872,564 shares) | | $ 15.22 |
A Redemption price per share is equal to net asset value less any applicable contingent deferred sales charge.
See accompanying notes which are an integral part of the financial statements.
Annual Report
Statement of Operations
| Year ended October 31, 2011 |
Investment Income | | |
Dividends | | $ 16,946,155 |
Interest | | 5,904 |
Income from Fidelity Central Funds | | 366,642 |
Income before foreign taxes withheld | | 17,318,701 |
Less foreign taxes withheld | | (1,108,723) |
Total income | | 16,209,978 |
| | |
Expenses | | |
Management fee | $ 5,689,907 | |
Transfer agent fees | 2,134,136 | |
Distribution and service plan fees | 777,366 | |
Accounting and security lending fees | 389,213 | |
Custodian fees and expenses | 182,573 | |
Independent trustees' compensation | 4,268 | |
Registration fees | 153,780 | |
Audit | 61,648 | |
Legal | 2,692 | |
Interest | 2,456 | |
Miscellaneous | 5,236 | |
Total expenses before reductions | 9,403,275 | |
Expense reductions | (62,747) | 9,340,528 |
Net investment income (loss) | | 6,869,450 |
Realized and Unrealized Gain (Loss) Net realized gain (loss) on: | | |
Investment securities: | | |
Unaffiliated issuers (net of foreign taxes of $8,021) | (6,689,458) | |
Foreign currency transactions | (208,574) | |
Total net realized gain (loss) | | (6,898,032) |
Change in net unrealized appreciation (depreciation) on: Investment securities (net of decrease in deferred foreign taxes of $77,622) | (67,470,576) | |
Assets and liabilities in foreign currencies | (249,333) | |
Total change in net unrealized appreciation (depreciation) | | (67,719,909) |
Net gain (loss) | | (74,617,941) |
Net increase (decrease) in net assets resulting from operations | | $ (67,748,491) |
See accompanying notes which are an integral part of the financial statements.
Annual Report
Financial Statements - continued
Statement of Changes in Net Assets
| Year ended
October 31,
2011 | Year ended
October 31,
2010 |
Increase (Decrease) in Net Assets | | |
Operations | | |
Net investment income (loss) | $ 6,869,450 | $ 5,290,077 |
Net realized gain (loss) | (6,898,032) | (2,643,429) |
Change in net unrealized appreciation (depreciation) | (67,719,909) | 40,356,160 |
Net increase (decrease) in net assets resulting
from operations | (67,748,491) | 43,002,808 |
Distributions to shareholders from net investment income | (5,045,313) | (188,424) |
Distributions to shareholders from net realized gain | (2,104,800) | (1,358,291) |
Total distributions | (7,150,113) | (1,546,715) |
Share transactions - net increase (decrease) | 418,528,912 | 198,095,255 |
Redemption fees | 94,436 | 48,090 |
Total increase (decrease) in net assets | 343,724,744 | 239,599,438 |
| | |
Net Assets | | |
Beginning of period | 436,743,155 | 197,143,717 |
End of period (including undistributed net investment income of $2,852,890 and undistributed net investment income of $4,074,073, respectively) | $ 780,467,899 | $ 436,743,155 |
See accompanying notes which are an integral part of the financial statements.
Annual Report
Financial Highlights - Class A
Years ended October 31, | 2011 | 2010 | 2009 I |
Selected Per-Share Data | | | |
Net asset value, beginning of period | $ 15.60 | $ 13.29 | $ 10.00 |
Income from Investment Operations | | | |
Net investment income (loss) E | .12 | .19 H | (.01) |
Net realized and unrealized gain (loss) | (.38) | 2.20 | 3.29 |
Total from investment operations | (.26) | 2.39 | 3.28 |
Distributions from net investment income | (.13) | - K | - |
Distributions from net realized gain | (.06) | (.08) | - |
Total distributions | (.20) L | (.08) | - |
Redemption fees added to paid in capital E | - K | - K | .01 |
Net asset value, end of period | $ 15.14 | $ 15.60 | $ 13.29 |
Total Return B,C,D | (1.80)% | 18.04% | 32.90% |
Ratios to Average Net Assets F,J | | | |
Expenses before reductions | 1.32% | 1.37% | 1.65% A |
Expenses net of fee waivers, if any | 1.32% | 1.37% | 1.50% A |
Expenses net of all reductions | 1.31% | 1.36% | 1.48% A |
Net investment income (loss) | .71% | 1.35% H | (.15)% A |
Supplemental Data | | | |
Net assets, end of period (000 omitted) | $ 127,979 | $ 60,370 | $ 15,705 |
Portfolio turnover rate G | 71% | 54% | 25% A |
A Annualized
B Total returns for periods of less than one year are not annualized.
C Total returns would have been lower if certain expenses had not been reduced during the applicable periods shown.
D Total returns do not include the effect of the sales charges.
E Calculated based on average shares outstanding during the period.
F Fees and expenses of any underlying Fidelity Central Funds are not included in the Fund's expense ratio. The Fund indirectly bears its proportionate share of the expenses of any underlying Fidelity Central Funds.
G Amount does not include the portfolio activity of any underlying Fidelity Central Funds.
H Investment income per share reflects a special dividend which amounted to $.13 per share. Excluding the special dividend, the ratio of net investment income (loss) to average net assets would have been .42%.
I For the period March 25, 2009 (commencement of operations) to October 31, 2009.
J Expense ratios reflect operating expenses of the class. Expenses before reductions do not reflect amounts reimbursed by the investment adviser or reductions from brokerage service arrangements or reductions from other expense offset arrangements and do not represent the amount paid by the class during periods when reimbursements or reductions occur. Expense ratios before reductions for start-up periods may not be representative of longer-term operating periods. Expenses net of fee waivers reflect expenses after reimbursement by the investment adviser but prior to reductions from brokerage service arrangements or other expense offset arrangements. Expenses net of all reductions represent the net expenses paid by the class.
K Amount represents less than $.01 per share.
L Total distributions of $.20 per share is comprised of distributions from net investment income of $.133 and distributions from net realized gain of $.062 per share.
See accompanying notes which are an integral part of the financial statements.
Annual Report
Financial Highlights - Class T
Years ended October 31, | 2011 | 2010 | 2009 I |
Selected Per-Share Data | | | |
Net asset value, beginning of period | $ 15.55 | $ 13.27 | $ 10.00 |
Income from Investment Operations | | | |
Net investment income (loss) E | .07 | .16 H | (.03) |
Net realized and unrealized gain (loss) | (.38) | 2.19 | 3.29 |
Total from investment operations | (.31) | 2.35 | 3.26 |
Distributions from net investment income | (.10) | - | - |
Distributions from net realized gain | (.06) | (.07) | - |
Total distributions | (.16) | (.07) | - |
Redemption fees added to paid in capital E | - K | - K | .01 |
Net asset value, end of period | $ 15.08 | $ 15.55 | $ 13.27 |
Total Return B,C,D | (2.09)% | 17.73% | 32.70% |
Ratios to Average Net Assets F,J | | | |
Expenses before reductions | 1.60% | 1.63% | 2.04% A |
Expenses net of fee waivers, if any | 1.60% | 1.63% | 1.75% A |
Expenses net of all reductions | 1.59% | 1.61% | 1.73% A |
Net investment income (loss) | .43% | 1.10% H | (.40)% A |
Supplemental Data | | | |
Net assets, end of period (000 omitted) | $ 20,831 | $ 11,762 | $ 4,665 |
Portfolio turnover rate G | 71% | 54% | 25% A |
A Annualized
B Total returns for periods of less than one year are not annualized.
C Total returns would have been lower if certain expenses had not been reduced during the applicable periods shown.
D Total returns do not include the effect of the sales charges.
E Calculated based on average shares outstanding during the period.
F Fees and expenses of any underlying Fidelity Central Funds are not included in the Fund's expense ratio. The Fund indirectly bears its proportionate share of the expenses of any underlying Fidelity Central Funds.
G Amount does not include the portfolio activity of any underlying Fidelity Central Funds.
H Investment income per share reflects a special dividend which amounted to $.13 per share. Excluding the special dividend, the ratio of net investment income (loss) to average net assets would have been .17%.
I For the period March 25, 2009 (commencement of operations) to October 31, 2009.
J Expense ratios reflect operating expenses of the class. Expenses before reductions do not reflect amounts reimbursed by the investment adviser or reductions from brokerage service arrangements or reductions from other expense offset arrangements and do not represent the amount paid by the class during periods when reimbursements or reductions occur. Expense ratios before reductions for start-up periods may not be representative of longer-term operating periods. Expenses net of fee waivers reflect expenses after reimbursement by the investment adviser but prior to reductions from brokerage service arrangements or other expense offset arrangements. Expenses net of all reductions represent the net expenses paid by the class.
K Amount represents less than $.01 per share.
See accompanying notes which are an integral part of the financial statements.
Annual Report
Financial Highlights - Class B
Years ended October 31, | 2011 | 2010 | 2009 I |
Selected Per-Share Data | | | |
Net asset value, beginning of period | $ 15.46 | $ 13.22 | $ 10.00 |
Income from Investment Operations | | | |
Net investment income (loss) E | (.01) | .08 H | (.07) |
Net realized and unrealized gain (loss) | (.39) | 2.20 | 3.28 |
Total from investment operations | (.40) | 2.28 | 3.21 |
Distributions from net realized gain | (.06) | (.04) | - |
Redemption fees added to paid in capital E | - K | - K | .01 |
Net asset value, end of period | $ 15.00 | $ 15.46 | $ 13.22 |
Total Return B,C,D | (2.62)% | 17.23% | 32.20% |
Ratios to Average Net Assets F,J | | | |
Expenses before reductions | 2.11% | 2.16% | 2.66% A |
Expenses net of fee waivers, if any | 2.11% | 2.16% | 2.25% A |
Expenses net of all reductions | 2.10% | 2.15% | 2.23% A |
Net investment income (loss) | (.09)% | .56% H | (.90)% A |
Supplemental Data | | | |
Net assets, end of period (000 omitted) | $ 4,324 | $ 4,348 | $ 2,726 |
Portfolio turnover rate G | 71% | 54% | 25% A |
A Annualized
B Total returns for periods of less than one year are not annualized.
C Total returns would have been lower if certain expenses had not been reduced during the applicable periods shown.
D Total returns do not include the effect of the contingent deferred sales charge.
E Calculated based on average shares outstanding during the period.
F Fees and expenses of any underlying Fidelity Central Funds are not included in the Fund's expense ratio. The Fund indirectly bears its proportionate share of the expenses of any underlying Fidelity Central Funds.
G Amount does not include the portfolio activity of any underlying Fidelity Central Funds.
H Investment income per share reflects a special dividend which amounted to $.13 per share. Excluding the special dividend, the ratio of net investment income (loss) to average net assets would have been (.37)%.
I For the period March 25, 2009 (commencement of operations) to October 31, 2009.
J Expense ratios reflect operating expenses of the class. Expenses before reductions do not reflect amounts reimbursed by the investment adviser or reductions from brokerage service arrangements or reductions from other expense offset arrangements and do not represent the amount paid by the class during periods when reimbursements or reductions occur. Expense ratios before reductions for start-up periods may not be representative of longer-term operating periods. Expenses net of fee waivers reflect expenses after reimbursement by the investment adviser but prior to reductions from brokerage service arrangements or other expense offset arrangements. Expenses net of all reductions represent the net expenses paid by the class.
K Amount represents less than $.01 per share.
See accompanying notes which are an integral part of the financial statements.
Annual Report
Financial Highlights - Class C
Years ended October 31, | 2011 | 2010 | 2009 I |
Selected Per-Share Data | | | |
Net asset value, beginning of period | $ 15.45 | $ 13.22 | $ 10.00 |
Income from Investment Operations | | | |
Net investment income (loss) E | (.01) | .08 H | (.07) |
Net realized and unrealized gain (loss) | (.38) | 2.19 | 3.28 |
Total from investment operations | (.39) | 2.27 | 3.21 |
Distributions from net investment income | (.05) | - | - |
Distributions from net realized gain | (.06) | (.04) | - |
Total distributions | (.11) | (.04) | - |
Redemption fees added to paid in capital E | - K | - K | .01 |
Net asset value, end of period | $ 14.95 | $ 15.45 | $ 13.22 |
Total Return B,C,D | (2.58)% | 17.21% | 32.20% |
Ratios to Average Net Assets F,J | | | |
Expenses before reductions | 2.09% | 2.14% | 2.53% A |
Expenses net of fee waivers, if any | 2.09% | 2.14% | 2.25% A |
Expenses net of all reductions | 2.08% | 2.13% | 2.23% A |
Net investment income (loss) | (.07)% | .58% H | (.90)% A |
Supplemental Data | | | |
Net assets, end of period (000 omitted) | $ 37,185 | $ 14,338 | $ 4,798 |
Portfolio turnover rate G | 71% | 54% | 25% A |
A Annualized
B Total returns for periods of less than one year are not annualized.
C Total returns would have been lower if certain expenses had not been reduced during the applicable periods shown.
D Total returns do not include the effect of the contingent deferred sales charge.
E Calculated based on average shares outstanding during the period.
F Fees and expenses of any underlying Fidelity Central Funds are not included in the Fund's expense ratio. The Fund indirectly bears its proportionate share of the expenses of any underlying Fidelity Central Funds.
G Amount does not include the portfolio activity of any underlying Fidelity Central Funds.
H Investment income per share reflects a special dividend which amounted to $.13 per share. Excluding the special dividend, the ratio of net investment income (loss) to average net assets would have been (.34)%.
I For the period March 25, 2009 (commencement of operations) to October 31, 2009.
J Expense ratios reflect operating expenses of the class. Expenses before reductions do not reflect amounts reimbursed by the investment adviser or reductions from brokerage service arrangements or reductions from other expense offset arrangements and do not represent the amount paid by the class during periods when reimbursements or reductions occur. Expense ratios before reductions for start-up periods may not be representative of longer-term operating periods. Expenses net of fee waivers reflect expenses after reimbursement by the investment adviser but prior to reductions from brokerage service arrangements or other expense offset arrangements. Expenses net of all reductions represent the net expenses paid by the class.
K Amount represents less than $.01 per share.
See accompanying notes which are an integral part of the financial statements.
Annual Report
Financial Highlights - Global Commodity Stock
Years ended October 31, | 2011 | 2010 | 2009 H |
Selected Per-Share Data | | | |
Net asset value, beginning of period | $ 15.66 | $ 13.31 | $ 10.00 |
Income from Investment Operations | | | |
Net investment income (loss) D | .16 | .23 G | .01 |
Net realized and unrealized gain (loss) | (.39) | 2.21 | 3.29 |
Total from investment operations | (.23) | 2.44 | 3.30 |
Distributions from net investment income | (.16) | (.01) | - |
Distributions from net realized gain | (.06) | (.08) | - |
Total distributions | (.22) | (.09) | - |
Redemption fees added to paid in capital D | - J | - J | .01 |
Net asset value, end of period | $ 15.21 | $ 15.66 | $ 13.31 |
Total Return B,C | (1.59)% | 18.38% | 33.10% |
Ratios to Average Net Assets E,I | | | |
Expenses before reductions | 1.08% | 1.10% | 1.42% A |
Expenses net of fee waivers, if any | 1.08% | 1.10% | 1.25% A |
Expenses net of all reductions | 1.07% | 1.09% | 1.23% A |
Net investment income (loss) | .95% | 1.62% G | .10% A |
Supplemental Data | | | |
Net assets, end of period (000 omitted) | $ 531,224 | $ 310,186 | $ 159,439 |
Portfolio turnover rate F | 71% | 54% | 25% A |
A Annualized
B Total returns for periods of less than one year are not annualized.
C Total returns would have been lower if certain expenses had not been reduced during the applicable periods shown.
D Calculated based on average shares outstanding during the period.
E Fees and expenses of any underlying Fidelity Central Funds are not included in the Fund's expense ratio. The Fund indirectly bears its proportionate share of the expenses of any underlying Fidelity Central Funds.
F Amount does not include the portfolio activity of any underlying Fidelity Central Funds.
G Investment income per share reflects a special dividend which amounted to $.13 per share. Excluding the special dividend, the ratio of net investment income (loss) to average net assets would have been .69%.
H For the period March 25, 2009 (commencement of operations) to October 31, 2009.
I Expense ratios reflect operating expenses of the class. Expenses before reductions do not reflect amounts reimbursed by the investment adviser or reductions from brokerage service arrangements or reductions from other expense offset arrangements and do not represent the amount paid by the class during periods when reimbursements or reductions occur. Expense ratios before reductions for start-up periods may not be representative of longer-term operating periods. Expenses net of fee waivers reflect expenses after reimbursement by the investment adviser but prior to reductions from brokerage service arrangements or other expense offset arrangements. Expenses net of all reductions represent the net expenses paid by the class.
J Amount represents less than $.01 per share.
See accompanying notes which are an integral part of the financial statements.
Annual Report
Financial Highlights - Institutional Class
Years ended October 31, | 2011 | 2010 | 2009 H |
Selected Per-Share Data | | | |
Net asset value, beginning of period | $ 15.66 | $ 13.31 | $ 10.00 |
Income from Investment Operations | | | |
Net investment income (loss) D | .16 | .23 G | .01 |
Net realized and unrealized gain (loss) | (.38) | 2.21 | 3.29 |
Total from investment operations | (.22) | 2.44 | 3.30 |
Distributions from net investment income | (.16) | (.01) | - |
Distributions from net realized gain | (.06) | (.08) | - |
Total distributions | (.22) | (.09) | - |
Redemption fees added to paid in capital D | - J | - J | .01 |
Net asset value, end of period | $ 15.22 | $ 15.66 | $ 13.31 |
Total Return B,C | (1.50)% | 18.39% | 33.10% |
Ratios to Average Net Assets E,I | | | |
Expenses before reductions | 1.03% | 1.09% | 1.36% A |
Expenses net of fee waivers, if any | 1.03% | 1.09% | 1.25% A |
Expenses net of all reductions | 1.03% | 1.07% | 1.23% A |
Net investment income (loss) | .99% | 1.64% G | .10% A |
Supplemental Data | | | |
Net assets, end of period (000 omitted) | $ 58,925 | $ 35,739 | $ 9,811 |
Portfolio turnover rate F | 71% | 54% | 25% A |
A Annualized
B Total returns for periods of less than one year are not annualized.
C Total returns would have been lower if certain expenses had not been reduced during the applicable periods shown.
D Calculated based on average shares outstanding during the period.
E Fees and expenses of any underlying Fidelity Central Funds are not included in the Fund's expense ratio. The Fund indirectly bears its proportionate share of the expenses of any underlying Fidelity Central Funds.
F Amount does not include the portfolio activity of any underlying Fidelity Central Funds.
G Investment income per share reflects a special dividend which amounted to $.13 per share. Excluding the special dividend, the ratio of net investment income (loss) to average net assets would have been .71%.
H For the period March 25, 2009 (commencement of operations) to October 31, 2009.
I Expense ratios reflect operating expenses of the class. Expenses before reductions do not reflect amounts reimbursed by the investment adviser or reductions from brokerage service arrangements or reductions from other expense offset arrangements and do not represent the amount paid by the class during periods when reimbursements or reductions occur. Expense ratios before reductions for start-up periods may not be representative of longer-term operating periods. Expenses net of fee waivers reflect expenses after reimbursement by the investment adviser but prior to reductions from brokerage service arrangements or other expense offset arrangements. Expenses net of all reductions represent the net expenses paid by the class.
J Amount represents less than $.01 per share.
See accompanying notes which are an integral part of the financial statements.
Annual Report
Notes to Financial Statements
For the period ended October 31, 2011
1. Organization.
Fidelity® Global Commodity Stock Fund (the Fund) is a non-diversified fund of Fidelity Investment Trust (the Trust) and is authorized to issue an unlimited number of shares. The Trust is registered under the Investment Company Act of 1940, as amended (the 1940 Act), as an open-end management investment company organized as a Massachusetts business trust. The Fund offers Class A, Class T, Class C, Global Commodity Stock and Institutional Class shares, each of which, along with Class B shares, has equal rights as to assets and voting privileges. Effective after the close of business on September 1, 2010, Class B shares were closed to new accounts and additional purchases, except for exchanges and reinvestments by existing shareholders. Each class has exclusive voting rights with respect to matters that affect that class. Class B shares will automatically convert to Class A shares after a holding period of seven years from the initial date of purchase. Investment income, realized and unrealized capital gains and losses, the common expenses of the Fund, and certain fund-level expense reductions, if any, are allocated on a pro-rata basis to each class based on the relative net assets of each class to the total net assets of the Fund. Each class differs with respect to transfer agent and distribution and service plan fees incurred. Certain expense reductions may also differ by class. The Fund's investments in emerging markets can be subject to social, economic, regulatory and political uncertainties and can be extremely volatile.
2. Investments in Fidelity Central Funds.
The Fund invests in Fidelity Central Funds, which are open-end investment companies available only to other investment companies and accounts managed by Fidelity Management & Research Company (FMR) and its affiliates. The Fund's Schedule of Investments lists each of the Fidelity Central Funds held as of period end, if any, as an investment of the Fund, but does not include the underlying holdings of each Fidelity Central Fund. As an Investing Fund, the Fund indirectly bears its proportionate share of the expenses of the underlying Fidelity Central Funds.
The Money Market Central Funds seek preservation of capital and current income and are managed by Fidelity Investments Money Management, Inc. (FIMM), an affiliate of FMR.
A complete unaudited list of holdings for each Fidelity Central Fund is available upon request or at the Securities and Exchange Commission (the SEC) web site at www.sec.gov. In addition, the financial statements of the Fidelity Central Funds, which are not covered by the Fund's Report of Independent Registered Public Accounting Firm, are available on the SEC web site or upon request.
Annual Report
3. Significant Accounting Policies.
The financial statements have been prepared in conformity with accounting principles generally accepted in the United States of America (GAAP), which require management to make certain estimates and assumptions at the date of the financial statements. Actual results could differ from those estimates. Subsequent events, if any, through the date that the financial statements were issued have been evaluated in the preparation of the financial statements. The following summarizes the significant accounting policies of the Fund:
Security Valuation. Investments are valued as of 4:00 p.m. Eastern time on the last calendar day of the period. The Fund uses independent pricing services approved by the Board of Trustees to value its investments. When current market prices or quotations are not readily available or reliable, valuations may be determined in good faith in accordance with procedures adopted by the Board of Trustees. Factors used in determining value may include market or security specific events, changes in interest rates and credit quality. The frequency with which these procedures are used cannot be predicted and they may be utilized to a significant extent. The value used for net asset value (NAV) calculation under these procedures may differ from published prices for the same securities.
The Fund categorizes the inputs to valuation techniques used to value its investments into a disclosure hierarchy consisting of three levels as shown below:
Level 1 - quoted prices in active markets for identical investments
Level 2 - other significant observable inputs (including quoted prices for similar investments, interest rates, prepayment speeds, etc.)
Level 3 - unobservable inputs (including the Fund's own assumptions based on the best information available)
Changes in valuation techniques may result in transfers in or out of an assigned level within the disclosure hierarchy. The aggregate value of investments by input level, as of October 31, 2011, as well as a roll forward of Level 3 securities, is included at the end of the Fund's Schedule of Investments. Valuation techniques used to value the Fund's investments by major category are as follows:
Equity securities, including restricted securities, for which market quotations are readily available, are valued at the last reported sale price or official closing price as reported by an independent pricing service on the primary market or exchange on which they are traded and are categorized as Level 1 in the hierarchy. In the event there were no sales during the day or closing prices are not available, securities are valued at the last quoted bid price or may be valued using the last available price and are generally categorized as Level 2 in the hierarchy. For foreign equity securities, when significant market or security
Annual Report
Notes to Financial Statements - continued
3. Significant Accounting Policies - continued
Security Valuation - continued
specific events arise, comparisons to the valuation of American Depositary Receipts (ADRs), futures contracts, Exchange-traded funds (ETFs) and certain indexes as well as quoted prices for similar securities are used and are categorized as Level 2 in the hierarchy in these circumstances. Utilizing these techniques may result in transfers between Level 1 and Level 2. For restricted equity securities and private placements where observable inputs are limited, assumptions about market activity and risk are used and are categorized as Level 3 in the hierarchy.
Debt securities, including restricted securities, are valued based on evaluated prices received from independent pricing services or from dealers who make markets in such securities. For corporate bonds, pricing services utilize matrix pricing which considers yield or price of bonds of comparable quality, coupon, maturity and type as well as dealer supplied prices and are generally categorized as Level 2 in the hierarchy. When independent prices are unavailable or unreliable, debt securities may be valued utilizing pricing matrices which consider similar factors that would be used by independent pricing services. These are generally categorized as Level 2 in the hierarchy but may be Level 3 depending on the circumstances.
Investments in open-end mutual funds, including the Fidelity Central Funds, are valued at their closing net asset value each business day and are categorized as Level 1 in the hierarchy.
Foreign Currency. The Fund may use foreign currency contracts to facilitate transactions in foreign-denominated securities. Gains and losses from these transactions may arise from changes in the value of the foreign currency or if the counterparties do not perform under the contracts' terms.
Foreign-denominated assets, including investment securities, and liabilities are translated into U.S. dollars at the exchange rate at period end. Purchases and sales of investment securities, income and dividends received and expenses denominated in foreign currencies are translated into U.S. dollars at the exchange rate in effect on the transaction date.
The effects of exchange rate fluctuations on investments are included with the net realized and unrealized gain (loss) on investment securities. Other foreign currency transactions resulting in realized and unrealized gain (loss) are disclosed separately.
Investment Transactions and Income. For financial reporting purposes, the Fund's investment holdings and NAV include trades executed through the end of the last business day of the period. The NAV per share for processing shareholder transactions is calculated as of the close of business of the New York Stock Exchange (NYSE), normally 4:00 p.m. Eastern time and includes trades executed through the end of the prior
Annual Report
3. Significant Accounting Policies - continued
Investment Transactions and Income - continued
business day. Gains and losses on securities sold are determined on the basis of identified cost. Dividend income is recorded on the ex-dividend date, except for certain dividends from foreign securities where the ex-dividend date may have passed, which are recorded as soon as the Fund is informed of the ex-dividend date. Non-cash dividends included in dividend income, if any, are recorded at the fair market value of the securities received. Distributions received on securities that represent a return of capital or capital gain are recorded as a reduction of cost of investments and/or as a realized gain. The Fund estimates the components of distributions received that may be considered return of capital distributions or capital gain distributions. Interest income and distributions from the Fidelity Central Funds are accrued as earned. Interest income includes coupon interest and amortization of premium and accretion of discount on debt securities. Investment income is recorded net of foreign taxes withheld where recovery of such taxes is uncertain.
Expenses. Expenses directly attributable to a fund are charged to that fund. Expenses attributable to more than one fund are allocated among the respective funds on the basis of relative net assets or other appropriate methods. Expense estimates are accrued in the period to which they relate and adjustments are made when actual amounts are known.
Income Tax Information and Distributions to Shareholders. Each year, the Fund intends to qualify as a regulated investment company, including distributing substantially all of its taxable income and realized gains under Subchapter M of the Internal Revenue Code and filing its U.S. federal tax return. As a result, no provision for income taxes is required. As of October 31, 2011, the Fund did not have any unrecognized tax benefits in the financial statements. A fund's federal tax return is subject to examination by the Internal Revenue Service (IRS) for a period of three years. Foreign taxes are provided for based on the Fund's understanding of the tax rules and rates that exist in the foreign markets in which it invests.
Distributions are declared and recorded on the ex-dividend date. Income dividends and capital gain distributions are declared separately for each class. Income and capital gain distributions are determined in accordance with income tax regulations, which may differ from GAAP. In addition, the Fund claimed a portion of the payment made to redeeming shareholders as a distribution for income tax purposes
Capital accounts within the financial statements are adjusted for permanent book-tax differences. These adjustments have no impact on net assets or the results of operations. Temporary book-tax differences will reverse in a subsequent period.
Annual Report
Notes to Financial Statements - continued
3. Significant Accounting Policies - continued
Income Tax Information and Distributions to Shareholders - continued
Book-tax differences are primarily due to foreign currency transactions, certain foreign taxes, passive foreign investment companies (PFIC), partnerships, capital loss carryforwards and losses deferred due to wash sales.
The federal tax cost of investment securities and unrealized appreciation (depreciation) as of period end were as follows:
Gross unrealized appreciation | $ 64,157,893 |
Gross unrealized depreciation | (89,393,208) |
Net unrealized appreciation (depreciation) on securities and other investments | $ (25,235,315) |
| |
Tax Cost | $ 831,986,305 |
The tax-based components of distributable earnings as of period end were as follows:
Undistributed ordinary income | $ 3,411,620 |
Capital loss carryforward | $ (6,966,394) |
Net unrealized appreciation (depreciation) | $ (25,483,446) |
Under the recently enacted Regulated Investment Company Modernization Act of 2010 (the Act), the Fund will be permitted to carry forward capital losses incurred in taxable years beginning after December 22, 2010 for an unlimited period. However, any losses incurred during those future taxable years will be required to be utilized prior to any losses incurred in pre-enactment taxable years, which generally expire after eight years from when they are incurred. Additionally, post-enactment capital losses that are carried forward will retain their character as either short-term or long-term capital losses rather than being considered all short-term as under previous law. The Fund's first fiscal year end subject to the Act will be October 31, 2012.
The tax character of distributions paid was as follows:
| October 31, 2011 | October 31, 2010 |
Ordinary Income | $ 5,112,665 | $ 1,546,715 |
Long-Term Capital Gains | 2,037,448 | - |
Total | $ 7,150,113 | $ 1,546,715 |
Short-Term Trading (Redemption) Fees. Shares held by investors in the Fund less than 30 days are subject to a redemption fee equal to 1.00% of the net asset value of shares redeemed. All redemption fees, which reduce the proceeds of the shareholder redemption, are retained by the Fund and accounted for as an addition to paid in capital.
Annual Report
3. Significant Accounting Policies - continued
New Accounting Pronouncement. In May 2011, the Financial Accounting Standards Board issued Accounting Standard Update No. 2011-04, Fair Value Measurement (Topic 820) - Amendments to Achieve Common Fair Value Measurement and Disclosure Requirements in U.S. GAAP and IFRSs. The update changes the wording used to describe the requirements in GAAP for measuring fair value and for disclosing information about fair value measurements. The update is effective during interim and annual periods beginning after December 15, 2011. Management is currently evaluating the impact of the update's adoption on the Fund's financial statement disclosures.
4. Operating Policies.
Restricted Securities. The Fund may invest in securities that are subject to legal or contractual restrictions on resale. These securities generally may be resold in transactions exempt from registration or to the public if the securities are registered. Disposal of these securities may involve time-consuming negotiations and expense, and prompt sale at an acceptable price may be difficult. Information regarding restricted securities is included at the end of the Fund's Schedule of Investments.
5. Purchases and Sales of Investments.
Purchases and sales of securities, other than short-term securities, aggregated $977,644,235 and $565,928,394, respectively.
6. Fees and Other Transactions with Affiliates.
Management Fee. FMR and its affiliates provide the Fund with investment management related services for which the Fund pays a monthly management fee. The management fee is the sum of an individual fund fee rate that is based on an annual rate of .45% of the Fund's average net assets and a group fee rate that averaged .26% during the period. The group fee rate is based upon the average net assets of all the mutual funds advised by FMR. The group fee rate decreases as assets under management increase and increases as assets under management decrease. For the period, the total annual management fee rate was .71% of the Fund's average net assets.
Distribution and Service Plan Fees. In accordance with Rule 12b-1 of the 1940 Act, the Fund has adopted separate Distribution and Service Plans for each class of shares. Certain classes pay Fidelity Distributors Corporation (FDC), an affiliate of FMR, separate Distribution and Service Fees, each of which is based on an annual percentage of each class' average net assets. In addition, FDC may pay financial intermediaries for selling shares of the Fund and providing shareholder support services. For the period, the Distribution and Service Fee rates, total fees and amounts retained by FDC were as follows:
Annual Report
Notes to Financial Statements - continued
6. Fees and Other Transactions with Affiliates - continued
Distribution and Service Plan Fees - continued
| Distribution
Fee | Service
Fee | Total Fees | Retained
by FDC |
Class A | -% | .25% | $ 294,482 | $ 11,535 |
Class T | .25% | .25% | 97,025 | 1 |
Class B | .75% | .25% | 48,554 | 36,421 |
Class C | .75% | .25% | 337,305 | 182,256 |
| | | $ 777,366 | $ 230,213 |
Sales Load. FDC may receive a front-end sales charge of up to 5.75% for selling Class A shares, and 3.50% for selling Class T shares, some of which is paid to financial intermediaries for selling shares of the Fund. Depending on the holding period, FDC may receive contingent deferred sales charges levied on Class A, Class T, Class B, and Class C redemptions. The deferred sales charges range from 5% to 1% for Class B, 1% for Class C, 1.00% for certain purchases of Class A shares and .25% for certain purchases of Class T shares.
For the period, sales charge amounts retained by FDC were as follows:
| Retained
by FDC |
Class A | $ 203,267 |
Class T | 23,029 |
Class B* | 73,574 |
Class C* | 12,313 |
| $ 312,183 |
* When Class B and Class C shares are initially sold, FDC pays commissions from its own resources to financial intermediaries through which the sales are made.
Transfer Agent Fees. Fidelity Investments Institutional Operations Company, Inc. (FIIOC), an affiliate of FMR, is the transfer, dividend disbursing and shareholder servicing agent for each class of the Fund. FIIOC receives account fees and asset-based fees that vary according to the account size and type of account of the shareholders of the respective classes of the Fund. FIIOC pays for typesetting, printing and mailing of shareholder reports, except proxy statements. For the period, transfer agent fees for each class were as follows:
Annual Report
6. Fees and Other Transactions with Affiliates - continued
Transfer Agent Fees - continued
| Amount | % of
Average
Net Assets |
Class A | $ 306,688 | .26 |
Class T | 56,044 | .29 |
Class B | 14,667 | .30 |
Class C | 96,930 | .29 |
Global Commodity Stock | 1,516,249 | .27 |
Institutional Class | 143,558 | .23 |
| $ 2,134,136 | |
Accounting and Security Lending Fees. Fidelity Service Company, Inc. (FSC), an affiliate of FMR, maintains the Fund's accounting records. The accounting fee is based on the level of average net assets for the month. Under a separate contract, FSC administers the security lending program. The security lending fee is based on the number and duration of lending transactions.
Brokerage Commissions. The Fund placed a portion of its portfolio transactions with brokerage firms which are affiliates of the investment adviser. The commissions paid to these affiliated firms were $20,462 for the period.
Interfund Lending Program. Pursuant to an Exemptive Order issued by the SEC, the Fund, along with other registered investment companies having management contracts with FMR, may participate in an interfund lending program. This program provides an alternative credit facility allowing the funds to borrow from, or lend money to, other participating affiliated funds. At period end, there were no interfund loans outstanding. The Fund's activity in this program during the period for which loans were outstanding was as follows:
Borrower or Lender | Average Daily
Loan Balance | Weighted Average Interest Rate | Interest
Expense |
Borrower | $ 5,072,574 | .35% | $ 2,323 |
7. Committed Line of Credit.
The Fund participates with other funds managed by FMR or an affiliate in a $4.0 billion credit facility (the "line of credit") to be utilized for temporary or emergency purposes to fund shareholder redemptions or for other short-term liquidity purposes. The Fund has agreed to pay commitment fees on its pro-rata portion of the line of credit, which amounted to $2,313 and is reflected in Miscellaneous expenses on the Statement of Operations. During the period, there were no borrowings on this line of credit.
Annual Report
Notes to Financial Statements - continued
8. Security Lending.
The Fund lends portfolio securities through a lending agent from time to time in order to earn additional income. For equity securities, a lending agent is used and may loan securities to certain qualified borrowers, including Fidelity Capital Markets (FCM), a broker-dealer affiliated with the Fund. On the settlement date of the loan, the Fund receives collateral (in the form of U.S. Treasury obligations, letters of credit and/or cash) against the loaned securities and maintains collateral in an amount not less than 100% of the market value of the loaned securities during the period of the loan. The market value of the loaned securities is determined at the close of business of the Fund and any additional required collateral is delivered to the Fund on the next business day. If the borrower defaults on its obligation to return the securities loaned because of insolvency or other reasons, a fund could experience delays and costs in recovering the securities loaned or in gaining access to the collateral. Any cash collateral received is invested in the Fidelity Securities Lending Cash Central Fund. The value of loaned securities and cash collateral at period end are disclosed on the Fund's Statement of Assets and Liabilities. Security lending income represents the income earned on investing cash collateral, less rebates paid to borrowers and any lending agent fees associated with the loan, plus any premium payments received for lending certain types of securities. Security lending income is presented in the Statement of Operations as a component of income from Fidelity Central Funds. Total security lending income during the period amounted to $351,340. During the period, there were no securities loaned to FCM.
9. Bank Borrowings.
The Fund is permitted to have bank borrowings for temporary or emergency purposes to fund shareholder redemptions or for other short-term liquidity requirements. The Fund has established borrowing arrangements with certain banks. The interest rate on the borrowings is the bank's base rate, as revised from time to time. The average daily loan balance during the period for which loans were outstanding amounted to $2,705,000. The weighted average interest rate was .59%. The interest expense amounted to $133 under the bank borrowing program. At period end, there were no bank borrowings outstanding.
10. Expense Reductions.
Many of the brokers with whom FMR places trades on behalf of the Fund provided services to the Fund in addition to trade execution. These services included payments of certain expenses on behalf of the Fund totaling $62,747 for the period.
Annual Report
11. Distributions to Shareholders.
Distributions to shareholders of each class were as follows:
Years ended October 31, | 2011 | 2010 |
From net investment income | | |
Class A | $ 597,144 | $ 7,432 |
Class T | 82,038 | - |
Class C | 56,214 | - |
Global Commodity Stock | 3,895,270 | 168,019 |
Institutional Class | 414,647 | 12,973 |
Total | $ 5,045,313 | $ 188,424 |
From net realized gain | | |
Class A | $ 275,211 | $ 143,058 |
Class T | 52,381 | 30,137 |
Class B | 16,866 | 9,302 |
Class C | 68,717 | 20,828 |
Global Commodity Stock | 1,532,256 | 1,078,126 |
Institutional Class | 159,369 | 76,840 |
Total | $ 2,104,800 | $ 1,358,291 |
12. Share Transactions.
Transactions for each class of shares were as follows:
| Shares | Dollars |
Years ended October 31, | 2011 | 2010 | 2011 | 2010 |
Class A | | | | |
Shares sold | 7,297,574 | 3,636,511 | $ 124,882,197 | $ 52,113,230 |
Reinvestment of distributions | 39,060 | 8,310 | 643,900 | 119,911 |
Shares redeemed | (2,752,883) | (957,806) | (44,565,640) | (13,354,681) |
Net increase (decrease) | 4,583,751 | 2,687,015 | $ 80,960,457 | $ 38,878,460 |
Class T | | | | |
Shares sold | 866,549 | 635,625 | $ 14,740,169 | $ 9,055,849 |
Reinvestment of distributions | 7,294 | 2,006 | 120,226 | 28,921 |
Shares redeemed | (249,100) | (233,090) | (4,030,489) | (3,190,490) |
Net increase (decrease) | 624,743 | 404,541 | $ 10,829,906 | $ 5,894,280 |
Class B | | | | |
Shares sold | 82,231 | 275,613 | $ 1,397,980 | $ 3,943,173 |
Reinvestment of distributions | 917 | 543 | 14,988 | 7,824 |
Shares redeemed | (76,244) | (200,985) | (1,237,701) | (2,763,660) |
Net increase (decrease) | 6,904 | 75,171 | $ 175,267 | $ 1,187,337 |
Annual Report
Notes to Financial Statements - continued
12. Share Transactions - continued
| Shares | Dollars |
Years ended October 31, | 2011 | 2010 | 2011 | 2010 |
Class C | | | | |
Shares sold | 2,215,036 | 869,321 | $ 37,885,797 | $ 12,506,411 |
Reinvestment of distributions | 6,435 | 1,339 | 105,874 | 19,266 |
Shares redeemed | (662,765) | (305,685) | (10,246,197) | (4,197,936) |
Net increase (decrease) | 1,558,706 | 564,975 | $ 27,745,474 | $ 8,327,741 |
Global Commodity Stock | | | | |
Shares sold | 32,339,719 | 19,122,952 | $ 553,926,075 | $ 278,892,729 |
Reinvestment of distributions | 293,921 | 81,765 | 4,855,462 | 1,181,498 |
Shares redeemed | (17,519,084) | (11,379,620) | (288,860,403) | (158,960,668) |
Net increase (decrease) | 15,114,556 | 7,825,097 | $ 269,921,134 | $ 121,113,559 |
Institutional Class | | | | |
Shares sold | 4,225,113 | 1,969,025 | $ 72,109,877 | $ 28,672,948 |
Reinvestment of distributions | 16,850 | 2,588 | 278,352 | 37,397 |
Shares redeemed | (2,651,317) | (426,975) | (43,491,555) | (6,016,467) |
Net increase (decrease) | 1,590,646 | 1,544,638 | $ 28,896,674 | $ 22,693,878 |
13. Other.
The Fund's organizational documents provide former and current trustees and officers with a limited indemnification against liabilities arising in connection with the performance of their duties to the Fund. In the normal course of business, the Fund may also enter into contracts that provide general indemnifications. The Fund's maximum exposure under these arrangements is unknown as this would be dependent on future claims that may be made against the Fund. The risk of material loss from such claims is considered remote.
Annual Report
To the Trustees of Fidelity Investment Trust and the Shareholders of Fidelity Global Commodity Stock Fund:
In our opinion, the accompanying statement of assets and liabilities, including the schedule of investments, and the related statements of operations and of changes in net assets and the financial highlights present fairly, in all material respects, the financial position of Fidelity Global Commodity Stock Fund (a fund of Fidelity Investment Trust) at October 31, 2011, the results of its operations for the year then ended, the changes in its net assets for each of the two years in the period then ended and the financial highlights for each of the periods indicated, in conformity with accounting principles generally accepted in the United States of America. These financial statements and financial highlights (hereafter referred to as "financial statements") are the responsibility of the Fidelity Global Commodity Stock Fund's management. Our responsibility is to express an opinion on these financial statements based on our audits. We conducted our audits of these financial statements in accordance with the standards of the Public Company Accounting Oversight Board (United States). Those standards require that we plan and perform the audit to obtain reasonable assurance about whether the financial statements are free of material misstatement. An audit includes examining, on a test basis, evidence supporting the amounts and disclosures in the financial statements, assessing the accounting principles used and significant estimates made by management, and evaluating the overall financial statement presentation. We believe that our audits, which included confirmation of securities at October 31, 2011 by correspondence with the custodian and brokers, provide a reasonable basis for our opinion.
PricewaterhouseCoopers LLP
Boston, Massachusetts
December 16, 2011
Annual Report
The Trustees, Members of the Advisory Board, and executive officers of the trust and fund, as applicable, are listed below. The Board of Trustees governs the fund and is responsible for protecting the interests of shareholders. The Trustees are experienced executives who meet periodically throughout the year to oversee the fund's activities, review contractual arrangements with companies that provide services to the fund, oversee management of the risks associated with such activities and contractual arrangements, and review the fund's performance. Except for James C. Curvey, each of the Trustees oversees 226 funds advised by FMR or an affiliate. Mr. Curvey oversees 429 funds advised by FMR or an affiliate.
The Trustees hold office without limit in time except that (a) any Trustee may resign; (b) any Trustee may be removed by written instrument, signed by at least two-thirds of the number of Trustees prior to such removal; (c) any Trustee who requests to be retired or who has become incapacitated by illness or injury may be retired by written instrument signed by a majority of the other Trustees; and (d) any Trustee may be removed at any special meeting of shareholders by a two-thirds vote of the outstanding voting securities of the trust. Each Trustee who is not an interested person (as defined in the 1940 Act) (Independent Trustee), shall retire not later than the last day of the calendar year in which his or her 75th birthday occurs. The Independent Trustees may waive this mandatory retirement age policy with respect to individual Trustees. The executive officers and Advisory Board Members hold office without limit in time, except that any officer and Advisory Board Member may resign or may be removed by a vote of a majority of the Trustees at any regular meeting or any special meeting of the Trustees. Except as indicated, each individual has held the office shown or other offices in the same company for the past five years.
Experience, Skills, Attributes, and Qualifications of the Fund's Trustees. The Governance and Nominating Committee has adopted a statement of policy that describes the experience, qualifications, attributes, and skills that are necessary and desirable for potential Independent Trustee candidates (Statement of Policy). The Board believes that each Trustee satisfied at the time he or she was initially elected or appointed a Trustee, and continues to satisfy, the standards contemplated by the Statement of Policy. The Governance and Nominating Committee also engages professional search firms to help identify potential Independent Trustee candidates who have the experience, qualifications, attributes, and skills consistent with the Statement of Policy. From time to time, additional criteria based on the composition and skills of the current Independent Trustees, as well as experience or skills that may be appropriate in light of future changes to board composition, business conditions, and regulatory or other developments, have also been considered by the professional search firms and the Governance and Nominating Committee. In addition, the Board takes into account the Trustees' commitment and participation in Board and committee meetings, as well as their leadership of standing and ad hoc committees throughout their tenure.
In determining that a particular Trustee was and continues to be qualified to serve as a Trustee, the Board has considered a variety of criteria, none of which, in isolation, was controlling. The Board believes that, collectively, the Trustees have balanced and diverse experience, qualifications, attributes, and skills, which allow the Board to operate effectively in governing the fund and protecting the interests of shareholders. Information about the specific experience, skills, attributes, and qualifications of each Trustee, which in each case led to the Board's conclusion that the Trustee should serve (or continue to serve) as a trustee of the fund, is provided below.
Annual Report
Trustees and Officers - continued
Board Structure and Oversight Function. James C. Curvey is an interested person (as defined in the 1940 Act) and currently serves as Acting Chairman. The Trustees have determined that an interested Chairman is appropriate and benefits shareholders because an interested Chairman has a personal and professional stake in the quality and continuity of services provided to the fund. Independent Trustees exercise their informed business judgment to appoint an individual of their choosing to serve as Chairman, regardless of whether the Trustee happens to be independent or a member of management. The Independent Trustees have determined that they can act independently and effectively without having an Independent Trustee serve as Chairman and that a key structural component for assuring that they are in a position to do so is for the Independent Trustees to constitute a substantial majority for the Board. The Independent Trustees also regularly meet in executive session. Ned C. Lautenbach serves as Chairman of the Independent Trustees and as such (i) acts as a liaison between the Independent Trustees and management with respect to matters important to the Independent Trustees and (ii) with management prepares agendas for Board meetings.
Fidelity funds are overseen by different Boards of Trustees. The fund's Board oversees Fidelity's equity and high income funds and another Board oversees Fidelity's investment-grade bond, money market, and asset allocation funds. The asset allocation funds may invest in Fidelity funds overseen by the fund's Board. The use of separate Boards, each with its own committee structure, allows the Trustees of each group of Fidelity funds to focus on the unique issues of the funds they oversee, including common research, investment, and operational issues. On occasion, the separate Boards establish joint committees to address issues of overlapping consequences for the Fidelity funds overseen by each Board.
The Trustees operate using a system of committees to facilitate the timely and efficient consideration of all matters of importance to the Trustees, the fund, and fund shareholders and to facilitate compliance with legal and regulatory requirements and oversight of the fund's activities and associated risks. The Board, acting through its committees, has charged FMR and its affiliates with (i) identifying events or circumstances the occurrence of which could have demonstrably adverse effects on the fund's business and/or reputation; (ii) implementing processes and controls to lessen the possibility that such events or circumstances occur or to mitigate the effects of such events or circumstances if they do occur; and (iii) creating and maintaining a system designed to evaluate continuously business and market conditions in order to facilitate the identification and implementation processes described in (i) and (ii) above. Because the day-to-day operations and activities of the fund are carried out by or through FMR, its affiliates and other service providers, the fund's exposure to risks is mitigated but not eliminated by the processes overseen by the Trustees. While each of the Board's committees has responsibility for overseeing different aspects of the fund's activities, oversight is exercised primarily through the Operations, Audit, and Compliance Committees. In addition, the Independent Trustees have worked with FMR to enhance the Board's oversight of investment and financial risks, legal and regulatory risks, technology risks, and operational risks, including the development of additional risk reporting to the Board. For example, a working group comprised of Independent Trustees and FMR has worked and continues to work to review the Fidelity funds' valuation-related activities, reporting and risk management. Appropriate personnel, including but not limited to the fund's Chief Compliance Officer (CCO), FMR's internal auditor, the independent accountants, the fund's Treasurer and portfolio management personnel, make periodic reports to the Board's committees, as appropriate, including an annual review of FMR's risk management program for the Fidelity funds. The responsibilities of each standing committee, including their oversight responsibilities, are described further under "Standing Committees of the Fund's Trustees."
Annual Report
The fund's Statement of Additional Information (SAI) includes more information about the Trustees. To request a free copy, call Fidelity at 1-877-208-0098.
Interested Trustees*:
Correspondence intended for each Trustee who is an interested person may be sent to Fidelity Investments, 82 Devonshire Street, Boston, Massachusetts 02109.
Name, Age; Principal Occupations and Other Relevant Experience+ |
James C. Curvey (76) |
| Year of Election or Appointment: 2007 Mr. Curvey is Trustee and Acting Chairman of the Board of Trustees of certain Trusts. Mr. Curvey also serves as Trustee (2007-present) of other investment companies advised by FMR. Mr. Curvey is a Director of Fidelity Investments Money Management, Inc. (2009-present), Director of Fidelity Research & Analysis Co. (2009-present) and Director of FMR and FMR Co., Inc. (2007-present). Mr. Curvey is also Vice Chairman (2007-present) and Director of FMR LLC. In addition, Mr. Curvey serves as an Overseer for the Boston Symphony Orchestra and a member of the Trustees of Villanova University. Previously, Mr. Curvey was the Vice Chairman (2006-2007) and Director (2000-2007) of FMR Corp. |
Ronald P. O'Hanley (54) |
| Year of Election or Appointment: 2011 Mr. O'Hanley is Director of FMR Co., Inc. (2010-present), Director of Fidelity Investments Money Management, Inc. (2010-present), Director of Fidelity Research & Analysis Company (2010-present), President of Fidelity Asset Management and Corporate Services and a member of Fidelity's Executive Committee (2010-present). Previously, Mr. O'Hanley served as President and Chief Executive Officer of BNY Mellon Asset Management (2007-2010). Mr. O'Hanley also served as Vice Chairman of Bank New York Mellon Corp. and a member of that firm's Executive Committee. Prior to the 2007 merger of The Bank of New York and Mellon Financial Corporation, he was Vice Chairman of Mellon Financial Corporation and President and Chief Executive Officer of Mellon Asset Management. He joined Mellon in February 1997. Mr. O'Hanley currently serves as Chairman of the Boston Public Library Foundation Board of Directors and sits on the Board of Directors of Beth Israel Deaconess Medical Center, the Board of Trustees of the Marine Biological Laboratory and the Advisory Board of the Maxwell School of Citizenship and Public Administration at Syracuse University. Mr. O'Hanley also chairs the Council on Asset Management for the Financial Services Roundtable and is a member of the Board of Directors of Institutional Investor's U.S. Institute. |
* Trustees have been determined to be "Interested Trustees" by virtue of, among other things, their affiliation with the trust or various entities under common control with FMR.
+ The information above includes each Trustee's principal occupation during the last five years and other information relating to the experience, attributes, and skills relevant to each Trustee's qualifications to serve as a Trustee, which led to the conclusion that each Trustee should serve as a Trustee for the fund.
Annual Report
Independent Trustees:
Correspondence intended for each Independent Trustee (that is, the Trustees other than the Interested Trustees) may be sent to Fidelity Investments, P.O. Box 55235, Boston, Massachusetts 02205-5235.
Name, Age; Principal Occupations and Other Relevant Experience+ |
Dennis J. Dirks (63) |
| Year of Election or Appointment: 2005 Prior to his retirement in May 2003, Mr. Dirks was Chief Operating Officer and a member of the Board of The Depository Trust & Clearing Corporation (DTCC). He also served as President, Chief Operating Officer, and Board member of The Depository Trust Company (DTC) and President and Board member of the National Securities Clearing Corporation (NSCC). In addition, Mr. Dirks served as Chief Executive Officer and Board member of the Government Securities Clearing Corporation, Chief Executive Officer and Board member of the Mortgage-Backed Securities Clearing Corporation, as a Trustee and a member of the Finance Committee of Manhattan College (2005-2008), and as a Trustee and a member of the Finance Committee of AHRC of Nassau County (2006-2008). Mr. Dirks is a member of the Independent Directors Council (IDC) Governing Council (2010-Present) and Board of Directors for The Brookville Center for Children's Services, Inc. (2009-present). |
Alan J. Lacy (58) |
| Year of Election or Appointment: 2008 Mr. Lacy serves as Senior Adviser (2007-present) of Oak Hill Capital Partners, L.P. (private equity). Mr. Lacy also served as Chief Executive Officer (2000-2005) and Vice Chairman (2005-2006) of Sears Holdings Corporation and Sears, Roebuck and Co. (retail). In addition, Mr. Lacy serves as a member of the Board of Directors of Dave & Buster's, Inc. (restaurant and entertainment complexes, 2010-present), The Hillman Companies, Inc. (hardware wholesalers, 2010-present), and Bristol-Myers Squibb Company (global pharmaceuticals, 2007-present). Mr. Lacy is a member of the Board of Trustees of The National Parks Conservation Association (2006-Present). Previously, Mr. Lacy served as Chairman of the Board of Trustees of the National Parks Conservation Association (2008-2011) and as a member of the Board of Directors for the Western Union Company (global money transfer, 2006-2011). |
Ned C. Lautenbach (67) |
| Year of Election or Appointment: 2000 Mr. Lautenbach is Chairman of the Independent Trustees of the Equity and High Income Funds (2006-present). Mr. Lautenbach currently serves as the Lead Director of the Eaton Corporation Board of Directors (diversified industrial, 1997-present). Mr. Lautenbach is also a member of the Board of Directors of the Philharmonic Center for the Arts in Naples, Florida (1999-present); a member of the Board of Trustees of Fairfield University (2005-present); and a member of the Council on Foreign Relations (1994-present). Previously, Mr. Lautenbach was a Partner/Advisory Partner at Clayton, Dubilier & Rice, LLC (private equity investment, 1998-2010), as well as a Director of Sony Corporation (2006-2007). |
Joseph Mauriello (67) |
| Year of Election or Appointment: 2008 Prior to his retirement in January 2006, Mr. Mauriello served in numerous senior management positions including Deputy Chairman and Chief Operating Officer (2004-2005), and Vice Chairman of Financial Services (2002-2004) of KPMG LLP US (professional services, 1965-2005). Mr. Mauriello currently serves as a member of the Board of Directors of XL Group plc. (global insurance and re-insurance, 2006-present) and of Arcadia Resources Inc. (health care services and products, 2007-present). Previously, Mr. Mauriello served as a Director of the Hamilton Funds of the Bank of New York (2006-2007). |
Robert W. Selander (61) |
| Year of Election or Appointment: 2011 Previously, Mr. Selander served as a Member of the Advisory Board of Fidelity's Equity and High Income Funds (2011), Executive Vice Chairman (2010), Chief Executive Officer (2009-2010), and President and Chief Executive Officer (1997-2009) of Mastercard, Inc. |
Cornelia M. Small (67) |
| Year of Election or Appointment: 2005 Ms. Small is a member of the Board of Directors of the Teagle Foundation (2009-present). Ms. Small is also a member of the Investment Committee, and Chair (2008-present) and a member of the Board of Trustees of Smith College. In addition, Ms. Small serves on the Investment Committee of the Berkshire Taconic Community Foundation (2008-present). Previously, Ms. Small served as Chairperson of the Investment Committee (2002-2008) of Smith College. In addition, Ms. Small served as Chief Investment Officer, Director of Global Equity Investments, and a member of the Board of Directors of Scudder, Stevens & Clark and Scudder Kemper Investments. |
William S. Stavropoulos (72) |
| Year of Election or Appointment: 2001 Mr. Stavropoulos is Vice Chairman of the Independent Trustees of the Equity and High Income Funds (2006-present). Mr. Stavropoulos serves as President and Founder of the Michigan Baseball Foundation, the Great Lakes Loons (2007-present). Mr. Stavropoulos is Chairman Emeritus of the Board of Directors of The Dow Chemical Company, where he previously served in numerous senior management positions, including President, CEO (1995-2000; 2002-2004), Chairman of the Executive Committee (2000-2006), and as a member of the Board of Directors (1990-2006). Currently, Mr. Stavropoulos is Chairman of Univar (global distributor of commodity and specialty chemicals, 2010-present), a Director of Teradata Corporation (data warehousing and technology solutions, 2008-present), Chemical Financial Corporation, Maersk Inc. (industrial conglomerate), Tyco International, Inc. (multinational manufacturing and services, 2007-present), and a member of the Advisory Board for Metalmark Capital (private equity investment, 2005-present). Mr. Stavropoulos is a special advisor to Clayton, Dubilier & Rice, LLC (private equity investment). In addition, Mr. Stavropoulos is a member of the University of Notre Dame Advisory Council for the College of Science. |
David M. Thomas (62) |
| Year of Election or Appointment: 2008 Previously, Mr. Thomas served as Executive Chairman (2005-2006) and Chairman and Chief Executive Officer (2000-2005) of IMS Health, Inc. (pharmaceutical and healthcare information solutions). In addition, Mr. Thomas serves as a member of the Board of Directors of Fortune Brands, Inc. (consumer products), and Interpublic Group of Companies, Inc. (marketing communication, 2004-present). |
Michael E. Wiley (61) |
| Year of Election or Appointment: 2008 Mr. Wiley also serves as a Director of Asia Pacific Exploration Consolidated (international oil and gas exploration and production, 2008-present). Mr. Wiley serves as a Director of Tesoro Corporation (independent oil refiner and marketer, 2005-present), and a Director of Bill Barrett Corporation (exploration and production, 2005-present). In addition, Mr. Wiley also serves as a Director of Post Oak Bank (privately-held bank, 2004-present). Previously, Mr. Wiley served as a member of the Board of Trustees of the University of Tulsa (2000-2006; 2007-2010), as a Senior Energy Advisor of Katzenbach Partners, LLC (consulting, 2006-2007), as an Advisory Director of Riverstone Holdings (private investment), Chairman, President, and CEO of Baker Hughes, Inc. (oilfield services, 2000-2004), and as Director of Spinnaker Exploration Company (exploration and production, 2001-2005). |
Annual Report
Trustees and Officers - continued
+ The information above includes each Trustee's principal occupation during the last five years and other information relating to the experience, attributes, and skills relevant to each Trustee's qualifications to serve as a Trustee, which led to the conclusion that each Trustee should serve as a Trustee for the fund.
Advisory Board Members and Executive Officers:
Correspondence intended for each executive officer, Edward C. Johnson 3d, and Peter S. Lynch may be sent to Fidelity Investments, 82 Devonshire Street, Boston, Massachusetts 02109.
Name, Age; Principal Occupation |
Edward C. Johnson 3d (81) |
| Year of Election or Appointment: 2011 Member of the Advisory Board of Fidelity's Equity and High Income Funds. Mr. Johnson serves as Chief Executive Officer, Chairman, and a Director of FMR LLC, and also serves as Chairman and Director of FIL Limited. Previously, Mr. Johnson served as a Trustee and Chairman of the Board of certain Fidelity Trusts, Chairman and a Director of FMR, Chairman and a Director of FMR Co., Inc., and President of FMR LLC (2006-2007). |
Peter S. Lynch (67) |
| Year of Election or Appointment: 2003 Member of the Advisory Board of Fidelity's Equity and High Income Funds. Mr. Lynch is Vice Chairman and a Director of FMR and FMR Co., Inc. In addition, Mr. Lynch serves as a Trustee of Boston College and as the Chairman of the Inner-City Scholarship Fund. Previously, Mr. Lynch served on the Special Olympics International Board of Directors (1997-2006). |
Kenneth B. Robins (42) |
| Year of Election or Appointment: 2008 President and Treasurer of Fidelity's Equity and High Income Funds. Mr. Robins also serves as President and Treasurer (2010-present) and Assistant Treasurer (2009-present) of other Fidelity funds and is an employee of Fidelity Investments (2004-present). Previously, Mr. Robins served as Deputy Treasurer of the Fidelity funds (2005-2008) and Treasurer and Chief Financial Officer of The North Carolina Capital Management Trust: Cash and Term Portfolios (2006-2008). |
Bruce T. Herring (46) |
| Year of Election or Appointment: 2006 Vice President of certain Equity Funds. Mr. Herring also serves as Chief Investment Officer and Director of Fidelity Management & Research (U.K.) Inc. (2010-present) and Group Chief Investments Officer of FMR. Previously, Mr. Herring served as Vice President (2005-2006) and Senior Vice President (2006-2007) of Fidelity Management & Research Company, Vice President of FMR Co., Inc. (2001-2007) and as a portfolio manager for Fidelity U.S. Equity Funds. |
Brian B. Hogan (47) |
| Year of Election or Appointment: 2009 Vice President of Equity and High Income Funds. Mr. Hogan also serves as President of FMR's Equity Division (2009-present). Previously, Mr. Hogan served as Senior Vice President, Equity Research of FMR (2006-2009) and as a portfolio manager. |
Scott C. Goebel (43) |
| Year of Election or Appointment: 2008 Secretary and Chief Legal Officer (CLO) of the Fidelity funds. Mr. Goebel also serves as Secretary of Fidelity Investments Money Management, Inc. (FIMM) (2010-present) and Fidelity Research and Analysis Company (FRAC) (2010-present); Secretary and CLO of The North Carolina Capital Management Trust: Cash and Term Portfolios (2008-present); General Counsel, Secretary, and Senior Vice President of FMR (2008-present) and FMR Co., Inc. (2008-present); employed by FMR LLC or an affiliate (2001-present); Chief Legal Officer of Fidelity Management & Research (Hong Kong) Limited (2008-present) and Assistant Secretary of Fidelity Management & Research (Japan) Inc. (2008-present), and Fidelity Management & Research (U.K.) Inc. (2008-present). Previously, Mr. Goebel served as Assistant Secretary of FIMM (2008-2010), FRAC (2008-2010), and the Funds (2007-2008) and as Vice President and Secretary of Fidelity Distributors Corporation (FDC) (2005-2007). |
William C. Coffey (42) |
| Year of Election or Appointment: 2009 Assistant Secretary of Fidelity's Equity and High Income Funds. Mr. Coffey also serves as Senior Vice President and Deputy General Counsel of FMR LLC (2010-present), and is an employee of Fidelity Investments. Previously, Mr. Coffey served as Vice President and Associate General Counsel of FMR LLC (2005-2009). |
Holly C. Laurent (57) |
| Year of Election or Appointment: 2008 Anti-Money Laundering (AML) Officer of the Fidelity funds. Ms. Laurent also serves as AML Officer of The North Carolina Capital Management Trust: Cash and Term Portfolios (2008-present) and is an employee of Fidelity Investments. Previously, Ms. Laurent was Senior Vice President and Head of Legal for Fidelity Business Services India Pvt. Ltd. (2006-2008), and Senior Vice President, Deputy General Counsel and Group Head for FMR LLC (2005-2006). |
Christine Reynolds (53) |
| Year of Election or Appointment: 2008 Chief Financial Officer of the Fidelity funds. Ms. Reynolds became President of Fidelity Pricing and Cash Management Services (FPCMS) in August 2008. Ms. Reynolds served as Chief Operating Officer of FPCMS (2007-2008). Previously, Ms. Reynolds served as President, Treasurer, and Anti-Money Laundering officer of the Fidelity funds (2004-2007). |
Kenneth A. Rathgeber (64) |
| Year of Election or Appointment: 2004 Chief Compliance Officer of Fidelity's Equity and High Income Funds. Mr. Rathgeber is Chief Compliance Officer of Fidelity Management & Research (Hong Kong) Limited (2008-present), Fidelity Management & Research (Japan) Inc. (2008-present), FMR (2005-present), FMR Co., Inc. (2005-present), Fidelity Management & Research (U.K.) Inc. (2005-present), Fidelity Research & Analysis Company (2005-present), Fidelity Investments Money Management, Inc. (2005-present), Pyramis Global Advisors, LLC (2005-present), and Strategic Advisers, Inc. (2005-present). |
Jeffrey S. Christian (50) |
| Year of Election or Appointment: 2009 Deputy Treasurer of the Fidelity funds. Mr. Christian is an employee of Fidelity Investments. Previously, Mr. Christian served as Chief Financial Officer (2008-2009) of certain Fidelity funds and Senior Vice President of Fidelity Pricing and Cash Management Services (FPCMS) (2004-2009). |
Joseph F. Zambello (54) |
| Year of Election or Appointment: 2011 Deputy Treasurer of the Fidelity funds. Mr. Zambello is an employee of Fidelity Investments. Previously, Mr. Zambello served as Vice President of FMR's Program Management Group (2009-2011) and Vice President of the Transfer Agent Oversight Group (2005-2009). |
Adrien E. Deberghes (44) |
| Year of Election or Appointment: 2008 Deputy Treasurer of Fidelity's Equity and High Income Funds. Mr. Deberghes also serves as Vice President and Assistant Treasurer of Fidelity Rutland Square Trust II and Fidelity Commonwealth Trust II (2011-present), Assistant Treasurer of other Fidelity funds (2010-present), and is an employee of Fidelity Investments (2008-present). Previously, Mr. Deberghes served as Senior Vice President of Mutual Fund Administration at State Street Corporation (2007-2008), Senior Director of Mutual Fund Administration at Investors Bank & Trust (2005-2007), and Director of Finance for Dunkin' Brands (2000-2005). |
Stephanie J. Dorsey (42) |
| Year of Election or Appointment: 2010 Assistant Treasurer of Fidelity's Equity and High Income Funds. Ms. Dorsey also serves as Deputy Treasurer of other Fidelity funds (2008-present) and is an employee of Fidelity Investments (2008-present). Previously, Ms. Dorsey served as Treasurer (2004-2008) of the JPMorgan Mutual Funds and Vice President (2004-2008) of JPMorgan Chase Bank. |
John R. Hebble (53) |
| Year of Election or Appointment: 2009 Assistant Treasurer of Fidelity's Equity and High Income Funds. Mr. Hebble also serves as President (2011-present), Treasurer, and Chief Financial Officer of The North Carolina Capital Management Trust: Cash and Term Portfolios (2008-present), President and Treasurer of other Fidelity funds (2008-present) and is an employee of Fidelity Investments. |
Gary W. Ryan (53) |
| Year of Election or Appointment: 2005 Assistant Treasurer of the Fidelity funds. Mr. Ryan is an employee of Fidelity Investments. Previously, Mr. Ryan served as Vice President of Fund Reporting in Fidelity Pricing and Cash Management Services (FPCMS) (1999-2005). |
Jonathan Davis (43) |
| Year of Election or Appointment: 2010 Assistant Treasurer of the Fidelity funds. Mr. Davis is also Assistant Treasurer of Fidelity Rutland Square Trust II and Fidelity Commonwealth Trust II. Mr. Davis is an employee of Fidelity Investments. Previously, Mr. Davis served as Vice President and Associate General Counsel of FMR LLC (2003-2010). |
Annual Report
The Board of Trustees of Fidelity Global Commodity Stock Fund voted to pay to shareholders of record at the opening of business on record date, the following distributions per share derived from capital gains realized from sales of portfolio securities, and dividends derived from net investment income:
| Pay Date | Record Date | Dividends | Capital Gains |
Class A | 12/12/11 | 12/09/11 | $0.052 | $0.014 |
Class T | 12/12/11 | 12/09/11 | $0.009 | $0.014 |
Class B | 12/12/11 | 12/09/11 | - | - |
Class C | 12/12/11 | 12/09/11 | - | - |
Class A designates 100% and 54%; Class T designates 100% and 54%; Class B designates 100% and 54%; and Class C designates 100% and 54% of the dividends distributed on December 10th and December 30th, respectively during the fiscal year as qualifying for the dividends received deduction for corporate shareholders.
Class A, T, B, and C designate 100% of the dividends distributed during the fiscal year as amounts which may be taken into account as a dividend for purposes of the maximum rate under section 1(h)(11) of the Internal Revenue Code.
The amounts per share which represent income derived from sources within, and taxes paid to, foreign countries or possessions of the United States are as follows:
| Pay Date | Income | Taxes |
Class A | 12/13/10 | $0.053 | $0.0095 |
| 12/31/10 | $0.010 | - |
Class T | 12/13/10 | $0.037 | $0.0095 |
| 12/31/10 | $0.010 | - |
Class B | 12/13/10 | - | - |
| 12/31/10 | - | - |
Class C | 12/13/10 | $0.016 | $0.0095 |
| 12/31/10 | $0.010 | - |
The fund will notify shareholders in January 2012 of amounts for use in preparing 2011 income tax returns.
Annual Report
Board Approval of Investment Advisory Contracts and Management Fees
Fidelity Global Commodity Stock Fund
Each year, the Board of Trustees, including the Independent Trustees (together, the Board), votes on the renewal of the management contract and sub-advisory agreements (together, the Advisory Contracts) for the fund. The Board, assisted by the advice of fund counsel and Independent Trustees' counsel, requests and considers a broad range of information relevant to the renewal of the Advisory Contracts throughout the year.
The Board meets regularly and considers at each of its meetings factors that are relevant to its annual consideration of the renewal of the fund's Advisory Contracts, including the services and support provided to the fund and its shareholders. The Board has established various standing committees, each composed of Independent Trustees with varying backgrounds, to which the Board has assigned specific subject matter responsibilities in order to enhance effective decision-making by the Board. The Board, acting directly and through its Committees, requests and receives information concerning the annual consideration of the renewal of the fund's Advisory Contracts. The Board also meets as needed to consider matters specifically related to the Board's annual consideration of the renewal of Advisory Contracts. Members of the Board may also meet with trustees of other Fidelity funds through ad hoc joint committees to discuss certain matters relevant to the Fidelity funds.
At its July 2011 meeting, the Board of Trustees, including the Independent Trustees, unanimously determined to renew the fund's Advisory Contracts. In reaching its determination, the Board considered all factors it believed relevant, including (i) the nature, extent, and quality of the services to be provided to the fund and its shareholders (including the investment performance of the fund); (ii) the competitiveness of the fund's management fee and total expense ratio; (iii) the total costs of the services to be provided by and the profits to be realized by Fidelity from its relationship with the fund; (iv) the extent to which economies of scale would be realized as the fund grows; and (v) whether fee levels reflect these economies of scale, if any, for the benefit of fund shareholders.
In considering whether to renew the Advisory Contracts for the fund, the Board reached a determination, with the assistance of fund counsel and Independent Trustees' counsel and through the exercise of its business judgment, that the renewal of the Advisory Contracts is in the best interests of the fund and its shareholders and that the compensation payable under the Advisory Contracts is fair and reasonable. The Board's decision to renew the Advisory Contracts was not based on any single factor, but rather was based on a comprehensive consideration of all the information provided to the Board at its meetings throughout the year. The Board, in reaching its determination to renew the Advisory Contracts, is aware that shareholders in the fund have a broad range of investment choices available to them, including a wide choice among mutual funds offered by Fidelity's competitors, and that the fund's shareholders, who have the opportunity to review and weigh the disclosure provided by the fund in its prospectus and other public disclosures, have chosen to invest in this fund, managed by Fidelity.
Annual Report
Board Approval of Investment Advisory Contracts and
Management Fees - continued
Nature, Extent, and Quality of Services Provided. The Board considered the staffing within the investment adviser, FMR, and the sub-advisers (together, the Investment Advisers), including the backgrounds of the fund's investment personnel and the fund's investment objective and discipline. The Independent Trustees also had discussions with senior management of Fidelity's investment operations and investment groups. The Board considered the structure of the portfolio manager compensation program and whether this structure provides appropriate incentives to act in the best interests of the fund.
Resources Dedicated to Investment Management and Support Services. The Board and the Fund Oversight and Research Committees reviewed the general qualifications and capabilities of the Investment Advisers' investment staff, including its size, education, experience, and resources, as well as the Investment Advisers' approach to recruiting, training, managing, and compensating investment personnel. The Board also noted that FMR has devoted increased resources to non-U.S. offices. The Board noted that Fidelity's analysts have extensive resources, tools and capabilities which allow them to conduct sophisticated quantitative and fundamental analysis, as well as credit analysis of issuers, counterparties and enhancers. The Board also believes that Fidelity's investment professionals have sufficient access to global information and data so as to provide competitive investment results over time, and that those professionals also have access to sophisticated tools which permit them to assess portfolio construction and risk and performance attribution characteristics continuously, as well as to transmit new information and research conclusions rapidly around the world. Additionally, in their deliberations, the Board considered the Investment Advisers' trading capabilities and resources which are an integral part of the investment management process.
Shareholder and Administrative Services. The Board considered (i) the nature, extent, quality, and cost of advisory, administrative, and shareholder services performed by the Investment Advisers and their affiliates under the Advisory Contracts and under separate agreements covering transfer agency, pricing and bookkeeping, and securities lending services for the fund; (ii) the nature and extent of the investment adviser's supervision of third party service providers, principally custodians and subcustodians; and (iii) the resources devoted to, and the record of compliance with, the fund's compliance policies and procedures. The Board also reviewed the allocation of fund brokerage, including allocations to brokers affiliated with the Investment Advisers, the use of brokerage commissions to pay fund expenses, and the use of "soft" commission dollars to pay for research services.
The Board noted that the growth of fund assets over time across the complex allows Fidelity to reinvest in the development of services designed to enhance the value or convenience of the Fidelity funds as investment vehicles. These services include 24-hour access to account information and market information through telephone representatives and over the Internet, investor education materials and asset allocation tools, and the expanded availability of Fidelity Investor Centers, with 35 new branches opening since 2010.
Annual Report
Investment in a Large Fund Family. The Board considered the benefits to shareholders of investing in a Fidelity fund, including the benefits of investing in a fund that is part of a large family of funds offering a variety of investment disciplines and providing a large variety of mutual fund investor services. The Board noted that Fidelity had taken, or had made recommendations that resulted in the Fidelity funds taking, a number of actions over the previous year that benefited particular funds, including (i) continuing to dedicate additional resources to investment research and support of the senior management team that oversees asset management; (ii) rationalizing product lines through the mergers of six funds into other funds; (iii) continuing to migrate the Freedom Funds to dedicated lower cost underlying funds; (iv) obtaining shareholder approval to broaden the investment strategies for Fidelity Consumer Finance Portfolio, Fidelity Emerging Asia Fund, and Fidelity Environment and Alternative Energy Portfolio; (v) contractually agreeing to reduce the management fees and impose other expense limitations on Spartan 500 Index Fund and U.S. Bond Index Fund in connection with launching new institutional classes of these funds; (vi) changing the name, primary and supplemental benchmarks, and investment policies of Fidelity Global Strategies Fund to support the fund's flexible investment mandate and global orientation; and (vii) reducing the transfer agency account fee rates on certain accounts.
Investment Performance. The Board considered whether the fund has operated in accordance with its investment objective, as well as its record of compliance with its investment restrictions. It also reviewed the fund's absolute investment performance for each class, as well as the fund's relative investment performance for each class measured against a third-party-sponsored index that reflects the market sector in which the fund invests. The Board noted that FMR does not believe that a meaningful peer group exists against which to compare the fund's performance. Because the fund had been in existence less than three calendar years, the following chart considered by the Board shows, for the one-year period ended December 31, 2010, the total returns of the retail class and Class B of the fund and the total return of a third-party-sponsored index ("benchmark").
Annual Report
Board Approval of Investment Advisory Contracts and
Management Fees - continued
Fidelity Global Commodity Stock Fund
The Board noted that the investment performance of the retail class of the fund compared favorably to its benchmark for the period shown. The Board considered that the variations in performance among the fund's classes reflect the variations in class expenses, which result in lower performance for higher expense classes. The Board also reviewed the fund's performance since inception as well as performance in the current year. The Board noted that it is difficult to evaluate in any comprehensive fashion the performance of the fund, in light of its relatively recent commencement of operations.
Based on its review, the Board concluded that the nature, extent, and quality of services provided to the fund under the Advisory Contracts should benefit the fund's shareholders.
Competitiveness of Management Fee and Total Expense Ratio. The Board considered the fund's management fee and total expense ratio compared to "mapped groups" of competitive funds and classes. Fidelity creates "mapped groups" by combining similar Lipper investment objective categories that have comparable management fee characteristics. Combining Lipper investment objective categories aids the Board's management fee and total expense ratio comparisons by broadening the competitive group used for comparison and by reducing the number of universes to which various Fidelity funds are compared.
Management Fee. The Board considered two proprietary management fee comparisons for the 12-month (or shorter) periods shown in the chart below. The group of Lipper funds used by the Board for management fee comparisons is referred to below as the "Total Mapped Group." The Total Mapped Group comparison focuses on a fund's standing relative to the total universe of comparable funds available to investors in terms of gross management fees before expense reimbursements or caps. "TMG %" represents the percentage of funds in the Total Mapped Group that had management fees that were lower than the fund's. For example, a TMG % of 30% means that 70% of the funds in the Total Mapped Group had higher management fees than the fund. The "Asset-Size Peer Group" (ASPG) comparison focuses on a fund's standing relative to non-Fidelity funds similar in size to the fund within the Total Mapped Group. The ASPG represents at least 15% of the funds in the Total Mapped Group with comparable asset size and management fee characteristics, subject to a minimum of 50 funds (or all funds in the Total Mapped Group if fewer than 50). Additional information, such as the ASPG quartile in which the fund's management fee ranked, is also included in the chart and considered by the Board.
Annual Report
Fidelity Global Commodity Stock Fund
The Board noted that the fund's management fee ranked below the median of its Total Mapped Group and below the median of its ASPG for 2010.
Based on its review, the Board concluded that the fund's management fee is fair and reasonable in light of the services that the fund receives and the other factors considered.
Total Expense Ratio. In its review of each class's total expense ratio, the Board considered the fund's management fee as well as other fund or class expenses, as applicable, such as transfer agent fees, pricing and bookkeeping fees, fund-paid 12b-1 fees, and custodial, legal, and audit fees. The Board also noted the effects of any waivers and reimbursements on fees and expenses. As part of its review, the Board also considered the current and historical total expense ratios of each class of the fund compared to competitive fund median expenses. Each class of the fund is compared to those funds and classes in the Total Mapped Group (used by the Board for management fee comparisons) that have a similar sales load structure.
Annual Report
Board Approval of Investment Advisory Contracts and
Management Fees - continued
The Board noted that the total expense ratio of each of Class A, Class B, Class C, Institutional Class, and the retail class ranked below its competitive median for 2010 and the total expense ratio of Class T ranked above its competitive median for 2010. The Board considered that various factors, including 12b-1 fees, positive or negative performance adjustments, and relatively higher other expenses in the case of small fund size, can affect total expense ratios. The Board noted that the total expense ratio of Class T was above the competitive median primarily because of higher 12b-1 fees on Class T. Class T has a higher 12b-1 fee, but a lower front-end sales charge, than traditionally priced front-end sales charge classes. The Board noted that the fund offers multiple classes, each of which has a different sales load and 12b-1 fee structure, and that the multiple structures are intended to offer a range of pricing options for the intermediary market. The Board also noted that the total expense ratios of the classes vary primarily by the level of their 12b-1 fees, although differences in transfer agent fees may also cause expenses to vary from class to class.
Fees Charged to Other Fidelity Clients. The Board also considered Fidelity fee structures and other information with respect to clients of FMR and its affiliates, such as other mutual funds advised or subadvised by FMR or its affiliates, pension plan clients, and other institutional clients. In March 2010, the Board created an ad hoc joint committee with the board of other Fidelity funds (the Committee) to review and compare Fidelity's institutional investment advisory business with its business of providing services to the Fidelity funds, including the differences in services provided, fees charged, and costs incurred, as well as competition in their respective marketplaces.
Based on its review of total expense ratios and fees charged to other Fidelity clients, the Board concluded that the total expense ratio of each class of the fund was reasonable, although Class T was above the median of the universe presented for comparison, in light of the services that the fund and its shareholders receive and the other factors considered, including the findings of the Committee.
Costs of the Services and Profitability. The Board considered the revenues earned and the expenses incurred by Fidelity in conducting the business of developing, marketing, distributing, managing, administering and servicing the fund and its shareholders. The Board also considered the level of Fidelity's profits in respect of all the Fidelity funds.
On an annual basis, FMR presents to the Board Fidelity's profitability for the fund. Fidelity calculates the profitability for each fund, as well as aggregate profitability for groups of Fidelity funds and all Fidelity funds, using a series of detailed revenue and cost allocation methodologies which originate with the books and records of Fidelity on which Fidelity's audited financial statements are based. The Audit Committee of the Board reviews any significant changes from the prior year's methodologies.
Annual Report
PricewaterhouseCoopers LLP (PwC), independent registered public accounting firm and auditor to Fidelity and certain Fidelity funds, has been engaged annually by the Board as part of the Board's assessment of Fidelity's profitability analysis. PwC's engagement includes the review and assessment of Fidelity's methodologies used in determining the revenues and expenses attributable to Fidelity's mutual fund business, and completion of agreed-upon procedures surrounding the mathematical accuracy of fund profitability and its conformity to allocation methodologies. After considering PwC's reports issued under the engagement and information provided by Fidelity, the Board concluded that while other allocation methods may also be reasonable, Fidelity's profitability methodologies are reasonable in all material respects.
The Board also reviewed Fidelity's non-fund businesses and fall-out benefits related to the mutual fund business as well as cases where Fidelity's affiliates may benefit from or be related to the fund's business.
The Board considered the costs of the services provided by and the profits realized by Fidelity in connection with the operation of the fund and was satisfied that the profitability was not excessive in the circumstances.
Economies of Scale. The Board considered whether there have been economies of scale in respect of the management of the Fidelity funds, whether the Fidelity funds (including the fund) have appropriately benefited from any such economies of scale, and whether there is potential for realization of any further economies of scale. The Board considered the extent to which the fund will benefit from economies of scale through increased services to the fund, through waivers or reimbursements, or through fee or expense reductions. The Board also noted that in 2009, it and the board of other Fidelity funds created an ad hoc committee (the Economies of Scale Committee) to analyze whether FMR attains economies of scale in respect of the management and servicing of the Fidelity funds, whether the Fidelity funds have appropriately benefited from such economies of scale, and whether there is potential for realization of any further economies of scale.
The Board recognized that the fund's management contract incorporates a "group fee" structure, which provides for lower group fee rates as total fund assets under FMR's management increase, and for higher group fee rates as total fund assets under FMR's management decrease. FMR calculates the group fee rates based on a tiered asset "breakpoint" schedule that varies based on asset class. The Board considered that the group fee is designed to deliver the benefits of economies of scale to fund shareholders when total Fidelity fund assets increase, even if assets of any particular fund are unchanged or have declined, because some portion of Fidelity's costs are attributable to services provided to all Fidelity funds, and all funds benefit if those costs can be allocated among more assets. The Board concluded that, given the group fee structure, fund shareholders will benefit from lower management fees as assets under FMR's management increase at the fund complex level, regardless of whether Fidelity achieves any such economies of scale.
Annual Report
Board Approval of Investment Advisory Contracts and
Management Fees - continued
The Board concluded, taking into account the analysis of the Economies of Scale Committee, that any potential economies of scale are being appropriately shared between fund shareholders and Fidelity.
Additional Information Requested by the Board. In order to develop fully the factual basis for consideration of the Fidelity funds' Advisory Contracts, the Board requested and received additional information on certain topics, including (i) fund performance trends, actions to be taken by FMR to improve certain funds' overall performance, and Fidelity's long-term strategies for certain funds; (ii) portfolio manager changes that have occurred during the past year and length of portfolio manager tenure for different categories of funds over time; (iii) Fidelity's compensation structure for portfolio managers and other key personnel and strategies for attracting and retaining non-investment personnel; (iv) the amount of the investment that each portfolio manager has made in the Fidelity fund(s) that he or she manages; (v) historical trends in Fidelity's realization of fall-out benefits; (vi) Fidelity's group fee structures and the rationale for the individual fee rates of certain funds; (vii) fund profitability methodology and the impact of certain factors on fund profitability results; (viii) trends regarding industry use of performance fee structures and Fidelity's compliance practices with respect to performance adjustment calculations; (ix) the fee structures in place for certain other Fidelity clients; and (x) explanations regarding the relative total expense ratios of certain funds and classes, total expense competitive trends, and actions that might be taken by FMR to reduce total expense ratios for certain funds and classes.
Based on its evaluation of all of the conclusions noted above, and after considering all factors it believed relevant, the Board ultimately concluded that the advisory fee structures are fair and reasonable, and that the fund's Advisory Contracts should be renewed.
Annual Report
Investment Adviser
Fidelity Management & Research Company
Boston, MA
Investment Sub-Advisers
FMR Co., Inc.
Fidelity Management & Research
(U.K.) Inc.
FIL Investment Advisors
FIL Investments (Japan) Limited
FIL Investment Advisors (U.K.) Limited
Fidelity Management & Research
(Hong Kong) Limited
Fidelity Management & Research
(Japan) Inc.
General Distributor
Fidelity Distributors Corporation
Boston, MA
Transfer and Service Agents
Fidelity Investments Institutional
Operations Company, Inc.
Boston, MA
Fidelity Service Company, Inc.
Boston, MA
Custodian
State Street Bank and Trust Company
Quincy, MA
AGCS-UANN-1211
1.879395.102
(Fidelity Logo)
Fidelity Advisor®
Global Commodity Stock
Fund - Institutional Class
Annual Report
October 31, 2011
(Fidelity Cover Art)
Institutional Class is a
class of Fidelity® Global
Commodity Stock Fund
Contents
Chairman's Message | (Click Here) | The Chairman's message to shareholders. |
Performance | (Click Here) | How the fund has done over time. |
Management's Discussion of Fund Performance | (Click Here) | The Portfolio Manager's review of fund performance and strategy. |
Shareholder Expense Example | (Click Here) | An example of shareholder expenses. |
Investment Changes | (Click Here) | A summary of major shifts in the fund's investments over the past six months. |
Investments | (Click Here) | A complete list of the fund's investments with their market values. |
Financial Statements | (Click Here) | Statements of assets and liabilities, operations, and changes in net assets, as well as financial highlights. |
Notes | (Click Here) | Notes to the financial statements. |
Report of Independent Registered Public Accounting Firm | (Click Here) | |
Trustees and Officers | (Click Here) | |
Distributions | (Click Here) | |
Board Approval of Investment Advisory Contracts and Management Fees | (Click Here) | |
To view a fund's proxy voting guidelines and proxy voting record for the 12-month period ended June 30, visit http://www.fidelity.com/proxyvotingresults or visit the Securities and Exchange Commission's (SEC) web site at http://www.sec.gov. You may also call 1-877-208-0098 to request a free copy of the proxy voting guidelines.
Standard & Poor's, S&P and S&P 500 are registered service marks of The McGraw-Hill Companies, Inc. and have been licensed for use by Fidelity Distributors Corporation.
Other third party marks appearing herein are the property of their respective owners.
All other marks appearing herein are registered or unregistered trademarks or service marks of FMR LLC or an affiliated company.
Annual Report
This report and the financial statements contained herein are submitted for the general information of the shareholders of the fund. This report is not authorized for distribution to prospective investors in the fund unless preceded or accompanied by an effective prospectus.
A fund files its complete schedule of portfolio holdings with the SEC for the first and third quarters of each fiscal year on Form N-Q. Forms N-Q are available on the SEC's web site at http://www.sec.gov. A fund's Forms N-Q may be reviewed and copied at the SEC's Public Reference Room in Washington, DC. Information regarding the operation of the SEC's Public Reference Room may be obtained by calling 1-800-SEC-0330. For a complete list of a fund's portfolio holdings, view the most recent holdings listing, semiannual report, or annual report on Fidelity's web site at http://www.fidelity.com, http://www.advisor.fidelity.com, or http://www.401k.com, as applicable.
NOT FDIC INSURED • MAY LOSE VALUE • NO BANK GUARANTEE
Neither the fund nor Fidelity Distributors Corporation is a bank.
Annual Report
(Acting Chairman's Photograph)
Dear Shareholder:
Global equity markets began the fourth quarter on a strong note, sharply reversing course in October amid strong corporate earnings, better-than-expected economic news and the promise of a resolution to the sovereign debt crisis in Europe. The mini rally followed a third quarter marked by a significant downturn in July and August, which heightened investor anxiety and set off a wave of volatility that hampered most major asset classes through the end of September. Financial markets are difficult to predict, of course, but you can help put the odds in your favor by following these time-tested investment principles.
One of the basic tenets is to invest according to your time horizon. For long-term investors, riding out the markets' inevitable ups and downs has proven much more effective than making decisions based on short-term developments. If your goal is approaching, you can also benefit from patience and restraint, rather than attempting to time the market. No matter your time horizon, missing only a few of the markets' best days can significantly diminish returns. Patience also affords the benefits of compounding - earning interest on additional income or reinvested dividends and capital gains. While staying the course doesn't eliminate risk, it can considerably lessen the negative impact of short-term downturns.
Asset allocation is another principle to manage risk. As you spread your portfolio among the asset classes, be sure to consider your time horizon, risk tolerance and investment objectives. Younger investors may be better served by emphasizing equities, which historically have been the best-performing asset class over time. Investors who are nearing a specific goal, such as retirement or sending a child to college, may choose to favor bonds and other investments that have tended to be more stable. Studies indicate that asset allocation is the single most important determinant of a portfolio's long-term success. After deciding on a suitable allocation strategy, make sure your portfolio is adequately diversified, with exposure to stocks of small-, mid- and large-cap companies in a range of sectors, for example. And today, more than ever, geographic diversification should be taken into account.
Lastly, investing a certain amount of money on a regular basis - a principle known as dollar-cost averaging - can help lower the average cost of your purchases, while also giving you the discipline to avoid selling weak performers just prior to an upswing, or chasing a hot performer just before a correction.
We invite you to learn more by visiting us on the Internet, dropping by one of our Investor Centers or calling us by phone. It is our privilege to provide the resources you need to choose investments that are right for you.
Sincerely,
(Acting Chairman's Signature)
James C. Curvey
Acting Chairman
Annual Report
Average annual total return reflects the change in the value of an investment, assuming reinvestment of the class' distributions from dividend income and capital gains (the profits earned upon the sale of securities that have grown in value, if any) and assuming a constant rate of performance each year. The $10,000 table and the fund's returns do not reflect the deduction of taxes that a shareholder would pay on fund distributions or the redemption of fund shares. During periods of reimbursement by Fidelity, a fund's total return will be greater than it would be had the reimbursement not occurred. How a fund did yesterday is no guarantee of how it will do tomorrow.
Average Annual Total Returns
Periods ended October 31, 2011 | Past 1
year | Life of
fund A |
Institutional Class | -1.50% | 18.40% |
A From March 25, 2009.
$10,000 Over Life of Fund
Let's say hypothetically that $10,000 was invested in Fidelity Advisor® Global Commodity Stock Fund - Institutional Class on March 25, 2009, when the fund started. The chart shows how the value of your investment would have changed, and also shows how the MSCI® ACWI® (All Country World Index) Index performed over the same period.
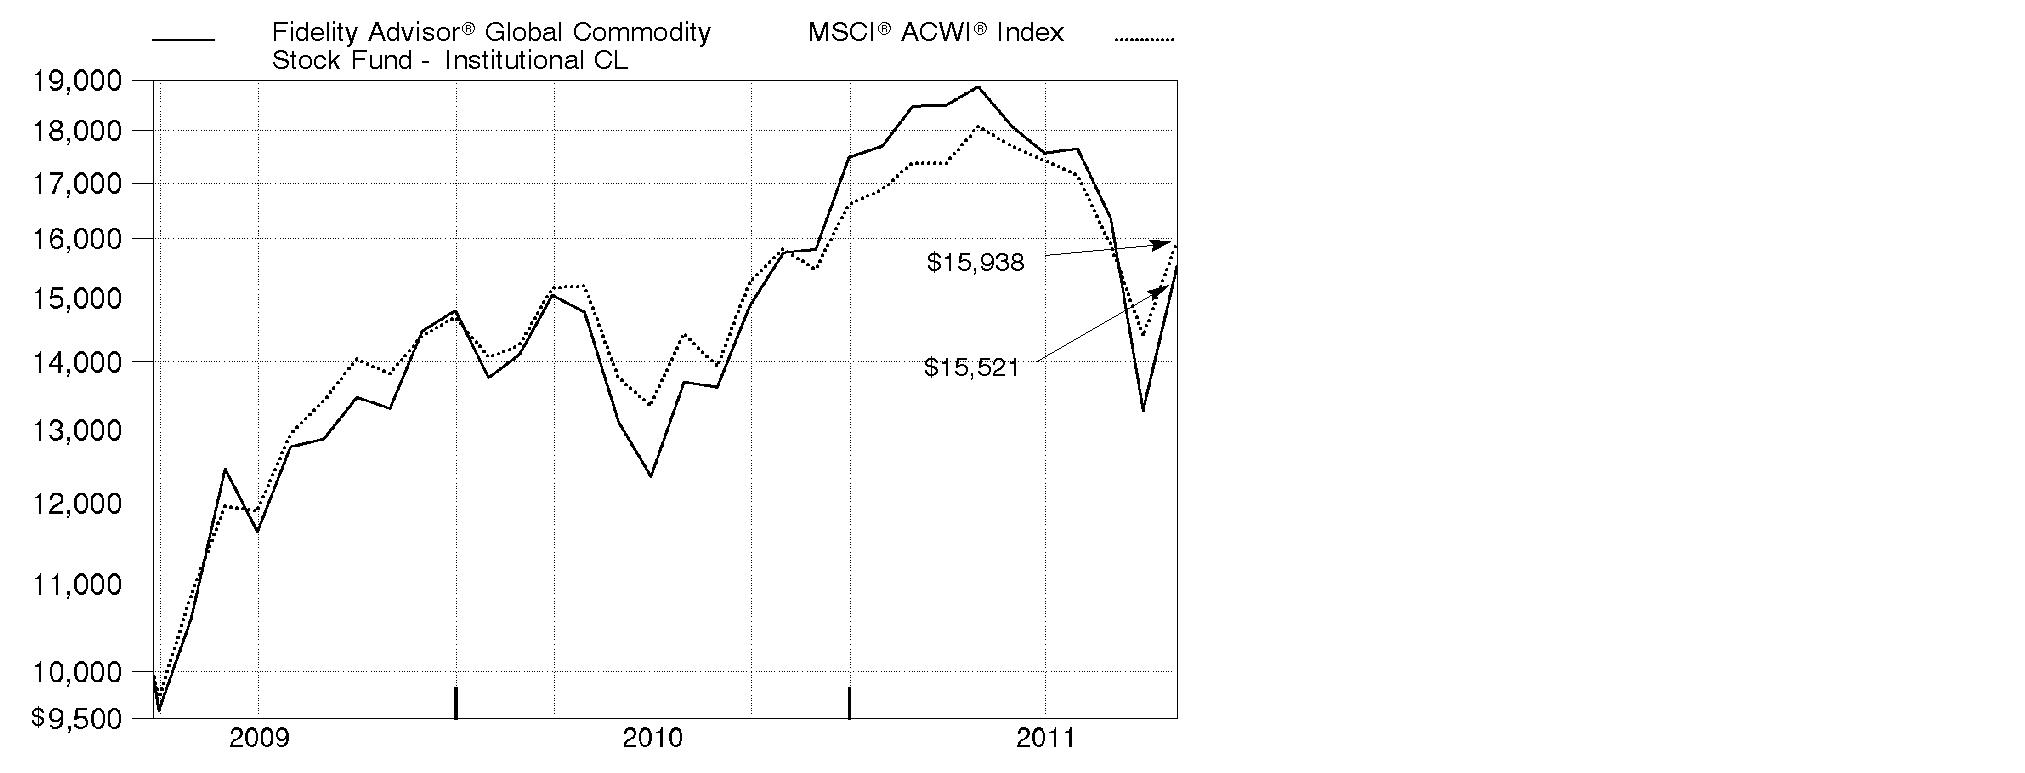
Annual Report
Market Recap: International equities were rocked by a number of headline events during the year ending October 31, 2011. Stocks posted a solid advance for the first half of the period, despite concern about the sovereign debt crisis in Europe, a devastating earthquake and tsunami in Japan, and political upheaval in the Middle East and North Africa. Sentiment turned decidedly negative in the second half, however, as fresh worries about Europe, inflation in China and a dimmed outlook for global growth caused foreign markets to suffer declines that intensified in August and September. October brought with it yet another dramatic swing, as eurozone policymakers appeared near a resolution to the debt debacle and buyers stormed back onto the scene in search of bargains. Still, those gains - along with favorable currency fluctuations overall - weren't enough to offset prior losses, and the MSCI® ACWI® (All Country World Index) ex USA Index finished the period down 4.56%. Within the MSCI index, Europe and emerging markets suffered the biggest declines, with many countries in these areas sustaining steep losses. By contrast, Japan showed resilience in the wake of its natural disasters, falling only 2%. Australia (+4%), Switzerland (+3%), the U.K. (+2%) and Canada, which produced a nominal return, were among the few major benchmark components to break into positive territory.
Comments from S. Joseph Wickwire II, Portfolio Manager of Fidelity Advisor® Global Commodity Stock Fund: For the year, the fund's Institutional Class shares returned -1.50%, lagging the -1.10% result of the MSCI® ACWI® (All Country World Index) Commodity Producers Sector Capped Index. Stock picking in coal/consumable fuels and oil/gas exploration and production (E&P) detracted, as did positioning in integrated oil/gas. Detractors included coal-producer Alpha Natural Resources and Australian uranium company Paladin Energy. Underweightings in integrated oil/gas companies ConocoPhillips and Royal Dutch Shell and overweightings in E&P companies Niko Resources and Petrobank Energy & Resources also hurt. Conversely, the fund benefited from an overweighting in the outperforming gold group, including Barrick Gold and Newmont Mining. Oil/gas equipment and services stocks, such as ION Geophysical, Halliburton and C&J Energy Services also helped, as did oil/gas refining and marketing names CVR Energy, Frontier Oil, Tesoro, Holly and Valero Energy. Frontier Oil and Holly merged during the period. Several of the stocks I've mentioned were not in the index or were sold by period end.
The views expressed above reflect those of the portfolio manager(s) only through the end of the period as stated on the cover of this report and do not necessarily represent the views of Fidelity or any other person in the Fidelity organization. Any such views are subject to change at any time based upon market or other conditions and Fidelity disclaims any responsibility to update such views. These views may not be relied on as investment advice and, because investment decisions for a Fidelity fund are based on numerous factors, may not be relied on as an indication of trading intent on behalf of any Fidelity fund.
Annual Report
Shareholder Expense Example
As a shareholder of the Fund, you incur two types of costs: (1) transaction costs, including sales charges (loads) on purchase payments or redemption proceeds, redemption fees, and (2) ongoing costs, including management fees, distribution and/or service (12b-1) fees and other Fund expenses. This Example is intended to help you understand your ongoing costs (in dollars) of investing in the Fund and to compare these costs with the ongoing costs of investing in other mutual funds.
The Example is based on an investment of $1,000 invested at the beginning of the period and held for the entire period (May 1, 2011 to October 31, 2011).
Actual Expenses
The first line of the accompanying table for each class of the Fund provides information about actual account values and actual expenses. You may use the information in this line, together with the amount you invested, to estimate the expenses that you paid over the period. Simply divide your account value by $1,000.00 (for example, an $8,600 account value divided by $1,000.00 = 8.6), then multiply the result by the number in the first line for a class of the Fund under the heading entitled "Expenses Paid During Period" to estimate the expenses you paid on your account during this period. A small balance maintenance fee of $12.00 that is charged once a year may apply for certain accounts with a value of less than $2,000. This fee is not included in the table below. If it was, the estimate of expenses you paid during the period would be higher, and your ending account value lower, by this amount. In addition, the Fund, as a shareholder in the underlying Fidelity Central Funds, will indirectly bear its pro-rata share of the fees and expenses incurred by the underlying Fidelity Central Funds. These fees and expenses are not included in the Fund's annualized expense ratio used to calculate the expense estimate in the table below.
Hypothetical Example for Comparison Purposes
The second line of the accompanying table for each class of the Fund provides information about hypothetical account values and hypothetical expenses based on a Class' actual expense ratio and an assumed rate of return of 5% per year before expenses, which is not the Class' actual return. The hypothetical account values and expenses may not be used to estimate the actual ending account balance or expenses you paid for the period. You may use this information to compare the ongoing costs of investing in the Fund and other funds. To do so, compare this 5% hypothetical example with the 5% hypothetical examples that appear in the shareholder reports of the other funds. A small balance maintenance fee of $12.00 that is charged once a year may apply for certain accounts with a value of less than $2,000. This fee is not included in the table below. If it was, the estimate of expenses you paid during the period would be higher, and your ending account value lower, by this amount. In addition, the Fund, as a shareholder in the underlying Fidelity Central Funds, will indirectly bear its pro-rata share of the fees and expenses incurred by the underlying Fidelity Central Funds. These fees and expenses are not included in the Fund's annualized expense ratio used to calculate the expense estimate in the table below.
Please note that the expenses shown in the table are meant to highlight your ongoing costs only and do not reflect any transaction costs. Therefore, the second line of the table is useful in comparing ongoing costs only, and will not help you determine the relative total costs of owning different funds. In addition, if these transactional costs were included, your costs would have been higher.
Annual Report
Shareholder Expense Example - continued
| Annualized Expense Ratio | Beginning
Account Value
May 1, 2011 | Ending
Account Value
October 31, 2011 | Expenses Paid
During Period*
May 1, 2011 to
October 31, 2011 |
Class A | 1.31% | | | |
Actual | | $ 1,000.00 | $ 821.50 | $ 6.01 |
HypotheticalA | | $ 1,000.00 | $ 1,018.60 | $ 6.67 |
Class T | 1.60% | | | |
Actual | | $ 1,000.00 | $ 820.00 | $ 7.34 |
HypotheticalA | | $ 1,000.00 | $ 1,017.14 | $ 8.13 |
Class B | 2.09% | | | |
Actual | | $ 1,000.00 | $ 817.90 | $ 9.58 |
HypotheticalA | | $ 1,000.00 | $ 1,014.67 | $ 10.61 |
Class C | 2.09% | | | |
Actual | | $ 1,000.00 | $ 817.80 | $ 9.58 |
HypotheticalA | | $ 1,000.00 | $ 1,014.67 | $ 10.61 |
Global Commodity Stock | 1.06% | | | |
Actual | | $ 1,000.00 | $ 822.20 | $ 4.87 |
HypotheticalA | | $ 1,000.00 | $ 1,019.86 | $ 5.40 |
Institutional Class | 1.02% | | | |
Actual | | $ 1,000.00 | $ 822.70 | $ 4.69 |
HypotheticalA | | $ 1,000.00 | $ 1,020.06 | $ 5.19 |
A 5% return per year before expenses
* Expenses are equal to each Class' annualized expense ratio, multiplied by the average account value over the period, multiplied by 184/365 (to reflect the one-half year period).
Annual Report
Investment Changes (Unaudited)
Top Ten Stocks as of October 31, 2011 |
| % of fund's
net assets | % of fund's net assets
6 months ago |
Exxon Mobil Corp. | 5.3 | 4.9 |
BHP Billiton PLC | 5.0 | 5.1 |
Potash Corp. of Saskatchewan, Inc. | 4.1 | 3.8 |
Royal Dutch Shell PLC Class A (United Kingdom) | 3.1 | 2.8 |
Chevron Corp. | 2.9 | 2.4 |
Syngenta AG (Switzerland) | 2.8 | 2.3 |
Rio Tinto PLC | 2.7 | 3.1 |
Monsanto Co. | 2.6 | 1.7 |
Goldcorp, Inc. | 2.0 | 1.2 |
Barrick Gold Corp. | 2.0 | 1.3 |
| 32.5 | |
Top Sectors (% of fund's net assets) |
As of October 31, 2011 |
| Energy 37.9% | |
| Metals 31.8% | |
| Agriculture 22.8% | |
| Other 6.2% | |
| Short-Term
Investments and
Net Other Assets 1.3% | |

As of April 30, 2011 |
| Energy 36.2% | |
| Metals 34.3% | |
| Agriculture 23.8% | |
| Other 5.2% | |
| Short-Term
Investments and
Net Other Assets 0.5% | |

Annual Report
Investments October 31, 2011
Showing Percentage of Net Assets
Common Stocks - 98.7% |
| Shares | | Value |
CHEMICALS - 18.0% |
Commodity Chemicals - 0.0% |
Braskem SA (PN-A) | 26,500 | | $ 236,111 |
Grasim Industries Ltd. | 734 | | 38,980 |
| | 275,091 |
Fertilizers & Agricultural Chemicals - 17.9% |
Agrium, Inc. | 121,200 | | 9,991,690 |
CF Industries Holdings, Inc. | 58,772 | | 9,536,932 |
China Bluechemical Ltd. (H shares) | 1,122,000 | | 879,234 |
Incitec Pivot Ltd. | 411,186 | | 1,489,514 |
Israel Chemicals Ltd. | 443,600 | | 5,337,885 |
Israel Corp. Ltd. (Class A) | 1,000 | | 736,552 |
K&S AG | 129,907 | | 8,268,903 |
Monsanto Co. | 278,300 | | 20,246,325 |
Potash Corp. of Saskatchewan, Inc. | 669,700 | | 31,696,289 |
Sinofert Holdings Ltd. | 2,060,000 | | 676,070 |
Sociedad Quimica y Minera de Chile SA (PN-B) sponsored ADR | 8,400 | | 491,400 |
Syngenta AG (Switzerland) | 72,182 | | 22,001,638 |
Taiwan Fertilizer Co. Ltd. | 161,000 | | 414,969 |
The Mosaic Co. | 242,300 | | 14,189,088 |
United Phosphorous Ltd. | 66,056 | | 197,668 |
Uralkali JSC GDR (Reg. S) | 137,900 | | 5,984,860 |
Yara International ASA | 153,500 | | 7,311,624 |
| | 139,450,641 |
Specialty Chemicals - 0.1% |
LyondellBasell Industries NV Class A | 13,700 | | 450,182 |
OMNOVA Solutions, Inc. (a) | 113,301 | | 501,923 |
| | 952,105 |
TOTAL CHEMICALS | | 140,677,837 |
CONSTRUCTION & ENGINEERING - 1.4% |
Construction & Engineering - 1.4% |
Fluor Corp. | 59,100 | | 3,359,835 |
Foster Wheeler AG (a) | 302,700 | | 6,453,564 |
Shaw Group, Inc. (a) | 36,300 | | 844,338 |
| | 10,657,737 |
CONTAINERS & PACKAGING - 0.4% |
Paper Packaging - 0.4% |
Greatview Aseptic Pack Co. Ltd. | 2,810,000 | | 1,043,465 |
Common Stocks - continued |
| Shares | | Value |
CONTAINERS & PACKAGING - CONTINUED |
Paper Packaging - continued |
Rock-Tenn Co. Class A | 18,900 | | $ 1,118,691 |
Smurfit Kappa Group PLC (a) | 98,000 | | 678,247 |
| | 2,840,403 |
DIVERSIFIED FINANCIAL SERVICES - 0.0% |
Other Diversified Financial Services - 0.0% |
Polymetal International PLC | 1,350 | | 19,974 |
ELECTRICAL EQUIPMENT - 0.4% |
Electrical Components & Equipment - 0.4% |
Regal-Beloit Corp. | 59,202 | | 3,145,402 |
ENERGY EQUIPMENT & SERVICES - 5.3% |
Oil & Gas Drilling - 2.9% |
Cathedral Energy Services Ltd. | 96,370 | | 647,719 |
Ensco International Ltd. ADR | 16,700 | | 829,322 |
Helmerich & Payne, Inc. | 2,000 | | 106,360 |
Nabors Industries Ltd. (a) | 43,100 | | 790,023 |
Noble Corp. | 66,700 | | 2,397,198 |
PHX Energy Services Corp. | 3,600 | | 37,017 |
Transocean Ltd. (United States) | 212,800 | | 12,161,520 |
Trinidad Drilling Ltd. | 302,171 | | 2,364,382 |
Tuscany International Drilling, Inc. (a) | 415,000 | | 283,092 |
Unit Corp. (a) | 4,400 | | 215,864 |
Vantage Drilling Co. (a) | 2,135,982 | | 2,904,936 |
| | 22,737,433 |
Oil & Gas Equipment & Services - 2.4% |
Aker Solutions ASA | 67,800 | | 788,500 |
Baker Hughes, Inc. | 37,080 | | 2,150,269 |
Cal Dive International, Inc. (a) | 87,700 | | 196,448 |
Cameron International Corp. (a) | 700 | | 34,398 |
Compagnie Generale de Geophysique SA (a) | 81,600 | | 1,783,169 |
Halliburton Co. | 83,500 | | 3,119,560 |
ION Geophysical Corp. (a) | 1,237,600 | | 9,430,512 |
McDermott International, Inc. (a) | 17,500 | | 192,150 |
Saipem SpA | 18,781 | | 842,109 |
Schlumberger Ltd. | 700 | | 51,429 |
| | 18,588,544 |
TOTAL ENERGY EQUIPMENT & SERVICES | | 41,325,977 |
Common Stocks - continued |
| Shares | | Value |
FOOD PRODUCTS - 3.4% |
Agricultural Products - 3.4% |
Archer Daniels Midland Co. | 502,800 | | $ 14,551,032 |
Bunge Ltd. | 113,500 | | 7,010,895 |
Chaoda Modern Agriculture (Holdings) Ltd. | 2,320,000 | | 328,493 |
China Agri-Industries Holding Ltd. | 1,295,000 | | 1,032,374 |
Corn Products International, Inc. | 6,400 | | 310,400 |
Cosan Ltd. Class A | 66,400 | | 796,800 |
Golden Agri-Resources Ltd. | 1,700,000 | | 869,958 |
PT Charoen Pokphand Indonesia Tbk | 85,000 | | 25,312 |
Suedzucker AG (Bearer) | 1,100 | | 32,265 |
Viterra, Inc. | 9,900 | | 101,895 |
Wilmar International Ltd. | 273,000 | | 1,178,344 |
| | 26,237,768 |
MACHINERY - 1.6% |
Construction & Farm Machinery & Heavy Trucks - 1.6% |
Caterpillar, Inc. | 2,800 | | 264,488 |
Cummins, Inc. | 11,200 | | 1,113,616 |
Fiat Industrial SpA (a) | 817,500 | | 7,133,088 |
Jain Irrigation Systems Ltd. | 1,197,816 | | 3,052,091 |
Joy Global, Inc. | 8,900 | | 776,080 |
| | 12,339,363 |
Industrial Machinery - 0.0% |
Sandvik AB | 32,000 | | 442,485 |
TOTAL MACHINERY | | 12,781,848 |
METALS & MINING - 31.8% |
Aluminum - 0.3% |
Alcoa, Inc. | 204,400 | | 2,199,344 |
Diversified Metals & Mining - 13.7% |
Anglo American PLC (United Kingdom) | 276,251 | | 10,189,260 |
Antofagasta PLC | 1,100 | | 20,644 |
BHP Billiton PLC | 1,228,316 | | 38,686,256 |
Copper Mountain Mining Corp. (a) | 721,400 | | 3,849,975 |
Eurasian Natural Resources Corp. PLC | 31,500 | | 333,332 |
First Quantum Minerals Ltd. | 158,500 | | 3,324,708 |
Freeport-McMoRan Copper & Gold, Inc. | 209,500 | | 8,434,470 |
Glencore International PLC (e) | 5,300 | | 37,333 |
Grupo Mexico SA de CV Series B | 89,182 | | 247,792 |
Iluka Resources Ltd. | 10,483 | | 174,293 |
Common Stocks - continued |
| Shares | | Value |
METALS & MINING - CONTINUED |
Diversified Metals & Mining - continued |
Ivanhoe Australia Ltd. (a) | 478,448 | | $ 532,063 |
Ivanhoe Mines Ltd. (a) | 84,540 | | 1,730,066 |
Kazakhmys PLC | 116,700 | | 1,740,704 |
Lynas Corp. Ltd. (a) | 385,000 | | 476,413 |
Major Drilling Group International, Inc. | 3,600 | | 48,140 |
Mitsubishi Materials Corp. | 123,000 | | 326,992 |
OJSC MMC Norilsk Nickel sponsored ADR | 1,700 | | 32,725 |
Rio Tinto PLC | 382,987 | | 20,723,044 |
Sterlite Industries (India) Ltd. | 148,488 | | 384,181 |
Sumitomo Metal Mining Co. Ltd. | 101,000 | | 1,390,494 |
Teck Resources Ltd. Class B (sub. vtg.) | 118,800 | | 4,762,249 |
Vedanta Resources PLC | 3,500 | | 71,935 |
Walter Energy, Inc. | 22,800 | | 1,724,820 |
Xstrata PLC | 480,391 | | 8,077,165 |
| | 107,319,054 |
Gold - 11.0% |
Agnico-Eagle Mines Ltd. (Canada) | 109,400 | | 4,745,404 |
AngloGold Ashanti Ltd. sponsored ADR | 147,800 | | 6,682,038 |
Barrick Gold Corp. | 320,500 | | 15,821,643 |
Centerra Gold, Inc. | 33,200 | | 658,105 |
Compania de Minas Buenaventura SA sponsored ADR | 39,300 | | 1,608,549 |
Eldorado Gold Corp. | 117,400 | | 2,205,850 |
Franco-Nevada Corp. | 7,300 | | 289,188 |
Gold Fields Ltd. sponsored ADR | 167,100 | | 2,912,553 |
Goldcorp, Inc. | 325,700 | | 15,846,366 |
Harmony Gold Mining Co. Ltd. sponsored ADR | 158,500 | | 2,081,105 |
IAMGOLD Corp. | 85,100 | | 1,829,456 |
Kingsgate Consolidated NL | 309,515 | | 2,440,465 |
Kinross Gold Corp. | 482,005 | | 6,870,934 |
Kinross Gold Corp. warrants 9/17/14 (a) | 2,772 | | 6,729 |
New Gold, Inc. (a) | 38,800 | | 480,694 |
Newcrest Mining Ltd. | 212,457 | | 7,509,335 |
Newmont Mining Corp. | 132,000 | | 8,821,560 |
Osisko Mining Corp. (a) | 65,500 | | 789,798 |
Randgold Resources Ltd. sponsored ADR | 20,100 | | 2,202,357 |
Yamana Gold, Inc. | 137,700 | | 2,055,451 |
| | 85,857,580 |
Precious Metals & Minerals - 1.2% |
African Minerals Ltd. (a) | 521,600 | | 3,705,563 |
Anglo Platinum Ltd. | 11,100 | | 803,447 |
Common Stocks - continued |
| Shares | | Value |
METALS & MINING - CONTINUED |
Precious Metals & Minerals - continued |
Aquarius Platinum Ltd. (United Kingdom) | 147,000 | | $ 439,714 |
Impala Platinum Holdings Ltd. | 14,300 | | 330,567 |
Lonmin PLC | 10,422 | | 182,356 |
Northam Platinum Ltd. | 30,500 | | 118,175 |
Pan American Silver Corp. | 19,600 | | 548,016 |
Silver Standard Resources, Inc. (a) | 37,500 | | 734,625 |
Silver Wheaton Corp. | 73,400 | | 2,534,411 |
| | 9,396,874 |
Steel - 5.6% |
Allegheny Technologies, Inc. | 26,800 | | 1,243,520 |
ArcelorMittal SA Class A unit (e) | 166,200 | | 3,445,326 |
BlueScope Steel Ltd. | 338,804 | | 296,424 |
China Steel Corp. | 1,160,260 | | 1,154,352 |
Cliffs Natural Resources, Inc. | 31,300 | | 2,135,286 |
Fortescue Metals Group Ltd. | 706,010 | | 3,546,514 |
Gerdau SA sponsored ADR | 194,200 | | 1,751,684 |
Hyundai Steel Co. | 2,003 | | 181,084 |
JFE Holdings, Inc. | 41,600 | | 791,856 |
Jindal Steel & Power Ltd. | 91,751 | | 1,051,587 |
JSW Steel Ltd. | 14,016 | | 187,130 |
Kobe Steel Ltd. | 160,000 | | 267,628 |
London Mining PLC (a) | 75,300 | | 386,604 |
Maanshan Iron & Steel Ltd. (H Shares) | 4,285,000 | | 1,275,767 |
Magnitogorsk Iron & Steel Works OJSC unit | 47,700 | | 295,502 |
Nippon Steel Corp. | 196,000 | | 511,080 |
Nucor Corp. | 900 | | 34,002 |
OneSteel Ltd. | 396,960 | | 504,893 |
POSCO | 11,540 | | 3,983,560 |
Reliance Steel & Aluminum Co. | 19,000 | | 839,610 |
Tata Steel Ltd. | 53,417 | | 526,019 |
Ternium SA sponsored ADR | 10,900 | | 267,486 |
Thyssenkrupp AG | 69,200 | | 1,997,197 |
United States Steel Corp. (e) | 28,800 | | 730,368 |
Usinas Siderurgicas de Minas Gerais SA - Usiminas (PN-A) (non-vtg.) | 37,700 | | 259,061 |
Vale SA (PN-A) sponsored ADR (e) | 631,200 | | 14,896,320 |
Common Stocks - continued |
| Shares | | Value |
METALS & MINING - CONTINUED |
Steel - continued |
Voestalpine AG | 16,400 | | $ 567,399 |
Yamato Kogyo Co. Ltd. | 9,100 | | 230,210 |
| | 43,357,469 |
TOTAL METALS & MINING | | 248,130,321 |
OIL, GAS & CONSUMABLE FUELS - 32.6% |
Coal & Consumable Fuels - 1.9% |
Alpha Natural Resources, Inc. (a) | 280,237 | | 6,736,897 |
Arch Coal, Inc. | 10,800 | | 196,776 |
Banpu PCL (For. Reg.) | 8,950 | | 181,688 |
Bumi PLC | 12,573 | | 149,627 |
China Coal Energy Co. Ltd. (H Shares) | 61,000 | | 75,977 |
CONSOL Energy, Inc. | 2,200 | | 94,072 |
Paladin Energy Ltd.: | | | |
(Australia) (a) | 731,842 | | 1,117,722 |
(Canada) (a) | 271,500 | | 424,878 |
Peabody Energy Corp. | 108,800 | | 4,718,656 |
Uranium One, Inc. | 424,900 | | 1,278,728 |
| | 14,975,021 |
Integrated Oil & Gas - 22.3% |
BG Group PLC | 366,250 | | 7,989,829 |
BP PLC | 1,946,900 | | 14,329,588 |
Cenovus Energy, Inc. | 4,700 | | 160,965 |
Chevron Corp. | 215,100 | | 22,596,255 |
China Petroleum & Chemical Corp. (H Shares) | 359,000 | | 339,517 |
ConocoPhillips | 88,700 | | 6,177,955 |
ENI SpA | 248,427 | | 5,492,003 |
Exxon Mobil Corp. | 530,061 | | 41,392,467 |
Gazprom OAO sponsored ADR | 575,000 | | 6,675,750 |
Hess Corp. | 52,800 | | 3,303,168 |
Imperial Oil Ltd. | 600 | | 24,846 |
InterOil Corp. (a)(e) | 84,400 | | 4,009,844 |
Lukoil Oil Co. sponsored ADR | 39,900 | | 2,302,230 |
Murphy Oil Corp. | 14,500 | | 802,865 |
Occidental Petroleum Corp. | 90,000 | | 8,364,600 |
Origin Energy Ltd. | 121,659 | | 1,833,505 |
Petroleo Brasileiro SA - Petrobras (PN) sponsored ADR (e) | 431,500 | | 10,912,635 |
PTT PCL (For. Reg.) | 3,100 | | 30,539 |
Repsol YPF SA | 60,117 | | 1,821,991 |
Common Stocks - continued |
| Shares | | Value |
OIL, GAS & CONSUMABLE FUELS - CONTINUED |
Integrated Oil & Gas - continued |
Royal Dutch Shell PLC Class A (United Kingdom) | 673,450 | | $ 23,861,212 |
Suncor Energy, Inc. | 208,432 | | 6,638,628 |
Total SA | 89,955 | | 4,694,282 |
| | 173,754,674 |
Oil & Gas Exploration & Production - 7.4% |
Anadarko Petroleum Corp. | 58,700 | | 4,607,950 |
Apache Corp. | 65,500 | | 6,525,765 |
Cabot Oil & Gas Corp. | 13,600 | | 1,056,992 |
Cairn Energy PLC (a) | 91,316 | | 432,633 |
Canadian Natural Resources Ltd. | 164,500 | | 5,802,097 |
Chesapeake Energy Corp. | 75,100 | | 2,111,812 |
Cimarex Energy Co. | 13,900 | | 889,600 |
CNOOC Ltd. | 120,000 | | 226,843 |
CNOOC Ltd. sponsored ADR | 16,000 | | 3,017,760 |
Concho Resources, Inc. (a) | 3,500 | | 331,520 |
Denbury Resources, Inc. (a) | 41,000 | | 643,700 |
Devon Energy Corp. | 17,100 | | 1,110,645 |
Double Eagle Petroleum Co. (a) | 94,370 | | 838,006 |
Encana Corp. | 1,000 | | 21,688 |
EOG Resources, Inc. | 3,600 | | 321,948 |
EXCO Resources, Inc. | 43,800 | | 552,318 |
Gran Tierra Energy, Inc. (Canada) (a) | 7,600 | | 46,583 |
INPEX Corp. | 23 | | 151,867 |
Japan Petroleum Exploration Co. Ltd. | 30,000 | | 1,185,050 |
Marathon Oil Corp. | 77,300 | | 2,012,119 |
Newfield Exploration Co. (a) | 13,700 | | 551,562 |
Nexen, Inc. | 70,200 | | 1,192,242 |
Niko Resources Ltd. | 39,100 | | 2,150,628 |
Noble Energy, Inc. | 16,000 | | 1,429,440 |
Northern Oil & Gas, Inc. (a)(e) | 227,900 | | 5,508,343 |
NOVATEK OAO GDR | 2,000 | | 280,800 |
Oasis Petroleum, Inc. (a) | 500 | | 14,670 |
OGX Petroleo e Gas Participacoes SA (a) | 155,900 | | 1,289,180 |
Pacific Rubiales Energy Corp. | 3,400 | | 79,266 |
Painted Pony Petroleum Ltd. (a)(f) | 15,000 | | 183,428 |
Painted Pony Petroleum Ltd. Class A (a) | 24,500 | | 299,599 |
PetroBakken Energy Ltd. Class A (e) | 7,748 | | 70,574 |
Petrobank Energy & Resources Ltd. | 83,900 | | 754,961 |
Petrominerales Ltd. | 16,526 | | 436,007 |
Pioneer Natural Resources Co. | 11,500 | | 964,850 |
Common Stocks - continued |
| Shares | | Value |
OIL, GAS & CONSUMABLE FUELS - CONTINUED |
Oil & Gas Exploration & Production - continued |
PTT Exploration and Production PCL (For. Reg.) | 6,500 | | $ 33,691 |
QEP Resources, Inc. | 31,600 | | 1,123,380 |
Santos Ltd. | 19,000 | | 256,631 |
Southwestern Energy Co. (a) | 40,600 | | 1,706,824 |
Stone Energy Corp. (a) | 12,900 | | 313,341 |
Talisman Energy, Inc. | 410,100 | | 5,817,138 |
Tullow Oil PLC | 1,600 | | 36,101 |
Ultra Petroleum Corp. (a) | 15,900 | | 506,574 |
Whiting Petroleum Corp. (a) | 12,500 | | 581,875 |
Woodside Petroleum Ltd. | 14,001 | | 533,168 |
| | 58,001,169 |
Oil & Gas Refining & Marketing - 0.9% |
CVR Energy, Inc. (a) | 21,200 | | 524,912 |
Marathon Petroleum Corp. | 95,700 | | 3,435,630 |
Tesoro Corp. (a) | 600 | | 15,564 |
Valero Energy Corp. | 110,900 | | 2,728,140 |
Western Refining, Inc. (a)(e) | 600 | | 9,588 |
| | 6,713,834 |
Oil & Gas Storage & Transport - 0.1% |
Atlas Pipeline Partners, LP | 22,600 | | 786,480 |
TOTAL OIL, GAS & CONSUMABLE FUELS | | 254,231,178 |
PAPER & FOREST PRODUCTS - 1.5% |
Forest Products - 0.1% |
China Forestry Holdings Co. Ltd. (a) | 3,302,000 | | 626,924 |
Duratex SA | 39,000 | | 211,216 |
| | 838,140 |
Paper Products - 1.4% |
Empresas CMPC SA | 848,910 | | 3,534,599 |
Fibria Celulose SA sponsored ADR (e) | 149,889 | | 1,329,515 |
International Paper Co. | 2,300 | | 63,710 |
MeadWestvaco Corp. | 1,000 | | 27,910 |
Nine Dragons Paper (Holdings) Ltd. | 854,000 | | 581,353 |
Nippon Paper Group, Inc. (e) | 34,400 | | 788,501 |
Oji Paper Co. Ltd. | 110,000 | | 544,158 |
Sappi Ltd. (a) | 24,704 | | 72,528 |
Stora Enso Oyj (R Shares) | 298,300 | | 1,898,134 |
Suzano Papel e Celulose SA | 38,725 | | 189,430 |
Common Stocks - continued |
| Shares | | Value |
PAPER & FOREST PRODUCTS - CONTINUED |
Paper Products - continued |
Svenska Cellulosa AB (SCA) (B Shares) | 41,900 | | $ 612,476 |
UPM-Kymmene Corp. | 130,200 | | 1,527,958 |
| | 11,170,272 |
TOTAL PAPER & FOREST PRODUCTS | | 12,008,412 |
REAL ESTATE INVESTMENT TRUSTS - 0.0% |
Specialized REITs - 0.0% |
Weyerhaeuser Co. | 1,685 | | 30,296 |
SPECIALTY RETAIL - 0.3% |
Specialty Stores - 0.3% |
Tsutsumi Jewelry Co. Ltd. | 95,500 | | 2,225,649 |
TRADING COMPANIES & DISTRIBUTORS - 2.0% |
Trading Companies & Distributors - 2.0% |
Marubeni Corp. | 448,000 | | 2,607,949 |
Mitsubishi Corp. | 276,900 | | 5,695,721 |
Noble Group Ltd. | 6,162,090 | | 7,521,210 |
| | 15,824,880 |
TOTAL COMMON STOCKS (Cost $788,765,973) | 770,137,682 |
Convertible Bonds - 0.0% |
| Principal Amount (d) | | |
PAPER & FOREST PRODUCTS - 0.0% |
Paper Products - 0.0% |
Suzano Papel e Celulose SA 4.5% 12/16/13
(Cost $377,129) | BRL | 572,000 | | 316,612 |
Money Market Funds - 4.7% |
| Shares | | Value |
Fidelity Cash Central Fund, 0.12% (b) | 2,670,024 | | $ 2,670,024 |
Fidelity Securities Lending Cash Central Fund, 0.11% (b)(c) | 33,626,672 | | 33,626,672 |
TOTAL MONEY MARKET FUNDS (Cost $36,296,696) | 36,296,696 |
TOTAL INVESTMENT PORTFOLIO - 103.4% (Cost $825,439,798) | 806,750,990 |
NET OTHER ASSETS (LIABILITIES) - (3.4)% | (26,283,091) |
NET ASSETS - 100% | $ 780,467,899 |
Currency Abbreviations |
BRL | - | Brazilian real |
Legend |
(a) Non-income producing |
(b) Affiliated fund that is available only to investment companies and other accounts managed by Fidelity Investments. The rate quoted is the annualized seven-day yield of the fund at period end. A complete unaudited listing of the fund's holdings as of its most recent quarter end is available upon request. In addition, each Fidelity Central Fund's financial statements, which are not covered by the Fund's Report of Independent Registered Public Accounting Firm, are available on the SEC's website or upon request. |
(c) Investment made with cash collateral received from securities on loan. |
(d) Principal amount is stated in United States dollars unless otherwise noted. |
(e) Security or a portion of the security is on loan at period end. |
(f) Security exempt from registration under Rule 144A of the Securities Act of 1933. These securities may be resold in transactions exempt from registration, normally to qualified institutional buyers. At the end of the period, the value of these securities amounted to $183,428 or 0.0% of net assets. |
Affiliated Central Funds |
Information regarding fiscal year to date income earned by the Fund from investments in Fidelity Central Funds is as follows: |
Fund | Income earned |
Fidelity Cash Central Fund | $ 15,302 |
Fidelity Securities Lending Cash Central Fund | 351,340 |
Total | $ 366,642 |
Other Information |
The following is a summary of the inputs used, as of October 31, 2011, involving the Fund's assets and liabilities carried at fair value. The inputs or methodology used for valuing securities may not be an indication of the risk associated with investing in those securities. For more information on valuation inputs, and their aggregation into the levels used in the tables below, please refer to the Security Valuation section in the accompanying Notes to Financial Statements. |
Valuation Inputs at Reporting Date: |
Description | Total | Level 1 | Level 2 | Level 3 |
Investments in Securities: | | | | |
Common Stocks | $ 770,137,682 | $ 573,040,015 | $ 196,142,250 | $ 955,417 |
Convertible Bonds | 316,612 | - | - | 316,612 |
Money Market Funds | 36,296,696 | 36,296,696 | - | - |
Total Investments in Securities: | $ 806,750,990 | $ 609,336,711 | $ 196,142,250 | $ 1,272,029 |
The following is a reconciliation of Investments in Securities for which Level 3 inputs were used in determining value: |
Investments in Securities: | |
Beginning Balance | $ - |
Total Realized Gain (Loss) | (399,873) |
Total Unrealized Gain (Loss) | (2,251,071) |
Cost of Purchases | 3,323,106 |
Proceeds of Sales | (353,517) |
Amortization/Accretion | - |
Transfers in to Level 3 | 953,384 |
Transfers out of Level 3 | - |
Ending Balance | $ 1,272,029 |
The change in unrealized gain (loss) for the period attributable to Level 3 securities held at October 31, 2011 | $ (2,251,071) |
The information used in the above reconciliation represents fiscal year to date activity for any Investments in Securities identified as using Level 3 inputs at either the beginning or the end of the current fiscal period. Transfers in or out of Level 3 represent the beginning value of any Security or Instrument where a change in the pricing level occurred from the beginning to the end of the period. The cost of purchases and the proceeds of sales may include securities received or delivered through corporate actions or exchanges. Realized and unrealized gains (losses) disclosed in the reconciliation are included in Net Gain (Loss) on the Fund's Statement of Operations. |
Distribution of investments by country of issue, as a percentage of total net assets, is as follows: (Unaudited) |
United States of America | 33.0% |
Canada | 18.5% |
United Kingdom | 16.4% |
Switzerland | 5.5% |
Brazil | 3.9% |
Australia | 2.8% |
Bermuda | 2.7% |
Japan | 2.1% |
Russia | 2.0% |
Italy | 1.7% |
South Africa | 1.6% |
Germany | 1.4% |
Norway | 1.0% |
Others (Individually Less Than 1%) | 7.4% |
| 100.0% |
Income Tax Information |
At October 31, 2011, the Fund had a capital loss carryforward of approximately $6,966,394 all of which will expire in fiscal 2019. Capital loss carryforwards are only available to offset future capital gains of the Fund to the extent provided by regulations and may be limited. |
See accompanying notes which are an integral part of the financial statements.
Annual Report
Statement of Assets and Liabilities
| October 31, 2011 |
Assets | | |
Investment in securities, at value (including securities loaned of $31,452,952) - See accompanying schedule: Unaffiliated issuers (cost $789,143,102) | $ 770,454,294 | |
Fidelity Central Funds (cost $36,296,696) | 36,296,696 | |
Total Investments (cost $825,439,798) | | $ 806,750,990 |
Foreign currency held at value (cost $4,098,833) | | 3,857,396 |
Receivable for investments sold | | 13,143,082 |
Receivable for fund shares sold | | 1,319,439 |
Dividends receivable | | 819,567 |
Interest receivable | | 13,133 |
Distributions receivable from Fidelity Central Funds | | 26,123 |
Prepaid expenses | | 4,397 |
Other receivables | | 22,094 |
Total assets | | 825,956,221 |
| | |
Liabilities | | |
Payable for investments purchased | $ 8,978,037 | |
Payable for fund shares redeemed | 2,105,156 | |
Accrued management fee | 436,053 | |
Distribution and service plan fees payable | 65,847 | |
Other affiliated payables | 214,270 | |
Other payables and accrued expenses | 62,287 | |
Collateral on securities loaned, at value | 33,626,672 | |
Total liabilities | | 45,488,322 |
| | |
Net Assets | | $ 780,467,899 |
Net Assets consist of: | | |
Paid in capital | | $ 809,500,953 |
Undistributed net investment income | | 2,852,890 |
Accumulated undistributed net realized gain (loss) on investments and foreign currency transactions | | (12,954,172) |
Net unrealized appreciation (depreciation) on investments and assets and liabilities in foreign currencies | | (18,931,772) |
Net Assets | | $ 780,467,899 |
See accompanying notes which are an integral part of the financial statements.
Annual Report
Statement of Assets and Liabilities - continued
| October 31, 2011 |
| | |
Calculation of Maximum Offering Price Class A:
Net Asset Value and redemption price per share ($127,978,760 ÷ 8,452,805 shares) | | $ 15.14 |
| | |
Maximum offering price per share (100/94.25 of $15.14) | | $ 16.06 |
Class T:
Net Asset Value and redemption price per share ($20,831,272 ÷ 1,380,984 shares) | | $ 15.08 |
| | |
Maximum offering price per share (100/96.50 of $15.08) | | $ 15.63 |
Class B:
Net Asset Value and offering price per share ($4,323,549 ÷ 288,202 shares)A | | $ 15.00 |
| | |
Class C:
Net Asset Value and offering price per share ($37,184,669 ÷ 2,486,493 shares)A | | $ 14.95 |
| | |
| | |
Global Commodity Stock:
Net Asset Value, offering price and redemption price per share ($531,224,376 ÷ 34,921,133 shares) | | $ 15.21 |
| | |
Institutional Class:
Net Asset Value, offering price and redemption price per share ($58,925,273 ÷ 3,872,564 shares) | | $ 15.22 |
A Redemption price per share is equal to net asset value less any applicable contingent deferred sales charge.
See accompanying notes which are an integral part of the financial statements.
Annual Report
Financial Statements - continued
Statement of Operations
| Year ended October 31, 2011 |
Investment Income | | |
Dividends | | $ 16,946,155 |
Interest | | 5,904 |
Income from Fidelity Central Funds | | 366,642 |
Income before foreign taxes withheld | | 17,318,701 |
Less foreign taxes withheld | | (1,108,723) |
Total income | | 16,209,978 |
| | |
Expenses | | |
Management fee | $ 5,689,907 | |
Transfer agent fees | 2,134,136 | |
Distribution and service plan fees | 777,366 | |
Accounting and security lending fees | 389,213 | |
Custodian fees and expenses | 182,573 | |
Independent trustees' compensation | 4,268 | |
Registration fees | 153,780 | |
Audit | 61,648 | |
Legal | 2,692 | |
Interest | 2,456 | |
Miscellaneous | 5,236 | |
Total expenses before reductions | 9,403,275 | |
Expense reductions | (62,747) | 9,340,528 |
Net investment income (loss) | | 6,869,450 |
Realized and Unrealized Gain (Loss) Net realized gain (loss) on: | | |
Investment securities: | | |
Unaffiliated issuers (net of foreign taxes of $8,021) | (6,689,458) | |
Foreign currency transactions | (208,574) | |
Total net realized gain (loss) | | (6,898,032) |
Change in net unrealized appreciation (depreciation) on: Investment securities (net of decrease in deferred foreign taxes of $77,622) | (67,470,576) | |
Assets and liabilities in foreign currencies | (249,333) | |
Total change in net unrealized appreciation (depreciation) | | (67,719,909) |
Net gain (loss) | | (74,617,941) |
Net increase (decrease) in net assets resulting from operations | | $ (67,748,491) |
See accompanying notes which are an integral part of the financial statements.
Annual Report
Statement of Changes in Net Assets
| Year ended
October 31,
2011 | Year ended
October 31,
2010 |
Increase (Decrease) in Net Assets | | |
Operations | | |
Net investment income (loss) | $ 6,869,450 | $ 5,290,077 |
Net realized gain (loss) | (6,898,032) | (2,643,429) |
Change in net unrealized appreciation (depreciation) | (67,719,909) | 40,356,160 |
Net increase (decrease) in net assets resulting
from operations | (67,748,491) | 43,002,808 |
Distributions to shareholders from net investment income | (5,045,313) | (188,424) |
Distributions to shareholders from net realized gain | (2,104,800) | (1,358,291) |
Total distributions | (7,150,113) | (1,546,715) |
Share transactions - net increase (decrease) | 418,528,912 | 198,095,255 |
Redemption fees | 94,436 | 48,090 |
Total increase (decrease) in net assets | 343,724,744 | 239,599,438 |
| | |
Net Assets | | |
Beginning of period | 436,743,155 | 197,143,717 |
End of period (including undistributed net investment income of $2,852,890 and undistributed net investment income of $4,074,073, respectively) | $ 780,467,899 | $ 436,743,155 |
See accompanying notes which are an integral part of the financial statements.
Annual Report
Financial Highlights - Class A
Years ended October 31, | 2011 | 2010 | 2009 I |
Selected Per-Share Data | | | |
Net asset value, beginning of period | $ 15.60 | $ 13.29 | $ 10.00 |
Income from Investment Operations | | | |
Net investment income (loss) E | .12 | .19 H | (.01) |
Net realized and unrealized gain (loss) | (.38) | 2.20 | 3.29 |
Total from investment operations | (.26) | 2.39 | 3.28 |
Distributions from net investment income | (.13) | - K | - |
Distributions from net realized gain | (.06) | (.08) | - |
Total distributions | (.20) L | (.08) | - |
Redemption fees added to paid in capital E | - K | - K | .01 |
Net asset value, end of period | $ 15.14 | $ 15.60 | $ 13.29 |
Total Return B,C,D | (1.80)% | 18.04% | 32.90% |
Ratios to Average Net Assets F,J | | | |
Expenses before reductions | 1.32% | 1.37% | 1.65% A |
Expenses net of fee waivers, if any | 1.32% | 1.37% | 1.50% A |
Expenses net of all reductions | 1.31% | 1.36% | 1.48% A |
Net investment income (loss) | .71% | 1.35% H | (.15)% A |
Supplemental Data | | | |
Net assets, end of period (000 omitted) | $ 127,979 | $ 60,370 | $ 15,705 |
Portfolio turnover rate G | 71% | 54% | 25% A |
A Annualized
B Total returns for periods of less than one year are not annualized.
C Total returns would have been lower if certain expenses had not been reduced during the applicable periods shown.
D Total returns do not include the effect of the sales charges.
E Calculated based on average shares outstanding during the period.
F Fees and expenses of any underlying Fidelity Central Funds are not included in the Fund's expense ratio. The Fund indirectly bears its proportionate share of the expenses of any underlying Fidelity Central Funds.
G Amount does not include the portfolio activity of any underlying Fidelity Central Funds.
H Investment income per share reflects a special dividend which amounted to $.13 per share. Excluding the special dividend, the ratio of net investment income (loss) to average net assets would have been .42%.
I For the period March 25, 2009 (commencement of operations) to October 31, 2009.
J Expense ratios reflect operating expenses of the class. Expenses before reductions do not reflect amounts reimbursed by the investment adviser or reductions from brokerage service arrangements or reductions from other expense offset arrangements and do not represent the amount paid by the class during periods when reimbursements or reductions occur. Expense ratios before reductions for start-up periods may not be representative of longer-term operating periods. Expenses net of fee waivers reflect expenses after reimbursement by the investment adviser but prior to reductions from brokerage service arrangements or other expense offset arrangements. Expenses net of all reductions represent the net expenses paid by the class.
K Amount represents less than $.01 per share.
L Total distributions of $.20 per share is comprised of distributions from net investment income of $.133 and distributions from net realized gain of $.062 per share.
See accompanying notes which are an integral part of the financial statements.
Annual Report
Financial Highlights - Class T
Years ended October 31, | 2011 | 2010 | 2009 I |
Selected Per-Share Data | | | |
Net asset value, beginning of period | $ 15.55 | $ 13.27 | $ 10.00 |
Income from Investment Operations | | | |
Net investment income (loss) E | .07 | .16 H | (.03) |
Net realized and unrealized gain (loss) | (.38) | 2.19 | 3.29 |
Total from investment operations | (.31) | 2.35 | 3.26 |
Distributions from net investment income | (.10) | - | - |
Distributions from net realized gain | (.06) | (.07) | - |
Total distributions | (.16) | (.07) | - |
Redemption fees added to paid in capital E | - K | - K | .01 |
Net asset value, end of period | $ 15.08 | $ 15.55 | $ 13.27 |
Total Return B,C,D | (2.09)% | 17.73% | 32.70% |
Ratios to Average Net Assets F,J | | | |
Expenses before reductions | 1.60% | 1.63% | 2.04% A |
Expenses net of fee waivers, if any | 1.60% | 1.63% | 1.75% A |
Expenses net of all reductions | 1.59% | 1.61% | 1.73% A |
Net investment income (loss) | .43% | 1.10% H | (.40)% A |
Supplemental Data | | | |
Net assets, end of period (000 omitted) | $ 20,831 | $ 11,762 | $ 4,665 |
Portfolio turnover rate G | 71% | 54% | 25% A |
A Annualized
B Total returns for periods of less than one year are not annualized.
C Total returns would have been lower if certain expenses had not been reduced during the applicable periods shown.
D Total returns do not include the effect of the sales charges.
E Calculated based on average shares outstanding during the period.
F Fees and expenses of any underlying Fidelity Central Funds are not included in the Fund's expense ratio. The Fund indirectly bears its proportionate share of the expenses of any underlying Fidelity Central Funds.
G Amount does not include the portfolio activity of any underlying Fidelity Central Funds.
H Investment income per share reflects a special dividend which amounted to $.13 per share. Excluding the special dividend, the ratio of net investment income (loss) to average net assets would have been .17%.
I For the period March 25, 2009 (commencement of operations) to October 31, 2009.
J Expense ratios reflect operating expenses of the class. Expenses before reductions do not reflect amounts reimbursed by the investment adviser or reductions from brokerage service arrangements or reductions from other expense offset arrangements and do not represent the amount paid by the class during periods when reimbursements or reductions occur. Expense ratios before reductions for start-up periods may not be representative of longer-term operating periods. Expenses net of fee waivers reflect expenses after reimbursement by the investment adviser but prior to reductions from brokerage service arrangements or other expense offset arrangements. Expenses net of all reductions represent the net expenses paid by the class.
K Amount represents less than $.01 per share.
See accompanying notes which are an integral part of the financial statements.
Annual Report
Financial Highlights - Class B
Years ended October 31, | 2011 | 2010 | 2009 I |
Selected Per-Share Data | | | |
Net asset value, beginning of period | $ 15.46 | $ 13.22 | $ 10.00 |
Income from Investment Operations | | | |
Net investment income (loss) E | (.01) | .08 H | (.07) |
Net realized and unrealized gain (loss) | (.39) | 2.20 | 3.28 |
Total from investment operations | (.40) | 2.28 | 3.21 |
Distributions from net realized gain | (.06) | (.04) | - |
Redemption fees added to paid in capital E | - K | - K | .01 |
Net asset value, end of period | $ 15.00 | $ 15.46 | $ 13.22 |
Total Return B,C,D | (2.62)% | 17.23% | 32.20% |
Ratios to Average Net Assets F,J | | | |
Expenses before reductions | 2.11% | 2.16% | 2.66% A |
Expenses net of fee waivers, if any | 2.11% | 2.16% | 2.25% A |
Expenses net of all reductions | 2.10% | 2.15% | 2.23% A |
Net investment income (loss) | (.09)% | .56% H | (.90)% A |
Supplemental Data | | | |
Net assets, end of period (000 omitted) | $ 4,324 | $ 4,348 | $ 2,726 |
Portfolio turnover rate G | 71% | 54% | 25% A |
A Annualized
B Total returns for periods of less than one year are not annualized.
C Total returns would have been lower if certain expenses had not been reduced during the applicable periods shown.
D Total returns do not include the effect of the contingent deferred sales charge.
E Calculated based on average shares outstanding during the period.
F Fees and expenses of any underlying Fidelity Central Funds are not included in the Fund's expense ratio. The Fund indirectly bears its proportionate share of the expenses of any underlying Fidelity Central Funds.
G Amount does not include the portfolio activity of any underlying Fidelity Central Funds.
H Investment income per share reflects a special dividend which amounted to $.13 per share. Excluding the special dividend, the ratio of net investment income (loss) to average net assets would have been (.37)%.
I For the period March 25, 2009 (commencement of operations) to October 31, 2009.
J Expense ratios reflect operating expenses of the class. Expenses before reductions do not reflect amounts reimbursed by the investment adviser or reductions from brokerage service arrangements or reductions from other expense offset arrangements and do not represent the amount paid by the class during periods when reimbursements or reductions occur. Expense ratios before reductions for start-up periods may not be representative of longer-term operating periods. Expenses net of fee waivers reflect expenses after reimbursement by the investment adviser but prior to reductions from brokerage service arrangements or other expense offset arrangements. Expenses net of all reductions represent the net expenses paid by the class.
K Amount represents less than $.01 per share.
See accompanying notes which are an integral part of the financial statements.
Annual Report
Financial Highlights - Class C
Years ended October 31, | 2011 | 2010 | 2009 I |
Selected Per-Share Data | | | |
Net asset value, beginning of period | $ 15.45 | $ 13.22 | $ 10.00 |
Income from Investment Operations | | | |
Net investment income (loss) E | (.01) | .08 H | (.07) |
Net realized and unrealized gain (loss) | (.38) | 2.19 | 3.28 |
Total from investment operations | (.39) | 2.27 | 3.21 |
Distributions from net investment income | (.05) | - | - |
Distributions from net realized gain | (.06) | (.04) | - |
Total distributions | (.11) | (.04) | - |
Redemption fees added to paid in capital E | - K | - K | .01 |
Net asset value, end of period | $ 14.95 | $ 15.45 | $ 13.22 |
Total Return B,C,D | (2.58)% | 17.21% | 32.20% |
Ratios to Average Net Assets F,J | | | |
Expenses before reductions | 2.09% | 2.14% | 2.53% A |
Expenses net of fee waivers, if any | 2.09% | 2.14% | 2.25% A |
Expenses net of all reductions | 2.08% | 2.13% | 2.23% A |
Net investment income (loss) | (.07)% | .58% H | (.90)% A |
Supplemental Data | | | |
Net assets, end of period (000 omitted) | $ 37,185 | $ 14,338 | $ 4,798 |
Portfolio turnover rate G | 71% | 54% | 25% A |
A Annualized
B Total returns for periods of less than one year are not annualized.
C Total returns would have been lower if certain expenses had not been reduced during the applicable periods shown.
D Total returns do not include the effect of the contingent deferred sales charge.
E Calculated based on average shares outstanding during the period.
F Fees and expenses of any underlying Fidelity Central Funds are not included in the Fund's expense ratio. The Fund indirectly bears its proportionate share of the expenses of any underlying Fidelity Central Funds.
G Amount does not include the portfolio activity of any underlying Fidelity Central Funds.
H Investment income per share reflects a special dividend which amounted to $.13 per share. Excluding the special dividend, the ratio of net investment income (loss) to average net assets would have been (.34)%.
I For the period March 25, 2009 (commencement of operations) to October 31, 2009.
J Expense ratios reflect operating expenses of the class. Expenses before reductions do not reflect amounts reimbursed by the investment adviser or reductions from brokerage service arrangements or reductions from other expense offset arrangements and do not represent the amount paid by the class during periods when reimbursements or reductions occur. Expense ratios before reductions for start-up periods may not be representative of longer-term operating periods. Expenses net of fee waivers reflect expenses after reimbursement by the investment adviser but prior to reductions from brokerage service arrangements or other expense offset arrangements. Expenses net of all reductions represent the net expenses paid by the class.
K Amount represents less than $.01 per share.
See accompanying notes which are an integral part of the financial statements.
Annual Report
Financial Highlights - Global Commodity Stock
Years ended October 31, | 2011 | 2010 | 2009 H |
Selected Per-Share Data | | | |
Net asset value, beginning of period | $ 15.66 | $ 13.31 | $ 10.00 |
Income from Investment Operations | | | |
Net investment income (loss) D | .16 | .23 G | .01 |
Net realized and unrealized gain (loss) | (.39) | 2.21 | 3.29 |
Total from investment operations | (.23) | 2.44 | 3.30 |
Distributions from net investment income | (.16) | (.01) | - |
Distributions from net realized gain | (.06) | (.08) | - |
Total distributions | (.22) | (.09) | - |
Redemption fees added to paid in capital D | - J | - J | .01 |
Net asset value, end of period | $ 15.21 | $ 15.66 | $ 13.31 |
Total Return B,C | (1.59)% | 18.38% | 33.10% |
Ratios to Average Net Assets E,I | | | |
Expenses before reductions | 1.08% | 1.10% | 1.42% A |
Expenses net of fee waivers, if any | 1.08% | 1.10% | 1.25% A |
Expenses net of all reductions | 1.07% | 1.09% | 1.23% A |
Net investment income (loss) | .95% | 1.62% G | .10% A |
Supplemental Data | | | |
Net assets, end of period (000 omitted) | $ 531,224 | $ 310,186 | $ 159,439 |
Portfolio turnover rate F | 71% | 54% | 25% A |
A Annualized
B Total returns for periods of less than one year are not annualized.
C Total returns would have been lower if certain expenses had not been reduced during the applicable periods shown.
D Calculated based on average shares outstanding during the period.
E Fees and expenses of any underlying Fidelity Central Funds are not included in the Fund's expense ratio. The Fund indirectly bears its proportionate share of the expenses of any underlying Fidelity Central Funds.
F Amount does not include the portfolio activity of any underlying Fidelity Central Funds.
G Investment income per share reflects a special dividend which amounted to $.13 per share. Excluding the special dividend, the ratio of net investment income (loss) to average net assets would have been .69%.
H For the period March 25, 2009 (commencement of operations) to October 31, 2009.
I Expense ratios reflect operating expenses of the class. Expenses before reductions do not reflect amounts reimbursed by the investment adviser or reductions from brokerage service arrangements or reductions from other expense offset arrangements and do not represent the amount paid by the class during periods when reimbursements or reductions occur. Expense ratios before reductions for start-up periods may not be representative of longer-term operating periods. Expenses net of fee waivers reflect expenses after reimbursement by the investment adviser but prior to reductions from brokerage service arrangements or other expense offset arrangements. Expenses net of all reductions represent the net expenses paid by the class.
J Amount represents less than $.01 per share.
See accompanying notes which are an integral part of the financial statements.
Annual Report
Financial Highlights - Institutional Class
Years ended October 31, | 2011 | 2010 | 2009 H |
Selected Per-Share Data | | | |
Net asset value, beginning of period | $ 15.66 | $ 13.31 | $ 10.00 |
Income from Investment Operations | | | |
Net investment income (loss) D | .16 | .23 G | .01 |
Net realized and unrealized gain (loss) | (.38) | 2.21 | 3.29 |
Total from investment operations | (.22) | 2.44 | 3.30 |
Distributions from net investment income | (.16) | (.01) | - |
Distributions from net realized gain | (.06) | (.08) | - |
Total distributions | (.22) | (.09) | - |
Redemption fees added to paid in capital D | - J | - J | .01 |
Net asset value, end of period | $ 15.22 | $ 15.66 | $ 13.31 |
Total Return B,C | (1.50)% | 18.39% | 33.10% |
Ratios to Average Net Assets E,I | | | |
Expenses before reductions | 1.03% | 1.09% | 1.36% A |
Expenses net of fee waivers, if any | 1.03% | 1.09% | 1.25% A |
Expenses net of all reductions | 1.03% | 1.07% | 1.23% A |
Net investment income (loss) | .99% | 1.64% G | .10% A |
Supplemental Data | | | |
Net assets, end of period (000 omitted) | $ 58,925 | $ 35,739 | $ 9,811 |
Portfolio turnover rate F | 71% | 54% | 25% A |
A Annualized
B Total returns for periods of less than one year are not annualized.
C Total returns would have been lower if certain expenses had not been reduced during the applicable periods shown.
D Calculated based on average shares outstanding during the period.
E Fees and expenses of any underlying Fidelity Central Funds are not included in the Fund's expense ratio. The Fund indirectly bears its proportionate share of the expenses of any underlying Fidelity Central Funds.
F Amount does not include the portfolio activity of any underlying Fidelity Central Funds.
G Investment income per share reflects a special dividend which amounted to $.13 per share. Excluding the special dividend, the ratio of net investment income (loss) to average net assets would have been .71%.
H For the period March 25, 2009 (commencement of operations) to October 31, 2009.
I Expense ratios reflect operating expenses of the class. Expenses before reductions do not reflect amounts reimbursed by the investment adviser or reductions from brokerage service arrangements or reductions from other expense offset arrangements and do not represent the amount paid by the class during periods when reimbursements or reductions occur. Expense ratios before reductions for start-up periods may not be representative of longer-term operating periods. Expenses net of fee waivers reflect expenses after reimbursement by the investment adviser but prior to reductions from brokerage service arrangements or other expense offset arrangements. Expenses net of all reductions represent the net expenses paid by the class.
J Amount represents less than $.01 per share.
See accompanying notes which are an integral part of the financial statements.
Annual Report
Notes to Financial Statements
For the period ended October 31, 2011
1. Organization.
Fidelity® Global Commodity Stock Fund (the Fund) is a non-diversified fund of Fidelity Investment Trust (the Trust) and is authorized to issue an unlimited number of shares. The Trust is registered under the Investment Company Act of 1940, as amended (the 1940 Act), as an open-end management investment company organized as a Massachusetts business trust. The Fund offers Class A, Class T, Class C, Global Commodity Stock and Institutional Class shares, each of which, along with Class B shares, has equal rights as to assets and voting privileges. Effective after the close of business on September 1, 2010, Class B shares were closed to new accounts and additional purchases, except for exchanges and reinvestments by existing shareholders. Each class has exclusive voting rights with respect to matters that affect that class. Class B shares will automatically convert to Class A shares after a holding period of seven years from the initial date of purchase. Investment income, realized and unrealized capital gains and losses, the common expenses of the Fund, and certain fund-level expense reductions, if any, are allocated on a pro-rata basis to each class based on the relative net assets of each class to the total net assets of the Fund. Each class differs with respect to transfer agent and distribution and service plan fees incurred. Certain expense reductions may also differ by class. The Fund's investments in emerging markets can be subject to social, economic, regulatory and political uncertainties and can be extremely volatile.
2. Investments in Fidelity Central Funds.
The Fund invests in Fidelity Central Funds, which are open-end investment companies available only to other investment companies and accounts managed by Fidelity Management & Research Company (FMR) and its affiliates. The Fund's Schedule of Investments lists each of the Fidelity Central Funds held as of period end, if any, as an investment of the Fund, but does not include the underlying holdings of each Fidelity Central Fund. As an Investing Fund, the Fund indirectly bears its proportionate share of the expenses of the underlying Fidelity Central Funds.
The Money Market Central Funds seek preservation of capital and current income and are managed by Fidelity Investments Money Management, Inc. (FIMM), an affiliate of FMR.
A complete unaudited list of holdings for each Fidelity Central Fund is available upon request or at the Securities and Exchange Commission (the SEC) web site at www.sec.gov. In addition, the financial statements of the Fidelity Central Funds, which are not covered by the Fund's Report of Independent Registered Public Accounting Firm, are available on the SEC web site or upon request.
Annual Report
3. Significant Accounting Policies.
The financial statements have been prepared in conformity with accounting principles generally accepted in the United States of America (GAAP), which require management to make certain estimates and assumptions at the date of the financial statements. Actual results could differ from those estimates. Subsequent events, if any, through the date that the financial statements were issued have been evaluated in the preparation of the financial statements. The following summarizes the significant accounting policies of the Fund:
Security Valuation. Investments are valued as of 4:00 p.m. Eastern time on the last calendar day of the period. The Fund uses independent pricing services approved by the Board of Trustees to value its investments. When current market prices or quotations are not readily available or reliable, valuations may be determined in good faith in accordance with procedures adopted by the Board of Trustees. Factors used in determining value may include market or security specific events, changes in interest rates and credit quality. The frequency with which these procedures are used cannot be predicted and they may be utilized to a significant extent. The value used for net asset value (NAV) calculation under these procedures may differ from published prices for the same securities.
The Fund categorizes the inputs to valuation techniques used to value its investments into a disclosure hierarchy consisting of three levels as shown below:
Level 1 - quoted prices in active markets for identical investments
Level 2 - other significant observable inputs (including quoted prices for similar investments, interest rates, prepayment speeds, etc.)
Level 3 - unobservable inputs (including the Fund's own assumptions based on the best information available)
Changes in valuation techniques may result in transfers in or out of an assigned level within the disclosure hierarchy. The aggregate value of investments by input level, as of October 31, 2011, as well as a roll forward of Level 3 securities, is included at the end of the Fund's Schedule of Investments. Valuation techniques used to value the Fund's investments by major category are as follows:
Equity securities, including restricted securities, for which market quotations are readily available, are valued at the last reported sale price or official closing price as reported by an independent pricing service on the primary market or exchange on which they are traded and are categorized as Level 1 in the hierarchy. In the event there were no sales during the day or closing prices are not available, securities are valued at the last quoted bid price or may be valued using the last available price and are generally categorized as Level 2 in the hierarchy. For foreign equity securities, when significant market or security
Annual Report
Notes to Financial Statements - continued
3. Significant Accounting Policies - continued
Security Valuation - continued
specific events arise, comparisons to the valuation of American Depositary Receipts (ADRs), futures contracts, Exchange-traded funds (ETFs) and certain indexes as well as quoted prices for similar securities are used and are categorized as Level 2 in the hierarchy in these circumstances. Utilizing these techniques may result in transfers between Level 1 and Level 2. For restricted equity securities and private placements where observable inputs are limited, assumptions about market activity and risk are used and are categorized as Level 3 in the hierarchy.
Debt securities, including restricted securities, are valued based on evaluated prices received from independent pricing services or from dealers who make markets in such securities. For corporate bonds, pricing services utilize matrix pricing which considers yield or price of bonds of comparable quality, coupon, maturity and type as well as dealer supplied prices and are generally categorized as Level 2 in the hierarchy. When independent prices are unavailable or unreliable, debt securities may be valued utilizing pricing matrices which consider similar factors that would be used by independent pricing services. These are generally categorized as Level 2 in the hierarchy but may be Level 3 depending on the circumstances.
Investments in open-end mutual funds, including the Fidelity Central Funds, are valued at their closing net asset value each business day and are categorized as Level 1 in the hierarchy.
Foreign Currency. The Fund may use foreign currency contracts to facilitate transactions in foreign-denominated securities. Gains and losses from these transactions may arise from changes in the value of the foreign currency or if the counterparties do not perform under the contracts' terms.
Foreign-denominated assets, including investment securities, and liabilities are translated into U.S. dollars at the exchange rate at period end. Purchases and sales of investment securities, income and dividends received and expenses denominated in foreign currencies are translated into U.S. dollars at the exchange rate in effect on the transaction date.
The effects of exchange rate fluctuations on investments are included with the net realized and unrealized gain (loss) on investment securities. Other foreign currency transactions resulting in realized and unrealized gain (loss) are disclosed separately.
Investment Transactions and Income. For financial reporting purposes, the Fund's investment holdings and NAV include trades executed through the end of the last business day of the period. The NAV per share for processing shareholder transactions is calculated as of the close of business of the New York Stock Exchange (NYSE), normally 4:00 p.m. Eastern time and includes trades executed through the end of the prior
Annual Report
3. Significant Accounting Policies - continued
Investment Transactions and Income - continued
business day. Gains and losses on securities sold are determined on the basis of identified cost. Dividend income is recorded on the ex-dividend date, except for certain dividends from foreign securities where the ex-dividend date may have passed, which are recorded as soon as the Fund is informed of the ex-dividend date. Non-cash dividends included in dividend income, if any, are recorded at the fair market value of the securities received. Distributions received on securities that represent a return of capital or capital gain are recorded as a reduction of cost of investments and/or as a realized gain. The Fund estimates the components of distributions received that may be considered return of capital distributions or capital gain distributions. Interest income and distributions from the Fidelity Central Funds are accrued as earned. Interest income includes coupon interest and amortization of premium and accretion of discount on debt securities. Investment income is recorded net of foreign taxes withheld where recovery of such taxes is uncertain.
Expenses. Expenses directly attributable to a fund are charged to that fund. Expenses attributable to more than one fund are allocated among the respective funds on the basis of relative net assets or other appropriate methods. Expense estimates are accrued in the period to which they relate and adjustments are made when actual amounts are known.
Income Tax Information and Distributions to Shareholders. Each year, the Fund intends to qualify as a regulated investment company, including distributing substantially all of its taxable income and realized gains under Subchapter M of the Internal Revenue Code and filing its U.S. federal tax return. As a result, no provision for income taxes is required. As of October 31, 2011, the Fund did not have any unrecognized tax benefits in the financial statements. A fund's federal tax return is subject to examination by the Internal Revenue Service (IRS) for a period of three years. Foreign taxes are provided for based on the Fund's understanding of the tax rules and rates that exist in the foreign markets in which it invests.
Distributions are declared and recorded on the ex-dividend date. Income dividends and capital gain distributions are declared separately for each class. Income and capital gain distributions are determined in accordance with income tax regulations, which may differ from GAAP. In addition, the Fund claimed a portion of the payment made to redeeming shareholders as a distribution for income tax purposes
Capital accounts within the financial statements are adjusted for permanent book-tax differences. These adjustments have no impact on net assets or the results of operations. Temporary book-tax differences will reverse in a subsequent period.
Annual Report
Notes to Financial Statements - continued
3. Significant Accounting Policies - continued
Income Tax Information and Distributions to Shareholders - continued
Book-tax differences are primarily due to foreign currency transactions, certain foreign taxes, passive foreign investment companies (PFIC), partnerships, capital loss carryforwards and losses deferred due to wash sales.
The federal tax cost of investment securities and unrealized appreciation (depreciation) as of period end were as follows:
Gross unrealized appreciation | $ 64,157,893 |
Gross unrealized depreciation | (89,393,208) |
Net unrealized appreciation (depreciation) on securities and other investments | $ (25,235,315) |
| |
Tax Cost | $ 831,986,305 |
The tax-based components of distributable earnings as of period end were as follows:
Undistributed ordinary income | $ 3,411,620 |
Capital loss carryforward | $ (6,966,394) |
Net unrealized appreciation (depreciation) | $ (25,483,446) |
Under the recently enacted Regulated Investment Company Modernization Act of 2010 (the Act), the Fund will be permitted to carry forward capital losses incurred in taxable years beginning after December 22, 2010 for an unlimited period. However, any losses incurred during those future taxable years will be required to be utilized prior to any losses incurred in pre-enactment taxable years, which generally expire after eight years from when they are incurred. Additionally, post-enactment capital losses that are carried forward will retain their character as either short-term or long-term capital losses rather than being considered all short-term as under previous law. The Fund's first fiscal year end subject to the Act will be October 31, 2012.
The tax character of distributions paid was as follows:
| October 31, 2011 | October 31, 2010 |
Ordinary Income | $ 5,112,665 | $ 1,546,715 |
Long-Term Capital Gains | 2,037,448 | - |
Total | $ 7,150,113 | $ 1,546,715 |
Short-Term Trading (Redemption) Fees. Shares held by investors in the Fund less than 30 days are subject to a redemption fee equal to 1.00% of the net asset value of shares redeemed. All redemption fees, which reduce the proceeds of the shareholder redemption, are retained by the Fund and accounted for as an addition to paid in capital.
Annual Report
3. Significant Accounting Policies - continued
New Accounting Pronouncement. In May 2011, the Financial Accounting Standards Board issued Accounting Standard Update No. 2011-04, Fair Value Measurement (Topic 820) - Amendments to Achieve Common Fair Value Measurement and Disclosure Requirements in U.S. GAAP and IFRSs. The update changes the wording used to describe the requirements in GAAP for measuring fair value and for disclosing information about fair value measurements. The update is effective during interim and annual periods beginning after December 15, 2011. Management is currently evaluating the impact of the update's adoption on the Fund's financial statement disclosures.
4. Operating Policies.
Restricted Securities. The Fund may invest in securities that are subject to legal or contractual restrictions on resale. These securities generally may be resold in transactions exempt from registration or to the public if the securities are registered. Disposal of these securities may involve time-consuming negotiations and expense, and prompt sale at an acceptable price may be difficult. Information regarding restricted securities is included at the end of the Fund's Schedule of Investments.
5. Purchases and Sales of Investments.
Purchases and sales of securities, other than short-term securities, aggregated $977,644,235 and $565,928,394, respectively.
6. Fees and Other Transactions with Affiliates.
Management Fee. FMR and its affiliates provide the Fund with investment management related services for which the Fund pays a monthly management fee. The management fee is the sum of an individual fund fee rate that is based on an annual rate of .45% of the Fund's average net assets and a group fee rate that averaged .26% during the period. The group fee rate is based upon the average net assets of all the mutual funds advised by FMR. The group fee rate decreases as assets under management increase and increases as assets under management decrease. For the period, the total annual management fee rate was .71% of the Fund's average net assets.
Distribution and Service Plan Fees. In accordance with Rule 12b-1 of the 1940 Act, the Fund has adopted separate Distribution and Service Plans for each class of shares. Certain classes pay Fidelity Distributors Corporation (FDC), an affiliate of FMR, separate Distribution and Service Fees, each of which is based on an annual percentage of each class' average net assets. In addition, FDC may pay financial intermediaries for selling shares of the Fund and providing shareholder support services. For the period, the Distribution and Service Fee rates, total fees and amounts retained by FDC were as follows:
Annual Report
Notes to Financial Statements - continued
6. Fees and Other Transactions with Affiliates - continued
Distribution and Service Plan Fees - continued
| Distribution
Fee | Service
Fee | Total Fees | Retained
by FDC |
Class A | -% | .25% | $ 294,482 | $ 11,535 |
Class T | .25% | .25% | 97,025 | 1 |
Class B | .75% | .25% | 48,554 | 36,421 |
Class C | .75% | .25% | 337,305 | 182,256 |
| | | $ 777,366 | $ 230,213 |
Sales Load. FDC may receive a front-end sales charge of up to 5.75% for selling Class A shares, and 3.50% for selling Class T shares, some of which is paid to financial intermediaries for selling shares of the Fund. Depending on the holding period, FDC may receive contingent deferred sales charges levied on Class A, Class T, Class B, and Class C redemptions. The deferred sales charges range from 5% to 1% for Class B, 1% for Class C, 1.00% for certain purchases of Class A shares and .25% for certain purchases of Class T shares.
For the period, sales charge amounts retained by FDC were as follows:
| Retained
by FDC |
Class A | $ 203,267 |
Class T | 23,029 |
Class B* | 73,574 |
Class C* | 12,313 |
| $ 312,183 |
* When Class B and Class C shares are initially sold, FDC pays commissions from its own resources to financial intermediaries through which the sales are made.
Transfer Agent Fees. Fidelity Investments Institutional Operations Company, Inc. (FIIOC), an affiliate of FMR, is the transfer, dividend disbursing and shareholder servicing agent for each class of the Fund. FIIOC receives account fees and asset-based fees that vary according to the account size and type of account of the shareholders of the respective classes of the Fund. FIIOC pays for typesetting, printing and mailing of shareholder reports, except proxy statements. For the period, transfer agent fees for each class were as follows:
Annual Report
6. Fees and Other Transactions with Affiliates - continued
Transfer Agent Fees - continued
| Amount | % of
Average
Net Assets |
Class A | $ 306,688 | .26 |
Class T | 56,044 | .29 |
Class B | 14,667 | .30 |
Class C | 96,930 | .29 |
Global Commodity Stock | 1,516,249 | .27 |
Institutional Class | 143,558 | .23 |
| $ 2,134,136 | |
Accounting and Security Lending Fees. Fidelity Service Company, Inc. (FSC), an affiliate of FMR, maintains the Fund's accounting records. The accounting fee is based on the level of average net assets for the month. Under a separate contract, FSC administers the security lending program. The security lending fee is based on the number and duration of lending transactions.
Brokerage Commissions. The Fund placed a portion of its portfolio transactions with brokerage firms which are affiliates of the investment adviser. The commissions paid to these affiliated firms were $20,462 for the period.
Interfund Lending Program. Pursuant to an Exemptive Order issued by the SEC, the Fund, along with other registered investment companies having management contracts with FMR, may participate in an interfund lending program. This program provides an alternative credit facility allowing the funds to borrow from, or lend money to, other participating affiliated funds. At period end, there were no interfund loans outstanding. The Fund's activity in this program during the period for which loans were outstanding was as follows:
Borrower or Lender | Average Daily
Loan Balance | Weighted Average Interest Rate | Interest
Expense |
Borrower | $ 5,072,574 | .35% | $ 2,323 |
7. Committed Line of Credit.
The Fund participates with other funds managed by FMR or an affiliate in a $4.0 billion credit facility (the "line of credit") to be utilized for temporary or emergency purposes to fund shareholder redemptions or for other short-term liquidity purposes. The Fund has agreed to pay commitment fees on its pro-rata portion of the line of credit, which amounted to $2,313 and is reflected in Miscellaneous expenses on the Statement of Operations. During the period, there were no borrowings on this line of credit.
Annual Report
Notes to Financial Statements - continued
8. Security Lending.
The Fund lends portfolio securities through a lending agent from time to time in order to earn additional income. For equity securities, a lending agent is used and may loan securities to certain qualified borrowers, including Fidelity Capital Markets (FCM), a broker-dealer affiliated with the Fund. On the settlement date of the loan, the Fund receives collateral (in the form of U.S. Treasury obligations, letters of credit and/or cash) against the loaned securities and maintains collateral in an amount not less than 100% of the market value of the loaned securities during the period of the loan. The market value of the loaned securities is determined at the close of business of the Fund and any additional required collateral is delivered to the Fund on the next business day. If the borrower defaults on its obligation to return the securities loaned because of insolvency or other reasons, a fund could experience delays and costs in recovering the securities loaned or in gaining access to the collateral. Any cash collateral received is invested in the Fidelity Securities Lending Cash Central Fund. The value of loaned securities and cash collateral at period end are disclosed on the Fund's Statement of Assets and Liabilities. Security lending income represents the income earned on investing cash collateral, less rebates paid to borrowers and any lending agent fees associated with the loan, plus any premium payments received for lending certain types of securities. Security lending income is presented in the Statement of Operations as a component of income from Fidelity Central Funds. Total security lending income during the period amounted to $351,340. During the period, there were no securities loaned to FCM.
9. Bank Borrowings.
The Fund is permitted to have bank borrowings for temporary or emergency purposes to fund shareholder redemptions or for other short-term liquidity requirements. The Fund has established borrowing arrangements with certain banks. The interest rate on the borrowings is the bank's base rate, as revised from time to time. The average daily loan balance during the period for which loans were outstanding amounted to $2,705,000. The weighted average interest rate was .59%. The interest expense amounted to $133 under the bank borrowing program. At period end, there were no bank borrowings outstanding.
10. Expense Reductions.
Many of the brokers with whom FMR places trades on behalf of the Fund provided services to the Fund in addition to trade execution. These services included payments of certain expenses on behalf of the Fund totaling $62,747 for the period.
Annual Report
11. Distributions to Shareholders.
Distributions to shareholders of each class were as follows:
Years ended October 31, | 2011 | 2010 |
From net investment income | | |
Class A | $ 597,144 | $ 7,432 |
Class T | 82,038 | - |
Class C | 56,214 | - |
Global Commodity Stock | 3,895,270 | 168,019 |
Institutional Class | 414,647 | 12,973 |
Total | $ 5,045,313 | $ 188,424 |
From net realized gain | | |
Class A | $ 275,211 | $ 143,058 |
Class T | 52,381 | 30,137 |
Class B | 16,866 | 9,302 |
Class C | 68,717 | 20,828 |
Global Commodity Stock | 1,532,256 | 1,078,126 |
Institutional Class | 159,369 | 76,840 |
Total | $ 2,104,800 | $ 1,358,291 |
12. Share Transactions.
Transactions for each class of shares were as follows:
| Shares | Dollars |
Years ended October 31, | 2011 | 2010 | 2011 | 2010 |
Class A | | | | |
Shares sold | 7,297,574 | 3,636,511 | $ 124,882,197 | $ 52,113,230 |
Reinvestment of distributions | 39,060 | 8,310 | 643,900 | 119,911 |
Shares redeemed | (2,752,883) | (957,806) | (44,565,640) | (13,354,681) |
Net increase (decrease) | 4,583,751 | 2,687,015 | $ 80,960,457 | $ 38,878,460 |
Class T | | | | |
Shares sold | 866,549 | 635,625 | $ 14,740,169 | $ 9,055,849 |
Reinvestment of distributions | 7,294 | 2,006 | 120,226 | 28,921 |
Shares redeemed | (249,100) | (233,090) | (4,030,489) | (3,190,490) |
Net increase (decrease) | 624,743 | 404,541 | $ 10,829,906 | $ 5,894,280 |
Class B | | | | |
Shares sold | 82,231 | 275,613 | $ 1,397,980 | $ 3,943,173 |
Reinvestment of distributions | 917 | 543 | 14,988 | 7,824 |
Shares redeemed | (76,244) | (200,985) | (1,237,701) | (2,763,660) |
Net increase (decrease) | 6,904 | 75,171 | $ 175,267 | $ 1,187,337 |
Annual Report
Notes to Financial Statements - continued
12. Share Transactions - continued
| Shares | Dollars |
Years ended October 31, | 2011 | 2010 | 2011 | 2010 |
Class C | | | | |
Shares sold | 2,215,036 | 869,321 | $ 37,885,797 | $ 12,506,411 |
Reinvestment of distributions | 6,435 | 1,339 | 105,874 | 19,266 |
Shares redeemed | (662,765) | (305,685) | (10,246,197) | (4,197,936) |
Net increase (decrease) | 1,558,706 | 564,975 | $ 27,745,474 | $ 8,327,741 |
Global Commodity Stock | | | | |
Shares sold | 32,339,719 | 19,122,952 | $ 553,926,075 | $ 278,892,729 |
Reinvestment of distributions | 293,921 | 81,765 | 4,855,462 | 1,181,498 |
Shares redeemed | (17,519,084) | (11,379,620) | (288,860,403) | (158,960,668) |
Net increase (decrease) | 15,114,556 | 7,825,097 | $ 269,921,134 | $ 121,113,559 |
Institutional Class | | | | |
Shares sold | 4,225,113 | 1,969,025 | $ 72,109,877 | $ 28,672,948 |
Reinvestment of distributions | 16,850 | 2,588 | 278,352 | 37,397 |
Shares redeemed | (2,651,317) | (426,975) | (43,491,555) | (6,016,467) |
Net increase (decrease) | 1,590,646 | 1,544,638 | $ 28,896,674 | $ 22,693,878 |
13. Other.
The Fund's organizational documents provide former and current trustees and officers with a limited indemnification against liabilities arising in connection with the performance of their duties to the Fund. In the normal course of business, the Fund may also enter into contracts that provide general indemnifications. The Fund's maximum exposure under these arrangements is unknown as this would be dependent on future claims that may be made against the Fund. The risk of material loss from such claims is considered remote.
Annual Report
To the Trustees of Fidelity Investment Trust and the Shareholders of Fidelity Global Commodity Stock Fund:
In our opinion, the accompanying statement of assets and liabilities, including the schedule of investments, and the related statements of operations and of changes in net assets and the financial highlights present fairly, in all material respects, the financial position of Fidelity Global Commodity Stock Fund (a fund of Fidelity Investment Trust) at October 31, 2011, the results of its operations for the year then ended, the changes in its net assets for each of the two years in the period then ended and the financial highlights for each of the periods indicated, in conformity with accounting principles generally accepted in the United States of America. These financial statements and financial highlights (hereafter referred to as "financial statements") are the responsibility of the Fidelity Global Commodity Stock Fund's management. Our responsibility is to express an opinion on these financial statements based on our audits. We conducted our audits of these financial statements in accordance with the standards of the Public Company Accounting Oversight Board (United States). Those standards require that we plan and perform the audit to obtain reasonable assurance about whether the financial statements are free of material misstatement. An audit includes examining, on a test basis, evidence supporting the amounts and disclosures in the financial statements, assessing the accounting principles used and significant estimates made by management, and evaluating the overall financial statement presentation. We believe that our audits, which included confirmation of securities at October 31, 2011 by correspondence with the custodian and brokers, provide a reasonable basis for our opinion.
PricewaterhouseCoopers LLP
Boston, Massachusetts
December 16, 2011
Annual Report
The Trustees, Members of the Advisory Board, and executive officers of the trust and fund, as applicable, are listed below. The Board of Trustees governs the fund and is responsible for protecting the interests of shareholders. The Trustees are experienced executives who meet periodically throughout the year to oversee the fund's activities, review contractual arrangements with companies that provide services to the fund, oversee management of the risks associated with such activities and contractual arrangements, and review the fund's performance. Except for James C. Curvey, each of the Trustees oversees 226 funds advised by FMR or an affiliate. Mr. Curvey oversees 429 funds advised by FMR or an affiliate.
The Trustees hold office without limit in time except that (a) any Trustee may resign; (b) any Trustee may be removed by written instrument, signed by at least two-thirds of the number of Trustees prior to such removal; (c) any Trustee who requests to be retired or who has become incapacitated by illness or injury may be retired by written instrument signed by a majority of the other Trustees; and (d) any Trustee may be removed at any special meeting of shareholders by a two-thirds vote of the outstanding voting securities of the trust. Each Trustee who is not an interested person (as defined in the 1940 Act) (Independent Trustee), shall retire not later than the last day of the calendar year in which his or her 75th birthday occurs. The Independent Trustees may waive this mandatory retirement age policy with respect to individual Trustees. The executive officers and Advisory Board Members hold office without limit in time, except that any officer and Advisory Board Member may resign or may be removed by a vote of a majority of the Trustees at any regular meeting or any special meeting of the Trustees. Except as indicated, each individual has held the office shown or other offices in the same company for the past five years.
Experience, Skills, Attributes, and Qualifications of the Fund's Trustees. The Governance and Nominating Committee has adopted a statement of policy that describes the experience, qualifications, attributes, and skills that are necessary and desirable for potential Independent Trustee candidates (Statement of Policy). The Board believes that each Trustee satisfied at the time he or she was initially elected or appointed a Trustee, and continues to satisfy, the standards contemplated by the Statement of Policy. The Governance and Nominating Committee also engages professional search firms to help identify potential Independent Trustee candidates who have the experience, qualifications, attributes, and skills consistent with the Statement of Policy. From time to time, additional criteria based on the composition and skills of the current Independent Trustees, as well as experience or skills that may be appropriate in light of future changes to board composition, business conditions, and regulatory or other developments, have also been considered by the professional search firms and the Governance and Nominating Committee. In addition, the Board takes into account the Trustees' commitment and participation in Board and committee meetings, as well as their leadership of standing and ad hoc committees throughout their tenure.
In determining that a particular Trustee was and continues to be qualified to serve as a Trustee, the Board has considered a variety of criteria, none of which, in isolation, was controlling. The Board believes that, collectively, the Trustees have balanced and diverse experience, qualifications, attributes, and skills, which allow the Board to operate effectively in governing the fund and protecting the interests of shareholders. Information about the specific experience, skills, attributes, and qualifications of each Trustee, which in each case led to the Board's conclusion that the Trustee should serve (or continue to serve) as a trustee of the fund, is provided below.
Annual Report
Trustees and Officers - continued
Board Structure and Oversight Function. James C. Curvey is an interested person (as defined in the 1940 Act) and currently serves as Acting Chairman. The Trustees have determined that an interested Chairman is appropriate and benefits shareholders because an interested Chairman has a personal and professional stake in the quality and continuity of services provided to the fund. Independent Trustees exercise their informed business judgment to appoint an individual of their choosing to serve as Chairman, regardless of whether the Trustee happens to be independent or a member of management. The Independent Trustees have determined that they can act independently and effectively without having an Independent Trustee serve as Chairman and that a key structural component for assuring that they are in a position to do so is for the Independent Trustees to constitute a substantial majority for the Board. The Independent Trustees also regularly meet in executive session. Ned C. Lautenbach serves as Chairman of the Independent Trustees and as such (i) acts as a liaison between the Independent Trustees and management with respect to matters important to the Independent Trustees and (ii) with management prepares agendas for Board meetings.
Fidelity funds are overseen by different Boards of Trustees. The fund's Board oversees Fidelity's equity and high income funds and another Board oversees Fidelity's investment-grade bond, money market, and asset allocation funds. The asset allocation funds may invest in Fidelity funds overseen by the fund's Board. The use of separate Boards, each with its own committee structure, allows the Trustees of each group of Fidelity funds to focus on the unique issues of the funds they oversee, including common research, investment, and operational issues. On occasion, the separate Boards establish joint committees to address issues of overlapping consequences for the Fidelity funds overseen by each Board.
The Trustees operate using a system of committees to facilitate the timely and efficient consideration of all matters of importance to the Trustees, the fund, and fund shareholders and to facilitate compliance with legal and regulatory requirements and oversight of the fund's activities and associated risks. The Board, acting through its committees, has charged FMR and its affiliates with (i) identifying events or circumstances the occurrence of which could have demonstrably adverse effects on the fund's business and/or reputation; (ii) implementing processes and controls to lessen the possibility that such events or circumstances occur or to mitigate the effects of such events or circumstances if they do occur; and (iii) creating and maintaining a system designed to evaluate continuously business and market conditions in order to facilitate the identification and implementation processes described in (i) and (ii) above. Because the day-to-day operations and activities of the fund are carried out by or through FMR, its affiliates and other service providers, the fund's exposure to risks is mitigated but not eliminated by the processes overseen by the Trustees. While each of the Board's committees has responsibility for overseeing different aspects of the fund's activities, oversight is exercised primarily through the Operations, Audit, and Compliance Committees. In addition, the Independent Trustees have worked with FMR to enhance the Board's oversight of investment and financial risks, legal and regulatory risks, technology risks, and operational risks, including the development of additional risk reporting to the Board. For example, a working group comprised of Independent Trustees and FMR has worked and continues to work to review the Fidelity funds' valuation-related activities, reporting and risk management. Appropriate personnel, including but not limited to the fund's Chief Compliance Officer (CCO), FMR's internal auditor, the independent accountants, the fund's Treasurer and portfolio management personnel, make periodic reports to the Board's committees, as appropriate, including an annual review of FMR's risk management program for the Fidelity funds. The responsibilities of each standing committee, including their oversight responsibilities, are described further under "Standing Committees of the Fund's Trustees."
Annual Report
The fund's Statement of Additional Information (SAI) includes more information about the Trustees. To request a free copy, call Fidelity at 1-877-208-0098.
Interested Trustees*:
Correspondence intended for each Trustee who is an interested person may be sent to Fidelity Investments, 82 Devonshire Street, Boston, Massachusetts 02109.
Name, Age; Principal Occupations and Other Relevant Experience+ |
James C. Curvey (76) |
| Year of Election or Appointment: 2007 Mr. Curvey is Trustee and Acting Chairman of the Board of Trustees of certain Trusts. Mr. Curvey also serves as Trustee (2007-present) of other investment companies advised by FMR. Mr. Curvey is a Director of Fidelity Investments Money Management, Inc. (2009-present), Director of Fidelity Research & Analysis Co. (2009-present) and Director of FMR and FMR Co., Inc. (2007-present). Mr. Curvey is also Vice Chairman (2007-present) and Director of FMR LLC. In addition, Mr. Curvey serves as an Overseer for the Boston Symphony Orchestra and a member of the Trustees of Villanova University. Previously, Mr. Curvey was the Vice Chairman (2006-2007) and Director (2000-2007) of FMR Corp. |
Ronald P. O'Hanley (54) |
| Year of Election or Appointment: 2011 Mr. O'Hanley is Director of FMR Co., Inc. (2010-present), Director of Fidelity Investments Money Management, Inc. (2010-present), Director of Fidelity Research & Analysis Company (2010-present), President of Fidelity Asset Management and Corporate Services and a member of Fidelity's Executive Committee (2010-present). Previously, Mr. O'Hanley served as President and Chief Executive Officer of BNY Mellon Asset Management (2007-2010). Mr. O'Hanley also served as Vice Chairman of Bank New York Mellon Corp. and a member of that firm's Executive Committee. Prior to the 2007 merger of The Bank of New York and Mellon Financial Corporation, he was Vice Chairman of Mellon Financial Corporation and President and Chief Executive Officer of Mellon Asset Management. He joined Mellon in February 1997. Mr. O'Hanley currently serves as Chairman of the Boston Public Library Foundation Board of Directors and sits on the Board of Directors of Beth Israel Deaconess Medical Center, the Board of Trustees of the Marine Biological Laboratory and the Advisory Board of the Maxwell School of Citizenship and Public Administration at Syracuse University. Mr. O'Hanley also chairs the Council on Asset Management for the Financial Services Roundtable and is a member of the Board of Directors of Institutional Investor's U.S. Institute. |
* Trustees have been determined to be "Interested Trustees" by virtue of, among other things, their affiliation with the trust or various entities under common control with FMR.
+ The information above includes each Trustee's principal occupation during the last five years and other information relating to the experience, attributes, and skills relevant to each Trustee's qualifications to serve as a Trustee, which led to the conclusion that each Trustee should serve as a Trustee for the fund.
Annual Report
Independent Trustees:
Correspondence intended for each Independent Trustee (that is, the Trustees other than the Interested Trustees) may be sent to Fidelity Investments, P.O. Box 55235, Boston, Massachusetts 02205-5235.
Name, Age; Principal Occupations and Other Relevant Experience+ |
Dennis J. Dirks (63) |
| Year of Election or Appointment: 2005 Prior to his retirement in May 2003, Mr. Dirks was Chief Operating Officer and a member of the Board of The Depository Trust & Clearing Corporation (DTCC). He also served as President, Chief Operating Officer, and Board member of The Depository Trust Company (DTC) and President and Board member of the National Securities Clearing Corporation (NSCC). In addition, Mr. Dirks served as Chief Executive Officer and Board member of the Government Securities Clearing Corporation, Chief Executive Officer and Board member of the Mortgage-Backed Securities Clearing Corporation, as a Trustee and a member of the Finance Committee of Manhattan College (2005-2008), and as a Trustee and a member of the Finance Committee of AHRC of Nassau County (2006-2008). Mr. Dirks is a member of the Independent Directors Council (IDC) Governing Council (2010-Present) and Board of Directors for The Brookville Center for Children's Services, Inc. (2009-present). |
Alan J. Lacy (58) |
| Year of Election or Appointment: 2008 Mr. Lacy serves as Senior Adviser (2007-present) of Oak Hill Capital Partners, L.P. (private equity). Mr. Lacy also served as Chief Executive Officer (2000-2005) and Vice Chairman (2005-2006) of Sears Holdings Corporation and Sears, Roebuck and Co. (retail). In addition, Mr. Lacy serves as a member of the Board of Directors of Dave & Buster's, Inc. (restaurant and entertainment complexes, 2010-present), The Hillman Companies, Inc. (hardware wholesalers, 2010-present), and Bristol-Myers Squibb Company (global pharmaceuticals, 2007-present). Mr. Lacy is a member of the Board of Trustees of The National Parks Conservation Association (2006-Present). Previously, Mr. Lacy served as Chairman of the Board of Trustees of the National Parks Conservation Association (2008-2011) and as a member of the Board of Directors for the Western Union Company (global money transfer, 2006-2011). |
Ned C. Lautenbach (67) |
| Year of Election or Appointment: 2000 Mr. Lautenbach is Chairman of the Independent Trustees of the Equity and High Income Funds (2006-present). Mr. Lautenbach currently serves as the Lead Director of the Eaton Corporation Board of Directors (diversified industrial, 1997-present). Mr. Lautenbach is also a member of the Board of Directors of the Philharmonic Center for the Arts in Naples, Florida (1999-present); a member of the Board of Trustees of Fairfield University (2005-present); and a member of the Council on Foreign Relations (1994-present). Previously, Mr. Lautenbach was a Partner/Advisory Partner at Clayton, Dubilier & Rice, LLC (private equity investment, 1998-2010), as well as a Director of Sony Corporation (2006-2007). |
Joseph Mauriello (67) |
| Year of Election or Appointment: 2008 Prior to his retirement in January 2006, Mr. Mauriello served in numerous senior management positions including Deputy Chairman and Chief Operating Officer (2004-2005), and Vice Chairman of Financial Services (2002-2004) of KPMG LLP US (professional services, 1965-2005). Mr. Mauriello currently serves as a member of the Board of Directors of XL Group plc. (global insurance and re-insurance, 2006-present) and of Arcadia Resources Inc. (health care services and products, 2007-present). Previously, Mr. Mauriello served as a Director of the Hamilton Funds of the Bank of New York (2006-2007). |
Robert W. Selander (61) |
| Year of Election or Appointment: 2011 Previously, Mr. Selander served as a Member of the Advisory Board of Fidelity's Equity and High Income Funds (2011), Executive Vice Chairman (2010), Chief Executive Officer (2009-2010), and President and Chief Executive Officer (1997-2009) of Mastercard, Inc. |
Cornelia M. Small (67) |
| Year of Election or Appointment: 2005 Ms. Small is a member of the Board of Directors of the Teagle Foundation (2009-present). Ms. Small is also a member of the Investment Committee, and Chair (2008-present) and a member of the Board of Trustees of Smith College. In addition, Ms. Small serves on the Investment Committee of the Berkshire Taconic Community Foundation (2008-present). Previously, Ms. Small served as Chairperson of the Investment Committee (2002-2008) of Smith College. In addition, Ms. Small served as Chief Investment Officer, Director of Global Equity Investments, and a member of the Board of Directors of Scudder, Stevens & Clark and Scudder Kemper Investments. |
William S. Stavropoulos (72) |
| Year of Election or Appointment: 2001 Mr. Stavropoulos is Vice Chairman of the Independent Trustees of the Equity and High Income Funds (2006-present). Mr. Stavropoulos serves as President and Founder of the Michigan Baseball Foundation, the Great Lakes Loons (2007-present). Mr. Stavropoulos is Chairman Emeritus of the Board of Directors of The Dow Chemical Company, where he previously served in numerous senior management positions, including President, CEO (1995-2000; 2002-2004), Chairman of the Executive Committee (2000-2006), and as a member of the Board of Directors (1990-2006). Currently, Mr. Stavropoulos is Chairman of Univar (global distributor of commodity and specialty chemicals, 2010-present), a Director of Teradata Corporation (data warehousing and technology solutions, 2008-present), Chemical Financial Corporation, Maersk Inc. (industrial conglomerate), Tyco International, Inc. (multinational manufacturing and services, 2007-present), and a member of the Advisory Board for Metalmark Capital (private equity investment, 2005-present). Mr. Stavropoulos is a special advisor to Clayton, Dubilier & Rice, LLC (private equity investment). In addition, Mr. Stavropoulos is a member of the University of Notre Dame Advisory Council for the College of Science. |
David M. Thomas (62) |
| Year of Election or Appointment: 2008 Previously, Mr. Thomas served as Executive Chairman (2005-2006) and Chairman and Chief Executive Officer (2000-2005) of IMS Health, Inc. (pharmaceutical and healthcare information solutions). In addition, Mr. Thomas serves as a member of the Board of Directors of Fortune Brands, Inc. (consumer products), and Interpublic Group of Companies, Inc. (marketing communication, 2004-present). |
Michael E. Wiley (61) |
| Year of Election or Appointment: 2008 Mr. Wiley also serves as a Director of Asia Pacific Exploration Consolidated (international oil and gas exploration and production, 2008-present). Mr. Wiley serves as a Director of Tesoro Corporation (independent oil refiner and marketer, 2005-present), and a Director of Bill Barrett Corporation (exploration and production, 2005-present). In addition, Mr. Wiley also serves as a Director of Post Oak Bank (privately-held bank, 2004-present). Previously, Mr. Wiley served as a member of the Board of Trustees of the University of Tulsa (2000-2006; 2007-2010), as a Senior Energy Advisor of Katzenbach Partners, LLC (consulting, 2006-2007), as an Advisory Director of Riverstone Holdings (private investment), Chairman, President, and CEO of Baker Hughes, Inc. (oilfield services, 2000-2004), and as Director of Spinnaker Exploration Company (exploration and production, 2001-2005). |
Annual Report
Trustees and Officers - continued
+ The information above includes each Trustee's principal occupation during the last five years and other information relating to the experience, attributes, and skills relevant to each Trustee's qualifications to serve as a Trustee, which led to the conclusion that each Trustee should serve as a Trustee for the fund.
Advisory Board Members and Executive Officers:
Correspondence intended for each executive officer, Edward C. Johnson 3d, and Peter S. Lynch may be sent to Fidelity Investments, 82 Devonshire Street, Boston, Massachusetts 02109.
Name, Age; Principal Occupation |
Edward C. Johnson 3d (81) |
| Year of Election or Appointment: 2011 Member of the Advisory Board of Fidelity's Equity and High Income Funds. Mr. Johnson serves as Chief Executive Officer, Chairman, and a Director of FMR LLC, and also serves as Chairman and Director of FIL Limited. Previously, Mr. Johnson served as a Trustee and Chairman of the Board of certain Fidelity Trusts, Chairman and a Director of FMR, Chairman and a Director of FMR Co., Inc., and President of FMR LLC (2006-2007). |
Peter S. Lynch (67) |
| Year of Election or Appointment: 2003 Member of the Advisory Board of Fidelity's Equity and High Income Funds. Mr. Lynch is Vice Chairman and a Director of FMR and FMR Co., Inc. In addition, Mr. Lynch serves as a Trustee of Boston College and as the Chairman of the Inner-City Scholarship Fund. Previously, Mr. Lynch served on the Special Olympics International Board of Directors (1997-2006). |
Kenneth B. Robins (42) |
| Year of Election or Appointment: 2008 President and Treasurer of Fidelity's Equity and High Income Funds. Mr. Robins also serves as President and Treasurer (2010-present) and Assistant Treasurer (2009-present) of other Fidelity funds and is an employee of Fidelity Investments (2004-present). Previously, Mr. Robins served as Deputy Treasurer of the Fidelity funds (2005-2008) and Treasurer and Chief Financial Officer of The North Carolina Capital Management Trust: Cash and Term Portfolios (2006-2008). |
Bruce T. Herring (46) |
| Year of Election or Appointment: 2006 Vice President of certain Equity Funds. Mr. Herring also serves as Chief Investment Officer and Director of Fidelity Management & Research (U.K.) Inc. (2010-present) and Group Chief Investments Officer of FMR. Previously, Mr. Herring served as Vice President (2005-2006) and Senior Vice President (2006-2007) of Fidelity Management & Research Company, Vice President of FMR Co., Inc. (2001-2007) and as a portfolio manager for Fidelity U.S. Equity Funds. |
Brian B. Hogan (47) |
| Year of Election or Appointment: 2009 Vice President of Equity and High Income Funds. Mr. Hogan also serves as President of FMR's Equity Division (2009-present). Previously, Mr. Hogan served as Senior Vice President, Equity Research of FMR (2006-2009) and as a portfolio manager. |
Scott C. Goebel (43) |
| Year of Election or Appointment: 2008 Secretary and Chief Legal Officer (CLO) of the Fidelity funds. Mr. Goebel also serves as Secretary of Fidelity Investments Money Management, Inc. (FIMM) (2010-present) and Fidelity Research and Analysis Company (FRAC) (2010-present); Secretary and CLO of The North Carolina Capital Management Trust: Cash and Term Portfolios (2008-present); General Counsel, Secretary, and Senior Vice President of FMR (2008-present) and FMR Co., Inc. (2008-present); employed by FMR LLC or an affiliate (2001-present); Chief Legal Officer of Fidelity Management & Research (Hong Kong) Limited (2008-present) and Assistant Secretary of Fidelity Management & Research (Japan) Inc. (2008-present), and Fidelity Management & Research (U.K.) Inc. (2008-present). Previously, Mr. Goebel served as Assistant Secretary of FIMM (2008-2010), FRAC (2008-2010), and the Funds (2007-2008) and as Vice President and Secretary of Fidelity Distributors Corporation (FDC) (2005-2007). |
William C. Coffey (42) |
| Year of Election or Appointment: 2009 Assistant Secretary of Fidelity's Equity and High Income Funds. Mr. Coffey also serves as Senior Vice President and Deputy General Counsel of FMR LLC (2010-present), and is an employee of Fidelity Investments. Previously, Mr. Coffey served as Vice President and Associate General Counsel of FMR LLC (2005-2009). |
Holly C. Laurent (57) |
| Year of Election or Appointment: 2008 Anti-Money Laundering (AML) Officer of the Fidelity funds. Ms. Laurent also serves as AML Officer of The North Carolina Capital Management Trust: Cash and Term Portfolios (2008-present) and is an employee of Fidelity Investments. Previously, Ms. Laurent was Senior Vice President and Head of Legal for Fidelity Business Services India Pvt. Ltd. (2006-2008), and Senior Vice President, Deputy General Counsel and Group Head for FMR LLC (2005-2006). |
Christine Reynolds (53) |
| Year of Election or Appointment: 2008 Chief Financial Officer of the Fidelity funds. Ms. Reynolds became President of Fidelity Pricing and Cash Management Services (FPCMS) in August 2008. Ms. Reynolds served as Chief Operating Officer of FPCMS (2007-2008). Previously, Ms. Reynolds served as President, Treasurer, and Anti-Money Laundering officer of the Fidelity funds (2004-2007). |
Kenneth A. Rathgeber (64) |
| Year of Election or Appointment: 2004 Chief Compliance Officer of Fidelity's Equity and High Income Funds. Mr. Rathgeber is Chief Compliance Officer of Fidelity Management & Research (Hong Kong) Limited (2008-present), Fidelity Management & Research (Japan) Inc. (2008-present), FMR (2005-present), FMR Co., Inc. (2005-present), Fidelity Management & Research (U.K.) Inc. (2005-present), Fidelity Research & Analysis Company (2005-present), Fidelity Investments Money Management, Inc. (2005-present), Pyramis Global Advisors, LLC (2005-present), and Strategic Advisers, Inc. (2005-present). |
Jeffrey S. Christian (50) |
| Year of Election or Appointment: 2009 Deputy Treasurer of the Fidelity funds. Mr. Christian is an employee of Fidelity Investments. Previously, Mr. Christian served as Chief Financial Officer (2008-2009) of certain Fidelity funds and Senior Vice President of Fidelity Pricing and Cash Management Services (FPCMS) (2004-2009). |
Joseph F. Zambello (54) |
| Year of Election or Appointment: 2011 Deputy Treasurer of the Fidelity funds. Mr. Zambello is an employee of Fidelity Investments. Previously, Mr. Zambello served as Vice President of FMR's Program Management Group (2009-2011) and Vice President of the Transfer Agent Oversight Group (2005-2009). |
Adrien E. Deberghes (44) |
| Year of Election or Appointment: 2008 Deputy Treasurer of Fidelity's Equity and High Income Funds. Mr. Deberghes also serves as Vice President and Assistant Treasurer of Fidelity Rutland Square Trust II and Fidelity Commonwealth Trust II (2011-present), Assistant Treasurer of other Fidelity funds (2010-present), and is an employee of Fidelity Investments (2008-present). Previously, Mr. Deberghes served as Senior Vice President of Mutual Fund Administration at State Street Corporation (2007-2008), Senior Director of Mutual Fund Administration at Investors Bank & Trust (2005-2007), and Director of Finance for Dunkin' Brands (2000-2005). |
Stephanie J. Dorsey (42) |
| Year of Election or Appointment: 2010 Assistant Treasurer of Fidelity's Equity and High Income Funds. Ms. Dorsey also serves as Deputy Treasurer of other Fidelity funds (2008-present) and is an employee of Fidelity Investments (2008-present). Previously, Ms. Dorsey served as Treasurer (2004-2008) of the JPMorgan Mutual Funds and Vice President (2004-2008) of JPMorgan Chase Bank. |
John R. Hebble (53) |
| Year of Election or Appointment: 2009 Assistant Treasurer of Fidelity's Equity and High Income Funds. Mr. Hebble also serves as President (2011-present), Treasurer, and Chief Financial Officer of The North Carolina Capital Management Trust: Cash and Term Portfolios (2008-present), President and Treasurer of other Fidelity funds (2008-present) and is an employee of Fidelity Investments. |
Gary W. Ryan (53) |
| Year of Election or Appointment: 2005 Assistant Treasurer of the Fidelity funds. Mr. Ryan is an employee of Fidelity Investments. Previously, Mr. Ryan served as Vice President of Fund Reporting in Fidelity Pricing and Cash Management Services (FPCMS) (1999-2005). |
Jonathan Davis (43) |
| Year of Election or Appointment: 2010 Assistant Treasurer of the Fidelity funds. Mr. Davis is also Assistant Treasurer of Fidelity Rutland Square Trust II and Fidelity Commonwealth Trust II. Mr. Davis is an employee of Fidelity Investments. Previously, Mr. Davis served as Vice President and Associate General Counsel of FMR LLC (2003-2010). |
Annual Report
The Board of Trustees of Fidelity Global Commodity Stock Fund voted to pay to shareholders of record at the opening of business on record date, the following distributions per share derived from capital gains realized from sales of portfolio securities, and dividends derived from net investment income:
| Pay Date | Record Date | Dividends | Capital Gains |
Institutional Class | 12/12/11 | 12/09/11 | $0.093 | $0.014 |
Institutional Class designates 96% and 54% of the dividends distributed on December 10th and December 30th, respectively during the fiscal year as qualifying to receive the dividends-received deduction for corporate shareholders.
Institutional Class designates 100% of the dividends distributed during the fiscal year as amounts which may be taken into account as a dividend for the purposes of the maximum rate under section 1(h)(11) of the Internal Revenue Code.
The amounts per share which represent income derived from sources within, and taxes paid to, foreign countries or possessions of the United States are as follows:
| Pay Date | Income | Taxes |
Institutional Class | 12/13/10 | $0.065 | $0.0095 |
| 12/31/10 | $0.010 | - |
The fund will notify shareholders in January 2012 of amounts for use in preparing 2011 income tax returns.
Annual Report
Board Approval of Investment Advisory Contracts and Management Fees
Fidelity Global Commodity Stock Fund
Each year, the Board of Trustees, including the Independent Trustees (together, the Board), votes on the renewal of the management contract and sub-advisory agreements (together, the Advisory Contracts) for the fund. The Board, assisted by the advice of fund counsel and Independent Trustees' counsel, requests and considers a broad range of information relevant to the renewal of the Advisory Contracts throughout the year.
The Board meets regularly and considers at each of its meetings factors that are relevant to its annual consideration of the renewal of the fund's Advisory Contracts, including the services and support provided to the fund and its shareholders. The Board has established various standing committees, each composed of Independent Trustees with varying backgrounds, to which the Board has assigned specific subject matter responsibilities in order to enhance effective decision-making by the Board. The Board, acting directly and through its Committees, requests and receives information concerning the annual consideration of the renewal of the fund's Advisory Contracts. The Board also meets as needed to consider matters specifically related to the Board's annual consideration of the renewal of Advisory Contracts. Members of the Board may also meet with trustees of other Fidelity funds through ad hoc joint committees to discuss certain matters relevant to the Fidelity funds.
At its July 2011 meeting, the Board of Trustees, including the Independent Trustees, unanimously determined to renew the fund's Advisory Contracts. In reaching its determination, the Board considered all factors it believed relevant, including (i) the nature, extent, and quality of the services to be provided to the fund and its shareholders (including the investment performance of the fund); (ii) the competitiveness of the fund's management fee and total expense ratio; (iii) the total costs of the services to be provided by and the profits to be realized by Fidelity from its relationship with the fund; (iv) the extent to which economies of scale would be realized as the fund grows; and (v) whether fee levels reflect these economies of scale, if any, for the benefit of fund shareholders.
In considering whether to renew the Advisory Contracts for the fund, the Board reached a determination, with the assistance of fund counsel and Independent Trustees' counsel and through the exercise of its business judgment, that the renewal of the Advisory Contracts is in the best interests of the fund and its shareholders and that the compensation payable under the Advisory Contracts is fair and reasonable. The Board's decision to renew the Advisory Contracts was not based on any single factor, but rather was based on a comprehensive consideration of all the information provided to the Board at its meetings throughout the year. The Board, in reaching its determination to renew the Advisory Contracts, is aware that shareholders in the fund have a broad range of investment choices available to them, including a wide choice among mutual funds offered by Fidelity's competitors, and that the fund's shareholders, who have the opportunity to review and weigh the disclosure provided by the fund in its prospectus and other public disclosures, have chosen to invest in this fund, managed by Fidelity.
Annual Report
Board Approval of Investment Advisory Contracts and
Management Fees - continued
Nature, Extent, and Quality of Services Provided. The Board considered the staffing within the investment adviser, FMR, and the sub-advisers (together, the Investment Advisers), including the backgrounds of the fund's investment personnel and the fund's investment objective and discipline. The Independent Trustees also had discussions with senior management of Fidelity's investment operations and investment groups. The Board considered the structure of the portfolio manager compensation program and whether this structure provides appropriate incentives to act in the best interests of the fund.
Resources Dedicated to Investment Management and Support Services. The Board and the Fund Oversight and Research Committees reviewed the general qualifications and capabilities of the Investment Advisers' investment staff, including its size, education, experience, and resources, as well as the Investment Advisers' approach to recruiting, training, managing, and compensating investment personnel. The Board also noted that FMR has devoted increased resources to non-U.S. offices. The Board noted that Fidelity's analysts have extensive resources, tools and capabilities which allow them to conduct sophisticated quantitative and fundamental analysis, as well as credit analysis of issuers, counterparties and enhancers. The Board also believes that Fidelity's investment professionals have sufficient access to global information and data so as to provide competitive investment results over time, and that those professionals also have access to sophisticated tools which permit them to assess portfolio construction and risk and performance attribution characteristics continuously, as well as to transmit new information and research conclusions rapidly around the world. Additionally, in their deliberations, the Board considered the Investment Advisers' trading capabilities and resources which are an integral part of the investment management process.
Shareholder and Administrative Services. The Board considered (i) the nature, extent, quality, and cost of advisory, administrative, and shareholder services performed by the Investment Advisers and their affiliates under the Advisory Contracts and under separate agreements covering transfer agency, pricing and bookkeeping, and securities lending services for the fund; (ii) the nature and extent of the investment adviser's supervision of third party service providers, principally custodians and subcustodians; and (iii) the resources devoted to, and the record of compliance with, the fund's compliance policies and procedures. The Board also reviewed the allocation of fund brokerage, including allocations to brokers affiliated with the Investment Advisers, the use of brokerage commissions to pay fund expenses, and the use of "soft" commission dollars to pay for research services.
The Board noted that the growth of fund assets over time across the complex allows Fidelity to reinvest in the development of services designed to enhance the value or convenience of the Fidelity funds as investment vehicles. These services include 24-hour access to account information and market information through telephone representatives and over the Internet, investor education materials and asset allocation tools, and the expanded availability of Fidelity Investor Centers, with 35 new branches opening since 2010.
Annual Report
Investment in a Large Fund Family. The Board considered the benefits to shareholders of investing in a Fidelity fund, including the benefits of investing in a fund that is part of a large family of funds offering a variety of investment disciplines and providing a large variety of mutual fund investor services. The Board noted that Fidelity had taken, or had made recommendations that resulted in the Fidelity funds taking, a number of actions over the previous year that benefited particular funds, including (i) continuing to dedicate additional resources to investment research and support of the senior management team that oversees asset management; (ii) rationalizing product lines through the mergers of six funds into other funds; (iii) continuing to migrate the Freedom Funds to dedicated lower cost underlying funds; (iv) obtaining shareholder approval to broaden the investment strategies for Fidelity Consumer Finance Portfolio, Fidelity Emerging Asia Fund, and Fidelity Environment and Alternative Energy Portfolio; (v) contractually agreeing to reduce the management fees and impose other expense limitations on Spartan 500 Index Fund and U.S. Bond Index Fund in connection with launching new institutional classes of these funds; (vi) changing the name, primary and supplemental benchmarks, and investment policies of Fidelity Global Strategies Fund to support the fund's flexible investment mandate and global orientation; and (vii) reducing the transfer agency account fee rates on certain accounts.
Investment Performance. The Board considered whether the fund has operated in accordance with its investment objective, as well as its record of compliance with its investment restrictions. It also reviewed the fund's absolute investment performance for each class, as well as the fund's relative investment performance for each class measured against a third-party-sponsored index that reflects the market sector in which the fund invests. The Board noted that FMR does not believe that a meaningful peer group exists against which to compare the fund's performance. Because the fund had been in existence less than three calendar years, the following chart considered by the Board shows, for the one-year period ended December 31, 2010, the total returns of the retail class and Class B of the fund and the total return of a third-party-sponsored index ("benchmark").
Annual Report
Board Approval of Investment Advisory Contracts and
Management Fees - continued
Fidelity Global Commodity Stock Fund
The Board noted that the investment performance of the retail class of the fund compared favorably to its benchmark for the period shown. The Board considered that the variations in performance among the fund's classes reflect the variations in class expenses, which result in lower performance for higher expense classes. The Board also reviewed the fund's performance since inception as well as performance in the current year. The Board noted that it is difficult to evaluate in any comprehensive fashion the performance of the fund, in light of its relatively recent commencement of operations.
Based on its review, the Board concluded that the nature, extent, and quality of services provided to the fund under the Advisory Contracts should benefit the fund's shareholders.
Competitiveness of Management Fee and Total Expense Ratio. The Board considered the fund's management fee and total expense ratio compared to "mapped groups" of competitive funds and classes. Fidelity creates "mapped groups" by combining similar Lipper investment objective categories that have comparable management fee characteristics. Combining Lipper investment objective categories aids the Board's management fee and total expense ratio comparisons by broadening the competitive group used for comparison and by reducing the number of universes to which various Fidelity funds are compared.
Management Fee. The Board considered two proprietary management fee comparisons for the 12-month (or shorter) periods shown in the chart below. The group of Lipper funds used by the Board for management fee comparisons is referred to below as the "Total Mapped Group." The Total Mapped Group comparison focuses on a fund's standing relative to the total universe of comparable funds available to investors in terms of gross management fees before expense reimbursements or caps. "TMG %" represents the percentage of funds in the Total Mapped Group that had management fees that were lower than the fund's. For example, a TMG % of 30% means that 70% of the funds in the Total Mapped Group had higher management fees than the fund. The "Asset-Size Peer Group" (ASPG) comparison focuses on a fund's standing relative to non-Fidelity funds similar in size to the fund within the Total Mapped Group. The ASPG represents at least 15% of the funds in the Total Mapped Group with comparable asset size and management fee characteristics, subject to a minimum of 50 funds (or all funds in the Total Mapped Group if fewer than 50). Additional information, such as the ASPG quartile in which the fund's management fee ranked, is also included in the chart and considered by the Board.
Annual Report
Fidelity Global Commodity Stock Fund
The Board noted that the fund's management fee ranked below the median of its Total Mapped Group and below the median of its ASPG for 2010.
Based on its review, the Board concluded that the fund's management fee is fair and reasonable in light of the services that the fund receives and the other factors considered.
Total Expense Ratio. In its review of each class's total expense ratio, the Board considered the fund's management fee as well as other fund or class expenses, as applicable, such as transfer agent fees, pricing and bookkeeping fees, fund-paid 12b-1 fees, and custodial, legal, and audit fees. The Board also noted the effects of any waivers and reimbursements on fees and expenses. As part of its review, the Board also considered the current and historical total expense ratios of each class of the fund compared to competitive fund median expenses. Each class of the fund is compared to those funds and classes in the Total Mapped Group (used by the Board for management fee comparisons) that have a similar sales load structure.
Annual Report
Board Approval of Investment Advisory Contracts and
Management Fees - continued
The Board noted that the total expense ratio of each of Class A, Class B, Class C, Institutional Class, and the retail class ranked below its competitive median for 2010 and the total expense ratio of Class T ranked above its competitive median for 2010. The Board considered that various factors, including 12b-1 fees, positive or negative performance adjustments, and relatively higher other expenses in the case of small fund size, can affect total expense ratios. The Board noted that the total expense ratio of Class T was above the competitive median primarily because of higher 12b-1 fees on Class T. Class T has a higher 12b-1 fee, but a lower front-end sales charge, than traditionally priced front-end sales charge classes. The Board noted that the fund offers multiple classes, each of which has a different sales load and 12b-1 fee structure, and that the multiple structures are intended to offer a range of pricing options for the intermediary market. The Board also noted that the total expense ratios of the classes vary primarily by the level of their 12b-1 fees, although differences in transfer agent fees may also cause expenses to vary from class to class.
Fees Charged to Other Fidelity Clients. The Board also considered Fidelity fee structures and other information with respect to clients of FMR and its affiliates, such as other mutual funds advised or subadvised by FMR or its affiliates, pension plan clients, and other institutional clients. In March 2010, the Board created an ad hoc joint committee with the board of other Fidelity funds (the Committee) to review and compare Fidelity's institutional investment advisory business with its business of providing services to the Fidelity funds, including the differences in services provided, fees charged, and costs incurred, as well as competition in their respective marketplaces.
Based on its review of total expense ratios and fees charged to other Fidelity clients, the Board concluded that the total expense ratio of each class of the fund was reasonable, although Class T was above the median of the universe presented for comparison, in light of the services that the fund and its shareholders receive and the other factors considered, including the findings of the Committee.
Costs of the Services and Profitability. The Board considered the revenues earned and the expenses incurred by Fidelity in conducting the business of developing, marketing, distributing, managing, administering and servicing the fund and its shareholders. The Board also considered the level of Fidelity's profits in respect of all the Fidelity funds.
On an annual basis, FMR presents to the Board Fidelity's profitability for the fund. Fidelity calculates the profitability for each fund, as well as aggregate profitability for groups of Fidelity funds and all Fidelity funds, using a series of detailed revenue and cost allocation methodologies which originate with the books and records of Fidelity on which Fidelity's audited financial statements are based. The Audit Committee of the Board reviews any significant changes from the prior year's methodologies.
Annual Report
PricewaterhouseCoopers LLP (PwC), independent registered public accounting firm and auditor to Fidelity and certain Fidelity funds, has been engaged annually by the Board as part of the Board's assessment of Fidelity's profitability analysis. PwC's engagement includes the review and assessment of Fidelity's methodologies used in determining the revenues and expenses attributable to Fidelity's mutual fund business, and completion of agreed-upon procedures surrounding the mathematical accuracy of fund profitability and its conformity to allocation methodologies. After considering PwC's reports issued under the engagement and information provided by Fidelity, the Board concluded that while other allocation methods may also be reasonable, Fidelity's profitability methodologies are reasonable in all material respects.
The Board also reviewed Fidelity's non-fund businesses and fall-out benefits related to the mutual fund business as well as cases where Fidelity's affiliates may benefit from or be related to the fund's business.
The Board considered the costs of the services provided by and the profits realized by Fidelity in connection with the operation of the fund and was satisfied that the profitability was not excessive in the circumstances.
Economies of Scale. The Board considered whether there have been economies of scale in respect of the management of the Fidelity funds, whether the Fidelity funds (including the fund) have appropriately benefited from any such economies of scale, and whether there is potential for realization of any further economies of scale. The Board considered the extent to which the fund will benefit from economies of scale through increased services to the fund, through waivers or reimbursements, or through fee or expense reductions. The Board also noted that in 2009, it and the board of other Fidelity funds created an ad hoc committee (the Economies of Scale Committee) to analyze whether FMR attains economies of scale in respect of the management and servicing of the Fidelity funds, whether the Fidelity funds have appropriately benefited from such economies of scale, and whether there is potential for realization of any further economies of scale.
The Board recognized that the fund's management contract incorporates a "group fee" structure, which provides for lower group fee rates as total fund assets under FMR's management increase, and for higher group fee rates as total fund assets under FMR's management decrease. FMR calculates the group fee rates based on a tiered asset "breakpoint" schedule that varies based on asset class. The Board considered that the group fee is designed to deliver the benefits of economies of scale to fund shareholders when total Fidelity fund assets increase, even if assets of any particular fund are unchanged or have declined, because some portion of Fidelity's costs are attributable to services provided to all Fidelity funds, and all funds benefit if those costs can be allocated among more assets. The Board concluded that, given the group fee structure, fund shareholders will benefit from lower management fees as assets under FMR's management increase at the fund complex level, regardless of whether Fidelity achieves any such economies of scale.
Annual Report
Board Approval of Investment Advisory Contracts and
Management Fees - continued
The Board concluded, taking into account the analysis of the Economies of Scale Committee, that any potential economies of scale are being appropriately shared between fund shareholders and Fidelity.
Additional Information Requested by the Board. In order to develop fully the factual basis for consideration of the Fidelity funds' Advisory Contracts, the Board requested and received additional information on certain topics, including (i) fund performance trends, actions to be taken by FMR to improve certain funds' overall performance, and Fidelity's long-term strategies for certain funds; (ii) portfolio manager changes that have occurred during the past year and length of portfolio manager tenure for different categories of funds over time; (iii) Fidelity's compensation structure for portfolio managers and other key personnel and strategies for attracting and retaining non-investment personnel; (iv) the amount of the investment that each portfolio manager has made in the Fidelity fund(s) that he or she manages; (v) historical trends in Fidelity's realization of fall-out benefits; (vi) Fidelity's group fee structures and the rationale for the individual fee rates of certain funds; (vii) fund profitability methodology and the impact of certain factors on fund profitability results; (viii) trends regarding industry use of performance fee structures and Fidelity's compliance practices with respect to performance adjustment calculations; (ix) the fee structures in place for certain other Fidelity clients; and (x) explanations regarding the relative total expense ratios of certain funds and classes, total expense competitive trends, and actions that might be taken by FMR to reduce total expense ratios for certain funds and classes.
Based on its evaluation of all of the conclusions noted above, and after considering all factors it believed relevant, the Board ultimately concluded that the advisory fee structures are fair and reasonable, and that the fund's Advisory Contracts should be renewed.
Annual Report
Investment Adviser
Fidelity Management & Research Company
Boston, MA
Investment Sub-Advisers
FMR Co., Inc.
Fidelity Management & Research
(U.K.) Inc.
FIL Investment Advisors
FIL Investments (Japan) Limited
FIL Investment Advisors
(U.K.) Limited
Fidelity Management & Research
(Hong Kong) Limited
Fidelity Management & Research
(Japan) Inc.
General Distributor
Fidelity Distributors Corporation
Boston, MA
Transfer and Service Agents
Fidelity Investments Institutional
Operations Company, Inc.
Boston, MA
Fidelity Service Company, Inc.
Boston, MA
Custodian
State Street Bank and Trust Company
Quincy, MA
AGCSI-UANN-1211
1.879388.102
Fidelity®
International Discovery
Fund
Annual Report
October 31, 2011
Contents
Chairman's Message | (Click Here) | The Chairman's message to shareholders. |
Performance | (Click Here) | How the fund has done over time. |
Management's Discussion of Fund Performance | (Click Here) | The Portfolio Manager's review of fundperformance and strategy. |
Shareholder Expense Example | (Click Here) | An example of shareholder expenses. |
Investment Changes | (Click Here) | A summary of major shifts in the fund's investments over the past six months. |
Investments | (Click Here) | A complete list of the fund's investments with their market values. |
Financial Statements | (Click Here) | Statements of assets and liabilities, operations, and changes in net assets,
as well as financial highlights. |
Notes | (Click Here) | Notes to the financial statements. |
Report of Independent Registered Public Accounting Firm | (Click Here) | |
Trustees and Officers | (Click Here) | |
Distributions | (Click Here) | |
Board Approval of Investment Advisory Contracts and Management Fees | (Click Here) | |
To view a fund's proxy voting guidelines and proxy voting record for the 12-month period ended June 30, visit http://www.fidelity.com/proxyvotingresults or visit the Securities and Exchange Commission's (SEC) web site at http://www.sec.gov. You may also call 1-800-544-8544 to request a free copy of the proxy voting guidelines.
Standard & Poor's, S&P and S&P 500 are registered service marks of The McGraw-Hill Companies, Inc. and have been licensed for use by Fidelity Distributors Corporation.
Other third party marks appearing herein are the property of their respective owners.
All other marks appearing herein are registered or unregistered trademarks or service marks of FMR LLC or an affiliated company.
Annual Report
This report and the financial statements contained herein are submitted for the general information of the shareholders of the fund. This report is not authorized for distribution to prospective investors in the fund unless preceded or accompanied by an effective prospectus.
A fund files its complete schedule of portfolio holdings with the SEC for the first and third quarters of each fiscal year on Form N-Q. Forms N-Q are available on the SEC's web site at http://www.sec.gov. A fund's Forms N-Q may be reviewed and copied at the SEC's Public Reference Room in Washington, DC. Information regarding the operation of the SEC's Public Reference Room may be obtained by calling 1-800-SEC-0330. For a complete list of a fund's portfolio holdings, view the most recent holdings listing, semiannual report, or annual report on Fidelity's web site at http://www.fidelity.com, http://www.advisor.fidelity.com, or http://www.401k.com, as applicable.
NOT FDIC INSURED • MAY LOSE VALUE • NO BANK GUARANTEE
Neither the fund nor Fidelity Distributors Corporation is a bank.
Annual Report
(Acting Chairman's Photograph)
Dear Shareholder:
Global equity markets began the fourth quarter on a strong note, sharply reversing course in October amid strong corporate earnings, better-than-expected economic news and the promise of a resolution to the sovereign debt crisis in Europe. The mini rally followed a third quarter marked by a significant downturn in July and August, which heightened investor anxiety and set off a wave of volatility that hampered most major asset classes through the end of September. Financial markets are difficult to predict, of course, but you can help put the odds in your favor by following these time-tested investment principles.
One of the basic tenets is to invest according to your time horizon. For long-term investors, riding out the markets' inevitable ups and downs has proven much more effective than making decisions based on short-term developments. If your goal is approaching, you can also benefit from patience and restraint, rather than attempting to time the market. No matter your time horizon, missing only a few of the markets' best days can significantly diminish returns. Patience also affords the benefits of compounding - earning interest on additional income or reinvested dividends and capital gains. While staying the course doesn't eliminate risk, it can considerably lessen the negative impact of short-term downturns.
Asset allocation is another principle to manage risk. As you spread your portfolio among the asset classes, be sure to consider your time horizon, risk tolerance and investment objectives. Younger investors may be better served by emphasizing equities, which historically have been the best-performing asset class over time. Investors who are nearing a specific goal, such as retirement or sending a child to college, may choose to favor bonds and other investments that have tended to be more stable. Studies indicate that asset allocation is the single most important determinant of a portfolio's long-term success. After deciding on a suitable allocation strategy, make sure your portfolio is adequately diversified, with exposure to stocks of small-, mid- and large-cap companies in a range of sectors, for example. And today, more than ever, geographic diversification should be taken into account.
Lastly, investing a certain amount of money on a regular basis - a principle known as dollar-cost averaging - can help lower the average cost of your purchases, while also giving you the discipline to avoid selling weak performers just prior to an upswing, or chasing a hot performer just before a correction.
We invite you to learn more by visiting us on the Internet, dropping by one of our Investor Centers or calling us by phone. It is our privilege to provide the resources you need to choose investments that are right for you.
Sincerely,
(Acting Chairman's Signature)
James C. Curvey
Acting Chairman
Annual Report
Average annual total return reflects the change in the value of an investment, assuming reinvestment of the class' distributions from dividend income and capital gains (the profits earned upon the sale of securities that have grown in value, if any) and assuming a constant rate of performance each year. The $10,000 table and the fund's returns do not reflect the deduction of taxes that a shareholder would pay on fund distributions or the redemption of fund shares. During periods of reimbursement by Fidelity, a fund's total return will be greater than it would be had the reimbursement not occurred. How a fund did yesterday is no guarantee of how it will do tomorrow.
Average Annual Total Returns
Periods ended October 31, 2011 | Past 1
year | Past 5
years | Past 10
years |
Fidelity® International Discovery Fund A | -6.39% | -1.60% | 7.58% |
A Prior to October 1, 2004, Fidelity International Discovery Fund operated under certain different investment policies. The fund's historical performance may not represent its current investment policies.
$10,000 Over 10 Years
Let's say hypothetically that $10,000 was invested in Fidelity® International Discovery Fund, a class of the fund, on October 31, 2001. The chart shows how the value of your investment would have changed, and also shows how the MSCI® EAFE ® (Europe, Australasia, Far East) Index performed over the same period.
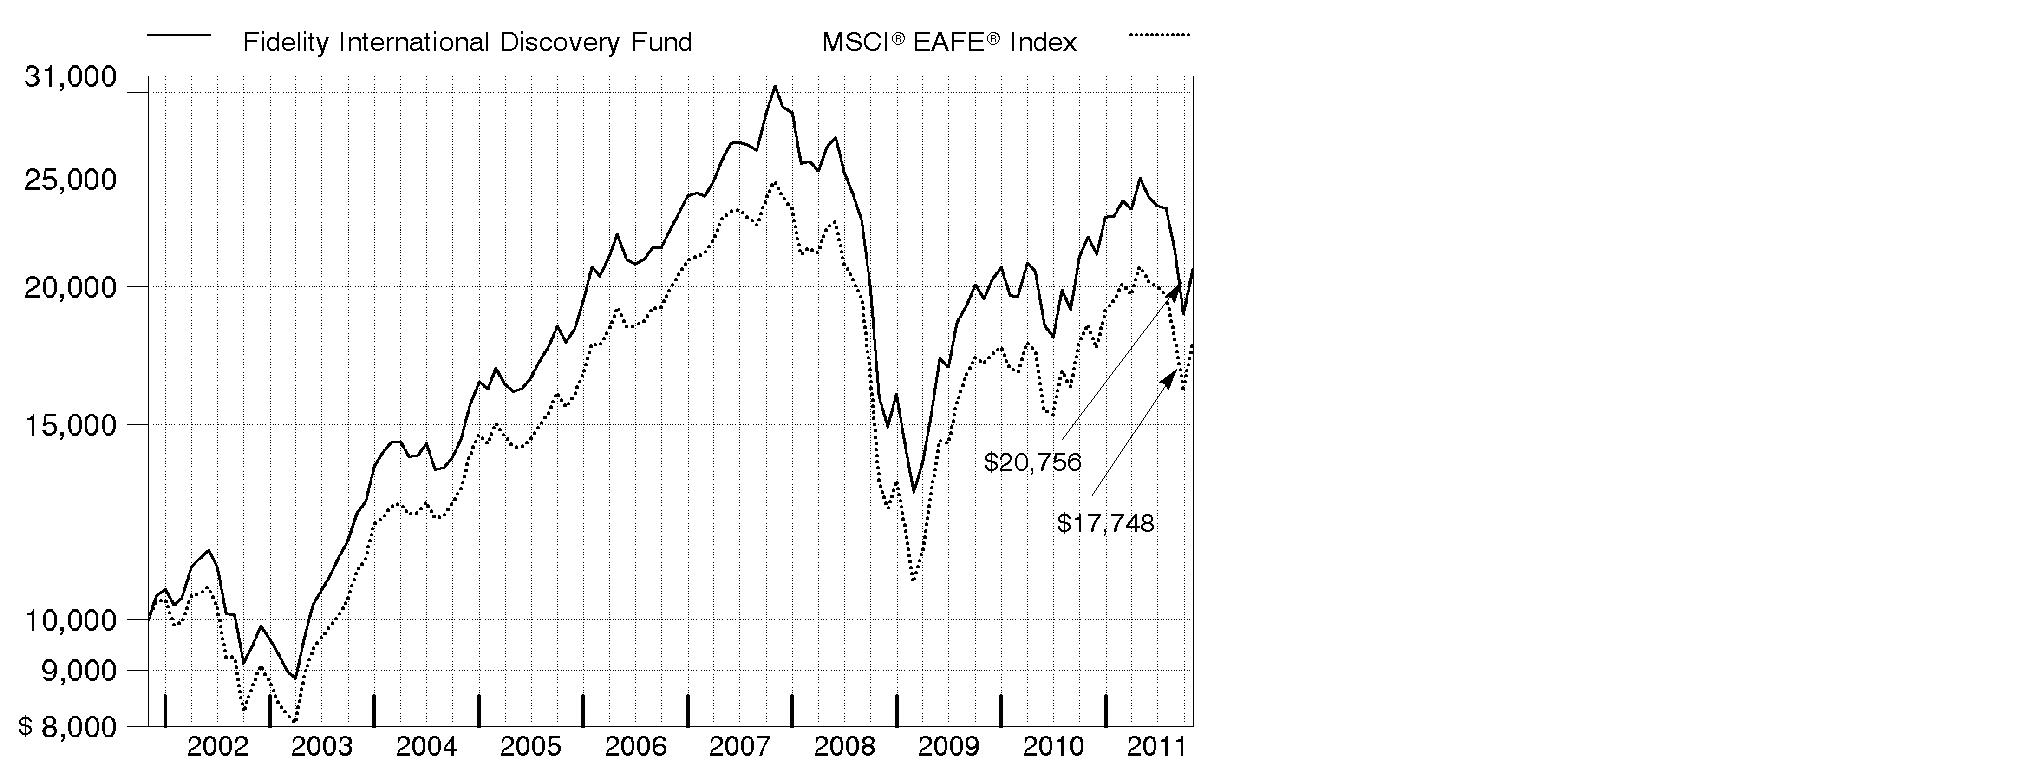
Annual Report
Market Recap: International equities were rocked by a number of headline events during the year ending October 31, 2011. Stocks posted a solid advance for the first half of the period, despite concern about the sovereign debt crisis in Europe, a devastating earthquake and tsunami in Japan, and political upheaval in the Middle East and North Africa. Sentiment turned decidedly negative in the second half, however, as fresh worries about Europe, inflation in China and a dimmed outlook for global growth caused foreign markets to suffer declines that intensified in August and September. October brought with it yet another dramatic swing, as eurozone policymakers appeared near a resolution to the debt debacle and buyers stormed back onto the scene in search of bargains. Still, those gains - along with favorable currency fluctuations overall - weren't enough to offset prior losses, and the MSCI® ACWI® (All Country World Index) ex USA Index finished the period down 4.56%. Within the MSCI index, Europe and emerging markets suffered the biggest declines, with many countries in these areas sustaining steep losses. By contrast, Japan showed resilience in the wake of its natural disasters, falling only 2%. Australia (+4%), Switzerland (+3%), the U.K. (+2%) and Canada, which produced a nominal return, were among the few major benchmark components to break into positive territory.
Comments from William Kennedy, Portfolio Manager of Fidelity® International Discovery Fund: For the 12 months ending October 31, 2011, the fund's Retail Class shares returned -6.39%, lagging the -3.97% return of the MSCI® EAFE® (Europe, Australasia, Far East) Index. Stock selection and currency exposure detracted from relative performance, particularly in emerging markets (an out-of-index investment); the Asia Pacific ex Japan region; and the United Kingdom. Positioning in energy and financials most hampered returns. Individual disappointments included French bank BNP Paribas, whose stock fell amid worries over its exposure to Greek debt, and Danish brewery Carlsberg, whose earnings suffered from a spike in Russian grain prices. The fund also was hurt by not owning Swiss pharmaceuticals firm and index component Roche Holding. Conversely, defensive positioning in Japan and Europe helped, as did security selection in consumer discretionary and information technology. A non-index stake in Japanese online retailer Start Today benefited from growth in Internet purchases, while shares of U.K. software company Autonomy jumped following a premium acquisition offer. Some of these names were no longer in the portfolio at period end.
The views expressed above reflect those of the portfolio manager(s) only through the end of the period as stated on the cover of this report and do not necessarily represent the views of Fidelity or any other person in the Fidelity organization. Any such views are subject to change at any time based upon market or other conditions and Fidelity disclaims any responsibility to update such views. These views may not be relied on as investment advice and, because investment decisions for a Fidelity fund are based on numerous factors, may not be relied on as an indication of trading intent on behalf of any Fidelity fund.
Annual Report
Shareholder Expense Example
As a shareholder of the Fund, you incur two types of costs: (1) transaction costs, including sales charges (loads) on purchase payments or redemption proceeds, redemption fees, and (2) ongoing costs, including management fees, distribution and/or service (12b-1) fees and other Fund expenses. This Example is intended to help you understand your ongoing costs (in dollars) of investing in the Fund and to compare these costs with the ongoing costs of investing in other mutual funds.
The Example is based on an investment of $1,000 invested at the beginning of the period and held for the entire period (May 1, 2011 to October 31, 2011).
Actual Expenses
The first line of the accompanying table for each class of the Fund provides information about actual account values and actual expenses. You may use the information in this line, together with the amount you invested, to estimate the expenses that you paid over the period. Simply divide your account value by $1,000.00 (for example, an $8,600 account value divided by $1,000.00 = 8.6), then multiply the result by the number in the first line for a class of the Fund under the heading entitled "Expenses Paid During Period" to estimate the expenses you paid on your account during this period. A small balance maintenance fee of $12.00 that is charged once a year may apply for certain accounts with a value of less than $2,000. This fee is not included in the table below. If it was, the estimate of expenses you paid during the period would be higher, and your ending account value lower, by this amount. In addition, the Fund, as a shareholder in the underlying Fidelity Central Funds, will indirectly bear its pro-rata share of the fees and expenses incurred by the underlying Fidelity Central Funds. These fees and expenses are not included in the Fund's annualized expense ratio used to calculate the expense estimate in the table below.
Hypothetical Example for Comparison Purposes
The second line of the accompanying table for each class of the Fund provides information about hypothetical account values and hypothetical expenses based on a Class' actual expense ratio and an assumed rate of return of 5% per year before expenses, which is not the Class' actual return. The hypothetical account values and expenses may not be used to estimate the actual ending account balance or expenses you paid for the period. You may use this information to compare the ongoing costs of investing in the Fund and other funds. To do so, compare this 5% hypothetical example with the 5% hypothetical examples that appear in the shareholder reports of the other funds. A small balance maintenance fee of $12.00 that is charged once a year may apply for certain accounts with a value of less than $2,000. This fee is not included in the table below. If it was, the estimate of expenses you paid during the period would be higher, and your ending account value lower, by this amount. In addition, the Fund, as a shareholder in the underlying Fidelity Central Funds, will indirectly bear its pro-rata share of the fees and expenses incurred by the underlying Fidelity Central Funds. These fees and expenses are not included in the Fund's annualized expense ratio used to calculate the expense estimate in the table below.
Please note that the expenses shown in the table are meant to highlight your ongoing costs only and do not reflect any transaction costs. Therefore, the second line of the table is useful in comparing ongoing costs only, and will not help you determine the relative total costs of owning different funds. In addition, if these transactional costs were included, your costs would have been higher.
Annual Report
| Annualized Expense Ratio | Beginning
Account Value
May 1, 2011 | Ending
Account Value
October 31, 2011 | Expenses Paid
During Period*
May 1, 2011 to October 31, 2011 |
Class A | 1.29% | | | |
Actual | | $ 1,000.00 | $ 827.20 | $ 5.94 |
HypotheticalA | | $ 1,000.00 | $ 1,018.70 | $ 6.56 |
Class T | 1.54% | | | |
Actual | | $ 1,000.00 | $ 825.90 | $ 7.09 |
HypotheticalA | | $ 1,000.00 | $ 1,017.44 | $ 7.83 |
Class B | 2.05% | | | |
Actual | | $ 1,000.00 | $ 824.20 | $ 9.43 |
HypotheticalA | | $ 1,000.00 | $ 1,014.87 | $ 10.41 |
Class C | 2.04% | | | |
Actual | | $ 1,000.00 | $ 824.30 | $ 9.38 |
HypotheticalA | | $ 1,000.00 | $ 1,014.92 | $ 10.36 |
International Discovery | .96% | | | |
Actual | | $ 1,000.00 | $ 828.60 | $ 4.42 |
HypotheticalA | | $ 1,000.00 | $ 1,020.37 | $ 4.89 |
Class K | .79% | | | |
Actual | | $ 1,000.00 | $ 829.20 | $ 3.64 |
HypotheticalA | | $ 1,000.00 | $ 1,021.22 | $ 4.02 |
Institutional Class | .95% | | | |
Actual | | $ 1,000.00 | $ 828.40 | $ 4.38 |
HypotheticalA | | $ 1,000.00 | $ 1,020.42 | $ 4.84 |
A 5% return per year before expenses
* Expenses are equal to each Class' annualized expense ratio, multiplied by the average account value over the period, multiplied by 184/365 (to reflect the one-half year period).
Annual Report
Investment Changes (Unaudited)
Geographic Diversification (% of fund's net assets) |
As of October 31, 2011 |
| United Kingdom 21.0% | |
| Japan 15.8% | |
| France 9.1% | |
| Switzerland 6.8% | |
| Germany 6.3% | |
| Australia 3.5% | |
| Netherlands 3.4% | |
| Cayman Islands 2.8% | |
| Korea (South) 2.5% | |
| Other 28.8% | |

Percentages are adjusted for the effect of futures contracts, if applicable. |
As of April 30, 2011 |
| United Kingdom 21.3% | |
| Japan 16.2% | |
| France 8.8% | |
| Germany 7.7% | |
| Switzerland 5.2% | |
| Australia 4.1% | |
| United States of America 3.7% | |
| Netherlands 3.3% | |
| Denmark 3.1% | |
| Other 26.6% | |

Percentages are adjusted for the effect of futures contracts, if applicable. |
Asset Allocation |
| % of fund's
net assets | % of fund's net assets
6 months ago |
Stocks | 99.9 | 98.7 |
Short-Term Investments and Net Other Assets | 0.1 | 1.3 |
Top Ten Stocks as of October 31, 2011 |
| % of fund's
net assets | % of fund's net assets
6 months ago |
Royal Dutch Shell PLC Class B (United Kingdom, Oil, Gas & Consumable Fuels) | 2.8 | 2.8 |
Nestle SA (Switzerland, Food Products) | 2.0 | 0.9 |
British American Tobacco PLC (United Kingdom) (United Kingdom, Tobacco) | 1.8 | 0.4 |
BHP Billiton PLC (United Kingdom, Metals & Mining) | 1.7 | 1.9 |
Vodafone Group PLC (United Kingdom, Wireless Telecommunication Services) | 1.5 | 1.2 |
ORIX Corp. (Japan, Diversified Financial Services) | 1.3 | 1.1 |
BG Group PLC (United Kingdom, Oil, Gas & Consumable Fuels) | 1.3 | 1.0 |
Japan Tobacco, Inc. (Japan, Tobacco) | 1.3 | 0.5 |
Novo Nordisk A/S Series B (Denmark, Pharmaceuticals) | 1.3 | 1.5 |
HSBC Holdings PLC (United Kingdom) (United Kingdom, Commercial Banks) | 1.2 | 1.3 |
| 16.2 | |
Market Sectors as of October 31, 2011 |
| % of fund's
net assets | % of fund's net assets
6 months ago |
Financials | 21.3 | 21.3 |
Consumer Discretionary | 18.6 | 17.3 |
Consumer Staples | 12.6 | 8.2 |
Information Technology | 9.8 | 8.7 |
Industrials | 9.6 | 14.3 |
Energy | 7.5 | 8.5 |
Health Care | 7.2 | 6.2 |
Telecommunication Services | 6.4 | 5.3 |
Materials | 6.0 | 8.7 |
Utilities | 0.9 | 0.2 |
Annual Report
Investments October 31, 2011
Showing Percentage of Net Assets
Common Stocks - 98.6% |
| Shares | | Value (000s) |
Australia - 3.5% |
Australia & New Zealand Banking Group Ltd. | 4,456,031 | | $ 100,700 |
carsales.com Ltd. (d) | 3,966,844 | | 20,509 |
Commonwealth Bank of Australia | 1,268,063 | | 65,147 |
Fortescue Metals Group Ltd. | 3,503,390 | | 17,599 |
Macquarie Group Ltd. | 472,090 | | 12,156 |
Newcrest Mining Ltd. | 1,658,172 | | 58,608 |
WorleyParsons Ltd. | 993,898 | | 28,850 |
TOTAL AUSTRALIA | | 303,569 |
Austria - 0.0% |
Osterreichische Elektrizitatswirtschafts AG | 101,380 | | 2,951 |
Bailiwick of Guernsey - 0.1% |
Ashmore Global Opportunities Ltd. (United Kingdom) | 825,990 | | 9,166 |
Bailiwick of Jersey - 2.0% |
Experian PLC | 3,236,600 | | 42,187 |
Shire PLC | 2,310,400 | | 72,527 |
Velti PLC (a) | 290,405 | | 2,445 |
Wolseley PLC | 1,930,464 | | 55,820 |
TOTAL BAILIWICK OF JERSEY | | 172,979 |
Belgium - 0.3% |
Anheuser-Busch InBev SA NV | 542,427 | | 30,085 |
Bermuda - 1.0% |
African Minerals Ltd. (a) | 2,899,600 | | 20,599 |
Cheung Kong Infrastructure Holdings Ltd. | 6,530,000 | | 34,979 |
Li & Fung Ltd. | 9,616,000 | | 18,532 |
Noble Group Ltd. | 11,199,364 | | 13,670 |
TOTAL BERMUDA | | 87,780 |
Brazil - 2.1% |
Anhanguera Educacional Participacoes SA | 1,834,900 | | 26,981 |
Arezzo Industria e Comercio SA | 849,800 | | 11,234 |
Itau Unibanco Banco Multiplo SA sponsored ADR | 1,260,500 | | 24,101 |
Qualicorp SA | 4,305,000 | | 39,360 |
Souza Cruz Industria Comerico | 3,799,000 | | 46,592 |
TIM Participacoes SA sponsored ADR (d) | 1,447,849 | | 37,702 |
TOTAL BRAZIL | | 185,970 |
Common Stocks - continued |
| Shares | | Value (000s) |
British Virgin Islands - 0.5% |
Arcos Dorados Holdings, Inc. | 731,300 | | $ 17,112 |
Mail.ru Group Ltd. GDR (Reg. S) | 713,000 | | 24,563 |
TOTAL BRITISH VIRGIN ISLANDS | | 41,675 |
Canada - 1.2% |
Canadian Natural Resources Ltd. | 573,500 | | 20,228 |
InterOil Corp. (a)(d) | 204,400 | | 9,711 |
Open Text Corp. (a)(d) | 769,600 | | 47,102 |
Trinidad Drilling Ltd. | 3,430,500 | | 26,842 |
TOTAL CANADA | | 103,883 |
Cayman Islands - 2.8% |
Airtac International Group | 2,543,000 | | 14,233 |
Belle International Holdings Ltd. | 10,683,000 | | 20,952 |
Biostime International Holdings Ltd. | 8,183,000 | | 14,593 |
Bosideng International Holdings Ltd. | 43,814,000 | | 12,078 |
China Kanghui Holdings sponsored ADR (a)(d) | 1,747,000 | | 27,375 |
China Mengniu Dairy Co. Ltd. | 6,180,000 | | 19,693 |
China ZhengTong Auto Services Holdings Ltd. | 14,117,500 | | 15,287 |
Ctrip.com International Ltd. sponsored ADR (a) | 915,000 | | 31,897 |
Hengdeli Holdings Ltd. | 28,576,000 | | 12,811 |
Microport Scientific Corp. | 8,277,000 | | 4,678 |
Sands China Ltd. (a) | 17,144,800 | | 51,523 |
Shenguan Holdings Group Ltd. | 35,412,000 | | 19,025 |
TOTAL CAYMAN ISLANDS | | 244,145 |
China - 1.3% |
Baidu.com, Inc. sponsored ADR (a) | 394,600 | | 55,315 |
China Telecom Corp. Ltd. (H Shares) | 41,444,000 | | 25,588 |
SINA Corp. (a)(d) | 310,200 | | 25,216 |
Zhaojin Mining Industry Co. Ltd. (H Shares) | 4,984,000 | | 8,898 |
TOTAL CHINA | | 115,017 |
Cyprus - 0.0% |
Aisi Realty Public Ltd. (a)(e) | 216,330 | | 240 |
Denmark - 2.2% |
Novo Nordisk A/S Series B | 1,029,289 | | 109,293 |
William Demant Holding A/S (a) | 984,500 | | 78,551 |
TOTAL DENMARK | | 187,844 |
Common Stocks - continued |
| Shares | | Value (000s) |
Finland - 0.7% |
Amer Group PLC (A Shares) | 1,325,300 | | $ 18,322 |
Nokian Tyres PLC | 1,213,133 | | 44,574 |
TOTAL FINLAND | | 62,896 |
France - 9.1% |
Air Liquide SA | 307,100 | | 39,843 |
Arkema SA | 436,670 | | 29,874 |
Atos Origin SA | 1,058,073 | | 51,279 |
AXA SA | 3,922,902 | | 63,898 |
BNP Paribas SA | 1,322,566 | | 60,125 |
Club Mediterranee SA (a) | 470,000 | | 8,917 |
Danone | 1,265,300 | | 88,078 |
Iliad SA | 625,259 | | 73,187 |
Ipsos SA | 54,516 | | 1,790 |
JC Decaux SA (a) | 652,300 | | 17,481 |
LVMH Moet Hennessy - Louis Vuitton | 621,877 | | 103,489 |
Pernod-Ricard SA | 329,525 | | 30,782 |
PPR SA | 398,700 | | 62,294 |
Safran SA | 714,800 | | 23,415 |
Sanofi-aventis | 953,011 | | 68,187 |
Schneider Electric SA | 529,528 | | 31,255 |
Societe Generale Series A | 685,447 | | 20,015 |
Unibail-Rodamco | 118,400 | | 23,677 |
TOTAL FRANCE | | 797,586 |
Germany - 5.1% |
Aareal Bank AG (a) | 1,131,037 | | 22,993 |
Allianz AG | 325,100 | | 36,537 |
Bayer AG | 767,558 | | 49,176 |
Bayerische Motoren Werke AG (BMW) | 834,676 | | 68,221 |
Commerzbank AG (a) | 4,229,500 | | 10,436 |
Deutsche Bank AG | 1,018,100 | | 42,103 |
Fresenius Medical Care AG & Co. KGaA | 940,100 | | 68,492 |
GEA Group AG | 992,880 | | 27,433 |
Gerry Weber International AG (Bearer) | 320,600 | | 9,983 |
Kabel Deutschland Holding AG (a) | 1,085,800 | | 61,999 |
Siemens AG | 475,549 | | 49,855 |
TOTAL GERMANY | | 447,228 |
Hong Kong - 1.5% |
AIA Group Ltd. | 13,058,400 | | 39,929 |
China Unicom (Hong Kong) Ltd. | 12,452,000 | | 25,036 |
Common Stocks - continued |
| Shares | | Value (000s) |
Hong Kong - continued |
I.T Ltd. | 14,631,000 | | $ 9,112 |
Techtronic Industries Co. Ltd. | 65,201,500 | | 56,415 |
TOTAL HONG KONG | | 130,492 |
India - 1.6% |
Apollo Hospitals Enterprise Ltd. | 1,432,254 | | 15,263 |
Bharti Airtel Ltd. | 5,744,231 | | 46,004 |
Housing Development Finance Corp. Ltd. | 2,696,342 | | 37,945 |
Larsen & Toubro Ltd. | 279,321 | | 8,057 |
Shriram Transport Finance Co. Ltd. | 732,049 | | 9,165 |
The Jammu & Kashmir Bank Ltd. | 545,569 | | 9,407 |
Titan Industries Ltd. | 3,211,760 | | 14,263 |
TOTAL INDIA | | 140,104 |
Indonesia - 0.6% |
PT Astra International Tbk | 1,338,500 | | 10,321 |
PT Sarana Menara Nusantara Tbk (a) | 13,136,500 | | 13,282 |
PT Tower Bersama Infrastructure Tbk | 55,223,500 | | 12,852 |
PT XL Axiata Tbk | 22,623,000 | | 12,653 |
TOTAL INDONESIA | | 49,108 |
Ireland - 1.4% |
Accenture PLC Class A | 719,100 | | 43,333 |
James Hardie Industries NV CDI (a) | 5,530,462 | | 35,824 |
Kenmare Resources PLC (a) | 5,264,162 | | 3,435 |
Paddy Power PLC (Ireland) | 728,700 | | 40,338 |
TOTAL IRELAND | | 122,930 |
Israel - 0.6% |
Check Point Software Technologies Ltd. (a) | 517,600 | | 29,829 |
Israel Chemicals Ltd. | 1,513,500 | | 18,212 |
TOTAL ISRAEL | | 48,041 |
Italy - 1.4% |
Intesa Sanpaolo SpA | 8,188,112 | | 14,629 |
Prada SpA | 2,305,100 | | 11,395 |
Prysmian SpA | 1,473,800 | | 22,334 |
Saipem SpA | 1,580,606 | | 70,872 |
TOTAL ITALY | | 119,230 |
Japan - 15.8% |
ABC-Mart, Inc. | 1,529,000 | | 59,886 |
Aozora Bank Ltd. | 4,562,000 | | 11,534 |
Common Stocks - continued |
| Shares | | Value (000s) |
Japan - continued |
Asics Corp. | 3,605,000 | | $ 47,798 |
Calbee, Inc. (d) | 700,800 | | 31,951 |
Canon, Inc. | 1,744,350 | | 79,200 |
Cosmos Pharmaceutical Corp. | 859,200 | | 39,858 |
Credit Saison Co. Ltd. | 1,323,500 | | 25,830 |
DeNA Co. Ltd. | 336,000 | | 14,504 |
Denso Corp. | 1,300,300 | | 39,994 |
Digital Garage, Inc. (a) | 2,715 | | 8,890 |
Don Quijote Co. Ltd. | 1,367,200 | | 50,088 |
Fanuc Corp. | 381,000 | | 61,612 |
Honda Motor Co. Ltd. | 1,966,400 | | 58,810 |
Japan Retail Fund Investment Corp. | 1,225 | | 1,897 |
Japan Tobacco, Inc. | 22,266 | | 111,303 |
JS Group Corp. | 1,457,600 | | 30,569 |
JSR Corp. | 2,283,400 | | 43,596 |
Kakaku.com, Inc. | 810,600 | | 32,100 |
KDDI Corp. | 10,315 | | 75,571 |
Keyence Corp. | 192,600 | | 48,967 |
Misumi Group, Inc. | 1,254,900 | | 26,114 |
Mitsubishi Corp. | 2,574,400 | | 52,954 |
Mitsubishi Estate Co. Ltd. | 1,553,000 | | 26,307 |
Mitsubishi UFJ Financial Group, Inc. | 15,161,400 | | 65,899 |
ORIX Corp. | 1,321,050 | | 115,310 |
Rakuten, Inc. | 68,670 | | 75,288 |
So-net M3, Inc. (d) | 5,296 | | 23,954 |
SOFTBANK CORP. | 1,375,900 | | 44,661 |
Start Today Co. Ltd. | 2,740,800 | | 57,987 |
Tokyo Electron Ltd. | 309,600 | | 16,468 |
TOTAL JAPAN | | 1,378,900 |
Korea (South) - 2.5% |
Hyundai Motor Co. | 209,530 | | 42,040 |
Kia Motors Corp. | 453,500 | | 28,966 |
LG Household & Health Care Ltd. | 49,310 | | 22,187 |
NHN Corp. (a) | 64,289 | | 13,362 |
Orion Corp. | 113,331 | | 60,574 |
Samsung Electronics Co. Ltd. | 38,175 | | 32,741 |
Shinhan Financial Group Co. Ltd. | 421,030 | | 16,710 |
TOTAL KOREA (SOUTH) | | 216,580 |
Luxembourg - 1.3% |
Brait SA | 5,949,360 | | 14,243 |
Common Stocks - continued |
| Shares | | Value (000s) |
Luxembourg - continued |
Millicom International Cellular SA | 190,400 | | $ 20,925 |
Millicom International Cellular SA (depositary receipt) | 477,100 | | 52,580 |
Samsonite International SA | 14,826,300 | | 24,124 |
TOTAL LUXEMBOURG | | 111,872 |
Mexico - 0.5% |
Wal-Mart de Mexico SA de CV Series V | 18,209,000 | | 47,039 |
Netherlands - 3.4% |
AEGON NV (a) | 5,028,800 | | 23,986 |
ASML Holding NV | 971,700 | | 40,743 |
Gemalto NV | 1,818,979 | | 82,995 |
ING Groep NV (Certificaten Van Aandelen) (a) | 11,511,300 | | 99,253 |
Koninklijke Philips Electronics NV | 1,247,700 | | 25,977 |
Randstad Holdings NV | 726,367 | | 25,910 |
TOTAL NETHERLANDS | | 298,864 |
Norway - 1.1% |
Aker Solutions ASA | 1,927,748 | | 22,419 |
DnB NOR ASA | 6,602,355 | | 77,021 |
TOTAL NORWAY | | 99,440 |
Philippines - 0.3% |
Alliance Global Group, Inc. | 101,250,000 | | 25,173 |
Poland - 0.3% |
Eurocash SA | 3,593,990 | | 28,816 |
Qatar - 0.3% |
Commercial Bank of Qatar GDR (Reg. S) | 5,094,802 | | 23,366 |
South Africa - 1.0% |
AngloGold Ashanti Ltd. sponsored ADR | 816,100 | | 36,896 |
Sanlam Ltd. | 5,826,600 | | 21,768 |
Shoprite Holdings Ltd. | 2,042,000 | | 29,926 |
TOTAL SOUTH AFRICA | | 88,590 |
Spain - 1.5% |
Banco Bilbao Vizcaya Argentaria SA | 1,836,204 | | 16,528 |
Banco Santander SA: | | | |
rights 10/31/11 | 6,080,392 | | 1,052 |
(Spain) | 6,080,392 | | 51,471 |
Inditex SA | 280,831 | | 25,557 |
Common Stocks - continued |
| Shares | | Value (000s) |
Spain - continued |
Prosegur Compania de Seguridad SA (Reg.) | 382,900 | | $ 19,103 |
Viscofan Envolturas Celulosicas SA | 515,100 | | 19,824 |
TOTAL SPAIN | | 133,535 |
Sweden - 1.3% |
Elekta AB (B Shares) | 316,100 | | 12,650 |
Intrum Justitia AB | 111,800 | | 1,839 |
Meda AB (A Shares) | 1,713,200 | | 17,501 |
Swedbank AB (A Shares) | 3,382,000 | | 47,647 |
Swedish Match Co. | 1,052,600 | | 36,424 |
TOTAL SWEDEN | | 116,061 |
Switzerland - 6.8% |
Adecco SA (Reg.) | 548,529 | | 26,509 |
Compagnie Financiere Richemont SA Series A | 315,194 | | 18,049 |
Kuehne & Nagel International AG | 197,400 | | 24,586 |
Nestle SA | 2,973,853 | | 172,491 |
Partners Group Holding | 230,056 | | 43,125 |
Schindler Holding AG (participation certificate) | 554,147 | | 65,168 |
The Swatch Group AG (Bearer) | 98,950 | | 41,901 |
Transocean Ltd. (United States) | 829,400 | | 47,400 |
UBS AG (a) | 3,755,130 | | 47,472 |
UBS AG (NY Shares) (a) | 1,833,200 | | 23,135 |
Zurich Financial Services AG | 346,539 | | 80,479 |
TOTAL SWITZERLAND | | 590,315 |
Taiwan - 0.5% |
Catcher Technology Co. Ltd. | 5,046,500 | | 28,117 |
WPG Holding Co. Ltd. | 15,884,570 | | 19,181 |
TOTAL TAIWAN | | 47,298 |
Turkey - 0.1% |
Boyner Buyuk Magazacilik A/S (a)(e) | 6,011,100 | | 10,096 |
United Kingdom - 21.0% |
Aberdeen Asset Management PLC | 9,033,732 | | 27,966 |
Aggreko PLC | 484,300 | | 13,334 |
Anglo American PLC (United Kingdom) | 1,293,300 | | 47,702 |
Ashmore Group PLC | 3,169,400 | | 17,585 |
Aviva PLC | 6,344,300 | | 34,618 |
Barclays PLC | 22,562,258 | | 69,955 |
BG Group PLC | 5,124,372 | | 111,789 |
BHP Billiton PLC | 4,802,296 | | 151,250 |
Common Stocks - continued |
| Shares | | Value (000s) |
United Kingdom - continued |
BP PLC | 11,307,867 | | $ 83,228 |
British American Tobacco PLC (United Kingdom) | 3,366,600 | | 154,388 |
British Land Co. PLC | 5,756,734 | | 47,262 |
Burberry Group PLC | 1,970,900 | | 42,504 |
Carphone Warehouse Group PLC | 15,119,465 | | 85,346 |
Diageo PLC | 1,603,635 | | 33,195 |
GlaxoSmithKline PLC | 3,131,100 | | 70,282 |
HSBC Holdings PLC (United Kingdom) | 11,905,657 | | 103,900 |
Imperial Tobacco Group PLC | 1,488,285 | | 54,427 |
International Personal Finance PLC | 9,411,888 | | 41,503 |
Jazztel PLC (a)(d) | 3,802,400 | | 21,996 |
Legal & General Group PLC | 30,442,457 | | 54,098 |
Lloyds Banking Group PLC (a) | 49,557,364 | | 25,632 |
Micro Focus International PLC | 2,166,900 | | 11,834 |
National Grid PLC | 4,386,000 | | 43,614 |
Ocado Group PLC (a)(d) | 14,388,400 | | 21,670 |
Reckitt Benckiser Group PLC | 414,431 | | 21,314 |
Royal Dutch Shell PLC Class B | 6,770,160 | | 242,949 |
Royalblue Group PLC | 128,356 | | 3,358 |
SuperGroup PLC (a)(d) | 960,741 | | 9,641 |
The Weir Group PLC | 599,600 | | 18,504 |
Ultra Electronics Holdings PLC | 614,667 | | 15,737 |
Vodafone Group PLC | 46,662,143 | | 129,590 |
Xstrata PLC | 1,728,100 | | 29,056 |
TOTAL UNITED KINGDOM | | 1,839,227 |
United States of America - 1.9% |
Citrix Systems, Inc. (a) | 546,700 | | 39,816 |
Cognizant Technology Solutions Corp. Class A (a) | 298,200 | | 21,694 |
Green Mountain Coffee Roasters, Inc. (a) | 180,700 | | 11,749 |
MasterCard, Inc. Class A | 165,200 | | 57,364 |
Virgin Media, Inc. | 1,603,800 | | 39,101 |
TOTAL UNITED STATES OF AMERICA | | 169,724 |
TOTAL COMMON STOCKS (Cost $8,600,939) |
8,627,815
|
Nonconvertible Preferred Stocks - 1.3% |
| Shares | | Value (000s) |
Germany - 1.2% |
ProSiebenSat.1 Media AG | 40,648 | | $ 872 |
Volkswagen AG | 569,500 | | 99,935 |
TOTAL GERMANY | | 100,807 |
Italy - 0.1% |
Fiat Industrial SpA (a) | 2,156,296 | | 13,231 |
TOTAL NONCONVERTIBLE PREFERRED STOCKS (Cost $90,158) |
114,038
|
Money Market Funds - 1.2% |
| | | |
Fidelity Cash Central Fund, 0.12% (b) | 27,641,463 | | 27,641 |
Fidelity Securities Lending Cash Central Fund, 0.11% (b)(c) | 80,899,017 | | 80,899 |
TOTAL MONEY MARKET FUNDS (Cost $108,540) |
108,540
|
TOTAL INVESTMENT PORTFOLIO - 101.1% (Cost $8,799,637) | | 8,850,393 |
NET OTHER ASSETS (LIABILITIES) - (1.1)% | | (97,426) |
NET ASSETS - 100% | $ 8,752,967 |
Legend |
(a) Non-income producing |
(b) Affiliated fund that is available only to investment companies and other accounts managed by Fidelity Investments. The rate quoted is the annualized seven-day yield of the fund at period end. A complete unaudited listing of the fund's holdings as of its most recent quarter end is available upon request. In addition, each Fidelity Central Fund's financial statements, which are not covered by the Fund's Report of Independent Registered Public Accounting Firm, are available on the SEC's website or upon request. |
(c) Investment made with cash collateral received from securities on loan. |
(d) Security or a portion of the security is on loan at period end. |
(e) Affiliated company |
Affiliated Central Funds |
Information regarding fiscal year to date income earned by the Fund from investments in Fidelity Central Funds is as follows: |
Fund | Income earned
(Amounts in thousands) |
Fidelity Cash Central Fund | $ 112 |
Fidelity Securities Lending Cash Central Fund | 6,208 |
Total | $ 6,320 |
Other Affiliated Issuers |
An affiliated company is a company in which the Fund has ownership of at least 5% of the voting securities. Fiscal year to date transactions with companies which are or were affiliates are as follows: |
Affiliate
(Amounts in thousands) | Value, beginning of period | Purchases | Sales Proceeds | Dividend Income | Value,
end of
period |
Aisi Realty Public Ltd. | $ 607 | $ - | $ - | $ - | $ 240 |
Ashmore Global Opportunities Ltd. (United States) | - | 10,376 | - | 259 | - |
Boyner Buyuk Magazacilik A/S | 11,256 | 2,951 | - | - | 10,096 |
Total | $ 11,863 | $ 13,327 | $ - | $ 259 | $ 10,336 |
Other Information |
The following is a summary of the inputs used, as of October 31, 2011, involving the Fund's assets and liabilities carried at fair value. The inputs or methodology used for valuing securities may not be an indication of the risk associated with investing in those securities. For more information on valuation inputs, and their aggregation into the levels used in the tables below, please refer to the Security Valuation section in the accompanying Notes to Financial Statements. |
Valuation Inputs at Reporting Date: |
Description
(Amounts in thousands) | Total | Level 1 | Level 2 | Level 3 |
Investments in Securities: | | | | |
Equities: | | | | |
United Kingdom | $ 1,839,227 | $ 696,626 | $ 1,142,601 | $ - |
Japan | 1,378,900 | - | 1,378,900 | - |
France | 797,586 | 729,399 | 68,187 | - |
Switzerland | 590,315 | 542,843 | 47,472 | - |
Germany | 548,035 | 387,585 | 160,450 | - |
Australia | 303,569 | - | 303,569 | - |
Netherlands | 298,864 | 149,648 | 149,216 | - |
Cayman Islands | 244,145 | 59,272 | 184,873 | - |
Korea (South) | 216,580 | - | 216,580 | - |
Other | 2,524,632 | 1,704,716 | 819,916 | - |
Money Market Funds | 108,540 | 108,540 | - | - |
Total Investments in Securities: | $ 8,850,393 | $ 4,378,629 | $ 4,471,764 | $ - |
Transfers from Level 1 to Level 2 during the period were $1,331,743,000. |
The following is a reconciliation of Investments in Securities for which Level 3 inputs were used in determining value: |
(Amounts in thousands) | |
Investments in Securities: | |
Beginning Balance | $ 607 |
Total Realized Gain (Loss) | - |
Total Unrealized Gain (Loss) | - |
Cost of Purchases | - |
Proceeds of Sales | - |
Amortization/Accretion | - |
Transfers in to Level 3 | - |
Transfers out of Level 3 | (607) |
Ending Balance | $ - |
The change in unrealized gain (loss) for the period attributable to Level 3 securities held at October 31, 2011 | $ - |
The information used in the above reconciliation represents fiscal year to date activity for any Investments in Securities identified as using Level 3 inputs at either the beginning or the end of the current fiscal period. Transfers in or out of Level 3 represent the beginning value of any Security or Instrument where a change in the pricing level occurred from the beginning to the end of the period. The cost of purchases and the proceeds of sales may include securities received or delivered through corporate actions or exchanges. Realized and unrealized gains (losses) disclosed in the reconciliation are included in Net Gain (Loss) on the Fund's Statement of Operations. |
Income Tax Information |
At October 31, 2011, the Fund had a capital loss carryforward of approximately $1,349,541,000 all of which will expire in fiscal 2017. Capital loss carryforwards are only available to offset future capital gains of the Fund to the extent provided by regulations and may be limited. |
See accompanying notes which are an integral part of the financial statements.
Annual Report
Statement of Assets and Liabilities
Amounts in thousands (except per-share amounts) | October 31, 2011 |
| | |
Assets | | |
Investment in securities, at value (including securities loaned of $73,811) - See accompanying schedule: Unaffiliated issuers (cost $8,669,458) | $ 8,731,517 | |
Fidelity Central Funds (cost $108,540) | 108,540 | |
Other affiliated issuers (cost $21,639) | 10,336 | |
Total Investments (cost $8,799,637) | | $ 8,850,393 |
Foreign currency held at value (cost $37,392) | | 37,392 |
Receivable for investments sold | | 89,865 |
Receivable for fund shares sold | | 6,925 |
Dividends receivable | | 18,912 |
Distributions receivable from Fidelity Central Funds | | 280 |
Prepaid expenses | | 35 |
Other receivables | | 5,269 |
Total assets | | 9,009,071 |
| | |
Liabilities | | |
Payable to custodian bank | $ 756 | |
Payable for investments purchased | 155,082 | |
Payable for fund shares redeemed | 11,410 | |
Accrued management fee | 4,698 | |
Distribution and service plan fees payable | 125 | |
Other affiliated payables | 1,638 | |
Other payables and accrued expenses | 1,496 | |
Collateral on securities loaned, at value | 80,899 | |
Total liabilities | | 256,104 |
| | |
Net Assets | | $ 8,752,967 |
Net Assets consist of: | | |
Paid in capital | | $ 10,067,323 |
Undistributed net investment income | | 102,433 |
Accumulated undistributed net realized gain (loss) on investments and foreign currency transactions | | (1,466,813) |
Net unrealized appreciation (depreciation) on investments and assets and liabilities in foreign currencies | | 50,024 |
Net Assets | | $ 8,752,967 |
See accompanying notes which are an integral part of the financial statements.
Annual Report
Financial Statements - continued
Statement of Assets and Liabilities - continued
Amounts in thousands (except per-share amounts) | October 31, 2011 |
| | |
Calculation of Maximum Offering Price Class A: Net Asset Value and redemption price per share
($319,917 ÷ 10,869.3 shares) | | $ 29.43 |
| | |
Maximum offering price per share (100/94.25 of $29.43) | | $ 31.23 |
Class T:
Net Asset Value and redemption price per share ($60,905 ÷ 2,087.0 shares) | | $ 29.18 |
| | |
Maximum offering price per share (100/96.50 of $29.18) | | $ 30.24 |
Class B:
Net Asset Value and offering price per share
($10,183 ÷ 350.9 shares)A | | $ 29.02 |
| | |
Class C:
Net Asset Value and offering price per share
($32,911 ÷ 1,131.9 shares)A | | $ 29.08 |
| | |
International Discovery:
Net Asset Value, offering price and redemption price per share ($6,806,183 ÷ 229,250.8 shares) | | $ 29.69 |
| | |
Class K:
Net Asset Value, offering price and redemption price per share ($1,244,550 ÷ 41,955.8 shares) | | $ 29.66 |
| | |
Institutional Class:
Net Asset Value, offering price and redemption price per share ($278,318 ÷ 9,386.6 shares) | | $ 29.65 |
A Redemption price per share is equal to net asset value less any applicable contingent deferred sales charge.
See accompanying notes which are an integral part of the financial statements.
Annual Report
Statement of Operations
Amounts in thousands | Year ended October 31, 2011 |
| | |
Investment Income | | |
Dividends (including $259 earned from other affiliated issuers) | | $ 263,448 |
Interest | | 3 |
Income from Fidelity Central Funds | | 6,320 |
Income before foreign taxes withheld | | 269,771 |
Less foreign taxes withheld | | (16,970) |
Total income | | 252,801 |
| | |
Expenses | | |
Management fee
Basic fee | $ 69,910 | |
Performance adjustment | (475) | |
Transfer agent fees | 20,262 | |
Distribution and service plan fees | 1,864 | |
Accounting and security lending fees | 1,798 | |
Custodian fees and expenses | 1,713 | |
Independent trustees' compensation | 55 | |
Registration fees | 186 | |
Audit | 122 | |
Legal | 40 | |
Interest | 2 | |
Miscellaneous | 107 | |
Total expenses before reductions | 95,584 | |
Expense reductions | (4,391) | 91,193 |
Net investment income (loss) | | 161,608 |
Realized and Unrealized Gain (Loss) Net realized gain (loss) on: | | |
Investment securities: | | |
Unaffiliated issuers | 506,179 | |
Foreign currency transactions | (4,241) | |
Total net realized gain (loss) | | 501,938 |
Change in net unrealized appreciation (depreciation) on: Investment securities (net of decrease in deferred foreign taxes of $8,547) | (1,246,049) | |
Assets and liabilities in foreign currencies | (1,473) | |
Total change in net unrealized appreciation (depreciation) | | (1,247,522) |
Net gain (loss) | | (745,584) |
Net increase (decrease) in net assets resulting from operations | | $ (583,976) |
See accompanying notes which are an integral part of the financial statements.
Annual Report
Financial Statements - continued
Statement of Changes in Net Assets
Amounts in thousands | Year ended
October 31,
2011 | Year ended
October 31,
2010 |
Increase (Decrease) in Net Assets | | |
Operations | | |
Net investment income (loss) | $ 161,608 | $ 130,595 |
Net realized gain (loss) | 501,938 | 481,821 |
Change in net unrealized appreciation (depreciation) | (1,247,522) | 638,780 |
Net increase (decrease) in net assets resulting
from operations | (583,976) | 1,251,196 |
Distributions to shareholders from net investment income | (149,936) | (116,422) |
Distributions to shareholders from net realized gain | (48,090) | (13,374) |
Total distributions | (198,026) | (129,796) |
Share transactions - net increase (decrease) | (537,341) | (662,032) |
Redemption fees | 160 | 291 |
Total increase (decrease) in net assets | (1,319,183) | 459,659 |
| | |
Net Assets | | |
Beginning of period | 10,072,150 | 9,612,491 |
End of period (including undistributed net investment income of $102,433 and undistributed net investment income of $120,198, respectively) | $ 8,752,967 | $ 10,072,150 |
See accompanying notes which are an integral part of the financial statements.
Annual Report
Financial Highlights - Class A
Years ended October 31, | 2011 | 2010 | 2009 | 2008 | 2007 |
Selected Per-Share Data | | | | | |
Net asset value, beginning of period | $ 32.07 | $ 28.57 | $ 23.68 | $ 47.34 | $ 36.47 |
Income from Investment Operations | | | | | |
Net investment income (loss) C | .42 | .31 | .31 | .46 | .44 |
Net realized and unrealized gain (loss) | (2.52) | 3.51 | 4.84 | (22.08) | 11.76 |
Total from investment operations | (2.10) | 3.82 | 5.15 | (21.62) | 12.20 |
Distributions from net investment income | (.38) | (.28) | (.26) | (.37) | (.35) |
Distributions from net realized gain | (.16) | (.04) | - | (1.67) | (.98) |
Total distributions | (.54) | (.32) | (.26) | (2.04) | (1.33) |
Redemption fees added to paid in capital C,G | - | - | - | - | - |
Net asset value, end of period | $ 29.43 | $ 32.07 | $ 28.57 | $ 23.68 | $ 47.34 |
Total Return A,B | (6.71)% | 13.43% | 22.14% | (47.65)% | 34.54% |
Ratios to Average Net Assets D,F | | | | | |
Expenses before reductions | 1.30% | 1.33% | 1.37% | 1.32% | 1.25% |
Expenses net of fee waivers, if any | 1.29% | 1.33% | 1.37% | 1.32% | 1.25% |
Expenses net of all reductions | 1.25% | 1.28% | 1.32% | 1.29% | 1.22% |
Net investment income (loss) | 1.31% | 1.06% | 1.28% | 1.27% | 1.08% |
Supplemental Data | | | | | |
Net assets, end of period (in millions) | $ 320 | $ 392 | $ 414 | $ 380 | $ 417 |
Portfolio turnover rate E | 75% | 82% | 98% | 79% | 56% |
A Total returns would have been lower if certain expenses had not been reduced during the applicable periods shown.
B Total returns do not include the effect of the sales charges.
C Calculated based on average shares outstanding during the period.
D Fees and expenses of any underlying Fidelity Central Funds are not included in the Fund's expense ratio. The Fund indirectly bears its proportionate share of the expenses of any underlying Fidelity Central Funds.
E Amount does not include the portfolio activity of any underlying Fidelity Central Funds.
F Expense ratios reflect operating expenses of the class. Expenses before reductions do not reflect amounts reimbursed by the investment adviser or reductions from brokerage service arrangements or reductions from other expense offset arrangements and do not represent the amount paid by the class during periods when reimbursements or reductions occur. Expenses net of fee waivers reflect expenses after reimbursement by the investment adviser but prior to reductions from brokerage service arrangements or other expense offset arrangements. Expenses net of all reductions represent the net expenses paid by the class.
G Amount represents less than $.01 per share.
See accompanying notes which are an integral part of the financial statements.
Annual Report
Financial Highlights - Class T
Years ended October 31, | 2011 | 2010 | 2009 | 2008 | 2007 |
Selected Per-Share Data | | | | | |
Net asset value, beginning of period | $ 31.81 | $ 28.35 | $ 23.49 | $ 47.06 | $ 36.30 |
Income from Investment Operations | | | | | |
Net investment income (loss) C | .34 | .23 | .24 | .33 | .29 |
Net realized and unrealized gain (loss) | (2.51) | 3.48 | 4.81 | (21.94) | 11.71 |
Total from investment operations | (2.17) | 3.71 | 5.05 | (21.61) | 12.00 |
Distributions from net investment income | (.30) | (.21) | (.19) | (.29) | (.26) |
Distributions from net realized gain | (.16) | (.04) | - | (1.67) | (.98) |
Total distributions | (.46) | (.25) | (.19) | (1.96) | (1.24) |
Redemption fees added to paid in capital C,G | - | - | - | - | - |
Net asset value, end of period | $ 29.18 | $ 31.81 | $ 28.35 | $ 23.49 | $ 47.06 |
Total Return A,B | (6.96)% | 13.14% | 21.79% | (47.84)% | 34.08% |
Ratios to Average Net Assets D,F | | | | | |
Expenses before reductions | 1.56% | 1.60% | 1.65% | 1.68% | 1.63% |
Expenses net of fee waivers, if any | 1.55% | 1.60% | 1.65% | 1.68% | 1.63% |
Expenses net of all reductions | 1.51% | 1.56% | 1.60% | 1.64% | 1.60% |
Net investment income (loss) | 1.05% | .79% | 1.00% | .91% | .70% |
Supplemental Data | | | | | |
Net assets, end of period (in millions) | $ 61 | $ 92 | $ 83 | $ 64 | $ 53 |
Portfolio turnover rate E | 75% | 82% | 98% | 79% | 56% |
A Total returns would have been lower if certain expenses had not been reduced during the applicable periods shown.
B Total returns do not include the effect of the sales charges.
C Calculated based on average shares outstanding during the period.
D Fees and expenses of any underlying Fidelity Central Funds are not included in the Fund's expense ratio. The Fund indirectly bears its proportionate share of the expenses of any underlying Fidelity Central Funds.
E Amount does not include the portfolio activity of any underlying Fidelity Central Funds.
F Expense ratios reflect operating expenses of the class. Expenses before reductions do not reflect amounts reimbursed by the investment adviser or reductions from brokerage service arrangements or reductions from other expense offset arrangements and do not represent the amount paid by the class during periods when reimbursements or reductions occur. Expenses net of fee waivers reflect expenses after reimbursement by the investment adviser but prior to reductions from brokerage service arrangements or other expense offset arrangements. Expenses net of all reductions represent the net expenses paid by the class.
G Amount represents less than $.01 per share.
See accompanying notes which are an integral part of the financial statements.
Annual Report
Financial Highlights - Class B
Years ended October 31, | 2011 | 2010 | 2009 | 2008 | 2007 |
Selected Per-Share Data | | | | | |
Net asset value, beginning of period | $ 31.60 | $ 28.18 | $ 23.25 | $ 46.70 | $ 36.12 |
Income from Investment Operations | | | | | |
Net investment income (loss) C | .17 | .08 | .12 | .15 | .08 |
Net realized and unrealized gain (loss) | (2.48) | 3.44 | 4.81 | (21.77) | 11.64 |
Total from investment operations | (2.31) | 3.52 | 4.93 | (21.62) | 11.72 |
Distributions from net investment income | (.12) | (.06) | - | (.16) | (.16) |
Distributions from net realized gain | (.16) | (.04) | - | (1.67) | (.98) |
Total distributions | (.27) H | (.10) | - | (1.83) | (1.14) |
Redemption fees added to paid in capital C,G | - | - | - | - | - |
Net asset value, end of period | $ 29.02 | $ 31.60 | $ 28.18 | $ 23.25 | $ 46.70 |
Total Return A,B | (7.39)% | 12.52% | 21.20% | (48.11)% | 33.37% |
Ratios to Average Net Assets D,F | | | | | |
Expenses before reductions | 2.06% | 2.12% | 2.16% | 2.19% | 2.14% |
Expenses net of fee waivers, if any | 2.06% | 2.12% | 2.16% | 2.19% | 2.14% |
Expenses net of all reductions | 2.02% | 2.08% | 2.11% | 2.15% | 2.10% |
Net investment income (loss) | .54% | .27% | .49% | .40% | .19% |
Supplemental Data | | | | | |
Net assets, end of period (in millions) | $ 10 | $ 14 | $ 16 | $ 15 | $ 17 |
Portfolio turnover rate E | 75% | 82% | 98% | 79% | 56% |
A Total returns would have been lower if certain expenses had not been reduced during the applicable periods shown.
B Total returns do not include the effect of the contingent deferred sales charge.
C Calculated based on average shares outstanding during the period.
D Fees and expenses of any underlying Fidelity Central Funds are not included in the Fund's expense ratio. The Fund indirectly bears its proportionate share of the expenses of any underlying Fidelity Central Funds.
E Amount does not include the portfolio activity of any underlying Fidelity Central Funds.
F Expense ratios reflect operating expenses of the class. Expenses before reductions do not reflect amounts reimbursed by the investment adviser or reductions from brokerage service arrangements or reductions from other expense offset arrangements and do not represent the amount paid by the class during periods when reimbursements or reductions occur. Expenses net of fee waivers reflect expenses after reimbursement by the investment adviser but prior to reductions from brokerage service arrangements or other expense offset arrangements. Expenses net of all reductions represent the net expenses paid by the class.
G Amount represents less than $.01 per share.
H Total distributions of $.27 per share is comprised of distributions from net investment income of $.115 and distributions from net realized gain of $.155 per share.
See accompanying notes which are an integral part of the financial statements.
Annual Report
Financial Highlights - Class C
Years ended October 31, | 2011 | 2010 | 2009 | 2008 | 2007 |
Selected Per-Share Data | | | | | |
Net asset value, beginning of period | $ 31.68 | $ 28.23 | $ 23.31 | $ 46.82 | $ 36.19 |
Income from Investment Operations | | | | | |
Net investment income (loss) C | .18 | .09 | .12 | .15 | .09 |
Net realized and unrealized gain (loss) | (2.49) | 3.45 | 4.82 | (21.82) | 11.66 |
Total from investment operations | (2.31) | 3.54 | 4.94 | (21.67) | 11.75 |
Distributions from net investment income | (.14) | (.05) | (.02) | (.17) | (.14) |
Distributions from net realized gain | (.16) | (.04) | - | (1.67) | (.98) |
Total distributions | (.29) H | (.09) | (.02) | (1.84) | (1.12) |
Redemption fees added to paid in capital C,G | - | - | - | - | - |
Net asset value, end of period | $ 29.08 | $ 31.68 | $ 28.23 | $ 23.31 | $ 46.82 |
Total Return A,B | (7.37)% | 12.54% | 21.22% | (48.10)% | 33.38% |
Ratios to Average Net Assets D,F | | | | | |
Expenses before reductions | 2.05% | 2.09% | 2.14% | 2.17% | 2.11% |
Expenses net of fee waivers, if any | 2.04% | 2.09% | 2.14% | 2.17% | 2.11% |
Expenses net of all reductions | 2.00% | 2.05% | 2.09% | 2.13% | 2.08% |
Net investment income (loss) | .56% | .30% | .51% | .42% | .22% |
Supplemental Data | | | | | |
Net assets, end of period (in millions) | $ 33 | $ 44 | $ 43 | $ 36 | $ 28 |
Portfolio turnover rate E | 75% | 82% | 98% | 79% | 56% |
A Total returns would have been lower if certain expenses had not been reduced during the applicable periods shown.
B Total returns do not include the effect of the contingent deferred sales charge.
C Calculated based on average shares outstanding during the period.
D Fees and expenses of any underlying Fidelity Central Funds are not included in the Fund's expense ratio. The Fund indirectly bears its proportionate share of the expenses of any underlying Fidelity Central Funds.
E Amount does not include the portfolio activity of any underlying Fidelity Central Funds.
F Expense ratios reflect operating expenses of the class. Expenses before reductions do not reflect amounts reimbursed by the investment adviser or reductions from brokerage service arrangements or reductions from other expense offset arrangements and do not represent the amount paid by the class during periods when reimbursements or reductions occur. Expenses net of fee waivers reflect expenses after reimbursement by the investment adviser but prior to reductions from brokerage service arrangements or other expense offset arrangements. Expenses net of all reductions represent the net expenses paid by the class.
G Amount represents less than $.01 per share.
H Total distributions of $.29 per share is comprised of distributions from net investment income of $.137 and distributions from net realized gain of $.155 per share.
See accompanying notes which are an integral part of the financial statements.
Annual Report
Financial Highlights - International Discovery
Years ended October 31, | 2011 | 2010 | 2009 | 2008 | 2007 |
Selected Per-Share Data | | | | | |
Net asset value, beginning of period | $ 32.34 | $ 28.79 | $ 23.88 | $ 47.68 | $ 36.67 |
Income from Investment Operations | | | | | |
Net investment income (loss) B | .53 | .40 | .37 | .57 | .53 |
Net realized and unrealized gain (loss) | (2.54) | 3.54 | 4.88 | (22.29) | 11.84 |
Total from investment operations | (2.01) | 3.94 | 5.25 | (21.72) | 12.37 |
Distributions from net investment income | (.48) | (.35) | (.34) | (.41) | (.38) |
Distributions from net realized gain | (.16) | (.04) | - | (1.67) | (.98) |
Total distributions | (.64) | (.39) | (.34) | (2.08) | (1.36) |
Redemption fees added to paid in capital B,F | - | - | - | - | - |
Net asset value, end of period | $ 29.69 | $ 32.34 | $ 28.79 | $ 23.88 | $ 47.68 |
Total Return A | (6.39)% | 13.76% | 22.47% | (47.55)% | 34.85% |
Ratios to Average Net Assets C,E | | | | | |
Expenses before reductions | .97% | 1.05% | 1.12% | 1.09% | 1.04% |
Expenses net of fee waivers, if any | .96% | 1.05% | 1.12% | 1.09% | 1.04% |
Expenses net of all reductions | .92% | 1.00% | 1.07% | 1.05% | 1.00% |
Net investment income (loss) | 1.64% | 1.35% | 1.53% | 1.51% | 1.30% |
Supplemental Data | | | | | |
Net assets, end of period (in millions) | $ 6,806 | $ 8,133 | $ 8,114 | $ 6,999 | $ 14,176 |
Portfolio turnover rate D | 75% | 82% | 98% | 79% | 56% |
A Total returns would have been lower if certain expenses had not been reduced during the applicable periods shown.
B Calculated based on average shares outstanding during the period.
C Fees and expenses of any underlying Fidelity Central Funds are not included in the Fund's expense ratio. The Fund indirectly bears its proportionate share of the expenses of any underlying Fidelity Central Funds.
D Amount does not include the portfolio activity of any underlying Fidelity Central Funds.
E Expense ratios reflect operating expenses of the class. Expenses before reductions do not reflect amounts reimbursed by the investment adviser or reductions from brokerage service arrangements or reductions from other expense offset arrangements and do not represent the amount paid by the class during periods when reimbursements or reductions occur. Expenses net of fee waivers reflect expenses after reimbursement by the investment adviser but prior to reductions from brokerage service arrangements or other expense offset arrangements. Expenses net of all reductions represent the net expenses paid by the class.
F Amount represents less than $.01 per share.
See accompanying notes which are an integral part of the financial statements.
Annual Report
Financial Highlights - Class K
Years ended October 31, | 2011 | 2010 | 2009 | 2008 G |
Selected Per-Share Data | | | | |
Net asset value, beginning of period | $ 32.32 | $ 28.78 | $ 23.90 | $ 40.32 |
Income from Investment Operations | | | | |
Net investment income (loss) D | .58 | .46 | .44 | .10 |
Net realized and unrealized gain (loss) | (2.54) | 3.53 | 4.86 | (16.52) |
Total from investment operations | (1.96) | 3.99 | 5.30 | (16.42) |
Distributions from net investment income | (.55) | (.41) | (.42) | - |
Distributions from net realized gain | (.16) | (.04) | - | - |
Total distributions | (.70)J | (.45) | (.42) | - |
Redemption fees added to paid in capital D,I | - | - | - | - |
Net asset value, end of period | $ 29.66 | $ 32.32 | $ 28.78 | $ 23.90 |
Total Return B,C | (6.24)% | 13.96% | 22.80% | (40.72)% |
Ratios to Average Net Assets E,H | | | | |
Expenses before reductions | .80% | .84% | .88% | .93% A |
Expenses net of fee waivers, if any | .79% | .84% | .88% | .93% A |
Expenses net of all reductions | .75% | .79% | .83% | .89% A |
Net investment income (loss) | 1.81% | 1.55% | 1.77% | .83% A |
Supplemental Data | | | | |
Net assets, end of period (in millions) | $ 1,245 | $ 1,078 | $ 674 | $ 145 |
Portfolio turnover rate F | 75% | 82% | 98% | 79% |
A Annualized
B Total returns for periods of less than one year are not annualized.
C Total returns would have been lower if certain expenses had not been reduced during the applicable periods shown.
D Calculated based on average shares outstanding during the period.
E Fees and expenses of any underlying Fidelity Central Funds are not included in the Fund's expense ratio. The Fund indirectly bears its proportionate share of the expenses of any underlying Fidelity Central Funds.
F Amount does not include the portfolio activity of any underlying Fidelity Central Funds.
G For the period May 9, 2008 (commencement of sale of shares) to October 31, 2008.
H Expense ratios reflect operating expenses of the class. Expenses before reductions do not reflect amounts reimbursed by the investment adviser or reductions from brokerage service arrangements or reductions from other expense offset arrangements and do not represent the amount paid by the class during periods when reimbursements or reductions occur. Expense ratios before reductions for start-up periods may not be representative of longer-term operating periods. Expenses net of fee waivers reflect expenses after reimbursement by the investment adviser but prior to reductions from brokerage service arrangements or other expense offset arrangements. Expenses net of all reductions represent the net expenses paid by the class.
I Amount represents less than $.01 per share.
J Total distributions of $.70 per share is comprised of distributions from net investment income of $.548 and distributions from net realized gain of $.155 per share.
See accompanying notes which are an integral part of the financial statements.
Annual Report
Financial Highlights - Institutional Class
Years ended October 31, | 2011 | 2010 | 2009 | 2008 | 2007 |
Selected Per-Share Data | | | | | |
Net asset value, beginning of period | $ 32.31 | $ 28.77 | $ 23.91 | $ 47.73 | $ 36.71 |
Income from Investment Operations | | | | | |
Net investment income (loss) B | .54 | .41 | .39 | .53 | .55 |
Net realized and unrealized gain (loss) | (2.55) | 3.55 | 4.86 | (22.24) | 11.85 |
Total from investment operations | (2.01) | 3.96 | 5.25 | (21.71) | 12.40 |
Distributions from net investment income | (.50) | (.38) | (.39) | (.44) | (.40) |
Distributions from net realized gain | (.16) | (.04) | - | (1.67) | (.98) |
Total distributions | (.65) G | (.42) | (.39) | (2.11) | (1.38) |
Redemption fees added to paid in capital B,F | - | - | - | - | - |
Net asset value, end of period | $ 29.65 | $ 32.31 | $ 28.77 | $ 23.91 | $ 47.73 |
Total Return A | (6.39)% | 13.84% | 22.52% | (47.51)% | 34.93% |
Ratios to Average Net Assets C, E | | | | | |
Expenses before reductions | .95% | .99% | 1.05% | 1.05% | .97% |
Expenses net of fee waivers, if any | .94% | .99% | 1.05% | 1.05% | .97% |
Expenses net of all reductions | .90% | .95% | 1.00% | 1.01% | .94% |
Net investment income (loss) | 1.66% | 1.40% | 1.60% | 1.54% | 1.36% |
Supplemental Data | | | | | |
Net assets, end of period (in millions) | $ 278 | $ 319 | $ 267 | $ 159 | $ 58 |
Portfolio turnover rate D | 75% | 82% | 98% | 79% | 56% |
A Total returns would have been lower if certain expenses had not been reduced during the applicable periods shown.
B Calculated based on average shares outstanding during the period.
C Fees and expenses of any underlying Fidelity Central Funds are not included in the Fund's expense ratio. The Fund indirectly bears its proportionate share of the expenses of any underlying Fidelity Central Funds.
D Amount does not include the portfolio activity of any underlying Fidelity Central Funds.
E Expense ratios reflect operating expenses of the class. Expenses before reductions do not reflect amounts reimbursed by the investment adviser or reductions from brokerage service arrangements or reductions from other expense offset arrangements and do not represent the amount paid by the class during periods when reimbursements or reductions occur. Expenses net of fee waivers reflect expenses after reimbursement by the investment adviser but prior to reductions from brokerage service arrangements or other expense offset arrangements. Expenses net of all reductions represent the net expenses paid by the class.
F Amount represents less than $.01 per share.
G Total distributions of $.65 per share is comprised of distributions from net investment income of $.497 and distributions from net realized gain of $.155 per share.
See accompanying notes which are an integral part of the financial statements.
Annual Report
Notes to Financial Statements
For the period ended October 31, 2011
(Amounts in thousands except percentages)
1. Organization.
Fidelity International Discovery Fund (the Fund) is a fund of Fidelity Investment Trust (the Trust) and is authorized to issue an unlimited number of shares. The Trust is registered under the Investment Company Act of 1940, as amended (the 1940 Act), as an open-end management investment company organized as a Massachusetts business trust. The Fund offers Class A, Class T, Class C, International Discovery, Class K and Institutional Class shares, each of which, along with Class B shares, has equal rights as to assets and voting privileges. Effective after the close of business on September 1, 2010, Class B shares were closed to new accounts and additional purchases, except for exchanges and reinvestments by existing shareholders. Each class has exclusive voting rights with respect to matters that affect that class. Class B shares will automatically convert to Class A shares after a holding period of seven years from the initial date of purchase. Investment income, realized and unrealized capital gains and losses, the common expenses of the Fund, and certain fund-level expense reductions, if any, are allocated on a pro-rata basis to each class based on the relative net assets of each class to the total net assets of the Fund. Each class differs with respect to transfer agent and distribution and service plan fees incurred. Certain expense reductions may also differ by class. The Fund's investments in emerging markets can be subject to social, economic, regulatory and political uncertainties and can be extremely volatile.
2. Investments in Fidelity Central Funds.
The Fund invests in Fidelity Central Funds, which are open-end investment companies available only to other investment companies and accounts managed by Fidelity Management & Research Company (FMR) and its affiliates. The Fund's Schedule of Investments lists each of the Fidelity Central Funds held as of period end, if any, as an investment of the Fund, but does not include the underlying holdings of each Fidelity Central Fund. As an Investing Fund, the Fund indirectly bears its proportionate share of the expenses of the underlying Fidelity Central Funds.
The Money Market Central Funds seek preservation of capital and current income and are managed by Fidelity Investments Money Management, Inc. (FIMM), an affiliate of FMR.
A complete unaudited list of holdings for each Fidelity Central Fund is available upon request or at the Securities and Exchange Commission (the SEC) web site at www.sec.gov. In addition, the financial statements of the Fidelity Central Funds, which are not covered by the Fund's Report of Independent Registered Public Accounting Firm, are available on the SEC web site or upon request.
Annual Report
Notes to Financial Statements - continued
(Amounts in thousands except percentages)
3. Significant Accounting Policies.
The financial statements have been prepared in conformity with accounting principles generally accepted in the United States of America (GAAP), which require management to make certain estimates and assumptions at the date of the financial statements. Actual results could differ from those estimates. Subsequent events, if any, through the date that the financial statements were issued have been evaluated in the preparation of the financial statements. The following summarizes the significant accounting policies of the Fund:
Security Valuation. Investments are valued as of 4:00 p.m. Eastern time on the last calendar day of the period. The Fund uses independent pricing services approved by the Board of Trustees to value its investments. When current market prices or quotations are not readily available or reliable, valuations may be determined in good faith in accordance with procedures adopted by the Board of Trustees. Factors used in determining value may include market or security specific events. The frequency with which these procedures are used cannot be predicted and they may be utilized to a significant extent. The value used for net asset value (NAV) calculation under these procedures may differ from published prices for the same securities.
The Fund categorizes the inputs to valuation techniques used to value its investments into a disclosure hierarchy consisting of three levels as shown below:
Level 1 - quoted prices in active markets for identical investments
Level 2 - other significant observable inputs (including quoted prices for similar investments, interest rates, prepayment speeds, etc.)
Level 3 - unobservable inputs (including the Fund's own assumptions based on the best information available)
Changes in valuation techniques may result in transfers in or out of an assigned level within the disclosure hierarchy. The aggregate value of investments by input level, as of October 31, 2011, as well as a roll forward of Level 3 securities, is included at the end of the Fund's Schedule of Investments. Valuation techniques used to value the Fund's investments by major category are as follows:
Equity securities, including restricted securities, for which market quotations are readily available, are valued at the last reported sale price or official closing price as reported by an independent pricing service on the primary market or exchange on which they are traded and are categorized as Level 1 in the hierarchy. In the event there were no sales during the day or closing prices are not available, securities are valued at the last quoted bid price or may be valued using the last available price and are generally categorized as Level 2 in the hierarchy. For foreign equity securities, when significant market or security specific events arise, comparisons to the valuation of American Depositary Receipts
Annual Report
3. Significant Accounting Policies - continued
Security Valuation - continued
(ADRs), futures contracts, Exchange-traded funds (ETFs) and certain indexes as well as quoted prices for similar securities are used and are categorized as Level 2 in the hierarchy in these circumstances. Utilizing these techniques may result in transfers between Level 1 and Level 2. For restricted equity securities and private placements where observable inputs are limited, assumptions about market activity and risk are used and are categorized as Level 3 in the hierarchy.
Investments in open-end mutual funds, including the Fidelity Central Funds, are valued at their closing net asset value each business day and are categorized as Level 1 in the hierarchy.
Foreign Currency. The Fund may use foreign currency contracts to facilitate transactions in foreign-denominated securities. Gains and losses from these transactions may arise from changes in the value of the foreign currency or if the counterparties do not perform under the contracts' terms.
Foreign-denominated assets, including investment securities, and liabilities are translated into U.S. dollars at the exchange rate at period end. Purchases and sales of investment securities, income and dividends received and expenses denominated in foreign currencies are translated into U.S. dollars at the exchange rate in effect on the transaction date.
The effects of exchange rate fluctuations on investments are included with the net realized and unrealized gain (loss) on investment securities. Other foreign currency transactions resulting in realized and unrealized gain (loss) are disclosed separately.
Investment Transactions and Income. For financial reporting purposes, the Fund's investment holdings and NAV include trades executed through the end of the last business day of the period. The NAV per share for processing shareholder transactions is calculated as of the close of business of the New York Stock Exchange (NYSE), normally 4:00 p.m. Eastern time and includes trades executed through the end of the prior business day. Gains and losses on securities sold are determined on the basis of identified cost and may include proceeds received from litigation. Dividend income is recorded on the ex-dividend date, except for certain dividends from foreign securities where the ex-dividend date may have passed, which are recorded as soon as the Fund is informed of the ex-dividend date. Non-cash dividends included in dividend income, if any, are recorded at the fair market value of the securities received. Distributions received on securities that represent a return of capital or capital gain are recorded as a reduction of cost of investments and/or as a realized gain. The Fund estimates the components of distributions received that may be considered return of capital distributions or capital
Annual Report
Notes to Financial Statements - continued
(Amounts in thousands except percentages)
3. Significant Accounting Policies - continued
Investment Transactions and Income - continued
gain distributions. Interest income and distributions from the Fidelity Central Funds are accrued as earned. Interest income includes coupon interest and amortization of premium and accretion of discount on debt securities. Investment income is recorded net of foreign taxes withheld where recovery of such taxes is uncertain.
Expenses. Expenses directly attributable to a fund are charged to that fund. Expenses attributable to more than one fund are allocated among the respective funds on the basis of relative net assets or other appropriate methods. Expense estimates are accrued in the period to which they relate and adjustments are made when actual amounts are known.
Deferred Trustee Compensation. Under a Deferred Compensation Plan (the Plan), independent Trustees may elect to defer receipt of a portion of their annual compensation. Deferred amounts are invested in a cross-section of Fidelity funds, are marked-to-market and remain in the Fund until distributed in accordance with the Plan. The investment of deferred amounts and the offsetting payable to the Trustees are included in the accompanying Statement of Assets and Liabilities.
Income Tax Information and Distributions to Shareholders. Each year, the Fund intends to qualify as a regulated investment company, including distributing substantially all of its taxable income and realized gains under Subchapter M of the Internal Revenue Code and filing its U.S. federal tax return. As a result, no provision for income taxes is required. As of October 31, 2011, the Fund did not have any unrecognized tax benefits in the financial statements. A fund's federal tax return is subject to examination by the Internal Revenue Service (IRS) for a period of three years. Foreign taxes are provided for based on the Fund's understanding of the tax rules and rates that exist in the foreign markets in which it invests. The Fund is subject to a tax imposed on realized short term capital gains on securities of certain issuers domiciled in India. An estimated deferred tax liability for net unrealized gains on these securities is included in Other payables and accrued expenses on the Statement of Assets and Liabilities.
Distributions are declared and recorded on the ex-dividend date. Income dividends and capital gain distributions are declared separately for each class. Income and capital gain distributions are determined in accordance with income tax regulations, which may differ from GAAP.
Capital accounts within the financial statements are adjusted for permanent book-tax differences. These adjustments have no impact on net assets or the results of operations. Temporary book-tax differences will reverse in a subsequent period.
Annual Report
3. Significant Accounting Policies - continued
Income Tax Information and Distributions to Shareholders - continued
Book-tax differences are primarily due to foreign currency transactions, certain foreign taxes, passive foreign investment companies (PFIC), deferred trustees compensation, capital loss carryforwards and losses deferred due to wash sales.
The federal tax cost of investment securities and unrealized appreciation (depreciation) as of period end were as follows:
Gross unrealized appreciation | $ 930,158 |
Gross unrealized depreciation | (996,674) |
Net unrealized appreciation (depreciation) on securities and other investments | $ (66,516) |
| |
Tax Cost | $ 8,916,909 |
The tax-based components of distributable earnings as of period end were as follows:
Undistributed ordinary income | $ 102,538 |
Capital loss carryforward | $ (1,349,541) |
Net unrealized appreciation (depreciation) | $ (66,186) |
Under the recently enacted Regulated Investment Company Modernization Act of 2010 (the Act), the Fund will be permitted to carry forward capital losses incurred in taxable years beginning after December 22, 2010 for an unlimited period. However, any losses incurred during those future taxable years will be required to be utilized prior to any losses incurred in pre-enactment taxable years, which generally expire after eight years from when they are incurred. Additionally, post-enactment capital losses that are carried forward will retain their character as either short-term or long-term capital losses rather than being considered all short-term as under previous law. The Fund's first fiscal year end subject to the Act will be October 31, 2012.
The tax character of distributions paid was as follows:
| October 31, 2011 | October 31, 2010 |
Ordinary Income | $ 198,026 | $ 129,796 |
Annual Report
Notes to Financial Statements - continued
(Amounts in thousands except percentages)
3. Significant Accounting Policies - continued
Short-Term Trading (Redemption) Fees. Shares held by investors in the Fund less than 30 days are subject to a redemption fee equal to 1.00% of the net asset value of shares redeemed. All redemption fees, which reduce the proceeds of the shareholder redemption, are retained by the Fund and accounted for as an addition to paid in capital.
New Accounting Pronouncement. In May 2011, the Financial Accounting Standards Board issued Accounting Standard Update No. 2011-04, Fair Value Measurement (Topic 820) - Amendments to Achieve Common Fair Value Measurement and Disclosure Requirements in U.S. GAAP and IFRSs. The update changes the wording used to describe the requirements in GAAP for measuring fair value and for disclosing information about fair value measurements. The update is effective during interim and annual periods beginning after December 15, 2011. Management is currently evaluating the impact of the update's adoption on the Fund's financial statement disclosures.
4. Purchases and Sales of Investments.
Purchases and sales of securities, other than short-term securities, aggregated $7,388,928 and $7,826,467, respectively.
5. Fees and Other Transactions with Affiliates.
Management Fee. FMR and its affiliates provide the Fund with investment management related services for which the Fund pays a monthly management fee. The management fee is the sum of an individual fund fee rate that is based on an annual rate of .45% of the Fund's average net assets and a group fee rate that averaged .26% during the period. The group fee rate is based upon the average net assets of all the mutual funds advised by FMR. The group fee rate decreases as assets under management increase and increases as assets under management decrease. In addition, the management fee is subject to a performance adjustment (up to a maximum of ± .20% of the Fund's average net assets over a 36 month performance period). The upward or downward adjustment to the management fee is based on the relative investment performance of International Discovery as compared to an appropriate benchmark index. For the period, the total annual management fee rate, including the performance adjustment, was .70% of the Fund's average net assets.
Distribution and Service Plan Fees. In accordance with Rule 12b-1 of the 1940 Act, the Fund has adopted separate Distribution and Service Plans for each class of shares. Certain classes pay Fidelity Distributors Corporation (FDC), an affiliate of FMR, separate Distribution and Service Fees, each of which is based on an annual percentage of each class' average net assets. In addition, FDC may pay financial intermediaries for selling shares of the Fund and providing shareholder support services. For the period, the Distribution and Service Fee rates, total fees and amounts retained by FDC were as follows:
Annual Report
5. Fees and Other Transactions with Affiliates - continued
Distribution and Service Plan Fees - continued
| Distribution
Fee | Service
Fee | Total Fees | Retained
by FDC |
Class A | -% | .25% | $ 937 | $ 19 |
Class T | .25% | .25% | 398 | 1 |
Class B | .75% | .25% | 130 | 98 |
Class C | .75% | .25% | 399 | 30 |
| | | $ 1,864 | $ 148 |
Sales Load. FDC may receive a front-end sales charge of up to 5.75% for selling Class A shares, and 3.50% for selling Class T shares, some of which is paid to financial intermediaries for selling shares of the Fund. Depending on the holding period, FDC may receive contingent deferred sales charges levied on Class A, Class T, Class B, and Class C redemptions. The deferred sales charges range from 5% to 1% for Class B, 1% for Class C, 1.00% for certain purchases of Class A shares and .25% for certain purchases of Class T shares.
For the period, sales charge amounts retained by FDC were as follows:
| Retained
by FDC |
Class A | $ 56 |
Class T | 11 |
Class B* | 21 |
Class C* | 3 |
| $ 91 |
* When Class B and Class C shares are initially sold, FDC pays commissions from its own resources to financial intermediaries through which the sales are made.
Transfer Agent Fees. Fidelity Investments Institutional Operations Company, Inc. (FIIOC), an affiliate of FMR, is the transfer, dividend disbursing and shareholder servicing agent for each class of the Fund. FIIOC receives account fees and asset-based fees that vary according to the account size and type of account of the shareholders of the respective classes of the Fund, except for Class K. FIIOC receives an asset-based fee of Class K's average net assets. FIIOC pays for typesetting, printing and mailing of shareholder reports, except proxy statements. For the period, transfer agent fees for each class were as follows:
Annual Report
Notes to Financial Statements - continued
(Amounts in thousands except percentages)
5. Fees and Other Transactions with Affiliates - continued
Transfer Agent Fees - continued
| Amount | % of
Average
Net Assets |
Class A | $ 1,138 | .30 |
Class T | 248 | .31 |
Class B | 41 | .31 |
Class C | 121 | .30 |
International Discovery | 17,436 | .22 |
Class K | 638 | .05 |
Institutional Class | 640 | .20 |
| $ 20,262 | |
Accounting and Security Lending Fees. Fidelity Service Company, Inc. (FSC), an affiliate of FMR, maintains the Fund's accounting records. The accounting fee is based on the level of average net assets for the month. Under a separate contract, FSC administers the security lending program. The security lending fee is based on the number and duration of lending transactions.
Brokerage Commissions. The Fund placed a portion of its portfolio transactions with brokerage firms which are affiliates of the investment adviser. The commissions paid to these affiliated firms were $9 for the period.
Interfund Lending Program. Pursuant to an Exemptive Order issued by the SEC, the Fund, along with other registered investment companies having management contracts with FMR, may participate in an interfund lending program. This program provides an alternative credit facility allowing the funds to borrow from, or lend money to, other participating affiliated funds. At period end, there were no interfund loans outstanding. The Fund's activity in this program during the period for which loans were outstanding was as follows:
Borrower or Lender | Average Daily
Loan Balance | Weighted Average Interest Rate | Interest Expense |
Borrower | $ 13,706 | .41% | $ 2 |
Annual Report
6. Committed Line of Credit.
The Fund participates with other funds managed by FMR or an affiliate in a $4.0 billion credit facility (the "line of credit") to be utilized for temporary or emergency purposes to fund shareholder redemptions or for other short-term liquidity purposes. The Fund has agreed to pay commitment fees on its pro-rata portion of the line of credit, which amounted to $31 and is reflected in Miscellaneous expenses on the Statement of Operations. During the period, there were no borrowings on this line of credit.
7. Security Lending.
The Fund lends portfolio securities through a lending agent from time to time in order to earn additional income. For equity securities, a lending agent is used and may loan securities to certain qualified borrowers, including Fidelity Capital Markets (FCM), a broker-dealer affiliated with the Fund. On the settlement date of the loan, the Fund receives collateral (in the form of U.S. Treasury obligations, letters of credit and/or cash) against the loaned securities and maintains collateral in an amount not less than 100% of the market value of the loaned securities during the period of the loan. The market value of the loaned securities is determined at the close of business of the Fund and any additional required collateral is delivered to the Fund on the next business day. If the borrower defaults on its obligation to return the securities loaned because of insolvency or other reasons, a fund could experience delays and costs in recovering the securities loaned or in gaining access to the collateral. Any cash collateral received is the Fidelity Securities Lending Cash Central Fund. The value of loaned securities and cash collateral at period end are disclosed on the Fund's Statement of Assets and Liabilities. The value of securities loaned to FCM at period end was $2,654. Security lending income represents the income earned on investing cash collateral, less rebates paid to borrowers and any lending agent fees associated with the loan, plus any premium payments received for lending certain types of securities. Security lending income is presented in the Statement of Operations as a component of income from Fidelity Central Funds. Total security lending income during the period amounted to $6,208, including $213 from securities loaned to FCM.
8. Expense Reductions.
FMR voluntarily agreed to reimburse a portion of its management fee. For the period, the amount of this reimbursement was $507.
Many of the brokers with whom FMR places trades on behalf of the Fund provided services to the Fund in addition to trade execution. These services included payments of certain expenses on behalf of the Fund totaling $3,884 for the period.
Annual Report
Notes to Financial Statements - continued
(Amounts in thousands except percentages)
9. Distributions to Shareholders.
Distributions to shareholders of each class were as follows:
Years ended October 31, | 2011 | 2010 |
From net investment income | | |
Class A | $ 4,617 | $ 3,889 |
Class T | 859 | 633 |
Class B | 51 | 37 |
Class C | 184 | 71 |
International Discovery | 121,061 | 98,508 |
Class K | 18,291 | 9,602 |
Institutional Class | 4,873 | 3,682 |
Total | $ 149,936 | $ 116,422 |
From net realized gain | | |
Class A | $ 1,880 | $ 555 |
Class T | 439 | 119 |
Class B | 69 | 23 |
Class C | 209 | 61 |
International Discovery | 38,831 | 11,290 |
Class K | 5,143 | 935 |
Institutional Class | 1,519 | 391 |
Total | $ 48,090 | $ 13,374 |
10. Share Transactions.
Transactions for each class of shares were as follows:
| Shares | Dollars |
Years ended October 31, | 2011 | 2010 | 2011 | 2010 |
Class A | | | | |
Shares sold | 2,821 | 4,849 | $ 91,649 | $ 142,203 |
Reinvestment of distributions | 173 | 120 | 5,606 | 3,654 |
Shares redeemed | (4,335) | (7,259) | (139,721) | (215,574) |
Net increase (decrease) | (1,341) | (2,290) | $ (42,466) | $ (69,717) |
Class T | | | | |
Shares sold | 443 | 1,165 | $ 14,328 | $ 34,154 |
Reinvestment of distributions | 38 | 24 | 1,235 | 716 |
Shares redeemed | (1,286) | (1,228) | (41,028) | (35,631) |
Net increase (decrease) | (805) | (39) | $ (25,465) | $ (761) |
Class B | | | | |
Shares sold | 21 | 105 | $ 671 | $ 3,047 |
Reinvestment of distributions | 3 | 2 | 111 | 54 |
Shares redeemed | (130) | (227) | (4,124) | (6,544) |
Net increase (decrease) | (106) | (120) | $ (3,342) | $ (3,443) |
Annual Report
10. Share Transactions - continued
| Shares | Dollars |
Years ended October 31, | 2011 | 2010 | 2011 | 2010 |
Class C | | | | |
Shares sold | 183 | 356 | $ 5,847 | $ 10,567 |
Reinvestment of distributions | 11 | 4 | 344 | 116 |
Shares redeemed | (437) | (515) | (13,875) | (14,926) |
Net increase (decrease) | (243) | (155) | $ (7,684) | $ (4,243) |
International Discovery | | | | |
Shares sold | 32,543 | 55,460 | $ 1,052,266 | $ 1,640,231 |
Reinvestment of distributions | 4,718 | 3,453 | 153,551 | 105,461 |
Shares redeemed | (59,489) | (89,239) | (1,934,353) | (2,636,183) |
Net increase (decrease) | (22,228) | (30,326) | $ (728,536) | $ (890,491) |
Class K | | | | |
Shares sold | 18,148 | 16,961 | $ 593,408 | $ 491,304 |
Reinvestment of distributions | 722 | 346 | 23,434 | 10,537 |
Shares redeemed | (10,275) | (7,377) | (330,258) | (215,813) |
Net increase (decrease) | 8,595 | 9,930 | $ 286,584 | $ 286,028 |
Institutional Class | | | | |
Shares sold | 2,364 | 4,322 | $ 75,348 | $ 127,580 |
Reinvestment of distributions | 69 | 36 | 2,254 | 1,083 |
Shares redeemed | (2,923) | (3,773) | (94,034) | (108,068) |
Net increase (decrease) | (490) | 585 | $ (16,432) | $ 20,595 |
11. Other.
The Fund's organizational documents provide former and current trustees and officers with a limited indemnification against liabilities arising in connection with the performance of their duties to the Fund. In the normal course of business, the Fund may also enter into contracts that provide general indemnifications. The Fund's maximum exposure under these arrangements is unknown as this would be dependent on future claims that may be made against the Fund. The risk of material loss from such claims is considered remote.
Annual Report
To the Trustees of Fidelity Investment Trust and the Shareholders of Fidelity International Discovery Fund:
In our opinion, the accompanying statement of assets and liabilities, including the schedule of investments, and the related statements of operations and of changes in net assets and the financial highlights present fairly, in all material respects, the financial position of Fidelity International Discovery Fund (a fund of Fidelity Investment Trust) at October 31, 2011, the results of its operations for the year then ended, the changes in its net assets for each of the two years in the period then ended and the financial highlights for each of the periods indicated, in conformity with accounting principles generally accepted in the United States of America. These financial statements and financial highlights (hereafter referred to as "financial statements") are the responsibility of the Fidelity International Discovery Fund's management. Our responsibility is to express an opinion on these financial statements based on our audits. We conducted our audits of these financial statements in accordance with the standards of the Public Company Accounting Oversight Board (United States). Those standards require that we plan and perform the audit to obtain reasonable assurance about whether the financial statements are free of material misstatement. An audit includes examining, on a test basis, evidence supporting the amounts and disclosures in the financial statements, assessing the accounting principles used and significant estimates made by management, and evaluating the overall financial statement presentation. We believe that our audits, which included confirmation of securities at October 31, 2011 by correspondence with the custodian and brokers, provide a reasonable basis for our opinion.
PricewaterhouseCoopers LLP
Boston, Massachusetts
December 13, 2011
Annual Report
The Trustees, Members of the Advisory Board, and executive officers of the trust and fund, as applicable, are listed below. The Board of Trustees governs the fund and is responsible for protecting the interests of shareholders. The Trustees are experienced executives who meet periodically throughout the year to oversee the fund's activities, review contractual arrangements with companies that provide services to the fund, oversee management of the risks associated with such activities and contractual arrangements, and review the fund's performance. Except for James C. Curvey, each of the Trustees oversees 226 funds advised by FMR or an affiliate. Mr. Curvey oversees 429 funds advised by FMR or an affiliate.
The Trustees hold office without limit in time except that (a) any Trustee may resign; (b) any Trustee may be removed by written instrument, signed by at least two-thirds of the number of Trustees prior to such removal; (c) any Trustee who requests to be retired or who has become incapacitated by illness or injury may be retired by written instrument signed by a majority of the other Trustees; and (d) any Trustee may be removed at any special meeting of shareholders by a two-thirds vote of the outstanding voting securities of the trust. Each Trustee who is not an interested person (as defined in the 1940 Act) (Independent Trustee), shall retire not later than the last day of the calendar year in which his or her 75th birthday occurs. The Independent Trustees may waive this mandatory retirement age policy with respect to individual Trustees. The executive officers and Advisory Board Members hold office without limit in time, except that any officer and Advisory Board Member may resign or may be removed by a vote of a majority of the Trustees at any regular meeting or any special meeting of the Trustees. Except as indicated, each individual has held the office shown or other offices in the same company for the past five years.
Experience, Skills, Attributes, and Qualifications of the Fund's Trustees. The Governance and Nominating Committee has adopted a statement of policy that describes the experience, qualifications, attributes, and skills that are necessary and desirable for potential Independent Trustee candidates (Statement of Policy). The Board believes that each Trustee satisfied at the time he or she was initially elected or appointed a Trustee, and continues to satisfy, the standards contemplated by the Statement of Policy. The Governance and Nominating Committee also engages professional search firms to help identify potential Independent Trustee candidates who have the experience, qualifications, attributes, and skills consistent with the Statement of Policy. From time to time, additional criteria based on the composition and skills of the current Independent Trustees, as well as experience or skills that may be appropriate in light of future changes to board composition, business conditions, and regulatory or other developments, have also been considered by the professional search firms and the Governance and Nominating Committee. In addition, the Board takes into account the Trustees' commitment and participation in Board and committee meetings, as well as their leadership of standing and ad hoc committees throughout their tenure.
In determining that a particular Trustee was and continues to be qualified to serve as a Trustee, the Board has considered a variety of criteria, none of which, in isolation, was controlling. The Board believes that, collectively, the Trustees have balanced and diverse experience, qualifications, attributes, and skills, which allow the Board to operate effectively in governing the fund and protecting the interests of shareholders. Information about the specific experience, skills, attributes, and qualifications of each Trustee, which in each case led to the Board's conclusion that the Trustee should serve (or continue to serve) as a trustee of the fund, is provided below.
Annual Report
Board Structure and Oversight Function. James C. Curvey is an interested person (as defined in the 1940 Act) and currently serves as Acting Chairman. The Trustees have determined that an interested Chairman is appropriate and benefits shareholders because an interested Chairman has a personal and professional stake in the quality and continuity of services provided to the fund. Independent Trustees exercise their informed business judgment to appoint an individual of their choosing to serve as Chairman, regardless of whether the Trustee happens to be independent or a member of management. The Independent Trustees have determined that they can act independently and effectively without having an Independent Trustee serve as Chairman and that a key structural component for assuring that they are in a position to do so is for the Independent Trustees to constitute a substantial majority for the Board. The Independent Trustees also regularly meet in executive session. Ned C. Lautenbach serves as Chairman of the Independent Trustees and as such (i) acts as a liaison between the Independent Trustees and management with respect to matters important to the Independent Trustees and (ii) with management prepares agendas for Board meetings.
Fidelity funds are overseen by different Boards of Trustees. The fund's Board oversees Fidelity's equity and high income funds and another Board oversees Fidelity's investment-grade bond, money market, and asset allocation funds. The asset allocation funds may invest in Fidelity funds overseen by the fund's Board. The use of separate Boards, each with its own committee structure, allows the Trustees of each group of Fidelity funds to focus on the unique issues of the funds they oversee, including common research, investment, and operational issues. On occasion, the separate Boards establish joint committees to address issues of overlapping consequences for the Fidelity funds overseen by each Board.
The Trustees operate using a system of committees to facilitate the timely and efficient consideration of all matters of importance to the Trustees, the fund, and fund shareholders and to facilitate compliance with legal and regulatory requirements and oversight of the fund's activities and associated risks. The Board, acting through its committees, has charged FMR and its affiliates with (i) identifying events or circumstances the occurrence of which could have demonstrably adverse effects on the fund's business and/or reputation; (ii) implementing processes and controls to lessen the possibility that such events or circumstances occur or to mitigate the effects of such events or circumstances if they do occur; and (iii) creating and maintaining a system designed to evaluate continuously business and market conditions in order to facilitate the identification and implementation processes described in (i) and (ii) above. Because the day-to-day operations and activities of the fund are carried out by or through FMR, its affiliates and other service providers, the fund's exposure to risks is mitigated but not eliminated by the processes overseen by the Trustees. While each of the Board's committees has responsibility for overseeing different aspects of the fund's activities, oversight is exercised primarily through the Operations, Audit, and Compliance Committees. In addition, the Independent Trustees have worked with FMR to enhance the Board's oversight of investment and financial risks, legal and regulatory risks, technology risks, and operational risks, including the development of additional risk reporting to the Board. For example, a working group comprised of Independent Trustees and FMR has worked and continues to work to review the Fidelity funds' valuation-related activities, reporting and risk management. Appropriate personnel, including but not limited to the fund's Chief Compliance Officer (CCO), FMR's internal auditor, the independent accountants, the fund's Treasurer and portfolio management personnel, make periodic reports to the Board's committees, as appropriate, including an annual review of FMR's risk management program for the Fidelity funds. The responsibilities of each standing committee, including their oversight responsibilities, are described further under "Standing Committees of the Fund's Trustees."
Annual Report
Trustees and Officers - continued
The fund's Statement of Additional Information (SAI) includes more information about the Trustees. To request a free copy, call Fidelity at 1-800-544-8544.
Interested Trustees*:
Correspondence intended for each Trustee who is an interested person may be sent to Fidelity Investments, 82 Devonshire Street, Boston, Massachusetts 02109.
Name, Age; Principal Occupations and Other Relevant Experience+ |
James C. Curvey (76) |
| Year of Election or Appointment: 2007 Mr. Curvey is Trustee and Acting Chairman of the Board of Trustees of certain Trusts. Mr. Curvey also serves as Trustee (2007-present) of other investment companies advised by FMR. Mr. Curvey is a Director of Fidelity Investments Money Management, Inc. (2009-present), Director of Fidelity Research & Analysis Co. (2009-present) and Director of FMR and FMR Co., Inc. (2007-present). Mr. Curvey is also Vice Chairman (2007-present) and Director of FMR LLC. In addition, Mr. Curvey serves as an Overseer for the Boston Symphony Orchestra and a member of the Trustees of Villanova University. Previously, Mr. Curvey was the Vice Chairman (2006-2007) and Director (2000-2007) of FMR Corp. |
Ronald P. O'Hanley (54) |
| Year of Election or Appointment: 2011 Mr. O'Hanley is Director of FMR Co., Inc. (2010-present), Director of Fidelity Investments Money Management, Inc. (2010-present), Director of Fidelity Research & Analysis Company (2010-present), President of Fidelity Asset Management and Corporate Services and a member of Fidelity's Executive Committee (2010-present). Previously, Mr. O'Hanley served as President and Chief Executive Officer of BNY Mellon Asset Management (2007-2010). Mr. O'Hanley also served as Vice Chairman of Bank New York Mellon Corp. and a member of that firm's Executive Committee. Prior to the 2007 merger of The Bank of New York and Mellon Financial Corporation, he was Vice Chairman of Mellon Financial Corporation and President and Chief Executive Officer of Mellon Asset Management. He joined Mellon in February 1997. Mr. O'Hanley currently serves as Chairman of the Boston Public Library Foundation Board of Directors and sits on the Board of Directors of Beth Israel Deaconess Medical Center, the Board of Trustees of the Marine Biological Laboratory and the Advisory Board of the Maxwell School of Citizenship and Public Administration at Syracuse University. Mr. O'Hanley also chairs the Council on Asset Management for the Financial Services Roundtable and is a member of the Board of Directors of Institutional Investor's U.S. Institute. |
* Trustees have been determined to be "Interested Trustees" by virtue of, among other things, their affiliation with the trust or various entities under common control with FMR.
+ The information above includes each Trustee's principal occupation during the last five years and other information relating to the experience, attributes, and skills relevant to each Trustee's qualifications to serve as a Trustee, which led to the conclusion that each Trustee should serve as a Trustee for the fund.
Annual Report
Trustees and Officers - continued
Independent Trustees:
Correspondence intended for each Independent Trustee (that is, the Trustees other than the Interested Trustees) may be sent to Fidelity Investments, P.O. Box 55235, Boston, Massachusetts 02205-5235.
Name, Age; Principal Occupations and Other Relevant Experience+ |
Dennis J. Dirks (63) |
| Year of Election or Appointment: 2005 Prior to his retirement in May 2003, Mr. Dirks was Chief Operating Officer and a member of the Board of The Depository Trust & Clearing Corporation (DTCC). He also served as President, Chief Operating Officer, and Board member of The Depository Trust Company (DTC) and President and Board member of the National Securities Clearing Corporation (NSCC). In addition, Mr. Dirks served as Chief Executive Officer and Board member of the Government Securities Clearing Corporation, Chief Executive Officer and Board member of the Mortgage-Backed Securities Clearing Corporation, as a Trustee and a member of the Finance Committee of Manhattan College (2005-2008), and as a Trustee and a member of the Finance Committee of AHRC of Nassau County (2006-2008). Mr. Dirks is a member of the Independent Directors Council (IDC) Governing Council (2010-Present) and Board of Directors for The Brookville Center for Children's Services, Inc. (2009-present). |
Alan J. Lacy (58) |
| Year of Election or Appointment: 2008 Mr. Lacy serves as Senior Adviser (2007-present) of Oak Hill Capital Partners, L.P. (private equity). Mr. Lacy also served as Chief Executive Officer (2000-2005) and Vice Chairman (2005-2006) of Sears Holdings Corporation and Sears, Roebuck and Co. (retail). In addition, Mr. Lacy serves as a member of the Board of Directors of Dave & Buster's, Inc. (restaurant and entertainment complexes, 2010-present), The Hillman Companies, Inc. (hardware wholesalers, 2010-present), and Bristol-Myers Squibb Company (global pharmaceuticals, 2007-present). Mr. Lacy is a member of the Board of Trustees of The National Parks Conservation Association (2006-Present). Previously, Mr. Lacy served as Chairman of the Board of Trustees of the National Parks Conservation Association (2008-2011) and as a member of the Board of Directors for the Western Union Company (global money transfer, 2006-2011). |
Ned C. Lautenbach (67) |
| Year of Election or Appointment: 2000 Mr. Lautenbach is Chairman of the Independent Trustees of the Equity and High Income Funds (2006-present). Mr. Lautenbach currently serves as the Lead Director of the Eaton Corporation Board of Directors (diversified industrial, 1997-present). Mr. Lautenbach is also a member of the Board of Directors of the Philharmonic Center for the Arts in Naples, Florida (1999-present); a member of the Board of Trustees of Fairfield University (2005-present); and a member of the Council on Foreign Relations (1994-present). Previously, Mr. Lautenbach was a Partner/Advisory Partner at Clayton, Dubilier & Rice, LLC (private equity investment, 1998-2010), as well as a Director of Sony Corporation (2006-2007). |
Joseph Mauriello (67) |
| Year of Election or Appointment: 2008 Prior to his retirement in January 2006, Mr. Mauriello served in numerous senior management positions including Deputy Chairman and Chief Operating Officer (2004-2005), and Vice Chairman of Financial Services (2002-2004) of KPMG LLP US (professional services, 1965-2005). Mr. Mauriello currently serves as a member of the Board of Directors of XL Group plc. (global insurance and re-insurance, 2006-present) and of Arcadia Resources Inc. (health care services and products, 2007-present). Previously, Mr. Mauriello served as a Director of the Hamilton Funds of the Bank of New York (2006-2007). |
Robert W. Selander (61) |
| Year of Election or Appointment: 2011 Previously, Mr. Selander served as a Member of the Advisory Board of Fidelity's Equity and High Income Funds (2011), Executive Vice Chairman (2010), Chief Executive Officer (2009-2010), and President and Chief Executive Officer (1997-2009) of Mastercard, Inc. |
Cornelia M. Small (67) |
| Year of Election or Appointment: 2005 Ms. Small is a member of the Board of Directors of the Teagle Foundation (2009-present). Ms. Small is also a member of the Investment Committee, and Chair (2008-present) and a member of the Board of Trustees of Smith College. In addition, Ms. Small serves on the Investment Committee of the Berkshire Taconic Community Foundation (2008-present). Previously, Ms. Small served as Chairperson of the Investment Committee (2002-2008) of Smith College. In addition, Ms. Small served as Chief Investment Officer, Director of Global Equity Investments, and a member of the Board of Directors of Scudder, Stevens & Clark and Scudder Kemper Investments. |
William S. Stavropoulos (72) |
| Year of Election or Appointment: 2001 Mr. Stavropoulos is Vice Chairman of the Independent Trustees of the Equity and High Income Funds (2006-present). Mr. Stavropoulos serves as President and Founder of the Michigan Baseball Foundation, the Great Lakes Loons (2007-present). Mr. Stavropoulos is Chairman Emeritus of the Board of Directors of The Dow Chemical Company, where he previously served in numerous senior management positions, including President, CEO (1995-2000; 2002-2004), Chairman of the Executive Committee (2000-2006), and as a member of the Board of Directors (1990-2006). Currently, Mr. Stavropoulos is Chairman of Univar (global distributor of commodity and specialty chemicals, 2010-present), a Director of Teradata Corporation (data warehousing and technology solutions, 2008-present), Chemical Financial Corporation, Maersk Inc. (industrial conglomerate), Tyco International, Inc. (multinational manufacturing and services, 2007-present), and a member of the Advisory Board for Metalmark Capital (private equity investment, 2005-present). Mr. Stavropoulos is a special advisor to Clayton, Dubilier & Rice, LLC (private equity investment). In addition, Mr. Stavropoulos is a member of the University of Notre Dame Advisory Council for the College of Science. |
David M. Thomas (62) |
| Year of Election or Appointment: 2008 Previously, Mr. Thomas served as Executive Chairman (2005-2006) and Chairman and Chief Executive Officer (2000-2005) of IMS Health, Inc. (pharmaceutical and healthcare information solutions). In addition, Mr. Thomas serves as a member of the Board of Directors of Fortune Brands, Inc. (consumer products), and Interpublic Group of Companies, Inc. (marketing communication, 2004-present). |
Michael E. Wiley (61) |
| Year of Election or Appointment: 2008 Mr. Wiley also serves as a Director of Asia Pacific Exploration Consolidated (international oil and gas exploration and production, 2008-present). Mr. Wiley serves as a Director of Tesoro Corporation (independent oil refiner and marketer, 2005-present), and a Director of Bill Barrett Corporation (exploration and production, 2005-present). In addition, Mr. Wiley also serves as a Director of Post Oak Bank (privately-held bank, 2004-present). Previously, Mr. Wiley served as a member of the Board of Trustees of the University of Tulsa (2000-2006; 2007-2010), as a Senior Energy Advisor of Katzenbach Partners, LLC (consulting, 2006-2007), as an Advisory Director of Riverstone Holdings (private investment), Chairman, President, and CEO of Baker Hughes, Inc. (oilfield services, 2000-2004), and as Director of Spinnaker Exploration Company (exploration and production, 2001-2005). |
Annual Report
+ The information above includes each Trustee's principal occupation during the last five years and other information relating to the experience, attributes, and skills relevant to each Trustee's qualifications to serve as a Trustee, which led to the conclusion that each Trustee should serve as a Trustee for the fund.
Advisory Board Members and Executive Officers:
Correspondence intended for each executive officer, Edward C. Johnson 3d, and Peter S. Lynch may be sent to Fidelity Investments, 82 Devonshire Street, Boston, Massachusetts 02109.
Name, Age; Principal Occupation |
Edward C. Johnson 3d (81) |
| Year of Election or Appointment: 2011 Member of the Advisory Board of Fidelity's Equity and High Income Funds. Mr. Johnson serves as Chief Executive Officer, Chairman, and a Director of FMR LLC, and also serves as Chairman and Director of FIL Limited. Previously, Mr. Johnson served as a Trustee and Chairman of the Board of certain Fidelity Trusts, Chairman and a Director of FMR, Chairman and a Director of FMR Co., Inc., and President of FMR LLC (2006-2007). |
Peter S. Lynch (67) |
| Year of Election or Appointment: 2003 Member of the Advisory Board of Fidelity's Equity and High Income Funds. Mr. Lynch is Vice Chairman and a Director of FMR and FMR Co., Inc. In addition, Mr. Lynch serves as a Trustee of Boston College and as the Chairman of the Inner-City Scholarship Fund. Previously, Mr. Lynch served on the Special Olympics International Board of Directors (1997-2006). |
Kenneth B. Robins (42) |
| Year of Election or Appointment: 2008 President and Treasurer of Fidelity's Equity and High Income Funds. Mr. Robins also serves as President and Treasurer (2010-present) and Assistant Treasurer (2009-present) of other Fidelity funds and is an employee of Fidelity Investments (2004-present). Previously, Mr. Robins served as Deputy Treasurer of the Fidelity funds (2005-2008) and Treasurer and Chief Financial Officer of The North Carolina Capital Management Trust: Cash and Term Portfolios (2006-2008). |
Bruce T. Herring (46) |
| Year of Election or Appointment: 2006 Vice President of certain Equity Funds. Mr. Herring also serves as Chief Investment Officer and Director of Fidelity Management & Research (U.K.) Inc. (2010-present) and Group Chief Investments Officer of FMR. Previously, Mr. Herring served as Vice President (2005-2006) and Senior Vice President (2006-2007) of Fidelity Management & Research Company, Vice President of FMR Co., Inc. (2001-2007) and as a portfolio manager for Fidelity U.S. Equity Funds. |
Brian B. Hogan (47) |
| Year of Election or Appointment: 2009 Vice President of Equity and High Income Funds. Mr. Hogan also serves as President of FMR's Equity Division (2009-present). Previously, Mr. Hogan served as Senior Vice President, Equity Research of FMR (2006-2009) and as a portfolio manager. |
Scott C. Goebel (43) |
| Year of Election or Appointment: 2008 Secretary and Chief Legal Officer (CLO) of the Fidelity funds. Mr. Goebel also serves as Secretary of Fidelity Investments Money Management, Inc. (FIMM) (2010-present) and Fidelity Research and Analysis Company (FRAC) (2010-present); Secretary and CLO of The North Carolina Capital Management Trust: Cash and Term Portfolios (2008-present); General Counsel, Secretary, and Senior Vice President of FMR (2008-present) and FMR Co., Inc. (2008-present); employed by FMR LLC or an affiliate (2001-present); Chief Legal Officer of Fidelity Management & Research (Hong Kong) Limited (2008-present) and Assistant Secretary of Fidelity Management & Research (Japan) Inc. (2008-present), and Fidelity Management & Research (U.K.) Inc. (2008-present). Previously, Mr. Goebel served as Assistant Secretary of FIMM (2008-2010), FRAC (2008-2010), and the Funds (2007-2008) and as Vice President and Secretary of Fidelity Distributors Corporation (FDC) (2005-2007). |
William C. Coffey (42) |
| Year of Election or Appointment: 2009 Assistant Secretary of Fidelity's Equity and High Income Funds. Mr. Coffey also serves as Senior Vice President and Deputy General Counsel of FMR LLC (2010-present), and is an employee of Fidelity Investments. Previously, Mr. Coffey served as Vice President and Associate General Counsel of FMR LLC (2005-2009). |
Holly C. Laurent (57) |
| Year of Election or Appointment: 2008 Anti-Money Laundering (AML) Officer of the Fidelity funds. Ms. Laurent also serves as AML Officer of The North Carolina Capital Management Trust: Cash and Term Portfolios (2008-present) and is an employee of Fidelity Investments. Previously, Ms. Laurent was Senior Vice President and Head of Legal for Fidelity Business Services India Pvt. Ltd. (2006-2008), and Senior Vice President, Deputy General Counsel and Group Head for FMR LLC (2005-2006). |
Christine Reynolds (53) |
| Year of Election or Appointment: 2008 Chief Financial Officer of the Fidelity funds. Ms. Reynolds became President of Fidelity Pricing and Cash Management Services (FPCMS) in August 2008. Ms. Reynolds served as Chief Operating Officer of FPCMS (2007-2008). Previously, Ms. Reynolds served as President, Treasurer, and Anti-Money Laundering officer of the Fidelity funds (2004-2007). |
Kenneth A. Rathgeber (64) |
| Year of Election or Appointment: 2004 Chief Compliance Officer of Fidelity's Equity and High Income Funds. Mr. Rathgeber is Chief Compliance Officer of Fidelity Management & Research (Hong Kong) Limited (2008-present), Fidelity Management & Research (Japan) Inc. (2008-present), FMR (2005-present), FMR Co., Inc. (2005-present), Fidelity Management & Research (U.K.) Inc. (2005-present), Fidelity Research & Analysis Company (2005-present), Fidelity Investments Money Management, Inc. (2005-present), Pyramis Global Advisors, LLC (2005-present), and Strategic Advisers, Inc. (2005-present). |
Jeffrey S. Christian (50) |
| Year of Election or Appointment: 2009 Deputy Treasurer of the Fidelity funds. Mr. Christian is an employee of Fidelity Investments. Previously, Mr. Christian served as Chief Financial Officer (2008-2009) of certain Fidelity funds and Senior Vice President of Fidelity Pricing and Cash Management Services (FPCMS) (2004-2009). |
Joseph F. Zambello (54) |
| Year of Election or Appointment: 2011 Deputy Treasurer of the Fidelity funds. Mr. Zambello is an employee of Fidelity Investments. Previously, Mr. Zambello served as Vice President of FMR's Program Management Group (2009-2011) and Vice President of the Transfer Agent Oversight Group (2005-2009). |
Adrien E. Deberghes (44) |
| Year of Election or Appointment: 2008 Deputy Treasurer of Fidelity's Equity and High Income Funds. Mr. Deberghes also serves as Vice President and Assistant Treasurer of Fidelity Rutland Square Trust II and Fidelity Commonwealth Trust II (2011-present), Assistant Treasurer of other Fidelity funds (2010-present), and is an employee of Fidelity Investments (2008-present). Previously, Mr. Deberghes served as Senior Vice President of Mutual Fund Administration at State Street Corporation (2007-2008), Senior Director of Mutual Fund Administration at Investors Bank & Trust (2005-2007), and Director of Finance for Dunkin' Brands (2000-2005). |
Stephanie J. Dorsey (42) |
| Year of Election or Appointment: 2010 Assistant Treasurer of Fidelity's Equity and High Income Funds. Ms. Dorsey also serves as Deputy Treasurer of other Fidelity funds (2008-present) and is an employee of Fidelity Investments (2008-present). Previously, Ms. Dorsey served as Treasurer (2004-2008) of the JPMorgan Mutual Funds and Vice President (2004-2008) of JPMorgan Chase Bank. |
John R. Hebble (53) |
| Year of Election or Appointment: 2009 Assistant Treasurer of Fidelity's Equity and High Income Funds. Mr. Hebble also serves as President (2011-present), Treasurer, and Chief Financial Officer of The North Carolina Capital Management Trust: Cash and Term Portfolios (2008-present), President and Treasurer of other Fidelity funds (2008-present) and is an employee of Fidelity Investments. |
Gary W. Ryan (53) |
| Year of Election or Appointment: 2005 Assistant Treasurer of the Fidelity funds. Mr. Ryan is an employee of Fidelity Investments. Previously, Mr. Ryan served as Vice President of Fund Reporting in Fidelity Pricing and Cash Management Services (FPCMS) (1999-2005). |
Jonathan Davis (43) |
| Year of Election or Appointment: 2010 Assistant Treasurer of the Fidelity funds. Mr. Davis is also Assistant Treasurer of Fidelity Rutland Square Trust II and Fidelity Commonwealth Trust II. Mr. Davis is an employee of Fidelity Investments. Previously, Mr. Davis served as Vice President and Associate General Counsel of FMR LLC (2003-2010). |
Annual Report
Fidelity International Discovery Fund designates 90% and 100% of the dividends distributed on December 3, 2010 and December 30, 2010, respectively during the fiscal year as amounts which may be taken into account as a dividend for the purposes of the maximum rate under section 1(h)(11) of the Internal Revenue Code.
The amounts per share which represent income derived from sources within, and taxes paid to, foreign countries or possessions of the United States are as follows:
| Pay Date | Income | Taxes |
Fidelity International Discovery Fund | 12/06/2010 | $0.414 | $0.0348 |
| 12/31/2010 | $0.041 | $0.0000 |
The fund will notify shareholders in January 2012 of amounts for use in preparing 2011 income tax returns.
Annual Report
Board Approval of Investment Advisory Contracts and Management Fees
Fidelity International Discovery Fund
Each year, the Board of Trustees, including the Independent Trustees (together, the Board), votes on the renewal of the management contract and sub-advisory agreements (together, the Advisory Contracts) for the fund. The Board, assisted by the advice of fund counsel and Independent Trustees' counsel, requests and considers a broad range of information relevant to the renewal of the Advisory Contracts throughout the year.
The Board meets regularly and considers at each of its meetings factors that are relevant to its annual consideration of the renewal of the fund's Advisory Contracts, including the services and support provided to the fund and its shareholders. The Board has established various standing committees, each composed of Independent Trustees with varying backgrounds, to which the Board has assigned specific subject matter responsibilities in order to enhance effective decision-making by the Board. The Board, acting directly and through its Committees, requests and receives information concerning the annual consideration of the renewal of the fund's Advisory Contracts. The Board also meets as needed to consider matters specifically related to the Board's annual consideration of the renewal of Advisory Contracts. Members of the Board may also meet with trustees of other Fidelity funds through ad hoc joint committees to discuss certain matters relevant to the Fidelity funds.
At its July 2011 meeting, the Board of Trustees, including the Independent Trustees, unanimously determined to renew the fund's Advisory Contracts. In reaching its determination, the Board considered all factors it believed relevant, including (i) the nature, extent, and quality of the services to be provided to the fund and its shareholders (including the investment performance of the fund); (ii) the competitiveness of the fund's management fee and total expense ratio; (iii) the total costs of the services to be provided by and the profits to be realized by Fidelity from its relationship with the fund; (iv) the extent to which economies of scale would be realized as the fund grows; and (v) whether fee levels reflect these economies of scale, if any, for the benefit of fund shareholders.
In considering whether to renew the Advisory Contracts for the fund, the Board reached a determination, with the assistance of fund counsel and Independent Trustees' counsel and through the exercise of its business judgment, that the renewal of the Advisory Contracts is in the best interests of the fund and its shareholders and that the compensation payable under the Advisory Contracts is fair and reasonable. The Board's decision to renew the Advisory Contracts was not based on any single factor, but rather was based on a comprehensive consideration of all the information provided to the Board at its meetings throughout the year. The Board, in reaching its determination to renew the Advisory Contracts, is aware that shareholders in the fund have a broad range of investment choices available to them, including a wide choice among mutual funds offered by Fidelity's competitors, and that the fund's shareholders, who have the opportunity to review and weigh the disclosure provided by the fund in its prospectus and other public disclosures, have chosen to invest in this fund, managed by Fidelity.
Annual Report
Nature, Extent, and Quality of Services Provided. The Board considered the staffing within the investment adviser, FMR, and the sub-advisers (together, the Investment Advisers), including the backgrounds of the fund's investment personnel and the fund's investment objective and discipline. The Independent Trustees also had discussions with senior management of Fidelity's investment operations and investment groups. The Board considered the structure of the portfolio manager compensation program and whether this structure provides appropriate incentives to act in the best interests of the fund.
Resources Dedicated to Investment Management and Support Services. The Board and the Fund Oversight and Research Committees reviewed the general qualifications and capabilities of the Investment Advisers' investment staff, including its size, education, experience, and resources, as well as the Investment Advisers' approach to recruiting, training, managing, and compensating investment personnel. The Board also noted that FMR has devoted increased resources to non-U.S. offices. The Board noted that Fidelity's analysts have extensive resources, tools and capabilities which allow them to conduct sophisticated quantitative and fundamental analysis, as well as credit analysis of issuers, counterparties and enhancers. The Board also believes that Fidelity's investment professionals have sufficient access to global information and data so as to provide competitive investment results over time, and that those professionals also have access to sophisticated tools which permit them to assess portfolio construction and risk and performance attribution characteristics continuously, as well as to transmit new information and research conclusions rapidly around the world. Additionally, in their deliberations, the Board considered the Investment Advisers' trading capabilities and resources which are an integral part of the investment management process.
Shareholder and Administrative Services. The Board considered (i) the nature, extent, quality, and cost of advisory, administrative, and shareholder services performed by the Investment Advisers and their affiliates under the Advisory Contracts and under separate agreements covering transfer agency, pricing and bookkeeping, and securities lending services for the fund; (ii) the nature and extent of the investment adviser's supervision of third party service providers, principally custodians and subcustodians; and (iii) the resources devoted to, and the record of compliance with, the fund's compliance policies and procedures. The Board also reviewed the allocation of fund brokerage, including allocations to brokers affiliated with the Investment Advisers, the use of brokerage commissions to pay fund expenses, and the use of "soft" commission dollars to pay for research services.
The Board noted that the growth of fund assets over time across the complex allows Fidelity to reinvest in the development of services designed to enhance the value or convenience of the Fidelity funds as investment vehicles. These services include 24-hour access to account information and market information through telephone representatives and over the Internet, investor education materials and asset allocation tools, and the expanded availability of Fidelity Investor Centers, with 35 new branches opening since 2010.
Annual Report
Board Approval of Investment Advisory Contracts and
Management Fees - continued
Investment in a Large Fund Family. The Board considered the benefits to shareholders of investing in a Fidelity fund, including the benefits of investing in a fund that is part of a large family of funds offering a variety of investment disciplines and providing a large variety of mutual fund investor services. The Board noted that Fidelity had taken, or had made recommendations that resulted in the Fidelity funds taking, a number of actions over the previous year that benefited particular funds, including (i) continuing to dedicate additional resources to investment research and support of the senior management team that oversees asset management; (ii) rationalizing product lines through the mergers of six funds into other funds; (iii) continuing to migrate the Freedom Funds to dedicated lower cost underlying funds; (iv) obtaining shareholder approval to broaden the investment strategies for Fidelity Consumer Finance Portfolio, Fidelity Emerging Asia Fund, and Fidelity Environment and Alternative Energy Portfolio; (v) contractually agreeing to reduce the management fees and impose other expense limitations on Spartan 500 Index Fund and U.S. Bond Index Fund in connection with launching new institutional classes of these funds; (vi) changing the name, primary and supplemental benchmarks, and investment policies of Fidelity Global Strategies Fund to support the fund's flexible investment mandate and global orientation; and (vii) reducing the transfer agency account fee rates on certain accounts.
Investment Performance. The Board considered whether the fund has operated in accordance with its investment objective, as well as its record of compliance with its investment restrictions. It also reviewed the fund's absolute investment performance for each class, as well as the fund's relative investment performance for each class measured over multiple periods against (i) a broad-based securities market index, and (ii) a peer group of mutual funds deemed appropriate by Fidelity and reviewed by the Board. The following charts considered by the Board show, over the one-, three-, and five-year periods ended December 31, 2010, the cumulative total returns of Institutional Class (Class I) and Class B of the fund, the cumulative total returns of a broad-based securities market index ("benchmark"), and a range of cumulative total returns of a peer group of mutual funds identified by Morningstar, Inc. as having an investment style similar to that of the fund based on underlying portfolio holdings. The returns of Institutional Class (Class I) and Class B show the performance of the highest and lowest performing classes, respectively (based on five-year performance). The box within each chart shows the 25th percentile return (bottom of box) and the 75th percentile return (top of box) of the peer group. Returns shown above the box are in the first quartile and returns shown below the box are in the fourth quartile. The percentage beaten numbers noted below each chart correspond to the percentile box and represent the percentage of funds in the peer group whose performance was equal to or lower than that of the class indicated.
Annual Report
Fidelity International Discovery Fund
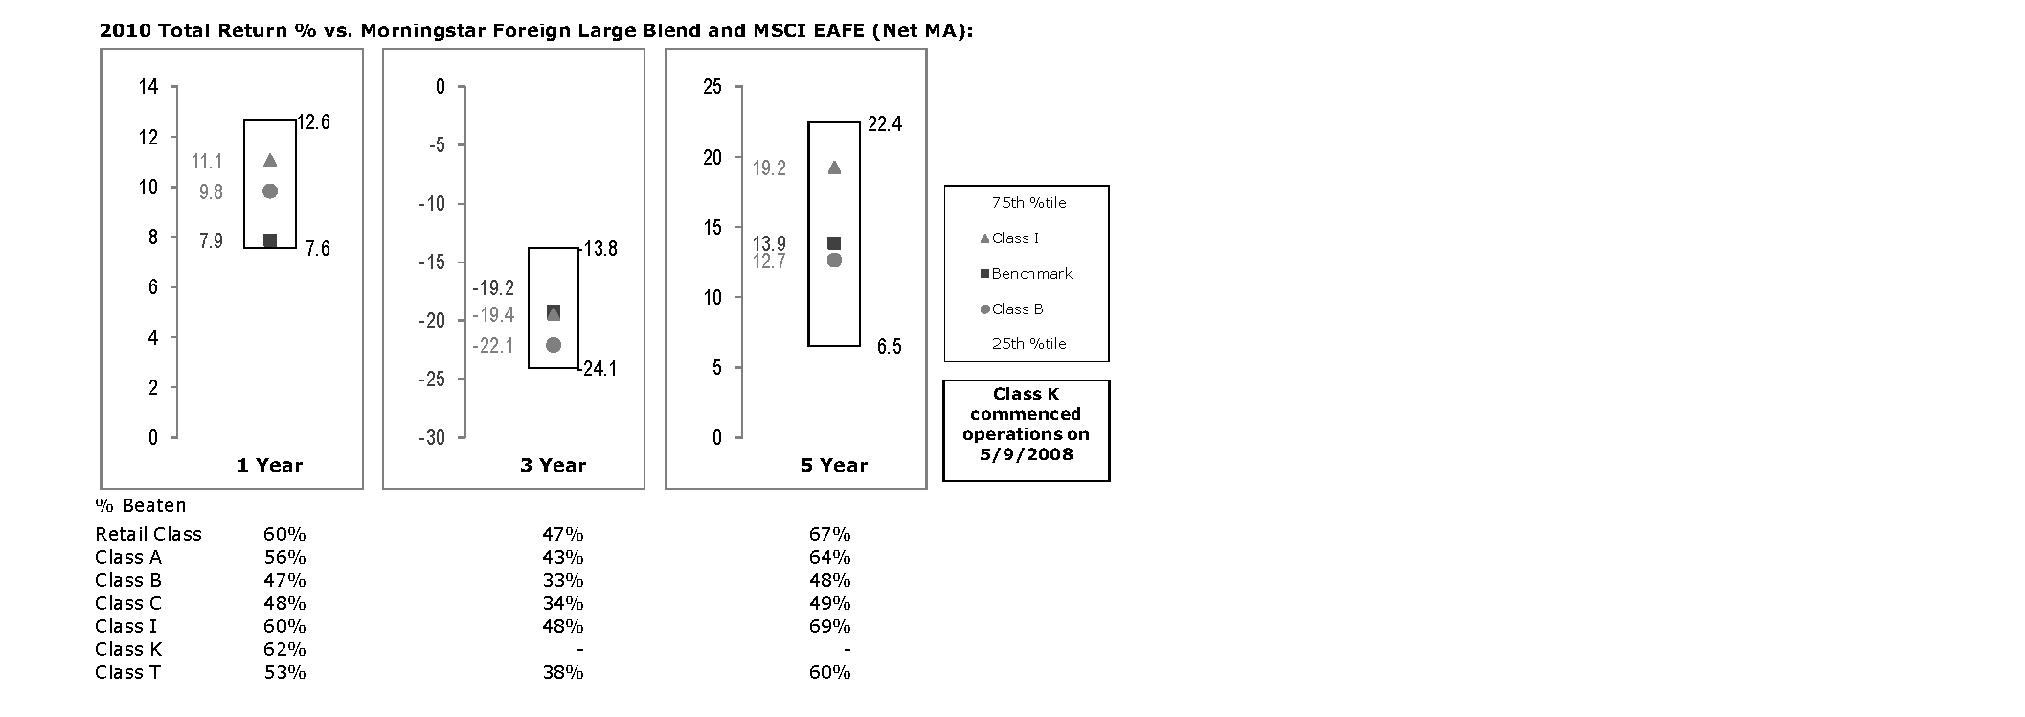
The Board reviewed the fund's relative investment performance against its peer group and noted that the performance of Institutional Class (Class I) of the fund was in the second quartile for the one- and five-year periods and the third quartile for the three-year period. The Board also noted that the investment performance of Institutional Class (Class I) of the fund compared favorably to its benchmark for the one- and five-year periods, although the fund's three-year cumulative total return was lower than its benchmark. The Board considered that the variations in performance among the fund's classes reflect the variations in class expenses, which result in lower performance for higher expense classes. The Board also reviewed the fund's performance since inception as well as performance in the current year.
The Board also considered that the fund's management fee is subject to upward or downward adjustment depending upon whether, and to what extent, the fund's investment performance for the performance period exceeds, or is exceeded by, the record (over the same period) of a Board-approved performance adjustment index. The Board noted that the performance adjustment provides FMR with a strong economic incentive to seek to achieve superior performance for the fund's shareholders and helps to more closely align the interests of FMR and the fund's shareholders.
Based on its review, the Board concluded that the nature, extent, and quality of services provided to the fund under the Advisory Contracts should benefit the fund's shareholders.
Annual Report
Board Approval of Investment Advisory Contracts and
Management Fees - continued
Competitiveness of Management Fee and Total Expense Ratio. The Board considered the fund's management fee and total expense ratio compared to "mapped groups" of competitive funds and classes. Fidelity creates "mapped groups" by combining similar Lipper investment objective categories that have comparable management fee characteristics. Combining Lipper investment objective categories aids the Board's management fee and total expense ratio comparisons by broadening the competitive group used for comparison and by reducing the number of universes to which various Fidelity funds are compared.
Management Fee. The Board considered two proprietary management fee comparisons for the 12-month periods shown in the chart below. The group of Lipper funds used by the Board for management fee comparisons is referred to below as the "Total Mapped Group." The Total Mapped Group comparison focuses on a fund's standing relative to the total universe of comparable funds available to investors in terms of gross management fees before expense reimbursements or caps, and without giving effect to the fund's performance adjustment. "TMG %" represents the percentage of funds in the Total Mapped Group that had management fees that were lower than the fund's. For example, a TMG % of 16% means that 84% of the funds in the Total Mapped Group had higher management fees than the fund. The "Asset-Size Peer Group" (ASPG) comparison focuses on a fund's standing relative to non-Fidelity funds similar in size to the fund within the Total Mapped Group. The ASPG represents at least 15% of the funds in the Total Mapped Group with comparable asset size and management fee characteristics, subject to a minimum of 50 funds (or all funds in the Total Mapped Group if fewer than 50). Additional information, such as the ASPG quartile in which the fund's management fee ranked and the impact of the fund's performance adjustment, is also included in the chart and considered by the Board.
Annual Report
Fidelity International Discovery Fund
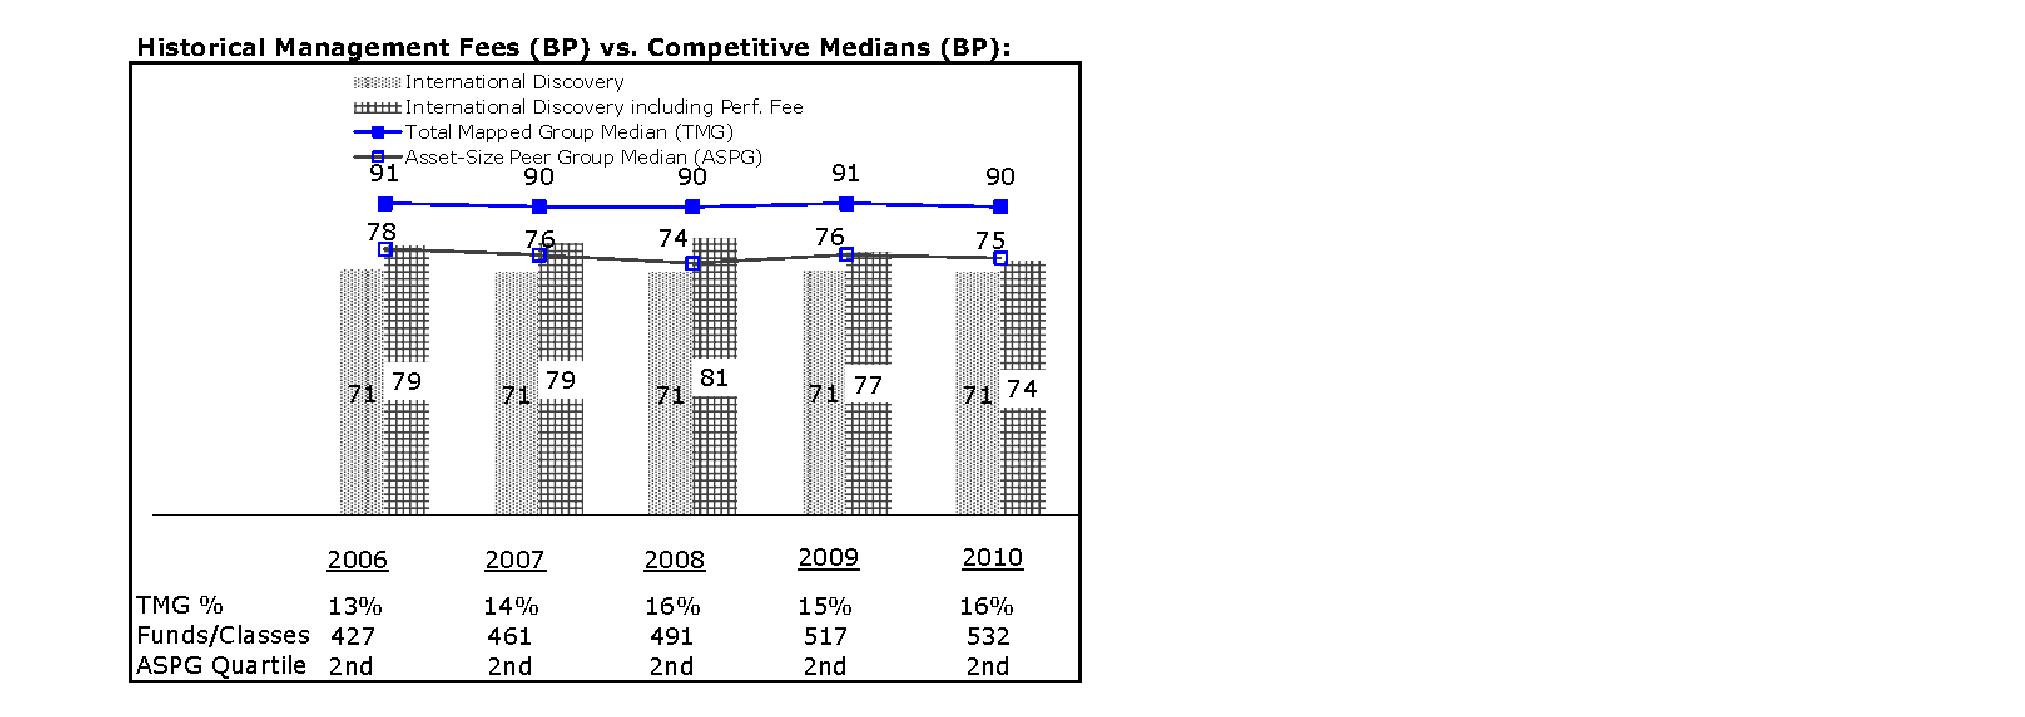
The Board noted that the fund's management fee ranked below the median of its Total Mapped Group and below the median of its ASPG for 2010. The Board also noted the effect of the fund's positive performance adjustment on the fund's management fee ranking. The Board noted that the performance adjustment for each year represents calculations for performance periods that differ from the periods shown in the performance charts above.
Based on its review, the Board concluded that the fund's management fee is fair and reasonable in light of the services that the fund receives and the other factors considered.
Total Expense Ratio. In its review of each class's total expense ratio, the Board considered the fund's management fee as well as other fund or class expenses, as applicable, such as transfer agent fees, pricing and bookkeeping fees, fund-paid 12b-1 fees, and custodial, legal, and audit fees. The Board also noted the effects of any waivers and reimbursements on fees and expenses, as well as the impact of the fund's performance adjustment. As part of its review, the Board also considered the current and historical total expense ratios of each class of the fund compared to competitive fund median expenses. Each class of the fund is compared to those funds and classes in the Total Mapped Group (used by the Board for management fee comparisons) that have a similar sales load structure.
The Board noted that the total expense ratio of each of Class A, Class B, Class C, Institutional Class, the retail class, and Class K ranked below its competitive median for 2010 and the total expense ratio of Class T ranked above its competitive median for 2010. The Board considered that various factors, including 12b-1 fees, positive or negative performance adjustments, and relatively higher other expenses in the case of small fund size, can affect total expense ratios. The Board noted that the total expense ratio of Class T was above the competitive median primarily because of higher 12b-1 fees on Class T. Class T has a higher 12b-1 fee, but a lower front-end sales charge, than traditionally priced front-end sales charge classes. The Board noted that the fund offers multiple classes, each of which has a different sales load and 12b-1 fee structure, and that the multiple structures are intended to offer a range of pricing options for the intermediary market. The Board also noted that the total expense ratios of the classes vary primarily by the level of their 12b-1 fees, although differences in transfer agent fees may also cause expenses to vary from class to class.
Annual Report
Board Approval of Investment Advisory Contracts and
Management Fees - continued
Fees Charged to Other Fidelity Clients. The Board also considered Fidelity fee structures and other information with respect to clients of FMR and its affiliates, such as other mutual funds advised or subadvised by FMR or its affiliates, pension plan clients, and other institutional clients. In March 2010, the Board created an ad hoc joint committee with the board of other Fidelity funds (the Committee) to review and compare Fidelity's institutional investment advisory business with its business of providing services to the Fidelity funds, including the differences in services provided, fees charged, and costs incurred, as well as competition in their respective marketplaces.
Based on its review of total expense ratios and fees charged to other Fidelity clients, the Board concluded that the total expense ratio of each class of the fund was reasonable, although Class T was above the median of the universe presented for comparison, in light of the services that the fund and its shareholders receive and the other factors considered, including the findings of the Committee.
Costs of the Services and Profitability. The Board considered the revenues earned and the expenses incurred by Fidelity in conducting the business of developing, marketing, distributing, managing, administering and servicing the fund and its shareholders. The Board also considered the level of Fidelity's profits in respect of all the Fidelity funds.
On an annual basis, FMR presents to the Board Fidelity's profitability for the fund. Fidelity calculates the profitability for each fund, as well as aggregate profitability for groups of Fidelity funds and all Fidelity funds, using a series of detailed revenue and cost allocation methodologies which originate with the books and records of Fidelity on which Fidelity's audited financial statements are based. The Audit Committee of the Board reviews any significant changes from the prior year's methodologies.
PricewaterhouseCoopers LLP (PwC), independent registered public accounting firm and auditor to Fidelity and certain Fidelity funds, has been engaged annually by the Board as part of the Board's assessment of Fidelity's profitability analysis. PwC's engagement includes the review and assessment of Fidelity's methodologies used in determining the revenues and expenses attributable to Fidelity's mutual fund business, and completion of agreed-upon procedures surrounding the mathematical accuracy of fund profitability and its conformity to allocation methodologies. After considering PwC's reports issued under the engagement and information provided by Fidelity, the Board concluded that while other allocation methods may also be reasonable, Fidelity's profitability methodologies are reasonable in all material respects.
Annual Report
The Board also reviewed Fidelity's non-fund businesses and fall-out benefits related to the mutual fund business as well as cases where Fidelity's affiliates may benefit from or be related to the fund's business.
The Board considered the costs of the services provided by and the profits realized by Fidelity in connection with the operation of the fund and was satisfied that the profitability was not excessive in the circumstances.
Economies of Scale. The Board considered whether there have been economies of scale in respect of the management of the Fidelity funds, whether the Fidelity funds (including the fund) have appropriately benefited from any such economies of scale, and whether there is potential for realization of any further economies of scale. The Board considered the extent to which the fund will benefit from economies of scale through increased services to the fund, through waivers or reimbursements, or through fee or expense reductions. The Board also noted that in 2009, it and the board of other Fidelity funds created an ad hoc committee (the Economies of Scale Committee) to analyze whether FMR attains economies of scale in respect of the management and servicing of the Fidelity funds, whether the Fidelity funds have appropriately benefited from such economies of scale, and whether there is potential for realization of any further economies of scale.
The Board recognized that the fund's management contract incorporates a "group fee" structure, which provides for lower group fee rates as total fund assets under FMR's management increase, and for higher group fee rates as total fund assets under FMR's management decrease. FMR calculates the group fee rates based on a tiered asset "breakpoint" schedule that varies based on asset class. The Board considered that the group fee is designed to deliver the benefits of economies of scale to fund shareholders when total Fidelity fund assets increase, even if assets of any particular fund are unchanged or have declined, because some portion of Fidelity's costs are attributable to services provided to all Fidelity funds, and all funds benefit if those costs can be allocated among more assets. The Board concluded that, given the group fee structure, fund shareholders will benefit from lower management fees as assets under FMR's management increase at the fund complex level, regardless of whether Fidelity achieves any such economies of scale.
The Board concluded, taking into account the analysis of the Economies of Scale Committee, that any potential economies of scale are being appropriately shared between fund shareholders and Fidelity.
Annual Report
Board Approval of Investment Advisory Contracts and
Management Fees - continued
Additional Information Requested by the Board. In order to develop fully the factual basis for consideration of the Fidelity funds' Advisory Contracts, the Board requested and received additional information on certain topics, including (i) fund performance trends, actions to be taken by FMR to improve certain funds' overall performance, and Fidelity's long-term strategies for certain funds; (ii) portfolio manager changes that have occurred during the past year and length of portfolio manager tenure for different categories of funds over time; (iii) Fidelity's compensation structure for portfolio managers and other key personnel and strategies for attracting and retaining non-investment personnel; (iv) the amount of the investment that each portfolio manager has made in the Fidelity fund(s) that he or she manages; (v) historical trends in Fidelity's realization of fall-out benefits; (vi) Fidelity's group fee structures and the rationale for the individual fee rates of certain funds; (vii) fund profitability methodology and the impact of certain factors on fund profitability results; (viii) trends regarding industry use of performance fee structures and Fidelity's compliance practices with respect to performance adjustment calculations; (ix) the fee structures in place for certain other Fidelity clients; and (x) explanations regarding the relative total expense ratios of certain funds and classes, total expense competitive trends, and actions that might be taken by FMR to reduce total expense ratios for certain funds and classes.
Based on its evaluation of all of the conclusions noted above, and after considering all factors it believed relevant, the Board ultimately concluded that the advisory fee structures are fair and reasonable, and that the fund's Advisory Contracts should be renewed.
Annual Report
Managing Your Investments
Fidelity offers several ways to conveniently manage your personal investments via your telephone or PC. You can access your account information, conduct trades and research your investments 24 hours a day.
By Phone
Fidelity Automated Service Telephone provides a single toll-free number to access account balances, positions, quotes and trading. It's easy to navigate the service, and on your first call, the system will help you create a personal identification number (PIN) for security.
(phone graphic)
Fidelity Automated
Service Telephone (FAST®)
1-800-544-5555
Press
1 For mutual fund and brokerage trading.
2 For quotes.*
3 For account balances and holdings.
4 To review orders and mutual
fund activity.
5 To change your PIN.
* 0 To speak to a Fidelity representative.
By PC
Fidelity's web site on the Internet provides a wide range of information, including daily financial news, fund performance, interactive planning tools and news about Fidelity products and services.
(computer graphic)
Fidelity's Web Site
www.fidelity.com
* When you call the quotes line, please remember that a fund's yield and return will vary and, except for money market funds, share price will also vary. This means that you may have a gain or loss when you sell your shares. There is no assurance that money market funds will be able to maintain a stable $1 share price; an investment in a money market fund is not insured or guaranteed by the U.S. government. Total returns are historical and include changes in share price, reinvestment of dividends and capital gains distributions, and the effects of any sales charges.
Annual Report
To Visit Fidelity
For directions and hours,
please call 1-800-544-9797.
Arizona
7001 West Ray Road
Chandler, AZ
15445 N. Scottsdale Road
Scottsdale, AZ
17550 North 75th Avenue
Glendale, AZ
5330 E. Broadway Blvd
Tucson, AZ
California
815 East Birch Street
Brea, CA
1411 Chapin Avenue
Burlingame, CA
851 East Hamilton Avenue
Campbell, CA
601 Larkspur Landing Circle
Larkspur, CA
2000 Avenue of the Stars
Los Angeles, CA
27101 Puerta Real
Mission Viejo, CA
73575 El Paseo
Palm Desert, CA
251 University Avenue
Palo Alto, CA
123 South Lake Avenue
Pasadena, CA
16656 Bernardo Ctr. Drive
Rancho Bernardo, CA
1220 Roseville Parkway
Roseville, CA
1740 Arden Way
Sacramento, CA
7676 Hazard Center Drive
San Diego, CA
11943 El Camino Real
San Diego, CA
8 Montgomery Street
San Francisco, CA
3793 State Street
Santa Barbara, CA
1200 Wilshire Boulevard
Santa Monica, CA
398 West El Camino Real
Sunnyvale, CA
111 South Westlake Blvd
Thousand Oaks, CA
21701 Hawthorne Boulevard
Torrance, CA
2001 North Main Street
Walnut Creek, CA
6326 Canoga Avenue
Woodland Hills, CA
2211 Michelson Drive
Irvine, CA
Colorado
281 East Flatiron Circle
Broomfield, CO
1625 Broadway
Denver, CO
9185 Westview Road
Lone Tree, CO
Connecticut
48 West Putnam Avenue
Greenwich, CT
265 Church Street
New Haven, CT
300 Atlantic Street
Stamford, CT
29 South Main Street
West Hartford, CT
1261 Post Road
Fairfield, CT
Delaware
400 Delaware Avenue
Wilmington, DE
Florida
175 East Altamonte Drive
Altamonte Springs, FL
1400 Glades Road
Boca Raton, FL
121 Alhambra Plaza
Coral Gables, FL
2948 N. Federal Highway
Ft. Lauderdale, FL
4671 Town Center Parkway
Jacksonville, FL
8880 Tamiami Trail, North
Naples, FL
230 Royal Palm Way
Palm Beach, FL
3501 PGA Boulevard
Palm Beach Gardens, FL
3550 Tamiami Trail, South
Sarasota, FL
1502 N. Westshore Blvd.
Tampa, FL
2465 State Road 7
Wellington, FL
Georgia
3242 Peachtree Road
Atlanta, GA
1000 Abernathy Road
Atlanta, GA
Illinois
One North LaSalle Street
Chicago, IL
401 North Michigan Avenue
Chicago, IL
One Skokie Valley Road
Highland Park, IL
1415 West 22nd Street
Oak Brook, IL
15105 S LaGrange Road
Orland Park, IL
1572 East Golf Road
Schaumburg, IL
1823 Freedom Drive
Naperville, IL
Indiana
8480 Keystone Crossing
Indianapolis, IN
Kansas
5400 College Boulevard
Overland Park, KS
Maine
Three Canal Plaza
Portland, ME
Maryland
7315 Wisconsin Avenue
Bethesda, MD
610 York Road
Towson, MD
Massachusetts
801 Boylston Street
Boston, MA
155 Congress Street
Boston, MA
300 Granite Street
Braintree, MA
44 Mall Road
Burlington, MA
238 Main Street
Cambridge, MA
200 Endicott Street
Danvers, MA
Fidelity Brokerage Services, Inc., 100 Summer St., Boston, MA 02110 Member NYSE/SIPC
Annual Report
405 Cochituate Road
Framingham, MA
551 Boston Turnpike
Shrewsbury, MA
Michigan
500 E. Eisenhower Pkwy.
Ann Arbor, MI
280 N. Old Woodward Ave.
Birmingham, MI
30200 Northwestern Hwy.
Farmington Hills, MI
43420 Grand River Avenue
Novi, MI
3480 28th Street
Grand Rapids, MI
2425 S. Linden Road STE E
Flint, MI
Minnesota
7740 France Avenue South
Edina, MN
8342 3rd Street North
Oakdale, MN
Missouri
1524 South Lindbergh Blvd.
St. Louis, MO
Nevada
2225 Village Walk Drive
Henderson, NV
New Jersey
501 Route 73 South
Marlton, NJ
150 Essex Street
Millburn, NJ
35 Morris Street
Morristown, NJ
396 Route 17, North
Paramus, NJ
3518 Route 1 North
Princeton, NJ
530 Broad Street
Shrewsbury, NJ
New Mexico
2261 Q Street NE
Albuquerque, NM
New York
1130 Franklin Avenue
Garden City, NY
37 West Jericho Turnpike
Huntington Station, NY
1271 Avenue of the Americas
New York, NY
980 Madison Avenue
New York, NY
61 Broadway
New York, NY
350 Park Avenue
New York, NY
200 Fifth Avenue
New York, NY
733 Third Avenue
New York, NY
2070 Broadway
New York, NY
1075 Northern Blvd.
Roslyn, NY
799 Central Park Avenue
Scarsdale, NY
3349 Monroe Avenue
Rochester, NY
North Carolina
4611 Sharon Road
Charlotte, NC
7011 Fayetteville Road
Durham, NC
Ohio
3805 Edwards Road
Cincinnati, OH
1324 Polaris Parkway
Columbus, OH
1800 Crocker Road
Westlake, OH
28699 Chagrin Boulevard
Woodmere Village, OH
Oregon
7493 SW Bridgeport Road
Tigard, OR
Pennsylvania
600 West DeKalb Pike
King of Prussia, PA
1735 Market Street
Philadelphia, PA
12001 Perry Highway
Wexford, PA
Rhode Island
10 Memorial Boulevard
Providence, RI
Tennessee
3018 Peoples Street
Johnson City, TN
7628 West Farmington Blvd.
Germantown, TN
2035 Mallory Lane
Franklin, TN
Texas
10000 Research Boulevard
Austin, TX
4001 Northwest Parkway
Dallas, TX
12532 Memorial Drive
Houston, TX
2701 Drexel Drive
Houston, TX
6560 Fannin Street
Houston, TX
1701 Lake Robbins Drive
The Woodlands, TX
6500 N. MacArthur Blvd.
Irving, TX
6005 West Park Boulevard
Plano, TX
1576 East Southlake Blvd.
Southlake, TX
15600 Southwest Freeway
Sugar Land, TX
139 N. Loop 1604 East
San Antonio, TX
Utah
279 West South Temple
Salt Lake City, UT
Virginia
1861 International Drive
McLean, VA
11957 Democracy Drive
Reston, VA
Washington
10500 NE 8th Street
Bellevue, WA
1518 6th Avenue
Seattle, WA
304 Strander Blvd
Tukwila, WA
Washington, DC
1900 K Street, N.W.
Washington, DC
Wisconsin
16020 West Bluemound Road
Brookfield, WI
Annual Report
To Write Fidelity
We'll give your correspondence immediate attention and send you written confirmation upon completion of your request.
(letter graphic)
Making Changes
To Your Account
(such as changing name, address, bank, etc.)
Fidelity Investments
P.O. Box 770001
Cincinnati, OH 45277-0002
(letter graphic)
For Non-Retirement
Accounts
Buying shares
Fidelity Investments
P.O. Box 770001
Cincinnati, OH 45277-0003
Overnight Express
Fidelity Investments
Attn: Distribution Services
100 Crosby Parkway - KC1H
Covington, KY 41015
Selling shares
Fidelity Investments
P.O. Box 770001
Cincinnati, OH 45277-0035
Overnight Express
Fidelity Investments
Attn: Distribution Services
100 Crosby Parkway - KC1H
Covington, KY 41015
General Correspondence
Fidelity Investments
P.O. Box 500
Merrimack, NH 03054-0500
(letter graphic)
For Retirement
Accounts
Buying shares
Fidelity Investments
P.O. Box 770001
Cincinnati, OH 45277-0003
Selling shares
Fidelity Investments
P.O. Box 770001
Cincinnati, OH 45277-0035
Overnight Express
Fidelity Investments
Attn: Distribution Services
100 Crosby Parkway - KC1H
Covington, KY 41015
General Correspondence
Fidelity Investments
P.O. Box 500
Merrimack, NH 03054-0500
Annual Report
Investment Adviser
Fidelity Management & Research Company
Boston, MA
Investment Sub-Advisers
FMR Co., Inc.
Fidelity Management & Research
(U.K.) Inc.
FIL Investment Advisors
FIL Investments (Japan) Limited
FIL Investment Advisors (U.K.) Limited
Fidelity Management & Research
(Hong Kong) Limited
Fidelity Management & Research
(Japan) Inc.
General Distributor
Fidelity Distributors Corporation
Boston, MA
Transfer and Service Agents
Fidelity Investments Institutional
Operations Company, Inc.
Boston, MA
Fidelity Service Company, Inc.
Boston, MA
Custodian
The Northern Trust Company
Chicago, IL
The Fidelity Telephone Connection
Mutual Fund 24-Hour Service
Exchanges/Redemptions
and Account Assistance 1-800-544-6666
Product Information 1-800-544-8888
Retirement Accounts 1-800-544-4774
(8 a.m. - 9 p.m.)
TDD Service 1-800-544-0118
for the deaf and hearing impaired
(9 a.m. - 9 p.m. Eastern time)
Fidelity Automated Service
Telephone (FAST®) (automated service graphic) 1-800-544-5555
(automated service graphic) Automated line for quickest service
(Fidelity Logo)
Corporate Headquarters
82 Devonshire St., Boston, MA 02109
www.fidelity.com
IGI-UANN-1211
1.807257.107
(Fidelity Logo)
Fidelity Advisor®
International Discovery
Fund - Class A, Class T, Class B
and Class C
Annual Report
October 31, 2011
(Fidelity Cover Art)
Class A, Class T, Class B, and Class C are classes of Fidelity® International Discovery Fund
Contents
Chairman's Message | (Click Here) | The Chairman's message to shareholders. |
Performance | (Click Here) | How the fund has done over time. |
Management's Discussion of Fund Performance | (Click Here) | The Portfolio Manager's review of fundperformance and strategy. |
Shareholder Expense Example | (Click Here) | An example of shareholder expenses. |
Investment Changes | (Click Here) | A summary of major shifts in the fund's investments over the past six months. |
Investments | (Click Here) | A complete list of the fund's investments with their market values. |
Financial Statements | (Click Here) | Statements of assets and liabilities, operations, and changes in net assets,
as well as financial highlights. |
Notes | (Click Here) | Notes to financial statements. |
Report of Independent Registered Public Accounting Firm | (Click Here) | |
Trustees and Officers | (Click Here) | |
Distributions | (Click Here) | |
Board Approval of Investment Advisory Contracts and Management Fees | (Click Here) | |
To view a fund's proxy voting guidelines and proxy voting record for the 12-month period ended June 30, visit http://www.fidelity.com/proxyvotingresults or visit the Securities and Exchange Commission's (SEC) web site at http://www.sec.gov. You may also call 1-877-208-0098 to request a free copy of the proxy voting guidelines.
Standard & Poor's, S&P and S&P 500 are registered service marks of The McGraw-Hill Companies, Inc. and have been licensed for use by Fidelity Distributors Corporation.
Other third party marks appearing herein are the property of their respective owners.
All other marks appearing herein are registered or unregistered trademarks or service marks of FMR LLC or an affiliated company.
Annual Report
This report and the financial statements contained herein are submitted for the general information of the shareholders of the fund. This report is not authorized for distribution to prospective investors in the fund unless preceded or accompanied by an effective prospectus.
A fund files its complete schedule of portfolio holdings with the SEC for the first and third quarters of each fiscal year on Form N-Q. Forms N-Q are available on the SEC's web site at http://www.sec.gov. A fund's Forms N-Q may be reviewed and copied at the SEC's Public Reference Room in Washington, DC. Information regarding the operation of the SEC's Public Reference Room may be obtained by calling 1-800-SEC-0330. For a complete list of a fund's portfolio holdings, view the most recent holdings listing, semiannual report, or annual report on Fidelity's web site at http://www.fidelity.com, http://www.advisor.fidelity.com, or http://www.401k.com, as applicable.
NOT FDIC INSURED • MAY LOSE VALUE • NO BANK GUARANTEE
Neither the fund nor Fidelity Distributors Corporation is a bank.
Annual Report
(Acting Chairman's Photograph)
Dear Shareholder:
Global equity markets began the fourth quarter on a strong note, sharply reversing course in October amid strong corporate earnings, better-than-expected economic news and the promise of a resolution to the sovereign debt crisis in Europe. The mini rally followed a third quarter marked by a significant downturn in July and August, which heightened investor anxiety and set off a wave of volatility that hampered most major asset classes through the end of September. Financial markets are difficult to predict, of course, but you can help put the odds in your favor by following these time-tested investment principles.
One of the basic tenets is to invest according to your time horizon. For long-term investors, riding out the markets' inevitable ups and downs has proven much more effective than making decisions based on short-term developments. If your goal is approaching, you can also benefit from patience and restraint, rather than attempting to time the market. No matter your time horizon, missing only a few of the markets' best days can significantly diminish returns. Patience also affords the benefits of compounding - earning interest on additional income or reinvested dividends and capital gains. While staying the course doesn't eliminate risk, it can considerably lessen the negative impact of short-term downturns.
Asset allocation is another principle to manage risk. As you spread your portfolio among the asset classes, be sure to consider your time horizon, risk tolerance and investment objectives. Younger investors may be better served by emphasizing equities, which historically have been the best-performing asset class over time. Investors who are nearing a specific goal, such as retirement or sending a child to college, may choose to favor bonds and other investments that have tended to be more stable. Studies indicate that asset allocation is the single most important determinant of a portfolio's long-term success. After deciding on a suitable allocation strategy, make sure your portfolio is adequately diversified, with exposure to stocks of small-, mid- and large-cap companies in a range of sectors, for example. And today, more than ever, geographic diversification should be taken into account.
Lastly, investing a certain amount of money on a regular basis - a principle known as dollar-cost averaging - can help lower the average cost of your purchases, while also giving you the discipline to avoid selling weak performers just prior to an upswing, or chasing a hot performer just before a correction.
We invite you to learn more by visiting us on the Internet, dropping by one of our Investor Centers or calling us by phone. It is our privilege to provide the resources you need to choose investments that are right for you.
Sincerely,
(Acting Chairman's Signature)
James C. Curvey
Acting Chairman
Annual Report
Average annual total return reflects the change in the value of an investment, assuming reinvestment of the class' distributions from dividend income and capital gains (the profits earned upon the sale of securities that have grown in value, if any) and assuming a constant rate of performance each year. The $10,000 table and the fund's returns do not reflect the deduction of taxes that a shareholder would pay on fund distributions or the redemption of fund shares. During periods of reimbursement by Fidelity, a fund's total return will be greater than it would be had the reimbursement not occurred. How a fund did yesterday is no guarantee of how it will do tomorrow.
Average Annual Total Returns
Periods ended October 31, 2011 | Past 1
year | Past 5
years | Past 10
years |
Class A (incl. 5.75% sales charge) A, E | -12.08% | -3.02% | 6.74% |
Class T (incl. 3.50% sales charge) B, E | -10.22% | -2.85% | 6.76% |
Class B (incl. contingent deferred sales charge) C, E | -11.98% | -3.02% | 6.77% |
Class C (incl. contingent deferred sales charge) D , E | -8.29% | -2.64% | 6.80% |
A Class A shares bear a 0.25% 12b-1 fee. The initial offering of Class A shares took place on Janu-ary 6, 2005. Returns prior to January 6, 2005 are those of Fidelity® International Discovery Fund, the original class of the fund, which has no 12b-1 fee. Had Class A shares' 12b-1 fee been reflected, returns prior to January 6, 2005 would have been lower.
B Class T shares bear a 0.50% 12b-1 fee. The initial offering of Class T shares took place on Janu-ary 6, 2005. Returns prior to January 6, 2005 are those of Fidelity International Discovery Fund, the original class of the fund, which has no 12b-1 fee. Had Class T shares' 12b-1 fee been reflected, returns prior to January 6, 2005 would have been lower.
C Class B shares bear a 1.00% 12b-1 fee. The initial offering of Class B shares took place on Janu-ary 6, 2005. Returns prior to January 6, 2005 are those of Fidelity International Discovery Fund, the original class of the fund, which has no 12b-1 fee. Had Class B shares' 12b-1 fee been reflected, returns prior to January 6, 2005 would have been lower. Class B shares' contingent deferred sales charges included in the past one year, past five year, and past 10 year total return figures are 5%, 2%, and 0% respectively.
D Class C shares bear a 1.00% 12b-1 fee. The initial offering of Class C shares took place on Janu-ary 6, 2005. Returns prior to January 6, 2005 are those of Fidelity International Discovery Fund, the original class of the fund, which has no 12b-1 fee. Had Class C shares' 12b-1 fee been reflected, returns prior to January 6, 2005 would have been lower. Class C shares' contingent deferred sales charges included in the past one year, past five year, and past 10 year total return figures are 1%, 0%, and 0% respectively.
E Prior to October 1, 2004, the fund operated under certain different investment policies. The fund's historical performance may not represent its current investment policies.
Annual Report
$10,000 Over 10 Years
Let's say hypothetically that $10,000 was invested in Fidelity Advisor® International Discovery Fund - Class A on October 31, 2001 and the current 5.75% sales charge was paid. The chart shows how the value of your investment would have changed, and also shows how the MSCI® EAFE® (Europe, Australasia, Far East) Index performed over the same period. The initial offering of Class A took place on January 6, 2005. See the previous page for additional information regarding the performance of Class A.
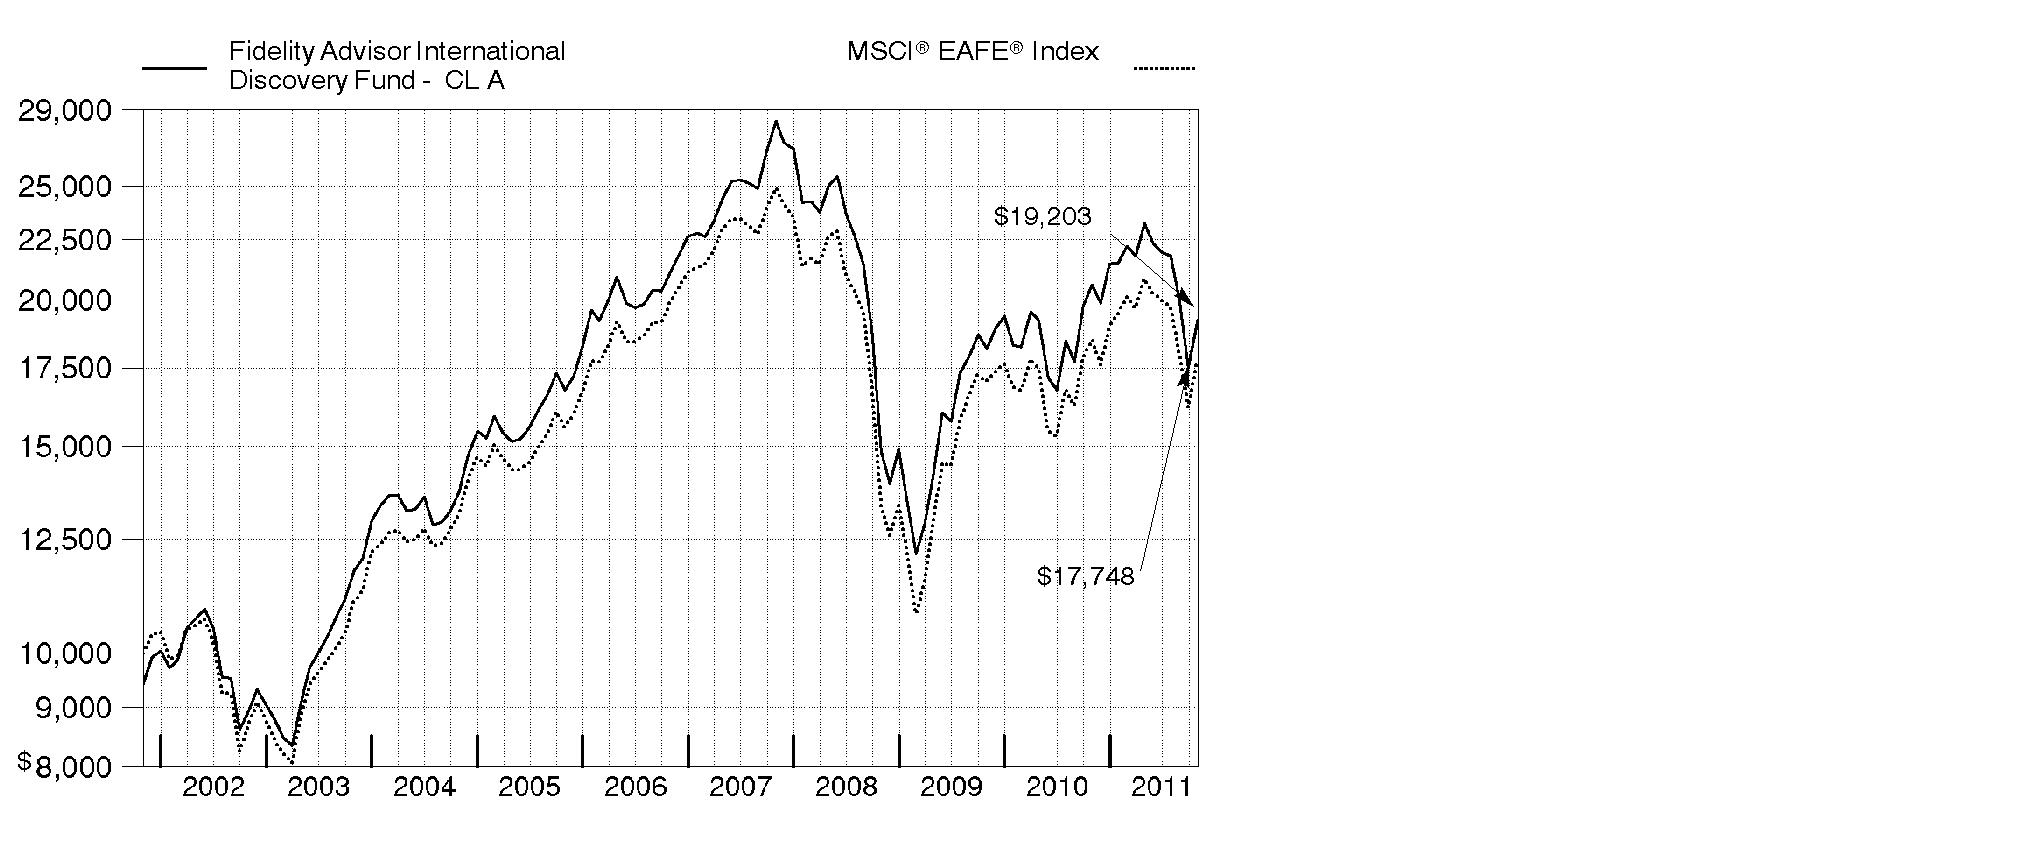
Annual Report
Market Recap: International equities were rocked by a number of headline events during the year ending October 31, 2011. Stocks posted a solid advance for the first half of the period, despite concern about the sovereign debt crisis in Europe, a devastating earthquake and tsunami in Japan, and political upheaval in the Middle East and North Africa. Sentiment turned decidedly negative in the second half, however, as fresh worries about Europe, inflation in China and a dimmed outlook for global growth caused foreign markets to suffer declines that intensified in August and September. October brought with it yet another dramatic swing, as eurozone policymakers appeared near a resolution to the debt debacle and buyers stormed back onto the scene in search of bargains. Still, those gains - along with favorable currency fluctuations overall - weren't enough to offset prior losses, and the MSCI® ACWI® (All Country World Index) ex USA Index finished the period down 4.56%. Within the MSCI index, Europe and emerging markets suffered the biggest declines, with many countries in these areas sustaining steep losses. By contrast, Japan showed resilience in the wake of its natural disasters, falling only 2%. Australia (+4%), Switzerland (+3%), the U.K. (+2%) and Canada, which produced a nominal return, were among the few major benchmark components to break into positive territory.
Comments from William Kennedy, Portfolio Manager of Fidelity Advisor® International Discovery Fund: For the year, the fund's Class A, Class T, Class B and Class C shares returned -6.71%, -6.96, -7.39% and -7.37%, respectively (excluding sales charges), lagging the -3.97% return of the MSCI® EAFE® (Europe, Australasia, Far East) Index. Stock selection and currency exposure detracted from relative performance, particularly in emerging markets (an out-of-index investment); the Asia Pacific ex Japan region; and the United Kingdom. Positioning in energy and financials most hampered returns. Individual disappointments included French bank BNP Paribas, whose stock fell amid worries over its exposure to Greek debt, and Danish brewery Carlsberg, whose earnings suffered from a spike in Russian grain prices. The fund also was hurt by not owning Swiss pharmaceuticals firm and index component Roche Holding. Conversely, defensive positioning in Japan and Europe helped, as did security selection in consumer discretionary and information technology. A non-index stake in Japanese online retailer Start Today benefited from growth in Internet purchases, while shares of U.K. software company Autonomy jumped following a premium acquisition offer. Some of these names were no longer in the portfolio at period end.
The views expressed above reflect those of the portfolio manager(s) only through the end of the period as stated on the cover of this report and do not necessarily represent the views of Fidelity or any other person in the Fidelity organization. Any such views are subject to change at any time based upon market or other conditions and Fidelity disclaims any responsibility to update such views. These views may not be relied on as investment advice and, because investment decisions for a Fidelity fund are based on numerous factors, may not be relied on as an indication of trading intent on behalf of any Fidelity fund.
Annual Report
Shareholder Expense Example
As a shareholder of the Fund, you incur two types of costs: (1) transaction costs, including sales charges (loads) on purchase payments or redemption proceeds, redemption fees, and (2) ongoing costs, including management fees, distribution and/or service (12b-1) fees and other Fund expenses. This Example is intended to help you understand your ongoing costs (in dollars) of investing in the Fund and to compare these costs with the ongoing costs of investing in other mutual funds.
The Example is based on an investment of $1,000 invested at the beginning of the period and held for the entire period (May 1, 2011 to October 31, 2011).
Actual Expenses
The first line of the accompanying table for each class of the Fund provides information about actual account values and actual expenses. You may use the information in this line, together with the amount you invested, to estimate the expenses that you paid over the period. Simply divide your account value by $1,000.00 (for example, an $8,600 account value divided by $1,000.00 = 8.6), then multiply the result by the number in the first line for a class of the Fund under the heading entitled "Expenses Paid During Period" to estimate the expenses you paid on your account during this period. A small balance maintenance fee of $12.00 that is charged once a year may apply for certain accounts with a value of less than $2,000. This fee is not included in the table below. If it was, the estimate of expenses you paid during the period would be higher, and your ending account value lower, by this amount. In addition, the Fund, as a shareholder in the underlying Fidelity Central Funds, will indirectly bear its pro-rata share of the fees and expenses incurred by the underlying Fidelity Central Funds. These fees and expenses are not included in the Fund's annualized expense ratio used to calculate the expense estimate in the table below.
Hypothetical Example for Comparison Purposes
The second line of the accompanying table for each class of the Fund provides information about hypothetical account values and hypothetical expenses based on a Class' actual expense ratio and an assumed rate of return of 5% per year before expenses, which is not the Class' actual return. The hypothetical account values and expenses may not be used to estimate the actual ending account balance or expenses you paid for the period. You may use this information to compare the ongoing costs of investing in the Fund and other funds. To do so, compare this 5% hypothetical example with the 5% hypothetical examples that appear in the shareholder reports of the other funds. A small balance maintenance fee of $12.00 that is charged once a year may apply for certain accounts with a value of less than $2,000. This fee is not included in the table below. If it was, the estimate of expenses you paid during the period would be higher, and your ending account value lower, by this amount. In addition, the Fund, as a shareholder in the underlying Fidelity Central Funds, will indirectly bear its pro-rata share of the fees and expenses incurred by the underlying Fidelity Central Funds. These fees and expenses are not included in the Fund's annualized expense ratio used to calculate the expense estimate in the table below.
Please note that the expenses shown in the table are meant to highlight your ongoing costs only and do not reflect any transaction costs. Therefore, the second line of the table is useful in comparing ongoing costs only, and will not help you determine the relative total costs of owning different funds. In addition, if these transactional costs were included, your costs would have been higher.
Annual Report
| Annualized Expense Ratio | Beginning
Account Value
May 1, 2011 | Ending
Account Value
October 31, 2011 | Expenses Paid
During Period*
May 1, 2011 to October 31, 2011 |
Class A | 1.29% | | | |
Actual | | $ 1,000.00 | $ 827.20 | $ 5.94 |
HypotheticalA | | $ 1,000.00 | $ 1,018.70 | $ 6.56 |
Class T | 1.54% | | | |
Actual | | $ 1,000.00 | $ 825.90 | $ 7.09 |
HypotheticalA | | $ 1,000.00 | $ 1,017.44 | $ 7.83 |
Class B | 2.05% | | | |
Actual | | $ 1,000.00 | $ 824.20 | $ 9.43 |
HypotheticalA | | $ 1,000.00 | $ 1,014.87 | $ 10.41 |
Class C | 2.04% | | | |
Actual | | $ 1,000.00 | $ 824.30 | $ 9.38 |
HypotheticalA | | $ 1,000.00 | $ 1,014.92 | $ 10.36 |
International Discovery | .96% | | | |
Actual | | $ 1,000.00 | $ 828.60 | $ 4.42 |
HypotheticalA | | $ 1,000.00 | $ 1,020.37 | $ 4.89 |
Class K | .79% | | | |
Actual | | $ 1,000.00 | $ 829.20 | $ 3.64 |
HypotheticalA | | $ 1,000.00 | $ 1,021.22 | $ 4.02 |
Institutional Class | .95% | | | |
Actual | | $ 1,000.00 | $ 828.40 | $ 4.38 |
HypotheticalA | | $ 1,000.00 | $ 1,020.42 | $ 4.84 |
A 5% return per year before expenses
* Expenses are equal to each Class' annualized expense ratio, multiplied by the average account value over the period, multiplied by 184/365 (to reflect the one-half year period).
Annual Report
Investment Changes (Unaudited)
Geographic Diversification (% of fund's net assets) |
As of October 31, 2011 |
| United Kingdom 21.0% | |
| Japan 15.8% | |
| France 9.1% | |
| Switzerland 6.8% | |
| Germany 6.3% | |
| Australia 3.5% | |
| Netherlands 3.4% | |
| Cayman Islands 2.8% | |
| Korea (South) 2.5% | |
| Other 28.8% | |

Percentages are adjusted for the effect of futures contracts, if applicable. |
As of April 30, 2011 |
| United Kingdom 21.3% | |
| Japan 16.2% | |
| France 8.8% | |
| Germany 7.7% | |
| Switzerland 5.2% | |
| Australia 4.1% | |
| United States of America 3.7% | |
| Netherlands 3.3% | |
| Denmark 3.1% | |
| Other 26.6% | |

Percentages are adjusted for the effect of futures contracts, if applicable. |
Asset Allocation |
| % of fund's
net assets | % of fund's net assets
6 months ago |
Stocks | 99.9 | 98.7 |
Short-Term Investments and Net Other Assets | 0.1 | 1.3 |
Top Ten Stocks as of October 31, 2011 |
| % of fund's
net assets | % of fund's net assets
6 months ago |
Royal Dutch Shell PLC Class B (United Kingdom, Oil, Gas & Consumable Fuels) | 2.8 | 2.8 |
Nestle SA (Switzerland, Food Products) | 2.0 | 0.9 |
British American Tobacco PLC (United Kingdom) (United Kingdom, Tobacco) | 1.8 | 0.4 |
BHP Billiton PLC (United Kingdom, Metals & Mining) | 1.7 | 1.9 |
Vodafone Group PLC (United Kingdom, Wireless Telecommunication Services) | 1.5 | 1.2 |
ORIX Corp. (Japan, Diversified Financial Services) | 1.3 | 1.1 |
BG Group PLC (United Kingdom, Oil, Gas & Consumable Fuels) | 1.3 | 1.0 |
Japan Tobacco, Inc. (Japan, Tobacco) | 1.3 | 0.5 |
Novo Nordisk A/S Series B (Denmark, Pharmaceuticals) | 1.3 | 1.5 |
HSBC Holdings PLC (United Kingdom) (United Kingdom, Commercial Banks) | 1.2 | 1.3 |
| 16.2 | |
Market Sectors as of October 31, 2011 |
| % of fund's
net assets | % of fund's net assets
6 months ago |
Financials | 21.3 | 21.3 |
Consumer Discretionary | 18.6 | 17.3 |
Consumer Staples | 12.6 | 8.2 |
Information Technology | 9.8 | 8.7 |
Industrials | 9.6 | 14.3 |
Energy | 7.5 | 8.5 |
Health Care | 7.2 | 6.2 |
Telecommunication Services | 6.4 | 5.3 |
Materials | 6.0 | 8.7 |
Utilities | 0.9 | 0.2 |
Annual Report
Investments October 31, 2011
Showing Percentage of Net Assets
Common Stocks - 98.6% |
| Shares | | Value (000s) |
Australia - 3.5% |
Australia & New Zealand Banking Group Ltd. | 4,456,031 | | $ 100,700 |
carsales.com Ltd. (d) | 3,966,844 | | 20,509 |
Commonwealth Bank of Australia | 1,268,063 | | 65,147 |
Fortescue Metals Group Ltd. | 3,503,390 | | 17,599 |
Macquarie Group Ltd. | 472,090 | | 12,156 |
Newcrest Mining Ltd. | 1,658,172 | | 58,608 |
WorleyParsons Ltd. | 993,898 | | 28,850 |
TOTAL AUSTRALIA | | 303,569 |
Austria - 0.0% |
Osterreichische Elektrizitatswirtschafts AG | 101,380 | | 2,951 |
Bailiwick of Guernsey - 0.1% |
Ashmore Global Opportunities Ltd. (United Kingdom) | 825,990 | | 9,166 |
Bailiwick of Jersey - 2.0% |
Experian PLC | 3,236,600 | | 42,187 |
Shire PLC | 2,310,400 | | 72,527 |
Velti PLC (a) | 290,405 | | 2,445 |
Wolseley PLC | 1,930,464 | | 55,820 |
TOTAL BAILIWICK OF JERSEY | | 172,979 |
Belgium - 0.3% |
Anheuser-Busch InBev SA NV | 542,427 | | 30,085 |
Bermuda - 1.0% |
African Minerals Ltd. (a) | 2,899,600 | | 20,599 |
Cheung Kong Infrastructure Holdings Ltd. | 6,530,000 | | 34,979 |
Li & Fung Ltd. | 9,616,000 | | 18,532 |
Noble Group Ltd. | 11,199,364 | | 13,670 |
TOTAL BERMUDA | | 87,780 |
Brazil - 2.1% |
Anhanguera Educacional Participacoes SA | 1,834,900 | | 26,981 |
Arezzo Industria e Comercio SA | 849,800 | | 11,234 |
Itau Unibanco Banco Multiplo SA sponsored ADR | 1,260,500 | | 24,101 |
Qualicorp SA | 4,305,000 | | 39,360 |
Souza Cruz Industria Comerico | 3,799,000 | | 46,592 |
TIM Participacoes SA sponsored ADR (d) | 1,447,849 | | 37,702 |
TOTAL BRAZIL | | 185,970 |
Common Stocks - continued |
| Shares | | Value (000s) |
British Virgin Islands - 0.5% |
Arcos Dorados Holdings, Inc. | 731,300 | | $ 17,112 |
Mail.ru Group Ltd. GDR (Reg. S) | 713,000 | | 24,563 |
TOTAL BRITISH VIRGIN ISLANDS | | 41,675 |
Canada - 1.2% |
Canadian Natural Resources Ltd. | 573,500 | | 20,228 |
InterOil Corp. (a)(d) | 204,400 | | 9,711 |
Open Text Corp. (a)(d) | 769,600 | | 47,102 |
Trinidad Drilling Ltd. | 3,430,500 | | 26,842 |
TOTAL CANADA | | 103,883 |
Cayman Islands - 2.8% |
Airtac International Group | 2,543,000 | | 14,233 |
Belle International Holdings Ltd. | 10,683,000 | | 20,952 |
Biostime International Holdings Ltd. | 8,183,000 | | 14,593 |
Bosideng International Holdings Ltd. | 43,814,000 | | 12,078 |
China Kanghui Holdings sponsored ADR (a)(d) | 1,747,000 | | 27,375 |
China Mengniu Dairy Co. Ltd. | 6,180,000 | | 19,693 |
China ZhengTong Auto Services Holdings Ltd. | 14,117,500 | | 15,287 |
Ctrip.com International Ltd. sponsored ADR (a) | 915,000 | | 31,897 |
Hengdeli Holdings Ltd. | 28,576,000 | | 12,811 |
Microport Scientific Corp. | 8,277,000 | | 4,678 |
Sands China Ltd. (a) | 17,144,800 | | 51,523 |
Shenguan Holdings Group Ltd. | 35,412,000 | | 19,025 |
TOTAL CAYMAN ISLANDS | | 244,145 |
China - 1.3% |
Baidu.com, Inc. sponsored ADR (a) | 394,600 | | 55,315 |
China Telecom Corp. Ltd. (H Shares) | 41,444,000 | | 25,588 |
SINA Corp. (a)(d) | 310,200 | | 25,216 |
Zhaojin Mining Industry Co. Ltd. (H Shares) | 4,984,000 | | 8,898 |
TOTAL CHINA | | 115,017 |
Cyprus - 0.0% |
Aisi Realty Public Ltd. (a)(e) | 216,330 | | 240 |
Denmark - 2.2% |
Novo Nordisk A/S Series B | 1,029,289 | | 109,293 |
William Demant Holding A/S (a) | 984,500 | | 78,551 |
TOTAL DENMARK | | 187,844 |
Common Stocks - continued |
| Shares | | Value (000s) |
Finland - 0.7% |
Amer Group PLC (A Shares) | 1,325,300 | | $ 18,322 |
Nokian Tyres PLC | 1,213,133 | | 44,574 |
TOTAL FINLAND | | 62,896 |
France - 9.1% |
Air Liquide SA | 307,100 | | 39,843 |
Arkema SA | 436,670 | | 29,874 |
Atos Origin SA | 1,058,073 | | 51,279 |
AXA SA | 3,922,902 | | 63,898 |
BNP Paribas SA | 1,322,566 | | 60,125 |
Club Mediterranee SA (a) | 470,000 | | 8,917 |
Danone | 1,265,300 | | 88,078 |
Iliad SA | 625,259 | | 73,187 |
Ipsos SA | 54,516 | | 1,790 |
JC Decaux SA (a) | 652,300 | | 17,481 |
LVMH Moet Hennessy - Louis Vuitton | 621,877 | | 103,489 |
Pernod-Ricard SA | 329,525 | | 30,782 |
PPR SA | 398,700 | | 62,294 |
Safran SA | 714,800 | | 23,415 |
Sanofi-aventis | 953,011 | | 68,187 |
Schneider Electric SA | 529,528 | | 31,255 |
Societe Generale Series A | 685,447 | | 20,015 |
Unibail-Rodamco | 118,400 | | 23,677 |
TOTAL FRANCE | | 797,586 |
Germany - 5.1% |
Aareal Bank AG (a) | 1,131,037 | | 22,993 |
Allianz AG | 325,100 | | 36,537 |
Bayer AG | 767,558 | | 49,176 |
Bayerische Motoren Werke AG (BMW) | 834,676 | | 68,221 |
Commerzbank AG (a) | 4,229,500 | | 10,436 |
Deutsche Bank AG | 1,018,100 | | 42,103 |
Fresenius Medical Care AG & Co. KGaA | 940,100 | | 68,492 |
GEA Group AG | 992,880 | | 27,433 |
Gerry Weber International AG (Bearer) | 320,600 | | 9,983 |
Kabel Deutschland Holding AG (a) | 1,085,800 | | 61,999 |
Siemens AG | 475,549 | | 49,855 |
TOTAL GERMANY | | 447,228 |
Hong Kong - 1.5% |
AIA Group Ltd. | 13,058,400 | | 39,929 |
China Unicom (Hong Kong) Ltd. | 12,452,000 | | 25,036 |
Common Stocks - continued |
| Shares | | Value (000s) |
Hong Kong - continued |
I.T Ltd. | 14,631,000 | | $ 9,112 |
Techtronic Industries Co. Ltd. | 65,201,500 | | 56,415 |
TOTAL HONG KONG | | 130,492 |
India - 1.6% |
Apollo Hospitals Enterprise Ltd. | 1,432,254 | | 15,263 |
Bharti Airtel Ltd. | 5,744,231 | | 46,004 |
Housing Development Finance Corp. Ltd. | 2,696,342 | | 37,945 |
Larsen & Toubro Ltd. | 279,321 | | 8,057 |
Shriram Transport Finance Co. Ltd. | 732,049 | | 9,165 |
The Jammu & Kashmir Bank Ltd. | 545,569 | | 9,407 |
Titan Industries Ltd. | 3,211,760 | | 14,263 |
TOTAL INDIA | | 140,104 |
Indonesia - 0.6% |
PT Astra International Tbk | 1,338,500 | | 10,321 |
PT Sarana Menara Nusantara Tbk (a) | 13,136,500 | | 13,282 |
PT Tower Bersama Infrastructure Tbk | 55,223,500 | | 12,852 |
PT XL Axiata Tbk | 22,623,000 | | 12,653 |
TOTAL INDONESIA | | 49,108 |
Ireland - 1.4% |
Accenture PLC Class A | 719,100 | | 43,333 |
James Hardie Industries NV CDI (a) | 5,530,462 | | 35,824 |
Kenmare Resources PLC (a) | 5,264,162 | | 3,435 |
Paddy Power PLC (Ireland) | 728,700 | | 40,338 |
TOTAL IRELAND | | 122,930 |
Israel - 0.6% |
Check Point Software Technologies Ltd. (a) | 517,600 | | 29,829 |
Israel Chemicals Ltd. | 1,513,500 | | 18,212 |
TOTAL ISRAEL | | 48,041 |
Italy - 1.4% |
Intesa Sanpaolo SpA | 8,188,112 | | 14,629 |
Prada SpA | 2,305,100 | | 11,395 |
Prysmian SpA | 1,473,800 | | 22,334 |
Saipem SpA | 1,580,606 | | 70,872 |
TOTAL ITALY | | 119,230 |
Japan - 15.8% |
ABC-Mart, Inc. | 1,529,000 | | 59,886 |
Aozora Bank Ltd. | 4,562,000 | | 11,534 |
Common Stocks - continued |
| Shares | | Value (000s) |
Japan - continued |
Asics Corp. | 3,605,000 | | $ 47,798 |
Calbee, Inc. (d) | 700,800 | | 31,951 |
Canon, Inc. | 1,744,350 | | 79,200 |
Cosmos Pharmaceutical Corp. | 859,200 | | 39,858 |
Credit Saison Co. Ltd. | 1,323,500 | | 25,830 |
DeNA Co. Ltd. | 336,000 | | 14,504 |
Denso Corp. | 1,300,300 | | 39,994 |
Digital Garage, Inc. (a) | 2,715 | | 8,890 |
Don Quijote Co. Ltd. | 1,367,200 | | 50,088 |
Fanuc Corp. | 381,000 | | 61,612 |
Honda Motor Co. Ltd. | 1,966,400 | | 58,810 |
Japan Retail Fund Investment Corp. | 1,225 | | 1,897 |
Japan Tobacco, Inc. | 22,266 | | 111,303 |
JS Group Corp. | 1,457,600 | | 30,569 |
JSR Corp. | 2,283,400 | | 43,596 |
Kakaku.com, Inc. | 810,600 | | 32,100 |
KDDI Corp. | 10,315 | | 75,571 |
Keyence Corp. | 192,600 | | 48,967 |
Misumi Group, Inc. | 1,254,900 | | 26,114 |
Mitsubishi Corp. | 2,574,400 | | 52,954 |
Mitsubishi Estate Co. Ltd. | 1,553,000 | | 26,307 |
Mitsubishi UFJ Financial Group, Inc. | 15,161,400 | | 65,899 |
ORIX Corp. | 1,321,050 | | 115,310 |
Rakuten, Inc. | 68,670 | | 75,288 |
So-net M3, Inc. (d) | 5,296 | | 23,954 |
SOFTBANK CORP. | 1,375,900 | | 44,661 |
Start Today Co. Ltd. | 2,740,800 | | 57,987 |
Tokyo Electron Ltd. | 309,600 | | 16,468 |
TOTAL JAPAN | | 1,378,900 |
Korea (South) - 2.5% |
Hyundai Motor Co. | 209,530 | | 42,040 |
Kia Motors Corp. | 453,500 | | 28,966 |
LG Household & Health Care Ltd. | 49,310 | | 22,187 |
NHN Corp. (a) | 64,289 | | 13,362 |
Orion Corp. | 113,331 | | 60,574 |
Samsung Electronics Co. Ltd. | 38,175 | | 32,741 |
Shinhan Financial Group Co. Ltd. | 421,030 | | 16,710 |
TOTAL KOREA (SOUTH) | | 216,580 |
Luxembourg - 1.3% |
Brait SA | 5,949,360 | | 14,243 |
Common Stocks - continued |
| Shares | | Value (000s) |
Luxembourg - continued |
Millicom International Cellular SA | 190,400 | | $ 20,925 |
Millicom International Cellular SA (depositary receipt) | 477,100 | | 52,580 |
Samsonite International SA | 14,826,300 | | 24,124 |
TOTAL LUXEMBOURG | | 111,872 |
Mexico - 0.5% |
Wal-Mart de Mexico SA de CV Series V | 18,209,000 | | 47,039 |
Netherlands - 3.4% |
AEGON NV (a) | 5,028,800 | | 23,986 |
ASML Holding NV | 971,700 | | 40,743 |
Gemalto NV | 1,818,979 | | 82,995 |
ING Groep NV (Certificaten Van Aandelen) (a) | 11,511,300 | | 99,253 |
Koninklijke Philips Electronics NV | 1,247,700 | | 25,977 |
Randstad Holdings NV | 726,367 | | 25,910 |
TOTAL NETHERLANDS | | 298,864 |
Norway - 1.1% |
Aker Solutions ASA | 1,927,748 | | 22,419 |
DnB NOR ASA | 6,602,355 | | 77,021 |
TOTAL NORWAY | | 99,440 |
Philippines - 0.3% |
Alliance Global Group, Inc. | 101,250,000 | | 25,173 |
Poland - 0.3% |
Eurocash SA | 3,593,990 | | 28,816 |
Qatar - 0.3% |
Commercial Bank of Qatar GDR (Reg. S) | 5,094,802 | | 23,366 |
South Africa - 1.0% |
AngloGold Ashanti Ltd. sponsored ADR | 816,100 | | 36,896 |
Sanlam Ltd. | 5,826,600 | | 21,768 |
Shoprite Holdings Ltd. | 2,042,000 | | 29,926 |
TOTAL SOUTH AFRICA | | 88,590 |
Spain - 1.5% |
Banco Bilbao Vizcaya Argentaria SA | 1,836,204 | | 16,528 |
Banco Santander SA: | | | |
rights 10/31/11 | 6,080,392 | | 1,052 |
(Spain) | 6,080,392 | | 51,471 |
Inditex SA | 280,831 | | 25,557 |
Common Stocks - continued |
| Shares | | Value (000s) |
Spain - continued |
Prosegur Compania de Seguridad SA (Reg.) | 382,900 | | $ 19,103 |
Viscofan Envolturas Celulosicas SA | 515,100 | | 19,824 |
TOTAL SPAIN | | 133,535 |
Sweden - 1.3% |
Elekta AB (B Shares) | 316,100 | | 12,650 |
Intrum Justitia AB | 111,800 | | 1,839 |
Meda AB (A Shares) | 1,713,200 | | 17,501 |
Swedbank AB (A Shares) | 3,382,000 | | 47,647 |
Swedish Match Co. | 1,052,600 | | 36,424 |
TOTAL SWEDEN | | 116,061 |
Switzerland - 6.8% |
Adecco SA (Reg.) | 548,529 | | 26,509 |
Compagnie Financiere Richemont SA Series A | 315,194 | | 18,049 |
Kuehne & Nagel International AG | 197,400 | | 24,586 |
Nestle SA | 2,973,853 | | 172,491 |
Partners Group Holding | 230,056 | | 43,125 |
Schindler Holding AG (participation certificate) | 554,147 | | 65,168 |
The Swatch Group AG (Bearer) | 98,950 | | 41,901 |
Transocean Ltd. (United States) | 829,400 | | 47,400 |
UBS AG (a) | 3,755,130 | | 47,472 |
UBS AG (NY Shares) (a) | 1,833,200 | | 23,135 |
Zurich Financial Services AG | 346,539 | | 80,479 |
TOTAL SWITZERLAND | | 590,315 |
Taiwan - 0.5% |
Catcher Technology Co. Ltd. | 5,046,500 | | 28,117 |
WPG Holding Co. Ltd. | 15,884,570 | | 19,181 |
TOTAL TAIWAN | | 47,298 |
Turkey - 0.1% |
Boyner Buyuk Magazacilik A/S (a)(e) | 6,011,100 | | 10,096 |
United Kingdom - 21.0% |
Aberdeen Asset Management PLC | 9,033,732 | | 27,966 |
Aggreko PLC | 484,300 | | 13,334 |
Anglo American PLC (United Kingdom) | 1,293,300 | | 47,702 |
Ashmore Group PLC | 3,169,400 | | 17,585 |
Aviva PLC | 6,344,300 | | 34,618 |
Barclays PLC | 22,562,258 | | 69,955 |
BG Group PLC | 5,124,372 | | 111,789 |
BHP Billiton PLC | 4,802,296 | | 151,250 |
Common Stocks - continued |
| Shares | | Value (000s) |
United Kingdom - continued |
BP PLC | 11,307,867 | | $ 83,228 |
British American Tobacco PLC (United Kingdom) | 3,366,600 | | 154,388 |
British Land Co. PLC | 5,756,734 | | 47,262 |
Burberry Group PLC | 1,970,900 | | 42,504 |
Carphone Warehouse Group PLC | 15,119,465 | | 85,346 |
Diageo PLC | 1,603,635 | | 33,195 |
GlaxoSmithKline PLC | 3,131,100 | | 70,282 |
HSBC Holdings PLC (United Kingdom) | 11,905,657 | | 103,900 |
Imperial Tobacco Group PLC | 1,488,285 | | 54,427 |
International Personal Finance PLC | 9,411,888 | | 41,503 |
Jazztel PLC (a)(d) | 3,802,400 | | 21,996 |
Legal & General Group PLC | 30,442,457 | | 54,098 |
Lloyds Banking Group PLC (a) | 49,557,364 | | 25,632 |
Micro Focus International PLC | 2,166,900 | | 11,834 |
National Grid PLC | 4,386,000 | | 43,614 |
Ocado Group PLC (a)(d) | 14,388,400 | | 21,670 |
Reckitt Benckiser Group PLC | 414,431 | | 21,314 |
Royal Dutch Shell PLC Class B | 6,770,160 | | 242,949 |
Royalblue Group PLC | 128,356 | | 3,358 |
SuperGroup PLC (a)(d) | 960,741 | | 9,641 |
The Weir Group PLC | 599,600 | | 18,504 |
Ultra Electronics Holdings PLC | 614,667 | | 15,737 |
Vodafone Group PLC | 46,662,143 | | 129,590 |
Xstrata PLC | 1,728,100 | | 29,056 |
TOTAL UNITED KINGDOM | | 1,839,227 |
United States of America - 1.9% |
Citrix Systems, Inc. (a) | 546,700 | | 39,816 |
Cognizant Technology Solutions Corp. Class A (a) | 298,200 | | 21,694 |
Green Mountain Coffee Roasters, Inc. (a) | 180,700 | | 11,749 |
MasterCard, Inc. Class A | 165,200 | | 57,364 |
Virgin Media, Inc. | 1,603,800 | | 39,101 |
TOTAL UNITED STATES OF AMERICA | | 169,724 |
TOTAL COMMON STOCKS (Cost $8,600,939) |
8,627,815
|
Nonconvertible Preferred Stocks - 1.3% |
| Shares | | Value (000s) |
Germany - 1.2% |
ProSiebenSat.1 Media AG | 40,648 | | $ 872 |
Volkswagen AG | 569,500 | | 99,935 |
TOTAL GERMANY | | 100,807 |
Italy - 0.1% |
Fiat Industrial SpA (a) | 2,156,296 | | 13,231 |
TOTAL NONCONVERTIBLE PREFERRED STOCKS (Cost $90,158) |
114,038
|
Money Market Funds - 1.2% |
| | | |
Fidelity Cash Central Fund, 0.12% (b) | 27,641,463 | | 27,641 |
Fidelity Securities Lending Cash Central Fund, 0.11% (b)(c) | 80,899,017 | | 80,899 |
TOTAL MONEY MARKET FUNDS (Cost $108,540) |
108,540
|
TOTAL INVESTMENT PORTFOLIO - 101.1% (Cost $8,799,637) | | 8,850,393 |
NET OTHER ASSETS (LIABILITIES) - (1.1)% | | (97,426) |
NET ASSETS - 100% | $ 8,752,967 |
Legend |
(a) Non-income producing |
(b) Affiliated fund that is available only to investment companies and other accounts managed by Fidelity Investments. The rate quoted is the annualized seven-day yield of the fund at period end. A complete unaudited listing of the fund's holdings as of its most recent quarter end is available upon request. In addition, each Fidelity Central Fund's financial statements, which are not covered by the Fund's Report of Independent Registered Public Accounting Firm, are available on the SEC's website or upon request. |
(c) Investment made with cash collateral received from securities on loan. |
(d) Security or a portion of the security is on loan at period end. |
(e) Affiliated company |
Affiliated Central Funds |
Information regarding fiscal year to date income earned by the Fund from investments in Fidelity Central Funds is as follows: |
Fund | Income earned
(Amounts in thousands) |
Fidelity Cash Central Fund | $ 112 |
Fidelity Securities Lending Cash Central Fund | 6,208 |
Total | $ 6,320 |
Other Affiliated Issuers |
An affiliated company is a company in which the Fund has ownership of at least 5% of the voting securities. Fiscal year to date transactions with companies which are or were affiliates are as follows: |
Affiliate
(Amounts in thousands) | Value, beginning of period | Purchases | Sales Proceeds | Dividend Income | Value,
end of
period |
Aisi Realty Public Ltd. | $ 607 | $ - | $ - | $ - | $ 240 |
Ashmore Global Opportunities Ltd. (United States) | - | 10,376 | - | 259 | - |
Boyner Buyuk Magazacilik A/S | 11,256 | 2,951 | - | - | 10,096 |
Total | $ 11,863 | $ 13,327 | $ - | $ 259 | $ 10,336 |
Other Information |
The following is a summary of the inputs used, as of October 31, 2011, involving the Fund's assets and liabilities carried at fair value. The inputs or methodology used for valuing securities may not be an indication of the risk associated with investing in those securities. For more information on valuation inputs, and their aggregation into the levels used in the tables below, please refer to the Security Valuation section in the accompanying Notes to Financial Statements. |
Valuation Inputs at Reporting Date: |
Description
(Amounts in thousands) | Total | Level 1 | Level 2 | Level 3 |
Investments in Securities: | | | | |
Equities: | | | | |
United Kingdom | $ 1,839,227 | $ 696,626 | $ 1,142,601 | $ - |
Japan | 1,378,900 | - | 1,378,900 | - |
France | 797,586 | 729,399 | 68,187 | - |
Switzerland | 590,315 | 542,843 | 47,472 | - |
Germany | 548,035 | 387,585 | 160,450 | - |
Australia | 303,569 | - | 303,569 | - |
Netherlands | 298,864 | 149,648 | 149,216 | - |
Cayman Islands | 244,145 | 59,272 | 184,873 | - |
Korea (South) | 216,580 | - | 216,580 | - |
Other | 2,524,632 | 1,704,716 | 819,916 | - |
Money Market Funds | 108,540 | 108,540 | - | - |
Total Investments in Securities: | $ 8,850,393 | $ 4,378,629 | $ 4,471,764 | $ - |
Transfers from Level 1 to Level 2 during the period were $1,331,743,000. |
The following is a reconciliation of Investments in Securities for which Level 3 inputs were used in determining value: |
(Amounts in thousands) | |
Investments in Securities: | |
Beginning Balance | $ 607 |
Total Realized Gain (Loss) | - |
Total Unrealized Gain (Loss) | - |
Cost of Purchases | - |
Proceeds of Sales | - |
Amortization/Accretion | - |
Transfers in to Level 3 | - |
Transfers out of Level 3 | (607) |
Ending Balance | $ - |
The change in unrealized gain (loss) for the period attributable to Level 3 securities held at October 31, 2011 | $ - |
The information used in the above reconciliation represents fiscal year to date activity for any Investments in Securities identified as using Level 3 inputs at either the beginning or the end of the current fiscal period. Transfers in or out of Level 3 represent the beginning value of any Security or Instrument where a change in the pricing level occurred from the beginning to the end of the period. The cost of purchases and the proceeds of sales may include securities received or delivered through corporate actions or exchanges. Realized and unrealized gains (losses) disclosed in the reconciliation are included in Net Gain (Loss) on the Fund's Statement of Operations. |
Income Tax Information |
At October 31, 2011, the Fund had a capital loss carryforward of approximately $1,349,541,000 all of which will expire in fiscal 2017. Capital loss carryforwards are only available to offset future capital gains of the Fund to the extent provided by regulations and may be limited. |
See accompanying notes which are an integral part of the financial statements.
Annual Report
Statement of Assets and Liabilities
Amounts in thousands (except per-share amounts) | October 31, 2011 |
| | |
Assets | | |
Investment in securities, at value (including securities loaned of $73,811) - See accompanying schedule: Unaffiliated issuers (cost $8,669,458) | $ 8,731,517 | |
Fidelity Central Funds (cost $108,540) | 108,540 | |
Other affiliated issuers (cost $21,639) | 10,336 | |
Total Investments (cost $8,799,637) | | $ 8,850,393 |
Foreign currency held at value (cost $37,392) | | 37,392 |
Receivable for investments sold | | 89,865 |
Receivable for fund shares sold | | 6,925 |
Dividends receivable | | 18,912 |
Distributions receivable from Fidelity Central Funds | | 280 |
Prepaid expenses | | 35 |
Other receivables | | 5,269 |
Total assets | | 9,009,071 |
| | |
Liabilities | | |
Payable to custodian bank | $ 756 | |
Payable for investments purchased | 155,082 | |
Payable for fund shares redeemed | 11,410 | |
Accrued management fee | 4,698 | |
Distribution and service plan fees payable | 125 | |
Other affiliated payables | 1,638 | |
Other payables and accrued expenses | 1,496 | |
Collateral on securities loaned, at value | 80,899 | |
Total liabilities | | 256,104 |
| | |
Net Assets | | $ 8,752,967 |
Net Assets consist of: | | |
Paid in capital | | $ 10,067,323 |
Undistributed net investment income | | 102,433 |
Accumulated undistributed net realized gain (loss) on investments and foreign currency transactions | | (1,466,813) |
Net unrealized appreciation (depreciation) on investments and assets and liabilities in foreign currencies | | 50,024 |
Net Assets | | $ 8,752,967 |
See accompanying notes which are an integral part of the financial statements.
Annual Report
Financial Statements - continued
Statement of Assets and Liabilities - continued
Amounts in thousands (except per-share amounts) | October 31, 2011 |
| | |
Calculation of Maximum Offering Price Class A: Net Asset Value and redemption price per share
($319,917 ÷ 10,869.3 shares) | | $ 29.43 |
| | |
Maximum offering price per share (100/94.25 of $29.43) | | $ 31.23 |
Class T:
Net Asset Value and redemption price per share ($60,905 ÷ 2,087.0 shares) | | $ 29.18 |
| | |
Maximum offering price per share (100/96.50 of $29.18) | | $ 30.24 |
Class B:
Net Asset Value and offering price per share
($10,183 ÷ 350.9 shares)A | | $ 29.02 |
| | |
Class C:
Net Asset Value and offering price per share
($32,911 ÷ 1,131.9 shares)A | | $ 29.08 |
| | |
International Discovery:
Net Asset Value, offering price and redemption price per share ($6,806,183 ÷ 229,250.8 shares) | | $ 29.69 |
| | |
Class K:
Net Asset Value, offering price and redemption price per share ($1,244,550 ÷ 41,955.8 shares) | | $ 29.66 |
| | |
Institutional Class:
Net Asset Value, offering price and redemption price per share ($278,318 ÷ 9,386.6 shares) | | $ 29.65 |
A Redemption price per share is equal to net asset value less any applicable contingent deferred sales charge.
See accompanying notes which are an integral part of the financial statements.
Annual Report
Statement of Operations
Amounts in thousands | Year ended October 31, 2011 |
| | |
Investment Income | | |
Dividends (including $259 earned from other affiliated issuers) | | $ 263,448 |
Interest | | 3 |
Income from Fidelity Central Funds | | 6,320 |
Income before foreign taxes withheld | | 269,771 |
Less foreign taxes withheld | | (16,970) |
Total income | | 252,801 |
| | |
Expenses | | |
Management fee
Basic fee | $ 69,910 | |
Performance adjustment | (475) | |
Transfer agent fees | 20,262 | |
Distribution and service plan fees | 1,864 | |
Accounting and security lending fees | 1,798 | |
Custodian fees and expenses | 1,713 | |
Independent trustees' compensation | 55 | |
Registration fees | 186 | |
Audit | 122 | |
Legal | 40 | |
Interest | 2 | |
Miscellaneous | 107 | |
Total expenses before reductions | 95,584 | |
Expense reductions | (4,391) | 91,193 |
Net investment income (loss) | | 161,608 |
Realized and Unrealized Gain (Loss) Net realized gain (loss) on: | | |
Investment securities: | | |
Unaffiliated issuers | 506,179 | |
Foreign currency transactions | (4,241) | |
Total net realized gain (loss) | | 501,938 |
Change in net unrealized appreciation (depreciation) on: Investment securities (net of decrease in deferred foreign taxes of $8,547) | (1,246,049) | |
Assets and liabilities in foreign currencies | (1,473) | |
Total change in net unrealized appreciation (depreciation) | | (1,247,522) |
Net gain (loss) | | (745,584) |
Net increase (decrease) in net assets resulting from operations | | $ (583,976) |
See accompanying notes which are an integral part of the financial statements.
Annual Report
Financial Statements - continued
Statement of Changes in Net Assets
Amounts in thousands | Year ended
October 31,
2011 | Year ended
October 31,
2010 |
Increase (Decrease) in Net Assets | | |
Operations | | |
Net investment income (loss) | $ 161,608 | $ 130,595 |
Net realized gain (loss) | 501,938 | 481,821 |
Change in net unrealized appreciation (depreciation) | (1,247,522) | 638,780 |
Net increase (decrease) in net assets resulting
from operations | (583,976) | 1,251,196 |
Distributions to shareholders from net investment income | (149,936) | (116,422) |
Distributions to shareholders from net realized gain | (48,090) | (13,374) |
Total distributions | (198,026) | (129,796) |
Share transactions - net increase (decrease) | (537,341) | (662,032) |
Redemption fees | 160 | 291 |
Total increase (decrease) in net assets | (1,319,183) | 459,659 |
| | |
Net Assets | | |
Beginning of period | 10,072,150 | 9,612,491 |
End of period (including undistributed net investment income of $102,433 and undistributed net investment income of $120,198, respectively) | $ 8,752,967 | $ 10,072,150 |
See accompanying notes which are an integral part of the financial statements.
Annual Report
Financial Highlights - Class A
Years ended October 31, | 2011 | 2010 | 2009 | 2008 | 2007 |
Selected Per-Share Data | | | | | |
Net asset value, beginning of period | $ 32.07 | $ 28.57 | $ 23.68 | $ 47.34 | $ 36.47 |
Income from Investment Operations | | | | | |
Net investment income (loss) C | .42 | .31 | .31 | .46 | .44 |
Net realized and unrealized gain (loss) | (2.52) | 3.51 | 4.84 | (22.08) | 11.76 |
Total from investment operations | (2.10) | 3.82 | 5.15 | (21.62) | 12.20 |
Distributions from net investment income | (.38) | (.28) | (.26) | (.37) | (.35) |
Distributions from net realized gain | (.16) | (.04) | - | (1.67) | (.98) |
Total distributions | (.54) | (.32) | (.26) | (2.04) | (1.33) |
Redemption fees added to paid in capital C,G | - | - | - | - | - |
Net asset value, end of period | $ 29.43 | $ 32.07 | $ 28.57 | $ 23.68 | $ 47.34 |
Total Return A,B | (6.71)% | 13.43% | 22.14% | (47.65)% | 34.54% |
Ratios to Average Net Assets D,F | | | | | |
Expenses before reductions | 1.30% | 1.33% | 1.37% | 1.32% | 1.25% |
Expenses net of fee waivers, if any | 1.29% | 1.33% | 1.37% | 1.32% | 1.25% |
Expenses net of all reductions | 1.25% | 1.28% | 1.32% | 1.29% | 1.22% |
Net investment income (loss) | 1.31% | 1.06% | 1.28% | 1.27% | 1.08% |
Supplemental Data | | | | | |
Net assets, end of period (in millions) | $ 320 | $ 392 | $ 414 | $ 380 | $ 417 |
Portfolio turnover rate E | 75% | 82% | 98% | 79% | 56% |
A Total returns would have been lower if certain expenses had not been reduced during the applicable periods shown.
B Total returns do not include the effect of the sales charges.
C Calculated based on average shares outstanding during the period.
D Fees and expenses of any underlying Fidelity Central Funds are not included in the Fund's expense ratio. The Fund indirectly bears its proportionate share of the expenses of any underlying Fidelity Central Funds.
E Amount does not include the portfolio activity of any underlying Fidelity Central Funds.
F Expense ratios reflect operating expenses of the class. Expenses before reductions do not reflect amounts reimbursed by the investment adviser or reductions from brokerage service arrangements or reductions from other expense offset arrangements and do not represent the amount paid by the class during periods when reimbursements or reductions occur. Expenses net of fee waivers reflect expenses after reimbursement by the investment adviser but prior to reductions from brokerage service arrangements or other expense offset arrangements. Expenses net of all reductions represent the net expenses paid by the class.
G Amount represents less than $.01 per share.
See accompanying notes which are an integral part of the financial statements.
Annual Report
Financial Highlights - Class T
Years ended October 31, | 2011 | 2010 | 2009 | 2008 | 2007 |
Selected Per-Share Data | | | | | |
Net asset value, beginning of period | $ 31.81 | $ 28.35 | $ 23.49 | $ 47.06 | $ 36.30 |
Income from Investment Operations | | | | | |
Net investment income (loss) C | .34 | .23 | .24 | .33 | .29 |
Net realized and unrealized gain (loss) | (2.51) | 3.48 | 4.81 | (21.94) | 11.71 |
Total from investment operations | (2.17) | 3.71 | 5.05 | (21.61) | 12.00 |
Distributions from net investment income | (.30) | (.21) | (.19) | (.29) | (.26) |
Distributions from net realized gain | (.16) | (.04) | - | (1.67) | (.98) |
Total distributions | (.46) | (.25) | (.19) | (1.96) | (1.24) |
Redemption fees added to paid in capital C,G | - | - | - | - | - |
Net asset value, end of period | $ 29.18 | $ 31.81 | $ 28.35 | $ 23.49 | $ 47.06 |
Total Return A,B | (6.96)% | 13.14% | 21.79% | (47.84)% | 34.08% |
Ratios to Average Net Assets D,F | | | | | |
Expenses before reductions | 1.56% | 1.60% | 1.65% | 1.68% | 1.63% |
Expenses net of fee waivers, if any | 1.55% | 1.60% | 1.65% | 1.68% | 1.63% |
Expenses net of all reductions | 1.51% | 1.56% | 1.60% | 1.64% | 1.60% |
Net investment income (loss) | 1.05% | .79% | 1.00% | .91% | .70% |
Supplemental Data | | | | | |
Net assets, end of period (in millions) | $ 61 | $ 92 | $ 83 | $ 64 | $ 53 |
Portfolio turnover rate E | 75% | 82% | 98% | 79% | 56% |
A Total returns would have been lower if certain expenses had not been reduced during the applicable periods shown.
B Total returns do not include the effect of the sales charges.
C Calculated based on average shares outstanding during the period.
D Fees and expenses of any underlying Fidelity Central Funds are not included in the Fund's expense ratio. The Fund indirectly bears its proportionate share of the expenses of any underlying Fidelity Central Funds.
E Amount does not include the portfolio activity of any underlying Fidelity Central Funds.
F Expense ratios reflect operating expenses of the class. Expenses before reductions do not reflect amounts reimbursed by the investment adviser or reductions from brokerage service arrangements or reductions from other expense offset arrangements and do not represent the amount paid by the class during periods when reimbursements or reductions occur. Expenses net of fee waivers reflect expenses after reimbursement by the investment adviser but prior to reductions from brokerage service arrangements or other expense offset arrangements. Expenses net of all reductions represent the net expenses paid by the class.
G Amount represents less than $.01 per share.
See accompanying notes which are an integral part of the financial statements.
Annual Report
Financial Highlights - Class B
Years ended October 31, | 2011 | 2010 | 2009 | 2008 | 2007 |
Selected Per-Share Data | | | | | |
Net asset value, beginning of period | $ 31.60 | $ 28.18 | $ 23.25 | $ 46.70 | $ 36.12 |
Income from Investment Operations | | | | | |
Net investment income (loss) C | .17 | .08 | .12 | .15 | .08 |
Net realized and unrealized gain (loss) | (2.48) | 3.44 | 4.81 | (21.77) | 11.64 |
Total from investment operations | (2.31) | 3.52 | 4.93 | (21.62) | 11.72 |
Distributions from net investment income | (.12) | (.06) | - | (.16) | (.16) |
Distributions from net realized gain | (.16) | (.04) | - | (1.67) | (.98) |
Total distributions | (.27) H | (.10) | - | (1.83) | (1.14) |
Redemption fees added to paid in capital C,G | - | - | - | - | - |
Net asset value, end of period | $ 29.02 | $ 31.60 | $ 28.18 | $ 23.25 | $ 46.70 |
Total Return A,B | (7.39)% | 12.52% | 21.20% | (48.11)% | 33.37% |
Ratios to Average Net Assets D,F | | | | | |
Expenses before reductions | 2.06% | 2.12% | 2.16% | 2.19% | 2.14% |
Expenses net of fee waivers, if any | 2.06% | 2.12% | 2.16% | 2.19% | 2.14% |
Expenses net of all reductions | 2.02% | 2.08% | 2.11% | 2.15% | 2.10% |
Net investment income (loss) | .54% | .27% | .49% | .40% | .19% |
Supplemental Data | | | | | |
Net assets, end of period (in millions) | $ 10 | $ 14 | $ 16 | $ 15 | $ 17 |
Portfolio turnover rate E | 75% | 82% | 98% | 79% | 56% |
A Total returns would have been lower if certain expenses had not been reduced during the applicable periods shown.
B Total returns do not include the effect of the contingent deferred sales charge.
C Calculated based on average shares outstanding during the period.
D Fees and expenses of any underlying Fidelity Central Funds are not included in the Fund's expense ratio. The Fund indirectly bears its proportionate share of the expenses of any underlying Fidelity Central Funds.
E Amount does not include the portfolio activity of any underlying Fidelity Central Funds.
F Expense ratios reflect operating expenses of the class. Expenses before reductions do not reflect amounts reimbursed by the investment adviser or reductions from brokerage service arrangements or reductions from other expense offset arrangements and do not represent the amount paid by the class during periods when reimbursements or reductions occur. Expenses net of fee waivers reflect expenses after reimbursement by the investment adviser but prior to reductions from brokerage service arrangements or other expense offset arrangements. Expenses net of all reductions represent the net expenses paid by the class.
G Amount represents less than $.01 per share.
H Total distributions of $.27 per share is comprised of distributions from net investment income of $.115 and distributions from net realized gain of $.155 per share.
See accompanying notes which are an integral part of the financial statements.
Annual Report
Financial Highlights - Class C
Years ended October 31, | 2011 | 2010 | 2009 | 2008 | 2007 |
Selected Per-Share Data | | | | | |
Net asset value, beginning of period | $ 31.68 | $ 28.23 | $ 23.31 | $ 46.82 | $ 36.19 |
Income from Investment Operations | | | | | |
Net investment income (loss) C | .18 | .09 | .12 | .15 | .09 |
Net realized and unrealized gain (loss) | (2.49) | 3.45 | 4.82 | (21.82) | 11.66 |
Total from investment operations | (2.31) | 3.54 | 4.94 | (21.67) | 11.75 |
Distributions from net investment income | (.14) | (.05) | (.02) | (.17) | (.14) |
Distributions from net realized gain | (.16) | (.04) | - | (1.67) | (.98) |
Total distributions | (.29) H | (.09) | (.02) | (1.84) | (1.12) |
Redemption fees added to paid in capital C,G | - | - | - | - | - |
Net asset value, end of period | $ 29.08 | $ 31.68 | $ 28.23 | $ 23.31 | $ 46.82 |
Total Return A,B | (7.37)% | 12.54% | 21.22% | (48.10)% | 33.38% |
Ratios to Average Net Assets D,F | | | | | |
Expenses before reductions | 2.05% | 2.09% | 2.14% | 2.17% | 2.11% |
Expenses net of fee waivers, if any | 2.04% | 2.09% | 2.14% | 2.17% | 2.11% |
Expenses net of all reductions | 2.00% | 2.05% | 2.09% | 2.13% | 2.08% |
Net investment income (loss) | .56% | .30% | .51% | .42% | .22% |
Supplemental Data | | | | | |
Net assets, end of period (in millions) | $ 33 | $ 44 | $ 43 | $ 36 | $ 28 |
Portfolio turnover rate E | 75% | 82% | 98% | 79% | 56% |
A Total returns would have been lower if certain expenses had not been reduced during the applicable periods shown.
B Total returns do not include the effect of the contingent deferred sales charge.
C Calculated based on average shares outstanding during the period.
D Fees and expenses of any underlying Fidelity Central Funds are not included in the Fund's expense ratio. The Fund indirectly bears its proportionate share of the expenses of any underlying Fidelity Central Funds.
E Amount does not include the portfolio activity of any underlying Fidelity Central Funds.
F Expense ratios reflect operating expenses of the class. Expenses before reductions do not reflect amounts reimbursed by the investment adviser or reductions from brokerage service arrangements or reductions from other expense offset arrangements and do not represent the amount paid by the class during periods when reimbursements or reductions occur. Expenses net of fee waivers reflect expenses after reimbursement by the investment adviser but prior to reductions from brokerage service arrangements or other expense offset arrangements. Expenses net of all reductions represent the net expenses paid by the class.
G Amount represents less than $.01 per share.
H Total distributions of $.29 per share is comprised of distributions from net investment income of $.137 and distributions from net realized gain of $.155 per share.
See accompanying notes which are an integral part of the financial statements.
Annual Report
Financial Highlights - International Discovery
Years ended October 31, | 2011 | 2010 | 2009 | 2008 | 2007 |
Selected Per-Share Data | | | | | |
Net asset value, beginning of period | $ 32.34 | $ 28.79 | $ 23.88 | $ 47.68 | $ 36.67 |
Income from Investment Operations | | | | | |
Net investment income (loss) B | .53 | .40 | .37 | .57 | .53 |
Net realized and unrealized gain (loss) | (2.54) | 3.54 | 4.88 | (22.29) | 11.84 |
Total from investment operations | (2.01) | 3.94 | 5.25 | (21.72) | 12.37 |
Distributions from net investment income | (.48) | (.35) | (.34) | (.41) | (.38) |
Distributions from net realized gain | (.16) | (.04) | - | (1.67) | (.98) |
Total distributions | (.64) | (.39) | (.34) | (2.08) | (1.36) |
Redemption fees added to paid in capital B,F | - | - | - | - | - |
Net asset value, end of period | $ 29.69 | $ 32.34 | $ 28.79 | $ 23.88 | $ 47.68 |
Total Return A | (6.39)% | 13.76% | 22.47% | (47.55)% | 34.85% |
Ratios to Average Net Assets C,E | | | | | |
Expenses before reductions | .97% | 1.05% | 1.12% | 1.09% | 1.04% |
Expenses net of fee waivers, if any | .96% | 1.05% | 1.12% | 1.09% | 1.04% |
Expenses net of all reductions | .92% | 1.00% | 1.07% | 1.05% | 1.00% |
Net investment income (loss) | 1.64% | 1.35% | 1.53% | 1.51% | 1.30% |
Supplemental Data | | | | | |
Net assets, end of period (in millions) | $ 6,806 | $ 8,133 | $ 8,114 | $ 6,999 | $ 14,176 |
Portfolio turnover rate D | 75% | 82% | 98% | 79% | 56% |
A Total returns would have been lower if certain expenses had not been reduced during the applicable periods shown.
B Calculated based on average shares outstanding during the period.
C Fees and expenses of any underlying Fidelity Central Funds are not included in the Fund's expense ratio. The Fund indirectly bears its proportionate share of the expenses of any underlying Fidelity Central Funds.
D Amount does not include the portfolio activity of any underlying Fidelity Central Funds.
E Expense ratios reflect operating expenses of the class. Expenses before reductions do not reflect amounts reimbursed by the investment adviser or reductions from brokerage service arrangements or reductions from other expense offset arrangements and do not represent the amount paid by the class during periods when reimbursements or reductions occur. Expenses net of fee waivers reflect expenses after reimbursement by the investment adviser but prior to reductions from brokerage service arrangements or other expense offset arrangements. Expenses net of all reductions represent the net expenses paid by the class.
F Amount represents less than $.01 per share.
See accompanying notes which are an integral part of the financial statements.
Annual Report
Financial Highlights - Class K
Years ended October 31, | 2011 | 2010 | 2009 | 2008 G |
Selected Per-Share Data | | | | |
Net asset value, beginning of period | $ 32.32 | $ 28.78 | $ 23.90 | $ 40.32 |
Income from Investment Operations | | | | |
Net investment income (loss) D | .58 | .46 | .44 | .10 |
Net realized and unrealized gain (loss) | (2.54) | 3.53 | 4.86 | (16.52) |
Total from investment operations | (1.96) | 3.99 | 5.30 | (16.42) |
Distributions from net investment income | (.55) | (.41) | (.42) | - |
Distributions from net realized gain | (.16) | (.04) | - | - |
Total distributions | (.70)J | (.45) | (.42) | - |
Redemption fees added to paid in capital D,I | - | - | - | - |
Net asset value, end of period | $ 29.66 | $ 32.32 | $ 28.78 | $ 23.90 |
Total Return B,C | (6.24)% | 13.96% | 22.80% | (40.72)% |
Ratios to Average Net Assets E,H | | | | |
Expenses before reductions | .80% | .84% | .88% | .93% A |
Expenses net of fee waivers, if any | .79% | .84% | .88% | .93% A |
Expenses net of all reductions | .75% | .79% | .83% | .89% A |
Net investment income (loss) | 1.81% | 1.55% | 1.77% | .83% A |
Supplemental Data | | | | |
Net assets, end of period (in millions) | $ 1,245 | $ 1,078 | $ 674 | $ 145 |
Portfolio turnover rate F | 75% | 82% | 98% | 79% |
A Annualized
B Total returns for periods of less than one year are not annualized.
C Total returns would have been lower if certain expenses had not been reduced during the applicable periods shown.
D Calculated based on average shares outstanding during the period.
E Fees and expenses of any underlying Fidelity Central Funds are not included in the Fund's expense ratio. The Fund indirectly bears its proportionate share of the expenses of any underlying Fidelity Central Funds.
F Amount does not include the portfolio activity of any underlying Fidelity Central Funds.
G For the period May 9, 2008 (commencement of sale of shares) to October 31, 2008.
H Expense ratios reflect operating expenses of the class. Expenses before reductions do not reflect amounts reimbursed by the investment adviser or reductions from brokerage service arrangements or reductions from other expense offset arrangements and do not represent the amount paid by the class during periods when reimbursements or reductions occur. Expense ratios before reductions for start-up periods may not be representative of longer-term operating periods. Expenses net of fee waivers reflect expenses after reimbursement by the investment adviser but prior to reductions from brokerage service arrangements or other expense offset arrangements. Expenses net of all reductions represent the net expenses paid by the class.
I Amount represents less than $.01 per share.
J Total distributions of $.70 per share is comprised of distributions from net investment income of $.548 and distributions from net realized gain of $.155 per share.
See accompanying notes which are an integral part of the financial statements.
Annual Report
Financial Highlights - Institutional Class
Years ended October 31, | 2011 | 2010 | 2009 | 2008 | 2007 |
Selected Per-Share Data | | | | | |
Net asset value, beginning of period | $ 32.31 | $ 28.77 | $ 23.91 | $ 47.73 | $ 36.71 |
Income from Investment Operations | | | | | |
Net investment income (loss) B | .54 | .41 | .39 | .53 | .55 |
Net realized and unrealized gain (loss) | (2.55) | 3.55 | 4.86 | (22.24) | 11.85 |
Total from investment operations | (2.01) | 3.96 | 5.25 | (21.71) | 12.40 |
Distributions from net investment income | (.50) | (.38) | (.39) | (.44) | (.40) |
Distributions from net realized gain | (.16) | (.04) | - | (1.67) | (.98) |
Total distributions | (.65) G | (.42) | (.39) | (2.11) | (1.38) |
Redemption fees added to paid in capital B,F | - | - | - | - | - |
Net asset value, end of period | $ 29.65 | $ 32.31 | $ 28.77 | $ 23.91 | $ 47.73 |
Total Return A | (6.39)% | 13.84% | 22.52% | (47.51)% | 34.93% |
Ratios to Average Net Assets C, E | | | | | |
Expenses before reductions | .95% | .99% | 1.05% | 1.05% | .97% |
Expenses net of fee waivers, if any | .94% | .99% | 1.05% | 1.05% | .97% |
Expenses net of all reductions | .90% | .95% | 1.00% | 1.01% | .94% |
Net investment income (loss) | 1.66% | 1.40% | 1.60% | 1.54% | 1.36% |
Supplemental Data | | | | | |
Net assets, end of period (in millions) | $ 278 | $ 319 | $ 267 | $ 159 | $ 58 |
Portfolio turnover rate D | 75% | 82% | 98% | 79% | 56% |
A Total returns would have been lower if certain expenses had not been reduced during the applicable periods shown.
B Calculated based on average shares outstanding during the period.
C Fees and expenses of any underlying Fidelity Central Funds are not included in the Fund's expense ratio. The Fund indirectly bears its proportionate share of the expenses of any underlying Fidelity Central Funds.
D Amount does not include the portfolio activity of any underlying Fidelity Central Funds.
E Expense ratios reflect operating expenses of the class. Expenses before reductions do not reflect amounts reimbursed by the investment adviser or reductions from brokerage service arrangements or reductions from other expense offset arrangements and do not represent the amount paid by the class during periods when reimbursements or reductions occur. Expenses net of fee waivers reflect expenses after reimbursement by the investment adviser but prior to reductions from brokerage service arrangements or other expense offset arrangements. Expenses net of all reductions represent the net expenses paid by the class.
F Amount represents less than $.01 per share.
G Total distributions of $.65 per share is comprised of distributions from net investment income of $.497 and distributions from net realized gain of $.155 per share.
See accompanying notes which are an integral part of the financial statements.
Annual Report
Notes to Financial Statements
For the period ended October 31, 2011
(Amounts in thousands except percentages)
1. Organization.
Fidelity International Discovery Fund (the Fund) is a fund of Fidelity Investment Trust (the Trust) and is authorized to issue an unlimited number of shares. The Trust is registered under the Investment Company Act of 1940, as amended (the 1940 Act), as an open-end management investment company organized as a Massachusetts business trust. The Fund offers Class A, Class T, Class C, International Discovery, Class K and Institutional Class shares, each of which, along with Class B shares, has equal rights as to assets and voting privileges. Effective after the close of business on September 1, 2010, Class B shares were closed to new accounts and additional purchases, except for exchanges and reinvestments by existing shareholders. Each class has exclusive voting rights with respect to matters that affect that class. Class B shares will automatically convert to Class A shares after a holding period of seven years from the initial date of purchase. Investment income, realized and unrealized capital gains and losses, the common expenses of the Fund, and certain fund-level expense reductions, if any, are allocated on a pro-rata basis to each class based on the relative net assets of each class to the total net assets of the Fund. Each class differs with respect to transfer agent and distribution and service plan fees incurred. Certain expense reductions may also differ by class. The Fund's investments in emerging markets can be subject to social, economic, regulatory and political uncertainties and can be extremely volatile.
2. Investments in Fidelity Central Funds.
The Fund invests in Fidelity Central Funds, which are open-end investment companies available only to other investment companies and accounts managed by Fidelity Management & Research Company (FMR) and its affiliates. The Fund's Schedule of Investments lists each of the Fidelity Central Funds held as of period end, if any, as an investment of the Fund, but does not include the underlying holdings of each Fidelity Central Fund. As an Investing Fund, the Fund indirectly bears its proportionate share of the expenses of the underlying Fidelity Central Funds.
The Money Market Central Funds seek preservation of capital and current income and are managed by Fidelity Investments Money Management, Inc. (FIMM), an affiliate of FMR.
A complete unaudited list of holdings for each Fidelity Central Fund is available upon request or at the Securities and Exchange Commission (the SEC) web site at www.sec.gov. In addition, the financial statements of the Fidelity Central Funds, which are not covered by the Fund's Report of Independent Registered Public Accounting Firm, are available on the SEC web site or upon request.
Annual Report
Notes to Financial Statements - continued
(Amounts in thousands except percentages)
3. Significant Accounting Policies.
The financial statements have been prepared in conformity with accounting principles generally accepted in the United States of America (GAAP), which require management to make certain estimates and assumptions at the date of the financial statements. Actual results could differ from those estimates. Subsequent events, if any, through the date that the financial statements were issued have been evaluated in the preparation of the financial statements. The following summarizes the significant accounting policies of the Fund:
Security Valuation. Investments are valued as of 4:00 p.m. Eastern time on the last calendar day of the period. The Fund uses independent pricing services approved by the Board of Trustees to value its investments. When current market prices or quotations are not readily available or reliable, valuations may be determined in good faith in accordance with procedures adopted by the Board of Trustees. Factors used in determining value may include market or security specific events. The frequency with which these procedures are used cannot be predicted and they may be utilized to a significant extent. The value used for net asset value (NAV) calculation under these procedures may differ from published prices for the same securities.
The Fund categorizes the inputs to valuation techniques used to value its investments into a disclosure hierarchy consisting of three levels as shown below:
Level 1 - quoted prices in active markets for identical investments
Level 2 - other significant observable inputs (including quoted prices for similar investments, interest rates, prepayment speeds, etc.)
Level 3 - unobservable inputs (including the Fund's own assumptions based on the best information available)
Changes in valuation techniques may result in transfers in or out of an assigned level within the disclosure hierarchy. The aggregate value of investments by input level, as of October 31, 2011, as well as a roll forward of Level 3 securities, is included at the end of the Fund's Schedule of Investments. Valuation techniques used to value the Fund's investments by major category are as follows:
Equity securities, including restricted securities, for which market quotations are readily available, are valued at the last reported sale price or official closing price as reported by an independent pricing service on the primary market or exchange on which they are traded and are categorized as Level 1 in the hierarchy. In the event there were no sales during the day or closing prices are not available, securities are valued at the last quoted bid price or may be valued using the last available price and are generally categorized as Level 2 in the hierarchy. For foreign equity securities, when significant market or security specific events arise, comparisons to the valuation of American Depositary Receipts
Annual Report
3. Significant Accounting Policies - continued
Security Valuation - continued
(ADRs), futures contracts, Exchange-traded funds (ETFs) and certain indexes as well as quoted prices for similar securities are used and are categorized as Level 2 in the hierarchy in these circumstances. Utilizing these techniques may result in transfers between Level 1 and Level 2. For restricted equity securities and private placements where observable inputs are limited, assumptions about market activity and risk are used and are categorized as Level 3 in the hierarchy.
Investments in open-end mutual funds, including the Fidelity Central Funds, are valued at their closing net asset value each business day and are categorized as Level 1 in the hierarchy.
Foreign Currency. The Fund may use foreign currency contracts to facilitate transactions in foreign-denominated securities. Gains and losses from these transactions may arise from changes in the value of the foreign currency or if the counterparties do not perform under the contracts' terms.
Foreign-denominated assets, including investment securities, and liabilities are translated into U.S. dollars at the exchange rate at period end. Purchases and sales of investment securities, income and dividends received and expenses denominated in foreign currencies are translated into U.S. dollars at the exchange rate in effect on the transaction date.
The effects of exchange rate fluctuations on investments are included with the net realized and unrealized gain (loss) on investment securities. Other foreign currency transactions resulting in realized and unrealized gain (loss) are disclosed separately.
Investment Transactions and Income. For financial reporting purposes, the Fund's investment holdings and NAV include trades executed through the end of the last business day of the period. The NAV per share for processing shareholder transactions is calculated as of the close of business of the New York Stock Exchange (NYSE), normally 4:00 p.m. Eastern time and includes trades executed through the end of the prior business day. Gains and losses on securities sold are determined on the basis of identified cost and may include proceeds received from litigation. Dividend income is recorded on the ex-dividend date, except for certain dividends from foreign securities where the ex-dividend date may have passed, which are recorded as soon as the Fund is informed of the ex-dividend date. Non-cash dividends included in dividend income, if any, are recorded at the fair market value of the securities received. Distributions received on securities that represent a return of capital or capital gain are recorded as a reduction of cost of investments and/or as a realized gain. The Fund estimates the components of distributions received that may be considered return of capital distributions or capital
Annual Report
Notes to Financial Statements - continued
(Amounts in thousands except percentages)
3. Significant Accounting Policies - continued
Investment Transactions and Income - continued
gain distributions. Interest income and distributions from the Fidelity Central Funds are accrued as earned. Interest income includes coupon interest and amortization of premium and accretion of discount on debt securities. Investment income is recorded net of foreign taxes withheld where recovery of such taxes is uncertain.
Expenses. Expenses directly attributable to a fund are charged to that fund. Expenses attributable to more than one fund are allocated among the respective funds on the basis of relative net assets or other appropriate methods. Expense estimates are accrued in the period to which they relate and adjustments are made when actual amounts are known.
Deferred Trustee Compensation. Under a Deferred Compensation Plan (the Plan), independent Trustees may elect to defer receipt of a portion of their annual compensation. Deferred amounts are invested in a cross-section of Fidelity funds, are marked-to-market and remain in the Fund until distributed in accordance with the Plan. The investment of deferred amounts and the offsetting payable to the Trustees are included in the accompanying Statement of Assets and Liabilities.
Income Tax Information and Distributions to Shareholders. Each year, the Fund intends to qualify as a regulated investment company, including distributing substantially all of its taxable income and realized gains under Subchapter M of the Internal Revenue Code and filing its U.S. federal tax return. As a result, no provision for income taxes is required. As of October 31, 2011, the Fund did not have any unrecognized tax benefits in the financial statements. A fund's federal tax return is subject to examination by the Internal Revenue Service (IRS) for a period of three years. Foreign taxes are provided for based on the Fund's understanding of the tax rules and rates that exist in the foreign markets in which it invests. The Fund is subject to a tax imposed on realized short term capital gains on securities of certain issuers domiciled in India. An estimated deferred tax liability for net unrealized gains on these securities is included in Other payables and accrued expenses on the Statement of Assets and Liabilities.
Distributions are declared and recorded on the ex-dividend date. Income dividends and capital gain distributions are declared separately for each class. Income and capital gain distributions are determined in accordance with income tax regulations, which may differ from GAAP.
Capital accounts within the financial statements are adjusted for permanent book-tax differences. These adjustments have no impact on net assets or the results of operations. Temporary book-tax differences will reverse in a subsequent period.
Annual Report
3. Significant Accounting Policies - continued
Income Tax Information and Distributions to Shareholders - continued
Book-tax differences are primarily due to foreign currency transactions, certain foreign taxes, passive foreign investment companies (PFIC), deferred trustees compensation, capital loss carryforwards and losses deferred due to wash sales.
The federal tax cost of investment securities and unrealized appreciation (depreciation) as of period end were as follows:
Gross unrealized appreciation | $ 930,158 |
Gross unrealized depreciation | (996,674) |
Net unrealized appreciation (depreciation) on securities and other investments | $ (66,516) |
| |
Tax Cost | $ 8,916,909 |
The tax-based components of distributable earnings as of period end were as follows:
Undistributed ordinary income | $ 102,538 |
Capital loss carryforward | $ (1,349,541) |
Net unrealized appreciation (depreciation) | $ (66,186) |
Under the recently enacted Regulated Investment Company Modernization Act of 2010 (the Act), the Fund will be permitted to carry forward capital losses incurred in taxable years beginning after December 22, 2010 for an unlimited period. However, any losses incurred during those future taxable years will be required to be utilized prior to any losses incurred in pre-enactment taxable years, which generally expire after eight years from when they are incurred. Additionally, post-enactment capital losses that are carried forward will retain their character as either short-term or long-term capital losses rather than being considered all short-term as under previous law. The Fund's first fiscal year end subject to the Act will be October 31, 2012.
The tax character of distributions paid was as follows:
| October 31, 2011 | October 31, 2010 |
Ordinary Income | $ 198,026 | $ 129,796 |
Annual Report
Notes to Financial Statements - continued
(Amounts in thousands except percentages)
3. Significant Accounting Policies - continued
Short-Term Trading (Redemption) Fees. Shares held by investors in the Fund less than 30 days are subject to a redemption fee equal to 1.00% of the net asset value of shares redeemed. All redemption fees, which reduce the proceeds of the shareholder redemption, are retained by the Fund and accounted for as an addition to paid in capital.
New Accounting Pronouncement. In May 2011, the Financial Accounting Standards Board issued Accounting Standard Update No. 2011-04, Fair Value Measurement (Topic 820) - Amendments to Achieve Common Fair Value Measurement and Disclosure Requirements in U.S. GAAP and IFRSs. The update changes the wording used to describe the requirements in GAAP for measuring fair value and for disclosing information about fair value measurements. The update is effective during interim and annual periods beginning after December 15, 2011. Management is currently evaluating the impact of the update's adoption on the Fund's financial statement disclosures.
4. Purchases and Sales of Investments.
Purchases and sales of securities, other than short-term securities, aggregated $7,388,928 and $7,826,467, respectively.
5. Fees and Other Transactions with Affiliates.
Management Fee. FMR and its affiliates provide the Fund with investment management related services for which the Fund pays a monthly management fee. The management fee is the sum of an individual fund fee rate that is based on an annual rate of .45% of the Fund's average net assets and a group fee rate that averaged .26% during the period. The group fee rate is based upon the average net assets of all the mutual funds advised by FMR. The group fee rate decreases as assets under management increase and increases as assets under management decrease. In addition, the management fee is subject to a performance adjustment (up to a maximum of ± .20% of the Fund's average net assets over a 36 month performance period). The upward or downward adjustment to the management fee is based on the relative investment performance of International Discovery as compared to an appropriate benchmark index. For the period, the total annual management fee rate, including the performance adjustment, was .70% of the Fund's average net assets.
Distribution and Service Plan Fees. In accordance with Rule 12b-1 of the 1940 Act, the Fund has adopted separate Distribution and Service Plans for each class of shares. Certain classes pay Fidelity Distributors Corporation (FDC), an affiliate of FMR, separate Distribution and Service Fees, each of which is based on an annual percentage of each class' average net assets. In addition, FDC may pay financial intermediaries for selling shares of the Fund and providing shareholder support services. For the period, the Distribution and Service Fee rates, total fees and amounts retained by FDC were as follows:
Annual Report
5. Fees and Other Transactions with Affiliates - continued
Distribution and Service Plan Fees - continued
| Distribution
Fee | Service
Fee | Total Fees | Retained
by FDC |
Class A | -% | .25% | $ 937 | $ 19 |
Class T | .25% | .25% | 398 | 1 |
Class B | .75% | .25% | 130 | 98 |
Class C | .75% | .25% | 399 | 30 |
| | | $ 1,864 | $ 148 |
Sales Load. FDC may receive a front-end sales charge of up to 5.75% for selling Class A shares, and 3.50% for selling Class T shares, some of which is paid to financial intermediaries for selling shares of the Fund. Depending on the holding period, FDC may receive contingent deferred sales charges levied on Class A, Class T, Class B, and Class C redemptions. The deferred sales charges range from 5% to 1% for Class B, 1% for Class C, 1.00% for certain purchases of Class A shares and .25% for certain purchases of Class T shares.
For the period, sales charge amounts retained by FDC were as follows:
| Retained
by FDC |
Class A | $ 56 |
Class T | 11 |
Class B* | 21 |
Class C* | 3 |
| $ 91 |
* When Class B and Class C shares are initially sold, FDC pays commissions from its own resources to financial intermediaries through which the sales are made.
Transfer Agent Fees. Fidelity Investments Institutional Operations Company, Inc. (FIIOC), an affiliate of FMR, is the transfer, dividend disbursing and shareholder servicing agent for each class of the Fund. FIIOC receives account fees and asset-based fees that vary according to the account size and type of account of the shareholders of the respective classes of the Fund, except for Class K. FIIOC receives an asset-based fee of Class K's average net assets. FIIOC pays for typesetting, printing and mailing of shareholder reports, except proxy statements. For the period, transfer agent fees for each class were as follows:
Annual Report
Notes to Financial Statements - continued
(Amounts in thousands except percentages)
5. Fees and Other Transactions with Affiliates - continued
Transfer Agent Fees - continued
| Amount | % of
Average
Net Assets |
Class A | $ 1,138 | .30 |
Class T | 248 | .31 |
Class B | 41 | .31 |
Class C | 121 | .30 |
International Discovery | 17,436 | .22 |
Class K | 638 | .05 |
Institutional Class | 640 | .20 |
| $ 20,262 | |
Accounting and Security Lending Fees. Fidelity Service Company, Inc. (FSC), an affiliate of FMR, maintains the Fund's accounting records. The accounting fee is based on the level of average net assets for the month. Under a separate contract, FSC administers the security lending program. The security lending fee is based on the number and duration of lending transactions.
Brokerage Commissions. The Fund placed a portion of its portfolio transactions with brokerage firms which are affiliates of the investment adviser. The commissions paid to these affiliated firms were $9 for the period.
Interfund Lending Program. Pursuant to an Exemptive Order issued by the SEC, the Fund, along with other registered investment companies having management contracts with FMR, may participate in an interfund lending program. This program provides an alternative credit facility allowing the funds to borrow from, or lend money to, other participating affiliated funds. At period end, there were no interfund loans outstanding. The Fund's activity in this program during the period for which loans were outstanding was as follows:
Borrower or Lender | Average Daily
Loan Balance | Weighted Average Interest Rate | Interest Expense |
Borrower | $ 13,706 | .41% | $ 2 |
Annual Report
6. Committed Line of Credit.
The Fund participates with other funds managed by FMR or an affiliate in a $4.0 billion credit facility (the "line of credit") to be utilized for temporary or emergency purposes to fund shareholder redemptions or for other short-term liquidity purposes. The Fund has agreed to pay commitment fees on its pro-rata portion of the line of credit, which amounted to $31 and is reflected in Miscellaneous expenses on the Statement of Operations. During the period, there were no borrowings on this line of credit.
7. Security Lending.
The Fund lends portfolio securities through a lending agent from time to time in order to earn additional income. For equity securities, a lending agent is used and may loan securities to certain qualified borrowers, including Fidelity Capital Markets (FCM), a broker-dealer affiliated with the Fund. On the settlement date of the loan, the Fund receives collateral (in the form of U.S. Treasury obligations, letters of credit and/or cash) against the loaned securities and maintains collateral in an amount not less than 100% of the market value of the loaned securities during the period of the loan. The market value of the loaned securities is determined at the close of business of the Fund and any additional required collateral is delivered to the Fund on the next business day. If the borrower defaults on its obligation to return the securities loaned because of insolvency or other reasons, a fund could experience delays and costs in recovering the securities loaned or in gaining access to the collateral. Any cash collateral received is the Fidelity Securities Lending Cash Central Fund. The value of loaned securities and cash collateral at period end are disclosed on the Fund's Statement of Assets and Liabilities. The value of securities loaned to FCM at period end was $2,654. Security lending income represents the income earned on investing cash collateral, less rebates paid to borrowers and any lending agent fees associated with the loan, plus any premium payments received for lending certain types of securities. Security lending income is presented in the Statement of Operations as a component of income from Fidelity Central Funds. Total security lending income during the period amounted to $6,208, including $213 from securities loaned to FCM.
8. Expense Reductions.
FMR voluntarily agreed to reimburse a portion of its management fee. For the period, the amount of this reimbursement was $507.
Many of the brokers with whom FMR places trades on behalf of the Fund provided services to the Fund in addition to trade execution. These services included payments of certain expenses on behalf of the Fund totaling $3,884 for the period.
Annual Report
Notes to Financial Statements - continued
(Amounts in thousands except percentages)
9. Distributions to Shareholders.
Distributions to shareholders of each class were as follows:
Years ended October 31, | 2011 | 2010 |
From net investment income | | |
Class A | $ 4,617 | $ 3,889 |
Class T | 859 | 633 |
Class B | 51 | 37 |
Class C | 184 | 71 |
International Discovery | 121,061 | 98,508 |
Class K | 18,291 | 9,602 |
Institutional Class | 4,873 | 3,682 |
Total | $ 149,936 | $ 116,422 |
From net realized gain | | |
Class A | $ 1,880 | $ 555 |
Class T | 439 | 119 |
Class B | 69 | 23 |
Class C | 209 | 61 |
International Discovery | 38,831 | 11,290 |
Class K | 5,143 | 935 |
Institutional Class | 1,519 | 391 |
Total | $ 48,090 | $ 13,374 |
10. Share Transactions.
Transactions for each class of shares were as follows:
| Shares | Dollars |
Years ended October 31, | 2011 | 2010 | 2011 | 2010 |
Class A | | | | |
Shares sold | 2,821 | 4,849 | $ 91,649 | $ 142,203 |
Reinvestment of distributions | 173 | 120 | 5,606 | 3,654 |
Shares redeemed | (4,335) | (7,259) | (139,721) | (215,574) |
Net increase (decrease) | (1,341) | (2,290) | $ (42,466) | $ (69,717) |
Class T | | | | |
Shares sold | 443 | 1,165 | $ 14,328 | $ 34,154 |
Reinvestment of distributions | 38 | 24 | 1,235 | 716 |
Shares redeemed | (1,286) | (1,228) | (41,028) | (35,631) |
Net increase (decrease) | (805) | (39) | $ (25,465) | $ (761) |
Class B | | | | |
Shares sold | 21 | 105 | $ 671 | $ 3,047 |
Reinvestment of distributions | 3 | 2 | 111 | 54 |
Shares redeemed | (130) | (227) | (4,124) | (6,544) |
Net increase (decrease) | (106) | (120) | $ (3,342) | $ (3,443) |
Annual Report
10. Share Transactions - continued
| Shares | Dollars |
Years ended October 31, | 2011 | 2010 | 2011 | 2010 |
Class C | | | | |
Shares sold | 183 | 356 | $ 5,847 | $ 10,567 |
Reinvestment of distributions | 11 | 4 | 344 | 116 |
Shares redeemed | (437) | (515) | (13,875) | (14,926) |
Net increase (decrease) | (243) | (155) | $ (7,684) | $ (4,243) |
International Discovery | | | | |
Shares sold | 32,543 | 55,460 | $ 1,052,266 | $ 1,640,231 |
Reinvestment of distributions | 4,718 | 3,453 | 153,551 | 105,461 |
Shares redeemed | (59,489) | (89,239) | (1,934,353) | (2,636,183) |
Net increase (decrease) | (22,228) | (30,326) | $ (728,536) | $ (890,491) |
Class K | | | | |
Shares sold | 18,148 | 16,961 | $ 593,408 | $ 491,304 |
Reinvestment of distributions | 722 | 346 | 23,434 | 10,537 |
Shares redeemed | (10,275) | (7,377) | (330,258) | (215,813) |
Net increase (decrease) | 8,595 | 9,930 | $ 286,584 | $ 286,028 |
Institutional Class | | | | |
Shares sold | 2,364 | 4,322 | $ 75,348 | $ 127,580 |
Reinvestment of distributions | 69 | 36 | 2,254 | 1,083 |
Shares redeemed | (2,923) | (3,773) | (94,034) | (108,068) |
Net increase (decrease) | (490) | 585 | $ (16,432) | $ 20,595 |
11. Other.
The Fund's organizational documents provide former and current trustees and officers with a limited indemnification against liabilities arising in connection with the performance of their duties to the Fund. In the normal course of business, the Fund may also enter into contracts that provide general indemnifications. The Fund's maximum exposure under these arrangements is unknown as this would be dependent on future claims that may be made against the Fund. The risk of material loss from such claims is considered remote.
Annual Report
To the Trustees of Fidelity Investment Trust and the Shareholders of Fidelity International Discovery Fund:
In our opinion, the accompanying statement of assets and liabilities, including the schedule of investments, and the related statements of operations and of changes in net assets and the financial highlights present fairly, in all material respects, the financial position of Fidelity International Discovery Fund (a fund of Fidelity Investment Trust) at October 31, 2011, the results of its operations for the year then ended, the changes in its net assets for each of the two years in the period then ended and the financial highlights for each of the periods indicated, in conformity with accounting principles generally accepted in the United States of America. These financial statements and financial highlights (hereafter referred to as "financial statements") are the responsibility of the Fidelity International Discovery Fund's management. Our responsibility is to express an opinion on these financial statements based on our audits. We conducted our audits of these financial statements in accordance with the standards of the Public Company Accounting Oversight Board (United States). Those standards require that we plan and perform the audit to obtain reasonable assurance about whether the financial statements are free of material misstatement. An audit includes examining, on a test basis, evidence supporting the amounts and disclosures in the financial statements, assessing the accounting principles used and significant estimates made by management, and evaluating the overall financial statement presentation. We believe that our audits, which included confirmation of securities at October 31, 2011 by correspondence with the custodian and brokers, provide a reasonable basis for our opinion.
PricewaterhouseCoopers LLP
Boston, Massachusetts
December 13, 2011
Annual Report
The Trustees, Members of the Advisory Board, and executive officers of the trust and fund, as applicable, are listed below. The Board of Trustees governs the fund and is responsible for protecting the interests of shareholders. The Trustees are experienced executives who meet periodically throughout the year to oversee the fund's activities, review contractual arrangements with companies that provide services to the fund, oversee management of the risks associated with such activities and contractual arrangements, and review the fund's performance. Except for James C. Curvey, each of the Trustees oversees 226 funds advised by FMR or an affiliate. Mr. Curvey oversees 429 funds advised by FMR or an affiliate.
The Trustees hold office without limit in time except that (a) any Trustee may resign; (b) any Trustee may be removed by written instrument, signed by at least two-thirds of the number of Trustees prior to such removal; (c) any Trustee who requests to be retired or who has become incapacitated by illness or injury may be retired by written instrument signed by a majority of the other Trustees; and (d) any Trustee may be removed at any special meeting of shareholders by a two-thirds vote of the outstanding voting securities of the trust. Each Trustee who is not an interested person (as defined in the 1940 Act) (Independent Trustee), shall retire not later than the last day of the calendar year in which his or her 75th birthday occurs. The Independent Trustees may waive this mandatory retirement age policy with respect to individual Trustees. The executive officers and Advisory Board Members hold office without limit in time, except that any officer and Advisory Board Member may resign or may be removed by a vote of a majority of the Trustees at any regular meeting or any special meeting of the Trustees. Except as indicated, each individual has held the office shown or other offices in the same company for the past five years.
Experience, Skills, Attributes, and Qualifications of the Fund's Trustees. The Governance and Nominating Committee has adopted a statement of policy that describes the experience, qualifications, attributes, and skills that are necessary and desirable for potential Independent Trustee candidates (Statement of Policy). The Board believes that each Trustee satisfied at the time he or she was initially elected or appointed a Trustee, and continues to satisfy, the standards contemplated by the Statement of Policy. The Governance and Nominating Committee also engages professional search firms to help identify potential Independent Trustee candidates who have the experience, qualifications, attributes, and skills consistent with the Statement of Policy. From time to time, additional criteria based on the composition and skills of the current Independent Trustees, as well as experience or skills that may be appropriate in light of future changes to board composition, business conditions, and regulatory or other developments, have also been considered by the professional search firms and the Governance and Nominating Committee. In addition, the Board takes into account the Trustees' commitment and participation in Board and committee meetings, as well as their leadership of standing and ad hoc committees throughout their tenure.
In determining that a particular Trustee was and continues to be qualified to serve as a Trustee, the Board has considered a variety of criteria, none of which, in isolation, was controlling. The Board believes that, collectively, the Trustees have balanced and diverse experience, qualifications, attributes, and skills, which allow the Board to operate effectively in governing the fund and protecting the interests of shareholders. Information about the specific experience, skills, attributes, and qualifications of each Trustee, which in each case led to the Board's conclusion that the Trustee should serve (or continue to serve) as a trustee of the fund, is provided below.
Annual Report
Board Structure and Oversight Function. James C. Curvey is an interested person (as defined in the 1940 Act) and currently serves as Acting Chairman. The Trustees have determined that an interested Chairman is appropriate and benefits shareholders because an interested Chairman has a personal and professional stake in the quality and continuity of services provided to the fund. Independent Trustees exercise their informed business judgment to appoint an individual of their choosing to serve as Chairman, regardless of whether the Trustee happens to be independent or a member of management. The Independent Trustees have determined that they can act independently and effectively without having an Independent Trustee serve as Chairman and that a key structural component for assuring that they are in a position to do so is for the Independent Trustees to constitute a substantial majority for the Board. The Independent Trustees also regularly meet in executive session. Ned C. Lautenbach serves as Chairman of the Independent Trustees and as such (i) acts as a liaison between the Independent Trustees and management with respect to matters important to the Independent Trustees and (ii) with management prepares agendas for Board meetings.
Fidelity funds are overseen by different Boards of Trustees. The fund's Board oversees Fidelity's equity and high income funds and another Board oversees Fidelity's investment-grade bond, money market, and asset allocation funds. The asset allocation funds may invest in Fidelity funds overseen by the fund's Board. The use of separate Boards, each with its own committee structure, allows the Trustees of each group of Fidelity funds to focus on the unique issues of the funds they oversee, including common research, investment, and operational issues. On occasion, the separate Boards establish joint committees to address issues of overlapping consequences for the Fidelity funds overseen by each Board.
The Trustees operate using a system of committees to facilitate the timely and efficient consideration of all matters of importance to the Trustees, the fund, and fund shareholders and to facilitate compliance with legal and regulatory requirements and oversight of the fund's activities and associated risks. The Board, acting through its committees, has charged FMR and its affiliates with (i) identifying events or circumstances the occurrence of which could have demonstrably adverse effects on the fund's business and/or reputation; (ii) implementing processes and controls to lessen the possibility that such events or circumstances occur or to mitigate the effects of such events or circumstances if they do occur; and (iii) creating and maintaining a system designed to evaluate continuously business and market conditions in order to facilitate the identification and implementation processes described in (i) and (ii) above. Because the day-to-day operations and activities of the fund are carried out by or through FMR, its affiliates and other service providers, the fund's exposure to risks is mitigated but not eliminated by the processes overseen by the Trustees. While each of the Board's committees has responsibility for overseeing different aspects of the fund's activities, oversight is exercised primarily through the Operations, Audit, and Compliance Committees. In addition, the Independent Trustees have worked with FMR to enhance the Board's oversight of investment and financial risks, legal and regulatory risks, technology risks, and operational risks, including the development of additional risk reporting to the Board. For example, a working group comprised of Independent Trustees and FMR has worked and continues to work to review the Fidelity funds' valuation-related activities, reporting and risk management. Appropriate personnel, including but not limited to the fund's Chief Compliance Officer (CCO), FMR's internal auditor, the independent accountants, the fund's Treasurer and portfolio management personnel, make periodic reports to the Board's committees, as appropriate, including an annual review of FMR's risk management program for the Fidelity funds. The responsibilities of each standing committee, including their oversight responsibilities, are described further under "Standing Committees of the Fund's Trustees."
Annual Report
Trustees and Officers - continued
The fund's Statement of Additional Information (SAI) includes more information about the Trustees. To request a free copy, call Fidelity at 1-877-208-0098.
Interested Trustees*:
Correspondence intended for each Trustee who is an interested person may be sent to Fidelity Investments, 82 Devonshire Street, Boston, Massachusetts 02109.
Name, Age; Principal Occupations and Other Relevant Experience+ |
James C. Curvey (76) |
| Year of Election or Appointment: 2007 Mr. Curvey is Trustee and Acting Chairman of the Board of Trustees of certain Trusts. Mr. Curvey also serves as Trustee (2007-present) of other investment companies advised by FMR. Mr. Curvey is a Director of Fidelity Investments Money Management, Inc. (2009-present), Director of Fidelity Research & Analysis Co. (2009-present) and Director of FMR and FMR Co., Inc. (2007-present). Mr. Curvey is also Vice Chairman (2007-present) and Director of FMR LLC. In addition, Mr. Curvey serves as an Overseer for the Boston Symphony Orchestra and a member of the Trustees of Villanova University. Previously, Mr. Curvey was the Vice Chairman (2006-2007) and Director (2000-2007) of FMR Corp. |
Ronald P. O'Hanley (54) |
| Year of Election or Appointment: 2011 Mr. O'Hanley is Director of FMR Co., Inc. (2010-present), Director of Fidelity Investments Money Management, Inc. (2010-present), Director of Fidelity Research & Analysis Company (2010-present), President of Fidelity Asset Management and Corporate Services and a member of Fidelity's Executive Committee (2010-present). Previously, Mr. O'Hanley served as President and Chief Executive Officer of BNY Mellon Asset Management (2007-2010). Mr. O'Hanley also served as Vice Chairman of Bank New York Mellon Corp. and a member of that firm's Executive Committee. Prior to the 2007 merger of The Bank of New York and Mellon Financial Corporation, he was Vice Chairman of Mellon Financial Corporation and President and Chief Executive Officer of Mellon Asset Management. He joined Mellon in February 1997. Mr. O'Hanley currently serves as Chairman of the Boston Public Library Foundation Board of Directors and sits on the Board of Directors of Beth Israel Deaconess Medical Center, the Board of Trustees of the Marine Biological Laboratory and the Advisory Board of the Maxwell School of Citizenship and Public Administration at Syracuse University. Mr. O'Hanley also chairs the Council on Asset Management for the Financial Services Roundtable and is a member of the Board of Directors of Institutional Investor's U.S. Institute. |
* Trustees have been determined to be "Interested Trustees" by virtue of, among other things, their affiliation with the trust or various entities under common control with FMR.
+ The information above includes each Trustee's principal occupation during the last five years and other information relating to the experience, attributes, and skills relevant to each Trustee's qualifications to serve as a Trustee, which led to the conclusion that each Trustee should serve as a Trustee for the fund.
Annual Report
Trustees and Officers - continued
Independent Trustees:
Correspondence intended for each Independent Trustee (that is, the Trustees other than the Interested Trustees) may be sent to Fidelity Investments, P.O. Box 55235, Boston, Massachusetts 02205-5235.
Name, Age; Principal Occupations and Other Relevant Experience+ |
Dennis J. Dirks (63) |
| Year of Election or Appointment: 2005 Prior to his retirement in May 2003, Mr. Dirks was Chief Operating Officer and a member of the Board of The Depository Trust & Clearing Corporation (DTCC). He also served as President, Chief Operating Officer, and Board member of The Depository Trust Company (DTC) and President and Board member of the National Securities Clearing Corporation (NSCC). In addition, Mr. Dirks served as Chief Executive Officer and Board member of the Government Securities Clearing Corporation, Chief Executive Officer and Board member of the Mortgage-Backed Securities Clearing Corporation, as a Trustee and a member of the Finance Committee of Manhattan College (2005-2008), and as a Trustee and a member of the Finance Committee of AHRC of Nassau County (2006-2008). Mr. Dirks is a member of the Independent Directors Council (IDC) Governing Council (2010-Present) and Board of Directors for The Brookville Center for Children's Services, Inc. (2009-present). |
Alan J. Lacy (58) |
| Year of Election or Appointment: 2008 Mr. Lacy serves as Senior Adviser (2007-present) of Oak Hill Capital Partners, L.P. (private equity). Mr. Lacy also served as Chief Executive Officer (2000-2005) and Vice Chairman (2005-2006) of Sears Holdings Corporation and Sears, Roebuck and Co. (retail). In addition, Mr. Lacy serves as a member of the Board of Directors of Dave & Buster's, Inc. (restaurant and entertainment complexes, 2010-present), The Hillman Companies, Inc. (hardware wholesalers, 2010-present), and Bristol-Myers Squibb Company (global pharmaceuticals, 2007-present). Mr. Lacy is a member of the Board of Trustees of The National Parks Conservation Association (2006-Present). Previously, Mr. Lacy served as Chairman of the Board of Trustees of the National Parks Conservation Association (2008-2011) and as a member of the Board of Directors for the Western Union Company (global money transfer, 2006-2011). |
Ned C. Lautenbach (67) |
| Year of Election or Appointment: 2000 Mr. Lautenbach is Chairman of the Independent Trustees of the Equity and High Income Funds (2006-present). Mr. Lautenbach currently serves as the Lead Director of the Eaton Corporation Board of Directors (diversified industrial, 1997-present). Mr. Lautenbach is also a member of the Board of Directors of the Philharmonic Center for the Arts in Naples, Florida (1999-present); a member of the Board of Trustees of Fairfield University (2005-present); and a member of the Council on Foreign Relations (1994-present). Previously, Mr. Lautenbach was a Partner/Advisory Partner at Clayton, Dubilier & Rice, LLC (private equity investment, 1998-2010), as well as a Director of Sony Corporation (2006-2007). |
Joseph Mauriello (67) |
| Year of Election or Appointment: 2008 Prior to his retirement in January 2006, Mr. Mauriello served in numerous senior management positions including Deputy Chairman and Chief Operating Officer (2004-2005), and Vice Chairman of Financial Services (2002-2004) of KPMG LLP US (professional services, 1965-2005). Mr. Mauriello currently serves as a member of the Board of Directors of XL Group plc. (global insurance and re-insurance, 2006-present) and of Arcadia Resources Inc. (health care services and products, 2007-present). Previously, Mr. Mauriello served as a Director of the Hamilton Funds of the Bank of New York (2006-2007). |
Robert W. Selander (61) |
| Year of Election or Appointment: 2011 Previously, Mr. Selander served as a Member of the Advisory Board of Fidelity's Equity and High Income Funds (2011), Executive Vice Chairman (2010), Chief Executive Officer (2009-2010), and President and Chief Executive Officer (1997-2009) of Mastercard, Inc. |
Cornelia M. Small (67) |
| Year of Election or Appointment: 2005 Ms. Small is a member of the Board of Directors of the Teagle Foundation (2009-present). Ms. Small is also a member of the Investment Committee, and Chair (2008-present) and a member of the Board of Trustees of Smith College. In addition, Ms. Small serves on the Investment Committee of the Berkshire Taconic Community Foundation (2008-present). Previously, Ms. Small served as Chairperson of the Investment Committee (2002-2008) of Smith College. In addition, Ms. Small served as Chief Investment Officer, Director of Global Equity Investments, and a member of the Board of Directors of Scudder, Stevens & Clark and Scudder Kemper Investments. |
William S. Stavropoulos (72) |
| Year of Election or Appointment: 2001 Mr. Stavropoulos is Vice Chairman of the Independent Trustees of the Equity and High Income Funds (2006-present). Mr. Stavropoulos serves as President and Founder of the Michigan Baseball Foundation, the Great Lakes Loons (2007-present). Mr. Stavropoulos is Chairman Emeritus of the Board of Directors of The Dow Chemical Company, where he previously served in numerous senior management positions, including President, CEO (1995-2000; 2002-2004), Chairman of the Executive Committee (2000-2006), and as a member of the Board of Directors (1990-2006). Currently, Mr. Stavropoulos is Chairman of Univar (global distributor of commodity and specialty chemicals, 2010-present), a Director of Teradata Corporation (data warehousing and technology solutions, 2008-present), Chemical Financial Corporation, Maersk Inc. (industrial conglomerate), Tyco International, Inc. (multinational manufacturing and services, 2007-present), and a member of the Advisory Board for Metalmark Capital (private equity investment, 2005-present). Mr. Stavropoulos is a special advisor to Clayton, Dubilier & Rice, LLC (private equity investment). In addition, Mr. Stavropoulos is a member of the University of Notre Dame Advisory Council for the College of Science. |
David M. Thomas (62) |
| Year of Election or Appointment: 2008 Previously, Mr. Thomas served as Executive Chairman (2005-2006) and Chairman and Chief Executive Officer (2000-2005) of IMS Health, Inc. (pharmaceutical and healthcare information solutions). In addition, Mr. Thomas serves as a member of the Board of Directors of Fortune Brands, Inc. (consumer products), and Interpublic Group of Companies, Inc. (marketing communication, 2004-present). |
Michael E. Wiley (61) |
| Year of Election or Appointment: 2008 Mr. Wiley also serves as a Director of Asia Pacific Exploration Consolidated (international oil and gas exploration and production, 2008-present). Mr. Wiley serves as a Director of Tesoro Corporation (independent oil refiner and marketer, 2005-present), and a Director of Bill Barrett Corporation (exploration and production, 2005-present). In addition, Mr. Wiley also serves as a Director of Post Oak Bank (privately-held bank, 2004-present). Previously, Mr. Wiley served as a member of the Board of Trustees of the University of Tulsa (2000-2006; 2007-2010), as a Senior Energy Advisor of Katzenbach Partners, LLC (consulting, 2006-2007), as an Advisory Director of Riverstone Holdings (private investment), Chairman, President, and CEO of Baker Hughes, Inc. (oilfield services, 2000-2004), and as Director of Spinnaker Exploration Company (exploration and production, 2001-2005). |
Annual Report
+ The information above includes each Trustee's principal occupation during the last five years and other information relating to the experience, attributes, and skills relevant to each Trustee's qualifications to serve as a Trustee, which led to the conclusion that each Trustee should serve as a Trustee for the fund.
Advisory Board Members and Executive Officers:
Correspondence intended for each executive officer, Edward C. Johnson 3d, and Peter S. Lynch may be sent to Fidelity Investments, 82 Devonshire Street, Boston, Massachusetts 02109.
Name, Age; Principal Occupation |
Edward C. Johnson 3d (81) |
| Year of Election or Appointment: 2011 Member of the Advisory Board of Fidelity's Equity and High Income Funds. Mr. Johnson serves as Chief Executive Officer, Chairman, and a Director of FMR LLC, and also serves as Chairman and Director of FIL Limited. Previously, Mr. Johnson served as a Trustee and Chairman of the Board of certain Fidelity Trusts, Chairman and a Director of FMR, Chairman and a Director of FMR Co., Inc., and President of FMR LLC (2006-2007). |
Peter S. Lynch (67) |
| Year of Election or Appointment: 2003 Member of the Advisory Board of Fidelity's Equity and High Income Funds. Mr. Lynch is Vice Chairman and a Director of FMR and FMR Co., Inc. In addition, Mr. Lynch serves as a Trustee of Boston College and as the Chairman of the Inner-City Scholarship Fund. Previously, Mr. Lynch served on the Special Olympics International Board of Directors (1997-2006). |
Kenneth B. Robins (42) |
| Year of Election or Appointment: 2008 President and Treasurer of Fidelity's Equity and High Income Funds. Mr. Robins also serves as President and Treasurer (2010-present) and Assistant Treasurer (2009-present) of other Fidelity funds and is an employee of Fidelity Investments (2004-present). Previously, Mr. Robins served as Deputy Treasurer of the Fidelity funds (2005-2008) and Treasurer and Chief Financial Officer of The North Carolina Capital Management Trust: Cash and Term Portfolios (2006-2008). |
Bruce T. Herring (46) |
| Year of Election or Appointment: 2006 Vice President of certain Equity Funds. Mr. Herring also serves as Chief Investment Officer and Director of Fidelity Management & Research (U.K.) Inc. (2010-present) and Group Chief Investments Officer of FMR. Previously, Mr. Herring served as Vice President (2005-2006) and Senior Vice President (2006-2007) of Fidelity Management & Research Company, Vice President of FMR Co., Inc. (2001-2007) and as a portfolio manager for Fidelity U.S. Equity Funds. |
Brian B. Hogan (47) |
| Year of Election or Appointment: 2009 Vice President of Equity and High Income Funds. Mr. Hogan also serves as President of FMR's Equity Division (2009-present). Previously, Mr. Hogan served as Senior Vice President, Equity Research of FMR (2006-2009) and as a portfolio manager. |
Scott C. Goebel (43) |
| Year of Election or Appointment: 2008 Secretary and Chief Legal Officer (CLO) of the Fidelity funds. Mr. Goebel also serves as Secretary of Fidelity Investments Money Management, Inc. (FIMM) (2010-present) and Fidelity Research and Analysis Company (FRAC) (2010-present); Secretary and CLO of The North Carolina Capital Management Trust: Cash and Term Portfolios (2008-present); General Counsel, Secretary, and Senior Vice President of FMR (2008-present) and FMR Co., Inc. (2008-present); employed by FMR LLC or an affiliate (2001-present); Chief Legal Officer of Fidelity Management & Research (Hong Kong) Limited (2008-present) and Assistant Secretary of Fidelity Management & Research (Japan) Inc. (2008-present), and Fidelity Management & Research (U.K.) Inc. (2008-present). Previously, Mr. Goebel served as Assistant Secretary of FIMM (2008-2010), FRAC (2008-2010), and the Funds (2007-2008) and as Vice President and Secretary of Fidelity Distributors Corporation (FDC) (2005-2007). |
William C. Coffey (42) |
| Year of Election or Appointment: 2009 Assistant Secretary of Fidelity's Equity and High Income Funds. Mr. Coffey also serves as Senior Vice President and Deputy General Counsel of FMR LLC (2010-present), and is an employee of Fidelity Investments. Previously, Mr. Coffey served as Vice President and Associate General Counsel of FMR LLC (2005-2009). |
Holly C. Laurent (57) |
| Year of Election or Appointment: 2008 Anti-Money Laundering (AML) Officer of the Fidelity funds. Ms. Laurent also serves as AML Officer of The North Carolina Capital Management Trust: Cash and Term Portfolios (2008-present) and is an employee of Fidelity Investments. Previously, Ms. Laurent was Senior Vice President and Head of Legal for Fidelity Business Services India Pvt. Ltd. (2006-2008), and Senior Vice President, Deputy General Counsel and Group Head for FMR LLC (2005-2006). |
Christine Reynolds (53) |
| Year of Election or Appointment: 2008 Chief Financial Officer of the Fidelity funds. Ms. Reynolds became President of Fidelity Pricing and Cash Management Services (FPCMS) in August 2008. Ms. Reynolds served as Chief Operating Officer of FPCMS (2007-2008). Previously, Ms. Reynolds served as President, Treasurer, and Anti-Money Laundering officer of the Fidelity funds (2004-2007). |
Kenneth A. Rathgeber (64) |
| Year of Election or Appointment: 2004 Chief Compliance Officer of Fidelity's Equity and High Income Funds. Mr. Rathgeber is Chief Compliance Officer of Fidelity Management & Research (Hong Kong) Limited (2008-present), Fidelity Management & Research (Japan) Inc. (2008-present), FMR (2005-present), FMR Co., Inc. (2005-present), Fidelity Management & Research (U.K.) Inc. (2005-present), Fidelity Research & Analysis Company (2005-present), Fidelity Investments Money Management, Inc. (2005-present), Pyramis Global Advisors, LLC (2005-present), and Strategic Advisers, Inc. (2005-present). |
Jeffrey S. Christian (50) |
| Year of Election or Appointment: 2009 Deputy Treasurer of the Fidelity funds. Mr. Christian is an employee of Fidelity Investments. Previously, Mr. Christian served as Chief Financial Officer (2008-2009) of certain Fidelity funds and Senior Vice President of Fidelity Pricing and Cash Management Services (FPCMS) (2004-2009). |
Joseph F. Zambello (54) |
| Year of Election or Appointment: 2011 Deputy Treasurer of the Fidelity funds. Mr. Zambello is an employee of Fidelity Investments. Previously, Mr. Zambello served as Vice President of FMR's Program Management Group (2009-2011) and Vice President of the Transfer Agent Oversight Group (2005-2009). |
Adrien E. Deberghes (44) |
| Year of Election or Appointment: 2008 Deputy Treasurer of Fidelity's Equity and High Income Funds. Mr. Deberghes also serves as Vice President and Assistant Treasurer of Fidelity Rutland Square Trust II and Fidelity Commonwealth Trust II (2011-present), Assistant Treasurer of other Fidelity funds (2010-present), and is an employee of Fidelity Investments (2008-present). Previously, Mr. Deberghes served as Senior Vice President of Mutual Fund Administration at State Street Corporation (2007-2008), Senior Director of Mutual Fund Administration at Investors Bank & Trust (2005-2007), and Director of Finance for Dunkin' Brands (2000-2005). |
Stephanie J. Dorsey (42) |
| Year of Election or Appointment: 2010 Assistant Treasurer of Fidelity's Equity and High Income Funds. Ms. Dorsey also serves as Deputy Treasurer of other Fidelity funds (2008-present) and is an employee of Fidelity Investments (2008-present). Previously, Ms. Dorsey served as Treasurer (2004-2008) of the JPMorgan Mutual Funds and Vice President (2004-2008) of JPMorgan Chase Bank. |
John R. Hebble (53) |
| Year of Election or Appointment: 2009 Assistant Treasurer of Fidelity's Equity and High Income Funds. Mr. Hebble also serves as President (2011-present), Treasurer, and Chief Financial Officer of The North Carolina Capital Management Trust: Cash and Term Portfolios (2008-present), President and Treasurer of other Fidelity funds (2008-present) and is an employee of Fidelity Investments. |
Gary W. Ryan (53) |
| Year of Election or Appointment: 2005 Assistant Treasurer of the Fidelity funds. Mr. Ryan is an employee of Fidelity Investments. Previously, Mr. Ryan served as Vice President of Fund Reporting in Fidelity Pricing and Cash Management Services (FPCMS) (1999-2005). |
Jonathan Davis (43) |
| Year of Election or Appointment: 2010 Assistant Treasurer of the Fidelity funds. Mr. Davis is also Assistant Treasurer of Fidelity Rutland Square Trust II and Fidelity Commonwealth Trust II. Mr. Davis is an employee of Fidelity Investments. Previously, Mr. Davis served as Vice President and Associate General Counsel of FMR LLC (2003-2010). |
Annual Report
Class A, T, B and C designate 100% of the dividends distributed in December during the fiscal year as amounts which may be taken into account as a dividend for purposes of the maximum rate under section 1(h)(11) of the Internal Revenue Code.
The amounts per share which represent income derived from sources within, and taxes paid to, foreign countries or possessions of the United States are as follows:
| Pay Date | Income | Taxes |
Class A | 12/06/2010 | $0.345 | $0.0348 |
| 12/31/2010 | $0.041 | $0.0000 |
Class T | 12/06/2010 | $0.293 | $0.0348 |
| 12/31/2010 | $0.041 | $0.0000 |
Class B | 12/06/2010 | $0.166 | $0.0348 |
| 12/31/2010 | $0.041 | $0.0000 |
Class C | 12/06/2010 | $0.180 | $0.0348 |
| 12/31/2010 | $0.041 | $0.0000 |
The fund will notify shareholders in January 2012 of amounts for use in preparing 2011 income tax returns.
Annual Report
Board Approval of Investment Advisory Contracts and Management Fees
Fidelity International Discovery Fund
Each year, the Board of Trustees, including the Independent Trustees (together, the Board), votes on the renewal of the management contract and sub-advisory agreements (together, the Advisory Contracts) for the fund. The Board, assisted by the advice of fund counsel and Independent Trustees' counsel, requests and considers a broad range of information relevant to the renewal of the Advisory Contracts throughout the year.
The Board meets regularly and considers at each of its meetings factors that are relevant to its annual consideration of the renewal of the fund's Advisory Contracts, including the services and support provided to the fund and its shareholders. The Board has established various standing committees, each composed of Independent Trustees with varying backgrounds, to which the Board has assigned specific subject matter responsibilities in order to enhance effective decision-making by the Board. The Board, acting directly and through its Committees, requests and receives information concerning the annual consideration of the renewal of the fund's Advisory Contracts. The Board also meets as needed to consider matters specifically related to the Board's annual consideration of the renewal of Advisory Contracts. Members of the Board may also meet with trustees of other Fidelity funds through ad hoc joint committees to discuss certain matters relevant to the Fidelity funds.
At its July 2011 meeting, the Board of Trustees, including the Independent Trustees, unanimously determined to renew the fund's Advisory Contracts. In reaching its determination, the Board considered all factors it believed relevant, including (i) the nature, extent, and quality of the services to be provided to the fund and its shareholders (including the investment performance of the fund); (ii) the competitiveness of the fund's management fee and total expense ratio; (iii) the total costs of the services to be provided by and the profits to be realized by Fidelity from its relationship with the fund; (iv) the extent to which economies of scale would be realized as the fund grows; and (v) whether fee levels reflect these economies of scale, if any, for the benefit of fund shareholders.
In considering whether to renew the Advisory Contracts for the fund, the Board reached a determination, with the assistance of fund counsel and Independent Trustees' counsel and through the exercise of its business judgment, that the renewal of the Advisory Contracts is in the best interests of the fund and its shareholders and that the compensation payable under the Advisory Contracts is fair and reasonable. The Board's decision to renew the Advisory Contracts was not based on any single factor, but rather was based on a comprehensive consideration of all the information provided to the Board at its meetings throughout the year. The Board, in reaching its determination to renew the Advisory Contracts, is aware that shareholders in the fund have a broad range of investment choices available to them, including a wide choice among mutual funds offered by Fidelity's competitors, and that the fund's shareholders, who have the opportunity to review and weigh the disclosure provided by the fund in its prospectus and other public disclosures, have chosen to invest in this fund, managed by Fidelity.
Annual Report
Nature, Extent, and Quality of Services Provided. The Board considered the staffing within the investment adviser, FMR, and the sub-advisers (together, the Investment Advisers), including the backgrounds of the fund's investment personnel and the fund's investment objective and discipline. The Independent Trustees also had discussions with senior management of Fidelity's investment operations and investment groups. The Board considered the structure of the portfolio manager compensation program and whether this structure provides appropriate incentives to act in the best interests of the fund.
Resources Dedicated to Investment Management and Support Services. The Board and the Fund Oversight and Research Committees reviewed the general qualifications and capabilities of the Investment Advisers' investment staff, including its size, education, experience, and resources, as well as the Investment Advisers' approach to recruiting, training, managing, and compensating investment personnel. The Board also noted that FMR has devoted increased resources to non-U.S. offices. The Board noted that Fidelity's analysts have extensive resources, tools and capabilities which allow them to conduct sophisticated quantitative and fundamental analysis, as well as credit analysis of issuers, counterparties and enhancers. The Board also believes that Fidelity's investment professionals have sufficient access to global information and data so as to provide competitive investment results over time, and that those professionals also have access to sophisticated tools which permit them to assess portfolio construction and risk and performance attribution characteristics continuously, as well as to transmit new information and research conclusions rapidly around the world. Additionally, in their deliberations, the Board considered the Investment Advisers' trading capabilities and resources which are an integral part of the investment management process.
Shareholder and Administrative Services. The Board considered (i) the nature, extent, quality, and cost of advisory, administrative, and shareholder services performed by the Investment Advisers and their affiliates under the Advisory Contracts and under separate agreements covering transfer agency, pricing and bookkeeping, and securities lending services for the fund; (ii) the nature and extent of the investment adviser's supervision of third party service providers, principally custodians and subcustodians; and (iii) the resources devoted to, and the record of compliance with, the fund's compliance policies and procedures. The Board also reviewed the allocation of fund brokerage, including allocations to brokers affiliated with the Investment Advisers, the use of brokerage commissions to pay fund expenses, and the use of "soft" commission dollars to pay for research services.
The Board noted that the growth of fund assets over time across the complex allows Fidelity to reinvest in the development of services designed to enhance the value or convenience of the Fidelity funds as investment vehicles. These services include 24-hour access to account information and market information through telephone representatives and over the Internet, investor education materials and asset allocation tools, and the expanded availability of Fidelity Investor Centers, with 35 new branches opening since 2010.
Annual Report
Board Approval of Investment Advisory Contracts and
Management Fees - continued
Investment in a Large Fund Family. The Board considered the benefits to shareholders of investing in a Fidelity fund, including the benefits of investing in a fund that is part of a large family of funds offering a variety of investment disciplines and providing a large variety of mutual fund investor services. The Board noted that Fidelity had taken, or had made recommendations that resulted in the Fidelity funds taking, a number of actions over the previous year that benefited particular funds, including (i) continuing to dedicate additional resources to investment research and support of the senior management team that oversees asset management; (ii) rationalizing product lines through the mergers of six funds into other funds; (iii) continuing to migrate the Freedom Funds to dedicated lower cost underlying funds; (iv) obtaining shareholder approval to broaden the investment strategies for Fidelity Consumer Finance Portfolio, Fidelity Emerging Asia Fund, and Fidelity Environment and Alternative Energy Portfolio; (v) contractually agreeing to reduce the management fees and impose other expense limitations on Spartan 500 Index Fund and U.S. Bond Index Fund in connection with launching new institutional classes of these funds; (vi) changing the name, primary and supplemental benchmarks, and investment policies of Fidelity Global Strategies Fund to support the fund's flexible investment mandate and global orientation; and (vii) reducing the transfer agency account fee rates on certain accounts.
Investment Performance. The Board considered whether the fund has operated in accordance with its investment objective, as well as its record of compliance with its investment restrictions. It also reviewed the fund's absolute investment performance for each class, as well as the fund's relative investment performance for each class measured over multiple periods against (i) a broad-based securities market index, and (ii) a peer group of mutual funds deemed appropriate by Fidelity and reviewed by the Board. The following charts considered by the Board show, over the one-, three-, and five-year periods ended December 31, 2010, the cumulative total returns of Institutional Class (Class I) and Class B of the fund, the cumulative total returns of a broad-based securities market index ("benchmark"), and a range of cumulative total returns of a peer group of mutual funds identified by Morningstar, Inc. as having an investment style similar to that of the fund based on underlying portfolio holdings. The returns of Institutional Class (Class I) and Class B show the performance of the highest and lowest performing classes, respectively (based on five-year performance). The box within each chart shows the 25th percentile return (bottom of box) and the 75th percentile return (top of box) of the peer group. Returns shown above the box are in the first quartile and returns shown below the box are in the fourth quartile. The percentage beaten numbers noted below each chart correspond to the percentile box and represent the percentage of funds in the peer group whose performance was equal to or lower than that of the class indicated.
Annual Report
Fidelity International Discovery Fund
The Board reviewed the fund's relative investment performance against its peer group and noted that the performance of Institutional Class (Class I) of the fund was in the second quartile for the one- and five-year periods and the third quartile for the three-year period. The Board also noted that the investment performance of Institutional Class (Class I) of the fund compared favorably to its benchmark for the one- and five-year periods, although the fund's three-year cumulative total return was lower than its benchmark. The Board considered that the variations in performance among the fund's classes reflect the variations in class expenses, which result in lower performance for higher expense classes. The Board also reviewed the fund's performance since inception as well as performance in the current year.
The Board also considered that the fund's management fee is subject to upward or downward adjustment depending upon whether, and to what extent, the fund's investment performance for the performance period exceeds, or is exceeded by, the record (over the same period) of a Board-approved performance adjustment index. The Board noted that the performance adjustment provides FMR with a strong economic incentive to seek to achieve superior performance for the fund's shareholders and helps to more closely align the interests of FMR and the fund's shareholders.
Based on its review, the Board concluded that the nature, extent, and quality of services provided to the fund under the Advisory Contracts should benefit the fund's shareholders.
Annual Report
Board Approval of Investment Advisory Contracts and
Management Fees - continued
Competitiveness of Management Fee and Total Expense Ratio. The Board considered the fund's management fee and total expense ratio compared to "mapped groups" of competitive funds and classes. Fidelity creates "mapped groups" by combining similar Lipper investment objective categories that have comparable management fee characteristics. Combining Lipper investment objective categories aids the Board's management fee and total expense ratio comparisons by broadening the competitive group used for comparison and by reducing the number of universes to which various Fidelity funds are compared.
Management Fee. The Board considered two proprietary management fee comparisons for the 12-month periods shown in the chart below. The group of Lipper funds used by the Board for management fee comparisons is referred to below as the "Total Mapped Group." The Total Mapped Group comparison focuses on a fund's standing relative to the total universe of comparable funds available to investors in terms of gross management fees before expense reimbursements or caps, and without giving effect to the fund's performance adjustment. "TMG %" represents the percentage of funds in the Total Mapped Group that had management fees that were lower than the fund's. For example, a TMG % of 16% means that 84% of the funds in the Total Mapped Group had higher management fees than the fund. The "Asset-Size Peer Group" (ASPG) comparison focuses on a fund's standing relative to non-Fidelity funds similar in size to the fund within the Total Mapped Group. The ASPG represents at least 15% of the funds in the Total Mapped Group with comparable asset size and management fee characteristics, subject to a minimum of 50 funds (or all funds in the Total Mapped Group if fewer than 50). Additional information, such as the ASPG quartile in which the fund's management fee ranked and the impact of the fund's performance adjustment, is also included in the chart and considered by the Board.
Annual Report
Fidelity International Discovery Fund
The Board noted that the fund's management fee ranked below the median of its Total Mapped Group and below the median of its ASPG for 2010. The Board also noted the effect of the fund's positive performance adjustment on the fund's management fee ranking. The Board noted that the performance adjustment for each year represents calculations for performance periods that differ from the periods shown in the performance charts above.
Based on its review, the Board concluded that the fund's management fee is fair and reasonable in light of the services that the fund receives and the other factors considered.
Total Expense Ratio. In its review of each class's total expense ratio, the Board considered the fund's management fee as well as other fund or class expenses, as applicable, such as transfer agent fees, pricing and bookkeeping fees, fund-paid 12b-1 fees, and custodial, legal, and audit fees. The Board also noted the effects of any waivers and reimbursements on fees and expenses, as well as the impact of the fund's performance adjustment. As part of its review, the Board also considered the current and historical total expense ratios of each class of the fund compared to competitive fund median expenses. Each class of the fund is compared to those funds and classes in the Total Mapped Group (used by the Board for management fee comparisons) that have a similar sales load structure.
The Board noted that the total expense ratio of each of Class A, Class B, Class C, Institutional Class, the retail class, and Class K ranked below its competitive median for 2010 and the total expense ratio of Class T ranked above its competitive median for 2010. The Board considered that various factors, including 12b-1 fees, positive or negative performance adjustments, and relatively higher other expenses in the case of small fund size, can affect total expense ratios. The Board noted that the total expense ratio of Class T was above the competitive median primarily because of higher 12b-1 fees on Class T. Class T has a higher 12b-1 fee, but a lower front-end sales charge, than traditionally priced front-end sales charge classes. The Board noted that the fund offers multiple classes, each of which has a different sales load and 12b-1 fee structure, and that the multiple structures are intended to offer a range of pricing options for the intermediary market. The Board also noted that the total expense ratios of the classes vary primarily by the level of their 12b-1 fees, although differences in transfer agent fees may also cause expenses to vary from class to class.
Annual Report
Board Approval of Investment Advisory Contracts and
Management Fees - continued
Fees Charged to Other Fidelity Clients. The Board also considered Fidelity fee structures and other information with respect to clients of FMR and its affiliates, such as other mutual funds advised or subadvised by FMR or its affiliates, pension plan clients, and other institutional clients. In March 2010, the Board created an ad hoc joint committee with the board of other Fidelity funds (the Committee) to review and compare Fidelity's institutional investment advisory business with its business of providing services to the Fidelity funds, including the differences in services provided, fees charged, and costs incurred, as well as competition in their respective marketplaces.
Based on its review of total expense ratios and fees charged to other Fidelity clients, the Board concluded that the total expense ratio of each class of the fund was reasonable, although Class T was above the median of the universe presented for comparison, in light of the services that the fund and its shareholders receive and the other factors considered, including the findings of the Committee.
Costs of the Services and Profitability. The Board considered the revenues earned and the expenses incurred by Fidelity in conducting the business of developing, marketing, distributing, managing, administering and servicing the fund and its shareholders. The Board also considered the level of Fidelity's profits in respect of all the Fidelity funds.
On an annual basis, FMR presents to the Board Fidelity's profitability for the fund. Fidelity calculates the profitability for each fund, as well as aggregate profitability for groups of Fidelity funds and all Fidelity funds, using a series of detailed revenue and cost allocation methodologies which originate with the books and records of Fidelity on which Fidelity's audited financial statements are based. The Audit Committee of the Board reviews any significant changes from the prior year's methodologies.
PricewaterhouseCoopers LLP (PwC), independent registered public accounting firm and auditor to Fidelity and certain Fidelity funds, has been engaged annually by the Board as part of the Board's assessment of Fidelity's profitability analysis. PwC's engagement includes the review and assessment of Fidelity's methodologies used in determining the revenues and expenses attributable to Fidelity's mutual fund business, and completion of agreed-upon procedures surrounding the mathematical accuracy of fund profitability and its conformity to allocation methodologies. After considering PwC's reports issued under the engagement and information provided by Fidelity, the Board concluded that while other allocation methods may also be reasonable, Fidelity's profitability methodologies are reasonable in all material respects.
Annual Report
The Board also reviewed Fidelity's non-fund businesses and fall-out benefits related to the mutual fund business as well as cases where Fidelity's affiliates may benefit from or be related to the fund's business.
The Board considered the costs of the services provided by and the profits realized by Fidelity in connection with the operation of the fund and was satisfied that the profitability was not excessive in the circumstances.
Economies of Scale. The Board considered whether there have been economies of scale in respect of the management of the Fidelity funds, whether the Fidelity funds (including the fund) have appropriately benefited from any such economies of scale, and whether there is potential for realization of any further economies of scale. The Board considered the extent to which the fund will benefit from economies of scale through increased services to the fund, through waivers or reimbursements, or through fee or expense reductions. The Board also noted that in 2009, it and the board of other Fidelity funds created an ad hoc committee (the Economies of Scale Committee) to analyze whether FMR attains economies of scale in respect of the management and servicing of the Fidelity funds, whether the Fidelity funds have appropriately benefited from such economies of scale, and whether there is potential for realization of any further economies of scale.
The Board recognized that the fund's management contract incorporates a "group fee" structure, which provides for lower group fee rates as total fund assets under FMR's management increase, and for higher group fee rates as total fund assets under FMR's management decrease. FMR calculates the group fee rates based on a tiered asset "breakpoint" schedule that varies based on asset class. The Board considered that the group fee is designed to deliver the benefits of economies of scale to fund shareholders when total Fidelity fund assets increase, even if assets of any particular fund are unchanged or have declined, because some portion of Fidelity's costs are attributable to services provided to all Fidelity funds, and all funds benefit if those costs can be allocated among more assets. The Board concluded that, given the group fee structure, fund shareholders will benefit from lower management fees as assets under FMR's management increase at the fund complex level, regardless of whether Fidelity achieves any such economies of scale.
The Board concluded, taking into account the analysis of the Economies of Scale Committee, that any potential economies of scale are being appropriately shared between fund shareholders and Fidelity.
Annual Report
Board Approval of Investment Advisory Contracts and
Management Fees - continued
Additional Information Requested by the Board. In order to develop fully the factual basis for consideration of the Fidelity funds' Advisory Contracts, the Board requested and received additional information on certain topics, including (i) fund performance trends, actions to be taken by FMR to improve certain funds' overall performance, and Fidelity's long-term strategies for certain funds; (ii) portfolio manager changes that have occurred during the past year and length of portfolio manager tenure for different categories of funds over time; (iii) Fidelity's compensation structure for portfolio managers and other key personnel and strategies for attracting and retaining non-investment personnel; (iv) the amount of the investment that each portfolio manager has made in the Fidelity fund(s) that he or she manages; (v) historical trends in Fidelity's realization of fall-out benefits; (vi) Fidelity's group fee structures and the rationale for the individual fee rates of certain funds; (vii) fund profitability methodology and the impact of certain factors on fund profitability results; (viii) trends regarding industry use of performance fee structures and Fidelity's compliance practices with respect to performance adjustment calculations; (ix) the fee structures in place for certain other Fidelity clients; and (x) explanations regarding the relative total expense ratios of certain funds and classes, total expense competitive trends, and actions that might be taken by FMR to reduce total expense ratios for certain funds and classes.
Based on its evaluation of all of the conclusions noted above, and after considering all factors it believed relevant, the Board ultimately concluded that the advisory fee structures are fair and reasonable, and that the fund's Advisory Contracts should be renewed.
Annual Report
Investment Adviser
Fidelity Management & Research Company
Boston, MA
Investment Sub-Advisers
FMR Co., Inc.
Fidelity Management & Research
(U.K.) Inc.
FIL Investment Advisors
FIL Investments (Japan) Limited
FIL Investment Advisors (U.K.) Limited
Fidelity Management & Research
(Hong Kong) Limited
Fidelity Management & Research
(Japan) Inc.
General Distributor
Fidelity Distributors Corporation
Boston, MA
Transfer and Service Agents
Fidelity Investments Institutional Operations Company, Inc.
Boston, MA
Fidelity Service Company, Inc.
Boston, MA
Custodian
The Northern Trust Company
Chicago, IL
AID-UANN-1211
1.806656.106
(Fidelity Logo)
Fidelity Advisor®
International Discovery
Fund - Institutional Class
Annual Report
October 31, 2011
(Fidelity Cover Art)
Institutional Class is
a class of Fidelity®
International Discovery Fund
Contents
Chairman's Message | (Click Here) | The Chairman's message to shareholders. |
Performance | (Click Here) | How the fund has done over time. |
Management's Discussion of Fund Performance | (Click Here) | The Portfolio Manager's review of fundperformance and strategy. |
Shareholder Expense Example | (Click Here) | An example of shareholder expenses. |
Investment Changes | (Click Here) | A summary of major shifts in the fund's investments over the past six months. |
Investments | (Click Here) | A complete list of the fund's investments with their market values. |
Financial Statements | (Click Here) | Statements of assets and liabilities, operations, and changes in net assets,
as well as financial highlights. |
Notes | (Click Here) | Notes to financial statements. |
Report of Independent Registered Public Accounting Firm | (Click Here) | |
Trustees and Officers | (Click Here) | |
Distributions | (Click Here) | |
Board Approval of Investment Advisory Contracts and Management Fees | (Click Here) | |
To view a fund's proxy voting guidelines and proxy voting record for the 12-month period ended June 30, visit http://www.fidelity.com/proxyvotingresults or visit the Securities and Exchange Commission's (SEC) web site at http://www.sec.gov. You may also call 1-877-208-0098 to request a free copy of the proxy voting guidelines.
Standard & Poor's, S&P and S&P 500 are registered service marks of The McGraw-Hill Companies, Inc. and have been licensed for use by Fidelity Distributors Corporation.
Other third party marks appearing herein are the property of their respective owners.
All other marks appearing herein are registered or unregistered trademarks or service marks of FMR LLC or an affiliated company.
Annual Report
This report and the financial statements contained herein are submitted for the general information of the shareholders of the fund. This report is not authorized for distribution to prospective investors in the fund unless preceded or accompanied by an effective prospectus.
A fund files its complete schedule of portfolio holdings with the SEC for the first and third quarters of each fiscal year on Form N-Q. Forms N-Q are available on the SEC's web site at http://www.sec.gov. A fund's Forms N-Q may be reviewed and copied at the SEC's Public Reference Room in Washington, DC. Information regarding the operation of the SEC's Public Reference Room may be obtained by calling 1-800-SEC-0330. For a complete list of a fund's portfolio holdings, view the fund's most recent holdings listing, semiannual report, or annual report on Fidelity's web site at http://www.fidelity.com, http://www.advisor.fidelity.com, or http://www.401k.com, as applicable.
NOT FDIC INSURED • MAY LOSE VALUE • NO BANK GUARANTEE
Neither the fund nor Fidelity Distributors Corporation is a bank.
Annual Report
(Acting Chairman's Photograph)
Dear Shareholder:
Global equity markets began the fourth quarter on a strong note, sharply reversing course in October amid strong corporate earnings, better-than-expected economic news and the promise of a resolution to the sovereign debt crisis in Europe. The mini rally followed a third quarter marked by a significant downturn in July and August, which heightened investor anxiety and set off a wave of volatility that hampered most major asset classes through the end of September. Financial markets are difficult to predict, of course, but you can help put the odds in your favor by following these time-tested investment principles.
One of the basic tenets is to invest according to your time horizon. For long-term investors, riding out the markets' inevitable ups and downs has proven much more effective than making decisions based on short-term developments. If your goal is approaching, you can also benefit from patience and restraint, rather than attempting to time the market. No matter your time horizon, missing only a few of the markets' best days can significantly diminish returns. Patience also affords the benefits of compounding - earning interest on additional income or reinvested dividends and capital gains. While staying the course doesn't eliminate risk, it can considerably lessen the negative impact of short-term downturns.
Asset allocation is another principle to manage risk. As you spread your portfolio among the asset classes, be sure to consider your time horizon, risk tolerance and investment objectives. Younger investors may be better served by emphasizing equities, which historically have been the best-performing asset class over time. Investors who are nearing a specific goal, such as retirement or sending a child to college, may choose to favor bonds and other investments that have tended to be more stable. Studies indicate that asset allocation is the single most important determinant of a portfolio's long-term success. After deciding on a suitable allocation strategy, make sure your portfolio is adequately diversified, with exposure to stocks of small-, mid- and large-cap companies in a range of sectors, for example. And today, more than ever, geographic diversification should be taken into account.
Lastly, investing a certain amount of money on a regular basis - a principle known as dollar-cost averaging - can help lower the average cost of your purchases, while also giving you the discipline to avoid selling weak performers just prior to an upswing, or chasing a hot performer just before a correction.
We invite you to learn more by visiting us on the Internet, dropping by one of our Investor Centers or calling us by phone. It is our privilege to provide the resources you need to choose investments that are right for you.
Sincerely,
(Acting Chairman's Signature)
James C. Curvey
Acting Chairman
Annual Report
Average annual total return reflects the change in the value of an investment, assuming reinvestment of the class' distributions from dividend income and capital gains (the profits earned upon the sale of securities that have grown in value, if any) and assuming a constant rate of performance each year. The $10,000 table and the fund's returns do not reflect the deduction of taxes that a shareholder would pay on fund distributions or the redemption of fund shares. During periods of reimbursement by Fidelity, a fund's total return will be greater than it would be had the reimbursement not occurred. How a fund did yesterday is no guarantee of how it will do tomorrow.
Average Annual Total Returns
Periods ended October 31, 2011 | Past 1
year | Past 5
years | Past 10 years |
Institutional Class A, B | -6.39% | -1.55% | 7.62% |
A The initial offering of Institutional Class shares took place on January 6, 2005. Returns prior to January 6, 2005 are those of Fidelity® International Discovery Fund, the original class of the fund.
B Prior to October 1, 2004, the fund operated under certain different investment policies. The fund's historical performance may not represent its current investment policies.
$10,000 Over 10 Years
Let's say hypothetically that $10,000 was invested in Fidelity Advisor® International Discovery Fund - Institutional Class on October 31, 2001. The chart shows how the value of your investment would have changed, and also shows how the MSCI® EAFE® (Europe, Australasia, Far East) Index performed over the same period. The initial offering of Institutional Class took place on January 6, 2005. See above for additional information regarding the performance of Institutional Class.
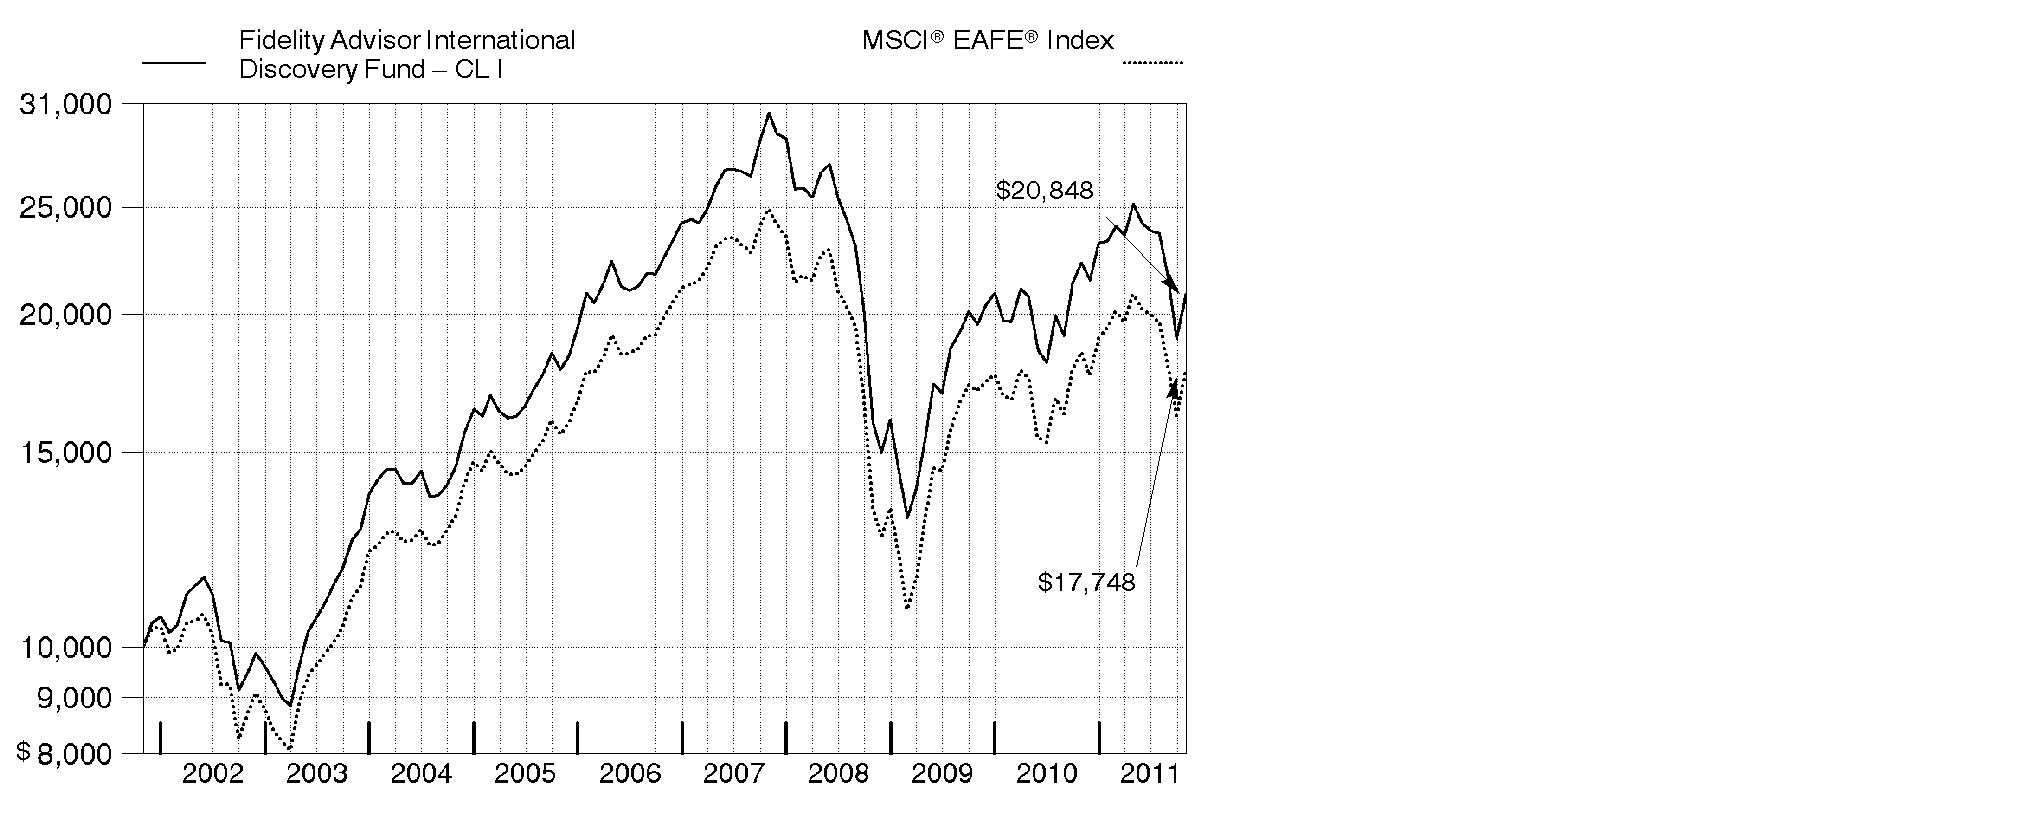
Annual Report
Market Recap: International equities were rocked by a number of headline events during the year ending October 31, 2011. Stocks posted a solid advance for the first half of the period, despite concern about the sovereign debt crisis in Europe, a devastating earthquake and tsunami in Japan, and political upheaval in the Middle East and North Africa. Sentiment turned decidedly negative in the second half, however, as fresh worries about Europe, inflation in China and a dimmed outlook for global growth caused foreign markets to suffer declines that intensified in August and September. October brought with it yet another dramatic swing, as eurozone policymakers appeared near a resolution to the debt debacle and buyers stormed back onto the scene in search of bargains. Still, those gains - along with favorable currency fluctuations overall - weren't enough to offset prior losses, and the MSCI® ACWI® (All Country World Index) ex USA Index finished the period down 4.56%. Within the MSCI index, Europe and emerging markets suffered the biggest declines, with many countries in these areas sustaining steep losses. By contrast, Japan showed resilience in the wake of its natural disasters, falling only 2%. Australia (+4%), Switzerland (+3%), the U.K. (+2%) and Canada, which produced a nominal return, were among the few major benchmark components to break into positive territory.
Comments from William Kennedy, Portfolio Manager of Fidelity Advisor® International Discovery Fund: For the year, the fund's Institutional Class shares returned -6.39%, lagging the -3.97% return of the MSCI EAFE® (Europe, Australasia, Far East) Index. Stock selection and currency exposure detracted from relative performance, particularly in emerging markets (an out-of-index investment); the Asia Pacific ex Japan region; and the United Kingdom. Positioning in energy and financials most hampered returns. Individual disappointments included French bank BNP Paribas, whose stock fell amid worries over its exposure to Greek debt, and Danish brewery Carlsberg, whose earnings suffered from a spike in Russian grain prices. The fund also was hurt by not owning Swiss pharmaceuticals firm and index component Roche Holding. Conversely, defensive positioning in Japan and Europe helped, as did security selection in consumer discretionary and information technology. A non-index stake in Japanese online retailer Start Today benefited from growth in Internet purchases, while shares of U.K. software company Autonomy jumped following a premium acquisition offer. Some of these names were no longer in the portfolio at period end.
The views expressed above reflect those of the portfolio manager(s) only through the end of the period as stated on the cover of this report and do not necessarily represent the views of Fidelity or any other person in the Fidelity organization. Any such views are subject to change at any time based upon market or other conditions and Fidelity disclaims any responsibility to update such views. These views may not be relied on as investment advice and, because investment decisions for a Fidelity fund are based on numerous factors, may not be relied on as an indication of trading intent on behalf of any Fidelity fund.
Annual Report
Shareholder Expense Example
As a shareholder of the Fund, you incur two types of costs: (1) transaction costs, including sales charges (loads) on purchase payments or redemption proceeds, redemption fees, and (2) ongoing costs, including management fees, distribution and/or service (12b-1) fees and other Fund expenses. This Example is intended to help you understand your ongoing costs (in dollars) of investing in the Fund and to compare these costs with the ongoing costs of investing in other mutual funds.
The Example is based on an investment of $1,000 invested at the beginning of the period and held for the entire period (May 1, 2011 to October 31, 2011).
Actual Expenses
The first line of the accompanying table for each class of the Fund provides information about actual account values and actual expenses. You may use the information in this line, together with the amount you invested, to estimate the expenses that you paid over the period. Simply divide your account value by $1,000.00 (for example, an $8,600 account value divided by $1,000.00 = 8.6), then multiply the result by the number in the first line for a class of the Fund under the heading entitled "Expenses Paid During Period" to estimate the expenses you paid on your account during this period. A small balance maintenance fee of $12.00 that is charged once a year may apply for certain accounts with a value of less than $2,000. This fee is not included in the table below. If it was, the estimate of expenses you paid during the period would be higher, and your ending account value lower, by this amount. In addition, the Fund, as a shareholder in the underlying Fidelity Central Funds, will indirectly bear its pro-rata share of the fees and expenses incurred by the underlying Fidelity Central Funds. These fees and expenses are not included in the Fund's annualized expense ratio used to calculate the expense estimate in the table below.
Hypothetical Example for Comparison Purposes
The second line of the accompanying table for each class of the Fund provides information about hypothetical account values and hypothetical expenses based on a Class' actual expense ratio and an assumed rate of return of 5% per year before expenses, which is not the Class' actual return. The hypothetical account values and expenses may not be used to estimate the actual ending account balance or expenses you paid for the period. You may use this information to compare the ongoing costs of investing in the Fund and other funds. To do so, compare this 5% hypothetical example with the 5% hypothetical examples that appear in the shareholder reports of the other funds. A small balance maintenance fee of $12.00 that is charged once a year may apply for certain accounts with a value of less than $2,000. This fee is not included in the table below. If it was, the estimate of expenses you paid during the period would be higher, and your ending account value lower, by this amount. In addition, the Fund, as a shareholder in the underlying Fidelity Central Funds, will indirectly bear its pro-rata share of the fees and expenses incurred by the underlying Fidelity Central Funds. These fees and expenses are not included in the Fund's annualized expense ratio used to calculate the expense estimate in the table below.
Please note that the expenses shown in the table are meant to highlight your ongoing costs only and do not reflect any transaction costs. Therefore, the second line of the table is useful in comparing ongoing costs only, and will not help you determine the relative total costs of owning different funds. In addition, if these transactional costs were included, your costs would have been higher.
Annual Report
| Annualized Expense Ratio | Beginning
Account Value
May 1, 2011 | Ending
Account Value
October 31, 2011 | Expenses Paid
During Period*
May 1, 2011 to October 31, 2011 |
Class A | 1.29% | | | |
Actual | | $ 1,000.00 | $ 827.20 | $ 5.94 |
HypotheticalA | | $ 1,000.00 | $ 1,018.70 | $ 6.56 |
Class T | 1.54% | | | |
Actual | | $ 1,000.00 | $ 825.90 | $ 7.09 |
HypotheticalA | | $ 1,000.00 | $ 1,017.44 | $ 7.83 |
Class B | 2.05% | | | |
Actual | | $ 1,000.00 | $ 824.20 | $ 9.43 |
HypotheticalA | | $ 1,000.00 | $ 1,014.87 | $ 10.41 |
Class C | 2.04% | | | |
Actual | | $ 1,000.00 | $ 824.30 | $ 9.38 |
HypotheticalA | | $ 1,000.00 | $ 1,014.92 | $ 10.36 |
International Discovery | .96% | | | |
Actual | | $ 1,000.00 | $ 828.60 | $ 4.42 |
HypotheticalA | | $ 1,000.00 | $ 1,020.37 | $ 4.89 |
Class K | .79% | | | |
Actual | | $ 1,000.00 | $ 829.20 | $ 3.64 |
HypotheticalA | | $ 1,000.00 | $ 1,021.22 | $ 4.02 |
Institutional Class | .95% | | | |
Actual | | $ 1,000.00 | $ 828.40 | $ 4.38 |
HypotheticalA | | $ 1,000.00 | $ 1,020.42 | $ 4.84 |
A 5% return per year before expenses
* Expenses are equal to each Class' annualized expense ratio, multiplied by the average account value over the period, multiplied by 184/365 (to reflect the one-half year period).
Annual Report
Investment Changes (Unaudited)
Geographic Diversification (% of fund's net assets) |
As of October 31, 2011 |
| United Kingdom 21.0% | |
| Japan 15.8% | |
| France 9.1% | |
| Switzerland 6.8% | |
| Germany 6.3% | |
| Australia 3.5% | |
| Netherlands 3.4% | |
| Cayman Islands 2.8% | |
| Korea (South) 2.5% | |
| Other 28.8% | |

Percentages are adjusted for the effect of futures contracts, if applicable. |
As of April 30, 2011 |
| United Kingdom 21.3% | |
| Japan 16.2% | |
| France 8.8% | |
| Germany 7.7% | |
| Switzerland 5.2% | |
| Australia 4.1% | |
| United States of America 3.7% | |
| Netherlands 3.3% | |
| Denmark 3.1% | |
| Other 26.6% | |

Percentages are adjusted for the effect of futures contracts, if applicable. |
Asset Allocation |
| % of fund's
net assets | % of fund's net assets
6 months ago |
Stocks | 99.9 | 98.7 |
Short-Term Investments and Net Other Assets | 0.1 | 1.3 |
Top Ten Stocks as of October 31, 2011 |
| % of fund's
net assets | % of fund's net assets
6 months ago |
Royal Dutch Shell PLC Class B (United Kingdom, Oil, Gas & Consumable Fuels) | 2.8 | 2.8 |
Nestle SA (Switzerland, Food Products) | 2.0 | 0.9 |
British American Tobacco PLC (United Kingdom) (United Kingdom, Tobacco) | 1.8 | 0.4 |
BHP Billiton PLC (United Kingdom, Metals & Mining) | 1.7 | 1.9 |
Vodafone Group PLC (United Kingdom, Wireless Telecommunication Services) | 1.5 | 1.2 |
ORIX Corp. (Japan, Diversified Financial Services) | 1.3 | 1.1 |
BG Group PLC (United Kingdom, Oil, Gas & Consumable Fuels) | 1.3 | 1.0 |
Japan Tobacco, Inc. (Japan, Tobacco) | 1.3 | 0.5 |
Novo Nordisk A/S Series B (Denmark, Pharmaceuticals) | 1.3 | 1.5 |
HSBC Holdings PLC (United Kingdom) (United Kingdom, Commercial Banks) | 1.2 | 1.3 |
| 16.2 | |
Market Sectors as of October 31, 2011 |
| % of fund's
net assets | % of fund's net assets
6 months ago |
Financials | 21.3 | 21.3 |
Consumer Discretionary | 18.6 | 17.3 |
Consumer Staples | 12.6 | 8.2 |
Information Technology | 9.8 | 8.7 |
Industrials | 9.6 | 14.3 |
Energy | 7.5 | 8.5 |
Health Care | 7.2 | 6.2 |
Telecommunication Services | 6.4 | 5.3 |
Materials | 6.0 | 8.7 |
Utilities | 0.9 | 0.2 |
Annual Report
Investments October 31, 2011
Showing Percentage of Net Assets
Common Stocks - 98.6% |
| Shares | | Value (000s) |
Australia - 3.5% |
Australia & New Zealand Banking Group Ltd. | 4,456,031 | | $ 100,700 |
carsales.com Ltd. (d) | 3,966,844 | | 20,509 |
Commonwealth Bank of Australia | 1,268,063 | | 65,147 |
Fortescue Metals Group Ltd. | 3,503,390 | | 17,599 |
Macquarie Group Ltd. | 472,090 | | 12,156 |
Newcrest Mining Ltd. | 1,658,172 | | 58,608 |
WorleyParsons Ltd. | 993,898 | | 28,850 |
TOTAL AUSTRALIA | | 303,569 |
Austria - 0.0% |
Osterreichische Elektrizitatswirtschafts AG | 101,380 | | 2,951 |
Bailiwick of Guernsey - 0.1% |
Ashmore Global Opportunities Ltd. (United Kingdom) | 825,990 | | 9,166 |
Bailiwick of Jersey - 2.0% |
Experian PLC | 3,236,600 | | 42,187 |
Shire PLC | 2,310,400 | | 72,527 |
Velti PLC (a) | 290,405 | | 2,445 |
Wolseley PLC | 1,930,464 | | 55,820 |
TOTAL BAILIWICK OF JERSEY | | 172,979 |
Belgium - 0.3% |
Anheuser-Busch InBev SA NV | 542,427 | | 30,085 |
Bermuda - 1.0% |
African Minerals Ltd. (a) | 2,899,600 | | 20,599 |
Cheung Kong Infrastructure Holdings Ltd. | 6,530,000 | | 34,979 |
Li & Fung Ltd. | 9,616,000 | | 18,532 |
Noble Group Ltd. | 11,199,364 | | 13,670 |
TOTAL BERMUDA | | 87,780 |
Brazil - 2.1% |
Anhanguera Educacional Participacoes SA | 1,834,900 | | 26,981 |
Arezzo Industria e Comercio SA | 849,800 | | 11,234 |
Itau Unibanco Banco Multiplo SA sponsored ADR | 1,260,500 | | 24,101 |
Qualicorp SA | 4,305,000 | | 39,360 |
Souza Cruz Industria Comerico | 3,799,000 | | 46,592 |
TIM Participacoes SA sponsored ADR (d) | 1,447,849 | | 37,702 |
TOTAL BRAZIL | | 185,970 |
Common Stocks - continued |
| Shares | | Value (000s) |
British Virgin Islands - 0.5% |
Arcos Dorados Holdings, Inc. | 731,300 | | $ 17,112 |
Mail.ru Group Ltd. GDR (Reg. S) | 713,000 | | 24,563 |
TOTAL BRITISH VIRGIN ISLANDS | | 41,675 |
Canada - 1.2% |
Canadian Natural Resources Ltd. | 573,500 | | 20,228 |
InterOil Corp. (a)(d) | 204,400 | | 9,711 |
Open Text Corp. (a)(d) | 769,600 | | 47,102 |
Trinidad Drilling Ltd. | 3,430,500 | | 26,842 |
TOTAL CANADA | | 103,883 |
Cayman Islands - 2.8% |
Airtac International Group | 2,543,000 | | 14,233 |
Belle International Holdings Ltd. | 10,683,000 | | 20,952 |
Biostime International Holdings Ltd. | 8,183,000 | | 14,593 |
Bosideng International Holdings Ltd. | 43,814,000 | | 12,078 |
China Kanghui Holdings sponsored ADR (a)(d) | 1,747,000 | | 27,375 |
China Mengniu Dairy Co. Ltd. | 6,180,000 | | 19,693 |
China ZhengTong Auto Services Holdings Ltd. | 14,117,500 | | 15,287 |
Ctrip.com International Ltd. sponsored ADR (a) | 915,000 | | 31,897 |
Hengdeli Holdings Ltd. | 28,576,000 | | 12,811 |
Microport Scientific Corp. | 8,277,000 | | 4,678 |
Sands China Ltd. (a) | 17,144,800 | | 51,523 |
Shenguan Holdings Group Ltd. | 35,412,000 | | 19,025 |
TOTAL CAYMAN ISLANDS | | 244,145 |
China - 1.3% |
Baidu.com, Inc. sponsored ADR (a) | 394,600 | | 55,315 |
China Telecom Corp. Ltd. (H Shares) | 41,444,000 | | 25,588 |
SINA Corp. (a)(d) | 310,200 | | 25,216 |
Zhaojin Mining Industry Co. Ltd. (H Shares) | 4,984,000 | | 8,898 |
TOTAL CHINA | | 115,017 |
Cyprus - 0.0% |
Aisi Realty Public Ltd. (a)(e) | 216,330 | | 240 |
Denmark - 2.2% |
Novo Nordisk A/S Series B | 1,029,289 | | 109,293 |
William Demant Holding A/S (a) | 984,500 | | 78,551 |
TOTAL DENMARK | | 187,844 |
Common Stocks - continued |
| Shares | | Value (000s) |
Finland - 0.7% |
Amer Group PLC (A Shares) | 1,325,300 | | $ 18,322 |
Nokian Tyres PLC | 1,213,133 | | 44,574 |
TOTAL FINLAND | | 62,896 |
France - 9.1% |
Air Liquide SA | 307,100 | | 39,843 |
Arkema SA | 436,670 | | 29,874 |
Atos Origin SA | 1,058,073 | | 51,279 |
AXA SA | 3,922,902 | | 63,898 |
BNP Paribas SA | 1,322,566 | | 60,125 |
Club Mediterranee SA (a) | 470,000 | | 8,917 |
Danone | 1,265,300 | | 88,078 |
Iliad SA | 625,259 | | 73,187 |
Ipsos SA | 54,516 | | 1,790 |
JC Decaux SA (a) | 652,300 | | 17,481 |
LVMH Moet Hennessy - Louis Vuitton | 621,877 | | 103,489 |
Pernod-Ricard SA | 329,525 | | 30,782 |
PPR SA | 398,700 | | 62,294 |
Safran SA | 714,800 | | 23,415 |
Sanofi-aventis | 953,011 | | 68,187 |
Schneider Electric SA | 529,528 | | 31,255 |
Societe Generale Series A | 685,447 | | 20,015 |
Unibail-Rodamco | 118,400 | | 23,677 |
TOTAL FRANCE | | 797,586 |
Germany - 5.1% |
Aareal Bank AG (a) | 1,131,037 | | 22,993 |
Allianz AG | 325,100 | | 36,537 |
Bayer AG | 767,558 | | 49,176 |
Bayerische Motoren Werke AG (BMW) | 834,676 | | 68,221 |
Commerzbank AG (a) | 4,229,500 | | 10,436 |
Deutsche Bank AG | 1,018,100 | | 42,103 |
Fresenius Medical Care AG & Co. KGaA | 940,100 | | 68,492 |
GEA Group AG | 992,880 | | 27,433 |
Gerry Weber International AG (Bearer) | 320,600 | | 9,983 |
Kabel Deutschland Holding AG (a) | 1,085,800 | | 61,999 |
Siemens AG | 475,549 | | 49,855 |
TOTAL GERMANY | | 447,228 |
Hong Kong - 1.5% |
AIA Group Ltd. | 13,058,400 | | 39,929 |
China Unicom (Hong Kong) Ltd. | 12,452,000 | | 25,036 |
Common Stocks - continued |
| Shares | | Value (000s) |
Hong Kong - continued |
I.T Ltd. | 14,631,000 | | $ 9,112 |
Techtronic Industries Co. Ltd. | 65,201,500 | | 56,415 |
TOTAL HONG KONG | | 130,492 |
India - 1.6% |
Apollo Hospitals Enterprise Ltd. | 1,432,254 | | 15,263 |
Bharti Airtel Ltd. | 5,744,231 | | 46,004 |
Housing Development Finance Corp. Ltd. | 2,696,342 | | 37,945 |
Larsen & Toubro Ltd. | 279,321 | | 8,057 |
Shriram Transport Finance Co. Ltd. | 732,049 | | 9,165 |
The Jammu & Kashmir Bank Ltd. | 545,569 | | 9,407 |
Titan Industries Ltd. | 3,211,760 | | 14,263 |
TOTAL INDIA | | 140,104 |
Indonesia - 0.6% |
PT Astra International Tbk | 1,338,500 | | 10,321 |
PT Sarana Menara Nusantara Tbk (a) | 13,136,500 | | 13,282 |
PT Tower Bersama Infrastructure Tbk | 55,223,500 | | 12,852 |
PT XL Axiata Tbk | 22,623,000 | | 12,653 |
TOTAL INDONESIA | | 49,108 |
Ireland - 1.4% |
Accenture PLC Class A | 719,100 | | 43,333 |
James Hardie Industries NV CDI (a) | 5,530,462 | | 35,824 |
Kenmare Resources PLC (a) | 5,264,162 | | 3,435 |
Paddy Power PLC (Ireland) | 728,700 | | 40,338 |
TOTAL IRELAND | | 122,930 |
Israel - 0.6% |
Check Point Software Technologies Ltd. (a) | 517,600 | | 29,829 |
Israel Chemicals Ltd. | 1,513,500 | | 18,212 |
TOTAL ISRAEL | | 48,041 |
Italy - 1.4% |
Intesa Sanpaolo SpA | 8,188,112 | | 14,629 |
Prada SpA | 2,305,100 | | 11,395 |
Prysmian SpA | 1,473,800 | | 22,334 |
Saipem SpA | 1,580,606 | | 70,872 |
TOTAL ITALY | | 119,230 |
Japan - 15.8% |
ABC-Mart, Inc. | 1,529,000 | | 59,886 |
Aozora Bank Ltd. | 4,562,000 | | 11,534 |
Common Stocks - continued |
| Shares | | Value (000s) |
Japan - continued |
Asics Corp. | 3,605,000 | | $ 47,798 |
Calbee, Inc. (d) | 700,800 | | 31,951 |
Canon, Inc. | 1,744,350 | | 79,200 |
Cosmos Pharmaceutical Corp. | 859,200 | | 39,858 |
Credit Saison Co. Ltd. | 1,323,500 | | 25,830 |
DeNA Co. Ltd. | 336,000 | | 14,504 |
Denso Corp. | 1,300,300 | | 39,994 |
Digital Garage, Inc. (a) | 2,715 | | 8,890 |
Don Quijote Co. Ltd. | 1,367,200 | | 50,088 |
Fanuc Corp. | 381,000 | | 61,612 |
Honda Motor Co. Ltd. | 1,966,400 | | 58,810 |
Japan Retail Fund Investment Corp. | 1,225 | | 1,897 |
Japan Tobacco, Inc. | 22,266 | | 111,303 |
JS Group Corp. | 1,457,600 | | 30,569 |
JSR Corp. | 2,283,400 | | 43,596 |
Kakaku.com, Inc. | 810,600 | | 32,100 |
KDDI Corp. | 10,315 | | 75,571 |
Keyence Corp. | 192,600 | | 48,967 |
Misumi Group, Inc. | 1,254,900 | | 26,114 |
Mitsubishi Corp. | 2,574,400 | | 52,954 |
Mitsubishi Estate Co. Ltd. | 1,553,000 | | 26,307 |
Mitsubishi UFJ Financial Group, Inc. | 15,161,400 | | 65,899 |
ORIX Corp. | 1,321,050 | | 115,310 |
Rakuten, Inc. | 68,670 | | 75,288 |
So-net M3, Inc. (d) | 5,296 | | 23,954 |
SOFTBANK CORP. | 1,375,900 | | 44,661 |
Start Today Co. Ltd. | 2,740,800 | | 57,987 |
Tokyo Electron Ltd. | 309,600 | | 16,468 |
TOTAL JAPAN | | 1,378,900 |
Korea (South) - 2.5% |
Hyundai Motor Co. | 209,530 | | 42,040 |
Kia Motors Corp. | 453,500 | | 28,966 |
LG Household & Health Care Ltd. | 49,310 | | 22,187 |
NHN Corp. (a) | 64,289 | | 13,362 |
Orion Corp. | 113,331 | | 60,574 |
Samsung Electronics Co. Ltd. | 38,175 | | 32,741 |
Shinhan Financial Group Co. Ltd. | 421,030 | | 16,710 |
TOTAL KOREA (SOUTH) | | 216,580 |
Luxembourg - 1.3% |
Brait SA | 5,949,360 | | 14,243 |
Common Stocks - continued |
| Shares | | Value (000s) |
Luxembourg - continued |
Millicom International Cellular SA | 190,400 | | $ 20,925 |
Millicom International Cellular SA (depositary receipt) | 477,100 | | 52,580 |
Samsonite International SA | 14,826,300 | | 24,124 |
TOTAL LUXEMBOURG | | 111,872 |
Mexico - 0.5% |
Wal-Mart de Mexico SA de CV Series V | 18,209,000 | | 47,039 |
Netherlands - 3.4% |
AEGON NV (a) | 5,028,800 | | 23,986 |
ASML Holding NV | 971,700 | | 40,743 |
Gemalto NV | 1,818,979 | | 82,995 |
ING Groep NV (Certificaten Van Aandelen) (a) | 11,511,300 | | 99,253 |
Koninklijke Philips Electronics NV | 1,247,700 | | 25,977 |
Randstad Holdings NV | 726,367 | | 25,910 |
TOTAL NETHERLANDS | | 298,864 |
Norway - 1.1% |
Aker Solutions ASA | 1,927,748 | | 22,419 |
DnB NOR ASA | 6,602,355 | | 77,021 |
TOTAL NORWAY | | 99,440 |
Philippines - 0.3% |
Alliance Global Group, Inc. | 101,250,000 | | 25,173 |
Poland - 0.3% |
Eurocash SA | 3,593,990 | | 28,816 |
Qatar - 0.3% |
Commercial Bank of Qatar GDR (Reg. S) | 5,094,802 | | 23,366 |
South Africa - 1.0% |
AngloGold Ashanti Ltd. sponsored ADR | 816,100 | | 36,896 |
Sanlam Ltd. | 5,826,600 | | 21,768 |
Shoprite Holdings Ltd. | 2,042,000 | | 29,926 |
TOTAL SOUTH AFRICA | | 88,590 |
Spain - 1.5% |
Banco Bilbao Vizcaya Argentaria SA | 1,836,204 | | 16,528 |
Banco Santander SA: | | | |
rights 10/31/11 | 6,080,392 | | 1,052 |
(Spain) | 6,080,392 | | 51,471 |
Inditex SA | 280,831 | | 25,557 |
Common Stocks - continued |
| Shares | | Value (000s) |
Spain - continued |
Prosegur Compania de Seguridad SA (Reg.) | 382,900 | | $ 19,103 |
Viscofan Envolturas Celulosicas SA | 515,100 | | 19,824 |
TOTAL SPAIN | | 133,535 |
Sweden - 1.3% |
Elekta AB (B Shares) | 316,100 | | 12,650 |
Intrum Justitia AB | 111,800 | | 1,839 |
Meda AB (A Shares) | 1,713,200 | | 17,501 |
Swedbank AB (A Shares) | 3,382,000 | | 47,647 |
Swedish Match Co. | 1,052,600 | | 36,424 |
TOTAL SWEDEN | | 116,061 |
Switzerland - 6.8% |
Adecco SA (Reg.) | 548,529 | | 26,509 |
Compagnie Financiere Richemont SA Series A | 315,194 | | 18,049 |
Kuehne & Nagel International AG | 197,400 | | 24,586 |
Nestle SA | 2,973,853 | | 172,491 |
Partners Group Holding | 230,056 | | 43,125 |
Schindler Holding AG (participation certificate) | 554,147 | | 65,168 |
The Swatch Group AG (Bearer) | 98,950 | | 41,901 |
Transocean Ltd. (United States) | 829,400 | | 47,400 |
UBS AG (a) | 3,755,130 | | 47,472 |
UBS AG (NY Shares) (a) | 1,833,200 | | 23,135 |
Zurich Financial Services AG | 346,539 | | 80,479 |
TOTAL SWITZERLAND | | 590,315 |
Taiwan - 0.5% |
Catcher Technology Co. Ltd. | 5,046,500 | | 28,117 |
WPG Holding Co. Ltd. | 15,884,570 | | 19,181 |
TOTAL TAIWAN | | 47,298 |
Turkey - 0.1% |
Boyner Buyuk Magazacilik A/S (a)(e) | 6,011,100 | | 10,096 |
United Kingdom - 21.0% |
Aberdeen Asset Management PLC | 9,033,732 | | 27,966 |
Aggreko PLC | 484,300 | | 13,334 |
Anglo American PLC (United Kingdom) | 1,293,300 | | 47,702 |
Ashmore Group PLC | 3,169,400 | | 17,585 |
Aviva PLC | 6,344,300 | | 34,618 |
Barclays PLC | 22,562,258 | | 69,955 |
BG Group PLC | 5,124,372 | | 111,789 |
BHP Billiton PLC | 4,802,296 | | 151,250 |
Common Stocks - continued |
| Shares | | Value (000s) |
United Kingdom - continued |
BP PLC | 11,307,867 | | $ 83,228 |
British American Tobacco PLC (United Kingdom) | 3,366,600 | | 154,388 |
British Land Co. PLC | 5,756,734 | | 47,262 |
Burberry Group PLC | 1,970,900 | | 42,504 |
Carphone Warehouse Group PLC | 15,119,465 | | 85,346 |
Diageo PLC | 1,603,635 | | 33,195 |
GlaxoSmithKline PLC | 3,131,100 | | 70,282 |
HSBC Holdings PLC (United Kingdom) | 11,905,657 | | 103,900 |
Imperial Tobacco Group PLC | 1,488,285 | | 54,427 |
International Personal Finance PLC | 9,411,888 | | 41,503 |
Jazztel PLC (a)(d) | 3,802,400 | | 21,996 |
Legal & General Group PLC | 30,442,457 | | 54,098 |
Lloyds Banking Group PLC (a) | 49,557,364 | | 25,632 |
Micro Focus International PLC | 2,166,900 | | 11,834 |
National Grid PLC | 4,386,000 | | 43,614 |
Ocado Group PLC (a)(d) | 14,388,400 | | 21,670 |
Reckitt Benckiser Group PLC | 414,431 | | 21,314 |
Royal Dutch Shell PLC Class B | 6,770,160 | | 242,949 |
Royalblue Group PLC | 128,356 | | 3,358 |
SuperGroup PLC (a)(d) | 960,741 | | 9,641 |
The Weir Group PLC | 599,600 | | 18,504 |
Ultra Electronics Holdings PLC | 614,667 | | 15,737 |
Vodafone Group PLC | 46,662,143 | | 129,590 |
Xstrata PLC | 1,728,100 | | 29,056 |
TOTAL UNITED KINGDOM | | 1,839,227 |
United States of America - 1.9% |
Citrix Systems, Inc. (a) | 546,700 | | 39,816 |
Cognizant Technology Solutions Corp. Class A (a) | 298,200 | | 21,694 |
Green Mountain Coffee Roasters, Inc. (a) | 180,700 | | 11,749 |
MasterCard, Inc. Class A | 165,200 | | 57,364 |
Virgin Media, Inc. | 1,603,800 | | 39,101 |
TOTAL UNITED STATES OF AMERICA | | 169,724 |
TOTAL COMMON STOCKS (Cost $8,600,939) |
8,627,815
|
Nonconvertible Preferred Stocks - 1.3% |
| Shares | | Value (000s) |
Germany - 1.2% |
ProSiebenSat.1 Media AG | 40,648 | | $ 872 |
Volkswagen AG | 569,500 | | 99,935 |
TOTAL GERMANY | | 100,807 |
Italy - 0.1% |
Fiat Industrial SpA (a) | 2,156,296 | | 13,231 |
TOTAL NONCONVERTIBLE PREFERRED STOCKS (Cost $90,158) |
114,038
|
Money Market Funds - 1.2% |
| | | |
Fidelity Cash Central Fund, 0.12% (b) | 27,641,463 | | 27,641 |
Fidelity Securities Lending Cash Central Fund, 0.11% (b)(c) | 80,899,017 | | 80,899 |
TOTAL MONEY MARKET FUNDS (Cost $108,540) |
108,540
|
TOTAL INVESTMENT PORTFOLIO - 101.1% (Cost $8,799,637) | | 8,850,393 |
NET OTHER ASSETS (LIABILITIES) - (1.1)% | | (97,426) |
NET ASSETS - 100% | $ 8,752,967 |
Legend |
(a) Non-income producing |
(b) Affiliated fund that is available only to investment companies and other accounts managed by Fidelity Investments. The rate quoted is the annualized seven-day yield of the fund at period end. A complete unaudited listing of the fund's holdings as of its most recent quarter end is available upon request. In addition, each Fidelity Central Fund's financial statements, which are not covered by the Fund's Report of Independent Registered Public Accounting Firm, are available on the SEC's website or upon request. |
(c) Investment made with cash collateral received from securities on loan. |
(d) Security or a portion of the security is on loan at period end. |
(e) Affiliated company |
Affiliated Central Funds |
Information regarding fiscal year to date income earned by the Fund from investments in Fidelity Central Funds is as follows: |
Fund | Income earned
(Amounts in thousands) |
Fidelity Cash Central Fund | $ 112 |
Fidelity Securities Lending Cash Central Fund | 6,208 |
Total | $ 6,320 |
Other Affiliated Issuers |
An affiliated company is a company in which the Fund has ownership of at least 5% of the voting securities. Fiscal year to date transactions with companies which are or were affiliates are as follows: |
Affiliate
(Amounts in thousands) | Value, beginning of period | Purchases | Sales Proceeds | Dividend Income | Value,
end of
period |
Aisi Realty Public Ltd. | $ 607 | $ - | $ - | $ - | $ 240 |
Ashmore Global Opportunities Ltd. (United States) | - | 10,376 | - | 259 | - |
Boyner Buyuk Magazacilik A/S | 11,256 | 2,951 | - | - | 10,096 |
Total | $ 11,863 | $ 13,327 | $ - | $ 259 | $ 10,336 |
Other Information |
The following is a summary of the inputs used, as of October 31, 2011, involving the Fund's assets and liabilities carried at fair value. The inputs or methodology used for valuing securities may not be an indication of the risk associated with investing in those securities. For more information on valuation inputs, and their aggregation into the levels used in the tables below, please refer to the Security Valuation section in the accompanying Notes to Financial Statements. |
Valuation Inputs at Reporting Date: |
Description
(Amounts in thousands) | Total | Level 1 | Level 2 | Level 3 |
Investments in Securities: | | | | |
Equities: | | | | |
United Kingdom | $ 1,839,227 | $ 696,626 | $ 1,142,601 | $ - |
Japan | 1,378,900 | - | 1,378,900 | - |
France | 797,586 | 729,399 | 68,187 | - |
Switzerland | 590,315 | 542,843 | 47,472 | - |
Germany | 548,035 | 387,585 | 160,450 | - |
Australia | 303,569 | - | 303,569 | - |
Netherlands | 298,864 | 149,648 | 149,216 | - |
Cayman Islands | 244,145 | 59,272 | 184,873 | - |
Korea (South) | 216,580 | - | 216,580 | - |
Other | 2,524,632 | 1,704,716 | 819,916 | - |
Money Market Funds | 108,540 | 108,540 | - | - |
Total Investments in Securities: | $ 8,850,393 | $ 4,378,629 | $ 4,471,764 | $ - |
Transfers from Level 1 to Level 2 during the period were $1,331,743,000. |
The following is a reconciliation of Investments in Securities for which Level 3 inputs were used in determining value: |
(Amounts in thousands) | |
Investments in Securities: | |
Beginning Balance | $ 607 |
Total Realized Gain (Loss) | - |
Total Unrealized Gain (Loss) | - |
Cost of Purchases | - |
Proceeds of Sales | - |
Amortization/Accretion | - |
Transfers in to Level 3 | - |
Transfers out of Level 3 | (607) |
Ending Balance | $ - |
The change in unrealized gain (loss) for the period attributable to Level 3 securities held at October 31, 2011 | $ - |
The information used in the above reconciliation represents fiscal year to date activity for any Investments in Securities identified as using Level 3 inputs at either the beginning or the end of the current fiscal period. Transfers in or out of Level 3 represent the beginning value of any Security or Instrument where a change in the pricing level occurred from the beginning to the end of the period. The cost of purchases and the proceeds of sales may include securities received or delivered through corporate actions or exchanges. Realized and unrealized gains (losses) disclosed in the reconciliation are included in Net Gain (Loss) on the Fund's Statement of Operations. |
Income Tax Information |
At October 31, 2011, the Fund had a capital loss carryforward of approximately $1,349,541,000 all of which will expire in fiscal 2017. Capital loss carryforwards are only available to offset future capital gains of the Fund to the extent provided by regulations and may be limited. |
See accompanying notes which are an integral part of the financial statements.
Annual Report
Statement of Assets and Liabilities
Amounts in thousands (except per-share amounts) | October 31, 2011 |
| | |
Assets | | |
Investment in securities, at value (including securities loaned of $73,811) - See accompanying schedule: Unaffiliated issuers (cost $8,669,458) | $ 8,731,517 | |
Fidelity Central Funds (cost $108,540) | 108,540 | |
Other affiliated issuers (cost $21,639) | 10,336 | |
Total Investments (cost $8,799,637) | | $ 8,850,393 |
Foreign currency held at value (cost $37,392) | | 37,392 |
Receivable for investments sold | | 89,865 |
Receivable for fund shares sold | | 6,925 |
Dividends receivable | | 18,912 |
Distributions receivable from Fidelity Central Funds | | 280 |
Prepaid expenses | | 35 |
Other receivables | | 5,269 |
Total assets | | 9,009,071 |
| | |
Liabilities | | |
Payable to custodian bank | $ 756 | |
Payable for investments purchased | 155,082 | |
Payable for fund shares redeemed | 11,410 | |
Accrued management fee | 4,698 | |
Distribution and service plan fees payable | 125 | |
Other affiliated payables | 1,638 | |
Other payables and accrued expenses | 1,496 | |
Collateral on securities loaned, at value | 80,899 | |
Total liabilities | | 256,104 |
| | |
Net Assets | | $ 8,752,967 |
Net Assets consist of: | | |
Paid in capital | | $ 10,067,323 |
Undistributed net investment income | | 102,433 |
Accumulated undistributed net realized gain (loss) on investments and foreign currency transactions | | (1,466,813) |
Net unrealized appreciation (depreciation) on investments and assets and liabilities in foreign currencies | | 50,024 |
Net Assets | | $ 8,752,967 |
See accompanying notes which are an integral part of the financial statements.
Annual Report
Financial Statements - continued
Statement of Assets and Liabilities - continued
Amounts in thousands (except per-share amounts) | October 31, 2011 |
| | |
Calculation of Maximum Offering Price Class A: Net Asset Value and redemption price per share
($319,917 ÷ 10,869.3 shares) | | $ 29.43 |
| | |
Maximum offering price per share (100/94.25 of $29.43) | | $ 31.23 |
Class T:
Net Asset Value and redemption price per share ($60,905 ÷ 2,087.0 shares) | | $ 29.18 |
| | |
Maximum offering price per share (100/96.50 of $29.18) | | $ 30.24 |
Class B:
Net Asset Value and offering price per share
($10,183 ÷ 350.9 shares)A | | $ 29.02 |
| | |
Class C:
Net Asset Value and offering price per share
($32,911 ÷ 1,131.9 shares)A | | $ 29.08 |
| | |
International Discovery:
Net Asset Value, offering price and redemption price per share ($6,806,183 ÷ 229,250.8 shares) | | $ 29.69 |
| | |
Class K:
Net Asset Value, offering price and redemption price per share ($1,244,550 ÷ 41,955.8 shares) | | $ 29.66 |
| | |
Institutional Class:
Net Asset Value, offering price and redemption price per share ($278,318 ÷ 9,386.6 shares) | | $ 29.65 |
A Redemption price per share is equal to net asset value less any applicable contingent deferred sales charge.
See accompanying notes which are an integral part of the financial statements.
Annual Report
Statement of Operations
Amounts in thousands | Year ended October 31, 2011 |
| | |
Investment Income | | |
Dividends (including $259 earned from other affiliated issuers) | | $ 263,448 |
Interest | | 3 |
Income from Fidelity Central Funds | | 6,320 |
Income before foreign taxes withheld | | 269,771 |
Less foreign taxes withheld | | (16,970) |
Total income | | 252,801 |
| | |
Expenses | | |
Management fee
Basic fee | $ 69,910 | |
Performance adjustment | (475) | |
Transfer agent fees | 20,262 | |
Distribution and service plan fees | 1,864 | |
Accounting and security lending fees | 1,798 | |
Custodian fees and expenses | 1,713 | |
Independent trustees' compensation | 55 | |
Registration fees | 186 | |
Audit | 122 | |
Legal | 40 | |
Interest | 2 | |
Miscellaneous | 107 | |
Total expenses before reductions | 95,584 | |
Expense reductions | (4,391) | 91,193 |
Net investment income (loss) | | 161,608 |
Realized and Unrealized Gain (Loss) Net realized gain (loss) on: | | |
Investment securities: | | |
Unaffiliated issuers | 506,179 | |
Foreign currency transactions | (4,241) | |
Total net realized gain (loss) | | 501,938 |
Change in net unrealized appreciation (depreciation) on: Investment securities (net of decrease in deferred foreign taxes of $8,547) | (1,246,049) | |
Assets and liabilities in foreign currencies | (1,473) | |
Total change in net unrealized appreciation (depreciation) | | (1,247,522) |
Net gain (loss) | | (745,584) |
Net increase (decrease) in net assets resulting from operations | | $ (583,976) |
See accompanying notes which are an integral part of the financial statements.
Annual Report
Financial Statements - continued
Statement of Changes in Net Assets
Amounts in thousands | Year ended
October 31,
2011 | Year ended
October 31,
2010 |
Increase (Decrease) in Net Assets | | |
Operations | | |
Net investment income (loss) | $ 161,608 | $ 130,595 |
Net realized gain (loss) | 501,938 | 481,821 |
Change in net unrealized appreciation (depreciation) | (1,247,522) | 638,780 |
Net increase (decrease) in net assets resulting
from operations | (583,976) | 1,251,196 |
Distributions to shareholders from net investment income | (149,936) | (116,422) |
Distributions to shareholders from net realized gain | (48,090) | (13,374) |
Total distributions | (198,026) | (129,796) |
Share transactions - net increase (decrease) | (537,341) | (662,032) |
Redemption fees | 160 | 291 |
Total increase (decrease) in net assets | (1,319,183) | 459,659 |
| | |
Net Assets | | |
Beginning of period | 10,072,150 | 9,612,491 |
End of period (including undistributed net investment income of $102,433 and undistributed net investment income of $120,198, respectively) | $ 8,752,967 | $ 10,072,150 |
See accompanying notes which are an integral part of the financial statements.
Annual Report
Financial Highlights - Class A
Years ended October 31, | 2011 | 2010 | 2009 | 2008 | 2007 |
Selected Per-Share Data | | | | | |
Net asset value, beginning of period | $ 32.07 | $ 28.57 | $ 23.68 | $ 47.34 | $ 36.47 |
Income from Investment Operations | | | | | |
Net investment income (loss) C | .42 | .31 | .31 | .46 | .44 |
Net realized and unrealized gain (loss) | (2.52) | 3.51 | 4.84 | (22.08) | 11.76 |
Total from investment operations | (2.10) | 3.82 | 5.15 | (21.62) | 12.20 |
Distributions from net investment income | (.38) | (.28) | (.26) | (.37) | (.35) |
Distributions from net realized gain | (.16) | (.04) | - | (1.67) | (.98) |
Total distributions | (.54) | (.32) | (.26) | (2.04) | (1.33) |
Redemption fees added to paid in capital C,G | - | - | - | - | - |
Net asset value, end of period | $ 29.43 | $ 32.07 | $ 28.57 | $ 23.68 | $ 47.34 |
Total Return A,B | (6.71)% | 13.43% | 22.14% | (47.65)% | 34.54% |
Ratios to Average Net Assets D,F | | | | | |
Expenses before reductions | 1.30% | 1.33% | 1.37% | 1.32% | 1.25% |
Expenses net of fee waivers, if any | 1.29% | 1.33% | 1.37% | 1.32% | 1.25% |
Expenses net of all reductions | 1.25% | 1.28% | 1.32% | 1.29% | 1.22% |
Net investment income (loss) | 1.31% | 1.06% | 1.28% | 1.27% | 1.08% |
Supplemental Data | | | | | |
Net assets, end of period (in millions) | $ 320 | $ 392 | $ 414 | $ 380 | $ 417 |
Portfolio turnover rate E | 75% | 82% | 98% | 79% | 56% |
A Total returns would have been lower if certain expenses had not been reduced during the applicable periods shown.
B Total returns do not include the effect of the sales charges.
C Calculated based on average shares outstanding during the period.
D Fees and expenses of any underlying Fidelity Central Funds are not included in the Fund's expense ratio. The Fund indirectly bears its proportionate share of the expenses of any underlying Fidelity Central Funds.
E Amount does not include the portfolio activity of any underlying Fidelity Central Funds.
F Expense ratios reflect operating expenses of the class. Expenses before reductions do not reflect amounts reimbursed by the investment adviser or reductions from brokerage service arrangements or reductions from other expense offset arrangements and do not represent the amount paid by the class during periods when reimbursements or reductions occur. Expenses net of fee waivers reflect expenses after reimbursement by the investment adviser but prior to reductions from brokerage service arrangements or other expense offset arrangements. Expenses net of all reductions represent the net expenses paid by the class.
G Amount represents less than $.01 per share.
See accompanying notes which are an integral part of the financial statements.
Annual Report
Financial Highlights - Class T
Years ended October 31, | 2011 | 2010 | 2009 | 2008 | 2007 |
Selected Per-Share Data | | | | | |
Net asset value, beginning of period | $ 31.81 | $ 28.35 | $ 23.49 | $ 47.06 | $ 36.30 |
Income from Investment Operations | | | | | |
Net investment income (loss) C | .34 | .23 | .24 | .33 | .29 |
Net realized and unrealized gain (loss) | (2.51) | 3.48 | 4.81 | (21.94) | 11.71 |
Total from investment operations | (2.17) | 3.71 | 5.05 | (21.61) | 12.00 |
Distributions from net investment income | (.30) | (.21) | (.19) | (.29) | (.26) |
Distributions from net realized gain | (.16) | (.04) | - | (1.67) | (.98) |
Total distributions | (.46) | (.25) | (.19) | (1.96) | (1.24) |
Redemption fees added to paid in capital C,G | - | - | - | - | - |
Net asset value, end of period | $ 29.18 | $ 31.81 | $ 28.35 | $ 23.49 | $ 47.06 |
Total Return A,B | (6.96)% | 13.14% | 21.79% | (47.84)% | 34.08% |
Ratios to Average Net Assets D,F | | | | | |
Expenses before reductions | 1.56% | 1.60% | 1.65% | 1.68% | 1.63% |
Expenses net of fee waivers, if any | 1.55% | 1.60% | 1.65% | 1.68% | 1.63% |
Expenses net of all reductions | 1.51% | 1.56% | 1.60% | 1.64% | 1.60% |
Net investment income (loss) | 1.05% | .79% | 1.00% | .91% | .70% |
Supplemental Data | | | | | |
Net assets, end of period (in millions) | $ 61 | $ 92 | $ 83 | $ 64 | $ 53 |
Portfolio turnover rate E | 75% | 82% | 98% | 79% | 56% |
A Total returns would have been lower if certain expenses had not been reduced during the applicable periods shown.
B Total returns do not include the effect of the sales charges.
C Calculated based on average shares outstanding during the period.
D Fees and expenses of any underlying Fidelity Central Funds are not included in the Fund's expense ratio. The Fund indirectly bears its proportionate share of the expenses of any underlying Fidelity Central Funds.
E Amount does not include the portfolio activity of any underlying Fidelity Central Funds.
F Expense ratios reflect operating expenses of the class. Expenses before reductions do not reflect amounts reimbursed by the investment adviser or reductions from brokerage service arrangements or reductions from other expense offset arrangements and do not represent the amount paid by the class during periods when reimbursements or reductions occur. Expenses net of fee waivers reflect expenses after reimbursement by the investment adviser but prior to reductions from brokerage service arrangements or other expense offset arrangements. Expenses net of all reductions represent the net expenses paid by the class.
G Amount represents less than $.01 per share.
See accompanying notes which are an integral part of the financial statements.
Annual Report
Financial Highlights - Class B
Years ended October 31, | 2011 | 2010 | 2009 | 2008 | 2007 |
Selected Per-Share Data | | | | | |
Net asset value, beginning of period | $ 31.60 | $ 28.18 | $ 23.25 | $ 46.70 | $ 36.12 |
Income from Investment Operations | | | | | |
Net investment income (loss) C | .17 | .08 | .12 | .15 | .08 |
Net realized and unrealized gain (loss) | (2.48) | 3.44 | 4.81 | (21.77) | 11.64 |
Total from investment operations | (2.31) | 3.52 | 4.93 | (21.62) | 11.72 |
Distributions from net investment income | (.12) | (.06) | - | (.16) | (.16) |
Distributions from net realized gain | (.16) | (.04) | - | (1.67) | (.98) |
Total distributions | (.27) H | (.10) | - | (1.83) | (1.14) |
Redemption fees added to paid in capital C,G | - | - | - | - | - |
Net asset value, end of period | $ 29.02 | $ 31.60 | $ 28.18 | $ 23.25 | $ 46.70 |
Total Return A,B | (7.39)% | 12.52% | 21.20% | (48.11)% | 33.37% |
Ratios to Average Net Assets D,F | | | | | |
Expenses before reductions | 2.06% | 2.12% | 2.16% | 2.19% | 2.14% |
Expenses net of fee waivers, if any | 2.06% | 2.12% | 2.16% | 2.19% | 2.14% |
Expenses net of all reductions | 2.02% | 2.08% | 2.11% | 2.15% | 2.10% |
Net investment income (loss) | .54% | .27% | .49% | .40% | .19% |
Supplemental Data | | | | | |
Net assets, end of period (in millions) | $ 10 | $ 14 | $ 16 | $ 15 | $ 17 |
Portfolio turnover rate E | 75% | 82% | 98% | 79% | 56% |
A Total returns would have been lower if certain expenses had not been reduced during the applicable periods shown.
B Total returns do not include the effect of the contingent deferred sales charge.
C Calculated based on average shares outstanding during the period.
D Fees and expenses of any underlying Fidelity Central Funds are not included in the Fund's expense ratio. The Fund indirectly bears its proportionate share of the expenses of any underlying Fidelity Central Funds.
E Amount does not include the portfolio activity of any underlying Fidelity Central Funds.
F Expense ratios reflect operating expenses of the class. Expenses before reductions do not reflect amounts reimbursed by the investment adviser or reductions from brokerage service arrangements or reductions from other expense offset arrangements and do not represent the amount paid by the class during periods when reimbursements or reductions occur. Expenses net of fee waivers reflect expenses after reimbursement by the investment adviser but prior to reductions from brokerage service arrangements or other expense offset arrangements. Expenses net of all reductions represent the net expenses paid by the class.
G Amount represents less than $.01 per share.
H Total distributions of $.27 per share is comprised of distributions from net investment income of $.115 and distributions from net realized gain of $.155 per share.
See accompanying notes which are an integral part of the financial statements.
Annual Report
Financial Highlights - Class C
Years ended October 31, | 2011 | 2010 | 2009 | 2008 | 2007 |
Selected Per-Share Data | | | | | |
Net asset value, beginning of period | $ 31.68 | $ 28.23 | $ 23.31 | $ 46.82 | $ 36.19 |
Income from Investment Operations | | | | | |
Net investment income (loss) C | .18 | .09 | .12 | .15 | .09 |
Net realized and unrealized gain (loss) | (2.49) | 3.45 | 4.82 | (21.82) | 11.66 |
Total from investment operations | (2.31) | 3.54 | 4.94 | (21.67) | 11.75 |
Distributions from net investment income | (.14) | (.05) | (.02) | (.17) | (.14) |
Distributions from net realized gain | (.16) | (.04) | - | (1.67) | (.98) |
Total distributions | (.29) H | (.09) | (.02) | (1.84) | (1.12) |
Redemption fees added to paid in capital C,G | - | - | - | - | - |
Net asset value, end of period | $ 29.08 | $ 31.68 | $ 28.23 | $ 23.31 | $ 46.82 |
Total Return A,B | (7.37)% | 12.54% | 21.22% | (48.10)% | 33.38% |
Ratios to Average Net Assets D,F | | | | | |
Expenses before reductions | 2.05% | 2.09% | 2.14% | 2.17% | 2.11% |
Expenses net of fee waivers, if any | 2.04% | 2.09% | 2.14% | 2.17% | 2.11% |
Expenses net of all reductions | 2.00% | 2.05% | 2.09% | 2.13% | 2.08% |
Net investment income (loss) | .56% | .30% | .51% | .42% | .22% |
Supplemental Data | | | | | |
Net assets, end of period (in millions) | $ 33 | $ 44 | $ 43 | $ 36 | $ 28 |
Portfolio turnover rate E | 75% | 82% | 98% | 79% | 56% |
A Total returns would have been lower if certain expenses had not been reduced during the applicable periods shown.
B Total returns do not include the effect of the contingent deferred sales charge.
C Calculated based on average shares outstanding during the period.
D Fees and expenses of any underlying Fidelity Central Funds are not included in the Fund's expense ratio. The Fund indirectly bears its proportionate share of the expenses of any underlying Fidelity Central Funds.
E Amount does not include the portfolio activity of any underlying Fidelity Central Funds.
F Expense ratios reflect operating expenses of the class. Expenses before reductions do not reflect amounts reimbursed by the investment adviser or reductions from brokerage service arrangements or reductions from other expense offset arrangements and do not represent the amount paid by the class during periods when reimbursements or reductions occur. Expenses net of fee waivers reflect expenses after reimbursement by the investment adviser but prior to reductions from brokerage service arrangements or other expense offset arrangements. Expenses net of all reductions represent the net expenses paid by the class.
G Amount represents less than $.01 per share.
H Total distributions of $.29 per share is comprised of distributions from net investment income of $.137 and distributions from net realized gain of $.155 per share.
See accompanying notes which are an integral part of the financial statements.
Annual Report
Financial Highlights - International Discovery
Years ended October 31, | 2011 | 2010 | 2009 | 2008 | 2007 |
Selected Per-Share Data | | | | | |
Net asset value, beginning of period | $ 32.34 | $ 28.79 | $ 23.88 | $ 47.68 | $ 36.67 |
Income from Investment Operations | | | | | |
Net investment income (loss) B | .53 | .40 | .37 | .57 | .53 |
Net realized and unrealized gain (loss) | (2.54) | 3.54 | 4.88 | (22.29) | 11.84 |
Total from investment operations | (2.01) | 3.94 | 5.25 | (21.72) | 12.37 |
Distributions from net investment income | (.48) | (.35) | (.34) | (.41) | (.38) |
Distributions from net realized gain | (.16) | (.04) | - | (1.67) | (.98) |
Total distributions | (.64) | (.39) | (.34) | (2.08) | (1.36) |
Redemption fees added to paid in capital B,F | - | - | - | - | - |
Net asset value, end of period | $ 29.69 | $ 32.34 | $ 28.79 | $ 23.88 | $ 47.68 |
Total Return A | (6.39)% | 13.76% | 22.47% | (47.55)% | 34.85% |
Ratios to Average Net Assets C,E | | | | | |
Expenses before reductions | .97% | 1.05% | 1.12% | 1.09% | 1.04% |
Expenses net of fee waivers, if any | .96% | 1.05% | 1.12% | 1.09% | 1.04% |
Expenses net of all reductions | .92% | 1.00% | 1.07% | 1.05% | 1.00% |
Net investment income (loss) | 1.64% | 1.35% | 1.53% | 1.51% | 1.30% |
Supplemental Data | | | | | |
Net assets, end of period (in millions) | $ 6,806 | $ 8,133 | $ 8,114 | $ 6,999 | $ 14,176 |
Portfolio turnover rate D | 75% | 82% | 98% | 79% | 56% |
A Total returns would have been lower if certain expenses had not been reduced during the applicable periods shown.
B Calculated based on average shares outstanding during the period.
C Fees and expenses of any underlying Fidelity Central Funds are not included in the Fund's expense ratio. The Fund indirectly bears its proportionate share of the expenses of any underlying Fidelity Central Funds.
D Amount does not include the portfolio activity of any underlying Fidelity Central Funds.
E Expense ratios reflect operating expenses of the class. Expenses before reductions do not reflect amounts reimbursed by the investment adviser or reductions from brokerage service arrangements or reductions from other expense offset arrangements and do not represent the amount paid by the class during periods when reimbursements or reductions occur. Expenses net of fee waivers reflect expenses after reimbursement by the investment adviser but prior to reductions from brokerage service arrangements or other expense offset arrangements. Expenses net of all reductions represent the net expenses paid by the class.
F Amount represents less than $.01 per share.
See accompanying notes which are an integral part of the financial statements.
Annual Report
Financial Highlights - Class K
Years ended October 31, | 2011 | 2010 | 2009 | 2008 G |
Selected Per-Share Data | | | | |
Net asset value, beginning of period | $ 32.32 | $ 28.78 | $ 23.90 | $ 40.32 |
Income from Investment Operations | | | | |
Net investment income (loss) D | .58 | .46 | .44 | .10 |
Net realized and unrealized gain (loss) | (2.54) | 3.53 | 4.86 | (16.52) |
Total from investment operations | (1.96) | 3.99 | 5.30 | (16.42) |
Distributions from net investment income | (.55) | (.41) | (.42) | - |
Distributions from net realized gain | (.16) | (.04) | - | - |
Total distributions | (.70)J | (.45) | (.42) | - |
Redemption fees added to paid in capital D,I | - | - | - | - |
Net asset value, end of period | $ 29.66 | $ 32.32 | $ 28.78 | $ 23.90 |
Total Return B,C | (6.24)% | 13.96% | 22.80% | (40.72)% |
Ratios to Average Net Assets E,H | | | | |
Expenses before reductions | .80% | .84% | .88% | .93% A |
Expenses net of fee waivers, if any | .79% | .84% | .88% | .93% A |
Expenses net of all reductions | .75% | .79% | .83% | .89% A |
Net investment income (loss) | 1.81% | 1.55% | 1.77% | .83% A |
Supplemental Data | | | | |
Net assets, end of period (in millions) | $ 1,245 | $ 1,078 | $ 674 | $ 145 |
Portfolio turnover rate F | 75% | 82% | 98% | 79% |
A Annualized
B Total returns for periods of less than one year are not annualized.
C Total returns would have been lower if certain expenses had not been reduced during the applicable periods shown.
D Calculated based on average shares outstanding during the period.
E Fees and expenses of any underlying Fidelity Central Funds are not included in the Fund's expense ratio. The Fund indirectly bears its proportionate share of the expenses of any underlying Fidelity Central Funds.
F Amount does not include the portfolio activity of any underlying Fidelity Central Funds.
G For the period May 9, 2008 (commencement of sale of shares) to October 31, 2008.
H Expense ratios reflect operating expenses of the class. Expenses before reductions do not reflect amounts reimbursed by the investment adviser or reductions from brokerage service arrangements or reductions from other expense offset arrangements and do not represent the amount paid by the class during periods when reimbursements or reductions occur. Expense ratios before reductions for start-up periods may not be representative of longer-term operating periods. Expenses net of fee waivers reflect expenses after reimbursement by the investment adviser but prior to reductions from brokerage service arrangements or other expense offset arrangements. Expenses net of all reductions represent the net expenses paid by the class.
I Amount represents less than $.01 per share.
J Total distributions of $.70 per share is comprised of distributions from net investment income of $.548 and distributions from net realized gain of $.155 per share.
See accompanying notes which are an integral part of the financial statements.
Annual Report
Financial Highlights - Institutional Class
Years ended October 31, | 2011 | 2010 | 2009 | 2008 | 2007 |
Selected Per-Share Data | | | | | |
Net asset value, beginning of period | $ 32.31 | $ 28.77 | $ 23.91 | $ 47.73 | $ 36.71 |
Income from Investment Operations | | | | | |
Net investment income (loss) B | .54 | .41 | .39 | .53 | .55 |
Net realized and unrealized gain (loss) | (2.55) | 3.55 | 4.86 | (22.24) | 11.85 |
Total from investment operations | (2.01) | 3.96 | 5.25 | (21.71) | 12.40 |
Distributions from net investment income | (.50) | (.38) | (.39) | (.44) | (.40) |
Distributions from net realized gain | (.16) | (.04) | - | (1.67) | (.98) |
Total distributions | (.65) G | (.42) | (.39) | (2.11) | (1.38) |
Redemption fees added to paid in capital B,F | - | - | - | - | - |
Net asset value, end of period | $ 29.65 | $ 32.31 | $ 28.77 | $ 23.91 | $ 47.73 |
Total Return A | (6.39)% | 13.84% | 22.52% | (47.51)% | 34.93% |
Ratios to Average Net Assets C, E | | | | | |
Expenses before reductions | .95% | .99% | 1.05% | 1.05% | .97% |
Expenses net of fee waivers, if any | .94% | .99% | 1.05% | 1.05% | .97% |
Expenses net of all reductions | .90% | .95% | 1.00% | 1.01% | .94% |
Net investment income (loss) | 1.66% | 1.40% | 1.60% | 1.54% | 1.36% |
Supplemental Data | | | | | |
Net assets, end of period (in millions) | $ 278 | $ 319 | $ 267 | $ 159 | $ 58 |
Portfolio turnover rate D | 75% | 82% | 98% | 79% | 56% |
A Total returns would have been lower if certain expenses had not been reduced during the applicable periods shown.
B Calculated based on average shares outstanding during the period.
C Fees and expenses of any underlying Fidelity Central Funds are not included in the Fund's expense ratio. The Fund indirectly bears its proportionate share of the expenses of any underlying Fidelity Central Funds.
D Amount does not include the portfolio activity of any underlying Fidelity Central Funds.
E Expense ratios reflect operating expenses of the class. Expenses before reductions do not reflect amounts reimbursed by the investment adviser or reductions from brokerage service arrangements or reductions from other expense offset arrangements and do not represent the amount paid by the class during periods when reimbursements or reductions occur. Expenses net of fee waivers reflect expenses after reimbursement by the investment adviser but prior to reductions from brokerage service arrangements or other expense offset arrangements. Expenses net of all reductions represent the net expenses paid by the class.
F Amount represents less than $.01 per share.
G Total distributions of $.65 per share is comprised of distributions from net investment income of $.497 and distributions from net realized gain of $.155 per share.
See accompanying notes which are an integral part of the financial statements.
Annual Report
Notes to Financial Statements
For the period ended October 31, 2011
(Amounts in thousands except percentages)
1. Organization.
Fidelity International Discovery Fund (the Fund) is a fund of Fidelity Investment Trust (the Trust) and is authorized to issue an unlimited number of shares. The Trust is registered under the Investment Company Act of 1940, as amended (the 1940 Act), as an open-end management investment company organized as a Massachusetts business trust. The Fund offers Class A, Class T, Class C, International Discovery, Class K and Institutional Class shares, each of which, along with Class B shares, has equal rights as to assets and voting privileges. Effective after the close of business on September 1, 2010, Class B shares were closed to new accounts and additional purchases, except for exchanges and reinvestments by existing shareholders. Each class has exclusive voting rights with respect to matters that affect that class. Class B shares will automatically convert to Class A shares after a holding period of seven years from the initial date of purchase. Investment income, realized and unrealized capital gains and losses, the common expenses of the Fund, and certain fund-level expense reductions, if any, are allocated on a pro-rata basis to each class based on the relative net assets of each class to the total net assets of the Fund. Each class differs with respect to transfer agent and distribution and service plan fees incurred. Certain expense reductions may also differ by class. The Fund's investments in emerging markets can be subject to social, economic, regulatory and political uncertainties and can be extremely volatile.
2. Investments in Fidelity Central Funds.
The Fund invests in Fidelity Central Funds, which are open-end investment companies available only to other investment companies and accounts managed by Fidelity Management & Research Company (FMR) and its affiliates. The Fund's Schedule of Investments lists each of the Fidelity Central Funds held as of period end, if any, as an investment of the Fund, but does not include the underlying holdings of each Fidelity Central Fund. As an Investing Fund, the Fund indirectly bears its proportionate share of the expenses of the underlying Fidelity Central Funds.
The Money Market Central Funds seek preservation of capital and current income and are managed by Fidelity Investments Money Management, Inc. (FIMM), an affiliate of FMR.
A complete unaudited list of holdings for each Fidelity Central Fund is available upon request or at the Securities and Exchange Commission (the SEC) web site at www.sec.gov. In addition, the financial statements of the Fidelity Central Funds, which are not covered by the Fund's Report of Independent Registered Public Accounting Firm, are available on the SEC web site or upon request.
Annual Report
Notes to Financial Statements - continued
(Amounts in thousands except percentages)
3. Significant Accounting Policies.
The financial statements have been prepared in conformity with accounting principles generally accepted in the United States of America (GAAP), which require management to make certain estimates and assumptions at the date of the financial statements. Actual results could differ from those estimates. Subsequent events, if any, through the date that the financial statements were issued have been evaluated in the preparation of the financial statements. The following summarizes the significant accounting policies of the Fund:
Security Valuation. Investments are valued as of 4:00 p.m. Eastern time on the last calendar day of the period. The Fund uses independent pricing services approved by the Board of Trustees to value its investments. When current market prices or quotations are not readily available or reliable, valuations may be determined in good faith in accordance with procedures adopted by the Board of Trustees. Factors used in determining value may include market or security specific events. The frequency with which these procedures are used cannot be predicted and they may be utilized to a significant extent. The value used for net asset value (NAV) calculation under these procedures may differ from published prices for the same securities.
The Fund categorizes the inputs to valuation techniques used to value its investments into a disclosure hierarchy consisting of three levels as shown below:
Level 1 - quoted prices in active markets for identical investments
Level 2 - other significant observable inputs (including quoted prices for similar investments, interest rates, prepayment speeds, etc.)
Level 3 - unobservable inputs (including the Fund's own assumptions based on the best information available)
Changes in valuation techniques may result in transfers in or out of an assigned level within the disclosure hierarchy. The aggregate value of investments by input level, as of October 31, 2011, as well as a roll forward of Level 3 securities, is included at the end of the Fund's Schedule of Investments. Valuation techniques used to value the Fund's investments by major category are as follows:
Equity securities, including restricted securities, for which market quotations are readily available, are valued at the last reported sale price or official closing price as reported by an independent pricing service on the primary market or exchange on which they are traded and are categorized as Level 1 in the hierarchy. In the event there were no sales during the day or closing prices are not available, securities are valued at the last quoted bid price or may be valued using the last available price and are generally categorized as Level 2 in the hierarchy. For foreign equity securities, when significant market or security specific events arise, comparisons to the valuation of American Depositary Receipts
Annual Report
3. Significant Accounting Policies - continued
Security Valuation - continued
(ADRs), futures contracts, Exchange-traded funds (ETFs) and certain indexes as well as quoted prices for similar securities are used and are categorized as Level 2 in the hierarchy in these circumstances. Utilizing these techniques may result in transfers between Level 1 and Level 2. For restricted equity securities and private placements where observable inputs are limited, assumptions about market activity and risk are used and are categorized as Level 3 in the hierarchy.
Investments in open-end mutual funds, including the Fidelity Central Funds, are valued at their closing net asset value each business day and are categorized as Level 1 in the hierarchy.
Foreign Currency. The Fund may use foreign currency contracts to facilitate transactions in foreign-denominated securities. Gains and losses from these transactions may arise from changes in the value of the foreign currency or if the counterparties do not perform under the contracts' terms.
Foreign-denominated assets, including investment securities, and liabilities are translated into U.S. dollars at the exchange rate at period end. Purchases and sales of investment securities, income and dividends received and expenses denominated in foreign currencies are translated into U.S. dollars at the exchange rate in effect on the transaction date.
The effects of exchange rate fluctuations on investments are included with the net realized and unrealized gain (loss) on investment securities. Other foreign currency transactions resulting in realized and unrealized gain (loss) are disclosed separately.
Investment Transactions and Income. For financial reporting purposes, the Fund's investment holdings and NAV include trades executed through the end of the last business day of the period. The NAV per share for processing shareholder transactions is calculated as of the close of business of the New York Stock Exchange (NYSE), normally 4:00 p.m. Eastern time and includes trades executed through the end of the prior business day. Gains and losses on securities sold are determined on the basis of identified cost and may include proceeds received from litigation. Dividend income is recorded on the ex-dividend date, except for certain dividends from foreign securities where the ex-dividend date may have passed, which are recorded as soon as the Fund is informed of the ex-dividend date. Non-cash dividends included in dividend income, if any, are recorded at the fair market value of the securities received. Distributions received on securities that represent a return of capital or capital gain are recorded as a reduction of cost of investments and/or as a realized gain. The Fund estimates the components of distributions received that may be considered return of capital distributions or capital
Annual Report
Notes to Financial Statements - continued
(Amounts in thousands except percentages)
3. Significant Accounting Policies - continued
Investment Transactions and Income - continued
gain distributions. Interest income and distributions from the Fidelity Central Funds are accrued as earned. Interest income includes coupon interest and amortization of premium and accretion of discount on debt securities. Investment income is recorded net of foreign taxes withheld where recovery of such taxes is uncertain.
Expenses. Expenses directly attributable to a fund are charged to that fund. Expenses attributable to more than one fund are allocated among the respective funds on the basis of relative net assets or other appropriate methods. Expense estimates are accrued in the period to which they relate and adjustments are made when actual amounts are known.
Deferred Trustee Compensation. Under a Deferred Compensation Plan (the Plan), independent Trustees may elect to defer receipt of a portion of their annual compensation. Deferred amounts are invested in a cross-section of Fidelity funds, are marked-to-market and remain in the Fund until distributed in accordance with the Plan. The investment of deferred amounts and the offsetting payable to the Trustees are included in the accompanying Statement of Assets and Liabilities.
Income Tax Information and Distributions to Shareholders. Each year, the Fund intends to qualify as a regulated investment company, including distributing substantially all of its taxable income and realized gains under Subchapter M of the Internal Revenue Code and filing its U.S. federal tax return. As a result, no provision for income taxes is required. As of October 31, 2011, the Fund did not have any unrecognized tax benefits in the financial statements. A fund's federal tax return is subject to examination by the Internal Revenue Service (IRS) for a period of three years. Foreign taxes are provided for based on the Fund's understanding of the tax rules and rates that exist in the foreign markets in which it invests. The Fund is subject to a tax imposed on realized short term capital gains on securities of certain issuers domiciled in India. An estimated deferred tax liability for net unrealized gains on these securities is included in Other payables and accrued expenses on the Statement of Assets and Liabilities.
Distributions are declared and recorded on the ex-dividend date. Income dividends and capital gain distributions are declared separately for each class. Income and capital gain distributions are determined in accordance with income tax regulations, which may differ from GAAP.
Capital accounts within the financial statements are adjusted for permanent book-tax differences. These adjustments have no impact on net assets or the results of operations. Temporary book-tax differences will reverse in a subsequent period.
Annual Report
3. Significant Accounting Policies - continued
Income Tax Information and Distributions to Shareholders - continued
Book-tax differences are primarily due to foreign currency transactions, certain foreign taxes, passive foreign investment companies (PFIC), deferred trustees compensation, capital loss carryforwards and losses deferred due to wash sales.
The federal tax cost of investment securities and unrealized appreciation (depreciation) as of period end were as follows:
Gross unrealized appreciation | $ 930,158 |
Gross unrealized depreciation | (996,674) |
Net unrealized appreciation (depreciation) on securities and other investments | $ (66,516) |
| |
Tax Cost | $ 8,916,909 |
The tax-based components of distributable earnings as of period end were as follows:
Undistributed ordinary income | $ 102,538 |
Capital loss carryforward | $ (1,349,541) |
Net unrealized appreciation (depreciation) | $ (66,186) |
Under the recently enacted Regulated Investment Company Modernization Act of 2010 (the Act), the Fund will be permitted to carry forward capital losses incurred in taxable years beginning after December 22, 2010 for an unlimited period. However, any losses incurred during those future taxable years will be required to be utilized prior to any losses incurred in pre-enactment taxable years, which generally expire after eight years from when they are incurred. Additionally, post-enactment capital losses that are carried forward will retain their character as either short-term or long-term capital losses rather than being considered all short-term as under previous law. The Fund's first fiscal year end subject to the Act will be October 31, 2012.
The tax character of distributions paid was as follows:
| October 31, 2011 | October 31, 2010 |
Ordinary Income | $ 198,026 | $ 129,796 |
Annual Report
Notes to Financial Statements - continued
(Amounts in thousands except percentages)
3. Significant Accounting Policies - continued
Short-Term Trading (Redemption) Fees. Shares held by investors in the Fund less than 30 days are subject to a redemption fee equal to 1.00% of the net asset value of shares redeemed. All redemption fees, which reduce the proceeds of the shareholder redemption, are retained by the Fund and accounted for as an addition to paid in capital.
New Accounting Pronouncement. In May 2011, the Financial Accounting Standards Board issued Accounting Standard Update No. 2011-04, Fair Value Measurement (Topic 820) - Amendments to Achieve Common Fair Value Measurement and Disclosure Requirements in U.S. GAAP and IFRSs. The update changes the wording used to describe the requirements in GAAP for measuring fair value and for disclosing information about fair value measurements. The update is effective during interim and annual periods beginning after December 15, 2011. Management is currently evaluating the impact of the update's adoption on the Fund's financial statement disclosures.
4. Purchases and Sales of Investments.
Purchases and sales of securities, other than short-term securities, aggregated $7,388,928 and $7,826,467, respectively.
5. Fees and Other Transactions with Affiliates.
Management Fee. FMR and its affiliates provide the Fund with investment management related services for which the Fund pays a monthly management fee. The management fee is the sum of an individual fund fee rate that is based on an annual rate of .45% of the Fund's average net assets and a group fee rate that averaged .26% during the period. The group fee rate is based upon the average net assets of all the mutual funds advised by FMR. The group fee rate decreases as assets under management increase and increases as assets under management decrease. In addition, the management fee is subject to a performance adjustment (up to a maximum of ± .20% of the Fund's average net assets over a 36 month performance period). The upward or downward adjustment to the management fee is based on the relative investment performance of International Discovery as compared to an appropriate benchmark index. For the period, the total annual management fee rate, including the performance adjustment, was .70% of the Fund's average net assets.
Distribution and Service Plan Fees. In accordance with Rule 12b-1 of the 1940 Act, the Fund has adopted separate Distribution and Service Plans for each class of shares. Certain classes pay Fidelity Distributors Corporation (FDC), an affiliate of FMR, separate Distribution and Service Fees, each of which is based on an annual percentage of each class' average net assets. In addition, FDC may pay financial intermediaries for selling shares of the Fund and providing shareholder support services. For the period, the Distribution and Service Fee rates, total fees and amounts retained by FDC were as follows:
Annual Report
5. Fees and Other Transactions with Affiliates - continued
Distribution and Service Plan Fees - continued
| Distribution
Fee | Service
Fee | Total Fees | Retained
by FDC |
Class A | -% | .25% | $ 937 | $ 19 |
Class T | .25% | .25% | 398 | 1 |
Class B | .75% | .25% | 130 | 98 |
Class C | .75% | .25% | 399 | 30 |
| | | $ 1,864 | $ 148 |
Sales Load. FDC may receive a front-end sales charge of up to 5.75% for selling Class A shares, and 3.50% for selling Class T shares, some of which is paid to financial intermediaries for selling shares of the Fund. Depending on the holding period, FDC may receive contingent deferred sales charges levied on Class A, Class T, Class B, and Class C redemptions. The deferred sales charges range from 5% to 1% for Class B, 1% for Class C, 1.00% for certain purchases of Class A shares and .25% for certain purchases of Class T shares.
For the period, sales charge amounts retained by FDC were as follows:
| Retained
by FDC |
Class A | $ 56 |
Class T | 11 |
Class B* | 21 |
Class C* | 3 |
| $ 91 |
* When Class B and Class C shares are initially sold, FDC pays commissions from its own resources to financial intermediaries through which the sales are made.
Transfer Agent Fees. Fidelity Investments Institutional Operations Company, Inc. (FIIOC), an affiliate of FMR, is the transfer, dividend disbursing and shareholder servicing agent for each class of the Fund. FIIOC receives account fees and asset-based fees that vary according to the account size and type of account of the shareholders of the respective classes of the Fund, except for Class K. FIIOC receives an asset-based fee of Class K's average net assets. FIIOC pays for typesetting, printing and mailing of shareholder reports, except proxy statements. For the period, transfer agent fees for each class were as follows:
Annual Report
Notes to Financial Statements - continued
(Amounts in thousands except percentages)
5. Fees and Other Transactions with Affiliates - continued
Transfer Agent Fees - continued
| Amount | % of
Average
Net Assets |
Class A | $ 1,138 | .30 |
Class T | 248 | .31 |
Class B | 41 | .31 |
Class C | 121 | .30 |
International Discovery | 17,436 | .22 |
Class K | 638 | .05 |
Institutional Class | 640 | .20 |
| $ 20,262 | |
Accounting and Security Lending Fees. Fidelity Service Company, Inc. (FSC), an affiliate of FMR, maintains the Fund's accounting records. The accounting fee is based on the level of average net assets for the month. Under a separate contract, FSC administers the security lending program. The security lending fee is based on the number and duration of lending transactions.
Brokerage Commissions. The Fund placed a portion of its portfolio transactions with brokerage firms which are affiliates of the investment adviser. The commissions paid to these affiliated firms were $9 for the period.
Interfund Lending Program. Pursuant to an Exemptive Order issued by the SEC, the Fund, along with other registered investment companies having management contracts with FMR, may participate in an interfund lending program. This program provides an alternative credit facility allowing the funds to borrow from, or lend money to, other participating affiliated funds. At period end, there were no interfund loans outstanding. The Fund's activity in this program during the period for which loans were outstanding was as follows:
Borrower or Lender | Average Daily
Loan Balance | Weighted Average Interest Rate | Interest Expense |
Borrower | $ 13,706 | .41% | $ 2 |
Annual Report
6. Committed Line of Credit.
The Fund participates with other funds managed by FMR or an affiliate in a $4.0 billion credit facility (the "line of credit") to be utilized for temporary or emergency purposes to fund shareholder redemptions or for other short-term liquidity purposes. The Fund has agreed to pay commitment fees on its pro-rata portion of the line of credit, which amounted to $31 and is reflected in Miscellaneous expenses on the Statement of Operations. During the period, there were no borrowings on this line of credit.
7. Security Lending.
The Fund lends portfolio securities through a lending agent from time to time in order to earn additional income. For equity securities, a lending agent is used and may loan securities to certain qualified borrowers, including Fidelity Capital Markets (FCM), a broker-dealer affiliated with the Fund. On the settlement date of the loan, the Fund receives collateral (in the form of U.S. Treasury obligations, letters of credit and/or cash) against the loaned securities and maintains collateral in an amount not less than 100% of the market value of the loaned securities during the period of the loan. The market value of the loaned securities is determined at the close of business of the Fund and any additional required collateral is delivered to the Fund on the next business day. If the borrower defaults on its obligation to return the securities loaned because of insolvency or other reasons, a fund could experience delays and costs in recovering the securities loaned or in gaining access to the collateral. Any cash collateral received is the Fidelity Securities Lending Cash Central Fund. The value of loaned securities and cash collateral at period end are disclosed on the Fund's Statement of Assets and Liabilities. The value of securities loaned to FCM at period end was $2,654. Security lending income represents the income earned on investing cash collateral, less rebates paid to borrowers and any lending agent fees associated with the loan, plus any premium payments received for lending certain types of securities. Security lending income is presented in the Statement of Operations as a component of income from Fidelity Central Funds. Total security lending income during the period amounted to $6,208, including $213 from securities loaned to FCM.
8. Expense Reductions.
FMR voluntarily agreed to reimburse a portion of its management fee. For the period, the amount of this reimbursement was $507.
Many of the brokers with whom FMR places trades on behalf of the Fund provided services to the Fund in addition to trade execution. These services included payments of certain expenses on behalf of the Fund totaling $3,884 for the period.
Annual Report
Notes to Financial Statements - continued
(Amounts in thousands except percentages)
9. Distributions to Shareholders.
Distributions to shareholders of each class were as follows:
Years ended October 31, | 2011 | 2010 |
From net investment income | | |
Class A | $ 4,617 | $ 3,889 |
Class T | 859 | 633 |
Class B | 51 | 37 |
Class C | 184 | 71 |
International Discovery | 121,061 | 98,508 |
Class K | 18,291 | 9,602 |
Institutional Class | 4,873 | 3,682 |
Total | $ 149,936 | $ 116,422 |
From net realized gain | | |
Class A | $ 1,880 | $ 555 |
Class T | 439 | 119 |
Class B | 69 | 23 |
Class C | 209 | 61 |
International Discovery | 38,831 | 11,290 |
Class K | 5,143 | 935 |
Institutional Class | 1,519 | 391 |
Total | $ 48,090 | $ 13,374 |
10. Share Transactions.
Transactions for each class of shares were as follows:
| Shares | Dollars |
Years ended October 31, | 2011 | 2010 | 2011 | 2010 |
Class A | | | | |
Shares sold | 2,821 | 4,849 | $ 91,649 | $ 142,203 |
Reinvestment of distributions | 173 | 120 | 5,606 | 3,654 |
Shares redeemed | (4,335) | (7,259) | (139,721) | (215,574) |
Net increase (decrease) | (1,341) | (2,290) | $ (42,466) | $ (69,717) |
Class T | | | | |
Shares sold | 443 | 1,165 | $ 14,328 | $ 34,154 |
Reinvestment of distributions | 38 | 24 | 1,235 | 716 |
Shares redeemed | (1,286) | (1,228) | (41,028) | (35,631) |
Net increase (decrease) | (805) | (39) | $ (25,465) | $ (761) |
Class B | | | | |
Shares sold | 21 | 105 | $ 671 | $ 3,047 |
Reinvestment of distributions | 3 | 2 | 111 | 54 |
Shares redeemed | (130) | (227) | (4,124) | (6,544) |
Net increase (decrease) | (106) | (120) | $ (3,342) | $ (3,443) |
Annual Report
10. Share Transactions - continued
| Shares | Dollars |
Years ended October 31, | 2011 | 2010 | 2011 | 2010 |
Class C | | | | |
Shares sold | 183 | 356 | $ 5,847 | $ 10,567 |
Reinvestment of distributions | 11 | 4 | 344 | 116 |
Shares redeemed | (437) | (515) | (13,875) | (14,926) |
Net increase (decrease) | (243) | (155) | $ (7,684) | $ (4,243) |
International Discovery | | | | |
Shares sold | 32,543 | 55,460 | $ 1,052,266 | $ 1,640,231 |
Reinvestment of distributions | 4,718 | 3,453 | 153,551 | 105,461 |
Shares redeemed | (59,489) | (89,239) | (1,934,353) | (2,636,183) |
Net increase (decrease) | (22,228) | (30,326) | $ (728,536) | $ (890,491) |
Class K | | | | |
Shares sold | 18,148 | 16,961 | $ 593,408 | $ 491,304 |
Reinvestment of distributions | 722 | 346 | 23,434 | 10,537 |
Shares redeemed | (10,275) | (7,377) | (330,258) | (215,813) |
Net increase (decrease) | 8,595 | 9,930 | $ 286,584 | $ 286,028 |
Institutional Class | | | | |
Shares sold | 2,364 | 4,322 | $ 75,348 | $ 127,580 |
Reinvestment of distributions | 69 | 36 | 2,254 | 1,083 |
Shares redeemed | (2,923) | (3,773) | (94,034) | (108,068) |
Net increase (decrease) | (490) | 585 | $ (16,432) | $ 20,595 |
11. Other.
The Fund's organizational documents provide former and current trustees and officers with a limited indemnification against liabilities arising in connection with the performance of their duties to the Fund. In the normal course of business, the Fund may also enter into contracts that provide general indemnifications. The Fund's maximum exposure under these arrangements is unknown as this would be dependent on future claims that may be made against the Fund. The risk of material loss from such claims is considered remote.
Annual Report
To the Trustees of Fidelity Investment Trust and the Shareholders of Fidelity International Discovery Fund:
In our opinion, the accompanying statement of assets and liabilities, including the schedule of investments, and the related statements of operations and of changes in net assets and the financial highlights present fairly, in all material respects, the financial position of Fidelity International Discovery Fund (a fund of Fidelity Investment Trust) at October 31, 2011, the results of its operations for the year then ended, the changes in its net assets for each of the two years in the period then ended and the financial highlights for each of the periods indicated, in conformity with accounting principles generally accepted in the United States of America. These financial statements and financial highlights (hereafter referred to as "financial statements") are the responsibility of the Fidelity International Discovery Fund's management. Our responsibility is to express an opinion on these financial statements based on our audits. We conducted our audits of these financial statements in accordance with the standards of the Public Company Accounting Oversight Board (United States). Those standards require that we plan and perform the audit to obtain reasonable assurance about whether the financial statements are free of material misstatement. An audit includes examining, on a test basis, evidence supporting the amounts and disclosures in the financial statements, assessing the accounting principles used and significant estimates made by management, and evaluating the overall financial statement presentation. We believe that our audits, which included confirmation of securities at October 31, 2011 by correspondence with the custodian and brokers, provide a reasonable basis for our opinion.
PricewaterhouseCoopers LLP
Boston, Massachusetts
December 13, 2011
Annual Report
The Trustees, Members of the Advisory Board, and executive officers of the trust and fund, as applicable, are listed below. The Board of Trustees governs the fund and is responsible for protecting the interests of shareholders. The Trustees are experienced executives who meet periodically throughout the year to oversee the fund's activities, review contractual arrangements with companies that provide services to the fund, oversee management of the risks associated with such activities and contractual arrangements, and review the fund's performance. Except for James C. Curvey, each of the Trustees oversees 226 funds advised by FMR or an affiliate. Mr. Curvey oversees 429 funds advised by FMR or an affiliate.
The Trustees hold office without limit in time except that (a) any Trustee may resign; (b) any Trustee may be removed by written instrument, signed by at least two-thirds of the number of Trustees prior to such removal; (c) any Trustee who requests to be retired or who has become incapacitated by illness or injury may be retired by written instrument signed by a majority of the other Trustees; and (d) any Trustee may be removed at any special meeting of shareholders by a two-thirds vote of the outstanding voting securities of the trust. Each Trustee who is not an interested person (as defined in the 1940 Act) (Independent Trustee), shall retire not later than the last day of the calendar year in which his or her 75th birthday occurs. The Independent Trustees may waive this mandatory retirement age policy with respect to individual Trustees. The executive officers and Advisory Board Members hold office without limit in time, except that any officer and Advisory Board Member may resign or may be removed by a vote of a majority of the Trustees at any regular meeting or any special meeting of the Trustees. Except as indicated, each individual has held the office shown or other offices in the same company for the past five years.
Experience, Skills, Attributes, and Qualifications of the Fund's Trustees. The Governance and Nominating Committee has adopted a statement of policy that describes the experience, qualifications, attributes, and skills that are necessary and desirable for potential Independent Trustee candidates (Statement of Policy). The Board believes that each Trustee satisfied at the time he or she was initially elected or appointed a Trustee, and continues to satisfy, the standards contemplated by the Statement of Policy. The Governance and Nominating Committee also engages professional search firms to help identify potential Independent Trustee candidates who have the experience, qualifications, attributes, and skills consistent with the Statement of Policy. From time to time, additional criteria based on the composition and skills of the current Independent Trustees, as well as experience or skills that may be appropriate in light of future changes to board composition, business conditions, and regulatory or other developments, have also been considered by the professional search firms and the Governance and Nominating Committee. In addition, the Board takes into account the Trustees' commitment and participation in Board and committee meetings, as well as their leadership of standing and ad hoc committees throughout their tenure.
In determining that a particular Trustee was and continues to be qualified to serve as a Trustee, the Board has considered a variety of criteria, none of which, in isolation, was controlling. The Board believes that, collectively, the Trustees have balanced and diverse experience, qualifications, attributes, and skills, which allow the Board to operate effectively in governing the fund and protecting the interests of shareholders. Information about the specific experience, skills, attributes, and qualifications of each Trustee, which in each case led to the Board's conclusion that the Trustee should serve (or continue to serve) as a trustee of the fund, is provided below.
Annual Report
Board Structure and Oversight Function. James C. Curvey is an interested person (as defined in the 1940 Act) and currently serves as Acting Chairman. The Trustees have determined that an interested Chairman is appropriate and benefits shareholders because an interested Chairman has a personal and professional stake in the quality and continuity of services provided to the fund. Independent Trustees exercise their informed business judgment to appoint an individual of their choosing to serve as Chairman, regardless of whether the Trustee happens to be independent or a member of management. The Independent Trustees have determined that they can act independently and effectively without having an Independent Trustee serve as Chairman and that a key structural component for assuring that they are in a position to do so is for the Independent Trustees to constitute a substantial majority for the Board. The Independent Trustees also regularly meet in executive session. Ned C. Lautenbach serves as Chairman of the Independent Trustees and as such (i) acts as a liaison between the Independent Trustees and management with respect to matters important to the Independent Trustees and (ii) with management prepares agendas for Board meetings.
Fidelity funds are overseen by different Boards of Trustees. The fund's Board oversees Fidelity's equity and high income funds and another Board oversees Fidelity's investment-grade bond, money market, and asset allocation funds. The asset allocation funds may invest in Fidelity funds overseen by the fund's Board. The use of separate Boards, each with its own committee structure, allows the Trustees of each group of Fidelity funds to focus on the unique issues of the funds they oversee, including common research, investment, and operational issues. On occasion, the separate Boards establish joint committees to address issues of overlapping consequences for the Fidelity funds overseen by each Board.
The Trustees operate using a system of committees to facilitate the timely and efficient consideration of all matters of importance to the Trustees, the fund, and fund shareholders and to facilitate compliance with legal and regulatory requirements and oversight of the fund's activities and associated risks. The Board, acting through its committees, has charged FMR and its affiliates with (i) identifying events or circumstances the occurrence of which could have demonstrably adverse effects on the fund's business and/or reputation; (ii) implementing processes and controls to lessen the possibility that such events or circumstances occur or to mitigate the effects of such events or circumstances if they do occur; and (iii) creating and maintaining a system designed to evaluate continuously business and market conditions in order to facilitate the identification and implementation processes described in (i) and (ii) above. Because the day-to-day operations and activities of the fund are carried out by or through FMR, its affiliates and other service providers, the fund's exposure to risks is mitigated but not eliminated by the processes overseen by the Trustees. While each of the Board's committees has responsibility for overseeing different aspects of the fund's activities, oversight is exercised primarily through the Operations, Audit, and Compliance Committees. In addition, the Independent Trustees have worked with FMR to enhance the Board's oversight of investment and financial risks, legal and regulatory risks, technology risks, and operational risks, including the development of additional risk reporting to the Board. For example, a working group comprised of Independent Trustees and FMR has worked and continues to work to review the Fidelity funds' valuation-related activities, reporting and risk management. Appropriate personnel, including but not limited to the fund's Chief Compliance Officer (CCO), FMR's internal auditor, the independent accountants, the fund's Treasurer and portfolio management personnel, make periodic reports to the Board's committees, as appropriate, including an annual review of FMR's risk management program for the Fidelity funds. The responsibilities of each standing committee, including their oversight responsibilities, are described further under "Standing Committees of the Fund's Trustees."
Annual Report
Trustees and Officers - continued
The fund's Statement of Additional Information (SAI) includes more information about the Trustees. To request a free copy, call Fidelity at 1-877-208-0098.
Interested Trustees*:
Correspondence intended for each Trustee who is an interested person may be sent to Fidelity Investments, 82 Devonshire Street, Boston, Massachusetts 02109.
Name, Age; Principal Occupations and Other Relevant Experience+ |
James C. Curvey (76) |
| Year of Election or Appointment: 2007 Mr. Curvey is Trustee and Acting Chairman of the Board of Trustees of certain Trusts. Mr. Curvey also serves as Trustee (2007-present) of other investment companies advised by FMR. Mr. Curvey is a Director of Fidelity Investments Money Management, Inc. (2009-present), Director of Fidelity Research & Analysis Co. (2009-present) and Director of FMR and FMR Co., Inc. (2007-present). Mr. Curvey is also Vice Chairman (2007-present) and Director of FMR LLC. In addition, Mr. Curvey serves as an Overseer for the Boston Symphony Orchestra and a member of the Trustees of Villanova University. Previously, Mr. Curvey was the Vice Chairman (2006-2007) and Director (2000-2007) of FMR Corp. |
Ronald P. O'Hanley (54) |
| Year of Election or Appointment: 2011 Mr. O'Hanley is Director of FMR Co., Inc. (2010-present), Director of Fidelity Investments Money Management, Inc. (2010-present), Director of Fidelity Research & Analysis Company (2010-present), President of Fidelity Asset Management and Corporate Services and a member of Fidelity's Executive Committee (2010-present). Previously, Mr. O'Hanley served as President and Chief Executive Officer of BNY Mellon Asset Management (2007-2010). Mr. O'Hanley also served as Vice Chairman of Bank New York Mellon Corp. and a member of that firm's Executive Committee. Prior to the 2007 merger of The Bank of New York and Mellon Financial Corporation, he was Vice Chairman of Mellon Financial Corporation and President and Chief Executive Officer of Mellon Asset Management. He joined Mellon in February 1997. Mr. O'Hanley currently serves as Chairman of the Boston Public Library Foundation Board of Directors and sits on the Board of Directors of Beth Israel Deaconess Medical Center, the Board of Trustees of the Marine Biological Laboratory and the Advisory Board of the Maxwell School of Citizenship and Public Administration at Syracuse University. Mr. O'Hanley also chairs the Council on Asset Management for the Financial Services Roundtable and is a member of the Board of Directors of Institutional Investor's U.S. Institute. |
* Trustees have been determined to be "Interested Trustees" by virtue of, among other things, their affiliation with the trust or various entities under common control with FMR.
+ The information above includes each Trustee's principal occupation during the last five years and other information relating to the experience, attributes, and skills relevant to each Trustee's qualifications to serve as a Trustee, which led to the conclusion that each Trustee should serve as a Trustee for the fund.
Annual Report
Trustees and Officers - continued
Independent Trustees:
Correspondence intended for each Independent Trustee (that is, the Trustees other than the Interested Trustees) may be sent to Fidelity Investments, P.O. Box 55235, Boston, Massachusetts 02205-5235.
Name, Age; Principal Occupations and Other Relevant Experience+ |
Dennis J. Dirks (63) |
| Year of Election or Appointment: 2005 Prior to his retirement in May 2003, Mr. Dirks was Chief Operating Officer and a member of the Board of The Depository Trust & Clearing Corporation (DTCC). He also served as President, Chief Operating Officer, and Board member of The Depository Trust Company (DTC) and President and Board member of the National Securities Clearing Corporation (NSCC). In addition, Mr. Dirks served as Chief Executive Officer and Board member of the Government Securities Clearing Corporation, Chief Executive Officer and Board member of the Mortgage-Backed Securities Clearing Corporation, as a Trustee and a member of the Finance Committee of Manhattan College (2005-2008), and as a Trustee and a member of the Finance Committee of AHRC of Nassau County (2006-2008). Mr. Dirks is a member of the Independent Directors Council (IDC) Governing Council (2010-Present) and Board of Directors for The Brookville Center for Children's Services, Inc. (2009-present). |
Alan J. Lacy (58) |
| Year of Election or Appointment: 2008 Mr. Lacy serves as Senior Adviser (2007-present) of Oak Hill Capital Partners, L.P. (private equity). Mr. Lacy also served as Chief Executive Officer (2000-2005) and Vice Chairman (2005-2006) of Sears Holdings Corporation and Sears, Roebuck and Co. (retail). In addition, Mr. Lacy serves as a member of the Board of Directors of Dave & Buster's, Inc. (restaurant and entertainment complexes, 2010-present), The Hillman Companies, Inc. (hardware wholesalers, 2010-present), and Bristol-Myers Squibb Company (global pharmaceuticals, 2007-present). Mr. Lacy is a member of the Board of Trustees of The National Parks Conservation Association (2006-Present). Previously, Mr. Lacy served as Chairman of the Board of Trustees of the National Parks Conservation Association (2008-2011) and as a member of the Board of Directors for the Western Union Company (global money transfer, 2006-2011). |
Ned C. Lautenbach (67) |
| Year of Election or Appointment: 2000 Mr. Lautenbach is Chairman of the Independent Trustees of the Equity and High Income Funds (2006-present). Mr. Lautenbach currently serves as the Lead Director of the Eaton Corporation Board of Directors (diversified industrial, 1997-present). Mr. Lautenbach is also a member of the Board of Directors of the Philharmonic Center for the Arts in Naples, Florida (1999-present); a member of the Board of Trustees of Fairfield University (2005-present); and a member of the Council on Foreign Relations (1994-present). Previously, Mr. Lautenbach was a Partner/Advisory Partner at Clayton, Dubilier & Rice, LLC (private equity investment, 1998-2010), as well as a Director of Sony Corporation (2006-2007). |
Joseph Mauriello (67) |
| Year of Election or Appointment: 2008 Prior to his retirement in January 2006, Mr. Mauriello served in numerous senior management positions including Deputy Chairman and Chief Operating Officer (2004-2005), and Vice Chairman of Financial Services (2002-2004) of KPMG LLP US (professional services, 1965-2005). Mr. Mauriello currently serves as a member of the Board of Directors of XL Group plc. (global insurance and re-insurance, 2006-present) and of Arcadia Resources Inc. (health care services and products, 2007-present). Previously, Mr. Mauriello served as a Director of the Hamilton Funds of the Bank of New York (2006-2007). |
Robert W. Selander (61) |
| Year of Election or Appointment: 2011 Previously, Mr. Selander served as a Member of the Advisory Board of Fidelity's Equity and High Income Funds (2011), Executive Vice Chairman (2010), Chief Executive Officer (2009-2010), and President and Chief Executive Officer (1997-2009) of Mastercard, Inc. |
Cornelia M. Small (67) |
| Year of Election or Appointment: 2005 Ms. Small is a member of the Board of Directors of the Teagle Foundation (2009-present). Ms. Small is also a member of the Investment Committee, and Chair (2008-present) and a member of the Board of Trustees of Smith College. In addition, Ms. Small serves on the Investment Committee of the Berkshire Taconic Community Foundation (2008-present). Previously, Ms. Small served as Chairperson of the Investment Committee (2002-2008) of Smith College. In addition, Ms. Small served as Chief Investment Officer, Director of Global Equity Investments, and a member of the Board of Directors of Scudder, Stevens & Clark and Scudder Kemper Investments. |
William S. Stavropoulos (72) |
| Year of Election or Appointment: 2001 Mr. Stavropoulos is Vice Chairman of the Independent Trustees of the Equity and High Income Funds (2006-present). Mr. Stavropoulos serves as President and Founder of the Michigan Baseball Foundation, the Great Lakes Loons (2007-present). Mr. Stavropoulos is Chairman Emeritus of the Board of Directors of The Dow Chemical Company, where he previously served in numerous senior management positions, including President, CEO (1995-2000; 2002-2004), Chairman of the Executive Committee (2000-2006), and as a member of the Board of Directors (1990-2006). Currently, Mr. Stavropoulos is Chairman of Univar (global distributor of commodity and specialty chemicals, 2010-present), a Director of Teradata Corporation (data warehousing and technology solutions, 2008-present), Chemical Financial Corporation, Maersk Inc. (industrial conglomerate), Tyco International, Inc. (multinational manufacturing and services, 2007-present), and a member of the Advisory Board for Metalmark Capital (private equity investment, 2005-present). Mr. Stavropoulos is a special advisor to Clayton, Dubilier & Rice, LLC (private equity investment). In addition, Mr. Stavropoulos is a member of the University of Notre Dame Advisory Council for the College of Science. |
David M. Thomas (62) |
| Year of Election or Appointment: 2008 Previously, Mr. Thomas served as Executive Chairman (2005-2006) and Chairman and Chief Executive Officer (2000-2005) of IMS Health, Inc. (pharmaceutical and healthcare information solutions). In addition, Mr. Thomas serves as a member of the Board of Directors of Fortune Brands, Inc. (consumer products), and Interpublic Group of Companies, Inc. (marketing communication, 2004-present). |
Michael E. Wiley (61) |
| Year of Election or Appointment: 2008 Mr. Wiley also serves as a Director of Asia Pacific Exploration Consolidated (international oil and gas exploration and production, 2008-present). Mr. Wiley serves as a Director of Tesoro Corporation (independent oil refiner and marketer, 2005-present), and a Director of Bill Barrett Corporation (exploration and production, 2005-present). In addition, Mr. Wiley also serves as a Director of Post Oak Bank (privately-held bank, 2004-present). Previously, Mr. Wiley served as a member of the Board of Trustees of the University of Tulsa (2000-2006; 2007-2010), as a Senior Energy Advisor of Katzenbach Partners, LLC (consulting, 2006-2007), as an Advisory Director of Riverstone Holdings (private investment), Chairman, President, and CEO of Baker Hughes, Inc. (oilfield services, 2000-2004), and as Director of Spinnaker Exploration Company (exploration and production, 2001-2005). |
Annual Report
+ The information above includes each Trustee's principal occupation during the last five years and other information relating to the experience, attributes, and skills relevant to each Trustee's qualifications to serve as a Trustee, which led to the conclusion that each Trustee should serve as a Trustee for the fund.
Advisory Board Members and Executive Officers:
Correspondence intended for each executive officer, Edward C. Johnson 3d, and Peter S. Lynch may be sent to Fidelity Investments, 82 Devonshire Street, Boston, Massachusetts 02109.
Name, Age; Principal Occupation |
Edward C. Johnson 3d (81) |
| Year of Election or Appointment: 2011 Member of the Advisory Board of Fidelity's Equity and High Income Funds. Mr. Johnson serves as Chief Executive Officer, Chairman, and a Director of FMR LLC, and also serves as Chairman and Director of FIL Limited. Previously, Mr. Johnson served as a Trustee and Chairman of the Board of certain Fidelity Trusts, Chairman and a Director of FMR, Chairman and a Director of FMR Co., Inc., and President of FMR LLC (2006-2007). |
Peter S. Lynch (67) |
| Year of Election or Appointment: 2003 Member of the Advisory Board of Fidelity's Equity and High Income Funds. Mr. Lynch is Vice Chairman and a Director of FMR and FMR Co., Inc. In addition, Mr. Lynch serves as a Trustee of Boston College and as the Chairman of the Inner-City Scholarship Fund. Previously, Mr. Lynch served on the Special Olympics International Board of Directors (1997-2006). |
Kenneth B. Robins (42) |
| Year of Election or Appointment: 2008 President and Treasurer of Fidelity's Equity and High Income Funds. Mr. Robins also serves as President and Treasurer (2010-present) and Assistant Treasurer (2009-present) of other Fidelity funds and is an employee of Fidelity Investments (2004-present). Previously, Mr. Robins served as Deputy Treasurer of the Fidelity funds (2005-2008) and Treasurer and Chief Financial Officer of The North Carolina Capital Management Trust: Cash and Term Portfolios (2006-2008). |
Bruce T. Herring (46) |
| Year of Election or Appointment: 2006 Vice President of certain Equity Funds. Mr. Herring also serves as Chief Investment Officer and Director of Fidelity Management & Research (U.K.) Inc. (2010-present) and Group Chief Investments Officer of FMR. Previously, Mr. Herring served as Vice President (2005-2006) and Senior Vice President (2006-2007) of Fidelity Management & Research Company, Vice President of FMR Co., Inc. (2001-2007) and as a portfolio manager for Fidelity U.S. Equity Funds. |
Brian B. Hogan (47) |
| Year of Election or Appointment: 2009 Vice President of Equity and High Income Funds. Mr. Hogan also serves as President of FMR's Equity Division (2009-present). Previously, Mr. Hogan served as Senior Vice President, Equity Research of FMR (2006-2009) and as a portfolio manager. |
Scott C. Goebel (43) |
| Year of Election or Appointment: 2008 Secretary and Chief Legal Officer (CLO) of the Fidelity funds. Mr. Goebel also serves as Secretary of Fidelity Investments Money Management, Inc. (FIMM) (2010-present) and Fidelity Research and Analysis Company (FRAC) (2010-present); Secretary and CLO of The North Carolina Capital Management Trust: Cash and Term Portfolios (2008-present); General Counsel, Secretary, and Senior Vice President of FMR (2008-present) and FMR Co., Inc. (2008-present); employed by FMR LLC or an affiliate (2001-present); Chief Legal Officer of Fidelity Management & Research (Hong Kong) Limited (2008-present) and Assistant Secretary of Fidelity Management & Research (Japan) Inc. (2008-present), and Fidelity Management & Research (U.K.) Inc. (2008-present). Previously, Mr. Goebel served as Assistant Secretary of FIMM (2008-2010), FRAC (2008-2010), and the Funds (2007-2008) and as Vice President and Secretary of Fidelity Distributors Corporation (FDC) (2005-2007). |
William C. Coffey (42) |
| Year of Election or Appointment: 2009 Assistant Secretary of Fidelity's Equity and High Income Funds. Mr. Coffey also serves as Senior Vice President and Deputy General Counsel of FMR LLC (2010-present), and is an employee of Fidelity Investments. Previously, Mr. Coffey served as Vice President and Associate General Counsel of FMR LLC (2005-2009). |
Holly C. Laurent (57) |
| Year of Election or Appointment: 2008 Anti-Money Laundering (AML) Officer of the Fidelity funds. Ms. Laurent also serves as AML Officer of The North Carolina Capital Management Trust: Cash and Term Portfolios (2008-present) and is an employee of Fidelity Investments. Previously, Ms. Laurent was Senior Vice President and Head of Legal for Fidelity Business Services India Pvt. Ltd. (2006-2008), and Senior Vice President, Deputy General Counsel and Group Head for FMR LLC (2005-2006). |
Christine Reynolds (53) |
| Year of Election or Appointment: 2008 Chief Financial Officer of the Fidelity funds. Ms. Reynolds became President of Fidelity Pricing and Cash Management Services (FPCMS) in August 2008. Ms. Reynolds served as Chief Operating Officer of FPCMS (2007-2008). Previously, Ms. Reynolds served as President, Treasurer, and Anti-Money Laundering officer of the Fidelity funds (2004-2007). |
Kenneth A. Rathgeber (64) |
| Year of Election or Appointment: 2004 Chief Compliance Officer of Fidelity's Equity and High Income Funds. Mr. Rathgeber is Chief Compliance Officer of Fidelity Management & Research (Hong Kong) Limited (2008-present), Fidelity Management & Research (Japan) Inc. (2008-present), FMR (2005-present), FMR Co., Inc. (2005-present), Fidelity Management & Research (U.K.) Inc. (2005-present), Fidelity Research & Analysis Company (2005-present), Fidelity Investments Money Management, Inc. (2005-present), Pyramis Global Advisors, LLC (2005-present), and Strategic Advisers, Inc. (2005-present). |
Jeffrey S. Christian (50) |
| Year of Election or Appointment: 2009 Deputy Treasurer of the Fidelity funds. Mr. Christian is an employee of Fidelity Investments. Previously, Mr. Christian served as Chief Financial Officer (2008-2009) of certain Fidelity funds and Senior Vice President of Fidelity Pricing and Cash Management Services (FPCMS) (2004-2009). |
Joseph F. Zambello (54) |
| Year of Election or Appointment: 2011 Deputy Treasurer of the Fidelity funds. Mr. Zambello is an employee of Fidelity Investments. Previously, Mr. Zambello served as Vice President of FMR's Program Management Group (2009-2011) and Vice President of the Transfer Agent Oversight Group (2005-2009). |
Adrien E. Deberghes (44) |
| Year of Election or Appointment: 2008 Deputy Treasurer of Fidelity's Equity and High Income Funds. Mr. Deberghes also serves as Vice President and Assistant Treasurer of Fidelity Rutland Square Trust II and Fidelity Commonwealth Trust II (2011-present), Assistant Treasurer of other Fidelity funds (2010-present), and is an employee of Fidelity Investments (2008-present). Previously, Mr. Deberghes served as Senior Vice President of Mutual Fund Administration at State Street Corporation (2007-2008), Senior Director of Mutual Fund Administration at Investors Bank & Trust (2005-2007), and Director of Finance for Dunkin' Brands (2000-2005). |
Stephanie J. Dorsey (42) |
| Year of Election or Appointment: 2010 Assistant Treasurer of Fidelity's Equity and High Income Funds. Ms. Dorsey also serves as Deputy Treasurer of other Fidelity funds (2008-present) and is an employee of Fidelity Investments (2008-present). Previously, Ms. Dorsey served as Treasurer (2004-2008) of the JPMorgan Mutual Funds and Vice President (2004-2008) of JPMorgan Chase Bank. |
John R. Hebble (53) |
| Year of Election or Appointment: 2009 Assistant Treasurer of Fidelity's Equity and High Income Funds. Mr. Hebble also serves as President (2011-present), Treasurer, and Chief Financial Officer of The North Carolina Capital Management Trust: Cash and Term Portfolios (2008-present), President and Treasurer of other Fidelity funds (2008-present) and is an employee of Fidelity Investments. |
Gary W. Ryan (53) |
| Year of Election or Appointment: 2005 Assistant Treasurer of the Fidelity funds. Mr. Ryan is an employee of Fidelity Investments. Previously, Mr. Ryan served as Vice President of Fund Reporting in Fidelity Pricing and Cash Management Services (FPCMS) (1999-2005). |
Jonathan Davis (43) |
| Year of Election or Appointment: 2010 Assistant Treasurer of the Fidelity funds. Mr. Davis is also Assistant Treasurer of Fidelity Rutland Square Trust II and Fidelity Commonwealth Trust II. Mr. Davis is an employee of Fidelity Investments. Previously, Mr. Davis served as Vice President and Associate General Counsel of FMR LLC (2003-2010). |
Annual Report
Institutional Class designates 88% and 100% of the dividends distributed on December 3, 2010 and December 30, 2010, respectively during the fiscal year as amounts which may be taken into account as a dividend for the purposes of the maximum rate under section 1(h)(11) of the Internal Revenue Code.
The amounts per share which represent income derived from sources within, and taxes paid to, foreign countries or possessions of the United States are as follows:
| Pay Date | Income | Taxes |
Institutional Class | 12/06/2010 | $0.424 | $0.0348 |
| 12/31/2010 | $0.041 | $0.0000 |
The fund will notify shareholders in January 2012 of amounts for use in preparing 2011 income tax returns.
Annual Report
Board Approval of Investment Advisory Contracts and Management Fees
Fidelity International Discovery Fund
Each year, the Board of Trustees, including the Independent Trustees (together, the Board), votes on the renewal of the management contract and sub-advisory agreements (together, the Advisory Contracts) for the fund. The Board, assisted by the advice of fund counsel and Independent Trustees' counsel, requests and considers a broad range of information relevant to the renewal of the Advisory Contracts throughout the year.
The Board meets regularly and considers at each of its meetings factors that are relevant to its annual consideration of the renewal of the fund's Advisory Contracts, including the services and support provided to the fund and its shareholders. The Board has established various standing committees, each composed of Independent Trustees with varying backgrounds, to which the Board has assigned specific subject matter responsibilities in order to enhance effective decision-making by the Board. The Board, acting directly and through its Committees, requests and receives information concerning the annual consideration of the renewal of the fund's Advisory Contracts. The Board also meets as needed to consider matters specifically related to the Board's annual consideration of the renewal of Advisory Contracts. Members of the Board may also meet with trustees of other Fidelity funds through ad hoc joint committees to discuss certain matters relevant to the Fidelity funds.
At its July 2011 meeting, the Board of Trustees, including the Independent Trustees, unanimously determined to renew the fund's Advisory Contracts. In reaching its determination, the Board considered all factors it believed relevant, including (i) the nature, extent, and quality of the services to be provided to the fund and its shareholders (including the investment performance of the fund); (ii) the competitiveness of the fund's management fee and total expense ratio; (iii) the total costs of the services to be provided by and the profits to be realized by Fidelity from its relationship with the fund; (iv) the extent to which economies of scale would be realized as the fund grows; and (v) whether fee levels reflect these economies of scale, if any, for the benefit of fund shareholders.
In considering whether to renew the Advisory Contracts for the fund, the Board reached a determination, with the assistance of fund counsel and Independent Trustees' counsel and through the exercise of its business judgment, that the renewal of the Advisory Contracts is in the best interests of the fund and its shareholders and that the compensation payable under the Advisory Contracts is fair and reasonable. The Board's decision to renew the Advisory Contracts was not based on any single factor, but rather was based on a comprehensive consideration of all the information provided to the Board at its meetings throughout the year. The Board, in reaching its determination to renew the Advisory Contracts, is aware that shareholders in the fund have a broad range of investment choices available to them, including a wide choice among mutual funds offered by Fidelity's competitors, and that the fund's shareholders, who have the opportunity to review and weigh the disclosure provided by the fund in its prospectus and other public disclosures, have chosen to invest in this fund, managed by Fidelity.
Annual Report
Nature, Extent, and Quality of Services Provided. The Board considered the staffing within the investment adviser, FMR, and the sub-advisers (together, the Investment Advisers), including the backgrounds of the fund's investment personnel and the fund's investment objective and discipline. The Independent Trustees also had discussions with senior management of Fidelity's investment operations and investment groups. The Board considered the structure of the portfolio manager compensation program and whether this structure provides appropriate incentives to act in the best interests of the fund.
Resources Dedicated to Investment Management and Support Services. The Board and the Fund Oversight and Research Committees reviewed the general qualifications and capabilities of the Investment Advisers' investment staff, including its size, education, experience, and resources, as well as the Investment Advisers' approach to recruiting, training, managing, and compensating investment personnel. The Board also noted that FMR has devoted increased resources to non-U.S. offices. The Board noted that Fidelity's analysts have extensive resources, tools and capabilities which allow them to conduct sophisticated quantitative and fundamental analysis, as well as credit analysis of issuers, counterparties and enhancers. The Board also believes that Fidelity's investment professionals have sufficient access to global information and data so as to provide competitive investment results over time, and that those professionals also have access to sophisticated tools which permit them to assess portfolio construction and risk and performance attribution characteristics continuously, as well as to transmit new information and research conclusions rapidly around the world. Additionally, in their deliberations, the Board considered the Investment Advisers' trading capabilities and resources which are an integral part of the investment management process.
Shareholder and Administrative Services. The Board considered (i) the nature, extent, quality, and cost of advisory, administrative, and shareholder services performed by the Investment Advisers and their affiliates under the Advisory Contracts and under separate agreements covering transfer agency, pricing and bookkeeping, and securities lending services for the fund; (ii) the nature and extent of the investment adviser's supervision of third party service providers, principally custodians and subcustodians; and (iii) the resources devoted to, and the record of compliance with, the fund's compliance policies and procedures. The Board also reviewed the allocation of fund brokerage, including allocations to brokers affiliated with the Investment Advisers, the use of brokerage commissions to pay fund expenses, and the use of "soft" commission dollars to pay for research services.
The Board noted that the growth of fund assets over time across the complex allows Fidelity to reinvest in the development of services designed to enhance the value or convenience of the Fidelity funds as investment vehicles. These services include 24-hour access to account information and market information through telephone representatives and over the Internet, investor education materials and asset allocation tools, and the expanded availability of Fidelity Investor Centers, with 35 new branches opening since 2010.
Annual Report
Board Approval of Investment Advisory Contracts and
Management Fees - continued
Investment in a Large Fund Family. The Board considered the benefits to shareholders of investing in a Fidelity fund, including the benefits of investing in a fund that is part of a large family of funds offering a variety of investment disciplines and providing a large variety of mutual fund investor services. The Board noted that Fidelity had taken, or had made recommendations that resulted in the Fidelity funds taking, a number of actions over the previous year that benefited particular funds, including (i) continuing to dedicate additional resources to investment research and support of the senior management team that oversees asset management; (ii) rationalizing product lines through the mergers of six funds into other funds; (iii) continuing to migrate the Freedom Funds to dedicated lower cost underlying funds; (iv) obtaining shareholder approval to broaden the investment strategies for Fidelity Consumer Finance Portfolio, Fidelity Emerging Asia Fund, and Fidelity Environment and Alternative Energy Portfolio; (v) contractually agreeing to reduce the management fees and impose other expense limitations on Spartan 500 Index Fund and U.S. Bond Index Fund in connection with launching new institutional classes of these funds; (vi) changing the name, primary and supplemental benchmarks, and investment policies of Fidelity Global Strategies Fund to support the fund's flexible investment mandate and global orientation; and (vii) reducing the transfer agency account fee rates on certain accounts.
Investment Performance. The Board considered whether the fund has operated in accordance with its investment objective, as well as its record of compliance with its investment restrictions. It also reviewed the fund's absolute investment performance for each class, as well as the fund's relative investment performance for each class measured over multiple periods against (i) a broad-based securities market index, and (ii) a peer group of mutual funds deemed appropriate by Fidelity and reviewed by the Board. The following charts considered by the Board show, over the one-, three-, and five-year periods ended December 31, 2010, the cumulative total returns of Institutional Class (Class I) and Class B of the fund, the cumulative total returns of a broad-based securities market index ("benchmark"), and a range of cumulative total returns of a peer group of mutual funds identified by Morningstar, Inc. as having an investment style similar to that of the fund based on underlying portfolio holdings. The returns of Institutional Class (Class I) and Class B show the performance of the highest and lowest performing classes, respectively (based on five-year performance). The box within each chart shows the 25th percentile return (bottom of box) and the 75th percentile return (top of box) of the peer group. Returns shown above the box are in the first quartile and returns shown below the box are in the fourth quartile. The percentage beaten numbers noted below each chart correspond to the percentile box and represent the percentage of funds in the peer group whose performance was equal to or lower than that of the class indicated.
Annual Report
Fidelity International Discovery Fund
The Board reviewed the fund's relative investment performance against its peer group and noted that the performance of Institutional Class (Class I) of the fund was in the second quartile for the one- and five-year periods and the third quartile for the three-year period. The Board also noted that the investment performance of Institutional Class (Class I) of the fund compared favorably to its benchmark for the one- and five-year periods, although the fund's three-year cumulative total return was lower than its benchmark. The Board considered that the variations in performance among the fund's classes reflect the variations in class expenses, which result in lower performance for higher expense classes. The Board also reviewed the fund's performance since inception as well as performance in the current year.
The Board also considered that the fund's management fee is subject to upward or downward adjustment depending upon whether, and to what extent, the fund's investment performance for the performance period exceeds, or is exceeded by, the record (over the same period) of a Board-approved performance adjustment index. The Board noted that the performance adjustment provides FMR with a strong economic incentive to seek to achieve superior performance for the fund's shareholders and helps to more closely align the interests of FMR and the fund's shareholders.
Based on its review, the Board concluded that the nature, extent, and quality of services provided to the fund under the Advisory Contracts should benefit the fund's shareholders.
Annual Report
Board Approval of Investment Advisory Contracts and
Management Fees - continued
Competitiveness of Management Fee and Total Expense Ratio. The Board considered the fund's management fee and total expense ratio compared to "mapped groups" of competitive funds and classes. Fidelity creates "mapped groups" by combining similar Lipper investment objective categories that have comparable management fee characteristics. Combining Lipper investment objective categories aids the Board's management fee and total expense ratio comparisons by broadening the competitive group used for comparison and by reducing the number of universes to which various Fidelity funds are compared.
Management Fee. The Board considered two proprietary management fee comparisons for the 12-month periods shown in the chart below. The group of Lipper funds used by the Board for management fee comparisons is referred to below as the "Total Mapped Group." The Total Mapped Group comparison focuses on a fund's standing relative to the total universe of comparable funds available to investors in terms of gross management fees before expense reimbursements or caps, and without giving effect to the fund's performance adjustment. "TMG %" represents the percentage of funds in the Total Mapped Group that had management fees that were lower than the fund's. For example, a TMG % of 16% means that 84% of the funds in the Total Mapped Group had higher management fees than the fund. The "Asset-Size Peer Group" (ASPG) comparison focuses on a fund's standing relative to non-Fidelity funds similar in size to the fund within the Total Mapped Group. The ASPG represents at least 15% of the funds in the Total Mapped Group with comparable asset size and management fee characteristics, subject to a minimum of 50 funds (or all funds in the Total Mapped Group if fewer than 50). Additional information, such as the ASPG quartile in which the fund's management fee ranked and the impact of the fund's performance adjustment, is also included in the chart and considered by the Board.
Annual Report
Fidelity International Discovery Fund
The Board noted that the fund's management fee ranked below the median of its Total Mapped Group and below the median of its ASPG for 2010. The Board also noted the effect of the fund's positive performance adjustment on the fund's management fee ranking. The Board noted that the performance adjustment for each year represents calculations for performance periods that differ from the periods shown in the performance charts above.
Based on its review, the Board concluded that the fund's management fee is fair and reasonable in light of the services that the fund receives and the other factors considered.
Total Expense Ratio. In its review of each class's total expense ratio, the Board considered the fund's management fee as well as other fund or class expenses, as applicable, such as transfer agent fees, pricing and bookkeeping fees, fund-paid 12b-1 fees, and custodial, legal, and audit fees. The Board also noted the effects of any waivers and reimbursements on fees and expenses, as well as the impact of the fund's performance adjustment. As part of its review, the Board also considered the current and historical total expense ratios of each class of the fund compared to competitive fund median expenses. Each class of the fund is compared to those funds and classes in the Total Mapped Group (used by the Board for management fee comparisons) that have a similar sales load structure.
The Board noted that the total expense ratio of each of Class A, Class B, Class C, Institutional Class, the retail class, and Class K ranked below its competitive median for 2010 and the total expense ratio of Class T ranked above its competitive median for 2010. The Board considered that various factors, including 12b-1 fees, positive or negative performance adjustments, and relatively higher other expenses in the case of small fund size, can affect total expense ratios. The Board noted that the total expense ratio of Class T was above the competitive median primarily because of higher 12b-1 fees on Class T. Class T has a higher 12b-1 fee, but a lower front-end sales charge, than traditionally priced front-end sales charge classes. The Board noted that the fund offers multiple classes, each of which has a different sales load and 12b-1 fee structure, and that the multiple structures are intended to offer a range of pricing options for the intermediary market. The Board also noted that the total expense ratios of the classes vary primarily by the level of their 12b-1 fees, although differences in transfer agent fees may also cause expenses to vary from class to class.
Annual Report
Board Approval of Investment Advisory Contracts and
Management Fees - continued
Fees Charged to Other Fidelity Clients. The Board also considered Fidelity fee structures and other information with respect to clients of FMR and its affiliates, such as other mutual funds advised or subadvised by FMR or its affiliates, pension plan clients, and other institutional clients. In March 2010, the Board created an ad hoc joint committee with the board of other Fidelity funds (the Committee) to review and compare Fidelity's institutional investment advisory business with its business of providing services to the Fidelity funds, including the differences in services provided, fees charged, and costs incurred, as well as competition in their respective marketplaces.
Based on its review of total expense ratios and fees charged to other Fidelity clients, the Board concluded that the total expense ratio of each class of the fund was reasonable, although Class T was above the median of the universe presented for comparison, in light of the services that the fund and its shareholders receive and the other factors considered, including the findings of the Committee.
Costs of the Services and Profitability. The Board considered the revenues earned and the expenses incurred by Fidelity in conducting the business of developing, marketing, distributing, managing, administering and servicing the fund and its shareholders. The Board also considered the level of Fidelity's profits in respect of all the Fidelity funds.
On an annual basis, FMR presents to the Board Fidelity's profitability for the fund. Fidelity calculates the profitability for each fund, as well as aggregate profitability for groups of Fidelity funds and all Fidelity funds, using a series of detailed revenue and cost allocation methodologies which originate with the books and records of Fidelity on which Fidelity's audited financial statements are based. The Audit Committee of the Board reviews any significant changes from the prior year's methodologies.
PricewaterhouseCoopers LLP (PwC), independent registered public accounting firm and auditor to Fidelity and certain Fidelity funds, has been engaged annually by the Board as part of the Board's assessment of Fidelity's profitability analysis. PwC's engagement includes the review and assessment of Fidelity's methodologies used in determining the revenues and expenses attributable to Fidelity's mutual fund business, and completion of agreed-upon procedures surrounding the mathematical accuracy of fund profitability and its conformity to allocation methodologies. After considering PwC's reports issued under the engagement and information provided by Fidelity, the Board concluded that while other allocation methods may also be reasonable, Fidelity's profitability methodologies are reasonable in all material respects.
Annual Report
The Board also reviewed Fidelity's non-fund businesses and fall-out benefits related to the mutual fund business as well as cases where Fidelity's affiliates may benefit from or be related to the fund's business.
The Board considered the costs of the services provided by and the profits realized by Fidelity in connection with the operation of the fund and was satisfied that the profitability was not excessive in the circumstances.
Economies of Scale. The Board considered whether there have been economies of scale in respect of the management of the Fidelity funds, whether the Fidelity funds (including the fund) have appropriately benefited from any such economies of scale, and whether there is potential for realization of any further economies of scale. The Board considered the extent to which the fund will benefit from economies of scale through increased services to the fund, through waivers or reimbursements, or through fee or expense reductions. The Board also noted that in 2009, it and the board of other Fidelity funds created an ad hoc committee (the Economies of Scale Committee) to analyze whether FMR attains economies of scale in respect of the management and servicing of the Fidelity funds, whether the Fidelity funds have appropriately benefited from such economies of scale, and whether there is potential for realization of any further economies of scale.
The Board recognized that the fund's management contract incorporates a "group fee" structure, which provides for lower group fee rates as total fund assets under FMR's management increase, and for higher group fee rates as total fund assets under FMR's management decrease. FMR calculates the group fee rates based on a tiered asset "breakpoint" schedule that varies based on asset class. The Board considered that the group fee is designed to deliver the benefits of economies of scale to fund shareholders when total Fidelity fund assets increase, even if assets of any particular fund are unchanged or have declined, because some portion of Fidelity's costs are attributable to services provided to all Fidelity funds, and all funds benefit if those costs can be allocated among more assets. The Board concluded that, given the group fee structure, fund shareholders will benefit from lower management fees as assets under FMR's management increase at the fund complex level, regardless of whether Fidelity achieves any such economies of scale.
The Board concluded, taking into account the analysis of the Economies of Scale Committee, that any potential economies of scale are being appropriately shared between fund shareholders and Fidelity.
Annual Report
Board Approval of Investment Advisory Contracts and
Management Fees - continued
Additional Information Requested by the Board. In order to develop fully the factual basis for consideration of the Fidelity funds' Advisory Contracts, the Board requested and received additional information on certain topics, including (i) fund performance trends, actions to be taken by FMR to improve certain funds' overall performance, and Fidelity's long-term strategies for certain funds; (ii) portfolio manager changes that have occurred during the past year and length of portfolio manager tenure for different categories of funds over time; (iii) Fidelity's compensation structure for portfolio managers and other key personnel and strategies for attracting and retaining non-investment personnel; (iv) the amount of the investment that each portfolio manager has made in the Fidelity fund(s) that he or she manages; (v) historical trends in Fidelity's realization of fall-out benefits; (vi) Fidelity's group fee structures and the rationale for the individual fee rates of certain funds; (vii) fund profitability methodology and the impact of certain factors on fund profitability results; (viii) trends regarding industry use of performance fee structures and Fidelity's compliance practices with respect to performance adjustment calculations; (ix) the fee structures in place for certain other Fidelity clients; and (x) explanations regarding the relative total expense ratios of certain funds and classes, total expense competitive trends, and actions that might be taken by FMR to reduce total expense ratios for certain funds and classes.
Based on its evaluation of all of the conclusions noted above, and after considering all factors it believed relevant, the Board ultimately concluded that the advisory fee structures are fair and reasonable, and that the fund's Advisory Contracts should be renewed.
Annual Report
Investment Adviser
Fidelity Management & Research Company
Boston, MA
Investment Sub-Advisers
FMR Co., Inc.
Fidelity Management & Research
(U.K.) Inc.
FIL Investment Advisors
FIL Investments (Japan) Limited
FIL Investment Advisors (U.K.) Limited
Fidelity Management & Research
(Hong Kong) Limited
Fidelity Management & Research
(Japan) Inc.
General Distributor
Fidelity Distributors Corporation
Boston, MA
Transfer and Service Agents
Fidelity Investments Institutional Operations Company, Inc.
Boston, MA
Fidelity Service Company, Inc.
Boston, MA
Custodian
The Northern Trust Company
Chicago, IL
AIDI-UANN-1211
1.806657.106
Fidelity®
International Discovery
Fund -
Class K
Annual Report
October 31, 2011
Contents
Chairman's Message | (Click Here) | The Chairman's message to shareholders. |
Performance | (Click Here) | How the fund has done over time. |
Management's Discussion of Fund Performance | (Click Here) | The Portfolio Manager's review of fundperformance and strategy. |
Shareholder Expense Example | (Click Here) | An example of shareholder expenses. |
Investment Changes | (Click Here) | A summary of major shifts in the fund's investments over the past six months. |
Investments | (Click Here) | A complete list of the fund's investments with their market values. |
Financial Statements | (Click Here) | Statements of assets and liabilities, operations, and changes in net assets,
as well as financial highlights. |
Notes | (Click Here) | Notes to the financial statements. |
Report of Independent Registered Public Accounting Firm | (Click Here) | |
Trustees and Officers | (Click Here) | |
Distributions | (Click Here) | |
Board Approval of Investment Advisory Contracts and Management Fees | (Click Here) | |
To view a fund's proxy voting guidelines and proxy voting record for the 12-month period ended June 30, visit http://www.fidelity.com/proxyvotingresults or visit the Securities and Exchange Commission's (SEC) web site at http://www.sec.gov. You may also call 1-800-835-5092 to request a free copy of the proxy voting guidelines.
Standard & Poor's, S&P and S&P 500 are registered service marks of The McGraw-Hill Companies, Inc. and have been licensed for use by Fidelity Distributors Corporation.
Other third party marks appearing herein are the property of their respective owners.
All other marks appearing herein are registered or unregistered trademarks or service marks of FMR LLC or an affiliated company.
Annual Report
This report and the financial statements contained herein are submitted for the general information of the shareholders of the fund. This report is not authorized for distribution to prospective investors in the fund unless preceded or accompanied by an effective prospectus.
A fund files its complete schedule of portfolio holdings with the SEC for the first and third quarters of each fiscal year on Form N-Q. Forms N-Q are available on the SEC's web site at http://www.sec.gov. A fund's Forms N-Q may be reviewed and copied at the SEC's Public Reference Room in Washington, DC. Information regarding the operation of the SEC's Public Reference Room may be obtained by calling 1-800-SEC-0330. For a complete list of a fund's portfolio holdings, view the most recent holdings listing, semiannual report, or annual report on Fidelity's web site at http://www.fidelity.com, http://www.advisor.fidelity.com, or http://www.401k.com, as applicable.
NOT FDIC INSURED • MAY LOSE VALUE • NO BANK GUARANTEE
Neither the fund nor Fidelity Distributors Corporation is a bank.
Annual Report
(Acting Chairman's Photograph)
Dear Shareholder:
Global equity markets began the fourth quarter on a strong note, sharply reversing course in October amid strong corporate earnings, better-than-expected economic news and the promise of a resolution to the sovereign debt crisis in Europe. The mini rally followed a third quarter marked by a significant downturn in July and August, which heightened investor anxiety and set off a wave of volatility that hampered most major asset classes through the end of September. Financial markets are difficult to predict, of course, but you can help put the odds in your favor by following these time-tested investment principles.
One of the basic tenets is to invest according to your time horizon. For long-term investors, riding out the markets' inevitable ups and downs has proven much more effective than making decisions based on short-term developments. If your goal is approaching, you can also benefit from patience and restraint, rather than attempting to time the market. No matter your time horizon, missing only a few of the markets' best days can significantly diminish returns. Patience also affords the benefits of compounding - earning interest on additional income or reinvested dividends and capital gains. While staying the course doesn't eliminate risk, it can considerably lessen the negative impact of short-term downturns.
Asset allocation is another principle to manage risk. As you spread your portfolio among the asset classes, be sure to consider your time horizon, risk tolerance and investment objectives. Younger investors may be better served by emphasizing equities, which historically have been the best-performing asset class over time. Investors who are nearing a specific goal, such as retirement or sending a child to college, may choose to favor bonds and other investments that have tended to be more stable. Studies indicate that asset allocation is the single most important determinant of a portfolio's long-term success. After deciding on a suitable allocation strategy, make sure your portfolio is adequately diversified, with exposure to stocks of small-, mid- and large-cap companies in a range of sectors, for example. And today, more than ever, geographic diversification should be taken into account.
Lastly, investing a certain amount of money on a regular basis - a principle known as dollar-cost averaging - can help lower the average cost of your purchases, while also giving you the discipline to avoid selling weak performers just prior to an upswing, or chasing a hot performer just before a correction.
We invite you to learn more by visiting us on the Internet, dropping by one of our Investor Centers or calling us by phone. It is our privilege to provide the resources you need to choose investments that are right for you.
Sincerely,
(Acting Chairman's Signature)
James C. Curvey
Acting Chairman
Annual Report
Average annual total return reflects the change in the value of an investment, assuming reinvestment of the class' distributions from dividend income and capital gains (the profits earned upon the sale of securities that have grown in value, if any) and assuming a constant rate of performance each year. The $10,000 table and the fund's returns do not reflect the deduction of taxes that a shareholder would pay on fund distributions or the redemption of fund shares. During periods of reimbursement by Fidelity, a fund's total return will be greater than it would be had the reimbursement not occurred. How a fund did yesterday is no guarantee of how it will do tomorrow.
Average Annual Total Returns
Periods ended October 31, 2011 | Past 1
year | Past 5
years | Past 10
years |
Class KA,B | -6.24% | -1.46% | 7.65% |
A The initial offering of Class K shares took place on May 9, 2008. Returns prior to May 9, 2008 are those of Fidelity® International Discovery Fund, the original class of the fund.
B Prior to October 1, 2004, the fund operated under certain different investment policies. The fund's historical performances may not represent its current investment policies.
$10,000 Over 10 Years
Let's say hypothetically that $10,000 was invested in Fidelity® International Discovery Fund - Class K on October 31, 2001. The chart shows how the value of your investment would have changed, and also shows how the MSCI® EAFE ® (Europe, Australasia, Far East) Index performed over the same period. The initial offering of Class K took place on May 9, 2008. See above for additional information regarding the performance of Class K.

Annual Report
Market Recap: International equities were rocked by a number of headline events during the year ending October 31, 2011. Stocks posted a solid advance for the first half of the period, despite concern about the sovereign debt crisis in Europe, a devastating earthquake and tsunami in Japan, and political upheaval in the Middle East and North Africa. Sentiment turned decidedly negative in the second half, however, as fresh worries about Europe, inflation in China and a dimmed outlook for global growth caused foreign markets to suffer declines that intensified in August and September. October brought with it yet another dramatic swing, as eurozone policymakers appeared near a resolution to the debt debacle and buyers stormed back onto the scene in search of bargains. Still, those gains - along with favorable currency fluctuations overall - weren't enough to offset prior losses, and the MSCI® ACWI® (All Country World Index) ex USA Index finished the period down 4.56%. Within the MSCI index, Europe and emerging markets suffered the biggest declines, with many countries in these areas sustaining steep losses. By contrast, Japan showed resilience in the wake of its natural disasters, falling only 2%. Australia (+4%), Switzerland (+3%), the U.K. (+2%) and Canada, which produced a nominal return, were among the few major benchmark components to break into positive territory
Comments from William Kennedy, Portfolio Manager of Fidelity® International Discovery Fund: For the 12 months ending October 31, 2011, the fund's Class K shares returned -6.24%, lagging the -3.97% return of the MSCI® EAFE® (Europe, Australasia, Far East) Index. Stock selection and currency exposure detracted from relative performance, particularly in emerging markets (an out-of-index investment); the Asia Pacific ex Japan region; and the United Kingdom. Positioning in energy and financials most hampered returns. Individual disappointments included French bank BNP Paribas, whose stock fell amid worries over its exposure to Greek debt, and Danish brewery Carlsberg, whose earnings suffered from a spike in Russian grain prices. The fund also was hurt by not owning Swiss pharmaceuticals firm and index component Roche Holding. Conversely, defensive positioning in Japan and Europe helped, as did security selection in consumer discretionary and information technology. A non-index stake in Japanese online retailer Start Today benefited from growth in Internet purchases, while shares of U.K. software company Autonomy jumped following a premium acquisition offer. Some of these names were no longer in the portfolio at period end.
The views expressed above reflect those of the portfolio manager(s) only through the end of the period as stated on the cover of this report and do not necessarily represent the views of Fidelity or any other person in the Fidelity organization. Any such views are subject to change at any time based upon market or other conditions and Fidelity disclaims any responsibility to update such views. These views may not be relied on as investment advice and, because investment decisions for a Fidelity fund are based on numerous factors, may not be relied on as an indication of trading intent on behalf of any Fidelity fund.
Annual Report
Shareholder Expense Example
As a shareholder of the Fund, you incur two types of costs: (1) transaction costs, including sales charges (loads) on purchase payments or redemption proceeds, redemption fees, and (2) ongoing costs, including management fees, distribution and/or service (12b-1) fees and other Fund expenses. This Example is intended to help you understand your ongoing costs (in dollars) of investing in the Fund and to compare these costs with the ongoing costs of investing in other mutual funds.
The Example is based on an investment of $1,000 invested at the beginning of the period and held for the entire period (May 1, 2011 to October 31, 2011).
Actual Expenses
The first line of the accompanying table for each class of the Fund provides information about actual account values and actual expenses. You may use the information in this line, together with the amount you invested, to estimate the expenses that you paid over the period. Simply divide your account value by $1,000.00 (for example, an $8,600 account value divided by $1,000.00 = 8.6), then multiply the result by the number in the first line for a class of the Fund under the heading entitled "Expenses Paid During Period" to estimate the expenses you paid on your account during this period. A small balance maintenance fee of $12.00 that is charged once a year may apply for certain accounts with a value of less than $2,000. This fee is not included in the table below. If it was, the estimate of expenses you paid during the period would be higher, and your ending account value lower, by this amount. In addition, the Fund, as a shareholder in the underlying Fidelity Central Funds, will indirectly bear its pro-rata share of the fees and expenses incurred by the underlying Fidelity Central Funds. These fees and expenses are not included in the Fund's annualized expense ratio used to calculate the expense estimate in the table below.
Hypothetical Example for Comparison Purposes
The second line of the accompanying table for each class of the Fund provides information about hypothetical account values and hypothetical expenses based on a Class' actual expense ratio and an assumed rate of return of 5% per year before expenses, which is not the Class' actual return. The hypothetical account values and expenses may not be used to estimate the actual ending account balance or expenses you paid for the period. You may use this information to compare the ongoing costs of investing in the Fund and other funds. To do so, compare this 5% hypothetical example with the 5% hypothetical examples that appear in the shareholder reports of the other funds. A small balance maintenance fee of $12.00 that is charged once a year may apply for certain accounts with a value of less than $2,000. This fee is not included in the table below. If it was, the estimate of expenses you paid during the period would be higher, and your ending account value lower, by this amount. In addition, the Fund, as a shareholder in the underlying Fidelity Central Funds, will indirectly bear its pro-rata share of the fees and expenses incurred by the underlying Fidelity Central Funds. These fees and expenses are not included in the Fund's annualized expense ratio used to calculate the expense estimate in the table below.
Please note that the expenses shown in the table are meant to highlight your ongoing costs only and do not reflect any transaction costs. Therefore, the second line of the table is useful in comparing ongoing costs only, and will not help you determine the relative total costs of owning different funds. In addition, if these transactional costs were included, your costs would have been higher.
Annual Report
| Annualized Expense Ratio | Beginning
Account Value
May 1, 2011 | Ending
Account Value
October 31, 2011 | Expenses Paid
During Period*
May 1, 2011 to October 31, 2011 |
Class A | 1.29% | | | |
Actual | | $ 1,000.00 | $ 827.20 | $ 5.94 |
HypotheticalA | | $ 1,000.00 | $ 1,018.70 | $ 6.56 |
Class T | 1.54% | | | |
Actual | | $ 1,000.00 | $ 825.90 | $ 7.09 |
HypotheticalA | | $ 1,000.00 | $ 1,017.44 | $ 7.83 |
Class B | 2.05% | | | |
Actual | | $ 1,000.00 | $ 824.20 | $ 9.43 |
HypotheticalA | | $ 1,000.00 | $ 1,014.87 | $ 10.41 |
Class C | 2.04% | | | |
Actual | | $ 1,000.00 | $ 824.30 | $ 9.38 |
HypotheticalA | | $ 1,000.00 | $ 1,014.92 | $ 10.36 |
International Discovery | .96% | | | |
Actual | | $ 1,000.00 | $ 828.60 | $ 4.42 |
HypotheticalA | | $ 1,000.00 | $ 1,020.37 | $ 4.89 |
Class K | .79% | | | |
Actual | | $ 1,000.00 | $ 829.20 | $ 3.64 |
HypotheticalA | | $ 1,000.00 | $ 1,021.22 | $ 4.02 |
Institutional Class | .95% | | | |
Actual | | $ 1,000.00 | $ 828.40 | $ 4.38 |
HypotheticalA | | $ 1,000.00 | $ 1,020.42 | $ 4.84 |
A 5% return per year before expenses
* Expenses are equal to each Class' annualized expense ratio, multiplied by the average account value over the period, multiplied by 184/365 (to reflect the one-half year period).
Annual Report
Investment Changes (Unaudited)
Geographic Diversification (% of fund's net assets) |
As of October 31, 2011 |
| United Kingdom 21.0% | |
| Japan 15.8% | |
| France 9.1% | |
| Switzerland 6.8% | |
| Germany 6.3% | |
| Australia 3.5% | |
| Netherlands 3.4% | |
| Cayman Islands 2.8% | |
| Korea (South) 2.5% | |
| Other 28.8% | |

Percentages are adjusted for the effect of futures contracts, if applicable. |
As of April 30, 2011 |
| United Kingdom 21.3% | |
| Japan 16.2% | |
| France 8.8% | |
| Germany 7.7% | |
| Switzerland 5.2% | |
| Australia 4.1% | |
| United States of America 3.7% | |
| Netherlands 3.3% | |
| Denmark 3.1% | |
| Other 26.6% | |

Percentages are adjusted for the effect of futures contracts, if applicable. |
Asset Allocation |
| % of fund's
net assets | % of fund's net assets
6 months ago |
Stocks | 99.9 | 98.7 |
Short-Term Investments and Net Other Assets | 0.1 | 1.3 |
Top Ten Stocks as of October 31, 2011 |
| % of fund's
net assets | % of fund's net assets
6 months ago |
Royal Dutch Shell PLC Class B (United Kingdom, Oil, Gas & Consumable Fuels) | 2.8 | 2.8 |
Nestle SA (Switzerland, Food Products) | 2.0 | 0.9 |
British American Tobacco PLC (United Kingdom) (United Kingdom, Tobacco) | 1.8 | 0.4 |
BHP Billiton PLC (United Kingdom, Metals & Mining) | 1.7 | 1.9 |
Vodafone Group PLC (United Kingdom, Wireless Telecommunication Services) | 1.5 | 1.2 |
ORIX Corp. (Japan, Diversified Financial Services) | 1.3 | 1.1 |
BG Group PLC (United Kingdom, Oil, Gas & Consumable Fuels) | 1.3 | 1.0 |
Japan Tobacco, Inc. (Japan, Tobacco) | 1.3 | 0.5 |
Novo Nordisk A/S Series B (Denmark, Pharmaceuticals) | 1.3 | 1.5 |
HSBC Holdings PLC (United Kingdom) (United Kingdom, Commercial Banks) | 1.2 | 1.3 |
| 16.2 | |
Market Sectors as of October 31, 2011 |
| % of fund's
net assets | % of fund's net assets
6 months ago |
Financials | 21.3 | 21.3 |
Consumer Discretionary | 18.6 | 17.3 |
Consumer Staples | 12.6 | 8.2 |
Information Technology | 9.8 | 8.7 |
Industrials | 9.6 | 14.3 |
Energy | 7.5 | 8.5 |
Health Care | 7.2 | 6.2 |
Telecommunication Services | 6.4 | 5.3 |
Materials | 6.0 | 8.7 |
Utilities | 0.9 | 0.2 |
Annual Report
Investments October 31, 2011
Showing Percentage of Net Assets
Common Stocks - 98.6% |
| Shares | | Value (000s) |
Australia - 3.5% |
Australia & New Zealand Banking Group Ltd. | 4,456,031 | | $ 100,700 |
carsales.com Ltd. (d) | 3,966,844 | | 20,509 |
Commonwealth Bank of Australia | 1,268,063 | | 65,147 |
Fortescue Metals Group Ltd. | 3,503,390 | | 17,599 |
Macquarie Group Ltd. | 472,090 | | 12,156 |
Newcrest Mining Ltd. | 1,658,172 | | 58,608 |
WorleyParsons Ltd. | 993,898 | | 28,850 |
TOTAL AUSTRALIA | | 303,569 |
Austria - 0.0% |
Osterreichische Elektrizitatswirtschafts AG | 101,380 | | 2,951 |
Bailiwick of Guernsey - 0.1% |
Ashmore Global Opportunities Ltd. (United Kingdom) | 825,990 | | 9,166 |
Bailiwick of Jersey - 2.0% |
Experian PLC | 3,236,600 | | 42,187 |
Shire PLC | 2,310,400 | | 72,527 |
Velti PLC (a) | 290,405 | | 2,445 |
Wolseley PLC | 1,930,464 | | 55,820 |
TOTAL BAILIWICK OF JERSEY | | 172,979 |
Belgium - 0.3% |
Anheuser-Busch InBev SA NV | 542,427 | | 30,085 |
Bermuda - 1.0% |
African Minerals Ltd. (a) | 2,899,600 | | 20,599 |
Cheung Kong Infrastructure Holdings Ltd. | 6,530,000 | | 34,979 |
Li & Fung Ltd. | 9,616,000 | | 18,532 |
Noble Group Ltd. | 11,199,364 | | 13,670 |
TOTAL BERMUDA | | 87,780 |
Brazil - 2.1% |
Anhanguera Educacional Participacoes SA | 1,834,900 | | 26,981 |
Arezzo Industria e Comercio SA | 849,800 | | 11,234 |
Itau Unibanco Banco Multiplo SA sponsored ADR | 1,260,500 | | 24,101 |
Qualicorp SA | 4,305,000 | | 39,360 |
Souza Cruz Industria Comerico | 3,799,000 | | 46,592 |
TIM Participacoes SA sponsored ADR (d) | 1,447,849 | | 37,702 |
TOTAL BRAZIL | | 185,970 |
Common Stocks - continued |
| Shares | | Value (000s) |
British Virgin Islands - 0.5% |
Arcos Dorados Holdings, Inc. | 731,300 | | $ 17,112 |
Mail.ru Group Ltd. GDR (Reg. S) | 713,000 | | 24,563 |
TOTAL BRITISH VIRGIN ISLANDS | | 41,675 |
Canada - 1.2% |
Canadian Natural Resources Ltd. | 573,500 | | 20,228 |
InterOil Corp. (a)(d) | 204,400 | | 9,711 |
Open Text Corp. (a)(d) | 769,600 | | 47,102 |
Trinidad Drilling Ltd. | 3,430,500 | | 26,842 |
TOTAL CANADA | | 103,883 |
Cayman Islands - 2.8% |
Airtac International Group | 2,543,000 | | 14,233 |
Belle International Holdings Ltd. | 10,683,000 | | 20,952 |
Biostime International Holdings Ltd. | 8,183,000 | | 14,593 |
Bosideng International Holdings Ltd. | 43,814,000 | | 12,078 |
China Kanghui Holdings sponsored ADR (a)(d) | 1,747,000 | | 27,375 |
China Mengniu Dairy Co. Ltd. | 6,180,000 | | 19,693 |
China ZhengTong Auto Services Holdings Ltd. | 14,117,500 | | 15,287 |
Ctrip.com International Ltd. sponsored ADR (a) | 915,000 | | 31,897 |
Hengdeli Holdings Ltd. | 28,576,000 | | 12,811 |
Microport Scientific Corp. | 8,277,000 | | 4,678 |
Sands China Ltd. (a) | 17,144,800 | | 51,523 |
Shenguan Holdings Group Ltd. | 35,412,000 | | 19,025 |
TOTAL CAYMAN ISLANDS | | 244,145 |
China - 1.3% |
Baidu.com, Inc. sponsored ADR (a) | 394,600 | | 55,315 |
China Telecom Corp. Ltd. (H Shares) | 41,444,000 | | 25,588 |
SINA Corp. (a)(d) | 310,200 | | 25,216 |
Zhaojin Mining Industry Co. Ltd. (H Shares) | 4,984,000 | | 8,898 |
TOTAL CHINA | | 115,017 |
Cyprus - 0.0% |
Aisi Realty Public Ltd. (a)(e) | 216,330 | | 240 |
Denmark - 2.2% |
Novo Nordisk A/S Series B | 1,029,289 | | 109,293 |
William Demant Holding A/S (a) | 984,500 | | 78,551 |
TOTAL DENMARK | | 187,844 |
Common Stocks - continued |
| Shares | | Value (000s) |
Finland - 0.7% |
Amer Group PLC (A Shares) | 1,325,300 | | $ 18,322 |
Nokian Tyres PLC | 1,213,133 | | 44,574 |
TOTAL FINLAND | | 62,896 |
France - 9.1% |
Air Liquide SA | 307,100 | | 39,843 |
Arkema SA | 436,670 | | 29,874 |
Atos Origin SA | 1,058,073 | | 51,279 |
AXA SA | 3,922,902 | | 63,898 |
BNP Paribas SA | 1,322,566 | | 60,125 |
Club Mediterranee SA (a) | 470,000 | | 8,917 |
Danone | 1,265,300 | | 88,078 |
Iliad SA | 625,259 | | 73,187 |
Ipsos SA | 54,516 | | 1,790 |
JC Decaux SA (a) | 652,300 | | 17,481 |
LVMH Moet Hennessy - Louis Vuitton | 621,877 | | 103,489 |
Pernod-Ricard SA | 329,525 | | 30,782 |
PPR SA | 398,700 | | 62,294 |
Safran SA | 714,800 | | 23,415 |
Sanofi-aventis | 953,011 | | 68,187 |
Schneider Electric SA | 529,528 | | 31,255 |
Societe Generale Series A | 685,447 | | 20,015 |
Unibail-Rodamco | 118,400 | | 23,677 |
TOTAL FRANCE | | 797,586 |
Germany - 5.1% |
Aareal Bank AG (a) | 1,131,037 | | 22,993 |
Allianz AG | 325,100 | | 36,537 |
Bayer AG | 767,558 | | 49,176 |
Bayerische Motoren Werke AG (BMW) | 834,676 | | 68,221 |
Commerzbank AG (a) | 4,229,500 | | 10,436 |
Deutsche Bank AG | 1,018,100 | | 42,103 |
Fresenius Medical Care AG & Co. KGaA | 940,100 | | 68,492 |
GEA Group AG | 992,880 | | 27,433 |
Gerry Weber International AG (Bearer) | 320,600 | | 9,983 |
Kabel Deutschland Holding AG (a) | 1,085,800 | | 61,999 |
Siemens AG | 475,549 | | 49,855 |
TOTAL GERMANY | | 447,228 |
Hong Kong - 1.5% |
AIA Group Ltd. | 13,058,400 | | 39,929 |
China Unicom (Hong Kong) Ltd. | 12,452,000 | | 25,036 |
Common Stocks - continued |
| Shares | | Value (000s) |
Hong Kong - continued |
I.T Ltd. | 14,631,000 | | $ 9,112 |
Techtronic Industries Co. Ltd. | 65,201,500 | | 56,415 |
TOTAL HONG KONG | | 130,492 |
India - 1.6% |
Apollo Hospitals Enterprise Ltd. | 1,432,254 | | 15,263 |
Bharti Airtel Ltd. | 5,744,231 | | 46,004 |
Housing Development Finance Corp. Ltd. | 2,696,342 | | 37,945 |
Larsen & Toubro Ltd. | 279,321 | | 8,057 |
Shriram Transport Finance Co. Ltd. | 732,049 | | 9,165 |
The Jammu & Kashmir Bank Ltd. | 545,569 | | 9,407 |
Titan Industries Ltd. | 3,211,760 | | 14,263 |
TOTAL INDIA | | 140,104 |
Indonesia - 0.6% |
PT Astra International Tbk | 1,338,500 | | 10,321 |
PT Sarana Menara Nusantara Tbk (a) | 13,136,500 | | 13,282 |
PT Tower Bersama Infrastructure Tbk | 55,223,500 | | 12,852 |
PT XL Axiata Tbk | 22,623,000 | | 12,653 |
TOTAL INDONESIA | | 49,108 |
Ireland - 1.4% |
Accenture PLC Class A | 719,100 | | 43,333 |
James Hardie Industries NV CDI (a) | 5,530,462 | | 35,824 |
Kenmare Resources PLC (a) | 5,264,162 | | 3,435 |
Paddy Power PLC (Ireland) | 728,700 | | 40,338 |
TOTAL IRELAND | | 122,930 |
Israel - 0.6% |
Check Point Software Technologies Ltd. (a) | 517,600 | | 29,829 |
Israel Chemicals Ltd. | 1,513,500 | | 18,212 |
TOTAL ISRAEL | | 48,041 |
Italy - 1.4% |
Intesa Sanpaolo SpA | 8,188,112 | | 14,629 |
Prada SpA | 2,305,100 | | 11,395 |
Prysmian SpA | 1,473,800 | | 22,334 |
Saipem SpA | 1,580,606 | | 70,872 |
TOTAL ITALY | | 119,230 |
Japan - 15.8% |
ABC-Mart, Inc. | 1,529,000 | | 59,886 |
Aozora Bank Ltd. | 4,562,000 | | 11,534 |
Common Stocks - continued |
| Shares | | Value (000s) |
Japan - continued |
Asics Corp. | 3,605,000 | | $ 47,798 |
Calbee, Inc. (d) | 700,800 | | 31,951 |
Canon, Inc. | 1,744,350 | | 79,200 |
Cosmos Pharmaceutical Corp. | 859,200 | | 39,858 |
Credit Saison Co. Ltd. | 1,323,500 | | 25,830 |
DeNA Co. Ltd. | 336,000 | | 14,504 |
Denso Corp. | 1,300,300 | | 39,994 |
Digital Garage, Inc. (a) | 2,715 | | 8,890 |
Don Quijote Co. Ltd. | 1,367,200 | | 50,088 |
Fanuc Corp. | 381,000 | | 61,612 |
Honda Motor Co. Ltd. | 1,966,400 | | 58,810 |
Japan Retail Fund Investment Corp. | 1,225 | | 1,897 |
Japan Tobacco, Inc. | 22,266 | | 111,303 |
JS Group Corp. | 1,457,600 | | 30,569 |
JSR Corp. | 2,283,400 | | 43,596 |
Kakaku.com, Inc. | 810,600 | | 32,100 |
KDDI Corp. | 10,315 | | 75,571 |
Keyence Corp. | 192,600 | | 48,967 |
Misumi Group, Inc. | 1,254,900 | | 26,114 |
Mitsubishi Corp. | 2,574,400 | | 52,954 |
Mitsubishi Estate Co. Ltd. | 1,553,000 | | 26,307 |
Mitsubishi UFJ Financial Group, Inc. | 15,161,400 | | 65,899 |
ORIX Corp. | 1,321,050 | | 115,310 |
Rakuten, Inc. | 68,670 | | 75,288 |
So-net M3, Inc. (d) | 5,296 | | 23,954 |
SOFTBANK CORP. | 1,375,900 | | 44,661 |
Start Today Co. Ltd. | 2,740,800 | | 57,987 |
Tokyo Electron Ltd. | 309,600 | | 16,468 |
TOTAL JAPAN | | 1,378,900 |
Korea (South) - 2.5% |
Hyundai Motor Co. | 209,530 | | 42,040 |
Kia Motors Corp. | 453,500 | | 28,966 |
LG Household & Health Care Ltd. | 49,310 | | 22,187 |
NHN Corp. (a) | 64,289 | | 13,362 |
Orion Corp. | 113,331 | | 60,574 |
Samsung Electronics Co. Ltd. | 38,175 | | 32,741 |
Shinhan Financial Group Co. Ltd. | 421,030 | | 16,710 |
TOTAL KOREA (SOUTH) | | 216,580 |
Luxembourg - 1.3% |
Brait SA | 5,949,360 | | 14,243 |
Common Stocks - continued |
| Shares | | Value (000s) |
Luxembourg - continued |
Millicom International Cellular SA | 190,400 | | $ 20,925 |
Millicom International Cellular SA (depositary receipt) | 477,100 | | 52,580 |
Samsonite International SA | 14,826,300 | | 24,124 |
TOTAL LUXEMBOURG | | 111,872 |
Mexico - 0.5% |
Wal-Mart de Mexico SA de CV Series V | 18,209,000 | | 47,039 |
Netherlands - 3.4% |
AEGON NV (a) | 5,028,800 | | 23,986 |
ASML Holding NV | 971,700 | | 40,743 |
Gemalto NV | 1,818,979 | | 82,995 |
ING Groep NV (Certificaten Van Aandelen) (a) | 11,511,300 | | 99,253 |
Koninklijke Philips Electronics NV | 1,247,700 | | 25,977 |
Randstad Holdings NV | 726,367 | | 25,910 |
TOTAL NETHERLANDS | | 298,864 |
Norway - 1.1% |
Aker Solutions ASA | 1,927,748 | | 22,419 |
DnB NOR ASA | 6,602,355 | | 77,021 |
TOTAL NORWAY | | 99,440 |
Philippines - 0.3% |
Alliance Global Group, Inc. | 101,250,000 | | 25,173 |
Poland - 0.3% |
Eurocash SA | 3,593,990 | | 28,816 |
Qatar - 0.3% |
Commercial Bank of Qatar GDR (Reg. S) | 5,094,802 | | 23,366 |
South Africa - 1.0% |
AngloGold Ashanti Ltd. sponsored ADR | 816,100 | | 36,896 |
Sanlam Ltd. | 5,826,600 | | 21,768 |
Shoprite Holdings Ltd. | 2,042,000 | | 29,926 |
TOTAL SOUTH AFRICA | | 88,590 |
Spain - 1.5% |
Banco Bilbao Vizcaya Argentaria SA | 1,836,204 | | 16,528 |
Banco Santander SA: | | | |
rights 10/31/11 | 6,080,392 | | 1,052 |
(Spain) | 6,080,392 | | 51,471 |
Inditex SA | 280,831 | | 25,557 |
Common Stocks - continued |
| Shares | | Value (000s) |
Spain - continued |
Prosegur Compania de Seguridad SA (Reg.) | 382,900 | | $ 19,103 |
Viscofan Envolturas Celulosicas SA | 515,100 | | 19,824 |
TOTAL SPAIN | | 133,535 |
Sweden - 1.3% |
Elekta AB (B Shares) | 316,100 | | 12,650 |
Intrum Justitia AB | 111,800 | | 1,839 |
Meda AB (A Shares) | 1,713,200 | | 17,501 |
Swedbank AB (A Shares) | 3,382,000 | | 47,647 |
Swedish Match Co. | 1,052,600 | | 36,424 |
TOTAL SWEDEN | | 116,061 |
Switzerland - 6.8% |
Adecco SA (Reg.) | 548,529 | | 26,509 |
Compagnie Financiere Richemont SA Series A | 315,194 | | 18,049 |
Kuehne & Nagel International AG | 197,400 | | 24,586 |
Nestle SA | 2,973,853 | | 172,491 |
Partners Group Holding | 230,056 | | 43,125 |
Schindler Holding AG (participation certificate) | 554,147 | | 65,168 |
The Swatch Group AG (Bearer) | 98,950 | | 41,901 |
Transocean Ltd. (United States) | 829,400 | | 47,400 |
UBS AG (a) | 3,755,130 | | 47,472 |
UBS AG (NY Shares) (a) | 1,833,200 | | 23,135 |
Zurich Financial Services AG | 346,539 | | 80,479 |
TOTAL SWITZERLAND | | 590,315 |
Taiwan - 0.5% |
Catcher Technology Co. Ltd. | 5,046,500 | | 28,117 |
WPG Holding Co. Ltd. | 15,884,570 | | 19,181 |
TOTAL TAIWAN | | 47,298 |
Turkey - 0.1% |
Boyner Buyuk Magazacilik A/S (a)(e) | 6,011,100 | | 10,096 |
United Kingdom - 21.0% |
Aberdeen Asset Management PLC | 9,033,732 | | 27,966 |
Aggreko PLC | 484,300 | | 13,334 |
Anglo American PLC (United Kingdom) | 1,293,300 | | 47,702 |
Ashmore Group PLC | 3,169,400 | | 17,585 |
Aviva PLC | 6,344,300 | | 34,618 |
Barclays PLC | 22,562,258 | | 69,955 |
BG Group PLC | 5,124,372 | | 111,789 |
BHP Billiton PLC | 4,802,296 | | 151,250 |
Common Stocks - continued |
| Shares | | Value (000s) |
United Kingdom - continued |
BP PLC | 11,307,867 | | $ 83,228 |
British American Tobacco PLC (United Kingdom) | 3,366,600 | | 154,388 |
British Land Co. PLC | 5,756,734 | | 47,262 |
Burberry Group PLC | 1,970,900 | | 42,504 |
Carphone Warehouse Group PLC | 15,119,465 | | 85,346 |
Diageo PLC | 1,603,635 | | 33,195 |
GlaxoSmithKline PLC | 3,131,100 | | 70,282 |
HSBC Holdings PLC (United Kingdom) | 11,905,657 | | 103,900 |
Imperial Tobacco Group PLC | 1,488,285 | | 54,427 |
International Personal Finance PLC | 9,411,888 | | 41,503 |
Jazztel PLC (a)(d) | 3,802,400 | | 21,996 |
Legal & General Group PLC | 30,442,457 | | 54,098 |
Lloyds Banking Group PLC (a) | 49,557,364 | | 25,632 |
Micro Focus International PLC | 2,166,900 | | 11,834 |
National Grid PLC | 4,386,000 | | 43,614 |
Ocado Group PLC (a)(d) | 14,388,400 | | 21,670 |
Reckitt Benckiser Group PLC | 414,431 | | 21,314 |
Royal Dutch Shell PLC Class B | 6,770,160 | | 242,949 |
Royalblue Group PLC | 128,356 | | 3,358 |
SuperGroup PLC (a)(d) | 960,741 | | 9,641 |
The Weir Group PLC | 599,600 | | 18,504 |
Ultra Electronics Holdings PLC | 614,667 | | 15,737 |
Vodafone Group PLC | 46,662,143 | | 129,590 |
Xstrata PLC | 1,728,100 | | 29,056 |
TOTAL UNITED KINGDOM | | 1,839,227 |
United States of America - 1.9% |
Citrix Systems, Inc. (a) | 546,700 | | 39,816 |
Cognizant Technology Solutions Corp. Class A (a) | 298,200 | | 21,694 |
Green Mountain Coffee Roasters, Inc. (a) | 180,700 | | 11,749 |
MasterCard, Inc. Class A | 165,200 | | 57,364 |
Virgin Media, Inc. | 1,603,800 | | 39,101 |
TOTAL UNITED STATES OF AMERICA | | 169,724 |
TOTAL COMMON STOCKS (Cost $8,600,939) |
8,627,815
|
Nonconvertible Preferred Stocks - 1.3% |
| Shares | | Value (000s) |
Germany - 1.2% |
ProSiebenSat.1 Media AG | 40,648 | | $ 872 |
Volkswagen AG | 569,500 | | 99,935 |
TOTAL GERMANY | | 100,807 |
Italy - 0.1% |
Fiat Industrial SpA (a) | 2,156,296 | | 13,231 |
TOTAL NONCONVERTIBLE PREFERRED STOCKS (Cost $90,158) |
114,038
|
Money Market Funds - 1.2% |
| | | |
Fidelity Cash Central Fund, 0.12% (b) | 27,641,463 | | 27,641 |
Fidelity Securities Lending Cash Central Fund, 0.11% (b)(c) | 80,899,017 | | 80,899 |
TOTAL MONEY MARKET FUNDS (Cost $108,540) |
108,540
|
TOTAL INVESTMENT PORTFOLIO - 101.1% (Cost $8,799,637) | | 8,850,393 |
NET OTHER ASSETS (LIABILITIES) - (1.1)% | | (97,426) |
NET ASSETS - 100% | $ 8,752,967 |
Legend |
(a) Non-income producing |
(b) Affiliated fund that is available only to investment companies and other accounts managed by Fidelity Investments. The rate quoted is the annualized seven-day yield of the fund at period end. A complete unaudited listing of the fund's holdings as of its most recent quarter end is available upon request. In addition, each Fidelity Central Fund's financial statements, which are not covered by the Fund's Report of Independent Registered Public Accounting Firm, are available on the SEC's website or upon request. |
(c) Investment made with cash collateral received from securities on loan. |
(d) Security or a portion of the security is on loan at period end. |
(e) Affiliated company |
Affiliated Central Funds |
Information regarding fiscal year to date income earned by the Fund from investments in Fidelity Central Funds is as follows: |
Fund | Income earned
(Amounts in thousands) |
Fidelity Cash Central Fund | $ 112 |
Fidelity Securities Lending Cash Central Fund | 6,208 |
Total | $ 6,320 |
Other Affiliated Issuers |
An affiliated company is a company in which the Fund has ownership of at least 5% of the voting securities. Fiscal year to date transactions with companies which are or were affiliates are as follows: |
Affiliate
(Amounts in thousands) | Value, beginning of period | Purchases | Sales Proceeds | Dividend Income | Value,
end of
period |
Aisi Realty Public Ltd. | $ 607 | $ - | $ - | $ - | $ 240 |
Ashmore Global Opportunities Ltd. (United States) | - | 10,376 | - | 259 | - |
Boyner Buyuk Magazacilik A/S | 11,256 | 2,951 | - | - | 10,096 |
Total | $ 11,863 | $ 13,327 | $ - | $ 259 | $ 10,336 |
Other Information |
The following is a summary of the inputs used, as of October 31, 2011, involving the Fund's assets and liabilities carried at fair value. The inputs or methodology used for valuing securities may not be an indication of the risk associated with investing in those securities. For more information on valuation inputs, and their aggregation into the levels used in the tables below, please refer to the Security Valuation section in the accompanying Notes to Financial Statements. |
Valuation Inputs at Reporting Date: |
Description
(Amounts in thousands) | Total | Level 1 | Level 2 | Level 3 |
Investments in Securities: | | | | |
Equities: | | | | |
United Kingdom | $ 1,839,227 | $ 696,626 | $ 1,142,601 | $ - |
Japan | 1,378,900 | - | 1,378,900 | - |
France | 797,586 | 729,399 | 68,187 | - |
Switzerland | 590,315 | 542,843 | 47,472 | - |
Germany | 548,035 | 387,585 | 160,450 | - |
Australia | 303,569 | - | 303,569 | - |
Netherlands | 298,864 | 149,648 | 149,216 | - |
Cayman Islands | 244,145 | 59,272 | 184,873 | - |
Korea (South) | 216,580 | - | 216,580 | - |
Other | 2,524,632 | 1,704,716 | 819,916 | - |
Money Market Funds | 108,540 | 108,540 | - | - |
Total Investments in Securities: | $ 8,850,393 | $ 4,378,629 | $ 4,471,764 | $ - |
Transfers from Level 1 to Level 2 during the period were $1,331,743,000. |
The following is a reconciliation of Investments in Securities for which Level 3 inputs were used in determining value: |
(Amounts in thousands) | |
Investments in Securities: | |
Beginning Balance | $ 607 |
Total Realized Gain (Loss) | - |
Total Unrealized Gain (Loss) | - |
Cost of Purchases | - |
Proceeds of Sales | - |
Amortization/Accretion | - |
Transfers in to Level 3 | - |
Transfers out of Level 3 | (607) |
Ending Balance | $ - |
The change in unrealized gain (loss) for the period attributable to Level 3 securities held at October 31, 2011 | $ - |
The information used in the above reconciliation represents fiscal year to date activity for any Investments in Securities identified as using Level 3 inputs at either the beginning or the end of the current fiscal period. Transfers in or out of Level 3 represent the beginning value of any Security or Instrument where a change in the pricing level occurred from the beginning to the end of the period. The cost of purchases and the proceeds of sales may include securities received or delivered through corporate actions or exchanges. Realized and unrealized gains (losses) disclosed in the reconciliation are included in Net Gain (Loss) on the Fund's Statement of Operations. |
Income Tax Information |
At October 31, 2011, the Fund had a capital loss carryforward of approximately $1,349,541,000 all of which will expire in fiscal 2017. Capital loss carryforwards are only available to offset future capital gains of the Fund to the extent provided by regulations and may be limited. |
See accompanying notes which are an integral part of the financial statements.
Annual Report
Statement of Assets and Liabilities
Amounts in thousands (except per-share amounts) | October 31, 2011 |
| | |
Assets | | |
Investment in securities, at value (including securities loaned of $73,811) - See accompanying schedule: Unaffiliated issuers (cost $8,669,458) | $ 8,731,517 | |
Fidelity Central Funds (cost $108,540) | 108,540 | |
Other affiliated issuers (cost $21,639) | 10,336 | |
Total Investments (cost $8,799,637) | | $ 8,850,393 |
Foreign currency held at value (cost $37,392) | | 37,392 |
Receivable for investments sold | | 89,865 |
Receivable for fund shares sold | | 6,925 |
Dividends receivable | | 18,912 |
Distributions receivable from Fidelity Central Funds | | 280 |
Prepaid expenses | | 35 |
Other receivables | | 5,269 |
Total assets | | 9,009,071 |
| | |
Liabilities | | |
Payable to custodian bank | $ 756 | |
Payable for investments purchased | 155,082 | |
Payable for fund shares redeemed | 11,410 | |
Accrued management fee | 4,698 | |
Distribution and service plan fees payable | 125 | |
Other affiliated payables | 1,638 | |
Other payables and accrued expenses | 1,496 | |
Collateral on securities loaned, at value | 80,899 | |
Total liabilities | | 256,104 |
| | |
Net Assets | | $ 8,752,967 |
Net Assets consist of: | | |
Paid in capital | | $ 10,067,323 |
Undistributed net investment income | | 102,433 |
Accumulated undistributed net realized gain (loss) on investments and foreign currency transactions | | (1,466,813) |
Net unrealized appreciation (depreciation) on investments and assets and liabilities in foreign currencies | | 50,024 |
Net Assets | | $ 8,752,967 |
See accompanying notes which are an integral part of the financial statements.
Annual Report
Financial Statements - continued
Statement of Assets and Liabilities - continued
Amounts in thousands (except per-share amounts) | October 31, 2011 |
| | |
Calculation of Maximum Offering Price Class A: Net Asset Value and redemption price per share
($319,917 ÷ 10,869.3 shares) | | $ 29.43 |
| | |
Maximum offering price per share (100/94.25 of $29.43) | | $ 31.23 |
Class T:
Net Asset Value and redemption price per share ($60,905 ÷ 2,087.0 shares) | | $ 29.18 |
| | |
Maximum offering price per share (100/96.50 of $29.18) | | $ 30.24 |
Class B:
Net Asset Value and offering price per share
($10,183 ÷ 350.9 shares)A | | $ 29.02 |
| | |
Class C:
Net Asset Value and offering price per share
($32,911 ÷ 1,131.9 shares)A | | $ 29.08 |
| | |
International Discovery:
Net Asset Value, offering price and redemption price per share ($6,806,183 ÷ 229,250.8 shares) | | $ 29.69 |
| | |
Class K:
Net Asset Value, offering price and redemption price per share ($1,244,550 ÷ 41,955.8 shares) | | $ 29.66 |
| | |
Institutional Class:
Net Asset Value, offering price and redemption price per share ($278,318 ÷ 9,386.6 shares) | | $ 29.65 |
A Redemption price per share is equal to net asset value less any applicable contingent deferred sales charge.
See accompanying notes which are an integral part of the financial statements.
Annual Report
Statement of Operations
Amounts in thousands | Year ended October 31, 2011 |
| | |
Investment Income | | |
Dividends (including $259 earned from other affiliated issuers) | | $ 263,448 |
Interest | | 3 |
Income from Fidelity Central Funds | | 6,320 |
Income before foreign taxes withheld | | 269,771 |
Less foreign taxes withheld | | (16,970) |
Total income | | 252,801 |
| | |
Expenses | | |
Management fee
Basic fee | $ 69,910 | |
Performance adjustment | (475) | |
Transfer agent fees | 20,262 | |
Distribution and service plan fees | 1,864 | |
Accounting and security lending fees | 1,798 | |
Custodian fees and expenses | 1,713 | |
Independent trustees' compensation | 55 | |
Registration fees | 186 | |
Audit | 122 | |
Legal | 40 | |
Interest | 2 | |
Miscellaneous | 107 | |
Total expenses before reductions | 95,584 | |
Expense reductions | (4,391) | 91,193 |
Net investment income (loss) | | 161,608 |
Realized and Unrealized Gain (Loss) Net realized gain (loss) on: | | |
Investment securities: | | |
Unaffiliated issuers | 506,179 | |
Foreign currency transactions | (4,241) | |
Total net realized gain (loss) | | 501,938 |
Change in net unrealized appreciation (depreciation) on: Investment securities (net of decrease in deferred foreign taxes of $8,547) | (1,246,049) | |
Assets and liabilities in foreign currencies | (1,473) | |
Total change in net unrealized appreciation (depreciation) | | (1,247,522) |
Net gain (loss) | | (745,584) |
Net increase (decrease) in net assets resulting from operations | | $ (583,976) |
See accompanying notes which are an integral part of the financial statements.
Annual Report
Financial Statements - continued
Statement of Changes in Net Assets
Amounts in thousands | Year ended
October 31,
2011 | Year ended
October 31,
2010 |
Increase (Decrease) in Net Assets | | |
Operations | | |
Net investment income (loss) | $ 161,608 | $ 130,595 |
Net realized gain (loss) | 501,938 | 481,821 |
Change in net unrealized appreciation (depreciation) | (1,247,522) | 638,780 |
Net increase (decrease) in net assets resulting
from operations | (583,976) | 1,251,196 |
Distributions to shareholders from net investment income | (149,936) | (116,422) |
Distributions to shareholders from net realized gain | (48,090) | (13,374) |
Total distributions | (198,026) | (129,796) |
Share transactions - net increase (decrease) | (537,341) | (662,032) |
Redemption fees | 160 | 291 |
Total increase (decrease) in net assets | (1,319,183) | 459,659 |
| | |
Net Assets | | |
Beginning of period | 10,072,150 | 9,612,491 |
End of period (including undistributed net investment income of $102,433 and undistributed net investment income of $120,198, respectively) | $ 8,752,967 | $ 10,072,150 |
See accompanying notes which are an integral part of the financial statements.
Annual Report
Financial Highlights - Class A
Years ended October 31, | 2011 | 2010 | 2009 | 2008 | 2007 |
Selected Per-Share Data | | | | | |
Net asset value, beginning of period | $ 32.07 | $ 28.57 | $ 23.68 | $ 47.34 | $ 36.47 |
Income from Investment Operations | | | | | |
Net investment income (loss) C | .42 | .31 | .31 | .46 | .44 |
Net realized and unrealized gain (loss) | (2.52) | 3.51 | 4.84 | (22.08) | 11.76 |
Total from investment operations | (2.10) | 3.82 | 5.15 | (21.62) | 12.20 |
Distributions from net investment income | (.38) | (.28) | (.26) | (.37) | (.35) |
Distributions from net realized gain | (.16) | (.04) | - | (1.67) | (.98) |
Total distributions | (.54) | (.32) | (.26) | (2.04) | (1.33) |
Redemption fees added to paid in capital C,G | - | - | - | - | - |
Net asset value, end of period | $ 29.43 | $ 32.07 | $ 28.57 | $ 23.68 | $ 47.34 |
Total Return A,B | (6.71)% | 13.43% | 22.14% | (47.65)% | 34.54% |
Ratios to Average Net Assets D,F | | | | | |
Expenses before reductions | 1.30% | 1.33% | 1.37% | 1.32% | 1.25% |
Expenses net of fee waivers, if any | 1.29% | 1.33% | 1.37% | 1.32% | 1.25% |
Expenses net of all reductions | 1.25% | 1.28% | 1.32% | 1.29% | 1.22% |
Net investment income (loss) | 1.31% | 1.06% | 1.28% | 1.27% | 1.08% |
Supplemental Data | | | | | |
Net assets, end of period (in millions) | $ 320 | $ 392 | $ 414 | $ 380 | $ 417 |
Portfolio turnover rate E | 75% | 82% | 98% | 79% | 56% |
A Total returns would have been lower if certain expenses had not been reduced during the applicable periods shown.
B Total returns do not include the effect of the sales charges.
C Calculated based on average shares outstanding during the period.
D Fees and expenses of any underlying Fidelity Central Funds are not included in the Fund's expense ratio. The Fund indirectly bears its proportionate share of the expenses of any underlying Fidelity Central Funds.
E Amount does not include the portfolio activity of any underlying Fidelity Central Funds.
F Expense ratios reflect operating expenses of the class. Expenses before reductions do not reflect amounts reimbursed by the investment adviser or reductions from brokerage service arrangements or reductions from other expense offset arrangements and do not represent the amount paid by the class during periods when reimbursements or reductions occur. Expenses net of fee waivers reflect expenses after reimbursement by the investment adviser but prior to reductions from brokerage service arrangements or other expense offset arrangements. Expenses net of all reductions represent the net expenses paid by the class.
G Amount represents less than $.01 per share.
See accompanying notes which are an integral part of the financial statements.
Annual Report
Financial Highlights - Class T
Years ended October 31, | 2011 | 2010 | 2009 | 2008 | 2007 |
Selected Per-Share Data | | | | | |
Net asset value, beginning of period | $ 31.81 | $ 28.35 | $ 23.49 | $ 47.06 | $ 36.30 |
Income from Investment Operations | | | | | |
Net investment income (loss) C | .34 | .23 | .24 | .33 | .29 |
Net realized and unrealized gain (loss) | (2.51) | 3.48 | 4.81 | (21.94) | 11.71 |
Total from investment operations | (2.17) | 3.71 | 5.05 | (21.61) | 12.00 |
Distributions from net investment income | (.30) | (.21) | (.19) | (.29) | (.26) |
Distributions from net realized gain | (.16) | (.04) | - | (1.67) | (.98) |
Total distributions | (.46) | (.25) | (.19) | (1.96) | (1.24) |
Redemption fees added to paid in capital C,G | - | - | - | - | - |
Net asset value, end of period | $ 29.18 | $ 31.81 | $ 28.35 | $ 23.49 | $ 47.06 |
Total Return A,B | (6.96)% | 13.14% | 21.79% | (47.84)% | 34.08% |
Ratios to Average Net Assets D,F | | | | | |
Expenses before reductions | 1.56% | 1.60% | 1.65% | 1.68% | 1.63% |
Expenses net of fee waivers, if any | 1.55% | 1.60% | 1.65% | 1.68% | 1.63% |
Expenses net of all reductions | 1.51% | 1.56% | 1.60% | 1.64% | 1.60% |
Net investment income (loss) | 1.05% | .79% | 1.00% | .91% | .70% |
Supplemental Data | | | | | |
Net assets, end of period (in millions) | $ 61 | $ 92 | $ 83 | $ 64 | $ 53 |
Portfolio turnover rate E | 75% | 82% | 98% | 79% | 56% |
A Total returns would have been lower if certain expenses had not been reduced during the applicable periods shown.
B Total returns do not include the effect of the sales charges.
C Calculated based on average shares outstanding during the period.
D Fees and expenses of any underlying Fidelity Central Funds are not included in the Fund's expense ratio. The Fund indirectly bears its proportionate share of the expenses of any underlying Fidelity Central Funds.
E Amount does not include the portfolio activity of any underlying Fidelity Central Funds.
F Expense ratios reflect operating expenses of the class. Expenses before reductions do not reflect amounts reimbursed by the investment adviser or reductions from brokerage service arrangements or reductions from other expense offset arrangements and do not represent the amount paid by the class during periods when reimbursements or reductions occur. Expenses net of fee waivers reflect expenses after reimbursement by the investment adviser but prior to reductions from brokerage service arrangements or other expense offset arrangements. Expenses net of all reductions represent the net expenses paid by the class.
G Amount represents less than $.01 per share.
See accompanying notes which are an integral part of the financial statements.
Annual Report
Financial Highlights - Class B
Years ended October 31, | 2011 | 2010 | 2009 | 2008 | 2007 |
Selected Per-Share Data | | | | | |
Net asset value, beginning of period | $ 31.60 | $ 28.18 | $ 23.25 | $ 46.70 | $ 36.12 |
Income from Investment Operations | | | | | |
Net investment income (loss) C | .17 | .08 | .12 | .15 | .08 |
Net realized and unrealized gain (loss) | (2.48) | 3.44 | 4.81 | (21.77) | 11.64 |
Total from investment operations | (2.31) | 3.52 | 4.93 | (21.62) | 11.72 |
Distributions from net investment income | (.12) | (.06) | - | (.16) | (.16) |
Distributions from net realized gain | (.16) | (.04) | - | (1.67) | (.98) |
Total distributions | (.27) H | (.10) | - | (1.83) | (1.14) |
Redemption fees added to paid in capital C,G | - | - | - | - | - |
Net asset value, end of period | $ 29.02 | $ 31.60 | $ 28.18 | $ 23.25 | $ 46.70 |
Total Return A,B | (7.39)% | 12.52% | 21.20% | (48.11)% | 33.37% |
Ratios to Average Net Assets D,F | | | | | |
Expenses before reductions | 2.06% | 2.12% | 2.16% | 2.19% | 2.14% |
Expenses net of fee waivers, if any | 2.06% | 2.12% | 2.16% | 2.19% | 2.14% |
Expenses net of all reductions | 2.02% | 2.08% | 2.11% | 2.15% | 2.10% |
Net investment income (loss) | .54% | .27% | .49% | .40% | .19% |
Supplemental Data | | | | | |
Net assets, end of period (in millions) | $ 10 | $ 14 | $ 16 | $ 15 | $ 17 |
Portfolio turnover rate E | 75% | 82% | 98% | 79% | 56% |
A Total returns would have been lower if certain expenses had not been reduced during the applicable periods shown.
B Total returns do not include the effect of the contingent deferred sales charge.
C Calculated based on average shares outstanding during the period.
D Fees and expenses of any underlying Fidelity Central Funds are not included in the Fund's expense ratio. The Fund indirectly bears its proportionate share of the expenses of any underlying Fidelity Central Funds.
E Amount does not include the portfolio activity of any underlying Fidelity Central Funds.
F Expense ratios reflect operating expenses of the class. Expenses before reductions do not reflect amounts reimbursed by the investment adviser or reductions from brokerage service arrangements or reductions from other expense offset arrangements and do not represent the amount paid by the class during periods when reimbursements or reductions occur. Expenses net of fee waivers reflect expenses after reimbursement by the investment adviser but prior to reductions from brokerage service arrangements or other expense offset arrangements. Expenses net of all reductions represent the net expenses paid by the class.
G Amount represents less than $.01 per share.
H Total distributions of $.27 per share is comprised of distributions from net investment income of $.115 and distributions from net realized gain of $.155 per share.
See accompanying notes which are an integral part of the financial statements.
Annual Report
Financial Highlights - Class C
Years ended October 31, | 2011 | 2010 | 2009 | 2008 | 2007 |
Selected Per-Share Data | | | | | |
Net asset value, beginning of period | $ 31.68 | $ 28.23 | $ 23.31 | $ 46.82 | $ 36.19 |
Income from Investment Operations | | | | | |
Net investment income (loss) C | .18 | .09 | .12 | .15 | .09 |
Net realized and unrealized gain (loss) | (2.49) | 3.45 | 4.82 | (21.82) | 11.66 |
Total from investment operations | (2.31) | 3.54 | 4.94 | (21.67) | 11.75 |
Distributions from net investment income | (.14) | (.05) | (.02) | (.17) | (.14) |
Distributions from net realized gain | (.16) | (.04) | - | (1.67) | (.98) |
Total distributions | (.29) H | (.09) | (.02) | (1.84) | (1.12) |
Redemption fees added to paid in capital C,G | - | - | - | - | - |
Net asset value, end of period | $ 29.08 | $ 31.68 | $ 28.23 | $ 23.31 | $ 46.82 |
Total Return A,B | (7.37)% | 12.54% | 21.22% | (48.10)% | 33.38% |
Ratios to Average Net Assets D,F | | | | | |
Expenses before reductions | 2.05% | 2.09% | 2.14% | 2.17% | 2.11% |
Expenses net of fee waivers, if any | 2.04% | 2.09% | 2.14% | 2.17% | 2.11% |
Expenses net of all reductions | 2.00% | 2.05% | 2.09% | 2.13% | 2.08% |
Net investment income (loss) | .56% | .30% | .51% | .42% | .22% |
Supplemental Data | | | | | |
Net assets, end of period (in millions) | $ 33 | $ 44 | $ 43 | $ 36 | $ 28 |
Portfolio turnover rate E | 75% | 82% | 98% | 79% | 56% |
A Total returns would have been lower if certain expenses had not been reduced during the applicable periods shown.
B Total returns do not include the effect of the contingent deferred sales charge.
C Calculated based on average shares outstanding during the period.
D Fees and expenses of any underlying Fidelity Central Funds are not included in the Fund's expense ratio. The Fund indirectly bears its proportionate share of the expenses of any underlying Fidelity Central Funds.
E Amount does not include the portfolio activity of any underlying Fidelity Central Funds.
F Expense ratios reflect operating expenses of the class. Expenses before reductions do not reflect amounts reimbursed by the investment adviser or reductions from brokerage service arrangements or reductions from other expense offset arrangements and do not represent the amount paid by the class during periods when reimbursements or reductions occur. Expenses net of fee waivers reflect expenses after reimbursement by the investment adviser but prior to reductions from brokerage service arrangements or other expense offset arrangements. Expenses net of all reductions represent the net expenses paid by the class.
G Amount represents less than $.01 per share.
H Total distributions of $.29 per share is comprised of distributions from net investment income of $.137 and distributions from net realized gain of $.155 per share.
See accompanying notes which are an integral part of the financial statements.
Annual Report
Financial Highlights - International Discovery
Years ended October 31, | 2011 | 2010 | 2009 | 2008 | 2007 |
Selected Per-Share Data | | | | | |
Net asset value, beginning of period | $ 32.34 | $ 28.79 | $ 23.88 | $ 47.68 | $ 36.67 |
Income from Investment Operations | | | | | |
Net investment income (loss) B | .53 | .40 | .37 | .57 | .53 |
Net realized and unrealized gain (loss) | (2.54) | 3.54 | 4.88 | (22.29) | 11.84 |
Total from investment operations | (2.01) | 3.94 | 5.25 | (21.72) | 12.37 |
Distributions from net investment income | (.48) | (.35) | (.34) | (.41) | (.38) |
Distributions from net realized gain | (.16) | (.04) | - | (1.67) | (.98) |
Total distributions | (.64) | (.39) | (.34) | (2.08) | (1.36) |
Redemption fees added to paid in capital B,F | - | - | - | - | - |
Net asset value, end of period | $ 29.69 | $ 32.34 | $ 28.79 | $ 23.88 | $ 47.68 |
Total Return A | (6.39)% | 13.76% | 22.47% | (47.55)% | 34.85% |
Ratios to Average Net Assets C,E | | | | | |
Expenses before reductions | .97% | 1.05% | 1.12% | 1.09% | 1.04% |
Expenses net of fee waivers, if any | .96% | 1.05% | 1.12% | 1.09% | 1.04% |
Expenses net of all reductions | .92% | 1.00% | 1.07% | 1.05% | 1.00% |
Net investment income (loss) | 1.64% | 1.35% | 1.53% | 1.51% | 1.30% |
Supplemental Data | | | | | |
Net assets, end of period (in millions) | $ 6,806 | $ 8,133 | $ 8,114 | $ 6,999 | $ 14,176 |
Portfolio turnover rate D | 75% | 82% | 98% | 79% | 56% |
A Total returns would have been lower if certain expenses had not been reduced during the applicable periods shown.
B Calculated based on average shares outstanding during the period.
C Fees and expenses of any underlying Fidelity Central Funds are not included in the Fund's expense ratio. The Fund indirectly bears its proportionate share of the expenses of any underlying Fidelity Central Funds.
D Amount does not include the portfolio activity of any underlying Fidelity Central Funds.
E Expense ratios reflect operating expenses of the class. Expenses before reductions do not reflect amounts reimbursed by the investment adviser or reductions from brokerage service arrangements or reductions from other expense offset arrangements and do not represent the amount paid by the class during periods when reimbursements or reductions occur. Expenses net of fee waivers reflect expenses after reimbursement by the investment adviser but prior to reductions from brokerage service arrangements or other expense offset arrangements. Expenses net of all reductions represent the net expenses paid by the class.
F Amount represents less than $.01 per share.
See accompanying notes which are an integral part of the financial statements.
Annual Report
Financial Highlights - Class K
Years ended October 31, | 2011 | 2010 | 2009 | 2008 G |
Selected Per-Share Data | | | | |
Net asset value, beginning of period | $ 32.32 | $ 28.78 | $ 23.90 | $ 40.32 |
Income from Investment Operations | | | | |
Net investment income (loss) D | .58 | .46 | .44 | .10 |
Net realized and unrealized gain (loss) | (2.54) | 3.53 | 4.86 | (16.52) |
Total from investment operations | (1.96) | 3.99 | 5.30 | (16.42) |
Distributions from net investment income | (.55) | (.41) | (.42) | - |
Distributions from net realized gain | (.16) | (.04) | - | - |
Total distributions | (.70)J | (.45) | (.42) | - |
Redemption fees added to paid in capital D,I | - | - | - | - |
Net asset value, end of period | $ 29.66 | $ 32.32 | $ 28.78 | $ 23.90 |
Total Return B,C | (6.24)% | 13.96% | 22.80% | (40.72)% |
Ratios to Average Net Assets E,H | | | | |
Expenses before reductions | .80% | .84% | .88% | .93% A |
Expenses net of fee waivers, if any | .79% | .84% | .88% | .93% A |
Expenses net of all reductions | .75% | .79% | .83% | .89% A |
Net investment income (loss) | 1.81% | 1.55% | 1.77% | .83% A |
Supplemental Data | | | | |
Net assets, end of period (in millions) | $ 1,245 | $ 1,078 | $ 674 | $ 145 |
Portfolio turnover rate F | 75% | 82% | 98% | 79% |
A Annualized
B Total returns for periods of less than one year are not annualized.
C Total returns would have been lower if certain expenses had not been reduced during the applicable periods shown.
D Calculated based on average shares outstanding during the period.
E Fees and expenses of any underlying Fidelity Central Funds are not included in the Fund's expense ratio. The Fund indirectly bears its proportionate share of the expenses of any underlying Fidelity Central Funds.
F Amount does not include the portfolio activity of any underlying Fidelity Central Funds.
G For the period May 9, 2008 (commencement of sale of shares) to October 31, 2008.
H Expense ratios reflect operating expenses of the class. Expenses before reductions do not reflect amounts reimbursed by the investment adviser or reductions from brokerage service arrangements or reductions from other expense offset arrangements and do not represent the amount paid by the class during periods when reimbursements or reductions occur. Expense ratios before reductions for start-up periods may not be representative of longer-term operating periods. Expenses net of fee waivers reflect expenses after reimbursement by the investment adviser but prior to reductions from brokerage service arrangements or other expense offset arrangements. Expenses net of all reductions represent the net expenses paid by the class.
I Amount represents less than $.01 per share.
J Total distributions of $.70 per share is comprised of distributions from net investment income of $.548 and distributions from net realized gain of $.155 per share.
See accompanying notes which are an integral part of the financial statements.
Annual Report
Financial Highlights - Institutional Class
Years ended October 31, | 2011 | 2010 | 2009 | 2008 | 2007 |
Selected Per-Share Data | | | | | |
Net asset value, beginning of period | $ 32.31 | $ 28.77 | $ 23.91 | $ 47.73 | $ 36.71 |
Income from Investment Operations | | | | | |
Net investment income (loss) B | .54 | .41 | .39 | .53 | .55 |
Net realized and unrealized gain (loss) | (2.55) | 3.55 | 4.86 | (22.24) | 11.85 |
Total from investment operations | (2.01) | 3.96 | 5.25 | (21.71) | 12.40 |
Distributions from net investment income | (.50) | (.38) | (.39) | (.44) | (.40) |
Distributions from net realized gain | (.16) | (.04) | - | (1.67) | (.98) |
Total distributions | (.65) G | (.42) | (.39) | (2.11) | (1.38) |
Redemption fees added to paid in capital B,F | - | - | - | - | - |
Net asset value, end of period | $ 29.65 | $ 32.31 | $ 28.77 | $ 23.91 | $ 47.73 |
Total Return A | (6.39)% | 13.84% | 22.52% | (47.51)% | 34.93% |
Ratios to Average Net Assets C, E | | | | | |
Expenses before reductions | .95% | .99% | 1.05% | 1.05% | .97% |
Expenses net of fee waivers, if any | .94% | .99% | 1.05% | 1.05% | .97% |
Expenses net of all reductions | .90% | .95% | 1.00% | 1.01% | .94% |
Net investment income (loss) | 1.66% | 1.40% | 1.60% | 1.54% | 1.36% |
Supplemental Data | | | | | |
Net assets, end of period (in millions) | $ 278 | $ 319 | $ 267 | $ 159 | $ 58 |
Portfolio turnover rate D | 75% | 82% | 98% | 79% | 56% |
A Total returns would have been lower if certain expenses had not been reduced during the applicable periods shown.
B Calculated based on average shares outstanding during the period.
C Fees and expenses of any underlying Fidelity Central Funds are not included in the Fund's expense ratio. The Fund indirectly bears its proportionate share of the expenses of any underlying Fidelity Central Funds.
D Amount does not include the portfolio activity of any underlying Fidelity Central Funds.
E Expense ratios reflect operating expenses of the class. Expenses before reductions do not reflect amounts reimbursed by the investment adviser or reductions from brokerage service arrangements or reductions from other expense offset arrangements and do not represent the amount paid by the class during periods when reimbursements or reductions occur. Expenses net of fee waivers reflect expenses after reimbursement by the investment adviser but prior to reductions from brokerage service arrangements or other expense offset arrangements. Expenses net of all reductions represent the net expenses paid by the class.
F Amount represents less than $.01 per share.
G Total distributions of $.65 per share is comprised of distributions from net investment income of $.497 and distributions from net realized gain of $.155 per share.
See accompanying notes which are an integral part of the financial statements.
Annual Report
Notes to Financial Statements
For the period ended October 31, 2011
(Amounts in thousands except percentages)
1. Organization.
Fidelity International Discovery Fund (the Fund) is a fund of Fidelity Investment Trust (the Trust) and is authorized to issue an unlimited number of shares. The Trust is registered under the Investment Company Act of 1940, as amended (the 1940 Act), as an open-end management investment company organized as a Massachusetts business trust. The Fund offers Class A, Class T, Class C, International Discovery, Class K and Institutional Class shares, each of which, along with Class B shares, has equal rights as to assets and voting privileges. Effective after the close of business on September 1, 2010, Class B shares were closed to new accounts and additional purchases, except for exchanges and reinvestments by existing shareholders. Each class has exclusive voting rights with respect to matters that affect that class. Class B shares will automatically convert to Class A shares after a holding period of seven years from the initial date of purchase. Investment income, realized and unrealized capital gains and losses, the common expenses of the Fund, and certain fund-level expense reductions, if any, are allocated on a pro-rata basis to each class based on the relative net assets of each class to the total net assets of the Fund. Each class differs with respect to transfer agent and distribution and service plan fees incurred. Certain expense reductions may also differ by class. The Fund's investments in emerging markets can be subject to social, economic, regulatory and political uncertainties and can be extremely volatile.
2. Investments in Fidelity Central Funds.
The Fund invests in Fidelity Central Funds, which are open-end investment companies available only to other investment companies and accounts managed by Fidelity Management & Research Company (FMR) and its affiliates. The Fund's Schedule of Investments lists each of the Fidelity Central Funds held as of period end, if any, as an investment of the Fund, but does not include the underlying holdings of each Fidelity Central Fund. As an Investing Fund, the Fund indirectly bears its proportionate share of the expenses of the underlying Fidelity Central Funds.
The Money Market Central Funds seek preservation of capital and current income and are managed by Fidelity Investments Money Management, Inc. (FIMM), an affiliate of FMR.
A complete unaudited list of holdings for each Fidelity Central Fund is available upon request or at the Securities and Exchange Commission (the SEC) web site at www.sec.gov. In addition, the financial statements of the Fidelity Central Funds, which are not covered by the Fund's Report of Independent Registered Public Accounting Firm, are available on the SEC web site or upon request.
Annual Report
Notes to Financial Statements - continued
(Amounts in thousands except percentages)
3. Significant Accounting Policies.
The financial statements have been prepared in conformity with accounting principles generally accepted in the United States of America (GAAP), which require management to make certain estimates and assumptions at the date of the financial statements. Actual results could differ from those estimates. Subsequent events, if any, through the date that the financial statements were issued have been evaluated in the preparation of the financial statements. The following summarizes the significant accounting policies of the Fund:
Security Valuation. Investments are valued as of 4:00 p.m. Eastern time on the last calendar day of the period. The Fund uses independent pricing services approved by the Board of Trustees to value its investments. When current market prices or quotations are not readily available or reliable, valuations may be determined in good faith in accordance with procedures adopted by the Board of Trustees. Factors used in determining value may include market or security specific events. The frequency with which these procedures are used cannot be predicted and they may be utilized to a significant extent. The value used for net asset value (NAV) calculation under these procedures may differ from published prices for the same securities.
The Fund categorizes the inputs to valuation techniques used to value its investments into a disclosure hierarchy consisting of three levels as shown below:
Level 1 - quoted prices in active markets for identical investments
Level 2 - other significant observable inputs (including quoted prices for similar investments, interest rates, prepayment speeds, etc.)
Level 3 - unobservable inputs (including the Fund's own assumptions based on the best information available)
Changes in valuation techniques may result in transfers in or out of an assigned level within the disclosure hierarchy. The aggregate value of investments by input level, as of October 31, 2011, as well as a roll forward of Level 3 securities, is included at the end of the Fund's Schedule of Investments. Valuation techniques used to value the Fund's investments by major category are as follows:
Equity securities, including restricted securities, for which market quotations are readily available, are valued at the last reported sale price or official closing price as reported by an independent pricing service on the primary market or exchange on which they are traded and are categorized as Level 1 in the hierarchy. In the event there were no sales during the day or closing prices are not available, securities are valued at the last quoted bid price or may be valued using the last available price and are generally categorized as Level 2 in the hierarchy. For foreign equity securities, when significant market or security specific events arise, comparisons to the valuation of American Depositary Receipts
Annual Report
3. Significant Accounting Policies - continued
Security Valuation - continued
(ADRs), futures contracts, Exchange-traded funds (ETFs) and certain indexes as well as quoted prices for similar securities are used and are categorized as Level 2 in the hierarchy in these circumstances. Utilizing these techniques may result in transfers between Level 1 and Level 2. For restricted equity securities and private placements where observable inputs are limited, assumptions about market activity and risk are used and are categorized as Level 3 in the hierarchy.
Investments in open-end mutual funds, including the Fidelity Central Funds, are valued at their closing net asset value each business day and are categorized as Level 1 in the hierarchy.
Foreign Currency. The Fund may use foreign currency contracts to facilitate transactions in foreign-denominated securities. Gains and losses from these transactions may arise from changes in the value of the foreign currency or if the counterparties do not perform under the contracts' terms.
Foreign-denominated assets, including investment securities, and liabilities are translated into U.S. dollars at the exchange rate at period end. Purchases and sales of investment securities, income and dividends received and expenses denominated in foreign currencies are translated into U.S. dollars at the exchange rate in effect on the transaction date.
The effects of exchange rate fluctuations on investments are included with the net realized and unrealized gain (loss) on investment securities. Other foreign currency transactions resulting in realized and unrealized gain (loss) are disclosed separately.
Investment Transactions and Income. For financial reporting purposes, the Fund's investment holdings and NAV include trades executed through the end of the last business day of the period. The NAV per share for processing shareholder transactions is calculated as of the close of business of the New York Stock Exchange (NYSE), normally 4:00 p.m. Eastern time and includes trades executed through the end of the prior business day. Gains and losses on securities sold are determined on the basis of identified cost and may include proceeds received from litigation. Dividend income is recorded on the ex-dividend date, except for certain dividends from foreign securities where the ex-dividend date may have passed, which are recorded as soon as the Fund is informed of the ex-dividend date. Non-cash dividends included in dividend income, if any, are recorded at the fair market value of the securities received. Distributions received on securities that represent a return of capital or capital gain are recorded as a reduction of cost of investments and/or as a realized gain. The Fund estimates the components of distributions received that may be considered return of capital distributions or capital
Annual Report
Notes to Financial Statements - continued
(Amounts in thousands except percentages)
3. Significant Accounting Policies - continued
Investment Transactions and Income - continued
gain distributions. Interest income and distributions from the Fidelity Central Funds are accrued as earned. Interest income includes coupon interest and amortization of premium and accretion of discount on debt securities. Investment income is recorded net of foreign taxes withheld where recovery of such taxes is uncertain.
Expenses. Expenses directly attributable to a fund are charged to that fund. Expenses attributable to more than one fund are allocated among the respective funds on the basis of relative net assets or other appropriate methods. Expense estimates are accrued in the period to which they relate and adjustments are made when actual amounts are known.
Deferred Trustee Compensation. Under a Deferred Compensation Plan (the Plan), independent Trustees may elect to defer receipt of a portion of their annual compensation. Deferred amounts are invested in a cross-section of Fidelity funds, are marked-to-market and remain in the Fund until distributed in accordance with the Plan. The investment of deferred amounts and the offsetting payable to the Trustees are included in the accompanying Statement of Assets and Liabilities.
Income Tax Information and Distributions to Shareholders. Each year, the Fund intends to qualify as a regulated investment company, including distributing substantially all of its taxable income and realized gains under Subchapter M of the Internal Revenue Code and filing its U.S. federal tax return. As a result, no provision for income taxes is required. As of October 31, 2011, the Fund did not have any unrecognized tax benefits in the financial statements. A fund's federal tax return is subject to examination by the Internal Revenue Service (IRS) for a period of three years. Foreign taxes are provided for based on the Fund's understanding of the tax rules and rates that exist in the foreign markets in which it invests. The Fund is subject to a tax imposed on realized short term capital gains on securities of certain issuers domiciled in India. An estimated deferred tax liability for net unrealized gains on these securities is included in Other payables and accrued expenses on the Statement of Assets and Liabilities.
Distributions are declared and recorded on the ex-dividend date. Income dividends and capital gain distributions are declared separately for each class. Income and capital gain distributions are determined in accordance with income tax regulations, which may differ from GAAP.
Capital accounts within the financial statements are adjusted for permanent book-tax differences. These adjustments have no impact on net assets or the results of operations. Temporary book-tax differences will reverse in a subsequent period.
Annual Report
3. Significant Accounting Policies - continued
Income Tax Information and Distributions to Shareholders - continued
Book-tax differences are primarily due to foreign currency transactions, certain foreign taxes, passive foreign investment companies (PFIC), deferred trustees compensation, capital loss carryforwards and losses deferred due to wash sales.
The federal tax cost of investment securities and unrealized appreciation (depreciation) as of period end were as follows:
Gross unrealized appreciation | $ 930,158 |
Gross unrealized depreciation | (996,674) |
Net unrealized appreciation (depreciation) on securities and other investments | $ (66,516) |
| |
Tax Cost | $ 8,916,909 |
The tax-based components of distributable earnings as of period end were as follows:
Undistributed ordinary income | $ 102,538 |
Capital loss carryforward | $ (1,349,541) |
Net unrealized appreciation (depreciation) | $ (66,186) |
Under the recently enacted Regulated Investment Company Modernization Act of 2010 (the Act), the Fund will be permitted to carry forward capital losses incurred in taxable years beginning after December 22, 2010 for an unlimited period. However, any losses incurred during those future taxable years will be required to be utilized prior to any losses incurred in pre-enactment taxable years, which generally expire after eight years from when they are incurred. Additionally, post-enactment capital losses that are carried forward will retain their character as either short-term or long-term capital losses rather than being considered all short-term as under previous law. The Fund's first fiscal year end subject to the Act will be October 31, 2012.
The tax character of distributions paid was as follows:
| October 31, 2011 | October 31, 2010 |
Ordinary Income | $ 198,026 | $ 129,796 |
Annual Report
Notes to Financial Statements - continued
(Amounts in thousands except percentages)
3. Significant Accounting Policies - continued
Short-Term Trading (Redemption) Fees. Shares held by investors in the Fund less than 30 days are subject to a redemption fee equal to 1.00% of the net asset value of shares redeemed. All redemption fees, which reduce the proceeds of the shareholder redemption, are retained by the Fund and accounted for as an addition to paid in capital.
New Accounting Pronouncement. In May 2011, the Financial Accounting Standards Board issued Accounting Standard Update No. 2011-04, Fair Value Measurement (Topic 820) - Amendments to Achieve Common Fair Value Measurement and Disclosure Requirements in U.S. GAAP and IFRSs. The update changes the wording used to describe the requirements in GAAP for measuring fair value and for disclosing information about fair value measurements. The update is effective during interim and annual periods beginning after December 15, 2011. Management is currently evaluating the impact of the update's adoption on the Fund's financial statement disclosures.
4. Purchases and Sales of Investments.
Purchases and sales of securities, other than short-term securities, aggregated $7,388,928 and $7,826,467, respectively.
5. Fees and Other Transactions with Affiliates.
Management Fee. FMR and its affiliates provide the Fund with investment management related services for which the Fund pays a monthly management fee. The management fee is the sum of an individual fund fee rate that is based on an annual rate of .45% of the Fund's average net assets and a group fee rate that averaged .26% during the period. The group fee rate is based upon the average net assets of all the mutual funds advised by FMR. The group fee rate decreases as assets under management increase and increases as assets under management decrease. In addition, the management fee is subject to a performance adjustment (up to a maximum of ± .20% of the Fund's average net assets over a 36 month performance period). The upward or downward adjustment to the management fee is based on the relative investment performance of International Discovery as compared to an appropriate benchmark index. For the period, the total annual management fee rate, including the performance adjustment, was .70% of the Fund's average net assets.
Distribution and Service Plan Fees. In accordance with Rule 12b-1 of the 1940 Act, the Fund has adopted separate Distribution and Service Plans for each class of shares. Certain classes pay Fidelity Distributors Corporation (FDC), an affiliate of FMR, separate Distribution and Service Fees, each of which is based on an annual percentage of each class' average net assets. In addition, FDC may pay financial intermediaries for selling shares of the Fund and providing shareholder support services. For the period, the Distribution and Service Fee rates, total fees and amounts retained by FDC were as follows:
Annual Report
5. Fees and Other Transactions with Affiliates - continued
Distribution and Service Plan Fees - continued
| Distribution
Fee | Service
Fee | Total Fees | Retained
by FDC |
Class A | -% | .25% | $ 937 | $ 19 |
Class T | .25% | .25% | 398 | 1 |
Class B | .75% | .25% | 130 | 98 |
Class C | .75% | .25% | 399 | 30 |
| | | $ 1,864 | $ 148 |
Sales Load. FDC may receive a front-end sales charge of up to 5.75% for selling Class A shares, and 3.50% for selling Class T shares, some of which is paid to financial intermediaries for selling shares of the Fund. Depending on the holding period, FDC may receive contingent deferred sales charges levied on Class A, Class T, Class B, and Class C redemptions. The deferred sales charges range from 5% to 1% for Class B, 1% for Class C, 1.00% for certain purchases of Class A shares and .25% for certain purchases of Class T shares.
For the period, sales charge amounts retained by FDC were as follows:
| Retained
by FDC |
Class A | $ 56 |
Class T | 11 |
Class B* | 21 |
Class C* | 3 |
| $ 91 |
* When Class B and Class C shares are initially sold, FDC pays commissions from its own resources to financial intermediaries through which the sales are made.
Transfer Agent Fees. Fidelity Investments Institutional Operations Company, Inc. (FIIOC), an affiliate of FMR, is the transfer, dividend disbursing and shareholder servicing agent for each class of the Fund. FIIOC receives account fees and asset-based fees that vary according to the account size and type of account of the shareholders of the respective classes of the Fund, except for Class K. FIIOC receives an asset-based fee of Class K's average net assets. FIIOC pays for typesetting, printing and mailing of shareholder reports, except proxy statements. For the period, transfer agent fees for each class were as follows:
Annual Report
Notes to Financial Statements - continued
(Amounts in thousands except percentages)
5. Fees and Other Transactions with Affiliates - continued
Transfer Agent Fees - continued
| Amount | % of
Average
Net Assets |
Class A | $ 1,138 | .30 |
Class T | 248 | .31 |
Class B | 41 | .31 |
Class C | 121 | .30 |
International Discovery | 17,436 | .22 |
Class K | 638 | .05 |
Institutional Class | 640 | .20 |
| $ 20,262 | |
Accounting and Security Lending Fees. Fidelity Service Company, Inc. (FSC), an affiliate of FMR, maintains the Fund's accounting records. The accounting fee is based on the level of average net assets for the month. Under a separate contract, FSC administers the security lending program. The security lending fee is based on the number and duration of lending transactions.
Brokerage Commissions. The Fund placed a portion of its portfolio transactions with brokerage firms which are affiliates of the investment adviser. The commissions paid to these affiliated firms were $9 for the period.
Interfund Lending Program. Pursuant to an Exemptive Order issued by the SEC, the Fund, along with other registered investment companies having management contracts with FMR, may participate in an interfund lending program. This program provides an alternative credit facility allowing the funds to borrow from, or lend money to, other participating affiliated funds. At period end, there were no interfund loans outstanding. The Fund's activity in this program during the period for which loans were outstanding was as follows:
Borrower or Lender | Average Daily
Loan Balance | Weighted Average Interest Rate | Interest Expense |
Borrower | $ 13,706 | .41% | $ 2 |
Annual Report
6. Committed Line of Credit.
The Fund participates with other funds managed by FMR or an affiliate in a $4.0 billion credit facility (the "line of credit") to be utilized for temporary or emergency purposes to fund shareholder redemptions or for other short-term liquidity purposes. The Fund has agreed to pay commitment fees on its pro-rata portion of the line of credit, which amounted to $31 and is reflected in Miscellaneous expenses on the Statement of Operations. During the period, there were no borrowings on this line of credit.
7. Security Lending.
The Fund lends portfolio securities through a lending agent from time to time in order to earn additional income. For equity securities, a lending agent is used and may loan securities to certain qualified borrowers, including Fidelity Capital Markets (FCM), a broker-dealer affiliated with the Fund. On the settlement date of the loan, the Fund receives collateral (in the form of U.S. Treasury obligations, letters of credit and/or cash) against the loaned securities and maintains collateral in an amount not less than 100% of the market value of the loaned securities during the period of the loan. The market value of the loaned securities is determined at the close of business of the Fund and any additional required collateral is delivered to the Fund on the next business day. If the borrower defaults on its obligation to return the securities loaned because of insolvency or other reasons, a fund could experience delays and costs in recovering the securities loaned or in gaining access to the collateral. Any cash collateral received is the Fidelity Securities Lending Cash Central Fund. The value of loaned securities and cash collateral at period end are disclosed on the Fund's Statement of Assets and Liabilities. The value of securities loaned to FCM at period end was $2,654. Security lending income represents the income earned on investing cash collateral, less rebates paid to borrowers and any lending agent fees associated with the loan, plus any premium payments received for lending certain types of securities. Security lending income is presented in the Statement of Operations as a component of income from Fidelity Central Funds. Total security lending income during the period amounted to $6,208, including $213 from securities loaned to FCM.
8. Expense Reductions.
FMR voluntarily agreed to reimburse a portion of its management fee. For the period, the amount of this reimbursement was $507.
Many of the brokers with whom FMR places trades on behalf of the Fund provided services to the Fund in addition to trade execution. These services included payments of certain expenses on behalf of the Fund totaling $3,884 for the period.
Annual Report
Notes to Financial Statements - continued
(Amounts in thousands except percentages)
9. Distributions to Shareholders.
Distributions to shareholders of each class were as follows:
Years ended October 31, | 2011 | 2010 |
From net investment income | | |
Class A | $ 4,617 | $ 3,889 |
Class T | 859 | 633 |
Class B | 51 | 37 |
Class C | 184 | 71 |
International Discovery | 121,061 | 98,508 |
Class K | 18,291 | 9,602 |
Institutional Class | 4,873 | 3,682 |
Total | $ 149,936 | $ 116,422 |
From net realized gain | | |
Class A | $ 1,880 | $ 555 |
Class T | 439 | 119 |
Class B | 69 | 23 |
Class C | 209 | 61 |
International Discovery | 38,831 | 11,290 |
Class K | 5,143 | 935 |
Institutional Class | 1,519 | 391 |
Total | $ 48,090 | $ 13,374 |
10. Share Transactions.
Transactions for each class of shares were as follows:
| Shares | Dollars |
Years ended October 31, | 2011 | 2010 | 2011 | 2010 |
Class A | | | | |
Shares sold | 2,821 | 4,849 | $ 91,649 | $ 142,203 |
Reinvestment of distributions | 173 | 120 | 5,606 | 3,654 |
Shares redeemed | (4,335) | (7,259) | (139,721) | (215,574) |
Net increase (decrease) | (1,341) | (2,290) | $ (42,466) | $ (69,717) |
Class T | | | | |
Shares sold | 443 | 1,165 | $ 14,328 | $ 34,154 |
Reinvestment of distributions | 38 | 24 | 1,235 | 716 |
Shares redeemed | (1,286) | (1,228) | (41,028) | (35,631) |
Net increase (decrease) | (805) | (39) | $ (25,465) | $ (761) |
Class B | | | | |
Shares sold | 21 | 105 | $ 671 | $ 3,047 |
Reinvestment of distributions | 3 | 2 | 111 | 54 |
Shares redeemed | (130) | (227) | (4,124) | (6,544) |
Net increase (decrease) | (106) | (120) | $ (3,342) | $ (3,443) |
Annual Report
10. Share Transactions - continued
| Shares | Dollars |
Years ended October 31, | 2011 | 2010 | 2011 | 2010 |
Class C | | | | |
Shares sold | 183 | 356 | $ 5,847 | $ 10,567 |
Reinvestment of distributions | 11 | 4 | 344 | 116 |
Shares redeemed | (437) | (515) | (13,875) | (14,926) |
Net increase (decrease) | (243) | (155) | $ (7,684) | $ (4,243) |
International Discovery | | | | |
Shares sold | 32,543 | 55,460 | $ 1,052,266 | $ 1,640,231 |
Reinvestment of distributions | 4,718 | 3,453 | 153,551 | 105,461 |
Shares redeemed | (59,489) | (89,239) | (1,934,353) | (2,636,183) |
Net increase (decrease) | (22,228) | (30,326) | $ (728,536) | $ (890,491) |
Class K | | | | |
Shares sold | 18,148 | 16,961 | $ 593,408 | $ 491,304 |
Reinvestment of distributions | 722 | 346 | 23,434 | 10,537 |
Shares redeemed | (10,275) | (7,377) | (330,258) | (215,813) |
Net increase (decrease) | 8,595 | 9,930 | $ 286,584 | $ 286,028 |
Institutional Class | | | | |
Shares sold | 2,364 | 4,322 | $ 75,348 | $ 127,580 |
Reinvestment of distributions | 69 | 36 | 2,254 | 1,083 |
Shares redeemed | (2,923) | (3,773) | (94,034) | (108,068) |
Net increase (decrease) | (490) | 585 | $ (16,432) | $ 20,595 |
11. Other.
The Fund's organizational documents provide former and current trustees and officers with a limited indemnification against liabilities arising in connection with the performance of their duties to the Fund. In the normal course of business, the Fund may also enter into contracts that provide general indemnifications. The Fund's maximum exposure under these arrangements is unknown as this would be dependent on future claims that may be made against the Fund. The risk of material loss from such claims is considered remote.
Annual Report
To the Trustees of Fidelity Investment Trust and the Shareholders of Fidelity International Discovery Fund:
In our opinion, the accompanying statement of assets and liabilities, including the schedule of investments, and the related statements of operations and of changes in net assets and the financial highlights present fairly, in all material respects, the financial position of Fidelity International Discovery Fund (a fund of Fidelity Investment Trust) at October 31, 2011, the results of its operations for the year then ended, the changes in its net assets for each of the two years in the period then ended and the financial highlights for each of the periods indicated, in conformity with accounting principles generally accepted in the United States of America. These financial statements and financial highlights (hereafter referred to as "financial statements") are the responsibility of the Fidelity International Discovery Fund's management. Our responsibility is to express an opinion on these financial statements based on our audits. We conducted our audits of these financial statements in accordance with the standards of the Public Company Accounting Oversight Board (United States). Those standards require that we plan and perform the audit to obtain reasonable assurance about whether the financial statements are free of material misstatement. An audit includes examining, on a test basis, evidence supporting the amounts and disclosures in the financial statements, assessing the accounting principles used and significant estimates made by management, and evaluating the overall financial statement presentation. We believe that our audits, which included confirmation of securities at October 31, 2011 by correspondence with the custodian and brokers, provide a reasonable basis for our opinion.
PricewaterhouseCoopers LLP
Boston, Massachusetts
December 13, 2011
Annual Report
The Trustees, Members of the Advisory Board, and executive officers of the trust and fund, as applicable, are listed below. The Board of Trustees governs the fund and is responsible for protecting the interests of shareholders. The Trustees are experienced executives who meet periodically throughout the year to oversee the fund's activities, review contractual arrangements with companies that provide services to the fund, oversee management of the risks associated with such activities and contractual arrangements, and review the fund's performance. Except for James C. Curvey, each of the Trustees oversees 226 funds advised by FMR or an affiliate. Mr. Curvey oversees 429 funds advised by FMR or an affiliate.
The Trustees hold office without limit in time except that (a) any Trustee may resign; (b) any Trustee may be removed by written instrument, signed by at least two-thirds of the number of Trustees prior to such removal; (c) any Trustee who requests to be retired or who has become incapacitated by illness or injury may be retired by written instrument signed by a majority of the other Trustees; and (d) any Trustee may be removed at any special meeting of shareholders by a two-thirds vote of the outstanding voting securities of the trust. Each Trustee who is not an interested person (as defined in the 1940 Act) (Independent Trustee), shall retire not later than the last day of the calendar year in which his or her 75th birthday occurs. The Independent Trustees may waive this mandatory retirement age policy with respect to individual Trustees. The executive officers and Advisory Board Members hold office without limit in time, except that any officer and Advisory Board Member may resign or may be removed by a vote of a majority of the Trustees at any regular meeting or any special meeting of the Trustees. Except as indicated, each individual has held the office shown or other offices in the same company for the past five years.
Experience, Skills, Attributes, and Qualifications of the Fund's Trustees. The Governance and Nominating Committee has adopted a statement of policy that describes the experience, qualifications, attributes, and skills that are necessary and desirable for potential Independent Trustee candidates (Statement of Policy). The Board believes that each Trustee satisfied at the time he or she was initially elected or appointed a Trustee, and continues to satisfy, the standards contemplated by the Statement of Policy. The Governance and Nominating Committee also engages professional search firms to help identify potential Independent Trustee candidates who have the experience, qualifications, attributes, and skills consistent with the Statement of Policy. From time to time, additional criteria based on the composition and skills of the current Independent Trustees, as well as experience or skills that may be appropriate in light of future changes to board composition, business conditions, and regulatory or other developments, have also been considered by the professional search firms and the Governance and Nominating Committee. In addition, the Board takes into account the Trustees' commitment and participation in Board and committee meetings, as well as their leadership of standing and ad hoc committees throughout their tenure.
In determining that a particular Trustee was and continues to be qualified to serve as a Trustee, the Board has considered a variety of criteria, none of which, in isolation, was controlling. The Board believes that, collectively, the Trustees have balanced and diverse experience, qualifications, attributes, and skills, which allow the Board to operate effectively in governing the fund and protecting the interests of shareholders. Information about the specific experience, skills, attributes, and qualifications of each Trustee, which in each case led to the Board's conclusion that the Trustee should serve (or continue to serve) as a trustee of the fund, is provided below.
Annual Report
Board Structure and Oversight Function. James C. Curvey is an interested person (as defined in the 1940 Act) and currently serves as Acting Chairman. The Trustees have determined that an interested Chairman is appropriate and benefits shareholders because an interested Chairman has a personal and professional stake in the quality and continuity of services provided to the fund. Independent Trustees exercise their informed business judgment to appoint an individual of their choosing to serve as Chairman, regardless of whether the Trustee happens to be independent or a member of management. The Independent Trustees have determined that they can act independently and effectively without having an Independent Trustee serve as Chairman and that a key structural component for assuring that they are in a position to do so is for the Independent Trustees to constitute a substantial majority for the Board. The Independent Trustees also regularly meet in executive session. Ned C. Lautenbach serves as Chairman of the Independent Trustees and as such (i) acts as a liaison between the Independent Trustees and management with respect to matters important to the Independent Trustees and (ii) with management prepares agendas for Board meetings.
Fidelity funds are overseen by different Boards of Trustees. The fund's Board oversees Fidelity's equity and high income funds and another Board oversees Fidelity's investment-grade bond, money market, and asset allocation funds. The asset allocation funds may invest in Fidelity funds overseen by the fund's Board. The use of separate Boards, each with its own committee structure, allows the Trustees of each group of Fidelity funds to focus on the unique issues of the funds they oversee, including common research, investment, and operational issues. On occasion, the separate Boards establish joint committees to address issues of overlapping consequences for the Fidelity funds overseen by each Board.
The Trustees operate using a system of committees to facilitate the timely and efficient consideration of all matters of importance to the Trustees, the fund, and fund shareholders and to facilitate compliance with legal and regulatory requirements and oversight of the fund's activities and associated risks. The Board, acting through its committees, has charged FMR and its affiliates with (i) identifying events or circumstances the occurrence of which could have demonstrably adverse effects on the fund's business and/or reputation; (ii) implementing processes and controls to lessen the possibility that such events or circumstances occur or to mitigate the effects of such events or circumstances if they do occur; and (iii) creating and maintaining a system designed to evaluate continuously business and market conditions in order to facilitate the identification and implementation processes described in (i) and (ii) above. Because the day-to-day operations and activities of the fund are carried out by or through FMR, its affiliates and other service providers, the fund's exposure to risks is mitigated but not eliminated by the processes overseen by the Trustees. While each of the Board's committees has responsibility for overseeing different aspects of the fund's activities, oversight is exercised primarily through the Operations, Audit, and Compliance Committees. In addition, the Independent Trustees have worked with FMR to enhance the Board's oversight of investment and financial risks, legal and regulatory risks, technology risks, and operational risks, including the development of additional risk reporting to the Board. For example, a working group comprised of Independent Trustees and FMR has worked and continues to work to review the Fidelity funds' valuation-related activities, reporting and risk management. Appropriate personnel, including but not limited to the fund's Chief Compliance Officer (CCO), FMR's internal auditor, the independent accountants, the fund's Treasurer and portfolio management personnel, make periodic reports to the Board's committees, as appropriate, including an annual review of FMR's risk management program for the Fidelity funds. The responsibilities of each standing committee, including their oversight responsibilities, are described further under "Standing Committees of the Fund's Trustees."
Annual Report
Trustees and Officers - continued
The fund's Statement of Additional Information (SAI) includes more information about the Trustees. To request a free copy, call Fidelity at 1-800-835-5092.
Interested Trustees*:
Correspondence intended for each Trustee who is an interested person may be sent to Fidelity Investments, 82 Devonshire Street, Boston, Massachusetts 02109.
Name, Age; Principal Occupations and Other Relevant Experience+ |
James C. Curvey (76) |
| Year of Election or Appointment: 2007 Mr. Curvey is Trustee and Acting Chairman of the Board of Trustees of certain Trusts. Mr. Curvey also serves as Trustee (2007-present) of other investment companies advised by FMR. Mr. Curvey is a Director of Fidelity Investments Money Management, Inc. (2009-present), Director of Fidelity Research & Analysis Co. (2009-present) and Director of FMR and FMR Co., Inc. (2007-present). Mr. Curvey is also Vice Chairman (2007-present) and Director of FMR LLC. In addition, Mr. Curvey serves as an Overseer for the Boston Symphony Orchestra and a member of the Trustees of Villanova University. Previously, Mr. Curvey was the Vice Chairman (2006-2007) and Director (2000-2007) of FMR Corp. |
Ronald P. O'Hanley (54) |
| Year of Election or Appointment: 2011 Mr. O'Hanley is Director of FMR Co., Inc. (2010-present), Director of Fidelity Investments Money Management, Inc. (2010-present), Director of Fidelity Research & Analysis Company (2010-present), President of Fidelity Asset Management and Corporate Services and a member of Fidelity's Executive Committee (2010-present). Previously, Mr. O'Hanley served as President and Chief Executive Officer of BNY Mellon Asset Management (2007-2010). Mr. O'Hanley also served as Vice Chairman of Bank New York Mellon Corp. and a member of that firm's Executive Committee. Prior to the 2007 merger of The Bank of New York and Mellon Financial Corporation, he was Vice Chairman of Mellon Financial Corporation and President and Chief Executive Officer of Mellon Asset Management. He joined Mellon in February 1997. Mr. O'Hanley currently serves as Chairman of the Boston Public Library Foundation Board of Directors and sits on the Board of Directors of Beth Israel Deaconess Medical Center, the Board of Trustees of the Marine Biological Laboratory and the Advisory Board of the Maxwell School of Citizenship and Public Administration at Syracuse University. Mr. O'Hanley also chairs the Council on Asset Management for the Financial Services Roundtable and is a member of the Board of Directors of Institutional Investor's U.S. Institute. |
* Trustees have been determined to be "Interested Trustees" by virtue of, among other things, their affiliation with the trust or various entities under common control with FMR.
+ The information above includes each Trustee's principal occupation during the last five years and other information relating to the experience, attributes, and skills relevant to each Trustee's qualifications to serve as a Trustee, which led to the conclusion that each Trustee should serve as a Trustee for the fund.
Annual Report
Trustees and Officers - continued
Independent Trustees:
Correspondence intended for each Independent Trustee (that is, the Trustees other than the Interested Trustees) may be sent to Fidelity Investments, P.O. Box 55235, Boston, Massachusetts 02205-5235.
Name, Age; Principal Occupations and Other Relevant Experience+ |
Dennis J. Dirks (63) |
| Year of Election or Appointment: 2005 Prior to his retirement in May 2003, Mr. Dirks was Chief Operating Officer and a member of the Board of The Depository Trust & Clearing Corporation (DTCC). He also served as President, Chief Operating Officer, and Board member of The Depository Trust Company (DTC) and President and Board member of the National Securities Clearing Corporation (NSCC). In addition, Mr. Dirks served as Chief Executive Officer and Board member of the Government Securities Clearing Corporation, Chief Executive Officer and Board member of the Mortgage-Backed Securities Clearing Corporation, as a Trustee and a member of the Finance Committee of Manhattan College (2005-2008), and as a Trustee and a member of the Finance Committee of AHRC of Nassau County (2006-2008). Mr. Dirks is a member of the Independent Directors Council (IDC) Governing Council (2010-Present) and Board of Directors for The Brookville Center for Children's Services, Inc. (2009-present). |
Alan J. Lacy (58) |
| Year of Election or Appointment: 2008 Mr. Lacy serves as Senior Adviser (2007-present) of Oak Hill Capital Partners, L.P. (private equity). Mr. Lacy also served as Chief Executive Officer (2000-2005) and Vice Chairman (2005-2006) of Sears Holdings Corporation and Sears, Roebuck and Co. (retail). In addition, Mr. Lacy serves as a member of the Board of Directors of Dave & Buster's, Inc. (restaurant and entertainment complexes, 2010-present), The Hillman Companies, Inc. (hardware wholesalers, 2010-present), and Bristol-Myers Squibb Company (global pharmaceuticals, 2007-present). Mr. Lacy is a member of the Board of Trustees of The National Parks Conservation Association (2006-Present). Previously, Mr. Lacy served as Chairman of the Board of Trustees of the National Parks Conservation Association (2008-2011) and as a member of the Board of Directors for the Western Union Company (global money transfer, 2006-2011). |
Ned C. Lautenbach (67) |
| Year of Election or Appointment: 2000 Mr. Lautenbach is Chairman of the Independent Trustees of the Equity and High Income Funds (2006-present). Mr. Lautenbach currently serves as the Lead Director of the Eaton Corporation Board of Directors (diversified industrial, 1997-present). Mr. Lautenbach is also a member of the Board of Directors of the Philharmonic Center for the Arts in Naples, Florida (1999-present); a member of the Board of Trustees of Fairfield University (2005-present); and a member of the Council on Foreign Relations (1994-present). Previously, Mr. Lautenbach was a Partner/Advisory Partner at Clayton, Dubilier & Rice, LLC (private equity investment, 1998-2010), as well as a Director of Sony Corporation (2006-2007). |
Joseph Mauriello (67) |
| Year of Election or Appointment: 2008 Prior to his retirement in January 2006, Mr. Mauriello served in numerous senior management positions including Deputy Chairman and Chief Operating Officer (2004-2005), and Vice Chairman of Financial Services (2002-2004) of KPMG LLP US (professional services, 1965-2005). Mr. Mauriello currently serves as a member of the Board of Directors of XL Group plc. (global insurance and re-insurance, 2006-present) and of Arcadia Resources Inc. (health care services and products, 2007-present). Previously, Mr. Mauriello served as a Director of the Hamilton Funds of the Bank of New York (2006-2007). |
Robert W. Selander (61) |
| Year of Election or Appointment: 2011 Previously, Mr. Selander served as a Member of the Advisory Board of Fidelity's Equity and High Income Funds (2011), Executive Vice Chairman (2010), Chief Executive Officer (2009-2010), and President and Chief Executive Officer (1997-2009) of Mastercard, Inc. |
Cornelia M. Small (67) |
| Year of Election or Appointment: 2005 Ms. Small is a member of the Board of Directors of the Teagle Foundation (2009-present). Ms. Small is also a member of the Investment Committee, and Chair (2008-present) and a member of the Board of Trustees of Smith College. In addition, Ms. Small serves on the Investment Committee of the Berkshire Taconic Community Foundation (2008-present). Previously, Ms. Small served as Chairperson of the Investment Committee (2002-2008) of Smith College. In addition, Ms. Small served as Chief Investment Officer, Director of Global Equity Investments, and a member of the Board of Directors of Scudder, Stevens & Clark and Scudder Kemper Investments. |
William S. Stavropoulos (72) |
| Year of Election or Appointment: 2001 Mr. Stavropoulos is Vice Chairman of the Independent Trustees of the Equity and High Income Funds (2006-present). Mr. Stavropoulos serves as President and Founder of the Michigan Baseball Foundation, the Great Lakes Loons (2007-present). Mr. Stavropoulos is Chairman Emeritus of the Board of Directors of The Dow Chemical Company, where he previously served in numerous senior management positions, including President, CEO (1995-2000; 2002-2004), Chairman of the Executive Committee (2000-2006), and as a member of the Board of Directors (1990-2006). Currently, Mr. Stavropoulos is Chairman of Univar (global distributor of commodity and specialty chemicals, 2010-present), a Director of Teradata Corporation (data warehousing and technology solutions, 2008-present), Chemical Financial Corporation, Maersk Inc. (industrial conglomerate), Tyco International, Inc. (multinational manufacturing and services, 2007-present), and a member of the Advisory Board for Metalmark Capital (private equity investment, 2005-present). Mr. Stavropoulos is a special advisor to Clayton, Dubilier & Rice, LLC (private equity investment). In addition, Mr. Stavropoulos is a member of the University of Notre Dame Advisory Council for the College of Science. |
David M. Thomas (62) |
| Year of Election or Appointment: 2008 Previously, Mr. Thomas served as Executive Chairman (2005-2006) and Chairman and Chief Executive Officer (2000-2005) of IMS Health, Inc. (pharmaceutical and healthcare information solutions). In addition, Mr. Thomas serves as a member of the Board of Directors of Fortune Brands, Inc. (consumer products), and Interpublic Group of Companies, Inc. (marketing communication, 2004-present). |
Michael E. Wiley (61) |
| Year of Election or Appointment: 2008 Mr. Wiley also serves as a Director of Asia Pacific Exploration Consolidated (international oil and gas exploration and production, 2008-present). Mr. Wiley serves as a Director of Tesoro Corporation (independent oil refiner and marketer, 2005-present), and a Director of Bill Barrett Corporation (exploration and production, 2005-present). In addition, Mr. Wiley also serves as a Director of Post Oak Bank (privately-held bank, 2004-present). Previously, Mr. Wiley served as a member of the Board of Trustees of the University of Tulsa (2000-2006; 2007-2010), as a Senior Energy Advisor of Katzenbach Partners, LLC (consulting, 2006-2007), as an Advisory Director of Riverstone Holdings (private investment), Chairman, President, and CEO of Baker Hughes, Inc. (oilfield services, 2000-2004), and as Director of Spinnaker Exploration Company (exploration and production, 2001-2005). |
Annual Report
+ The information above includes each Trustee's principal occupation during the last five years and other information relating to the experience, attributes, and skills relevant to each Trustee's qualifications to serve as a Trustee, which led to the conclusion that each Trustee should serve as a Trustee for the fund.
Advisory Board Members and Executive Officers:
Correspondence intended for each executive officer, Edward C. Johnson 3d, and Peter S. Lynch may be sent to Fidelity Investments, 82 Devonshire Street, Boston, Massachusetts 02109.
Name, Age; Principal Occupation |
Edward C. Johnson 3d (81) |
| Year of Election or Appointment: 2011 Member of the Advisory Board of Fidelity's Equity and High Income Funds. Mr. Johnson serves as Chief Executive Officer, Chairman, and a Director of FMR LLC, and also serves as Chairman and Director of FIL Limited. Previously, Mr. Johnson served as a Trustee and Chairman of the Board of certain Fidelity Trusts, Chairman and a Director of FMR, Chairman and a Director of FMR Co., Inc., and President of FMR LLC (2006-2007). |
Peter S. Lynch (67) |
| Year of Election or Appointment: 2003 Member of the Advisory Board of Fidelity's Equity and High Income Funds. Mr. Lynch is Vice Chairman and a Director of FMR and FMR Co., Inc. In addition, Mr. Lynch serves as a Trustee of Boston College and as the Chairman of the Inner-City Scholarship Fund. Previously, Mr. Lynch served on the Special Olympics International Board of Directors (1997-2006). |
Kenneth B. Robins (42) |
| Year of Election or Appointment: 2008 President and Treasurer of Fidelity's Equity and High Income Funds. Mr. Robins also serves as President and Treasurer (2010-present) and Assistant Treasurer (2009-present) of other Fidelity funds and is an employee of Fidelity Investments (2004-present). Previously, Mr. Robins served as Deputy Treasurer of the Fidelity funds (2005-2008) and Treasurer and Chief Financial Officer of The North Carolina Capital Management Trust: Cash and Term Portfolios (2006-2008). |
Bruce T. Herring (46) |
| Year of Election or Appointment: 2006 Vice President of certain Equity Funds. Mr. Herring also serves as Chief Investment Officer and Director of Fidelity Management & Research (U.K.) Inc. (2010-present) and Group Chief Investments Officer of FMR. Previously, Mr. Herring served as Vice President (2005-2006) and Senior Vice President (2006-2007) of Fidelity Management & Research Company, Vice President of FMR Co., Inc. (2001-2007) and as a portfolio manager for Fidelity U.S. Equity Funds. |
Brian B. Hogan (47) |
| Year of Election or Appointment: 2009 Vice President of Equity and High Income Funds. Mr. Hogan also serves as President of FMR's Equity Division (2009-present). Previously, Mr. Hogan served as Senior Vice President, Equity Research of FMR (2006-2009) and as a portfolio manager. |
Scott C. Goebel (43) |
| Year of Election or Appointment: 2008 Secretary and Chief Legal Officer (CLO) of the Fidelity funds. Mr. Goebel also serves as Secretary of Fidelity Investments Money Management, Inc. (FIMM) (2010-present) and Fidelity Research and Analysis Company (FRAC) (2010-present); Secretary and CLO of The North Carolina Capital Management Trust: Cash and Term Portfolios (2008-present); General Counsel, Secretary, and Senior Vice President of FMR (2008-present) and FMR Co., Inc. (2008-present); employed by FMR LLC or an affiliate (2001-present); Chief Legal Officer of Fidelity Management & Research (Hong Kong) Limited (2008-present) and Assistant Secretary of Fidelity Management & Research (Japan) Inc. (2008-present), and Fidelity Management & Research (U.K.) Inc. (2008-present). Previously, Mr. Goebel served as Assistant Secretary of FIMM (2008-2010), FRAC (2008-2010), and the Funds (2007-2008) and as Vice President and Secretary of Fidelity Distributors Corporation (FDC) (2005-2007). |
William C. Coffey (42) |
| Year of Election or Appointment: 2009 Assistant Secretary of Fidelity's Equity and High Income Funds. Mr. Coffey also serves as Senior Vice President and Deputy General Counsel of FMR LLC (2010-present), and is an employee of Fidelity Investments. Previously, Mr. Coffey served as Vice President and Associate General Counsel of FMR LLC (2005-2009). |
Holly C. Laurent (57) |
| Year of Election or Appointment: 2008 Anti-Money Laundering (AML) Officer of the Fidelity funds. Ms. Laurent also serves as AML Officer of The North Carolina Capital Management Trust: Cash and Term Portfolios (2008-present) and is an employee of Fidelity Investments. Previously, Ms. Laurent was Senior Vice President and Head of Legal for Fidelity Business Services India Pvt. Ltd. (2006-2008), and Senior Vice President, Deputy General Counsel and Group Head for FMR LLC (2005-2006). |
Christine Reynolds (53) |
| Year of Election or Appointment: 2008 Chief Financial Officer of the Fidelity funds. Ms. Reynolds became President of Fidelity Pricing and Cash Management Services (FPCMS) in August 2008. Ms. Reynolds served as Chief Operating Officer of FPCMS (2007-2008). Previously, Ms. Reynolds served as President, Treasurer, and Anti-Money Laundering officer of the Fidelity funds (2004-2007). |
Kenneth A. Rathgeber (64) |
| Year of Election or Appointment: 2004 Chief Compliance Officer of Fidelity's Equity and High Income Funds. Mr. Rathgeber is Chief Compliance Officer of Fidelity Management & Research (Hong Kong) Limited (2008-present), Fidelity Management & Research (Japan) Inc. (2008-present), FMR (2005-present), FMR Co., Inc. (2005-present), Fidelity Management & Research (U.K.) Inc. (2005-present), Fidelity Research & Analysis Company (2005-present), Fidelity Investments Money Management, Inc. (2005-present), Pyramis Global Advisors, LLC (2005-present), and Strategic Advisers, Inc. (2005-present). |
Jeffrey S. Christian (50) |
| Year of Election or Appointment: 2009 Deputy Treasurer of the Fidelity funds. Mr. Christian is an employee of Fidelity Investments. Previously, Mr. Christian served as Chief Financial Officer (2008-2009) of certain Fidelity funds and Senior Vice President of Fidelity Pricing and Cash Management Services (FPCMS) (2004-2009). |
Joseph F. Zambello (54) |
| Year of Election or Appointment: 2011 Deputy Treasurer of the Fidelity funds. Mr. Zambello is an employee of Fidelity Investments. Previously, Mr. Zambello served as Vice President of FMR's Program Management Group (2009-2011) and Vice President of the Transfer Agent Oversight Group (2005-2009). |
Adrien E. Deberghes (44) |
| Year of Election or Appointment: 2008 Deputy Treasurer of Fidelity's Equity and High Income Funds. Mr. Deberghes also serves as Vice President and Assistant Treasurer of Fidelity Rutland Square Trust II and Fidelity Commonwealth Trust II (2011-present), Assistant Treasurer of other Fidelity funds (2010-present), and is an employee of Fidelity Investments (2008-present). Previously, Mr. Deberghes served as Senior Vice President of Mutual Fund Administration at State Street Corporation (2007-2008), Senior Director of Mutual Fund Administration at Investors Bank & Trust (2005-2007), and Director of Finance for Dunkin' Brands (2000-2005). |
Stephanie J. Dorsey (42) |
| Year of Election or Appointment: 2010 Assistant Treasurer of Fidelity's Equity and High Income Funds. Ms. Dorsey also serves as Deputy Treasurer of other Fidelity funds (2008-present) and is an employee of Fidelity Investments (2008-present). Previously, Ms. Dorsey served as Treasurer (2004-2008) of the JPMorgan Mutual Funds and Vice President (2004-2008) of JPMorgan Chase Bank. |
John R. Hebble (53) |
| Year of Election or Appointment: 2009 Assistant Treasurer of Fidelity's Equity and High Income Funds. Mr. Hebble also serves as President (2011-present), Treasurer, and Chief Financial Officer of The North Carolina Capital Management Trust: Cash and Term Portfolios (2008-present), President and Treasurer of other Fidelity funds (2008-present) and is an employee of Fidelity Investments. |
Gary W. Ryan (53) |
| Year of Election or Appointment: 2005 Assistant Treasurer of the Fidelity funds. Mr. Ryan is an employee of Fidelity Investments. Previously, Mr. Ryan served as Vice President of Fund Reporting in Fidelity Pricing and Cash Management Services (FPCMS) (1999-2005). |
Jonathan Davis (43) |
| Year of Election or Appointment: 2010 Assistant Treasurer of the Fidelity funds. Mr. Davis is also Assistant Treasurer of Fidelity Rutland Square Trust II and Fidelity Commonwealth Trust II. Mr. Davis is an employee of Fidelity Investments. Previously, Mr. Davis served as Vice President and Associate General Counsel of FMR LLC (2003-2010). |
Annual Report
Class K designates 82% and 100% of the dividends distributed on December 3, 2010 and December 30, 2010, respectively during the fiscal year as amounts which may be taken into account as a dividend for the purposes of the maximum rate under section 1(h)(11) of the Internal Revenue Code.
The amounts per share which represent income derived from sources within, and taxes paid to, foreign countries or possessions of the United States are as follows:
| Pay Date | Income | Taxes |
Class K | 12/06/2010 | $0.458 | $0.0348 |
| 12/31/2010 | $0.041 | $0.0000 |
The fund will notify shareholders in January 2012 of amounts for use in preparing 2011 income tax returns.
Annual Report
Board Approval of Investment Advisory Contracts and Management Fees
Fidelity International Discovery Fund
Each year, the Board of Trustees, including the Independent Trustees (together, the Board), votes on the renewal of the management contract and sub-advisory agreements (together, the Advisory Contracts) for the fund. The Board, assisted by the advice of fund counsel and Independent Trustees' counsel, requests and considers a broad range of information relevant to the renewal of the Advisory Contracts throughout the year.
The Board meets regularly and considers at each of its meetings factors that are relevant to its annual consideration of the renewal of the fund's Advisory Contracts, including the services and support provided to the fund and its shareholders. The Board has established various standing committees, each composed of Independent Trustees with varying backgrounds, to which the Board has assigned specific subject matter responsibilities in order to enhance effective decision-making by the Board. The Board, acting directly and through its Committees, requests and receives information concerning the annual consideration of the renewal of the fund's Advisory Contracts. The Board also meets as needed to consider matters specifically related to the Board's annual consideration of the renewal of Advisory Contracts. Members of the Board may also meet with trustees of other Fidelity funds through ad hoc joint committees to discuss certain matters relevant to the Fidelity funds.
At its July 2011 meeting, the Board of Trustees, including the Independent Trustees, unanimously determined to renew the fund's Advisory Contracts. In reaching its determination, the Board considered all factors it believed relevant, including (i) the nature, extent, and quality of the services to be provided to the fund and its shareholders (including the investment performance of the fund); (ii) the competitiveness of the fund's management fee and total expense ratio; (iii) the total costs of the services to be provided by and the profits to be realized by Fidelity from its relationship with the fund; (iv) the extent to which economies of scale would be realized as the fund grows; and (v) whether fee levels reflect these economies of scale, if any, for the benefit of fund shareholders.
In considering whether to renew the Advisory Contracts for the fund, the Board reached a determination, with the assistance of fund counsel and Independent Trustees' counsel and through the exercise of its business judgment, that the renewal of the Advisory Contracts is in the best interests of the fund and its shareholders and that the compensation payable under the Advisory Contracts is fair and reasonable. The Board's decision to renew the Advisory Contracts was not based on any single factor, but rather was based on a comprehensive consideration of all the information provided to the Board at its meetings throughout the year. The Board, in reaching its determination to renew the Advisory Contracts, is aware that shareholders in the fund have a broad range of investment choices available to them, including a wide choice among mutual funds offered by Fidelity's competitors, and that the fund's shareholders, who have the opportunity to review and weigh the disclosure provided by the fund in its prospectus and other public disclosures, have chosen to invest in this fund, managed by Fidelity.
Annual Report
Nature, Extent, and Quality of Services Provided. The Board considered the staffing within the investment adviser, FMR, and the sub-advisers (together, the Investment Advisers), including the backgrounds of the fund's investment personnel and the fund's investment objective and discipline. The Independent Trustees also had discussions with senior management of Fidelity's investment operations and investment groups. The Board considered the structure of the portfolio manager compensation program and whether this structure provides appropriate incentives to act in the best interests of the fund.
Resources Dedicated to Investment Management and Support Services. The Board and the Fund Oversight and Research Committees reviewed the general qualifications and capabilities of the Investment Advisers' investment staff, including its size, education, experience, and resources, as well as the Investment Advisers' approach to recruiting, training, managing, and compensating investment personnel. The Board also noted that FMR has devoted increased resources to non-U.S. offices. The Board noted that Fidelity's analysts have extensive resources, tools and capabilities which allow them to conduct sophisticated quantitative and fundamental analysis, as well as credit analysis of issuers, counterparties and enhancers. The Board also believes that Fidelity's investment professionals have sufficient access to global information and data so as to provide competitive investment results over time, and that those professionals also have access to sophisticated tools which permit them to assess portfolio construction and risk and performance attribution characteristics continuously, as well as to transmit new information and research conclusions rapidly around the world. Additionally, in their deliberations, the Board considered the Investment Advisers' trading capabilities and resources which are an integral part of the investment management process.
Shareholder and Administrative Services. The Board considered (i) the nature, extent, quality, and cost of advisory, administrative, and shareholder services performed by the Investment Advisers and their affiliates under the Advisory Contracts and under separate agreements covering transfer agency, pricing and bookkeeping, and securities lending services for the fund; (ii) the nature and extent of the investment adviser's supervision of third party service providers, principally custodians and subcustodians; and (iii) the resources devoted to, and the record of compliance with, the fund's compliance policies and procedures. The Board also reviewed the allocation of fund brokerage, including allocations to brokers affiliated with the Investment Advisers, the use of brokerage commissions to pay fund expenses, and the use of "soft" commission dollars to pay for research services.
The Board noted that the growth of fund assets over time across the complex allows Fidelity to reinvest in the development of services designed to enhance the value or convenience of the Fidelity funds as investment vehicles. These services include 24-hour access to account information and market information through telephone representatives and over the Internet, investor education materials and asset allocation tools, and the expanded availability of Fidelity Investor Centers, with 35 new branches opening since 2010.
Annual Report
Board Approval of Investment Advisory Contracts and
Management Fees - continued
Investment in a Large Fund Family. The Board considered the benefits to shareholders of investing in a Fidelity fund, including the benefits of investing in a fund that is part of a large family of funds offering a variety of investment disciplines and providing a large variety of mutual fund investor services. The Board noted that Fidelity had taken, or had made recommendations that resulted in the Fidelity funds taking, a number of actions over the previous year that benefited particular funds, including (i) continuing to dedicate additional resources to investment research and support of the senior management team that oversees asset management; (ii) rationalizing product lines through the mergers of six funds into other funds; (iii) continuing to migrate the Freedom Funds to dedicated lower cost underlying funds; (iv) obtaining shareholder approval to broaden the investment strategies for Fidelity Consumer Finance Portfolio, Fidelity Emerging Asia Fund, and Fidelity Environment and Alternative Energy Portfolio; (v) contractually agreeing to reduce the management fees and impose other expense limitations on Spartan 500 Index Fund and U.S. Bond Index Fund in connection with launching new institutional classes of these funds; (vi) changing the name, primary and supplemental benchmarks, and investment policies of Fidelity Global Strategies Fund to support the fund's flexible investment mandate and global orientation; and (vii) reducing the transfer agency account fee rates on certain accounts.
Investment Performance. The Board considered whether the fund has operated in accordance with its investment objective, as well as its record of compliance with its investment restrictions. It also reviewed the fund's absolute investment performance for each class, as well as the fund's relative investment performance for each class measured over multiple periods against (i) a broad-based securities market index, and (ii) a peer group of mutual funds deemed appropriate by Fidelity and reviewed by the Board. The following charts considered by the Board show, over the one-, three-, and five-year periods ended December 31, 2010, the cumulative total returns of Institutional Class (Class I) and Class B of the fund, the cumulative total returns of a broad-based securities market index ("benchmark"), and a range of cumulative total returns of a peer group of mutual funds identified by Morningstar, Inc. as having an investment style similar to that of the fund based on underlying portfolio holdings. The returns of Institutional Class (Class I) and Class B show the performance of the highest and lowest performing classes, respectively (based on five-year performance). The box within each chart shows the 25th percentile return (bottom of box) and the 75th percentile return (top of box) of the peer group. Returns shown above the box are in the first quartile and returns shown below the box are in the fourth quartile. The percentage beaten numbers noted below each chart correspond to the percentile box and represent the percentage of funds in the peer group whose performance was equal to or lower than that of the class indicated.
Annual Report
Fidelity International Discovery Fund
The Board reviewed the fund's relative investment performance against its peer group and noted that the performance of Institutional Class (Class I) of the fund was in the second quartile for the one- and five-year periods and the third quartile for the three-year period. The Board also noted that the investment performance of Institutional Class (Class I) of the fund compared favorably to its benchmark for the one- and five-year periods, although the fund's three-year cumulative total return was lower than its benchmark. The Board considered that the variations in performance among the fund's classes reflect the variations in class expenses, which result in lower performance for higher expense classes. The Board also reviewed the fund's performance since inception as well as performance in the current year.
The Board also considered that the fund's management fee is subject to upward or downward adjustment depending upon whether, and to what extent, the fund's investment performance for the performance period exceeds, or is exceeded by, the record (over the same period) of a Board-approved performance adjustment index. The Board noted that the performance adjustment provides FMR with a strong economic incentive to seek to achieve superior performance for the fund's shareholders and helps to more closely align the interests of FMR and the fund's shareholders.
Based on its review, the Board concluded that the nature, extent, and quality of services provided to the fund under the Advisory Contracts should benefit the fund's shareholders.
Annual Report
Board Approval of Investment Advisory Contracts and
Management Fees - continued
Competitiveness of Management Fee and Total Expense Ratio. The Board considered the fund's management fee and total expense ratio compared to "mapped groups" of competitive funds and classes. Fidelity creates "mapped groups" by combining similar Lipper investment objective categories that have comparable management fee characteristics. Combining Lipper investment objective categories aids the Board's management fee and total expense ratio comparisons by broadening the competitive group used for comparison and by reducing the number of universes to which various Fidelity funds are compared.
Management Fee. The Board considered two proprietary management fee comparisons for the 12-month periods shown in the chart below. The group of Lipper funds used by the Board for management fee comparisons is referred to below as the "Total Mapped Group." The Total Mapped Group comparison focuses on a fund's standing relative to the total universe of comparable funds available to investors in terms of gross management fees before expense reimbursements or caps, and without giving effect to the fund's performance adjustment. "TMG %" represents the percentage of funds in the Total Mapped Group that had management fees that were lower than the fund's. For example, a TMG % of 16% means that 84% of the funds in the Total Mapped Group had higher management fees than the fund. The "Asset-Size Peer Group" (ASPG) comparison focuses on a fund's standing relative to non-Fidelity funds similar in size to the fund within the Total Mapped Group. The ASPG represents at least 15% of the funds in the Total Mapped Group with comparable asset size and management fee characteristics, subject to a minimum of 50 funds (or all funds in the Total Mapped Group if fewer than 50). Additional information, such as the ASPG quartile in which the fund's management fee ranked and the impact of the fund's performance adjustment, is also included in the chart and considered by the Board.
Annual Report
Fidelity International Discovery Fund
The Board noted that the fund's management fee ranked below the median of its Total Mapped Group and below the median of its ASPG for 2010. The Board also noted the effect of the fund's positive performance adjustment on the fund's management fee ranking. The Board noted that the performance adjustment for each year represents calculations for performance periods that differ from the periods shown in the performance charts above.
Based on its review, the Board concluded that the fund's management fee is fair and reasonable in light of the services that the fund receives and the other factors considered.
Total Expense Ratio. In its review of each class's total expense ratio, the Board considered the fund's management fee as well as other fund or class expenses, as applicable, such as transfer agent fees, pricing and bookkeeping fees, fund-paid 12b-1 fees, and custodial, legal, and audit fees. The Board also noted the effects of any waivers and reimbursements on fees and expenses, as well as the impact of the fund's performance adjustment. As part of its review, the Board also considered the current and historical total expense ratios of each class of the fund compared to competitive fund median expenses. Each class of the fund is compared to those funds and classes in the Total Mapped Group (used by the Board for management fee comparisons) that have a similar sales load structure.
The Board noted that the total expense ratio of each of Class A, Class B, Class C, Institutional Class, the retail class, and Class K ranked below its competitive median for 2010 and the total expense ratio of Class T ranked above its competitive median for 2010. The Board considered that various factors, including 12b-1 fees, positive or negative performance adjustments, and relatively higher other expenses in the case of small fund size, can affect total expense ratios. The Board noted that the total expense ratio of Class T was above the competitive median primarily because of higher 12b-1 fees on Class T. Class T has a higher 12b-1 fee, but a lower front-end sales charge, than traditionally priced front-end sales charge classes. The Board noted that the fund offers multiple classes, each of which has a different sales load and 12b-1 fee structure, and that the multiple structures are intended to offer a range of pricing options for the intermediary market. The Board also noted that the total expense ratios of the classes vary primarily by the level of their 12b-1 fees, although differences in transfer agent fees may also cause expenses to vary from class to class.
Annual Report
Board Approval of Investment Advisory Contracts and
Management Fees - continued
Fees Charged to Other Fidelity Clients. The Board also considered Fidelity fee structures and other information with respect to clients of FMR and its affiliates, such as other mutual funds advised or subadvised by FMR or its affiliates, pension plan clients, and other institutional clients. In March 2010, the Board created an ad hoc joint committee with the board of other Fidelity funds (the Committee) to review and compare Fidelity's institutional investment advisory business with its business of providing services to the Fidelity funds, including the differences in services provided, fees charged, and costs incurred, as well as competition in their respective marketplaces.
Based on its review of total expense ratios and fees charged to other Fidelity clients, the Board concluded that the total expense ratio of each class of the fund was reasonable, although Class T was above the median of the universe presented for comparison, in light of the services that the fund and its shareholders receive and the other factors considered, including the findings of the Committee.
Costs of the Services and Profitability. The Board considered the revenues earned and the expenses incurred by Fidelity in conducting the business of developing, marketing, distributing, managing, administering and servicing the fund and its shareholders. The Board also considered the level of Fidelity's profits in respect of all the Fidelity funds.
On an annual basis, FMR presents to the Board Fidelity's profitability for the fund. Fidelity calculates the profitability for each fund, as well as aggregate profitability for groups of Fidelity funds and all Fidelity funds, using a series of detailed revenue and cost allocation methodologies which originate with the books and records of Fidelity on which Fidelity's audited financial statements are based. The Audit Committee of the Board reviews any significant changes from the prior year's methodologies.
PricewaterhouseCoopers LLP (PwC), independent registered public accounting firm and auditor to Fidelity and certain Fidelity funds, has been engaged annually by the Board as part of the Board's assessment of Fidelity's profitability analysis. PwC's engagement includes the review and assessment of Fidelity's methodologies used in determining the revenues and expenses attributable to Fidelity's mutual fund business, and completion of agreed-upon procedures surrounding the mathematical accuracy of fund profitability and its conformity to allocation methodologies. After considering PwC's reports issued under the engagement and information provided by Fidelity, the Board concluded that while other allocation methods may also be reasonable, Fidelity's profitability methodologies are reasonable in all material respects.
Annual Report
The Board also reviewed Fidelity's non-fund businesses and fall-out benefits related to the mutual fund business as well as cases where Fidelity's affiliates may benefit from or be related to the fund's business.
The Board considered the costs of the services provided by and the profits realized by Fidelity in connection with the operation of the fund and was satisfied that the profitability was not excessive in the circumstances.
Economies of Scale. The Board considered whether there have been economies of scale in respect of the management of the Fidelity funds, whether the Fidelity funds (including the fund) have appropriately benefited from any such economies of scale, and whether there is potential for realization of any further economies of scale. The Board considered the extent to which the fund will benefit from economies of scale through increased services to the fund, through waivers or reimbursements, or through fee or expense reductions. The Board also noted that in 2009, it and the board of other Fidelity funds created an ad hoc committee (the Economies of Scale Committee) to analyze whether FMR attains economies of scale in respect of the management and servicing of the Fidelity funds, whether the Fidelity funds have appropriately benefited from such economies of scale, and whether there is potential for realization of any further economies of scale.
The Board recognized that the fund's management contract incorporates a "group fee" structure, which provides for lower group fee rates as total fund assets under FMR's management increase, and for higher group fee rates as total fund assets under FMR's management decrease. FMR calculates the group fee rates based on a tiered asset "breakpoint" schedule that varies based on asset class. The Board considered that the group fee is designed to deliver the benefits of economies of scale to fund shareholders when total Fidelity fund assets increase, even if assets of any particular fund are unchanged or have declined, because some portion of Fidelity's costs are attributable to services provided to all Fidelity funds, and all funds benefit if those costs can be allocated among more assets. The Board concluded that, given the group fee structure, fund shareholders will benefit from lower management fees as assets under FMR's management increase at the fund complex level, regardless of whether Fidelity achieves any such economies of scale.
The Board concluded, taking into account the analysis of the Economies of Scale Committee, that any potential economies of scale are being appropriately shared between fund shareholders and Fidelity.
Annual Report
Board Approval of Investment Advisory Contracts and
Management Fees - continued
Additional Information Requested by the Board. In order to develop fully the factual basis for consideration of the Fidelity funds' Advisory Contracts, the Board requested and received additional information on certain topics, including (i) fund performance trends, actions to be taken by FMR to improve certain funds' overall performance, and Fidelity's long-term strategies for certain funds; (ii) portfolio manager changes that have occurred during the past year and length of portfolio manager tenure for different categories of funds over time; (iii) Fidelity's compensation structure for portfolio managers and other key personnel and strategies for attracting and retaining non-investment personnel; (iv) the amount of the investment that each portfolio manager has made in the Fidelity fund(s) that he or she manages; (v) historical trends in Fidelity's realization of fall-out benefits; (vi) Fidelity's group fee structures and the rationale for the individual fee rates of certain funds; (vii) fund profitability methodology and the impact of certain factors on fund profitability results; (viii) trends regarding industry use of performance fee structures and Fidelity's compliance practices with respect to performance adjustment calculations; (ix) the fee structures in place for certain other Fidelity clients; and (x) explanations regarding the relative total expense ratios of certain funds and classes, total expense competitive trends, and actions that might be taken by FMR to reduce total expense ratios for certain funds and classes.
Based on its evaluation of all of the conclusions noted above, and after considering all factors it believed relevant, the Board ultimately concluded that the advisory fee structures are fair and reasonable, and that the fund's Advisory Contracts should be renewed.
Annual Report
Managing Your Investments
Fidelity offers several ways to conveniently manage your workplace benefits (including your workplace savings plan, investments, and additional services) via your telephone or PC. You can access your plan and account information and research your investments 24 hours a day.
By Phone
Fidelity provides a single toll-free number to access plan information, account balances, positions, and quotes*. It's easy to navigate the service, and on your first call, the system will help you create a personal identification number (PIN) for security.
(phone graphic)
Fidelity Workplace
Investing
1-800-835-5092
By PC
Fidelity's web site on the Internet provides a wide range of information, including plan information, daily financial news, fund performance, interactive planning tools, and news about Fidelity products and services.
(computer graphic)
Fidelity's Web Site
www.401k.com
* When you call the quotes line, please remember that a fund's yield and return will vary and, except for money market funds, share price will also vary. This means that you may have a gain or loss when you sell your shares. There is no assurance that money market funds will be able to maintain a stable $1 share price; an investment in a money market fund is not insured or guaranteed by the U.S. government. Total returns are historical and include changes in share price, reinvestment of dividends and capital gains distributions, and the effects of any sales charges.
Annual Report
To Write Fidelity
We'll give your correspondence immediate attention and send you written confirmation upon completion of your request.
(letter graphic)
For Non-Retirement
Accounts
Buying shares
Fidelity Investments
P.O. Box 770001
Cincinnati, OH 45277-0003
Overnight Express
Fidelity Investments
Attn: Distribution Services
100 Crosby Parkway - KC1H
Covington, KY 41015
Selling shares
Fidelity Investments
P.O. Box 770001
Cincinnati, OH 45277-0035
Overnight Express
Fidelity Investments
Attn: Distribution Services
100 Crosby Parkway - KC1H
Covington, KY 41015
General Correspondence
Fidelity Investments
P.O. Box 500
Merrimack, NH 03054-0500
(letter graphic)
For Retirement
Accounts
Buying shares
Fidelity Investments
P.O. Box 770001
Cincinnati, OH 45277-0003
Selling shares
Fidelity Investments
P.O. Box 770001
Cincinnati, OH 45277-0035
Overnight Express
Fidelity Investments
Attn: Distribution Services
100 Crosby Parkway - KC1H
Covington, KY 41015
General Correspondence
Fidelity Investments
P.O. Box 500
Merrimack, NH 03054-0500
Annual Report
Investment Adviser
Fidelity Management & Research Company
Boston, MA
Investment Sub-Advisers
FMR Co., Inc.
Fidelity Management & Research
(U.K.) Inc.
FIL Investments (Japan) Limited
FIL Investment Advisors
FIL Investment Advisors
(U.K.) Limited
Fidelity Management & Research
(Hong Kong) Limited
Fidelity Management & Research
(Japan) Inc.
General Distributor
Fidelity Distributors Corporation
Boston, MA
Transfer and Service Agents
Fidelity Investments Institutional
Operations Company, Inc.
Boston, MA
Fidelity Service Company, Inc.
Boston, MA
Custodian
The Northern Trust Company
Chicago, IL
(Fidelity Logo)
Corporate Headquarters
82 Devonshire St., Boston, MA 02109
www.fidelity.com
IGI-K-UANN-1211
1.863305.103
Fidelity®
International Growth Fund
Annual Report
October 31, 2011
Contents
Chairman's Message | (Click Here) | The Chairman's message to shareholders. |
Performance | (Click Here) | How the fund has done over time. |
Management's Discussion of Fund Performance | (Click Here) | The Portfolio Manager's review of fund performance and strategy. |
Shareholder Expense Example | (Click Here) | An example of shareholder expenses. |
Investment Changes | (Click Here) | A summary of major shifts in the fund's investments over the past six months. |
Investments | (Click Here) | A complete list of the fund's investments with their market values. |
Financial Statements | (Click Here) | Statements of assets and liabilities, operations, and changes in net assets, as well as financial highlights. |
Notes | (Click Here) | Notes to financial statements. |
Report of Independent Registered Public Accounting Firm | (Click Here) | |
Trustees and Officers | (Click Here) | |
Distributions | (Click Here) | |
Board Approval of Investment Advisory Contracts and Management Fees | (Click Here) | |
To view a fund's proxy voting guidelines and proxy voting record for the 12-month period ended June 30, visit http://www.fidelity.com/proxyvotingresults or visit the Securities and Exchange Commission's (SEC) web site at http://www.sec.gov. You may also call 1-800-544-8544 to request a free copy of the proxy voting guidelines.
Standard & Poor's, S&P and S&P 500 are registered service marks of The McGraw-Hill Companies, Inc. and have been licensed for use by Fidelity Distributors Corporation.
Other third party marks appearing herein are the property of their respective owners.
All other marks appearing herein are registered or unregistered trademarks or service marks of FMR LLC or an affiliated company.
Annual Report
This report and the financial statements contained herein are submitted for the general information of the shareholders of the fund. This report is not authorized for distribution to prospective investors in the fund unless preceded or accompanied by an effective prospectus.
A fund files its complete schedule of portfolio holdings with the SEC for the first and third quarters of each fiscal year on Form N-Q. Forms N-Q are available on the SEC's web site at http://www.sec.gov. A fund's Forms N-Q may be reviewed and copied at the SEC's Public Reference Room in Washington, DC. Information regarding the operation of the SEC's Public Reference Room may be obtained by calling 1-800-SEC-0330. For a complete list of a fund's portfolio holdings, view the most recent holdings listing, semiannual report, or annual report on Fidelity's web site at http://www.fidelity.com, http://www.advisor.fidelity.com, or http://www.401k.com, as applicable.
NOT FDIC INSURED • MAY LOSE VALUE • NO BANK GUARANTEE
Neither the fund nor Fidelity Distributors Corporation is a bank.
Annual Report
(Acting Chairman's Photograph)
Dear Shareholder:
Global equity markets began the fourth quarter on a strong note, sharply reversing course in October amid strong corporate earnings, better-than-expected economic news and the promise of a resolution to the sovereign debt crisis in Europe. The mini rally followed a third quarter marked by a significant downturn in July and August, which heightened investor anxiety and set off a wave of volatility that hampered most major asset classes through the end of September. Financial markets are difficult to predict, of course, but you can help put the odds in your favor by following these time-tested investment principles.
One of the basic tenets is to invest according to your time horizon. For long-term investors, riding out the markets' inevitable ups and downs has proven much more effective than making decisions based on short-term developments. If your goal is approaching, you can also benefit from patience and restraint, rather than attempting to time the market. No matter your time horizon, missing only a few of the markets' best days can significantly diminish returns. Patience also affords the benefits of compounding - earning interest on additional income or reinvested dividends and capital gains. While staying the course doesn't eliminate risk, it can considerably lessen the negative impact of short-term downturns.
Asset allocation is another principle to manage risk. As you spread your portfolio among the asset classes, be sure to consider your time horizon, risk tolerance and investment objectives. Younger investors may be better served by emphasizing equities, which historically have been the best-performing asset class over time. Investors who are nearing a specific goal, such as retirement or sending a child to college, may choose to favor bonds and other investments that have tended to be more stable. Studies indicate that asset allocation is the single most important determinant of a portfolio's long-term success. After deciding on a suitable allocation strategy, make sure your portfolio is adequately diversified, with exposure to stocks of small-, mid- and large-cap companies in a range of sectors, for example. And today, more than ever, geographic diversification should be taken into account.
Lastly, investing a certain amount of money on a regular basis - a principle known as dollar-cost averaging - can help lower the average cost of your purchases, while also giving you the discipline to avoid selling weak performers just prior to an upswing, or chasing a hot performer just before a correction.
We invite you to learn more by visiting us on the Internet, dropping by one of our Investor Centers or calling us by phone. It is our privilege to provide the resources you need to choose investments that are right for you.
Sincerely,
(Acting Chairman's Signature)
James C. Curvey
Acting Chairman
Annual Report
Average annual total return reflects the change in the value of an investment, assuming reinvestment of the class' distributions from dividend income and capital gains (the profits earned upon the sale of securities that have grown in value, if any) and assuming a constant rate of performance each year. The $10,000 table and the fund's returns do not reflect the deduction of taxes that a shareholder would pay on fund distributions or the redemption of fund shares. During periods of reimbursement by Fidelity, a fund's total return will be greater than it would be had the reimbursement not occurred. How a fund did yesterday is no guarantee of how it will do tomorrow.
Average Annual Total Returns
Periods ended October 31, 2011 | Past 1
year | Life of
fundA |
Fidelity® International Growth Fund | -2.47% | -4.28% |
A From November 1, 2007.
$10,000 Over Life of Fund
Let's say hypothetically that $10,000 was invested in Fidelity® International Growth Fund, a class of the fund, on November 1, 2007, when the fund started. The chart shows how the value of your investment would have changed, and also shows how the MSCI® EAFE® (Europe, Australasia, Far East) Growth Index performed over the same period.
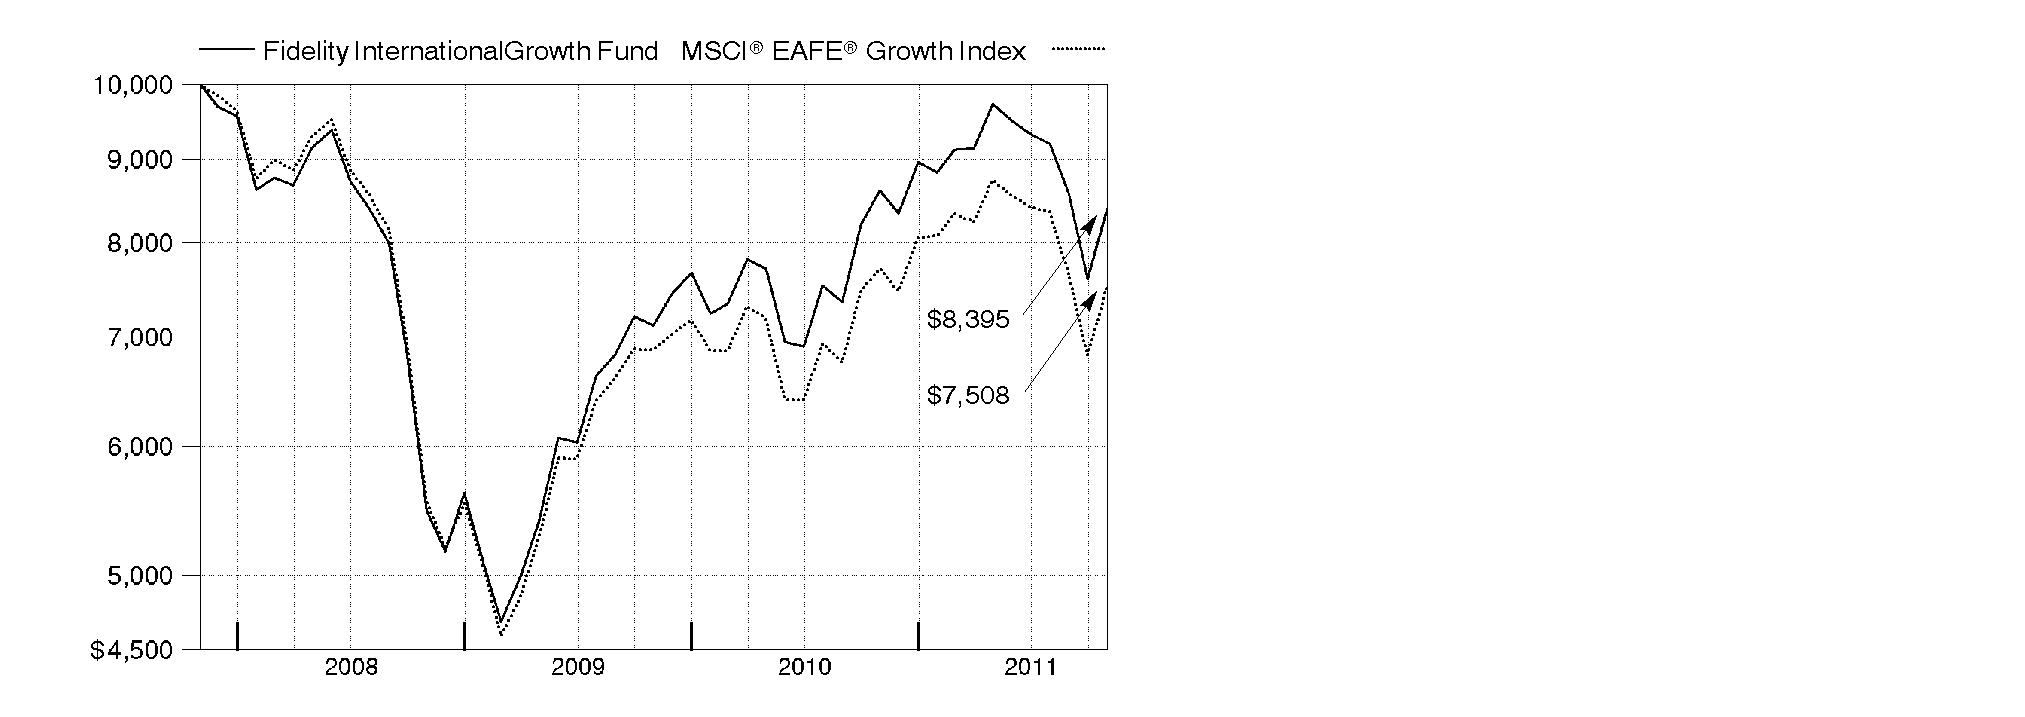
Annual Report
Market Recap: International equities were rocked by a number of headline events during the year ending October 31, 2011. Stocks posted a solid advance for the first half of the period, despite concern about the sovereign debt crisis in Europe, a devastating earthquake and tsunami in Japan, and political upheaval in the Middle East and North Africa. Sentiment turned decidedly negative in the second half, however, as fresh worries about Europe, inflation in China and a dimmed outlook for global growth caused foreign markets to suffer declines that intensified in August and September. October brought with it yet another dramatic swing, as eurozone policymakers appeared near a resolution to the debt debacle and buyers stormed back onto the scene in search of bargains. Still, those gains - along with favorable currency fluctuations overall - weren't enough to offset prior losses, and the MSCI® ACWI® (All Country World Index) ex USA Index finished the period down 4.56%. Within the MSCI index, Europe and emerging markets suffered the biggest declines, with many countries in these areas sustaining steep losses. By contrast, Japan showed resilience in the wake of its natural disasters, falling only 2%. Australia (+4%), Switzerland (+3%), the U.K. (+2%) and Canada, which produced a nominal return, were among the few major benchmark components to break into positive territory.
Comments from Jed Weiss, Portfolio Manager of Fidelity® International Growth Fund: For the year, the fund's Retail Class shares fell 2.47%, versus a 2.69% decline in the MSCI® EAFE® (Europe, Australasia, Far East) Growth Index. Stock selection in continental Europe and Japan was helpful, while an out-of-benchmark stake in the U.S. also contributed. However, my choices within non-index emerging markets were poor, notably Brazil and Turkey, while picks in the U.K., Canada and Australia further detracted. From a sector view, positioning in information technology, consumer discretionary and financials added value. In contrast, picks in health care equipment/services, capital goods and the food/beverage/tobacco segment of consumer staples notably detracted. On an individual security basis, lacking a position in weak-performing U.K.-based bank and benchmark component Lloyds Banking Group helped, as did out-of-benchmark stakes in U.S.-based credit card processor MasterCard and baby food maker Mead Johnson Nutrition. Conversely, not owning index constituent British American Tobacco hurt. I chose to own Philip Morris International instead - another of the fund's contributors. Non-index holdings in Turkish bank Turkiye Garanti Bankasi and Canadian energy company Niko Resources also detracted.
The views expressed above reflect those of the portfolio manager(s) only through the end of the period as stated on the cover of this report and do not necessarily represent the views of Fidelity or any other person in the Fidelity organization. Any such views are subject to change at any time based upon market or other conditions and Fidelity disclaims any responsibility to update such views. These views may not be relied on as investment advice and, because investment decisions for a Fidelity fund are based on numerous factors, may not be relied on as an indication of trading intent on behalf of any Fidelity fund.
Annual Report
Shareholder Expense Example
As a shareholder of the Fund, you incur two types of costs: (1) transaction costs, including sales charges (loads) on purchase payments or redemption proceeds, redemption fees, and (2) ongoing costs, including management fees, distribution and/or service (12b-1) fees and other Fund expenses. This Example is intended to help you understand your ongoing costs (in dollars) of investing in the Fund and to compare these costs with the ongoing costs of investing in other mutual funds.
The Example is based on an investment of $1,000 invested at the beginning of the period and held for the entire period (May 1, 2011 to October 31, 2011).
Actual Expenses
The first line of the accompanying table for each class of the Fund provides information about actual account values and actual expenses. You may use the information in this line, together with the amount you invested, to estimate the expenses that you paid over the period. Simply divide your account value by $1,000.00 (for example, an $8,600 account value divided by $1,000.00 = 8.6), then multiply the result by the number in the first line for a class of the Fund under the heading entitled "Expenses Paid During Period" to estimate the expenses you paid on your account during this period. A small balance maintenance fee of $12.00 that is charged once a year may apply for certain accounts with a value of less than $2,000. This fee is not included in the table below. If it was, the estimate of expenses you paid during the period would be higher, and your ending account value lower, by this amount. In addition, the Fund, as a shareholder in the underlying Fidelity Central Funds, will indirectly bear its pro-rata share of the fees and expenses incurred by the underlying Fidelity Central Funds. These fees and expenses are not included in the Fund's annualized expense ratio used to calculate the expense estimate in the table below.
Hypothetical Example for Comparison Purposes
The second line of the accompanying table for each class of the Fund provides information about hypothetical account values and hypothetical expenses based on a Class' actual expense ratio and an assumed rate of return of 5% per year before expenses, which is not the Class' actual return. The hypothetical account values and expenses may not be used to estimate the actual ending account balance or expenses you paid for the period. You may use this information to compare the ongoing costs of investing in the Fund and other funds. To do so, compare this 5% hypothetical example with the 5% hypothetical examples that appear in the shareholder reports of the other funds. A small balance maintenance fee of $12.00 that is charged once a year may apply for certain accounts with a value of less than $2,000. This fee is not included in the table below. If it was, the estimate of expenses you paid during the period would be higher, and your ending account value lower, by this amount. In addition, the Fund, as a shareholder in the underlying Fidelity Central Funds, will indirectly bear its pro-rata share of the fees and expenses incurred by the underlying Fidelity Central Funds. These fees and expenses are not included in the Fund's annualized expense ratio used to calculate the expense estimate in the table below.
Please note that the expenses shown in the table are meant to highlight your ongoing costs only and do not reflect any transaction costs. Therefore, the second line of the table is useful in comparing ongoing costs only, and will not help you determine the relative total costs of owning different funds. In addition, if these transactional costs were included, your costs would have been higher.
Annual Report
Shareholder Expense Example - continued
| Annualized
Expense Ratio | Beginning
Account Value
May 1, 2011 | Ending
Account Value
October 31, 2011 | Expenses Paid
During Period*
May 1, 2011 to
October 31, 2011 |
Class A | 1.45% | | | |
Actual | | $ 1,000.00 | $ 861.60 | $ 6.80 |
HypotheticalA | | $ 1,000.00 | $ 1,017.90 | $ 7.38 |
Class T | 1.70% | | | |
Actual | | $ 1,000.00 | $ 860.50 | $ 7.97 |
HypotheticalA | | $ 1,000.00 | $ 1,016.64 | $ 8.64 |
Class B | 2.20% | | | |
Actual | | $ 1,000.00 | $ 858.40 | $ 10.31 |
HypotheticalA | | $ 1,000.00 | $ 1,014.12 | $ 11.17 |
Class C | 2.20% | | | |
Actual | | $ 1,000.00 | $ 857.90 | $ 10.30 |
HypotheticalA | | $ 1,000.00 | $ 1,014.12 | $ 11.17 |
International Growth | 1.20% | | | |
Actual | | $ 1,000.00 | $ 862.90 | $ 5.63 |
HypotheticalA | | $ 1,000.00 | $ 1,019.16 | $ 6.11 |
Institutional Class | 1.20% | | | |
Actual | | $ 1,000.00 | $ 862.90 | $ 5.63 |
HypotheticalA | | $ 1,000.00 | $ 1,019.16 | $ 6.11 |
A 5% return per year before expenses
* Expenses are equal to each Class' annualized expense ratio, multiplied by the average account value over the period, multiplied by 184/365 (to reflect the one-half year period).
Annual Report
Investment Changes (Unaudited)
Geographic Diversification (% of fund's net assets) |
As of October 31, 2011 |
| United Kingdom 18.5% | |
| United States of America 17.5% | |
| Switzerland 9.6% | |
| Japan 7.4% | |
| Australia 5.2% | |
| Germany 4.9% | |
| France 4.1% | |
| Belgium 3.5% | |
| Denmark 2.9% | |
| Other 26.4% | |

Percentages are adjusted for the effect of futures contracts, if applicable. |
As of April 30, 2011 |
| United Kingdom 20.2% | |
| United States of America 13.6% | |
| Switzerland 9.2% | |
| Japan 7.5% | |
| Germany 5.5% | |
| Australia 5.2% | |
| Belgium 3.5% | |
| France 3.4% | |
| Brazil 3.0% | |
| Other 28.9% | |

Percentages are adjusted for the effect of futures contracts, if applicable. |
Asset Allocation |
| % of fund's
net assets | % of fund's net assets
6 months ago |
Stocks and Investment Companies | 95.8 | 97.9 |
Short-Term Investments and Net Other Assets | 4.2 | 2.1 |
Top Ten Stocks as of October 31, 2011 |
| % of fund's
net assets | % of fund's net assets
6 months ago |
Nestle SA (Switzerland, Food Products) | 4.9 | 4.6 |
BHP Billiton PLC ADR (United Kingdom, Metals & Mining) | 3.6 | 4.4 |
Anheuser-Busch InBev SA NV (Belgium, Beverages) | 2.9 | 2.8 |
BG Group PLC (United Kingdom, Oil, Gas & Consumable Fuels) | 2.8 | 2.4 |
Linde AG (Germany, Chemicals) | 2.2 | 1.9 |
Novo Nordisk A/S Series B sponsored ADR (Denmark, Pharmaceuticals) | 2.2 | 2.1 |
Roche Holding AG (participation certificate) (Switzerland, Pharmaceuticals) | 1.8 | 1.2 |
Danone (France, Food Products) | 1.7 | 0.8 |
Siemens AG sponsored ADR (Germany, Industrial Conglomerates) | 1.7 | 2.1 |
Philip Morris International, Inc. (United States of America, Tobacco) | 1.6 | 0.7 |
| 25.4 | |
Market Sectors as of October 31, 2011 |
| % of fund's
net assets | % of fund's net assets
6 months ago |
Consumer Staples | 22.2 | 17.0 |
Materials | 15.8 | 18.2 |
Industrials | 12.7 | 14.5 |
Consumer Discretionary | 12.1 | 12.8 |
Financials | 10.4 | 13.3 |
Information Technology | 8.5 | 7.7 |
Health Care | 8.2 | 7.1 |
Energy | 5.2 | 5.5 |
Telecommunication Services | 0.7 | 0.8 |
Annual Report
Investments October 31, 2011
Showing Percentage of Net Assets
Common Stocks - 95.8% |
| Shares | | Value |
Australia - 5.2% |
Coca-Cola Amatil Ltd. | 26,816 | | $ 346,197 |
CSL Ltd. | 25,527 | | 768,921 |
MAp Group unit | 58,681 | | 209,411 |
Newcrest Mining Ltd. | 16,135 | | 570,295 |
Newcrest Mining Ltd. sponsored ADR | 8,107 | | 284,961 |
OZ Minerals Ltd. | 23,905 | | 287,097 |
QBE Insurance Group Ltd. | 11,795 | | 181,577 |
Woolworths Ltd. | 10,289 | | 257,227 |
WorleyParsons Ltd. | 18,798 | | 545,659 |
TOTAL AUSTRALIA | | 3,451,345 |
Austria - 0.8% |
Andritz AG | 4,500 | | 398,750 |
Zumtobel AG | 7,800 | | 162,672 |
TOTAL AUSTRIA | | 561,422 |
Bailiwick of Guernsey - 0.2% |
Resolution Ltd. | 31,193 | | 137,953 |
Bailiwick of Jersey - 1.2% |
Informa PLC | 26,847 | | 156,467 |
Randgold Resources Ltd. sponsored ADR | 5,835 | | 639,341 |
TOTAL BAILIWICK OF JERSEY | | 795,808 |
Belgium - 3.5% |
Anheuser-Busch InBev SA NV | 34,391 | | 1,907,468 |
Umicore SA | 9,945 | | 428,232 |
TOTAL BELGIUM | | 2,335,700 |
Bermuda - 1.4% |
Lazard Ltd. Class A | 9,492 | | 259,511 |
Li & Fung Ltd. | 266,000 | | 512,634 |
Trinity Ltd. | 200,000 | | 181,272 |
TOTAL BERMUDA | | 953,417 |
Brazil - 2.7% |
Arezzo Industria e Comercio SA | 13,600 | | 179,781 |
BM&F Bovespa SA | 55,500 | | 331,281 |
BR Malls Participacoes SA | 15,500 | | 167,438 |
Braskem SA Class A sponsored ADR | 18,900 | | 340,956 |
Iguatemi Empresa de Shopping Centers SA | 8,700 | | 168,559 |
Common Stocks - continued |
| Shares | | Value |
Brazil - continued |
Itau Unibanco Banco Multiplo SA sponsored ADR | 15,830 | | $ 302,670 |
Multiplan Empreendimentos Imobiliarios SA | 13,300 | | 268,912 |
TOTAL BRAZIL | | 1,759,597 |
Canada - 2.6% |
Agnico-Eagle Mines Ltd. (Canada) | 7,600 | | 329,662 |
Fairfax Financial Holdings Ltd. (sub. vtg.) | 1,000 | | 417,987 |
Goldcorp, Inc. | 4,900 | | 238,401 |
Niko Resources Ltd. | 5,700 | | 313,519 |
Open Text Corp. (a) | 4,800 | | 293,773 |
Pan American Silver Corp. | 5,000 | | 139,800 |
TOTAL CANADA | | 1,733,142 |
Cayman Islands - 1.3% |
NVC Lighting Holdings Ltd. | 412,000 | | 178,887 |
Sands China Ltd. (a) | 102,600 | | 308,332 |
Wynn Macau Ltd. | 129,400 | | 362,563 |
TOTAL CAYMAN ISLANDS | | 849,782 |
Chile - 0.4% |
Banco Santander Chile sponsored ADR (d) | 3,400 | | 277,712 |
China - 0.5% |
Baidu.com, Inc. sponsored ADR (a) | 2,580 | | 361,664 |
Denmark - 2.9% |
Novo Nordisk A/S Series B sponsored ADR (d) | 13,700 | | 1,456,310 |
William Demant Holding A/S (a) | 5,900 | | 470,749 |
TOTAL DENMARK | | 1,927,059 |
Finland - 1.5% |
Metso Corp. | 4,600 | | 179,138 |
Nokian Tyres PLC | 12,900 | | 473,979 |
Outotec Oyj | 8,000 | | 373,985 |
TOTAL FINLAND | | 1,027,102 |
France - 4.1% |
Alstom SA | 16,016 | | 600,659 |
Danone | 15,852 | | 1,103,460 |
Remy Cointreau SA | 3,690 | | 303,332 |
Safran SA | 20,800 | | 681,344 |
TOTAL FRANCE | | 2,688,795 |
Common Stocks - continued |
| Shares | | Value |
Germany - 4.9% |
alstria office REIT-AG | 13,500 | | $ 173,562 |
Bayerische Motoren Werke AG (BMW) | 3,422 | | 279,691 |
Linde AG | 9,241 | | 1,470,052 |
MAN SE | 2,427 | | 215,261 |
Siemens AG sponsored ADR (d) | 10,400 | | 1,091,688 |
TOTAL GERMANY | | 3,230,254 |
Hong Kong - 0.9% |
Hong Kong Exchanges and Clearing Ltd. | 33,700 | | 571,279 |
India - 0.5% |
Bharti Airtel Ltd. | 42,571 | | 340,939 |
Ireland - 1.1% |
CRH PLC sponsored ADR (d) | 19,800 | | 364,518 |
James Hardie Industries NV sponsored ADR (a) | 11,400 | | 369,702 |
TOTAL IRELAND | | 734,220 |
Israel - 0.2% |
Azrieli Group | 6,300 | | 162,097 |
Italy - 1.2% |
Fiat Industrial SpA (a) | 40,201 | | 350,773 |
Interpump Group SpA | 23,751 | | 152,972 |
Saipem SpA | 6,670 | | 299,072 |
TOTAL ITALY | | 802,817 |
Japan - 7.4% |
Autobacs Seven Co. Ltd. | 7,500 | | 343,476 |
Denso Corp. | 16,900 | | 519,797 |
Fanuc Corp. | 5,400 | | 873,239 |
Fast Retailing Co. Ltd. | 1,500 | | 269,488 |
Japan Tobacco, Inc. | 41 | | 204,951 |
Keyence Corp. | 2,420 | | 615,269 |
Kobayashi Pharmaceutical Co. Ltd. | 6,000 | | 297,454 |
Osaka Securities Exchange Co. Ltd. | 63 | | 295,260 |
SHO-BOND Holdings Co. Ltd. | 6,600 | | 147,245 |
Unicharm Corp. | 9,800 | | 438,938 |
USS Co. Ltd. | 7,010 | | 579,585 |
Yamato Kogyo Co. Ltd. | 12,900 | | 326,341 |
TOTAL JAPAN | | 4,911,043 |
Mexico - 1.1% |
Wal-Mart de Mexico SA de CV Series V | 287,100 | | 741,667 |
Common Stocks - continued |
| Shares | | Value |
Netherlands - 1.4% |
ASML Holding NV | 17,400 | | $ 729,582 |
QIAGEN NV (a)(d) | 13,300 | | 183,274 |
TOTAL NETHERLANDS | | 912,856 |
Portugal - 0.9% |
Jeronimo Martins SGPS SA | 33,075 | | 572,156 |
South Africa - 1.7% |
African Rainbow Minerals Ltd. | 14,739 | | 340,641 |
Clicks Group Ltd. | 28,722 | | 150,734 |
JSE Ltd. | 29,300 | | 259,466 |
Mr Price Group Ltd. | 28,700 | | 276,285 |
MTN Group Ltd. | 7,300 | | 127,414 |
TOTAL SOUTH AFRICA | | 1,154,540 |
Spain - 1.3% |
Inditex SA | 5,827 | | 530,288 |
Prosegur Compania de Seguridad SA (Reg.) | 6,000 | | 299,338 |
TOTAL SPAIN | | 829,626 |
Sweden - 1.9% |
Fagerhult AB | 6,100 | | 143,622 |
H&M Hennes & Mauritz AB (B Shares) | 21,979 | | 727,852 |
Swedish Match Co. | 10,400 | | 359,878 |
TOTAL SWEDEN | | 1,231,352 |
Switzerland - 9.6% |
Nestle SA | 55,720 | | 3,231,892 |
Novartis AG sponsored ADR | 4,800 | | 271,056 |
Roche Holding AG (participation certificate) | 7,212 | | 1,189,193 |
Schindler Holding AG: | | | |
(participation certificate) | 2,598 | | 305,525 |
(Reg.) | 730 | | 85,931 |
The Swatch Group AG (Bearer) | 2,280 | | 965,470 |
UBS AG (NY Shares) (a) | 26,025 | | 328,436 |
TOTAL SWITZERLAND | | 6,377,503 |
Turkey - 1.6% |
Anadolu Efes Biracilik ve Malt Sanayii AS | 12,800 | | 155,634 |
Coca-Cola Icecek AS | 23,000 | | 312,173 |
Tupras-Turkiye Petrol Rafinerileri AS | 6,687 | | 151,268 |
Turkiye Garanti Bankasi AS | 125,500 | | 442,879 |
TOTAL TURKEY | | 1,061,954 |
Common Stocks - continued |
| Shares | | Value |
United Kingdom - 18.5% |
Anglo American PLC: | | | |
ADR | 18,300 | | $ 335,805 |
(United Kingdom) | 4,800 | | 177,044 |
Babcock International Group PLC | 39,300 | | 445,260 |
BG Group PLC | 84,755 | | 1,848,950 |
BHP Billiton PLC ADR (d) | 38,300 | | 2,411,751 |
GlaxoSmithKline PLC sponsored ADR | 11,100 | | 497,169 |
Imperial Tobacco Group PLC | 9,278 | | 339,301 |
InterContinental Hotel Group PLC ADR | 25,155 | | 464,864 |
Johnson Matthey PLC | 15,624 | | 472,127 |
Reckitt Benckiser Group PLC | 13,645 | | 701,766 |
Rio Tinto PLC sponsored ADR | 13,100 | | 708,186 |
Rolls-Royce Group PLC | 53,737 | | 607,099 |
Rolls-Royce Group PLC Class C | 3,707,853 | | 5,963 |
Rotork PLC | 9,700 | | 262,696 |
SABMiller PLC | 19,566 | | 714,751 |
Serco Group PLC | 42,761 | | 357,251 |
Shaftesbury PLC | 20,033 | | 162,374 |
Standard Chartered PLC (United Kingdom) | 41,951 | | 984,323 |
Tesco PLC | 78,253 | | 505,588 |
Unite Group PLC | 48,100 | | 136,763 |
Victrex PLC | 7,600 | | 155,223 |
TOTAL UNITED KINGDOM | | 12,294,254 |
United States of America - 13.3% |
Allergan, Inc. | 3,400 | | 286,008 |
Autoliv, Inc. (d) | 8,300 | | 479,491 |
Berkshire Hathaway, Inc. Class B (a) | 8,923 | | 694,745 |
Cymer, Inc. (a) | 3,700 | | 160,765 |
eBay, Inc. (a) | 10,536 | | 335,361 |
Google, Inc. Class A (a) | 620 | | 367,437 |
ION Geophysical Corp. (a) | 35,300 | | 268,986 |
JPMorgan Chase & Co. | 6,600 | | 229,416 |
Juniper Networks, Inc. (a) | 23,500 | | 575,045 |
Lam Research Corp. (a) | 5,555 | | 238,809 |
Martin Marietta Materials, Inc. (d) | 2,300 | | 165,991 |
MasterCard, Inc. Class A | 2,600 | | 902,824 |
Mead Johnson Nutrition Co. Class A | 10,100 | | 725,685 |
Mohawk Industries, Inc. (a) | 7,000 | | 368,550 |
Nuance Communications, Inc. (a) | 5,044 | | 133,565 |
Philip Morris International, Inc. | 14,908 | | 1,041,622 |
ResMed, Inc. (a) | 11,300 | | 319,790 |
Common Stocks - continued |
| Shares | | Value |
United States of America - continued |
Solera Holdings, Inc. | 3,189 | | $ 174,215 |
Union Pacific Corp. | 5,700 | | 567,549 |
Visa, Inc. Class A | 8,900 | | 830,014 |
TOTAL UNITED STATES OF AMERICA | | 8,865,868 |
TOTAL COMMON STOCKS (Cost $64,891,214) |
63,654,923
|
Money Market Funds - 13.0% |
| | | |
Fidelity Cash Central Fund, 0.12% (b) | 3,244,067 | | 3,244,067 |
Fidelity Securities Lending Cash Central Fund, 0.11% (b)(c) | 5,405,750 | | 5,405,750 |
TOTAL MONEY MARKET FUNDS (Cost $8,649,817) |
8,649,817
|
TOTAL INVESTMENT PORTFOLIO - 108.8% (Cost $73,541,031) | | 72,304,740 |
NET OTHER ASSETS (LIABILITIES) - (8.8)% | | (5,864,357) |
NET ASSETS - 100% | $ 66,440,383 |
Legend |
(a) Non-income producing |
(b) Affiliated fund that is available only to investment companies and other accounts managed by Fidelity Investments. The rate quoted is the annualized seven-day yield of the fund at period end. A complete unaudited listing of the fund's holdings as of its most recent quarter end is available upon request. In addition, each Fidelity Central Fund's financial statements, which are not covered by the Fund's Report of Independent Registered Public Accounting Firm, are available on the SEC's website or upon request. |
(c) Investment made with cash collateral received from securities on loan. |
(d) Security or a portion of the security is on loan at period end. |
Affiliated Central Funds |
Information regarding fiscal year to date income earned by the Fund from investments in Fidelity Central Funds is as follows: |
Fund | Income earned |
Fidelity Cash Central Fund | $ 133 |
Fidelity Securities Lending Cash Central Fund | 30,491 |
Total | $ 30,624 |
Other Information |
The following is a summary of the inputs used, as of October 31, 2011, involving the Fund's assets and liabilities carried at fair value. The inputs or methodology used for valuing securities may not be an indication of the risk associated with investing in those securities. For more information on valuation inputs, and their aggregation into the levels used in the table below, please refer to the Security Valuation section in the accompanying Notes to Financial Statements. |
Valuation Inputs at Reporting Date: |
Description | Total | Level 1 | Level 2 | Level 3 |
Investments in Securities: | | | | |
Equities: | | | | |
United Kingdom | $ 12,294,254 | $ 12,294,254 | $ - | $ - |
United States of America | 8,865,868 | 8,865,868 | - | - |
Switzerland | 6,377,503 | 6,377,503 | - | - |
Japan | 4,911,043 | - | 4,911,043 | - |
Australia | 3,451,345 | 284,961 | 3,166,384 | - |
Germany | 3,230,254 | 3,230,254 | - | - |
France | 2,688,795 | 2,688,795 | - | - |
Belgium | 2,335,700 | 428,232 | 1,907,468 | - |
Denmark | 1,927,059 | 1,927,059 | - | - |
Other | 17,573,102 | 15,117,196 | 2,455,906 | - |
Money Market Funds | 8,649,817 | 8,649,817 | - | - |
Total Investments in Securities: | $ 72,304,740 | $ 59,863,939 | $ 12,440,801 | $ - |
Income Tax Information |
At October 31, 2011, the Fund had a capital loss carryforward of approximately $4,617,271 of which $1,819,472 and $2,797,799 will expire in fiscal 2016 and 2017, respectively. Capital loss carryforwards are only available to offset future capital gains of the Fund to the extent provided by regulations and may be limited. |
See accompanying notes which are an integral part of the financial statements.
Annual Report
Statement of Assets and Liabilities
| October 31, 2011 |
| | |
Assets | | |
Investment in securities, at value (including securities loaned of $4,993,707) - See accompanying schedule: Unaffiliated issuers (cost $64,891,214) | $ 63,654,923 | |
Fidelity Central Funds (cost $8,649,817) | 8,649,817 | |
Total Investments (cost $73,541,031) | | $ 72,304,740 |
Foreign currency held at value (cost $25) | | 25 |
Receivable for fund shares sold | | 215,605 |
Dividends receivable | | 77,337 |
Distributions receivable from Fidelity Central Funds | | 1,200 |
Prepaid expenses | | 325 |
Receivable from investment adviser for expense reductions | | 47,592 |
Other receivables | | 8,776 |
Total assets | | 72,655,600 |
| | |
Liabilities | | |
Payable to custodian bank | $ 86 | |
Payable for investments purchased | 556,492 | |
Payable for fund shares redeemed | 129,097 | |
Accrued management fee | 43,489 | |
Distribution and service plan fees payable | 4,953 | |
Other affiliated payables | 18,627 | |
Other payables and accrued expenses | 56,723 | |
Collateral on securities loaned, at value | 5,405,750 | |
Total liabilities | | 6,215,217 |
| | |
Net Assets | | $ 66,440,383 |
Net Assets consist of: | | |
Paid in capital | | $ 72,102,749 |
Undistributed net investment income | | 591,460 |
Accumulated undistributed net realized gain (loss) on investments and foreign currency transactions | | (5,018,547) |
Net unrealized appreciation (depreciation) on investments and assets and liabilities in foreign currencies | | (1,235,279) |
Net Assets | | $ 66,440,383 |
See accompanying notes which are an integral part of the financial statements.
Annual Report
Statement of Assets and Liabilities - continued
| October 31, 2011 |
| | |
Calculation of Maximum Offering Price
Class A:
Net Asset Value and redemption price per share ($6,352,040 ÷ 784,991 shares) | | $ 8.09 |
| | |
Maximum offering price per share (100/94.25 of $8.09) | | $ 8.58 |
Class T:
Net Asset Value and redemption price per share ($2,917,485 ÷ 360,874 shares) | | $ 8.08 |
| | |
Maximum offering price per share (100/96.50 of $8.08) | | $ 8.37 |
Class B:
Net Asset Value and offering price per share ($473,300 ÷ 58,728 shares)A | | $ 8.06 |
| | |
Class C:
Net Asset Value and offering price per share ($2,767,455 ÷ 344,459 shares)A | | $ 8.03 |
| | |
| | |
International Growth:
Net Asset Value, offering price and redemption price per share ($53,437,349 ÷ 6,578,532 shares) | | $ 8.12 |
| | |
Institutional Class:
Net Asset Value, offering price and redemption price per share ($492,754 ÷ 60,686 shares) | | $ 8.12 |
A Redemption price per share is equal to net asset value less any applicable contingent deferred sales charge.
See accompanying notes which are an integral part of the financial statements.
Annual Report
Financial Statements - continued
Statement of Operations
| Year ended October 31, 2011 |
| | |
Investment Income | | |
Dividends | | $ 1,423,446 |
Interest | | 1,263 |
Income from Fidelity Central Funds | | 30,624 |
Income before foreign taxes withheld | | 1,455,333 |
Less foreign taxes withheld | | (88,339) |
Total income | | 1,366,994 |
| | |
Expenses | | |
Management fee
Basic fee | $ 410,826 | |
Performance adjustment | 56,123 | |
Transfer agent fees | 177,014 | |
Distribution and service plan fees | 51,133 | |
Accounting and security lending fees | 30,647 | |
Custodian fees and expenses | 63,389 | |
Independent trustees' compensation | 307 | |
Registration fees | 81,018 | |
Audit | 62,443 | |
Legal | 205 | |
Miscellaneous | 356 | |
Total expenses before reductions | 933,461 | |
Expense reductions | (195,414) | 738,047 |
Net investment income (loss) | | 628,947 |
Realized and Unrealized Gain (Loss) Net realized gain (loss) on: | | |
Investment securities: | | |
Unaffiliated issuers | 1,846,627 | |
Foreign currency transactions | (28,806) | |
Total net realized gain (loss) | | 1,817,821 |
Change in net unrealized appreciation (depreciation) on: Investment securities | (6,054,664) | |
Assets and liabilities in foreign currencies | (2,910) | |
Total change in net unrealized appreciation (depreciation) | | (6,057,574) |
Net gain (loss) | | (4,239,753) |
Net increase (decrease) in net assets resulting from operations | | $ (3,610,806) |
See accompanying notes which are an integral part of the financial statements.
Annual Report
Statement of Changes in Net Assets
| Year ended
October 31,
2011 | Year ended
October 31,
2010 |
Increase (Decrease) in Net Assets | | |
Operations | | |
Net investment income (loss) | $ 628,947 | $ 244,323 |
Net realized gain (loss) | 1,817,821 | 1,690,004 |
Change in net unrealized appreciation (depreciation) | (6,057,574) | 3,221,795 |
Net increase (decrease) in net assets resulting
from operations | (3,610,806) | 5,156,122 |
Distributions to shareholders from net investment income | (276,358) | (167,219) |
Distributions to shareholders from net realized gain | (48,341) | (78,510) |
Total distributions | (324,699) | (245,729) |
Share transactions - net increase (decrease) | 35,841,228 | 8,231,990 |
Redemption fees | 7,927 | 2,560 |
Total increase (decrease) in net assets | 31,913,650 | 13,144,943 |
| | |
Net Assets | | |
Beginning of period | 34,526,733 | 21,381,790 |
End of period (including undistributed net investment income of $591,460 and undistributed net investment income of $237,573, respectively) | $ 66,440,383 | $ 34,526,733 |
See accompanying notes which are an integral part of the financial statements.
Annual Report
Financial Highlights - Class A
Years ended October 31, | 2011 | 2010 | 2009 | 2008 F |
Selected Per-Share Data | | | | |
Net asset value, beginning of period | $ 8.38 | $ 7.01 | $ 5.46 | $ 10.00 |
Income from Investment Operations | | | | |
Net investment income (loss) C | .08 | .05 | .05 | .07 |
Net realized and unrealized gain (loss) | (.31) | 1.39 | 1.55 | (4.61) |
Total from investment operations | (.23) | 1.44 | 1.60 | (4.54) |
Distributions from net investment income | (.05) | (.05) | (.05) | - |
Distributions from net realized gain | (.01) | (.03) | - | - |
Total distributions | (.06) | (.07) I | (.05) | - |
Redemption fees added to paid in capital C, H | - | - | - | - |
Net asset value, end of period | $ 8.09 | $ 8.38 | $ 7.01 | $ 5.46 |
Total Return A, B | (2.76)% | 20.68% | 29.72% | (45.40)% |
Ratios to Average Net Assets D, G | | | | |
Expenses before reductions | 1.77% | 2.13% | 2.46% | 2.88% |
Expenses net of fee waivers, if any | 1.45% | 1.50% | 1.50% | 1.50% |
Expenses net of all reductions | 1.43% | 1.48% | 1.47% | 1.48% |
Net investment income (loss) | .92% | .74% | .85% | .80% |
Supplemental Data | | | | |
Net assets, end of period (000 omitted) | $ 6,352 | $ 3,084 | $ 1,452 | $ 820 |
Portfolio turnover rate E | 68% | 87% | 116% | 115% |
A Total returns would have been lower if certain expenses had not been reduced during the applicable periods shown.
B Total returns do not include the effect of the sales charges.
C Calculated based on average shares outstanding during the period.
D Fees and expenses of any underlying Fidelity Central Funds are not included in the Fund's expense ratio. The Fund indirectly bears its proportionate share of the expenses of any underlying Fidelity Central Funds.
E Amount does not include the portfolio activity of any underlying Fidelity Central Funds.
F For the period November 1, 2007 (commencement of operations) to October 31, 2008.
G Expense ratios reflect operating expenses of the class. Expenses before reductions do not reflect amounts reimbursed by the investment adviser or reductions from brokerage service arrangements or reductions from other expense offset arrangements and do not represent the amount paid by the class during periods when reimbursements or reductions occur. Expense ratios before reductions for start-up periods may not be representative of longer-term operating periods. Expenses net of fee waivers reflect expenses after reimbursement by the investment adviser but prior to reductions from brokerage service arrangements or other expense offset arrangements. Expenses net of all reductions represent the net expenses paid by the class.
H Amount represents less than $.01 per share.
I Total distributions of $.07 per share is comprised of distributions from net investment income of $.046 and distributions from net realized gain of $.025 per share.
See accompanying notes which are an integral part of the financial statements.
Annual Report
Financial Highlights - Class T
Years ended October 31, | 2011 | 2010 | 2009 | 2008 F |
Selected Per-Share Data | | | | |
Net asset value, beginning of period | $ 8.38 | $ 7.00 | $ 5.45 | $ 10.00 |
Income from Investment Operations | | | | |
Net investment income (loss) C | .06 | .04 | .03 | .05 |
Net realized and unrealized gain (loss) | (.31) | 1.39 | 1.55 | (4.60) |
Total from investment operations | (.25) | 1.43 | 1.58 | (4.55) |
Distributions from net investment income | (.04) | (.02) | (.03) | - |
Distributions from net realized gain | (.01) | (.03) | - | - |
Total distributions | (.05) | (.05) | (.03) | - |
Redemption fees added to paid in capital C, H | - | - | - | - |
Net asset value, end of period | $ 8.08 | $ 8.38 | $ 7.00 | $ 5.45 |
Total Return A, B | (3.03)% | 20.47% | 29.22% | (45.50)% |
Ratios to Average Net Assets D, G | | | | |
Expenses before reductions | 2.03% | 2.41% | 2.67% | 3.07% |
Expenses net of fee waivers, if any | 1.70% | 1.75% | 1.75% | 1.75% |
Expenses net of all reductions | 1.68% | 1.73% | 1.73% | 1.73% |
Net investment income (loss) | .67% | .49% | .59% | .55% |
Supplemental Data | | | | |
Net assets, end of period (000 omitted) | $ 2,917 | $ 1,034 | $ 532 | $ 507 |
Portfolio turnover rate E | 68% | 87% | 116% | 115% |
A Total returns would have been lower if certain expenses had not been reduced during the applicable periods shown.
B Total returns do not include the effect of the sales charges.
C Calculated based on average shares outstanding during the period.
D Fees and expenses of any underlying Fidelity Central Funds are not included in the Fund's expense ratio. The Fund indirectly bears its proportionate share of the expenses of any underlying Fidelity Central Funds.
E Amount does not include the portfolio activity of any underlying Fidelity Central Funds.
F For the period November 1, 2007 (commencement of operations) to October 31, 2008.
G Expense ratios reflect operating expenses of the class. Expenses before reductions do not reflect amounts reimbursed by the investment adviser or reductions from brokerage service arrangements or reductions from other expense offset arrangements and do not represent the amount paid by the class during periods when reimbursements or reductions occur. Expense ratios before reductions for start-up periods may not be representative of longer-term operating periods. Expenses net of fee waivers reflect expenses after reimbursement by the investment adviser but prior to reductions from brokerage service arrangements or other expense offset arrangements. Expenses net of all reductions represent the net expenses paid by the class.
H Amount represents less than $.01 per share.
See accompanying notes which are an integral part of the financial statements.
Annual Report
Financial Highlights - Class B
Years ended October 31, | 2011 | 2010 | 2009 | 2008 F |
Selected Per-Share Data | | | | |
Net asset value, beginning of period | $ 8.36 | $ 6.98 | $ 5.42 | $ 10.00 |
Income from Investment Operations | | | | |
Net investment income (loss) C | .01 | - H | .01 | - H |
Net realized and unrealized gain (loss) | (.30) | 1.38 | 1.55 | (4.58) |
Total from investment operations | (.29) | 1.38 | 1.56 | (4.58) |
Distributions from net investment income | (.01) | - | - | - |
Distributions from net realized gain | - H | - | - | - |
Total distributions | (.01) | - | - | - |
Redemption fees added to paid in capital C, H | - | - | - | - |
Net asset value, end of period | $ 8.06 | $ 8.36 | $ 6.98 | $ 5.42 |
Total Return A, B | (3.47)% | 19.77% | 28.78% | (45.80)% |
Ratios to Average Net Assets D, G | | | | |
Expenses before reductions | 2.55% | 2.87% | 3.17% | 3.55% |
Expenses net of fee waivers, if any | 2.20% | 2.25% | 2.25% | 2.25% |
Expenses net of all reductions | 2.18% | 2.23% | 2.23% | 2.23% |
Net investment income (loss) | .17% | (.01)% | .09% | .05% |
Supplemental Data | | | | |
Net assets, end of period (000 omitted) | $ 473 | $ 581 | $ 328 | $ 642 |
Portfolio turnover rate E | 68% | 87% | 116% | 115% |
A Total returns would have been lower if certain expenses had not been reduced during the applicable periods shown.
B Total returns do not include the effect of the contingent deferred sales charge.
C Calculated based on average shares outstanding during the period.
D Fees and expenses of any underlying Fidelity Central Funds are not included in the Fund's expense ratio. The Fund indirectly bears its proportionate share of the expenses of any underlying Fidelity Central Funds.
E Amount does not include the portfolio activity of any underlying Fidelity Central Funds.
F For the period November 1, 2007 (commencement of operations) to October 31, 2008.
G Expense ratios reflect operating expenses of the class. Expenses before reductions do not reflect amounts reimbursed by the investment adviser or reductions from brokerage service arrangements or reductions from other expense offset arrangements and do not represent the amount paid by the class during periods when reimbursements or reductions occur. Expense ratios before reductions for start-up periods may not be representative of longer-term operating periods. Expenses net of fee waivers reflect expenses after reimbursement by the investment adviser but prior to reductions from brokerage service arrangements or other expense offset arrangements. Expenses net of all reductions represent the net expenses paid by the class.
H Amount represents less than $.01 per share.
See accompanying notes which are an integral part of the financial statements.
Annual Report
Financial Highlights - Class C
Years ended October 31, | 2011 | 2010 | 2009 | 2008 F |
Selected Per-Share Data | | | | |
Net asset value, beginning of period | $ 8.34 | $ 6.98 | $ 5.42 | $ 10.00 |
Income from Investment Operations | | | | |
Net investment income (loss) C | .01 | - H | .01 | - H |
Net realized and unrealized gain (loss) | (.31) | 1.38 | 1.55 | (4.58) |
Total from investment operations | (.30) | 1.38 | 1.56 | (4.58) |
Distributions from net investment income | (.01) | - | - | - |
Distributions from net realized gain | (.01) | (.02) | - | - |
Total distributions | (.01) I | (.02) | - | - |
Redemption fees added to paid in capital C, H | - | - | - | - |
Net asset value, end of period | $ 8.03 | $ 8.34 | $ 6.98 | $ 5.42 |
Total Return A, B | (3.57)% | 19.82% | 28.78% | (45.80)% |
Ratios to Average Net Assets D, G | | | | |
Expenses before reductions | 2.52% | 2.89% | 3.21% | 3.52% |
Expenses net of fee waivers, if any | 2.20% | 2.25% | 2.25% | 2.25% |
Expenses net of all reductions | 2.18% | 2.24% | 2.23% | 2.23% |
Net investment income (loss) | .17% | (.01)% | .09% | .05% |
Supplemental Data | | | | |
Net assets, end of period (000 omitted) | $ 2,767 | $ 1,261 | $ 780 | $ 684 |
Portfolio turnover rate E | 68% | 87% | 116% | 115% |
A Total returns would have been lower if certain expenses had not been reduced during the applicable periods shown.
B Total returns do not include the effect of the contingent deferred sales charge.
C Calculated based on average shares outstanding during the period.
D Fees and expenses of any underlying Fidelity Central Funds are not included in the Fund's expense ratio. The Fund indirectly bears its proportionate share of the expenses of any underlying Fidelity Central Funds.
E Amount does not include the portfolio activity of any underlying Fidelity Central Funds.
F For the period November 1, 2007 (commencement of operations) to October 31, 2008.
G Expense ratios reflect operating expenses of the class. Expenses before reductions do not reflect amounts reimbursed by the investment adviser or reductions from brokerage service arrangements or reductions from other expense offset arrangements and do not represent the amount paid by the class during periods when reimbursements or reductions occur. Expense ratios before reductions for start-up periods may not be representative of longer-term operating periods. Expenses net of fee waivers reflect expenses after reimbursement by the investment adviser but prior to reductions from brokerage service arrangements or other expense offset arrangements. Expenses net of all reductions represent the net expenses paid by the class.
H Amount represents less than $.01 per share.
I Total distributions of $.01 per share is comprised of distributions from net investment income of $.008 and distributions from net realized gain of $.005 per share.
See accompanying notes which are an integral part of the financial statements.
Annual Report
Financial Highlights - International Growth
Years ended October 31, | 2011 | 2010 | 2009 | 2008 E |
Selected Per-Share Data | | | | |
Net asset value, beginning of period | $ 8.40 | $ 7.02 | $ 5.48 | $ 10.00 |
Income from Investment Operations | | | | |
Net investment income (loss) B | .10 | .07 | .06 | .09 |
Net realized and unrealized gain (loss) | (.30) | 1.39 | 1.54 | (4.60) |
Total from investment operations | (.20) | 1.46 | 1.60 | (4.51) |
Distributions from net investment income | (.07) | (.06) | (.06) | (.01) |
Distributions from net realized gain | (.01) | (.03) | - | - |
Total distributions | (.08) | (.08) H | (.06) | (.01) |
Redemption fees added to paid in capital B, G | - | - | - | - |
Net asset value, end of period | $ 8.12 | $ 8.40 | $ 7.02 | $ 5.48 |
Total Return A | (2.47)% | 20.97% | 29.77% | (45.17)% |
Ratios to Average Net Assets C, F | | | | |
Expenses before reductions | 1.52% | 1.89% | 2.19% | 2.35% |
Expenses net of fee waivers, if any | 1.20% | 1.25% | 1.25% | 1.25% |
Expenses net of all reductions | 1.18% | 1.23% | 1.23% | 1.23% |
Net investment income (loss) | 1.17% | .99% | 1.09% | 1.05% |
Supplemental Data | | | | |
Net assets, end of period (000 omitted) | $ 53,437 | $ 28,454 | $ 18,254 | $ 11,884 |
Portfolio turnover rate D | 68% | 87% | 116% | 115% |
A Total returns would have been lower if certain expenses had not been reduced during the applicable periods shown.
B Calculated based on average shares outstanding during the period.
C Fees and expenses of any underlying Fidelity Central Funds are not included in the Fund's expense ratio. The Fund indirectly bears its proportionate share of the expenses of any underlying Fidelity Central Funds.
D Amount does not include the portfolio activity of any underlying Fidelity Central Funds.
E For the period November 1, 2007 (commencement of operations) to October 31, 2008.
F Expense ratios reflect operating expenses of the class. Expenses before reductions do not reflect amounts reimbursed by the investment adviser or reductions from brokerage service arrangements or reductions from other expense offset arrangements and do not represent the amount paid by the class during periods when reimbursements or reductions occur. Expense ratios before reductions for start-up periods may not be representative of longer-term operating periods. Expenses net of fee waivers reflect expenses after reimbursement by the investment adviser but prior to reductions from brokerage service arrangements or other expense offset arrangements. Expenses net of all reductions represent the net expenses paid by the class.
G Amount represents less than $.01 per share.
H Total distributions of $.08 per share is comprised of distributions from net investment income of $.057 and distributions from net realized gain of $.025 per share.
See accompanying notes which are an integral part of the financial statements.
Annual Report
Financial Highlights - Institutional Class
Years ended October 31, | 2011 | 2010 | 2009 | 2008 E |
Selected Per-Share Data | | | | |
Net asset value, beginning of period | $ 8.40 | $ 7.02 | $ 5.48 | $ 10.00 |
Income from Investment Operations | | | | |
Net investment income (loss) B | .10 | .07 | .06 | .09 |
Net realized and unrealized gain (loss) | (.30) | 1.39 | 1.54 | (4.60) |
Total from investment operations | (.20) | 1.46 | 1.60 | (4.51) |
Distributions from net investment income | (.07) | (.06) | (.06) | (.01) |
Distributions from net realized gain | (.01) | (.03) | - | - |
Total distributions | (.08) | (.08) H | (.06) | (.01) |
Redemption fees added to paid in capital B, G | - | - | - | - |
Net asset value, end of period | $ 8.12 | $ 8.40 | $ 7.02 | $ 5.48 |
Total Return A | (2.47)% | 20.97% | 29.77% | (45.17)% |
Ratios to Average Net Assets C, F | | | | |
Expenses before reductions | 1.50% | 1.92% | 2.01% | 2.56% |
Expenses net of fee waivers, if any | 1.20% | 1.25% | 1.25% | 1.25% |
Expenses net of all reductions | 1.18% | 1.23% | 1.23% | 1.23% |
Net investment income (loss) | 1.17% | .99% | 1.09% | 1.05% |
Supplemental Data | | | | |
Net assets, end of period (000 omitted) | $ 493 | $ 113 | $ 36 | $ 521 |
Portfolio turnover rate D | 68% | 87% | 116% | 115% |
A Total returns would have been lower if certain expenses had not been reduced during the applicable periods shown.
B Calculated based on average shares outstanding during the period.
C Fees and expenses of any underlying Fidelity Central Funds are not included in the Fund's expense ratio. The Fund indirectly bears its proportionate share of the expenses of any underlying Fidelity Central Funds.
D Amount does not include the portfolio activity of any underlying Fidelity Central Funds.
E For the period November 1, 2007 (commencement of operations) to October 31, 2008.
F Expense ratios reflect operating expenses of the class. Expenses before reductions do not reflect amounts reimbursed by the investment adviser or reductions from brokerage service arrangements or reductions from other expense offset arrangements and do not represent the amount paid by the class during periods when reimbursements or reductions occur. Expense ratios before reductions for start-up periods may not be representative of longer-term operating periods. Expenses net of fee waivers reflect expenses after reimbursement by the investment adviser but prior to reductions from brokerage service arrangements or other expense offset arrangements. Expenses net of all reductions represent the net expenses paid by the class.
G Amount represents less than $.01 per share.
H Total distributions of $.08 per share is comprised of distributions from net investment income of $.057 and distributions from net realized gain of $.025 per share.
See accompanying notes which are an integral part of the financial statements.
Annual Report
Notes to Financial Statements
For the period ended October 31, 2011
1. Organization.
Fidelity International Growth Fund (the Fund) is a fund of Fidelity Investment Trust (the Trust) and is authorized to issue an unlimited number of shares. The Trust is registered under the Investment Company Act of 1940, as amended (the 1940 Act), as an open-end management investment company organized as a Massachusetts business trust. The Fund offers Class A, Class T, Class C, International Growth and Institutional Class shares, each of which, along with Class B shares, has equal rights as to assets and voting privileges. Effective after the close of business on September 1, 2010, Class B shares were closed to new accounts and additional purchases, except for exchanges and reinvestments by existing shareholders. Each class has exclusive voting rights with respect to matters that affect that class. Class B shares will automatically convert to Class A shares after a holding period of seven years from the initial date of purchase. Investment income, realized and unrealized capital gains and losses, the common expenses of the Fund, and certain fund-level expense reductions, if any, are allocated on a pro-rata basis to each class based on the relative net assets of each class to the total net assets of the Fund. Each class differs with respect to transfer agent and distribution and service plan fees incurred. Certain expense reductions may also differ by class. The Fund's investments in emerging markets can be subject to social, economic, regulatory, and political uncertainties and can be extremely volatile.
2. Investments in Fidelity Central Funds.
The Fund invests in Fidelity Central Funds, which are open-end investment companies available only to other investment companies and accounts managed by Fidelity Management & Research Company (FMR) and its affiliates. The Fund's Schedule of Investments lists each of the Fidelity Central Funds held as of period end, if any, as an investment of the Fund, but does not include the underlying holdings of each Fidelity Central Fund. As an Investing Fund, the Fund indirectly bears its proportionate share of the expenses of the underlying Fidelity Central Funds.
The Money Market Central Funds seek preservation of capital and current income and are managed by Fidelity Investments Money Management, Inc. (FIMM), an affiliate of FMR.
A complete unaudited list of holdings for each Fidelity Central Fund is available upon request or at the Securities and Exchange Commission (the SEC) web site at www.sec.gov. In addition, the financial statements of the Fidelity Central Funds, which are not covered by the Fund's Report of Independent Registered Public Accounting Firm, are available on the SEC web site or upon request.
Annual Report
3. Significant Accounting Policies.
The financial statements have been prepared in conformity with accounting principles generally accepted in the United States of America (GAAP), which require management to make certain estimates and assumptions at the date of the financial statements. Actual results could differ from those estimates. Subsequent events, if any, through the date that the financial statements were issued have been evaluated in the preparation of the financial statements. The following summarizes the significant accounting policies of the Fund:
Security Valuation. Investments are valued as of 4:00 p.m. Eastern time on the last calendar day of the period. The Fund uses independent pricing services approved by the Board of Trustees to value its investments. When current market prices or quotations are not readily available or reliable, valuations may be determined in good faith in accordance with procedures adopted by the Board of Trustees. Factors used in determining value may include market or security specific events. The frequency with which these procedures are used cannot be predicted and they may be utilized to a significant extent. The value used for net asset value (NAV) calculation under these procedures may differ from published prices for the same securities.
The Fund categorizes the inputs to valuation techniques used to value its investments into a disclosure hierarchy consisting of three levels as shown below:
Level 1 - quoted prices in active markets for identical investments
Level 2 - other significant observable inputs (including quoted prices for similar investments, interest rates, prepayment speeds, etc.)
Level 3 - unobservable inputs (including the Fund's own assumptions based on the best information available)
Changes in valuation techniques may result in transfers in or out of an assigned level within the disclosure hierarchy. The aggregate value of investments by input level, as of October 31, 2011, is included at the end of the Fund's Schedule of Investments. Valuation techniques used to value the Fund's investments by major category are as follows:
Equity securities, including restricted securities, for which market quotations are readily available, are valued at the last reported sale price or official closing price as reported by an independent pricing service on the primary market or exchange on which they are traded and are categorized as Level 1 in the hierarchy. In the event there were no sales during the day or closing prices are not available, securities are valued at the last quoted bid price or may be valued using the last available price and are generally categorized as Level 2 in the hierarchy. For foreign equity securities, when significant market or security specific events arise, comparisons to the valuation of American Depositary Receipts
Annual Report
Notes to Financial Statements - continued
3. Significant Accounting Policies - continued
Security Valuation - continued
(ADRs), futures contracts, Exchange-traded funds (ETFs) and certain indexes as well as quoted prices for similar securities are used and are categorized as Level 2 in the hierarchy in these circumstances. Utilizing these techniques may result in transfers between Level 1 and Level 2. For restricted equity securities and private placements where observable inputs are limited, assumptions about market activity and risk are used and are categorized as Level 3 in the hierarchy.
Investments in open-end mutual funds, including the Fidelity Central Funds, are valued at their closing net asset value each business day and are categorized as Level 1 in the hierarchy.
Foreign Currency. The Fund may use foreign currency contracts to facilitate transactions in foreign-denominated securities. Gains and losses from these transactions may arise from changes in the value of the foreign currency or if the counterparties do not perform under the contracts' terms.
Foreign-denominated assets, including investment securities, and liabilities are translated into U.S. dollars at the exchange rate at period end. Purchases and sales of investment securities, income and dividends received and expenses denominated in foreign currencies are translated into U.S. dollars at the exchange rate in effect on the transaction date.
The effects of exchange rate fluctuations on investments are included with the net realized and unrealized gain (loss) on investment securities. Other foreign currency transactions resulting in realized and unrealized gain (loss) are disclosed separately.
Investment Transactions and Income. For financial reporting purposes, the Fund's investment holdings and NAV include trades executed through the end of the last business day of the period. The NAV per share for processing shareholder transactions is calculated as of the close of business of the New York Stock Exchange (NYSE), normally 4:00 p.m. Eastern time and includes trades executed through the end of the prior business day. Gains and losses on securities sold are determined on the basis of identified cost. Dividend income is recorded on the ex-dividend date, except for certain dividends from foreign securities where the ex-dividend date may have passed, which are recorded as soon as the Fund is informed of the ex-dividend date. Non-cash dividends included in dividend income, if any, are recorded at the fair market value of the securities received. Distributions received on securities that represent a return of capital or capital gain are recorded as a reduction of cost of investments and/or as a realized gain. The Fund estimates the components of distributions received that may be considered return of
Annual Report
3. Significant Accounting Policies - continued
Investment Transactions and Income - continued
capital distributions or capital gain distributions. Interest income and distributions from the Fidelity Central Funds are accrued as earned. Interest income includes coupon interest and amortization of premium and accretion of discount on debt securities. Investment income is recorded net of foreign taxes withheld where recovery of such taxes is uncertain.
Expenses. Expenses directly attributable to a fund are charged to that fund. Expenses attributable to more than one fund are allocated among the respective funds on the basis of relative net assets or other appropriate methods. Expense estimates are accrued in the period to which they relate and adjustments are made when actual amounts are known.
Income Tax Information and Distributions to Shareholders. Each year, the Fund intends to qualify as a regulated investment company, including distributing substantially all of its taxable income and realized gains under Subchapter M of the Internal Revenue Code and filing its U.S. federal tax return. As a result, no provision for income taxes is required. As of October 31, 2011, the Fund did not have any unrecognized tax benefits in the financial statements. A fund's federal tax return is subject to examination by the Internal Revenue Service (IRS) for a period of three years. Foreign taxes are provided for based on the Fund's understanding of the tax rules and rates that exist in the foreign markets in which it invests.
Distributions are declared and recorded on the ex-dividend date. Income dividends and capital gain distributions are declared separately for each class. Income and capital gain distributions are determined in accordance with income tax regulations, which may differ from GAAP.
Capital accounts within the financial statements are adjusted for permanent book-tax differences. These adjustments have no impact on net assets or the results of operations. Temporary book-tax differences will reverse in a subsequent period.
Book-tax differences are primarily due to foreign currency transactions, passive foreign investment companies (PFIC), partnerships, capital loss carryforwards and losses deferred due to wash sales.
The federal tax cost of investment securities and unrealized appreciation (depreciation) as of period end were as follows:
Gross unrealized appreciation | $ 4,011,207 |
Gross unrealized depreciation | (5,680,632) |
Net unrealized appreciation (depreciation) on securities and other investments | $ (1,669,425) |
| |
Tax Cost | $ 73,974,165 |
Annual Report
Notes to Financial Statements - continued
3. Significant Accounting Policies - continued
Income Tax Information and Distributions to Shareholders - continued
The tax-based components of distributable earnings as of period end were as follows:
Undistributed ordinary income | $ 623,318 |
Capital loss carryforward | $ (4,617,271) |
Net unrealized appreciation (depreciation) | $ (1,668,413) |
Under the recently enacted Regulated Investment Company Modernization Act of 2010 (the Act), the Fund will be permitted to carry forward capital losses incurred in taxable years beginning after December 22, 2010 for an unlimited period. However, any losses incurred during those future taxable years will be required to be utilized prior to any losses incurred in pre-enactment taxable years, which generally expire after eight years from when they are incurred. Additionally, post-enactment capital losses that are carried forward will retain their character as either short-term or long-term capital losses rather than being considered all short-term as under previous law. The Fund's first fiscal year end subject to the Act will be October 31 2012.
The tax character of distributions paid was as follows:
| October 31, 2011 | October 31, 2010 |
Ordinary Income | $ 324,699 | $ 245,729 |
Short-Term Trading (Redemption) Fees. Shares held by investors in the Fund less than 30 days are subject to a redemption fee equal to 1.00% of the net asset value of shares redeemed. All redemption fees, which reduce the proceeds of the shareholder redemption, are retained by the Fund and accounted for as an addition to paid in capital.
New Accounting Pronouncement. In May 2011, the Financial Accounting Standards Board issued Accounting Standard Update No. 2011-04, Fair Value Measurement (Topic 820) - Amendments to Achieve Common Fair Value Measurement and Disclosure Requirements in U.S. GAAP and IFRSs. The update changes the wording used to describe the requirements in GAAP for measuring fair value and for disclosing information about fair value measurements. The update is effective during interim and annual periods beginning after December 15, 2011. Management is currently evaluating the impact of the update's adoption on the Fund's financial statement disclosures.
4. Purchases and Sales of Investments.
Purchases and sales of securities, other than short-term securities, aggregated $72,616,731 and $38,664,366, respectively.
Annual Report
5. Fees and Other Transactions with Affiliates.
Management Fee. FMR and its affiliates provide the Fund with investment management related services for which the Fund pays a monthly management fee. The management fee is the sum of an individual fund fee rate that is based on an annual rate of .45% of the Fund's average net assets and a group fee rate that averaged .26% during the period. The group fee rate is based upon the average net assets of all the mutual funds advised by FMR. The group fee rate decreases as assets under management increase and increases as assets under management decrease. In addition, the management fee is subject to a performance adjustment (up to a maximum of ± .20% of the Fund's average net assets over a 36 month performance period). The upward or downward adjustment to the management fee is based on the relative investment performance of International Growth as compared to an appropriate benchmark index. The Fund's performance adjustment took effect in November 2008. Subsequent months will be added until the performance period includes 36 months. For the period, the total annual management fee rate, including the performance adjustment, was .80% of the Fund's average net assets.
Distribution and Service Plan Fees. In accordance with Rule 12b-1 of the 1940 Act, the Fund has adopted separate Distribution and Service Plans for each class of shares. Certain classes pay Fidelity Distributors Corporation (FDC), an affiliate of FMR, separate Distribution and Service Fees, each of which is based on an annual percentage of each class' average net assets. In addition, FDC may pay financial intermediaries for selling shares of the Fund and providing shareholder support services. For the period, the Distribution and Service Fee rates, total fees and amounts retained by FDC were as follows:
| Distribution
Fee | Service
Fee | Total
Fees | Retained
by FDC |
Class A | -% | .25% | $ 12,491 | $ 190 |
Class T | .25% | .25% | 10,239 | 1 |
Class B | .75% | .25% | 5,882 | 4,518 |
Class C | .75% | .25% | 22,521 | 7,930 |
| | | $ 51,133 | $ 12,639 |
Sales Load. FDC may receive a front-end sales charge of up to 5.75% for selling Class A shares, and 3.50% for selling Class T shares, some of which is paid to financial intermediaries for selling shares of the Fund. Depending on the holding period, FDC may receive contingent deferred sales charges levied on Class A, Class T, Class B, and Class C redemptions. The deferred sales charges range from 5% to 1% for Class B, 1% for Class C, 1.00% for certain purchases of Class A shares and .25% for certain purchases of Class T shares.
Annual Report
Notes to Financial Statements - continued
5. Fees and Other Transactions with Affiliates - continued
Sales Load - continued
For the period, sales charge amounts retained by FDC were as follows:
| Retained
by FDC |
Class A | $ 7,797 |
Class T | 1,892 |
Class B* | 695 |
Class C* | 351 |
| $ 10,735 |
* When Class B and Class C shares are initially sold, FDC pays commissions from its own resources to financial intermediaries through which the sales are made.
Transfer Agent Fees. Fidelity Investments Institutional Operations Company, Inc. (FIIOC), an affiliate of FMR, is the transfer, dividend disbursing and shareholder servicing agent for each class of the Fund. FIIOC receives account fees and asset-based fees that vary according to the account size and type of account of the shareholders of the respective classes of the Fund. FIIOC pays for typesetting, printing and mailing of shareholder reports, except proxy statements. For the period, transfer agent fees for each class were as follows:
| Amount | % of
Average
Net Assets |
Class A | $ 15,298 | .31 |
Class T | 6,766 | .33 |
Class B | 1,802 | .31 |
Class C | 6,897 | .31 |
International Growth | 144,927 | .30 |
Institutional Class | 1,324 | .29 |
| $ 177,014 | |
Accounting and Security Lending Fees. Fidelity Service Company, Inc. (FSC), an affiliate of FMR, maintains the Fund's accounting records. The accounting fee is based on the level of average net assets for the month. Under a separate contract, FSC administers the security lending program. The security lending fee is based on the number and duration of lending transactions.
Brokerage Commissions. The Fund placed a portion of its portfolio transactions with brokerage firms which are affiliates of the investment adviser. The commissions paid to these affiliated firms were $670 for the period.
Annual Report
6. Committed Line of Credit.
The Fund participates with other funds managed by FMR or an affiliate in a $4.0 billion credit facility (the "line of credit") to be utilized for temporary or emergency purposes to fund shareholder redemptions or for other short-term liquidity purposes. The Fund has agreed to pay commitment fees on its pro-rata portion of the line of credit, which amounted to $165 and is reflected in Miscellaneous expenses on the Statement of Operations. During the period, there were no borrowings on this line of credit.
7. Security Lending.
The Fund lends portfolio securities through a lending agent from time to time in order to earn additional income. For equity securities, a lending agent is used and may loan securities to certain qualified borrowers, including Fidelity Capital Markets (FCM), a broker-dealer affiliated with the Fund. On the settlement date of the loan, the Fund receives collateral (in the form of U.S. Treasury obligations, letters of credit and/or cash) against the loaned securities and maintains collateral in an amount not less than 100% of the market value of the loaned securities during the period of the loan. The market value of the loaned securities is determined at the close of business of the Fund and any additional required collateral is delivered to the Fund on the next business day. If the borrower defaults on its obligation to return the securities loaned because of insolvency or other reasons, a fund could experience delays and costs in recovering the securities loaned or in gaining access to the collateral. Any cash collateral received is invested in the Fidelity Securities Lending Cash Central Fund. The value of loaned securities and cash collateral at period end are disclosed on the Fund's Statement of Assets and Liabilities. Security lending income represents the income earned on investing cash collateral, less rebates paid to borrowers and any lending agent fees associated with the loan, plus any premium payments received for lending certain types of securities. Security lending income is presented in the Statement of Operations as a component of income from Fidelity Central Funds. Total security lending income during the period amounted to $30,491. During the period, there were no securities loaned to FCM.
8. Expense Reductions.
FMR contractually agreed to reimburse each class to the extent annual operating expenses exceeded certain levels of average net assets as noted in the table below. This reimbursement will remain in place through December 31, 2012. Some expenses, for example interest expense, including commitment fees, are excluded from this reimbursement.
Annual Report
Notes to Financial Statements - continued
8. Expense Reductions - continued
The following classes were in reimbursement during the period:
| Expense
Limitations | Reimbursement
from adviser |
| | |
Class A | 1.45% | $ 15,994 |
Class T | 1.70% | 6,877 |
Class B | 2.20% | 2,026 |
Class C | 2.20% | 7,234 |
International Growth | 1.20% | 151,732 |
Institutional Class | 1.20% | 1,375 |
| | $ 185,238 |
In addition, FMR voluntarily agreed to reimburse a portion of its management fee. For the period, the amount of this reimbursement was $286.
Many of the brokers with whom FMR places trades on behalf of the Fund provided services to the Fund in addition to trade execution. These services included payments of certain expenses on behalf of the Fund totaling $9,776 for the period. In addition, through arrangements with the Fund's custodian, credits realized as a result of uninvested cash balances were used to reduce the Fund's expenses. During the period, these credits reduced the Fund's custody expenses by $114.
9. Distributions to Shareholders.
Distributions to shareholders of each class were as follows:
Years ended October 31, | 2011 | 2010 |
From net investment income | | |
Class A | $ 19,878 | $ 10,514 |
Class T | 5,087 | 1,819 |
Class B | 545 | - |
Class C | 1,547 | - |
International Growth | 247,117 | 154,599 |
Institutional Class | 2,184 | 287 |
Total | $ 276,358 | $ 167,219 |
From net realized gain | | |
Class A | $ 4,255 | $ 5,713 |
Class T | 1,455 | 2,067 |
Class B | 211 | - |
Class C | 826 | 2,797 |
International Growth | 41,245 | 67,807 |
Institutional Class | 349 | 126 |
Total | $ 48,341 | $ 78,510 |
Annual Report
10. Share Transactions.
Transactions for each class of shares were as follows:
| Shares | Dollars |
Years ended October 31, | 2011 | 2010 | 2011 | 2010 |
Class A | | | | |
Shares sold | 547,911 | 247,866 | $ 4,762,829 | $ 1,869,390 |
Reinvestment of distributions | 2,679 | 2,011 | 22,867 | 14,999 |
Shares redeemed | (133,581) | (88,980) | (1,142,023) | (650,197) |
Net increase (decrease) | 417,009 | 160,897 | $ 3,643,673 | $ 1,234,192 |
Class T | | | | |
Shares sold | 292,221 | 73,695 | $ 2,542,402 | $ 554,529 |
Reinvestment of distributions | 762 | 513 | 6,516 | 3,840 |
Shares redeemed | (55,432) | (26,780) | (470,382) | (194,364) |
Net increase (decrease) | 237,551 | 47,428 | $ 2,078,536 | $ 364,005 |
Class B | | | | |
Shares sold | 22,762 | 37,806 | $ 193,446 | $ 276,981 |
Reinvestment of distributions | 78 | - | 670 | - |
Shares redeemed | (33,639) | (15,339) | (282,311) | (113,063) |
Net increase (decrease) | (10,799) | 22,467 | $ (88,195) | $ 163,918 |
Class C | | | | |
Shares sold | 258,483 | 110,505 | $ 2,202,762 | $ 831,229 |
Reinvestment of distributions | 274 | 369 | 2,357 | 2,760 |
Shares redeemed | (65,559) | (71,336) | (555,739) | (504,821) |
Net increase (decrease) | 193,198 | 39,538 | $ 1,649,380 | $ 329,168 |
International Growth | | | | |
Shares sold | 5,799,026 | 1,971,246 | $ 50,047,832 | $ 14,829,454 |
Reinvestment of distributions | 33,184 | 28,518 | 283,553 | 212,744 |
Shares redeemed | (2,639,092) | (1,213,664) | (22,190,157) | (8,965,012) |
Net increase (decrease) | 3,193,118 | 786,100 | $ 28,141,228 | $ 6,077,186 |
Institutional Class | | | | |
Shares sold | 76,126 | 11,311 | $ 670,433 | $ 86,413 |
Reinvestment of distributions | 292 | 55 | 2,491 | 412 |
Shares redeemed | (29,187) | (3,097) | (256,318) | (23,304) |
Net increase (decrease) | 47,231 | 8,269 | $ 416,606 | $ 63,521 |
11. Other.
The Fund's organizational documents provide former and current trustees and officers with a limited indemnification against liabilities arising in connection with the performance of their duties to the Fund. In the normal course of business, the Fund may also enter into contracts that provide general indemnifications. The Fund's maximum exposure under these arrangements is unknown as this would be dependent on future claims that may be made against the Fund. The risk of material loss from such claims is considered remote.
Annual Report
To the Trustees of Fidelity Investment Trust and the Shareholders of Fidelity International Growth Fund:
In our opinion, the accompanying statement of assets and liabilities, including the schedule of investments, and the related statements of operations and of changes in net assets and the financial highlights present fairly, in all material respects, the financial position of Fidelity International Growth Fund (a fund of Fidelity Investment Trust) at October 31, 2011, the results of its operations for the year then ended, the changes in its net assets for each of the two years in the period then ended and the financial highlights for each of the periods indicated, in conformity with accounting principles generally accepted in the United States of America. These financial statements and financial highlights (hereafter referred to as "financial statements") are the responsibility of the Fidelity International Growth Fund's management. Our responsibility is to express an opinion on these financial statements based on our audits. We conducted our audits of these financial statements in accordance with the standards of the Public Company Accounting Oversight Board (United States). Those standards require that we plan and perform the audit to obtain reasonable assurance about whether the financial statements are free of material misstatement. An audit includes examining, on a test basis, evidence supporting the amounts and disclosures in the financial statements, assessing the accounting principles used and significant estimates made by management, and evaluating the overall financial statement presentation. We believe that our audits, which included confirmation of securities at October 31, 2011 by correspondence with the custodian and brokers, provide a reasonable basis for our opinion.
PricewaterhouseCoopers LLP
Boston, Massachusetts
December 9, 2011
Annual Report
The Trustees, Members of the Advisory Board, and executive officers of the trust and funds, as applicable, are listed below. The Board of Trustees governs each fund and is responsible for protecting the interests of shareholders. The Trustees are experienced executives who meet periodically throughout the year to oversee each fund's activities, review contractual arrangements with companies that provide services to each fund, oversee management of the risks associated with such activities and contractual arrangements, and review each fund's performance. Except for James C. Curvey, each of the Trustees oversees 226 funds advised by FMR or an affiliate. Mr. Curvey oversees 429 funds advised by FMR or an affiliate.
The Trustees hold office without limit in time except that (a) any Trustee may resign; (b) any Trustee may be removed by written instrument, signed by at least two-thirds of the number of Trustees prior to such removal; (c) any Trustee who requests to be retired or who has become incapacitated by illness or injury may be retired by written instrument signed by a majority of the other Trustees; and (d) any Trustee may be removed at any special meeting of shareholders by a two-thirds vote of the outstanding voting securities of the trust. Each Trustee who is not an interested person (as defined in the 1940 Act) (Independent Trustee), shall retire not later than the last day of the calendar year in which his or her 75th birthday occurs. The Independent Trustees may waive this mandatory retirement age policy with respect to individual Trustees. The executive officers and Advisory Board Members hold office without limit in time, except that any officer and Advisory Board Member may resign or may be removed by a vote of a majority of the Trustees at any regular meeting or any special meeting of the Trustees. Except as indicated, each individual has held the office shown or other offices in the same company for the past five years.
Experience, Skills, Attributes, and Qualifications of the Funds' Trustees. The Governance and Nominating Committee has adopted a statement of policy that describes the experience, qualifications, attributes, and skills that are necessary and desirable for potential Independent Trustee candidates (Statement of Policy). The Board believes that each Trustee satisfied at the time he or she was initially elected or appointed a Trustee, and continues to satisfy, the standards contemplated by the Statement of Policy. The Governance and Nominating Committee also engages professional search firms to help identify potential Independent Trustee candidates who have the experience, qualifications, attributes, and skills consistent with the Statement of Policy. From time to time, additional criteria based on the composition and skills of the current Independent Trustees, as well as experience or skills that may be appropriate in light of future changes to board composition, business conditions, and regulatory or other developments, have also been considered by the professional search firms and the Governance and Nominating Committee. In addition, the Board takes into account the Trustees' commitment and participation in Board and committee meetings, as well as their leadership of standing and ad hoc committees throughout their tenure.
In determining that a particular Trustee was and continues to be qualified to serve as a Trustee, the Board has considered a variety of criteria, none of which, in isolation, was controlling. The Board believes that, collectively, the Trustees have balanced and diverse experience, qualifications, attributes, and skills, which allow the Board to operate effectively in governing each fund and protecting the interests of shareholders. Information about the specific experience, skills, attributes, and qualifications of each Trustee, which in each case led to the Board's conclusion that the Trustee should serve (or continue to serve) as a trustee of the funds, is provided below.
Annual Report
Trustees and Officers - continued
Board Structure and Oversight Function. James C. Curvey is an interested person (as defined in the 1940 Act) and currently serves as Acting Chairman. The Trustees have determined that an interested Chairman is appropriate and benefits shareholders because an interested Chairman has a personal and professional stake in the quality and continuity of services provided to the funds. Independent Trustees exercise their informed business judgment to appoint an individual of their choosing to serve as Chairman, regardless of whether the Trustee happens to be independent or a member of management. The Independent Trustees have determined that they can act independently and effectively without having an Independent Trustee serve as Chairman and that a key structural component for assuring that they are in a position to do so is for the Independent Trustees to constitute a substantial majority for the Board. The Independent Trustees also regularly meet in executive session. Ned C. Lautenbach serves as Chairman of the Independent Trustees and as such (i) acts as a liaison between the Independent Trustees and management with respect to matters important to the Independent Trustees and (ii) with management prepares agendas for Board meetings.
Fidelity funds are overseen by different Boards of Trustees. The funds' Board oversees Fidelity's equity and high income funds and another Board oversees Fidelity's investment-grade bond, money market, and asset allocation funds. The asset allocation funds may invest in Fidelity funds overseen by the funds' Board. The use of separate Boards, each with its own committee structure, allows the Trustees of each group of Fidelity funds to focus on the unique issues of the funds they oversee, including common research, investment, and operational issues. On occasion, the separate Boards establish joint committees to address issues of overlapping consequences for the Fidelity funds overseen by each Board.
The Trustees operate using a system of committees to facilitate the timely and efficient consideration of all matters of importance to the Trustees, each fund, and fund shareholders and to facilitate compliance with legal and regulatory requirements and oversight of the funds' activities and associated risks. The Board, acting through its committees, has charged FMR and its affiliates with (i) identifying events or circumstances the occurrence of which could have demonstrably adverse effects on the funds' business and/or reputation; (ii) implementing processes and controls to lessen the possibility that such events or circumstances occur or to mitigate the effects of such events or circumstances if they do occur; and (iii) creating and maintaining a system designed to evaluate continuously business and market conditions in order to facilitate the identification and implementation processes described in (i) and (ii) above. Because the day-to-day operations and activities of the funds are carried out by or through FMR, its affiliates and other service providers, the funds' exposure to risks is mitigated but not eliminated by the processes overseen by the Trustees. While each of the Board's committees has responsibility for overseeing different aspects of the funds' activities, oversight is exercised primarily through the Operations, Audit, and Compliance Committees. In addition, the Independent Trustees have worked with FMR to enhance the Board's oversight of investment and financial risks, legal and regulatory risks, technology risks, and operational risks, including the development of additional risk reporting to the Board. For example, a working group comprised of Independent Trustees and FMR has worked and continues to work to review the Fidelity funds' valuation-related activities, reporting and risk management. Appropriate personnel, including but not limited to the funds' Chief Compliance Officer (CCO), FMR's internal auditor, the independent accountants, the funds' Treasurer and portfolio management personnel, make periodic reports to the Board's committees, as appropriate, including an annual review of FMR's risk management program for the Fidelity funds. The responsibilities of each standing committee, including their oversight responsibilities, are described further under "Standing Committees of the Funds' Trustees."
Annual Report
The funds' Statement of Additional Information (SAI) includes more information about the Trustees. To request a free copy, call Fidelity at 1-800-544-8544.
Interested Trustees*:
Correspondence intended for each Trustee who is an interested person may be sent to Fidelity Investments, 82 Devonshire Street, Boston, Massachusetts 02109.
Name, Age; Principal Occupations and Other Relevant Experience+ |
James C. Curvey (76) |
| Year of Election or Appointment: 2007 Mr. Curvey is Trustee and Acting Chairman of the Board of Trustees of certain Trusts. Mr. Curvey also serves as Trustee (2007-present) of other investment companies advised by FMR. Mr. Curvey is a Director of Fidelity Investments Money Management, Inc. (2009-present), Director of Fidelity Research & Analysis Co. (2009-present) and Director of FMR and FMR Co., Inc. (2007-present). Mr. Curvey is also Vice Chairman (2007-present) and Director of FMR LLC. In addition, Mr. Curvey serves as an Overseer for the Boston Symphony Orchestra and a member of the Trustees of Villanova University. Previously, Mr. Curvey was the Vice Chairman (2006-2007) and Director (2000-2007) of FMR Corp. |
Ronald P. O'Hanley (54) |
| Year of Election or Appointment: 2011 Mr. O'Hanley is Director of FMR Co., Inc. (2010-present), Director of Fidelity Investments Money Management, Inc. (2010-present), Director of Fidelity Research & Analysis Company (2010-present), President of Fidelity Asset Management and Corporate Services and a member of Fidelity's Executive Committee (2010-present). Previously, Mr. O'Hanley served as President and Chief Executive Officer of BNY Mellon Asset Management (2007-2010). Mr. O'Hanley also served as Vice Chairman of Bank New York Mellon Corp. and a member of that firm's Executive Committee. Prior to the 2007 merger of The Bank of New York and Mellon Financial Corporation, he was Vice Chairman of Mellon Financial Corporation and President and Chief Executive Officer of Mellon Asset Management. He joined Mellon in February 1997. Mr. O'Hanley currently serves as Chairman of the Boston Public Library Foundation Board of Directors and sits on the Board of Directors of Beth Israel Deaconess Medical Center, the Board of Trustees of the Marine Biological Laboratory and the Advisory Board of the Maxwell School of Citizenship and Public Administration at Syracuse University. Mr. O'Hanley also chairs the Council on Asset Management for the Financial Services Roundtable and is a member of the Board of Directors of Institutional Investor's U.S. Institute. |
* Trustees have been determined to be "Interested Trustees" by virtue of, among other things, their affiliation with the trust or various entities under common control with FMR.
+ The information above includes each Trustee's principal occupation during the last five years and other information relating to the experience, attributes, and skills relevant to each Trustee's qualifications to serve as a Trustee, which led to the conclusion that each Trustee should serve as a Trustee for each fund.
Annual Report
Independent Trustees:
Correspondence intended for each Independent Trustee (that is, the Trustees other than the Interested Trustees) may be sent to Fidelity Investments, P.O. Box 55235, Boston, Massachusetts 02205-5235.
Name, Age; Principal Occupations and Other Relevant Experience+ |
Dennis J. Dirks (63) |
| Year of Election or Appointment: 2005 Prior to his retirement in May 2003, Mr. Dirks was Chief Operating Officer and a member of the Board of The Depository Trust & Clearing Corporation (DTCC). He also served as President, Chief Operating Officer, and Board member of The Depository Trust Company (DTC) and President and Board member of the National Securities Clearing Corporation (NSCC). In addition, Mr. Dirks served as Chief Executive Officer and Board member of the Government Securities Clearing Corporation, Chief Executive Officer and Board member of the Mortgage-Backed Securities Clearing Corporation, as a Trustee and a member of the Finance Committee of Manhattan College (2005-2008), and as a Trustee and a member of the Finance Committee of AHRC of Nassau County (2006-2008). Mr. Dirks is a member of the Independent Directors Council (IDC) Governing Council (2010-Present) and Board of Directors for The Brookville Center for Children's Services, Inc. (2009-present). |
Alan J. Lacy (58) |
| Year of Election or Appointment: 2008 Mr. Lacy serves as Senior Adviser (2007-present) of Oak Hill Capital Partners, L.P. (private equity). Mr. Lacy also served as Chief Executive Officer (2000-2005) and Vice Chairman (2005-2006) of Sears Holdings Corporation and Sears, Roebuck and Co. (retail). In addition, Mr. Lacy serves as a member of the Board of Directors of Dave & Buster's, Inc. (restaurant and entertainment complexes, 2010-present), The Hillman Companies, Inc. (hardware wholesalers, 2010-present), and Bristol-Myers Squibb Company (global pharmaceuticals, 2007-present). Mr. Lacy is a member of the Board of Trustees of The National Parks Conservation Association (2006-Present). Previously, Mr. Lacy served as Chairman of the Board of Trustees of the National Parks Conservation Association (2008-2011) and as a member of the Board of Directors for the Western Union Company (global money transfer, 2006-2011). |
Ned C. Lautenbach (67) |
| Year of Election or Appointment: 2000 Mr. Lautenbach is Chairman of the Independent Trustees of the Equity and High Income Funds (2006-present). Mr. Lautenbach currently serves as the Lead Director of the Eaton Corporation Board of Directors (diversified industrial, 1997-present). Mr. Lautenbach is also a member of the Board of Directors of the Philharmonic Center for the Arts in Naples, Florida (1999-present); a member of the Board of Trustees of Fairfield University (2005-present); and a member of the Council on Foreign Relations (1994-present). Previously, Mr. Lautenbach was a Partner/Advisory Partner at Clayton, Dubilier & Rice, LLC (private equity investment, 1998-2010), as well as a Director of Sony Corporation (2006-2007). |
Joseph Mauriello (67) |
| Year of Election or Appointment: 2008 Prior to his retirement in January 2006, Mr. Mauriello served in numerous senior management positions including Deputy Chairman and Chief Operating Officer (2004-2005), and Vice Chairman of Financial Services (2002-2004) of KPMG LLP US (professional services, 1965-2005). Mr. Mauriello currently serves as a member of the Board of Directors of XL Group plc. (global insurance and re-insurance, 2006-present) and of Arcadia Resources Inc. (health care services and products, 2007-present). Previously, Mr. Mauriello served as a Director of the Hamilton Funds of the Bank of New York (2006-2007). |
Robert W. Selander (61) |
| Year of Election or Appointment: 2011 Previously, Mr. Selander served as a Member of the Advisory Board of Fidelity's Equity and High Income Funds (2011), Executive Vice Chairman (2010), Chief Executive Officer (2009-2010), and President and Chief Executive Officer (1997-2009) of Mastercard, Inc. |
Cornelia M. Small (67) |
| Year of Election or Appointment: 2005 Ms. Small is a member of the Board of Directors of the Teagle Foundation (2009-present). Ms. Small is also a member of the Investment Committee, and Chair (2008-present) and a member of the Board of Trustees of Smith College. In addition, Ms. Small serves on the Investment Committee of the Berkshire Taconic Community Foundation (2008-present). Previously, Ms. Small served as Chairperson of the Investment Committee (2002-2008) of Smith College. In addition, Ms. Small served as Chief Investment Officer, Director of Global Equity Investments, and a member of the Board of Directors of Scudder, Stevens & Clark and Scudder Kemper Investments. |
William S. Stavropoulos (72) |
| Year of Election or Appointment: 2001 Mr. Stavropoulos is Vice Chairman of the Independent Trustees of the Equity and High Income Funds (2006-present). Mr. Stavropoulos serves as President and Founder of the Michigan Baseball Foundation, the Great Lakes Loons (2007-present). Mr. Stavropoulos is Chairman Emeritus of the Board of Directors of The Dow Chemical Company, where he previously served in numerous senior management positions, including President, CEO (1995-2000; 2002-2004), Chairman of the Executive Committee (2000-2006), and as a member of the Board of Directors (1990-2006). Currently, Mr. Stavropoulos is Chairman of Univar (global distributor of commodity and specialty chemicals, 2010-present), a Director of Teradata Corporation (data warehousing and technology solutions, 2008-present), Chemical Financial Corporation, Maersk Inc. (industrial conglomerate), Tyco International, Inc. (multinational manufacturing and services, 2007-present), and a member of the Advisory Board for Metalmark Capital (private equity investment, 2005-present). Mr. Stavropoulos is a special advisor to Clayton, Dubilier & Rice, LLC (private equity investment). In addition, Mr. Stavropoulos is a member of the University of Notre Dame Advisory Council for the College of Science. |
David M. Thomas (62) |
| Year of Election or Appointment: 2008 Previously, Mr. Thomas served as Executive Chairman (2005-2006) and Chairman and Chief Executive Officer (2000-2005) of IMS Health, Inc. (pharmaceutical and healthcare information solutions). In addition, Mr. Thomas serves as a member of the Board of Directors of Fortune Brands, Inc. (consumer products), and Interpublic Group of Companies, Inc. (marketing communication, 2004-present). |
Michael E. Wiley (61) |
| Year of Election or Appointment: 2008 Mr. Wiley also serves as a Director of Asia Pacific Exploration Consolidated (international oil and gas exploration and production, 2008-present). Mr. Wiley serves as a Director of Tesoro Corporation (independent oil refiner and marketer, 2005-present), and a Director of Bill Barrett Corporation (exploration and production, 2005-present). In addition, Mr. Wiley also serves as a Director of Post Oak Bank (privately-held bank, 2004-present). Previously, Mr. Wiley served as a member of the Board of Trustees of the University of Tulsa (2000-2006; 2007-2010), as a Senior Energy Advisor of Katzenbach Partners, LLC (consulting, 2006-2007), as an Advisory Director of Riverstone Holdings (private investment), Chairman, President, and CEO of Baker Hughes, Inc. (oilfield services, 2000-2004), and as Director of Spinnaker Exploration Company (exploration and production, 2001-2005). |
Annual Report
Trustees and Officers - continued
+ The information above includes each Trustee's principal occupation during the last five years and other information relating to the experience, attributes, and skills relevant to each Trustee's qualifications to serve as a Trustee, which led to the conclusion that each Trustee should serve as a Trustee for each fund.
Advisory Board Members and Executive Officers:
Correspondence intended for each executive officer, Edward C. Johnson 3d, and Peter S. Lynch, may be sent to Fidelity Investments, 82 Devonshire Street, Boston, Massachusetts 02109.
Name, Age; Principal Occupation |
Edward C. Johnson 3d (81) |
| Year of Election or Appointment: 2011 Member of the Advisory Board of Fidelity's Equity and High Income Funds. Mr. Johnson serves as Chief Executive Officer, Chairman, and a Director of FMR LLC, and also serves as Chairman and Director of FIL Limited. Previously, Mr. Johnson served as a Trustee and Chairman of the Board of certain Fidelity Trusts, Chairman and a Director of FMR, Chairman and a Director of FMR Co., Inc., and President of FMR LLC (2006-2007). |
Peter S. Lynch (67) |
| Year of Election or Appointment: 2003 Member of the Advisory Board of Fidelity's Equity and High Income Funds. Mr. Lynch is Vice Chairman and a Director of FMR and FMR Co., Inc. In addition, Mr. Lynch serves as a Trustee of Boston College and as the Chairman of the Inner-City Scholarship Fund. Previously, Mr. Lynch served on the Special Olympics International Board of Directors (1997-2006). |
Kenneth B. Robins (42) |
| Year of Election or Appointment: 2008 President and Treasurer of Fidelity's Equity and High Income Funds. Mr. Robins also serves as President and Treasurer (2010-present) and Assistant Treasurer (2009-present) of other Fidelity funds and is an employee of Fidelity Investments (2004-present). Previously, Mr. Robins served as Deputy Treasurer of the Fidelity funds (2005-2008) and Treasurer and Chief Financial Officer of The North Carolina Capital Management Trust: Cash and Term Portfolios (2006-2008). |
Bruce T. Herring (46) |
| Year of Election or Appointment: 2006 Vice President of certain Equity Funds. Mr. Herring also serves as Chief Investment Officer and Director of Fidelity Management & Research (U.K.) Inc. (2010-present) and Group Chief Investments Officer of FMR. Previously, Mr. Herring served as Vice President (2005-2006) and Senior Vice President (2006-2007) of Fidelity Management & Research Company, Vice President of FMR Co., Inc. (2001-2007) and as a portfolio manager for Fidelity U.S. Equity Funds. |
Brian B. Hogan (47) |
| Year of Election or Appointment: 2009 Vice President of Equity and High Income Funds. Mr. Hogan also serves as President of FMR's Equity Division (2009-present). Previously, Mr. Hogan served as Senior Vice President, Equity Research of FMR (2006-2009) and as a portfolio manager. |
Scott C. Goebel (43) |
| Year of Election or Appointment: 2008 Secretary and Chief Legal Officer (CLO) of the Fidelity funds. Mr. Goebel also serves as Secretary of Fidelity Investments Money Management, Inc. (FIMM) (2010-present) and Fidelity Research and Analysis Company (FRAC) (2010-present); Secretary and CLO of The North Carolina Capital Management Trust: Cash and Term Portfolios (2008-present); General Counsel, Secretary, and Senior Vice President of FMR (2008-present) and FMR Co., Inc. (2008-present); employed by FMR LLC or an affiliate (2001-present); Chief Legal Officer of Fidelity Management & Research (Hong Kong) Limited (2008-present) and Assistant Secretary of Fidelity Management & Research (Japan) Inc. (2008-present), and Fidelity Management & Research (U.K.) Inc. (2008-present). Previously, Mr. Goebel served as Assistant Secretary of FIMM (2008-2010), FRAC (2008-2010), and the Funds (2007-2008) and as Vice President and Secretary of Fidelity Distributors Corporation (FDC) (2005-2007). |
William C. Coffey (42) |
| Year of Election or Appointment: 2009 Assistant Secretary of Fidelity's Equity and High Income Funds. Mr. Coffey also serves as Senior Vice President and Deputy General Counsel of FMR LLC (2010-present), and is an employee of Fidelity Investments. Previously, Mr. Coffey served as Vice President and Associate General Counsel of FMR LLC (2005-2009). |
Holly C. Laurent (57) |
| Year of Election or Appointment: 2008 Anti-Money Laundering (AML) Officer of the Fidelity funds. Ms. Laurent also serves as AML Officer of The North Carolina Capital Management Trust: Cash and Term Portfolios (2008-present) and is an employee of Fidelity Investments. Previously, Ms. Laurent was Senior Vice President and Head of Legal for Fidelity Business Services India Pvt. Ltd. (2006-2008), and Senior Vice President, Deputy General Counsel and Group Head for FMR LLC (2005-2006). |
Christine Reynolds (53) |
| Year of Election or Appointment: 2008 Chief Financial Officer of the Fidelity funds. Ms. Reynolds became President of Fidelity Pricing and Cash Management Services (FPCMS) in August 2008. Ms. Reynolds served as Chief Operating Officer of FPCMS (2007-2008). Previously, Ms. Reynolds served as President, Treasurer, and Anti-Money Laundering officer of the Fidelity funds (2004-2007). |
Kenneth A. Rathgeber (64) |
| Year of Election or Appointment: 2004 Chief Compliance Officer of Fidelity's Equity and High Income Funds. Mr. Rathgeber is Chief Compliance Officer of Fidelity Management & Research (Hong Kong) Limited (2008-present), Fidelity Management & Research (Japan) Inc. (2008-present), FMR (2005-present), FMR Co., Inc. (2005-present), Fidelity Management & Research (U.K.) Inc. (2005-present), Fidelity Research & Analysis Company (2005-present), Fidelity Investments Money Management, Inc. (2005-present), Pyramis Global Advisors, LLC (2005-present), and Strategic Advisers, Inc. (2005-present). |
Jeffrey S. Christian (50) |
| Year of Election or Appointment: 2009 Deputy Treasurer of the Fidelity funds. Mr. Christian is an employee of Fidelity Investments. Previously, Mr. Christian served as Chief Financial Officer (2008-2009) of certain Fidelity funds and Senior Vice President of Fidelity Pricing and Cash Management Services (FPCMS) (2004-2009). |
Joseph F. Zambello (54) |
| Year of Election or Appointment: 2011 Deputy Treasurer of the Fidelity funds. Mr. Zambello is an employee of Fidelity Investments. Previously, Mr. Zambello served as Vice President of FMR's Program Management Group (2009-2011) and Vice President of the Transfer Agent Oversight Group (2005-2009). |
Adrien E. Deberghes (44) |
| Year of Election or Appointment: 2008 Deputy Treasurer of Fidelity's Equity and High Income Funds. Mr. Deberghes also serves as Vice President and Assistant Treasurer of Fidelity Rutland Square Trust II and Fidelity Commonwealth Trust II (2011-present), Assistant Treasurer of other Fidelity funds (2010-present), and is an employee of Fidelity Investments (2008-present). Previously, Mr. Deberghes served as Senior Vice President of Mutual Fund Administration at State Street Corporation (2007-2008), Senior Director of Mutual Fund Administration at Investors Bank & Trust (2005-2007), and Director of Finance for Dunkin' Brands (2000-2005). |
Stephanie J. Dorsey (42) |
| Year of Election or Appointment: 2010 Assistant Treasurer of Fidelity's Equity and High Income Funds. Ms. Dorsey also serves as Deputy Treasurer of other Fidelity funds (2008-present) and is an employee of Fidelity Investments (2008-present). Previously, Ms. Dorsey served as Treasurer (2004-2008) of the JPMorgan Mutual Funds and Vice President (2004-2008) of JPMorgan Chase Bank. |
John R. Hebble (53) |
| Year of Election or Appointment: 2009 Assistant Treasurer of Fidelity's Equity and High Income Funds. Mr. Hebble also serves as President (2011-present), Treasurer, and Chief Financial Officer of The North Carolina Capital Management Trust: Cash and Term Portfolios (2008-present), President and Treasurer of other Fidelity funds (2008-present) and is an employee of Fidelity Investments. |
Gary W. Ryan (53) |
| Year of Election or Appointment: 2005 Assistant Treasurer of the Fidelity funds. Mr. Ryan is an employee of Fidelity Investments. Previously, Mr. Ryan served as Vice President of Fund Reporting in Fidelity Pricing and Cash Management Services (FPCMS) (1999-2005). |
Jonathan Davis (43) |
| Year of Election or Appointment: 2010 Assistant Treasurer of the Fidelity funds. Mr. Davis is also Assistant Treasurer of Fidelity Rutland Square Trust II and Fidelity Commonwealth Trust II. Mr. Davis is an employee of Fidelity Investments. Previously, Mr. Davis served as Vice President and Associate General Counsel of FMR LLC (2003-2010). |
Annual Report
The Board of Trustees of Fidelity International Growth Fund voted to pay on December 5, 2011, to shareholders of record at the opening of business on December 2, 2011, a distribution of $.006 per share derived from capital gains realized from sales of portfolio securities and a dividend of $.079 per share from net investment income.
The fund designates 100% of the dividends distributed during the fiscal year as amounts which may be taken into account as a dividend for the purposes of the maximum rate under section 1(h)(11) of the Internal Revenue Code.
The amounts per share which represent income derived from sources within, and taxes paid to, foreign countries or possessions of the United States are as follows:
| Pay Date | Income | Taxes |
International Growth Fund | 12/06/2010 | $0.072 | $0.008 |
| 12/31/2010 | $0.008 | $0.000 |
The fund will notify shareholders in January 2012 of amounts for use in preparing 2011 income tax returns.
Annual Report
Board Approval of Investment Advisory Contracts and Management Fees
Fidelity International Growth Fund
Each year, the Board of Trustees, including the Independent Trustees (together, the Board), votes on the renewal of the management contract and sub-advisory agreements (together, the Advisory Contracts) for the fund. The Board, assisted by the advice of fund counsel and Independent Trustees' counsel, requests and considers a broad range of information relevant to the renewal of the Advisory Contracts throughout the year.
The Board meets regularly and considers at each of its meetings factors that are relevant to its annual consideration of the renewal of the fund's Advisory Contracts, including the services and support provided to the fund and its shareholders. The Board has established various standing committees, each composed of Independent Trustees with varying backgrounds, to which the Board has assigned specific subject matter responsibilities in order to enhance effective decision-making by the Board. The Board, acting directly and through its Committees, requests and receives information concerning the annual consideration of the renewal of the fund's Advisory Contracts. The Board also meets as needed to consider matters specifically related to the Board's annual consideration of the renewal of Advisory Contracts. Members of the Board may also meet with trustees of other Fidelity funds through ad hoc joint committees to discuss certain matters relevant to the Fidelity funds.
At its July 2011 meeting, the Board of Trustees, including the Independent Trustees, unanimously determined to renew the fund's Advisory Contracts. In reaching its determination, the Board considered all factors it believed relevant, including (i) the nature, extent, and quality of the services to be provided to the fund and its shareholders (including the investment performance of the fund); (ii) the competitiveness of the fund's management fee and total expense ratio; (iii) the total costs of the services to be provided by and the profits to be realized by Fidelity from its relationship with the fund; (iv) the extent to which economies of scale would be realized as the fund grows; and (v) whether fee levels reflect these economies of scale, if any, for the benefit of fund shareholders.
In considering whether to renew the Advisory Contracts for the fund, the Board reached a determination, with the assistance of fund counsel and Independent Trustees' counsel and through the exercise of its business judgment, that the renewal of the Advisory Contracts is in the best interests of the fund and its shareholders and that the compensation payable under the Advisory Contracts is fair and reasonable. The Board's decision to renew the Advisory Contracts was not based on any single factor, but rather was based on a comprehensive consideration of all the information provided to the Board at its meetings throughout the year. The Board, in reaching its determination to renew the Advisory Contracts, is aware that shareholders in the fund have a broad range of investment choices available to them, including a wide choice among mutual funds offered by Fidelity's competitors, and that the fund's shareholders, who have the opportunity to review and weigh the disclosure provided by the fund in its prospectus and other public disclosures, have chosen to invest in this fund, managed by Fidelity.
Annual Report
Board Approval of Investment Advisory Contracts and
Management Fees - continued
Nature, Extent, and Quality of Services Provided. The Board considered the staffing within the investment adviser, FMR, and the sub-advisers (together, the Investment Advisers), including the backgrounds of the fund's investment personnel and the fund's investment objective and discipline. The Independent Trustees also had discussions with senior management of Fidelity's investment operations and investment groups. The Board considered the structure of the portfolio manager compensation program and whether this structure provides appropriate incentives to act in the best interests of the fund.
Resources Dedicated to Investment Management and Support Services. The Board and the Fund Oversight and Research Committees reviewed the general qualifications and capabilities of the Investment Advisers' investment staff, including its size, education, experience, and resources, as well as the Investment Advisers' approach to recruiting, training, managing, and compensating investment personnel. The Board also noted that FMR has devoted increased resources to non-U.S. offices. The Board noted that Fidelity's analysts have extensive resources, tools and capabilities which allow them to conduct sophisticated quantitative and fundamental analysis, as well as credit analysis of issuers, counterparties and enhancers. The Board also believes that Fidelity's investment professionals have sufficient access to global information and data so as to provide competitive investment results over time, and that those professionals also have access to sophisticated tools which permit them to assess portfolio construction and risk and performance attribution characteristics continuously, as well as to transmit new information and research conclusions rapidly around the world. Additionally, in their deliberations, the Board considered the Investment Advisers' trading capabilities and resources which are an integral part of the investment management process.
Shareholder and Administrative Services. The Board considered (i) the nature, extent, quality, and cost of advisory, administrative, and shareholder services performed by the Investment Advisers and their affiliates under the Advisory Contracts and under separate agreements covering transfer agency, pricing and bookkeeping, and securities lending services for the fund; (ii) the nature and extent of the investment adviser's supervision of third party service providers, principally custodians and subcustodians; and (iii) the resources devoted to, and the record of compliance with, the fund's compliance policies and procedures. The Board also reviewed the allocation of fund brokerage, including allocations to brokers affiliated with the Investment Advisers, the use of brokerage commissions to pay fund expenses, and the use of "soft" commission dollars to pay for research services.
The Board noted that the growth of fund assets over time across the complex allows Fidelity to reinvest in the development of services designed to enhance the value or convenience of the Fidelity funds as investment vehicles. These services include 24-hour access to account information and market information through telephone representatives and over the Internet, investor education materials and asset allocation tools, and the expanded availability of Fidelity Investor Centers, with 35 new branches opening since 2010.
Annual Report
Investment in a Large Fund Family. The Board considered the benefits to shareholders of investing in a Fidelity fund, including the benefits of investing in a fund that is part of a large family of funds offering a variety of investment disciplines and providing a large variety of mutual fund investor services. The Board noted that Fidelity had taken, or had made recommendations that resulted in the Fidelity funds taking, a number of actions over the previous year that benefited particular funds, including (i) continuing to dedicate additional resources to investment research and support of the senior management team that oversees asset management; (ii) rationalizing product lines through the mergers of six funds into other funds; (iii) continuing to migrate the Freedom Funds to dedicated lower cost underlying funds; (iv) obtaining shareholder approval to broaden the investment strategies for Fidelity Consumer Finance Portfolio, Fidelity Emerging Asia Fund, and Fidelity Environment and Alternative Energy Portfolio; (v) contractually agreeing to reduce the management fees and impose other expense limitations on Spartan 500 Index Fund and U.S. Bond Index Fund in connection with launching new institutional classes of these funds; (vi) changing the name, primary and supplemental benchmarks, and investment policies of Fidelity Global Strategies Fund to support the fund's flexible investment mandate and global orientation; and (vii) reducing the transfer agency account fee rates on certain accounts.
Investment Performance. The Board considered whether the fund has operated in accordance with its investment objective, as well as its record of compliance with its investment restrictions. It also reviewed the fund's absolute investment performance for each class, as well as the fund's relative investment performance for each class measured over multiple periods against (i) a broad-based securities market index, and (ii) a custom peer group of mutual funds deemed appropriate by Fidelity and reviewed by the Board. Because the fund had been in existence less than five calendar years, the following charts, considered by the Board show, over the one- and three-year periods ended December 31, 2010, the cumulative total returns of the retail class and Class C of the fund, the cumulative total returns of a broad-based securities market index ("benchmark"), and a range of cumulative total returns of a custom peer group of mutual funds defined by FMR based on categories assigned by Morningstar, Inc. The returns of the retail class and Class C show the performance of the highest and lowest performing classes, respectively (based on three-year performance). The box within each chart shows the 25th percentile return (bottom of box) and the 75th percentile return (top of box) of the peer group. Returns shown above the box are in the first quartile and returns shown below the box are in the fourth quartile. The percentage beaten numbers noted below each chart correspond to the percentile box and represent the percentage of funds in the peer group whose performance was equal to or lower than that of the class indicated. The fund's custom peer group, defined by FMR, is a peer group that FMR believes provides a more meaningful performance comparison than the peer group assigned by Morningstar, Inc., which assigns mutual funds to categories based on their investment styles as measured by their underlying portfolio holdings.
Annual Report
Board Approval of Investment Advisory Contracts and
Management Fees - continued
Fidelity International Growth Fund
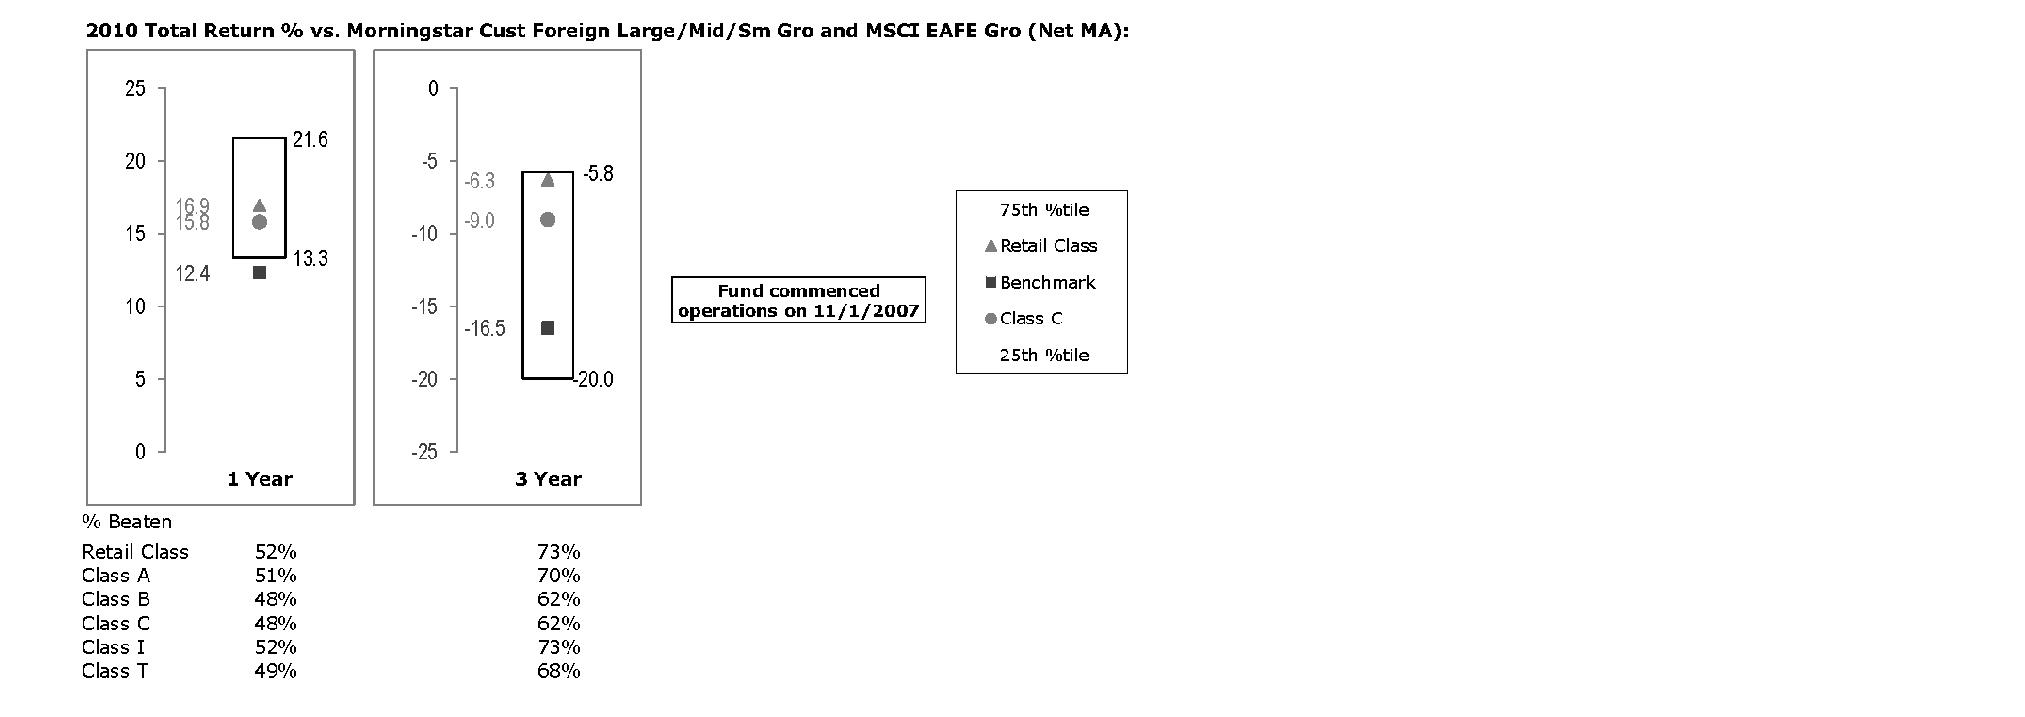
The Board reviewed the fund's relative investment performance against its peer group and noted that the performance of the retail class of the fund was in the second quartile for all the periods shown. The Board also noted that the investment performance of the retail class of the fund compared favorably to its benchmark for all the periods shown. The Board considered that the variations in performance among the fund's classes reflect the variations in class expenses, which result in lower performance for higher expense classes. The Board also reviewed the fund's performance since inception as well as performance in the current year.
The Board also considered that the fund's management fee is subject to upward or downward adjustment depending upon whether, and to what extent, the fund's investment performance for the performance period exceeds, or is exceeded by, the record (over the same period) of a Board-approved performance adjustment index. The Board noted that the performance adjustment provides FMR with a strong economic incentive to seek to achieve superior performance for the fund's shareholders and helps to more closely align the interests of FMR and the fund's shareholders.
Annual Report
Based on its review, the Board concluded that the nature, extent, and quality of services provided to the fund under the Advisory Contracts should benefit the fund's shareholders.
Competitiveness of Management Fee and Total Expense Ratio. The Board considered the fund's management fee and total expense ratio compared to "mapped groups" of competitive funds and classes. Fidelity creates "mapped groups" by combining similar Lipper investment objective categories that have comparable management fee characteristics. Combining Lipper investment objective categories aids the Board's management fee and total expense ratio comparisons by broadening the competitive group used for comparison and by reducing the number of universes to which various Fidelity funds are compared.
Management Fee. The Board considered two proprietary management fee comparisons for the 12-month (or shorter) periods shown in the chart below. The group of Lipper funds used by the Board for management fee comparisons is referred to below as the "Total Mapped Group." The Total Mapped Group comparison focuses on a fund's standing relative to the total universe of comparable funds available to investors in terms of gross management fees before expense reimbursements or caps, and without giving effect to the fund's performance adjustment. "TMG %" represents the percentage of funds in the Total Mapped Group that had management fees that were lower than the fund's. For example, a TMG % of 16% means that 84% of the funds in the Total Mapped Group had higher management fees than the fund. The "Asset-Size Peer Group" (ASPG) comparison focuses on a fund's standing relative to non-Fidelity funds similar in size to the fund within the Total Mapped Group. The ASPG represents at least 15% of the funds in the Total Mapped Group with comparable asset size and management fee characteristics, subject to a minimum of 50 funds (or all funds in the Total Mapped Group if fewer than 50). Additional information, such as the ASPG quartile in which the fund's management fee ranked and the impact of the fund's performance adjustment, is also included in the chart and considered by the Board.
Annual Report
Board Approval of Investment Advisory Contracts and
Management Fees - continued
Fidelity International Growth Fund
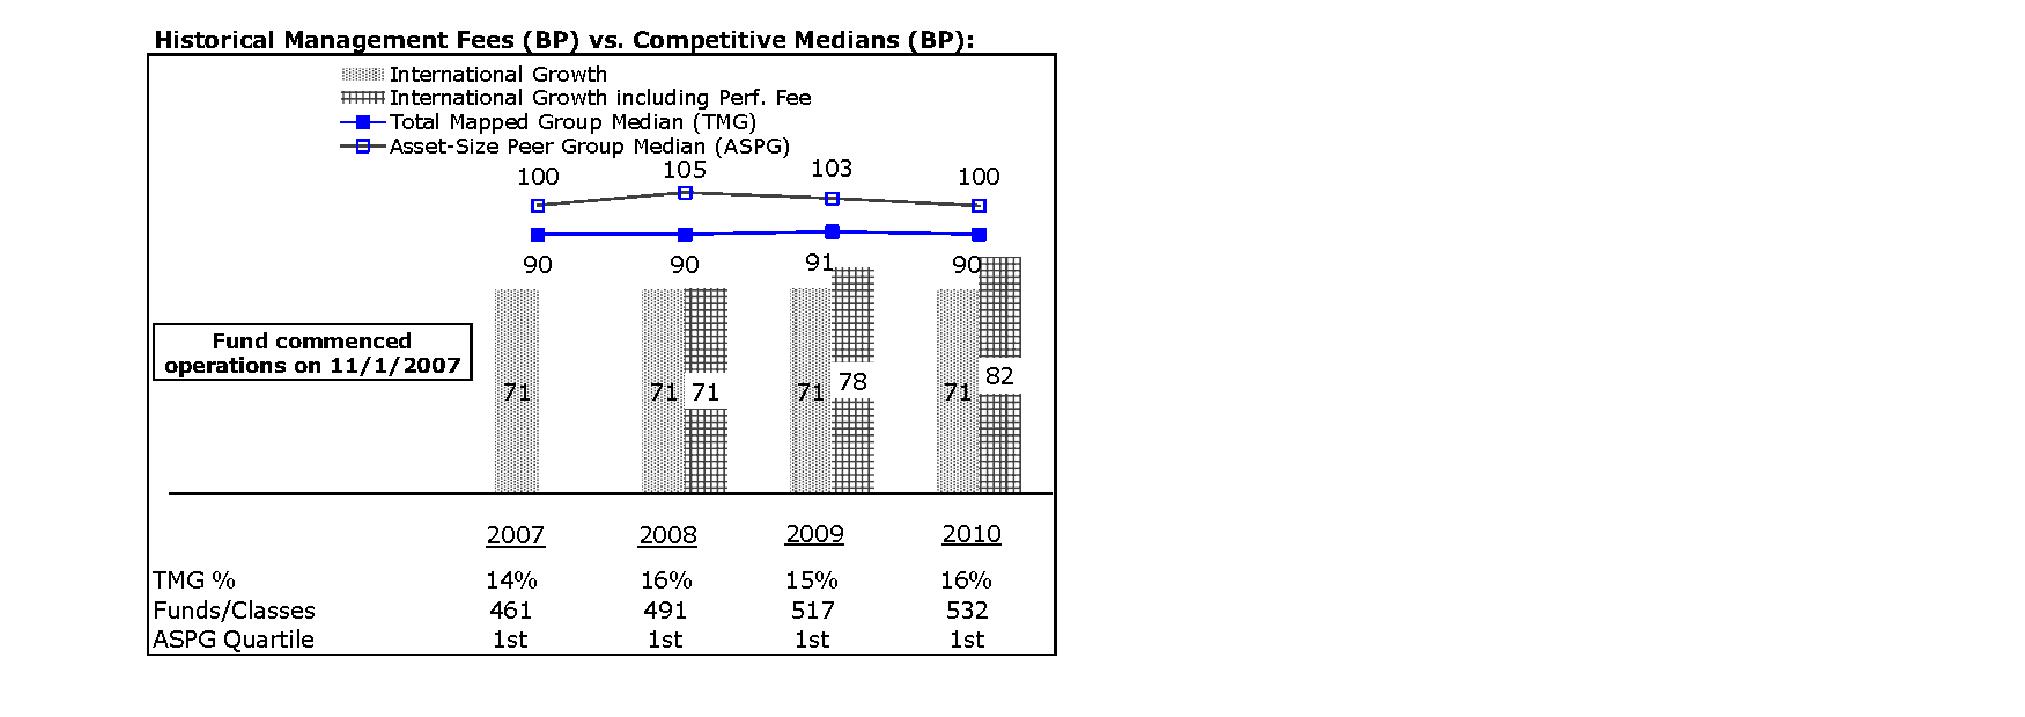
The Board noted that the fund's management fee ranked below the median of its Total Mapped Group and below the median of its ASPG for 2010. The Board also noted the effect of the fund's positive performance adjustment on the fund's management fee ranking. The Board noted that the performance adjustment for each year represents calculations for performance periods that differ from the periods shown in the performance charts above.
Based on its review, the Board concluded that the fund's management fee is fair and reasonable in light of the services that the fund receives and the other factors considered.
Total Expense Ratio. In its review of each class's total expense ratio, the Board considered the fund's management fee as well as other fund or class expenses, as applicable, such as transfer agent fees, pricing and bookkeeping fees, fund-paid 12b-1 fees, and custodial, legal, and audit fees. The Board also noted the effects of any waivers and reimbursements on fees and expenses, as well as the impact of the fund's performance adjustment. As part of its review, the Board also considered the current and historical total expense ratios of each class of the fund compared to competitive fund median expenses. Each class of the fund is compared to those funds and classes in the Total Mapped Group (used by the Board for management fee comparisons) that have a similar sales load structure.
The Board noted that the total expense ratio of each of Class A, Class B, and the retail class ranked below its competitive median for 2010, the total expense ratio of Class C ranked equal to its competitive median for 2010, and the total expense ratio of each of Class T and Institutional Class ranked above its competitive median for 2010. The Board considered that various factors, including 12b-1 fees, positive or negative performance adjustments, and relatively higher other expenses in the case of small fund size, can affect total expense ratios. The Board noted that the total expense ratio of Class T was above the competitive median primarily because of higher 12b-1 fees on Class T. Class T has a higher 12b-1 fee, but a lower front-end sales charge, than traditionally priced front-end sales charge classes. The Board noted that the fund offers multiple classes, each of which has a different sales load and 12b-1 fee structure, and that the multiple structures are intended to offer a range of pricing options for the intermediary market. The Board also noted that the total expense ratios of the classes vary primarily by the level of their 12b-1 fees, although differences in transfer agent fees may also cause expenses to vary from class to class.
Annual Report
Fees Charged to Other Fidelity Clients. The Board also considered Fidelity fee structures and other information with respect to clients of FMR and its affiliates, such as other mutual funds advised or subadvised by FMR or its affiliates, pension plan clients, and other institutional clients. In March 2010, the Board created an ad hoc joint committee with the board of other Fidelity funds (the Committee) to review and compare Fidelity's institutional investment advisory business with its business of providing services to the Fidelity funds, including the differences in services provided, fees charged, and costs incurred, as well as competition in their respective marketplaces.
Based on its review of total expense ratios and fees charged to other Fidelity clients, the Board concluded that the total expense ratio of each class of the fund was reasonable, although in some cases above the median of the universe presented for comparison, in light of the services that the fund and its shareholders receive and the other factors considered, including the findings of the Committee.
Costs of the Services and Profitability. The Board considered the revenues earned and the expenses incurred by Fidelity in conducting the business of developing, marketing, distributing, managing, administering and servicing the fund and its shareholders. The Board also considered the level of Fidelity's profits in respect of all the Fidelity funds.
On an annual basis, FMR presents to the Board Fidelity's profitability for the fund. Fidelity calculates the profitability for each fund, as well as aggregate profitability for groups of Fidelity funds and all Fidelity funds, using a series of detailed revenue and cost allocation methodologies which originate with the books and records of Fidelity on which Fidelity's audited financial statements are based. The Audit Committee of the Board reviews any significant changes from the prior year's methodologies.
PricewaterhouseCoopers LLP (PwC), independent registered public accounting firm and auditor to Fidelity and certain Fidelity funds, has been engaged annually by the Board as part of the Board's assessment of Fidelity's profitability analysis. PwC's engagement includes the review and assessment of Fidelity's methodologies used in determining the revenues and expenses attributable to Fidelity's mutual fund business, and completion of agreed-upon procedures surrounding the mathematical accuracy of fund profitability and its conformity to allocation methodologies. After considering PwC's reports issued under the engagement and information provided by Fidelity, the Board concluded that while other allocation methods may also be reasonable, Fidelity's profitability methodologies are reasonable in all material respects.
Annual Report
Board Approval of Investment Advisory Contracts and
Management Fees - continued
The Board also reviewed Fidelity's non-fund businesses and fall-out benefits related to the mutual fund business as well as cases where Fidelity's affiliates may benefit from or be related to the fund's business.
The Board considered the costs of the services provided by and the profits realized by Fidelity in connection with the operation of the fund and was satisfied that the profitability was not excessive in the circumstances.
Economies of Scale. The Board considered whether there have been economies of scale in respect of the management of the Fidelity funds, whether the Fidelity funds (including the fund) have appropriately benefited from any such economies of scale, and whether there is potential for realization of any further economies of scale. The Board considered the extent to which the fund will benefit from economies of scale through increased services to the fund, through waivers or reimbursements, or through fee or expense reductions. The Board also noted that in 2009, it and the board of other Fidelity funds created an ad hoc committee (the Economies of Scale Committee) to analyze whether FMR attains economies of scale in respect of the management and servicing of the Fidelity funds, whether the Fidelity funds have appropriately benefited from such economies of scale, and whether there is potential for realization of any further economies of scale.
The Board recognized that the fund's management contract incorporates a "group fee" structure, which provides for lower group fee rates as total fund assets under FMR's management increase, and for higher group fee rates as total fund assets under FMR's management decrease. FMR calculates the group fee rates based on a tiered asset "breakpoint" schedule that varies based on asset class. The Board considered that the group fee is designed to deliver the benefits of economies of scale to fund shareholders when total Fidelity fund assets increase, even if assets of any particular fund are unchanged or have declined, because some portion of Fidelity's costs are attributable to services provided to all Fidelity funds, and all funds benefit if those costs can be allocated among more assets. The Board concluded that, given the group fee structure, fund shareholders will benefit from lower management fees as assets under FMR's management increase at the fund complex level, regardless of whether Fidelity achieves any such economies of scale.
Annual Report
The Board concluded, taking into account the analysis of the Economies of Scale Committee, that any potential economies of scale are being appropriately shared between fund shareholders and Fidelity.
Additional Information Requested by the Board. In order to develop fully the factual basis for consideration of the Fidelity funds' Advisory Contracts, the Board requested and received additional information on certain topics, including (i) fund performance trends, actions to be taken by FMR to improve certain funds' overall performance, and Fidelity's long-term strategies for certain funds; (ii) portfolio manager changes that have occurred during the past year and length of portfolio manager tenure for different categories of funds over time; (iii) Fidelity's compensation structure for portfolio managers and other key personnel and strategies for attracting and retaining non-investment personnel; (iv) the amount of the investment that each portfolio manager has made in the Fidelity fund(s) that he or she manages; (v) historical trends in Fidelity's realization of fall-out benefits; (vi) Fidelity's group fee structures and the rationale for the individual fee rates of certain funds; (vii) fund profitability methodology and the impact of certain factors on fund profitability results; (viii) trends regarding industry use of performance fee structures and Fidelity's compliance practices with respect to performance adjustment calculations; (ix) the fee structures in place for certain other Fidelity clients; and (x) explanations regarding the relative total expense ratios of certain funds and classes, total expense competitive trends, and actions that might be taken by FMR to reduce total expense ratios for certain funds and classes.
Based on its evaluation of all of the conclusions noted above, and after considering all factors it believed relevant, the Board ultimately concluded that the advisory fee structures are fair and reasonable, and that the fund's Advisory Contracts should be renewed.
Annual Report
Managing Your Investments
Fidelity offers several ways to conveniently manage your personal investments via your telephone or PC. You can access your account information, conduct trades and research your investments 24 hours a day.
By Phone
Fidelity Automated Service Telephone provides a single toll-free number to access account balances, positions, quotes and trading. It's easy to navigate the service, and on your first call, the system will help you create a personal identification number (PIN) for security.
(phone graphic)
Fidelity Automated
Service Telephone (FAST®)
1-800-544-5555
Press
1 For mutual fund and brokerage trading.
2 For quotes.*
3 For account balances and holdings.
4 To review orders and mutual
fund activity.
5 To change your PIN.
* 0 To speak to a Fidelity representative.
By PC
Fidelity's web site on the Internet provides a wide range of information, including daily financial news, fund performance, interactive planning tools and news about Fidelity products and services.
(computer graphic)
Fidelity's Web Site
www.fidelity.com
* When you call the quotes line, please remember that a fund's yield and return will vary and, except for money market funds, share price will also vary. This means that you may have a gain or loss when you sell your shares. There is no assurance that money market funds will be able to maintain a stable $1 share price; an investment in a money market fund is not insured or guaranteed by the U.S. government. Total returns are historical and include changes in share price, reinvestment of dividends and capital gains distributions, and the effects of any sales charges.
Annual Report
To Write Fidelity
We'll give your correspondence immediate attention and send you written confirmation upon completion of your request.
(letter graphic)
Making Changes
To Your Account
(such as changing name, address, bank, etc.)
Fidelity Investments
P.O. Box 770001
Cincinnati, OH 45277-0002
(letter graphic)
For Non-Retirement
Accounts
Buying shares
Fidelity Investments
P.O. Box 770001
Cincinnati, OH 45277-0003
Overnight Express
Fidelity Investments
Attn: Distribution Services
100 Crosby Parkway - KC1H
Covington, KY 41015
Selling shares
Fidelity Investments
P.O. Box 770001
Cincinnati, OH 45277-0035
Overnight Express
Fidelity Investments
Attn: Distribution Services
100 Crosby Parkway - KC1H
Covington, KY 41015
General Correspondence
Fidelity Investments
P.O. Box 500
Merrimack, NH 03054-0500
(letter graphic)
For Retirement
Accounts
Buying shares
Fidelity Investments
P.O. Box 770001
Cincinnati, OH 45277-0003
Selling shares
Fidelity Investments
P.O. Box 770001
Cincinnati, OH 45277-0035
Overnight Express
Fidelity Investments
Attn: Distribution Services
100 Crosby Parkway - KC1H
Covington, KY 41015
General Correspondence
Fidelity Investments
P.O. Box 500
Merrimack, NH 03054-0500
Annual Report
To Visit Fidelity
For directions and hours,
please call 1-800-544-9797.
Arizona
7001 West Ray Road
Chandler, AZ
15445 N. Scottsdale Road
Scottsdale, AZ
17550 North 75th Avenue
Glendale, AZ
5330 E. Broadway Blvd
Tucson, AZ
California
815 East Birch Street
Brea, CA
1411 Chapin Avenue
Burlingame, CA
851 East Hamilton Avenue
Campbell, CA
601 Larkspur Landing Circle
Larkspur, CA
2000 Avenue of the Stars
Los Angeles, CA
27101 Puerta Real
Mission Viejo, CA
73575 El Paseo
Palm Desert, CA
251 University Avenue
Palo Alto, CA
123 South Lake Avenue
Pasadena, CA
16656 Bernardo Ctr. Drive
Rancho Bernardo, CA
1220 Roseville Parkway
Roseville, CA
1740 Arden Way
Sacramento, CA
7676 Hazard Center Drive
San Diego, CA
11943 El Camino Real
San Diego, CA
8 Montgomery Street
San Francisco, CA
3793 State Street
Santa Barbara, CA
1200 Wilshire Boulevard
Santa Monica, CA
398 West El Camino Real
Sunnyvale, CA
111 South Westlake Blvd
Thousand Oaks, CA
21701 Hawthorne Boulevard
Torrance, CA
2001 North Main Street
Walnut Creek, CA
6326 Canoga Avenue
Woodland Hills, CA
2211 Michelson Drive
Irvine, CA
Colorado
281 East Flatiron Circle
Broomfield, CO
1625 Broadway
Denver, CO
9185 Westview Road
Lone Tree, CO
Connecticut
48 West Putnam Avenue
Greenwich, CT
265 Church Street
New Haven, CT
300 Atlantic Street
Stamford, CT
29 South Main Street
West Hartford, CT
1261 Post Road
Fairfield, CT
Delaware
400 Delaware Avenue
Wilmington, DE
Florida
175 East Altamonte Drive
Altamonte Springs, FL
1400 Glades Road
Boca Raton, FL
121 Alhambra Plaza
Coral Gables, FL
2948 N. Federal Highway
Ft. Lauderdale, FL
4671 Town Center Parkway
Jacksonville, FL
8880 Tamiami Trail, North
Naples, FL
230 Royal Palm Way
Palm Beach, FL
3501 PGA Boulevard
Palm Beach Gardens, FL
3550 Tamiami Trail, South
Sarasota, FL
1502 N. Westshore Blvd.
Tampa, FL
2465 State Road 7
Wellington, FL
Georgia
3242 Peachtree Road
Atlanta, GA
1000 Abernathy Road
Atlanta, GA
Illinois
One North LaSalle Street
Chicago, IL
401 North Michigan Avenue
Chicago, IL
One Skokie Valley Road
Highland Park, IL
1415 West 22nd Street
Oak Brook, IL
15105 S LaGrange Road
Orland Park, IL
1572 East Golf Road
Schaumburg, IL
1823 Freedom Drive
Naperville, IL
Indiana
8480 Keystone Crossing
Indianapolis, IN
Kansas
5400 College Boulevard
Overland Park, KS
Maine
Three Canal Plaza
Portland, ME
Maryland
7315 Wisconsin Avenue
Bethesda, MD
610 York Road
Towson, MD
Massachusetts
801 Boylston Street
Boston, MA
155 Congress Street
Boston, MA
300 Granite Street
Braintree, MA
44 Mall Road
Burlington, MA
238 Main Street
Cambridge, MA
200 Endicott Street
Danvers, MA
Annual Report
405 Cochituate Road
Framingham, MA
551 Boston Turnpike
Shrewsbury, MA
Michigan
500 E. Eisenhower Pkwy.
Ann Arbor, MI
280 N. Old Woodward Ave.
Birmingham, MI
30200 Northwestern Hwy.
Farmington Hills, MI
43420 Grand River Avenue
Novi, MI
3480 28th Street
Grand Rapids, MI
2425 S. Linden Road STE E
Flint, MI
Minnesota
7740 France Avenue South
Edina, MN
8342 3rd Street North
Oakdale, MN
Missouri
1524 South Lindbergh Blvd.
St. Louis, MO
Nevada
2225 Village Walk Drive
Henderson, NV
New Jersey
501 Route 73 South
Marlton, NJ
150 Essex Street
Millburn, NJ
35 Morris Street
Morristown, NJ
396 Route 17, North
Paramus, NJ
3518 Route 1 North
Princeton, NJ
530 Broad Street
Shrewsbury, NJ
New Mexico
2261 Q Street NE
Albuquerque, NM
New York
1130 Franklin Avenue
Garden City, NY
37 West Jericho Turnpike
Huntington Station, NY
1271 Avenue of the Americas
New York, NY
980 Madison Avenue
New York, NY
61 Broadway
New York, NY
350 Park Avenue
New York, NY
200 Fifth Avenue
New York, NY
733 Third Avenue
New York, NY
2070 Broadway
New York, NY
1075 Northern Blvd.
Roslyn, NY
799 Central Park Avenue
Scarsdale, NY
3349 Monroe Avenue
Rochester, NY
North Carolina
4611 Sharon Road
Charlotte, NC
7011 Fayetteville Road
Durham, NC
Ohio
3805 Edwards Road
Cincinnati, OH
1324 Polaris Parkway
Columbus, OH
1800 Crocker Road
Westlake, OH
28699 Chagrin Boulevard
Woodmere Village, OH
Oregon
7493 SW Bridgeport Road
Tigard, OR
Pennsylvania
600 West DeKalb Pike
King of Prussia, PA
1735 Market Street
Philadelphia, PA
12001 Perry Highway
Wexford, PA
Rhode Island
10 Memorial Boulevard
Providence, RI
Tennessee
3018 Peoples Street
Johnson City, TN
7628 West Farmington Blvd.
Germantown, TN
2035 Mallory Lane
Franklin, TN
Texas
10000 Research Boulevard
Austin, TX
4001 Northwest Parkway
Dallas, TX
12532 Memorial Drive
Houston, TX
2701 Drexel Drive
Houston, TX
6560 Fannin Street
Houston, TX
1701 Lake Robbins Drive
The Woodlands, TX
6500 N. MacArthur Blvd.
Irving, TX
6005 West Park Boulevard
Plano, TX
1576 East Southlake Blvd.
Southlake, TX
15600 Southwest Freeway
Sugar Land, TX
139 N. Loop 1604 East
San Antonio, TX
Utah
279 West South Temple
Salt Lake City, UT
Virginia
1861 International Drive
McLean, VA
11957 Democracy Drive
Reston, VA
Washington
10500 NE 8th Street
Bellevue, WA
1518 6th Avenue
Seattle, WA
304 Strander Blvd
Tukwila, WA
Washington, DC
1900 K Street, N.W.
Washington, DC
Wisconsin
16020 West Bluemound Road
Brookfield, WI
Fidelity Brokerage Services, Inc., 100 Summer St., Boston, MA 02110 Member NYSE/SIPC
Annual Report
Investment Adviser
Fidelity Management & Research Company
Boston, MA
Investment Sub-Advisers
FMR Co., Inc.
Fidelity Management & Research
(U.K.) Inc.
Fidelity Management & Research
(Hong Kong) Limited
Fidelity Management & Research
(Japan) Inc.
FIL Investment Advisors
FIL Investments (Japan) Limited
FIL Investment Advisors (U.K.) Ltd.
General Distributor
Fidelity Distributors Corporation
Boston, MA
Transfer and Service Agent
Fidelity Investments Institutional
Operations Company, Inc.
Boston, MA
Fidelity Service Company, Inc.
Boston, MA
Custodian
State Street Bank and Trust Company
Quincy, MA
The Fidelity Telephone Connection
Mutual Fund 24-Hour Service
Exchanges/Redemptions
and Account Assistance 1-800-544-6666
Product Information 1-800-544-8888
Retirement Accounts 1-800-544-4774
(8 a.m. - 9 p.m.)
TDD Service 1-800-544-0118
for the deaf and hearing impaired
(9 a.m. - 9 p.m. Eastern time)
Fidelity Automated Service
Telephone (FAST®) (automated service graphic) 1-800-544-5555
(automated service graphic) Automated line for quickest service
(Fidelity Logo)
Corporate Headquarters
82 Devonshire St., Boston, MA 02109
www.fidelity.com
IGF-UANN-1211
1.912349.101
(Fidelity Logo)
Fidelity Advisor®
International Growth
Fund - Class A, Class T, Class B
and Class C
Annual Report
October 31, 2011
(Fidelity Cover Art)
Class A, Class T,
Class B, and Class C are
classes of Fidelity®
International Growth Fund
Contents
Chairman's Message | (Click Here) | The Chairman's message to shareholders. |
Performance | (Click Here) | How the fund has done over time. |
Management's Discussion of Fund Performance | (Click Here) | The Portfolio Manager's review of fund performance and strategy. |
Shareholder Expense Example | (Click Here) | An example of shareholder expenses. |
Investment Changes | (Click Here) | A summary of major shifts in the fund's investments over the past six months. |
Investments | (Click Here) | A complete list of the fund's investments with their market values. |
Financial Statements | (Click Here) | Statements of assets and liabilities, operations, and changes in net assets, as well as financial highlights. |
Notes | (Click Here) | Notes to financial statements. |
Report of Independent Registered Public Accounting Firm | (Click Here) | |
Trustees and Officers | (Click Here) | |
Distributions | (Click Here) | |
Board Approval of Investment Advisory Contracts and Management Fees | (Click Here) | |
To view a fund's proxy voting guidelines and proxy voting record for the 12-month period ended June 30, visit http://www.fidelity.com/proxyvotingresults or visit the Securities and Exchange Commission's (SEC) web site at http://www.sec.gov. You may also call 1-877-208-0098 to request a free copy of the proxy voting guidelines.
Standard & Poor's, S&P and S&P 500 are registered service marks of The McGraw-Hill Companies, Inc. and have been licensed for use by Fidelity Distributors Corporation.
Other third party marks appearing herein are the property of their respective owners.
All other marks appearing herein are registered or unregistered trademarks or service marks of FMR LLC or an affiliated company.
Annual Report
This report and the financial statements contained herein are submitted for the general information of the shareholders of the fund. This report is not authorized for distribution to prospective investors in the fund unless preceded or accompanied by an effective prospectus.
A fund files its complete schedule of portfolio holdings with the SEC for the first and third quarters of each fiscal year on Form N-Q. Forms N-Q are available on the SEC's web site at http://www.sec.gov. A fund's Forms N-Q may be reviewed and copied at the SEC's Public Reference Room in Washington, DC. Information regarding the operation of the SEC's Public Reference Room may be obtained by calling 1-800-SEC-0330. For a complete list of a fund's portfolio holdings, view the most recent holdings listing, semiannual report, or annual report on Fidelity's web site at http://www.fidelity.com, http://www.advisor.fidelity.com, or http://www.401k.com, as applicable.
NOT FDIC INSURED • MAY LOSE VALUE • NO BANK GUARANTEE
Neither the fund nor Fidelity Distributors Corporation is a bank.
Annual Report
(Acting Chairman's Photograph)
Dear Shareholder:
Global equity markets began the fourth quarter on a strong note, sharply reversing course in October amid strong corporate earnings, better-than-expected economic news and the promise of a resolution to the sovereign debt crisis in Europe. The mini rally followed a third quarter marked by a significant downturn in July and August, which heightened investor anxiety and set off a wave of volatility that hampered most major asset classes through the end of September. Financial markets are difficult to predict, of course, but you can help put the odds in your favor by following these time-tested investment principles.
One of the basic tenets is to invest according to your time horizon. For long-term investors, riding out the markets' inevitable ups and downs has proven much more effective than making decisions based on short-term developments. If your goal is approaching, you can also benefit from patience and restraint, rather than attempting to time the market. No matter your time horizon, missing only a few of the markets' best days can significantly diminish returns. Patience also affords the benefits of compounding - earning interest on additional income or reinvested dividends and capital gains. While staying the course doesn't eliminate risk, it can considerably lessen the negative impact of short-term downturns.
Asset allocation is another principle to manage risk. As you spread your portfolio among the asset classes, be sure to consider your time horizon, risk tolerance and investment objectives. Younger investors may be better served by emphasizing equities, which historically have been the best-performing asset class over time. Investors who are nearing a specific goal, such as retirement or sending a child to college, may choose to favor bonds and other investments that have tended to be more stable. Studies indicate that asset allocation is the single most important determinant of a portfolio's long-term success. After deciding on a suitable allocation strategy, make sure your portfolio is adequately diversified, with exposure to stocks of small-, mid- and large-cap companies in a range of sectors, for example. And today, more than ever, geographic diversification should be taken into account.
Lastly, investing a certain amount of money on a regular basis - a principle known as dollar-cost averaging - can help lower the average cost of your purchases, while also giving you the discipline to avoid selling weak performers just prior to an upswing, or chasing a hot performer just before a correction.
We invite you to learn more by visiting us on the Internet, dropping by one of our Investor Centers or calling us by phone. It is our privilege to provide the resources you need to choose investments that are right for you.
Sincerely,
(Acting Chairman's Signature)
James C. Curvey
Acting Chairman
Annual Report
Average annual total return reflects the change in the value of an investment, assuming reinvestment of the class' distributions from dividend income and capital gains (the profits earned upon the sale of securities that have grown in value, if any) and assuming a constant rate of performance each year. The $10,000 table and the fund's returns do not reflect the deduction of taxes that a shareholder would pay on fund distributions or the redemption of fund shares. During periods of reimbursement by Fidelity, a fund's total return will be greater than it would be had the reimbursement not occurred. How a fund did yesterday is no guarantee of how it will do tomorrow.
Average Annual Total Returns
Periods ended October 31, 2011 | Past 1
year | Life of
fund A |
Class A (incl. 5.75% sales charge) | -8.35% | -5.92% |
Class T (incl. 3.50% sales charge) | -6.42% | -5.61% |
Class B (incl. contingent deferred sales charge) B | -8.29% | -5.94% |
Class C (incl. contingent deferred sales charge) C | -4.53% | -5.24% |
A From November 1, 2007.
B Class B shares' contingent deferred sales charge included in the past one year and life of fund total return figures are 5% and 3%, respectively.
C Class C shares' contingent deferred sales charge included in the past one year and life of fund total return figures are 1% and 0%, respectively.
Annual Report
$10,000 Over Life of Fund
Let's say hypothetically that $10,000 was invested in Fidelity Advisor® International Growth Fund - Class A on November 1, 2007, when the fund started, and the current 5.75% sales charge was paid. The chart shows how the value of your investment would have changed, and also shows how the MSCI® EAFE® (Europe, Australasia, Far East) Growth Index performed over the same period.
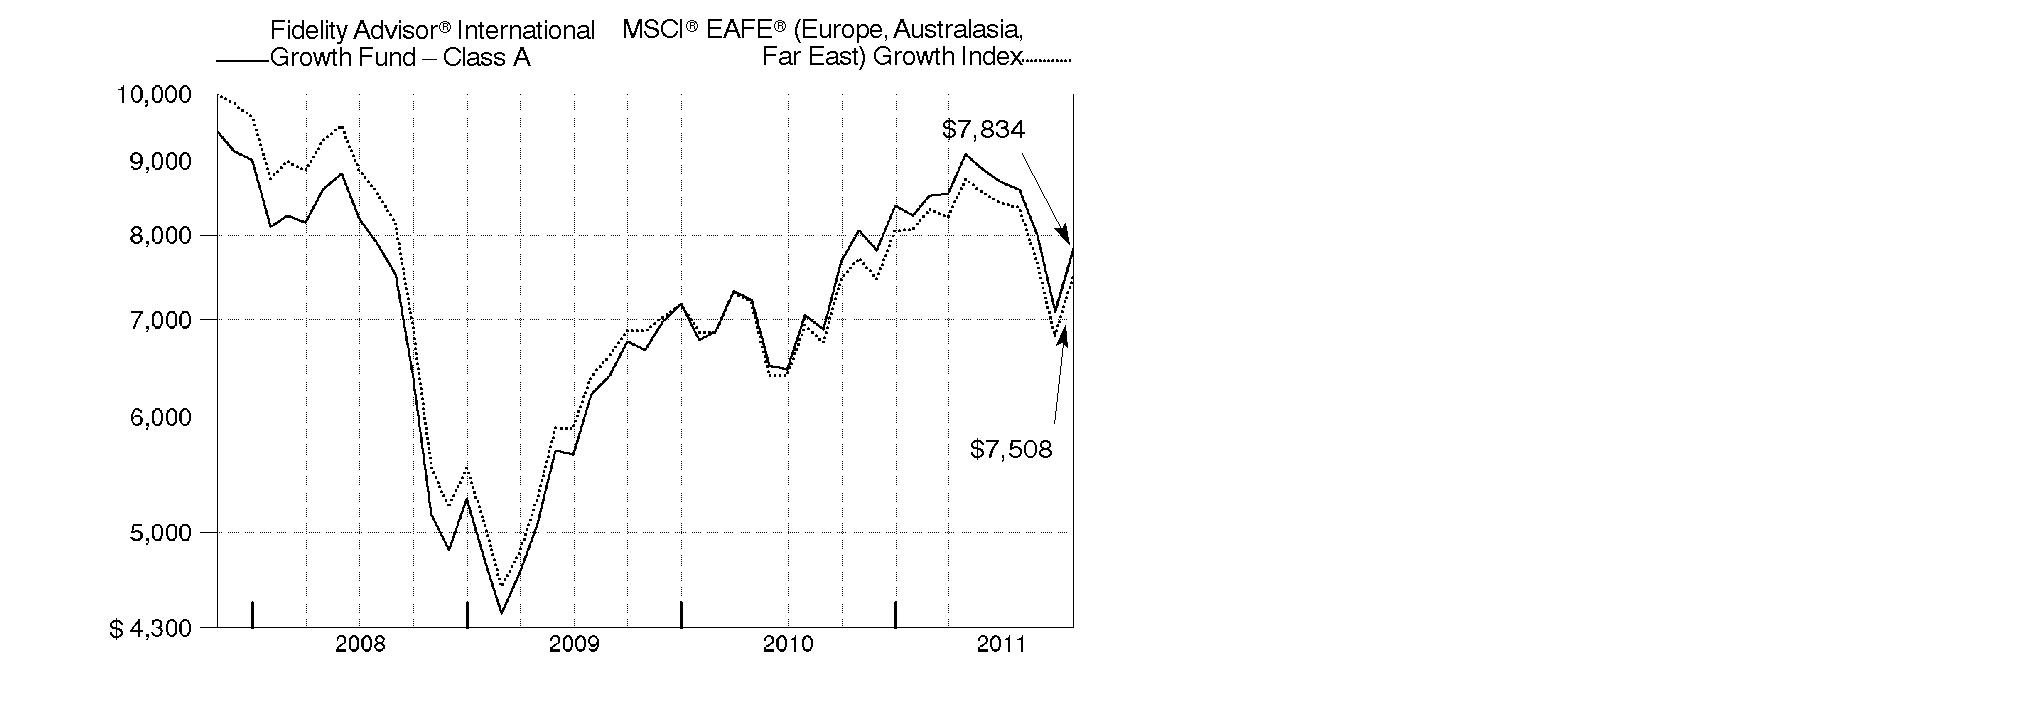
Annual Report
Market Recap: International equities were rocked by a number of headline events during the year ending October 31, 2011. Stocks posted a solid advance for the first half of the period, despite concern about the sovereign debt crisis in Europe, a devastating earthquake and tsunami in Japan, and political upheaval in the Middle East and North Africa. Sentiment turned decidedly negative in the second half, however, as fresh worries about Europe, inflation in China and a dimmed outlook for global growth caused foreign markets to suffer declines that intensified in August and September. October brought with it yet another dramatic swing, as eurozone policymakers appeared near a resolution to the debt debacle and buyers stormed back onto the scene in search of bargains. Still, those gains - along with favorable currency fluctuations overall - weren't enough to offset prior losses, and the MSCI® ACWI® (All Country World Index) ex USA Index finished the period down 4.56%. Within the MSCI index, Europe and emerging markets suffered the biggest declines, with many countries in these areas sustaining steep losses. By contrast, Japan showed resilience in the wake of its natural disasters, falling only 2%. Australia (+4%), Switzerland (+3%), the U.K. (+2%) and Canada, which produced a nominal return, were among the few major benchmark components to break into positive territory.
Comments from Jed Weiss, Portfolio Manager of Fidelity Advisor® International Growth Fund: For the year, the fund's Class A, Class T, Class B and Class C shares fell 2.76%, 3.03%, 3.47% and 3.57%, respectively (excluding sales charges), versus a 2.69% decline in the MSCI® EAFE® (Europe, Australasia, Far East) Growth Index. Stock selection in continental Europe and Japan was helpful, while an out-of-benchmark stake in the U.S. also contributed. However, my choices within non-index emerging markets were poor, notably Brazil and Turkey, while picks in the U.K., Canada and Australia further detracted. From a sector view, positioning in information technology, consumer discretionary and financials added value. In contrast, picks in health care equipment/services, capital goods and the food/beverage/tobacco segment of consumer staples notably detracted. On an individual security basis, lacking a position in weak-performing U.K.-based bank and benchmark component Lloyds Banking Group helped, as did out-of-benchmark stakes in U.S.-based credit card processor MasterCard and baby food maker Mead Johnson Nutrition. Conversely, not owning index constituent British American Tobacco hurt. I chose to own Philip Morris International instead - another of the fund's contributors. Non-index holdings in Turkish bank Turkiye Garanti Bankasi and Canadian energy company Niko Resources also detracted.
The views expressed above reflect those of the portfolio manager(s) only through the end of the period as stated on the cover of this report and do not necessarily represent the views of Fidelity or any other person in the Fidelity organization. Any such views are subject to change at any time based upon market or other conditions and Fidelity disclaims any responsibility to update such views. These views may not be relied on as investment advice and, because investment decisions for a Fidelity fund are based on numerous factors, may not be relied on as an indication of trading intent on behalf of any Fidelity fund.
Annual Report
Shareholder Expense Example
As a shareholder of the Fund, you incur two types of costs: (1) transaction costs, including sales charges (loads) on purchase payments or redemption proceeds, redemption fees, and (2) ongoing costs, including management fees, distribution and/or service (12b-1) fees and other Fund expenses. This Example is intended to help you understand your ongoing costs (in dollars) of investing in the Fund and to compare these costs with the ongoing costs of investing in other mutual funds.
The Example is based on an investment of $1,000 invested at the beginning of the period and held for the entire period (May 1, 2011 to October 31, 2011).
Actual Expenses
The first line of the accompanying table for each class of the Fund provides information about actual account values and actual expenses. You may use the information in this line, together with the amount you invested, to estimate the expenses that you paid over the period. Simply divide your account value by $1,000.00 (for example, an $8,600 account value divided by $1,000.00 = 8.6), then multiply the result by the number in the first line for a class of the Fund under the heading entitled "Expenses Paid During Period" to estimate the expenses you paid on your account during this period. A small balance maintenance fee of $12.00 that is charged once a year may apply for certain accounts with a value of less than $2,000. This fee is not included in the table below. If it was, the estimate of expenses you paid during the period would be higher, and your ending account value lower, by this amount. In addition, the Fund, as a shareholder in the underlying Fidelity Central Funds, will indirectly bear its pro-rata share of the fees and expenses incurred by the underlying Fidelity Central Funds. These fees and expenses are not included in the Fund's annualized expense ratio used to calculate the expense estimate in the table below.
Hypothetical Example for Comparison Purposes
The second line of the accompanying table for each class of the Fund provides information about hypothetical account values and hypothetical expenses based on a Class' actual expense ratio and an assumed rate of return of 5% per year before expenses, which is not the Class' actual return. The hypothetical account values and expenses may not be used to estimate the actual ending account balance or expenses you paid for the period. You may use this information to compare the ongoing costs of investing in the Fund and other funds. To do so, compare this 5% hypothetical example with the 5% hypothetical examples that appear in the shareholder reports of the other funds. A small balance maintenance fee of $12.00 that is charged once a year may apply for certain accounts with a value of less than $2,000. This fee is not included in the table below. If it was, the estimate of expenses you paid during the period would be higher, and your ending account value lower, by this amount. In addition, the Fund, as a shareholder in the underlying Fidelity Central Funds, will indirectly bear its pro-rata share of the fees and expenses incurred by the underlying Fidelity Central Funds. These fees and expenses are not included in the Fund's annualized expense ratio used to calculate the expense estimate in the table below.
Please note that the expenses shown in the table are meant to highlight your ongoing costs only and do not reflect any transaction costs. Therefore, the second line of the table is useful in comparing ongoing costs only, and will not help you determine the relative total costs of owning different funds. In addition, if these transactional costs were included, your costs would have been higher.
Annual Report
| Annualized
Expense Ratio | Beginning
Account Value
May 1, 2011 | Ending
Account Value
October 31, 2011 | Expenses Paid
During Period*
May 1, 2011 to
October 31, 2011 |
Class A | 1.45% | | | |
Actual | | $ 1,000.00 | $ 861.60 | $ 6.80 |
HypotheticalA | | $ 1,000.00 | $ 1,017.90 | $ 7.38 |
Class T | 1.70% | | | |
Actual | | $ 1,000.00 | $ 860.50 | $ 7.97 |
HypotheticalA | | $ 1,000.00 | $ 1,016.64 | $ 8.64 |
Class B | 2.20% | | | |
Actual | | $ 1,000.00 | $ 858.40 | $ 10.31 |
HypotheticalA | | $ 1,000.00 | $ 1,014.12 | $ 11.17 |
Class C | 2.20% | | | |
Actual | | $ 1,000.00 | $ 857.90 | $ 10.30 |
HypotheticalA | | $ 1,000.00 | $ 1,014.12 | $ 11.17 |
International Growth | 1.20% | | | |
Actual | | $ 1,000.00 | $ 862.90 | $ 5.63 |
HypotheticalA | | $ 1,000.00 | $ 1,019.16 | $ 6.11 |
Institutional Class | 1.20% | | | |
Actual | | $ 1,000.00 | $ 862.90 | $ 5.63 |
HypotheticalA | | $ 1,000.00 | $ 1,019.16 | $ 6.11 |
A 5% return per year before expenses
* Expenses are equal to each Class' annualized expense ratio, multiplied by the average account value over the period, multiplied by 184/365 (to reflect the one-half year period).
Annual Report
Investment Changes (Unaudited)
Geographic Diversification (% of fund's net assets) |
As of October 31, 2011 |
| United Kingdom 18.5% | |
| United States of America 17.5% | |
| Switzerland 9.6% | |
| Japan 7.4% | |
| Australia 5.2% | |
| Germany 4.9% | |
| France 4.1% | |
| Belgium 3.5% | |
| Denmark 2.9% | |
| Other 26.4% | |
Percentages are adjusted for the effect of futures contracts, if applicable. |
As of April 30, 2011 |
| United Kingdom 20.2% | |
| United States of America 13.6% | |
| Switzerland 9.2% | |
| Japan 7.5% | |
| Germany 5.5% | |
| Australia 5.2% | |
| Belgium 3.5% | |
| France 3.4% | |
| Brazil 3.0% | |
| Other 28.9% | |
Percentages are adjusted for the effect of futures contracts, if applicable. |
Asset Allocation |
| % of fund's
net assets | % of fund's net assets
6 months ago |
Stocks and Investment Companies | 95.8 | 97.9 |
Short-Term Investments and Net Other Assets | 4.2 | 2.1 |
Top Ten Stocks as of October 31, 2011 |
| % of fund's
net assets | % of fund's net assets
6 months ago |
Nestle SA (Switzerland, Food Products) | 4.9 | 4.6 |
BHP Billiton PLC ADR (United Kingdom, Metals & Mining) | 3.6 | 4.4 |
Anheuser-Busch InBev SA NV (Belgium, Beverages) | 2.9 | 2.8 |
BG Group PLC (United Kingdom, Oil, Gas & Consumable Fuels) | 2.8 | 2.4 |
Linde AG (Germany, Chemicals) | 2.2 | 1.9 |
Novo Nordisk A/S Series B sponsored ADR (Denmark, Pharmaceuticals) | 2.2 | 2.1 |
Roche Holding AG (participation certificate) (Switzerland, Pharmaceuticals) | 1.8 | 1.2 |
Danone (France, Food Products) | 1.7 | 0.8 |
Siemens AG sponsored ADR (Germany, Industrial Conglomerates) | 1.7 | 2.1 |
Philip Morris International, Inc. (United States of America, Tobacco) | 1.6 | 0.7 |
| 25.4 | |
Market Sectors as of October 31, 2011 |
| % of fund's
net assets | % of fund's net assets
6 months ago |
Consumer Staples | 22.2 | 17.0 |
Materials | 15.8 | 18.2 |
Industrials | 12.7 | 14.5 |
Consumer Discretionary | 12.1 | 12.8 |
Financials | 10.4 | 13.3 |
Information Technology | 8.5 | 7.7 |
Health Care | 8.2 | 7.1 |
Energy | 5.2 | 5.5 |
Telecommunication Services | 0.7 | 0.8 |
Annual Report
Investments October 31, 2011
Showing Percentage of Net Assets
Common Stocks - 95.8% |
| Shares | | Value |
Australia - 5.2% |
Coca-Cola Amatil Ltd. | 26,816 | | $ 346,197 |
CSL Ltd. | 25,527 | | 768,921 |
MAp Group unit | 58,681 | | 209,411 |
Newcrest Mining Ltd. | 16,135 | | 570,295 |
Newcrest Mining Ltd. sponsored ADR | 8,107 | | 284,961 |
OZ Minerals Ltd. | 23,905 | | 287,097 |
QBE Insurance Group Ltd. | 11,795 | | 181,577 |
Woolworths Ltd. | 10,289 | | 257,227 |
WorleyParsons Ltd. | 18,798 | | 545,659 |
TOTAL AUSTRALIA | | 3,451,345 |
Austria - 0.8% |
Andritz AG | 4,500 | | 398,750 |
Zumtobel AG | 7,800 | | 162,672 |
TOTAL AUSTRIA | | 561,422 |
Bailiwick of Guernsey - 0.2% |
Resolution Ltd. | 31,193 | | 137,953 |
Bailiwick of Jersey - 1.2% |
Informa PLC | 26,847 | | 156,467 |
Randgold Resources Ltd. sponsored ADR | 5,835 | | 639,341 |
TOTAL BAILIWICK OF JERSEY | | 795,808 |
Belgium - 3.5% |
Anheuser-Busch InBev SA NV | 34,391 | | 1,907,468 |
Umicore SA | 9,945 | | 428,232 |
TOTAL BELGIUM | | 2,335,700 |
Bermuda - 1.4% |
Lazard Ltd. Class A | 9,492 | | 259,511 |
Li & Fung Ltd. | 266,000 | | 512,634 |
Trinity Ltd. | 200,000 | | 181,272 |
TOTAL BERMUDA | | 953,417 |
Brazil - 2.7% |
Arezzo Industria e Comercio SA | 13,600 | | 179,781 |
BM&F Bovespa SA | 55,500 | | 331,281 |
BR Malls Participacoes SA | 15,500 | | 167,438 |
Braskem SA Class A sponsored ADR | 18,900 | | 340,956 |
Iguatemi Empresa de Shopping Centers SA | 8,700 | | 168,559 |
Common Stocks - continued |
| Shares | | Value |
Brazil - continued |
Itau Unibanco Banco Multiplo SA sponsored ADR | 15,830 | | $ 302,670 |
Multiplan Empreendimentos Imobiliarios SA | 13,300 | | 268,912 |
TOTAL BRAZIL | | 1,759,597 |
Canada - 2.6% |
Agnico-Eagle Mines Ltd. (Canada) | 7,600 | | 329,662 |
Fairfax Financial Holdings Ltd. (sub. vtg.) | 1,000 | | 417,987 |
Goldcorp, Inc. | 4,900 | | 238,401 |
Niko Resources Ltd. | 5,700 | | 313,519 |
Open Text Corp. (a) | 4,800 | | 293,773 |
Pan American Silver Corp. | 5,000 | | 139,800 |
TOTAL CANADA | | 1,733,142 |
Cayman Islands - 1.3% |
NVC Lighting Holdings Ltd. | 412,000 | | 178,887 |
Sands China Ltd. (a) | 102,600 | | 308,332 |
Wynn Macau Ltd. | 129,400 | | 362,563 |
TOTAL CAYMAN ISLANDS | | 849,782 |
Chile - 0.4% |
Banco Santander Chile sponsored ADR (d) | 3,400 | | 277,712 |
China - 0.5% |
Baidu.com, Inc. sponsored ADR (a) | 2,580 | | 361,664 |
Denmark - 2.9% |
Novo Nordisk A/S Series B sponsored ADR (d) | 13,700 | | 1,456,310 |
William Demant Holding A/S (a) | 5,900 | | 470,749 |
TOTAL DENMARK | | 1,927,059 |
Finland - 1.5% |
Metso Corp. | 4,600 | | 179,138 |
Nokian Tyres PLC | 12,900 | | 473,979 |
Outotec Oyj | 8,000 | | 373,985 |
TOTAL FINLAND | | 1,027,102 |
France - 4.1% |
Alstom SA | 16,016 | | 600,659 |
Danone | 15,852 | | 1,103,460 |
Remy Cointreau SA | 3,690 | | 303,332 |
Safran SA | 20,800 | | 681,344 |
TOTAL FRANCE | | 2,688,795 |
Common Stocks - continued |
| Shares | | Value |
Germany - 4.9% |
alstria office REIT-AG | 13,500 | | $ 173,562 |
Bayerische Motoren Werke AG (BMW) | 3,422 | | 279,691 |
Linde AG | 9,241 | | 1,470,052 |
MAN SE | 2,427 | | 215,261 |
Siemens AG sponsored ADR (d) | 10,400 | | 1,091,688 |
TOTAL GERMANY | | 3,230,254 |
Hong Kong - 0.9% |
Hong Kong Exchanges and Clearing Ltd. | 33,700 | | 571,279 |
India - 0.5% |
Bharti Airtel Ltd. | 42,571 | | 340,939 |
Ireland - 1.1% |
CRH PLC sponsored ADR (d) | 19,800 | | 364,518 |
James Hardie Industries NV sponsored ADR (a) | 11,400 | | 369,702 |
TOTAL IRELAND | | 734,220 |
Israel - 0.2% |
Azrieli Group | 6,300 | | 162,097 |
Italy - 1.2% |
Fiat Industrial SpA (a) | 40,201 | | 350,773 |
Interpump Group SpA | 23,751 | | 152,972 |
Saipem SpA | 6,670 | | 299,072 |
TOTAL ITALY | | 802,817 |
Japan - 7.4% |
Autobacs Seven Co. Ltd. | 7,500 | | 343,476 |
Denso Corp. | 16,900 | | 519,797 |
Fanuc Corp. | 5,400 | | 873,239 |
Fast Retailing Co. Ltd. | 1,500 | | 269,488 |
Japan Tobacco, Inc. | 41 | | 204,951 |
Keyence Corp. | 2,420 | | 615,269 |
Kobayashi Pharmaceutical Co. Ltd. | 6,000 | | 297,454 |
Osaka Securities Exchange Co. Ltd. | 63 | | 295,260 |
SHO-BOND Holdings Co. Ltd. | 6,600 | | 147,245 |
Unicharm Corp. | 9,800 | | 438,938 |
USS Co. Ltd. | 7,010 | | 579,585 |
Yamato Kogyo Co. Ltd. | 12,900 | | 326,341 |
TOTAL JAPAN | | 4,911,043 |
Mexico - 1.1% |
Wal-Mart de Mexico SA de CV Series V | 287,100 | | 741,667 |
Common Stocks - continued |
| Shares | | Value |
Netherlands - 1.4% |
ASML Holding NV | 17,400 | | $ 729,582 |
QIAGEN NV (a)(d) | 13,300 | | 183,274 |
TOTAL NETHERLANDS | | 912,856 |
Portugal - 0.9% |
Jeronimo Martins SGPS SA | 33,075 | | 572,156 |
South Africa - 1.7% |
African Rainbow Minerals Ltd. | 14,739 | | 340,641 |
Clicks Group Ltd. | 28,722 | | 150,734 |
JSE Ltd. | 29,300 | | 259,466 |
Mr Price Group Ltd. | 28,700 | | 276,285 |
MTN Group Ltd. | 7,300 | | 127,414 |
TOTAL SOUTH AFRICA | | 1,154,540 |
Spain - 1.3% |
Inditex SA | 5,827 | | 530,288 |
Prosegur Compania de Seguridad SA (Reg.) | 6,000 | | 299,338 |
TOTAL SPAIN | | 829,626 |
Sweden - 1.9% |
Fagerhult AB | 6,100 | | 143,622 |
H&M Hennes & Mauritz AB (B Shares) | 21,979 | | 727,852 |
Swedish Match Co. | 10,400 | | 359,878 |
TOTAL SWEDEN | | 1,231,352 |
Switzerland - 9.6% |
Nestle SA | 55,720 | | 3,231,892 |
Novartis AG sponsored ADR | 4,800 | | 271,056 |
Roche Holding AG (participation certificate) | 7,212 | | 1,189,193 |
Schindler Holding AG: | | | |
(participation certificate) | 2,598 | | 305,525 |
(Reg.) | 730 | | 85,931 |
The Swatch Group AG (Bearer) | 2,280 | | 965,470 |
UBS AG (NY Shares) (a) | 26,025 | | 328,436 |
TOTAL SWITZERLAND | | 6,377,503 |
Turkey - 1.6% |
Anadolu Efes Biracilik ve Malt Sanayii AS | 12,800 | | 155,634 |
Coca-Cola Icecek AS | 23,000 | | 312,173 |
Tupras-Turkiye Petrol Rafinerileri AS | 6,687 | | 151,268 |
Turkiye Garanti Bankasi AS | 125,500 | | 442,879 |
TOTAL TURKEY | | 1,061,954 |
Common Stocks - continued |
| Shares | | Value |
United Kingdom - 18.5% |
Anglo American PLC: | | | |
ADR | 18,300 | | $ 335,805 |
(United Kingdom) | 4,800 | | 177,044 |
Babcock International Group PLC | 39,300 | | 445,260 |
BG Group PLC | 84,755 | | 1,848,950 |
BHP Billiton PLC ADR (d) | 38,300 | | 2,411,751 |
GlaxoSmithKline PLC sponsored ADR | 11,100 | | 497,169 |
Imperial Tobacco Group PLC | 9,278 | | 339,301 |
InterContinental Hotel Group PLC ADR | 25,155 | | 464,864 |
Johnson Matthey PLC | 15,624 | | 472,127 |
Reckitt Benckiser Group PLC | 13,645 | | 701,766 |
Rio Tinto PLC sponsored ADR | 13,100 | | 708,186 |
Rolls-Royce Group PLC | 53,737 | | 607,099 |
Rolls-Royce Group PLC Class C | 3,707,853 | | 5,963 |
Rotork PLC | 9,700 | | 262,696 |
SABMiller PLC | 19,566 | | 714,751 |
Serco Group PLC | 42,761 | | 357,251 |
Shaftesbury PLC | 20,033 | | 162,374 |
Standard Chartered PLC (United Kingdom) | 41,951 | | 984,323 |
Tesco PLC | 78,253 | | 505,588 |
Unite Group PLC | 48,100 | | 136,763 |
Victrex PLC | 7,600 | | 155,223 |
TOTAL UNITED KINGDOM | | 12,294,254 |
United States of America - 13.3% |
Allergan, Inc. | 3,400 | | 286,008 |
Autoliv, Inc. (d) | 8,300 | | 479,491 |
Berkshire Hathaway, Inc. Class B (a) | 8,923 | | 694,745 |
Cymer, Inc. (a) | 3,700 | | 160,765 |
eBay, Inc. (a) | 10,536 | | 335,361 |
Google, Inc. Class A (a) | 620 | | 367,437 |
ION Geophysical Corp. (a) | 35,300 | | 268,986 |
JPMorgan Chase & Co. | 6,600 | | 229,416 |
Juniper Networks, Inc. (a) | 23,500 | | 575,045 |
Lam Research Corp. (a) | 5,555 | | 238,809 |
Martin Marietta Materials, Inc. (d) | 2,300 | | 165,991 |
MasterCard, Inc. Class A | 2,600 | | 902,824 |
Mead Johnson Nutrition Co. Class A | 10,100 | | 725,685 |
Mohawk Industries, Inc. (a) | 7,000 | | 368,550 |
Nuance Communications, Inc. (a) | 5,044 | | 133,565 |
Philip Morris International, Inc. | 14,908 | | 1,041,622 |
ResMed, Inc. (a) | 11,300 | | 319,790 |
Common Stocks - continued |
| Shares | | Value |
United States of America - continued |
Solera Holdings, Inc. | 3,189 | | $ 174,215 |
Union Pacific Corp. | 5,700 | | 567,549 |
Visa, Inc. Class A | 8,900 | | 830,014 |
TOTAL UNITED STATES OF AMERICA | | 8,865,868 |
TOTAL COMMON STOCKS (Cost $64,891,214) |
63,654,923
|
Money Market Funds - 13.0% |
| | | |
Fidelity Cash Central Fund, 0.12% (b) | 3,244,067 | | 3,244,067 |
Fidelity Securities Lending Cash Central Fund, 0.11% (b)(c) | 5,405,750 | | 5,405,750 |
TOTAL MONEY MARKET FUNDS (Cost $8,649,817) |
8,649,817
|
TOTAL INVESTMENT PORTFOLIO - 108.8% (Cost $73,541,031) | | 72,304,740 |
NET OTHER ASSETS (LIABILITIES) - (8.8)% | | (5,864,357) |
NET ASSETS - 100% | $ 66,440,383 |
Legend |
(a) Non-income producing |
(b) Affiliated fund that is available only to investment companies and other accounts managed by Fidelity Investments. The rate quoted is the annualized seven-day yield of the fund at period end. A complete unaudited listing of the fund's holdings as of its most recent quarter end is available upon request. In addition, each Fidelity Central Fund's financial statements, which are not covered by the Fund's Report of Independent Registered Public Accounting Firm, are available on the SEC's website or upon request. |
(c) Investment made with cash collateral received from securities on loan. |
(d) Security or a portion of the security is on loan at period end. |
Affiliated Central Funds |
Information regarding fiscal year to date income earned by the Fund from investments in Fidelity Central Funds is as follows: |
Fund | Income earned |
Fidelity Cash Central Fund | $ 133 |
Fidelity Securities Lending Cash Central Fund | 30,491 |
Total | $ 30,624 |
Other Information |
The following is a summary of the inputs used, as of October 31, 2011, involving the Fund's assets and liabilities carried at fair value. The inputs or methodology used for valuing securities may not be an indication of the risk associated with investing in those securities. For more information on valuation inputs, and their aggregation into the levels used in the table below, please refer to the Security Valuation section in the accompanying Notes to Financial Statements. |
Valuation Inputs at Reporting Date: |
Description | Total | Level 1 | Level 2 | Level 3 |
Investments in Securities: | | | | |
Equities: | | | | |
United Kingdom | $ 12,294,254 | $ 12,294,254 | $ - | $ - |
United States of America | 8,865,868 | 8,865,868 | - | - |
Switzerland | 6,377,503 | 6,377,503 | - | - |
Japan | 4,911,043 | - | 4,911,043 | - |
Australia | 3,451,345 | 284,961 | 3,166,384 | - |
Germany | 3,230,254 | 3,230,254 | - | - |
France | 2,688,795 | 2,688,795 | - | - |
Belgium | 2,335,700 | 428,232 | 1,907,468 | - |
Denmark | 1,927,059 | 1,927,059 | - | - |
Other | 17,573,102 | 15,117,196 | 2,455,906 | - |
Money Market Funds | 8,649,817 | 8,649,817 | - | - |
Total Investments in Securities: | $ 72,304,740 | $ 59,863,939 | $ 12,440,801 | $ - |
Income Tax Information |
At October 31, 2011, the Fund had a capital loss carryforward of approximately $4,617,271 of which $1,819,472 and $2,797,799 will expire in fiscal 2016 and 2017, respectively. Capital loss carryforwards are only available to offset future capital gains of the Fund to the extent provided by regulations and may be limited. |
See accompanying notes which are an integral part of the financial statements.
Annual Report
Statement of Assets and Liabilities
| October 31, 2011 |
| | |
Assets | | |
Investment in securities, at value (including securities loaned of $4,993,707) - See accompanying schedule: Unaffiliated issuers (cost $64,891,214) | $ 63,654,923 | |
Fidelity Central Funds (cost $8,649,817) | 8,649,817 | |
Total Investments (cost $73,541,031) | | $ 72,304,740 |
Foreign currency held at value (cost $25) | | 25 |
Receivable for fund shares sold | | 215,605 |
Dividends receivable | | 77,337 |
Distributions receivable from Fidelity Central Funds | | 1,200 |
Prepaid expenses | | 325 |
Receivable from investment adviser for expense reductions | | 47,592 |
Other receivables | | 8,776 |
Total assets | | 72,655,600 |
| | |
Liabilities | | |
Payable to custodian bank | $ 86 | |
Payable for investments purchased | 556,492 | |
Payable for fund shares redeemed | 129,097 | |
Accrued management fee | 43,489 | |
Distribution and service plan fees payable | 4,953 | |
Other affiliated payables | 18,627 | |
Other payables and accrued expenses | 56,723 | |
Collateral on securities loaned, at value | 5,405,750 | |
Total liabilities | | 6,215,217 |
| | |
Net Assets | | $ 66,440,383 |
Net Assets consist of: | | |
Paid in capital | | $ 72,102,749 |
Undistributed net investment income | | 591,460 |
Accumulated undistributed net realized gain (loss) on investments and foreign currency transactions | | (5,018,547) |
Net unrealized appreciation (depreciation) on investments and assets and liabilities in foreign currencies | | (1,235,279) |
Net Assets | | $ 66,440,383 |
See accompanying notes which are an integral part of the financial statements.
Annual Report
Financial Statements - continued
Statement of Assets and Liabilities - continued
| October 31, 2011 |
| | |
Calculation of Maximum Offering Price
Class A:
Net Asset Value and redemption price per share ($6,352,040 ÷ 784,991 shares) | | $ 8.09 |
| | |
Maximum offering price per share (100/94.25 of $8.09) | | $ 8.58 |
Class T:
Net Asset Value and redemption price per share ($2,917,485 ÷ 360,874 shares) | | $ 8.08 |
| | |
Maximum offering price per share (100/96.50 of $8.08) | | $ 8.37 |
Class B:
Net Asset Value and offering price per share ($473,300 ÷ 58,728 shares)A | | $ 8.06 |
| | |
Class C:
Net Asset Value and offering price per share ($2,767,455 ÷ 344,459 shares)A | | $ 8.03 |
| | |
| | |
International Growth:
Net Asset Value, offering price and redemption price per share ($53,437,349 ÷ 6,578,532 shares) | | $ 8.12 |
| | |
Institutional Class:
Net Asset Value, offering price and redemption price per share ($492,754 ÷ 60,686 shares) | | $ 8.12 |
A Redemption price per share is equal to net asset value less any applicable contingent deferred sales charge.
See accompanying notes which are an integral part of the financial statements.
Annual Report
Statement of Operations
| Year ended October 31, 2011 |
| | |
Investment Income | | |
Dividends | | $ 1,423,446 |
Interest | | 1,263 |
Income from Fidelity Central Funds | | 30,624 |
Income before foreign taxes withheld | | 1,455,333 |
Less foreign taxes withheld | | (88,339) |
Total income | | 1,366,994 |
| | |
Expenses | | |
Management fee
Basic fee | $ 410,826 | |
Performance adjustment | 56,123 | |
Transfer agent fees | 177,014 | |
Distribution and service plan fees | 51,133 | |
Accounting and security lending fees | 30,647 | |
Custodian fees and expenses | 63,389 | |
Independent trustees' compensation | 307 | |
Registration fees | 81,018 | |
Audit | 62,443 | |
Legal | 205 | |
Miscellaneous | 356 | |
Total expenses before reductions | 933,461 | |
Expense reductions | (195,414) | 738,047 |
Net investment income (loss) | | 628,947 |
Realized and Unrealized Gain (Loss) Net realized gain (loss) on: | | |
Investment securities: | | |
Unaffiliated issuers | 1,846,627 | |
Foreign currency transactions | (28,806) | |
Total net realized gain (loss) | | 1,817,821 |
Change in net unrealized appreciation (depreciation) on: Investment securities | (6,054,664) | |
Assets and liabilities in foreign currencies | (2,910) | |
Total change in net unrealized appreciation (depreciation) | | (6,057,574) |
Net gain (loss) | | (4,239,753) |
Net increase (decrease) in net assets resulting from operations | | $ (3,610,806) |
See accompanying notes which are an integral part of the financial statements.
Annual Report
Financial Statements - continued
Statement of Changes in Net Assets
| Year ended
October 31,
2011 | Year ended
October 31,
2010 |
Increase (Decrease) in Net Assets | | |
Operations | | |
Net investment income (loss) | $ 628,947 | $ 244,323 |
Net realized gain (loss) | 1,817,821 | 1,690,004 |
Change in net unrealized appreciation (depreciation) | (6,057,574) | 3,221,795 |
Net increase (decrease) in net assets resulting
from operations | (3,610,806) | 5,156,122 |
Distributions to shareholders from net investment income | (276,358) | (167,219) |
Distributions to shareholders from net realized gain | (48,341) | (78,510) |
Total distributions | (324,699) | (245,729) |
Share transactions - net increase (decrease) | 35,841,228 | 8,231,990 |
Redemption fees | 7,927 | 2,560 |
Total increase (decrease) in net assets | 31,913,650 | 13,144,943 |
| | |
Net Assets | | |
Beginning of period | 34,526,733 | 21,381,790 |
End of period (including undistributed net investment income of $591,460 and undistributed net investment income of $237,573, respectively) | $ 66,440,383 | $ 34,526,733 |
See accompanying notes which are an integral part of the financial statements.
Annual Report
Financial Highlights - Class A
Years ended October 31, | 2011 | 2010 | 2009 | 2008 F |
Selected Per-Share Data | | | | |
Net asset value, beginning of period | $ 8.38 | $ 7.01 | $ 5.46 | $ 10.00 |
Income from Investment Operations | | | | |
Net investment income (loss) C | .08 | .05 | .05 | .07 |
Net realized and unrealized gain (loss) | (.31) | 1.39 | 1.55 | (4.61) |
Total from investment operations | (.23) | 1.44 | 1.60 | (4.54) |
Distributions from net investment income | (.05) | (.05) | (.05) | - |
Distributions from net realized gain | (.01) | (.03) | - | - |
Total distributions | (.06) | (.07) I | (.05) | - |
Redemption fees added to paid in capital C, H | - | - | - | - |
Net asset value, end of period | $ 8.09 | $ 8.38 | $ 7.01 | $ 5.46 |
Total Return A, B | (2.76)% | 20.68% | 29.72% | (45.40)% |
Ratios to Average Net Assets D, G | | | | |
Expenses before reductions | 1.77% | 2.13% | 2.46% | 2.88% |
Expenses net of fee waivers, if any | 1.45% | 1.50% | 1.50% | 1.50% |
Expenses net of all reductions | 1.43% | 1.48% | 1.47% | 1.48% |
Net investment income (loss) | .92% | .74% | .85% | .80% |
Supplemental Data | | | | |
Net assets, end of period (000 omitted) | $ 6,352 | $ 3,084 | $ 1,452 | $ 820 |
Portfolio turnover rate E | 68% | 87% | 116% | 115% |
A Total returns would have been lower if certain expenses had not been reduced during the applicable periods shown.
B Total returns do not include the effect of the sales charges.
C Calculated based on average shares outstanding during the period.
D Fees and expenses of any underlying Fidelity Central Funds are not included in the Fund's expense ratio. The Fund indirectly bears its proportionate share of the expenses of any underlying Fidelity Central Funds.
E Amount does not include the portfolio activity of any underlying Fidelity Central Funds.
F For the period November 1, 2007 (commencement of operations) to October 31, 2008.
G Expense ratios reflect operating expenses of the class. Expenses before reductions do not reflect amounts reimbursed by the investment adviser or reductions from brokerage service arrangements or reductions from other expense offset arrangements and do not represent the amount paid by the class during periods when reimbursements or reductions occur. Expense ratios before reductions for start-up periods may not be representative of longer-term operating periods. Expenses net of fee waivers reflect expenses after reimbursement by the investment adviser but prior to reductions from brokerage service arrangements or other expense offset arrangements. Expenses net of all reductions represent the net expenses paid by the class.
H Amount represents less than $.01 per share.
I Total distributions of $.07 per share is comprised of distributions from net investment income of $.046 and distributions from net realized gain of $.025 per share.
See accompanying notes which are an integral part of the financial statements.
Annual Report
Financial Highlights - Class T
Years ended October 31, | 2011 | 2010 | 2009 | 2008 F |
Selected Per-Share Data | | | | |
Net asset value, beginning of period | $ 8.38 | $ 7.00 | $ 5.45 | $ 10.00 |
Income from Investment Operations | | | | |
Net investment income (loss) C | .06 | .04 | .03 | .05 |
Net realized and unrealized gain (loss) | (.31) | 1.39 | 1.55 | (4.60) |
Total from investment operations | (.25) | 1.43 | 1.58 | (4.55) |
Distributions from net investment income | (.04) | (.02) | (.03) | - |
Distributions from net realized gain | (.01) | (.03) | - | - |
Total distributions | (.05) | (.05) | (.03) | - |
Redemption fees added to paid in capital C, H | - | - | - | - |
Net asset value, end of period | $ 8.08 | $ 8.38 | $ 7.00 | $ 5.45 |
Total Return A, B | (3.03)% | 20.47% | 29.22% | (45.50)% |
Ratios to Average Net Assets D, G | | | | |
Expenses before reductions | 2.03% | 2.41% | 2.67% | 3.07% |
Expenses net of fee waivers, if any | 1.70% | 1.75% | 1.75% | 1.75% |
Expenses net of all reductions | 1.68% | 1.73% | 1.73% | 1.73% |
Net investment income (loss) | .67% | .49% | .59% | .55% |
Supplemental Data | | | | |
Net assets, end of period (000 omitted) | $ 2,917 | $ 1,034 | $ 532 | $ 507 |
Portfolio turnover rate E | 68% | 87% | 116% | 115% |
A Total returns would have been lower if certain expenses had not been reduced during the applicable periods shown.
B Total returns do not include the effect of the sales charges.
C Calculated based on average shares outstanding during the period.
D Fees and expenses of any underlying Fidelity Central Funds are not included in the Fund's expense ratio. The Fund indirectly bears its proportionate share of the expenses of any underlying Fidelity Central Funds.
E Amount does not include the portfolio activity of any underlying Fidelity Central Funds.
F For the period November 1, 2007 (commencement of operations) to October 31, 2008.
G Expense ratios reflect operating expenses of the class. Expenses before reductions do not reflect amounts reimbursed by the investment adviser or reductions from brokerage service arrangements or reductions from other expense offset arrangements and do not represent the amount paid by the class during periods when reimbursements or reductions occur. Expense ratios before reductions for start-up periods may not be representative of longer-term operating periods. Expenses net of fee waivers reflect expenses after reimbursement by the investment adviser but prior to reductions from brokerage service arrangements or other expense offset arrangements. Expenses net of all reductions represent the net expenses paid by the class.
H Amount represents less than $.01 per share.
See accompanying notes which are an integral part of the financial statements.
Annual Report
Financial Highlights - Class B
Years ended October 31, | 2011 | 2010 | 2009 | 2008 F |
Selected Per-Share Data | | | | |
Net asset value, beginning of period | $ 8.36 | $ 6.98 | $ 5.42 | $ 10.00 |
Income from Investment Operations | | | | |
Net investment income (loss) C | .01 | - H | .01 | - H |
Net realized and unrealized gain (loss) | (.30) | 1.38 | 1.55 | (4.58) |
Total from investment operations | (.29) | 1.38 | 1.56 | (4.58) |
Distributions from net investment income | (.01) | - | - | - |
Distributions from net realized gain | - H | - | - | - |
Total distributions | (.01) | - | - | - |
Redemption fees added to paid in capital C, H | - | - | - | - |
Net asset value, end of period | $ 8.06 | $ 8.36 | $ 6.98 | $ 5.42 |
Total Return A, B | (3.47)% | 19.77% | 28.78% | (45.80)% |
Ratios to Average Net Assets D, G | | | | |
Expenses before reductions | 2.55% | 2.87% | 3.17% | 3.55% |
Expenses net of fee waivers, if any | 2.20% | 2.25% | 2.25% | 2.25% |
Expenses net of all reductions | 2.18% | 2.23% | 2.23% | 2.23% |
Net investment income (loss) | .17% | (.01)% | .09% | .05% |
Supplemental Data | | | | |
Net assets, end of period (000 omitted) | $ 473 | $ 581 | $ 328 | $ 642 |
Portfolio turnover rate E | 68% | 87% | 116% | 115% |
A Total returns would have been lower if certain expenses had not been reduced during the applicable periods shown.
B Total returns do not include the effect of the contingent deferred sales charge.
C Calculated based on average shares outstanding during the period.
D Fees and expenses of any underlying Fidelity Central Funds are not included in the Fund's expense ratio. The Fund indirectly bears its proportionate share of the expenses of any underlying Fidelity Central Funds.
E Amount does not include the portfolio activity of any underlying Fidelity Central Funds.
F For the period November 1, 2007 (commencement of operations) to October 31, 2008.
G Expense ratios reflect operating expenses of the class. Expenses before reductions do not reflect amounts reimbursed by the investment adviser or reductions from brokerage service arrangements or reductions from other expense offset arrangements and do not represent the amount paid by the class during periods when reimbursements or reductions occur. Expense ratios before reductions for start-up periods may not be representative of longer-term operating periods. Expenses net of fee waivers reflect expenses after reimbursement by the investment adviser but prior to reductions from brokerage service arrangements or other expense offset arrangements. Expenses net of all reductions represent the net expenses paid by the class.
H Amount represents less than $.01 per share.
See accompanying notes which are an integral part of the financial statements.
Annual Report
Financial Highlights - Class C
Years ended October 31, | 2011 | 2010 | 2009 | 2008 F |
Selected Per-Share Data | | | | |
Net asset value, beginning of period | $ 8.34 | $ 6.98 | $ 5.42 | $ 10.00 |
Income from Investment Operations | | | | |
Net investment income (loss) C | .01 | - H | .01 | - H |
Net realized and unrealized gain (loss) | (.31) | 1.38 | 1.55 | (4.58) |
Total from investment operations | (.30) | 1.38 | 1.56 | (4.58) |
Distributions from net investment income | (.01) | - | - | - |
Distributions from net realized gain | (.01) | (.02) | - | - |
Total distributions | (.01) I | (.02) | - | - |
Redemption fees added to paid in capital C, H | - | - | - | - |
Net asset value, end of period | $ 8.03 | $ 8.34 | $ 6.98 | $ 5.42 |
Total Return A, B | (3.57)% | 19.82% | 28.78% | (45.80)% |
Ratios to Average Net Assets D, G | | | | |
Expenses before reductions | 2.52% | 2.89% | 3.21% | 3.52% |
Expenses net of fee waivers, if any | 2.20% | 2.25% | 2.25% | 2.25% |
Expenses net of all reductions | 2.18% | 2.24% | 2.23% | 2.23% |
Net investment income (loss) | .17% | (.01)% | .09% | .05% |
Supplemental Data | | | | |
Net assets, end of period (000 omitted) | $ 2,767 | $ 1,261 | $ 780 | $ 684 |
Portfolio turnover rate E | 68% | 87% | 116% | 115% |
A Total returns would have been lower if certain expenses had not been reduced during the applicable periods shown.
B Total returns do not include the effect of the contingent deferred sales charge.
C Calculated based on average shares outstanding during the period.
D Fees and expenses of any underlying Fidelity Central Funds are not included in the Fund's expense ratio. The Fund indirectly bears its proportionate share of the expenses of any underlying Fidelity Central Funds.
E Amount does not include the portfolio activity of any underlying Fidelity Central Funds.
F For the period November 1, 2007 (commencement of operations) to October 31, 2008.
G Expense ratios reflect operating expenses of the class. Expenses before reductions do not reflect amounts reimbursed by the investment adviser or reductions from brokerage service arrangements or reductions from other expense offset arrangements and do not represent the amount paid by the class during periods when reimbursements or reductions occur. Expense ratios before reductions for start-up periods may not be representative of longer-term operating periods. Expenses net of fee waivers reflect expenses after reimbursement by the investment adviser but prior to reductions from brokerage service arrangements or other expense offset arrangements. Expenses net of all reductions represent the net expenses paid by the class.
H Amount represents less than $.01 per share.
I Total distributions of $.01 per share is comprised of distributions from net investment income of $.008 and distributions from net realized gain of $.005 per share.
See accompanying notes which are an integral part of the financial statements.
Annual Report
Financial Highlights - International Growth
Years ended October 31, | 2011 | 2010 | 2009 | 2008 E |
Selected Per-Share Data | | | | |
Net asset value, beginning of period | $ 8.40 | $ 7.02 | $ 5.48 | $ 10.00 |
Income from Investment Operations | | | | |
Net investment income (loss) B | .10 | .07 | .06 | .09 |
Net realized and unrealized gain (loss) | (.30) | 1.39 | 1.54 | (4.60) |
Total from investment operations | (.20) | 1.46 | 1.60 | (4.51) |
Distributions from net investment income | (.07) | (.06) | (.06) | (.01) |
Distributions from net realized gain | (.01) | (.03) | - | - |
Total distributions | (.08) | (.08) H | (.06) | (.01) |
Redemption fees added to paid in capital B, G | - | - | - | - |
Net asset value, end of period | $ 8.12 | $ 8.40 | $ 7.02 | $ 5.48 |
Total Return A | (2.47)% | 20.97% | 29.77% | (45.17)% |
Ratios to Average Net Assets C, F | | | | |
Expenses before reductions | 1.52% | 1.89% | 2.19% | 2.35% |
Expenses net of fee waivers, if any | 1.20% | 1.25% | 1.25% | 1.25% |
Expenses net of all reductions | 1.18% | 1.23% | 1.23% | 1.23% |
Net investment income (loss) | 1.17% | .99% | 1.09% | 1.05% |
Supplemental Data | | | | |
Net assets, end of period (000 omitted) | $ 53,437 | $ 28,454 | $ 18,254 | $ 11,884 |
Portfolio turnover rate D | 68% | 87% | 116% | 115% |
A Total returns would have been lower if certain expenses had not been reduced during the applicable periods shown.
B Calculated based on average shares outstanding during the period.
C Fees and expenses of any underlying Fidelity Central Funds are not included in the Fund's expense ratio. The Fund indirectly bears its proportionate share of the expenses of any underlying Fidelity Central Funds.
D Amount does not include the portfolio activity of any underlying Fidelity Central Funds.
E For the period November 1, 2007 (commencement of operations) to October 31, 2008.
F Expense ratios reflect operating expenses of the class. Expenses before reductions do not reflect amounts reimbursed by the investment adviser or reductions from brokerage service arrangements or reductions from other expense offset arrangements and do not represent the amount paid by the class during periods when reimbursements or reductions occur. Expense ratios before reductions for start-up periods may not be representative of longer-term operating periods. Expenses net of fee waivers reflect expenses after reimbursement by the investment adviser but prior to reductions from brokerage service arrangements or other expense offset arrangements. Expenses net of all reductions represent the net expenses paid by the class.
G Amount represents less than $.01 per share.
H Total distributions of $.08 per share is comprised of distributions from net investment income of $.057 and distributions from net realized gain of $.025 per share.
See accompanying notes which are an integral part of the financial statements.
Annual Report
Financial Highlights - Institutional Class
Years ended October 31, | 2011 | 2010 | 2009 | 2008 E |
Selected Per-Share Data | | | | |
Net asset value, beginning of period | $ 8.40 | $ 7.02 | $ 5.48 | $ 10.00 |
Income from Investment Operations | | | | |
Net investment income (loss) B | .10 | .07 | .06 | .09 |
Net realized and unrealized gain (loss) | (.30) | 1.39 | 1.54 | (4.60) |
Total from investment operations | (.20) | 1.46 | 1.60 | (4.51) |
Distributions from net investment income | (.07) | (.06) | (.06) | (.01) |
Distributions from net realized gain | (.01) | (.03) | - | - |
Total distributions | (.08) | (.08) H | (.06) | (.01) |
Redemption fees added to paid in capital B, G | - | - | - | - |
Net asset value, end of period | $ 8.12 | $ 8.40 | $ 7.02 | $ 5.48 |
Total Return A | (2.47)% | 20.97% | 29.77% | (45.17)% |
Ratios to Average Net Assets C, F | | | | |
Expenses before reductions | 1.50% | 1.92% | 2.01% | 2.56% |
Expenses net of fee waivers, if any | 1.20% | 1.25% | 1.25% | 1.25% |
Expenses net of all reductions | 1.18% | 1.23% | 1.23% | 1.23% |
Net investment income (loss) | 1.17% | .99% | 1.09% | 1.05% |
Supplemental Data | | | | |
Net assets, end of period (000 omitted) | $ 493 | $ 113 | $ 36 | $ 521 |
Portfolio turnover rate D | 68% | 87% | 116% | 115% |
A Total returns would have been lower if certain expenses had not been reduced during the applicable periods shown.
B Calculated based on average shares outstanding during the period.
C Fees and expenses of any underlying Fidelity Central Funds are not included in the Fund's expense ratio. The Fund indirectly bears its proportionate share of the expenses of any underlying Fidelity Central Funds.
D Amount does not include the portfolio activity of any underlying Fidelity Central Funds.
E For the period November 1, 2007 (commencement of operations) to October 31, 2008.
F Expense ratios reflect operating expenses of the class. Expenses before reductions do not reflect amounts reimbursed by the investment adviser or reductions from brokerage service arrangements or reductions from other expense offset arrangements and do not represent the amount paid by the class during periods when reimbursements or reductions occur. Expense ratios before reductions for start-up periods may not be representative of longer-term operating periods. Expenses net of fee waivers reflect expenses after reimbursement by the investment adviser but prior to reductions from brokerage service arrangements or other expense offset arrangements. Expenses net of all reductions represent the net expenses paid by the class.
G Amount represents less than $.01 per share.
H Total distributions of $.08 per share is comprised of distributions from net investment income of $.057 and distributions from net realized gain of $.025 per share.
See accompanying notes which are an integral part of the financial statements.
Annual Report
Notes to Financial Statements
For the period ended October 31, 2011
1. Organization.
Fidelity International Growth Fund (the Fund) is a fund of Fidelity Investment Trust (the Trust) and is authorized to issue an unlimited number of shares. The Trust is registered under the Investment Company Act of 1940, as amended (the 1940 Act), as an open-end management investment company organized as a Massachusetts business trust. The Fund offers Class A, Class T, Class C, International Growth and Institutional Class shares, each of which, along with Class B shares, has equal rights as to assets and voting privileges. Effective after the close of business on September 1, 2010, Class B shares were closed to new accounts and additional purchases, except for exchanges and reinvestments by existing shareholders. Each class has exclusive voting rights with respect to matters that affect that class. Class B shares will automatically convert to Class A shares after a holding period of seven years from the initial date of purchase. Investment income, realized and unrealized capital gains and losses, the common expenses of the Fund, and certain fund-level expense reductions, if any, are allocated on a pro-rata basis to each class based on the relative net assets of each class to the total net assets of the Fund. Each class differs with respect to transfer agent and distribution and service plan fees incurred. Certain expense reductions may also differ by class. The Fund's investments in emerging markets can be subject to social, economic, regulatory, and political uncertainties and can be extremely volatile.
2. Investments in Fidelity Central Funds.
The Fund invests in Fidelity Central Funds, which are open-end investment companies available only to other investment companies and accounts managed by Fidelity Management & Research Company (FMR) and its affiliates. The Fund's Schedule of Investments lists each of the Fidelity Central Funds held as of period end, if any, as an investment of the Fund, but does not include the underlying holdings of each Fidelity Central Fund. As an Investing Fund, the Fund indirectly bears its proportionate share of the expenses of the underlying Fidelity Central Funds.
The Money Market Central Funds seek preservation of capital and current income and are managed by Fidelity Investments Money Management, Inc. (FIMM), an affiliate of FMR.
A complete unaudited list of holdings for each Fidelity Central Fund is available upon request or at the Securities and Exchange Commission (the SEC) web site at www.sec.gov. In addition, the financial statements of the Fidelity Central Funds, which are not covered by the Fund's Report of Independent Registered Public Accounting Firm, are available on the SEC web site or upon request.
Annual Report
3. Significant Accounting Policies.
The financial statements have been prepared in conformity with accounting principles generally accepted in the United States of America (GAAP), which require management to make certain estimates and assumptions at the date of the financial statements. Actual results could differ from those estimates. Subsequent events, if any, through the date that the financial statements were issued have been evaluated in the preparation of the financial statements. The following summarizes the significant accounting policies of the Fund:
Security Valuation. Investments are valued as of 4:00 p.m. Eastern time on the last calendar day of the period. The Fund uses independent pricing services approved by the Board of Trustees to value its investments. When current market prices or quotations are not readily available or reliable, valuations may be determined in good faith in accordance with procedures adopted by the Board of Trustees. Factors used in determining value may include market or security specific events. The frequency with which these procedures are used cannot be predicted and they may be utilized to a significant extent. The value used for net asset value (NAV) calculation under these procedures may differ from published prices for the same securities.
The Fund categorizes the inputs to valuation techniques used to value its investments into a disclosure hierarchy consisting of three levels as shown below:
Level 1 - quoted prices in active markets for identical investments
Level 2 - other significant observable inputs (including quoted prices for similar investments, interest rates, prepayment speeds, etc.)
Level 3 - unobservable inputs (including the Fund's own assumptions based on the best information available)
Changes in valuation techniques may result in transfers in or out of an assigned level within the disclosure hierarchy. The aggregate value of investments by input level, as of October 31, 2011, is included at the end of the Fund's Schedule of Investments. Valuation techniques used to value the Fund's investments by major category are as follows:
Equity securities, including restricted securities, for which market quotations are readily available, are valued at the last reported sale price or official closing price as reported by an independent pricing service on the primary market or exchange on which they are traded and are categorized as Level 1 in the hierarchy. In the event there were no sales during the day or closing prices are not available, securities are valued at the last quoted bid price or may be valued using the last available price and are generally categorized as Level 2 in the hierarchy. For foreign equity securities, when significant market or security specific events arise, comparisons to the valuation of American Depositary Receipts
Annual Report
Notes to Financial Statements - continued
3. Significant Accounting Policies - continued
Security Valuation - continued
(ADRs), futures contracts, Exchange-traded funds (ETFs) and certain indexes as well as quoted prices for similar securities are used and are categorized as Level 2 in the hierarchy in these circumstances. Utilizing these techniques may result in transfers between Level 1 and Level 2. For restricted equity securities and private placements where observable inputs are limited, assumptions about market activity and risk are used and are categorized as Level 3 in the hierarchy.
Investments in open-end mutual funds, including the Fidelity Central Funds, are valued at their closing net asset value each business day and are categorized as Level 1 in the hierarchy.
Foreign Currency. The Fund may use foreign currency contracts to facilitate transactions in foreign-denominated securities. Gains and losses from these transactions may arise from changes in the value of the foreign currency or if the counterparties do not perform under the contracts' terms.
Foreign-denominated assets, including investment securities, and liabilities are translated into U.S. dollars at the exchange rate at period end. Purchases and sales of investment securities, income and dividends received and expenses denominated in foreign currencies are translated into U.S. dollars at the exchange rate in effect on the transaction date.
The effects of exchange rate fluctuations on investments are included with the net realized and unrealized gain (loss) on investment securities. Other foreign currency transactions resulting in realized and unrealized gain (loss) are disclosed separately.
Investment Transactions and Income. For financial reporting purposes, the Fund's investment holdings and NAV include trades executed through the end of the last business day of the period. The NAV per share for processing shareholder transactions is calculated as of the close of business of the New York Stock Exchange (NYSE), normally 4:00 p.m. Eastern time and includes trades executed through the end of the prior business day. Gains and losses on securities sold are determined on the basis of identified cost. Dividend income is recorded on the ex-dividend date, except for certain dividends from foreign securities where the ex-dividend date may have passed, which are recorded as soon as the Fund is informed of the ex-dividend date. Non-cash dividends included in dividend income, if any, are recorded at the fair market value of the securities received. Distributions received on securities that represent a return of capital or capital gain are recorded as a reduction of cost of investments and/or as a realized gain. The Fund estimates the components of distributions received that may be considered return of
Annual Report
3. Significant Accounting Policies - continued
Investment Transactions and Income - continued
capital distributions or capital gain distributions. Interest income and distributions from the Fidelity Central Funds are accrued as earned. Interest income includes coupon interest and amortization of premium and accretion of discount on debt securities. Investment income is recorded net of foreign taxes withheld where recovery of such taxes is uncertain.
Expenses. Expenses directly attributable to a fund are charged to that fund. Expenses attributable to more than one fund are allocated among the respective funds on the basis of relative net assets or other appropriate methods. Expense estimates are accrued in the period to which they relate and adjustments are made when actual amounts are known.
Income Tax Information and Distributions to Shareholders. Each year, the Fund intends to qualify as a regulated investment company, including distributing substantially all of its taxable income and realized gains under Subchapter M of the Internal Revenue Code and filing its U.S. federal tax return. As a result, no provision for income taxes is required. As of October 31, 2011, the Fund did not have any unrecognized tax benefits in the financial statements. A fund's federal tax return is subject to examination by the Internal Revenue Service (IRS) for a period of three years. Foreign taxes are provided for based on the Fund's understanding of the tax rules and rates that exist in the foreign markets in which it invests.
Distributions are declared and recorded on the ex-dividend date. Income dividends and capital gain distributions are declared separately for each class. Income and capital gain distributions are determined in accordance with income tax regulations, which may differ from GAAP.
Capital accounts within the financial statements are adjusted for permanent book-tax differences. These adjustments have no impact on net assets or the results of operations. Temporary book-tax differences will reverse in a subsequent period.
Book-tax differences are primarily due to foreign currency transactions, passive foreign investment companies (PFIC), partnerships, capital loss carryforwards and losses deferred due to wash sales.
The federal tax cost of investment securities and unrealized appreciation (depreciation) as of period end were as follows:
Gross unrealized appreciation | $ 4,011,207 |
Gross unrealized depreciation | (5,680,632) |
Net unrealized appreciation (depreciation) on securities and other investments | $ (1,669,425) |
| |
Tax Cost | $ 73,974,165 |
Annual Report
Notes to Financial Statements - continued
3. Significant Accounting Policies - continued
Income Tax Information and Distributions to Shareholders - continued
The tax-based components of distributable earnings as of period end were as follows:
Undistributed ordinary income | $ 623,318 |
Capital loss carryforward | $ (4,617,271) |
Net unrealized appreciation (depreciation) | $ (1,668,413) |
Under the recently enacted Regulated Investment Company Modernization Act of 2010 (the Act), the Fund will be permitted to carry forward capital losses incurred in taxable years beginning after December 22, 2010 for an unlimited period. However, any losses incurred during those future taxable years will be required to be utilized prior to any losses incurred in pre-enactment taxable years, which generally expire after eight years from when they are incurred. Additionally, post-enactment capital losses that are carried forward will retain their character as either short-term or long-term capital losses rather than being considered all short-term as under previous law. The Fund's first fiscal year end subject to the Act will be October 31 2012.
The tax character of distributions paid was as follows:
| October 31, 2011 | October 31, 2010 |
Ordinary Income | $ 324,699 | $ 245,729 |
Short-Term Trading (Redemption) Fees. Shares held by investors in the Fund less than 30 days are subject to a redemption fee equal to 1.00% of the net asset value of shares redeemed. All redemption fees, which reduce the proceeds of the shareholder redemption, are retained by the Fund and accounted for as an addition to paid in capital.
New Accounting Pronouncement. In May 2011, the Financial Accounting Standards Board issued Accounting Standard Update No. 2011-04, Fair Value Measurement (Topic 820) - Amendments to Achieve Common Fair Value Measurement and Disclosure Requirements in U.S. GAAP and IFRSs. The update changes the wording used to describe the requirements in GAAP for measuring fair value and for disclosing information about fair value measurements. The update is effective during interim and annual periods beginning after December 15, 2011. Management is currently evaluating the impact of the update's adoption on the Fund's financial statement disclosures.
4. Purchases and Sales of Investments.
Purchases and sales of securities, other than short-term securities, aggregated $72,616,731 and $38,664,366, respectively.
Annual Report
5. Fees and Other Transactions with Affiliates.
Management Fee. FMR and its affiliates provide the Fund with investment management related services for which the Fund pays a monthly management fee. The management fee is the sum of an individual fund fee rate that is based on an annual rate of .45% of the Fund's average net assets and a group fee rate that averaged .26% during the period. The group fee rate is based upon the average net assets of all the mutual funds advised by FMR. The group fee rate decreases as assets under management increase and increases as assets under management decrease. In addition, the management fee is subject to a performance adjustment (up to a maximum of ± .20% of the Fund's average net assets over a 36 month performance period). The upward or downward adjustment to the management fee is based on the relative investment performance of International Growth as compared to an appropriate benchmark index. The Fund's performance adjustment took effect in November 2008. Subsequent months will be added until the performance period includes 36 months. For the period, the total annual management fee rate, including the performance adjustment, was .80% of the Fund's average net assets.
Distribution and Service Plan Fees. In accordance with Rule 12b-1 of the 1940 Act, the Fund has adopted separate Distribution and Service Plans for each class of shares. Certain classes pay Fidelity Distributors Corporation (FDC), an affiliate of FMR, separate Distribution and Service Fees, each of which is based on an annual percentage of each class' average net assets. In addition, FDC may pay financial intermediaries for selling shares of the Fund and providing shareholder support services. For the period, the Distribution and Service Fee rates, total fees and amounts retained by FDC were as follows:
| Distribution
Fee | Service
Fee | Total
Fees | Retained
by FDC |
Class A | -% | .25% | $ 12,491 | $ 190 |
Class T | .25% | .25% | 10,239 | 1 |
Class B | .75% | .25% | 5,882 | 4,518 |
Class C | .75% | .25% | 22,521 | 7,930 |
| | | $ 51,133 | $ 12,639 |
Sales Load. FDC may receive a front-end sales charge of up to 5.75% for selling Class A shares, and 3.50% for selling Class T shares, some of which is paid to financial intermediaries for selling shares of the Fund. Depending on the holding period, FDC may receive contingent deferred sales charges levied on Class A, Class T, Class B, and Class C redemptions. The deferred sales charges range from 5% to 1% for Class B, 1% for Class C, 1.00% for certain purchases of Class A shares and .25% for certain purchases of Class T shares.
Annual Report
Notes to Financial Statements - continued
5. Fees and Other Transactions with Affiliates - continued
Sales Load - continued
For the period, sales charge amounts retained by FDC were as follows:
| Retained
by FDC |
Class A | $ 7,797 |
Class T | 1,892 |
Class B* | 695 |
Class C* | 351 |
| $ 10,735 |
* When Class B and Class C shares are initially sold, FDC pays commissions from its own resources to financial intermediaries through which the sales are made.
Transfer Agent Fees. Fidelity Investments Institutional Operations Company, Inc. (FIIOC), an affiliate of FMR, is the transfer, dividend disbursing and shareholder servicing agent for each class of the Fund. FIIOC receives account fees and asset-based fees that vary according to the account size and type of account of the shareholders of the respective classes of the Fund. FIIOC pays for typesetting, printing and mailing of shareholder reports, except proxy statements. For the period, transfer agent fees for each class were as follows:
| Amount | % of
Average
Net Assets |
Class A | $ 15,298 | .31 |
Class T | 6,766 | .33 |
Class B | 1,802 | .31 |
Class C | 6,897 | .31 |
International Growth | 144,927 | .30 |
Institutional Class | 1,324 | .29 |
| $ 177,014 | |
Accounting and Security Lending Fees. Fidelity Service Company, Inc. (FSC), an affiliate of FMR, maintains the Fund's accounting records. The accounting fee is based on the level of average net assets for the month. Under a separate contract, FSC administers the security lending program. The security lending fee is based on the number and duration of lending transactions.
Brokerage Commissions. The Fund placed a portion of its portfolio transactions with brokerage firms which are affiliates of the investment adviser. The commissions paid to these affiliated firms were $670 for the period.
Annual Report
6. Committed Line of Credit.
The Fund participates with other funds managed by FMR or an affiliate in a $4.0 billion credit facility (the "line of credit") to be utilized for temporary or emergency purposes to fund shareholder redemptions or for other short-term liquidity purposes. The Fund has agreed to pay commitment fees on its pro-rata portion of the line of credit, which amounted to $165 and is reflected in Miscellaneous expenses on the Statement of Operations. During the period, there were no borrowings on this line of credit.
7. Security Lending.
The Fund lends portfolio securities through a lending agent from time to time in order to earn additional income. For equity securities, a lending agent is used and may loan securities to certain qualified borrowers, including Fidelity Capital Markets (FCM), a broker-dealer affiliated with the Fund. On the settlement date of the loan, the Fund receives collateral (in the form of U.S. Treasury obligations, letters of credit and/or cash) against the loaned securities and maintains collateral in an amount not less than 100% of the market value of the loaned securities during the period of the loan. The market value of the loaned securities is determined at the close of business of the Fund and any additional required collateral is delivered to the Fund on the next business day. If the borrower defaults on its obligation to return the securities loaned because of insolvency or other reasons, a fund could experience delays and costs in recovering the securities loaned or in gaining access to the collateral. Any cash collateral received is invested in the Fidelity Securities Lending Cash Central Fund. The value of loaned securities and cash collateral at period end are disclosed on the Fund's Statement of Assets and Liabilities. Security lending income represents the income earned on investing cash collateral, less rebates paid to borrowers and any lending agent fees associated with the loan, plus any premium payments received for lending certain types of securities. Security lending income is presented in the Statement of Operations as a component of income from Fidelity Central Funds. Total security lending income during the period amounted to $30,491. During the period, there were no securities loaned to FCM.
8. Expense Reductions.
FMR contractually agreed to reimburse each class to the extent annual operating expenses exceeded certain levels of average net assets as noted in the table below. This reimbursement will remain in place through December 31, 2012. Some expenses, for example interest expense, including commitment fees, are excluded from this reimbursement.
Annual Report
Notes to Financial Statements - continued
8. Expense Reductions - continued
The following classes were in reimbursement during the period:
| Expense
Limitations | Reimbursement
from adviser |
| | |
Class A | 1.45% | $ 15,994 |
Class T | 1.70% | 6,877 |
Class B | 2.20% | 2,026 |
Class C | 2.20% | 7,234 |
International Growth | 1.20% | 151,732 |
Institutional Class | 1.20% | 1,375 |
| | $ 185,238 |
In addition, FMR voluntarily agreed to reimburse a portion of its management fee. For the period, the amount of this reimbursement was $286.
Many of the brokers with whom FMR places trades on behalf of the Fund provided services to the Fund in addition to trade execution. These services included payments of certain expenses on behalf of the Fund totaling $9,776 for the period. In addition, through arrangements with the Fund's custodian, credits realized as a result of uninvested cash balances were used to reduce the Fund's expenses. During the period, these credits reduced the Fund's custody expenses by $114.
9. Distributions to Shareholders.
Distributions to shareholders of each class were as follows:
Years ended October 31, | 2011 | 2010 |
From net investment income | | |
Class A | $ 19,878 | $ 10,514 |
Class T | 5,087 | 1,819 |
Class B | 545 | - |
Class C | 1,547 | - |
International Growth | 247,117 | 154,599 |
Institutional Class | 2,184 | 287 |
Total | $ 276,358 | $ 167,219 |
From net realized gain | | |
Class A | $ 4,255 | $ 5,713 |
Class T | 1,455 | 2,067 |
Class B | 211 | - |
Class C | 826 | 2,797 |
International Growth | 41,245 | 67,807 |
Institutional Class | 349 | 126 |
Total | $ 48,341 | $ 78,510 |
Annual Report
10. Share Transactions.
Transactions for each class of shares were as follows:
| Shares | Dollars |
Years ended October 31, | 2011 | 2010 | 2011 | 2010 |
Class A | | | | |
Shares sold | 547,911 | 247,866 | $ 4,762,829 | $ 1,869,390 |
Reinvestment of distributions | 2,679 | 2,011 | 22,867 | 14,999 |
Shares redeemed | (133,581) | (88,980) | (1,142,023) | (650,197) |
Net increase (decrease) | 417,009 | 160,897 | $ 3,643,673 | $ 1,234,192 |
Class T | | | | |
Shares sold | 292,221 | 73,695 | $ 2,542,402 | $ 554,529 |
Reinvestment of distributions | 762 | 513 | 6,516 | 3,840 |
Shares redeemed | (55,432) | (26,780) | (470,382) | (194,364) |
Net increase (decrease) | 237,551 | 47,428 | $ 2,078,536 | $ 364,005 |
Class B | | | | |
Shares sold | 22,762 | 37,806 | $ 193,446 | $ 276,981 |
Reinvestment of distributions | 78 | - | 670 | - |
Shares redeemed | (33,639) | (15,339) | (282,311) | (113,063) |
Net increase (decrease) | (10,799) | 22,467 | $ (88,195) | $ 163,918 |
Class C | | | | |
Shares sold | 258,483 | 110,505 | $ 2,202,762 | $ 831,229 |
Reinvestment of distributions | 274 | 369 | 2,357 | 2,760 |
Shares redeemed | (65,559) | (71,336) | (555,739) | (504,821) |
Net increase (decrease) | 193,198 | 39,538 | $ 1,649,380 | $ 329,168 |
International Growth | | | | |
Shares sold | 5,799,026 | 1,971,246 | $ 50,047,832 | $ 14,829,454 |
Reinvestment of distributions | 33,184 | 28,518 | 283,553 | 212,744 |
Shares redeemed | (2,639,092) | (1,213,664) | (22,190,157) | (8,965,012) |
Net increase (decrease) | 3,193,118 | 786,100 | $ 28,141,228 | $ 6,077,186 |
Institutional Class | | | | |
Shares sold | 76,126 | 11,311 | $ 670,433 | $ 86,413 |
Reinvestment of distributions | 292 | 55 | 2,491 | 412 |
Shares redeemed | (29,187) | (3,097) | (256,318) | (23,304) |
Net increase (decrease) | 47,231 | 8,269 | $ 416,606 | $ 63,521 |
11. Other.
The Fund's organizational documents provide former and current trustees and officers with a limited indemnification against liabilities arising in connection with the performance of their duties to the Fund. In the normal course of business, the Fund may also enter into contracts that provide general indemnifications. The Fund's maximum exposure under these arrangements is unknown as this would be dependent on future claims that may be made against the Fund. The risk of material loss from such claims is considered remote.
Annual Report
To the Trustees of Fidelity Investment Trust and the Shareholders of Fidelity International Growth Fund:
In our opinion, the accompanying statement of assets and liabilities, including the schedule of investments, and the related statements of operations and of changes in net assets and the financial highlights present fairly, in all material respects, the financial position of Fidelity International Growth Fund (a fund of Fidelity Investment Trust) at October 31, 2011, the results of its operations for the year then ended, the changes in its net assets for each of the two years in the period then ended and the financial highlights for each of the periods indicated, in conformity with accounting principles generally accepted in the United States of America. These financial statements and financial highlights (hereafter referred to as "financial statements") are the responsibility of the Fidelity International Growth Fund's management. Our responsibility is to express an opinion on these financial statements based on our audits. We conducted our audits of these financial statements in accordance with the standards of the Public Company Accounting Oversight Board (United States). Those standards require that we plan and perform the audit to obtain reasonable assurance about whether the financial statements are free of material misstatement. An audit includes examining, on a test basis, evidence supporting the amounts and disclosures in the financial statements, assessing the accounting principles used and significant estimates made by management, and evaluating the overall financial statement presentation. We believe that our audits, which included confirmation of securities at October 31, 2011 by correspondence with the custodian and brokers, provide a reasonable basis for our opinion.
PricewaterhouseCoopers LLP
Boston, Massachusetts
December 9, 2011
Annual Report
The Trustees, Members of the Advisory Board, and executive officers of the trust and fund, as applicable, are listed below. The Board of Trustees governs the fund and is responsible for protecting the interests of shareholders. The Trustees are experienced executives who meet periodically throughout the year to oversee the fund's activities, review contractual arrangements with companies that provide services to the fund, oversee management of the risks associated with such activities and contractual arrangements, and review the fund's performance. Except for James C. Curvey, each of the Trustees oversees 226 funds advised by FMR or an affiliate. Mr. Curvey oversees 429 funds advised by FMR or an affiliate.
The Trustees hold office without limit in time except that (a) any Trustee may resign; (b) any Trustee may be removed by written instrument, signed by at least two-thirds of the number of Trustees prior to such removal; (c) any Trustee who requests to be retired or who has become incapacitated by illness or injury may be retired by written instrument signed by a majority of the other Trustees; and (d) any Trustee may be removed at any special meeting of shareholders by a two-thirds vote of the outstanding voting securities of the trust. Each Trustee who is not an interested person (as defined in the 1940 Act) (Independent Trustee), shall retire not later than the last day of the calendar year in which his or her 75th birthday occurs. The Independent Trustees may waive this mandatory retirement age policy with respect to individual Trustees. The executive officers and Advisory Board Members hold office without limit in time, except that any officer and Advisory Board Member may resign or may be removed by a vote of a majority of the Trustees at any regular meeting or any special meeting of the Trustees. Except as indicated, each individual has held the office shown or other offices in the same company for the past five years.
Experience, Skills, Attributes, and Qualifications of the Fund's Trustees. The Governance and Nominating Committee has adopted a statement of policy that describes the experience, qualifications, attributes, and skills that are necessary and desirable for potential Independent Trustee candidates (Statement of Policy). The Board believes that each Trustee satisfied at the time he or she was initially elected or appointed a Trustee, and continues to satisfy, the standards contemplated by the Statement of Policy. The Governance and Nominating Committee also engages professional search firms to help identify potential Independent Trustee candidates who have the experience, qualifications, attributes, and skills consistent with the Statement of Policy. From time to time, additional criteria based on the composition and skills of the current Independent Trustees, as well as experience or skills that may be appropriate in light of future changes to board composition, business conditions, and regulatory or other developments, have also been considered by the professional search firms and the Governance and Nominating Committee. In addition, the Board takes into account the Trustees' commitment and participation in Board and committee meetings, as well as their leadership of standing and ad hoc committees throughout their tenure.
In determining that a particular Trustee was and continues to be qualified to serve as a Trustee, the Board has considered a variety of criteria, none of which, in isolation, was controlling. The Board believes that, collectively, the Trustees have balanced and diverse experience, qualifications, attributes, and skills, which allow the Board to operate effectively in governing the fund and protecting the interests of shareholders. Information about the specific experience, skills, attributes, and qualifications of each Trustee, which in each case led to the Board's conclusion that the Trustee should serve (or continue to serve) as a trustee of the fund, is provided below.
Annual Report
Trustees and Officers - continued
Board Structure and Oversight Function. James C. Curvey is an interested person (as defined in the 1940 Act) and currently serves as Acting Chairman. The Trustees have determined that an interested Chairman is appropriate and benefits shareholders because an interested Chairman has a personal and professional stake in the quality and continuity of services provided to the fund. Independent Trustees exercise their informed business judgment to appoint an individual of their choosing to serve as Chairman, regardless of whether the Trustee happens to be independent or a member of management. The Independent Trustees have determined that they can act independently and effectively without having an Independent Trustee serve as Chairman and that a key structural component for assuring that they are in a position to do so is for the Independent Trustees to constitute a substantial majority for the Board. The Independent Trustees also regularly meet in executive session. Ned C. Lautenbach serves as Chairman of the Independent Trustees and as such (i) acts as a liaison between the Independent Trustees and management with respect to matters important to the Independent Trustees and (ii) with management prepares agendas for Board meetings.
Fidelity funds are overseen by different Boards of Trustees. The fund's Board oversees Fidelity's equity and high income funds and another Board oversees Fidelity's investment-grade bond, money market, and asset allocation funds. The asset allocation funds may invest in Fidelity funds overseen by the fund's Board. The use of separate Boards, each with its own committee structure, allows the Trustees of each group of Fidelity funds to focus on the unique issues of the funds they oversee, including common research, investment, and operational issues. On occasion, the separate Boards establish joint committees to address issues of overlapping consequences for the Fidelity funds overseen by each Board.
The Trustees operate using a system of committees to facilitate the timely and efficient consideration of all matters of importance to the Trustees, the fund, and fund shareholders and to facilitate compliance with legal and regulatory requirements and oversight of the fund's activities and associated risks. The Board, acting through its committees, has charged FMR and its affiliates with (i) identifying events or circumstances the occurrence of which could have demonstrably adverse effects on the fund's business and/or reputation; (ii) implementing processes and controls to lessen the possibility that such events or circumstances occur or to mitigate the effects of such events or circumstances if they do occur; and (iii) creating and maintaining a system designed to evaluate continuously business and market conditions in order to facilitate the identification and implementation processes described in (i) and (ii) above. Because the day-to-day operations and activities of the fund are carried out by or through FMR, its affiliates and other service providers, the fund's exposure to risks is mitigated but not eliminated by the processes overseen by the Trustees. While each of the Board's committees has responsibility for overseeing different aspects of the fund's activities, oversight is exercised primarily through the Operations, Audit, and Compliance Committees. In addition, the Independent Trustees have worked with FMR to enhance the Board's oversight of investment and financial risks, legal and regulatory risks, technology risks, and operational risks, including the development of additional risk reporting to the Board. For example, a working group comprised of Independent Trustees and FMR has worked and continues to work to review the Fidelity funds' valuation-related activities, reporting and risk management. Appropriate personnel, including but not limited to the fund's Chief Compliance Officer (CCO), FMR's internal auditor, the independent accountants, the fund's Treasurer and portfolio management personnel, make periodic reports to the Board's committees, as appropriate, including an annual review of FMR's risk management program for the Fidelity funds. The responsibilities of each standing committee, including their oversight responsibilities, are described further under "Standing Committees of the Fund's Trustees."
Annual Report
The fund's Statement of Additional Information (SAI) includes more information about the Trustees. To request a free copy, call Fidelity at 1-877-208-0098.
Interested Trustees*:
Correspondence intended for each Trustee who is an interested person may be sent to Fidelity Investments, 82 Devonshire Street, Boston, Massachusetts 02109.
Name, Age; Principal Occupations and Other Relevant Experience+ |
James C. Curvey (76) |
| Year of Election or Appointment: 2007 Mr. Curvey is Trustee and Acting Chairman of the Board of Trustees of certain Trusts. Mr. Curvey also serves as Trustee (2007-present) of other investment companies advised by FMR. Mr. Curvey is a Director of Fidelity Investments Money Management, Inc. (2009-present), Director of Fidelity Research & Analysis Co. (2009-present) and Director of FMR and FMR Co., Inc. (2007-present). Mr. Curvey is also Vice Chairman (2007-present) and Director of FMR LLC. In addition, Mr. Curvey serves as an Overseer for the Boston Symphony Orchestra and a member of the Trustees of Villanova University. Previously, Mr. Curvey was the Vice Chairman (2006-2007) and Director (2000-2007) of FMR Corp. |
Ronald P. O'Hanley (54) |
| Year of Election or Appointment: 2011 Mr. O'Hanley is Director of FMR Co., Inc. (2010-present), Director of Fidelity Investments Money Management, Inc. (2010-present), Director of Fidelity Research & Analysis Company (2010-present), President of Fidelity Asset Management and Corporate Services and a member of Fidelity's Executive Committee (2010-present). Previously, Mr. O'Hanley served as President and Chief Executive Officer of BNY Mellon Asset Management (2007-2010). Mr. O'Hanley also served as Vice Chairman of Bank New York Mellon Corp. and a member of that firm's Executive Committee. Prior to the 2007 merger of The Bank of New York and Mellon Financial Corporation, he was Vice Chairman of Mellon Financial Corporation and President and Chief Executive Officer of Mellon Asset Management. He joined Mellon in February 1997. Mr. O'Hanley currently serves as Chairman of the Boston Public Library Foundation Board of Directors and sits on the Board of Directors of Beth Israel Deaconess Medical Center, the Board of Trustees of the Marine Biological Laboratory and the Advisory Board of the Maxwell School of Citizenship and Public Administration at Syracuse University. Mr. O'Hanley also chairs the Council on Asset Management for the Financial Services Roundtable and is a member of the Board of Directors of Institutional Investor's U.S. Institute. |
* Trustees have been determined to be "Interested Trustees" by virtue of, among other things, their affiliation with the trust or various entities under common control with FMR.
+ The information above includes each Trustee's principal occupation during the last five years and other information relating to the experience, attributes, and skills relevant to each Trustee's qualifications to serve as a Trustee, which led to the conclusion that each Trustee should serve as a Trustee for the fund.
Annual Report
Independent Trustees:
Correspondence intended for each Independent Trustee (that is, the Trustees other than the Interested Trustees) may be sent to Fidelity Investments, P.O. Box 55235, Boston, Massachusetts 02205-5235.
Name, Age; Principal Occupations and Other Relevant Experience+ |
Dennis J. Dirks (63) |
| Year of Election or Appointment: 2005 Prior to his retirement in May 2003, Mr. Dirks was Chief Operating Officer and a member of the Board of The Depository Trust & Clearing Corporation (DTCC). He also served as President, Chief Operating Officer, and Board member of The Depository Trust Company (DTC) and President and Board member of the National Securities Clearing Corporation (NSCC). In addition, Mr. Dirks served as Chief Executive Officer and Board member of the Government Securities Clearing Corporation, Chief Executive Officer and Board member of the Mortgage-Backed Securities Clearing Corporation, as a Trustee and a member of the Finance Committee of Manhattan College (2005-2008), and as a Trustee and a member of the Finance Committee of AHRC of Nassau County (2006-2008). Mr. Dirks is a member of the Independent Directors Council (IDC) Governing Council (2010-Present) and Board of Directors for The Brookville Center for Children's Services, Inc. (2009-present). |
Alan J. Lacy (58) |
| Year of Election or Appointment: 2008 Mr. Lacy serves as Senior Adviser (2007-present) of Oak Hill Capital Partners, L.P. (private equity). Mr. Lacy also served as Chief Executive Officer (2000-2005) and Vice Chairman (2005-2006) of Sears Holdings Corporation and Sears, Roebuck and Co. (retail). In addition, Mr. Lacy serves as a member of the Board of Directors of Dave & Buster's, Inc. (restaurant and entertainment complexes, 2010-present), The Hillman Companies, Inc. (hardware wholesalers, 2010-present), and Bristol-Myers Squibb Company (global pharmaceuticals, 2007-present). Mr. Lacy is a member of the Board of Trustees of The National Parks Conservation Association (2006-Present). Previously, Mr. Lacy served as Chairman of the Board of Trustees of the National Parks Conservation Association (2008-2011) and as a member of the Board of Directors for the Western Union Company (global money transfer, 2006-2011). |
Ned C. Lautenbach (67) |
| Year of Election or Appointment: 2000 Mr. Lautenbach is Chairman of the Independent Trustees of the Equity and High Income Funds (2006-present). Mr. Lautenbach currently serves as the Lead Director of the Eaton Corporation Board of Directors (diversified industrial, 1997-present). Mr. Lautenbach is also a member of the Board of Directors of the Philharmonic Center for the Arts in Naples, Florida (1999-present); a member of the Board of Trustees of Fairfield University (2005-present); and a member of the Council on Foreign Relations (1994-present). Previously, Mr. Lautenbach was a Partner/Advisory Partner at Clayton, Dubilier & Rice, LLC (private equity investment, 1998-2010), as well as a Director of Sony Corporation (2006-2007). |
Joseph Mauriello (67) |
| Year of Election or Appointment: 2008 Prior to his retirement in January 2006, Mr. Mauriello served in numerous senior management positions including Deputy Chairman and Chief Operating Officer (2004-2005), and Vice Chairman of Financial Services (2002-2004) of KPMG LLP US (professional services, 1965-2005). Mr. Mauriello currently serves as a member of the Board of Directors of XL Group plc. (global insurance and re-insurance, 2006-present) and of Arcadia Resources Inc. (health care services and products, 2007-present). Previously, Mr. Mauriello served as a Director of the Hamilton Funds of the Bank of New York (2006-2007). |
Robert W. Selander (61) |
| Year of Election or Appointment: 2011 Previously, Mr. Selander served as a Member of the Advisory Board of Fidelity's Equity and High Income Funds (2011), Executive Vice Chairman (2010), Chief Executive Officer (2009-2010), and President and Chief Executive Officer (1997-2009) of Mastercard, Inc. |
Cornelia M. Small (67) |
| Year of Election or Appointment: 2005 Ms. Small is a member of the Board of Directors of the Teagle Foundation (2009-present). Ms. Small is also a member of the Investment Committee, and Chair (2008-present) and a member of the Board of Trustees of Smith College. In addition, Ms. Small serves on the Investment Committee of the Berkshire Taconic Community Foundation (2008-present). Previously, Ms. Small served as Chairperson of the Investment Committee (2002-2008) of Smith College. In addition, Ms. Small served as Chief Investment Officer, Director of Global Equity Investments, and a member of the Board of Directors of Scudder, Stevens & Clark and Scudder Kemper Investments. |
William S. Stavropoulos (72) |
| Year of Election or Appointment: 2001 Mr. Stavropoulos is Vice Chairman of the Independent Trustees of the Equity and High Income Funds (2006-present). Mr. Stavropoulos serves as President and Founder of the Michigan Baseball Foundation, the Great Lakes Loons (2007-present). Mr. Stavropoulos is Chairman Emeritus of the Board of Directors of The Dow Chemical Company, where he previously served in numerous senior management positions, including President, CEO (1995-2000; 2002-2004), Chairman of the Executive Committee (2000-2006), and as a member of the Board of Directors (1990-2006). Currently, Mr. Stavropoulos is Chairman of Univar (global distributor of commodity and specialty chemicals, 2010-present), a Director of Teradata Corporation (data warehousing and technology solutions, 2008-present), Chemical Financial Corporation, Maersk Inc. (industrial conglomerate), Tyco International, Inc. (multinational manufacturing and services, 2007-present), and a member of the Advisory Board for Metalmark Capital (private equity investment, 2005-present). Mr. Stavropoulos is a special advisor to Clayton, Dubilier & Rice, LLC (private equity investment). In addition, Mr. Stavropoulos is a member of the University of Notre Dame Advisory Council for the College of Science. |
David M. Thomas (62) |
| Year of Election or Appointment: 2008 Previously, Mr. Thomas served as Executive Chairman (2005-2006) and Chairman and Chief Executive Officer (2000-2005) of IMS Health, Inc. (pharmaceutical and healthcare information solutions). In addition, Mr. Thomas serves as a member of the Board of Directors of Fortune Brands, Inc. (consumer products), and Interpublic Group of Companies, Inc. (marketing communication, 2004-present). |
Michael E. Wiley (61) |
| Year of Election or Appointment: 2008 Mr. Wiley also serves as a Director of Asia Pacific Exploration Consolidated (international oil and gas exploration and production, 2008-present). Mr. Wiley serves as a Director of Tesoro Corporation (independent oil refiner and marketer, 2005-present), and a Director of Bill Barrett Corporation (exploration and production, 2005-present). In addition, Mr. Wiley also serves as a Director of Post Oak Bank (privately-held bank, 2004-present). Previously, Mr. Wiley served as a member of the Board of Trustees of the University of Tulsa (2000-2006; 2007-2010), as a Senior Energy Advisor of Katzenbach Partners, LLC (consulting, 2006-2007), as an Advisory Director of Riverstone Holdings (private investment), Chairman, President, and CEO of Baker Hughes, Inc. (oilfield services, 2000-2004), and as Director of Spinnaker Exploration Company (exploration and production, 2001-2005). |
Annual Report
Trustees and Officers - continued
+ The information above includes each Trustee's principal occupation during the last five years and other information relating to the experience, attributes, and skills relevant to each Trustee's qualifications to serve as a Trustee, which led to the conclusion that each Trustee should serve as a Trustee for the fund.
Advisory Board Members and Executive Officers:
Correspondence intended for each executive officer, Edward C. Johnson 3d, and Peter S. Lynch may be sent to Fidelity Investments, 82 Devonshire Street, Boston, Massachusetts 02109.
Name, Age; Principal Occupation |
Edward C. Johnson 3d (81) |
| Year of Election or Appointment: 2011 Member of the Advisory Board of Fidelity's Equity and High Income Funds. Mr. Johnson serves as Chief Executive Officer, Chairman, and a Director of FMR LLC, and also serves as Chairman and Director of FIL Limited. Previously, Mr. Johnson served as a Trustee and Chairman of the Board of certain Fidelity Trusts, Chairman and a Director of FMR, Chairman and a Director of FMR Co., Inc., and President of FMR LLC (2006-2007). |
Peter S. Lynch (67) |
| Year of Election or Appointment: 2003 Member of the Advisory Board of Fidelity's Equity and High Income Funds. Mr. Lynch is Vice Chairman and a Director of FMR and FMR Co., Inc. In addition, Mr. Lynch serves as a Trustee of Boston College and as the Chairman of the Inner-City Scholarship Fund. Previously, Mr. Lynch served on the Special Olympics International Board of Directors (1997-2006). |
Kenneth B. Robins (42) |
| Year of Election or Appointment: 2008 President and Treasurer of Fidelity's Equity and High Income Funds. Mr. Robins also serves as President and Treasurer (2010-present) and Assistant Treasurer (2009-present) of other Fidelity funds and is an employee of Fidelity Investments (2004-present). Previously, Mr. Robins served as Deputy Treasurer of the Fidelity funds (2005-2008) and Treasurer and Chief Financial Officer of The North Carolina Capital Management Trust: Cash and Term Portfolios (2006-2008). |
Bruce T. Herring (46) |
| Year of Election or Appointment: 2006 Vice President of certain Equity Funds. Mr. Herring also serves as Chief Investment Officer and Director of Fidelity Management & Research (U.K.) Inc. (2010-present) and Group Chief Investments Officer of FMR. Previously, Mr. Herring served as Vice President (2005-2006) and Senior Vice President (2006-2007) of Fidelity Management & Research Company, Vice President of FMR Co., Inc. (2001-2007) and as a portfolio manager for Fidelity U.S. Equity Funds. |
Brian B. Hogan (47) |
| Year of Election or Appointment: 2009 Vice President of Equity and High Income Funds. Mr. Hogan also serves as President of FMR's Equity Division (2009-present). Previously, Mr. Hogan served as Senior Vice President, Equity Research of FMR (2006-2009) and as a portfolio manager. |
Scott C. Goebel (43) |
| Year of Election or Appointment: 2008 Secretary and Chief Legal Officer (CLO) of the Fidelity funds. Mr. Goebel also serves as Secretary of Fidelity Investments Money Management, Inc. (FIMM) (2010-present) and Fidelity Research and Analysis Company (FRAC) (2010-present); Secretary and CLO of The North Carolina Capital Management Trust: Cash and Term Portfolios (2008-present); General Counsel, Secretary, and Senior Vice President of FMR (2008-present) and FMR Co., Inc. (2008-present); employed by FMR LLC or an affiliate (2001-present); Chief Legal Officer of Fidelity Management & Research (Hong Kong) Limited (2008-present) and Assistant Secretary of Fidelity Management & Research (Japan) Inc. (2008-present), and Fidelity Management & Research (U.K.) Inc. (2008-present). Previously, Mr. Goebel served as Assistant Secretary of FIMM (2008-2010), FRAC (2008-2010), and the Funds (2007-2008) and as Vice President and Secretary of Fidelity Distributors Corporation (FDC) (2005-2007). |
William C. Coffey (42) |
| Year of Election or Appointment: 2009 Assistant Secretary of Fidelity's Equity and High Income Funds. Mr. Coffey also serves as Senior Vice President and Deputy General Counsel of FMR LLC (2010-present), and is an employee of Fidelity Investments. Previously, Mr. Coffey served as Vice President and Associate General Counsel of FMR LLC (2005-2009). |
Holly C. Laurent (57) |
| Year of Election or Appointment: 2008 Anti-Money Laundering (AML) Officer of the Fidelity funds. Ms. Laurent also serves as AML Officer of The North Carolina Capital Management Trust: Cash and Term Portfolios (2008-present) and is an employee of Fidelity Investments. Previously, Ms. Laurent was Senior Vice President and Head of Legal for Fidelity Business Services India Pvt. Ltd. (2006-2008), and Senior Vice President, Deputy General Counsel and Group Head for FMR LLC (2005-2006). |
Christine Reynolds (53) |
| Year of Election or Appointment: 2008 Chief Financial Officer of the Fidelity funds. Ms. Reynolds became President of Fidelity Pricing and Cash Management Services (FPCMS) in August 2008. Ms. Reynolds served as Chief Operating Officer of FPCMS (2007-2008). Previously, Ms. Reynolds served as President, Treasurer, and Anti-Money Laundering officer of the Fidelity funds (2004-2007). |
Kenneth A. Rathgeber (64) |
| Year of Election or Appointment: 2004 Chief Compliance Officer of Fidelity's Equity and High Income Funds. Mr. Rathgeber is Chief Compliance Officer of Fidelity Management & Research (Hong Kong) Limited (2008-present), Fidelity Management & Research (Japan) Inc. (2008-present), FMR (2005-present), FMR Co., Inc. (2005-present), Fidelity Management & Research (U.K.) Inc. (2005-present), Fidelity Research & Analysis Company (2005-present), Fidelity Investments Money Management, Inc. (2005-present), Pyramis Global Advisors, LLC (2005-present), and Strategic Advisers, Inc. (2005-present). |
Jeffrey S. Christian (50) |
| Year of Election or Appointment: 2009 Deputy Treasurer of the Fidelity funds. Mr. Christian is an employee of Fidelity Investments. Previously, Mr. Christian served as Chief Financial Officer (2008-2009) of certain Fidelity funds and Senior Vice President of Fidelity Pricing and Cash Management Services (FPCMS) (2004-2009). |
Joseph F. Zambello (54) |
| Year of Election or Appointment: 2011 Deputy Treasurer of the Fidelity funds. Mr. Zambello is an employee of Fidelity Investments. Previously, Mr. Zambello served as Vice President of FMR's Program Management Group (2009-2011) and Vice President of the Transfer Agent Oversight Group (2005-2009). |
Adrien E. Deberghes (44) |
| Year of Election or Appointment: 2008 Deputy Treasurer of Fidelity's Equity and High Income Funds. Mr. Deberghes also serves as Vice President and Assistant Treasurer of Fidelity Rutland Square Trust II and Fidelity Commonwealth Trust II (2011-present), Assistant Treasurer of other Fidelity funds (2010-present), and is an employee of Fidelity Investments (2008-present). Previously, Mr. Deberghes served as Senior Vice President of Mutual Fund Administration at State Street Corporation (2007-2008), Senior Director of Mutual Fund Administration at Investors Bank & Trust (2005-2007), and Director of Finance for Dunkin' Brands (2000-2005). |
Stephanie J. Dorsey (42) |
| Year of Election or Appointment: 2010 Assistant Treasurer of Fidelity's Equity and High Income Funds. Ms. Dorsey also serves as Deputy Treasurer of other Fidelity funds (2008-present) and is an employee of Fidelity Investments (2008-present). Previously, Ms. Dorsey served as Treasurer (2004-2008) of the JPMorgan Mutual Funds and Vice President (2004-2008) of JPMorgan Chase Bank. |
John R. Hebble (53) |
| Year of Election or Appointment: 2009 Assistant Treasurer of Fidelity's Equity and High Income Funds. Mr. Hebble also serves as President (2011-present), Treasurer, and Chief Financial Officer of The North Carolina Capital Management Trust: Cash and Term Portfolios (2008-present), President and Treasurer of other Fidelity funds (2008-present) and is an employee of Fidelity Investments. |
Gary W. Ryan (53) |
| Year of Election or Appointment: 2005 Assistant Treasurer of the Fidelity funds. Mr. Ryan is an employee of Fidelity Investments. Previously, Mr. Ryan served as Vice President of Fund Reporting in Fidelity Pricing and Cash Management Services (FPCMS) (1999-2005). |
Jonathan Davis (43) |
| Year of Election or Appointment: 2010 Assistant Treasurer of the Fidelity funds. Mr. Davis is also Assistant Treasurer of Fidelity Rutland Square Trust II and Fidelity Commonwealth Trust II. Mr. Davis is an employee of Fidelity Investments. Previously, Mr. Davis served as Vice President and Associate General Counsel of FMR LLC (2003-2010). |
Annual Report
The Board of Trustees of Fidelity International Growth Fund voted to pay to shareholders of record at the opening of business on record date, the following distributions per share derived from capital gains realized from sales of portfolio securities, and dividends derived from net investment income:
| Pay Date | Record Date | Dividends | Capital Gains |
Class A | 12/05/11 | 12/02/11 | $.063 | $.006 |
| | | | |
Class T | 12/05/11 | 12/02/11 | $.051 | $.006 |
| | | | |
Class B | 12/05/11 | 12/02/11 | $- | $- |
| | | | |
Class C | 12/05/11 | 12/02/11 | $.007 | $.006 |
Class A, Class T, Class B, and Class C designates 100% of the dividends distributed during the fiscal year as amounts which may be taken into account as a dividend for purposes of the maximum rate under section 1(h)(11) of the Internal Revenue Code.
The amounts per share which represent income derived from sources within, and taxes paid to, foreign countries or possessions of the United States are as follows:
| Pay Date | Income | Taxes |
Class A | 12/06/2010 | $0.059 | $0.008 |
| 12/31/2010 | $0.008 | $0.000 |
Class T | 12/06/2010 | $0.047 | $0.008 |
| 12/31/2010 | 0.008 | $0.000 |
Class B | 12/06/2010 | $0.010 | $0.008 |
| 12/31/2010 | $0.008 | $0.000 |
Class C | 12/06/2010 | $0.012 | $0.008 |
| 12/31/2010 | $0.008 | $0.000 |
The fund will notify shareholders in January 2012 of amounts for use in preparing 2011 income tax returns.
Annual Report
Board Approval of Investment Advisory Contracts and Management Fees
Fidelity International Growth Fund
Each year, the Board of Trustees, including the Independent Trustees (together, the Board), votes on the renewal of the management contract and sub-advisory agreements (together, the Advisory Contracts) for the fund. The Board, assisted by the advice of fund counsel and Independent Trustees' counsel, requests and considers a broad range of information relevant to the renewal of the Advisory Contracts throughout the year.
The Board meets regularly and considers at each of its meetings factors that are relevant to its annual consideration of the renewal of the fund's Advisory Contracts, including the services and support provided to the fund and its shareholders. The Board has established various standing committees, each composed of Independent Trustees with varying backgrounds, to which the Board has assigned specific subject matter responsibilities in order to enhance effective decision-making by the Board. The Board, acting directly and through its Committees, requests and receives information concerning the annual consideration of the renewal of the fund's Advisory Contracts. The Board also meets as needed to consider matters specifically related to the Board's annual consideration of the renewal of Advisory Contracts. Members of the Board may also meet with trustees of other Fidelity funds through ad hoc joint committees to discuss certain matters relevant to the Fidelity funds.
At its July 2011 meeting, the Board of Trustees, including the Independent Trustees, unanimously determined to renew the fund's Advisory Contracts. In reaching its determination, the Board considered all factors it believed relevant, including (i) the nature, extent, and quality of the services to be provided to the fund and its shareholders (including the investment performance of the fund); (ii) the competitiveness of the fund's management fee and total expense ratio; (iii) the total costs of the services to be provided by and the profits to be realized by Fidelity from its relationship with the fund; (iv) the extent to which economies of scale would be realized as the fund grows; and (v) whether fee levels reflect these economies of scale, if any, for the benefit of fund shareholders.
In considering whether to renew the Advisory Contracts for the fund, the Board reached a determination, with the assistance of fund counsel and Independent Trustees' counsel and through the exercise of its business judgment, that the renewal of the Advisory Contracts is in the best interests of the fund and its shareholders and that the compensation payable under the Advisory Contracts is fair and reasonable. The Board's decision to renew the Advisory Contracts was not based on any single factor, but rather was based on a comprehensive consideration of all the information provided to the Board at its meetings throughout the year. The Board, in reaching its determination to renew the Advisory Contracts, is aware that shareholders in the fund have a broad range of investment choices available to them, including a wide choice among mutual funds offered by Fidelity's competitors, and that the fund's shareholders, who have the opportunity to review and weigh the disclosure provided by the fund in its prospectus and other public disclosures, have chosen to invest in this fund, managed by Fidelity.
Annual Report
Board Approval of Investment Advisory Contracts and
Management Fees - continued
Nature, Extent, and Quality of Services Provided. The Board considered the staffing within the investment adviser, FMR, and the sub-advisers (together, the Investment Advisers), including the backgrounds of the fund's investment personnel and the fund's investment objective and discipline. The Independent Trustees also had discussions with senior management of Fidelity's investment operations and investment groups. The Board considered the structure of the portfolio manager compensation program and whether this structure provides appropriate incentives to act in the best interests of the fund.
Resources Dedicated to Investment Management and Support Services. The Board and the Fund Oversight and Research Committees reviewed the general qualifications and capabilities of the Investment Advisers' investment staff, including its size, education, experience, and resources, as well as the Investment Advisers' approach to recruiting, training, managing, and compensating investment personnel. The Board also noted that FMR has devoted increased resources to non-U.S. offices. The Board noted that Fidelity's analysts have extensive resources, tools and capabilities which allow them to conduct sophisticated quantitative and fundamental analysis, as well as credit analysis of issuers, counterparties and enhancers. The Board also believes that Fidelity's investment professionals have sufficient access to global information and data so as to provide competitive investment results over time, and that those professionals also have access to sophisticated tools which permit them to assess portfolio construction and risk and performance attribution characteristics continuously, as well as to transmit new information and research conclusions rapidly around the world. Additionally, in their deliberations, the Board considered the Investment Advisers' trading capabilities and resources which are an integral part of the investment management process.
Shareholder and Administrative Services. The Board considered (i) the nature, extent, quality, and cost of advisory, administrative, and shareholder services performed by the Investment Advisers and their affiliates under the Advisory Contracts and under separate agreements covering transfer agency, pricing and bookkeeping, and securities lending services for the fund; (ii) the nature and extent of the investment adviser's supervision of third party service providers, principally custodians and subcustodians; and (iii) the resources devoted to, and the record of compliance with, the fund's compliance policies and procedures. The Board also reviewed the allocation of fund brokerage, including allocations to brokers affiliated with the Investment Advisers, the use of brokerage commissions to pay fund expenses, and the use of "soft" commission dollars to pay for research services.
The Board noted that the growth of fund assets over time across the complex allows Fidelity to reinvest in the development of services designed to enhance the value or convenience of the Fidelity funds as investment vehicles. These services include 24-hour access to account information and market information through telephone representatives and over the Internet, investor education materials and asset allocation tools, and the expanded availability of Fidelity Investor Centers, with 35 new branches opening since 2010.
Annual Report
Investment in a Large Fund Family. The Board considered the benefits to shareholders of investing in a Fidelity fund, including the benefits of investing in a fund that is part of a large family of funds offering a variety of investment disciplines and providing a large variety of mutual fund investor services. The Board noted that Fidelity had taken, or had made recommendations that resulted in the Fidelity funds taking, a number of actions over the previous year that benefited particular funds, including (i) continuing to dedicate additional resources to investment research and support of the senior management team that oversees asset management; (ii) rationalizing product lines through the mergers of six funds into other funds; (iii) continuing to migrate the Freedom Funds to dedicated lower cost underlying funds; (iv) obtaining shareholder approval to broaden the investment strategies for Fidelity Consumer Finance Portfolio, Fidelity Emerging Asia Fund, and Fidelity Environment and Alternative Energy Portfolio; (v) contractually agreeing to reduce the management fees and impose other expense limitations on Spartan 500 Index Fund and U.S. Bond Index Fund in connection with launching new institutional classes of these funds; (vi) changing the name, primary and supplemental benchmarks, and investment policies of Fidelity Global Strategies Fund to support the fund's flexible investment mandate and global orientation; and (vii) reducing the transfer agency account fee rates on certain accounts.
Investment Performance. The Board considered whether the fund has operated in accordance with its investment objective, as well as its record of compliance with its investment restrictions. It also reviewed the fund's absolute investment performance for each class, as well as the fund's relative investment performance for each class measured over multiple periods against (i) a broad-based securities market index, and (ii) a custom peer group of mutual funds deemed appropriate by Fidelity and reviewed by the Board. Because the fund had been in existence less than five calendar years, the following charts, considered by the Board show, over the one- and three-year periods ended December 31, 2010, the cumulative total returns of the retail class and Class C of the fund, the cumulative total returns of a broad-based securities market index ("benchmark"), and a range of cumulative total returns of a custom peer group of mutual funds defined by FMR based on categories assigned by Morningstar, Inc. The returns of the retail class and Class C show the performance of the highest and lowest performing classes, respectively (based on three-year performance). The box within each chart shows the 25th percentile return (bottom of box) and the 75th percentile return (top of box) of the peer group. Returns shown above the box are in the first quartile and returns shown below the box are in the fourth quartile. The percentage beaten numbers noted below each chart correspond to the percentile box and represent the percentage of funds in the peer group whose performance was equal to or lower than that of the class indicated. The fund's custom peer group, defined by FMR, is a peer group that FMR believes provides a more meaningful performance comparison than the peer group assigned by Morningstar, Inc., which assigns mutual funds to categories based on their investment styles as measured by their underlying portfolio holdings.
Annual Report
Board Approval of Investment Advisory Contracts and
Management Fees - continued
Fidelity International Growth Fund
The Board reviewed the fund's relative investment performance against its peer group and noted that the performance of the retail class of the fund was in the second quartile for all the periods shown. The Board also noted that the investment performance of the retail class of the fund compared favorably to its benchmark for all the periods shown. The Board considered that the variations in performance among the fund's classes reflect the variations in class expenses, which result in lower performance for higher expense classes. The Board also reviewed the fund's performance since inception as well as performance in the current year.
The Board also considered that the fund's management fee is subject to upward or downward adjustment depending upon whether, and to what extent, the fund's investment performance for the performance period exceeds, or is exceeded by, the record (over the same period) of a Board-approved performance adjustment index. The Board noted that the performance adjustment provides FMR with a strong economic incentive to seek to achieve superior performance for the fund's shareholders and helps to more closely align the interests of FMR and the fund's shareholders.
Annual Report
Based on its review, the Board concluded that the nature, extent, and quality of services provided to the fund under the Advisory Contracts should benefit the fund's shareholders.
Competitiveness of Management Fee and Total Expense Ratio. The Board considered the fund's management fee and total expense ratio compared to "mapped groups" of competitive funds and classes. Fidelity creates "mapped groups" by combining similar Lipper investment objective categories that have comparable management fee characteristics. Combining Lipper investment objective categories aids the Board's management fee and total expense ratio comparisons by broadening the competitive group used for comparison and by reducing the number of universes to which various Fidelity funds are compared.
Management Fee. The Board considered two proprietary management fee comparisons for the 12-month (or shorter) periods shown in the chart below. The group of Lipper funds used by the Board for management fee comparisons is referred to below as the "Total Mapped Group." The Total Mapped Group comparison focuses on a fund's standing relative to the total universe of comparable funds available to investors in terms of gross management fees before expense reimbursements or caps, and without giving effect to the fund's performance adjustment. "TMG %" represents the percentage of funds in the Total Mapped Group that had management fees that were lower than the fund's. For example, a TMG % of 16% means that 84% of the funds in the Total Mapped Group had higher management fees than the fund. The "Asset-Size Peer Group" (ASPG) comparison focuses on a fund's standing relative to non-Fidelity funds similar in size to the fund within the Total Mapped Group. The ASPG represents at least 15% of the funds in the Total Mapped Group with comparable asset size and management fee characteristics, subject to a minimum of 50 funds (or all funds in the Total Mapped Group if fewer than 50). Additional information, such as the ASPG quartile in which the fund's management fee ranked and the impact of the fund's performance adjustment, is also included in the chart and considered by the Board.
Annual Report
Board Approval of Investment Advisory Contracts and
Management Fees - continued
Fidelity International Growth Fund
The Board noted that the fund's management fee ranked below the median of its Total Mapped Group and below the median of its ASPG for 2010. The Board also noted the effect of the fund's positive performance adjustment on the fund's management fee ranking. The Board noted that the performance adjustment for each year represents calculations for performance periods that differ from the periods shown in the performance charts above.
Based on its review, the Board concluded that the fund's management fee is fair and reasonable in light of the services that the fund receives and the other factors considered.
Total Expense Ratio. In its review of each class's total expense ratio, the Board considered the fund's management fee as well as other fund or class expenses, as applicable, such as transfer agent fees, pricing and bookkeeping fees, fund-paid 12b-1 fees, and custodial, legal, and audit fees. The Board also noted the effects of any waivers and reimbursements on fees and expenses, as well as the impact of the fund's performance adjustment. As part of its review, the Board also considered the current and historical total expense ratios of each class of the fund compared to competitive fund median expenses. Each class of the fund is compared to those funds and classes in the Total Mapped Group (used by the Board for management fee comparisons) that have a similar sales load structure.
The Board noted that the total expense ratio of each of Class A, Class B, and the retail class ranked below its competitive median for 2010, the total expense ratio of Class C ranked equal to its competitive median for 2010, and the total expense ratio of each of Class T and Institutional Class ranked above its competitive median for 2010. The Board considered that various factors, including 12b-1 fees, positive or negative performance adjustments, and relatively higher other expenses in the case of small fund size, can affect total expense ratios. The Board noted that the total expense ratio of Class T was above the competitive median primarily because of higher 12b-1 fees on Class T. Class T has a higher 12b-1 fee, but a lower front-end sales charge, than traditionally priced front-end sales charge classes. The Board noted that the fund offers multiple classes, each of which has a different sales load and 12b-1 fee structure, and that the multiple structures are intended to offer a range of pricing options for the intermediary market. The Board also noted that the total expense ratios of the classes vary primarily by the level of their 12b-1 fees, although differences in transfer agent fees may also cause expenses to vary from class to class.
Annual Report
Fees Charged to Other Fidelity Clients. The Board also considered Fidelity fee structures and other information with respect to clients of FMR and its affiliates, such as other mutual funds advised or subadvised by FMR or its affiliates, pension plan clients, and other institutional clients. In March 2010, the Board created an ad hoc joint committee with the board of other Fidelity funds (the Committee) to review and compare Fidelity's institutional investment advisory business with its business of providing services to the Fidelity funds, including the differences in services provided, fees charged, and costs incurred, as well as competition in their respective marketplaces.
Based on its review of total expense ratios and fees charged to other Fidelity clients, the Board concluded that the total expense ratio of each class of the fund was reasonable, although in some cases above the median of the universe presented for comparison, in light of the services that the fund and its shareholders receive and the other factors considered, including the findings of the Committee.
Costs of the Services and Profitability. The Board considered the revenues earned and the expenses incurred by Fidelity in conducting the business of developing, marketing, distributing, managing, administering and servicing the fund and its shareholders. The Board also considered the level of Fidelity's profits in respect of all the Fidelity funds.
On an annual basis, FMR presents to the Board Fidelity's profitability for the fund. Fidelity calculates the profitability for each fund, as well as aggregate profitability for groups of Fidelity funds and all Fidelity funds, using a series of detailed revenue and cost allocation methodologies which originate with the books and records of Fidelity on which Fidelity's audited financial statements are based. The Audit Committee of the Board reviews any significant changes from the prior year's methodologies.
PricewaterhouseCoopers LLP (PwC), independent registered public accounting firm and auditor to Fidelity and certain Fidelity funds, has been engaged annually by the Board as part of the Board's assessment of Fidelity's profitability analysis. PwC's engagement includes the review and assessment of Fidelity's methodologies used in determining the revenues and expenses attributable to Fidelity's mutual fund business, and completion of agreed-upon procedures surrounding the mathematical accuracy of fund profitability and its conformity to allocation methodologies. After considering PwC's reports issued under the engagement and information provided by Fidelity, the Board concluded that while other allocation methods may also be reasonable, Fidelity's profitability methodologies are reasonable in all material respects.
Annual Report
Board Approval of Investment Advisory Contracts and
Management Fees - continued
The Board also reviewed Fidelity's non-fund businesses and fall-out benefits related to the mutual fund business as well as cases where Fidelity's affiliates may benefit from or be related to the fund's business.
The Board considered the costs of the services provided by and the profits realized by Fidelity in connection with the operation of the fund and was satisfied that the profitability was not excessive in the circumstances.
Economies of Scale. The Board considered whether there have been economies of scale in respect of the management of the Fidelity funds, whether the Fidelity funds (including the fund) have appropriately benefited from any such economies of scale, and whether there is potential for realization of any further economies of scale. The Board considered the extent to which the fund will benefit from economies of scale through increased services to the fund, through waivers or reimbursements, or through fee or expense reductions. The Board also noted that in 2009, it and the board of other Fidelity funds created an ad hoc committee (the Economies of Scale Committee) to analyze whether FMR attains economies of scale in respect of the management and servicing of the Fidelity funds, whether the Fidelity funds have appropriately benefited from such economies of scale, and whether there is potential for realization of any further economies of scale.
The Board recognized that the fund's management contract incorporates a "group fee" structure, which provides for lower group fee rates as total fund assets under FMR's management increase, and for higher group fee rates as total fund assets under FMR's management decrease. FMR calculates the group fee rates based on a tiered asset "breakpoint" schedule that varies based on asset class. The Board considered that the group fee is designed to deliver the benefits of economies of scale to fund shareholders when total Fidelity fund assets increase, even if assets of any particular fund are unchanged or have declined, because some portion of Fidelity's costs are attributable to services provided to all Fidelity funds, and all funds benefit if those costs can be allocated among more assets. The Board concluded that, given the group fee structure, fund shareholders will benefit from lower management fees as assets under FMR's management increase at the fund complex level, regardless of whether Fidelity achieves any such economies of scale.
Annual Report
The Board concluded, taking into account the analysis of the Economies of Scale Committee, that any potential economies of scale are being appropriately shared between fund shareholders and Fidelity.
Additional Information Requested by the Board. In order to develop fully the factual basis for consideration of the Fidelity funds' Advisory Contracts, the Board requested and received additional information on certain topics, including (i) fund performance trends, actions to be taken by FMR to improve certain funds' overall performance, and Fidelity's long-term strategies for certain funds; (ii) portfolio manager changes that have occurred during the past year and length of portfolio manager tenure for different categories of funds over time; (iii) Fidelity's compensation structure for portfolio managers and other key personnel and strategies for attracting and retaining non-investment personnel; (iv) the amount of the investment that each portfolio manager has made in the Fidelity fund(s) that he or she manages; (v) historical trends in Fidelity's realization of fall-out benefits; (vi) Fidelity's group fee structures and the rationale for the individual fee rates of certain funds; (vii) fund profitability methodology and the impact of certain factors on fund profitability results; (viii) trends regarding industry use of performance fee structures and Fidelity's compliance practices with respect to performance adjustment calculations; (ix) the fee structures in place for certain other Fidelity clients; and (x) explanations regarding the relative total expense ratios of certain funds and classes, total expense competitive trends, and actions that might be taken by FMR to reduce total expense ratios for certain funds and classes.
Based on its evaluation of all of the conclusions noted above, and after considering all factors it believed relevant, the Board ultimately concluded that the advisory fee structures are fair and reasonable, and that the fund's Advisory Contracts should be renewed.
Annual Report
Investment Adviser
Fidelity Management & Research Company
Boston, MA
Investment Sub-Advisers
FMR Co., Inc.
Fidelity Management & Research
(U.K.) Inc.
Fidelity Management & Research
(Hong Kong) Limited
Fidelity Management & Research
(Japan) Inc.
FIL Investment Advisors
FIL Investments (Japan) Limited
FIL Investment Advisors (UK) Limited
General Distributor
Fidelity Distributors Corporation
Boston, MA
Transfer and Service Agents
Fidelity Investments Institutional Operations Company, Inc.
Boston, MA
Fidelity Service Company, Inc.
Boston, MA
Custodian
State Street Bank and Trust Company
Quincy, MA
AIGF-UANN-1211
1.853348.103
(Fidelity Logo)
Fidelity Advisor®
International Growth
Fund - Institutional Class
Annual Report
October 31, 2011
(Fidelity Cover Art)
Institutional Class is
a class of Fidelity®
International Growth Fund
Contents
Chairman's Message | (Click Here) | The Chairman's message to shareholders. |
Performance | (Click Here) | How the fund has done over time. |
Management's Discussion of Fund Performance | (Click Here) | The Portfolio Manager's review of fund performance and strategy. |
Shareholder Expense Example | (Click Here) | An example of shareholder expenses. |
Investment Changes | (Click Here) | A summary of major shifts in the fund's investments over the past six months. |
Investments | (Click Here) | A complete list of the fund's investments with their market values. |
Financial Statements | (Click Here) | Statements of assets and liabilities, operations, and changes in net assets, as well as financial highlights. |
Notes | (Click Here) | Notes to financial statements. |
Report of Independent Registered Public Accounting Firm | (Click Here) | |
Trustees and Officers | (Click Here) | |
Distributions | (Click Here) | |
Board Approval of Investment Advisory Contracts and Management Fees | (Click Here) | |
To view a fund's proxy voting guidelines and proxy voting record for the 12-month period ended June 30, visit http://www.fidelity.com/proxyvotingresults or visit the Securities and Exchange Commission's (SEC) web site at http://www.sec.gov. You may also call 1-877-208-0098 to request a free copy of the proxy voting guidelines.
Standard & Poor's, S&P and S&P 500 are registered service marks of The McGraw-Hill Companies, Inc. and have been licensed for use by Fidelity Distributors Corporation.
Other third party marks appearing herein are the property of their respective owners.
All other marks appearing herein are registered or unregistered trademarks or service marks of FMR LLC or an affiliated company.
Annual Report
This report and the financial statements contained herein are submitted for the general information of the shareholders of the fund. This report is not authorized for distribution to prospective investors in the fund unless preceded or accompanied by an effective prospectus.
A fund files its complete schedule of portfolio holdings with the SEC for the first and third quarters of each fiscal year on Form N-Q. Forms N-Q are available on the SEC's web site at http://www.sec.gov. A fund's Forms N-Q may be reviewed and copied at the SEC's Public Reference Room in Washington, DC. Information regarding the operation of the SEC's Public Reference Room may be obtained by calling 1-800-SEC-0330. For a complete list of a fund's portfolio holdings, view the most recent holdings listing, semiannual report, or annual report on Fidelity's web site at http://www.fidelity.com, http://www.advisor.fidelity.com, or http://www.401k.com, as applicable.
NOT FDIC INSURED • MAY LOSE VALUE • NO BANK GUARANTEE
Neither the fund nor Fidelity Distributors Corporation is a bank.
Annual Report
(Acting Chairman's Photograph)
Dear Shareholder:
Global equity markets began the fourth quarter on a strong note, sharply reversing course in October amid strong corporate earnings, better-than-expected economic news and the promise of a resolution to the sovereign debt crisis in Europe. The mini rally followed a third quarter marked by a significant downturn in July and August, which heightened investor anxiety and set off a wave of volatility that hampered most major asset classes through the end of September. Financial markets are difficult to predict, of course, but you can help put the odds in your favor by following these time-tested investment principles.
One of the basic tenets is to invest according to your time horizon. For long-term investors, riding out the markets' inevitable ups and downs has proven much more effective than making decisions based on short-term developments. If your goal is approaching, you can also benefit from patience and restraint, rather than attempting to time the market. No matter your time horizon, missing only a few of the markets' best days can significantly diminish returns. Patience also affords the benefits of compounding - earning interest on additional income or reinvested dividends and capital gains. While staying the course doesn't eliminate risk, it can considerably lessen the negative impact of short-term downturns.
Asset allocation is another principle to manage risk. As you spread your portfolio among the asset classes, be sure to consider your time horizon, risk tolerance and investment objectives. Younger investors may be better served by emphasizing equities, which historically have been the best-performing asset class over time. Investors who are nearing a specific goal, such as retirement or sending a child to college, may choose to favor bonds and other investments that have tended to be more stable. Studies indicate that asset allocation is the single most important determinant of a portfolio's long-term success. After deciding on a suitable allocation strategy, make sure your portfolio is adequately diversified, with exposure to stocks of small-, mid- and large-cap companies in a range of sectors, for example. And today, more than ever, geographic diversification should be taken into account.
Lastly, investing a certain amount of money on a regular basis - a principle known as dollar-cost averaging - can help lower the average cost of your purchases, while also giving you the discipline to avoid selling weak performers just prior to an upswing, or chasing a hot performer just before a correction.
We invite you to learn more by visiting us on the Internet, dropping by one of our Investor Centers or calling us by phone. It is our privilege to provide the resources you need to choose investments that are right for you.
Sincerely,
(Acting Chairman's Signature)
James C. Curvey
Acting Chairman
Annual Report
Average annual total return reflects the change in the value of an investment, assuming reinvestment of the class' distributions from dividend income and capital gains (the profits earned upon the sale of securities that have grown in value, if any) and assuming a constant rate of performance each year. The $10,000 table and the fund's returns do not reflect the deduction of taxes that a shareholder would pay on fund distributions or the redemption of fund shares. During periods of reimbursement by Fidelity, a fund's total return will be greater than it would be had the reimbursement not occurred. How a fund did yesterday is no guarantee of how it will do tomorrow.
Average Annual Total Returns
Periods ended October 31, 2011 | Past 1
year | Life of
fund A |
Institutional Class | -2.47% | -4.28% |
A From November 1, 2007.
$10,000 Over Life of Fund
Let's say hypothetically that $10,000 was invested in Fidelity Advisor® International Growth Fund - Institutional Class on November 1, 2007, when the fund started. The chart shows how the value of your investment would have changed, and also shows how the MSCI® EAFE® (Europe, Australasia, Far East) Growth Index performed over the same period.
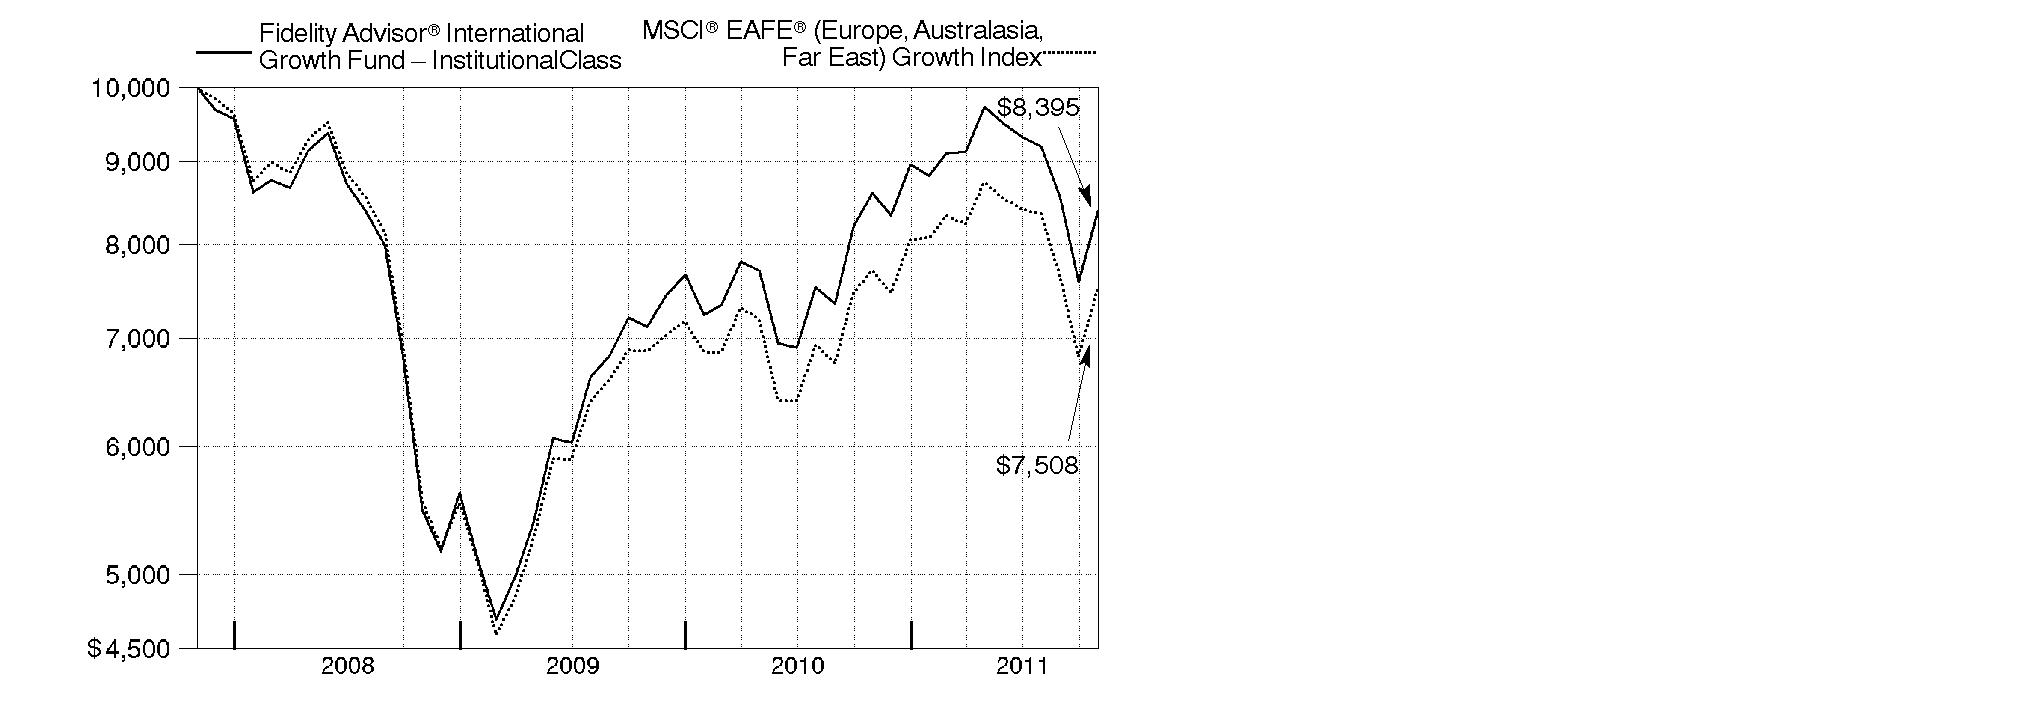
Annual Report
Market Recap: International equities were rocked by a number of headline events during the year ending October 31, 2011. Stocks posted a solid advance for the first half of the period, despite concern about the sovereign debt crisis in Europe, a devastating earthquake and tsunami in Japan, and political upheaval in the Middle East and North Africa. Sentiment turned decidedly negative in the second half, however, as fresh worries about Europe, inflation in China and a dimmed outlook for global growth caused foreign markets to suffer declines that intensified in August and September. October brought with it yet another dramatic swing, as eurozone policymakers appeared near a resolution to the debt debacle and buyers stormed back onto the scene in search of bargains. Still, those gains - along with favorable currency fluctuations overall - weren't enough to offset prior losses, and the MSCI® ACWI® (All Country World Index) ex USA Index finished the period down 4.56%. Within the MSCI index, Europe and emerging markets suffered the biggest declines, with many countries in these areas sustaining steep losses. By contrast, Japan showed resilience in the wake of its natural disasters, falling only 2%. Australia (+4%), Switzerland (+3%), the U.K. (+2%) and Canada, which produced a nominal return, were among the few major benchmark components to break into positive territory.
Comments from Jed Weiss, Portfolio Manager of Fidelity Advisor® International Growth Fund: For the year, the fund's Institutional Class shares fell 2.47%, versus a 2.69% decline in the MSCI® EAFE® (Europe, Australasia, Far East) Growth Index. Stock selection in continental Europe and Japan was helpful, while an out-of-benchmark stake in the U.S. also contributed. However, my choices within non-index emerging markets were poor, notably Brazil and Turkey, while picks in the U.K., Canada and Australia further detracted. From a sector view, positioning in information technology, consumer discretionary and financials added value. In contrast, picks in health care equipment/services, capital goods and the food/beverage/tobacco segment of consumer staples notably detracted. On an individual security basis, lacking a position in weak-performing U.K.-based bank and benchmark component Lloyds Banking Group helped, as did out-of-benchmark stakes in U.S.-based credit card processor MasterCard and baby food maker Mead Johnson Nutrition. Conversely, not owning index constituent British American Tobacco hurt. I chose to own Philip Morris International instead - another of the fund's contributors. Non-index holdings in Turkish bank Turkiye Garanti Bankasi and Canadian energy company Niko Resources also detracted.
The views expressed above reflect those of the portfolio manager(s) only through the end of the period as stated on the cover of this report and do not necessarily represent the views of Fidelity or any other person in the Fidelity organization. Any such views are subject to change at any time based upon market or other conditions and Fidelity disclaims any responsibility to update such views. These views may not be relied on as investment advice and, because investment decisions for a Fidelity fund are based on numerous factors, may not be relied on as an indication of trading intent on behalf of any Fidelity fund.
Annual Report
Shareholder Expense Example
As a shareholder of the Fund, you incur two types of costs: (1) transaction costs, including sales charges (loads) on purchase payments or redemption proceeds, redemption fees, and (2) ongoing costs, including management fees, distribution and/or service (12b-1) fees and other Fund expenses. This Example is intended to help you understand your ongoing costs (in dollars) of investing in the Fund and to compare these costs with the ongoing costs of investing in other mutual funds.
The Example is based on an investment of $1,000 invested at the beginning of the period and held for the entire period (May 1, 2011 to October 31, 2011).
Actual Expenses
The first line of the accompanying table for each class of the Fund provides information about actual account values and actual expenses. You may use the information in this line, together with the amount you invested, to estimate the expenses that you paid over the period. Simply divide your account value by $1,000.00 (for example, an $8,600 account value divided by $1,000.00 = 8.6), then multiply the result by the number in the first line for a class of the Fund under the heading entitled "Expenses Paid During Period" to estimate the expenses you paid on your account during this period. A small balance maintenance fee of $12.00 that is charged once a year may apply for certain accounts with a value of less than $2,000. This fee is not included in the table below. If it was, the estimate of expenses you paid during the period would be higher, and your ending account value lower, by this amount. In addition, the Fund, as a shareholder in the underlying Fidelity Central Funds, will indirectly bear its pro-rata share of the fees and expenses incurred by the underlying Fidelity Central Funds. These fees and expenses are not included in the Fund's annualized expense ratio used to calculate the expense estimate in the table below.
Hypothetical Example for Comparison Purposes
The second line of the accompanying table for each class of the Fund provides information about hypothetical account values and hypothetical expenses based on a Class' actual expense ratio and an assumed rate of return of 5% per year before expenses, which is not the Class' actual return. The hypothetical account values and expenses may not be used to estimate the actual ending account balance or expenses you paid for the period. You may use this information to compare the ongoing costs of investing in the Fund and other funds. To do so, compare this 5% hypothetical example with the 5% hypothetical examples that appear in the shareholder reports of the other funds. A small balance maintenance fee of $12.00 that is charged once a year may apply for certain accounts with a value of less than $2,000. This fee is not included in the table below. If it was, the estimate of expenses you paid during the period would be higher, and your ending account value lower, by this amount. In addition, the Fund, as a shareholder in the underlying Fidelity Central Funds, will indirectly bear its pro-rata share of the fees and expenses incurred by the underlying Fidelity Central Funds. These fees and expenses are not included in the Fund's annualized expense ratio used to calculate the expense estimate in the table below.
Please note that the expenses shown in the table are meant to highlight your ongoing costs only and do not reflect any transaction costs. Therefore, the second line of the table is useful in comparing ongoing costs only, and will not help you determine the relative total costs of owning different funds. In addition, if these transactional costs were included, your costs would have been higher.
Annual Report
Shareholder Expense Example - continued
| Annualized
Expense Ratio | Beginning
Account Value
May 1, 2011 | Ending
Account Value
October 31, 2011 | Expenses Paid
During Period*
May 1, 2011 to
October 31, 2011 |
Class A | 1.45% | | | |
Actual | | $ 1,000.00 | $ 861.60 | $ 6.80 |
HypotheticalA | | $ 1,000.00 | $ 1,017.90 | $ 7.38 |
Class T | 1.70% | | | |
Actual | | $ 1,000.00 | $ 860.50 | $ 7.97 |
HypotheticalA | | $ 1,000.00 | $ 1,016.64 | $ 8.64 |
Class B | 2.20% | | | |
Actual | | $ 1,000.00 | $ 858.40 | $ 10.31 |
HypotheticalA | | $ 1,000.00 | $ 1,014.12 | $ 11.17 |
Class C | 2.20% | | | |
Actual | | $ 1,000.00 | $ 857.90 | $ 10.30 |
HypotheticalA | | $ 1,000.00 | $ 1,014.12 | $ 11.17 |
International Growth | 1.20% | | | |
Actual | | $ 1,000.00 | $ 862.90 | $ 5.63 |
HypotheticalA | | $ 1,000.00 | $ 1,019.16 | $ 6.11 |
Institutional Class | 1.20% | | | |
Actual | | $ 1,000.00 | $ 862.90 | $ 5.63 |
HypotheticalA | | $ 1,000.00 | $ 1,019.16 | $ 6.11 |
A 5% return per year before expenses
* Expenses are equal to each Class' annualized expense ratio, multiplied by the average account value over the period, multiplied by 184/365 (to reflect the one-half year period).
Annual Report
Investment Changes (Unaudited)
Geographic Diversification (% of fund's net assets) |
As of October 31, 2011 |
| United Kingdom 18.5% | |
| United States of America 17.5% | |
| Switzerland 9.6% | |
| Japan 7.4% | |
| Australia 5.2% | |
| Germany 4.9% | |
| France 4.1% | |
| Belgium 3.5% | |
| Denmark 2.9% | |
| Other 26.4% | |
Percentages are adjusted for the effect of futures contracts, if applicable. |
As of April 30, 2011 |
| United Kingdom 20.2% | |
| United States of America 13.6% | |
| Switzerland 9.2% | |
| Japan 7.5% | |
| Germany 5.5% | |
| Australia 5.2% | |
| Belgium 3.5% | |
| France 3.4% | |
| Brazil 3.0% | |
| Other 28.9% | |
Percentages are adjusted for the effect of futures contracts, if applicable. |
Asset Allocation |
| % of fund's
net assets | % of fund's net assets
6 months ago |
Stocks and Investment Companies | 95.8 | 97.9 |
Short-Term Investments and Net Other Assets | 4.2 | 2.1 |
Top Ten Stocks as of October 31, 2011 |
| % of fund's
net assets | % of fund's net assets
6 months ago |
Nestle SA (Switzerland, Food Products) | 4.9 | 4.6 |
BHP Billiton PLC ADR (United Kingdom, Metals & Mining) | 3.6 | 4.4 |
Anheuser-Busch InBev SA NV (Belgium, Beverages) | 2.9 | 2.8 |
BG Group PLC (United Kingdom, Oil, Gas & Consumable Fuels) | 2.8 | 2.4 |
Linde AG (Germany, Chemicals) | 2.2 | 1.9 |
Novo Nordisk A/S Series B sponsored ADR (Denmark, Pharmaceuticals) | 2.2 | 2.1 |
Roche Holding AG (participation certificate) (Switzerland, Pharmaceuticals) | 1.8 | 1.2 |
Danone (France, Food Products) | 1.7 | 0.8 |
Siemens AG sponsored ADR (Germany, Industrial Conglomerates) | 1.7 | 2.1 |
Philip Morris International, Inc. (United States of America, Tobacco) | 1.6 | 0.7 |
| 25.4 | |
Market Sectors as of October 31, 2011 |
| % of fund's
net assets | % of fund's net assets
6 months ago |
Consumer Staples | 22.2 | 17.0 |
Materials | 15.8 | 18.2 |
Industrials | 12.7 | 14.5 |
Consumer Discretionary | 12.1 | 12.8 |
Financials | 10.4 | 13.3 |
Information Technology | 8.5 | 7.7 |
Health Care | 8.2 | 7.1 |
Energy | 5.2 | 5.5 |
Telecommunication Services | 0.7 | 0.8 |
Annual Report
Investments October 31, 2011
Showing Percentage of Net Assets
Common Stocks - 95.8% |
| Shares | | Value |
Australia - 5.2% |
Coca-Cola Amatil Ltd. | 26,816 | | $ 346,197 |
CSL Ltd. | 25,527 | | 768,921 |
MAp Group unit | 58,681 | | 209,411 |
Newcrest Mining Ltd. | 16,135 | | 570,295 |
Newcrest Mining Ltd. sponsored ADR | 8,107 | | 284,961 |
OZ Minerals Ltd. | 23,905 | | 287,097 |
QBE Insurance Group Ltd. | 11,795 | | 181,577 |
Woolworths Ltd. | 10,289 | | 257,227 |
WorleyParsons Ltd. | 18,798 | | 545,659 |
TOTAL AUSTRALIA | | 3,451,345 |
Austria - 0.8% |
Andritz AG | 4,500 | | 398,750 |
Zumtobel AG | 7,800 | | 162,672 |
TOTAL AUSTRIA | | 561,422 |
Bailiwick of Guernsey - 0.2% |
Resolution Ltd. | 31,193 | | 137,953 |
Bailiwick of Jersey - 1.2% |
Informa PLC | 26,847 | | 156,467 |
Randgold Resources Ltd. sponsored ADR | 5,835 | | 639,341 |
TOTAL BAILIWICK OF JERSEY | | 795,808 |
Belgium - 3.5% |
Anheuser-Busch InBev SA NV | 34,391 | | 1,907,468 |
Umicore SA | 9,945 | | 428,232 |
TOTAL BELGIUM | | 2,335,700 |
Bermuda - 1.4% |
Lazard Ltd. Class A | 9,492 | | 259,511 |
Li & Fung Ltd. | 266,000 | | 512,634 |
Trinity Ltd. | 200,000 | | 181,272 |
TOTAL BERMUDA | | 953,417 |
Brazil - 2.7% |
Arezzo Industria e Comercio SA | 13,600 | | 179,781 |
BM&F Bovespa SA | 55,500 | | 331,281 |
BR Malls Participacoes SA | 15,500 | | 167,438 |
Braskem SA Class A sponsored ADR | 18,900 | | 340,956 |
Iguatemi Empresa de Shopping Centers SA | 8,700 | | 168,559 |
Common Stocks - continued |
| Shares | | Value |
Brazil - continued |
Itau Unibanco Banco Multiplo SA sponsored ADR | 15,830 | | $ 302,670 |
Multiplan Empreendimentos Imobiliarios SA | 13,300 | | 268,912 |
TOTAL BRAZIL | | 1,759,597 |
Canada - 2.6% |
Agnico-Eagle Mines Ltd. (Canada) | 7,600 | | 329,662 |
Fairfax Financial Holdings Ltd. (sub. vtg.) | 1,000 | | 417,987 |
Goldcorp, Inc. | 4,900 | | 238,401 |
Niko Resources Ltd. | 5,700 | | 313,519 |
Open Text Corp. (a) | 4,800 | | 293,773 |
Pan American Silver Corp. | 5,000 | | 139,800 |
TOTAL CANADA | | 1,733,142 |
Cayman Islands - 1.3% |
NVC Lighting Holdings Ltd. | 412,000 | | 178,887 |
Sands China Ltd. (a) | 102,600 | | 308,332 |
Wynn Macau Ltd. | 129,400 | | 362,563 |
TOTAL CAYMAN ISLANDS | | 849,782 |
Chile - 0.4% |
Banco Santander Chile sponsored ADR (d) | 3,400 | | 277,712 |
China - 0.5% |
Baidu.com, Inc. sponsored ADR (a) | 2,580 | | 361,664 |
Denmark - 2.9% |
Novo Nordisk A/S Series B sponsored ADR (d) | 13,700 | | 1,456,310 |
William Demant Holding A/S (a) | 5,900 | | 470,749 |
TOTAL DENMARK | | 1,927,059 |
Finland - 1.5% |
Metso Corp. | 4,600 | | 179,138 |
Nokian Tyres PLC | 12,900 | | 473,979 |
Outotec Oyj | 8,000 | | 373,985 |
TOTAL FINLAND | | 1,027,102 |
France - 4.1% |
Alstom SA | 16,016 | | 600,659 |
Danone | 15,852 | | 1,103,460 |
Remy Cointreau SA | 3,690 | | 303,332 |
Safran SA | 20,800 | | 681,344 |
TOTAL FRANCE | | 2,688,795 |
Common Stocks - continued |
| Shares | | Value |
Germany - 4.9% |
alstria office REIT-AG | 13,500 | | $ 173,562 |
Bayerische Motoren Werke AG (BMW) | 3,422 | | 279,691 |
Linde AG | 9,241 | | 1,470,052 |
MAN SE | 2,427 | | 215,261 |
Siemens AG sponsored ADR (d) | 10,400 | | 1,091,688 |
TOTAL GERMANY | | 3,230,254 |
Hong Kong - 0.9% |
Hong Kong Exchanges and Clearing Ltd. | 33,700 | | 571,279 |
India - 0.5% |
Bharti Airtel Ltd. | 42,571 | | 340,939 |
Ireland - 1.1% |
CRH PLC sponsored ADR (d) | 19,800 | | 364,518 |
James Hardie Industries NV sponsored ADR (a) | 11,400 | | 369,702 |
TOTAL IRELAND | | 734,220 |
Israel - 0.2% |
Azrieli Group | 6,300 | | 162,097 |
Italy - 1.2% |
Fiat Industrial SpA (a) | 40,201 | | 350,773 |
Interpump Group SpA | 23,751 | | 152,972 |
Saipem SpA | 6,670 | | 299,072 |
TOTAL ITALY | | 802,817 |
Japan - 7.4% |
Autobacs Seven Co. Ltd. | 7,500 | | 343,476 |
Denso Corp. | 16,900 | | 519,797 |
Fanuc Corp. | 5,400 | | 873,239 |
Fast Retailing Co. Ltd. | 1,500 | | 269,488 |
Japan Tobacco, Inc. | 41 | | 204,951 |
Keyence Corp. | 2,420 | | 615,269 |
Kobayashi Pharmaceutical Co. Ltd. | 6,000 | | 297,454 |
Osaka Securities Exchange Co. Ltd. | 63 | | 295,260 |
SHO-BOND Holdings Co. Ltd. | 6,600 | | 147,245 |
Unicharm Corp. | 9,800 | | 438,938 |
USS Co. Ltd. | 7,010 | | 579,585 |
Yamato Kogyo Co. Ltd. | 12,900 | | 326,341 |
TOTAL JAPAN | | 4,911,043 |
Mexico - 1.1% |
Wal-Mart de Mexico SA de CV Series V | 287,100 | | 741,667 |
Common Stocks - continued |
| Shares | | Value |
Netherlands - 1.4% |
ASML Holding NV | 17,400 | | $ 729,582 |
QIAGEN NV (a)(d) | 13,300 | | 183,274 |
TOTAL NETHERLANDS | | 912,856 |
Portugal - 0.9% |
Jeronimo Martins SGPS SA | 33,075 | | 572,156 |
South Africa - 1.7% |
African Rainbow Minerals Ltd. | 14,739 | | 340,641 |
Clicks Group Ltd. | 28,722 | | 150,734 |
JSE Ltd. | 29,300 | | 259,466 |
Mr Price Group Ltd. | 28,700 | | 276,285 |
MTN Group Ltd. | 7,300 | | 127,414 |
TOTAL SOUTH AFRICA | | 1,154,540 |
Spain - 1.3% |
Inditex SA | 5,827 | | 530,288 |
Prosegur Compania de Seguridad SA (Reg.) | 6,000 | | 299,338 |
TOTAL SPAIN | | 829,626 |
Sweden - 1.9% |
Fagerhult AB | 6,100 | | 143,622 |
H&M Hennes & Mauritz AB (B Shares) | 21,979 | | 727,852 |
Swedish Match Co. | 10,400 | | 359,878 |
TOTAL SWEDEN | | 1,231,352 |
Switzerland - 9.6% |
Nestle SA | 55,720 | | 3,231,892 |
Novartis AG sponsored ADR | 4,800 | | 271,056 |
Roche Holding AG (participation certificate) | 7,212 | | 1,189,193 |
Schindler Holding AG: | | | |
(participation certificate) | 2,598 | | 305,525 |
(Reg.) | 730 | | 85,931 |
The Swatch Group AG (Bearer) | 2,280 | | 965,470 |
UBS AG (NY Shares) (a) | 26,025 | | 328,436 |
TOTAL SWITZERLAND | | 6,377,503 |
Turkey - 1.6% |
Anadolu Efes Biracilik ve Malt Sanayii AS | 12,800 | | 155,634 |
Coca-Cola Icecek AS | 23,000 | | 312,173 |
Tupras-Turkiye Petrol Rafinerileri AS | 6,687 | | 151,268 |
Turkiye Garanti Bankasi AS | 125,500 | | 442,879 |
TOTAL TURKEY | | 1,061,954 |
Common Stocks - continued |
| Shares | | Value |
United Kingdom - 18.5% |
Anglo American PLC: | | | |
ADR | 18,300 | | $ 335,805 |
(United Kingdom) | 4,800 | | 177,044 |
Babcock International Group PLC | 39,300 | | 445,260 |
BG Group PLC | 84,755 | | 1,848,950 |
BHP Billiton PLC ADR (d) | 38,300 | | 2,411,751 |
GlaxoSmithKline PLC sponsored ADR | 11,100 | | 497,169 |
Imperial Tobacco Group PLC | 9,278 | | 339,301 |
InterContinental Hotel Group PLC ADR | 25,155 | | 464,864 |
Johnson Matthey PLC | 15,624 | | 472,127 |
Reckitt Benckiser Group PLC | 13,645 | | 701,766 |
Rio Tinto PLC sponsored ADR | 13,100 | | 708,186 |
Rolls-Royce Group PLC | 53,737 | | 607,099 |
Rolls-Royce Group PLC Class C | 3,707,853 | | 5,963 |
Rotork PLC | 9,700 | | 262,696 |
SABMiller PLC | 19,566 | | 714,751 |
Serco Group PLC | 42,761 | | 357,251 |
Shaftesbury PLC | 20,033 | | 162,374 |
Standard Chartered PLC (United Kingdom) | 41,951 | | 984,323 |
Tesco PLC | 78,253 | | 505,588 |
Unite Group PLC | 48,100 | | 136,763 |
Victrex PLC | 7,600 | | 155,223 |
TOTAL UNITED KINGDOM | | 12,294,254 |
United States of America - 13.3% |
Allergan, Inc. | 3,400 | | 286,008 |
Autoliv, Inc. (d) | 8,300 | | 479,491 |
Berkshire Hathaway, Inc. Class B (a) | 8,923 | | 694,745 |
Cymer, Inc. (a) | 3,700 | | 160,765 |
eBay, Inc. (a) | 10,536 | | 335,361 |
Google, Inc. Class A (a) | 620 | | 367,437 |
ION Geophysical Corp. (a) | 35,300 | | 268,986 |
JPMorgan Chase & Co. | 6,600 | | 229,416 |
Juniper Networks, Inc. (a) | 23,500 | | 575,045 |
Lam Research Corp. (a) | 5,555 | | 238,809 |
Martin Marietta Materials, Inc. (d) | 2,300 | | 165,991 |
MasterCard, Inc. Class A | 2,600 | | 902,824 |
Mead Johnson Nutrition Co. Class A | 10,100 | | 725,685 |
Mohawk Industries, Inc. (a) | 7,000 | | 368,550 |
Nuance Communications, Inc. (a) | 5,044 | | 133,565 |
Philip Morris International, Inc. | 14,908 | | 1,041,622 |
ResMed, Inc. (a) | 11,300 | | 319,790 |
Common Stocks - continued |
| Shares | | Value |
United States of America - continued |
Solera Holdings, Inc. | 3,189 | | $ 174,215 |
Union Pacific Corp. | 5,700 | | 567,549 |
Visa, Inc. Class A | 8,900 | | 830,014 |
TOTAL UNITED STATES OF AMERICA | | 8,865,868 |
TOTAL COMMON STOCKS (Cost $64,891,214) |
63,654,923
|
Money Market Funds - 13.0% |
| | | |
Fidelity Cash Central Fund, 0.12% (b) | 3,244,067 | | 3,244,067 |
Fidelity Securities Lending Cash Central Fund, 0.11% (b)(c) | 5,405,750 | | 5,405,750 |
TOTAL MONEY MARKET FUNDS (Cost $8,649,817) |
8,649,817
|
TOTAL INVESTMENT PORTFOLIO - 108.8% (Cost $73,541,031) | | 72,304,740 |
NET OTHER ASSETS (LIABILITIES) - (8.8)% | | (5,864,357) |
NET ASSETS - 100% | $ 66,440,383 |
Legend |
(a) Non-income producing |
(b) Affiliated fund that is available only to investment companies and other accounts managed by Fidelity Investments. The rate quoted is the annualized seven-day yield of the fund at period end. A complete unaudited listing of the fund's holdings as of its most recent quarter end is available upon request. In addition, each Fidelity Central Fund's financial statements, which are not covered by the Fund's Report of Independent Registered Public Accounting Firm, are available on the SEC's website or upon request. |
(c) Investment made with cash collateral received from securities on loan. |
(d) Security or a portion of the security is on loan at period end. |
Affiliated Central Funds |
Information regarding fiscal year to date income earned by the Fund from investments in Fidelity Central Funds is as follows: |
Fund | Income earned |
Fidelity Cash Central Fund | $ 133 |
Fidelity Securities Lending Cash Central Fund | 30,491 |
Total | $ 30,624 |
Other Information |
The following is a summary of the inputs used, as of October 31, 2011, involving the Fund's assets and liabilities carried at fair value. The inputs or methodology used for valuing securities may not be an indication of the risk associated with investing in those securities. For more information on valuation inputs, and their aggregation into the levels used in the table below, please refer to the Security Valuation section in the accompanying Notes to Financial Statements. |
Valuation Inputs at Reporting Date: |
Description | Total | Level 1 | Level 2 | Level 3 |
Investments in Securities: | | | | |
Equities: | | | | |
United Kingdom | $ 12,294,254 | $ 12,294,254 | $ - | $ - |
United States of America | 8,865,868 | 8,865,868 | - | - |
Switzerland | 6,377,503 | 6,377,503 | - | - |
Japan | 4,911,043 | - | 4,911,043 | - |
Australia | 3,451,345 | 284,961 | 3,166,384 | - |
Germany | 3,230,254 | 3,230,254 | - | - |
France | 2,688,795 | 2,688,795 | - | - |
Belgium | 2,335,700 | 428,232 | 1,907,468 | - |
Denmark | 1,927,059 | 1,927,059 | - | - |
Other | 17,573,102 | 15,117,196 | 2,455,906 | - |
Money Market Funds | 8,649,817 | 8,649,817 | - | - |
Total Investments in Securities: | $ 72,304,740 | $ 59,863,939 | $ 12,440,801 | $ - |
Income Tax Information |
At October 31, 2011, the Fund had a capital loss carryforward of approximately $4,617,271 of which $1,819,472 and $2,797,799 will expire in fiscal 2016 and 2017, respectively. Capital loss carryforwards are only available to offset future capital gains of the Fund to the extent provided by regulations and may be limited. |
See accompanying notes which are an integral part of the financial statements.
Annual Report
Statement of Assets and Liabilities
| October 31, 2011 |
| | |
Assets | | |
Investment in securities, at value (including securities loaned of $4,993,707) - See accompanying schedule: Unaffiliated issuers (cost $64,891,214) | $ 63,654,923 | |
Fidelity Central Funds (cost $8,649,817) | 8,649,817 | |
Total Investments (cost $73,541,031) | | $ 72,304,740 |
Foreign currency held at value (cost $25) | | 25 |
Receivable for fund shares sold | | 215,605 |
Dividends receivable | | 77,337 |
Distributions receivable from Fidelity Central Funds | | 1,200 |
Prepaid expenses | | 325 |
Receivable from investment adviser for expense reductions | | 47,592 |
Other receivables | | 8,776 |
Total assets | | 72,655,600 |
| | |
Liabilities | | |
Payable to custodian bank | $ 86 | |
Payable for investments purchased | 556,492 | |
Payable for fund shares redeemed | 129,097 | |
Accrued management fee | 43,489 | |
Distribution and service plan fees payable | 4,953 | |
Other affiliated payables | 18,627 | |
Other payables and accrued expenses | 56,723 | |
Collateral on securities loaned, at value | 5,405,750 | |
Total liabilities | | 6,215,217 |
| | |
Net Assets | | $ 66,440,383 |
Net Assets consist of: | | |
Paid in capital | | $ 72,102,749 |
Undistributed net investment income | | 591,460 |
Accumulated undistributed net realized gain (loss) on investments and foreign currency transactions | | (5,018,547) |
Net unrealized appreciation (depreciation) on investments and assets and liabilities in foreign currencies | | (1,235,279) |
Net Assets | | $ 66,440,383 |
See accompanying notes which are an integral part of the financial statements.
Annual Report
Statement of Assets and Liabilities - continued
| October 31, 2011 |
| | |
Calculation of Maximum Offering Price
Class A:
Net Asset Value and redemption price per share ($6,352,040 ÷ 784,991 shares) | | $ 8.09 |
| | |
Maximum offering price per share (100/94.25 of $8.09) | | $ 8.58 |
Class T:
Net Asset Value and redemption price per share ($2,917,485 ÷ 360,874 shares) | | $ 8.08 |
| | |
Maximum offering price per share (100/96.50 of $8.08) | | $ 8.37 |
Class B:
Net Asset Value and offering price per share ($473,300 ÷ 58,728 shares)A | | $ 8.06 |
| | |
Class C:
Net Asset Value and offering price per share ($2,767,455 ÷ 344,459 shares)A | | $ 8.03 |
| | |
| | |
International Growth:
Net Asset Value, offering price and redemption price per share ($53,437,349 ÷ 6,578,532 shares) | | $ 8.12 |
| | |
Institutional Class:
Net Asset Value, offering price and redemption price per share ($492,754 ÷ 60,686 shares) | | $ 8.12 |
A Redemption price per share is equal to net asset value less any applicable contingent deferred sales charge.
See accompanying notes which are an integral part of the financial statements.
Annual Report
Financial Statements - continued
Statement of Operations
| Year ended October 31, 2011 |
| | |
Investment Income | | |
Dividends | | $ 1,423,446 |
Interest | | 1,263 |
Income from Fidelity Central Funds | | 30,624 |
Income before foreign taxes withheld | | 1,455,333 |
Less foreign taxes withheld | | (88,339) |
Total income | | 1,366,994 |
| | |
Expenses | | |
Management fee
Basic fee | $ 410,826 | |
Performance adjustment | 56,123 | |
Transfer agent fees | 177,014 | |
Distribution and service plan fees | 51,133 | |
Accounting and security lending fees | 30,647 | |
Custodian fees and expenses | 63,389 | |
Independent trustees' compensation | 307 | |
Registration fees | 81,018 | |
Audit | 62,443 | |
Legal | 205 | |
Miscellaneous | 356 | |
Total expenses before reductions | 933,461 | |
Expense reductions | (195,414) | 738,047 |
Net investment income (loss) | | 628,947 |
Realized and Unrealized Gain (Loss) Net realized gain (loss) on: | | |
Investment securities: | | |
Unaffiliated issuers | 1,846,627 | |
Foreign currency transactions | (28,806) | |
Total net realized gain (loss) | | 1,817,821 |
Change in net unrealized appreciation (depreciation) on: Investment securities | (6,054,664) | |
Assets and liabilities in foreign currencies | (2,910) | |
Total change in net unrealized appreciation (depreciation) | | (6,057,574) |
Net gain (loss) | | (4,239,753) |
Net increase (decrease) in net assets resulting from operations | | $ (3,610,806) |
See accompanying notes which are an integral part of the financial statements.
Annual Report
Statement of Changes in Net Assets
| Year ended
October 31,
2011 | Year ended
October 31,
2010 |
Increase (Decrease) in Net Assets | | |
Operations | | |
Net investment income (loss) | $ 628,947 | $ 244,323 |
Net realized gain (loss) | 1,817,821 | 1,690,004 |
Change in net unrealized appreciation (depreciation) | (6,057,574) | 3,221,795 |
Net increase (decrease) in net assets resulting
from operations | (3,610,806) | 5,156,122 |
Distributions to shareholders from net investment income | (276,358) | (167,219) |
Distributions to shareholders from net realized gain | (48,341) | (78,510) |
Total distributions | (324,699) | (245,729) |
Share transactions - net increase (decrease) | 35,841,228 | 8,231,990 |
Redemption fees | 7,927 | 2,560 |
Total increase (decrease) in net assets | 31,913,650 | 13,144,943 |
| | |
Net Assets | | |
Beginning of period | 34,526,733 | 21,381,790 |
End of period (including undistributed net investment income of $591,460 and undistributed net investment income of $237,573, respectively) | $ 66,440,383 | $ 34,526,733 |
See accompanying notes which are an integral part of the financial statements.
Annual Report
Financial Highlights - Class A
Years ended October 31, | 2011 | 2010 | 2009 | 2008 F |
Selected Per-Share Data | | | | |
Net asset value, beginning of period | $ 8.38 | $ 7.01 | $ 5.46 | $ 10.00 |
Income from Investment Operations | | | | |
Net investment income (loss) C | .08 | .05 | .05 | .07 |
Net realized and unrealized gain (loss) | (.31) | 1.39 | 1.55 | (4.61) |
Total from investment operations | (.23) | 1.44 | 1.60 | (4.54) |
Distributions from net investment income | (.05) | (.05) | (.05) | - |
Distributions from net realized gain | (.01) | (.03) | - | - |
Total distributions | (.06) | (.07) I | (.05) | - |
Redemption fees added to paid in capital C, H | - | - | - | - |
Net asset value, end of period | $ 8.09 | $ 8.38 | $ 7.01 | $ 5.46 |
Total Return A, B | (2.76)% | 20.68% | 29.72% | (45.40)% |
Ratios to Average Net Assets D, G | | | | |
Expenses before reductions | 1.77% | 2.13% | 2.46% | 2.88% |
Expenses net of fee waivers, if any | 1.45% | 1.50% | 1.50% | 1.50% |
Expenses net of all reductions | 1.43% | 1.48% | 1.47% | 1.48% |
Net investment income (loss) | .92% | .74% | .85% | .80% |
Supplemental Data | | | | |
Net assets, end of period (000 omitted) | $ 6,352 | $ 3,084 | $ 1,452 | $ 820 |
Portfolio turnover rate E | 68% | 87% | 116% | 115% |
A Total returns would have been lower if certain expenses had not been reduced during the applicable periods shown.
B Total returns do not include the effect of the sales charges.
C Calculated based on average shares outstanding during the period.
D Fees and expenses of any underlying Fidelity Central Funds are not included in the Fund's expense ratio. The Fund indirectly bears its proportionate share of the expenses of any underlying Fidelity Central Funds.
E Amount does not include the portfolio activity of any underlying Fidelity Central Funds.
F For the period November 1, 2007 (commencement of operations) to October 31, 2008.
G Expense ratios reflect operating expenses of the class. Expenses before reductions do not reflect amounts reimbursed by the investment adviser or reductions from brokerage service arrangements or reductions from other expense offset arrangements and do not represent the amount paid by the class during periods when reimbursements or reductions occur. Expense ratios before reductions for start-up periods may not be representative of longer-term operating periods. Expenses net of fee waivers reflect expenses after reimbursement by the investment adviser but prior to reductions from brokerage service arrangements or other expense offset arrangements. Expenses net of all reductions represent the net expenses paid by the class.
H Amount represents less than $.01 per share.
I Total distributions of $.07 per share is comprised of distributions from net investment income of $.046 and distributions from net realized gain of $.025 per share.
See accompanying notes which are an integral part of the financial statements.
Annual Report
Financial Highlights - Class T
Years ended October 31, | 2011 | 2010 | 2009 | 2008 F |
Selected Per-Share Data | | | | |
Net asset value, beginning of period | $ 8.38 | $ 7.00 | $ 5.45 | $ 10.00 |
Income from Investment Operations | | | | |
Net investment income (loss) C | .06 | .04 | .03 | .05 |
Net realized and unrealized gain (loss) | (.31) | 1.39 | 1.55 | (4.60) |
Total from investment operations | (.25) | 1.43 | 1.58 | (4.55) |
Distributions from net investment income | (.04) | (.02) | (.03) | - |
Distributions from net realized gain | (.01) | (.03) | - | - |
Total distributions | (.05) | (.05) | (.03) | - |
Redemption fees added to paid in capital C, H | - | - | - | - |
Net asset value, end of period | $ 8.08 | $ 8.38 | $ 7.00 | $ 5.45 |
Total Return A, B | (3.03)% | 20.47% | 29.22% | (45.50)% |
Ratios to Average Net Assets D, G | | | | |
Expenses before reductions | 2.03% | 2.41% | 2.67% | 3.07% |
Expenses net of fee waivers, if any | 1.70% | 1.75% | 1.75% | 1.75% |
Expenses net of all reductions | 1.68% | 1.73% | 1.73% | 1.73% |
Net investment income (loss) | .67% | .49% | .59% | .55% |
Supplemental Data | | | | |
Net assets, end of period (000 omitted) | $ 2,917 | $ 1,034 | $ 532 | $ 507 |
Portfolio turnover rate E | 68% | 87% | 116% | 115% |
A Total returns would have been lower if certain expenses had not been reduced during the applicable periods shown.
B Total returns do not include the effect of the sales charges.
C Calculated based on average shares outstanding during the period.
D Fees and expenses of any underlying Fidelity Central Funds are not included in the Fund's expense ratio. The Fund indirectly bears its proportionate share of the expenses of any underlying Fidelity Central Funds.
E Amount does not include the portfolio activity of any underlying Fidelity Central Funds.
F For the period November 1, 2007 (commencement of operations) to October 31, 2008.
G Expense ratios reflect operating expenses of the class. Expenses before reductions do not reflect amounts reimbursed by the investment adviser or reductions from brokerage service arrangements or reductions from other expense offset arrangements and do not represent the amount paid by the class during periods when reimbursements or reductions occur. Expense ratios before reductions for start-up periods may not be representative of longer-term operating periods. Expenses net of fee waivers reflect expenses after reimbursement by the investment adviser but prior to reductions from brokerage service arrangements or other expense offset arrangements. Expenses net of all reductions represent the net expenses paid by the class.
H Amount represents less than $.01 per share.
See accompanying notes which are an integral part of the financial statements.
Annual Report
Financial Highlights - Class B
Years ended October 31, | 2011 | 2010 | 2009 | 2008 F |
Selected Per-Share Data | | | | |
Net asset value, beginning of period | $ 8.36 | $ 6.98 | $ 5.42 | $ 10.00 |
Income from Investment Operations | | | | |
Net investment income (loss) C | .01 | - H | .01 | - H |
Net realized and unrealized gain (loss) | (.30) | 1.38 | 1.55 | (4.58) |
Total from investment operations | (.29) | 1.38 | 1.56 | (4.58) |
Distributions from net investment income | (.01) | - | - | - |
Distributions from net realized gain | - H | - | - | - |
Total distributions | (.01) | - | - | - |
Redemption fees added to paid in capital C, H | - | - | - | - |
Net asset value, end of period | $ 8.06 | $ 8.36 | $ 6.98 | $ 5.42 |
Total Return A, B | (3.47)% | 19.77% | 28.78% | (45.80)% |
Ratios to Average Net Assets D, G | | | | |
Expenses before reductions | 2.55% | 2.87% | 3.17% | 3.55% |
Expenses net of fee waivers, if any | 2.20% | 2.25% | 2.25% | 2.25% |
Expenses net of all reductions | 2.18% | 2.23% | 2.23% | 2.23% |
Net investment income (loss) | .17% | (.01)% | .09% | .05% |
Supplemental Data | | | | |
Net assets, end of period (000 omitted) | $ 473 | $ 581 | $ 328 | $ 642 |
Portfolio turnover rate E | 68% | 87% | 116% | 115% |
A Total returns would have been lower if certain expenses had not been reduced during the applicable periods shown.
B Total returns do not include the effect of the contingent deferred sales charge.
C Calculated based on average shares outstanding during the period.
D Fees and expenses of any underlying Fidelity Central Funds are not included in the Fund's expense ratio. The Fund indirectly bears its proportionate share of the expenses of any underlying Fidelity Central Funds.
E Amount does not include the portfolio activity of any underlying Fidelity Central Funds.
F For the period November 1, 2007 (commencement of operations) to October 31, 2008.
G Expense ratios reflect operating expenses of the class. Expenses before reductions do not reflect amounts reimbursed by the investment adviser or reductions from brokerage service arrangements or reductions from other expense offset arrangements and do not represent the amount paid by the class during periods when reimbursements or reductions occur. Expense ratios before reductions for start-up periods may not be representative of longer-term operating periods. Expenses net of fee waivers reflect expenses after reimbursement by the investment adviser but prior to reductions from brokerage service arrangements or other expense offset arrangements. Expenses net of all reductions represent the net expenses paid by the class.
H Amount represents less than $.01 per share.
See accompanying notes which are an integral part of the financial statements.
Annual Report
Financial Highlights - Class C
Years ended October 31, | 2011 | 2010 | 2009 | 2008 F |
Selected Per-Share Data | | | | |
Net asset value, beginning of period | $ 8.34 | $ 6.98 | $ 5.42 | $ 10.00 |
Income from Investment Operations | | | | |
Net investment income (loss) C | .01 | - H | .01 | - H |
Net realized and unrealized gain (loss) | (.31) | 1.38 | 1.55 | (4.58) |
Total from investment operations | (.30) | 1.38 | 1.56 | (4.58) |
Distributions from net investment income | (.01) | - | - | - |
Distributions from net realized gain | (.01) | (.02) | - | - |
Total distributions | (.01) I | (.02) | - | - |
Redemption fees added to paid in capital C, H | - | - | - | - |
Net asset value, end of period | $ 8.03 | $ 8.34 | $ 6.98 | $ 5.42 |
Total Return A, B | (3.57)% | 19.82% | 28.78% | (45.80)% |
Ratios to Average Net Assets D, G | | | | |
Expenses before reductions | 2.52% | 2.89% | 3.21% | 3.52% |
Expenses net of fee waivers, if any | 2.20% | 2.25% | 2.25% | 2.25% |
Expenses net of all reductions | 2.18% | 2.24% | 2.23% | 2.23% |
Net investment income (loss) | .17% | (.01)% | .09% | .05% |
Supplemental Data | | | | |
Net assets, end of period (000 omitted) | $ 2,767 | $ 1,261 | $ 780 | $ 684 |
Portfolio turnover rate E | 68% | 87% | 116% | 115% |
A Total returns would have been lower if certain expenses had not been reduced during the applicable periods shown.
B Total returns do not include the effect of the contingent deferred sales charge.
C Calculated based on average shares outstanding during the period.
D Fees and expenses of any underlying Fidelity Central Funds are not included in the Fund's expense ratio. The Fund indirectly bears its proportionate share of the expenses of any underlying Fidelity Central Funds.
E Amount does not include the portfolio activity of any underlying Fidelity Central Funds.
F For the period November 1, 2007 (commencement of operations) to October 31, 2008.
G Expense ratios reflect operating expenses of the class. Expenses before reductions do not reflect amounts reimbursed by the investment adviser or reductions from brokerage service arrangements or reductions from other expense offset arrangements and do not represent the amount paid by the class during periods when reimbursements or reductions occur. Expense ratios before reductions for start-up periods may not be representative of longer-term operating periods. Expenses net of fee waivers reflect expenses after reimbursement by the investment adviser but prior to reductions from brokerage service arrangements or other expense offset arrangements. Expenses net of all reductions represent the net expenses paid by the class.
H Amount represents less than $.01 per share.
I Total distributions of $.01 per share is comprised of distributions from net investment income of $.008 and distributions from net realized gain of $.005 per share.
See accompanying notes which are an integral part of the financial statements.
Annual Report
Financial Highlights - International Growth
Years ended October 31, | 2011 | 2010 | 2009 | 2008 E |
Selected Per-Share Data | | | | |
Net asset value, beginning of period | $ 8.40 | $ 7.02 | $ 5.48 | $ 10.00 |
Income from Investment Operations | | | | |
Net investment income (loss) B | .10 | .07 | .06 | .09 |
Net realized and unrealized gain (loss) | (.30) | 1.39 | 1.54 | (4.60) |
Total from investment operations | (.20) | 1.46 | 1.60 | (4.51) |
Distributions from net investment income | (.07) | (.06) | (.06) | (.01) |
Distributions from net realized gain | (.01) | (.03) | - | - |
Total distributions | (.08) | (.08) H | (.06) | (.01) |
Redemption fees added to paid in capital B, G | - | - | - | - |
Net asset value, end of period | $ 8.12 | $ 8.40 | $ 7.02 | $ 5.48 |
Total Return A | (2.47)% | 20.97% | 29.77% | (45.17)% |
Ratios to Average Net Assets C, F | | | | |
Expenses before reductions | 1.52% | 1.89% | 2.19% | 2.35% |
Expenses net of fee waivers, if any | 1.20% | 1.25% | 1.25% | 1.25% |
Expenses net of all reductions | 1.18% | 1.23% | 1.23% | 1.23% |
Net investment income (loss) | 1.17% | .99% | 1.09% | 1.05% |
Supplemental Data | | | | |
Net assets, end of period (000 omitted) | $ 53,437 | $ 28,454 | $ 18,254 | $ 11,884 |
Portfolio turnover rate D | 68% | 87% | 116% | 115% |
A Total returns would have been lower if certain expenses had not been reduced during the applicable periods shown.
B Calculated based on average shares outstanding during the period.
C Fees and expenses of any underlying Fidelity Central Funds are not included in the Fund's expense ratio. The Fund indirectly bears its proportionate share of the expenses of any underlying Fidelity Central Funds.
D Amount does not include the portfolio activity of any underlying Fidelity Central Funds.
E For the period November 1, 2007 (commencement of operations) to October 31, 2008.
F Expense ratios reflect operating expenses of the class. Expenses before reductions do not reflect amounts reimbursed by the investment adviser or reductions from brokerage service arrangements or reductions from other expense offset arrangements and do not represent the amount paid by the class during periods when reimbursements or reductions occur. Expense ratios before reductions for start-up periods may not be representative of longer-term operating periods. Expenses net of fee waivers reflect expenses after reimbursement by the investment adviser but prior to reductions from brokerage service arrangements or other expense offset arrangements. Expenses net of all reductions represent the net expenses paid by the class.
G Amount represents less than $.01 per share.
H Total distributions of $.08 per share is comprised of distributions from net investment income of $.057 and distributions from net realized gain of $.025 per share.
See accompanying notes which are an integral part of the financial statements.
Annual Report
Financial Highlights - Institutional Class
Years ended October 31, | 2011 | 2010 | 2009 | 2008 E |
Selected Per-Share Data | | | | |
Net asset value, beginning of period | $ 8.40 | $ 7.02 | $ 5.48 | $ 10.00 |
Income from Investment Operations | | | | |
Net investment income (loss) B | .10 | .07 | .06 | .09 |
Net realized and unrealized gain (loss) | (.30) | 1.39 | 1.54 | (4.60) |
Total from investment operations | (.20) | 1.46 | 1.60 | (4.51) |
Distributions from net investment income | (.07) | (.06) | (.06) | (.01) |
Distributions from net realized gain | (.01) | (.03) | - | - |
Total distributions | (.08) | (.08) H | (.06) | (.01) |
Redemption fees added to paid in capital B, G | - | - | - | - |
Net asset value, end of period | $ 8.12 | $ 8.40 | $ 7.02 | $ 5.48 |
Total Return A | (2.47)% | 20.97% | 29.77% | (45.17)% |
Ratios to Average Net Assets C, F | | | | |
Expenses before reductions | 1.50% | 1.92% | 2.01% | 2.56% |
Expenses net of fee waivers, if any | 1.20% | 1.25% | 1.25% | 1.25% |
Expenses net of all reductions | 1.18% | 1.23% | 1.23% | 1.23% |
Net investment income (loss) | 1.17% | .99% | 1.09% | 1.05% |
Supplemental Data | | | | |
Net assets, end of period (000 omitted) | $ 493 | $ 113 | $ 36 | $ 521 |
Portfolio turnover rate D | 68% | 87% | 116% | 115% |
A Total returns would have been lower if certain expenses had not been reduced during the applicable periods shown.
B Calculated based on average shares outstanding during the period.
C Fees and expenses of any underlying Fidelity Central Funds are not included in the Fund's expense ratio. The Fund indirectly bears its proportionate share of the expenses of any underlying Fidelity Central Funds.
D Amount does not include the portfolio activity of any underlying Fidelity Central Funds.
E For the period November 1, 2007 (commencement of operations) to October 31, 2008.
F Expense ratios reflect operating expenses of the class. Expenses before reductions do not reflect amounts reimbursed by the investment adviser or reductions from brokerage service arrangements or reductions from other expense offset arrangements and do not represent the amount paid by the class during periods when reimbursements or reductions occur. Expense ratios before reductions for start-up periods may not be representative of longer-term operating periods. Expenses net of fee waivers reflect expenses after reimbursement by the investment adviser but prior to reductions from brokerage service arrangements or other expense offset arrangements. Expenses net of all reductions represent the net expenses paid by the class.
G Amount represents less than $.01 per share.
H Total distributions of $.08 per share is comprised of distributions from net investment income of $.057 and distributions from net realized gain of $.025 per share.
See accompanying notes which are an integral part of the financial statements.
Annual Report
Notes to Financial Statements
For the period ended October 31, 2011
1. Organization.
Fidelity International Growth Fund (the Fund) is a fund of Fidelity Investment Trust (the Trust) and is authorized to issue an unlimited number of shares. The Trust is registered under the Investment Company Act of 1940, as amended (the 1940 Act), as an open-end management investment company organized as a Massachusetts business trust. The Fund offers Class A, Class T, Class C, International Growth and Institutional Class shares, each of which, along with Class B shares, has equal rights as to assets and voting privileges. Effective after the close of business on September 1, 2010, Class B shares were closed to new accounts and additional purchases, except for exchanges and reinvestments by existing shareholders. Each class has exclusive voting rights with respect to matters that affect that class. Class B shares will automatically convert to Class A shares after a holding period of seven years from the initial date of purchase. Investment income, realized and unrealized capital gains and losses, the common expenses of the Fund, and certain fund-level expense reductions, if any, are allocated on a pro-rata basis to each class based on the relative net assets of each class to the total net assets of the Fund. Each class differs with respect to transfer agent and distribution and service plan fees incurred. Certain expense reductions may also differ by class. The Fund's investments in emerging markets can be subject to social, economic, regulatory, and political uncertainties and can be extremely volatile.
2. Investments in Fidelity Central Funds.
The Fund invests in Fidelity Central Funds, which are open-end investment companies available only to other investment companies and accounts managed by Fidelity Management & Research Company (FMR) and its affiliates. The Fund's Schedule of Investments lists each of the Fidelity Central Funds held as of period end, if any, as an investment of the Fund, but does not include the underlying holdings of each Fidelity Central Fund. As an Investing Fund, the Fund indirectly bears its proportionate share of the expenses of the underlying Fidelity Central Funds.
The Money Market Central Funds seek preservation of capital and current income and are managed by Fidelity Investments Money Management, Inc. (FIMM), an affiliate of FMR.
A complete unaudited list of holdings for each Fidelity Central Fund is available upon request or at the Securities and Exchange Commission (the SEC) web site at www.sec.gov. In addition, the financial statements of the Fidelity Central Funds, which are not covered by the Fund's Report of Independent Registered Public Accounting Firm, are available on the SEC web site or upon request.
Annual Report
3. Significant Accounting Policies.
The financial statements have been prepared in conformity with accounting principles generally accepted in the United States of America (GAAP), which require management to make certain estimates and assumptions at the date of the financial statements. Actual results could differ from those estimates. Subsequent events, if any, through the date that the financial statements were issued have been evaluated in the preparation of the financial statements. The following summarizes the significant accounting policies of the Fund:
Security Valuation. Investments are valued as of 4:00 p.m. Eastern time on the last calendar day of the period. The Fund uses independent pricing services approved by the Board of Trustees to value its investments. When current market prices or quotations are not readily available or reliable, valuations may be determined in good faith in accordance with procedures adopted by the Board of Trustees. Factors used in determining value may include market or security specific events. The frequency with which these procedures are used cannot be predicted and they may be utilized to a significant extent. The value used for net asset value (NAV) calculation under these procedures may differ from published prices for the same securities.
The Fund categorizes the inputs to valuation techniques used to value its investments into a disclosure hierarchy consisting of three levels as shown below:
Level 1 - quoted prices in active markets for identical investments
Level 2 - other significant observable inputs (including quoted prices for similar investments, interest rates, prepayment speeds, etc.)
Level 3 - unobservable inputs (including the Fund's own assumptions based on the best information available)
Changes in valuation techniques may result in transfers in or out of an assigned level within the disclosure hierarchy. The aggregate value of investments by input level, as of October 31, 2011, is included at the end of the Fund's Schedule of Investments. Valuation techniques used to value the Fund's investments by major category are as follows:
Equity securities, including restricted securities, for which market quotations are readily available, are valued at the last reported sale price or official closing price as reported by an independent pricing service on the primary market or exchange on which they are traded and are categorized as Level 1 in the hierarchy. In the event there were no sales during the day or closing prices are not available, securities are valued at the last quoted bid price or may be valued using the last available price and are generally categorized as Level 2 in the hierarchy. For foreign equity securities, when significant market or security specific events arise, comparisons to the valuation of American Depositary Receipts
Annual Report
Notes to Financial Statements - continued
3. Significant Accounting Policies - continued
Security Valuation - continued
(ADRs), futures contracts, Exchange-traded funds (ETFs) and certain indexes as well as quoted prices for similar securities are used and are categorized as Level 2 in the hierarchy in these circumstances. Utilizing these techniques may result in transfers between Level 1 and Level 2. For restricted equity securities and private placements where observable inputs are limited, assumptions about market activity and risk are used and are categorized as Level 3 in the hierarchy.
Investments in open-end mutual funds, including the Fidelity Central Funds, are valued at their closing net asset value each business day and are categorized as Level 1 in the hierarchy.
Foreign Currency. The Fund may use foreign currency contracts to facilitate transactions in foreign-denominated securities. Gains and losses from these transactions may arise from changes in the value of the foreign currency or if the counterparties do not perform under the contracts' terms.
Foreign-denominated assets, including investment securities, and liabilities are translated into U.S. dollars at the exchange rate at period end. Purchases and sales of investment securities, income and dividends received and expenses denominated in foreign currencies are translated into U.S. dollars at the exchange rate in effect on the transaction date.
The effects of exchange rate fluctuations on investments are included with the net realized and unrealized gain (loss) on investment securities. Other foreign currency transactions resulting in realized and unrealized gain (loss) are disclosed separately.
Investment Transactions and Income. For financial reporting purposes, the Fund's investment holdings and NAV include trades executed through the end of the last business day of the period. The NAV per share for processing shareholder transactions is calculated as of the close of business of the New York Stock Exchange (NYSE), normally 4:00 p.m. Eastern time and includes trades executed through the end of the prior business day. Gains and losses on securities sold are determined on the basis of identified cost. Dividend income is recorded on the ex-dividend date, except for certain dividends from foreign securities where the ex-dividend date may have passed, which are recorded as soon as the Fund is informed of the ex-dividend date. Non-cash dividends included in dividend income, if any, are recorded at the fair market value of the securities received. Distributions received on securities that represent a return of capital or capital gain are recorded as a reduction of cost of investments and/or as a realized gain. The Fund estimates the components of distributions received that may be considered return of
Annual Report
3. Significant Accounting Policies - continued
Investment Transactions and Income - continued
capital distributions or capital gain distributions. Interest income and distributions from the Fidelity Central Funds are accrued as earned. Interest income includes coupon interest and amortization of premium and accretion of discount on debt securities. Investment income is recorded net of foreign taxes withheld where recovery of such taxes is uncertain.
Expenses. Expenses directly attributable to a fund are charged to that fund. Expenses attributable to more than one fund are allocated among the respective funds on the basis of relative net assets or other appropriate methods. Expense estimates are accrued in the period to which they relate and adjustments are made when actual amounts are known.
Income Tax Information and Distributions to Shareholders. Each year, the Fund intends to qualify as a regulated investment company, including distributing substantially all of its taxable income and realized gains under Subchapter M of the Internal Revenue Code and filing its U.S. federal tax return. As a result, no provision for income taxes is required. As of October 31, 2011, the Fund did not have any unrecognized tax benefits in the financial statements. A fund's federal tax return is subject to examination by the Internal Revenue Service (IRS) for a period of three years. Foreign taxes are provided for based on the Fund's understanding of the tax rules and rates that exist in the foreign markets in which it invests.
Distributions are declared and recorded on the ex-dividend date. Income dividends and capital gain distributions are declared separately for each class. Income and capital gain distributions are determined in accordance with income tax regulations, which may differ from GAAP.
Capital accounts within the financial statements are adjusted for permanent book-tax differences. These adjustments have no impact on net assets or the results of operations. Temporary book-tax differences will reverse in a subsequent period.
Book-tax differences are primarily due to foreign currency transactions, passive foreign investment companies (PFIC), partnerships, capital loss carryforwards and losses deferred due to wash sales.
The federal tax cost of investment securities and unrealized appreciation (depreciation) as of period end were as follows:
Gross unrealized appreciation | $ 4,011,207 |
Gross unrealized depreciation | (5,680,632) |
Net unrealized appreciation (depreciation) on securities and other investments | $ (1,669,425) |
| |
Tax Cost | $ 73,974,165 |
Annual Report
Notes to Financial Statements - continued
3. Significant Accounting Policies - continued
Income Tax Information and Distributions to Shareholders - continued
The tax-based components of distributable earnings as of period end were as follows:
Undistributed ordinary income | $ 623,318 |
Capital loss carryforward | $ (4,617,271) |
Net unrealized appreciation (depreciation) | $ (1,668,413) |
Under the recently enacted Regulated Investment Company Modernization Act of 2010 (the Act), the Fund will be permitted to carry forward capital losses incurred in taxable years beginning after December 22, 2010 for an unlimited period. However, any losses incurred during those future taxable years will be required to be utilized prior to any losses incurred in pre-enactment taxable years, which generally expire after eight years from when they are incurred. Additionally, post-enactment capital losses that are carried forward will retain their character as either short-term or long-term capital losses rather than being considered all short-term as under previous law. The Fund's first fiscal year end subject to the Act will be October 31 2012.
The tax character of distributions paid was as follows:
| October 31, 2011 | October 31, 2010 |
Ordinary Income | $ 324,699 | $ 245,729 |
Short-Term Trading (Redemption) Fees. Shares held by investors in the Fund less than 30 days are subject to a redemption fee equal to 1.00% of the net asset value of shares redeemed. All redemption fees, which reduce the proceeds of the shareholder redemption, are retained by the Fund and accounted for as an addition to paid in capital.
New Accounting Pronouncement. In May 2011, the Financial Accounting Standards Board issued Accounting Standard Update No. 2011-04, Fair Value Measurement (Topic 820) - Amendments to Achieve Common Fair Value Measurement and Disclosure Requirements in U.S. GAAP and IFRSs. The update changes the wording used to describe the requirements in GAAP for measuring fair value and for disclosing information about fair value measurements. The update is effective during interim and annual periods beginning after December 15, 2011. Management is currently evaluating the impact of the update's adoption on the Fund's financial statement disclosures.
4. Purchases and Sales of Investments.
Purchases and sales of securities, other than short-term securities, aggregated $72,616,731 and $38,664,366, respectively.
Annual Report
5. Fees and Other Transactions with Affiliates.
Management Fee. FMR and its affiliates provide the Fund with investment management related services for which the Fund pays a monthly management fee. The management fee is the sum of an individual fund fee rate that is based on an annual rate of .45% of the Fund's average net assets and a group fee rate that averaged .26% during the period. The group fee rate is based upon the average net assets of all the mutual funds advised by FMR. The group fee rate decreases as assets under management increase and increases as assets under management decrease. In addition, the management fee is subject to a performance adjustment (up to a maximum of ± .20% of the Fund's average net assets over a 36 month performance period). The upward or downward adjustment to the management fee is based on the relative investment performance of International Growth as compared to an appropriate benchmark index. The Fund's performance adjustment took effect in November 2008. Subsequent months will be added until the performance period includes 36 months. For the period, the total annual management fee rate, including the performance adjustment, was .80% of the Fund's average net assets.
Distribution and Service Plan Fees. In accordance with Rule 12b-1 of the 1940 Act, the Fund has adopted separate Distribution and Service Plans for each class of shares. Certain classes pay Fidelity Distributors Corporation (FDC), an affiliate of FMR, separate Distribution and Service Fees, each of which is based on an annual percentage of each class' average net assets. In addition, FDC may pay financial intermediaries for selling shares of the Fund and providing shareholder support services. For the period, the Distribution and Service Fee rates, total fees and amounts retained by FDC were as follows:
| Distribution
Fee | Service
Fee | Total
Fees | Retained
by FDC |
Class A | -% | .25% | $ 12,491 | $ 190 |
Class T | .25% | .25% | 10,239 | 1 |
Class B | .75% | .25% | 5,882 | 4,518 |
Class C | .75% | .25% | 22,521 | 7,930 |
| | | $ 51,133 | $ 12,639 |
Sales Load. FDC may receive a front-end sales charge of up to 5.75% for selling Class A shares, and 3.50% for selling Class T shares, some of which is paid to financial intermediaries for selling shares of the Fund. Depending on the holding period, FDC may receive contingent deferred sales charges levied on Class A, Class T, Class B, and Class C redemptions. The deferred sales charges range from 5% to 1% for Class B, 1% for Class C, 1.00% for certain purchases of Class A shares and .25% for certain purchases of Class T shares.
Annual Report
Notes to Financial Statements - continued
5. Fees and Other Transactions with Affiliates - continued
Sales Load - continued
For the period, sales charge amounts retained by FDC were as follows:
| Retained
by FDC |
Class A | $ 7,797 |
Class T | 1,892 |
Class B* | 695 |
Class C* | 351 |
| $ 10,735 |
* When Class B and Class C shares are initially sold, FDC pays commissions from its own resources to financial intermediaries through which the sales are made.
Transfer Agent Fees. Fidelity Investments Institutional Operations Company, Inc. (FIIOC), an affiliate of FMR, is the transfer, dividend disbursing and shareholder servicing agent for each class of the Fund. FIIOC receives account fees and asset-based fees that vary according to the account size and type of account of the shareholders of the respective classes of the Fund. FIIOC pays for typesetting, printing and mailing of shareholder reports, except proxy statements. For the period, transfer agent fees for each class were as follows:
| Amount | % of
Average
Net Assets |
Class A | $ 15,298 | .31 |
Class T | 6,766 | .33 |
Class B | 1,802 | .31 |
Class C | 6,897 | .31 |
International Growth | 144,927 | .30 |
Institutional Class | 1,324 | .29 |
| $ 177,014 | |
Accounting and Security Lending Fees. Fidelity Service Company, Inc. (FSC), an affiliate of FMR, maintains the Fund's accounting records. The accounting fee is based on the level of average net assets for the month. Under a separate contract, FSC administers the security lending program. The security lending fee is based on the number and duration of lending transactions.
Brokerage Commissions. The Fund placed a portion of its portfolio transactions with brokerage firms which are affiliates of the investment adviser. The commissions paid to these affiliated firms were $670 for the period.
Annual Report
6. Committed Line of Credit.
The Fund participates with other funds managed by FMR or an affiliate in a $4.0 billion credit facility (the "line of credit") to be utilized for temporary or emergency purposes to fund shareholder redemptions or for other short-term liquidity purposes. The Fund has agreed to pay commitment fees on its pro-rata portion of the line of credit, which amounted to $165 and is reflected in Miscellaneous expenses on the Statement of Operations. During the period, there were no borrowings on this line of credit.
7. Security Lending.
The Fund lends portfolio securities through a lending agent from time to time in order to earn additional income. For equity securities, a lending agent is used and may loan securities to certain qualified borrowers, including Fidelity Capital Markets (FCM), a broker-dealer affiliated with the Fund. On the settlement date of the loan, the Fund receives collateral (in the form of U.S. Treasury obligations, letters of credit and/or cash) against the loaned securities and maintains collateral in an amount not less than 100% of the market value of the loaned securities during the period of the loan. The market value of the loaned securities is determined at the close of business of the Fund and any additional required collateral is delivered to the Fund on the next business day. If the borrower defaults on its obligation to return the securities loaned because of insolvency or other reasons, a fund could experience delays and costs in recovering the securities loaned or in gaining access to the collateral. Any cash collateral received is invested in the Fidelity Securities Lending Cash Central Fund. The value of loaned securities and cash collateral at period end are disclosed on the Fund's Statement of Assets and Liabilities. Security lending income represents the income earned on investing cash collateral, less rebates paid to borrowers and any lending agent fees associated with the loan, plus any premium payments received for lending certain types of securities. Security lending income is presented in the Statement of Operations as a component of income from Fidelity Central Funds. Total security lending income during the period amounted to $30,491. During the period, there were no securities loaned to FCM.
8. Expense Reductions.
FMR contractually agreed to reimburse each class to the extent annual operating expenses exceeded certain levels of average net assets as noted in the table below. This reimbursement will remain in place through December 31, 2012. Some expenses, for example interest expense, including commitment fees, are excluded from this reimbursement.
Annual Report
Notes to Financial Statements - continued
8. Expense Reductions - continued
The following classes were in reimbursement during the period:
| Expense
Limitations | Reimbursement
from adviser |
| | |
Class A | 1.45% | $ 15,994 |
Class T | 1.70% | 6,877 |
Class B | 2.20% | 2,026 |
Class C | 2.20% | 7,234 |
International Growth | 1.20% | 151,732 |
Institutional Class | 1.20% | 1,375 |
| | $ 185,238 |
In addition, FMR voluntarily agreed to reimburse a portion of its management fee. For the period, the amount of this reimbursement was $286.
Many of the brokers with whom FMR places trades on behalf of the Fund provided services to the Fund in addition to trade execution. These services included payments of certain expenses on behalf of the Fund totaling $9,776 for the period. In addition, through arrangements with the Fund's custodian, credits realized as a result of uninvested cash balances were used to reduce the Fund's expenses. During the period, these credits reduced the Fund's custody expenses by $114.
9. Distributions to Shareholders.
Distributions to shareholders of each class were as follows:
Years ended October 31, | 2011 | 2010 |
From net investment income | | |
Class A | $ 19,878 | $ 10,514 |
Class T | 5,087 | 1,819 |
Class B | 545 | - |
Class C | 1,547 | - |
International Growth | 247,117 | 154,599 |
Institutional Class | 2,184 | 287 |
Total | $ 276,358 | $ 167,219 |
From net realized gain | | |
Class A | $ 4,255 | $ 5,713 |
Class T | 1,455 | 2,067 |
Class B | 211 | - |
Class C | 826 | 2,797 |
International Growth | 41,245 | 67,807 |
Institutional Class | 349 | 126 |
Total | $ 48,341 | $ 78,510 |
Annual Report
10. Share Transactions.
Transactions for each class of shares were as follows:
| Shares | Dollars |
Years ended October 31, | 2011 | 2010 | 2011 | 2010 |
Class A | | | | |
Shares sold | 547,911 | 247,866 | $ 4,762,829 | $ 1,869,390 |
Reinvestment of distributions | 2,679 | 2,011 | 22,867 | 14,999 |
Shares redeemed | (133,581) | (88,980) | (1,142,023) | (650,197) |
Net increase (decrease) | 417,009 | 160,897 | $ 3,643,673 | $ 1,234,192 |
Class T | | | | |
Shares sold | 292,221 | 73,695 | $ 2,542,402 | $ 554,529 |
Reinvestment of distributions | 762 | 513 | 6,516 | 3,840 |
Shares redeemed | (55,432) | (26,780) | (470,382) | (194,364) |
Net increase (decrease) | 237,551 | 47,428 | $ 2,078,536 | $ 364,005 |
Class B | | | | |
Shares sold | 22,762 | 37,806 | $ 193,446 | $ 276,981 |
Reinvestment of distributions | 78 | - | 670 | - |
Shares redeemed | (33,639) | (15,339) | (282,311) | (113,063) |
Net increase (decrease) | (10,799) | 22,467 | $ (88,195) | $ 163,918 |
Class C | | | | |
Shares sold | 258,483 | 110,505 | $ 2,202,762 | $ 831,229 |
Reinvestment of distributions | 274 | 369 | 2,357 | 2,760 |
Shares redeemed | (65,559) | (71,336) | (555,739) | (504,821) |
Net increase (decrease) | 193,198 | 39,538 | $ 1,649,380 | $ 329,168 |
International Growth | | | | |
Shares sold | 5,799,026 | 1,971,246 | $ 50,047,832 | $ 14,829,454 |
Reinvestment of distributions | 33,184 | 28,518 | 283,553 | 212,744 |
Shares redeemed | (2,639,092) | (1,213,664) | (22,190,157) | (8,965,012) |
Net increase (decrease) | 3,193,118 | 786,100 | $ 28,141,228 | $ 6,077,186 |
Institutional Class | | | | |
Shares sold | 76,126 | 11,311 | $ 670,433 | $ 86,413 |
Reinvestment of distributions | 292 | 55 | 2,491 | 412 |
Shares redeemed | (29,187) | (3,097) | (256,318) | (23,304) |
Net increase (decrease) | 47,231 | 8,269 | $ 416,606 | $ 63,521 |
11. Other.
The Fund's organizational documents provide former and current trustees and officers with a limited indemnification against liabilities arising in connection with the performance of their duties to the Fund. In the normal course of business, the Fund may also enter into contracts that provide general indemnifications. The Fund's maximum exposure under these arrangements is unknown as this would be dependent on future claims that may be made against the Fund. The risk of material loss from such claims is considered remote.
Annual Report
To the Trustees of Fidelity Investment Trust and the Shareholders of Fidelity International Growth Fund:
In our opinion, the accompanying statement of assets and liabilities, including the schedule of investments, and the related statements of operations and of changes in net assets and the financial highlights present fairly, in all material respects, the financial position of Fidelity International Growth Fund (a fund of Fidelity Investment Trust) at October 31, 2011, the results of its operations for the year then ended, the changes in its net assets for each of the two years in the period then ended and the financial highlights for each of the periods indicated, in conformity with accounting principles generally accepted in the United States of America. These financial statements and financial highlights (hereafter referred to as "financial statements") are the responsibility of the Fidelity International Growth Fund's management. Our responsibility is to express an opinion on these financial statements based on our audits. We conducted our audits of these financial statements in accordance with the standards of the Public Company Accounting Oversight Board (United States). Those standards require that we plan and perform the audit to obtain reasonable assurance about whether the financial statements are free of material misstatement. An audit includes examining, on a test basis, evidence supporting the amounts and disclosures in the financial statements, assessing the accounting principles used and significant estimates made by management, and evaluating the overall financial statement presentation. We believe that our audits, which included confirmation of securities at October 31, 2011 by correspondence with the custodian and brokers, provide a reasonable basis for our opinion.
PricewaterhouseCoopers LLP
Boston, Massachusetts
December 9, 2011
Annual Report
The Trustees, Members of the Advisory Board, and executive officers of the trust and fund, as applicable, are listed below. The Board of Trustees governs the fund and is responsible for protecting the interests of shareholders. The Trustees are experienced executives who meet periodically throughout the year to oversee the fund's activities, review contractual arrangements with companies that provide services to the fund, oversee management of the risks associated with such activities and contractual arrangements, and review the fund's performance. Except for James C. Curvey, each of the Trustees oversees 226 funds advised by FMR or an affiliate. Mr. Curvey oversees 429 funds advised by FMR or an affiliate.
The Trustees hold office without limit in time except that (a) any Trustee may resign; (b) any Trustee may be removed by written instrument, signed by at least two-thirds of the number of Trustees prior to such removal; (c) any Trustee who requests to be retired or who has become incapacitated by illness or injury may be retired by written instrument signed by a majority of the other Trustees; and (d) any Trustee may be removed at any special meeting of shareholders by a two-thirds vote of the outstanding voting securities of the trust. Each Trustee who is not an interested person (as defined in the 1940 Act) (Independent Trustee), shall retire not later than the last day of the calendar year in which his or her 75th birthday occurs. The Independent Trustees may waive this mandatory retirement age policy with respect to individual Trustees. The executive officers and Advisory Board Members hold office without limit in time, except that any officer and Advisory Board Member may resign or may be removed by a vote of a majority of the Trustees at any regular meeting or any special meeting of the Trustees. Except as indicated, each individual has held the office shown or other offices in the same company for the past five years.
Experience, Skills, Attributes, and Qualifications of the Fund's Trustees. The Governance and Nominating Committee has adopted a statement of policy that describes the experience, qualifications, attributes, and skills that are necessary and desirable for potential Independent Trustee candidates (Statement of Policy). The Board believes that each Trustee satisfied at the time he or she was initially elected or appointed a Trustee, and continues to satisfy, the standards contemplated by the Statement of Policy. The Governance and Nominating Committee also engages professional search firms to help identify potential Independent Trustee candidates who have the experience, qualifications, attributes, and skills consistent with the Statement of Policy. From time to time, additional criteria based on the composition and skills of the current Independent Trustees, as well as experience or skills that may be appropriate in light of future changes to board composition, business conditions, and regulatory or other developments, have also been considered by the professional search firms and the Governance and Nominating Committee. In addition, the Board takes into account the Trustees' commitment and participation in Board and committee meetings, as well as their leadership of standing and ad hoc committees throughout their tenure.
In determining that a particular Trustee was and continues to be qualified to serve as a Trustee, the Board has considered a variety of criteria, none of which, in isolation, was controlling. The Board believes that, collectively, the Trustees have balanced and diverse experience, qualifications, attributes, and skills, which allow the Board to operate effectively in governing the fund and protecting the interests of shareholders. Information about the specific experience, skills, attributes, and qualifications of each Trustee, which in each case led to the Board's conclusion that the Trustee should serve (or continue to serve) as a trustee of the fund, is provided below.
Annual Report
Trustees and Officers - continued
Board Structure and Oversight Function. James C. Curvey is an interested person (as defined in the 1940 Act) and currently serves as Acting Chairman. The Trustees have determined that an interested Chairman is appropriate and benefits shareholders because an interested Chairman has a personal and professional stake in the quality and continuity of services provided to the fund. Independent Trustees exercise their informed business judgment to appoint an individual of their choosing to serve as Chairman, regardless of whether the Trustee happens to be independent or a member of management. The Independent Trustees have determined that they can act independently and effectively without having an Independent Trustee serve as Chairman and that a key structural component for assuring that they are in a position to do so is for the Independent Trustees to constitute a substantial majority for the Board. The Independent Trustees also regularly meet in executive session. Ned C. Lautenbach serves as Chairman of the Independent Trustees and as such (i) acts as a liaison between the Independent Trustees and management with respect to matters important to the Independent Trustees and (ii) with management prepares agendas for Board meetings.
Fidelity funds are overseen by different Boards of Trustees. The fund's Board oversees Fidelity's equity and high income funds and another Board oversees Fidelity's investment-grade bond, money market, and asset allocation funds. The asset allocation funds may invest in Fidelity funds overseen by the fund's Board. The use of separate Boards, each with its own committee structure, allows the Trustees of each group of Fidelity funds to focus on the unique issues of the funds they oversee, including common research, investment, and operational issues. On occasion, the separate Boards establish joint committees to address issues of overlapping consequences for the Fidelity funds overseen by each Board.
The Trustees operate using a system of committees to facilitate the timely and efficient consideration of all matters of importance to the Trustees, the fund, and fund shareholders and to facilitate compliance with legal and regulatory requirements and oversight of the fund's activities and associated risks. The Board, acting through its committees, has charged FMR and its affiliates with (i) identifying events or circumstances the occurrence of which could have demonstrably adverse effects on the fund's business and/or reputation; (ii) implementing processes and controls to lessen the possibility that such events or circumstances occur or to mitigate the effects of such events or circumstances if they do occur; and (iii) creating and maintaining a system designed to evaluate continuously business and market conditions in order to facilitate the identification and implementation processes described in (i) and (ii) above. Because the day-to-day operations and activities of the fund are carried out by or through FMR, its affiliates and other service providers, the fund's exposure to risks is mitigated but not eliminated by the processes overseen by the Trustees. While each of the Board's committees has responsibility for overseeing different aspects of the fund's activities, oversight is exercised primarily through the Operations, Audit, and Compliance Committees. In addition, the Independent Trustees have worked with FMR to enhance the Board's oversight of investment and financial risks, legal and regulatory risks, technology risks, and operational risks, including the development of additional risk reporting to the Board. For example, a working group comprised of Independent Trustees and FMR has worked and continues to work to review the Fidelity funds' valuation-related activities, reporting and risk management. Appropriate personnel, including but not limited to the fund's Chief Compliance Officer (CCO), FMR's internal auditor, the independent accountants, the fund's Treasurer and portfolio management personnel, make periodic reports to the Board's committees, as appropriate, including an annual review of FMR's risk management program for the Fidelity funds. The responsibilities of each standing committee, including their oversight responsibilities, are described further under "Standing Committees of the Fund's Trustees."
Annual Report
The fund's Statement of Additional Information (SAI) includes more information about the Trustees. To request a free copy, call Fidelity at 1-877-208-0098.
Interested Trustees*:
Correspondence intended for each Trustee who is an interested person may be sent to Fidelity Investments, 82 Devonshire Street, Boston, Massachusetts 02109.
Name, Age; Principal Occupations and Other Relevant Experience+ |
James C. Curvey (76) |
| Year of Election or Appointment: 2007 Mr. Curvey is Trustee and Acting Chairman of the Board of Trustees of certain Trusts. Mr. Curvey also serves as Trustee (2007-present) of other investment companies advised by FMR. Mr. Curvey is a Director of Fidelity Investments Money Management, Inc. (2009-present), Director of Fidelity Research & Analysis Co. (2009-present) and Director of FMR and FMR Co., Inc. (2007-present). Mr. Curvey is also Vice Chairman (2007-present) and Director of FMR LLC. In addition, Mr. Curvey serves as an Overseer for the Boston Symphony Orchestra and a member of the Trustees of Villanova University. Previously, Mr. Curvey was the Vice Chairman (2006-2007) and Director (2000-2007) of FMR Corp. |
Ronald P. O'Hanley (54) |
| Year of Election or Appointment: 2011 Mr. O'Hanley is Director of FMR Co., Inc. (2010-present), Director of Fidelity Investments Money Management, Inc. (2010-present), Director of Fidelity Research & Analysis Company (2010-present), President of Fidelity Asset Management and Corporate Services and a member of Fidelity's Executive Committee (2010-present). Previously, Mr. O'Hanley served as President and Chief Executive Officer of BNY Mellon Asset Management (2007-2010). Mr. O'Hanley also served as Vice Chairman of Bank New York Mellon Corp. and a member of that firm's Executive Committee. Prior to the 2007 merger of The Bank of New York and Mellon Financial Corporation, he was Vice Chairman of Mellon Financial Corporation and President and Chief Executive Officer of Mellon Asset Management. He joined Mellon in February 1997. Mr. O'Hanley currently serves as Chairman of the Boston Public Library Foundation Board of Directors and sits on the Board of Directors of Beth Israel Deaconess Medical Center, the Board of Trustees of the Marine Biological Laboratory and the Advisory Board of the Maxwell School of Citizenship and Public Administration at Syracuse University. Mr. O'Hanley also chairs the Council on Asset Management for the Financial Services Roundtable and is a member of the Board of Directors of Institutional Investor's U.S. Institute. |
* Trustees have been determined to be "Interested Trustees" by virtue of, among other things, their affiliation with the trust or various entities under common control with FMR.
+ The information above includes each Trustee's principal occupation during the last five years and other information relating to the experience, attributes, and skills relevant to each Trustee's qualifications to serve as a Trustee, which led to the conclusion that each Trustee should serve as a Trustee for the fund.
Annual Report
Independent Trustees:
Correspondence intended for each Independent Trustee (that is, the Trustees other than the Interested Trustees) may be sent to Fidelity Investments, P.O. Box 55235, Boston, Massachusetts 02205-5235.
Name, Age; Principal Occupations and Other Relevant Experience+ |
Dennis J. Dirks (63) |
| Year of Election or Appointment: 2005 Prior to his retirement in May 2003, Mr. Dirks was Chief Operating Officer and a member of the Board of The Depository Trust & Clearing Corporation (DTCC). He also served as President, Chief Operating Officer, and Board member of The Depository Trust Company (DTC) and President and Board member of the National Securities Clearing Corporation (NSCC). In addition, Mr. Dirks served as Chief Executive Officer and Board member of the Government Securities Clearing Corporation, Chief Executive Officer and Board member of the Mortgage-Backed Securities Clearing Corporation, as a Trustee and a member of the Finance Committee of Manhattan College (2005-2008), and as a Trustee and a member of the Finance Committee of AHRC of Nassau County (2006-2008). Mr. Dirks is a member of the Independent Directors Council (IDC) Governing Council (2010-Present) and Board of Directors for The Brookville Center for Children's Services, Inc. (2009-present). |
Alan J. Lacy (58) |
| Year of Election or Appointment: 2008 Mr. Lacy serves as Senior Adviser (2007-present) of Oak Hill Capital Partners, L.P. (private equity). Mr. Lacy also served as Chief Executive Officer (2000-2005) and Vice Chairman (2005-2006) of Sears Holdings Corporation and Sears, Roebuck and Co. (retail). In addition, Mr. Lacy serves as a member of the Board of Directors of Dave & Buster's, Inc. (restaurant and entertainment complexes, 2010-present), The Hillman Companies, Inc. (hardware wholesalers, 2010-present), and Bristol-Myers Squibb Company (global pharmaceuticals, 2007-present). Mr. Lacy is a member of the Board of Trustees of The National Parks Conservation Association (2006-Present). Previously, Mr. Lacy served as Chairman of the Board of Trustees of the National Parks Conservation Association (2008-2011) and as a member of the Board of Directors for the Western Union Company (global money transfer, 2006-2011). |
Ned C. Lautenbach (67) |
| Year of Election or Appointment: 2000 Mr. Lautenbach is Chairman of the Independent Trustees of the Equity and High Income Funds (2006-present). Mr. Lautenbach currently serves as the Lead Director of the Eaton Corporation Board of Directors (diversified industrial, 1997-present). Mr. Lautenbach is also a member of the Board of Directors of the Philharmonic Center for the Arts in Naples, Florida (1999-present); a member of the Board of Trustees of Fairfield University (2005-present); and a member of the Council on Foreign Relations (1994-present). Previously, Mr. Lautenbach was a Partner/Advisory Partner at Clayton, Dubilier & Rice, LLC (private equity investment, 1998-2010), as well as a Director of Sony Corporation (2006-2007). |
Joseph Mauriello (67) |
| Year of Election or Appointment: 2008 Prior to his retirement in January 2006, Mr. Mauriello served in numerous senior management positions including Deputy Chairman and Chief Operating Officer (2004-2005), and Vice Chairman of Financial Services (2002-2004) of KPMG LLP US (professional services, 1965-2005). Mr. Mauriello currently serves as a member of the Board of Directors of XL Group plc. (global insurance and re-insurance, 2006-present) and of Arcadia Resources Inc. (health care services and products, 2007-present). Previously, Mr. Mauriello served as a Director of the Hamilton Funds of the Bank of New York (2006-2007). |
Robert W. Selander (61) |
| Year of Election or Appointment: 2011 Previously, Mr. Selander served as a Member of the Advisory Board of Fidelity's Equity and High Income Funds (2011), Executive Vice Chairman (2010), Chief Executive Officer (2009-2010), and President and Chief Executive Officer (1997-2009) of Mastercard, Inc. |
Cornelia M. Small (67) |
| Year of Election or Appointment: 2005 Ms. Small is a member of the Board of Directors of the Teagle Foundation (2009-present). Ms. Small is also a member of the Investment Committee, and Chair (2008-present) and a member of the Board of Trustees of Smith College. In addition, Ms. Small serves on the Investment Committee of the Berkshire Taconic Community Foundation (2008-present). Previously, Ms. Small served as Chairperson of the Investment Committee (2002-2008) of Smith College. In addition, Ms. Small served as Chief Investment Officer, Director of Global Equity Investments, and a member of the Board of Directors of Scudder, Stevens & Clark and Scudder Kemper Investments. |
William S. Stavropoulos (72) |
| Year of Election or Appointment: 2001 Mr. Stavropoulos is Vice Chairman of the Independent Trustees of the Equity and High Income Funds (2006-present). Mr. Stavropoulos serves as President and Founder of the Michigan Baseball Foundation, the Great Lakes Loons (2007-present). Mr. Stavropoulos is Chairman Emeritus of the Board of Directors of The Dow Chemical Company, where he previously served in numerous senior management positions, including President, CEO (1995-2000; 2002-2004), Chairman of the Executive Committee (2000-2006), and as a member of the Board of Directors (1990-2006). Currently, Mr. Stavropoulos is Chairman of Univar (global distributor of commodity and specialty chemicals, 2010-present), a Director of Teradata Corporation (data warehousing and technology solutions, 2008-present), Chemical Financial Corporation, Maersk Inc. (industrial conglomerate), Tyco International, Inc. (multinational manufacturing and services, 2007-present), and a member of the Advisory Board for Metalmark Capital (private equity investment, 2005-present). Mr. Stavropoulos is a special advisor to Clayton, Dubilier & Rice, LLC (private equity investment). In addition, Mr. Stavropoulos is a member of the University of Notre Dame Advisory Council for the College of Science. |
David M. Thomas (62) |
| Year of Election or Appointment: 2008 Previously, Mr. Thomas served as Executive Chairman (2005-2006) and Chairman and Chief Executive Officer (2000-2005) of IMS Health, Inc. (pharmaceutical and healthcare information solutions). In addition, Mr. Thomas serves as a member of the Board of Directors of Fortune Brands, Inc. (consumer products), and Interpublic Group of Companies, Inc. (marketing communication, 2004-present). |
Michael E. Wiley (61) |
| Year of Election or Appointment: 2008 Mr. Wiley also serves as a Director of Asia Pacific Exploration Consolidated (international oil and gas exploration and production, 2008-present). Mr. Wiley serves as a Director of Tesoro Corporation (independent oil refiner and marketer, 2005-present), and a Director of Bill Barrett Corporation (exploration and production, 2005-present). In addition, Mr. Wiley also serves as a Director of Post Oak Bank (privately-held bank, 2004-present). Previously, Mr. Wiley served as a member of the Board of Trustees of the University of Tulsa (2000-2006; 2007-2010), as a Senior Energy Advisor of Katzenbach Partners, LLC (consulting, 2006-2007), as an Advisory Director of Riverstone Holdings (private investment), Chairman, President, and CEO of Baker Hughes, Inc. (oilfield services, 2000-2004), and as Director of Spinnaker Exploration Company (exploration and production, 2001-2005). |
Annual Report
Trustees and Officers - continued
+ The information above includes each Trustee's principal occupation during the last five years and other information relating to the experience, attributes, and skills relevant to each Trustee's qualifications to serve as a Trustee, which led to the conclusion that each Trustee should serve as a Trustee for the fund.
Advisory Board Members and Executive Officers:
Correspondence intended for each executive officer, Edward C. Johnson 3d, and Peter S. Lynch may be sent to Fidelity Investments, 82 Devonshire Street, Boston, Massachusetts 02109.
Name, Age; Principal Occupation |
Edward C. Johnson 3d (81) |
| Year of Election or Appointment: 2011 Member of the Advisory Board of Fidelity's Equity and High Income Funds. Mr. Johnson serves as Chief Executive Officer, Chairman, and a Director of FMR LLC, and also serves as Chairman and Director of FIL Limited. Previously, Mr. Johnson served as a Trustee and Chairman of the Board of certain Fidelity Trusts, Chairman and a Director of FMR, Chairman and a Director of FMR Co., Inc., and President of FMR LLC (2006-2007). |
Peter S. Lynch (67) |
| Year of Election or Appointment: 2003 Member of the Advisory Board of Fidelity's Equity and High Income Funds. Mr. Lynch is Vice Chairman and a Director of FMR and FMR Co., Inc. In addition, Mr. Lynch serves as a Trustee of Boston College and as the Chairman of the Inner-City Scholarship Fund. Previously, Mr. Lynch served on the Special Olympics International Board of Directors (1997-2006). |
Kenneth B. Robins (42) |
| Year of Election or Appointment: 2008 President and Treasurer of Fidelity's Equity and High Income Funds. Mr. Robins also serves as President and Treasurer (2010-present) and Assistant Treasurer (2009-present) of other Fidelity funds and is an employee of Fidelity Investments (2004-present). Previously, Mr. Robins served as Deputy Treasurer of the Fidelity funds (2005-2008) and Treasurer and Chief Financial Officer of The North Carolina Capital Management Trust: Cash and Term Portfolios (2006-2008). |
Bruce T. Herring (46) |
| Year of Election or Appointment: 2006 Vice President of certain Equity Funds. Mr. Herring also serves as Chief Investment Officer and Director of Fidelity Management & Research (U.K.) Inc. (2010-present) and Group Chief Investments Officer of FMR. Previously, Mr. Herring served as Vice President (2005-2006) and Senior Vice President (2006-2007) of Fidelity Management & Research Company, Vice President of FMR Co., Inc. (2001-2007) and as a portfolio manager for Fidelity U.S. Equity Funds. |
Brian B. Hogan (47) |
| Year of Election or Appointment: 2009 Vice President of Equity and High Income Funds. Mr. Hogan also serves as President of FMR's Equity Division (2009-present). Previously, Mr. Hogan served as Senior Vice President, Equity Research of FMR (2006-2009) and as a portfolio manager. |
Scott C. Goebel (43) |
| Year of Election or Appointment: 2008 Secretary and Chief Legal Officer (CLO) of the Fidelity funds. Mr. Goebel also serves as Secretary of Fidelity Investments Money Management, Inc. (FIMM) (2010-present) and Fidelity Research and Analysis Company (FRAC) (2010-present); Secretary and CLO of The North Carolina Capital Management Trust: Cash and Term Portfolios (2008-present); General Counsel, Secretary, and Senior Vice President of FMR (2008-present) and FMR Co., Inc. (2008-present); employed by FMR LLC or an affiliate (2001-present); Chief Legal Officer of Fidelity Management & Research (Hong Kong) Limited (2008-present) and Assistant Secretary of Fidelity Management & Research (Japan) Inc. (2008-present), and Fidelity Management & Research (U.K.) Inc. (2008-present). Previously, Mr. Goebel served as Assistant Secretary of FIMM (2008-2010), FRAC (2008-2010), and the Funds (2007-2008) and as Vice President and Secretary of Fidelity Distributors Corporation (FDC) (2005-2007). |
William C. Coffey (42) |
| Year of Election or Appointment: 2009 Assistant Secretary of Fidelity's Equity and High Income Funds. Mr. Coffey also serves as Senior Vice President and Deputy General Counsel of FMR LLC (2010-present), and is an employee of Fidelity Investments. Previously, Mr. Coffey served as Vice President and Associate General Counsel of FMR LLC (2005-2009). |
Holly C. Laurent (57) |
| Year of Election or Appointment: 2008 Anti-Money Laundering (AML) Officer of the Fidelity funds. Ms. Laurent also serves as AML Officer of The North Carolina Capital Management Trust: Cash and Term Portfolios (2008-present) and is an employee of Fidelity Investments. Previously, Ms. Laurent was Senior Vice President and Head of Legal for Fidelity Business Services India Pvt. Ltd. (2006-2008), and Senior Vice President, Deputy General Counsel and Group Head for FMR LLC (2005-2006). |
Christine Reynolds (53) |
| Year of Election or Appointment: 2008 Chief Financial Officer of the Fidelity funds. Ms. Reynolds became President of Fidelity Pricing and Cash Management Services (FPCMS) in August 2008. Ms. Reynolds served as Chief Operating Officer of FPCMS (2007-2008). Previously, Ms. Reynolds served as President, Treasurer, and Anti-Money Laundering officer of the Fidelity funds (2004-2007). |
Kenneth A. Rathgeber (64) |
| Year of Election or Appointment: 2004 Chief Compliance Officer of Fidelity's Equity and High Income Funds. Mr. Rathgeber is Chief Compliance Officer of Fidelity Management & Research (Hong Kong) Limited (2008-present), Fidelity Management & Research (Japan) Inc. (2008-present), FMR (2005-present), FMR Co., Inc. (2005-present), Fidelity Management & Research (U.K.) Inc. (2005-present), Fidelity Research & Analysis Company (2005-present), Fidelity Investments Money Management, Inc. (2005-present), Pyramis Global Advisors, LLC (2005-present), and Strategic Advisers, Inc. (2005-present). |
Jeffrey S. Christian (50) |
| Year of Election or Appointment: 2009 Deputy Treasurer of the Fidelity funds. Mr. Christian is an employee of Fidelity Investments. Previously, Mr. Christian served as Chief Financial Officer (2008-2009) of certain Fidelity funds and Senior Vice President of Fidelity Pricing and Cash Management Services (FPCMS) (2004-2009). |
Joseph F. Zambello (54) |
| Year of Election or Appointment: 2011 Deputy Treasurer of the Fidelity funds. Mr. Zambello is an employee of Fidelity Investments. Previously, Mr. Zambello served as Vice President of FMR's Program Management Group (2009-2011) and Vice President of the Transfer Agent Oversight Group (2005-2009). |
Adrien E. Deberghes (44) |
| Year of Election or Appointment: 2008 Deputy Treasurer of Fidelity's Equity and High Income Funds. Mr. Deberghes also serves as Vice President and Assistant Treasurer of Fidelity Rutland Square Trust II and Fidelity Commonwealth Trust II (2011-present), Assistant Treasurer of other Fidelity funds (2010-present), and is an employee of Fidelity Investments (2008-present). Previously, Mr. Deberghes served as Senior Vice President of Mutual Fund Administration at State Street Corporation (2007-2008), Senior Director of Mutual Fund Administration at Investors Bank & Trust (2005-2007), and Director of Finance for Dunkin' Brands (2000-2005). |
Stephanie J. Dorsey (42) |
| Year of Election or Appointment: 2010 Assistant Treasurer of Fidelity's Equity and High Income Funds. Ms. Dorsey also serves as Deputy Treasurer of other Fidelity funds (2008-present) and is an employee of Fidelity Investments (2008-present). Previously, Ms. Dorsey served as Treasurer (2004-2008) of the JPMorgan Mutual Funds and Vice President (2004-2008) of JPMorgan Chase Bank. |
John R. Hebble (53) |
| Year of Election or Appointment: 2009 Assistant Treasurer of Fidelity's Equity and High Income Funds. Mr. Hebble also serves as President (2011-present), Treasurer, and Chief Financial Officer of The North Carolina Capital Management Trust: Cash and Term Portfolios (2008-present), President and Treasurer of other Fidelity funds (2008-present) and is an employee of Fidelity Investments. |
Gary W. Ryan (53) |
| Year of Election or Appointment: 2005 Assistant Treasurer of the Fidelity funds. Mr. Ryan is an employee of Fidelity Investments. Previously, Mr. Ryan served as Vice President of Fund Reporting in Fidelity Pricing and Cash Management Services (FPCMS) (1999-2005). |
Jonathan Davis (43) |
| Year of Election or Appointment: 2010 Assistant Treasurer of the Fidelity funds. Mr. Davis is also Assistant Treasurer of Fidelity Rutland Square Trust II and Fidelity Commonwealth Trust II. Mr. Davis is an employee of Fidelity Investments. Previously, Mr. Davis served as Vice President and Associate General Counsel of FMR LLC (2003-2010). |
Annual Report
The Board of Trustees of Fidelity International Growth Fund voted to pay to shareholders of record at the opening of business on record date, the following distributions per share derived from capital gains realized from sales of portfolio securities, and dividends derived from net investment income:
| Pay Date | Record Date | Dividends | Capital Gains |
Institutional Class | 12/05/11 | 12/02/11 | $.079 | $.006 |
Institutional Class designates 100% of the dividends distributed during the fiscal year as amounts which may be taken into account as a dividend for purposes of the maximum rate under section 1(h)(11) of the Internal Revenue Code.
The amounts per share which represent income derived from sources within, and taxes paid to, foreign countries or possessions of the United States are as follows:
| Pay Date | Income | Taxes |
Institutional Class | 12/06/2010 | $0.072 | $0.008 |
| 12/31/2010 | $0.008 | $0.000 |
The fund will notify shareholders in January 2012 of amounts for use in preparing 2011 income tax returns.
Annual Report
Board Approval of Investment Advisory Contracts and Management Fees
Fidelity International Growth Fund
Each year, the Board of Trustees, including the Independent Trustees (together, the Board), votes on the renewal of the management contract and sub-advisory agreements (together, the Advisory Contracts) for the fund. The Board, assisted by the advice of fund counsel and Independent Trustees' counsel, requests and considers a broad range of information relevant to the renewal of the Advisory Contracts throughout the year.
The Board meets regularly and considers at each of its meetings factors that are relevant to its annual consideration of the renewal of the fund's Advisory Contracts, including the services and support provided to the fund and its shareholders. The Board has established various standing committees, each composed of Independent Trustees with varying backgrounds, to which the Board has assigned specific subject matter responsibilities in order to enhance effective decision-making by the Board. The Board, acting directly and through its Committees, requests and receives information concerning the annual consideration of the renewal of the fund's Advisory Contracts. The Board also meets as needed to consider matters specifically related to the Board's annual consideration of the renewal of Advisory Contracts. Members of the Board may also meet with trustees of other Fidelity funds through ad hoc joint committees to discuss certain matters relevant to the Fidelity funds.
At its July 2011 meeting, the Board of Trustees, including the Independent Trustees, unanimously determined to renew the fund's Advisory Contracts. In reaching its determination, the Board considered all factors it believed relevant, including (i) the nature, extent, and quality of the services to be provided to the fund and its shareholders (including the investment performance of the fund); (ii) the competitiveness of the fund's management fee and total expense ratio; (iii) the total costs of the services to be provided by and the profits to be realized by Fidelity from its relationship with the fund; (iv) the extent to which economies of scale would be realized as the fund grows; and (v) whether fee levels reflect these economies of scale, if any, for the benefit of fund shareholders.
In considering whether to renew the Advisory Contracts for the fund, the Board reached a determination, with the assistance of fund counsel and Independent Trustees' counsel and through the exercise of its business judgment, that the renewal of the Advisory Contracts is in the best interests of the fund and its shareholders and that the compensation payable under the Advisory Contracts is fair and reasonable. The Board's decision to renew the Advisory Contracts was not based on any single factor, but rather was based on a comprehensive consideration of all the information provided to the Board at its meetings throughout the year. The Board, in reaching its determination to renew the Advisory Contracts, is aware that shareholders in the fund have a broad range of investment choices available to them, including a wide choice among mutual funds offered by Fidelity's competitors, and that the fund's shareholders, who have the opportunity to review and weigh the disclosure provided by the fund in its prospectus and other public disclosures, have chosen to invest in this fund, managed by Fidelity.
Annual Report
Board Approval of Investment Advisory Contracts and
Management Fees - continued
Nature, Extent, and Quality of Services Provided. The Board considered the staffing within the investment adviser, FMR, and the sub-advisers (together, the Investment Advisers), including the backgrounds of the fund's investment personnel and the fund's investment objective and discipline. The Independent Trustees also had discussions with senior management of Fidelity's investment operations and investment groups. The Board considered the structure of the portfolio manager compensation program and whether this structure provides appropriate incentives to act in the best interests of the fund.
Resources Dedicated to Investment Management and Support Services. The Board and the Fund Oversight and Research Committees reviewed the general qualifications and capabilities of the Investment Advisers' investment staff, including its size, education, experience, and resources, as well as the Investment Advisers' approach to recruiting, training, managing, and compensating investment personnel. The Board also noted that FMR has devoted increased resources to non-U.S. offices. The Board noted that Fidelity's analysts have extensive resources, tools and capabilities which allow them to conduct sophisticated quantitative and fundamental analysis, as well as credit analysis of issuers, counterparties and enhancers. The Board also believes that Fidelity's investment professionals have sufficient access to global information and data so as to provide competitive investment results over time, and that those professionals also have access to sophisticated tools which permit them to assess portfolio construction and risk and performance attribution characteristics continuously, as well as to transmit new information and research conclusions rapidly around the world. Additionally, in their deliberations, the Board considered the Investment Advisers' trading capabilities and resources which are an integral part of the investment management process.
Shareholder and Administrative Services. The Board considered (i) the nature, extent, quality, and cost of advisory, administrative, and shareholder services performed by the Investment Advisers and their affiliates under the Advisory Contracts and under separate agreements covering transfer agency, pricing and bookkeeping, and securities lending services for the fund; (ii) the nature and extent of the investment adviser's supervision of third party service providers, principally custodians and subcustodians; and (iii) the resources devoted to, and the record of compliance with, the fund's compliance policies and procedures. The Board also reviewed the allocation of fund brokerage, including allocations to brokers affiliated with the Investment Advisers, the use of brokerage commissions to pay fund expenses, and the use of "soft" commission dollars to pay for research services.
The Board noted that the growth of fund assets over time across the complex allows Fidelity to reinvest in the development of services designed to enhance the value or convenience of the Fidelity funds as investment vehicles. These services include 24-hour access to account information and market information through telephone representatives and over the Internet, investor education materials and asset allocation tools, and the expanded availability of Fidelity Investor Centers, with 35 new branches opening since 2010.
Annual Report
Investment in a Large Fund Family. The Board considered the benefits to shareholders of investing in a Fidelity fund, including the benefits of investing in a fund that is part of a large family of funds offering a variety of investment disciplines and providing a large variety of mutual fund investor services. The Board noted that Fidelity had taken, or had made recommendations that resulted in the Fidelity funds taking, a number of actions over the previous year that benefited particular funds, including (i) continuing to dedicate additional resources to investment research and support of the senior management team that oversees asset management; (ii) rationalizing product lines through the mergers of six funds into other funds; (iii) continuing to migrate the Freedom Funds to dedicated lower cost underlying funds; (iv) obtaining shareholder approval to broaden the investment strategies for Fidelity Consumer Finance Portfolio, Fidelity Emerging Asia Fund, and Fidelity Environment and Alternative Energy Portfolio; (v) contractually agreeing to reduce the management fees and impose other expense limitations on Spartan 500 Index Fund and U.S. Bond Index Fund in connection with launching new institutional classes of these funds; (vi) changing the name, primary and supplemental benchmarks, and investment policies of Fidelity Global Strategies Fund to support the fund's flexible investment mandate and global orientation; and (vii) reducing the transfer agency account fee rates on certain accounts.
Investment Performance. The Board considered whether the fund has operated in accordance with its investment objective, as well as its record of compliance with its investment restrictions. It also reviewed the fund's absolute investment performance for each class, as well as the fund's relative investment performance for each class measured over multiple periods against (i) a broad-based securities market index, and (ii) a custom peer group of mutual funds deemed appropriate by Fidelity and reviewed by the Board. Because the fund had been in existence less than five calendar years, the following charts, considered by the Board show, over the one- and three-year periods ended December 31, 2010, the cumulative total returns of the retail class and Class C of the fund, the cumulative total returns of a broad-based securities market index ("benchmark"), and a range of cumulative total returns of a custom peer group of mutual funds defined by FMR based on categories assigned by Morningstar, Inc. The returns of the retail class and Class C show the performance of the highest and lowest performing classes, respectively (based on three-year performance). The box within each chart shows the 25th percentile return (bottom of box) and the 75th percentile return (top of box) of the peer group. Returns shown above the box are in the first quartile and returns shown below the box are in the fourth quartile. The percentage beaten numbers noted below each chart correspond to the percentile box and represent the percentage of funds in the peer group whose performance was equal to or lower than that of the class indicated. The fund's custom peer group, defined by FMR, is a peer group that FMR believes provides a more meaningful performance comparison than the peer group assigned by Morningstar, Inc., which assigns mutual funds to categories based on their investment styles as measured by their underlying portfolio holdings.
Annual Report
Board Approval of Investment Advisory Contracts and
Management Fees - continued
Fidelity International Growth Fund
The Board reviewed the fund's relative investment performance against its peer group and noted that the performance of the retail class of the fund was in the second quartile for all the periods shown. The Board also noted that the investment performance of the retail class of the fund compared favorably to its benchmark for all the periods shown. The Board considered that the variations in performance among the fund's classes reflect the variations in class expenses, which result in lower performance for higher expense classes. The Board also reviewed the fund's performance since inception as well as performance in the current year.
The Board also considered that the fund's management fee is subject to upward or downward adjustment depending upon whether, and to what extent, the fund's investment performance for the performance period exceeds, or is exceeded by, the record (over the same period) of a Board-approved performance adjustment index. The Board noted that the performance adjustment provides FMR with a strong economic incentive to seek to achieve superior performance for the fund's shareholders and helps to more closely align the interests of FMR and the fund's shareholders.
Annual Report
Based on its review, the Board concluded that the nature, extent, and quality of services provided to the fund under the Advisory Contracts should benefit the fund's shareholders.
Competitiveness of Management Fee and Total Expense Ratio. The Board considered the fund's management fee and total expense ratio compared to "mapped groups" of competitive funds and classes. Fidelity creates "mapped groups" by combining similar Lipper investment objective categories that have comparable management fee characteristics. Combining Lipper investment objective categories aids the Board's management fee and total expense ratio comparisons by broadening the competitive group used for comparison and by reducing the number of universes to which various Fidelity funds are compared.
Management Fee. The Board considered two proprietary management fee comparisons for the 12-month (or shorter) periods shown in the chart below. The group of Lipper funds used by the Board for management fee comparisons is referred to below as the "Total Mapped Group." The Total Mapped Group comparison focuses on a fund's standing relative to the total universe of comparable funds available to investors in terms of gross management fees before expense reimbursements or caps, and without giving effect to the fund's performance adjustment. "TMG %" represents the percentage of funds in the Total Mapped Group that had management fees that were lower than the fund's. For example, a TMG % of 16% means that 84% of the funds in the Total Mapped Group had higher management fees than the fund. The "Asset-Size Peer Group" (ASPG) comparison focuses on a fund's standing relative to non-Fidelity funds similar in size to the fund within the Total Mapped Group. The ASPG represents at least 15% of the funds in the Total Mapped Group with comparable asset size and management fee characteristics, subject to a minimum of 50 funds (or all funds in the Total Mapped Group if fewer than 50). Additional information, such as the ASPG quartile in which the fund's management fee ranked and the impact of the fund's performance adjustment, is also included in the chart and considered by the Board.
Annual Report
Board Approval of Investment Advisory Contracts and
Management Fees - continued
Fidelity International Growth Fund
The Board noted that the fund's management fee ranked below the median of its Total Mapped Group and below the median of its ASPG for 2010. The Board also noted the effect of the fund's positive performance adjustment on the fund's management fee ranking. The Board noted that the performance adjustment for each year represents calculations for performance periods that differ from the periods shown in the performance charts above.
Based on its review, the Board concluded that the fund's management fee is fair and reasonable in light of the services that the fund receives and the other factors considered.
Total Expense Ratio. In its review of each class's total expense ratio, the Board considered the fund's management fee as well as other fund or class expenses, as applicable, such as transfer agent fees, pricing and bookkeeping fees, fund-paid 12b-1 fees, and custodial, legal, and audit fees. The Board also noted the effects of any waivers and reimbursements on fees and expenses, as well as the impact of the fund's performance adjustment. As part of its review, the Board also considered the current and historical total expense ratios of each class of the fund compared to competitive fund median expenses. Each class of the fund is compared to those funds and classes in the Total Mapped Group (used by the Board for management fee comparisons) that have a similar sales load structure.
The Board noted that the total expense ratio of each of Class A, Class B, and the retail class ranked below its competitive median for 2010, the total expense ratio of Class C ranked equal to its competitive median for 2010, and the total expense ratio of each of Class T and Institutional Class ranked above its competitive median for 2010. The Board considered that various factors, including 12b-1 fees, positive or negative performance adjustments, and relatively higher other expenses in the case of small fund size, can affect total expense ratios. The Board noted that the total expense ratio of Class T was above the competitive median primarily because of higher 12b-1 fees on Class T. Class T has a higher 12b-1 fee, but a lower front-end sales charge, than traditionally priced front-end sales charge classes. The Board noted that the fund offers multiple classes, each of which has a different sales load and 12b-1 fee structure, and that the multiple structures are intended to offer a range of pricing options for the intermediary market. The Board also noted that the total expense ratios of the classes vary primarily by the level of their 12b-1 fees, although differences in transfer agent fees may also cause expenses to vary from class to class.
Annual Report
Fees Charged to Other Fidelity Clients. The Board also considered Fidelity fee structures and other information with respect to clients of FMR and its affiliates, such as other mutual funds advised or subadvised by FMR or its affiliates, pension plan clients, and other institutional clients. In March 2010, the Board created an ad hoc joint committee with the board of other Fidelity funds (the Committee) to review and compare Fidelity's institutional investment advisory business with its business of providing services to the Fidelity funds, including the differences in services provided, fees charged, and costs incurred, as well as competition in their respective marketplaces.
Based on its review of total expense ratios and fees charged to other Fidelity clients, the Board concluded that the total expense ratio of each class of the fund was reasonable, although in some cases above the median of the universe presented for comparison, in light of the services that the fund and its shareholders receive and the other factors considered, including the findings of the Committee.
Costs of the Services and Profitability. The Board considered the revenues earned and the expenses incurred by Fidelity in conducting the business of developing, marketing, distributing, managing, administering and servicing the fund and its shareholders. The Board also considered the level of Fidelity's profits in respect of all the Fidelity funds.
On an annual basis, FMR presents to the Board Fidelity's profitability for the fund. Fidelity calculates the profitability for each fund, as well as aggregate profitability for groups of Fidelity funds and all Fidelity funds, using a series of detailed revenue and cost allocation methodologies which originate with the books and records of Fidelity on which Fidelity's audited financial statements are based. The Audit Committee of the Board reviews any significant changes from the prior year's methodologies.
PricewaterhouseCoopers LLP (PwC), independent registered public accounting firm and auditor to Fidelity and certain Fidelity funds, has been engaged annually by the Board as part of the Board's assessment of Fidelity's profitability analysis. PwC's engagement includes the review and assessment of Fidelity's methodologies used in determining the revenues and expenses attributable to Fidelity's mutual fund business, and completion of agreed-upon procedures surrounding the mathematical accuracy of fund profitability and its conformity to allocation methodologies. After considering PwC's reports issued under the engagement and information provided by Fidelity, the Board concluded that while other allocation methods may also be reasonable, Fidelity's profitability methodologies are reasonable in all material respects.
Annual Report
Board Approval of Investment Advisory Contracts and
Management Fees - continued
The Board also reviewed Fidelity's non-fund businesses and fall-out benefits related to the mutual fund business as well as cases where Fidelity's affiliates may benefit from or be related to the fund's business.
The Board considered the costs of the services provided by and the profits realized by Fidelity in connection with the operation of the fund and was satisfied that the profitability was not excessive in the circumstances.
Economies of Scale. The Board considered whether there have been economies of scale in respect of the management of the Fidelity funds, whether the Fidelity funds (including the fund) have appropriately benefited from any such economies of scale, and whether there is potential for realization of any further economies of scale. The Board considered the extent to which the fund will benefit from economies of scale through increased services to the fund, through waivers or reimbursements, or through fee or expense reductions. The Board also noted that in 2009, it and the board of other Fidelity funds created an ad hoc committee (the Economies of Scale Committee) to analyze whether FMR attains economies of scale in respect of the management and servicing of the Fidelity funds, whether the Fidelity funds have appropriately benefited from such economies of scale, and whether there is potential for realization of any further economies of scale.
The Board recognized that the fund's management contract incorporates a "group fee" structure, which provides for lower group fee rates as total fund assets under FMR's management increase, and for higher group fee rates as total fund assets under FMR's management decrease. FMR calculates the group fee rates based on a tiered asset "breakpoint" schedule that varies based on asset class. The Board considered that the group fee is designed to deliver the benefits of economies of scale to fund shareholders when total Fidelity fund assets increase, even if assets of any particular fund are unchanged or have declined, because some portion of Fidelity's costs are attributable to services provided to all Fidelity funds, and all funds benefit if those costs can be allocated among more assets. The Board concluded that, given the group fee structure, fund shareholders will benefit from lower management fees as assets under FMR's management increase at the fund complex level, regardless of whether Fidelity achieves any such economies of scale.
Annual Report
The Board concluded, taking into account the analysis of the Economies of Scale Committee, that any potential economies of scale are being appropriately shared between fund shareholders and Fidelity.
Additional Information Requested by the Board. In order to develop fully the factual basis for consideration of the Fidelity funds' Advisory Contracts, the Board requested and received additional information on certain topics, including (i) fund performance trends, actions to be taken by FMR to improve certain funds' overall performance, and Fidelity's long-term strategies for certain funds; (ii) portfolio manager changes that have occurred during the past year and length of portfolio manager tenure for different categories of funds over time; (iii) Fidelity's compensation structure for portfolio managers and other key personnel and strategies for attracting and retaining non-investment personnel; (iv) the amount of the investment that each portfolio manager has made in the Fidelity fund(s) that he or she manages; (v) historical trends in Fidelity's realization of fall-out benefits; (vi) Fidelity's group fee structures and the rationale for the individual fee rates of certain funds; (vii) fund profitability methodology and the impact of certain factors on fund profitability results; (viii) trends regarding industry use of performance fee structures and Fidelity's compliance practices with respect to performance adjustment calculations; (ix) the fee structures in place for certain other Fidelity clients; and (x) explanations regarding the relative total expense ratios of certain funds and classes, total expense competitive trends, and actions that might be taken by FMR to reduce total expense ratios for certain funds and classes.
Based on its evaluation of all of the conclusions noted above, and after considering all factors it believed relevant, the Board ultimately concluded that the advisory fee structures are fair and reasonable, and that the fund's Advisory Contracts should be renewed.
Annual Report
Investment Adviser
Fidelity Management & Research Company
Boston, MA
Investment Sub-Advisers
FMR Co., Inc.
Fidelity Management & Research
(U.K.) Inc.
Fidelity Management & Research
(Hong Kong) Limited
Fidelity Management & Research
(Japan) Inc.
FIL Investment Advisors
FIL Investments (Japan) Limited
FIL Investment Advisors (UK) Limited
General Distributor
Fidelity Distributors Corporation
Boston, MA
Transfer and Service Agents
Fidelity Investments Institutional Operations Company, Inc.
Boston, MA
Fidelity Service Company, Inc.
Boston, MA
Custodian
State Street Bank and Trust Company
Quincy, MA
AIGFI-UANN-1211
1.853341.103
Fidelity®
International Small Cap
Fund
Annual Report
October 31, 2011
Contents
Chairman's Message | (Click Here) | The Chairman's message to shareholders. |
Performance | (Click Here) | How the fund has done over time. |
Management's Discussion of Fund Performance | (Click Here) | The Portfolio Managers' review of fund performance and strategy. |
Shareholder Expense Example | (Click Here) | An example of shareholder expenses. |
Investment Changes | (Click Here) | A summary of major shifts in the fund's investments over the past six months. |
Investments | (Click Here) | A complete list of the fund's investments with their market values. |
Financial Statements | (Click Here) | Statements of assets and liabilities, operations, and changes in net assets, as well as financial highlights. |
Notes | (Click Here) | Notes to financial statements. |
Report of Independent Registered Public Accounting Firm | (Click Here) | |
Trustees and Officers | (Click Here) | |
Distributions | (Click Here) | |
Board Approval of Investment Advisory Contracts and Management Fees | (Click Here) | |
To view a fund's proxy voting guidelines and proxy voting record for the 12-month period ended June 30, visit http://www.fidelity.com/proxyvotingresults or visit the Securities and Exchange Commission's (SEC) web site at http://www.sec.gov. You may also call 1-800-544-8544 to request a free copy of the proxy voting guidelines.
Standard & Poor's, S&P and S&P 500 are registered service marks of The McGraw-Hill Companies, Inc. and have been licensed for use by Fidelity Distributors Corporation.
Other third party marks appearing herein are the property of their respective owners.
All other marks appearing herein are registered or unregistered trademarks or service marks of FMR LLC or an affiliated company.
Annual Report
This report and the financial statements contained herein are submitted for the general information of the shareholders of the fund. This report is not authorized for distribution to prospective investors in the fund unless preceded or accompanied by an effective prospectus.
A fund files its complete schedule of portfolio holdings with the SEC for the first and third quarters of each fiscal year on Form N-Q. Forms N-Q are available on the SEC's web site at http://www.sec.gov. A fund's Forms N-Q may be reviewed and copied at the SEC's Public Reference Room in Washington, DC. Information regarding the operation of the SEC's Public Reference Room may be obtained by calling 1-800-SEC-0330. For a complete list of a fund's portfolio holdings, view the most recent holdings listing, semiannual report, or annual report on Fidelity's web site at http://www.fidelity.com, http://www.advisor.fidelity.com, or http://www.401k.com, as applicable.
NOT FDIC INSURED • MAY LOSE VALUE • NO BANK GUARANTEE
Neither the fund nor Fidelity Distributors Corporation is a bank.
Annual Report
(Acting Chairman's Photograph)
Dear Shareholder:
Global equity markets began the fourth quarter on a strong note, sharply reversing course in October amid strong corporate earnings, better-than-expected economic news and the promise of a resolution to the sovereign debt crisis in Europe. The mini rally followed a third quarter marked by a significant downturn in July and August, which heightened investor anxiety and set off a wave of volatility that hampered most major asset classes through the end of September. Financial markets are difficult to predict, of course, but you can help put the odds in your favor by following these time-tested investment principles.
One of the basic tenets is to invest according to your time horizon. For long-term investors, riding out the markets' inevitable ups and downs has proven much more effective than making decisions based on short-term developments. If your goal is approaching, you can also benefit from patience and restraint, rather than attempting to time the market. No matter your time horizon, missing only a few of the markets' best days can significantly diminish returns. Patience also affords the benefits of compounding - earning interest on additional income or reinvested dividends and capital gains. While staying the course doesn't eliminate risk, it can considerably lessen the negative impact of short-term downturns.
Asset allocation is another principle to manage risk. As you spread your portfolio among the asset classes, be sure to consider your time horizon, risk tolerance and investment objectives. Younger investors may be better served by emphasizing equities, which historically have been the best-performing asset class over time. Investors who are nearing a specific goal, such as retirement or sending a child to college, may choose to favor bonds and other investments that have tended to be more stable. Studies indicate that asset allocation is the single most important determinant of a portfolio's long-term success. After deciding on a suitable allocation strategy, make sure your portfolio is adequately diversified, with exposure to stocks of small-, mid- and large-cap companies in a range of sectors, for example. And today, more than ever, geographic diversification should be taken into account.
Lastly, investing a certain amount of money on a regular basis - a principle known as dollar-cost averaging - can help lower the average cost of your purchases, while also giving you the discipline to avoid selling weak performers just prior to an upswing, or chasing a hot performer just before a correction.
We invite you to learn more by visiting us on the Internet, dropping by one of our Investor Centers or calling us by phone. It is our privilege to provide the resources you need to choose investments that are right for you.
Sincerely,
(Acting Chairman's Signature)
James C. Curvey
Acting Chairman
Annual Report
Average annual total return reflects the change in the value of an investment, assuming reinvestment of the class' distributions from dividend income and capital gains (the profits earned upon the sale of securities that have grown in value, if any) and assuming a constant rate of performance each year. The $10,000 table and the fund's returns do not reflect the deduction of taxes that a shareholder would pay on fund distributions or the redemption of fund shares. During periods of reimbursement by Fidelity, a fund's total return will be greater than it would be had the reimbursement not occurred. How a fund did yesterday is no guarantee of how it will do tomorrow.
Average Annual Total Returns
Periods ended October 31, 2011 | Past 1
year | Past 5
years | Life of
class A |
Fidelity® International Small Cap Fund | -3.65% | 1.17% | 15.22% |
A From September 18, 2002.
$10,000 Over Life of Fund
Let's say hypothetically that $10,000 was invested in Fidelity® International Small Cap Fund, a class of the fund, on September 18, 2002, when the fund started. The chart shows how the value of your investment would have changed, and also shows how the MSCI® EAFE® (Europe, Australasia, Far East) Small Cap Index performed over the same period.
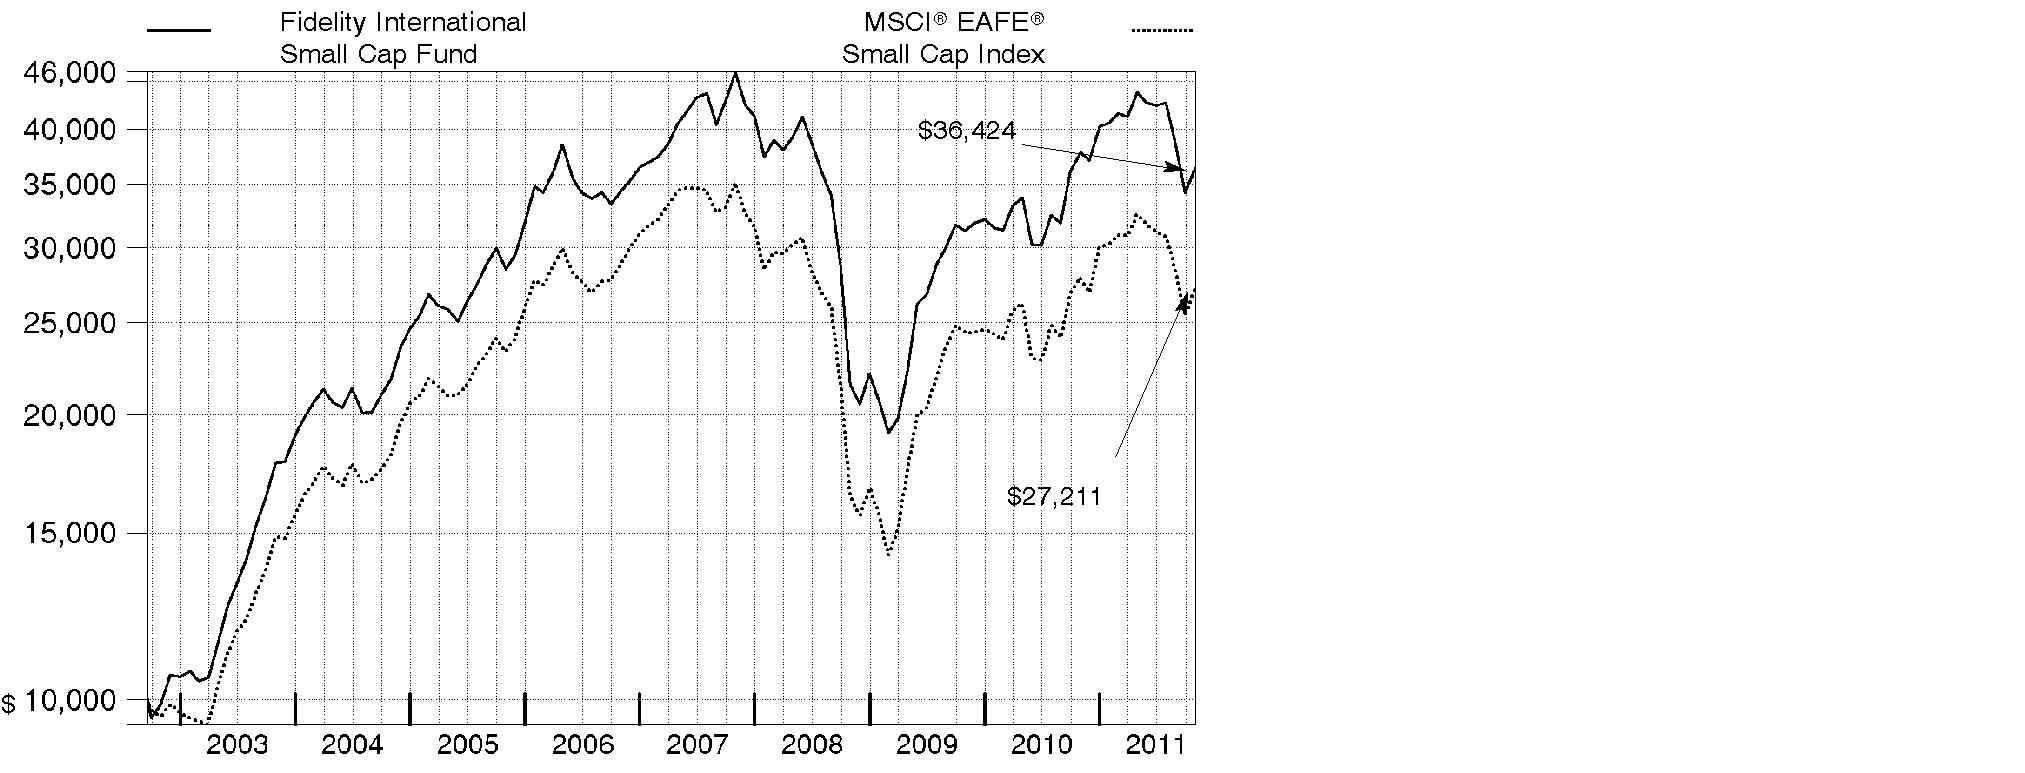
Annual Report
Market Recap: International equities were rocked by a number of headline events during the year ending October 31, 2011. Stocks posted a solid advance for the first half of the period, despite concern about the sovereign debt crisis in Europe, a devastating earthquake and tsunami in Japan, and political upheaval in the Middle East and North Africa. Sentiment turned decidedly negative in the second half, however, as fresh worries about Europe, inflation in China and a dimmed outlook for global growth caused foreign markets to suffer declines that intensified in August and September. October brought with it yet another dramatic swing, as eurozone policymakers appeared near a resolution to the debt debacle and buyers stormed back onto the scene in search of bargains. Still, those gains - along with favorable currency fluctuations overall - weren't enough to offset prior losses, and the MSCI® ACWI® (All Country World Index) ex USA Index finished the period down 4.56%. Within the MSCI index, Europe and emerging markets suffered the biggest declines, with many countries in these areas sustaining steep losses. By contrast, Japan showed resilience in the wake of its natural disasters, falling only 2%. Australia (+4%), Switzerland (+3%), the U.K. (+2%) and Canada, which produced a nominal return, were among the few major benchmark components to break into positive territory.
Comments from Colin Stone, Dale Nicholls and Nicholas Price, Co-Portfolio Managers of Fidelity® International Small Cap Fund: For the year, the fund's Retail Class shares returned -3.65%, lagging the -2.39% mark of the MSCI® EAFE® (Europe, Australasia, Far East) Small Cap Index. Positioning in energy and industrials meaningfully detracted. By contrast, our stakes in health care and financials notably contributed. Geographically, our picks in the U.K. and an overweighting in China hurt, while security selection in Europe, Japan and elsewhere in Asia-Pacific helped. The Europe/Middle East/Africa subportfolio had the weakest performance. U.K. energy firm Aurelian Oil & Gas detracted, while Irish biopharmaceutical firm Elan added value. The Asia-Pacific ex Japan subportfolio finished about even with its benchmark's modest loss. Sino Prosper State Gold Resources Holdings detracted, and Singapore-based consumer electronics firm Pertama Holdings helped. The Japanese subportfolio beat its benchmark's roughly 9% gain. Online advertising firm CyberAgent contributed, and electronic components maker Mitsumi Electric - which we sold - hurt. Elan, Sino Prosper and Pertama were not in the index.
Note to shareholders: Nicholas Price became Co-Portfolio Manager on November 1, 2011.
The views expressed above reflect those of the portfolio manager(s) only through the end of the period as stated on the cover of this report and do not necessarily represent the views of Fidelity or any other person in the Fidelity organization. Any such views are subject to change at any time based upon market or other conditions and Fidelity disclaims any responsibility to update such views. These views may not be relied on as investment advice and, because investment decisions for a Fidelity fund are based on numerous factors, may not be relied on as an indication of trading intent on behalf of any Fidelity fund.
Annual Report
Shareholder Expense Example
As a shareholder of the Fund, you incur two types of costs: (1) transaction costs, including sales charges (loads) on purchase payments or redemption proceeds, redemption fees, and (2) ongoing costs, including management fees, distribution and/or service (12b-1) fees and other Fund expenses. This Example is intended to help you understand your ongoing costs (in dollars) of investing in the Fund and to compare these costs with the ongoing costs of investing in other mutual funds.
The Example is based on an investment of $1,000 invested at the beginning of the period and held for the entire period (May 1, 2011 to October 31, 2011).
Actual Expenses
The first line of the accompanying table for each class of the Fund provides information about actual account values and actual expenses. You may use the information in this line, together with the amount you invested, to estimate the expenses that you paid over the period. Simply divide your account value by $1,000.00 (for example, an $8,600 account value divided by $1,000.00 = 8.6), then multiply the result by the number in the first line for a class of the Fund under the heading entitled "Expenses Paid During Period" to estimate the expenses you paid on your account during this period. A small balance maintenance fee of $12.00 that is charged once a year may apply for certain accounts with a value of less than $2,000. This fee is not included in the table below. If it was, the estimate of expenses you paid during the period would be higher, and your ending account value lower, by this amount. In addition, the Fund, as a shareholder in the underlying Fidelity Central Funds, will indirectly bear its pro-rata share of the fees and expenses incurred by the underlying Fidelity Central Funds. These fees and expenses are not included in the Fund's annualized expense ratio used to calculate the expense estimate in the table below.
Hypothetical Example for Comparison Purposes
The second line of the accompanying table for each class of the Fund provides information about hypothetical account values and hypothetical expenses based on a Class' actual expense ratio and an assumed rate of return of 5% per year before expenses, which is not the Class' actual return. The hypothetical account values and expenses may not be used to estimate the actual ending account balance or expenses you paid for the period. You may use this information to compare the ongoing costs of investing in the Fund and other funds. To do so, compare this 5% hypothetical example with the 5% hypothetical examples that appear in the shareholder reports of the other funds. A small balance maintenance fee of $12.00 that is charged once a year may apply for certain accounts with a value of less than $2,000. This fee is not included in the table below. If it was, the estimate of expenses you paid during the period would be higher, and your ending account value lower, by this amount. In addition, the Fund, as a shareholder in the underlying Fidelity Central Funds, will indirectly bear its pro-rata share of the fees and expenses incurred by the underlying Fidelity Central Funds. These fees and expenses are not included in the Fund's annualized expense ratio used to calculate the expense estimate in the table below.
Please note that the expenses shown in the table are meant to highlight your ongoing costs only and do not reflect any transaction costs. Therefore, the second line of the table is useful in comparing ongoing costs only, and will not help you determine the relative total costs of owning different funds. In addition, if these transactional costs were included, your costs would have been higher.
Annual Report
| Annualized Expense Ratio | Beginning
Account Value
May 1, 2011 | Ending
Account Value
October 31, 2011 | Expenses Paid
During Period*
May 1, 2011 to October 31, 2011 |
Class A | 1.55% | | | |
Actual | | $ 1,000.00 | $ 831.30 | $ 7.15 |
HypotheticalA | | $ 1,000.00 | $ 1,017.39 | $ 7.88 |
Class T | 1.81% | | | |
Actual | | $ 1,000.00 | $ 830.40 | $ 8.35 |
HypotheticalA | | $ 1,000.00 | $ 1,016.08 | $ 9.20 |
Class B | 2.30% | | | |
Actual | | $ 1,000.00 | $ 828.30 | $ 10.60 |
HypotheticalA | | $ 1,000.00 | $ 1,013.61 | $ 11.67 |
Class C | 2.27% | | | |
Actual | | $ 1,000.00 | $ 828.30 | $ 10.46 |
HypotheticalA | | $ 1,000.00 | $ 1,013.76 | $ 11.52 |
International Small Cap | 1.25% | | | |
Actual | | $ 1,000.00 | $ 832.50 | $ 5.77 |
HypotheticalA | | $ 1,000.00 | $ 1,018.90 | $ 6.36 |
Institutional Class | 1.21% | | | |
Actual | | $ 1,000.00 | $ 832.90 | $ 5.59 |
HypotheticalA | | $ 1,000.00 | $ 1,019.11 | $ 6.16 |
A 5% return per year before expenses
* Expenses are equal to each Class' annualized expense ratio, multiplied by the average account value over the period, multiplied by 184/365 (to reflect the one-half year period).
Annual Report
Investment Changes (Unaudited)
Geographic Diversification (% of fund's net assets) |
As of October 31, 2011 |
| Japan 27.8% | |
| United Kingdom 18.2% | |
| Germany 8.5% | |
| Australia 7.5% | |
| France 5.1% | |
| Ireland 3.2% | |
| Bermuda 2.9% | |
| Cayman Islands 2.5% | |
| Singapore 2.3% | |
| Other 22.0% | |

Percentages are adjusted for the effect of futures contracts, if applicable. |
As of April 30, 2011 |
| Japan 22.0% | |
| United Kingdom 18.1% | |
| Germany 10.2% | |
| Australia 6.8% | |
| France 6.7% | |
| United States of America 3.7% | |
| Bermuda 3.1% | |
| Cayman Islands 2.6% | |
| Norway 2.4% | |
| Other 24.4% | |

Percentages are adjusted for the effect of futures contracts, if applicable. |
Asset Allocation |
| % of fund's
net assets | % of fund's net assets
6 months ago |
Stocks and Equity Futures | 98.5 | 96.7 |
Bonds | 0.1 | 0.2 |
Short-Term Investments and Net Other Assets | 1.4 | 3.1 |
Top Ten Stocks as of October 31, 2011 |
| % of fund's
net assets | % of fund's net assets
6 months ago |
Pertama Holdings Ltd. (Singapore, Specialty Retail) | 1.3 | 0.7 |
London Mining PLC (United Kingdom, Metals & Mining) | 1.0 | 1.0 |
Paddy Power PLC (Ireland) (Ireland, Hotels, Restaurants & Leisure) | 0.9 | 0.1 |
Kenmare Resources PLC (Ireland, Metals & Mining) | 0.9 | 0.9 |
Elan Corp. PLC (Ireland, Pharmaceuticals) | 0.9 | 0.8 |
Tiger Resources Ltd. (Australia, Metals & Mining) | 0.9 | 0.9 |
Ipsos SA (France, Media) | 0.9 | 0.8 |
Asahi Intecc Co. Ltd. (Japan, Health Care Equipment & Supplies) | 0.9 | 0.6 |
CTS Eventim AG (Germany, Media) | 0.9 | 0.7 |
Lanxess AG (Germany, Chemicals) | 0.9 | 1.0 |
| 9.5 | |
Market Sectors as of October 31, 2011 |
| % of fund's
net assets | % of fund's net assets
6 months ago |
Consumer Discretionary | 21.0 | 17.3 |
Industrials | 17.7 | 18.4 |
Information Technology | 15.0 | 14.9 |
Materials | 13.6 | 13.8 |
Financials | 11.3 | 12.4 |
Health Care | 9.7 | 8.3 |
Energy | 5.7 | 6.6 |
Consumer Staples | 2.7 | 2.3 |
Telecommunication Services | 1.3 | 2.3 |
Utilities | 0.3 | 0.6 |
Annual Report
Investments October 31, 2011
Showing Percentage of Net Assets
Common Stocks - 98.2% |
| Shares | | Value |
Australia - 7.5% |
Atlas Iron Ltd. | 610,639 | | $ 1,980,723 |
Ausgold Ltd. (a)(e) | 1,220,000 | | 1,528,690 |
Austal Ltd. | 848,401 | | 2,017,722 |
Beach Energy Ltd. | 575,255 | | 707,059 |
Blackgold International Holdings Ltd. | 1,950,000 | | 447,192 |
carsales.com Ltd. (e) | 430,178 | | 2,224,021 |
Centamin Egypt Ltd. (United Kingdom) (a) | 2,018,614 | | 3,564,476 |
Dart Energy Ltd. (a) | 3,642,982 | | 2,344,864 |
DUET Group | 917,947 | | 1,599,925 |
Goodman Group unit | 1,506,880 | | 979,326 |
Horizon Oil Ltd. (a) | 2,028,276 | | 504,048 |
Iluka Resources Ltd. | 130,860 | | 2,175,715 |
Imdex Ltd. | 595,564 | | 1,300,593 |
Industrea Ltd. | 870,384 | | 1,167,628 |
Iress Market Technology Ltd. | 140,627 | | 1,120,793 |
Ironbark Zinc Ltd. (a) | 2,305,831 | | 726,992 |
Karoon Gas Australia Ltd. (a) | 160,153 | | 739,131 |
Kingsgate Consolidated NL | 141,376 | | 1,114,722 |
Linc Energy Ltd. | 508,182 | | 1,091,028 |
MAp Group unit | 169,101 | | 603,458 |
Medusa Mining Ltd. | 239,743 | | 1,685,456 |
Mesoblast Ltd. (a)(e) | 252,300 | | 2,145,258 |
Mineral Deposits Ltd. (a) | 445,391 | | 3,009,757 |
Mineral Deposits Ltd. (Canada) (a) | 457,000 | | 2,874,444 |
Mirabela Nickel Ltd. (a) | 795,964 | | 1,368,741 |
Monto Minerals Ltd. (a) | 273,551 | | 5,383 |
Navitas Ltd. | 464,760 | | 2,013,083 |
Northern Iron Ltd. (a) | 423,362 | | 512,891 |
Paladin Energy Ltd. (Australia) (a) | 113,814 | | 173,825 |
Panaust Ltd. (a) | 455,468 | | 1,539,223 |
Ramsay Health Care Ltd. | 119,108 | | 2,341,572 |
realestate.com.au Ltd. | 84,356 | | 1,144,994 |
Red 5 Ltd. (a) | 4,566,367 | | 890,754 |
SAI Global Ltd. | 942,792 | | 4,696,897 |
SEEK Ltd. | 421,927 | | 2,735,662 |
Sino Gas & Energy Ltd. (a) | 8,152,205 | | 364,173 |
SomnoMed Ltd. (a) | 531,849 | | 613,708 |
Tiger Resources Ltd. (a) | 16,688,264 | | 8,106,796 |
TPG Telecom Ltd. | 891,143 | | 1,333,188 |
Troy Resources NL | 314,010 | | 1,334,616 |
Wotif.com Holdings Ltd. (e) | 562,113 | | 2,166,275 |
TOTAL AUSTRALIA | | 68,994,802 |
Common Stocks - continued |
| Shares | | Value |
Bailiwick of Jersey - 1.2% |
Informa PLC | 1,249,285 | | $ 7,280,979 |
LXB Retail Properties PLC (a)(i) | 2,495,000 | | 4,052,584 |
TOTAL BAILIWICK OF JERSEY | | 11,333,563 |
Belgium - 0.7% |
EVS Broadcast Equipment SA | 119,700 | | 6,145,720 |
Bermuda - 2.9% |
Aquarius Platinum Ltd.: | | | |
(Australia) | 465,705 | | 1,366,313 |
(United Kingdom) | 1,502,800 | | 4,495,254 |
Asia Satellite Telecommunications Holdings Ltd. | 271,000 | | 513,613 |
Biosensors International Group Ltd. (a) | 1,769,000 | | 1,971,308 |
China Animal Healthcare Ltd. | 2,129,000 | | 477,140 |
China LotSynergy Holdings Ltd. (a) | 7,324,000 | | 103,084 |
China Singyes Solar Tech Holdings Ltd. | 818,000 | | 447,262 |
China Water Affairs Group Ltd. | 1,134,000 | | 325,718 |
G-Resources Group Ltd. (a) | 15,882,000 | | 957,927 |
Imagi International Holdings Ltd. (a) | 17,664,000 | | 461,374 |
Luk Fook Holdings International Ltd. | 757,000 | | 3,245,563 |
Oakley Capital Investments Ltd. (a) | 1,596,500 | | 3,555,975 |
Petra Diamonds Ltd. (a) | 2,629,100 | | 4,862,336 |
Texwinca Holdings Ltd. | 874,000 | | 1,107,283 |
Vtech Holdings Ltd. | 279,100 | | 2,606,039 |
TOTAL BERMUDA | | 26,496,189 |
British Virgin Islands - 0.6% |
Kalahari Energy (a)(i) | 1,451,000 | | 15 |
Playtech Ltd. (e) | 1,183,846 | | 5,183,262 |
TOTAL BRITISH VIRGIN ISLANDS | | 5,183,277 |
Canada - 0.7% |
AirSea Lines (a)(i) | 1,893,338 | | 26 |
Banro Corp. (a) | 794,600 | | 3,379,750 |
Rock Well Petroleum, Inc. (a)(i) | 770,400 | | 8 |
Starfield Resources, Inc. (a) | 4,328,075 | | 86,835 |
Teranga Gold Corp. (a) | 1,338,099 | | 2,886,004 |
TOTAL CANADA | | 6,352,623 |
Cayman Islands - 2.5% |
AirMedia Group, Inc. ADR (a)(e) | 150,900 | | 410,448 |
Airtac International Group | 135,000 | | 755,605 |
China Automation Group Ltd. | 1,589,000 | | 551,626 |
Common Stocks - continued |
| Shares | | Value |
Cayman Islands - continued |
China Corn Oil Co. Ltd. | 967,000 | | $ 410,222 |
China High Precision Automation Group Ltd. | 712,000 | | 251,117 |
China Lilang Ltd. | 340,000 | | 357,894 |
China Metal International Holdings, Inc. | 2,002,000 | | 356,747 |
China Real Estate Information Corp. ADR (a) | 75,300 | | 448,035 |
China ZhengTong Auto Services Holdings Ltd. | 536,500 | | 580,929 |
CNinsure, Inc. ADR (a)(e) | 31,900 | | 240,845 |
Concord Medical Services Holdings Ltd. ADR | 84,800 | | 310,368 |
Ctrip.com International Ltd. sponsored ADR (a) | 21,900 | | 763,434 |
Daphne International Holdings Ltd. | 662,000 | | 691,631 |
EVA Precision Industrial Holdings Ltd. | 11,604,000 | | 2,996,746 |
Fook Woo Group Holdings Ltd. (a) | 2,055,000 | | 388,301 |
Haitian International Holdings Ltd. | 597,000 | | 530,432 |
Kingdee International Software Group Co. Ltd. | 896,400 | | 363,132 |
KongZhong Corp. sponsored ADR (a) | 46,600 | | 238,592 |
Lee's Pharmaceutical Holdings Ltd. | 595,000 | | 225,337 |
Little Sheep Group Ltd. | 614,000 | | 397,728 |
Marwyn Value Investors II Ltd. (a) | 1,971,700 | | 4,455,098 |
Ming Fai International Holdings Ltd. | 8,719,000 | | 1,269,099 |
Minth Group Ltd. | 574,000 | | 595,563 |
MStar Semiconductor, Inc. | 84,000 | | 486,791 |
Orchid Developments Group Ltd. (a) | 1,180,100 | | 66,424 |
Perfect World Co. Ltd. sponsored ADR Class B (a) | 34,900 | | 454,049 |
Shenguan Holdings Group Ltd. | 3,154,000 | | 1,694,504 |
Sino-Life Group Ltd. (a) | 3,020,000 | | 97,440 |
SouFun Holdings Ltd. ADR (e) | 25,400 | | 324,104 |
VisionChina Media, Inc. ADR (a)(e) | 183,500 | | 330,300 |
VST Holdings Ltd. (a) | 1,858,000 | | 295,617 |
WuXi PharmaTech Cayman, Inc. sponsored ADR (a) | 39,000 | | 484,770 |
Xueda Education Group sponsored ADR | 78,600 | | 260,952 |
Yip's Chemical Holdings Ltd. | 592,000 | | 515,290 |
TOTAL CAYMAN ISLANDS | | 22,599,170 |
China - 0.9% |
51job, Inc. sponsored ADR (a) | 12,800 | | 591,104 |
AMVIG Holdings Ltd. | 764,000 | | 476,697 |
Baidu.com, Inc. sponsored ADR (a) | 9,800 | | 1,373,764 |
Beijing Jingkelong Co. Ltd. (H Shares) | 379,000 | | 370,158 |
China Metal Recycling (Holdings) Ltd. | 436,800 | | 467,680 |
Dalian Port (PDA) Co. Ltd. (H Shares) | 1,786,000 | | 456,603 |
People's Food Holdings Ltd. (a) | 866,000 | | 448,715 |
Royale Furniture Holdings Ltd. | 2,335,074 | | 706,687 |
Common Stocks - continued |
| Shares | | Value |
China - continued |
Sino Prosper State Gold Resources Holdings, Ltd. (a) | 74,950,000 | | $ 1,268,788 |
Weiqiao Textile Co. Ltd. (H Shares) | 2,055,500 | | 1,124,065 |
Zhaojin Mining Industry Co. Ltd. (H Shares) | 117,000 | | 208,890 |
Zhongpin, Inc. (a)(e) | 40,200 | | 371,046 |
Zijin Mining Group Co. Ltd. (H Shares) | 1,008,000 | | 429,035 |
TOTAL CHINA | | 8,293,232 |
Cyprus - 0.8% |
Buried Hill Energy (Cyprus) PCL (a)(i) | 1,947,000 | | 4,867,500 |
Mirland Development Corp. PLC (a) | 822,600 | | 2,516,827 |
TOTAL CYPRUS | | 7,384,327 |
Denmark - 1.3% |
DSV de Sammensluttede Vognmaend A/S | 297,600 | | 6,016,482 |
William Demant Holding A/S (a) | 69,800 | | 5,569,201 |
TOTAL DENMARK | | 11,585,683 |
France - 5.0% |
Altamir Amboise (a) | 584,200 | | 5,408,694 |
ALTEN | 125,000 | | 3,567,002 |
Audika SA | 113,900 | | 2,518,867 |
Axway Software SA (a) | 51,625 | | 1,057,369 |
Devoteam SA (e) | 42,500 | | 736,961 |
Faiveley Transport | 45,935 | | 3,152,091 |
Iliad SA | 41,971 | | 4,912,717 |
Ipsos SA | 243,672 | | 8,002,176 |
LeGuide.com SA (a) | 94,400 | | 1,933,474 |
Maisons France Confort | 93,944 | | 3,367,236 |
Pierre & Vacances | 19,190 | | 753,158 |
Sartorius Stedim Biotech | 57,000 | | 3,865,233 |
Sopra Group SA | 41,300 | | 2,623,418 |
SR Teleperformance SA | 153,600 | | 3,248,024 |
Trigano SA | 23,987 | | 439,344 |
TOTAL FRANCE | | 45,585,764 |
Germany - 8.1% |
Bilfinger Berger AG | 74,327 | | 6,663,344 |
CENTROTEC Sustainable AG | 226,778 | | 4,423,548 |
CTS Eventim AG | 239,026 | | 7,914,105 |
Delticom AG | 49,200 | | 5,501,501 |
GFK AG | 142,601 | | 6,591,341 |
HeidelbergCement AG | 129,066 | | 5,890,704 |
Lanxess AG | 131,385 | | 7,743,871 |
Common Stocks - continued |
| Shares | | Value |
Germany - continued |
MTU Aero Engines Holdings AG | 84,500 | | $ 5,678,585 |
Rational AG | 16,720 | | 3,876,907 |
Rheinmetall AG | 60,500 | | 3,224,286 |
RIB Software AG | 413,200 | | 2,573,796 |
Stroer Out-of-Home Media AG (a) | 194,100 | | 2,847,319 |
Tom Tailor Holding AG (a) | 242,500 | | 3,785,520 |
United Internet AG | 331,665 | | 6,547,509 |
Wirecard AG | 41,362 | | 661,132 |
TOTAL GERMANY | | 73,923,468 |
Hong Kong - 0.7% |
Convenience Retail Asia Ltd. | 700,000 | | 296,043 |
Dah Sing Financial Holdings Ltd. | 172,000 | | 533,943 |
GZI Transport Ltd. | 1,294,000 | | 558,606 |
I.T Ltd. | 1,912,000 | | 1,190,786 |
Magnificent Estates Ltd. | 32,558,000 | | 1,035,192 |
REXCAPITAL Financial Holdings Ltd. | 11,300,000 | | 785,838 |
Techtronic Industries Co. Ltd. | 2,059,500 | | 1,781,948 |
Tian An China Investments Co. Ltd. | 750,000 | | 396,123 |
YGM Trading Ltd. | 115,000 | | 269,918 |
TOTAL HONG KONG | | 6,848,397 |
Iceland - 0.8% |
Ossur hf (a) | 4,510,900 | | 7,131,195 |
India - 0.5% |
Ahluwalia Contracts (India) Ltd. | 230,314 | | 501,916 |
Educomp Solutions Ltd. | 44,518 | | 246,144 |
Financial Technologies India Ltd. | 23,352 | | 349,909 |
Geodesic Ltd. | 256,340 | | 308,497 |
Grasim Industries Ltd. | 9,911 | | 526,336 |
Indian Overseas Bank | 186,286 | | 390,401 |
IndusInd Bank Ltd. | 91,917 | | 560,426 |
PI Industries Ltd. | 54,595 | | 648,096 |
Thangamayil Jewellery Ltd. | 253,192 | | 879,907 |
TOTAL INDIA | | 4,411,632 |
Indonesia - 0.6% |
PT AKR Corporindo Tbk | 1,961,000 | | 663,389 |
PT Clipan Finance Indonesia Tbk | 9,427,900 | | 488,389 |
PT Clipan Finance Indonesia Tbk warrants 10/7/14 (a) | 2,275,700 | | 28,221 |
PT Jasa Marga Tbk | 1,205,000 | | 519,366 |
PT Lippo Karawaci Tbk | 5,564,125 | | 398,922 |
Common Stocks - continued |
| Shares | | Value |
Indonesia - continued |
PT Mayora Indah Tbk | 372,500 | | $ 591,391 |
PT Media Nusantara Citra Tbk | 4,202,500 | | 519,145 |
PT Mitra Adiperkasa Tbk | 2,179,500 | | 1,200,384 |
PT Nippon Indosari Corpindo Tbk | 1,712,000 | | 655,041 |
PT Tower Bersama Infrastructure Tbk | 1,675,500 | | 389,945 |
TOTAL INDONESIA | | 5,454,193 |
Ireland - 3.2% |
Elan Corp. PLC (a) | 530,300 | | 6,289,835 |
Elan Corp. PLC sponsored ADR (a) | 170,600 | | 2,045,494 |
James Hardie Industries NV CDI (a) | 162,432 | | 1,052,159 |
Kenmare Resources PLC (a) | 12,870,600 | | 8,397,381 |
Paddy Power PLC (Ireland) | 158,884 | | 8,795,183 |
Petroceltic International PLC (a) | 24,756,300 | | 2,392,766 |
Petroneft Resources PLC (a) | 1,748,000 | | 737,812 |
TOTAL IRELAND | | 29,710,630 |
Isle of Man - 1.6% |
Bahamas Petroleum Co. PLC (a) | 13,324,710 | | 1,547,159 |
Exillon Energy PLC (a) | 1,163,900 | | 5,615,352 |
IBS Group Holding Ltd. GDR (Reg. S) | 343,200 | | 7,361,795 |
TOTAL ISLE OF MAN | | 14,524,306 |
Israel - 0.1% |
Sarin Technologies Ltd. | 851,000 | | 528,817 |
Italy - 1.7% |
Piaggio & C SpA | 1,031,400 | | 3,425,651 |
Salvatore Ferragamo Italia SpA (a) | 477,800 | | 7,742,973 |
Tod's SpA | 41,626 | | 4,164,930 |
TOTAL ITALY | | 15,333,554 |
Japan - 27.8% |
ABC-Mart, Inc. | 68,700 | | 2,690,765 |
Accordia Golf Co. Ltd. | 2,070 | | 1,524,208 |
Aica Kogyo Co. Ltd. | 92,100 | | 1,246,083 |
Air Water, Inc. | 175,000 | | 2,221,768 |
Arc Land Sakamoto Co. Ltd. | 130,000 | | 2,380,159 |
ARCS Co. Ltd. | 310,500 | | 5,528,920 |
Asahi Diamond Industrial Co. Ltd. | 87,600 | | 1,290,167 |
ASAHI INTECC Co. Ltd. | 313,300 | | 7,950,482 |
ASKUL Corp. | 126,000 | | 1,796,666 |
Avex Group Holdings, Inc. | 181,000 | | 2,141,587 |
Common Stocks - continued |
| Shares | | Value |
Japan - continued |
Calbee, Inc. | 42,100 | | $ 1,919,445 |
Chiba Bank Ltd. | 316,000 | | 1,933,645 |
Chiyoda Corp. | 255,000 | | 2,936,882 |
Chugai Ro Co. Ltd. | 404,000 | | 1,187,568 |
Create SD Holdings Co. Ltd. | 48,200 | | 1,028,684 |
Credit Saison Co. Ltd. | 209,900 | | 4,096,484 |
CyberAgent, Inc. (e) | 2,176 | | 7,334,744 |
Dai-ichi Seiko Co. Ltd. | 22,400 | | 614,408 |
Daido Metal Co. Ltd. | 469,000 | | 4,795,740 |
Daihen Corp. | 256,000 | | 876,882 |
Daikyo, Inc. (a) | 512,000 | | 872,963 |
DeNA Co. Ltd. | 50,100 | | 2,162,672 |
Digital Garage, Inc. (a)(e) | 1,179 | | 3,860,534 |
Don Quijote Co. Ltd. | 98,300 | | 3,601,298 |
Ebara Corp. | 1,324,000 | | 4,836,031 |
EDION Corp. | 91,800 | | 734,605 |
Eiken Chemical Co. Ltd. | 41,000 | | 518,641 |
Exedy Corp. | 131,600 | | 3,813,015 |
Fippon Kayaku Co. Ltd. | 139,000 | | 1,360,157 |
FreeBit Co., Ltd. (e) | 215 | | 571,724 |
Fuji Oil Co. Ltd. | 175,900 | | 2,497,057 |
Fuji Seal International, Inc. | 132,100 | | 2,500,401 |
Furuya Metal Co. Ltd. | 33,400 | | 1,393,134 |
Glory Ltd. | 35,700 | | 764,222 |
Hamamatsu Photonics KK | 40,600 | | 1,544,906 |
Hi-Lex Corp. | 48,500 | | 709,390 |
Horiba Ltd. | 65,300 | | 2,071,698 |
Hulic Co. Ltd. | 299,500 | | 3,206,768 |
Ibiden Co. Ltd. | 116,800 | | 2,579,593 |
Isetan Mitsukoshi Holdings Ltd. | 250,100 | | 2,547,835 |
Iwatsuka Confectionary Co. Ltd. | 11,600 | | 406,140 |
Japan Logistics Fund, Inc. | 117 | | 1,008,436 |
Japan Petroleum Exploration Co. Ltd. | 23,000 | | 908,538 |
JP-Holdings, Inc. (e) | 221,400 | | 1,942,742 |
JSP Corp. | 137,000 | | 2,011,165 |
JTEKT Corp. | 399,000 | | 4,363,695 |
KOMERI Co. Ltd. | 118,800 | | 3,743,376 |
Kuraray Co. Ltd. | 352,600 | | 4,936,614 |
Maeda Corp. | 595,000 | | 2,169,453 |
Makino Milling Machine Co. Ltd. | 242,000 | | 1,606,545 |
Maruwa Ceramic Co. Ltd. | 127,000 | | 5,495,324 |
Melco Holdings, Inc. | 83,700 | | 2,329,189 |
Common Stocks - continued |
| Shares | | Value |
Japan - continued |
Message Co. Ltd. | 1,789 | | $ 5,786,154 |
Misumi Group, Inc. | 167,700 | | 3,489,832 |
Mitsubishi UFJ Lease & Finance Co. Ltd. | 97,330 | | 3,772,101 |
Nabtesco Corp. | 194,000 | | 4,249,457 |
Nihon Kohden Corp. | 90,000 | | 2,101,412 |
Nihon M&A Center, Inc. | 534 | | 3,014,528 |
Nippon Ceramic Co. Ltd. | 88,700 | | 1,614,639 |
Nippon Shinyaku Co. Ltd. | 216,000 | | 2,512,334 |
Nippon Shokubai Co. Ltd. | 424,000 | | 4,325,027 |
Nomura Real Estate Holdings, Inc. | 169,000 | | 2,724,733 |
Nomura Real Estate Residential Fund, Inc. | 426 | | 2,069,511 |
NTT Urban Development Co. | 1,270 | | 874,437 |
OSAKA Titanium technologies Co. Ltd. (e) | 60,200 | | 3,316,210 |
Outsourcing, Inc. (e) | 366,300 | | 1,385,167 |
Pigeon Corp. | 62,800 | | 2,320,527 |
Point, Inc. | 82,570 | | 3,561,874 |
Pola Orbis Holdings, Inc. | 162,300 | | 4,339,997 |
Rinnai Corp. | 42,800 | | 3,197,858 |
Saizeriya Co. Ltd. | 77,600 | | 1,257,790 |
Sanken Electric Co. Ltd. (e) | 1,065,000 | | 3,996,185 |
Sankyu, Inc. | 423,000 | | 1,675,070 |
Santen Pharmaceutical Co. Ltd. | 58,000 | | 2,164,464 |
Sawada Holdings Co. Ltd. (a) | 242,900 | | 1,960,516 |
Sekisui Chemical Co. Ltd. | 574,000 | | 4,504,901 |
Shimadzu Corp. | 272,000 | | 2,315,897 |
Shimamura Co. Ltd. | 40,000 | | 4,000,936 |
Shin-Kobe Electric Machinery Co. Ltd. (e) | 448,000 | | 7,689,356 |
Shinsei Bank Ltd. | 1,522,000 | | 1,673,019 |
SHO-BI Corp. (e) | 183,200 | | 1,099,948 |
SHO-BOND Holdings Co. Ltd. | 111,700 | | 2,492,015 |
So-net M3, Inc. (e) | 1,201 | | 5,432,129 |
Sony Financial Holdings, Inc. | 202,800 | | 3,373,984 |
SRI Sports Ltd. | 66,500 | | 708,305 |
Sumitomo Mitsui Trust Holdings, Inc. | 644,800 | | 2,206,868 |
Sysmex Corp. | 47,800 | | 1,571,390 |
SystemPro Co. Ltd. | 2,036 | | 1,411,697 |
Takata Corp. | 60,200 | | 1,464,305 |
Tera Probe, Inc. | 38,400 | | 553,267 |
The Suruga Bank Ltd. | 308,000 | | 2,567,830 |
Toho Co. Ltd. | 116,400 | | 2,002,433 |
Tokyu Livable, Inc. (e) | 157,200 | | 1,415,516 |
Toshiba Plant Systems & Services Corp. | 249,000 | | 2,662,195 |
Common Stocks - continued |
| Shares | | Value |
Japan - continued |
Toto Ltd. | 529,000 | | $ 4,399,195 |
Tsubakimoto Chain Co. | 404,000 | | 2,073,675 |
Xebio Co. Ltd. | 54,100 | | 1,310,126 |
Yamatake Corp. | 66,700 | | 1,475,835 |
Yamato Kogyo Co. Ltd. | 80,000 | | 2,023,821 |
TOTAL JAPAN | | 254,701,614 |
Korea (South) - 0.5% |
Daou Technology, Inc. | 190,310 | | 1,708,661 |
Duksan Hi-Metal Co. Ltd. (a) | 55,341 | | 1,242,745 |
KC Tech Co. Ltd. | 129,924 | | 595,482 |
Medy-Tox, Inc. | 24,874 | | 453,187 |
TK Corp. (a) | 33,575 | | 619,360 |
TOTAL KOREA (SOUTH) | | 4,619,435 |
Luxembourg - 0.9% |
GlobeOp Financial Services SA | 1,176,485 | | 5,392,266 |
SAF-Holland SA (a)(e) | 420,100 | | 2,608,636 |
TOTAL LUXEMBOURG | | 8,000,902 |
Malaysia - 0.3% |
JobStreet Corp. Bhd | 1,223,100 | | 943,764 |
Lion Industries Corp. Bhd | 722,500 | | 357,160 |
Muhibbah Engineering (M) Bhd | 1,050,100 | | 412,133 |
Top Glove Corp. Bhd | 222,000 | | 308,230 |
WCT Bhd | 560,100 | | 471,811 |
TOTAL MALAYSIA | | 2,493,098 |
Netherlands - 1.1% |
Gemalto NV | 167,770 | | 7,654,873 |
SMARTRAC NV (a) | 24,426 | | 354,933 |
Wavin NV (a) | 296,512 | | 2,203,952 |
TOTAL NETHERLANDS | | 10,213,758 |
Norway - 1.3% |
Aker Solutions ASA | 389,100 | | 4,525,150 |
Schibsted ASA (B Shares) | 214,200 | | 5,605,457 |
Sevan Drilling ASA | 2,350,000 | | 1,890,940 |
Sevan Marine ASA (a)(e) | 2,052,500 | | 103,222 |
TOTAL NORWAY | | 12,124,769 |
Common Stocks - continued |
| Shares | | Value |
Philippines - 0.2% |
Alliance Global Group, Inc. | 3,295,000 | | $ 819,210 |
Belle Corp. (a) | 7,310,000 | | 653,245 |
TOTAL PHILIPPINES | | 1,472,455 |
Poland - 0.6% |
Warsaw Stock Exchange | 424,200 | | 5,988,737 |
Singapore - 2.3% |
CSE Global Ltd. | 1,069,000 | | 711,508 |
First (REIT) | 997,000 | | 629,207 |
Goodpack Ltd. | 1,516,000 | | 2,019,759 |
Hyflux Ltd. | 597,000 | | 677,731 |
OSIM International Ltd. | 1,036,000 | | 1,018,129 |
Pertama Holdings Ltd. (f) | 23,060,000 | | 11,809,703 |
Petra Foods Ltd. | 370,000 | | 481,007 |
Raffles Medical Group Ltd. | 436,205 | | 775,556 |
Sakari Resources Ltd. | 627,000 | | 1,170,802 |
Venture Corp. Ltd. | 259,000 | | 1,380,859 |
Yanlord Land Group Ltd. | 668,000 | | 541,882 |
TOTAL SINGAPORE | | 21,216,143 |
South Africa - 0.3% |
Blue Label Telecoms Ltd. | 3,254,300 | | 2,329,098 |
Sweden - 1.3% |
Elekta AB (B Shares) (e) | 180,000 | | 7,203,258 |
Modern Times Group MTG AB (B Shares) | 87,500 | | 4,641,041 |
TOTAL SWEDEN | | 11,844,299 |
Switzerland - 0.9% |
Leclanche SA (a) | 77,770 | | 1,542,018 |
VZ Holding AG | 57,960 | | 6,604,752 |
TOTAL SWITZERLAND | | 8,146,770 |
Taiwan - 0.2% |
Lung Yen Life Service Co. Ltd. | 121,000 | | 374,623 |
Pacific Hospital Supply Co. Ltd. | 91,000 | | 297,779 |
Tong Hsing Electronics Industries Ltd. | 216,721 | | 549,116 |
Topoint Technology Co. Ltd. | 557,000 | | 397,056 |
WPG Holding Co. Ltd. | 294,000 | | 355,006 |
TOTAL TAIWAN | | 1,973,580 |
Thailand - 0.2% |
TISCO Financial Group PCL | 401,300 | | 445,721 |
Common Stocks - continued |
| Shares | | Value |
Thailand - continued |
Toyo-Thai Corp. PCL | 5,714,500 | | $ 1,729,343 |
Toyo-Thai Corp. PCL NVDR | 168,000 | | 50,949 |
TOTAL THAILAND | | 2,226,013 |
United Kingdom - 18.2% |
African Barrick Gold Ltd. | 660,600 | | 5,736,835 |
Amerisur Resources PLC (a) | 8,152,624 | | 1,671,659 |
Ashmore Group PLC | 1,196,700 | | 6,639,639 |
ASOS PLC (a) | 38,570 | | 965,160 |
Aurelian Oil & Gas PLC (a) | 5,996,200 | | 1,856,295 |
Avanti Communications Group PLC (a)(e) | 494,400 | | 2,466,779 |
Aveva Group PLC | 203,000 | | 5,161,405 |
Bond International Software PLC | 843,266 | | 596,702 |
Borders & Southern Petroleum PLC (a) | 698,500 | | 544,814 |
Bowleven PLC (a)(e) | 450,100 | | 785,378 |
Brammer PLC | 1,380,200 | | 5,923,658 |
Cadogan Petroleum PLC (a) | 1,723,100 | | 1,177,713 |
Central Asia Metals PLC (a) | 1,538,400 | | 1,682,357 |
Ceres Power Holdings PLC (a) | 233,800 | | 59,220 |
China Goldmines PLC (a) | 669,353 | | 232,514 |
Cove Energy PLC (a) | 2,959,800 | | 4,402,954 |
Craneware PLC | 847,300 | | 7,630,716 |
Faroe Petroleum PLC (a) | 480,947 | | 1,237,534 |
GoIndustry-DoveBid PLC (a) | 117,989 | | 92,977 |
ICAP PLC | 897,900 | | 5,835,215 |
IG Group Holdings PLC | 994,884 | | 7,457,472 |
International Personal Finance PLC | 1,431,100 | | 6,310,699 |
Jazztel PLC (a)(e) | 409,000 | | 2,365,943 |
Johnson Matthey PLC | 187,700 | | 5,671,933 |
Jubilee Platinum PLC (a) | 2,985,047 | | 774,089 |
Keronite PLC (a)(i) | 13,620,267 | | 219 |
London Mining PLC (a) | 1,736,500 | | 8,915,501 |
Michael Page International PLC | 970,400 | | 6,270,480 |
Moneysupermarket.com Group PLC | 3,920,400 | | 6,746,122 |
Monitise PLC (a) | 4,772,600 | | 2,916,612 |
Mothercare PLC | 547,400 | | 1,481,593 |
Nautical Petroleum PLC (a) | 435,207 | | 2,071,704 |
NCC Group Ltd. | 239,415 | | 2,552,730 |
Ocado Group PLC (a)(e) | 1,180,900 | | 1,778,529 |
Pureprofile Media PLC (a)(i) | 1,108,572 | | 713,122 |
Regenersis PLC (a) | 1,425,100 | | 1,781,910 |
Robert Walters PLC | 937,800 | | 3,091,748 |
Common Stocks - continued |
| Shares | | Value |
United Kingdom - continued |
Rockhopper Exploration PLC (a) | 1,154,500 | | $ 3,973,267 |
Royalblue Group PLC | 202,542 | | 5,299,595 |
SDL PLC | 495,062 | | 5,246,686 |
Serco Group PLC | 481,786 | | 4,025,129 |
Silverdell PLC (a) | 6,644,400 | | 1,081,909 |
Sinclair Pharma PLC (a) | 4,408,649 | | 1,807,947 |
Sphere Medical Holding PLC (i) | 568,406 | | 1,553,988 |
Sthree PLC | 1,128,809 | | 5,175,565 |
Synergy Health PLC | 299,653 | | 4,016,653 |
Ted Baker PLC | 486,475 | | 6,033,867 |
TMO Renewables Ltd. (i) | 1,000,000 | | 562,870 |
Travis Perkins PLC | 405,400 | | 5,610,153 |
Valiant Petroleum PLC (a) | 437,400 | | 3,427,446 |
Wolfson Microelectronics PLC (a) | 1,756,400 | | 3,304,832 |
Zenergy Power PLC (a) | 855,520 | | 159,942 |
TOTAL UNITED KINGDOM | | 166,879,779 |
United States of America - 0.7% |
ChinaCast Education Corp. (a)(e) | 70,100 | | 281,802 |
CTC Media, Inc. | 192,200 | | 2,212,222 |
KIT Digital, Inc. (a)(e) | 428,400 | | 3,855,600 |
Mudalla Technology, Inc. (a) | 996,527 | | 16 |
XL TechGroup, Inc. (a) | 1,329,250 | | 21 |
YOU On Demand Holdings, Inc. (a) | 6,523,000 | | 455,958 |
TOTAL UNITED STATES OF AMERICA | | 6,805,619 |
TOTAL COMMON STOCKS (Cost $894,072,982) |
898,856,611
|
Convertible Bonds - 0.1% |
| Principal Amount (d) | | |
France - 0.1% |
Pierre Et Vacances La Defense 4% 10/1/15 (h) | EUR | 1,196,800 | | 1,075,042 |
United Kingdom - 0.0% |
Sphere Medical Holding PLC 8% 12/31/12 (i) | GBP | 101,923 | | 163,913 |
TOTAL CONVERTIBLE BONDS (Cost $1,416,277) |
1,238,955
|
Government Obligations - 0.1% |
| Principal Amount (d) | | Value |
Germany - 0.1% |
German Federal Republic 0.1521% to 0.2372% 11/9/11 to 11/23/11 (g)
(Cost $747,359) | EUR | 550,000 | | $ 760,975 |
Money Market Funds - 4.1% |
| Shares | | |
Fidelity Cash Central Fund, 0.12% (b) | 2,652,401 | | 2,652,401 |
Fidelity Securities Lending Cash Central Fund, 0.11% (b)(c) | 34,344,415 | | 34,344,415 |
TOTAL MONEY MARKET FUNDS (Cost $36,996,816) |
36,996,816
|
TOTAL INVESTMENT PORTFOLIO - 102.5% (Cost $933,233,434) | 937,853,357 |
NET OTHER ASSETS (LIABILITIES) - (2.5)% | (22,869,202) |
NET ASSETS - 100% | $ 914,984,155 |
Futures Contracts |
| Expiration Date | | Underlying Face Amount at Value | | Unrealized Appreciation/
(Depreciation) |
Purchased |
Equity Index Contracts |
86 Eurex EURO STOXX 50 Index Contracts (Germany) | Dec. 2011 | | $ 2,842,088 | | $ (113,279) |
|
The face value of futures purchased as a percentage of net assets is 0.3% |
Currency Abbreviations |
EUR | - | European Monetary Unit |
GBP | - | British pound |
Legend |
(a) Non-income producing |
(b) Affiliated fund that is available only to investment companies and other accounts managed by Fidelity Investments. The rate quoted is the annualized seven-day yield of the fund at period end. A complete unaudited listing of the fund's holdings as of its most recent quarter end is available upon request. In addition, each Fidelity Central Fund's financial statements, which are not covered by the Fund's Report of Independent Registered Public Accounting Firm, are available on the SEC's website or upon request. |
(c) Investment made with cash collateral received from securities on loan. |
(d) Principal amount is stated in United States dollars unless otherwise noted. |
(e) Security or a portion of the security is on loan at period end. |
(f) Affiliated company |
(g) Security or a portion of the security was pledged to cover margin requirements for futures contracts. At the period end, the value of securities pledged amounted to $691,784. |
(h) Principal amount shown represents units. |
(i) Restricted securities - Investment in securities not registered under the Securities Act of 1933 (excluding 144A issues). At the end of the period, the value of restricted securities (excluding 144A issues) amounted to $11,914,245 or 1.3% of net assets. |
Additional information on each restricted holding is as follows: |
Security | Acquisition Date | Acquisition Cost |
AirSea Lines | 8/4/06 | $ 1,199,182 |
Buried Hill Energy (Cyprus) PCL | 8/18/06 | $ 2,141,700 |
Kalahari Energy | 9/1/06 | $ 1,813,750 |
Keronite PLC | 8/16/06 | $ 1,548,992 |
LXB Retail Properties PLC | 5/26/11 | $ 4,661,808 |
Pureprofile Media PLC | 5/3/05 - 1/11/06 | $ 1,173,341 |
Rock Well Petroleum, Inc. | 4/13/06 | $ 1,004,171 |
Sphere Medical Holding PLC | 8/27/08 - 8/22/11 | $ 1,697,579 |
Sphere Medical Holding PLC 8% 12/31/12 | 4/21/11 - 10/24/11 | $ 166,822 |
TMO Renewables Ltd. | 10/27/05 | $ 535,065 |
Affiliated Central Funds |
Information regarding fiscal year to date income earned by the Fund from investments in Fidelity Central Funds is as follows: |
Fund | Income earned |
Fidelity Cash Central Fund | $ 63,355 |
Fidelity Securities Lending Cash Central Fund | 916,949 |
Total | $ 980,304 |
Other Affiliated Issuers |
An affiliated company is a company in which the Fund has ownership of at least 5% of the voting securities. Fiscal year to date transactions with companies which are or were affiliates are as follows: |
Affiliate | Value, beginning of period | Purchases | Sales Proceeds | Dividend Income | Value,
end of
period |
Centurion Electronics PLC | $ 12 | $ - | $ 109 | $ - | $ - |
Pertama Holdings Ltd. | 7,080,399 | 1,144,853 | 223,172 | 1,146,797 | 11,809,703 |
Total | $ 7,080,411 | $ 1,144,853 | $ 223,281 | $ 1,146,797 | $ 11,809,703 |
Other Information |
The following is a summary of the inputs used, as of October 31, 2011, involving the Fund's assets and liabilities carried at fair value. The inputs or methodology used for valuing securities may not be an indication of the risk associated with investing in those securities. For more information on valuation inputs, and their aggregation into the levels used in the tables below, please refer to the Security Valuation section in the accompanying Notes to Financial Statements. |
Valuation Inputs at Reporting Date: |
Description | Total | Level 1 | Level 2 | Level 3 |
Investments in Securities: | | | | |
Equities: | | | | |
Japan | $ 254,701,614 | $ - | $ 254,701,614 | $ - |
United Kingdom | 166,879,779 | 163,817,066 | - | 3,062,713 |
Germany | 73,923,468 | 73,923,468 | - | - |
Australia | 68,994,802 | 6,438,920 | 62,555,882 | - |
France | 45,585,764 | 45,585,764 | - | - |
Ireland | 29,710,630 | 22,368,636 | 7,341,994 | - |
Bermuda | 26,496,189 | 12,913,565 | 13,582,624 | - |
Cayman Islands | 22,599,170 | 8,787,419 | 13,560,634 | 251,117 |
Singapore | 21,216,143 | - | 21,216,143 | - |
Cyprus | 7,384,327 | 2,516,827 | - | 4,867,500 |
United States of America | 6,805,619 | 6,805,582 | - | 37 |
Canada | 6,352,623 | 6,352,589 | - | 34 |
British Virgin Islands | 5,183,277 | 5,183,262 | - | 15 |
Other | 163,023,206 | 128,510,723 | 34,512,483 | - |
Corporate Bonds | 1,238,955 | - | 1,075,042 | 163,913 |
Government Obligations | 760,975 | - | 760,975 | - |
Money Market Funds | 36,996,816 | 36,996,816 | - | - |
Total Investments in Securities: | $ 937,853,357 | $ 520,200,637 | $ 409,307,391 | $ 8,345,329 |
Derivative Instruments: | | | | |
Liabilities | | | | |
Futures Contracts | $ (113,279) | $ (113,279) | $ - | $ - |
Transfers from Level 1 to Level 2 during the period were $210,157,354. |
The following is a reconciliation of Investments in Securities for which Level 3 inputs were used in determining value: |
Investments in Securities: | |
Beginning Balance | $ 8,166,674 |
Total Realized Gain (Loss) | (5,310,046) |
Total Unrealized Gain (Loss) | 5,514,712 |
Cost of Purchases | 202,673 |
Proceeds of Sales | (158,598) |
Amortization/Accretion | - |
Transfers in to Level 3 | 453,769 |
Transfers out of Level 3 | (523,855) |
Ending Balance | $ 8,345,329 |
The change in unrealized gain (loss) for the period attributable to Level 3 securities held at October 31, 2011 | $ 205,883 |
The information used in the above reconciliation represents fiscal year to date activity for any Investments in Securities identified as using Level 3 inputs at either the beginning or the end of the current fiscal period. Transfers in or out of Level 3 represent the beginning value of any Security or Instrument where a change in the pricing level occurred from the beginning to the end of the period. The cost of purchases and the proceeds of sales may include securities received or delivered through corporate actions or exchanges. Realized and unrealized gains (losses) disclosed in the reconciliation are included in Net Gain (Loss) on the Fund's Statement of Operations. |
Value of Derivative Instruments |
The following table is a summary of the Fund's value of derivative instruments by risk exposure as of October 31, 2011. For additional information on derivative instruments, please refer to the Derivative Instruments section in the accompanying Notes to Financial Statements. |
Risk Exposure /
Derivative Type | Value |
| Asset | Liability |
Equity Risk | | |
Futures Contracts (a) | $ - | $ (113,279) |
Total Value of Derivatives | $ - | $ (113,279) |
(a) Reflects cumulative appreciation/(depreciation) on futures contracts as disclosed on the Schedule of Investments. Only the period end variation margin is separately disclosed on the Statement of Assets and Liabilities. |
Income Tax Information |
At October 31, 2011, the Fund had a capital loss carryforward of approximately $65,361,612 all of which will expire in fiscal 2017. Capital loss carryforwards are only available to offset future capital gains of the Fund to the extent provided by regulations and may be limited. |
See accompanying notes which are an integral part of the financial statements.
Annual Report
Statement of Assets and Liabilities
| October 31, 2011 |
| | |
Assets | | |
Investment in securities, at value (including securities loaned of $32,083,640) - See accompanying schedule: Unaffiliated issuers (cost $889,824,332) | $ 889,046,838 | |
Fidelity Central Funds (cost $36,996,816) | 36,996,816 | |
Other affiliated issuers (cost $6,412,286) | 11,809,703 | |
Total Investments (cost $933,233,434) | | $ 937,853,357 |
Foreign currency held at value (cost $685,308) | | 675,490 |
Receivable for investments sold | | 16,030,490 |
Receivable for fund shares sold | | 676,296 |
Dividends receivable | | 3,020,183 |
Interest receivable | | 8,399 |
Distributions receivable from Fidelity Central Funds | | 90,125 |
Prepaid expenses | | 4,727 |
Other receivables | | 47,683 |
Total assets | | 958,406,750 |
| | |
Liabilities | | |
Payable to custodian bank | $ 2,590,473 | |
Payable for investments purchased | 694,635 | |
Payable for fund shares redeemed | 4,600,143 | |
Accrued management fee | 724,220 | |
Distribution and service plan fees payable | 19,270 | |
Payable for daily variation margin on futures contracts | 82,870 | |
Other affiliated payables | 249,776 | |
Other payables and accrued expenses | 116,793 | |
Collateral on securities loaned, at value | 34,344,415 | |
Total liabilities | | 43,422,595 |
| | |
Net Assets | | $ 914,984,155 |
Net Assets consist of: | | |
Paid in capital | | $ 981,093,471 |
Undistributed net investment income | | 8,017,124 |
Accumulated undistributed net realized gain (loss) on investments and foreign currency transactions | | (78,629,647) |
Net unrealized appreciation (depreciation) on investments and assets and liabilities in foreign currencies | | 4,503,207 |
Net Assets | | $ 914,984,155 |
See accompanying notes which are an integral part of the financial statements.
Annual Report
Financial Statements - continued
Statement of Assets and Liabilities - continued
| October 31, 2011 |
| | |
Calculation of Maximum Offering Price Class A:
Net Asset Value and redemption price per share ($17,185,173 ÷ 905,703 shares) | | $ 18.97 |
| | |
Maximum offering price per share (100/94.25 of $18.97) | | $ 20.13 |
Class T:
Net Asset Value and redemption price per share ($13,743,891 ÷ 731,123 shares) | | $ 18.80 |
| | |
Maximum offering price per share (100/96.50 of $18.80) | | $ 19.48 |
Class B:
Net Asset Value and offering price per share ($2,067,349 ÷ 112,497 shares)A | | $ 18.38 |
| | |
Class C:
Net Asset Value and offering price per share ($9,544,545 ÷ 519,249 shares)A | | $ 18.38 |
| | |
International Small Cap:
Net Asset Value, offering price and redemption price per share ($856,691,635 ÷ 44,550,818 shares) | | $ 19.23 |
| | |
Institutional Class:
Net Asset Value, offering price and redemption price per share ($15,751,562 ÷ 818,833 shares) | | $ 19.24 |
A Redemption price per share is equal to net asset value less any applicable contingent deferred sales charge.
See accompanying notes which are an integral part of the financial statements.
Annual Report
Statement of Operations
| Year ended October 31, 2011 |
| | |
Investment Income | | |
Dividends (including $1,146,797 earned from other affiliated issuers) | | $ 21,550,414 |
Interest | | 63,975 |
Income from Fidelity Central Funds | | 980,304 |
Income before foreign taxes withheld | | 22,594,693 |
Less foreign taxes withheld | | (1,429,635) |
Total income | | 21,165,058 |
| | |
Expenses | | |
Management fee
Basic fee | $ 8,945,294 | |
Performance adjustment | 442,233 | |
Transfer agent fees | 2,603,163 | |
Distribution and service plan fees | 287,441 | |
Accounting and security lending fees | 491,914 | |
Custodian fees and expenses | 359,301 | |
Independent trustees' compensation | 5,687 | |
Registration fees | 122,881 | |
Audit | 145,078 | |
Legal | 3,942 | |
Miscellaneous | 9,145 | |
Total expenses before reductions | 13,416,079 | |
Expense reductions | (268,142) | 13,147,937 |
Net investment income (loss) | | 8,017,121 |
Realized and Unrealized Gain (Loss) Net realized gain (loss) on: | | |
Investment securities: | | |
Unaffiliated issuers (net of foreign taxes of $21,350) | 37,978,566 | |
Other affiliated issuers | (210,119) | |
Foreign currency transactions | 4,325 | |
Futures contracts | (2,512,331) | |
Total net realized gain (loss) | | 35,260,441 |
Change in net unrealized appreciation (depreciation) on: Investment securities (net of decrease in deferred foreign taxes of $17,178) | (96,611,078) | |
Assets and liabilities in foreign currencies | (53,087) | |
Futures contracts | (166,462) | |
Total change in net unrealized appreciation (depreciation) | | (96,830,627) |
Net gain (loss) | | (61,570,186) |
Net increase (decrease) in net assets resulting from operations | | $ (53,553,065) |
See accompanying notes which are an integral part of the financial statements.
Annual Report
Financial Statements - continued
Statement of Changes in Net Assets
| Year ended
October 31,
2011 | Year ended
October 31,
2010 |
Increase (Decrease) in Net Assets | | |
Operations | | |
Net investment income (loss) | $ 8,017,121 | $ 2,524,061 |
Net realized gain (loss) | 35,260,441 | 45,718,988 |
Change in net unrealized appreciation (depreciation) | (96,830,627) | 97,376,459 |
Net increase (decrease) in net assets resulting
from operations | (53,553,065) | 145,619,508 |
Distributions to shareholders from net investment income | (2,430,566) | (3,368,409) |
Distributions to shareholders from net realized gain | (28,246,937) | (14,323,742) |
Total distributions | (30,677,503) | (17,692,151) |
Share transactions - net increase (decrease) | 129,451,482 | 26,936,768 |
Redemption fees | 283,575 | 118,859 |
Total increase (decrease) in net assets | 45,504,489 | 154,982,984 |
| | |
Net Assets | | |
Beginning of period | 869,479,666 | 714,496,682 |
End of period (including undistributed net investment income of $8,017,124 and undistributed net investment income of $2,441,101, respectively) | $ 914,984,155 | $ 869,479,666 |
See accompanying notes which are an integral part of the financial statements.
Annual Report
Financial Highlights - Class A
Years ended October 31, | 2011 | 2010 | 2009 | 2008 | 2007 |
Selected Per-Share Data | | | | | |
Net asset value, beginning of period | $ 20.42 | $ 17.28 | $ 11.91 | $ 31.14 | $ 28.79 |
Income from Investment Operations | | | | | |
Net investment income (loss) C | .10 | .03 | .06 | - H | .03 |
Net realized and unrealized gain (loss) | (.88) | 3.51 | 5.31 | (14.03) | 7.97 |
Total from investment operations | (.78) | 3.54 | 5.37 | (14.03) | 8.00 |
Distributions from net investment income | (.02) | (.06) | - | (.03) | - |
Distributions from net realized gain | (.66) | (.34) | - | (5.18) | (5.65) |
Total distributions | (.68) | (.40) | - | (5.20) I | (5.65) |
Redemption fees added to paid in capital C | .01 | - H | - H | - H | - H |
Net asset value, end of period | $ 18.97 | $ 20.42 | $ 17.28 | $ 11.91 | $ 31.14 |
Total Return A,B | (4.00)% | 20.85% | 45.09% | (53.35)% | 33.43% |
Ratios to Average Net Assets D,G | | | | | |
Expenses before reductions | 1.56% | 1.71% | 1.75% | 1.82% | 1.53% |
Expenses net of fee waivers, if any | 1.55% | 1.65% | 1.65% | 1.65% | 1.53% |
Expenses net of all reductions | 1.54% | 1.63% | 1.62% | 1.60% | 1.49% |
Net investment income (loss) | .49% | .16% | .41% | -% F | .10% |
Supplemental Data | | | | | |
Net assets, end of period (000 omitted) | $ 17,185 | $ 19,720 | $ 17,590 | $ 13,561 | $ 38,585 |
Portfolio turnover rate E | 47% | 66% | 81% | 113% | 70% |
A Total returns would have been lower if certain expenses had not been reduced during the applicable periods shown.
B Total returns do not include the effect of the sales charges.
C Calculated based on average shares outstanding during the period.
D Fees and expenses of any underlying Fidelity Central Funds are not included in the Fund's expense ratio. The Fund indirectly bears its proportionate share of the expenses of any underlying Fidelity Central Funds.
E Amount does not include the portfolio activity of any underlying Fidelity Central Funds.
F Amount represents less than .01%.
G Expense ratios reflect operating expenses of the class. Expenses before reductions do not reflect amounts reimbursed by the investment adviser or reductions from brokerage service arrangements or reductions from other expense offset arrangements and do not represent the amount paid by the class during periods when reimbursements or reductions occur. Expenses net of fee waivers reflect expenses after reimbursement by the investment adviser but prior to reductions from brokerage service arrangements or other expense offset arrangements. Expenses net of all reductions represent the net expenses paid by the class.
H Amount represents less than $.01 per share.
I Total distributions of $5.20 per share is comprised of distributions from net investment income of $.026 and distributions from net realized gain of $5.176 per share.
See accompanying notes which are an integral part of the financial statements.
Annual Report
Financial Highlights - Class T
Years ended October 31, | 2011 | 2010 | 2009 | 2008 | 2007 |
Selected Per-Share Data | | | | | |
Net asset value, beginning of period | $ 20.23 | $ 17.14 | $ 11.84 | $ 30.96 | $ 28.64 |
Income from Investment Operations | | | | | |
Net investment income (loss) C | .05 | (.02) | .02 | (.05) | (.04) |
Net realized and unrealized gain (loss) | (.86) | 3.47 | 5.28 | (13.95) | 7.93 |
Total from investment operations | (.81) | 3.45 | 5.30 | (14.00) | 7.89 |
Distributions from net investment income | - | (.02) | - | - | - |
Distributions from net realized gain | (.63) | (.34) | - | (5.12) | (5.57) |
Total distributions | (.63) | (.36) | - | (5.12) | (5.57) |
Redemption fees added to paid in capital C | .01 | - G | - G | - G | - G |
Net asset value, end of period | $ 18.80 | $ 20.23 | $ 17.14 | $ 11.84 | $ 30.96 |
Total Return A,B | (4.18)% | 20.46% | 44.76% | (53.46)% | 33.07% |
Ratios to Average Net Assets D,F | | | | | |
Expenses before reductions | 1.82% | 1.97% | 2.00% | 2.07% | 1.77% |
Expenses net of fee waivers, if any | 1.81% | 1.90% | 1.90% | 1.90% | 1.77% |
Expenses net of all reductions | 1.79% | 1.88% | 1.86% | 1.86% | 1.73% |
Net investment income (loss) | .24% | (.09)% | .16% | (.25)% | (.14)% |
Supplemental Data | | | | | |
Net assets, end of period (000 omitted) | $ 13,744 | $ 16,092 | $ 15,760 | $ 13,493 | $ 40,823 |
Portfolio turnover rate E | 47% | 66% | 81% | 113% | 70% |
A Total returns would have been lower if certain expenses had not been reduced during the applicable periods shown.
B Total returns do not include the effect of the sales charges.
C Calculated based on average shares outstanding during the period.
D Fees and expenses of any underlying Fidelity Central Funds are not included in the Fund's expense ratio. The Fund indirectly bears its proportionate share of the expenses of any underlying Fidelity Central Funds.
E Amount does not include the portfolio activity of any underlying Fidelity Central Funds.
F Expense ratios reflect operating expenses of the class. Expenses before reductions do not reflect amounts reimbursed by the investment adviser or reductions from brokerage service arrangements or reductions from other expense offset arrangements and do not represent the amount paid by the class during periods when reimbursements or reductions occur. Expenses net of fee waivers reflect expenses after reimbursement by the investment adviser but prior to reductions from brokerage service arrangements or other expense offset arrangements. Expenses net of all reductions represent the net expenses paid by the class.
G Amount represents less than $.01 per share.
See accompanying notes which are an integral part of the financial statements.
Annual Report
Financial Highlights - Class B
Years ended October 31, | 2011 | 2010 | 2009 | 2008 | 2007 |
Selected Per-Share Data | | | | | |
Net asset value, beginning of period | $ 19.79 | $ 16.78 | $ 11.65 | $ 30.49 | $ 28.26 |
Income from Investment Operations | | | | | |
Net investment income (loss) C | (.05) | (.10) | (.04) | (.16) | (.18) |
Net realized and unrealized gain (loss) | (.85) | 3.39 | 5.17 | (13.73) | 7.82 |
Total from investment operations | (.90) | 3.29 | 5.13 | (13.89) | 7.64 |
Distributions from net realized gain | (.52) | (.28) | - | (4.95) | (5.41) |
Redemption fees added to paid in capital C | .01 | - G | - G | - G | - G |
Net asset value, end of period | $ 18.38 | $ 19.79 | $ 16.78 | $ 11.65 | $ 30.49 |
Total Return A,B | (4.68)% | 19.90% | 44.03% | (53.68)% | 32.38% |
Ratios to Average Net Assets D,F | | | | | |
Expenses before reductions | 2.32% | 2.47% | 2.49% | 2.58% | 2.30% |
Expenses net of fee waivers, if any | 2.30% | 2.40% | 2.40% | 2.40% | 2.30% |
Expenses net of all reductions | 2.29% | 2.38% | 2.36% | 2.36% | 2.26% |
Net investment income (loss) | (.26)% | (.59)% | (.33)% | (.75)% | (.66)% |
Supplemental Data | | | | | |
Net assets, end of period (000 omitted) | $ 2,067 | $ 3,457 | $ 3,601 | $ 3,230 | $ 10,704 |
Portfolio turnover rate E | 47% | 66% | 81% | 113% | 70% |
A Total returns would have been lower if certain expenses had not been reduced during the applicable periods shown.
B Total returns do not include the effect of the contingent deferred sales charge.
C Calculated based on average shares outstanding during the period.
D Fees and expenses of any underlying Fidelity Central Funds are not included in the Fund's expense ratio. The Fund indirectly bears its proportionate share of the expenses of any underlying Fidelity Central Funds.
E Amount does not include the portfolio activity of any underlying Fidelity Central Funds.
F Expense ratios reflect operating expenses of the class. Expenses before reductions do not reflect amounts reimbursed by the investment adviser or reductions from brokerage service arrangements or reductions from other expense offset arrangements and do not represent the amount paid by the class during periods when reimbursements or reductions occur. Expenses net of fee waivers reflect expenses after reimbursement by the investment adviser but prior to reductions from brokerage service arrangements or other expense offset arrangements. Expenses net of all reductions represent the net expenses paid by the class.
G Amount represents less than $.01 per share.
See accompanying notes which are an integral part of the financial statements.
Annual Report
Financial Highlights - Class C
Years ended October 31, | 2011 | 2010 | 2009 | 2008 | 2007 |
Selected Per-Share Data | | | | | |
Net asset value, beginning of period | $ 19.85 | $ 16.85 | $ 11.70 | $ 30.62 | $ 28.33 |
Income from Investment Operations | | | | | |
Net investment income (loss) C | (.04) | (.10) | (.04) | (.16) | (.17) |
Net realized and unrealized gain (loss) | (.85) | 3.40 | 5.19 | (13.78) | 7.85 |
Total from investment operations | (.89) | 3.30 | 5.15 | (13.94) | 7.68 |
Distributions from net realized gain | (.59) | (.30) | - | (4.98) | (5.39) |
Redemption fees added to paid in capital C | .01 | - G | - G | - G | - G |
Net asset value, end of period | $ 18.38 | $ 19.85 | $ 16.85 | $ 11.70 | $ 30.62 |
Total Return A,B | (4.64)% | 19.86% | 44.02% | (53.67)% | 32.39% |
Ratios to Average Net Assets D,F | | | | | |
Expenses before reductions | 2.27% | 2.42% | 2.49% | 2.57% | 2.26% |
Expenses net of fee waivers, if any | 2.26% | 2.40% | 2.40% | 2.40% | 2.26% |
Expenses net of all reductions | 2.24% | 2.37% | 2.36% | 2.36% | 2.22% |
Net investment income (loss) | (.21)% | (.59)% | (.33)% | (.76)% | (.62)% |
Supplemental Data | | | | | |
Net assets, end of period (000 omitted) | $ 9,545 | $ 13,501 | $ 5,814 | $ 5,658 | $ 20,094 |
Portfolio turnover rate E | 47% | 66% | 81% | 113% | 70% |
A Total returns would have been lower if certain expenses had not been reduced during the applicable periods shown.
B Total returns do not include the effect of the contingent deferred sales charge.
C Calculated based on average shares outstanding during the period.
D Fees and expenses of any underlying Fidelity Central Funds are not included in the Fund's expense ratio. The Fund indirectly bears its proportionate share of the expenses of any underlying Fidelity Central Funds.
E Amount does not include the portfolio activity of any underlying Fidelity Central Funds.
F Expense ratios reflect operating expenses of the class. Expenses before reductions do not reflect amounts reimbursed by the investment adviser or reductions from brokerage service arrangements or reductions from other expense offset arrangements and do not represent the amount paid by the class during periods when reimbursements or reductions occur. Expenses net of fee waivers reflect expenses after reimbursement by the investment adviser but prior to reductions from brokerage service arrangements or other expense offset arrangements. Expenses net of all reductions represent the net expenses paid by the class.
G Amount represents less than $.01 per share.
See accompanying notes which are an integral part of the financial statements.
Annual Report
Financial Highlights - International Small Cap
Years ended October 31, | 2011 | 2010 | 2009 | 2008 | 2007 |
Selected Per-Share Data | | | | | |
Net asset value, beginning of period | $ 20.66 | $ 17.48 | $ 12.03 | $ 31.44 | $ 29.03 |
Income from Investment Operations | | | | | |
Net investment income (loss) B | .17 | .07 | .08 | .03 | .12 |
Net realized and unrealized gain (loss) | (.89) | 3.53 | 5.37 | (14.14) | 8.03 |
Total from investment operations | (.72) | 3.60 | 5.45 | (14.11) | 8.15 |
Distributions from net investment income | (.06) | (.08) | - | (.12) | (.07) |
Distributions from net realized gain | (.66) | (.34) | - | (5.18) | (5.67) |
Total distributions | (.72) | (.42) | - | (5.30) | (5.74) |
Redemption fees added to paid in capital B | .01 | - F | - F | - F | - F |
Net asset value, end of period | $ 19.23 | $ 20.66 | $ 17.48 | $ 12.03 | $ 31.44 |
Total Return A | (3.65)% | 21.02% | 45.30% | (53.25)% | 33.82% |
Ratios to Average Net Assets C,E | | | | | |
Expenses before reductions | 1.26% | 1.44% | 1.48% | 1.49% | 1.19% |
Expenses net of fee waivers, if any | 1.25% | 1.44% | 1.48% | 1.49% | 1.19% |
Expenses net of all reductions | 1.23% | 1.42% | 1.44% | 1.44% | 1.15% |
Net investment income (loss) | .80% | .37% | .58% | .16% | .45% |
Supplemental Data | | | | | |
Net assets, end of period (000 omitted) | $ 856,692 | $ 808,478 | $ 669,035 | $ 536,291 | $ 1,663,761 |
Portfolio turnover rate D | 47% | 66% | 81% | 113% | 70% |
A Total returns would have been lower if certain expenses had not been reduced during the applicable periods shown.
B Calculated based on average shares outstanding during the period.
C Fees and expenses of any underlying Fidelity Central Funds are not included in the Fund's expense ratio. The Fund indirectly bears its proportionate share of the expenses of any underlying Fidelity Central Funds.
D Amount does not include the portfolio activity of any underlying Fidelity Central Funds.
E Expense ratios reflect operating expenses of the class. Expenses before reductions do not reflect amounts reimbursed by the investment adviser or reductions from brokerage service arrangements or reductions from other expense offset arrangements and do not represent the amount paid by the class during periods when reimbursements or reductions occur. Expenses net of fee waivers reflect expenses after reimbursement by the investment adviser but prior to reductions from brokerage service arrangements or other expense offset arrangements. Expenses net of all reductions represent the net expenses paid by the class.
F Amount represents less than $.01 per share.
See accompanying notes which are an integral part of the financial statements.
Annual Report
Financial Highlights - Institutional Class
Years ended October 31, | 2011 | 2010 | 2009 | 2008 | 2007 |
Selected Per-Share Data | | | | | |
Net asset value, beginning of period | $ 20.66 | $ 17.47 | $ 12.01 | $ 31.38 | $ 28.99 |
Income from Investment Operations | | | | | |
Net investment income (loss) B | .18 | .09 | .09 | .05 | .12 |
Net realized and unrealized gain (loss) | (.89) | 3.53 | 5.37 | (14.12) | 8.02 |
Total from investment operations | (.71) | 3.62 | 5.46 | (14.07) | 8.14 |
Distributions from net investment income | (.06) | (.09) | - | (.12) | (.07) |
Distributions from net realized gain | (.66) | (.34) | - | (5.18) | (5.68) |
Total distributions | (.72) | (.43) | - | (5.30) | (5.75) |
Redemption fees added to paid in capital B | .01 | - F | - F | - F | - F |
Net asset value, end of period | $ 19.24 | $ 20.66 | $ 17.47 | $ 12.01 | $ 31.38 |
Total Return A | (3.62)% | 21.15% | 45.46% | (53.22)% | 33.84% |
Ratios to Average Net Assets C,E | | | | | |
Expenses before reductions | 1.22% | 1.34% | 1.45% | 1.49% | 1.18% |
Expenses net of fee waivers, if any | 1.21% | 1.34% | 1.40% | 1.40% | 1.18% |
Expenses net of all reductions | 1.19% | 1.31% | 1.37% | 1.35% | 1.14% |
Net investment income (loss) | .84% | .47% | .66% | .25% | .45% |
Supplemental Data | | | | | |
Net assets, end of period (000 omitted) | $ 15,752 | $ 8,231 | $ 2,696 | $ 2,217 | $ 7,774 |
Portfolio turnover rate D | 47% | 66% | 81% | 113% | 70% |
A Total returns would have been lower if certain expenses had not been reduced during the applicable periods shown.
B Calculated based on average shares outstanding during the period.
C Fees and expenses of any underlying Fidelity Central Funds are not included in the Fund's expense ratio. The Fund indirectly bears its proportionate share of the expenses of any underlying Fidelity Central Funds.
D Amount does not include the portfolio activity of any underlying Fidelity Central Funds.
E Expense ratios reflect operating expenses of the class. Expenses before reductions do not reflect amounts reimbursed by the investment adviser or reductions from brokerage service arrangements or reductions from other expense offset arrangements and do not represent the amount paid by the class during periods when reimbursements or reductions occur. Expenses net of fee waivers reflect expenses after reimbursement by the investment adviser but prior to reductions from brokerage service arrangements or other expense offset arrangements. Expenses net of all reductions represent the net expenses paid by the class.
F Amount represents less than $.01 per share.
See accompanying notes which are an integral part of the financial statements.
Annual Report
Notes to Financial Statements
For the period ended October 31, 2011
1. Organization.
Fidelity International Small Cap Fund (the Fund) is a fund of Fidelity Investment Trust (the Trust) and is authorized to issue an unlimited number of shares. The Trust is registered under the Investment Company Act of 1940, as amended (the 1940 Act), as an open-end management investment company organized as a Massachusetts business trust. The Fund offers Class A, Class T, Class C, International Small Cap and Institutional Class shares each of which, along with Class B shares, has equal rights as to assets and voting privileges. Effective after the close of business on September 1, 2010, Class B shares were closed to new accounts and additional purchases, except for exchanges and reinvestments by existing shareholders. Each class has exclusive voting rights with respect to matters that affect that class. Class B shares will automatically convert to Class A shares after a holding period of seven years from the initial date of purchase. Investment income, realized and unrealized capital gains and losses, the common expenses of the Fund, and certain fund-level expense reductions, if any, are allocated on a pro-rata basis to each class based on the relative net assets of each class to the total net assets of the Fund. Each class differs with respect to transfer agent and distribution and service plan fees incurred. Certain expense reductions may also differ by class. The Fund's investments in emerging markets can be subject to social, economic, regulatory and political uncertainties and can be extremely volatile.
2. Investments in Fidelity Central Funds.
The Fund invests in Fidelity Central Funds, which are open-end investment companies available only to other investment companies and accounts managed by Fidelity Management & Research Company (FMR) and its affiliates. The Fund's Schedule of Investments lists each of the Fidelity Central Funds held as of period end, if any, as an investment of the Fund, but does not include the underlying holdings of each Fidelity Central Fund. As an Investing Fund, the Fund indirectly bears its proportionate share of the expenses of the underlying Fidelity Central Funds.
The Money Market Central Funds seek preservation of capital and current income and are managed by Fidelity Investments Money Management, Inc. (FIMM), an affiliate of FMR.
A complete unaudited list of holdings for each Fidelity Central Fund is available upon request or at the Securities and Exchange Commission (the SEC) web site at www.sec.gov. In addition, the financial statements of the Fidelity Central Funds, which are not covered by the Fund's Report of Independent Registered Public Accounting Firm, are available on the SEC web site or upon request.
Annual Report
Notes to Financial Statements - continued
3. Significant Accounting Policies.
The financial statements have been prepared in conformity with accounting principles generally accepted in the United States of America (GAAP), which require management to make certain estimates and assumptions at the date of the financial statements. Actual results could differ from those estimates. Subsequent events, if any, through the date that the financial statements were issued have been evaluated in the preparation of the financial statements. The following summarizes the significant accounting policies of the Fund:
Security Valuation. Investments are valued as of 4:00 p.m. Eastern time on the last calendar day of the period. The Fund uses independent pricing services approved by the Board of Trustees to value its investments. When current market prices or quotations are not readily available or reliable, valuations may be determined in good faith in accordance with procedures adopted by the Board of Trustees. Factors used in determining value may include market or security specific events, changes in interest rates and credit quality. The frequency with which these procedures are used cannot be predicted and they may be utilized to a significant extent. The value used for net asset value (NAV) calculation under these procedures may differ from published prices for the same securities.
The Fund categorizes the inputs to valuation techniques used to value its investments into a disclosure hierarchy consisting of three levels as shown below:
Level 1 - quoted prices in active markets for identical investments
Level 2 - other significant observable inputs (including quoted prices for similar investments, interest rates, prepayment speeds, etc.)
Level 3 - unobservable inputs (including the Fund's own assumptions based on the best information available)
Changes in valuation techniques may result in transfers in or out of an assigned level within the disclosure hierarchy. The aggregate value of investments by input level, as of October 31, 2011, as well as a roll forward of Level 3 securities, is included at the end of the Fund's Schedule of Investments. Valuation techniques used to value the Fund's investments by major category are as follows:
Equity securities, including restricted securities, for which market quotations are readily available, are valued at the last reported sale price or official closing price as reported by an independent pricing service on the primary market or exchange on which they are traded and are categorized as Level 1 in the hierarchy. In the event there were no sales during the day or closing prices are not available, securities are valued at the last quoted bid price or may be valued using the last available price and are generally categorized as
Annual Report
3. Significant Accounting Policies - continued
Security Valuation - continued
Level 2 in the hierarchy. For foreign equity securities, when significant market or security specific events arise, comparisons to the valuation of American Depositary Receipts (ADRs) futures contracts, Exchange-traded funds (ETFs) and certain indexes as well as quoted prices for similar securities are used and are categorized as Level 2 in the hierarchy in these circumstances. Utilizing these techniques may result in transfers between Level 1 and Level 2. For restricted equity securities and private placements where observable inputs are limited, assumptions about market activity and risk are used and are categorized as Level 3 in the hierarchy.
Debt securities, including restricted securities, are valued based on evaluated prices received from independent pricing services or from dealers who make markets in such securities. For corporate bonds and foreign government and government agency obligations, pricing services utilize matrix pricing which considers yield or price of bonds of comparable quality, coupon, maturity and type as well as dealer supplied prices and are generally categorized as Level 2 in the hierarchy. When independent prices are unavailable or unreliable, debt securities may be valued utilizing pricing matrices which consider similar factors that would be used by independent pricing services. These are generally categorized as Level 2 in the hierarchy but may be Level 3 depending on the circumstances.
Futures contracts are valued at the settlement price established each day by the board of trade or exchange on which they are traded and are categorized as Level 1 in the hierarchy. Investments in open-end mutual funds, including the Fidelity Central Funds, are valued at their closing net asset value each business day and are categorized as Level 1 in the hierarchy.
Foreign Currency. The Fund may use foreign currency contracts to facilitate transactions in foreign-denominated securities. Gains and losses from these transactions may arise from changes in the value of the foreign currency or if the counterparties do not perform under the contracts' terms.
Foreign-denominated assets, including investment securities, and liabilities are translated into U.S. dollars at the exchange rate at period end. Purchases and sales of investment securities, income and dividends received and expenses denominated in foreign currencies are translated into U.S. dollars at the exchange rate in effect on the transaction date.
The effects of exchange rate fluctuations on investments are included with the net realized and unrealized gain (loss) on investment securities. Other foreign currency transactions resulting in realized and unrealized gain (loss) are disclosed separately.
Annual Report
Notes to Financial Statements - continued
3. Significant Accounting Policies - continued
Investment Transactions and Income. For financial reporting purposes, the Fund's investment holdings and NAV include trades executed through the end of the last business day of the period. The NAV per share for processing shareholder transactions is calculated as of the close of business of the New York Stock Exchange (NYSE), normally 4:00 p.m. Eastern time and includes trades executed through the end of the prior business day. Gains and losses on securities sold are determined on the basis of identified cost. Dividend income is recorded on the ex-dividend date, except for certain dividends from foreign securities where the ex-dividend date may have passed, which are recorded as soon as the Fund is informed of the ex-dividend date. Non-cash dividends included in dividend income, if any, are recorded at the fair market value of the securities received. Distributions received on securities that represent a return of capital or capital gain are recorded as a reduction of cost of investments and/or as a realized gain. The Fund estimates the components of distributions received that may be considered return of capital distributions or capital gain distributions. Interest income and distributions from the Fidelity Central Funds are accrued as earned. Interest income includes coupon interest and amortization of premium and accretion of discount on debt securities. Investment income is recorded net of foreign taxes withheld where recovery of such taxes is uncertain.
Expenses. Expenses directly attributable to a fund are charged to that fund. Expenses attributable to more than one fund are allocated among the respective funds on the basis of relative net assets or other appropriate methods. Expense estimates are accrued in the period to which they relate and adjustments are made when actual amounts are known.
Income Tax Information and Distributions to Shareholders. Each year, the Fund intends to qualify as a regulated investment company, including distributing substantially all of its taxable income and realized gains under Subchapter M of the Internal Revenue Code and filing its U.S. federal tax return. As a result, no provision for income taxes is required. As of October 31, 2011, the Fund did not have any unrecognized tax benefits in the financial statements. A fund's federal tax return is subject to examination by the Internal Revenue Service (IRS) for a period of three years. Foreign taxes are provided for based on the Fund's understanding of the tax rules and rates that exist in the foreign markets in which it invests.
Distributions are declared and recorded on the ex-dividend date. Income dividends and capital gain distributions are declared separately for each class. Income and capital gain distributions are determined in accordance with income tax regulations, which may differ from GAAP.
Capital accounts within the financial statements are adjusted for permanent book-tax differences. These adjustments have no impact on net assets or the results of operations. Temporary book-tax differences will reverse in a subsequent period.
Annual Report
3. Significant Accounting Policies - continued
Income Tax Information and Distributions to Shareholders - continued
Book-tax differences are primarily due to futures transactions, foreign currency transactions, certain foreign taxes, passive foreign investment companies (PFIC), market discount, capital loss carryforwards and losses deferred due to wash sales.
The federal tax cost of investment securities and unrealized appreciation (depreciation) as of period end were as follows:
Gross unrealized appreciation | $ 149,880,839 |
Gross unrealized depreciation | (171,005,789) |
Net unrealized appreciation (depreciation) on securities and other investments | $ (21,124,950) |
| |
Tax Cost | $ 958,978,307 |
The tax-based components of distributable earnings as of period end were as follows:
Undistributed ordinary income | $ 20,493,962 |
Capital loss carryforward | $ (65,361,612) |
Net unrealized appreciation (depreciation) | $ (21,244,105) |
Under the recently enacted Regulated Investment Company Modernization Act of 2010 (the Act), the Fund will be permitted to carry forward capital losses incurred in taxable years beginning after December 22, 2010 for an unlimited period. However, any losses incurred during those future taxable years will be required to be utilized prior to any losses incurred in pre-enactment taxable years, which generally expire after eight years from when they are incurred. Additionally, post-enactment capital losses that are carried forward will retain their character as either short-term or long-term capital losses rather than being considered all short-term as under previous law. The Fund's first fiscal year end subject to the Act will be October 31, 2012.
The tax character of distributions paid was as follows:
| October 31, 2011 | October 31, 2010 |
Ordinary Income | $ 30,677,503 | $ 17,692,151 |
Short-Term Trading (Redemption) Fees. Shares held by investors in the Fund less than 90 days are subject to a redemption fee equal to 2.00% of the net asset value of shares redeemed. All redemption fees, which reduce the proceeds of the shareholder redemption, are retained by the Fund and accounted for as an addition to paid in capital.
Annual Report
Notes to Financial Statements - continued
3. Significant Accounting Policies - continued
New Accounting Pronouncement. In May 2011, the Financial Accounting Standards Board issued Accounting Standard Update No. 2011-04, Fair Value Measurement (Topic 820) - Amendments to Achieve Common Fair Value Measurement and Disclosure Requirements in U.S. GAAP and IFRSs. The update changes the wording used to describe the requirements in GAAP for measuring fair value and for disclosing information about fair value measurements. The update is effective during interim and annual periods beginning after December 15, 2011. Management is currently evaluating the impact of the update's adoption on the Funds' financial statement disclosures.
4. Operating Policies.
Restricted Securities. The Fund may invest in securities that are subject to legal or contractual restrictions on resale. These securities generally may be resold in transactions exempt from registration or to the public if the securities are registered. Disposal of these securities may involve time-consuming negotiations and expense, and prompt sale at an acceptable price may be difficult. Information regarding restricted securities is included at the end of the Fund's Schedule of Investments.
5. Derivative Instruments.
Risk Exposures and the Use of Derivative Instruments. The Fund used derivative instruments (derivatives), including futures contracts, in order to meet its investment objectives. The strategy is to use derivatives to increase returns and to manage exposure to certain risks as defined below. The success of any strategy involving derivatives depends on analysis of numerous economic factors, and if the strategies for investment do not work as intended, the Fund may not achieve its objectives.
The Fund's use of derivatives increased or decreased its exposure to the following risk:
Equity Risk | Equity risk relates to the fluctuations in the value of financial instruments as a result of changes in market prices (other than those arising from interest rate risk or foreign exchange risk), whether caused by factors specific to an individual investment, its issuer, or all factors affecting all instruments traded in a market or market segment |
The Fund is also exposed to additional risks from investing in derivatives, such as liquidity risk and counterparty credit risk. Liquidity risk is the risk that the Fund will be unable to sell the derivative in the open market in a timely manner. Counterparty credit risk is the risk that the counterparty will not be able to fulfill its obligation to the Fund. The Fund's maximum risk of loss from counterparty credit risk is generally the aggregate unrealized appreciation and unpaid counterparty payments in excess of any collateral pledged by the counterparty to the Fund. Counterparty risk related to exchange-traded futures contracts is minimal because of the protection provided by the exchange on which they trade. Derivatives involve, to varying degrees, risk of loss in excess of the amounts recognized in the Statement of Assets and Liabilities.
Annual Report
5. Derivative Instruments - continued
Futures Contracts. A futures contract is an agreement between two parties to buy or sell a specified underlying instrument for a fixed price at a specified future date. The Fund used futures contracts to manage its exposure to the stock market.
Upon entering into a futures contract, a fund is required to deposit either cash or securities (initial margin) with a clearing broker in an amount equal to a certain percentage of the face value of the contract. Futures contracts are marked-to-market daily and subsequent payments (variation margin) are made or received by a fund depending on the daily fluctuations in the value of the futures contracts and are recorded as unrealized appreciation or (depreciation). This receivable and/or payable is included in daily variation margin on futures contracts in the Statement of Assets and Liabilities. Realized gain or (loss) is recorded upon the expiration or closing of a futures contract.
The underlying face amount at value of open futures contracts at period end, is shown in the Schedule of Investments under the caption "Futures Contracts." This amount reflects each contract's exposure to the underlying instrument at period end and is representative of activity for the period. Securities deposited to meet initial margin requirements are identified in the Schedule of Investments.
Certain risks arise upon entering into futures contracts, including the risk that an illiquid market limits the ability to close out a futures contract prior to settlement date.
During the period, the Fund recognized net realized gain (loss) of $(2,512,331) and a change in net unrealized appreciation (depreciation) of $(166,462) related to its investment in futures contracts. These amounts are included in the Statement of Operations.
6. Purchases and Sales of Investments.
Purchases and sales of securities, other than short-term securities, aggregated $610,178,106 and $471,939,072, respectively.
7. Fees and Other Transactions with Affiliates.
Management Fee. FMR and its affiliates provide the Fund with investment management related services for which the Fund pays a monthly management fee. The management fee is the sum of an individual fund fee rate that is based on an annual rate of .60% of the Fund's average net assets and a group fee rate that averaged .26% during the period. The group fee rate is based upon the average net assets of all the mutual funds advised by FMR. The group fee rate decreases as assets under management increase and increases as assets under management decrease. In addition, the management fee is subject to a performance adjustment (up to a maximum of ± .20% of the Fund's average net assets over a 36 month performance period). The upward or downward adjustment to the management fee is based on the relative investment performance of International
Annual Report
Notes to Financial Statements - continued
7. Fees and Other Transactions with Affiliates - continued
Management Fee - continued
Small Cap as compared to an appropriate benchmark index. For the period, the total annual management fee rate, including the performance adjustment, was .90% of the Fund's average net assets.
Distribution and Service Plan Fees. In accordance with Rule 12b-1 of the 1940 Act, the Fund has adopted separate Distribution and Service Plans for each class of shares. Certain classes pay Fidelity Distributors Corporation (FDC), an affiliate of FMR, separate Distribution and Service Fees, each of which is based on an annual percentage of each class' average net assets. In addition, FDC may pay financial intermediaries for selling shares of the Fund and providing shareholder support services. For the period, the Distribution and Service Fee rates, total fees and amounts retained by FDC were as follows:
| Distribution
Fee | Service
Fee | Total
Fees | Retained
by FDC |
Class A | -% | .25% | $ 51,630 | $ 463 |
Class T | .25% | .25% | 80,842 | 106 |
Class B | .75% | .25% | 28,921 | 21,741 |
Class C | .75% | .25% | 126,048 | 9,890 |
| | | $ 287,441 | $ 32,200 |
Sales Load. FDC may receive a front-end sales charge of up to 5.75% for selling Class A shares and 3.50% for selling Class T shares, some of which is paid to financial intermediaries for selling shares of the Fund. Depending on the holding period, FDC may receive contingent deferred sales charges levied on Class A, Class T, Class B, and Class C redemptions. The deferred sales charges range from 5% to 1% for Class B, 1% for Class C, 1.00% for certain purchases of Class A shares and .25% for certain purchases of Class T shares.
For the period, sales charge amounts retained by FDC were as follows:
| Retained
by FDC |
Class A | $ 8,134 |
Class T | 1,971 |
Class B* | 3,356 |
Class C* | 712 |
| $ 14,173 |
* When Class B and Class C shares are initially sold, FDC pays commissions from its own resources to financial intermediaries through which the sales are made.
Annual Report
7. Fees and Other Transactions with Affiliates - continued
Transfer Agent Fees. Fidelity Investments Institutional Operations Company, Inc. (FIIOC), an affiliate of FMR, is the transfer, dividend disbursing and shareholder servicing agent for each class of the Fund. FIIOC receives account fees and asset-based fees that vary according to the account size and type of account of the shareholders of the respective classes of the Fund. FIIOC pays for typesetting, printing and mailing of shareholder reports, except proxy statements. For the period, transfer agent fees for each class were as follows:
| Amount | % of
Average
Net Assets |
Class A | $ 62,531 | .30 |
Class T | 49,403 | .31 |
Class B | 8,779 | .30 |
Class C | 32,009 | .25 |
International Small Cap | 2,420,969 | .25 |
Institutional Class | 29,472 | .21 |
| $ 2,603,163 | |
Accounting and Security Lending Fees. Fidelity Service Company, Inc. (FSC), an affiliate of FMR, maintains the Fund's accounting records. The accounting fee is based on the level of average net assets for the month. Under a separate contract, FSC administers the security lending program. The security lending fee is based on the number and duration of lending transactions.
Brokerage Commissions. The Fund placed a portion of its portfolio transactions with brokerage firms which are affiliates of the investment adviser. The commissions paid to these affiliated firms were $215 for the period.
8. Committed Line of Credit.
The Fund participates with other funds managed by FMR or an affiliate in a $4.0 billion credit facility (the "line of credit") to be utilized for temporary or emergency purposes to fund shareholder redemptions or for other short-term liquidity purposes. The Fund has agreed to pay commitment fees on its pro-rata portion of the line of credit, which amounted to $3,143 and is reflected in Miscellaneous expenses on the Statement of Operations. During the period, there were no borrowings on this line of credit.
Annual Report
Notes to Financial Statements - continued
9. Security Lending.
The Fund lends portfolio securities through a lending agent from time to time in order to earn additional income. For equity securities, a lending agent is used and may loan securities to certain qualified borrowers, including Fidelity Capital Markets (FCM), a broker-dealer affiliated with the Fund. On the settlement date of the loan, the Fund receives collateral (in the form of U.S. Treasury obligations, letters of credit and/or cash) against the loaned securities and maintains collateral in an amount not less than 100% of the market value of the loaned securities during the period of the loan. The market value of the loaned securities is determined at the close of business of the Fund and any additional required collateral is delivered to the Fund on the next business day. If the borrower defaults on its obligation to return the securities loaned because of insolvency or other reasons, a fund could experience delays and costs in recovering the securities loaned or in gaining access to the collateral. Any cash collateral received is invested in the Fidelity Securities Lending Cash Central Fund. The value of loaned securities and cash collateral at period end are disclosed on the Fund's Statement of Assets and Liabilities. The value of securities loaned to FCM at period end was $432,000. Security lending income represents the income earned on investing cash collateral, less rebates paid to borrowers and any lending agent fees associated with the loan, plus any premium payments received for lending certain types of securities. Security lending income is presented in the Statement of Operations as a component of income from Fidelity Central Funds. Total security lending income during the period amounted to $916,949, including $2,558 from securities loaned to FCM.
10. Expense Reductions.
FMR voluntarily agreed to reimburse a portion of its management fee. For the period, the amount of this reimbursement was $108,473.
Many of the brokers with whom FMR places trades on behalf of the Fund provided services to the Fund in addition to trade execution. These services included payments of certain expenses on behalf of the Fund totaling $159,669 for the period.
11. Distributions to Shareholders.
Distributions to shareholders of each class were as follows:
Years ended October 31, | 2011 | 2010 |
From net investment income | | |
Class A | $ 15,709 | $ 59,453 |
Class T | - | 16,412 |
International Small Cap | 2,403,692 | 3,278,578 |
Institutional Class | 11,165 | 13,966 |
Total | $ 2,430,566 | $ 3,368,409 |
Annual Report
11. Distributions to Shareholders - continued
Years ended October 31, | 2011 | 2010 |
From net realized gain | | |
Class A | $ 648,961 | $ 354,632 |
Class T | 496,268 | 310,013 |
Class B | 87,007 | 60,241 |
Class C | 402,241 | 116,929 |
International Small Cap | 26,480,677 | 13,430,315 |
Institutional Class | 131,783 | 51,612 |
Total | $ 28,246,937 | $ 14,323,742 |
12. Share Transactions.
Transactions for each class of shares were as follows:
| Shares | Dollars |
Years ended October 31, | 2011 | 2010 | 2011 | 2010 |
Class A | | | | |
Shares sold | 472,219 | 380,659 | $ 10,051,889 | $ 6,723,746 |
Reinvestment of distributions | 30,361 | 22,435 | 616,326 | 393,061 |
Shares redeemed | (562,759) | (454,943) | (11,902,630) | (8,359,905) |
Net increase (decrease) | (60,179) | (51,849) | $ (1,234,415) | $ (1,243,098) |
Class T | | | | |
Shares sold | 237,757 | 143,286 | $ 5,055,416 | $ 2,532,790 |
Reinvestment of distributions | 24,155 | 18,371 | 486,714 | 319,658 |
Shares redeemed | (326,059) | (286,001) | (6,629,520) | (4,986,007) |
Net increase (decrease) | (64,147) | (124,344) | $ (1,087,390) | $ (2,133,559) |
Class B | | | | |
Shares sold | 21,873 | 14,694 | $ 464,854 | $ 256,700 |
Reinvestment of distributions | 4,142 | 3,302 | 81,975 | 56,465 |
Shares redeemed | (88,228) | (57,958) | (1,778,852) | (990,211) |
Net increase (decrease) | (62,213) | (39,962) | $ (1,232,023) | $ (677,046) |
Class C | | | | |
Shares sold | 128,685 | 430,838 | $ 2,661,361 | $ 7,671,593 |
Reinvestment of distributions | 19,105 | 6,001 | 378,079 | 102,910 |
Shares redeemed | (308,659) | (101,847) | (6,253,765) | (1,759,170) |
Net increase (decrease) | (160,869) | 334,992 | $ (3,214,325) | $ 6,015,333 |
International Small Cap | | | | |
Shares sold | 17,502,789 | 10,330,000 | $ 375,309,666 | $ 188,548,758 |
Reinvestment of distributions | 1,321,812 | 888,440 | 27,110,370 | 15,725,385 |
Shares redeemed | (13,398,001) | (10,371,667) | (275,580,654) | (183,663,034) |
Net increase (decrease) | 5,426,600 | 846,773 | $ 126,839,382 | $ 20,611,109 |
Institutional Class | | | | |
Shares sold | 798,910 | 288,839 | $ 17,190,303 | $ 5,178,797 |
Reinvestment of distributions | 5,609 | 2,890 | 115,044 | 51,087 |
Shares redeemed | (384,085) | (47,677) | (7,925,094) | (865,855) |
Net increase (decrease) | 420,434 | 244,052 | $ 9,380,253 | $ 4,364,029 |
Annual Report
Notes to Financial Statements - continued
13. Other.
The Fund's organizational documents provide former and current trustees and officers with a limited indemnification against liabilities arising in connection with the performance of their duties to the Fund. In the normal course of business, the Fund may also enter into contracts that provide general indemnifications. The Fund's maximum exposure under these arrangements is unknown as this would be dependent on future claims that may be made against the Fund. The risk of material loss from such claims is considered remote.
At the end of the period, FMR or its affiliates were the owners of record of 13% of the total outstanding shares of the Fund.
Annual Report
To the Trustees of Fidelity Investment Trust and Shareholders of Fidelity International Small Cap Fund:
We have audited the accompanying statement of assets and liabilities of Fidelity International Small Cap Fund (the Fund), a fund of Fidelity Investment Trust, including the schedule of investments, as of October 31, 2011, and the related statement of operations for the year then ended, the statement of changes in net assets for each of the two years in the period then ended, and the financial highlights for each of the five years in the period then ended. These financial statements and financial highlights are the responsibility of the Fund's management. Our responsibility is to express an opinion on these financial statements and financial highlights based on our audits.
We conducted our audits in accordance with the standards of the Public Company Accounting Oversight Board (United States). Those standards require that we plan and perform the audit to obtain reasonable assurance about whether the financial statements and financial highlights are free of material misstatement. The Fund is not required to have, nor were we engaged to perform, an audit of its internal control over financial reporting. Our audits included consideration of internal control over financial reporting as a basis for designing audit procedures that are appropriate in the circumstances, but not for the purpose of expressing an opinion on the effectiveness of the Fund's internal control over financial reporting. Accordingly, we express no such opinion. An audit also includes examining, on a test basis, evidence supporting the amounts and disclosures in the financial statements, assessing the accounting principles used and significant estimates made by management, as well as evaluating the overall financial statement presentation. Our procedures included confirmation of securities owned as of October 31, 2011, by correspondence with the custodians and brokers; where replies were not received from brokers, we performed other auditing procedures. We believe that our audits provide a reasonable basis for our opinion.
In our opinion, the financial statements and financial highlights referred to above present fairly, in all material respects, the financial position of Fidelity International Small Cap Fund as of October 31, 2011, the results of its operations for the year then ended, the changes in the net assets for each of the two years in the period then ended, and the financial highlights for each of the five years in the period then ended, in conformity with accounting principles generally accepted in the United States of America.
DELOITTE & TOUCHE LLP
Boston, Massachusetts
December 12, 2011
Annual Report
The Trustees, Members of the Advisory Board, and executive officers of the trust and fund, as applicable, are listed below. The Board of Trustees governs the fund and is responsible for protecting the interests of shareholders. The Trustees are experienced executives who meet periodically throughout the year to oversee the fund's activities, review contractual arrangements with companies that provide services to the fund, oversee management of the risks associated with such activities and contractual arrangements, and review the fund's performance. Except for James C. Curvey, each of the Trustees oversees 226 funds advised by FMR or an affiliate. Mr. Curvey oversees 429 funds advised by FMR or an affiliate.
The Trustees hold office without limit in time except that (a) any Trustee may resign; (b) any Trustee may be removed by written instrument, signed by at least two-thirds of the number of Trustees prior to such removal; (c) any Trustee who requests to be retired or who has become incapacitated by illness or injury may be retired by written instrument signed by a majority of the other Trustees; and (d) any Trustee may be removed at any special meeting of shareholders by a two-thirds vote of the outstanding voting securities of the trust. Each Trustee who is not an interested person (as defined in the 1940 Act) (Independent Trustee), shall retire not later than the last day of the calendar year in which his or her 75th birthday occurs. The Independent Trustees may waive this mandatory retirement age policy with respect to individual Trustees. The executive officers and Advisory Board Members hold office without limit in time, except that any officer and Advisory Board Member may resign or may be removed by a vote of a majority of the Trustees at any regular meeting or any special meeting of the Trustees. Except as indicated, each individual has held the office shown or other offices in the same company for the past five years.
Experience, Skills, Attributes, and Qualifications of the Fund's Trustees. The Governance and Nominating Committee has adopted a statement of policy that describes the experience, qualifications, attributes, and skills that are necessary and desirable for potential Independent Trustee candidates (Statement of Policy). The Board believes that each Trustee satisfied at the time he or she was initially elected or appointed a Trustee, and continues to satisfy, the standards contemplated by the Statement of Policy. The Governance and Nominating Committee also engages professional search firms to help identify potential Independent Trustee candidates who have the experience, qualifications, attributes, and skills consistent with the Statement of Policy. From time to time, additional criteria based on the composition and skills of the current Independent Trustees, as well as experience or skills that may be appropriate in light of future changes to board composition, business conditions, and regulatory or other developments, have also been considered by the professional search firms and the Governance and Nominating Committee. In addition, the Board takes into account the Trustees' commitment and participation in Board and committee meetings, as well as their leadership of standing and ad hoc committees throughout their tenure.
In determining that a particular Trustee was and continues to be qualified to serve as a Trustee, the Board has considered a variety of criteria, none of which, in isolation, was controlling. The Board believes that, collectively, the Trustees have balanced and diverse experience, qualifications, attributes, and skills, which allow the Board to operate effectively in governing the fund and protecting the interests of shareholders. Information about the specific experience, skills, attributes, and qualifications of each Trustee, which in each case led to the Board's conclusion that the Trustee should serve (or continue to serve) as a trustee of the fund, is provided below.
Annual Report
Board Structure and Oversight Function. James C. Curvey is an interested person (as defined in the 1940 Act) and currently serves as Acting Chairman. The Trustees have determined that an interested Chairman is appropriate and benefits shareholders because an interested Chairman has a personal and professional stake in the quality and continuity of services provided to the fund. Independent Trustees exercise their informed business judgment to appoint an individual of their choosing to serve as Chairman, regardless of whether the Trustee happens to be independent or a member of management. The Independent Trustees have determined that they can act independently and effectively without having an Independent Trustee serve as Chairman and that a key structural component for assuring that they are in a position to do so is for the Independent Trustees to constitute a substantial majority for the Board. The Independent Trustees also regularly meet in executive session. Ned C. Lautenbach serves as Chairman of the Independent Trustees and as such (i) acts as a liaison between the Independent Trustees and management with respect to matters important to the Independent Trustees and (ii) with management prepares agendas for Board meetings.
Fidelity funds are overseen by different Boards of Trustees. The fund's Board oversees Fidelity's equity and high income funds and another Board oversees Fidelity's investment-grade bond, money market, and asset allocation funds. The asset allocation funds may invest in Fidelity funds overseen by the fund's Board. The use of separate Boards, each with its own committee structure, allows the Trustees of each group of Fidelity funds to focus on the unique issues of the funds they oversee, including common research, investment, and operational issues. On occasion, the separate Boards establish joint committees to address issues of overlapping consequences for the Fidelity funds overseen by each Board.
The Trustees operate using a system of committees to facilitate the timely and efficient consideration of all matters of importance to the Trustees, the fund, and fund shareholders and to facilitate compliance with legal and regulatory requirements and oversight of the fund's activities and associated risks. The Board, acting through its committees, has charged FMR and its affiliates with (i) identifying events or circumstances the occurrence of which could have demonstrably adverse effects on the fund's business and/or reputation; (ii) implementing processes and controls to lessen the possibility that such events or circumstances occur or to mitigate the effects of such events or circumstances if they do occur; and (iii) creating and maintaining a system designed to evaluate continuously business and market conditions in order to facilitate the identification and implementation processes described in (i) and (ii) above. Because the day-to-day operations and activities of the fund are carried out by or through FMR, its affiliates and other service providers, the fund's exposure to risks is mitigated but not eliminated by the processes overseen by the Trustees. While each of the Board's committees has responsibility for overseeing different aspects of the fund's activities, oversight is exercised primarily through the Operations, Audit, and Compliance Committees. In addition, the Independent Trustees have worked with FMR to enhance the Board's oversight of investment and financial risks, legal and regulatory risks, technology risks, and operational risks, including the development of additional risk reporting to the Board. For example, a working group comprised of Independent Trustees and FMR has worked and continues to work to review the Fidelity funds' valuation-related activities, reporting and risk management. Appropriate personnel, including but not limited to the fund's Chief Compliance Officer (CCO), FMR's internal auditor, the independent accountants, the fund's Treasurer and portfolio management personnel, make periodic reports to the Board's committees, as appropriate, including an annual review of FMR's risk management program for the Fidelity funds. The responsibilities of each standing committee, including their oversight responsibilities, are described further under "Standing Committees of the Fund's Trustees."
Annual Report
Trustees and Officers - continued
The fund's Statement of Additional Information (SAI) includes more information about the Trustees. To request a free copy, call Fidelity at 1-800-544-8544.
Interested Trustees*:
Correspondence intended for each Trustee who is an interested person may be sent to Fidelity Investments, 82 Devonshire Street, Boston, Massachusetts 02109.
Name, Age; Principal Occupations and Other Relevant Experience+ |
James C. Curvey (76) |
| Year of Election or Appointment: 2007 Mr. Curvey is Trustee and Acting Chairman of the Board of Trustees of certain Trusts. Mr. Curvey also serves as Trustee (2007-present) of other investment companies advised by FMR. Mr. Curvey is a Director of Fidelity Investments Money Management, Inc. (2009-present), Director of Fidelity Research & Analysis Co. (2009-present) and Director of FMR and FMR Co., Inc. (2007-present). Mr. Curvey is also Vice Chairman (2007-present) and Director of FMR LLC. In addition, Mr. Curvey serves as an Overseer for the Boston Symphony Orchestra and a member of the Trustees of Villanova University. Previously, Mr. Curvey was the Vice Chairman (2006-2007) and Director (2000-2007) of FMR Corp. |
Ronald P. O'Hanley (54) |
| Year of Election or Appointment: 2011 Mr. O'Hanley is Director of FMR Co., Inc. (2010-present), Director of Fidelity Investments Money Management, Inc. (2010-present), Director of Fidelity Research & Analysis Company (2010-present), President of Fidelity Asset Management and Corporate Services and a member of Fidelity's Executive Committee (2010-present). Previously, Mr. O'Hanley served as President and Chief Executive Officer of BNY Mellon Asset Management (2007-2010). Mr. O'Hanley also served as Vice Chairman of Bank New York Mellon Corp. and a member of that firm's Executive Committee. Prior to the 2007 merger of The Bank of New York and Mellon Financial Corporation, he was Vice Chairman of Mellon Financial Corporation and President and Chief Executive Officer of Mellon Asset Management. He joined Mellon in February 1997. Mr. O'Hanley currently serves as Chairman of the Boston Public Library Foundation Board of Directors and sits on the Board of Directors of Beth Israel Deaconess Medical Center, the Board of Trustees of the Marine Biological Laboratory and the Advisory Board of the Maxwell School of Citizenship and Public Administration at Syracuse University. Mr. O'Hanley also chairs the Council on Asset Management for the Financial Services Roundtable and is a member of the Board of Directors of Institutional Investor's U.S. Institute. |
* Trustees have been determined to be "Interested Trustees" by virtue of, among other things, their affiliation with the trust or various entities under common control with FMR.
+ The information above includes each Trustee's principal occupation during the last five years and other information relating to the experience, attributes, and skills relevant to each Trustee's qualifications to serve as a Trustee, which led to the conclusion that each Trustee should serve as a Trustee for the fund.
Annual Report
Trustees and Officers - continued
Independent Trustees:
Correspondence intended for each Independent Trustee (that is, the Trustees other than the Interested Trustees) may be sent to Fidelity Investments, P.O. Box 55235, Boston, Massachusetts 02205-5235.
Name, Age; Principal Occupations and Other Relevant Experience+ |
Dennis J. Dirks (63) |
| Year of Election or Appointment: 2005 Prior to his retirement in May 2003, Mr. Dirks was Chief Operating Officer and a member of the Board of The Depository Trust & Clearing Corporation (DTCC). He also served as President, Chief Operating Officer, and Board member of The Depository Trust Company (DTC) and President and Board member of the National Securities Clearing Corporation (NSCC). In addition, Mr. Dirks served as Chief Executive Officer and Board member of the Government Securities Clearing Corporation, Chief Executive Officer and Board member of the Mortgage-Backed Securities Clearing Corporation, as a Trustee and a member of the Finance Committee of Manhattan College (2005-2008), and as a Trustee and a member of the Finance Committee of AHRC of Nassau County (2006-2008). Mr. Dirks is a member of the Independent Directors Council (IDC) Governing Council (2010-Present) and Board of Directors for The Brookville Center for Children's Services, Inc. (2009-present). |
Alan J. Lacy (58) |
| Year of Election or Appointment: 2008 Mr. Lacy serves as Senior Adviser (2007-present) of Oak Hill Capital Partners, L.P. (private equity). Mr. Lacy also served as Chief Executive Officer (2000-2005) and Vice Chairman (2005-2006) of Sears Holdings Corporation and Sears, Roebuck and Co. (retail). In addition, Mr. Lacy serves as a member of the Board of Directors of Dave & Buster's, Inc. (restaurant and entertainment complexes, 2010-present), The Hillman Companies, Inc. (hardware wholesalers, 2010-present), and Bristol-Myers Squibb Company (global pharmaceuticals, 2007-present). Mr. Lacy is a member of the Board of Trustees of The National Parks Conservation Association (2006-Present). Previously, Mr. Lacy served as Chairman of the Board of Trustees of the National Parks Conservation Association (2008-2011) and as a member of the Board of Directors for the Western Union Company (global money transfer, 2006-2011). |
Ned C. Lautenbach (67) |
| Year of Election or Appointment: 2000 Mr. Lautenbach is Chairman of the Independent Trustees of the Equity and High Income Funds (2006-present). Mr. Lautenbach currently serves as the Lead Director of the Eaton Corporation Board of Directors (diversified industrial, 1997-present). Mr. Lautenbach is also a member of the Board of Directors of the Philharmonic Center for the Arts in Naples, Florida (1999-present); a member of the Board of Trustees of Fairfield University (2005-present); and a member of the Council on Foreign Relations (1994-present). Previously, Mr. Lautenbach was a Partner/Advisory Partner at Clayton, Dubilier & Rice, LLC (private equity investment, 1998-2010), as well as a Director of Sony Corporation (2006-2007). |
Joseph Mauriello (67) |
| Year of Election or Appointment: 2008 Prior to his retirement in January 2006, Mr. Mauriello served in numerous senior management positions including Deputy Chairman and Chief Operating Officer (2004-2005), and Vice Chairman of Financial Services (2002-2004) of KPMG LLP US (professional services, 1965-2005). Mr. Mauriello currently serves as a member of the Board of Directors of XL Group plc. (global insurance and re-insurance, 2006-present) and of Arcadia Resources Inc. (health care services and products, 2007-present). Previously, Mr. Mauriello served as a Director of the Hamilton Funds of the Bank of New York (2006-2007). |
Robert W. Selander (61) |
| Year of Election or Appointment: 2011 Previously, Mr. Selander served as a Member of the Advisory Board of Fidelity's Equity and High Income Funds (2011), Executive Vice Chairman (2010), Chief Executive Officer (2009-2010), and President and Chief Executive Officer (1997-2009) of Mastercard, Inc. |
Cornelia M. Small (67) |
| Year of Election or Appointment: 2005 Ms. Small is a member of the Board of Directors of the Teagle Foundation (2009-present). Ms. Small is also a member of the Investment Committee, and Chair (2008-present) and a member of the Board of Trustees of Smith College. In addition, Ms. Small serves on the Investment Committee of the Berkshire Taconic Community Foundation (2008-present). Previously, Ms. Small served as Chairperson of the Investment Committee (2002-2008) of Smith College. In addition, Ms. Small served as Chief Investment Officer, Director of Global Equity Investments, and a member of the Board of Directors of Scudder, Stevens & Clark and Scudder Kemper Investments. |
William S. Stavropoulos (72) |
| Year of Election or Appointment: 2001 Mr. Stavropoulos is Vice Chairman of the Independent Trustees of the Equity and High Income Funds (2006-present). Mr. Stavropoulos serves as President and Founder of the Michigan Baseball Foundation, the Great Lakes Loons (2007-present). Mr. Stavropoulos is Chairman Emeritus of the Board of Directors of The Dow Chemical Company, where he previously served in numerous senior management positions, including President, CEO (1995-2000; 2002-2004), Chairman of the Executive Committee (2000-2006), and as a member of the Board of Directors (1990-2006). Currently, Mr. Stavropoulos is Chairman of Univar (global distributor of commodity and specialty chemicals, 2010-present), a Director of Teradata Corporation (data warehousing and technology solutions, 2008-present), Chemical Financial Corporation, Maersk Inc. (industrial conglomerate), Tyco International, Inc. (multinational manufacturing and services, 2007-present), and a member of the Advisory Board for Metalmark Capital (private equity investment, 2005-present). Mr. Stavropoulos is a special advisor to Clayton, Dubilier & Rice, LLC (private equity investment). In addition, Mr. Stavropoulos is a member of the University of Notre Dame Advisory Council for the College of Science. |
David M. Thomas (62) |
| Year of Election or Appointment: 2008 Previously, Mr. Thomas served as Executive Chairman (2005-2006) and Chairman and Chief Executive Officer (2000-2005) of IMS Health, Inc. (pharmaceutical and healthcare information solutions). In addition, Mr. Thomas serves as a member of the Board of Directors of Fortune Brands, Inc. (consumer products), and Interpublic Group of Companies, Inc. (marketing communication, 2004-present). |
Michael E. Wiley (61) |
| Year of Election or Appointment: 2008 Mr. Wiley also serves as a Director of Asia Pacific Exploration Consolidated (international oil and gas exploration and production, 2008-present). Mr. Wiley serves as a Director of Tesoro Corporation (independent oil refiner and marketer, 2005-present), and a Director of Bill Barrett Corporation (exploration and production, 2005-present). In addition, Mr. Wiley also serves as a Director of Post Oak Bank (privately-held bank, 2004-present). Previously, Mr. Wiley served as a member of the Board of Trustees of the University of Tulsa (2000-2006; 2007-2010), as a Senior Energy Advisor of Katzenbach Partners, LLC (consulting, 2006-2007), as an Advisory Director of Riverstone Holdings (private investment), Chairman, President, and CEO of Baker Hughes, Inc. (oilfield services, 2000-2004), and as Director of Spinnaker Exploration Company (exploration and production, 2001-2005). |
Annual Report
+ The information above includes each Trustee's principal occupation during the last five years and other information relating to the experience, attributes, and skills relevant to each Trustee's qualifications to serve as a Trustee, which led to the conclusion that each Trustee should serve as a Trustee for the fund.
Advisory Board Members and Executive Officers:
Correspondence intended for each executive officer, Edward C. Johnson 3d, and Peter S. Lynch may be sent to Fidelity Investments, 82 Devonshire Street, Boston, Massachusetts 02109.
Name, Age; Principal Occupation |
Edward C. Johnson 3d (81) |
| Year of Election or Appointment: 2011 Member of the Advisory Board of Fidelity's Equity and High Income Funds. Mr. Johnson serves as Chief Executive Officer, Chairman, and a Director of FMR LLC, and also serves as Chairman and Director of FIL Limited. Previously, Mr. Johnson served as a Trustee and Chairman of the Board of certain Fidelity Trusts, Chairman and a Director of FMR, Chairman and a Director of FMR Co., Inc., and President of FMR LLC (2006-2007). |
Peter S. Lynch (67) |
| Year of Election or Appointment: 2003 Member of the Advisory Board of Fidelity's Equity and High Income Funds. Mr. Lynch is Vice Chairman and a Director of FMR and FMR Co., Inc. In addition, Mr. Lynch serves as a Trustee of Boston College and as the Chairman of the Inner-City Scholarship Fund. Previously, Mr. Lynch served on the Special Olympics International Board of Directors (1997-2006). |
Kenneth B. Robins (42) |
| Year of Election or Appointment: 2008 President and Treasurer of Fidelity's Equity and High Income Funds. Mr. Robins also serves as President and Treasurer (2010-present) and Assistant Treasurer (2009-present) of other Fidelity funds and is an employee of Fidelity Investments (2004-present). Previously, Mr. Robins served as Deputy Treasurer of the Fidelity funds (2005-2008) and Treasurer and Chief Financial Officer of The North Carolina Capital Management Trust: Cash and Term Portfolios (2006-2008). |
Brian B. Hogan (47) |
| Year of Election or Appointment: 2009 Vice President of Equity and High Income Funds. Mr. Hogan also serves as President of FMR's Equity Division (2009-present). Previously, Mr. Hogan served as Senior Vice President, Equity Research of FMR (2006-2009) and as a portfolio manager. |
Thomas C. Hense (47) |
| Year of Election or Appointment: 2008 or 2010 Vice President of Fidelity's High Income (2008), Small Cap (2008), and Value (2010) Funds. Previously, Mr. Hense served as a portfolio manager for Fidelity's Institutional Money Management Group (Pyramis) (2003-2008). |
Scott C. Goebel (43) |
| Year of Election or Appointment: 2008 Secretary and Chief Legal Officer (CLO) of the Fidelity funds. Mr. Goebel also serves as Secretary of Fidelity Investments Money Management, Inc. (FIMM) (2010-present) and Fidelity Research and Analysis Company (FRAC) (2010-present); Secretary and CLO of The North Carolina Capital Management Trust: Cash and Term Portfolios (2008-present); General Counsel, Secretary, and Senior Vice President of FMR (2008-present) and FMR Co., Inc. (2008-present); employed by FMR LLC or an affiliate (2001-present); Chief Legal Officer of Fidelity Management & Research (Hong Kong) Limited (2008-present) and Assistant Secretary of Fidelity Management & Research (Japan) Inc. (2008-present), and Fidelity Management & Research (U.K.) Inc. (2008-present). Previously, Mr. Goebel served as Assistant Secretary of FIMM (2008-2010), FRAC (2008-2010), and the Funds (2007-2008) and as Vice President and Secretary of Fidelity Distributors Corporation (FDC) (2005-2007). |
William C. Coffey (42) |
| Year of Election or Appointment: 2009 Assistant Secretary of Fidelity's Equity and High Income Funds. Mr. Coffey also serves as Senior Vice President and Deputy General Counsel of FMR LLC (2010-present), and is an employee of Fidelity Investments. Previously, Mr. Coffey served as Vice President and Associate General Counsel of FMR LLC (2005-2009). |
Holly C. Laurent (57) |
| Year of Election or Appointment: 2008 Anti-Money Laundering (AML) Officer of the Fidelity funds. Ms. Laurent also serves as AML Officer of The North Carolina Capital Management Trust: Cash and Term Portfolios (2008-present) and is an employee of Fidelity Investments. Previously, Ms. Laurent was Senior Vice President and Head of Legal for Fidelity Business Services India Pvt. Ltd. (2006-2008), and Senior Vice President, Deputy General Counsel and Group Head for FMR LLC (2005-2006). |
Christine Reynolds (53) |
| Year of Election or Appointment: 2008 Chief Financial Officer of the Fidelity funds. Ms. Reynolds became President of Fidelity Pricing and Cash Management Services (FPCMS) in August 2008. Ms. Reynolds served as Chief Operating Officer of FPCMS (2007-2008). Previously, Ms. Reynolds served as President, Treasurer, and Anti-Money Laundering officer of the Fidelity funds (2004-2007). |
Kenneth A. Rathgeber (64) |
| Year of Election or Appointment: 2004 Chief Compliance Officer of Fidelity's Equity and High Income Funds. Mr. Rathgeber is Chief Compliance Officer of Fidelity Management & Research (Hong Kong) Limited (2008-present), Fidelity Management & Research (Japan) Inc. (2008-present), FMR (2005-present), FMR Co., Inc. (2005-present), Fidelity Management & Research (U.K.) Inc. (2005-present), Fidelity Research & Analysis Company (2005-present), Fidelity Investments Money Management, Inc. (2005-present), Pyramis Global Advisors, LLC (2005-present), and Strategic Advisers, Inc. (2005-present). |
Jeffrey S. Christian (50) |
| Year of Election or Appointment: 2009 Deputy Treasurer of the Fidelity funds. Mr. Christian is an employee of Fidelity Investments. Previously, Mr. Christian served as Chief Financial Officer (2008-2009) of certain Fidelity funds and Senior Vice President of Fidelity Pricing and Cash Management Services (FPCMS) (2004-2009). |
Joseph F. Zambello (54) |
| Year of Election or Appointment: 2011 Deputy Treasurer of the Fidelity funds. Mr. Zambello is an employee of Fidelity Investments. Previously, Mr. Zambello served as Vice President of FMR's Program Management Group (2009-2011) and Vice President of the Transfer Agent Oversight Group (2005-2009). |
Adrien E. Deberghes (44) |
| Year of Election or Appointment: 2008 Deputy Treasurer of Fidelity's Equity and High Income Funds. Mr. Deberghes also serves as Vice President and Assistant Treasurer of Fidelity Rutland Square Trust II and Fidelity Commonwealth Trust II (2011-present), Assistant Treasurer of other Fidelity funds (2010-present), and is an employee of Fidelity Investments (2008-present). Previously, Mr. Deberghes served as Senior Vice President of Mutual Fund Administration at State Street Corporation (2007-2008), Senior Director of Mutual Fund Administration at Investors Bank & Trust (2005-2007), and Director of Finance for Dunkin' Brands (2000-2005). |
Stephanie J. Dorsey (42) |
| Year of Election or Appointment: 2010 Assistant Treasurer of Fidelity's Equity and High Income Funds. Ms. Dorsey also serves as Deputy Treasurer of other Fidelity funds (2008-present) and is an employee of Fidelity Investments (2008-present). Previously, Ms. Dorsey served as Treasurer (2004-2008) of the JPMorgan Mutual Funds and Vice President (2004-2008) of JPMorgan Chase Bank. |
John R. Hebble (53) |
| Year of Election or Appointment: 2009 Assistant Treasurer of Fidelity's Equity and High Income Funds. Mr. Hebble also serves as President (2011-present), Treasurer, and Chief Financial Officer of The North Carolina Capital Management Trust: Cash and Term Portfolios (2008-present), President and Treasurer of other Fidelity funds (2008-present) and is an employee of Fidelity Investments. |
Gary W. Ryan (53) |
| Year of Election or Appointment: 2005 Assistant Treasurer of the Fidelity funds. Mr. Ryan is an employee of Fidelity Investments. Previously, Mr. Ryan served as Vice President of Fund Reporting in Fidelity Pricing and Cash Management Services (FPCMS) (1999-2005). |
Jonathan Davis (43) |
| Year of Election or Appointment: 2010 Assistant Treasurer of the Fidelity funds. Mr. Davis is also Assistant Treasurer of Fidelity Rutland Square Trust II and Fidelity Commonwealth Trust II. Mr. Davis is an employee of Fidelity Investments. Previously, Mr. Davis served as Vice President and Associate General Counsel of FMR LLC (2003-2010). |
Annual Report
The Board of Trustees of Fidelity International Small Cap Fund voted to pay to shareholders of record at the opening of business on record date, the following distributions per share derived from capital gains realized from sales of portfolio securities, and dividends derived from net investment income:
| Pay Date | Record Date | Dividends | Capital Gains |
International Small Cap Fund | 12/05/11 | 12/02/11 | $0.178 | $0.272 |
International Small Cap fund designates 25% of the dividends distributed during the fiscal year as amounts which may be taken into account as a dividend for purposes of the maximum rate under section 1(h)(11) of the Internal Revenue Code.
The amounts per share which represent income derived from sources within, and taxes paid to, foreign countries or possessions of the United States are as follows:
| Pay Date | Income | Taxes |
International Small Cap Fund | 12/06/10 | $0.197 | $0.0124 |
The fund will notify shareholders in January 2012 of amounts for use in preparing 2011 income tax returns.
Annual Report
Board Approval of Investment Advisory Contracts and Management Fees
Fidelity International Small Cap Fund
Each year, the Board of Trustees, including the Independent Trustees (together, the Board), votes on the renewal of the management contract and sub-advisory agreements (together, the Advisory Contracts) for the fund. The Board, assisted by the advice of fund counsel and Independent Trustees' counsel, requests and considers a broad range of information relevant to the renewal of the Advisory Contracts throughout the year.
The Board meets regularly and considers at each of its meetings factors that are relevant to its annual consideration of the renewal of the fund's Advisory Contracts, including the services and support provided to the fund and its shareholders. The Board has established various standing committees, each composed of Independent Trustees with varying backgrounds, to which the Board has assigned specific subject matter responsibilities in order to enhance effective decision-making by the Board. The Board, acting directly and through its Committees, requests and receives information concerning the annual consideration of the renewal of the fund's Advisory Contracts. The Board also meets as needed to consider matters specifically related to the Board's annual consideration of the renewal of Advisory Contracts. Members of the Board may also meet with trustees of other Fidelity funds through ad hoc joint committees to discuss certain matters relevant to the Fidelity funds.
At its July 2011 meeting, the Board of Trustees, including the Independent Trustees, unanimously determined to renew the fund's Advisory Contracts. In reaching its determination, the Board considered all factors it believed relevant, including (i) the nature, extent, and quality of the services to be provided to the fund and its shareholders (including the investment performance of the fund); (ii) the competitiveness of the fund's management fee and total expense ratio; (iii) the total costs of the services to be provided by and the profits to be realized by Fidelity from its relationship with the fund; (iv) the extent to which economies of scale would be realized as the fund grows; and (v) whether fee levels reflect these economies of scale, if any, for the benefit of fund shareholders.
In considering whether to renew the Advisory Contracts for the fund, the Board reached a determination, with the assistance of fund counsel and Independent Trustees' counsel and through the exercise of its business judgment, that the renewal of the Advisory Contracts is in the best interests of the fund and its shareholders and that the compensation payable under the Advisory Contracts is fair and reasonable. The Board's decision to renew the Advisory Contracts was not based on any single factor, but rather was based on a comprehensive consideration of all the information provided to the Board at its meetings throughout the year. The Board, in reaching its determination to renew the Advisory Contracts, is aware that shareholders in the fund have a broad range of investment choices available to them, including a wide choice among mutual funds offered by Fidelity's competitors, and that the fund's shareholders, who have the opportunity to review and weigh the disclosure provided by the fund in its prospectus and other public disclosures, have chosen to invest in this fund, managed by Fidelity.
Annual Report
Nature, Extent, and Quality of Services Provided. The Board considered the staffing within the investment adviser, FMR, and the sub-advisers (together, the Investment Advisers), including the backgrounds of the fund's investment personnel and the fund's investment objective and discipline. The Independent Trustees also had discussions with senior management of Fidelity's investment operations and investment groups. The Board considered the structure of the portfolio manager compensation program and whether this structure provides appropriate incentives to act in the best interests of the fund.
Resources Dedicated to Investment Management and Support Services. The Board and the Fund Oversight and Research Committees reviewed the general qualifications and capabilities of the Investment Advisers' investment staff, including its size, education, experience, and resources, as well as the Investment Advisers' approach to recruiting, training, managing, and compensating investment personnel. The Board also noted that FMR has devoted increased resources to non-U.S. offices. The Board noted that Fidelity's analysts have extensive resources, tools and capabilities which allow them to conduct sophisticated quantitative and fundamental analysis, as well as credit analysis of issuers, counterparties and enhancers. The Board also believes that Fidelity's investment professionals have sufficient access to global information and data so as to provide competitive investment results over time, and that those professionals also have access to sophisticated tools which permit them to assess portfolio construction and risk and performance attribution characteristics continuously, as well as to transmit new information and research conclusions rapidly around the world. Additionally, in their deliberations, the Board considered the Investment Advisers' trading capabilities and resources which are an integral part of the investment management process.
Shareholder and Administrative Services. The Board considered (i) the nature, extent, quality, and cost of advisory, administrative, and shareholder services performed by the Investment Advisers and their affiliates under the Advisory Contracts and under separate agreements covering transfer agency, pricing and bookkeeping, and securities lending services for the fund; (ii) the nature and extent of the investment adviser's supervision of third party service providers, principally custodians and subcustodians; and (iii) the resources devoted to, and the record of compliance with, the fund's compliance policies and procedures. The Board also reviewed the allocation of fund brokerage, including allocations to brokers affiliated with the Investment Advisers, the use of brokerage commissions to pay fund expenses, and the use of "soft" commission dollars to pay for research services.
The Board noted that the growth of fund assets over time across the complex allows Fidelity to reinvest in the development of services designed to enhance the value or convenience of the Fidelity funds as investment vehicles. These services include 24-hour access to account information and market information through telephone representatives and over the Internet, investor education materials and asset allocation tools, and the expanded availability of Fidelity Investor Centers, with 35 new branches opening since 2010.
Annual Report
Board Approval of Investment Advisory Contracts and
Management Fees - continued
Investment in a Large Fund Family. The Board considered the benefits to shareholders of investing in a Fidelity fund, including the benefits of investing in a fund that is part of a large family of funds offering a variety of investment disciplines and providing a large variety of mutual fund investor services. The Board noted that Fidelity had taken, or had made recommendations that resulted in the Fidelity funds taking, a number of actions over the previous year that benefited particular funds, including (i) continuing to dedicate additional resources to investment research and support of the senior management team that oversees asset management; (ii) rationalizing product lines through the mergers of six funds into other funds; (iii) continuing to migrate the Freedom Funds to dedicated lower cost underlying funds; (iv) obtaining shareholder approval to broaden the investment strategies for Fidelity Consumer Finance Portfolio, Fidelity Emerging Asia Fund, and Fidelity Environment and Alternative Energy Portfolio; (v) contractually agreeing to reduce the management fees and impose other expense limitations on Spartan 500 Index Fund and U.S. Bond Index Fund in connection with launching new institutional classes of these funds; (vi) changing the name, primary and supplemental benchmarks, and investment policies of Fidelity Global Strategies Fund to support the fund's flexible investment mandate and global orientation; and (vii) reducing the transfer agency account fee rates on certain accounts.
Investment Performance. The Board considered whether the fund has operated in accordance with its investment objective, as well as its record of compliance with its investment restrictions. It also reviewed the fund's absolute investment performance for each class, as well as the fund's relative investment performance for each class measured over multiple periods against (i) a broad-based securities market index, and (ii) a peer group of mutual funds deemed appropriate by Fidelity and reviewed by the Board. The following charts considered by the Board show, over the one-, three-, and five-year periods ended December 31, 2010, the cumulative total returns of Institutional Class (Class I) and Class B of the fund, the cumulative total returns of a broad-based securities market index ("benchmark"), and a range of cumulative total returns of a peer group of mutual funds identified by Lipper Inc. as having an investment objective similar to that of the fund. The returns of Institutional Class (Class I) and Class B show the performance of the highest and lowest performing classes, respectively (based on five-year performance). The box within each chart shows the 25th percentile return (bottom of box) and the 75th percentile return (top of box) of the peer group. Returns shown above the box are in the first quartile and returns shown below the box are in the fourth quartile. The percentage beaten numbers noted below each chart correspond to the percentile box and represent the percentage of funds in the peer group whose performance was equal to or lower than that of the class indicated.
Annual Report
Fidelity International Small Cap Fund

The Board reviewed the fund's relative investment performance against its peer group and noted that the performance of Institutional Class (Class I) of the fund was in the first quartile for the one- and three-year periods and the third quartile for the five-year period. The Board also noted that the investment performance of Institutional Class (Class I) of the fund compared favorably to its benchmark for all the periods shown. The Board considered that the variations in performance among the fund's classes reflect the variations in class expenses, which result in lower performance for higher expense classes. The Board also reviewed the fund's performance since inception as well as performance in the current year.
The Board also considered that the fund's management fee is subject to upward or downward adjustment depending upon whether, and to what extent, the fund's investment performance for the performance period exceeds, or is exceeded by, the record (over the same period) of a Board-approved performance adjustment index. The Board noted that the performance adjustment provides FMR with a strong economic incentive to seek to achieve superior performance for the fund's shareholders and helps to more closely align the interests of FMR and the fund's shareholders.
Based on its review, the Board concluded that the nature, extent, and quality of services provided to the fund under the Advisory Contracts should benefit the fund's shareholders.
Annual Report
Board Approval of Investment Advisory Contracts and
Management Fees - continued
Competitiveness of Management Fee and Total Expense Ratio. The Board considered the fund's management fee and total expense ratio compared to "mapped groups" of competitive funds and classes. Fidelity creates "mapped groups" by combining similar Lipper investment objective categories that have comparable management fee characteristics. Combining Lipper investment objective categories aids the Board's management fee and total expense ratio comparisons by broadening the competitive group used for comparison and by reducing the number of universes to which various Fidelity funds are compared.
Management Fee. The Board considered two proprietary management fee comparisons for the 12-month periods shown in the chart below. The group of Lipper funds used by the Board for management fee comparisons is referred to below as the "Total Mapped Group." The Total Mapped Group is broader than the Lipper peer group used by the Board for performance comparisons because the Total Mapped Group combines several Lipper investment objective categories while the Lipper peer group does not. The Total Mapped Group comparison focuses on a fund's standing relative to the total universe of comparable funds available to investors in terms of gross management fees before expense reimbursements or caps, and without giving effect to the fund's performance adjustment. "TMG %" represents the percentage of funds in the Total Mapped Group that had management fees that were lower than the fund's. For example, a TMG % of 19% means that 81% of the funds in the Total Mapped Group had higher management fees than the fund. The "Asset-Size Peer Group" (ASPG) comparison focuses on a fund's standing relative to non-Fidelity funds similar in size to the fund within the Total Mapped Group. The ASPG represents at least 15% of the funds in the Total Mapped Group with comparable asset size and management fee characteristics, subject to a minimum of 50 funds (or all funds in the Total Mapped Group if fewer than 50). Additional information, such as the ASPG quartile in which the fund's management fee ranked and the impact of the fund's performance adjustment, is also included in the chart and considered by the Board.
Annual Report
Fidelity International Small Cap Fund

The Board noted that the fund's management fee ranked below the median of its Total Mapped Group and below the median of its ASPG for 2010. The Board also noted the effect of the fund's positive performance adjustment on the fund's management fee ranking. The Board noted that the performance adjustment for each year represents calculations for performance periods that differ from the periods shown in the performance charts above.
Based on its review, the Board concluded that the fund's management fee is fair and reasonable in light of the services that the fund receives and the other factors considered.
Total Expense Ratio. In its review of each class's total expense ratio, the Board considered the fund's management fee as well as other fund or class expenses, as applicable, such as transfer agent fees, pricing and bookkeeping fees, fund-paid 12b-1 fees, and custodial, legal, and audit fees. The Board also noted the effects of any waivers and reimbursements on fees and expenses, as well as the impact of the fund's performance adjustment. As part of its review, the Board also considered the current and historical total expense ratios of each class of the fund compared to competitive fund median expenses. Each class of the fund is compared to those funds and classes in the Total Mapped Group (used by the Board for management fee comparisons) that have a similar sales load structure.
The Board noted that the total expense ratio of each of Class A, Class B, Class C, Institutional Class, and the retail class ranked below its competitive median for 2010 and the total expense ratio of Class T ranked above its competitive median for 2010. The Board considered that various factors, including 12b-1 fees, positive or negative performance adjustments, and relatively higher other expenses in the case of small fund size, can affect total expense ratios. The Board noted that the total expense ratio of Class T was above the competitive median primarily because of higher 12b-1 fees on Class T. Class T has a higher 12b-1 fee, but a lower front-end sales charge, than traditionally priced front-end sales charge classes. The Board noted that the fund offers multiple classes, each of which has a different sales load and 12b-1 fee structure, and that the multiple structures are intended to offer a range of pricing options for the intermediary market. The Board also noted that the total expense ratios of the classes vary primarily by the level of their 12b-1 fees, although differences in transfer agent fees may also cause expenses to vary from class to class.
Annual Report
Board Approval of Investment Advisory Contracts and
Management Fees - continued
Fees Charged to Other Fidelity Clients. The Board also considered Fidelity fee structures and other information with respect to clients of FMR and its affiliates, such as other mutual funds advised or subadvised by FMR or its affiliates, pension plan clients, and other institutional clients. In March 2010, the Board created an ad hoc joint committee with the board of other Fidelity funds (the Committee) to review and compare Fidelity's institutional investment advisory business with its business of providing services to the Fidelity funds, including the differences in services provided, fees charged, and costs incurred, as well as competition in their respective marketplaces.
Based on its review of total expense ratios and fees charged to other Fidelity clients, the Board concluded that the total expense ratio of each class of the fund was reasonable, although Class T was above the median of the universe presented for comparison, in light of the services that the fund and its shareholders receive and the other factors considered, including the findings of the Committee.
Costs of the Services and Profitability. The Board considered the revenues earned and the expenses incurred by Fidelity in conducting the business of developing, marketing, distributing, managing, administering and servicing the fund and its shareholders. The Board also considered the level of Fidelity's profits in respect of all the Fidelity funds.
On an annual basis, FMR presents to the Board Fidelity's profitability for the fund. Fidelity calculates the profitability for each fund, as well as aggregate profitability for groups of Fidelity funds and all Fidelity funds, using a series of detailed revenue and cost allocation methodologies which originate with the books and records of Fidelity on which Fidelity's audited financial statements are based. The Audit Committee of the Board reviews any significant changes from the prior year's methodologies.
PricewaterhouseCoopers LLP (PwC), independent registered public accounting firm and auditor to Fidelity and certain Fidelity funds, has been engaged annually by the Board as part of the Board's assessment of Fidelity's profitability analysis. PwC's engagement includes the review and assessment of Fidelity's methodologies used in determining the revenues and expenses attributable to Fidelity's mutual fund business, and completion of agreed-upon procedures surrounding the mathematical accuracy of fund profitability and its conformity to allocation methodologies. After considering PwC's reports issued under the engagement and information provided by Fidelity, the Board concluded that while other allocation methods may also be reasonable, Fidelity's profitability methodologies are reasonable in all material respects.
Annual Report
The Board also reviewed Fidelity's non-fund businesses and fall-out benefits related to the mutual fund business as well as cases where Fidelity's affiliates may benefit from or be related to the fund's business.
The Board considered the costs of the services provided by and the profits realized by Fidelity in connection with the operation of the fund and was satisfied that the profitability was not excessive in the circumstances.
Economies of Scale. The Board considered whether there have been economies of scale in respect of the management of the Fidelity funds, whether the Fidelity funds (including the fund) have appropriately benefited from any such economies of scale, and whether there is potential for realization of any further economies of scale. The Board considered the extent to which the fund will benefit from economies of scale through increased services to the fund, through waivers or reimbursements, or through fee or expense reductions. The Board also noted that in 2009, it and the board of other Fidelity funds created an ad hoc committee (the Economies of Scale Committee) to analyze whether FMR attains economies of scale in respect of the management and servicing of the Fidelity funds, whether the Fidelity funds have appropriately benefited from such economies of scale, and whether there is potential for realization of any further economies of scale.
The Board recognized that the fund's management contract incorporates a "group fee" structure, which provides for lower group fee rates as total fund assets under FMR's management increase, and for higher group fee rates as total fund assets under FMR's management decrease. FMR calculates the group fee rates based on a tiered asset "breakpoint" schedule that varies based on asset class. The Board considered that the group fee is designed to deliver the benefits of economies of scale to fund shareholders when total Fidelity fund assets increase, even if assets of any particular fund are unchanged or have declined, because some portion of Fidelity's costs are attributable to services provided to all Fidelity funds, and all funds benefit if those costs can be allocated among more assets. The Board concluded that, given the group fee structure, fund shareholders will benefit from lower management fees as assets under FMR's management increase at the fund complex level, regardless of whether Fidelity achieves any such economies of scale.
The Board concluded, taking into account the analysis of the Economies of Scale Committee, that any potential economies of scale are being appropriately shared between fund shareholders and Fidelity.
Annual Report
Board Approval of Investment Advisory Contracts and
Management Fees - continued
Additional Information Requested by the Board. In order to develop fully the factual basis for consideration of the Fidelity funds' Advisory Contracts, the Board requested and received additional information on certain topics, including (i) fund performance trends, actions to be taken by FMR to improve certain funds' overall performance, and Fidelity's long-term strategies for certain funds; (ii) portfolio manager changes that have occurred during the past year and length of portfolio manager tenure for different categories of funds over time; (iii) Fidelity's compensation structure for portfolio managers and other key personnel and strategies for attracting and retaining non-investment personnel; (iv) the amount of the investment that each portfolio manager has made in the Fidelity fund(s) that he or she manages; (v) historical trends in Fidelity's realization of fall-out benefits; (vi) Fidelity's group fee structures and the rationale for the individual fee rates of certain funds; (vii) fund profitability methodology and the impact of certain factors on fund profitability results; (viii) trends regarding industry use of performance fee structures and Fidelity's compliance practices with respect to performance adjustment calculations; (ix) the fee structures in place for certain other Fidelity clients; and (x) explanations regarding the relative total expense ratios of certain funds and classes, total expense competitive trends, and actions that might be taken by FMR to reduce total expense ratios for certain funds and classes.
Based on its evaluation of all of the conclusions noted above, and after considering all factors it believed relevant, the Board ultimately concluded that the advisory fee structures are fair and reasonable, and that the fund's Advisory Contracts should be renewed.
Annual Report
Managing Your Investments
Fidelity offers several ways to conveniently manage your personal investments via your telephone or PC. You can access your account information, conduct trades and research your investments 24 hours a day.
By Phone
Fidelity Automated Service Telephone provides a single toll-free number to access account balances, positions, quotes and trading. It's easy to navigate the service, and on your first call, the system will help you create a personal identification number (PIN) for security.
(phone graphic)
Fidelity Automated
Service Telephone (FAST®)
1-800-544-5555
Press
1 For mutual fund and brokerage trading.
2 For quotes.*
3 For account balances and holdings.
4 To review orders and mutual
fund activity.
5 To change your PIN.
* 0 To speak to a Fidelity representative.
By PC
Fidelity's web site on the Internet provides a wide range of information, including daily financial news, fund performance, interactive planning tools and news about Fidelity products and services.
(computer graphic)
Fidelity's Web Site
www.fidelity.com
* When you call the quotes line, please remember that a fund's yield and return will vary and, except for money market funds, share price will also vary. This means that you may have a gain or loss when you sell your shares. There is no assurance that money market funds will be able to maintain a stable $1 share price; an investment in a money market fund is not insured or guaranteed by the U.S. government. Total returns are historical and include changes in share price, reinvestment of dividends and capital gains distributions, and the effects of any sales charges.
Annual Report
Investment Adviser
Fidelity Management & Research Company
Boston, MA
Investment Sub-Advisers
FMR Co., Inc.
Fidelity Management & Research
(U.K.) Inc.
FIL Investment Advisors
FIL Investments (Japan) Limited
FIL Investment Advisors (UK) Ltd.
Fidelity Management & Research
(Hong Kong) Limited
Fidelity Management & Research
(Japan) Inc.
General Distributor
Fidelity Distributors Corporation
Boston, MA
Transfer and Service Agents
Fidelity Investments Institutional
Operations Company, Inc.
Boston, MA
Fidelity Service Company, Inc.
Boston, MA
Custodian
The Bank of New York Mellon
New York, NY
The Fidelity Telephone Connection
Mutual Fund 24-Hour Service
Exchanges/Redemptions
and Account Assistance 1-800-544-6666
Product Information 1-800-544-8888
Retirement Accounts 1-800-544-4774
(8 a.m. - 9 p.m.)
TDD Service 1-800-544-0118
for the deaf and hearing impaired
(9 a.m. - 9 p.m. Eastern time)
Fidelity Automated Service
Telephone (FAST®) (automated service graphic) 1-800-544-5555
(automated service graphic) Automated line for quickest service
(Fidelity Logo)
Corporate Headquarters
82 Devonshire St., Boston, MA 02109
www.fidelity.com
ISC-UANN-1211
1.793584.108
(Fidelity Logo)
Fidelity Advisor®
International Small Cap
Fund - Class A, Class T, Class B
and Class C
Annual Report
October 31, 2011
(Fidelity Cover Art)
Class A, Class T, Class B, and Class C are classes of Fidelity®
International Small Cap Fund
Contents
Chairman's Message | (Click Here) | The Chairman's message to shareholders. |
Performance | (Click Here) | How the fund has done over time. |
Management's Discussion of Fund Performance | (Click Here) | The Portfolio Managers' review of fund performance and strategy. |
Shareholder Expense Example | (Click Here) | An example of shareholder expenses. |
Investment Changes | (Click Here) | A summary of major shifts in the fund's investments over the past six months. |
Investments | (Click Here) | A complete list of the fund's investments with their market values. |
Financial Statements | (Click Here) | Statements of assets and liabilities, operations, and changes in net assets,
as well as financial highlights. |
Notes | (Click Here) | Notes to financial statements. |
Report of Independent Registered Public Accounting Firm | (Click Here) | |
Trustees and Officers | (Click Here) | |
Distributions | (Click Here) | |
Board Approval of Investment Advisory Contracts and Management Fees | (Click Here) | |
To view a fund's proxy voting guidelines and proxy voting record for the 12-month period ended June 30, visit http://www.fidelity.com/proxyvotingresults or visit the Securities and Exchange Commission's (SEC) web site at http://www.sec.gov. You may also call 1-877-208-0098 to request a free copy of the proxy voting guidelines.
Standard & Poor's, S&P and S&P 500 are registered service marks of The McGraw-Hill Companies, Inc. and have been licensed for use by Fidelity Distributors Corporation.
Other third party marks appearing herein are the property of their respective owners.
All other marks appearing herein are registered or unregistered trademarks or service marks of FMR LLC or an affiliated company.
Annual Report
This report and the financial statements contained herein are submitted for the general information of the shareholders of the fund. This report is not authorized for distribution to prospective investors in the fund unless preceded or accompanied by an effective prospectus.
A fund files its complete schedule of portfolio holdings with the SEC for the first and third quarters of each fiscal year on Form N-Q. Forms N-Q are available on the SEC's web site at http://www.sec.gov. A fund's Forms N-Q may be reviewed and copied at the SEC's Public Reference Room in Washington, DC. Information regarding the operation of the SEC's Public Reference Room may be obtained by calling 1-800-SEC-0330. For a complete list of a fund's portfolio holdings, view the most recent holdings listing, semiannual report, or annual report on Fidelity's web site at http://www.fidelity.com, http://www.advisor.fidelity.com, or http://www.401k.com, as applicable.
NOT FDIC INSURED • MAY LOSE VALUE • NO BANK GUARANTEE
Neither the fund nor Fidelity Distributors Corporation is a bank.
Annual Report
(Acting Chairman's Photograph)
Dear Shareholder:
Global equity markets began the fourth quarter on a strong note, sharply reversing course in October amid strong corporate earnings, better-than-expected economic news and the promise of a resolution to the sovereign debt crisis in Europe. The mini rally followed a third quarter marked by a significant downturn in July and August, which heightened investor anxiety and set off a wave of volatility that hampered most major asset classes through the end of September. Financial markets are difficult to predict, of course, but you can help put the odds in your favor by following these time-tested investment principles.
One of the basic tenets is to invest according to your time horizon. For long-term investors, riding out the markets' inevitable ups and downs has proven much more effective than making decisions based on short-term developments. If your goal is approaching, you can also benefit from patience and restraint, rather than attempting to time the market. No matter your time horizon, missing only a few of the markets' best days can significantly diminish returns. Patience also affords the benefits of compounding - earning interest on additional income or reinvested dividends and capital gains. While staying the course doesn't eliminate risk, it can considerably lessen the negative impact of short-term downturns.
Asset allocation is another principle to manage risk. As you spread your portfolio among the asset classes, be sure to consider your time horizon, risk tolerance and investment objectives. Younger investors may be better served by emphasizing equities, which historically have been the best-performing asset class over time. Investors who are nearing a specific goal, such as retirement or sending a child to college, may choose to favor bonds and other investments that have tended to be more stable. Studies indicate that asset allocation is the single most important determinant of a portfolio's long-term success. After deciding on a suitable allocation strategy, make sure your portfolio is adequately diversified, with exposure to stocks of small-, mid- and large-cap companies in a range of sectors, for example. And today, more than ever, geographic diversification should be taken into account.
Lastly, investing a certain amount of money on a regular basis - a principle known as dollar-cost averaging - can help lower the average cost of your purchases, while also giving you the discipline to avoid selling weak performers just prior to an upswing, or chasing a hot performer just before a correction.
We invite you to learn more by visiting us on the Internet, dropping by one of our Investor Centers or calling us by phone. It is our privilege to provide the resources you need to choose investments that are right for you.
Sincerely,
(Acting Chairman's Signature)
James C. Curvey
Acting Chairman
Annual Report
Average annual total return reflects the change in the value of an investment, assuming reinvestment of the class' distributions from dividend income and capital gains (the profits earned upon the sale of securities that have grown in value, if any) and assuming a constant rate of performance each year. The $10,000 table and the fund's returns do not reflect the deduction of taxes that a shareholder would pay on fund distributions or the redemption of fund shares. During periods of reimbursement by Fidelity, a fund's total return will be greater than it would be had the reimbursement not occurred. How a fund did yesterday is no guarantee of how it will do tomorrow.
Average Annual Total Returns
Periods ended October 31, 2011 | Past 1
year | Past 5
years | Life of
fund A |
Class A (incl. 5.75% sales charge) B | -9.52% | -0.25% | 14.17% |
Class T (incl. 3.50% sales charge) C | -7.53% | -0.03% | 14.20% |
Class B (incl. contingent deferred sales charge) D | -9.32% | -0.07% | 14.21% |
Class C (incl. contingent deferred sales charge) E | -5.57% | 0.19% | 14.14% |
A From September 18, 2002.
B Class A shares bear a 0.25% 12b-1 fee. The initial offering of Class A shares took place on May 27, 2003. Returns prior to May 27, 2003 are those of Fidelity® International Small Cap Fund, the original class of the fund, which has no 12b-1 fee. Had Class A shares' 12b-1 fee been reflected, returns prior to May 27, 2003 would have been lower.
C Class T shares bear a 0.50% 12b-1 fee. The initial offering of Class T shares took place on May 27, 2003. Returns prior to May 27, 2003 are those of Fidelity® International Small Cap Fund, the original class of the fund, which has no 12b-1 fee. Had Class T shares' 12b-1 fee been reflected, returns prior to May 27, 2003 would have been lower.
D Class B shares bear a 1.00% 12b-1 fee. The initial offering of Class B shares took place on May 27, 2003. Returns prior to May 27, 2003 are those of Fidelity International Small Cap Fund, the original class of the fund, which has no 12b-1 fee. Had Class B shares' 12b-1 fee been reflected, returns prior to May 27, 2003 would have been lower. Class B shares' contingent deferred sales charge included in the past one year, five years, and life of fund total return figures are 5%, 2%, and 0%, respectively.
E Class C shares bear a 1.00% 12b-1 fee. The initial offering of Class C shares took place on May 27, 2003. Returns prior to May 27, 2003 are those of Fidelity International Small Cap Fund, the original class of the fund, which has no 12b-1 fee. Had Class C shares' 12b-1 fee been reflected, returns prior to May 27, 2003 would have been lower. Class C shares' contingent deferred sales charge included in the past one year, five years, and life of fund total return figures are 1%, 0%, and 0%, respectively.
Annual Report
$10,000 Over Life of Fund
Let's say hypothetically that $10,000 was invested in Fidelity Advisor® International Small Cap Fund - Class A, a class of the fund, on September 18, 2002, when the fund started, and the current 5.75% sales charge was paid. The chart shows how the value of your investment would have changed, and also shows how the MSCI® EAFE® (Europe, Australasia, Far East) Small Cap Index performed over the same period. The initial offering of Class A took place on May 27, 2003. See the previous page for additional information regarding the performance of Class A.
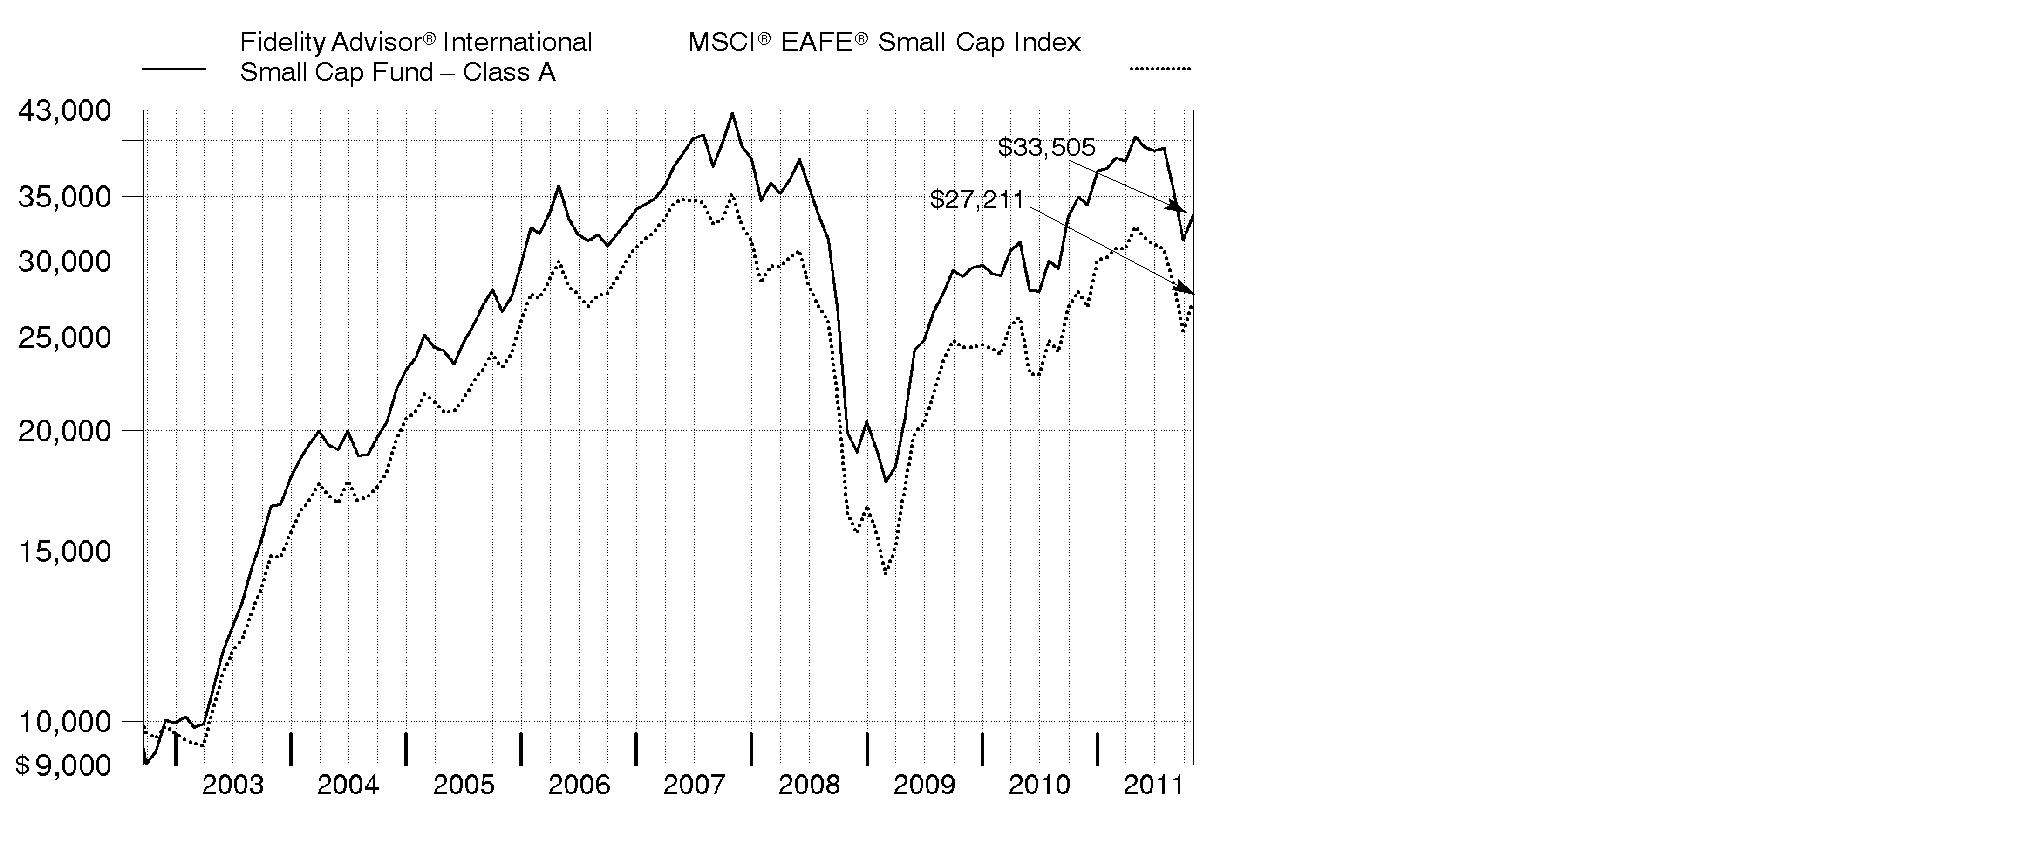
Annual Report
Market Recap: International equities were rocked by a number of headline events during the year ending October 31, 2011. Stocks posted a solid advance for the first half of the period, despite concern about the sovereign debt crisis in Europe, a devastating earthquake and tsunami in Japan, and political upheaval in the Middle East and North Africa. Sentiment turned decidedly negative in the second half, however, as fresh worries about Europe, inflation in China and a dimmed outlook for global growth caused foreign markets to suffer declines that intensified in August and September. October brought with it yet another dramatic swing, as eurozone policymakers appeared near a resolution to the debt debacle and buyers stormed back onto the scene in search of bargains. Still, those gains - along with favorable currency fluctuations overall - weren't enough to offset prior losses, and the MSCI® ACWI® (All Country World Index) ex USA Index finished the period down 4.56%. Within the MSCI index, Europe and emerging markets suffered the biggest declines, with many countries in these areas sustaining steep losses. By contrast, Japan showed resilience in the wake of its natural disasters, falling only 2%. Australia (+4%), Switzerland (+3%), the U.K. (+2%) and Canada, which produced a nominal return, were among the few major benchmark components to break into positive territory.
Comments from Colin Stone, Dale Nicholls and Nicholas Price, Co-Portfolio Managers of Fidelity Advisor® International Small Cap Fund: For the year, the fund's Class A, Class T, Class B and Class C shares returned -4.00%, -4.18%, -4.68% and -4.64%, respectively (excluding sales charges), lagging the -2.39% mark of the MSCI® EAFE® (Europe, Australasia, Far East) Small Cap Index. Positioning in energy and industrials meaningfully detracted. By contrast, our stakes in health care and financials notably contributed. Geographically, our picks in the U.K. and an overweighting in China hurt, while security selection in Europe, Japan and elsewhere in Asia-Pacific helped. The Europe/Middle East/Africa subportfolio had the weakest performance. U.K. energy firm Aurelian Oil & Gas detracted, while Irish biopharmaceutical firm Elan added value. The Asia-Pacific ex Japan subportfolio finished about even with its benchmark's modest loss. Sino Prosper State Gold Resources Holdings detracted, and Singapore-based consumer electronics firm Pertama Holdings helped. The Japanese subportfolio beat its benchmark's roughly 9% gain. Online advertising firm CyberAgent contributed, and electronic components maker Mitsumi Electric - which we sold - hurt. Elan, Sino Prosper and Pertama were not in the index.
Note to shareholders: Nicholas Price became Co-Portfolio Manager on November 1, 2011.
The views expressed above reflect those of the portfolio manager(s) only through the end of the period as stated on the cover of this report and do not necessarily represent the views of Fidelity or any other person in the Fidelity organization. Any such views are subject to change at any time based upon market or other conditions and Fidelity disclaims any responsibility to update such views. These views may not be relied on as investment advice and, because investment decisions for a Fidelity fund are based on numerous factors, may not be relied on as an indication of trading intent on behalf of any Fidelity fund.
Annual Report
Shareholder Expense Example
As a shareholder of the Fund, you incur two types of costs: (1) transaction costs, including sales charges (loads) on purchase payments or redemption proceeds, redemption fees, and (2) ongoing costs, including management fees, distribution and/or service (12b-1) fees and other Fund expenses. This Example is intended to help you understand your ongoing costs (in dollars) of investing in the Fund and to compare these costs with the ongoing costs of investing in other mutual funds.
The Example is based on an investment of $1,000 invested at the beginning of the period and held for the entire period (May 1, 2011 to October 31, 2011).
Actual Expenses
The first line of the accompanying table for each class of the Fund provides information about actual account values and actual expenses. You may use the information in this line, together with the amount you invested, to estimate the expenses that you paid over the period. Simply divide your account value by $1,000.00 (for example, an $8,600 account value divided by $1,000.00 = 8.6), then multiply the result by the number in the first line for a class of the Fund under the heading entitled "Expenses Paid During Period" to estimate the expenses you paid on your account during this period. A small balance maintenance fee of $12.00 that is charged once a year may apply for certain accounts with a value of less than $2,000. This fee is not included in the table below. If it was, the estimate of expenses you paid during the period would be higher, and your ending account value lower, by this amount. In addition, the Fund, as a shareholder in the underlying Fidelity Central Funds, will indirectly bear its pro-rata share of the fees and expenses incurred by the underlying Fidelity Central Funds. These fees and expenses are not included in the Fund's annualized expense ratio used to calculate the expense estimate in the table below.
Hypothetical Example for Comparison Purposes
The second line of the accompanying table for each class of the Fund provides information about hypothetical account values and hypothetical expenses based on a Class' actual expense ratio and an assumed rate of return of 5% per year before expenses, which is not the Class' actual return. The hypothetical account values and expenses may not be used to estimate the actual ending account balance or expenses you paid for the period. You may use this information to compare the ongoing costs of investing in the Fund and other funds. To do so, compare this 5% hypothetical example with the 5% hypothetical examples that appear in the shareholder reports of the other funds. A small balance maintenance fee of $12.00 that is charged once a year may apply for certain accounts with a value of less than $2,000. This fee is not included in the table below. If it was, the estimate of expenses you paid during the period would be higher, and your ending account value lower, by this amount. In addition, the Fund, as a shareholder in the underlying Fidelity Central Funds, will indirectly bear its pro-rata share of the fees and expenses incurred by the underlying Fidelity Central Funds. These fees and expenses are not included in the Fund's annualized expense ratio used to calculate the expense estimate in the table below.
Please note that the expenses shown in the table are meant to highlight your ongoing costs only and do not reflect any transaction costs. Therefore, the second line of the table is useful in comparing ongoing costs only, and will not help you determine the relative total costs of owning different funds. In addition, if these transactional costs were included, your costs would have been higher.
Annual Report
| Annualized Expense Ratio | Beginning
Account Value
May 1, 2011 | Ending
Account Value
October 31, 2011 | Expenses Paid
During Period*
May 1, 2011 to October 31, 2011 |
Class A | 1.55% | | | |
Actual | | $ 1,000.00 | $ 831.30 | $ 7.15 |
HypotheticalA | | $ 1,000.00 | $ 1,017.39 | $ 7.88 |
Class T | 1.81% | | | |
Actual | | $ 1,000.00 | $ 830.40 | $ 8.35 |
HypotheticalA | | $ 1,000.00 | $ 1,016.08 | $ 9.20 |
Class B | 2.30% | | | |
Actual | | $ 1,000.00 | $ 828.30 | $ 10.60 |
HypotheticalA | | $ 1,000.00 | $ 1,013.61 | $ 11.67 |
Class C | 2.27% | | | |
Actual | | $ 1,000.00 | $ 828.30 | $ 10.46 |
HypotheticalA | | $ 1,000.00 | $ 1,013.76 | $ 11.52 |
International Small Cap | 1.25% | | | |
Actual | | $ 1,000.00 | $ 832.50 | $ 5.77 |
HypotheticalA | | $ 1,000.00 | $ 1,018.90 | $ 6.36 |
Institutional Class | 1.21% | | | |
Actual | | $ 1,000.00 | $ 832.90 | $ 5.59 |
HypotheticalA | | $ 1,000.00 | $ 1,019.11 | $ 6.16 |
A 5% return per year before expenses
* Expenses are equal to each Class' annualized expense ratio, multiplied by the average account value over the period, multiplied by 184/365 (to reflect the one-half year period).
Annual Report
Investment Changes (Unaudited)
Geographic Diversification (% of fund's net assets) |
As of October 31, 2011 |
| Japan 27.8% | |
| United Kingdom 18.2% | |
| Germany 8.5% | |
| Australia 7.5% | |
| France 5.1% | |
| Ireland 3.2% | |
| Bermuda 2.9% | |
| Cayman Islands 2.5% | |
| Singapore 2.3% | |
| Other 22.0% | |

Percentages are adjusted for the effect of futures contracts, if applicable. |
As of April 30, 2011 |
| Japan 22.0% | |
| United Kingdom 18.1% | |
| Germany 10.2% | |
| Australia 6.8% | |
| France 6.7% | |
| United States of America 3.7% | |
| Bermuda 3.1% | |
| Cayman Islands 2.6% | |
| Norway 2.4% | |
| Other 24.4% | |

Percentages are adjusted for the effect of futures contracts, if applicable. |
Asset Allocation |
| % of fund's
net assets | % of fund's net assets
6 months ago |
Stocks and Equity Futures | 98.5 | 96.7 |
Bonds | 0.1 | 0.2 |
Short-Term Investments and Net Other Assets | 1.4 | 3.1 |
Top Ten Stocks as of October 31, 2011 |
| % of fund's
net assets | % of fund's net assets
6 months ago |
Pertama Holdings Ltd. (Singapore, Specialty Retail) | 1.3 | 0.7 |
London Mining PLC (United Kingdom, Metals & Mining) | 1.0 | 1.0 |
Paddy Power PLC (Ireland) (Ireland, Hotels, Restaurants & Leisure) | 0.9 | 0.1 |
Kenmare Resources PLC (Ireland, Metals & Mining) | 0.9 | 0.9 |
Elan Corp. PLC (Ireland, Pharmaceuticals) | 0.9 | 0.8 |
Tiger Resources Ltd. (Australia, Metals & Mining) | 0.9 | 0.9 |
Ipsos SA (France, Media) | 0.9 | 0.8 |
Asahi Intecc Co. Ltd. (Japan, Health Care Equipment & Supplies) | 0.9 | 0.6 |
CTS Eventim AG (Germany, Media) | 0.9 | 0.7 |
Lanxess AG (Germany, Chemicals) | 0.9 | 1.0 |
| 9.5 | |
Market Sectors as of October 31, 2011 |
| % of fund's
net assets | % of fund's net assets
6 months ago |
Consumer Discretionary | 21.0 | 17.3 |
Industrials | 17.7 | 18.4 |
Information Technology | 15.0 | 14.9 |
Materials | 13.6 | 13.8 |
Financials | 11.3 | 12.4 |
Health Care | 9.7 | 8.3 |
Energy | 5.7 | 6.6 |
Consumer Staples | 2.7 | 2.3 |
Telecommunication Services | 1.3 | 2.3 |
Utilities | 0.3 | 0.6 |
Annual Report
Investments October 31, 2011
Showing Percentage of Net Assets
Common Stocks - 98.2% |
| Shares | | Value |
Australia - 7.5% |
Atlas Iron Ltd. | 610,639 | | $ 1,980,723 |
Ausgold Ltd. (a)(e) | 1,220,000 | | 1,528,690 |
Austal Ltd. | 848,401 | | 2,017,722 |
Beach Energy Ltd. | 575,255 | | 707,059 |
Blackgold International Holdings Ltd. | 1,950,000 | | 447,192 |
carsales.com Ltd. (e) | 430,178 | | 2,224,021 |
Centamin Egypt Ltd. (United Kingdom) (a) | 2,018,614 | | 3,564,476 |
Dart Energy Ltd. (a) | 3,642,982 | | 2,344,864 |
DUET Group | 917,947 | | 1,599,925 |
Goodman Group unit | 1,506,880 | | 979,326 |
Horizon Oil Ltd. (a) | 2,028,276 | | 504,048 |
Iluka Resources Ltd. | 130,860 | | 2,175,715 |
Imdex Ltd. | 595,564 | | 1,300,593 |
Industrea Ltd. | 870,384 | | 1,167,628 |
Iress Market Technology Ltd. | 140,627 | | 1,120,793 |
Ironbark Zinc Ltd. (a) | 2,305,831 | | 726,992 |
Karoon Gas Australia Ltd. (a) | 160,153 | | 739,131 |
Kingsgate Consolidated NL | 141,376 | | 1,114,722 |
Linc Energy Ltd. | 508,182 | | 1,091,028 |
MAp Group unit | 169,101 | | 603,458 |
Medusa Mining Ltd. | 239,743 | | 1,685,456 |
Mesoblast Ltd. (a)(e) | 252,300 | | 2,145,258 |
Mineral Deposits Ltd. (a) | 445,391 | | 3,009,757 |
Mineral Deposits Ltd. (Canada) (a) | 457,000 | | 2,874,444 |
Mirabela Nickel Ltd. (a) | 795,964 | | 1,368,741 |
Monto Minerals Ltd. (a) | 273,551 | | 5,383 |
Navitas Ltd. | 464,760 | | 2,013,083 |
Northern Iron Ltd. (a) | 423,362 | | 512,891 |
Paladin Energy Ltd. (Australia) (a) | 113,814 | | 173,825 |
Panaust Ltd. (a) | 455,468 | | 1,539,223 |
Ramsay Health Care Ltd. | 119,108 | | 2,341,572 |
realestate.com.au Ltd. | 84,356 | | 1,144,994 |
Red 5 Ltd. (a) | 4,566,367 | | 890,754 |
SAI Global Ltd. | 942,792 | | 4,696,897 |
SEEK Ltd. | 421,927 | | 2,735,662 |
Sino Gas & Energy Ltd. (a) | 8,152,205 | | 364,173 |
SomnoMed Ltd. (a) | 531,849 | | 613,708 |
Tiger Resources Ltd. (a) | 16,688,264 | | 8,106,796 |
TPG Telecom Ltd. | 891,143 | | 1,333,188 |
Troy Resources NL | 314,010 | | 1,334,616 |
Wotif.com Holdings Ltd. (e) | 562,113 | | 2,166,275 |
TOTAL AUSTRALIA | | 68,994,802 |
Common Stocks - continued |
| Shares | | Value |
Bailiwick of Jersey - 1.2% |
Informa PLC | 1,249,285 | | $ 7,280,979 |
LXB Retail Properties PLC (a)(i) | 2,495,000 | | 4,052,584 |
TOTAL BAILIWICK OF JERSEY | | 11,333,563 |
Belgium - 0.7% |
EVS Broadcast Equipment SA | 119,700 | | 6,145,720 |
Bermuda - 2.9% |
Aquarius Platinum Ltd.: | | | |
(Australia) | 465,705 | | 1,366,313 |
(United Kingdom) | 1,502,800 | | 4,495,254 |
Asia Satellite Telecommunications Holdings Ltd. | 271,000 | | 513,613 |
Biosensors International Group Ltd. (a) | 1,769,000 | | 1,971,308 |
China Animal Healthcare Ltd. | 2,129,000 | | 477,140 |
China LotSynergy Holdings Ltd. (a) | 7,324,000 | | 103,084 |
China Singyes Solar Tech Holdings Ltd. | 818,000 | | 447,262 |
China Water Affairs Group Ltd. | 1,134,000 | | 325,718 |
G-Resources Group Ltd. (a) | 15,882,000 | | 957,927 |
Imagi International Holdings Ltd. (a) | 17,664,000 | | 461,374 |
Luk Fook Holdings International Ltd. | 757,000 | | 3,245,563 |
Oakley Capital Investments Ltd. (a) | 1,596,500 | | 3,555,975 |
Petra Diamonds Ltd. (a) | 2,629,100 | | 4,862,336 |
Texwinca Holdings Ltd. | 874,000 | | 1,107,283 |
Vtech Holdings Ltd. | 279,100 | | 2,606,039 |
TOTAL BERMUDA | | 26,496,189 |
British Virgin Islands - 0.6% |
Kalahari Energy (a)(i) | 1,451,000 | | 15 |
Playtech Ltd. (e) | 1,183,846 | | 5,183,262 |
TOTAL BRITISH VIRGIN ISLANDS | | 5,183,277 |
Canada - 0.7% |
AirSea Lines (a)(i) | 1,893,338 | | 26 |
Banro Corp. (a) | 794,600 | | 3,379,750 |
Rock Well Petroleum, Inc. (a)(i) | 770,400 | | 8 |
Starfield Resources, Inc. (a) | 4,328,075 | | 86,835 |
Teranga Gold Corp. (a) | 1,338,099 | | 2,886,004 |
TOTAL CANADA | | 6,352,623 |
Cayman Islands - 2.5% |
AirMedia Group, Inc. ADR (a)(e) | 150,900 | | 410,448 |
Airtac International Group | 135,000 | | 755,605 |
China Automation Group Ltd. | 1,589,000 | | 551,626 |
Common Stocks - continued |
| Shares | | Value |
Cayman Islands - continued |
China Corn Oil Co. Ltd. | 967,000 | | $ 410,222 |
China High Precision Automation Group Ltd. | 712,000 | | 251,117 |
China Lilang Ltd. | 340,000 | | 357,894 |
China Metal International Holdings, Inc. | 2,002,000 | | 356,747 |
China Real Estate Information Corp. ADR (a) | 75,300 | | 448,035 |
China ZhengTong Auto Services Holdings Ltd. | 536,500 | | 580,929 |
CNinsure, Inc. ADR (a)(e) | 31,900 | | 240,845 |
Concord Medical Services Holdings Ltd. ADR | 84,800 | | 310,368 |
Ctrip.com International Ltd. sponsored ADR (a) | 21,900 | | 763,434 |
Daphne International Holdings Ltd. | 662,000 | | 691,631 |
EVA Precision Industrial Holdings Ltd. | 11,604,000 | | 2,996,746 |
Fook Woo Group Holdings Ltd. (a) | 2,055,000 | | 388,301 |
Haitian International Holdings Ltd. | 597,000 | | 530,432 |
Kingdee International Software Group Co. Ltd. | 896,400 | | 363,132 |
KongZhong Corp. sponsored ADR (a) | 46,600 | | 238,592 |
Lee's Pharmaceutical Holdings Ltd. | 595,000 | | 225,337 |
Little Sheep Group Ltd. | 614,000 | | 397,728 |
Marwyn Value Investors II Ltd. (a) | 1,971,700 | | 4,455,098 |
Ming Fai International Holdings Ltd. | 8,719,000 | | 1,269,099 |
Minth Group Ltd. | 574,000 | | 595,563 |
MStar Semiconductor, Inc. | 84,000 | | 486,791 |
Orchid Developments Group Ltd. (a) | 1,180,100 | | 66,424 |
Perfect World Co. Ltd. sponsored ADR Class B (a) | 34,900 | | 454,049 |
Shenguan Holdings Group Ltd. | 3,154,000 | | 1,694,504 |
Sino-Life Group Ltd. (a) | 3,020,000 | | 97,440 |
SouFun Holdings Ltd. ADR (e) | 25,400 | | 324,104 |
VisionChina Media, Inc. ADR (a)(e) | 183,500 | | 330,300 |
VST Holdings Ltd. (a) | 1,858,000 | | 295,617 |
WuXi PharmaTech Cayman, Inc. sponsored ADR (a) | 39,000 | | 484,770 |
Xueda Education Group sponsored ADR | 78,600 | | 260,952 |
Yip's Chemical Holdings Ltd. | 592,000 | | 515,290 |
TOTAL CAYMAN ISLANDS | | 22,599,170 |
China - 0.9% |
51job, Inc. sponsored ADR (a) | 12,800 | | 591,104 |
AMVIG Holdings Ltd. | 764,000 | | 476,697 |
Baidu.com, Inc. sponsored ADR (a) | 9,800 | | 1,373,764 |
Beijing Jingkelong Co. Ltd. (H Shares) | 379,000 | | 370,158 |
China Metal Recycling (Holdings) Ltd. | 436,800 | | 467,680 |
Dalian Port (PDA) Co. Ltd. (H Shares) | 1,786,000 | | 456,603 |
People's Food Holdings Ltd. (a) | 866,000 | | 448,715 |
Royale Furniture Holdings Ltd. | 2,335,074 | | 706,687 |
Common Stocks - continued |
| Shares | | Value |
China - continued |
Sino Prosper State Gold Resources Holdings, Ltd. (a) | 74,950,000 | | $ 1,268,788 |
Weiqiao Textile Co. Ltd. (H Shares) | 2,055,500 | | 1,124,065 |
Zhaojin Mining Industry Co. Ltd. (H Shares) | 117,000 | | 208,890 |
Zhongpin, Inc. (a)(e) | 40,200 | | 371,046 |
Zijin Mining Group Co. Ltd. (H Shares) | 1,008,000 | | 429,035 |
TOTAL CHINA | | 8,293,232 |
Cyprus - 0.8% |
Buried Hill Energy (Cyprus) PCL (a)(i) | 1,947,000 | | 4,867,500 |
Mirland Development Corp. PLC (a) | 822,600 | | 2,516,827 |
TOTAL CYPRUS | | 7,384,327 |
Denmark - 1.3% |
DSV de Sammensluttede Vognmaend A/S | 297,600 | | 6,016,482 |
William Demant Holding A/S (a) | 69,800 | | 5,569,201 |
TOTAL DENMARK | | 11,585,683 |
France - 5.0% |
Altamir Amboise (a) | 584,200 | | 5,408,694 |
ALTEN | 125,000 | | 3,567,002 |
Audika SA | 113,900 | | 2,518,867 |
Axway Software SA (a) | 51,625 | | 1,057,369 |
Devoteam SA (e) | 42,500 | | 736,961 |
Faiveley Transport | 45,935 | | 3,152,091 |
Iliad SA | 41,971 | | 4,912,717 |
Ipsos SA | 243,672 | | 8,002,176 |
LeGuide.com SA (a) | 94,400 | | 1,933,474 |
Maisons France Confort | 93,944 | | 3,367,236 |
Pierre & Vacances | 19,190 | | 753,158 |
Sartorius Stedim Biotech | 57,000 | | 3,865,233 |
Sopra Group SA | 41,300 | | 2,623,418 |
SR Teleperformance SA | 153,600 | | 3,248,024 |
Trigano SA | 23,987 | | 439,344 |
TOTAL FRANCE | | 45,585,764 |
Germany - 8.1% |
Bilfinger Berger AG | 74,327 | | 6,663,344 |
CENTROTEC Sustainable AG | 226,778 | | 4,423,548 |
CTS Eventim AG | 239,026 | | 7,914,105 |
Delticom AG | 49,200 | | 5,501,501 |
GFK AG | 142,601 | | 6,591,341 |
HeidelbergCement AG | 129,066 | | 5,890,704 |
Lanxess AG | 131,385 | | 7,743,871 |
Common Stocks - continued |
| Shares | | Value |
Germany - continued |
MTU Aero Engines Holdings AG | 84,500 | | $ 5,678,585 |
Rational AG | 16,720 | | 3,876,907 |
Rheinmetall AG | 60,500 | | 3,224,286 |
RIB Software AG | 413,200 | | 2,573,796 |
Stroer Out-of-Home Media AG (a) | 194,100 | | 2,847,319 |
Tom Tailor Holding AG (a) | 242,500 | | 3,785,520 |
United Internet AG | 331,665 | | 6,547,509 |
Wirecard AG | 41,362 | | 661,132 |
TOTAL GERMANY | | 73,923,468 |
Hong Kong - 0.7% |
Convenience Retail Asia Ltd. | 700,000 | | 296,043 |
Dah Sing Financial Holdings Ltd. | 172,000 | | 533,943 |
GZI Transport Ltd. | 1,294,000 | | 558,606 |
I.T Ltd. | 1,912,000 | | 1,190,786 |
Magnificent Estates Ltd. | 32,558,000 | | 1,035,192 |
REXCAPITAL Financial Holdings Ltd. | 11,300,000 | | 785,838 |
Techtronic Industries Co. Ltd. | 2,059,500 | | 1,781,948 |
Tian An China Investments Co. Ltd. | 750,000 | | 396,123 |
YGM Trading Ltd. | 115,000 | | 269,918 |
TOTAL HONG KONG | | 6,848,397 |
Iceland - 0.8% |
Ossur hf (a) | 4,510,900 | | 7,131,195 |
India - 0.5% |
Ahluwalia Contracts (India) Ltd. | 230,314 | | 501,916 |
Educomp Solutions Ltd. | 44,518 | | 246,144 |
Financial Technologies India Ltd. | 23,352 | | 349,909 |
Geodesic Ltd. | 256,340 | | 308,497 |
Grasim Industries Ltd. | 9,911 | | 526,336 |
Indian Overseas Bank | 186,286 | | 390,401 |
IndusInd Bank Ltd. | 91,917 | | 560,426 |
PI Industries Ltd. | 54,595 | | 648,096 |
Thangamayil Jewellery Ltd. | 253,192 | | 879,907 |
TOTAL INDIA | | 4,411,632 |
Indonesia - 0.6% |
PT AKR Corporindo Tbk | 1,961,000 | | 663,389 |
PT Clipan Finance Indonesia Tbk | 9,427,900 | | 488,389 |
PT Clipan Finance Indonesia Tbk warrants 10/7/14 (a) | 2,275,700 | | 28,221 |
PT Jasa Marga Tbk | 1,205,000 | | 519,366 |
PT Lippo Karawaci Tbk | 5,564,125 | | 398,922 |
Common Stocks - continued |
| Shares | | Value |
Indonesia - continued |
PT Mayora Indah Tbk | 372,500 | | $ 591,391 |
PT Media Nusantara Citra Tbk | 4,202,500 | | 519,145 |
PT Mitra Adiperkasa Tbk | 2,179,500 | | 1,200,384 |
PT Nippon Indosari Corpindo Tbk | 1,712,000 | | 655,041 |
PT Tower Bersama Infrastructure Tbk | 1,675,500 | | 389,945 |
TOTAL INDONESIA | | 5,454,193 |
Ireland - 3.2% |
Elan Corp. PLC (a) | 530,300 | | 6,289,835 |
Elan Corp. PLC sponsored ADR (a) | 170,600 | | 2,045,494 |
James Hardie Industries NV CDI (a) | 162,432 | | 1,052,159 |
Kenmare Resources PLC (a) | 12,870,600 | | 8,397,381 |
Paddy Power PLC (Ireland) | 158,884 | | 8,795,183 |
Petroceltic International PLC (a) | 24,756,300 | | 2,392,766 |
Petroneft Resources PLC (a) | 1,748,000 | | 737,812 |
TOTAL IRELAND | | 29,710,630 |
Isle of Man - 1.6% |
Bahamas Petroleum Co. PLC (a) | 13,324,710 | | 1,547,159 |
Exillon Energy PLC (a) | 1,163,900 | | 5,615,352 |
IBS Group Holding Ltd. GDR (Reg. S) | 343,200 | | 7,361,795 |
TOTAL ISLE OF MAN | | 14,524,306 |
Israel - 0.1% |
Sarin Technologies Ltd. | 851,000 | | 528,817 |
Italy - 1.7% |
Piaggio & C SpA | 1,031,400 | | 3,425,651 |
Salvatore Ferragamo Italia SpA (a) | 477,800 | | 7,742,973 |
Tod's SpA | 41,626 | | 4,164,930 |
TOTAL ITALY | | 15,333,554 |
Japan - 27.8% |
ABC-Mart, Inc. | 68,700 | | 2,690,765 |
Accordia Golf Co. Ltd. | 2,070 | | 1,524,208 |
Aica Kogyo Co. Ltd. | 92,100 | | 1,246,083 |
Air Water, Inc. | 175,000 | | 2,221,768 |
Arc Land Sakamoto Co. Ltd. | 130,000 | | 2,380,159 |
ARCS Co. Ltd. | 310,500 | | 5,528,920 |
Asahi Diamond Industrial Co. Ltd. | 87,600 | | 1,290,167 |
ASAHI INTECC Co. Ltd. | 313,300 | | 7,950,482 |
ASKUL Corp. | 126,000 | | 1,796,666 |
Avex Group Holdings, Inc. | 181,000 | | 2,141,587 |
Common Stocks - continued |
| Shares | | Value |
Japan - continued |
Calbee, Inc. | 42,100 | | $ 1,919,445 |
Chiba Bank Ltd. | 316,000 | | 1,933,645 |
Chiyoda Corp. | 255,000 | | 2,936,882 |
Chugai Ro Co. Ltd. | 404,000 | | 1,187,568 |
Create SD Holdings Co. Ltd. | 48,200 | | 1,028,684 |
Credit Saison Co. Ltd. | 209,900 | | 4,096,484 |
CyberAgent, Inc. (e) | 2,176 | | 7,334,744 |
Dai-ichi Seiko Co. Ltd. | 22,400 | | 614,408 |
Daido Metal Co. Ltd. | 469,000 | | 4,795,740 |
Daihen Corp. | 256,000 | | 876,882 |
Daikyo, Inc. (a) | 512,000 | | 872,963 |
DeNA Co. Ltd. | 50,100 | | 2,162,672 |
Digital Garage, Inc. (a)(e) | 1,179 | | 3,860,534 |
Don Quijote Co. Ltd. | 98,300 | | 3,601,298 |
Ebara Corp. | 1,324,000 | | 4,836,031 |
EDION Corp. | 91,800 | | 734,605 |
Eiken Chemical Co. Ltd. | 41,000 | | 518,641 |
Exedy Corp. | 131,600 | | 3,813,015 |
Fippon Kayaku Co. Ltd. | 139,000 | | 1,360,157 |
FreeBit Co., Ltd. (e) | 215 | | 571,724 |
Fuji Oil Co. Ltd. | 175,900 | | 2,497,057 |
Fuji Seal International, Inc. | 132,100 | | 2,500,401 |
Furuya Metal Co. Ltd. | 33,400 | | 1,393,134 |
Glory Ltd. | 35,700 | | 764,222 |
Hamamatsu Photonics KK | 40,600 | | 1,544,906 |
Hi-Lex Corp. | 48,500 | | 709,390 |
Horiba Ltd. | 65,300 | | 2,071,698 |
Hulic Co. Ltd. | 299,500 | | 3,206,768 |
Ibiden Co. Ltd. | 116,800 | | 2,579,593 |
Isetan Mitsukoshi Holdings Ltd. | 250,100 | | 2,547,835 |
Iwatsuka Confectionary Co. Ltd. | 11,600 | | 406,140 |
Japan Logistics Fund, Inc. | 117 | | 1,008,436 |
Japan Petroleum Exploration Co. Ltd. | 23,000 | | 908,538 |
JP-Holdings, Inc. (e) | 221,400 | | 1,942,742 |
JSP Corp. | 137,000 | | 2,011,165 |
JTEKT Corp. | 399,000 | | 4,363,695 |
KOMERI Co. Ltd. | 118,800 | | 3,743,376 |
Kuraray Co. Ltd. | 352,600 | | 4,936,614 |
Maeda Corp. | 595,000 | | 2,169,453 |
Makino Milling Machine Co. Ltd. | 242,000 | | 1,606,545 |
Maruwa Ceramic Co. Ltd. | 127,000 | | 5,495,324 |
Melco Holdings, Inc. | 83,700 | | 2,329,189 |
Common Stocks - continued |
| Shares | | Value |
Japan - continued |
Message Co. Ltd. | 1,789 | | $ 5,786,154 |
Misumi Group, Inc. | 167,700 | | 3,489,832 |
Mitsubishi UFJ Lease & Finance Co. Ltd. | 97,330 | | 3,772,101 |
Nabtesco Corp. | 194,000 | | 4,249,457 |
Nihon Kohden Corp. | 90,000 | | 2,101,412 |
Nihon M&A Center, Inc. | 534 | | 3,014,528 |
Nippon Ceramic Co. Ltd. | 88,700 | | 1,614,639 |
Nippon Shinyaku Co. Ltd. | 216,000 | | 2,512,334 |
Nippon Shokubai Co. Ltd. | 424,000 | | 4,325,027 |
Nomura Real Estate Holdings, Inc. | 169,000 | | 2,724,733 |
Nomura Real Estate Residential Fund, Inc. | 426 | | 2,069,511 |
NTT Urban Development Co. | 1,270 | | 874,437 |
OSAKA Titanium technologies Co. Ltd. (e) | 60,200 | | 3,316,210 |
Outsourcing, Inc. (e) | 366,300 | | 1,385,167 |
Pigeon Corp. | 62,800 | | 2,320,527 |
Point, Inc. | 82,570 | | 3,561,874 |
Pola Orbis Holdings, Inc. | 162,300 | | 4,339,997 |
Rinnai Corp. | 42,800 | | 3,197,858 |
Saizeriya Co. Ltd. | 77,600 | | 1,257,790 |
Sanken Electric Co. Ltd. (e) | 1,065,000 | | 3,996,185 |
Sankyu, Inc. | 423,000 | | 1,675,070 |
Santen Pharmaceutical Co. Ltd. | 58,000 | | 2,164,464 |
Sawada Holdings Co. Ltd. (a) | 242,900 | | 1,960,516 |
Sekisui Chemical Co. Ltd. | 574,000 | | 4,504,901 |
Shimadzu Corp. | 272,000 | | 2,315,897 |
Shimamura Co. Ltd. | 40,000 | | 4,000,936 |
Shin-Kobe Electric Machinery Co. Ltd. (e) | 448,000 | | 7,689,356 |
Shinsei Bank Ltd. | 1,522,000 | | 1,673,019 |
SHO-BI Corp. (e) | 183,200 | | 1,099,948 |
SHO-BOND Holdings Co. Ltd. | 111,700 | | 2,492,015 |
So-net M3, Inc. (e) | 1,201 | | 5,432,129 |
Sony Financial Holdings, Inc. | 202,800 | | 3,373,984 |
SRI Sports Ltd. | 66,500 | | 708,305 |
Sumitomo Mitsui Trust Holdings, Inc. | 644,800 | | 2,206,868 |
Sysmex Corp. | 47,800 | | 1,571,390 |
SystemPro Co. Ltd. | 2,036 | | 1,411,697 |
Takata Corp. | 60,200 | | 1,464,305 |
Tera Probe, Inc. | 38,400 | | 553,267 |
The Suruga Bank Ltd. | 308,000 | | 2,567,830 |
Toho Co. Ltd. | 116,400 | | 2,002,433 |
Tokyu Livable, Inc. (e) | 157,200 | | 1,415,516 |
Toshiba Plant Systems & Services Corp. | 249,000 | | 2,662,195 |
Common Stocks - continued |
| Shares | | Value |
Japan - continued |
Toto Ltd. | 529,000 | | $ 4,399,195 |
Tsubakimoto Chain Co. | 404,000 | | 2,073,675 |
Xebio Co. Ltd. | 54,100 | | 1,310,126 |
Yamatake Corp. | 66,700 | | 1,475,835 |
Yamato Kogyo Co. Ltd. | 80,000 | | 2,023,821 |
TOTAL JAPAN | | 254,701,614 |
Korea (South) - 0.5% |
Daou Technology, Inc. | 190,310 | | 1,708,661 |
Duksan Hi-Metal Co. Ltd. (a) | 55,341 | | 1,242,745 |
KC Tech Co. Ltd. | 129,924 | | 595,482 |
Medy-Tox, Inc. | 24,874 | | 453,187 |
TK Corp. (a) | 33,575 | | 619,360 |
TOTAL KOREA (SOUTH) | | 4,619,435 |
Luxembourg - 0.9% |
GlobeOp Financial Services SA | 1,176,485 | | 5,392,266 |
SAF-Holland SA (a)(e) | 420,100 | | 2,608,636 |
TOTAL LUXEMBOURG | | 8,000,902 |
Malaysia - 0.3% |
JobStreet Corp. Bhd | 1,223,100 | | 943,764 |
Lion Industries Corp. Bhd | 722,500 | | 357,160 |
Muhibbah Engineering (M) Bhd | 1,050,100 | | 412,133 |
Top Glove Corp. Bhd | 222,000 | | 308,230 |
WCT Bhd | 560,100 | | 471,811 |
TOTAL MALAYSIA | | 2,493,098 |
Netherlands - 1.1% |
Gemalto NV | 167,770 | | 7,654,873 |
SMARTRAC NV (a) | 24,426 | | 354,933 |
Wavin NV (a) | 296,512 | | 2,203,952 |
TOTAL NETHERLANDS | | 10,213,758 |
Norway - 1.3% |
Aker Solutions ASA | 389,100 | | 4,525,150 |
Schibsted ASA (B Shares) | 214,200 | | 5,605,457 |
Sevan Drilling ASA | 2,350,000 | | 1,890,940 |
Sevan Marine ASA (a)(e) | 2,052,500 | | 103,222 |
TOTAL NORWAY | | 12,124,769 |
Common Stocks - continued |
| Shares | | Value |
Philippines - 0.2% |
Alliance Global Group, Inc. | 3,295,000 | | $ 819,210 |
Belle Corp. (a) | 7,310,000 | | 653,245 |
TOTAL PHILIPPINES | | 1,472,455 |
Poland - 0.6% |
Warsaw Stock Exchange | 424,200 | | 5,988,737 |
Singapore - 2.3% |
CSE Global Ltd. | 1,069,000 | | 711,508 |
First (REIT) | 997,000 | | 629,207 |
Goodpack Ltd. | 1,516,000 | | 2,019,759 |
Hyflux Ltd. | 597,000 | | 677,731 |
OSIM International Ltd. | 1,036,000 | | 1,018,129 |
Pertama Holdings Ltd. (f) | 23,060,000 | | 11,809,703 |
Petra Foods Ltd. | 370,000 | | 481,007 |
Raffles Medical Group Ltd. | 436,205 | | 775,556 |
Sakari Resources Ltd. | 627,000 | | 1,170,802 |
Venture Corp. Ltd. | 259,000 | | 1,380,859 |
Yanlord Land Group Ltd. | 668,000 | | 541,882 |
TOTAL SINGAPORE | | 21,216,143 |
South Africa - 0.3% |
Blue Label Telecoms Ltd. | 3,254,300 | | 2,329,098 |
Sweden - 1.3% |
Elekta AB (B Shares) (e) | 180,000 | | 7,203,258 |
Modern Times Group MTG AB (B Shares) | 87,500 | | 4,641,041 |
TOTAL SWEDEN | | 11,844,299 |
Switzerland - 0.9% |
Leclanche SA (a) | 77,770 | | 1,542,018 |
VZ Holding AG | 57,960 | | 6,604,752 |
TOTAL SWITZERLAND | | 8,146,770 |
Taiwan - 0.2% |
Lung Yen Life Service Co. Ltd. | 121,000 | | 374,623 |
Pacific Hospital Supply Co. Ltd. | 91,000 | | 297,779 |
Tong Hsing Electronics Industries Ltd. | 216,721 | | 549,116 |
Topoint Technology Co. Ltd. | 557,000 | | 397,056 |
WPG Holding Co. Ltd. | 294,000 | | 355,006 |
TOTAL TAIWAN | | 1,973,580 |
Thailand - 0.2% |
TISCO Financial Group PCL | 401,300 | | 445,721 |
Common Stocks - continued |
| Shares | | Value |
Thailand - continued |
Toyo-Thai Corp. PCL | 5,714,500 | | $ 1,729,343 |
Toyo-Thai Corp. PCL NVDR | 168,000 | | 50,949 |
TOTAL THAILAND | | 2,226,013 |
United Kingdom - 18.2% |
African Barrick Gold Ltd. | 660,600 | | 5,736,835 |
Amerisur Resources PLC (a) | 8,152,624 | | 1,671,659 |
Ashmore Group PLC | 1,196,700 | | 6,639,639 |
ASOS PLC (a) | 38,570 | | 965,160 |
Aurelian Oil & Gas PLC (a) | 5,996,200 | | 1,856,295 |
Avanti Communications Group PLC (a)(e) | 494,400 | | 2,466,779 |
Aveva Group PLC | 203,000 | | 5,161,405 |
Bond International Software PLC | 843,266 | | 596,702 |
Borders & Southern Petroleum PLC (a) | 698,500 | | 544,814 |
Bowleven PLC (a)(e) | 450,100 | | 785,378 |
Brammer PLC | 1,380,200 | | 5,923,658 |
Cadogan Petroleum PLC (a) | 1,723,100 | | 1,177,713 |
Central Asia Metals PLC (a) | 1,538,400 | | 1,682,357 |
Ceres Power Holdings PLC (a) | 233,800 | | 59,220 |
China Goldmines PLC (a) | 669,353 | | 232,514 |
Cove Energy PLC (a) | 2,959,800 | | 4,402,954 |
Craneware PLC | 847,300 | | 7,630,716 |
Faroe Petroleum PLC (a) | 480,947 | | 1,237,534 |
GoIndustry-DoveBid PLC (a) | 117,989 | | 92,977 |
ICAP PLC | 897,900 | | 5,835,215 |
IG Group Holdings PLC | 994,884 | | 7,457,472 |
International Personal Finance PLC | 1,431,100 | | 6,310,699 |
Jazztel PLC (a)(e) | 409,000 | | 2,365,943 |
Johnson Matthey PLC | 187,700 | | 5,671,933 |
Jubilee Platinum PLC (a) | 2,985,047 | | 774,089 |
Keronite PLC (a)(i) | 13,620,267 | | 219 |
London Mining PLC (a) | 1,736,500 | | 8,915,501 |
Michael Page International PLC | 970,400 | | 6,270,480 |
Moneysupermarket.com Group PLC | 3,920,400 | | 6,746,122 |
Monitise PLC (a) | 4,772,600 | | 2,916,612 |
Mothercare PLC | 547,400 | | 1,481,593 |
Nautical Petroleum PLC (a) | 435,207 | | 2,071,704 |
NCC Group Ltd. | 239,415 | | 2,552,730 |
Ocado Group PLC (a)(e) | 1,180,900 | | 1,778,529 |
Pureprofile Media PLC (a)(i) | 1,108,572 | | 713,122 |
Regenersis PLC (a) | 1,425,100 | | 1,781,910 |
Robert Walters PLC | 937,800 | | 3,091,748 |
Common Stocks - continued |
| Shares | | Value |
United Kingdom - continued |
Rockhopper Exploration PLC (a) | 1,154,500 | | $ 3,973,267 |
Royalblue Group PLC | 202,542 | | 5,299,595 |
SDL PLC | 495,062 | | 5,246,686 |
Serco Group PLC | 481,786 | | 4,025,129 |
Silverdell PLC (a) | 6,644,400 | | 1,081,909 |
Sinclair Pharma PLC (a) | 4,408,649 | | 1,807,947 |
Sphere Medical Holding PLC (i) | 568,406 | | 1,553,988 |
Sthree PLC | 1,128,809 | | 5,175,565 |
Synergy Health PLC | 299,653 | | 4,016,653 |
Ted Baker PLC | 486,475 | | 6,033,867 |
TMO Renewables Ltd. (i) | 1,000,000 | | 562,870 |
Travis Perkins PLC | 405,400 | | 5,610,153 |
Valiant Petroleum PLC (a) | 437,400 | | 3,427,446 |
Wolfson Microelectronics PLC (a) | 1,756,400 | | 3,304,832 |
Zenergy Power PLC (a) | 855,520 | | 159,942 |
TOTAL UNITED KINGDOM | | 166,879,779 |
United States of America - 0.7% |
ChinaCast Education Corp. (a)(e) | 70,100 | | 281,802 |
CTC Media, Inc. | 192,200 | | 2,212,222 |
KIT Digital, Inc. (a)(e) | 428,400 | | 3,855,600 |
Mudalla Technology, Inc. (a) | 996,527 | | 16 |
XL TechGroup, Inc. (a) | 1,329,250 | | 21 |
YOU On Demand Holdings, Inc. (a) | 6,523,000 | | 455,958 |
TOTAL UNITED STATES OF AMERICA | | 6,805,619 |
TOTAL COMMON STOCKS (Cost $894,072,982) |
898,856,611
|
Convertible Bonds - 0.1% |
| Principal Amount (d) | | |
France - 0.1% |
Pierre Et Vacances La Defense 4% 10/1/15 (h) | EUR | 1,196,800 | | 1,075,042 |
United Kingdom - 0.0% |
Sphere Medical Holding PLC 8% 12/31/12 (i) | GBP | 101,923 | | 163,913 |
TOTAL CONVERTIBLE BONDS (Cost $1,416,277) |
1,238,955
|
Government Obligations - 0.1% |
| Principal Amount (d) | | Value |
Germany - 0.1% |
German Federal Republic 0.1521% to 0.2372% 11/9/11 to 11/23/11 (g)
(Cost $747,359) | EUR | 550,000 | | $ 760,975 |
Money Market Funds - 4.1% |
| Shares | | |
Fidelity Cash Central Fund, 0.12% (b) | 2,652,401 | | 2,652,401 |
Fidelity Securities Lending Cash Central Fund, 0.11% (b)(c) | 34,344,415 | | 34,344,415 |
TOTAL MONEY MARKET FUNDS (Cost $36,996,816) |
36,996,816
|
TOTAL INVESTMENT PORTFOLIO - 102.5% (Cost $933,233,434) | 937,853,357 |
NET OTHER ASSETS (LIABILITIES) - (2.5)% | (22,869,202) |
NET ASSETS - 100% | $ 914,984,155 |
Futures Contracts |
| Expiration Date | | Underlying Face Amount at Value | | Unrealized Appreciation/
(Depreciation) |
Purchased |
Equity Index Contracts |
86 Eurex EURO STOXX 50 Index Contracts (Germany) | Dec. 2011 | | $ 2,842,088 | | $ (113,279) |
|
The face value of futures purchased as a percentage of net assets is 0.3% |
Currency Abbreviations |
EUR | - | European Monetary Unit |
GBP | - | British pound |
Legend |
(a) Non-income producing |
(b) Affiliated fund that is available only to investment companies and other accounts managed by Fidelity Investments. The rate quoted is the annualized seven-day yield of the fund at period end. A complete unaudited listing of the fund's holdings as of its most recent quarter end is available upon request. In addition, each Fidelity Central Fund's financial statements, which are not covered by the Fund's Report of Independent Registered Public Accounting Firm, are available on the SEC's website or upon request. |
(c) Investment made with cash collateral received from securities on loan. |
(d) Principal amount is stated in United States dollars unless otherwise noted. |
(e) Security or a portion of the security is on loan at period end. |
(f) Affiliated company |
(g) Security or a portion of the security was pledged to cover margin requirements for futures contracts. At the period end, the value of securities pledged amounted to $691,784. |
(h) Principal amount shown represents units. |
(i) Restricted securities - Investment in securities not registered under the Securities Act of 1933 (excluding 144A issues). At the end of the period, the value of restricted securities (excluding 144A issues) amounted to $11,914,245 or 1.3% of net assets. |
Additional information on each restricted holding is as follows: |
Security | Acquisition Date | Acquisition Cost |
AirSea Lines | 8/4/06 | $ 1,199,182 |
Buried Hill Energy (Cyprus) PCL | 8/18/06 | $ 2,141,700 |
Kalahari Energy | 9/1/06 | $ 1,813,750 |
Keronite PLC | 8/16/06 | $ 1,548,992 |
LXB Retail Properties PLC | 5/26/11 | $ 4,661,808 |
Pureprofile Media PLC | 5/3/05 - 1/11/06 | $ 1,173,341 |
Rock Well Petroleum, Inc. | 4/13/06 | $ 1,004,171 |
Sphere Medical Holding PLC | 8/27/08 - 8/22/11 | $ 1,697,579 |
Sphere Medical Holding PLC 8% 12/31/12 | 4/21/11 - 10/24/11 | $ 166,822 |
TMO Renewables Ltd. | 10/27/05 | $ 535,065 |
Affiliated Central Funds |
Information regarding fiscal year to date income earned by the Fund from investments in Fidelity Central Funds is as follows: |
Fund | Income earned |
Fidelity Cash Central Fund | $ 63,355 |
Fidelity Securities Lending Cash Central Fund | 916,949 |
Total | $ 980,304 |
Other Affiliated Issuers |
An affiliated company is a company in which the Fund has ownership of at least 5% of the voting securities. Fiscal year to date transactions with companies which are or were affiliates are as follows: |
Affiliate | Value, beginning of period | Purchases | Sales Proceeds | Dividend Income | Value,
end of
period |
Centurion Electronics PLC | $ 12 | $ - | $ 109 | $ - | $ - |
Pertama Holdings Ltd. | 7,080,399 | 1,144,853 | 223,172 | 1,146,797 | 11,809,703 |
Total | $ 7,080,411 | $ 1,144,853 | $ 223,281 | $ 1,146,797 | $ 11,809,703 |
Other Information |
The following is a summary of the inputs used, as of October 31, 2011, involving the Fund's assets and liabilities carried at fair value. The inputs or methodology used for valuing securities may not be an indication of the risk associated with investing in those securities. For more information on valuation inputs, and their aggregation into the levels used in the tables below, please refer to the Security Valuation section in the accompanying Notes to Financial Statements. |
Valuation Inputs at Reporting Date: |
Description | Total | Level 1 | Level 2 | Level 3 |
Investments in Securities: | | | | |
Equities: | | | | |
Japan | $ 254,701,614 | $ - | $ 254,701,614 | $ - |
United Kingdom | 166,879,779 | 163,817,066 | - | 3,062,713 |
Germany | 73,923,468 | 73,923,468 | - | - |
Australia | 68,994,802 | 6,438,920 | 62,555,882 | - |
France | 45,585,764 | 45,585,764 | - | - |
Ireland | 29,710,630 | 22,368,636 | 7,341,994 | - |
Bermuda | 26,496,189 | 12,913,565 | 13,582,624 | - |
Cayman Islands | 22,599,170 | 8,787,419 | 13,560,634 | 251,117 |
Singapore | 21,216,143 | - | 21,216,143 | - |
Cyprus | 7,384,327 | 2,516,827 | - | 4,867,500 |
United States of America | 6,805,619 | 6,805,582 | - | 37 |
Canada | 6,352,623 | 6,352,589 | - | 34 |
British Virgin Islands | 5,183,277 | 5,183,262 | - | 15 |
Other | 163,023,206 | 128,510,723 | 34,512,483 | - |
Corporate Bonds | 1,238,955 | - | 1,075,042 | 163,913 |
Government Obligations | 760,975 | - | 760,975 | - |
Money Market Funds | 36,996,816 | 36,996,816 | - | - |
Total Investments in Securities: | $ 937,853,357 | $ 520,200,637 | $ 409,307,391 | $ 8,345,329 |
Derivative Instruments: | | | | |
Liabilities | | | | |
Futures Contracts | $ (113,279) | $ (113,279) | $ - | $ - |
Transfers from Level 1 to Level 2 during the period were $210,157,354. |
The following is a reconciliation of Investments in Securities for which Level 3 inputs were used in determining value: |
Investments in Securities: | |
Beginning Balance | $ 8,166,674 |
Total Realized Gain (Loss) | (5,310,046) |
Total Unrealized Gain (Loss) | 5,514,712 |
Cost of Purchases | 202,673 |
Proceeds of Sales | (158,598) |
Amortization/Accretion | - |
Transfers in to Level 3 | 453,769 |
Transfers out of Level 3 | (523,855) |
Ending Balance | $ 8,345,329 |
The change in unrealized gain (loss) for the period attributable to Level 3 securities held at October 31, 2011 | $ 205,883 |
The information used in the above reconciliation represents fiscal year to date activity for any Investments in Securities identified as using Level 3 inputs at either the beginning or the end of the current fiscal period. Transfers in or out of Level 3 represent the beginning value of any Security or Instrument where a change in the pricing level occurred from the beginning to the end of the period. The cost of purchases and the proceeds of sales may include securities received or delivered through corporate actions or exchanges. Realized and unrealized gains (losses) disclosed in the reconciliation are included in Net Gain (Loss) on the Fund's Statement of Operations. |
Value of Derivative Instruments |
The following table is a summary of the Fund's value of derivative instruments by risk exposure as of October 31, 2011. For additional information on derivative instruments, please refer to the Derivative Instruments section in the accompanying Notes to Financial Statements. |
Risk Exposure /
Derivative Type | Value |
| Asset | Liability |
Equity Risk | | |
Futures Contracts (a) | $ - | $ (113,279) |
Total Value of Derivatives | $ - | $ (113,279) |
(a) Reflects cumulative appreciation/(depreciation) on futures contracts as disclosed on the Schedule of Investments. Only the period end variation margin is separately disclosed on the Statement of Assets and Liabilities. |
Income Tax Information |
At October 31, 2011, the Fund had a capital loss carryforward of approximately $65,361,612 all of which will expire in fiscal 2017. Capital loss carryforwards are only available to offset future capital gains of the Fund to the extent provided by regulations and may be limited. |
See accompanying notes which are an integral part of the financial statements.
Annual Report
Statement of Assets and Liabilities
| October 31, 2011 |
| | |
Assets | | |
Investment in securities, at value (including securities loaned of $32,083,640) - See accompanying schedule: Unaffiliated issuers (cost $889,824,332) | $ 889,046,838 | |
Fidelity Central Funds (cost $36,996,816) | 36,996,816 | |
Other affiliated issuers (cost $6,412,286) | 11,809,703 | |
Total Investments (cost $933,233,434) | | $ 937,853,357 |
Foreign currency held at value (cost $685,308) | | 675,490 |
Receivable for investments sold | | 16,030,490 |
Receivable for fund shares sold | | 676,296 |
Dividends receivable | | 3,020,183 |
Interest receivable | | 8,399 |
Distributions receivable from Fidelity Central Funds | | 90,125 |
Prepaid expenses | | 4,727 |
Other receivables | | 47,683 |
Total assets | | 958,406,750 |
| | |
Liabilities | | |
Payable to custodian bank | $ 2,590,473 | |
Payable for investments purchased | 694,635 | |
Payable for fund shares redeemed | 4,600,143 | |
Accrued management fee | 724,220 | |
Distribution and service plan fees payable | 19,270 | |
Payable for daily variation margin on futures contracts | 82,870 | |
Other affiliated payables | 249,776 | |
Other payables and accrued expenses | 116,793 | |
Collateral on securities loaned, at value | 34,344,415 | |
Total liabilities | | 43,422,595 |
| | |
Net Assets | | $ 914,984,155 |
Net Assets consist of: | | |
Paid in capital | | $ 981,093,471 |
Undistributed net investment income | | 8,017,124 |
Accumulated undistributed net realized gain (loss) on investments and foreign currency transactions | | (78,629,647) |
Net unrealized appreciation (depreciation) on investments and assets and liabilities in foreign currencies | | 4,503,207 |
Net Assets | | $ 914,984,155 |
See accompanying notes which are an integral part of the financial statements.
Annual Report
Financial Statements - continued
Statement of Assets and Liabilities - continued
| October 31, 2011 |
| | |
Calculation of Maximum Offering Price Class A:
Net Asset Value and redemption price per share ($17,185,173 ÷ 905,703 shares) | | $ 18.97 |
| | |
Maximum offering price per share (100/94.25 of $18.97) | | $ 20.13 |
Class T:
Net Asset Value and redemption price per share ($13,743,891 ÷ 731,123 shares) | | $ 18.80 |
| | |
Maximum offering price per share (100/96.50 of $18.80) | | $ 19.48 |
Class B:
Net Asset Value and offering price per share ($2,067,349 ÷ 112,497 shares)A | | $ 18.38 |
| | |
Class C:
Net Asset Value and offering price per share ($9,544,545 ÷ 519,249 shares)A | | $ 18.38 |
| | |
International Small Cap:
Net Asset Value, offering price and redemption price per share ($856,691,635 ÷ 44,550,818 shares) | | $ 19.23 |
| | |
Institutional Class:
Net Asset Value, offering price and redemption price per share ($15,751,562 ÷ 818,833 shares) | | $ 19.24 |
A Redemption price per share is equal to net asset value less any applicable contingent deferred sales charge.
See accompanying notes which are an integral part of the financial statements.
Annual Report
Statement of Operations
| Year ended October 31, 2011 |
| | |
Investment Income | | |
Dividends (including $1,146,797 earned from other affiliated issuers) | | $ 21,550,414 |
Interest | | 63,975 |
Income from Fidelity Central Funds | | 980,304 |
Income before foreign taxes withheld | | 22,594,693 |
Less foreign taxes withheld | | (1,429,635) |
Total income | | 21,165,058 |
| | |
Expenses | | |
Management fee
Basic fee | $ 8,945,294 | |
Performance adjustment | 442,233 | |
Transfer agent fees | 2,603,163 | |
Distribution and service plan fees | 287,441 | |
Accounting and security lending fees | 491,914 | |
Custodian fees and expenses | 359,301 | |
Independent trustees' compensation | 5,687 | |
Registration fees | 122,881 | |
Audit | 145,078 | |
Legal | 3,942 | |
Miscellaneous | 9,145 | |
Total expenses before reductions | 13,416,079 | |
Expense reductions | (268,142) | 13,147,937 |
Net investment income (loss) | | 8,017,121 |
Realized and Unrealized Gain (Loss) Net realized gain (loss) on: | | |
Investment securities: | | |
Unaffiliated issuers (net of foreign taxes of $21,350) | 37,978,566 | |
Other affiliated issuers | (210,119) | |
Foreign currency transactions | 4,325 | |
Futures contracts | (2,512,331) | |
Total net realized gain (loss) | | 35,260,441 |
Change in net unrealized appreciation (depreciation) on: Investment securities (net of decrease in deferred foreign taxes of $17,178) | (96,611,078) | |
Assets and liabilities in foreign currencies | (53,087) | |
Futures contracts | (166,462) | |
Total change in net unrealized appreciation (depreciation) | | (96,830,627) |
Net gain (loss) | | (61,570,186) |
Net increase (decrease) in net assets resulting from operations | | $ (53,553,065) |
See accompanying notes which are an integral part of the financial statements.
Annual Report
Financial Statements - continued
Statement of Changes in Net Assets
| Year ended
October 31,
2011 | Year ended
October 31,
2010 |
Increase (Decrease) in Net Assets | | |
Operations | | |
Net investment income (loss) | $ 8,017,121 | $ 2,524,061 |
Net realized gain (loss) | 35,260,441 | 45,718,988 |
Change in net unrealized appreciation (depreciation) | (96,830,627) | 97,376,459 |
Net increase (decrease) in net assets resulting
from operations | (53,553,065) | 145,619,508 |
Distributions to shareholders from net investment income | (2,430,566) | (3,368,409) |
Distributions to shareholders from net realized gain | (28,246,937) | (14,323,742) |
Total distributions | (30,677,503) | (17,692,151) |
Share transactions - net increase (decrease) | 129,451,482 | 26,936,768 |
Redemption fees | 283,575 | 118,859 |
Total increase (decrease) in net assets | 45,504,489 | 154,982,984 |
| | |
Net Assets | | |
Beginning of period | 869,479,666 | 714,496,682 |
End of period (including undistributed net investment income of $8,017,124 and undistributed net investment income of $2,441,101, respectively) | $ 914,984,155 | $ 869,479,666 |
See accompanying notes which are an integral part of the financial statements.
Annual Report
Financial Highlights - Class A
Years ended October 31, | 2011 | 2010 | 2009 | 2008 | 2007 |
Selected Per-Share Data | | | | | |
Net asset value, beginning of period | $ 20.42 | $ 17.28 | $ 11.91 | $ 31.14 | $ 28.79 |
Income from Investment Operations | | | | | |
Net investment income (loss) C | .10 | .03 | .06 | - H | .03 |
Net realized and unrealized gain (loss) | (.88) | 3.51 | 5.31 | (14.03) | 7.97 |
Total from investment operations | (.78) | 3.54 | 5.37 | (14.03) | 8.00 |
Distributions from net investment income | (.02) | (.06) | - | (.03) | - |
Distributions from net realized gain | (.66) | (.34) | - | (5.18) | (5.65) |
Total distributions | (.68) | (.40) | - | (5.20) I | (5.65) |
Redemption fees added to paid in capital C | .01 | - H | - H | - H | - H |
Net asset value, end of period | $ 18.97 | $ 20.42 | $ 17.28 | $ 11.91 | $ 31.14 |
Total Return A,B | (4.00)% | 20.85% | 45.09% | (53.35)% | 33.43% |
Ratios to Average Net Assets D,G | | | | | |
Expenses before reductions | 1.56% | 1.71% | 1.75% | 1.82% | 1.53% |
Expenses net of fee waivers, if any | 1.55% | 1.65% | 1.65% | 1.65% | 1.53% |
Expenses net of all reductions | 1.54% | 1.63% | 1.62% | 1.60% | 1.49% |
Net investment income (loss) | .49% | .16% | .41% | -% F | .10% |
Supplemental Data | | | | | |
Net assets, end of period (000 omitted) | $ 17,185 | $ 19,720 | $ 17,590 | $ 13,561 | $ 38,585 |
Portfolio turnover rate E | 47% | 66% | 81% | 113% | 70% |
A Total returns would have been lower if certain expenses had not been reduced during the applicable periods shown.
B Total returns do not include the effect of the sales charges.
C Calculated based on average shares outstanding during the period.
D Fees and expenses of any underlying Fidelity Central Funds are not included in the Fund's expense ratio. The Fund indirectly bears its proportionate share of the expenses of any underlying Fidelity Central Funds.
E Amount does not include the portfolio activity of any underlying Fidelity Central Funds.
F Amount represents less than .01%.
G Expense ratios reflect operating expenses of the class. Expenses before reductions do not reflect amounts reimbursed by the investment adviser or reductions from brokerage service arrangements or reductions from other expense offset arrangements and do not represent the amount paid by the class during periods when reimbursements or reductions occur. Expenses net of fee waivers reflect expenses after reimbursement by the investment adviser but prior to reductions from brokerage service arrangements or other expense offset arrangements. Expenses net of all reductions represent the net expenses paid by the class.
H Amount represents less than $.01 per share.
I Total distributions of $5.20 per share is comprised of distributions from net investment income of $.026 and distributions from net realized gain of $5.176 per share.
See accompanying notes which are an integral part of the financial statements.
Annual Report
Financial Highlights - Class T
Years ended October 31, | 2011 | 2010 | 2009 | 2008 | 2007 |
Selected Per-Share Data | | | | | |
Net asset value, beginning of period | $ 20.23 | $ 17.14 | $ 11.84 | $ 30.96 | $ 28.64 |
Income from Investment Operations | | | | | |
Net investment income (loss) C | .05 | (.02) | .02 | (.05) | (.04) |
Net realized and unrealized gain (loss) | (.86) | 3.47 | 5.28 | (13.95) | 7.93 |
Total from investment operations | (.81) | 3.45 | 5.30 | (14.00) | 7.89 |
Distributions from net investment income | - | (.02) | - | - | - |
Distributions from net realized gain | (.63) | (.34) | - | (5.12) | (5.57) |
Total distributions | (.63) | (.36) | - | (5.12) | (5.57) |
Redemption fees added to paid in capital C | .01 | - G | - G | - G | - G |
Net asset value, end of period | $ 18.80 | $ 20.23 | $ 17.14 | $ 11.84 | $ 30.96 |
Total Return A,B | (4.18)% | 20.46% | 44.76% | (53.46)% | 33.07% |
Ratios to Average Net Assets D,F | | | | | |
Expenses before reductions | 1.82% | 1.97% | 2.00% | 2.07% | 1.77% |
Expenses net of fee waivers, if any | 1.81% | 1.90% | 1.90% | 1.90% | 1.77% |
Expenses net of all reductions | 1.79% | 1.88% | 1.86% | 1.86% | 1.73% |
Net investment income (loss) | .24% | (.09)% | .16% | (.25)% | (.14)% |
Supplemental Data | | | | | |
Net assets, end of period (000 omitted) | $ 13,744 | $ 16,092 | $ 15,760 | $ 13,493 | $ 40,823 |
Portfolio turnover rate E | 47% | 66% | 81% | 113% | 70% |
A Total returns would have been lower if certain expenses had not been reduced during the applicable periods shown.
B Total returns do not include the effect of the sales charges.
C Calculated based on average shares outstanding during the period.
D Fees and expenses of any underlying Fidelity Central Funds are not included in the Fund's expense ratio. The Fund indirectly bears its proportionate share of the expenses of any underlying Fidelity Central Funds.
E Amount does not include the portfolio activity of any underlying Fidelity Central Funds.
F Expense ratios reflect operating expenses of the class. Expenses before reductions do not reflect amounts reimbursed by the investment adviser or reductions from brokerage service arrangements or reductions from other expense offset arrangements and do not represent the amount paid by the class during periods when reimbursements or reductions occur. Expenses net of fee waivers reflect expenses after reimbursement by the investment adviser but prior to reductions from brokerage service arrangements or other expense offset arrangements. Expenses net of all reductions represent the net expenses paid by the class.
G Amount represents less than $.01 per share.
See accompanying notes which are an integral part of the financial statements.
Annual Report
Financial Highlights - Class B
Years ended October 31, | 2011 | 2010 | 2009 | 2008 | 2007 |
Selected Per-Share Data | | | | | |
Net asset value, beginning of period | $ 19.79 | $ 16.78 | $ 11.65 | $ 30.49 | $ 28.26 |
Income from Investment Operations | | | | | |
Net investment income (loss) C | (.05) | (.10) | (.04) | (.16) | (.18) |
Net realized and unrealized gain (loss) | (.85) | 3.39 | 5.17 | (13.73) | 7.82 |
Total from investment operations | (.90) | 3.29 | 5.13 | (13.89) | 7.64 |
Distributions from net realized gain | (.52) | (.28) | - | (4.95) | (5.41) |
Redemption fees added to paid in capital C | .01 | - G | - G | - G | - G |
Net asset value, end of period | $ 18.38 | $ 19.79 | $ 16.78 | $ 11.65 | $ 30.49 |
Total Return A,B | (4.68)% | 19.90% | 44.03% | (53.68)% | 32.38% |
Ratios to Average Net Assets D,F | | | | | |
Expenses before reductions | 2.32% | 2.47% | 2.49% | 2.58% | 2.30% |
Expenses net of fee waivers, if any | 2.30% | 2.40% | 2.40% | 2.40% | 2.30% |
Expenses net of all reductions | 2.29% | 2.38% | 2.36% | 2.36% | 2.26% |
Net investment income (loss) | (.26)% | (.59)% | (.33)% | (.75)% | (.66)% |
Supplemental Data | | | | | |
Net assets, end of period (000 omitted) | $ 2,067 | $ 3,457 | $ 3,601 | $ 3,230 | $ 10,704 |
Portfolio turnover rate E | 47% | 66% | 81% | 113% | 70% |
A Total returns would have been lower if certain expenses had not been reduced during the applicable periods shown.
B Total returns do not include the effect of the contingent deferred sales charge.
C Calculated based on average shares outstanding during the period.
D Fees and expenses of any underlying Fidelity Central Funds are not included in the Fund's expense ratio. The Fund indirectly bears its proportionate share of the expenses of any underlying Fidelity Central Funds.
E Amount does not include the portfolio activity of any underlying Fidelity Central Funds.
F Expense ratios reflect operating expenses of the class. Expenses before reductions do not reflect amounts reimbursed by the investment adviser or reductions from brokerage service arrangements or reductions from other expense offset arrangements and do not represent the amount paid by the class during periods when reimbursements or reductions occur. Expenses net of fee waivers reflect expenses after reimbursement by the investment adviser but prior to reductions from brokerage service arrangements or other expense offset arrangements. Expenses net of all reductions represent the net expenses paid by the class.
G Amount represents less than $.01 per share.
See accompanying notes which are an integral part of the financial statements.
Annual Report
Financial Highlights - Class C
Years ended October 31, | 2011 | 2010 | 2009 | 2008 | 2007 |
Selected Per-Share Data | | | | | |
Net asset value, beginning of period | $ 19.85 | $ 16.85 | $ 11.70 | $ 30.62 | $ 28.33 |
Income from Investment Operations | | | | | |
Net investment income (loss) C | (.04) | (.10) | (.04) | (.16) | (.17) |
Net realized and unrealized gain (loss) | (.85) | 3.40 | 5.19 | (13.78) | 7.85 |
Total from investment operations | (.89) | 3.30 | 5.15 | (13.94) | 7.68 |
Distributions from net realized gain | (.59) | (.30) | - | (4.98) | (5.39) |
Redemption fees added to paid in capital C | .01 | - G | - G | - G | - G |
Net asset value, end of period | $ 18.38 | $ 19.85 | $ 16.85 | $ 11.70 | $ 30.62 |
Total Return A,B | (4.64)% | 19.86% | 44.02% | (53.67)% | 32.39% |
Ratios to Average Net Assets D,F | | | | | |
Expenses before reductions | 2.27% | 2.42% | 2.49% | 2.57% | 2.26% |
Expenses net of fee waivers, if any | 2.26% | 2.40% | 2.40% | 2.40% | 2.26% |
Expenses net of all reductions | 2.24% | 2.37% | 2.36% | 2.36% | 2.22% |
Net investment income (loss) | (.21)% | (.59)% | (.33)% | (.76)% | (.62)% |
Supplemental Data | | | | | |
Net assets, end of period (000 omitted) | $ 9,545 | $ 13,501 | $ 5,814 | $ 5,658 | $ 20,094 |
Portfolio turnover rate E | 47% | 66% | 81% | 113% | 70% |
A Total returns would have been lower if certain expenses had not been reduced during the applicable periods shown.
B Total returns do not include the effect of the contingent deferred sales charge.
C Calculated based on average shares outstanding during the period.
D Fees and expenses of any underlying Fidelity Central Funds are not included in the Fund's expense ratio. The Fund indirectly bears its proportionate share of the expenses of any underlying Fidelity Central Funds.
E Amount does not include the portfolio activity of any underlying Fidelity Central Funds.
F Expense ratios reflect operating expenses of the class. Expenses before reductions do not reflect amounts reimbursed by the investment adviser or reductions from brokerage service arrangements or reductions from other expense offset arrangements and do not represent the amount paid by the class during periods when reimbursements or reductions occur. Expenses net of fee waivers reflect expenses after reimbursement by the investment adviser but prior to reductions from brokerage service arrangements or other expense offset arrangements. Expenses net of all reductions represent the net expenses paid by the class.
G Amount represents less than $.01 per share.
See accompanying notes which are an integral part of the financial statements.
Annual Report
Financial Highlights - International Small Cap
Years ended October 31, | 2011 | 2010 | 2009 | 2008 | 2007 |
Selected Per-Share Data | | | | | |
Net asset value, beginning of period | $ 20.66 | $ 17.48 | $ 12.03 | $ 31.44 | $ 29.03 |
Income from Investment Operations | | | | | |
Net investment income (loss) B | .17 | .07 | .08 | .03 | .12 |
Net realized and unrealized gain (loss) | (.89) | 3.53 | 5.37 | (14.14) | 8.03 |
Total from investment operations | (.72) | 3.60 | 5.45 | (14.11) | 8.15 |
Distributions from net investment income | (.06) | (.08) | - | (.12) | (.07) |
Distributions from net realized gain | (.66) | (.34) | - | (5.18) | (5.67) |
Total distributions | (.72) | (.42) | - | (5.30) | (5.74) |
Redemption fees added to paid in capital B | .01 | - F | - F | - F | - F |
Net asset value, end of period | $ 19.23 | $ 20.66 | $ 17.48 | $ 12.03 | $ 31.44 |
Total Return A | (3.65)% | 21.02% | 45.30% | (53.25)% | 33.82% |
Ratios to Average Net Assets C,E | | | | | |
Expenses before reductions | 1.26% | 1.44% | 1.48% | 1.49% | 1.19% |
Expenses net of fee waivers, if any | 1.25% | 1.44% | 1.48% | 1.49% | 1.19% |
Expenses net of all reductions | 1.23% | 1.42% | 1.44% | 1.44% | 1.15% |
Net investment income (loss) | .80% | .37% | .58% | .16% | .45% |
Supplemental Data | | | | | |
Net assets, end of period (000 omitted) | $ 856,692 | $ 808,478 | $ 669,035 | $ 536,291 | $ 1,663,761 |
Portfolio turnover rate D | 47% | 66% | 81% | 113% | 70% |
A Total returns would have been lower if certain expenses had not been reduced during the applicable periods shown.
B Calculated based on average shares outstanding during the period.
C Fees and expenses of any underlying Fidelity Central Funds are not included in the Fund's expense ratio. The Fund indirectly bears its proportionate share of the expenses of any underlying Fidelity Central Funds.
D Amount does not include the portfolio activity of any underlying Fidelity Central Funds.
E Expense ratios reflect operating expenses of the class. Expenses before reductions do not reflect amounts reimbursed by the investment adviser or reductions from brokerage service arrangements or reductions from other expense offset arrangements and do not represent the amount paid by the class during periods when reimbursements or reductions occur. Expenses net of fee waivers reflect expenses after reimbursement by the investment adviser but prior to reductions from brokerage service arrangements or other expense offset arrangements. Expenses net of all reductions represent the net expenses paid by the class.
F Amount represents less than $.01 per share.
See accompanying notes which are an integral part of the financial statements.
Annual Report
Financial Highlights - Institutional Class
Years ended October 31, | 2011 | 2010 | 2009 | 2008 | 2007 |
Selected Per-Share Data | | | | | |
Net asset value, beginning of period | $ 20.66 | $ 17.47 | $ 12.01 | $ 31.38 | $ 28.99 |
Income from Investment Operations | | | | | |
Net investment income (loss) B | .18 | .09 | .09 | .05 | .12 |
Net realized and unrealized gain (loss) | (.89) | 3.53 | 5.37 | (14.12) | 8.02 |
Total from investment operations | (.71) | 3.62 | 5.46 | (14.07) | 8.14 |
Distributions from net investment income | (.06) | (.09) | - | (.12) | (.07) |
Distributions from net realized gain | (.66) | (.34) | - | (5.18) | (5.68) |
Total distributions | (.72) | (.43) | - | (5.30) | (5.75) |
Redemption fees added to paid in capital B | .01 | - F | - F | - F | - F |
Net asset value, end of period | $ 19.24 | $ 20.66 | $ 17.47 | $ 12.01 | $ 31.38 |
Total Return A | (3.62)% | 21.15% | 45.46% | (53.22)% | 33.84% |
Ratios to Average Net Assets C,E | | | | | |
Expenses before reductions | 1.22% | 1.34% | 1.45% | 1.49% | 1.18% |
Expenses net of fee waivers, if any | 1.21% | 1.34% | 1.40% | 1.40% | 1.18% |
Expenses net of all reductions | 1.19% | 1.31% | 1.37% | 1.35% | 1.14% |
Net investment income (loss) | .84% | .47% | .66% | .25% | .45% |
Supplemental Data | | | | | |
Net assets, end of period (000 omitted) | $ 15,752 | $ 8,231 | $ 2,696 | $ 2,217 | $ 7,774 |
Portfolio turnover rate D | 47% | 66% | 81% | 113% | 70% |
A Total returns would have been lower if certain expenses had not been reduced during the applicable periods shown.
B Calculated based on average shares outstanding during the period.
C Fees and expenses of any underlying Fidelity Central Funds are not included in the Fund's expense ratio. The Fund indirectly bears its proportionate share of the expenses of any underlying Fidelity Central Funds.
D Amount does not include the portfolio activity of any underlying Fidelity Central Funds.
E Expense ratios reflect operating expenses of the class. Expenses before reductions do not reflect amounts reimbursed by the investment adviser or reductions from brokerage service arrangements or reductions from other expense offset arrangements and do not represent the amount paid by the class during periods when reimbursements or reductions occur. Expenses net of fee waivers reflect expenses after reimbursement by the investment adviser but prior to reductions from brokerage service arrangements or other expense offset arrangements. Expenses net of all reductions represent the net expenses paid by the class.
F Amount represents less than $.01 per share.
See accompanying notes which are an integral part of the financial statements.
Annual Report
Notes to Financial Statements
For the period ended October 31, 2011
1. Organization.
Fidelity International Small Cap Fund (the Fund) is a fund of Fidelity Investment Trust (the Trust) and is authorized to issue an unlimited number of shares. The Trust is registered under the Investment Company Act of 1940, as amended (the 1940 Act), as an open-end management investment company organized as a Massachusetts business trust. The Fund offers Class A, Class T, Class C, International Small Cap and Institutional Class shares each of which, along with Class B shares, has equal rights as to assets and voting privileges. Effective after the close of business on September 1, 2010, Class B shares were closed to new accounts and additional purchases, except for exchanges and reinvestments by existing shareholders. Each class has exclusive voting rights with respect to matters that affect that class. Class B shares will automatically convert to Class A shares after a holding period of seven years from the initial date of purchase. Investment income, realized and unrealized capital gains and losses, the common expenses of the Fund, and certain fund-level expense reductions, if any, are allocated on a pro-rata basis to each class based on the relative net assets of each class to the total net assets of the Fund. Each class differs with respect to transfer agent and distribution and service plan fees incurred. Certain expense reductions may also differ by class. The Fund's investments in emerging markets can be subject to social, economic, regulatory and political uncertainties and can be extremely volatile.
2. Investments in Fidelity Central Funds.
The Fund invests in Fidelity Central Funds, which are open-end investment companies available only to other investment companies and accounts managed by Fidelity Management & Research Company (FMR) and its affiliates. The Fund's Schedule of Investments lists each of the Fidelity Central Funds held as of period end, if any, as an investment of the Fund, but does not include the underlying holdings of each Fidelity Central Fund. As an Investing Fund, the Fund indirectly bears its proportionate share of the expenses of the underlying Fidelity Central Funds.
The Money Market Central Funds seek preservation of capital and current income and are managed by Fidelity Investments Money Management, Inc. (FIMM), an affiliate of FMR.
A complete unaudited list of holdings for each Fidelity Central Fund is available upon request or at the Securities and Exchange Commission (the SEC) web site at www.sec.gov. In addition, the financial statements of the Fidelity Central Funds, which are not covered by the Fund's Report of Independent Registered Public Accounting Firm, are available on the SEC web site or upon request.
Annual Report
Notes to Financial Statements - continued
3. Significant Accounting Policies.
The financial statements have been prepared in conformity with accounting principles generally accepted in the United States of America (GAAP), which require management to make certain estimates and assumptions at the date of the financial statements. Actual results could differ from those estimates. Subsequent events, if any, through the date that the financial statements were issued have been evaluated in the preparation of the financial statements. The following summarizes the significant accounting policies of the Fund:
Security Valuation. Investments are valued as of 4:00 p.m. Eastern time on the last calendar day of the period. The Fund uses independent pricing services approved by the Board of Trustees to value its investments. When current market prices or quotations are not readily available or reliable, valuations may be determined in good faith in accordance with procedures adopted by the Board of Trustees. Factors used in determining value may include market or security specific events, changes in interest rates and credit quality. The frequency with which these procedures are used cannot be predicted and they may be utilized to a significant extent. The value used for net asset value (NAV) calculation under these procedures may differ from published prices for the same securities.
The Fund categorizes the inputs to valuation techniques used to value its investments into a disclosure hierarchy consisting of three levels as shown below:
Level 1 - quoted prices in active markets for identical investments
Level 2 - other significant observable inputs (including quoted prices for similar investments, interest rates, prepayment speeds, etc.)
Level 3 - unobservable inputs (including the Fund's own assumptions based on the best information available)
Changes in valuation techniques may result in transfers in or out of an assigned level within the disclosure hierarchy. The aggregate value of investments by input level, as of October 31, 2011, as well as a roll forward of Level 3 securities, is included at the end of the Fund's Schedule of Investments. Valuation techniques used to value the Fund's investments by major category are as follows:
Equity securities, including restricted securities, for which market quotations are readily available, are valued at the last reported sale price or official closing price as reported by an independent pricing service on the primary market or exchange on which they are traded and are categorized as Level 1 in the hierarchy. In the event there were no sales during the day or closing prices are not available, securities are valued at the last quoted bid price or may be valued using the last available price and are generally categorized as
Annual Report
3. Significant Accounting Policies - continued
Security Valuation - continued
Level 2 in the hierarchy. For foreign equity securities, when significant market or security specific events arise, comparisons to the valuation of American Depositary Receipts (ADRs) futures contracts, Exchange-traded funds (ETFs) and certain indexes as well as quoted prices for similar securities are used and are categorized as Level 2 in the hierarchy in these circumstances. Utilizing these techniques may result in transfers between Level 1 and Level 2. For restricted equity securities and private placements where observable inputs are limited, assumptions about market activity and risk are used and are categorized as Level 3 in the hierarchy.
Debt securities, including restricted securities, are valued based on evaluated prices received from independent pricing services or from dealers who make markets in such securities. For corporate bonds and foreign government and government agency obligations, pricing services utilize matrix pricing which considers yield or price of bonds of comparable quality, coupon, maturity and type as well as dealer supplied prices and are generally categorized as Level 2 in the hierarchy. When independent prices are unavailable or unreliable, debt securities may be valued utilizing pricing matrices which consider similar factors that would be used by independent pricing services. These are generally categorized as Level 2 in the hierarchy but may be Level 3 depending on the circumstances.
Futures contracts are valued at the settlement price established each day by the board of trade or exchange on which they are traded and are categorized as Level 1 in the hierarchy. Investments in open-end mutual funds, including the Fidelity Central Funds, are valued at their closing net asset value each business day and are categorized as Level 1 in the hierarchy.
Foreign Currency. The Fund may use foreign currency contracts to facilitate transactions in foreign-denominated securities. Gains and losses from these transactions may arise from changes in the value of the foreign currency or if the counterparties do not perform under the contracts' terms.
Foreign-denominated assets, including investment securities, and liabilities are translated into U.S. dollars at the exchange rate at period end. Purchases and sales of investment securities, income and dividends received and expenses denominated in foreign currencies are translated into U.S. dollars at the exchange rate in effect on the transaction date.
The effects of exchange rate fluctuations on investments are included with the net realized and unrealized gain (loss) on investment securities. Other foreign currency transactions resulting in realized and unrealized gain (loss) are disclosed separately.
Annual Report
Notes to Financial Statements - continued
3. Significant Accounting Policies - continued
Investment Transactions and Income. For financial reporting purposes, the Fund's investment holdings and NAV include trades executed through the end of the last business day of the period. The NAV per share for processing shareholder transactions is calculated as of the close of business of the New York Stock Exchange (NYSE), normally 4:00 p.m. Eastern time and includes trades executed through the end of the prior business day. Gains and losses on securities sold are determined on the basis of identified cost. Dividend income is recorded on the ex-dividend date, except for certain dividends from foreign securities where the ex-dividend date may have passed, which are recorded as soon as the Fund is informed of the ex-dividend date. Non-cash dividends included in dividend income, if any, are recorded at the fair market value of the securities received. Distributions received on securities that represent a return of capital or capital gain are recorded as a reduction of cost of investments and/or as a realized gain. The Fund estimates the components of distributions received that may be considered return of capital distributions or capital gain distributions. Interest income and distributions from the Fidelity Central Funds are accrued as earned. Interest income includes coupon interest and amortization of premium and accretion of discount on debt securities. Investment income is recorded net of foreign taxes withheld where recovery of such taxes is uncertain.
Expenses. Expenses directly attributable to a fund are charged to that fund. Expenses attributable to more than one fund are allocated among the respective funds on the basis of relative net assets or other appropriate methods. Expense estimates are accrued in the period to which they relate and adjustments are made when actual amounts are known.
Income Tax Information and Distributions to Shareholders. Each year, the Fund intends to qualify as a regulated investment company, including distributing substantially all of its taxable income and realized gains under Subchapter M of the Internal Revenue Code and filing its U.S. federal tax return. As a result, no provision for income taxes is required. As of October 31, 2011, the Fund did not have any unrecognized tax benefits in the financial statements. A fund's federal tax return is subject to examination by the Internal Revenue Service (IRS) for a period of three years. Foreign taxes are provided for based on the Fund's understanding of the tax rules and rates that exist in the foreign markets in which it invests.
Distributions are declared and recorded on the ex-dividend date. Income dividends and capital gain distributions are declared separately for each class. Income and capital gain distributions are determined in accordance with income tax regulations, which may differ from GAAP.
Capital accounts within the financial statements are adjusted for permanent book-tax differences. These adjustments have no impact on net assets or the results of operations. Temporary book-tax differences will reverse in a subsequent period.
Annual Report
3. Significant Accounting Policies - continued
Income Tax Information and Distributions to Shareholders - continued
Book-tax differences are primarily due to futures transactions, foreign currency transactions, certain foreign taxes, passive foreign investment companies (PFIC), market discount, capital loss carryforwards and losses deferred due to wash sales.
The federal tax cost of investment securities and unrealized appreciation (depreciation) as of period end were as follows:
Gross unrealized appreciation | $ 149,880,839 |
Gross unrealized depreciation | (171,005,789) |
Net unrealized appreciation (depreciation) on securities and other investments | $ (21,124,950) |
| |
Tax Cost | $ 958,978,307 |
The tax-based components of distributable earnings as of period end were as follows:
Undistributed ordinary income | $ 20,493,962 |
Capital loss carryforward | $ (65,361,612) |
Net unrealized appreciation (depreciation) | $ (21,244,105) |
Under the recently enacted Regulated Investment Company Modernization Act of 2010 (the Act), the Fund will be permitted to carry forward capital losses incurred in taxable years beginning after December 22, 2010 for an unlimited period. However, any losses incurred during those future taxable years will be required to be utilized prior to any losses incurred in pre-enactment taxable years, which generally expire after eight years from when they are incurred. Additionally, post-enactment capital losses that are carried forward will retain their character as either short-term or long-term capital losses rather than being considered all short-term as under previous law. The Fund's first fiscal year end subject to the Act will be October 31, 2012.
The tax character of distributions paid was as follows:
| October 31, 2011 | October 31, 2010 |
Ordinary Income | $ 30,677,503 | $ 17,692,151 |
Short-Term Trading (Redemption) Fees. Shares held by investors in the Fund less than 90 days are subject to a redemption fee equal to 2.00% of the net asset value of shares redeemed. All redemption fees, which reduce the proceeds of the shareholder redemption, are retained by the Fund and accounted for as an addition to paid in capital.
Annual Report
Notes to Financial Statements - continued
3. Significant Accounting Policies - continued
New Accounting Pronouncement. In May 2011, the Financial Accounting Standards Board issued Accounting Standard Update No. 2011-04, Fair Value Measurement (Topic 820) - Amendments to Achieve Common Fair Value Measurement and Disclosure Requirements in U.S. GAAP and IFRSs. The update changes the wording used to describe the requirements in GAAP for measuring fair value and for disclosing information about fair value measurements. The update is effective during interim and annual periods beginning after December 15, 2011. Management is currently evaluating the impact of the update's adoption on the Funds' financial statement disclosures.
4. Operating Policies.
Restricted Securities. The Fund may invest in securities that are subject to legal or contractual restrictions on resale. These securities generally may be resold in transactions exempt from registration or to the public if the securities are registered. Disposal of these securities may involve time-consuming negotiations and expense, and prompt sale at an acceptable price may be difficult. Information regarding restricted securities is included at the end of the Fund's Schedule of Investments.
5. Derivative Instruments.
Risk Exposures and the Use of Derivative Instruments. The Fund used derivative instruments (derivatives), including futures contracts, in order to meet its investment objectives. The strategy is to use derivatives to increase returns and to manage exposure to certain risks as defined below. The success of any strategy involving derivatives depends on analysis of numerous economic factors, and if the strategies for investment do not work as intended, the Fund may not achieve its objectives.
The Fund's use of derivatives increased or decreased its exposure to the following risk:
Equity Risk | Equity risk relates to the fluctuations in the value of financial instruments as a result of changes in market prices (other than those arising from interest rate risk or foreign exchange risk), whether caused by factors specific to an individual investment, its issuer, or all factors affecting all instruments traded in a market or market segment |
The Fund is also exposed to additional risks from investing in derivatives, such as liquidity risk and counterparty credit risk. Liquidity risk is the risk that the Fund will be unable to sell the derivative in the open market in a timely manner. Counterparty credit risk is the risk that the counterparty will not be able to fulfill its obligation to the Fund. The Fund's maximum risk of loss from counterparty credit risk is generally the aggregate unrealized appreciation and unpaid counterparty payments in excess of any collateral pledged by the counterparty to the Fund. Counterparty risk related to exchange-traded futures contracts is minimal because of the protection provided by the exchange on which they trade. Derivatives involve, to varying degrees, risk of loss in excess of the amounts recognized in the Statement of Assets and Liabilities.
Annual Report
5. Derivative Instruments - continued
Futures Contracts. A futures contract is an agreement between two parties to buy or sell a specified underlying instrument for a fixed price at a specified future date. The Fund used futures contracts to manage its exposure to the stock market.
Upon entering into a futures contract, a fund is required to deposit either cash or securities (initial margin) with a clearing broker in an amount equal to a certain percentage of the face value of the contract. Futures contracts are marked-to-market daily and subsequent payments (variation margin) are made or received by a fund depending on the daily fluctuations in the value of the futures contracts and are recorded as unrealized appreciation or (depreciation). This receivable and/or payable is included in daily variation margin on futures contracts in the Statement of Assets and Liabilities. Realized gain or (loss) is recorded upon the expiration or closing of a futures contract.
The underlying face amount at value of open futures contracts at period end, is shown in the Schedule of Investments under the caption "Futures Contracts." This amount reflects each contract's exposure to the underlying instrument at period end and is representative of activity for the period. Securities deposited to meet initial margin requirements are identified in the Schedule of Investments.
Certain risks arise upon entering into futures contracts, including the risk that an illiquid market limits the ability to close out a futures contract prior to settlement date.
During the period, the Fund recognized net realized gain (loss) of $(2,512,331) and a change in net unrealized appreciation (depreciation) of $(166,462) related to its investment in futures contracts. These amounts are included in the Statement of Operations.
6. Purchases and Sales of Investments.
Purchases and sales of securities, other than short-term securities, aggregated $610,178,106 and $471,939,072, respectively.
7. Fees and Other Transactions with Affiliates.
Management Fee. FMR and its affiliates provide the Fund with investment management related services for which the Fund pays a monthly management fee. The management fee is the sum of an individual fund fee rate that is based on an annual rate of .60% of the Fund's average net assets and a group fee rate that averaged .26% during the period. The group fee rate is based upon the average net assets of all the mutual funds advised by FMR. The group fee rate decreases as assets under management increase and increases as assets under management decrease. In addition, the management fee is subject to a performance adjustment (up to a maximum of ± .20% of the Fund's average net assets over a 36 month performance period). The upward or downward adjustment to the management fee is based on the relative investment performance of International
Annual Report
Notes to Financial Statements - continued
7. Fees and Other Transactions with Affiliates - continued
Management Fee - continued
Small Cap as compared to an appropriate benchmark index. For the period, the total annual management fee rate, including the performance adjustment, was .90% of the Fund's average net assets.
Distribution and Service Plan Fees. In accordance with Rule 12b-1 of the 1940 Act, the Fund has adopted separate Distribution and Service Plans for each class of shares. Certain classes pay Fidelity Distributors Corporation (FDC), an affiliate of FMR, separate Distribution and Service Fees, each of which is based on an annual percentage of each class' average net assets. In addition, FDC may pay financial intermediaries for selling shares of the Fund and providing shareholder support services. For the period, the Distribution and Service Fee rates, total fees and amounts retained by FDC were as follows:
| Distribution
Fee | Service
Fee | Total
Fees | Retained
by FDC |
Class A | -% | .25% | $ 51,630 | $ 463 |
Class T | .25% | .25% | 80,842 | 106 |
Class B | .75% | .25% | 28,921 | 21,741 |
Class C | .75% | .25% | 126,048 | 9,890 |
| | | $ 287,441 | $ 32,200 |
Sales Load. FDC may receive a front-end sales charge of up to 5.75% for selling Class A shares and 3.50% for selling Class T shares, some of which is paid to financial intermediaries for selling shares of the Fund. Depending on the holding period, FDC may receive contingent deferred sales charges levied on Class A, Class T, Class B, and Class C redemptions. The deferred sales charges range from 5% to 1% for Class B, 1% for Class C, 1.00% for certain purchases of Class A shares and .25% for certain purchases of Class T shares.
For the period, sales charge amounts retained by FDC were as follows:
| Retained
by FDC |
Class A | $ 8,134 |
Class T | 1,971 |
Class B* | 3,356 |
Class C* | 712 |
| $ 14,173 |
* When Class B and Class C shares are initially sold, FDC pays commissions from its own resources to financial intermediaries through which the sales are made.
Annual Report
7. Fees and Other Transactions with Affiliates - continued
Transfer Agent Fees. Fidelity Investments Institutional Operations Company, Inc. (FIIOC), an affiliate of FMR, is the transfer, dividend disbursing and shareholder servicing agent for each class of the Fund. FIIOC receives account fees and asset-based fees that vary according to the account size and type of account of the shareholders of the respective classes of the Fund. FIIOC pays for typesetting, printing and mailing of shareholder reports, except proxy statements. For the period, transfer agent fees for each class were as follows:
| Amount | % of
Average
Net Assets |
Class A | $ 62,531 | .30 |
Class T | 49,403 | .31 |
Class B | 8,779 | .30 |
Class C | 32,009 | .25 |
International Small Cap | 2,420,969 | .25 |
Institutional Class | 29,472 | .21 |
| $ 2,603,163 | |
Accounting and Security Lending Fees. Fidelity Service Company, Inc. (FSC), an affiliate of FMR, maintains the Fund's accounting records. The accounting fee is based on the level of average net assets for the month. Under a separate contract, FSC administers the security lending program. The security lending fee is based on the number and duration of lending transactions.
Brokerage Commissions. The Fund placed a portion of its portfolio transactions with brokerage firms which are affiliates of the investment adviser. The commissions paid to these affiliated firms were $215 for the period.
8. Committed Line of Credit.
The Fund participates with other funds managed by FMR or an affiliate in a $4.0 billion credit facility (the "line of credit") to be utilized for temporary or emergency purposes to fund shareholder redemptions or for other short-term liquidity purposes. The Fund has agreed to pay commitment fees on its pro-rata portion of the line of credit, which amounted to $3,143 and is reflected in Miscellaneous expenses on the Statement of Operations. During the period, there were no borrowings on this line of credit.
Annual Report
Notes to Financial Statements - continued
9. Security Lending.
The Fund lends portfolio securities through a lending agent from time to time in order to earn additional income. For equity securities, a lending agent is used and may loan securities to certain qualified borrowers, including Fidelity Capital Markets (FCM), a broker-dealer affiliated with the Fund. On the settlement date of the loan, the Fund receives collateral (in the form of U.S. Treasury obligations, letters of credit and/or cash) against the loaned securities and maintains collateral in an amount not less than 100% of the market value of the loaned securities during the period of the loan. The market value of the loaned securities is determined at the close of business of the Fund and any additional required collateral is delivered to the Fund on the next business day. If the borrower defaults on its obligation to return the securities loaned because of insolvency or other reasons, a fund could experience delays and costs in recovering the securities loaned or in gaining access to the collateral. Any cash collateral received is invested in the Fidelity Securities Lending Cash Central Fund. The value of loaned securities and cash collateral at period end are disclosed on the Fund's Statement of Assets and Liabilities. The value of securities loaned to FCM at period end was $432,000. Security lending income represents the income earned on investing cash collateral, less rebates paid to borrowers and any lending agent fees associated with the loan, plus any premium payments received for lending certain types of securities. Security lending income is presented in the Statement of Operations as a component of income from Fidelity Central Funds. Total security lending income during the period amounted to $916,949, including $2,558 from securities loaned to FCM.
10. Expense Reductions.
FMR voluntarily agreed to reimburse a portion of its management fee. For the period, the amount of this reimbursement was $108,473.
Many of the brokers with whom FMR places trades on behalf of the Fund provided services to the Fund in addition to trade execution. These services included payments of certain expenses on behalf of the Fund totaling $159,669 for the period.
11. Distributions to Shareholders.
Distributions to shareholders of each class were as follows:
Years ended October 31, | 2011 | 2010 |
From net investment income | | |
Class A | $ 15,709 | $ 59,453 |
Class T | - | 16,412 |
International Small Cap | 2,403,692 | 3,278,578 |
Institutional Class | 11,165 | 13,966 |
Total | $ 2,430,566 | $ 3,368,409 |
Annual Report
11. Distributions to Shareholders - continued
Years ended October 31, | 2011 | 2010 |
From net realized gain | | |
Class A | $ 648,961 | $ 354,632 |
Class T | 496,268 | 310,013 |
Class B | 87,007 | 60,241 |
Class C | 402,241 | 116,929 |
International Small Cap | 26,480,677 | 13,430,315 |
Institutional Class | 131,783 | 51,612 |
Total | $ 28,246,937 | $ 14,323,742 |
12. Share Transactions.
Transactions for each class of shares were as follows:
| Shares | Dollars |
Years ended October 31, | 2011 | 2010 | 2011 | 2010 |
Class A | | | | |
Shares sold | 472,219 | 380,659 | $ 10,051,889 | $ 6,723,746 |
Reinvestment of distributions | 30,361 | 22,435 | 616,326 | 393,061 |
Shares redeemed | (562,759) | (454,943) | (11,902,630) | (8,359,905) |
Net increase (decrease) | (60,179) | (51,849) | $ (1,234,415) | $ (1,243,098) |
Class T | | | | |
Shares sold | 237,757 | 143,286 | $ 5,055,416 | $ 2,532,790 |
Reinvestment of distributions | 24,155 | 18,371 | 486,714 | 319,658 |
Shares redeemed | (326,059) | (286,001) | (6,629,520) | (4,986,007) |
Net increase (decrease) | (64,147) | (124,344) | $ (1,087,390) | $ (2,133,559) |
Class B | | | | |
Shares sold | 21,873 | 14,694 | $ 464,854 | $ 256,700 |
Reinvestment of distributions | 4,142 | 3,302 | 81,975 | 56,465 |
Shares redeemed | (88,228) | (57,958) | (1,778,852) | (990,211) |
Net increase (decrease) | (62,213) | (39,962) | $ (1,232,023) | $ (677,046) |
Class C | | | | |
Shares sold | 128,685 | 430,838 | $ 2,661,361 | $ 7,671,593 |
Reinvestment of distributions | 19,105 | 6,001 | 378,079 | 102,910 |
Shares redeemed | (308,659) | (101,847) | (6,253,765) | (1,759,170) |
Net increase (decrease) | (160,869) | 334,992 | $ (3,214,325) | $ 6,015,333 |
International Small Cap | | | | |
Shares sold | 17,502,789 | 10,330,000 | $ 375,309,666 | $ 188,548,758 |
Reinvestment of distributions | 1,321,812 | 888,440 | 27,110,370 | 15,725,385 |
Shares redeemed | (13,398,001) | (10,371,667) | (275,580,654) | (183,663,034) |
Net increase (decrease) | 5,426,600 | 846,773 | $ 126,839,382 | $ 20,611,109 |
Institutional Class | | | | |
Shares sold | 798,910 | 288,839 | $ 17,190,303 | $ 5,178,797 |
Reinvestment of distributions | 5,609 | 2,890 | 115,044 | 51,087 |
Shares redeemed | (384,085) | (47,677) | (7,925,094) | (865,855) |
Net increase (decrease) | 420,434 | 244,052 | $ 9,380,253 | $ 4,364,029 |
Annual Report
Notes to Financial Statements - continued
13. Other.
The Fund's organizational documents provide former and current trustees and officers with a limited indemnification against liabilities arising in connection with the performance of their duties to the Fund. In the normal course of business, the Fund may also enter into contracts that provide general indemnifications. The Fund's maximum exposure under these arrangements is unknown as this would be dependent on future claims that may be made against the Fund. The risk of material loss from such claims is considered remote.
At the end of the period, FMR or its affiliates were the owners of record of 13% of the total outstanding shares of the Fund.
Annual Report
To the Trustees of Fidelity Investment Trust and Shareholders of Fidelity International Small Cap Fund:
We have audited the accompanying statement of assets and liabilities of Fidelity International Small Cap Fund (the Fund), a fund of Fidelity Investment Trust, including the schedule of investments, as of October 31, 2011, and the related statement of operations for the year then ended, the statement of changes in net assets for each of the two years in the period then ended, and the financial highlights for each of the five years in the period then ended. These financial statements and financial highlights are the responsibility of the Fund's management. Our responsibility is to express an opinion on these financial statements and financial highlights based on our audits.
We conducted our audits in accordance with the standards of the Public Company Accounting Oversight Board (United States). Those standards require that we plan and perform the audit to obtain reasonable assurance about whether the financial statements and financial highlights are free of material misstatement. The Fund is not required to have, nor were we engaged to perform, an audit of its internal control over financial reporting. Our audits included consideration of internal control over financial reporting as a basis for designing audit procedures that are appropriate in the circumstances, but not for the purpose of expressing an opinion on the effectiveness of the Fund's internal control over financial reporting. Accordingly, we express no such opinion. An audit also includes examining, on a test basis, evidence supporting the amounts and disclosures in the financial statements, assessing the accounting principles used and significant estimates made by management, as well as evaluating the overall financial statement presentation. Our procedures included confirmation of securities owned as of October 31, 2011, by correspondence with the custodians and brokers; where replies were not received from brokers, we performed other auditing procedures. We believe that our audits provide a reasonable basis for our opinion.
In our opinion, the financial statements and financial highlights referred to above present fairly, in all material respects, the financial position of Fidelity International Small Cap Fund as of October 31, 2011, the results of its operations for the year then ended, the changes in the net assets for each of the two years in the period then ended, and the financial highlights for each of the five years in the period then ended, in conformity with accounting principles generally accepted in the United States of America.
DELOITTE & TOUCHE LLP
Boston, Massachusetts
December 12, 2011
Annual Report
The Trustees, Members of the Advisory Board, and executive officers of the trust and fund, as applicable, are listed below. The Board of Trustees governs the fund and is responsible for protecting the interests of shareholders. The Trustees are experienced executives who meet periodically throughout the year to oversee the fund's activities, review contractual arrangements with companies that provide services to the fund, oversee management of the risks associated with such activities and contractual arrangements, and review the fund's performance. Except for James C. Curvey, each of the Trustees oversees 226 funds advised by FMR or an affiliate. Mr. Curvey oversees 429 funds advised by FMR or an affiliate.
The Trustees hold office without limit in time except that (a) any Trustee may resign; (b) any Trustee may be removed by written instrument, signed by at least two-thirds of the number of Trustees prior to such removal; (c) any Trustee who requests to be retired or who has become incapacitated by illness or injury may be retired by written instrument signed by a majority of the other Trustees; and (d) any Trustee may be removed at any special meeting of shareholders by a two-thirds vote of the outstanding voting securities of the trust. Each Trustee who is not an interested person (as defined in the 1940 Act) (Independent Trustee), shall retire not later than the last day of the calendar year in which his or her 75th birthday occurs. The Independent Trustees may waive this mandatory retirement age policy with respect to individual Trustees. The executive officers and Advisory Board Members hold office without limit in time, except that any officer and Advisory Board Member may resign or may be removed by a vote of a majority of the Trustees at any regular meeting or any special meeting of the Trustees. Except as indicated, each individual has held the office shown or other offices in the same company for the past five years.
Experience, Skills, Attributes, and Qualifications of the Fund's Trustees. The Governance and Nominating Committee has adopted a statement of policy that describes the experience, qualifications, attributes, and skills that are necessary and desirable for potential Independent Trustee candidates (Statement of Policy). The Board believes that each Trustee satisfied at the time he or she was initially elected or appointed a Trustee, and continues to satisfy, the standards contemplated by the Statement of Policy. The Governance and Nominating Committee also engages professional search firms to help identify potential Independent Trustee candidates who have the experience, qualifications, attributes, and skills consistent with the Statement of Policy. From time to time, additional criteria based on the composition and skills of the current Independent Trustees, as well as experience or skills that may be appropriate in light of future changes to board composition, business conditions, and regulatory or other developments, have also been considered by the professional search firms and the Governance and Nominating Committee. In addition, the Board takes into account the Trustees' commitment and participation in Board and committee meetings, as well as their leadership of standing and ad hoc committees throughout their tenure.
In determining that a particular Trustee was and continues to be qualified to serve as a Trustee, the Board has considered a variety of criteria, none of which, in isolation, was controlling. The Board believes that, collectively, the Trustees have balanced and diverse experience, qualifications, attributes, and skills, which allow the Board to operate effectively in governing the fund and protecting the interests of shareholders. Information about the specific experience, skills, attributes, and qualifications of each Trustee, which in each case led to the Board's conclusion that the Trustee should serve (or continue to serve) as a trustee of the fund, is provided below.
Annual Report
Board Structure and Oversight Function. James C. Curvey is an interested person (as defined in the 1940 Act) and currently serves as Acting Chairman. The Trustees have determined that an interested Chairman is appropriate and benefits shareholders because an interested Chairman has a personal and professional stake in the quality and continuity of services provided to the fund. Independent Trustees exercise their informed business judgment to appoint an individual of their choosing to serve as Chairman, regardless of whether the Trustee happens to be independent or a member of management. The Independent Trustees have determined that they can act independently and effectively without having an Independent Trustee serve as Chairman and that a key structural component for assuring that they are in a position to do so is for the Independent Trustees to constitute a substantial majority for the Board. The Independent Trustees also regularly meet in executive session. Ned C. Lautenbach serves as Chairman of the Independent Trustees and as such (i) acts as a liaison between the Independent Trustees and management with respect to matters important to the Independent Trustees and (ii) with management prepares agendas for Board meetings.
Fidelity funds are overseen by different Boards of Trustees. The fund's Board oversees Fidelity's equity and high income funds and another Board oversees Fidelity's investment-grade bond, money market, and asset allocation funds. The asset allocation funds may invest in Fidelity funds overseen by the fund's Board. The use of separate Boards, each with its own committee structure, allows the Trustees of each group of Fidelity funds to focus on the unique issues of the funds they oversee, including common research, investment, and operational issues. On occasion, the separate Boards establish joint committees to address issues of overlapping consequences for the Fidelity funds overseen by each Board.
The Trustees operate using a system of committees to facilitate the timely and efficient consideration of all matters of importance to the Trustees, the fund, and fund shareholders and to facilitate compliance with legal and regulatory requirements and oversight of the fund's activities and associated risks. The Board, acting through its committees, has charged FMR and its affiliates with (i) identifying events or circumstances the occurrence of which could have demonstrably adverse effects on the fund's business and/or reputation; (ii) implementing processes and controls to lessen the possibility that such events or circumstances occur or to mitigate the effects of such events or circumstances if they do occur; and (iii) creating and maintaining a system designed to evaluate continuously business and market conditions in order to facilitate the identification and implementation processes described in (i) and (ii) above. Because the day-to-day operations and activities of the fund are carried out by or through FMR, its affiliates and other service providers, the fund's exposure to risks is mitigated but not eliminated by the processes overseen by the Trustees. While each of the Board's committees has responsibility for overseeing different aspects of the fund's activities, oversight is exercised primarily through the Operations, Audit, and Compliance Committees. In addition, the Independent Trustees have worked with FMR to enhance the Board's oversight of investment and financial risks, legal and regulatory risks, technology risks, and operational risks, including the development of additional risk reporting to the Board. For example, a working group comprised of Independent Trustees and FMR has worked and continues to work to review the Fidelity funds' valuation-related activities, reporting and risk management. Appropriate personnel, including but not limited to the fund's Chief Compliance Officer (CCO), FMR's internal auditor, the independent accountants, the fund's Treasurer and portfolio management personnel, make periodic reports to the Board's committees, as appropriate, including an annual review of FMR's risk management program for the Fidelity funds. The responsibilities of each standing committee, including their oversight responsibilities, are described further under "Standing Committees of the Fund's Trustees."
Annual Report
Trustees and Officers - continued
The fund's Statement of Additional Information (SAI) includes more information about the Trustees. To request a free copy, call Fidelity at 1-877-208-0098.
Interested Trustees*:
Correspondence intended for each Trustee who is an interested person may be sent to Fidelity Investments, 82 Devonshire Street, Boston, Massachusetts 02109.
Name, Age; Principal Occupations and Other Relevant Experience+ |
James C. Curvey (76) |
| Year of Election or Appointment: 2007 Mr. Curvey is Trustee and Acting Chairman of the Board of Trustees of certain Trusts. Mr. Curvey also serves as Trustee (2007-present) of other investment companies advised by FMR. Mr. Curvey is a Director of Fidelity Investments Money Management, Inc. (2009-present), Director of Fidelity Research & Analysis Co. (2009-present) and Director of FMR and FMR Co., Inc. (2007-present). Mr. Curvey is also Vice Chairman (2007-present) and Director of FMR LLC. In addition, Mr. Curvey serves as an Overseer for the Boston Symphony Orchestra and a member of the Trustees of Villanova University. Previously, Mr. Curvey was the Vice Chairman (2006-2007) and Director (2000-2007) of FMR Corp. |
Ronald P. O'Hanley (54) |
| Year of Election or Appointment: 2011 Mr. O'Hanley is Director of FMR Co., Inc. (2010-present), Director of Fidelity Investments Money Management, Inc. (2010-present), Director of Fidelity Research & Analysis Company (2010-present), President of Fidelity Asset Management and Corporate Services and a member of Fidelity's Executive Committee (2010-present). Previously, Mr. O'Hanley served as President and Chief Executive Officer of BNY Mellon Asset Management (2007-2010). Mr. O'Hanley also served as Vice Chairman of Bank New York Mellon Corp. and a member of that firm's Executive Committee. Prior to the 2007 merger of The Bank of New York and Mellon Financial Corporation, he was Vice Chairman of Mellon Financial Corporation and President and Chief Executive Officer of Mellon Asset Management. He joined Mellon in February 1997. Mr. O'Hanley currently serves as Chairman of the Boston Public Library Foundation Board of Directors and sits on the Board of Directors of Beth Israel Deaconess Medical Center, the Board of Trustees of the Marine Biological Laboratory and the Advisory Board of the Maxwell School of Citizenship and Public Administration at Syracuse University. Mr. O'Hanley also chairs the Council on Asset Management for the Financial Services Roundtable and is a member of the Board of Directors of Institutional Investor's U.S. Institute. |
* Trustees have been determined to be "Interested Trustees" by virtue of, among other things, their affiliation with the trust or various entities under common control with FMR.
+ The information above includes each Trustee's principal occupation during the last five years and other information relating to the experience, attributes, and skills relevant to each Trustee's qualifications to serve as a Trustee, which led to the conclusion that each Trustee should serve as a Trustee for the fund.
Annual Report
Trustees and Officers - continued
Independent Trustees:
Correspondence intended for each Independent Trustee (that is, the Trustees other than the Interested Trustees) may be sent to Fidelity Investments, P.O. Box 55235, Boston, Massachusetts 02205-5235.
Name, Age; Principal Occupations and Other Relevant Experience+ |
Dennis J. Dirks (63) |
| Year of Election or Appointment: 2005 Prior to his retirement in May 2003, Mr. Dirks was Chief Operating Officer and a member of the Board of The Depository Trust & Clearing Corporation (DTCC). He also served as President, Chief Operating Officer, and Board member of The Depository Trust Company (DTC) and President and Board member of the National Securities Clearing Corporation (NSCC). In addition, Mr. Dirks served as Chief Executive Officer and Board member of the Government Securities Clearing Corporation, Chief Executive Officer and Board member of the Mortgage-Backed Securities Clearing Corporation, as a Trustee and a member of the Finance Committee of Manhattan College (2005-2008), and as a Trustee and a member of the Finance Committee of AHRC of Nassau County (2006-2008). Mr. Dirks is a member of the Independent Directors Council (IDC) Governing Council (2010-Present) and Board of Directors for The Brookville Center for Children's Services, Inc. (2009-present). |
Alan J. Lacy (58) |
| Year of Election or Appointment: 2008 Mr. Lacy serves as Senior Adviser (2007-present) of Oak Hill Capital Partners, L.P. (private equity). Mr. Lacy also served as Chief Executive Officer (2000-2005) and Vice Chairman (2005-2006) of Sears Holdings Corporation and Sears, Roebuck and Co. (retail). In addition, Mr. Lacy serves as a member of the Board of Directors of Dave & Buster's, Inc. (restaurant and entertainment complexes, 2010-present), The Hillman Companies, Inc. (hardware wholesalers, 2010-present), and Bristol-Myers Squibb Company (global pharmaceuticals, 2007-present). Mr. Lacy is a member of the Board of Trustees of The National Parks Conservation Association (2006-Present). Previously, Mr. Lacy served as Chairman of the Board of Trustees of the National Parks Conservation Association (2008-2011) and as a member of the Board of Directors for the Western Union Company (global money transfer, 2006-2011). |
Ned C. Lautenbach (67) |
| Year of Election or Appointment: 2000 Mr. Lautenbach is Chairman of the Independent Trustees of the Equity and High Income Funds (2006-present). Mr. Lautenbach currently serves as the Lead Director of the Eaton Corporation Board of Directors (diversified industrial, 1997-present). Mr. Lautenbach is also a member of the Board of Directors of the Philharmonic Center for the Arts in Naples, Florida (1999-present); a member of the Board of Trustees of Fairfield University (2005-present); and a member of the Council on Foreign Relations (1994-present). Previously, Mr. Lautenbach was a Partner/Advisory Partner at Clayton, Dubilier & Rice, LLC (private equity investment, 1998-2010), as well as a Director of Sony Corporation (2006-2007). |
Joseph Mauriello (67) |
| Year of Election or Appointment: 2008 Prior to his retirement in January 2006, Mr. Mauriello served in numerous senior management positions including Deputy Chairman and Chief Operating Officer (2004-2005), and Vice Chairman of Financial Services (2002-2004) of KPMG LLP US (professional services, 1965-2005). Mr. Mauriello currently serves as a member of the Board of Directors of XL Group plc. (global insurance and re-insurance, 2006-present) and of Arcadia Resources Inc. (health care services and products, 2007-present). Previously, Mr. Mauriello served as a Director of the Hamilton Funds of the Bank of New York (2006-2007). |
Robert W. Selander (61) |
| Year of Election or Appointment: 2011 Previously, Mr. Selander served as a Member of the Advisory Board of Fidelity's Equity and High Income Funds (2011), Executive Vice Chairman (2010), Chief Executive Officer (2009-2010), and President and Chief Executive Officer (1997-2009) of Mastercard, Inc. |
Cornelia M. Small (67) |
| Year of Election or Appointment: 2005 Ms. Small is a member of the Board of Directors of the Teagle Foundation (2009-present). Ms. Small is also a member of the Investment Committee, and Chair (2008-present) and a member of the Board of Trustees of Smith College. In addition, Ms. Small serves on the Investment Committee of the Berkshire Taconic Community Foundation (2008-present). Previously, Ms. Small served as Chairperson of the Investment Committee (2002-2008) of Smith College. In addition, Ms. Small served as Chief Investment Officer, Director of Global Equity Investments, and a member of the Board of Directors of Scudder, Stevens & Clark and Scudder Kemper Investments. |
William S. Stavropoulos (72) |
| Year of Election or Appointment: 2001 Mr. Stavropoulos is Vice Chairman of the Independent Trustees of the Equity and High Income Funds (2006-present). Mr. Stavropoulos serves as President and Founder of the Michigan Baseball Foundation, the Great Lakes Loons (2007-present). Mr. Stavropoulos is Chairman Emeritus of the Board of Directors of The Dow Chemical Company, where he previously served in numerous senior management positions, including President, CEO (1995-2000; 2002-2004), Chairman of the Executive Committee (2000-2006), and as a member of the Board of Directors (1990-2006). Currently, Mr. Stavropoulos is Chairman of Univar (global distributor of commodity and specialty chemicals, 2010-present), a Director of Teradata Corporation (data warehousing and technology solutions, 2008-present), Chemical Financial Corporation, Maersk Inc. (industrial conglomerate), Tyco International, Inc. (multinational manufacturing and services, 2007-present), and a member of the Advisory Board for Metalmark Capital (private equity investment, 2005-present). Mr. Stavropoulos is a special advisor to Clayton, Dubilier & Rice, LLC (private equity investment). In addition, Mr. Stavropoulos is a member of the University of Notre Dame Advisory Council for the College of Science. |
David M. Thomas (62) |
| Year of Election or Appointment: 2008 Previously, Mr. Thomas served as Executive Chairman (2005-2006) and Chairman and Chief Executive Officer (2000-2005) of IMS Health, Inc. (pharmaceutical and healthcare information solutions). In addition, Mr. Thomas serves as a member of the Board of Directors of Fortune Brands, Inc. (consumer products), and Interpublic Group of Companies, Inc. (marketing communication, 2004-present). |
Michael E. Wiley (61) |
| Year of Election or Appointment: 2008 Mr. Wiley also serves as a Director of Asia Pacific Exploration Consolidated (international oil and gas exploration and production, 2008-present). Mr. Wiley serves as a Director of Tesoro Corporation (independent oil refiner and marketer, 2005-present), and a Director of Bill Barrett Corporation (exploration and production, 2005-present). In addition, Mr. Wiley also serves as a Director of Post Oak Bank (privately-held bank, 2004-present). Previously, Mr. Wiley served as a member of the Board of Trustees of the University of Tulsa (2000-2006; 2007-2010), as a Senior Energy Advisor of Katzenbach Partners, LLC (consulting, 2006-2007), as an Advisory Director of Riverstone Holdings (private investment), Chairman, President, and CEO of Baker Hughes, Inc. (oilfield services, 2000-2004), and as Director of Spinnaker Exploration Company (exploration and production, 2001-2005). |
Annual Report
+ The information above includes each Trustee's principal occupation during the last five years and other information relating to the experience, attributes, and skills relevant to each Trustee's qualifications to serve as a Trustee, which led to the conclusion that each Trustee should serve as a Trustee for the fund.
Advisory Board Members and Executive Officers:
Correspondence intended for each executive officer, Edward C. Johnson 3d, and Peter S. Lynch may be sent to Fidelity Investments, 82 Devonshire Street, Boston, Massachusetts 02109.
Name, Age; Principal Occupation |
Edward C. Johnson 3d (81) |
| Year of Election or Appointment: 2011 Member of the Advisory Board of Fidelity's Equity and High Income Funds. Mr. Johnson serves as Chief Executive Officer, Chairman, and a Director of FMR LLC, and also serves as Chairman and Director of FIL Limited. Previously, Mr. Johnson served as a Trustee and Chairman of the Board of certain Fidelity Trusts, Chairman and a Director of FMR, Chairman and a Director of FMR Co., Inc., and President of FMR LLC (2006-2007). |
Peter S. Lynch (67) |
| Year of Election or Appointment: 2003 Member of the Advisory Board of Fidelity's Equity and High Income Funds. Mr. Lynch is Vice Chairman and a Director of FMR and FMR Co., Inc. In addition, Mr. Lynch serves as a Trustee of Boston College and as the Chairman of the Inner-City Scholarship Fund. Previously, Mr. Lynch served on the Special Olympics International Board of Directors (1997-2006). |
Kenneth B. Robins (42) |
| Year of Election or Appointment: 2008 President and Treasurer of Fidelity's Equity and High Income Funds. Mr. Robins also serves as President and Treasurer (2010-present) and Assistant Treasurer (2009-present) of other Fidelity funds and is an employee of Fidelity Investments (2004-present). Previously, Mr. Robins served as Deputy Treasurer of the Fidelity funds (2005-2008) and Treasurer and Chief Financial Officer of The North Carolina Capital Management Trust: Cash and Term Portfolios (2006-2008). |
Brian B. Hogan (47) |
| Year of Election or Appointment: 2009 Vice President of Equity and High Income Funds. Mr. Hogan also serves as President of FMR's Equity Division (2009-present). Previously, Mr. Hogan served as Senior Vice President, Equity Research of FMR (2006-2009) and as a portfolio manager. |
Thomas C. Hense (47) |
| Year of Election or Appointment: 2008 or 2010 Vice President of Fidelity's High Income (2008), Small Cap (2008), and Value (2010) Funds. Previously, Mr. Hense served as a portfolio manager for Fidelity's Institutional Money Management Group (Pyramis) (2003-2008). |
Scott C. Goebel (43) |
| Year of Election or Appointment: 2008 Secretary and Chief Legal Officer (CLO) of the Fidelity funds. Mr. Goebel also serves as Secretary of Fidelity Investments Money Management, Inc. (FIMM) (2010-present) and Fidelity Research and Analysis Company (FRAC) (2010-present); Secretary and CLO of The North Carolina Capital Management Trust: Cash and Term Portfolios (2008-present); General Counsel, Secretary, and Senior Vice President of FMR (2008-present) and FMR Co., Inc. (2008-present); employed by FMR LLC or an affiliate (2001-present); Chief Legal Officer of Fidelity Management & Research (Hong Kong) Limited (2008-present) and Assistant Secretary of Fidelity Management & Research (Japan) Inc. (2008-present), and Fidelity Management & Research (U.K.) Inc. (2008-present). Previously, Mr. Goebel served as Assistant Secretary of FIMM (2008-2010), FRAC (2008-2010), and the Funds (2007-2008) and as Vice President and Secretary of Fidelity Distributors Corporation (FDC) (2005-2007). |
William C. Coffey (42) |
| Year of Election or Appointment: 2009 Assistant Secretary of Fidelity's Equity and High Income Funds. Mr. Coffey also serves as Senior Vice President and Deputy General Counsel of FMR LLC (2010-present), and is an employee of Fidelity Investments. Previously, Mr. Coffey served as Vice President and Associate General Counsel of FMR LLC (2005-2009). |
Holly C. Laurent (57) |
| Year of Election or Appointment: 2008 Anti-Money Laundering (AML) Officer of the Fidelity funds. Ms. Laurent also serves as AML Officer of The North Carolina Capital Management Trust: Cash and Term Portfolios (2008-present) and is an employee of Fidelity Investments. Previously, Ms. Laurent was Senior Vice President and Head of Legal for Fidelity Business Services India Pvt. Ltd. (2006-2008), and Senior Vice President, Deputy General Counsel and Group Head for FMR LLC (2005-2006). |
Christine Reynolds (53) |
| Year of Election or Appointment: 2008 Chief Financial Officer of the Fidelity funds. Ms. Reynolds became President of Fidelity Pricing and Cash Management Services (FPCMS) in August 2008. Ms. Reynolds served as Chief Operating Officer of FPCMS (2007-2008). Previously, Ms. Reynolds served as President, Treasurer, and Anti-Money Laundering officer of the Fidelity funds (2004-2007). |
Kenneth A. Rathgeber (64) |
| Year of Election or Appointment: 2004 Chief Compliance Officer of Fidelity's Equity and High Income Funds. Mr. Rathgeber is Chief Compliance Officer of Fidelity Management & Research (Hong Kong) Limited (2008-present), Fidelity Management & Research (Japan) Inc. (2008-present), FMR (2005-present), FMR Co., Inc. (2005-present), Fidelity Management & Research (U.K.) Inc. (2005-present), Fidelity Research & Analysis Company (2005-present), Fidelity Investments Money Management, Inc. (2005-present), Pyramis Global Advisors, LLC (2005-present), and Strategic Advisers, Inc. (2005-present). |
Jeffrey S. Christian (50) |
| Year of Election or Appointment: 2009 Deputy Treasurer of the Fidelity funds. Mr. Christian is an employee of Fidelity Investments. Previously, Mr. Christian served as Chief Financial Officer (2008-2009) of certain Fidelity funds and Senior Vice President of Fidelity Pricing and Cash Management Services (FPCMS) (2004-2009). |
Joseph F. Zambello (54) |
| Year of Election or Appointment: 2011 Deputy Treasurer of the Fidelity funds. Mr. Zambello is an employee of Fidelity Investments. Previously, Mr. Zambello served as Vice President of FMR's Program Management Group (2009-2011) and Vice President of the Transfer Agent Oversight Group (2005-2009). |
Adrien E. Deberghes (44) |
| Year of Election or Appointment: 2008 Deputy Treasurer of Fidelity's Equity and High Income Funds. Mr. Deberghes also serves as Vice President and Assistant Treasurer of Fidelity Rutland Square Trust II and Fidelity Commonwealth Trust II (2011-present), Assistant Treasurer of other Fidelity funds (2010-present), and is an employee of Fidelity Investments (2008-present). Previously, Mr. Deberghes served as Senior Vice President of Mutual Fund Administration at State Street Corporation (2007-2008), Senior Director of Mutual Fund Administration at Investors Bank & Trust (2005-2007), and Director of Finance for Dunkin' Brands (2000-2005). |
Stephanie J. Dorsey (42) |
| Year of Election or Appointment: 2010 Assistant Treasurer of Fidelity's Equity and High Income Funds. Ms. Dorsey also serves as Deputy Treasurer of other Fidelity funds (2008-present) and is an employee of Fidelity Investments (2008-present). Previously, Ms. Dorsey served as Treasurer (2004-2008) of the JPMorgan Mutual Funds and Vice President (2004-2008) of JPMorgan Chase Bank. |
John R. Hebble (53) |
| Year of Election or Appointment: 2009 Assistant Treasurer of Fidelity's Equity and High Income Funds. Mr. Hebble also serves as President (2011-present), Treasurer, and Chief Financial Officer of The North Carolina Capital Management Trust: Cash and Term Portfolios (2008-present), President and Treasurer of other Fidelity funds (2008-present) and is an employee of Fidelity Investments. |
Gary W. Ryan (53) |
| Year of Election or Appointment: 2005 Assistant Treasurer of the Fidelity funds. Mr. Ryan is an employee of Fidelity Investments. Previously, Mr. Ryan served as Vice President of Fund Reporting in Fidelity Pricing and Cash Management Services (FPCMS) (1999-2005). |
Jonathan Davis (43) |
| Year of Election or Appointment: 2010 Assistant Treasurer of the Fidelity funds. Mr. Davis is also Assistant Treasurer of Fidelity Rutland Square Trust II and Fidelity Commonwealth Trust II. Mr. Davis is an employee of Fidelity Investments. Previously, Mr. Davis served as Vice President and Associate General Counsel of FMR LLC (2003-2010). |
Annual Report
The Board of Trustees of Advisor International Small Cap Fund voted to pay to shareholders of record at the opening of business on record date, the following distributions per share derived from capital gains realized from sales of portfolio securities, and dividends derived from net investment income:
| Pay Date | Record Date | Dividends | Capital Gains |
Class A | 12/05/11 | 12/02/11 | $0.108 | $0.272 |
Class T | 12/05/11 | 12/02/11 | $0.029 | $0.272 |
Class B | 12/05/11 | 12/02/11 | $0.000 | $0.147 |
Class C | 12/05/11 | 12/02/11 | $0.000 | $0.186 |
Class A designates 26%; Class T designates 28%; Class B designates 34%; and Class C designates 30%of the dividends distributed during the fiscal year as amounts which may be taken into account as a dividend for purposes of the maximum rate under section 1(h)(11) of the Internal Revenue Code.
The amounts per share which represent income derived from sources within, and taxes paid to, foreign countries or possessions of the United States are as follows:
| Pay Date | Income | Taxes |
Class A | 12/06/10 | $0.185 | $0.0124 |
Class T | 12/06/10 | $0.172 | $0.0124 |
Class B | 12/06/10 | $0.143 | $0.0124 |
Class C | 12/06/10 | $0.162 | $0.0124 |
The fund will notify shareholders in January 2012 of amounts for use in preparing 2011 income tax returns.
Annual Report
Board Approval of Investment Advisory Contracts and Management Fees
Fidelity International Small Cap Fund
Each year, the Board of Trustees, including the Independent Trustees (together, the Board), votes on the renewal of the management contract and sub-advisory agreements (together, the Advisory Contracts) for the fund. The Board, assisted by the advice of fund counsel and Independent Trustees' counsel, requests and considers a broad range of information relevant to the renewal of the Advisory Contracts throughout the year.
The Board meets regularly and considers at each of its meetings factors that are relevant to its annual consideration of the renewal of the fund's Advisory Contracts, including the services and support provided to the fund and its shareholders. The Board has established various standing committees, each composed of Independent Trustees with varying backgrounds, to which the Board has assigned specific subject matter responsibilities in order to enhance effective decision-making by the Board. The Board, acting directly and through its Committees, requests and receives information concerning the annual consideration of the renewal of the fund's Advisory Contracts. The Board also meets as needed to consider matters specifically related to the Board's annual consideration of the renewal of Advisory Contracts. Members of the Board may also meet with trustees of other Fidelity funds through ad hoc joint committees to discuss certain matters relevant to the Fidelity funds.
At its July 2011 meeting, the Board of Trustees, including the Independent Trustees, unanimously determined to renew the fund's Advisory Contracts. In reaching its determination, the Board considered all factors it believed relevant, including (i) the nature, extent, and quality of the services to be provided to the fund and its shareholders (including the investment performance of the fund); (ii) the competitiveness of the fund's management fee and total expense ratio; (iii) the total costs of the services to be provided by and the profits to be realized by Fidelity from its relationship with the fund; (iv) the extent to which economies of scale would be realized as the fund grows; and (v) whether fee levels reflect these economies of scale, if any, for the benefit of fund shareholders.
In considering whether to renew the Advisory Contracts for the fund, the Board reached a determination, with the assistance of fund counsel and Independent Trustees' counsel and through the exercise of its business judgment, that the renewal of the Advisory Contracts is in the best interests of the fund and its shareholders and that the compensation payable under the Advisory Contracts is fair and reasonable. The Board's decision to renew the Advisory Contracts was not based on any single factor, but rather was based on a comprehensive consideration of all the information provided to the Board at its meetings throughout the year. The Board, in reaching its determination to renew the Advisory Contracts, is aware that shareholders in the fund have a broad range of investment choices available to them, including a wide choice among mutual funds offered by Fidelity's competitors, and that the fund's shareholders, who have the opportunity to review and weigh the disclosure provided by the fund in its prospectus and other public disclosures, have chosen to invest in this fund, managed by Fidelity.
Annual Report
Nature, Extent, and Quality of Services Provided. The Board considered the staffing within the investment adviser, FMR, and the sub-advisers (together, the Investment Advisers), including the backgrounds of the fund's investment personnel and the fund's investment objective and discipline. The Independent Trustees also had discussions with senior management of Fidelity's investment operations and investment groups. The Board considered the structure of the portfolio manager compensation program and whether this structure provides appropriate incentives to act in the best interests of the fund.
Resources Dedicated to Investment Management and Support Services. The Board and the Fund Oversight and Research Committees reviewed the general qualifications and capabilities of the Investment Advisers' investment staff, including its size, education, experience, and resources, as well as the Investment Advisers' approach to recruiting, training, managing, and compensating investment personnel. The Board also noted that FMR has devoted increased resources to non-U.S. offices. The Board noted that Fidelity's analysts have extensive resources, tools and capabilities which allow them to conduct sophisticated quantitative and fundamental analysis, as well as credit analysis of issuers, counterparties and enhancers. The Board also believes that Fidelity's investment professionals have sufficient access to global information and data so as to provide competitive investment results over time, and that those professionals also have access to sophisticated tools which permit them to assess portfolio construction and risk and performance attribution characteristics continuously, as well as to transmit new information and research conclusions rapidly around the world. Additionally, in their deliberations, the Board considered the Investment Advisers' trading capabilities and resources which are an integral part of the investment management process.
Shareholder and Administrative Services. The Board considered (i) the nature, extent, quality, and cost of advisory, administrative, and shareholder services performed by the Investment Advisers and their affiliates under the Advisory Contracts and under separate agreements covering transfer agency, pricing and bookkeeping, and securities lending services for the fund; (ii) the nature and extent of the investment adviser's supervision of third party service providers, principally custodians and subcustodians; and (iii) the resources devoted to, and the record of compliance with, the fund's compliance policies and procedures. The Board also reviewed the allocation of fund brokerage, including allocations to brokers affiliated with the Investment Advisers, the use of brokerage commissions to pay fund expenses, and the use of "soft" commission dollars to pay for research services.
The Board noted that the growth of fund assets over time across the complex allows Fidelity to reinvest in the development of services designed to enhance the value or convenience of the Fidelity funds as investment vehicles. These services include 24-hour access to account information and market information through telephone representatives and over the Internet, investor education materials and asset allocation tools, and the expanded availability of Fidelity Investor Centers, with 35 new branches opening since 2010.
Annual Report
Board Approval of Investment Advisory Contracts and
Management Fees - continued
Investment in a Large Fund Family. The Board considered the benefits to shareholders of investing in a Fidelity fund, including the benefits of investing in a fund that is part of a large family of funds offering a variety of investment disciplines and providing a large variety of mutual fund investor services. The Board noted that Fidelity had taken, or had made recommendations that resulted in the Fidelity funds taking, a number of actions over the previous year that benefited particular funds, including (i) continuing to dedicate additional resources to investment research and support of the senior management team that oversees asset management; (ii) rationalizing product lines through the mergers of six funds into other funds; (iii) continuing to migrate the Freedom Funds to dedicated lower cost underlying funds; (iv) obtaining shareholder approval to broaden the investment strategies for Fidelity Consumer Finance Portfolio, Fidelity Emerging Asia Fund, and Fidelity Environment and Alternative Energy Portfolio; (v) contractually agreeing to reduce the management fees and impose other expense limitations on Spartan 500 Index Fund and U.S. Bond Index Fund in connection with launching new institutional classes of these funds; (vi) changing the name, primary and supplemental benchmarks, and investment policies of Fidelity Global Strategies Fund to support the fund's flexible investment mandate and global orientation; and (vii) reducing the transfer agency account fee rates on certain accounts.
Investment Performance. The Board considered whether the fund has operated in accordance with its investment objective, as well as its record of compliance with its investment restrictions. It also reviewed the fund's absolute investment performance for each class, as well as the fund's relative investment performance for each class measured over multiple periods against (i) a broad-based securities market index, and (ii) a peer group of mutual funds deemed appropriate by Fidelity and reviewed by the Board. The following charts considered by the Board show, over the one-, three-, and five-year periods ended December 31, 2010, the cumulative total returns of Institutional Class (Class I) and Class B of the fund, the cumulative total returns of a broad-based securities market index ("benchmark"), and a range of cumulative total returns of a peer group of mutual funds identified by Lipper Inc. as having an investment objective similar to that of the fund. The returns of Institutional Class (Class I) and Class B show the performance of the highest and lowest performing classes, respectively (based on five-year performance). The box within each chart shows the 25th percentile return (bottom of box) and the 75th percentile return (top of box) of the peer group. Returns shown above the box are in the first quartile and returns shown below the box are in the fourth quartile. The percentage beaten numbers noted below each chart correspond to the percentile box and represent the percentage of funds in the peer group whose performance was equal to or lower than that of the class indicated.
Annual Report
Fidelity International Small Cap Fund

The Board reviewed the fund's relative investment performance against its peer group and noted that the performance of Institutional Class (Class I) of the fund was in the first quartile for the one- and three-year periods and the third quartile for the five-year period. The Board also noted that the investment performance of Institutional Class (Class I) of the fund compared favorably to its benchmark for all the periods shown. The Board considered that the variations in performance among the fund's classes reflect the variations in class expenses, which result in lower performance for higher expense classes. The Board also reviewed the fund's performance since inception as well as performance in the current year.
The Board also considered that the fund's management fee is subject to upward or downward adjustment depending upon whether, and to what extent, the fund's investment performance for the performance period exceeds, or is exceeded by, the record (over the same period) of a Board-approved performance adjustment index. The Board noted that the performance adjustment provides FMR with a strong economic incentive to seek to achieve superior performance for the fund's shareholders and helps to more closely align the interests of FMR and the fund's shareholders.
Based on its review, the Board concluded that the nature, extent, and quality of services provided to the fund under the Advisory Contracts should benefit the fund's shareholders.
Annual Report
Board Approval of Investment Advisory Contracts and
Management Fees - continued
Competitiveness of Management Fee and Total Expense Ratio. The Board considered the fund's management fee and total expense ratio compared to "mapped groups" of competitive funds and classes. Fidelity creates "mapped groups" by combining similar Lipper investment objective categories that have comparable management fee characteristics. Combining Lipper investment objective categories aids the Board's management fee and total expense ratio comparisons by broadening the competitive group used for comparison and by reducing the number of universes to which various Fidelity funds are compared.
Management Fee. The Board considered two proprietary management fee comparisons for the 12-month periods shown in the chart below. The group of Lipper funds used by the Board for management fee comparisons is referred to below as the "Total Mapped Group." The Total Mapped Group is broader than the Lipper peer group used by the Board for performance comparisons because the Total Mapped Group combines several Lipper investment objective categories while the Lipper peer group does not. The Total Mapped Group comparison focuses on a fund's standing relative to the total universe of comparable funds available to investors in terms of gross management fees before expense reimbursements or caps, and without giving effect to the fund's performance adjustment. "TMG %" represents the percentage of funds in the Total Mapped Group that had management fees that were lower than the fund's. For example, a TMG % of 19% means that 81% of the funds in the Total Mapped Group had higher management fees than the fund. The "Asset-Size Peer Group" (ASPG) comparison focuses on a fund's standing relative to non-Fidelity funds similar in size to the fund within the Total Mapped Group. The ASPG represents at least 15% of the funds in the Total Mapped Group with comparable asset size and management fee characteristics, subject to a minimum of 50 funds (or all funds in the Total Mapped Group if fewer than 50). Additional information, such as the ASPG quartile in which the fund's management fee ranked and the impact of the fund's performance adjustment, is also included in the chart and considered by the Board.
Annual Report
Fidelity International Small Cap Fund
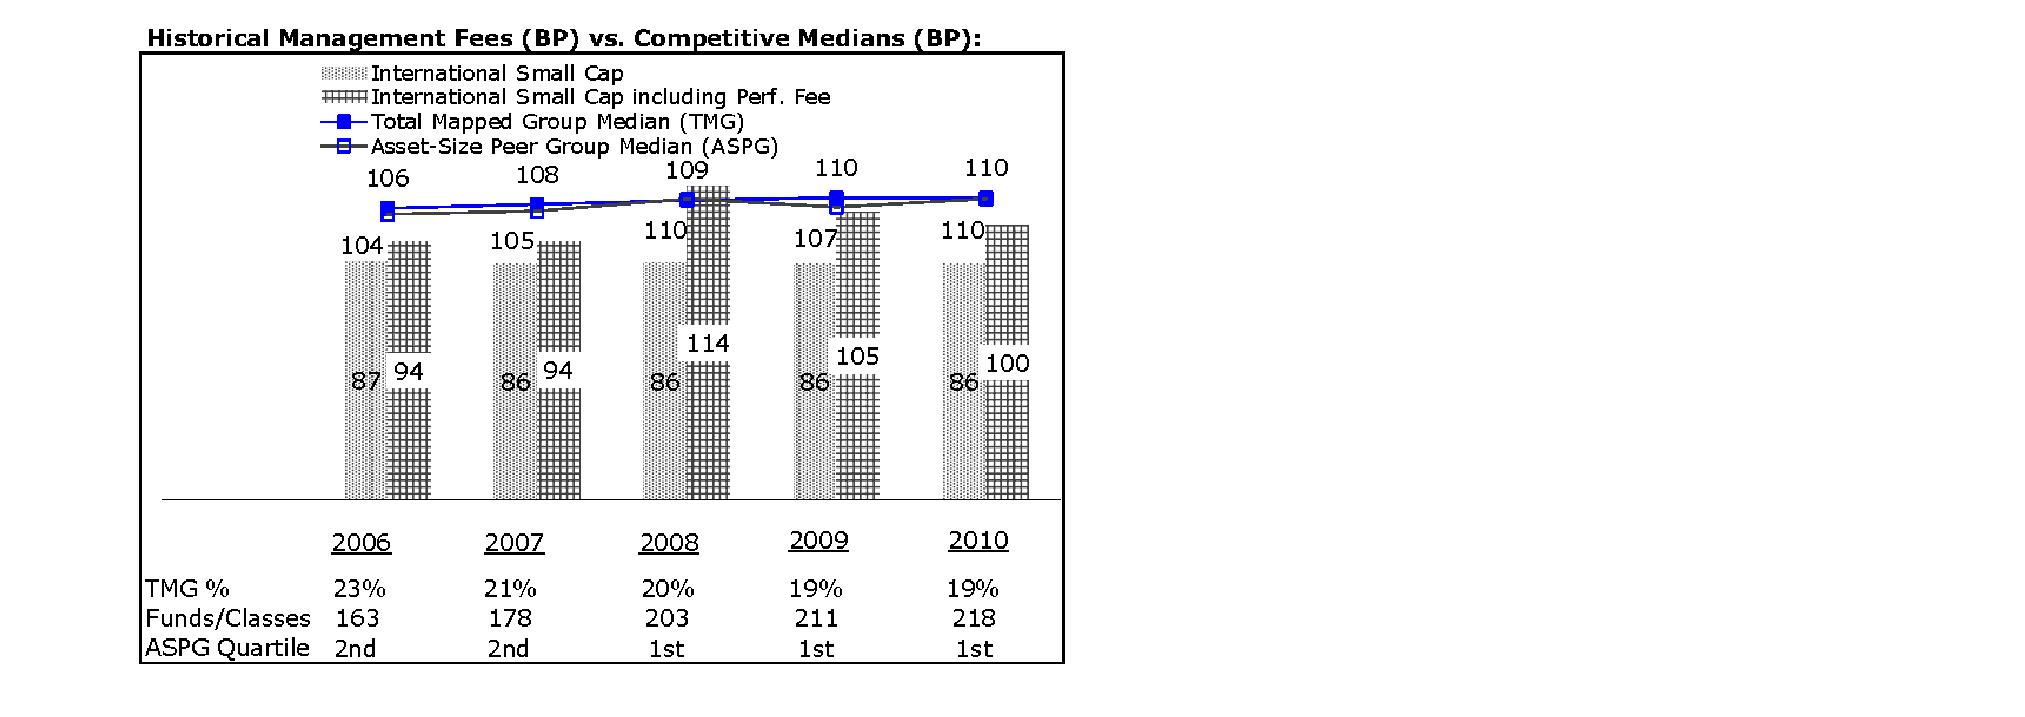
The Board noted that the fund's management fee ranked below the median of its Total Mapped Group and below the median of its ASPG for 2010. The Board also noted the effect of the fund's positive performance adjustment on the fund's management fee ranking. The Board noted that the performance adjustment for each year represents calculations for performance periods that differ from the periods shown in the performance charts above.
Based on its review, the Board concluded that the fund's management fee is fair and reasonable in light of the services that the fund receives and the other factors considered.
Total Expense Ratio. In its review of each class's total expense ratio, the Board considered the fund's management fee as well as other fund or class expenses, as applicable, such as transfer agent fees, pricing and bookkeeping fees, fund-paid 12b-1 fees, and custodial, legal, and audit fees. The Board also noted the effects of any waivers and reimbursements on fees and expenses, as well as the impact of the fund's performance adjustment. As part of its review, the Board also considered the current and historical total expense ratios of each class of the fund compared to competitive fund median expenses. Each class of the fund is compared to those funds and classes in the Total Mapped Group (used by the Board for management fee comparisons) that have a similar sales load structure.
The Board noted that the total expense ratio of each of Class A, Class B, Class C, Institutional Class, and the retail class ranked below its competitive median for 2010 and the total expense ratio of Class T ranked above its competitive median for 2010. The Board considered that various factors, including 12b-1 fees, positive or negative performance adjustments, and relatively higher other expenses in the case of small fund size, can affect total expense ratios. The Board noted that the total expense ratio of Class T was above the competitive median primarily because of higher 12b-1 fees on Class T. Class T has a higher 12b-1 fee, but a lower front-end sales charge, than traditionally priced front-end sales charge classes. The Board noted that the fund offers multiple classes, each of which has a different sales load and 12b-1 fee structure, and that the multiple structures are intended to offer a range of pricing options for the intermediary market. The Board also noted that the total expense ratios of the classes vary primarily by the level of their 12b-1 fees, although differences in transfer agent fees may also cause expenses to vary from class to class.
Annual Report
Board Approval of Investment Advisory Contracts and
Management Fees - continued
Fees Charged to Other Fidelity Clients. The Board also considered Fidelity fee structures and other information with respect to clients of FMR and its affiliates, such as other mutual funds advised or subadvised by FMR or its affiliates, pension plan clients, and other institutional clients. In March 2010, the Board created an ad hoc joint committee with the board of other Fidelity funds (the Committee) to review and compare Fidelity's institutional investment advisory business with its business of providing services to the Fidelity funds, including the differences in services provided, fees charged, and costs incurred, as well as competition in their respective marketplaces.
Based on its review of total expense ratios and fees charged to other Fidelity clients, the Board concluded that the total expense ratio of each class of the fund was reasonable, although Class T was above the median of the universe presented for comparison, in light of the services that the fund and its shareholders receive and the other factors considered, including the findings of the Committee.
Costs of the Services and Profitability. The Board considered the revenues earned and the expenses incurred by Fidelity in conducting the business of developing, marketing, distributing, managing, administering and servicing the fund and its shareholders. The Board also considered the level of Fidelity's profits in respect of all the Fidelity funds.
On an annual basis, FMR presents to the Board Fidelity's profitability for the fund. Fidelity calculates the profitability for each fund, as well as aggregate profitability for groups of Fidelity funds and all Fidelity funds, using a series of detailed revenue and cost allocation methodologies which originate with the books and records of Fidelity on which Fidelity's audited financial statements are based. The Audit Committee of the Board reviews any significant changes from the prior year's methodologies.
PricewaterhouseCoopers LLP (PwC), independent registered public accounting firm and auditor to Fidelity and certain Fidelity funds, has been engaged annually by the Board as part of the Board's assessment of Fidelity's profitability analysis. PwC's engagement includes the review and assessment of Fidelity's methodologies used in determining the revenues and expenses attributable to Fidelity's mutual fund business, and completion of agreed-upon procedures surrounding the mathematical accuracy of fund profitability and its conformity to allocation methodologies. After considering PwC's reports issued under the engagement and information provided by Fidelity, the Board concluded that while other allocation methods may also be reasonable, Fidelity's profitability methodologies are reasonable in all material respects.
Annual Report
The Board also reviewed Fidelity's non-fund businesses and fall-out benefits related to the mutual fund business as well as cases where Fidelity's affiliates may benefit from or be related to the fund's business.
The Board considered the costs of the services provided by and the profits realized by Fidelity in connection with the operation of the fund and was satisfied that the profitability was not excessive in the circumstances.
Economies of Scale. The Board considered whether there have been economies of scale in respect of the management of the Fidelity funds, whether the Fidelity funds (including the fund) have appropriately benefited from any such economies of scale, and whether there is potential for realization of any further economies of scale. The Board considered the extent to which the fund will benefit from economies of scale through increased services to the fund, through waivers or reimbursements, or through fee or expense reductions. The Board also noted that in 2009, it and the board of other Fidelity funds created an ad hoc committee (the Economies of Scale Committee) to analyze whether FMR attains economies of scale in respect of the management and servicing of the Fidelity funds, whether the Fidelity funds have appropriately benefited from such economies of scale, and whether there is potential for realization of any further economies of scale.
The Board recognized that the fund's management contract incorporates a "group fee" structure, which provides for lower group fee rates as total fund assets under FMR's management increase, and for higher group fee rates as total fund assets under FMR's management decrease. FMR calculates the group fee rates based on a tiered asset "breakpoint" schedule that varies based on asset class. The Board considered that the group fee is designed to deliver the benefits of economies of scale to fund shareholders when total Fidelity fund assets increase, even if assets of any particular fund are unchanged or have declined, because some portion of Fidelity's costs are attributable to services provided to all Fidelity funds, and all funds benefit if those costs can be allocated among more assets. The Board concluded that, given the group fee structure, fund shareholders will benefit from lower management fees as assets under FMR's management increase at the fund complex level, regardless of whether Fidelity achieves any such economies of scale.
The Board concluded, taking into account the analysis of the Economies of Scale Committee, that any potential economies of scale are being appropriately shared between fund shareholders and Fidelity.
Annual Report
Board Approval of Investment Advisory Contracts and
Management Fees - continued
Additional Information Requested by the Board. In order to develop fully the factual basis for consideration of the Fidelity funds' Advisory Contracts, the Board requested and received additional information on certain topics, including (i) fund performance trends, actions to be taken by FMR to improve certain funds' overall performance, and Fidelity's long-term strategies for certain funds; (ii) portfolio manager changes that have occurred during the past year and length of portfolio manager tenure for different categories of funds over time; (iii) Fidelity's compensation structure for portfolio managers and other key personnel and strategies for attracting and retaining non-investment personnel; (iv) the amount of the investment that each portfolio manager has made in the Fidelity fund(s) that he or she manages; (v) historical trends in Fidelity's realization of fall-out benefits; (vi) Fidelity's group fee structures and the rationale for the individual fee rates of certain funds; (vii) fund profitability methodology and the impact of certain factors on fund profitability results; (viii) trends regarding industry use of performance fee structures and Fidelity's compliance practices with respect to performance adjustment calculations; (ix) the fee structures in place for certain other Fidelity clients; and (x) explanations regarding the relative total expense ratios of certain funds and classes, total expense competitive trends, and actions that might be taken by FMR to reduce total expense ratios for certain funds and classes.
Based on its evaluation of all of the conclusions noted above, and after considering all factors it believed relevant, the Board ultimately concluded that the advisory fee structures are fair and reasonable, and that the fund's Advisory Contracts should be renewed.
Annual Report
Investment Adviser
Fidelity Management & Research Company
Boston, MA
Investment Sub-Advisers
FMR Co., Inc.
Fidelity Management & Research
(U.K.) Inc.
FIL Investment Advisors
FIL Investments (Japan) Limited
FIL Investment Advisors (UK) Ltd.
Fidelity Management & Research
(Hong Kong) Limited
Fidelity Management & Research
(Japan) Inc.
General Distributor
Fidelity Distributors Corporation
Boston, MA
Transfer and Service Agents
Fidelity Investments Institutional Operations Company, Inc.
Boston, MA
Fidelity Service Company, Inc.
Boston, MA
Custodian
The Bank of New York Mellon
New York, NY
AISC-UANN-1211
1.793568.108
(Fidelity Logo)
Fidelity Advisor®
International Small Cap
Fund - Institutional Class
Annual Report
October 31, 2011
(Fidelity Cover Art)
Institutional Class is a class of
Fidelity® International Small Cap Fund
Contents
Chairman's Message | 4 | The Chairman's message to shareholders. |
Performance | 5 | How the fund has done over time. |
Management's Discussion of Fund Performance | 6 | The Portfolio Managers' review of fund performance and strategy. |
Shareholder Expense Example | 7 | An example of shareholder expenses. |
Investment Changes | 9 | A summary of major shifts in the fund's investments over the past six months. |
Investments | 11 | A complete list of the fund's investments with their market values. |
Financial Statements | 27 | Statements of assets and liabilities, operations, and changes in net assets, as well as financial highlights. |
Notes | 37 | Notes to financial statements. |
Report of Independent Registered Public Accounting Firm | 49 | |
Trustees and Officers | 50 | |
Distributions | 61 | |
Board Approval of Investment Advisory Contracts and Management Fees | 62 | |
To view a fund's proxy voting guidelines and proxy voting record for the 12-month period ended June 30, visit http://www.fidelity.com/proxyvotingresults or visit the Securities and Exchange Commission's (SEC) web site at http://www.sec.gov. You may also call 1-877-208-0098 to request a free copy of the proxy voting guidelines.
Standard & Poor's, S&P and S&P 500 are registered service marks of The McGraw-Hill Companies, Inc. and have been licensed for use by Fidelity Distributors Corporation.
Other third party marks appearing herein are the property of their respective owners.
All other marks appearing herein are registered or unregistered trademarks or service marks of FMR LLC or an affiliated company.
Annual Report
This report and the financial statements contained herein are submitted for the general information of the shareholders of the fund. This report is not authorized for distribution to prospective investors in the fund unless preceded or accompanied by an effective prospectus.
A fund files its complete schedule of portfolio holdings with the SEC for the first and third quarters of each fiscal year on Form N-Q. Forms N-Q are available on the SEC's web site at http://www.sec.gov. A fund's Forms N-Q may be reviewed and copied at the SEC's Public Reference Room in Washington, DC. Information regarding the operation of the SEC's Public Reference Room may be obtained by calling 1-800-SEC-0330. For a complete list of a fund's portfolio holdings, view the most recent holdings listing, semiannual report, or annual report on Fidelity's web site at http://www.fidelity.com, http://www.advisor.fidelity.com, or http://www.401k.com, as applicable.
NOT FDIC INSURED • MAY LOSE VALUE • NO BANK GUARANTEE
Neither the fund nor Fidelity Distributors Corporation is a bank.
Annual Report
(Acting Chairman's Photograph)
Dear Shareholder:
Global equity markets began the fourth quarter on a strong note, sharply reversing course in October amid strong corporate earnings, better-than-expected economic news and the promise of a resolution to the sovereign debt crisis in Europe. The mini rally followed a third quarter marked by a significant downturn in July and August, which heightened investor anxiety and set off a wave of volatility that hampered most major asset classes through the end of September. Financial markets are difficult to predict, of course, but you can help put the odds in your favor by following these time-tested investment principles.
One of the basic tenets is to invest according to your time horizon. For long-term investors, riding out the markets' inevitable ups and downs has proven much more effective than making decisions based on short-term developments. If your goal is approaching, you can also benefit from patience and restraint, rather than attempting to time the market. No matter your time horizon, missing only a few of the markets' best days can significantly diminish returns. Patience also affords the benefits of compounding - earning interest on additional income or reinvested dividends and capital gains. While staying the course doesn't eliminate risk, it can considerably lessen the negative impact of short-term downturns.
Asset allocation is another principle to manage risk. As you spread your portfolio among the asset classes, be sure to consider your time horizon, risk tolerance and investment objectives. Younger investors may be better served by emphasizing equities, which historically have been the best-performing asset class over time. Investors who are nearing a specific goal, such as retirement or sending a child to college, may choose to favor bonds and other investments that have tended to be more stable. Studies indicate that asset allocation is the single most important determinant of a portfolio's long-term success. After deciding on a suitable allocation strategy, make sure your portfolio is adequately diversified, with exposure to stocks of small-, mid- and large-cap companies in a range of sectors, for example. And today, more than ever, geographic diversification should be taken into account.
Lastly, investing a certain amount of money on a regular basis - a principle known as dollar-cost averaging - can help lower the average cost of your purchases, while also giving you the discipline to avoid selling weak performers just prior to an upswing, or chasing a hot performer just before a correction.
We invite you to learn more by visiting us on the Internet, dropping by one of our Investor Centers or calling us by phone. It is our privilege to provide the resources you need to choose investments that are right for you.
Sincerely,
(Acting Chairman's Signature)
James C. Curvey
Acting Chairman
Annual Report
Performance: The Bottom Line
Average annual total return reflects the change in the value of an investment, assuming reinvestment of the class' distributions from dividend income and capital gains (the profits earned upon the sale of securities that have grown in value, if any) and assuming a constant rate of performance each year. The $10,000 table and the fund's returns do not reflect the deduction of taxes that a shareholder would pay on fund distributions or the redemption of fund shares. During periods of reimbursement by Fidelity, a fund's total return will be greater than it would be had the reimbursement not occurred. How a fund did yesterday is no guarantee of how it will do tomorrow.
Average Annual Total Returns
Periods ended October 31, 2011 | Past 1
year | Past 5
years | Life of
fundA |
Institutional Class B | -3.62% | 1.24% | 15.26% |
A From September 18, 2002.
B The initial offering of Institutional Class shares took place on May 27, 2003. Returns prior to May 27, 2003 are those of Fidelity® International Small Cap Fund, the original class of the fund.
$10,000 Over Life of Fund
Let's say hypothetically that $10,000 was invested in Fidelity Advisor® International Small Cap Fund - Institutional Class, a class of the fund, on September 18, 2002, when the fund started. The chart shows how the value of your investment would have changed, and also shows how the MSCI® EAFE® (Europe, Australasia, Far East) Small Cap Index performed over the same period. The initial offering of Institutional Class took place on May 27, 2003. See above for additional information regarding the performance of Institutional Class.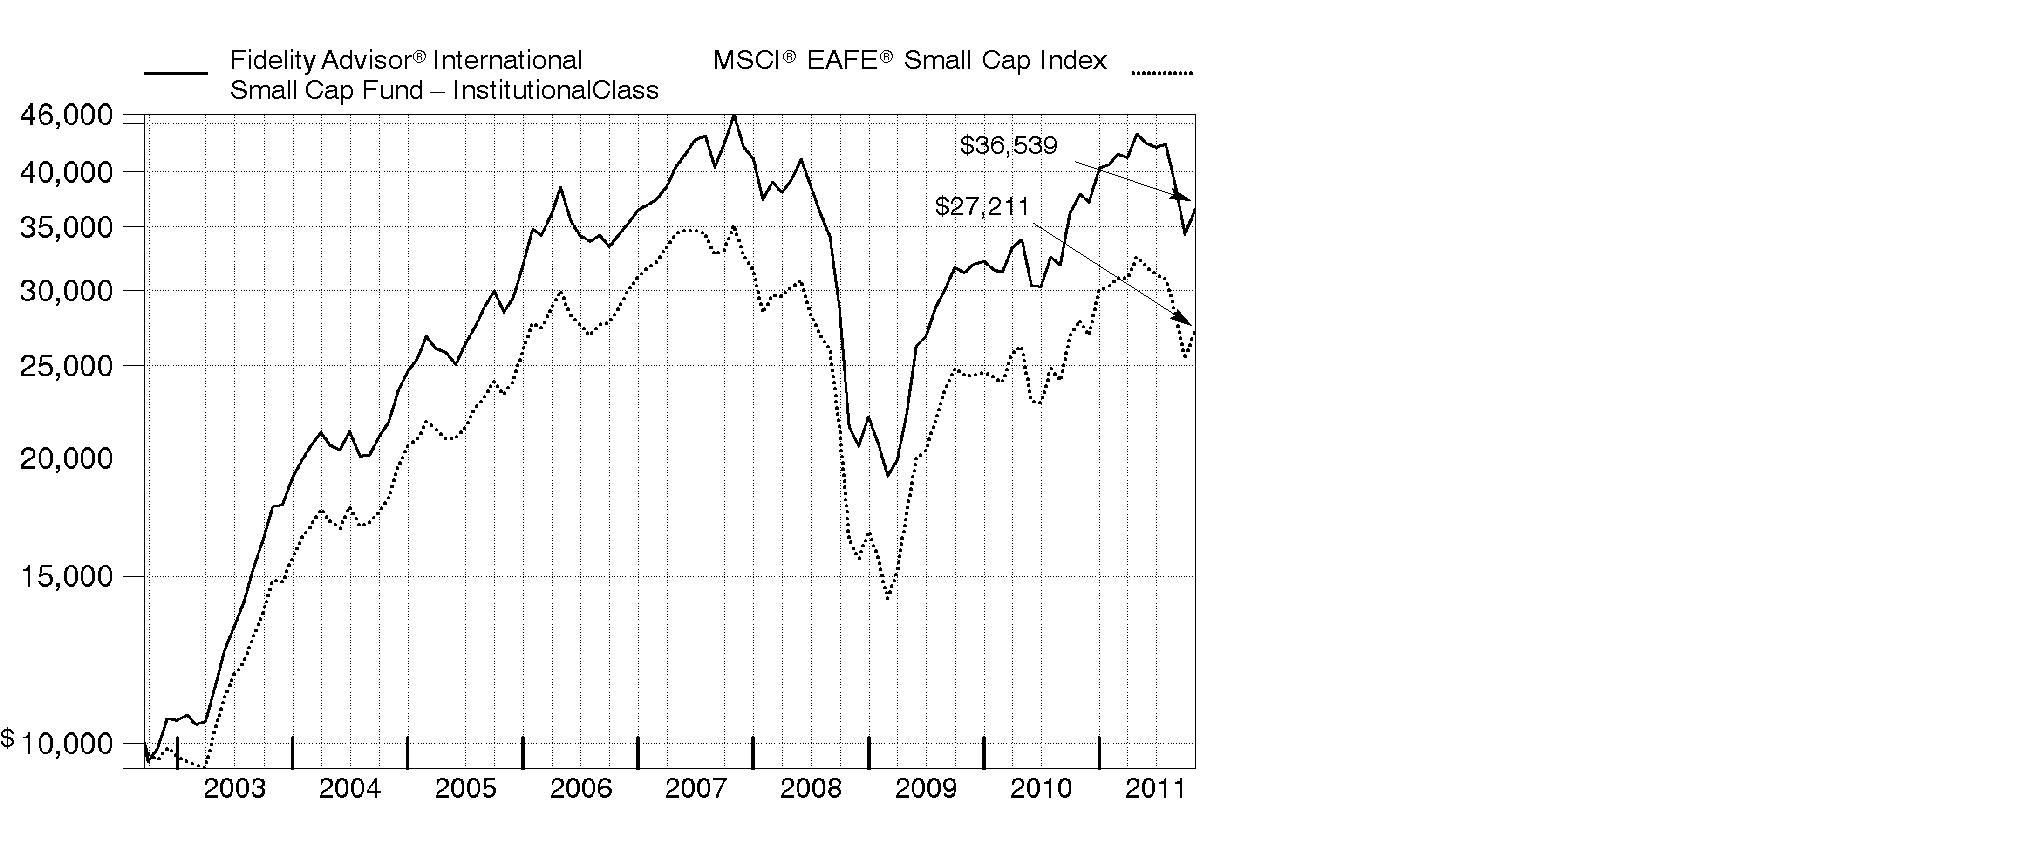
Annual Report
Management's Discussion of Fund Performance
Market Recap: International equities were rocked by a number of headline events during the year ending October 31, 2011. Stocks posted a solid advance for the first half of the period, despite concern about the sovereign debt crisis in Europe, a devastating earthquake and tsunami in Japan, and political upheaval in the Middle East and North Africa. Sentiment turned decidedly negative in the second half, however, as fresh worries about Europe, inflation in China and a dimmed outlook for global growth caused foreign markets to suffer declines that intensified in August and September. October brought with it yet another dramatic swing, as eurozone policymakers appeared near a resolution to the debt debacle and buyers stormed back onto the scene in search of bargains. Still, those gains - along with favorable currency fluctuations overall - weren't enough to offset prior losses, and the MSCI® ACWI® (All Country World Index) ex USA Index finished the period down 4.56%. Within the MSCI index, Europe and emerging markets suffered the biggest declines, with many countries in these areas sustaining steep losses. By contrast, Japan showed resilience in the wake of its natural disasters, falling only 2%. Australia (+4%), Switzerland (+3%), the U.K. (+2%) and Canada, which produced a nominal return, were among the few major benchmark components to break into positive territory.
Comments from Colin Stone, Dale Nicholls and Nicholas Price, Co-Portfolio Managers of Fidelity Advisor® International Small Cap Fund: For the year, the fund's Institutional Class shares returned -3.62%, lagging the -2.39% mark of the MSCI® EAFE® (Europe, Australasia, Far East) Small Cap Index. Positioning in energy and industrials meaningfully detracted. By contrast, our stakes in health care and financials notably contributed. Geographically, our picks in the U.K. and an overweighting in China hurt, while security selection in Europe, Japan and elsewhere in Asia-Pacific helped. The Europe/Middle East/Africa subportfolio had the weakest performance. U.K. energy firm Aurelian Oil & Gas detracted, while Irish biopharmaceutical firm Elan added value. The Asia-Pacific ex Japan subportfolio finished about even with its benchmark's modest loss. Sino Prosper State Gold Resources Holdings detracted, and Singapore-based consumer electronics firm Pertama Holdings helped. The Japanese subportfolio beat its benchmark's roughly 9% gain. Online advertising firm CyberAgent contributed, and electronic components maker Mitsumi Electric - which we sold - hurt. Elan, Sino Prosper and Pertama were not in the index.
Note to shareholders: Nicholas Price became Co-Portfolio Manager on November 1, 2011.
The views expressed above reflect those of the portfolio manager(s) only through the end of the period as stated on the cover of this report and do not necessarily represent the views of Fidelity or any other person in the Fidelity organization. Any such views are subject to change at any time based upon market or other conditions and Fidelity disclaims any responsibility to update such views. These views may not be relied on as investment advice and, because investment decisions for a Fidelity fund are based on numerous factors, may not be relied on as an indication of trading intent on behalf of any Fidelity fund.
Annual Report
Shareholder Expense Example
As a shareholder of the Fund, you incur two types of costs: (1) transaction costs, including sales charges (loads) on purchase payments or redemption proceeds, redemption fees, and (2) ongoing costs, including management fees, distribution and/or service (12b-1) fees and other Fund expenses. This Example is intended to help you understand your ongoing costs (in dollars) of investing in the Fund and to compare these costs with the ongoing costs of investing in other mutual funds.
The Example is based on an investment of $1,000 invested at the beginning of the period and held for the entire period (May 1, 2011 to October 31, 2011).
Actual Expenses
The first line of the accompanying table for each class of the Fund provides information about actual account values and actual expenses. You may use the information in this line, together with the amount you invested, to estimate the expenses that you paid over the period. Simply divide your account value by $1,000.00 (for example, an $8,600 account value divided by $1,000.00 = 8.6), then multiply the result by the number in the first line for a class of the Fund under the heading entitled "Expenses Paid During Period" to estimate the expenses you paid on your account during this period. A small balance maintenance fee of $12.00 that is charged once a year may apply for certain accounts with a value of less than $2,000. This fee is not included in the table below. If it was, the estimate of expenses you paid during the period would be higher, and your ending account value lower, by this amount. In addition, the Fund, as a shareholder in the underlying Fidelity Central Funds, will indirectly bear its pro-rata share of the fees and expenses incurred by the underlying Fidelity Central Funds. These fees and expenses are not included in the Fund's annualized expense ratio used to calculate the expense estimate in the table below.
Hypothetical Example for Comparison Purposes
The second line of the accompanying table for each class of the Fund provides information about hypothetical account values and hypothetical expenses based on a Class' actual expense ratio and an assumed rate of return of 5% per year before expenses, which is not the Class' actual return. The hypothetical account values and expenses may not be used to estimate the actual ending account balance or expenses you paid for the period. You may use this information to compare the ongoing costs of investing in the Fund and other funds. To do so, compare this 5% hypothetical example with the 5% hypothetical examples that appear in the shareholder reports of the other funds. A small balance maintenance fee of $12.00 that is charged once a year may apply for certain accounts with a value of less than $2,000. This fee is not included in the table below. If it was, the estimate of expenses you paid during the period would be higher, and your ending account value lower, by this amount. In addition, the Fund, as a shareholder in the underlying Fidelity Central Funds, will indirectly bear its pro-rata share of the fees and expenses incurred by the underlying Fidelity Central Funds. These fees and expenses are not included in the Fund's annualized expense ratio used to calculate the expense estimate in the table below.
Please note that the expenses shown in the table are meant to highlight your ongoing costs only and do not reflect any transaction costs. Therefore, the second line of the table is useful in comparing ongoing costs only, and will not help you determine the relative total costs of owning different funds. In addition, if these transactional costs were included, your costs would have been higher.
Annual Report
| Annualized Expense Ratio | Beginning
Account Value
May 1, 2011 | Ending
Account Value
October 31, 2011 | Expenses Paid
During Period*
May 1, 2011 to October 31, 2011 |
Class A | 1.55% | | | |
Actual | | $ 1,000.00 | $ 831.30 | $ 7.15 |
HypotheticalA | | $ 1,000.00 | $ 1,017.39 | $ 7.88 |
Class T | 1.81% | | | |
Actual | | $ 1,000.00 | $ 830.40 | $ 8.35 |
HypotheticalA | | $ 1,000.00 | $ 1,016.08 | $ 9.20 |
Class B | 2.30% | | | |
Actual | | $ 1,000.00 | $ 828.30 | $ 10.60 |
HypotheticalA | | $ 1,000.00 | $ 1,013.61 | $ 11.67 |
Class C | 2.27% | | | |
Actual | | $ 1,000.00 | $ 828.30 | $ 10.46 |
HypotheticalA | | $ 1,000.00 | $ 1,013.76 | $ 11.52 |
International Small Cap | 1.25% | | | |
Actual | | $ 1,000.00 | $ 832.50 | $ 5.77 |
HypotheticalA | | $ 1,000.00 | $ 1,018.90 | $ 6.36 |
Institutional Class | 1.21% | | | |
Actual | | $ 1,000.00 | $ 832.90 | $ 5.59 |
HypotheticalA | | $ 1,000.00 | $ 1,019.11 | $ 6.16 |
A 5% return per year before expenses
* Expenses are equal to each Class' annualized expense ratio, multiplied by the average account value over the period, multiplied by 184/365 (to reflect the one-half year period).
Annual Report
Investment Changes (Unaudited)
Geographic Diversification (% of fund's net assets) |
As of October 31, 2011 |
| Japan 27.8% | |
| United Kingdom 18.2% | |
| Germany 8.5% | |
| Australia 7.5% | |
| France 5.1% | |
| Ireland 3.2% | |
| Bermuda 2.9% | |
| Cayman Islands 2.5% | |
| Singapore 2.3% | |
| Other 22.0% | |

Percentages are adjusted for the effect of futures contracts, if applicable. |
As of April 30, 2011 |
| Japan 22.0% | |
| United Kingdom 18.1% | |
| Germany 10.2% | |
| Australia 6.8% | |
| France 6.7% | |
| United States of America 3.7% | |
| Bermuda 3.1% | |
| Cayman Islands 2.6% | |
| Norway 2.4% | |
| Other 24.4% | |

Percentages are adjusted for the effect of futures contracts, if applicable. |
Asset Allocation |
| % of fund's
net assets | % of fund's net assets
6 months ago |
Stocks and Equity Futures | 98.5 | 96.7 |
Bonds | 0.1 | 0.2 |
Short-Term Investments and Net Other Assets | 1.4 | 3.1 |
Top Ten Stocks as of October 31, 2011 |
| % of fund's
net assets | % of fund's net assets
6 months ago |
Pertama Holdings Ltd. (Singapore, Specialty Retail) | 1.3 | 0.7 |
London Mining PLC (United Kingdom, Metals & Mining) | 1.0 | 1.0 |
Paddy Power PLC (Ireland) (Ireland, Hotels, Restaurants & Leisure) | 0.9 | 0.1 |
Kenmare Resources PLC (Ireland, Metals & Mining) | 0.9 | 0.9 |
Elan Corp. PLC (Ireland, Pharmaceuticals) | 0.9 | 0.8 |
Tiger Resources Ltd. (Australia, Metals & Mining) | 0.9 | 0.9 |
Ipsos SA (France, Media) | 0.9 | 0.8 |
Asahi Intecc Co. Ltd. (Japan, Health Care Equipment & Supplies) | 0.9 | 0.6 |
CTS Eventim AG (Germany, Media) | 0.9 | 0.7 |
Lanxess AG (Germany, Chemicals) | 0.9 | 1.0 |
| 9.5 | |
Market Sectors as of October 31, 2011 |
| % of fund's
net assets | % of fund's net assets
6 months ago |
Consumer Discretionary | 21.0 | 17.3 |
Industrials | 17.7 | 18.4 |
Information Technology | 15.0 | 14.9 |
Materials | 13.6 | 13.8 |
Financials | 11.3 | 12.4 |
Health Care | 9.7 | 8.3 |
Energy | 5.7 | 6.6 |
Consumer Staples | 2.7 | 2.3 |
Telecommunication Services | 1.3 | 2.3 |
Utilities | 0.3 | 0.6 |
Annual Report
Investments October 31, 2011
Showing Percentage of Net Assets
Common Stocks - 98.2% |
| Shares | | Value |
Australia - 7.5% |
Atlas Iron Ltd. | 610,639 | | $ 1,980,723 |
Ausgold Ltd. (a)(e) | 1,220,000 | | 1,528,690 |
Austal Ltd. | 848,401 | | 2,017,722 |
Beach Energy Ltd. | 575,255 | | 707,059 |
Blackgold International Holdings Ltd. | 1,950,000 | | 447,192 |
carsales.com Ltd. (e) | 430,178 | | 2,224,021 |
Centamin Egypt Ltd. (United Kingdom) (a) | 2,018,614 | | 3,564,476 |
Dart Energy Ltd. (a) | 3,642,982 | | 2,344,864 |
DUET Group | 917,947 | | 1,599,925 |
Goodman Group unit | 1,506,880 | | 979,326 |
Horizon Oil Ltd. (a) | 2,028,276 | | 504,048 |
Iluka Resources Ltd. | 130,860 | | 2,175,715 |
Imdex Ltd. | 595,564 | | 1,300,593 |
Industrea Ltd. | 870,384 | | 1,167,628 |
Iress Market Technology Ltd. | 140,627 | | 1,120,793 |
Ironbark Zinc Ltd. (a) | 2,305,831 | | 726,992 |
Karoon Gas Australia Ltd. (a) | 160,153 | | 739,131 |
Kingsgate Consolidated NL | 141,376 | | 1,114,722 |
Linc Energy Ltd. | 508,182 | | 1,091,028 |
MAp Group unit | 169,101 | | 603,458 |
Medusa Mining Ltd. | 239,743 | | 1,685,456 |
Mesoblast Ltd. (a)(e) | 252,300 | | 2,145,258 |
Mineral Deposits Ltd. (a) | 445,391 | | 3,009,757 |
Mineral Deposits Ltd. (Canada) (a) | 457,000 | | 2,874,444 |
Mirabela Nickel Ltd. (a) | 795,964 | | 1,368,741 |
Monto Minerals Ltd. (a) | 273,551 | | 5,383 |
Navitas Ltd. | 464,760 | | 2,013,083 |
Northern Iron Ltd. (a) | 423,362 | | 512,891 |
Paladin Energy Ltd. (Australia) (a) | 113,814 | | 173,825 |
Panaust Ltd. (a) | 455,468 | | 1,539,223 |
Ramsay Health Care Ltd. | 119,108 | | 2,341,572 |
realestate.com.au Ltd. | 84,356 | | 1,144,994 |
Red 5 Ltd. (a) | 4,566,367 | | 890,754 |
SAI Global Ltd. | 942,792 | | 4,696,897 |
SEEK Ltd. | 421,927 | | 2,735,662 |
Sino Gas & Energy Ltd. (a) | 8,152,205 | | 364,173 |
SomnoMed Ltd. (a) | 531,849 | | 613,708 |
Tiger Resources Ltd. (a) | 16,688,264 | | 8,106,796 |
TPG Telecom Ltd. | 891,143 | | 1,333,188 |
Troy Resources NL | 314,010 | | 1,334,616 |
Wotif.com Holdings Ltd. (e) | 562,113 | | 2,166,275 |
TOTAL AUSTRALIA | | 68,994,802 |
Common Stocks - continued |
| Shares | | Value |
Bailiwick of Jersey - 1.2% |
Informa PLC | 1,249,285 | | $ 7,280,979 |
LXB Retail Properties PLC (a)(i) | 2,495,000 | | 4,052,584 |
TOTAL BAILIWICK OF JERSEY | | 11,333,563 |
Belgium - 0.7% |
EVS Broadcast Equipment SA | 119,700 | | 6,145,720 |
Bermuda - 2.9% |
Aquarius Platinum Ltd.: | | | |
(Australia) | 465,705 | | 1,366,313 |
(United Kingdom) | 1,502,800 | | 4,495,254 |
Asia Satellite Telecommunications Holdings Ltd. | 271,000 | | 513,613 |
Biosensors International Group Ltd. (a) | 1,769,000 | | 1,971,308 |
China Animal Healthcare Ltd. | 2,129,000 | | 477,140 |
China LotSynergy Holdings Ltd. (a) | 7,324,000 | | 103,084 |
China Singyes Solar Tech Holdings Ltd. | 818,000 | | 447,262 |
China Water Affairs Group Ltd. | 1,134,000 | | 325,718 |
G-Resources Group Ltd. (a) | 15,882,000 | | 957,927 |
Imagi International Holdings Ltd. (a) | 17,664,000 | | 461,374 |
Luk Fook Holdings International Ltd. | 757,000 | | 3,245,563 |
Oakley Capital Investments Ltd. (a) | 1,596,500 | | 3,555,975 |
Petra Diamonds Ltd. (a) | 2,629,100 | | 4,862,336 |
Texwinca Holdings Ltd. | 874,000 | | 1,107,283 |
Vtech Holdings Ltd. | 279,100 | | 2,606,039 |
TOTAL BERMUDA | | 26,496,189 |
British Virgin Islands - 0.6% |
Kalahari Energy (a)(i) | 1,451,000 | | 15 |
Playtech Ltd. (e) | 1,183,846 | | 5,183,262 |
TOTAL BRITISH VIRGIN ISLANDS | | 5,183,277 |
Canada - 0.7% |
AirSea Lines (a)(i) | 1,893,338 | | 26 |
Banro Corp. (a) | 794,600 | | 3,379,750 |
Rock Well Petroleum, Inc. (a)(i) | 770,400 | | 8 |
Starfield Resources, Inc. (a) | 4,328,075 | | 86,835 |
Teranga Gold Corp. (a) | 1,338,099 | | 2,886,004 |
TOTAL CANADA | | 6,352,623 |
Cayman Islands - 2.5% |
AirMedia Group, Inc. ADR (a)(e) | 150,900 | | 410,448 |
Airtac International Group | 135,000 | | 755,605 |
China Automation Group Ltd. | 1,589,000 | | 551,626 |
Common Stocks - continued |
| Shares | | Value |
Cayman Islands - continued |
China Corn Oil Co. Ltd. | 967,000 | | $ 410,222 |
China High Precision Automation Group Ltd. | 712,000 | | 251,117 |
China Lilang Ltd. | 340,000 | | 357,894 |
China Metal International Holdings, Inc. | 2,002,000 | | 356,747 |
China Real Estate Information Corp. ADR (a) | 75,300 | | 448,035 |
China ZhengTong Auto Services Holdings Ltd. | 536,500 | | 580,929 |
CNinsure, Inc. ADR (a)(e) | 31,900 | | 240,845 |
Concord Medical Services Holdings Ltd. ADR | 84,800 | | 310,368 |
Ctrip.com International Ltd. sponsored ADR (a) | 21,900 | | 763,434 |
Daphne International Holdings Ltd. | 662,000 | | 691,631 |
EVA Precision Industrial Holdings Ltd. | 11,604,000 | | 2,996,746 |
Fook Woo Group Holdings Ltd. (a) | 2,055,000 | | 388,301 |
Haitian International Holdings Ltd. | 597,000 | | 530,432 |
Kingdee International Software Group Co. Ltd. | 896,400 | | 363,132 |
KongZhong Corp. sponsored ADR (a) | 46,600 | | 238,592 |
Lee's Pharmaceutical Holdings Ltd. | 595,000 | | 225,337 |
Little Sheep Group Ltd. | 614,000 | | 397,728 |
Marwyn Value Investors II Ltd. (a) | 1,971,700 | | 4,455,098 |
Ming Fai International Holdings Ltd. | 8,719,000 | | 1,269,099 |
Minth Group Ltd. | 574,000 | | 595,563 |
MStar Semiconductor, Inc. | 84,000 | | 486,791 |
Orchid Developments Group Ltd. (a) | 1,180,100 | | 66,424 |
Perfect World Co. Ltd. sponsored ADR Class B (a) | 34,900 | | 454,049 |
Shenguan Holdings Group Ltd. | 3,154,000 | | 1,694,504 |
Sino-Life Group Ltd. (a) | 3,020,000 | | 97,440 |
SouFun Holdings Ltd. ADR (e) | 25,400 | | 324,104 |
VisionChina Media, Inc. ADR (a)(e) | 183,500 | | 330,300 |
VST Holdings Ltd. (a) | 1,858,000 | | 295,617 |
WuXi PharmaTech Cayman, Inc. sponsored ADR (a) | 39,000 | | 484,770 |
Xueda Education Group sponsored ADR | 78,600 | | 260,952 |
Yip's Chemical Holdings Ltd. | 592,000 | | 515,290 |
TOTAL CAYMAN ISLANDS | | 22,599,170 |
China - 0.9% |
51job, Inc. sponsored ADR (a) | 12,800 | | 591,104 |
AMVIG Holdings Ltd. | 764,000 | | 476,697 |
Baidu.com, Inc. sponsored ADR (a) | 9,800 | | 1,373,764 |
Beijing Jingkelong Co. Ltd. (H Shares) | 379,000 | | 370,158 |
China Metal Recycling (Holdings) Ltd. | 436,800 | | 467,680 |
Dalian Port (PDA) Co. Ltd. (H Shares) | 1,786,000 | | 456,603 |
People's Food Holdings Ltd. (a) | 866,000 | | 448,715 |
Royale Furniture Holdings Ltd. | 2,335,074 | | 706,687 |
Common Stocks - continued |
| Shares | | Value |
China - continued |
Sino Prosper State Gold Resources Holdings, Ltd. (a) | 74,950,000 | | $ 1,268,788 |
Weiqiao Textile Co. Ltd. (H Shares) | 2,055,500 | | 1,124,065 |
Zhaojin Mining Industry Co. Ltd. (H Shares) | 117,000 | | 208,890 |
Zhongpin, Inc. (a)(e) | 40,200 | | 371,046 |
Zijin Mining Group Co. Ltd. (H Shares) | 1,008,000 | | 429,035 |
TOTAL CHINA | | 8,293,232 |
Cyprus - 0.8% |
Buried Hill Energy (Cyprus) PCL (a)(i) | 1,947,000 | | 4,867,500 |
Mirland Development Corp. PLC (a) | 822,600 | | 2,516,827 |
TOTAL CYPRUS | | 7,384,327 |
Denmark - 1.3% |
DSV de Sammensluttede Vognmaend A/S | 297,600 | | 6,016,482 |
William Demant Holding A/S (a) | 69,800 | | 5,569,201 |
TOTAL DENMARK | | 11,585,683 |
France - 5.0% |
Altamir Amboise (a) | 584,200 | | 5,408,694 |
ALTEN | 125,000 | | 3,567,002 |
Audika SA | 113,900 | | 2,518,867 |
Axway Software SA (a) | 51,625 | | 1,057,369 |
Devoteam SA (e) | 42,500 | | 736,961 |
Faiveley Transport | 45,935 | | 3,152,091 |
Iliad SA | 41,971 | | 4,912,717 |
Ipsos SA | 243,672 | | 8,002,176 |
LeGuide.com SA (a) | 94,400 | | 1,933,474 |
Maisons France Confort | 93,944 | | 3,367,236 |
Pierre & Vacances | 19,190 | | 753,158 |
Sartorius Stedim Biotech | 57,000 | | 3,865,233 |
Sopra Group SA | 41,300 | | 2,623,418 |
SR Teleperformance SA | 153,600 | | 3,248,024 |
Trigano SA | 23,987 | | 439,344 |
TOTAL FRANCE | | 45,585,764 |
Germany - 8.1% |
Bilfinger Berger AG | 74,327 | | 6,663,344 |
CENTROTEC Sustainable AG | 226,778 | | 4,423,548 |
CTS Eventim AG | 239,026 | | 7,914,105 |
Delticom AG | 49,200 | | 5,501,501 |
GFK AG | 142,601 | | 6,591,341 |
HeidelbergCement AG | 129,066 | | 5,890,704 |
Lanxess AG | 131,385 | | 7,743,871 |
Common Stocks - continued |
| Shares | | Value |
Germany - continued |
MTU Aero Engines Holdings AG | 84,500 | | $ 5,678,585 |
Rational AG | 16,720 | | 3,876,907 |
Rheinmetall AG | 60,500 | | 3,224,286 |
RIB Software AG | 413,200 | | 2,573,796 |
Stroer Out-of-Home Media AG (a) | 194,100 | | 2,847,319 |
Tom Tailor Holding AG (a) | 242,500 | | 3,785,520 |
United Internet AG | 331,665 | | 6,547,509 |
Wirecard AG | 41,362 | | 661,132 |
TOTAL GERMANY | | 73,923,468 |
Hong Kong - 0.7% |
Convenience Retail Asia Ltd. | 700,000 | | 296,043 |
Dah Sing Financial Holdings Ltd. | 172,000 | | 533,943 |
GZI Transport Ltd. | 1,294,000 | | 558,606 |
I.T Ltd. | 1,912,000 | | 1,190,786 |
Magnificent Estates Ltd. | 32,558,000 | | 1,035,192 |
REXCAPITAL Financial Holdings Ltd. | 11,300,000 | | 785,838 |
Techtronic Industries Co. Ltd. | 2,059,500 | | 1,781,948 |
Tian An China Investments Co. Ltd. | 750,000 | | 396,123 |
YGM Trading Ltd. | 115,000 | | 269,918 |
TOTAL HONG KONG | | 6,848,397 |
Iceland - 0.8% |
Ossur hf (a) | 4,510,900 | | 7,131,195 |
India - 0.5% |
Ahluwalia Contracts (India) Ltd. | 230,314 | | 501,916 |
Educomp Solutions Ltd. | 44,518 | | 246,144 |
Financial Technologies India Ltd. | 23,352 | | 349,909 |
Geodesic Ltd. | 256,340 | | 308,497 |
Grasim Industries Ltd. | 9,911 | | 526,336 |
Indian Overseas Bank | 186,286 | | 390,401 |
IndusInd Bank Ltd. | 91,917 | | 560,426 |
PI Industries Ltd. | 54,595 | | 648,096 |
Thangamayil Jewellery Ltd. | 253,192 | | 879,907 |
TOTAL INDIA | | 4,411,632 |
Indonesia - 0.6% |
PT AKR Corporindo Tbk | 1,961,000 | | 663,389 |
PT Clipan Finance Indonesia Tbk | 9,427,900 | | 488,389 |
PT Clipan Finance Indonesia Tbk warrants 10/7/14 (a) | 2,275,700 | | 28,221 |
PT Jasa Marga Tbk | 1,205,000 | | 519,366 |
PT Lippo Karawaci Tbk | 5,564,125 | | 398,922 |
Common Stocks - continued |
| Shares | | Value |
Indonesia - continued |
PT Mayora Indah Tbk | 372,500 | | $ 591,391 |
PT Media Nusantara Citra Tbk | 4,202,500 | | 519,145 |
PT Mitra Adiperkasa Tbk | 2,179,500 | | 1,200,384 |
PT Nippon Indosari Corpindo Tbk | 1,712,000 | | 655,041 |
PT Tower Bersama Infrastructure Tbk | 1,675,500 | | 389,945 |
TOTAL INDONESIA | | 5,454,193 |
Ireland - 3.2% |
Elan Corp. PLC (a) | 530,300 | | 6,289,835 |
Elan Corp. PLC sponsored ADR (a) | 170,600 | | 2,045,494 |
James Hardie Industries NV CDI (a) | 162,432 | | 1,052,159 |
Kenmare Resources PLC (a) | 12,870,600 | | 8,397,381 |
Paddy Power PLC (Ireland) | 158,884 | | 8,795,183 |
Petroceltic International PLC (a) | 24,756,300 | | 2,392,766 |
Petroneft Resources PLC (a) | 1,748,000 | | 737,812 |
TOTAL IRELAND | | 29,710,630 |
Isle of Man - 1.6% |
Bahamas Petroleum Co. PLC (a) | 13,324,710 | | 1,547,159 |
Exillon Energy PLC (a) | 1,163,900 | | 5,615,352 |
IBS Group Holding Ltd. GDR (Reg. S) | 343,200 | | 7,361,795 |
TOTAL ISLE OF MAN | | 14,524,306 |
Israel - 0.1% |
Sarin Technologies Ltd. | 851,000 | | 528,817 |
Italy - 1.7% |
Piaggio & C SpA | 1,031,400 | | 3,425,651 |
Salvatore Ferragamo Italia SpA (a) | 477,800 | | 7,742,973 |
Tod's SpA | 41,626 | | 4,164,930 |
TOTAL ITALY | | 15,333,554 |
Japan - 27.8% |
ABC-Mart, Inc. | 68,700 | | 2,690,765 |
Accordia Golf Co. Ltd. | 2,070 | | 1,524,208 |
Aica Kogyo Co. Ltd. | 92,100 | | 1,246,083 |
Air Water, Inc. | 175,000 | | 2,221,768 |
Arc Land Sakamoto Co. Ltd. | 130,000 | | 2,380,159 |
ARCS Co. Ltd. | 310,500 | | 5,528,920 |
Asahi Diamond Industrial Co. Ltd. | 87,600 | | 1,290,167 |
ASAHI INTECC Co. Ltd. | 313,300 | | 7,950,482 |
ASKUL Corp. | 126,000 | | 1,796,666 |
Avex Group Holdings, Inc. | 181,000 | | 2,141,587 |
Common Stocks - continued |
| Shares | | Value |
Japan - continued |
Calbee, Inc. | 42,100 | | $ 1,919,445 |
Chiba Bank Ltd. | 316,000 | | 1,933,645 |
Chiyoda Corp. | 255,000 | | 2,936,882 |
Chugai Ro Co. Ltd. | 404,000 | | 1,187,568 |
Create SD Holdings Co. Ltd. | 48,200 | | 1,028,684 |
Credit Saison Co. Ltd. | 209,900 | | 4,096,484 |
CyberAgent, Inc. (e) | 2,176 | | 7,334,744 |
Dai-ichi Seiko Co. Ltd. | 22,400 | | 614,408 |
Daido Metal Co. Ltd. | 469,000 | | 4,795,740 |
Daihen Corp. | 256,000 | | 876,882 |
Daikyo, Inc. (a) | 512,000 | | 872,963 |
DeNA Co. Ltd. | 50,100 | | 2,162,672 |
Digital Garage, Inc. (a)(e) | 1,179 | | 3,860,534 |
Don Quijote Co. Ltd. | 98,300 | | 3,601,298 |
Ebara Corp. | 1,324,000 | | 4,836,031 |
EDION Corp. | 91,800 | | 734,605 |
Eiken Chemical Co. Ltd. | 41,000 | | 518,641 |
Exedy Corp. | 131,600 | | 3,813,015 |
Fippon Kayaku Co. Ltd. | 139,000 | | 1,360,157 |
FreeBit Co., Ltd. (e) | 215 | | 571,724 |
Fuji Oil Co. Ltd. | 175,900 | | 2,497,057 |
Fuji Seal International, Inc. | 132,100 | | 2,500,401 |
Furuya Metal Co. Ltd. | 33,400 | | 1,393,134 |
Glory Ltd. | 35,700 | | 764,222 |
Hamamatsu Photonics KK | 40,600 | | 1,544,906 |
Hi-Lex Corp. | 48,500 | | 709,390 |
Horiba Ltd. | 65,300 | | 2,071,698 |
Hulic Co. Ltd. | 299,500 | | 3,206,768 |
Ibiden Co. Ltd. | 116,800 | | 2,579,593 |
Isetan Mitsukoshi Holdings Ltd. | 250,100 | | 2,547,835 |
Iwatsuka Confectionary Co. Ltd. | 11,600 | | 406,140 |
Japan Logistics Fund, Inc. | 117 | | 1,008,436 |
Japan Petroleum Exploration Co. Ltd. | 23,000 | | 908,538 |
JP-Holdings, Inc. (e) | 221,400 | | 1,942,742 |
JSP Corp. | 137,000 | | 2,011,165 |
JTEKT Corp. | 399,000 | | 4,363,695 |
KOMERI Co. Ltd. | 118,800 | | 3,743,376 |
Kuraray Co. Ltd. | 352,600 | | 4,936,614 |
Maeda Corp. | 595,000 | | 2,169,453 |
Makino Milling Machine Co. Ltd. | 242,000 | | 1,606,545 |
Maruwa Ceramic Co. Ltd. | 127,000 | | 5,495,324 |
Melco Holdings, Inc. | 83,700 | | 2,329,189 |
Common Stocks - continued |
| Shares | | Value |
Japan - continued |
Message Co. Ltd. | 1,789 | | $ 5,786,154 |
Misumi Group, Inc. | 167,700 | | 3,489,832 |
Mitsubishi UFJ Lease & Finance Co. Ltd. | 97,330 | | 3,772,101 |
Nabtesco Corp. | 194,000 | | 4,249,457 |
Nihon Kohden Corp. | 90,000 | | 2,101,412 |
Nihon M&A Center, Inc. | 534 | | 3,014,528 |
Nippon Ceramic Co. Ltd. | 88,700 | | 1,614,639 |
Nippon Shinyaku Co. Ltd. | 216,000 | | 2,512,334 |
Nippon Shokubai Co. Ltd. | 424,000 | | 4,325,027 |
Nomura Real Estate Holdings, Inc. | 169,000 | | 2,724,733 |
Nomura Real Estate Residential Fund, Inc. | 426 | | 2,069,511 |
NTT Urban Development Co. | 1,270 | | 874,437 |
OSAKA Titanium technologies Co. Ltd. (e) | 60,200 | | 3,316,210 |
Outsourcing, Inc. (e) | 366,300 | | 1,385,167 |
Pigeon Corp. | 62,800 | | 2,320,527 |
Point, Inc. | 82,570 | | 3,561,874 |
Pola Orbis Holdings, Inc. | 162,300 | | 4,339,997 |
Rinnai Corp. | 42,800 | | 3,197,858 |
Saizeriya Co. Ltd. | 77,600 | | 1,257,790 |
Sanken Electric Co. Ltd. (e) | 1,065,000 | | 3,996,185 |
Sankyu, Inc. | 423,000 | | 1,675,070 |
Santen Pharmaceutical Co. Ltd. | 58,000 | | 2,164,464 |
Sawada Holdings Co. Ltd. (a) | 242,900 | | 1,960,516 |
Sekisui Chemical Co. Ltd. | 574,000 | | 4,504,901 |
Shimadzu Corp. | 272,000 | | 2,315,897 |
Shimamura Co. Ltd. | 40,000 | | 4,000,936 |
Shin-Kobe Electric Machinery Co. Ltd. (e) | 448,000 | | 7,689,356 |
Shinsei Bank Ltd. | 1,522,000 | | 1,673,019 |
SHO-BI Corp. (e) | 183,200 | | 1,099,948 |
SHO-BOND Holdings Co. Ltd. | 111,700 | | 2,492,015 |
So-net M3, Inc. (e) | 1,201 | | 5,432,129 |
Sony Financial Holdings, Inc. | 202,800 | | 3,373,984 |
SRI Sports Ltd. | 66,500 | | 708,305 |
Sumitomo Mitsui Trust Holdings, Inc. | 644,800 | | 2,206,868 |
Sysmex Corp. | 47,800 | | 1,571,390 |
SystemPro Co. Ltd. | 2,036 | | 1,411,697 |
Takata Corp. | 60,200 | | 1,464,305 |
Tera Probe, Inc. | 38,400 | | 553,267 |
The Suruga Bank Ltd. | 308,000 | | 2,567,830 |
Toho Co. Ltd. | 116,400 | | 2,002,433 |
Tokyu Livable, Inc. (e) | 157,200 | | 1,415,516 |
Toshiba Plant Systems & Services Corp. | 249,000 | | 2,662,195 |
Common Stocks - continued |
| Shares | | Value |
Japan - continued |
Toto Ltd. | 529,000 | | $ 4,399,195 |
Tsubakimoto Chain Co. | 404,000 | | 2,073,675 |
Xebio Co. Ltd. | 54,100 | | 1,310,126 |
Yamatake Corp. | 66,700 | | 1,475,835 |
Yamato Kogyo Co. Ltd. | 80,000 | | 2,023,821 |
TOTAL JAPAN | | 254,701,614 |
Korea (South) - 0.5% |
Daou Technology, Inc. | 190,310 | | 1,708,661 |
Duksan Hi-Metal Co. Ltd. (a) | 55,341 | | 1,242,745 |
KC Tech Co. Ltd. | 129,924 | | 595,482 |
Medy-Tox, Inc. | 24,874 | | 453,187 |
TK Corp. (a) | 33,575 | | 619,360 |
TOTAL KOREA (SOUTH) | | 4,619,435 |
Luxembourg - 0.9% |
GlobeOp Financial Services SA | 1,176,485 | | 5,392,266 |
SAF-Holland SA (a)(e) | 420,100 | | 2,608,636 |
TOTAL LUXEMBOURG | | 8,000,902 |
Malaysia - 0.3% |
JobStreet Corp. Bhd | 1,223,100 | | 943,764 |
Lion Industries Corp. Bhd | 722,500 | | 357,160 |
Muhibbah Engineering (M) Bhd | 1,050,100 | | 412,133 |
Top Glove Corp. Bhd | 222,000 | | 308,230 |
WCT Bhd | 560,100 | | 471,811 |
TOTAL MALAYSIA | | 2,493,098 |
Netherlands - 1.1% |
Gemalto NV | 167,770 | | 7,654,873 |
SMARTRAC NV (a) | 24,426 | | 354,933 |
Wavin NV (a) | 296,512 | | 2,203,952 |
TOTAL NETHERLANDS | | 10,213,758 |
Norway - 1.3% |
Aker Solutions ASA | 389,100 | | 4,525,150 |
Schibsted ASA (B Shares) | 214,200 | | 5,605,457 |
Sevan Drilling ASA | 2,350,000 | | 1,890,940 |
Sevan Marine ASA (a)(e) | 2,052,500 | | 103,222 |
TOTAL NORWAY | | 12,124,769 |
Common Stocks - continued |
| Shares | | Value |
Philippines - 0.2% |
Alliance Global Group, Inc. | 3,295,000 | | $ 819,210 |
Belle Corp. (a) | 7,310,000 | | 653,245 |
TOTAL PHILIPPINES | | 1,472,455 |
Poland - 0.6% |
Warsaw Stock Exchange | 424,200 | | 5,988,737 |
Singapore - 2.3% |
CSE Global Ltd. | 1,069,000 | | 711,508 |
First (REIT) | 997,000 | | 629,207 |
Goodpack Ltd. | 1,516,000 | | 2,019,759 |
Hyflux Ltd. | 597,000 | | 677,731 |
OSIM International Ltd. | 1,036,000 | | 1,018,129 |
Pertama Holdings Ltd. (f) | 23,060,000 | | 11,809,703 |
Petra Foods Ltd. | 370,000 | | 481,007 |
Raffles Medical Group Ltd. | 436,205 | | 775,556 |
Sakari Resources Ltd. | 627,000 | | 1,170,802 |
Venture Corp. Ltd. | 259,000 | | 1,380,859 |
Yanlord Land Group Ltd. | 668,000 | | 541,882 |
TOTAL SINGAPORE | | 21,216,143 |
South Africa - 0.3% |
Blue Label Telecoms Ltd. | 3,254,300 | | 2,329,098 |
Sweden - 1.3% |
Elekta AB (B Shares) (e) | 180,000 | | 7,203,258 |
Modern Times Group MTG AB (B Shares) | 87,500 | | 4,641,041 |
TOTAL SWEDEN | | 11,844,299 |
Switzerland - 0.9% |
Leclanche SA (a) | 77,770 | | 1,542,018 |
VZ Holding AG | 57,960 | | 6,604,752 |
TOTAL SWITZERLAND | | 8,146,770 |
Taiwan - 0.2% |
Lung Yen Life Service Co. Ltd. | 121,000 | | 374,623 |
Pacific Hospital Supply Co. Ltd. | 91,000 | | 297,779 |
Tong Hsing Electronics Industries Ltd. | 216,721 | | 549,116 |
Topoint Technology Co. Ltd. | 557,000 | | 397,056 |
WPG Holding Co. Ltd. | 294,000 | | 355,006 |
TOTAL TAIWAN | | 1,973,580 |
Thailand - 0.2% |
TISCO Financial Group PCL | 401,300 | | 445,721 |
Common Stocks - continued |
| Shares | | Value |
Thailand - continued |
Toyo-Thai Corp. PCL | 5,714,500 | | $ 1,729,343 |
Toyo-Thai Corp. PCL NVDR | 168,000 | | 50,949 |
TOTAL THAILAND | | 2,226,013 |
United Kingdom - 18.2% |
African Barrick Gold Ltd. | 660,600 | | 5,736,835 |
Amerisur Resources PLC (a) | 8,152,624 | | 1,671,659 |
Ashmore Group PLC | 1,196,700 | | 6,639,639 |
ASOS PLC (a) | 38,570 | | 965,160 |
Aurelian Oil & Gas PLC (a) | 5,996,200 | | 1,856,295 |
Avanti Communications Group PLC (a)(e) | 494,400 | | 2,466,779 |
Aveva Group PLC | 203,000 | | 5,161,405 |
Bond International Software PLC | 843,266 | | 596,702 |
Borders & Southern Petroleum PLC (a) | 698,500 | | 544,814 |
Bowleven PLC (a)(e) | 450,100 | | 785,378 |
Brammer PLC | 1,380,200 | | 5,923,658 |
Cadogan Petroleum PLC (a) | 1,723,100 | | 1,177,713 |
Central Asia Metals PLC (a) | 1,538,400 | | 1,682,357 |
Ceres Power Holdings PLC (a) | 233,800 | | 59,220 |
China Goldmines PLC (a) | 669,353 | | 232,514 |
Cove Energy PLC (a) | 2,959,800 | | 4,402,954 |
Craneware PLC | 847,300 | | 7,630,716 |
Faroe Petroleum PLC (a) | 480,947 | | 1,237,534 |
GoIndustry-DoveBid PLC (a) | 117,989 | | 92,977 |
ICAP PLC | 897,900 | | 5,835,215 |
IG Group Holdings PLC | 994,884 | | 7,457,472 |
International Personal Finance PLC | 1,431,100 | | 6,310,699 |
Jazztel PLC (a)(e) | 409,000 | | 2,365,943 |
Johnson Matthey PLC | 187,700 | | 5,671,933 |
Jubilee Platinum PLC (a) | 2,985,047 | | 774,089 |
Keronite PLC (a)(i) | 13,620,267 | | 219 |
London Mining PLC (a) | 1,736,500 | | 8,915,501 |
Michael Page International PLC | 970,400 | | 6,270,480 |
Moneysupermarket.com Group PLC | 3,920,400 | | 6,746,122 |
Monitise PLC (a) | 4,772,600 | | 2,916,612 |
Mothercare PLC | 547,400 | | 1,481,593 |
Nautical Petroleum PLC (a) | 435,207 | | 2,071,704 |
NCC Group Ltd. | 239,415 | | 2,552,730 |
Ocado Group PLC (a)(e) | 1,180,900 | | 1,778,529 |
Pureprofile Media PLC (a)(i) | 1,108,572 | | 713,122 |
Regenersis PLC (a) | 1,425,100 | | 1,781,910 |
Robert Walters PLC | 937,800 | | 3,091,748 |
Common Stocks - continued |
| Shares | | Value |
United Kingdom - continued |
Rockhopper Exploration PLC (a) | 1,154,500 | | $ 3,973,267 |
Royalblue Group PLC | 202,542 | | 5,299,595 |
SDL PLC | 495,062 | | 5,246,686 |
Serco Group PLC | 481,786 | | 4,025,129 |
Silverdell PLC (a) | 6,644,400 | | 1,081,909 |
Sinclair Pharma PLC (a) | 4,408,649 | | 1,807,947 |
Sphere Medical Holding PLC (i) | 568,406 | | 1,553,988 |
Sthree PLC | 1,128,809 | | 5,175,565 |
Synergy Health PLC | 299,653 | | 4,016,653 |
Ted Baker PLC | 486,475 | | 6,033,867 |
TMO Renewables Ltd. (i) | 1,000,000 | | 562,870 |
Travis Perkins PLC | 405,400 | | 5,610,153 |
Valiant Petroleum PLC (a) | 437,400 | | 3,427,446 |
Wolfson Microelectronics PLC (a) | 1,756,400 | | 3,304,832 |
Zenergy Power PLC (a) | 855,520 | | 159,942 |
TOTAL UNITED KINGDOM | | 166,879,779 |
United States of America - 0.7% |
ChinaCast Education Corp. (a)(e) | 70,100 | | 281,802 |
CTC Media, Inc. | 192,200 | | 2,212,222 |
KIT Digital, Inc. (a)(e) | 428,400 | | 3,855,600 |
Mudalla Technology, Inc. (a) | 996,527 | | 16 |
XL TechGroup, Inc. (a) | 1,329,250 | | 21 |
YOU On Demand Holdings, Inc. (a) | 6,523,000 | | 455,958 |
TOTAL UNITED STATES OF AMERICA | | 6,805,619 |
TOTAL COMMON STOCKS (Cost $894,072,982) |
898,856,611
|
Convertible Bonds - 0.1% |
| Principal Amount (d) | | |
France - 0.1% |
Pierre Et Vacances La Defense 4% 10/1/15 (h) | EUR | 1,196,800 | | 1,075,042 |
United Kingdom - 0.0% |
Sphere Medical Holding PLC 8% 12/31/12 (i) | GBP | 101,923 | | 163,913 |
TOTAL CONVERTIBLE BONDS (Cost $1,416,277) |
1,238,955
|
Government Obligations - 0.1% |
| Principal Amount (d) | | Value |
Germany - 0.1% |
German Federal Republic 0.1521% to 0.2372% 11/9/11 to 11/23/11 (g)
(Cost $747,359) | EUR | 550,000 | | $ 760,975 |
Money Market Funds - 4.1% |
| Shares | | |
Fidelity Cash Central Fund, 0.12% (b) | 2,652,401 | | 2,652,401 |
Fidelity Securities Lending Cash Central Fund, 0.11% (b)(c) | 34,344,415 | | 34,344,415 |
TOTAL MONEY MARKET FUNDS (Cost $36,996,816) |
36,996,816
|
TOTAL INVESTMENT PORTFOLIO - 102.5% (Cost $933,233,434) | 937,853,357 |
NET OTHER ASSETS (LIABILITIES) - (2.5)% | (22,869,202) |
NET ASSETS - 100% | $ 914,984,155 |
Futures Contracts |
| Expiration Date | | Underlying Face Amount at Value | | Unrealized Appreciation/
(Depreciation) |
Purchased |
Equity Index Contracts |
86 Eurex EURO STOXX 50 Index Contracts (Germany) | Dec. 2011 | | $ 2,842,088 | | $ (113,279) |
|
The face value of futures purchased as a percentage of net assets is 0.3% |
Currency Abbreviations |
EUR | - | European Monetary Unit |
GBP | - | British pound |
Legend |
(a) Non-income producing |
(b) Affiliated fund that is available only to investment companies and other accounts managed by Fidelity Investments. The rate quoted is the annualized seven-day yield of the fund at period end. A complete unaudited listing of the fund's holdings as of its most recent quarter end is available upon request. In addition, each Fidelity Central Fund's financial statements, which are not covered by the Fund's Report of Independent Registered Public Accounting Firm, are available on the SEC's website or upon request. |
(c) Investment made with cash collateral received from securities on loan. |
(d) Principal amount is stated in United States dollars unless otherwise noted. |
(e) Security or a portion of the security is on loan at period end. |
(f) Affiliated company |
(g) Security or a portion of the security was pledged to cover margin requirements for futures contracts. At the period end, the value of securities pledged amounted to $691,784. |
(h) Principal amount shown represents units. |
(i) Restricted securities - Investment in securities not registered under the Securities Act of 1933 (excluding 144A issues). At the end of the period, the value of restricted securities (excluding 144A issues) amounted to $11,914,245 or 1.3% of net assets. |
Additional information on each restricted holding is as follows: |
Security | Acquisition Date | Acquisition Cost |
AirSea Lines | 8/4/06 | $ 1,199,182 |
Buried Hill Energy (Cyprus) PCL | 8/18/06 | $ 2,141,700 |
Kalahari Energy | 9/1/06 | $ 1,813,750 |
Keronite PLC | 8/16/06 | $ 1,548,992 |
LXB Retail Properties PLC | 5/26/11 | $ 4,661,808 |
Pureprofile Media PLC | 5/3/05 - 1/11/06 | $ 1,173,341 |
Rock Well Petroleum, Inc. | 4/13/06 | $ 1,004,171 |
Sphere Medical Holding PLC | 8/27/08 - 8/22/11 | $ 1,697,579 |
Sphere Medical Holding PLC 8% 12/31/12 | 4/21/11 - 10/24/11 | $ 166,822 |
TMO Renewables Ltd. | 10/27/05 | $ 535,065 |
Affiliated Central Funds |
Information regarding fiscal year to date income earned by the Fund from investments in Fidelity Central Funds is as follows: |
Fund | Income earned |
Fidelity Cash Central Fund | $ 63,355 |
Fidelity Securities Lending Cash Central Fund | 916,949 |
Total | $ 980,304 |
Other Affiliated Issuers |
An affiliated company is a company in which the Fund has ownership of at least 5% of the voting securities. Fiscal year to date transactions with companies which are or were affiliates are as follows: |
Affiliate | Value, beginning of period | Purchases | Sales Proceeds | Dividend Income | Value,
end of
period |
Centurion Electronics PLC | $ 12 | $ - | $ 109 | $ - | $ - |
Pertama Holdings Ltd. | 7,080,399 | 1,144,853 | 223,172 | 1,146,797 | 11,809,703 |
Total | $ 7,080,411 | $ 1,144,853 | $ 223,281 | $ 1,146,797 | $ 11,809,703 |
Other Information |
The following is a summary of the inputs used, as of October 31, 2011, involving the Fund's assets and liabilities carried at fair value. The inputs or methodology used for valuing securities may not be an indication of the risk associated with investing in those securities. For more information on valuation inputs, and their aggregation into the levels used in the tables below, please refer to the Security Valuation section in the accompanying Notes to Financial Statements. |
Valuation Inputs at Reporting Date: |
Description | Total | Level 1 | Level 2 | Level 3 |
Investments in Securities: | | | | |
Equities: | | | | |
Japan | $ 254,701,614 | $ - | $ 254,701,614 | $ - |
United Kingdom | 166,879,779 | 163,817,066 | - | 3,062,713 |
Germany | 73,923,468 | 73,923,468 | - | - |
Australia | 68,994,802 | 6,438,920 | 62,555,882 | - |
France | 45,585,764 | 45,585,764 | - | - |
Ireland | 29,710,630 | 22,368,636 | 7,341,994 | - |
Bermuda | 26,496,189 | 12,913,565 | 13,582,624 | - |
Cayman Islands | 22,599,170 | 8,787,419 | 13,560,634 | 251,117 |
Singapore | 21,216,143 | - | 21,216,143 | - |
Cyprus | 7,384,327 | 2,516,827 | - | 4,867,500 |
United States of America | 6,805,619 | 6,805,582 | - | 37 |
Canada | 6,352,623 | 6,352,589 | - | 34 |
British Virgin Islands | 5,183,277 | 5,183,262 | - | 15 |
Other | 163,023,206 | 128,510,723 | 34,512,483 | - |
Corporate Bonds | 1,238,955 | - | 1,075,042 | 163,913 |
Government Obligations | 760,975 | - | 760,975 | - |
Money Market Funds | 36,996,816 | 36,996,816 | - | - |
Total Investments in Securities: | $ 937,853,357 | $ 520,200,637 | $ 409,307,391 | $ 8,345,329 |
Derivative Instruments: | | | | |
Liabilities | | | | |
Futures Contracts | $ (113,279) | $ (113,279) | $ - | $ - |
Transfers from Level 1 to Level 2 during the period were $210,157,354. |
The following is a reconciliation of Investments in Securities for which Level 3 inputs were used in determining value: |
Investments in Securities: | |
Beginning Balance | $ 8,166,674 |
Total Realized Gain (Loss) | (5,310,046) |
Total Unrealized Gain (Loss) | 5,514,712 |
Cost of Purchases | 202,673 |
Proceeds of Sales | (158,598) |
Amortization/Accretion | - |
Transfers in to Level 3 | 453,769 |
Transfers out of Level 3 | (523,855) |
Ending Balance | $ 8,345,329 |
The change in unrealized gain (loss) for the period attributable to Level 3 securities held at October 31, 2011 | $ 205,883 |
The information used in the above reconciliation represents fiscal year to date activity for any Investments in Securities identified as using Level 3 inputs at either the beginning or the end of the current fiscal period. Transfers in or out of Level 3 represent the beginning value of any Security or Instrument where a change in the pricing level occurred from the beginning to the end of the period. The cost of purchases and the proceeds of sales may include securities received or delivered through corporate actions or exchanges. Realized and unrealized gains (losses) disclosed in the reconciliation are included in Net Gain (Loss) on the Fund's Statement of Operations. |
Value of Derivative Instruments |
The following table is a summary of the Fund's value of derivative instruments by risk exposure as of October 31, 2011. For additional information on derivative instruments, please refer to the Derivative Instruments section in the accompanying Notes to Financial Statements. |
Risk Exposure /
Derivative Type | Value |
| Asset | Liability |
Equity Risk | | |
Futures Contracts (a) | $ - | $ (113,279) |
Total Value of Derivatives | $ - | $ (113,279) |
(a) Reflects cumulative appreciation/(depreciation) on futures contracts as disclosed on the Schedule of Investments. Only the period end variation margin is separately disclosed on the Statement of Assets and Liabilities. |
Income Tax Information |
At October 31, 2011, the Fund had a capital loss carryforward of approximately $65,361,612 all of which will expire in fiscal 2017. Capital loss carryforwards are only available to offset future capital gains of the Fund to the extent provided by regulations and may be limited. |
See accompanying notes which are an integral part of the financial statements.
Annual Report
Financial Statements
Statement of Assets and Liabilities
| October 31, 2011 |
| | |
Assets | | |
Investment in securities, at value (including securities loaned of $32,083,640) - See accompanying schedule: Unaffiliated issuers (cost $889,824,332) | $ 889,046,838 | |
Fidelity Central Funds (cost $36,996,816) | 36,996,816 | |
Other affiliated issuers (cost $6,412,286) | 11,809,703 | |
Total Investments (cost $933,233,434) | | $ 937,853,357 |
Foreign currency held at value (cost $685,308) | | 675,490 |
Receivable for investments sold | | 16,030,490 |
Receivable for fund shares sold | | 676,296 |
Dividends receivable | | 3,020,183 |
Interest receivable | | 8,399 |
Distributions receivable from Fidelity Central Funds | | 90,125 |
Prepaid expenses | | 4,727 |
Other receivables | | 47,683 |
Total assets | | 958,406,750 |
| | |
Liabilities | | |
Payable to custodian bank | $ 2,590,473 | |
Payable for investments purchased | 694,635 | |
Payable for fund shares redeemed | 4,600,143 | |
Accrued management fee | 724,220 | |
Distribution and service plan fees payable | 19,270 | |
Payable for daily variation margin on futures contracts | 82,870 | |
Other affiliated payables | 249,776 | |
Other payables and accrued expenses | 116,793 | |
Collateral on securities loaned, at value | 34,344,415 | |
Total liabilities | | 43,422,595 |
| | |
Net Assets | | $ 914,984,155 |
Net Assets consist of: | | |
Paid in capital | | $ 981,093,471 |
Undistributed net investment income | | 8,017,124 |
Accumulated undistributed net realized gain (loss) on investments and foreign currency transactions | | (78,629,647) |
Net unrealized appreciation (depreciation) on investments and assets and liabilities in foreign currencies | | 4,503,207 |
Net Assets | | $ 914,984,155 |
See accompanying notes which are an integral part of the financial statements.
Annual Report
Financial Statements - continued
Statement of Assets and Liabilities - continued
| October 31, 2011 |
| | |
Calculation of Maximum Offering Price Class A:
Net Asset Value and redemption price per share ($17,185,173 ÷ 905,703 shares) | | $ 18.97 |
| | |
Maximum offering price per share (100/94.25 of $18.97) | | $ 20.13 |
Class T:
Net Asset Value and redemption price per share ($13,743,891 ÷ 731,123 shares) | | $ 18.80 |
| | |
Maximum offering price per share (100/96.50 of $18.80) | | $ 19.48 |
Class B:
Net Asset Value and offering price per share ($2,067,349 ÷ 112,497 shares)A | | $ 18.38 |
| | |
Class C:
Net Asset Value and offering price per share ($9,544,545 ÷ 519,249 shares)A | | $ 18.38 |
| | |
International Small Cap:
Net Asset Value, offering price and redemption price per share ($856,691,635 ÷ 44,550,818 shares) | | $ 19.23 |
| | |
Institutional Class:
Net Asset Value, offering price and redemption price per share ($15,751,562 ÷ 818,833 shares) | | $ 19.24 |
A Redemption price per share is equal to net asset value less any applicable contingent deferred sales charge.
See accompanying notes which are an integral part of the financial statements.
Annual Report
Statement of Operations
| Year ended October 31, 2011 |
| | |
Investment Income | | |
Dividends (including $1,146,797 earned from other affiliated issuers) | | $ 21,550,414 |
Interest | | 63,975 |
Income from Fidelity Central Funds | | 980,304 |
Income before foreign taxes withheld | | 22,594,693 |
Less foreign taxes withheld | | (1,429,635) |
Total income | | 21,165,058 |
| | |
Expenses | | |
Management fee
Basic fee | $ 8,945,294 | |
Performance adjustment | 442,233 | |
Transfer agent fees | 2,603,163 | |
Distribution and service plan fees | 287,441 | |
Accounting and security lending fees | 491,914 | |
Custodian fees and expenses | 359,301 | |
Independent trustees' compensation | 5,687 | |
Registration fees | 122,881 | |
Audit | 145,078 | |
Legal | 3,942 | |
Miscellaneous | 9,145 | |
Total expenses before reductions | 13,416,079 | |
Expense reductions | (268,142) | 13,147,937 |
Net investment income (loss) | | 8,017,121 |
Realized and Unrealized Gain (Loss) Net realized gain (loss) on: | | |
Investment securities: | | |
Unaffiliated issuers (net of foreign taxes of $21,350) | 37,978,566 | |
Other affiliated issuers | (210,119) | |
Foreign currency transactions | 4,325 | |
Futures contracts | (2,512,331) | |
Total net realized gain (loss) | | 35,260,441 |
Change in net unrealized appreciation (depreciation) on: Investment securities (net of decrease in deferred foreign taxes of $17,178) | (96,611,078) | |
Assets and liabilities in foreign currencies | (53,087) | |
Futures contracts | (166,462) | |
Total change in net unrealized appreciation (depreciation) | | (96,830,627) |
Net gain (loss) | | (61,570,186) |
Net increase (decrease) in net assets resulting from operations | | $ (53,553,065) |
See accompanying notes which are an integral part of the financial statements.
Annual Report
Financial Statements - continued
Statement of Changes in Net Assets
| Year ended
October 31,
2011 | Year ended
October 31,
2010 |
Increase (Decrease) in Net Assets | | |
Operations | | |
Net investment income (loss) | $ 8,017,121 | $ 2,524,061 |
Net realized gain (loss) | 35,260,441 | 45,718,988 |
Change in net unrealized appreciation (depreciation) | (96,830,627) | 97,376,459 |
Net increase (decrease) in net assets resulting
from operations | (53,553,065) | 145,619,508 |
Distributions to shareholders from net investment income | (2,430,566) | (3,368,409) |
Distributions to shareholders from net realized gain | (28,246,937) | (14,323,742) |
Total distributions | (30,677,503) | (17,692,151) |
Share transactions - net increase (decrease) | 129,451,482 | 26,936,768 |
Redemption fees | 283,575 | 118,859 |
Total increase (decrease) in net assets | 45,504,489 | 154,982,984 |
| | |
Net Assets | | |
Beginning of period | 869,479,666 | 714,496,682 |
End of period (including undistributed net investment income of $8,017,124 and undistributed net investment income of $2,441,101, respectively) | $ 914,984,155 | $ 869,479,666 |
See accompanying notes which are an integral part of the financial statements.
Annual Report
Financial Highlights - Class A
Years ended October 31, | 2011 | 2010 | 2009 | 2008 | 2007 |
Selected Per-Share Data | | | | | |
Net asset value, beginning of period | $ 20.42 | $ 17.28 | $ 11.91 | $ 31.14 | $ 28.79 |
Income from Investment Operations | | | | | |
Net investment income (loss) C | .10 | .03 | .06 | - H | .03 |
Net realized and unrealized gain (loss) | (.88) | 3.51 | 5.31 | (14.03) | 7.97 |
Total from investment operations | (.78) | 3.54 | 5.37 | (14.03) | 8.00 |
Distributions from net investment income | (.02) | (.06) | - | (.03) | - |
Distributions from net realized gain | (.66) | (.34) | - | (5.18) | (5.65) |
Total distributions | (.68) | (.40) | - | (5.20) I | (5.65) |
Redemption fees added to paid in capital C | .01 | - H | - H | - H | - H |
Net asset value, end of period | $ 18.97 | $ 20.42 | $ 17.28 | $ 11.91 | $ 31.14 |
Total Return A,B | (4.00)% | 20.85% | 45.09% | (53.35)% | 33.43% |
Ratios to Average Net Assets D,G | | | | | |
Expenses before reductions | 1.56% | 1.71% | 1.75% | 1.82% | 1.53% |
Expenses net of fee waivers, if any | 1.55% | 1.65% | 1.65% | 1.65% | 1.53% |
Expenses net of all reductions | 1.54% | 1.63% | 1.62% | 1.60% | 1.49% |
Net investment income (loss) | .49% | .16% | .41% | -% F | .10% |
Supplemental Data | | | | | |
Net assets, end of period (000 omitted) | $ 17,185 | $ 19,720 | $ 17,590 | $ 13,561 | $ 38,585 |
Portfolio turnover rate E | 47% | 66% | 81% | 113% | 70% |
A Total returns would have been lower if certain expenses had not been reduced during the applicable periods shown.
B Total returns do not include the effect of the sales charges.
C Calculated based on average shares outstanding during the period.
D Fees and expenses of any underlying Fidelity Central Funds are not included in the Fund's expense ratio. The Fund indirectly bears its proportionate share of the expenses of any underlying Fidelity Central Funds.
E Amount does not include the portfolio activity of any underlying Fidelity Central Funds.
F Amount represents less than .01%.
G Expense ratios reflect operating expenses of the class. Expenses before reductions do not reflect amounts reimbursed by the investment adviser or reductions from brokerage service arrangements or reductions from other expense offset arrangements and do not represent the amount paid by the class during periods when reimbursements or reductions occur. Expenses net of fee waivers reflect expenses after reimbursement by the investment adviser but prior to reductions from brokerage service arrangements or other expense offset arrangements. Expenses net of all reductions represent the net expenses paid by the class.
H Amount represents less than $.01 per share.
I Total distributions of $5.20 per share is comprised of distributions from net investment income of $.026 and distributions from net realized gain of $5.176 per share.
See accompanying notes which are an integral part of the financial statements.
Annual Report
Financial Highlights - Class T
Years ended October 31, | 2011 | 2010 | 2009 | 2008 | 2007 |
Selected Per-Share Data | | | | | |
Net asset value, beginning of period | $ 20.23 | $ 17.14 | $ 11.84 | $ 30.96 | $ 28.64 |
Income from Investment Operations | | | | | |
Net investment income (loss) C | .05 | (.02) | .02 | (.05) | (.04) |
Net realized and unrealized gain (loss) | (.86) | 3.47 | 5.28 | (13.95) | 7.93 |
Total from investment operations | (.81) | 3.45 | 5.30 | (14.00) | 7.89 |
Distributions from net investment income | - | (.02) | - | - | - |
Distributions from net realized gain | (.63) | (.34) | - | (5.12) | (5.57) |
Total distributions | (.63) | (.36) | - | (5.12) | (5.57) |
Redemption fees added to paid in capital C | .01 | - G | - G | - G | - G |
Net asset value, end of period | $ 18.80 | $ 20.23 | $ 17.14 | $ 11.84 | $ 30.96 |
Total Return A,B | (4.18)% | 20.46% | 44.76% | (53.46)% | 33.07% |
Ratios to Average Net Assets D,F | | | | | |
Expenses before reductions | 1.82% | 1.97% | 2.00% | 2.07% | 1.77% |
Expenses net of fee waivers, if any | 1.81% | 1.90% | 1.90% | 1.90% | 1.77% |
Expenses net of all reductions | 1.79% | 1.88% | 1.86% | 1.86% | 1.73% |
Net investment income (loss) | .24% | (.09)% | .16% | (.25)% | (.14)% |
Supplemental Data | | | | | |
Net assets, end of period (000 omitted) | $ 13,744 | $ 16,092 | $ 15,760 | $ 13,493 | $ 40,823 |
Portfolio turnover rate E | 47% | 66% | 81% | 113% | 70% |
A Total returns would have been lower if certain expenses had not been reduced during the applicable periods shown.
B Total returns do not include the effect of the sales charges.
C Calculated based on average shares outstanding during the period.
D Fees and expenses of any underlying Fidelity Central Funds are not included in the Fund's expense ratio. The Fund indirectly bears its proportionate share of the expenses of any underlying Fidelity Central Funds.
E Amount does not include the portfolio activity of any underlying Fidelity Central Funds.
F Expense ratios reflect operating expenses of the class. Expenses before reductions do not reflect amounts reimbursed by the investment adviser or reductions from brokerage service arrangements or reductions from other expense offset arrangements and do not represent the amount paid by the class during periods when reimbursements or reductions occur. Expenses net of fee waivers reflect expenses after reimbursement by the investment adviser but prior to reductions from brokerage service arrangements or other expense offset arrangements. Expenses net of all reductions represent the net expenses paid by the class.
G Amount represents less than $.01 per share.
See accompanying notes which are an integral part of the financial statements.
Annual Report
Financial Highlights - Class B
Years ended October 31, | 2011 | 2010 | 2009 | 2008 | 2007 |
Selected Per-Share Data | | | | | |
Net asset value, beginning of period | $ 19.79 | $ 16.78 | $ 11.65 | $ 30.49 | $ 28.26 |
Income from Investment Operations | | | | | |
Net investment income (loss) C | (.05) | (.10) | (.04) | (.16) | (.18) |
Net realized and unrealized gain (loss) | (.85) | 3.39 | 5.17 | (13.73) | 7.82 |
Total from investment operations | (.90) | 3.29 | 5.13 | (13.89) | 7.64 |
Distributions from net realized gain | (.52) | (.28) | - | (4.95) | (5.41) |
Redemption fees added to paid in capital C | .01 | - G | - G | - G | - G |
Net asset value, end of period | $ 18.38 | $ 19.79 | $ 16.78 | $ 11.65 | $ 30.49 |
Total Return A,B | (4.68)% | 19.90% | 44.03% | (53.68)% | 32.38% |
Ratios to Average Net Assets D,F | | | | | |
Expenses before reductions | 2.32% | 2.47% | 2.49% | 2.58% | 2.30% |
Expenses net of fee waivers, if any | 2.30% | 2.40% | 2.40% | 2.40% | 2.30% |
Expenses net of all reductions | 2.29% | 2.38% | 2.36% | 2.36% | 2.26% |
Net investment income (loss) | (.26)% | (.59)% | (.33)% | (.75)% | (.66)% |
Supplemental Data | | | | | |
Net assets, end of period (000 omitted) | $ 2,067 | $ 3,457 | $ 3,601 | $ 3,230 | $ 10,704 |
Portfolio turnover rate E | 47% | 66% | 81% | 113% | 70% |
A Total returns would have been lower if certain expenses had not been reduced during the applicable periods shown.
B Total returns do not include the effect of the contingent deferred sales charge.
C Calculated based on average shares outstanding during the period.
D Fees and expenses of any underlying Fidelity Central Funds are not included in the Fund's expense ratio. The Fund indirectly bears its proportionate share of the expenses of any underlying Fidelity Central Funds.
E Amount does not include the portfolio activity of any underlying Fidelity Central Funds.
F Expense ratios reflect operating expenses of the class. Expenses before reductions do not reflect amounts reimbursed by the investment adviser or reductions from brokerage service arrangements or reductions from other expense offset arrangements and do not represent the amount paid by the class during periods when reimbursements or reductions occur. Expenses net of fee waivers reflect expenses after reimbursement by the investment adviser but prior to reductions from brokerage service arrangements or other expense offset arrangements. Expenses net of all reductions represent the net expenses paid by the class.
G Amount represents less than $.01 per share.
See accompanying notes which are an integral part of the financial statements.
Annual Report
Financial Highlights - Class C
Years ended October 31, | 2011 | 2010 | 2009 | 2008 | 2007 |
Selected Per-Share Data | | | | | |
Net asset value, beginning of period | $ 19.85 | $ 16.85 | $ 11.70 | $ 30.62 | $ 28.33 |
Income from Investment Operations | | | | | |
Net investment income (loss) C | (.04) | (.10) | (.04) | (.16) | (.17) |
Net realized and unrealized gain (loss) | (.85) | 3.40 | 5.19 | (13.78) | 7.85 |
Total from investment operations | (.89) | 3.30 | 5.15 | (13.94) | 7.68 |
Distributions from net realized gain | (.59) | (.30) | - | (4.98) | (5.39) |
Redemption fees added to paid in capital C | .01 | - G | - G | - G | - G |
Net asset value, end of period | $ 18.38 | $ 19.85 | $ 16.85 | $ 11.70 | $ 30.62 |
Total Return A,B | (4.64)% | 19.86% | 44.02% | (53.67)% | 32.39% |
Ratios to Average Net Assets D,F | | | | | |
Expenses before reductions | 2.27% | 2.42% | 2.49% | 2.57% | 2.26% |
Expenses net of fee waivers, if any | 2.26% | 2.40% | 2.40% | 2.40% | 2.26% |
Expenses net of all reductions | 2.24% | 2.37% | 2.36% | 2.36% | 2.22% |
Net investment income (loss) | (.21)% | (.59)% | (.33)% | (.76)% | (.62)% |
Supplemental Data | | | | | |
Net assets, end of period (000 omitted) | $ 9,545 | $ 13,501 | $ 5,814 | $ 5,658 | $ 20,094 |
Portfolio turnover rate E | 47% | 66% | 81% | 113% | 70% |
A Total returns would have been lower if certain expenses had not been reduced during the applicable periods shown.
B Total returns do not include the effect of the contingent deferred sales charge.
C Calculated based on average shares outstanding during the period.
D Fees and expenses of any underlying Fidelity Central Funds are not included in the Fund's expense ratio. The Fund indirectly bears its proportionate share of the expenses of any underlying Fidelity Central Funds.
E Amount does not include the portfolio activity of any underlying Fidelity Central Funds.
F Expense ratios reflect operating expenses of the class. Expenses before reductions do not reflect amounts reimbursed by the investment adviser or reductions from brokerage service arrangements or reductions from other expense offset arrangements and do not represent the amount paid by the class during periods when reimbursements or reductions occur. Expenses net of fee waivers reflect expenses after reimbursement by the investment adviser but prior to reductions from brokerage service arrangements or other expense offset arrangements. Expenses net of all reductions represent the net expenses paid by the class.
G Amount represents less than $.01 per share.
See accompanying notes which are an integral part of the financial statements.
Annual Report
Financial Highlights - International Small Cap
Years ended October 31, | 2011 | 2010 | 2009 | 2008 | 2007 |
Selected Per-Share Data | | | | | |
Net asset value, beginning of period | $ 20.66 | $ 17.48 | $ 12.03 | $ 31.44 | $ 29.03 |
Income from Investment Operations | | | | | |
Net investment income (loss) B | .17 | .07 | .08 | .03 | .12 |
Net realized and unrealized gain (loss) | (.89) | 3.53 | 5.37 | (14.14) | 8.03 |
Total from investment operations | (.72) | 3.60 | 5.45 | (14.11) | 8.15 |
Distributions from net investment income | (.06) | (.08) | - | (.12) | (.07) |
Distributions from net realized gain | (.66) | (.34) | - | (5.18) | (5.67) |
Total distributions | (.72) | (.42) | - | (5.30) | (5.74) |
Redemption fees added to paid in capital B | .01 | - F | - F | - F | - F |
Net asset value, end of period | $ 19.23 | $ 20.66 | $ 17.48 | $ 12.03 | $ 31.44 |
Total Return A | (3.65)% | 21.02% | 45.30% | (53.25)% | 33.82% |
Ratios to Average Net Assets C,E | | | | | |
Expenses before reductions | 1.26% | 1.44% | 1.48% | 1.49% | 1.19% |
Expenses net of fee waivers, if any | 1.25% | 1.44% | 1.48% | 1.49% | 1.19% |
Expenses net of all reductions | 1.23% | 1.42% | 1.44% | 1.44% | 1.15% |
Net investment income (loss) | .80% | .37% | .58% | .16% | .45% |
Supplemental Data | | | | | |
Net assets, end of period (000 omitted) | $ 856,692 | $ 808,478 | $ 669,035 | $ 536,291 | $ 1,663,761 |
Portfolio turnover rate D | 47% | 66% | 81% | 113% | 70% |
A Total returns would have been lower if certain expenses had not been reduced during the applicable periods shown.
B Calculated based on average shares outstanding during the period.
C Fees and expenses of any underlying Fidelity Central Funds are not included in the Fund's expense ratio. The Fund indirectly bears its proportionate share of the expenses of any underlying Fidelity Central Funds.
D Amount does not include the portfolio activity of any underlying Fidelity Central Funds.
E Expense ratios reflect operating expenses of the class. Expenses before reductions do not reflect amounts reimbursed by the investment adviser or reductions from brokerage service arrangements or reductions from other expense offset arrangements and do not represent the amount paid by the class during periods when reimbursements or reductions occur. Expenses net of fee waivers reflect expenses after reimbursement by the investment adviser but prior to reductions from brokerage service arrangements or other expense offset arrangements. Expenses net of all reductions represent the net expenses paid by the class.
F Amount represents less than $.01 per share.
See accompanying notes which are an integral part of the financial statements.
Annual Report
Financial Highlights - Institutional Class
Years ended October 31, | 2011 | 2010 | 2009 | 2008 | 2007 |
Selected Per-Share Data | | | | | |
Net asset value, beginning of period | $ 20.66 | $ 17.47 | $ 12.01 | $ 31.38 | $ 28.99 |
Income from Investment Operations | | | | | |
Net investment income (loss) B | .18 | .09 | .09 | .05 | .12 |
Net realized and unrealized gain (loss) | (.89) | 3.53 | 5.37 | (14.12) | 8.02 |
Total from investment operations | (.71) | 3.62 | 5.46 | (14.07) | 8.14 |
Distributions from net investment income | (.06) | (.09) | - | (.12) | (.07) |
Distributions from net realized gain | (.66) | (.34) | - | (5.18) | (5.68) |
Total distributions | (.72) | (.43) | - | (5.30) | (5.75) |
Redemption fees added to paid in capital B | .01 | - F | - F | - F | - F |
Net asset value, end of period | $ 19.24 | $ 20.66 | $ 17.47 | $ 12.01 | $ 31.38 |
Total Return A | (3.62)% | 21.15% | 45.46% | (53.22)% | 33.84% |
Ratios to Average Net Assets C,E | | | | | |
Expenses before reductions | 1.22% | 1.34% | 1.45% | 1.49% | 1.18% |
Expenses net of fee waivers, if any | 1.21% | 1.34% | 1.40% | 1.40% | 1.18% |
Expenses net of all reductions | 1.19% | 1.31% | 1.37% | 1.35% | 1.14% |
Net investment income (loss) | .84% | .47% | .66% | .25% | .45% |
Supplemental Data | | | | | |
Net assets, end of period (000 omitted) | $ 15,752 | $ 8,231 | $ 2,696 | $ 2,217 | $ 7,774 |
Portfolio turnover rate D | 47% | 66% | 81% | 113% | 70% |
A Total returns would have been lower if certain expenses had not been reduced during the applicable periods shown.
B Calculated based on average shares outstanding during the period.
C Fees and expenses of any underlying Fidelity Central Funds are not included in the Fund's expense ratio. The Fund indirectly bears its proportionate share of the expenses of any underlying Fidelity Central Funds.
D Amount does not include the portfolio activity of any underlying Fidelity Central Funds.
E Expense ratios reflect operating expenses of the class. Expenses before reductions do not reflect amounts reimbursed by the investment adviser or reductions from brokerage service arrangements or reductions from other expense offset arrangements and do not represent the amount paid by the class during periods when reimbursements or reductions occur. Expenses net of fee waivers reflect expenses after reimbursement by the investment adviser but prior to reductions from brokerage service arrangements or other expense offset arrangements. Expenses net of all reductions represent the net expenses paid by the class.
F Amount represents less than $.01 per share.
See accompanying notes which are an integral part of the financial statements.
Annual Report
Notes to Financial Statements
For the period ended October 31, 2011
1. Organization.
Fidelity International Small Cap Fund (the Fund) is a fund of Fidelity Investment Trust (the Trust) and is authorized to issue an unlimited number of shares. The Trust is registered under the Investment Company Act of 1940, as amended (the 1940 Act), as an open-end management investment company organized as a Massachusetts business trust. The Fund offers Class A, Class T, Class C, International Small Cap and Institutional Class shares each of which, along with Class B shares, has equal rights as to assets and voting privileges. Effective after the close of business on September 1, 2010, Class B shares were closed to new accounts and additional purchases, except for exchanges and reinvestments by existing shareholders. Each class has exclusive voting rights with respect to matters that affect that class. Class B shares will automatically convert to Class A shares after a holding period of seven years from the initial date of purchase. Investment income, realized and unrealized capital gains and losses, the common expenses of the Fund, and certain fund-level expense reductions, if any, are allocated on a pro-rata basis to each class based on the relative net assets of each class to the total net assets of the Fund. Each class differs with respect to transfer agent and distribution and service plan fees incurred. Certain expense reductions may also differ by class. The Fund's investments in emerging markets can be subject to social, economic, regulatory and political uncertainties and can be extremely volatile.
2. Investments in Fidelity Central Funds.
The Fund invests in Fidelity Central Funds, which are open-end investment companies available only to other investment companies and accounts managed by Fidelity Management & Research Company (FMR) and its affiliates. The Fund's Schedule of Investments lists each of the Fidelity Central Funds held as of period end, if any, as an investment of the Fund, but does not include the underlying holdings of each Fidelity Central Fund. As an Investing Fund, the Fund indirectly bears its proportionate share of the expenses of the underlying Fidelity Central Funds.
The Money Market Central Funds seek preservation of capital and current income and are managed by Fidelity Investments Money Management, Inc. (FIMM), an affiliate of FMR.
A complete unaudited list of holdings for each Fidelity Central Fund is available upon request or at the Securities and Exchange Commission (the SEC) web site at www.sec.gov. In addition, the financial statements of the Fidelity Central Funds, which are not covered by the Fund's Report of Independent Registered Public Accounting Firm, are available on the SEC web site or upon request.
Annual Report
Notes to Financial Statements - continued
3. Significant Accounting Policies.
The financial statements have been prepared in conformity with accounting principles generally accepted in the United States of America (GAAP), which require management to make certain estimates and assumptions at the date of the financial statements. Actual results could differ from those estimates. Subsequent events, if any, through the date that the financial statements were issued have been evaluated in the preparation of the financial statements. The following summarizes the significant accounting policies of the Fund:
Security Valuation. Investments are valued as of 4:00 p.m. Eastern time on the last calendar day of the period. The Fund uses independent pricing services approved by the Board of Trustees to value its investments. When current market prices or quotations are not readily available or reliable, valuations may be determined in good faith in accordance with procedures adopted by the Board of Trustees. Factors used in determining value may include market or security specific events, changes in interest rates and credit quality. The frequency with which these procedures are used cannot be predicted and they may be utilized to a significant extent. The value used for net asset value (NAV) calculation under these procedures may differ from published prices for the same securities.
The Fund categorizes the inputs to valuation techniques used to value its investments into a disclosure hierarchy consisting of three levels as shown below:
Level 1 - quoted prices in active markets for identical investments
Level 2 - other significant observable inputs (including quoted prices for similar investments, interest rates, prepayment speeds, etc.)
Level 3 - unobservable inputs (including the Fund's own assumptions based on the best information available)
Changes in valuation techniques may result in transfers in or out of an assigned level within the disclosure hierarchy. The aggregate value of investments by input level, as of October 31, 2011, as well as a roll forward of Level 3 securities, is included at the end of the Fund's Schedule of Investments. Valuation techniques used to value the Fund's investments by major category are as follows:
Equity securities, including restricted securities, for which market quotations are readily available, are valued at the last reported sale price or official closing price as reported by an independent pricing service on the primary market or exchange on which they are traded and are categorized as Level 1 in the hierarchy. In the event there were no sales during the day or closing prices are not available, securities are valued at the last quoted bid price or may be valued using the last available price and are generally categorized as
Annual Report
3. Significant Accounting Policies - continued
Security Valuation - continued
Level 2 in the hierarchy. For foreign equity securities, when significant market or security specific events arise, comparisons to the valuation of American Depositary Receipts (ADRs) futures contracts, Exchange-traded funds (ETFs) and certain indexes as well as quoted prices for similar securities are used and are categorized as Level 2 in the hierarchy in these circumstances. Utilizing these techniques may result in transfers between Level 1 and Level 2. For restricted equity securities and private placements where observable inputs are limited, assumptions about market activity and risk are used and are categorized as Level 3 in the hierarchy.
Debt securities, including restricted securities, are valued based on evaluated prices received from independent pricing services or from dealers who make markets in such securities. For corporate bonds and foreign government and government agency obligations, pricing services utilize matrix pricing which considers yield or price of bonds of comparable quality, coupon, maturity and type as well as dealer supplied prices and are generally categorized as Level 2 in the hierarchy. When independent prices are unavailable or unreliable, debt securities may be valued utilizing pricing matrices which consider similar factors that would be used by independent pricing services. These are generally categorized as Level 2 in the hierarchy but may be Level 3 depending on the circumstances.
Futures contracts are valued at the settlement price established each day by the board of trade or exchange on which they are traded and are categorized as Level 1 in the hierarchy. Investments in open-end mutual funds, including the Fidelity Central Funds, are valued at their closing net asset value each business day and are categorized as Level 1 in the hierarchy.
Foreign Currency. The Fund may use foreign currency contracts to facilitate transactions in foreign-denominated securities. Gains and losses from these transactions may arise from changes in the value of the foreign currency or if the counterparties do not perform under the contracts' terms.
Foreign-denominated assets, including investment securities, and liabilities are translated into U.S. dollars at the exchange rate at period end. Purchases and sales of investment securities, income and dividends received and expenses denominated in foreign currencies are translated into U.S. dollars at the exchange rate in effect on the transaction date.
The effects of exchange rate fluctuations on investments are included with the net realized and unrealized gain (loss) on investment securities. Other foreign currency transactions resulting in realized and unrealized gain (loss) are disclosed separately.
Annual Report
Notes to Financial Statements - continued
3. Significant Accounting Policies - continued
Investment Transactions and Income. For financial reporting purposes, the Fund's investment holdings and NAV include trades executed through the end of the last business day of the period. The NAV per share for processing shareholder transactions is calculated as of the close of business of the New York Stock Exchange (NYSE), normally 4:00 p.m. Eastern time and includes trades executed through the end of the prior business day. Gains and losses on securities sold are determined on the basis of identified cost. Dividend income is recorded on the ex-dividend date, except for certain dividends from foreign securities where the ex-dividend date may have passed, which are recorded as soon as the Fund is informed of the ex-dividend date. Non-cash dividends included in dividend income, if any, are recorded at the fair market value of the securities received. Distributions received on securities that represent a return of capital or capital gain are recorded as a reduction of cost of investments and/or as a realized gain. The Fund estimates the components of distributions received that may be considered return of capital distributions or capital gain distributions. Interest income and distributions from the Fidelity Central Funds are accrued as earned. Interest income includes coupon interest and amortization of premium and accretion of discount on debt securities. Investment income is recorded net of foreign taxes withheld where recovery of such taxes is uncertain.
Expenses. Expenses directly attributable to a fund are charged to that fund. Expenses attributable to more than one fund are allocated among the respective funds on the basis of relative net assets or other appropriate methods. Expense estimates are accrued in the period to which they relate and adjustments are made when actual amounts are known.
Income Tax Information and Distributions to Shareholders. Each year, the Fund intends to qualify as a regulated investment company, including distributing substantially all of its taxable income and realized gains under Subchapter M of the Internal Revenue Code and filing its U.S. federal tax return. As a result, no provision for income taxes is required. As of October 31, 2011, the Fund did not have any unrecognized tax benefits in the financial statements. A fund's federal tax return is subject to examination by the Internal Revenue Service (IRS) for a period of three years. Foreign taxes are provided for based on the Fund's understanding of the tax rules and rates that exist in the foreign markets in which it invests.
Distributions are declared and recorded on the ex-dividend date. Income dividends and capital gain distributions are declared separately for each class. Income and capital gain distributions are determined in accordance with income tax regulations, which may differ from GAAP.
Capital accounts within the financial statements are adjusted for permanent book-tax differences. These adjustments have no impact on net assets or the results of operations. Temporary book-tax differences will reverse in a subsequent period.
Annual Report
3. Significant Accounting Policies - continued
Income Tax Information and Distributions to Shareholders - continued
Book-tax differences are primarily due to futures transactions, foreign currency transactions, certain foreign taxes, passive foreign investment companies (PFIC), market discount, capital loss carryforwards and losses deferred due to wash sales.
The federal tax cost of investment securities and unrealized appreciation (depreciation) as of period end were as follows:
Gross unrealized appreciation | $ 149,880,839 |
Gross unrealized depreciation | (171,005,789) |
Net unrealized appreciation (depreciation) on securities and other investments | $ (21,124,950) |
| |
Tax Cost | $ 958,978,307 |
The tax-based components of distributable earnings as of period end were as follows:
Undistributed ordinary income | $ 20,493,962 |
Capital loss carryforward | $ (65,361,612) |
Net unrealized appreciation (depreciation) | $ (21,244,105) |
Under the recently enacted Regulated Investment Company Modernization Act of 2010 (the Act), the Fund will be permitted to carry forward capital losses incurred in taxable years beginning after December 22, 2010 for an unlimited period. However, any losses incurred during those future taxable years will be required to be utilized prior to any losses incurred in pre-enactment taxable years, which generally expire after eight years from when they are incurred. Additionally, post-enactment capital losses that are carried forward will retain their character as either short-term or long-term capital losses rather than being considered all short-term as under previous law. The Fund's first fiscal year end subject to the Act will be October 31, 2012.
The tax character of distributions paid was as follows:
| October 31, 2011 | October 31, 2010 |
Ordinary Income | $ 30,677,503 | $ 17,692,151 |
Short-Term Trading (Redemption) Fees. Shares held by investors in the Fund less than 90 days are subject to a redemption fee equal to 2.00% of the net asset value of shares redeemed. All redemption fees, which reduce the proceeds of the shareholder redemption, are retained by the Fund and accounted for as an addition to paid in capital.
Annual Report
Notes to Financial Statements - continued
3. Significant Accounting Policies - continued
New Accounting Pronouncement. In May 2011, the Financial Accounting Standards Board issued Accounting Standard Update No. 2011-04, Fair Value Measurement (Topic 820) - Amendments to Achieve Common Fair Value Measurement and Disclosure Requirements in U.S. GAAP and IFRSs. The update changes the wording used to describe the requirements in GAAP for measuring fair value and for disclosing information about fair value measurements. The update is effective during interim and annual periods beginning after December 15, 2011. Management is currently evaluating the impact of the update's adoption on the Funds' financial statement disclosures.
4. Operating Policies.
Restricted Securities. The Fund may invest in securities that are subject to legal or contractual restrictions on resale. These securities generally may be resold in transactions exempt from registration or to the public if the securities are registered. Disposal of these securities may involve time-consuming negotiations and expense, and prompt sale at an acceptable price may be difficult. Information regarding restricted securities is included at the end of the Fund's Schedule of Investments.
5. Derivative Instruments.
Risk Exposures and the Use of Derivative Instruments. The Fund used derivative instruments (derivatives), including futures contracts, in order to meet its investment objectives. The strategy is to use derivatives to increase returns and to manage exposure to certain risks as defined below. The success of any strategy involving derivatives depends on analysis of numerous economic factors, and if the strategies for investment do not work as intended, the Fund may not achieve its objectives.
The Fund's use of derivatives increased or decreased its exposure to the following risk:
Equity Risk | Equity risk relates to the fluctuations in the value of financial instruments as a result of changes in market prices (other than those arising from interest rate risk or foreign exchange risk), whether caused by factors specific to an individual investment, its issuer, or all factors affecting all instruments traded in a market or market segment |
The Fund is also exposed to additional risks from investing in derivatives, such as liquidity risk and counterparty credit risk. Liquidity risk is the risk that the Fund will be unable to sell the derivative in the open market in a timely manner. Counterparty credit risk is the risk that the counterparty will not be able to fulfill its obligation to the Fund. The Fund's maximum risk of loss from counterparty credit risk is generally the aggregate unrealized appreciation and unpaid counterparty payments in excess of any collateral pledged by the counterparty to the Fund. Counterparty risk related to exchange-traded futures contracts is minimal because of the protection provided by the exchange on which they trade. Derivatives involve, to varying degrees, risk of loss in excess of the amounts recognized in the Statement of Assets and Liabilities.
Annual Report
5. Derivative Instruments - continued
Futures Contracts. A futures contract is an agreement between two parties to buy or sell a specified underlying instrument for a fixed price at a specified future date. The Fund used futures contracts to manage its exposure to the stock market.
Upon entering into a futures contract, a fund is required to deposit either cash or securities (initial margin) with a clearing broker in an amount equal to a certain percentage of the face value of the contract. Futures contracts are marked-to-market daily and subsequent payments (variation margin) are made or received by a fund depending on the daily fluctuations in the value of the futures contracts and are recorded as unrealized appreciation or (depreciation). This receivable and/or payable is included in daily variation margin on futures contracts in the Statement of Assets and Liabilities. Realized gain or (loss) is recorded upon the expiration or closing of a futures contract.
The underlying face amount at value of open futures contracts at period end, is shown in the Schedule of Investments under the caption "Futures Contracts." This amount reflects each contract's exposure to the underlying instrument at period end and is representative of activity for the period. Securities deposited to meet initial margin requirements are identified in the Schedule of Investments.
Certain risks arise upon entering into futures contracts, including the risk that an illiquid market limits the ability to close out a futures contract prior to settlement date.
During the period, the Fund recognized net realized gain (loss) of $(2,512,331) and a change in net unrealized appreciation (depreciation) of $(166,462) related to its investment in futures contracts. These amounts are included in the Statement of Operations.
6. Purchases and Sales of Investments.
Purchases and sales of securities, other than short-term securities, aggregated $610,178,106 and $471,939,072, respectively.
7. Fees and Other Transactions with Affiliates.
Management Fee. FMR and its affiliates provide the Fund with investment management related services for which the Fund pays a monthly management fee. The management fee is the sum of an individual fund fee rate that is based on an annual rate of .60% of the Fund's average net assets and a group fee rate that averaged .26% during the period. The group fee rate is based upon the average net assets of all the mutual funds advised by FMR. The group fee rate decreases as assets under management increase and increases as assets under management decrease. In addition, the management fee is subject to a performance adjustment (up to a maximum of ± .20% of the Fund's average net assets over a 36 month performance period). The upward or downward adjustment to the management fee is based on the relative investment performance of International
Annual Report
Notes to Financial Statements - continued
7. Fees and Other Transactions with Affiliates - continued
Management Fee - continued
Small Cap as compared to an appropriate benchmark index. For the period, the total annual management fee rate, including the performance adjustment, was .90% of the Fund's average net assets.
Distribution and Service Plan Fees. In accordance with Rule 12b-1 of the 1940 Act, the Fund has adopted separate Distribution and Service Plans for each class of shares. Certain classes pay Fidelity Distributors Corporation (FDC), an affiliate of FMR, separate Distribution and Service Fees, each of which is based on an annual percentage of each class' average net assets. In addition, FDC may pay financial intermediaries for selling shares of the Fund and providing shareholder support services. For the period, the Distribution and Service Fee rates, total fees and amounts retained by FDC were as follows:
| Distribution
Fee | Service
Fee | Total
Fees | Retained
by FDC |
Class A | -% | .25% | $ 51,630 | $ 463 |
Class T | .25% | .25% | 80,842 | 106 |
Class B | .75% | .25% | 28,921 | 21,741 |
Class C | .75% | .25% | 126,048 | 9,890 |
| | | $ 287,441 | $ 32,200 |
Sales Load. FDC may receive a front-end sales charge of up to 5.75% for selling Class A shares and 3.50% for selling Class T shares, some of which is paid to financial intermediaries for selling shares of the Fund. Depending on the holding period, FDC may receive contingent deferred sales charges levied on Class A, Class T, Class B, and Class C redemptions. The deferred sales charges range from 5% to 1% for Class B, 1% for Class C, 1.00% for certain purchases of Class A shares and .25% for certain purchases of Class T shares.
For the period, sales charge amounts retained by FDC were as follows:
| Retained
by FDC |
Class A | $ 8,134 |
Class T | 1,971 |
Class B* | 3,356 |
Class C* | 712 |
| $ 14,173 |
* When Class B and Class C shares are initially sold, FDC pays commissions from its own resources to financial intermediaries through which the sales are made.
Annual Report
7. Fees and Other Transactions with Affiliates - continued
Transfer Agent Fees. Fidelity Investments Institutional Operations Company, Inc. (FIIOC), an affiliate of FMR, is the transfer, dividend disbursing and shareholder servicing agent for each class of the Fund. FIIOC receives account fees and asset-based fees that vary according to the account size and type of account of the shareholders of the respective classes of the Fund. FIIOC pays for typesetting, printing and mailing of shareholder reports, except proxy statements. For the period, transfer agent fees for each class were as follows:
| Amount | % of
Average
Net Assets |
Class A | $ 62,531 | .30 |
Class T | 49,403 | .31 |
Class B | 8,779 | .30 |
Class C | 32,009 | .25 |
International Small Cap | 2,420,969 | .25 |
Institutional Class | 29,472 | .21 |
| $ 2,603,163 | |
Accounting and Security Lending Fees. Fidelity Service Company, Inc. (FSC), an affiliate of FMR, maintains the Fund's accounting records. The accounting fee is based on the level of average net assets for the month. Under a separate contract, FSC administers the security lending program. The security lending fee is based on the number and duration of lending transactions.
Brokerage Commissions. The Fund placed a portion of its portfolio transactions with brokerage firms which are affiliates of the investment adviser. The commissions paid to these affiliated firms were $215 for the period.
8. Committed Line of Credit.
The Fund participates with other funds managed by FMR or an affiliate in a $4.0 billion credit facility (the "line of credit") to be utilized for temporary or emergency purposes to fund shareholder redemptions or for other short-term liquidity purposes. The Fund has agreed to pay commitment fees on its pro-rata portion of the line of credit, which amounted to $3,143 and is reflected in Miscellaneous expenses on the Statement of Operations. During the period, there were no borrowings on this line of credit.
Annual Report
Notes to Financial Statements - continued
9. Security Lending.
The Fund lends portfolio securities through a lending agent from time to time in order to earn additional income. For equity securities, a lending agent is used and may loan securities to certain qualified borrowers, including Fidelity Capital Markets (FCM), a broker-dealer affiliated with the Fund. On the settlement date of the loan, the Fund receives collateral (in the form of U.S. Treasury obligations, letters of credit and/or cash) against the loaned securities and maintains collateral in an amount not less than 100% of the market value of the loaned securities during the period of the loan. The market value of the loaned securities is determined at the close of business of the Fund and any additional required collateral is delivered to the Fund on the next business day. If the borrower defaults on its obligation to return the securities loaned because of insolvency or other reasons, a fund could experience delays and costs in recovering the securities loaned or in gaining access to the collateral. Any cash collateral received is invested in the Fidelity Securities Lending Cash Central Fund. The value of loaned securities and cash collateral at period end are disclosed on the Fund's Statement of Assets and Liabilities. The value of securities loaned to FCM at period end was $432,000. Security lending income represents the income earned on investing cash collateral, less rebates paid to borrowers and any lending agent fees associated with the loan, plus any premium payments received for lending certain types of securities. Security lending income is presented in the Statement of Operations as a component of income from Fidelity Central Funds. Total security lending income during the period amounted to $916,949, including $2,558 from securities loaned to FCM.
10. Expense Reductions.
FMR voluntarily agreed to reimburse a portion of its management fee. For the period, the amount of this reimbursement was $108,473.
Many of the brokers with whom FMR places trades on behalf of the Fund provided services to the Fund in addition to trade execution. These services included payments of certain expenses on behalf of the Fund totaling $159,669 for the period.
11. Distributions to Shareholders.
Distributions to shareholders of each class were as follows:
Years ended October 31, | 2011 | 2010 |
From net investment income | | |
Class A | $ 15,709 | $ 59,453 |
Class T | - | 16,412 |
International Small Cap | 2,403,692 | 3,278,578 |
Institutional Class | 11,165 | 13,966 |
Total | $ 2,430,566 | $ 3,368,409 |
Annual Report
11. Distributions to Shareholders - continued
Years ended October 31, | 2011 | 2010 |
From net realized gain | | |
Class A | $ 648,961 | $ 354,632 |
Class T | 496,268 | 310,013 |
Class B | 87,007 | 60,241 |
Class C | 402,241 | 116,929 |
International Small Cap | 26,480,677 | 13,430,315 |
Institutional Class | 131,783 | 51,612 |
Total | $ 28,246,937 | $ 14,323,742 |
12. Share Transactions.
Transactions for each class of shares were as follows:
| Shares | Dollars |
Years ended October 31, | 2011 | 2010 | 2011 | 2010 |
Class A | | | | |
Shares sold | 472,219 | 380,659 | $ 10,051,889 | $ 6,723,746 |
Reinvestment of distributions | 30,361 | 22,435 | 616,326 | 393,061 |
Shares redeemed | (562,759) | (454,943) | (11,902,630) | (8,359,905) |
Net increase (decrease) | (60,179) | (51,849) | $ (1,234,415) | $ (1,243,098) |
Class T | | | | |
Shares sold | 237,757 | 143,286 | $ 5,055,416 | $ 2,532,790 |
Reinvestment of distributions | 24,155 | 18,371 | 486,714 | 319,658 |
Shares redeemed | (326,059) | (286,001) | (6,629,520) | (4,986,007) |
Net increase (decrease) | (64,147) | (124,344) | $ (1,087,390) | $ (2,133,559) |
Class B | | | | |
Shares sold | 21,873 | 14,694 | $ 464,854 | $ 256,700 |
Reinvestment of distributions | 4,142 | 3,302 | 81,975 | 56,465 |
Shares redeemed | (88,228) | (57,958) | (1,778,852) | (990,211) |
Net increase (decrease) | (62,213) | (39,962) | $ (1,232,023) | $ (677,046) |
Class C | | | | |
Shares sold | 128,685 | 430,838 | $ 2,661,361 | $ 7,671,593 |
Reinvestment of distributions | 19,105 | 6,001 | 378,079 | 102,910 |
Shares redeemed | (308,659) | (101,847) | (6,253,765) | (1,759,170) |
Net increase (decrease) | (160,869) | 334,992 | $ (3,214,325) | $ 6,015,333 |
International Small Cap | | | | |
Shares sold | 17,502,789 | 10,330,000 | $ 375,309,666 | $ 188,548,758 |
Reinvestment of distributions | 1,321,812 | 888,440 | 27,110,370 | 15,725,385 |
Shares redeemed | (13,398,001) | (10,371,667) | (275,580,654) | (183,663,034) |
Net increase (decrease) | 5,426,600 | 846,773 | $ 126,839,382 | $ 20,611,109 |
Institutional Class | | | | |
Shares sold | 798,910 | 288,839 | $ 17,190,303 | $ 5,178,797 |
Reinvestment of distributions | 5,609 | 2,890 | 115,044 | 51,087 |
Shares redeemed | (384,085) | (47,677) | (7,925,094) | (865,855) |
Net increase (decrease) | 420,434 | 244,052 | $ 9,380,253 | $ 4,364,029 |
Annual Report
Notes to Financial Statements - continued
13. Other.
The Fund's organizational documents provide former and current trustees and officers with a limited indemnification against liabilities arising in connection with the performance of their duties to the Fund. In the normal course of business, the Fund may also enter into contracts that provide general indemnifications. The Fund's maximum exposure under these arrangements is unknown as this would be dependent on future claims that may be made against the Fund. The risk of material loss from such claims is considered remote.
At the end of the period, FMR or its affiliates were the owners of record of 13% of the total outstanding shares of the Fund.
Annual Report
Report of Independent Registered Public Accounting Firm
To the Trustees of Fidelity Investment Trust and Shareholders of Fidelity International Small Cap Fund:
We have audited the accompanying statement of assets and liabilities of Fidelity International Small Cap Fund (the Fund), a fund of Fidelity Investment Trust, including the schedule of investments, as of October 31, 2011, and the related statement of operations for the year then ended, the statement of changes in net assets for each of the two years in the period then ended, and the financial highlights for each of the five years in the period then ended. These financial statements and financial highlights are the responsibility of the Fund's management. Our responsibility is to express an opinion on these financial statements and financial highlights based on our audits.
We conducted our audits in accordance with the standards of the Public Company Accounting Oversight Board (United States). Those standards require that we plan and perform the audit to obtain reasonable assurance about whether the financial statements and financial highlights are free of material misstatement. The Fund is not required to have, nor were we engaged to perform, an audit of its internal control over financial reporting. Our audits included consideration of internal control over financial reporting as a basis for designing audit procedures that are appropriate in the circumstances, but not for the purpose of expressing an opinion on the effectiveness of the Fund's internal control over financial reporting. Accordingly, we express no such opinion. An audit also includes examining, on a test basis, evidence supporting the amounts and disclosures in the financial statements, assessing the accounting principles used and significant estimates made by management, as well as evaluating the overall financial statement presentation. Our procedures included confirmation of securities owned as of October 31, 2011, by correspondence with the custodians and brokers; where replies were not received from brokers, we performed other auditing procedures. We believe that our audits provide a reasonable basis for our opinion.
In our opinion, the financial statements and financial highlights referred to above present fairly, in all material respects, the financial position of Fidelity International Small Cap Fund as of October 31, 2011, the results of its operations for the year then ended, the changes in the net assets for each of the two years in the period then ended, and the financial highlights for each of the five years in the period then ended, in conformity with accounting principles generally accepted in the United States of America.
DELOITTE & TOUCHE LLP
Boston, Massachusetts
December 12, 2011
Annual Report
Trustees and Officers
The Trustees, Members of the Advisory Board, and executive officers of the trust and fund, as applicable, are listed below. The Board of Trustees governs the fund and is responsible for protecting the interests of shareholders. The Trustees are experienced executives who meet periodically throughout the year to oversee the fund's activities, review contractual arrangements with companies that provide services to the fund, oversee management of the risks associated with such activities and contractual arrangements, and review the fund's performance. Except for James C. Curvey, each of the Trustees oversees 226 funds advised by FMR or an affiliate. Mr. Curvey oversees 429 funds advised by FMR or an affiliate.
The Trustees hold office without limit in time except that (a) any Trustee may resign; (b) any Trustee may be removed by written instrument, signed by at least two-thirds of the number of Trustees prior to such removal; (c) any Trustee who requests to be retired or who has become incapacitated by illness or injury may be retired by written instrument signed by a majority of the other Trustees; and (d) any Trustee may be removed at any special meeting of shareholders by a two-thirds vote of the outstanding voting securities of the trust. Each Trustee who is not an interested person (as defined in the 1940 Act) (Independent Trustee), shall retire not later than the last day of the calendar year in which his or her 75th birthday occurs. The Independent Trustees may waive this mandatory retirement age policy with respect to individual Trustees. The executive officers and Advisory Board Members hold office without limit in time, except that any officer and Advisory Board Member may resign or may be removed by a vote of a majority of the Trustees at any regular meeting or any special meeting of the Trustees. Except as indicated, each individual has held the office shown or other offices in the same company for the past five years.
Experience, Skills, Attributes, and Qualifications of the Fund's Trustees. The Governance and Nominating Committee has adopted a statement of policy that describes the experience, qualifications, attributes, and skills that are necessary and desirable for potential Independent Trustee candidates (Statement of Policy). The Board believes that each Trustee satisfied at the time he or she was initially elected or appointed a Trustee, and continues to satisfy, the standards contemplated by the Statement of Policy. The Governance and Nominating Committee also engages professional search firms to help identify potential Independent Trustee candidates who have the experience, qualifications, attributes, and skills consistent with the Statement of Policy. From time to time, additional criteria based on the composition and skills of the current Independent Trustees, as well as experience or skills that may be appropriate in light of future changes to board composition, business conditions, and regulatory or other developments, have also been considered by the professional search firms and the Governance and Nominating Committee. In addition, the Board takes into account the Trustees' commitment and participation in Board and committee meetings, as well as their leadership of standing and ad hoc committees throughout their tenure.
In determining that a particular Trustee was and continues to be qualified to serve as a Trustee, the Board has considered a variety of criteria, none of which, in isolation, was controlling. The Board believes that, collectively, the Trustees have balanced and diverse experience, qualifications, attributes, and skills, which allow the Board to operate effectively in governing the fund and protecting the interests of shareholders. Information about the specific experience, skills, attributes, and qualifications of each Trustee, which in each case led to the Board's conclusion that the Trustee should serve (or continue to serve) as a trustee of the fund, is provided below.
Annual Report
Board Structure and Oversight Function. James C. Curvey is an interested person (as defined in the 1940 Act) and currently serves as Acting Chairman. The Trustees have determined that an interested Chairman is appropriate and benefits shareholders because an interested Chairman has a personal and professional stake in the quality and continuity of services provided to the fund. Independent Trustees exercise their informed business judgment to appoint an individual of their choosing to serve as Chairman, regardless of whether the Trustee happens to be independent or a member of management. The Independent Trustees have determined that they can act independently and effectively without having an Independent Trustee serve as Chairman and that a key structural component for assuring that they are in a position to do so is for the Independent Trustees to constitute a substantial majority for the Board. The Independent Trustees also regularly meet in executive session. Ned C. Lautenbach serves as Chairman of the Independent Trustees and as such (i) acts as a liaison between the Independent Trustees and management with respect to matters important to the Independent Trustees and (ii) with management prepares agendas for Board meetings.
Fidelity funds are overseen by different Boards of Trustees. The fund's Board oversees Fidelity's equity and high income funds and another Board oversees Fidelity's investment-grade bond, money market, and asset allocation funds. The asset allocation funds may invest in Fidelity funds overseen by the fund's Board. The use of separate Boards, each with its own committee structure, allows the Trustees of each group of Fidelity funds to focus on the unique issues of the funds they oversee, including common research, investment, and operational issues. On occasion, the separate Boards establish joint committees to address issues of overlapping consequences for the Fidelity funds overseen by each Board.
The Trustees operate using a system of committees to facilitate the timely and efficient consideration of all matters of importance to the Trustees, the fund, and fund shareholders and to facilitate compliance with legal and regulatory requirements and oversight of the fund's activities and associated risks. The Board, acting through its committees, has charged FMR and its affiliates with (i) identifying events or circumstances the occurrence of which could have demonstrably adverse effects on the fund's business and/or reputation; (ii) implementing processes and controls to lessen the possibility that such events or circumstances occur or to mitigate the effects of such events or circumstances if they do occur; and (iii) creating and maintaining a system designed to evaluate continuously business and market conditions in order to facilitate the identification and implementation processes described in (i) and (ii) above. Because the day-to-day operations and activities of the fund are carried out by or through FMR, its affiliates and other service providers, the fund's exposure to risks is mitigated but not eliminated by the processes overseen by the Trustees. While each of the Board's committees has responsibility for overseeing different aspects of the fund's activities, oversight is exercised primarily through the Operations, Audit, and Compliance Committees. In addition, the Independent Trustees have worked with FMR to enhance the Board's oversight of investment and financial risks, legal and regulatory risks, technology risks, and operational risks, including the development of additional risk reporting to the Board. For example, a working group comprised of Independent Trustees and FMR has worked and continues to work to review the Fidelity funds' valuation-related activities, reporting and risk management. Appropriate personnel, including but not limited to the fund's Chief Compliance Officer (CCO), FMR's internal auditor, the independent accountants, the fund's Treasurer and portfolio management personnel, make periodic reports to the Board's committees, as appropriate, including an annual review of FMR's risk management program for the Fidelity funds. The responsibilities of each standing committee, including their oversight responsibilities, are described further under "Standing Committees of the Fund's Trustees."
Annual Report
Trustees and Officers - continued
The fund's Statement of Additional Information (SAI) includes more information about the Trustees. To request a free copy, call Fidelity at 1-877-208-0098.
Interested Trustees*:
Correspondence intended for each Trustee who is an interested person may be sent to Fidelity Investments, 82 Devonshire Street, Boston, Massachusetts 02109.
Name, Age; Principal Occupations and Other Relevant Experience+ |
James C. Curvey (76) |
| Year of Election or Appointment: 2007 Mr. Curvey is Trustee and Acting Chairman of the Board of Trustees of certain Trusts. Mr. Curvey also serves as Trustee (2007-present) of other investment companies advised by FMR. Mr. Curvey is a Director of Fidelity Investments Money Management, Inc. (2009-present), Director of Fidelity Research & Analysis Co. (2009-present) and Director of FMR and FMR Co., Inc. (2007-present). Mr. Curvey is also Vice Chairman (2007-present) and Director of FMR LLC. In addition, Mr. Curvey serves as an Overseer for the Boston Symphony Orchestra and a member of the Trustees of Villanova University. Previously, Mr. Curvey was the Vice Chairman (2006-2007) and Director (2000-2007) of FMR Corp. |
Ronald P. O'Hanley (54) |
| Year of Election or Appointment: 2011 Mr. O'Hanley is Director of FMR Co., Inc. (2010-present), Director of Fidelity Investments Money Management, Inc. (2010-present), Director of Fidelity Research & Analysis Company (2010-present), President of Fidelity Asset Management and Corporate Services and a member of Fidelity's Executive Committee (2010-present). Previously, Mr. O'Hanley served as President and Chief Executive Officer of BNY Mellon Asset Management (2007-2010). Mr. O'Hanley also served as Vice Chairman of Bank New York Mellon Corp. and a member of that firm's Executive Committee. Prior to the 2007 merger of The Bank of New York and Mellon Financial Corporation, he was Vice Chairman of Mellon Financial Corporation and President and Chief Executive Officer of Mellon Asset Management. He joined Mellon in February 1997. Mr. O'Hanley currently serves as Chairman of the Boston Public Library Foundation Board of Directors and sits on the Board of Directors of Beth Israel Deaconess Medical Center, the Board of Trustees of the Marine Biological Laboratory and the Advisory Board of the Maxwell School of Citizenship and Public Administration at Syracuse University. Mr. O'Hanley also chairs the Council on Asset Management for the Financial Services Roundtable and is a member of the Board of Directors of Institutional Investor's U.S. Institute. |
* Trustees have been determined to be "Interested Trustees" by virtue of, among other things, their affiliation with the trust or various entities under common control with FMR.
+ The information above includes each Trustee's principal occupation during the last five years and other information relating to the experience, attributes, and skills relevant to each Trustee's qualifications to serve as a Trustee, which led to the conclusion that each Trustee should serve as a Trustee for the fund.
Annual Report
Trustees and Officers - continued
Independent Trustees:
Correspondence intended for each Independent Trustee (that is, the Trustees other than the Interested Trustees) may be sent to Fidelity Investments, P.O. Box 55235, Boston, Massachusetts 02205-5235.
Name, Age; Principal Occupations and Other Relevant Experience+ |
Dennis J. Dirks (63) |
| Year of Election or Appointment: 2005 Prior to his retirement in May 2003, Mr. Dirks was Chief Operating Officer and a member of the Board of The Depository Trust & Clearing Corporation (DTCC). He also served as President, Chief Operating Officer, and Board member of The Depository Trust Company (DTC) and President and Board member of the National Securities Clearing Corporation (NSCC). In addition, Mr. Dirks served as Chief Executive Officer and Board member of the Government Securities Clearing Corporation, Chief Executive Officer and Board member of the Mortgage-Backed Securities Clearing Corporation, as a Trustee and a member of the Finance Committee of Manhattan College (2005-2008), and as a Trustee and a member of the Finance Committee of AHRC of Nassau County (2006-2008). Mr. Dirks is a member of the Independent Directors Council (IDC) Governing Council (2010-Present) and Board of Directors for The Brookville Center for Children's Services, Inc. (2009-present). |
Alan J. Lacy (58) |
| Year of Election or Appointment: 2008 Mr. Lacy serves as Senior Adviser (2007-present) of Oak Hill Capital Partners, L.P. (private equity). Mr. Lacy also served as Chief Executive Officer (2000-2005) and Vice Chairman (2005-2006) of Sears Holdings Corporation and Sears, Roebuck and Co. (retail). In addition, Mr. Lacy serves as a member of the Board of Directors of Dave & Buster's, Inc. (restaurant and entertainment complexes, 2010-present), The Hillman Companies, Inc. (hardware wholesalers, 2010-present), and Bristol-Myers Squibb Company (global pharmaceuticals, 2007-present). Mr. Lacy is a member of the Board of Trustees of The National Parks Conservation Association (2006-Present). Previously, Mr. Lacy served as Chairman of the Board of Trustees of the National Parks Conservation Association (2008-2011) and as a member of the Board of Directors for the Western Union Company (global money transfer, 2006-2011). |
Ned C. Lautenbach (67) |
| Year of Election or Appointment: 2000 Mr. Lautenbach is Chairman of the Independent Trustees of the Equity and High Income Funds (2006-present). Mr. Lautenbach currently serves as the Lead Director of the Eaton Corporation Board of Directors (diversified industrial, 1997-present). Mr. Lautenbach is also a member of the Board of Directors of the Philharmonic Center for the Arts in Naples, Florida (1999-present); a member of the Board of Trustees of Fairfield University (2005-present); and a member of the Council on Foreign Relations (1994-present). Previously, Mr. Lautenbach was a Partner/Advisory Partner at Clayton, Dubilier & Rice, LLC (private equity investment, 1998-2010), as well as a Director of Sony Corporation (2006-2007). |
Joseph Mauriello (67) |
| Year of Election or Appointment: 2008 Prior to his retirement in January 2006, Mr. Mauriello served in numerous senior management positions including Deputy Chairman and Chief Operating Officer (2004-2005), and Vice Chairman of Financial Services (2002-2004) of KPMG LLP US (professional services, 1965-2005). Mr. Mauriello currently serves as a member of the Board of Directors of XL Group plc. (global insurance and re-insurance, 2006-present) and of Arcadia Resources Inc. (health care services and products, 2007-present). Previously, Mr. Mauriello served as a Director of the Hamilton Funds of the Bank of New York (2006-2007). |
Robert W. Selander (61) |
| Year of Election or Appointment: 2011 Previously, Mr. Selander served as a Member of the Advisory Board of Fidelity's Equity and High Income Funds (2011), Executive Vice Chairman (2010), Chief Executive Officer (2009-2010), and President and Chief Executive Officer (1997-2009) of Mastercard, Inc. |
Cornelia M. Small (67) |
| Year of Election or Appointment: 2005 Ms. Small is a member of the Board of Directors of the Teagle Foundation (2009-present). Ms. Small is also a member of the Investment Committee, and Chair (2008-present) and a member of the Board of Trustees of Smith College. In addition, Ms. Small serves on the Investment Committee of the Berkshire Taconic Community Foundation (2008-present). Previously, Ms. Small served as Chairperson of the Investment Committee (2002-2008) of Smith College. In addition, Ms. Small served as Chief Investment Officer, Director of Global Equity Investments, and a member of the Board of Directors of Scudder, Stevens & Clark and Scudder Kemper Investments. |
William S. Stavropoulos (72) |
| Year of Election or Appointment: 2001 Mr. Stavropoulos is Vice Chairman of the Independent Trustees of the Equity and High Income Funds (2006-present). Mr. Stavropoulos serves as President and Founder of the Michigan Baseball Foundation, the Great Lakes Loons (2007-present). Mr. Stavropoulos is Chairman Emeritus of the Board of Directors of The Dow Chemical Company, where he previously served in numerous senior management positions, including President, CEO (1995-2000; 2002-2004), Chairman of the Executive Committee (2000-2006), and as a member of the Board of Directors (1990-2006). Currently, Mr. Stavropoulos is Chairman of Univar (global distributor of commodity and specialty chemicals, 2010-present), a Director of Teradata Corporation (data warehousing and technology solutions, 2008-present), Chemical Financial Corporation, Maersk Inc. (industrial conglomerate), Tyco International, Inc. (multinational manufacturing and services, 2007-present), and a member of the Advisory Board for Metalmark Capital (private equity investment, 2005-present). Mr. Stavropoulos is a special advisor to Clayton, Dubilier & Rice, LLC (private equity investment). In addition, Mr. Stavropoulos is a member of the University of Notre Dame Advisory Council for the College of Science. |
David M. Thomas (62) |
| Year of Election or Appointment: 2008 Previously, Mr. Thomas served as Executive Chairman (2005-2006) and Chairman and Chief Executive Officer (2000-2005) of IMS Health, Inc. (pharmaceutical and healthcare information solutions). In addition, Mr. Thomas serves as a member of the Board of Directors of Fortune Brands, Inc. (consumer products), and Interpublic Group of Companies, Inc. (marketing communication, 2004-present). |
Michael E. Wiley (61) |
| Year of Election or Appointment: 2008 Mr. Wiley also serves as a Director of Asia Pacific Exploration Consolidated (international oil and gas exploration and production, 2008-present). Mr. Wiley serves as a Director of Tesoro Corporation (independent oil refiner and marketer, 2005-present), and a Director of Bill Barrett Corporation (exploration and production, 2005-present). In addition, Mr. Wiley also serves as a Director of Post Oak Bank (privately-held bank, 2004-present). Previously, Mr. Wiley served as a member of the Board of Trustees of the University of Tulsa (2000-2006; 2007-2010), as a Senior Energy Advisor of Katzenbach Partners, LLC (consulting, 2006-2007), as an Advisory Director of Riverstone Holdings (private investment), Chairman, President, and CEO of Baker Hughes, Inc. (oilfield services, 2000-2004), and as Director of Spinnaker Exploration Company (exploration and production, 2001-2005). |
Annual Report
+ The information above includes each Trustee's principal occupation during the last five years and other information relating to the experience, attributes, and skills relevant to each Trustee's qualifications to serve as a Trustee, which led to the conclusion that each Trustee should serve as a Trustee for the fund.
Advisory Board Members and Executive Officers:
Correspondence intended for each executive officer, Edward C. Johnson 3d, and Peter S. Lynch may be sent to Fidelity Investments, 82 Devonshire Street, Boston, Massachusetts 02109.
Name, Age; Principal Occupation |
Edward C. Johnson 3d (81) |
| Year of Election or Appointment: 2011 Member of the Advisory Board of Fidelity's Equity and High Income Funds. Mr. Johnson serves as Chief Executive Officer, Chairman, and a Director of FMR LLC, and also serves as Chairman and Director of FIL Limited. Previously, Mr. Johnson served as a Trustee and Chairman of the Board of certain Fidelity Trusts, Chairman and a Director of FMR, Chairman and a Director of FMR Co., Inc., and President of FMR LLC (2006-2007). |
Peter S. Lynch (67) |
| Year of Election or Appointment: 2003 Member of the Advisory Board of Fidelity's Equity and High Income Funds. Mr. Lynch is Vice Chairman and a Director of FMR and FMR Co., Inc. In addition, Mr. Lynch serves as a Trustee of Boston College and as the Chairman of the Inner-City Scholarship Fund. Previously, Mr. Lynch served on the Special Olympics International Board of Directors (1997-2006). |
Kenneth B. Robins (42) |
| Year of Election or Appointment: 2008 President and Treasurer of Fidelity's Equity and High Income Funds. Mr. Robins also serves as President and Treasurer (2010-present) and Assistant Treasurer (2009-present) of other Fidelity funds and is an employee of Fidelity Investments (2004-present). Previously, Mr. Robins served as Deputy Treasurer of the Fidelity funds (2005-2008) and Treasurer and Chief Financial Officer of The North Carolina Capital Management Trust: Cash and Term Portfolios (2006-2008). |
Brian B. Hogan (47) |
| Year of Election or Appointment: 2009 Vice President of Equity and High Income Funds. Mr. Hogan also serves as President of FMR's Equity Division (2009-present). Previously, Mr. Hogan served as Senior Vice President, Equity Research of FMR (2006-2009) and as a portfolio manager. |
Thomas C. Hense (47) |
| Year of Election or Appointment: 2008 or 2010 Vice President of Fidelity's High Income (2008), Small Cap (2008), and Value (2010) Funds. Previously, Mr. Hense served as a portfolio manager for Fidelity's Institutional Money Management Group (Pyramis) (2003-2008). |
Scott C. Goebel (43) |
| Year of Election or Appointment: 2008 Secretary and Chief Legal Officer (CLO) of the Fidelity funds. Mr. Goebel also serves as Secretary of Fidelity Investments Money Management, Inc. (FIMM) (2010-present) and Fidelity Research and Analysis Company (FRAC) (2010-present); Secretary and CLO of The North Carolina Capital Management Trust: Cash and Term Portfolios (2008-present); General Counsel, Secretary, and Senior Vice President of FMR (2008-present) and FMR Co., Inc. (2008-present); employed by FMR LLC or an affiliate (2001-present); Chief Legal Officer of Fidelity Management & Research (Hong Kong) Limited (2008-present) and Assistant Secretary of Fidelity Management & Research (Japan) Inc. (2008-present), and Fidelity Management & Research (U.K.) Inc. (2008-present). Previously, Mr. Goebel served as Assistant Secretary of FIMM (2008-2010), FRAC (2008-2010), and the Funds (2007-2008) and as Vice President and Secretary of Fidelity Distributors Corporation (FDC) (2005-2007). |
William C. Coffey (42) |
| Year of Election or Appointment: 2009 Assistant Secretary of Fidelity's Equity and High Income Funds. Mr. Coffey also serves as Senior Vice President and Deputy General Counsel of FMR LLC (2010-present), and is an employee of Fidelity Investments. Previously, Mr. Coffey served as Vice President and Associate General Counsel of FMR LLC (2005-2009). |
Holly C. Laurent (57) |
| Year of Election or Appointment: 2008 Anti-Money Laundering (AML) Officer of the Fidelity funds. Ms. Laurent also serves as AML Officer of The North Carolina Capital Management Trust: Cash and Term Portfolios (2008-present) and is an employee of Fidelity Investments. Previously, Ms. Laurent was Senior Vice President and Head of Legal for Fidelity Business Services India Pvt. Ltd. (2006-2008), and Senior Vice President, Deputy General Counsel and Group Head for FMR LLC (2005-2006). |
Christine Reynolds (53) |
| Year of Election or Appointment: 2008 Chief Financial Officer of the Fidelity funds. Ms. Reynolds became President of Fidelity Pricing and Cash Management Services (FPCMS) in August 2008. Ms. Reynolds served as Chief Operating Officer of FPCMS (2007-2008). Previously, Ms. Reynolds served as President, Treasurer, and Anti-Money Laundering officer of the Fidelity funds (2004-2007). |
Kenneth A. Rathgeber (64) |
| Year of Election or Appointment: 2004 Chief Compliance Officer of Fidelity's Equity and High Income Funds. Mr. Rathgeber is Chief Compliance Officer of Fidelity Management & Research (Hong Kong) Limited (2008-present), Fidelity Management & Research (Japan) Inc. (2008-present), FMR (2005-present), FMR Co., Inc. (2005-present), Fidelity Management & Research (U.K.) Inc. (2005-present), Fidelity Research & Analysis Company (2005-present), Fidelity Investments Money Management, Inc. (2005-present), Pyramis Global Advisors, LLC (2005-present), and Strategic Advisers, Inc. (2005-present). |
Jeffrey S. Christian (50) |
| Year of Election or Appointment: 2009 Deputy Treasurer of the Fidelity funds. Mr. Christian is an employee of Fidelity Investments. Previously, Mr. Christian served as Chief Financial Officer (2008-2009) of certain Fidelity funds and Senior Vice President of Fidelity Pricing and Cash Management Services (FPCMS) (2004-2009). |
Joseph F. Zambello (54) |
| Year of Election or Appointment: 2011 Deputy Treasurer of the Fidelity funds. Mr. Zambello is an employee of Fidelity Investments. Previously, Mr. Zambello served as Vice President of FMR's Program Management Group (2009-2011) and Vice President of the Transfer Agent Oversight Group (2005-2009). |
Adrien E. Deberghes (44) |
| Year of Election or Appointment: 2008 Deputy Treasurer of Fidelity's Equity and High Income Funds. Mr. Deberghes also serves as Vice President and Assistant Treasurer of Fidelity Rutland Square Trust II and Fidelity Commonwealth Trust II (2011-present), Assistant Treasurer of other Fidelity funds (2010-present), and is an employee of Fidelity Investments (2008-present). Previously, Mr. Deberghes served as Senior Vice President of Mutual Fund Administration at State Street Corporation (2007-2008), Senior Director of Mutual Fund Administration at Investors Bank & Trust (2005-2007), and Director of Finance for Dunkin' Brands (2000-2005). |
Stephanie J. Dorsey (42) |
| Year of Election or Appointment: 2010 Assistant Treasurer of Fidelity's Equity and High Income Funds. Ms. Dorsey also serves as Deputy Treasurer of other Fidelity funds (2008-present) and is an employee of Fidelity Investments (2008-present). Previously, Ms. Dorsey served as Treasurer (2004-2008) of the JPMorgan Mutual Funds and Vice President (2004-2008) of JPMorgan Chase Bank. |
John R. Hebble (53) |
| Year of Election or Appointment: 2009 Assistant Treasurer of Fidelity's Equity and High Income Funds. Mr. Hebble also serves as President (2011-present), Treasurer, and Chief Financial Officer of The North Carolina Capital Management Trust: Cash and Term Portfolios (2008-present), President and Treasurer of other Fidelity funds (2008-present) and is an employee of Fidelity Investments. |
Gary W. Ryan (53) |
| Year of Election or Appointment: 2005 Assistant Treasurer of the Fidelity funds. Mr. Ryan is an employee of Fidelity Investments. Previously, Mr. Ryan served as Vice President of Fund Reporting in Fidelity Pricing and Cash Management Services (FPCMS) (1999-2005). |
Jonathan Davis (43) |
| Year of Election or Appointment: 2010 Assistant Treasurer of the Fidelity funds. Mr. Davis is also Assistant Treasurer of Fidelity Rutland Square Trust II and Fidelity Commonwealth Trust II. Mr. Davis is an employee of Fidelity Investments. Previously, Mr. Davis served as Vice President and Associate General Counsel of FMR LLC (2003-2010). |
Annual Report
Distributions
The Board of Trustees of Advisor International Small Cap Fund voted to pay to shareholders of record at the opening of business on record date, the following distributions per share derived from capital gains realized from sales of portfolio securities, and dividends derived from net investment income:
| Pay Date | Record Date | Dividends | Capital Gains |
Institutional Class | 12/05/11 | 12/02/11 | $0.196 | $0.272 |
Institutional Class designates 25% of the dividends distributed during the fiscal year as amounts which may be taken into account as a dividend for purposes of the maximum rate under section 1(h)(11) of the Internal Revenue Code.
The amounts per share which represent income derived from sources within, and taxes paid to, foreign countries or possessions of the United States are as follows:
| Pay Date | Income | Taxes |
Institutional Class | 12/06/10 | $0.196 | $0.0124 |
The fund will notify shareholders in January 2012 of amounts for use in preparing 2011 income tax returns.
Annual Report
Board Approval of Investment Advisory Contracts and Management Fees
Fidelity International Small Cap Fund
Each year, the Board of Trustees, including the Independent Trustees (together, the Board), votes on the renewal of the management contract and sub-advisory agreements (together, the Advisory Contracts) for the fund. The Board, assisted by the advice of fund counsel and Independent Trustees' counsel, requests and considers a broad range of information relevant to the renewal of the Advisory Contracts throughout the year.
The Board meets regularly and considers at each of its meetings factors that are relevant to its annual consideration of the renewal of the fund's Advisory Contracts, including the services and support provided to the fund and its shareholders. The Board has established various standing committees, each composed of Independent Trustees with varying backgrounds, to which the Board has assigned specific subject matter responsibilities in order to enhance effective decision-making by the Board. The Board, acting directly and through its Committees, requests and receives information concerning the annual consideration of the renewal of the fund's Advisory Contracts. The Board also meets as needed to consider matters specifically related to the Board's annual consideration of the renewal of Advisory Contracts. Members of the Board may also meet with trustees of other Fidelity funds through ad hoc joint committees to discuss certain matters relevant to the Fidelity funds.
At its July 2011 meeting, the Board of Trustees, including the Independent Trustees, unanimously determined to renew the fund's Advisory Contracts. In reaching its determination, the Board considered all factors it believed relevant, including (i) the nature, extent, and quality of the services to be provided to the fund and its shareholders (including the investment performance of the fund); (ii) the competitiveness of the fund's management fee and total expense ratio; (iii) the total costs of the services to be provided by and the profits to be realized by Fidelity from its relationship with the fund; (iv) the extent to which economies of scale would be realized as the fund grows; and (v) whether fee levels reflect these economies of scale, if any, for the benefit of fund shareholders.
In considering whether to renew the Advisory Contracts for the fund, the Board reached a determination, with the assistance of fund counsel and Independent Trustees' counsel and through the exercise of its business judgment, that the renewal of the Advisory Contracts is in the best interests of the fund and its shareholders and that the compensation payable under the Advisory Contracts is fair and reasonable. The Board's decision to renew the Advisory Contracts was not based on any single factor, but rather was based on a comprehensive consideration of all the information provided to the Board at its meetings throughout the year. The Board, in reaching its determination to renew the Advisory Contracts, is aware that shareholders in the fund have a broad range of investment choices available to them, including a wide choice among mutual funds offered by Fidelity's competitors, and that the fund's shareholders, who have the opportunity to review and weigh the disclosure provided by the fund in its prospectus and other public disclosures, have chosen to invest in this fund, managed by Fidelity.
Annual Report
Nature, Extent, and Quality of Services Provided. The Board considered the staffing within the investment adviser, FMR, and the sub-advisers (together, the Investment Advisers), including the backgrounds of the fund's investment personnel and the fund's investment objective and discipline. The Independent Trustees also had discussions with senior management of Fidelity's investment operations and investment groups. The Board considered the structure of the portfolio manager compensation program and whether this structure provides appropriate incentives to act in the best interests of the fund.
Resources Dedicated to Investment Management and Support Services. The Board and the Fund Oversight and Research Committees reviewed the general qualifications and capabilities of the Investment Advisers' investment staff, including its size, education, experience, and resources, as well as the Investment Advisers' approach to recruiting, training, managing, and compensating investment personnel. The Board also noted that FMR has devoted increased resources to non-U.S. offices. The Board noted that Fidelity's analysts have extensive resources, tools and capabilities which allow them to conduct sophisticated quantitative and fundamental analysis, as well as credit analysis of issuers, counterparties and enhancers. The Board also believes that Fidelity's investment professionals have sufficient access to global information and data so as to provide competitive investment results over time, and that those professionals also have access to sophisticated tools which permit them to assess portfolio construction and risk and performance attribution characteristics continuously, as well as to transmit new information and research conclusions rapidly around the world. Additionally, in their deliberations, the Board considered the Investment Advisers' trading capabilities and resources which are an integral part of the investment management process.
Shareholder and Administrative Services. The Board considered (i) the nature, extent, quality, and cost of advisory, administrative, and shareholder services performed by the Investment Advisers and their affiliates under the Advisory Contracts and under separate agreements covering transfer agency, pricing and bookkeeping, and securities lending services for the fund; (ii) the nature and extent of the investment adviser's supervision of third party service providers, principally custodians and subcustodians; and (iii) the resources devoted to, and the record of compliance with, the fund's compliance policies and procedures. The Board also reviewed the allocation of fund brokerage, including allocations to brokers affiliated with the Investment Advisers, the use of brokerage commissions to pay fund expenses, and the use of "soft" commission dollars to pay for research services.
The Board noted that the growth of fund assets over time across the complex allows Fidelity to reinvest in the development of services designed to enhance the value or convenience of the Fidelity funds as investment vehicles. These services include 24-hour access to account information and market information through telephone representatives and over the Internet, investor education materials and asset allocation tools, and the expanded availability of Fidelity Investor Centers, with 35 new branches opening since 2010.
Annual Report
Board Approval of Investment Advisory Contracts and
Management Fees - continued
Investment in a Large Fund Family. The Board considered the benefits to shareholders of investing in a Fidelity fund, including the benefits of investing in a fund that is part of a large family of funds offering a variety of investment disciplines and providing a large variety of mutual fund investor services. The Board noted that Fidelity had taken, or had made recommendations that resulted in the Fidelity funds taking, a number of actions over the previous year that benefited particular funds, including (i) continuing to dedicate additional resources to investment research and support of the senior management team that oversees asset management; (ii) rationalizing product lines through the mergers of six funds into other funds; (iii) continuing to migrate the Freedom Funds to dedicated lower cost underlying funds; (iv) obtaining shareholder approval to broaden the investment strategies for Fidelity Consumer Finance Portfolio, Fidelity Emerging Asia Fund, and Fidelity Environment and Alternative Energy Portfolio; (v) contractually agreeing to reduce the management fees and impose other expense limitations on Spartan 500 Index Fund and U.S. Bond Index Fund in connection with launching new institutional classes of these funds; (vi) changing the name, primary and supplemental benchmarks, and investment policies of Fidelity Global Strategies Fund to support the fund's flexible investment mandate and global orientation; and (vii) reducing the transfer agency account fee rates on certain accounts.
Investment Performance. The Board considered whether the fund has operated in accordance with its investment objective, as well as its record of compliance with its investment restrictions. It also reviewed the fund's absolute investment performance for each class, as well as the fund's relative investment performance for each class measured over multiple periods against (i) a broad-based securities market index, and (ii) a peer group of mutual funds deemed appropriate by Fidelity and reviewed by the Board. The following charts considered by the Board show, over the one-, three-, and five-year periods ended December 31, 2010, the cumulative total returns of Institutional Class (Class I) and Class B of the fund, the cumulative total returns of a broad-based securities market index ("benchmark"), and a range of cumulative total returns of a peer group of mutual funds identified by Lipper Inc. as having an investment objective similar to that of the fund. The returns of Institutional Class (Class I) and Class B show the performance of the highest and lowest performing classes, respectively (based on five-year performance). The box within each chart shows the 25th percentile return (bottom of box) and the 75th percentile return (top of box) of the peer group. Returns shown above the box are in the first quartile and returns shown below the box are in the fourth quartile. The percentage beaten numbers noted below each chart correspond to the percentile box and represent the percentage of funds in the peer group whose performance was equal to or lower than that of the class indicated.
Annual Report
Fidelity International Small Cap Fund
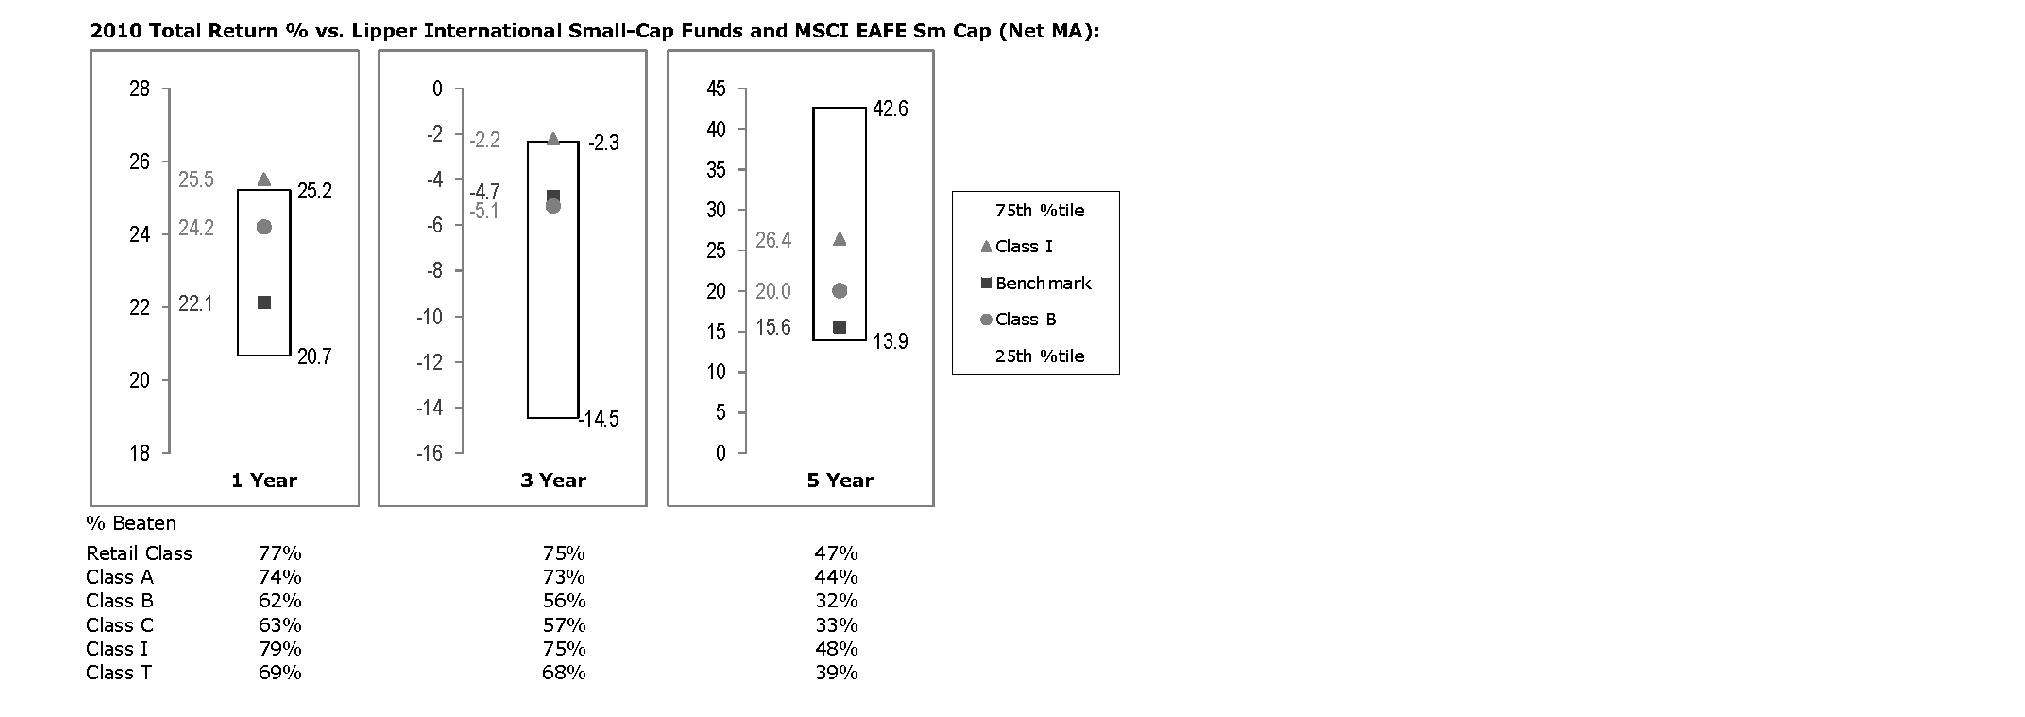
The Board reviewed the fund's relative investment performance against its peer group and noted that the performance of Institutional Class (Class I) of the fund was in the first quartile for the one- and three-year periods and the third quartile for the five-year period. The Board also noted that the investment performance of Institutional Class (Class I) of the fund compared favorably to its benchmark for all the periods shown. The Board considered that the variations in performance among the fund's classes reflect the variations in class expenses, which result in lower performance for higher expense classes. The Board also reviewed the fund's performance since inception as well as performance in the current year.
The Board also considered that the fund's management fee is subject to upward or downward adjustment depending upon whether, and to what extent, the fund's investment performance for the performance period exceeds, or is exceeded by, the record (over the same period) of a Board-approved performance adjustment index. The Board noted that the performance adjustment provides FMR with a strong economic incentive to seek to achieve superior performance for the fund's shareholders and helps to more closely align the interests of FMR and the fund's shareholders.
Based on its review, the Board concluded that the nature, extent, and quality of services provided to the fund under the Advisory Contracts should benefit the fund's shareholders.
Annual Report
Board Approval of Investment Advisory Contracts and
Management Fees - continued
Competitiveness of Management Fee and Total Expense Ratio. The Board considered the fund's management fee and total expense ratio compared to "mapped groups" of competitive funds and classes. Fidelity creates "mapped groups" by combining similar Lipper investment objective categories that have comparable management fee characteristics. Combining Lipper investment objective categories aids the Board's management fee and total expense ratio comparisons by broadening the competitive group used for comparison and by reducing the number of universes to which various Fidelity funds are compared.
Management Fee. The Board considered two proprietary management fee comparisons for the 12-month periods shown in the chart below. The group of Lipper funds used by the Board for management fee comparisons is referred to below as the "Total Mapped Group." The Total Mapped Group is broader than the Lipper peer group used by the Board for performance comparisons because the Total Mapped Group combines several Lipper investment objective categories while the Lipper peer group does not. The Total Mapped Group comparison focuses on a fund's standing relative to the total universe of comparable funds available to investors in terms of gross management fees before expense reimbursements or caps, and without giving effect to the fund's performance adjustment. "TMG %" represents the percentage of funds in the Total Mapped Group that had management fees that were lower than the fund's. For example, a TMG % of 19% means that 81% of the funds in the Total Mapped Group had higher management fees than the fund. The "Asset-Size Peer Group" (ASPG) comparison focuses on a fund's standing relative to non-Fidelity funds similar in size to the fund within the Total Mapped Group. The ASPG represents at least 15% of the funds in the Total Mapped Group with comparable asset size and management fee characteristics, subject to a minimum of 50 funds (or all funds in the Total Mapped Group if fewer than 50). Additional information, such as the ASPG quartile in which the fund's management fee ranked and the impact of the fund's performance adjustment, is also included in the chart and considered by the Board.
Annual Report
Fidelity International Small Cap Fund

The Board noted that the fund's management fee ranked below the median of its Total Mapped Group and below the median of its ASPG for 2010. The Board also noted the effect of the fund's positive performance adjustment on the fund's management fee ranking. The Board noted that the performance adjustment for each year represents calculations for performance periods that differ from the periods shown in the performance charts above.
Based on its review, the Board concluded that the fund's management fee is fair and reasonable in light of the services that the fund receives and the other factors considered.
Total Expense Ratio. In its review of each class's total expense ratio, the Board considered the fund's management fee as well as other fund or class expenses, as applicable, such as transfer agent fees, pricing and bookkeeping fees, fund-paid 12b-1 fees, and custodial, legal, and audit fees. The Board also noted the effects of any waivers and reimbursements on fees and expenses, as well as the impact of the fund's performance adjustment. As part of its review, the Board also considered the current and historical total expense ratios of each class of the fund compared to competitive fund median expenses. Each class of the fund is compared to those funds and classes in the Total Mapped Group (used by the Board for management fee comparisons) that have a similar sales load structure.
The Board noted that the total expense ratio of each of Class A, Class B, Class C, Institutional Class, and the retail class ranked below its competitive median for 2010 and the total expense ratio of Class T ranked above its competitive median for 2010. The Board considered that various factors, including 12b-1 fees, positive or negative performance adjustments, and relatively higher other expenses in the case of small fund size, can affect total expense ratios. The Board noted that the total expense ratio of Class T was above the competitive median primarily because of higher 12b-1 fees on Class T. Class T has a higher 12b-1 fee, but a lower front-end sales charge, than traditionally priced front-end sales charge classes. The Board noted that the fund offers multiple classes, each of which has a different sales load and 12b-1 fee structure, and that the multiple structures are intended to offer a range of pricing options for the intermediary market. The Board also noted that the total expense ratios of the classes vary primarily by the level of their 12b-1 fees, although differences in transfer agent fees may also cause expenses to vary from class to class.
Annual Report
Board Approval of Investment Advisory Contracts and
Management Fees - continued
Fees Charged to Other Fidelity Clients. The Board also considered Fidelity fee structures and other information with respect to clients of FMR and its affiliates, such as other mutual funds advised or subadvised by FMR or its affiliates, pension plan clients, and other institutional clients. In March 2010, the Board created an ad hoc joint committee with the board of other Fidelity funds (the Committee) to review and compare Fidelity's institutional investment advisory business with its business of providing services to the Fidelity funds, including the differences in services provided, fees charged, and costs incurred, as well as competition in their respective marketplaces.
Based on its review of total expense ratios and fees charged to other Fidelity clients, the Board concluded that the total expense ratio of each class of the fund was reasonable, although Class T was above the median of the universe presented for comparison, in light of the services that the fund and its shareholders receive and the other factors considered, including the findings of the Committee.
Costs of the Services and Profitability. The Board considered the revenues earned and the expenses incurred by Fidelity in conducting the business of developing, marketing, distributing, managing, administering and servicing the fund and its shareholders. The Board also considered the level of Fidelity's profits in respect of all the Fidelity funds.
On an annual basis, FMR presents to the Board Fidelity's profitability for the fund. Fidelity calculates the profitability for each fund, as well as aggregate profitability for groups of Fidelity funds and all Fidelity funds, using a series of detailed revenue and cost allocation methodologies which originate with the books and records of Fidelity on which Fidelity's audited financial statements are based. The Audit Committee of the Board reviews any significant changes from the prior year's methodologies.
PricewaterhouseCoopers LLP (PwC), independent registered public accounting firm and auditor to Fidelity and certain Fidelity funds, has been engaged annually by the Board as part of the Board's assessment of Fidelity's profitability analysis. PwC's engagement includes the review and assessment of Fidelity's methodologies used in determining the revenues and expenses attributable to Fidelity's mutual fund business, and completion of agreed-upon procedures surrounding the mathematical accuracy of fund profitability and its conformity to allocation methodologies. After considering PwC's reports issued under the engagement and information provided by Fidelity, the Board concluded that while other allocation methods may also be reasonable, Fidelity's profitability methodologies are reasonable in all material respects.
Annual Report
The Board also reviewed Fidelity's non-fund businesses and fall-out benefits related to the mutual fund business as well as cases where Fidelity's affiliates may benefit from or be related to the fund's business.
The Board considered the costs of the services provided by and the profits realized by Fidelity in connection with the operation of the fund and was satisfied that the profitability was not excessive in the circumstances.
Economies of Scale. The Board considered whether there have been economies of scale in respect of the management of the Fidelity funds, whether the Fidelity funds (including the fund) have appropriately benefited from any such economies of scale, and whether there is potential for realization of any further economies of scale. The Board considered the extent to which the fund will benefit from economies of scale through increased services to the fund, through waivers or reimbursements, or through fee or expense reductions. The Board also noted that in 2009, it and the board of other Fidelity funds created an ad hoc committee (the Economies of Scale Committee) to analyze whether FMR attains economies of scale in respect of the management and servicing of the Fidelity funds, whether the Fidelity funds have appropriately benefited from such economies of scale, and whether there is potential for realization of any further economies of scale.
The Board recognized that the fund's management contract incorporates a "group fee" structure, which provides for lower group fee rates as total fund assets under FMR's management increase, and for higher group fee rates as total fund assets under FMR's management decrease. FMR calculates the group fee rates based on a tiered asset "breakpoint" schedule that varies based on asset class. The Board considered that the group fee is designed to deliver the benefits of economies of scale to fund shareholders when total Fidelity fund assets increase, even if assets of any particular fund are unchanged or have declined, because some portion of Fidelity's costs are attributable to services provided to all Fidelity funds, and all funds benefit if those costs can be allocated among more assets. The Board concluded that, given the group fee structure, fund shareholders will benefit from lower management fees as assets under FMR's management increase at the fund complex level, regardless of whether Fidelity achieves any such economies of scale.
The Board concluded, taking into account the analysis of the Economies of Scale Committee, that any potential economies of scale are being appropriately shared between fund shareholders and Fidelity.
Annual Report
Board Approval of Investment Advisory Contracts and
Management Fees - continued
Additional Information Requested by the Board. In order to develop fully the factual basis for consideration of the Fidelity funds' Advisory Contracts, the Board requested and received additional information on certain topics, including (i) fund performance trends, actions to be taken by FMR to improve certain funds' overall performance, and Fidelity's long-term strategies for certain funds; (ii) portfolio manager changes that have occurred during the past year and length of portfolio manager tenure for different categories of funds over time; (iii) Fidelity's compensation structure for portfolio managers and other key personnel and strategies for attracting and retaining non-investment personnel; (iv) the amount of the investment that each portfolio manager has made in the Fidelity fund(s) that he or she manages; (v) historical trends in Fidelity's realization of fall-out benefits; (vi) Fidelity's group fee structures and the rationale for the individual fee rates of certain funds; (vii) fund profitability methodology and the impact of certain factors on fund profitability results; (viii) trends regarding industry use of performance fee structures and Fidelity's compliance practices with respect to performance adjustment calculations; (ix) the fee structures in place for certain other Fidelity clients; and (x) explanations regarding the relative total expense ratios of certain funds and classes, total expense competitive trends, and actions that might be taken by FMR to reduce total expense ratios for certain funds and classes.
Based on its evaluation of all of the conclusions noted above, and after considering all factors it believed relevant, the Board ultimately concluded that the advisory fee structures are fair and reasonable, and that the fund's Advisory Contracts should be renewed.
Annual Report
Investment Adviser
Fidelity Management & Research Company
Boston, MA
Investment Sub-Advisers
FMR Co., Inc.
Fidelity Management & Research
(U.K.) Inc.
FIL Investment Advisors
FIL Investments (Japan) Limited
FIL Investment Advisors (UK) Ltd.
Fidelity Management & Research
(Hong Kong) Limited
Fidelity Management & Research
(Japan) Inc.
General Distributor
Fidelity Distributors Corporation
Boston, MA
Transfer and Service Agents
Fidelity Investments Institutional Operations Company, Inc.
Boston, MA
Fidelity Service Company, Inc.
Boston, MA
Custodian
The Bank of New York Mellon
New York, NY
AISCI-UANN-1211
1.793572.108
Fidelity®
International Small Cap Opportunities
Fund
Annual Report
October 31, 2011
Contents
Chairman's Message | (Click Here) | The Chairman's message to shareholders. |
Performance | (Click Here) | How the fund has done over time. |
Management's Discussion of Fund Performance | (Click Here) | The Portfolio Manager's review of fund performance and strategy. |
Shareholder Expense Example | (Click Here) | An example of shareholder expenses. |
Investment Changes | (Click Here) | A summary of major shifts in the fund's investments over the past six months. |
Investments | (Click Here) | A complete list of the fund's investments with their market values. |
Financial Statements | (Click Here) | Statements of assets and liabilities, operations, and changes in net assets, as well as financial highlights. |
Notes | (Click Here) | Notes to the financial statements. |
Report of Independent Registered Public Accounting Firm | (Click Here) | |
Trustees and Officers | (Click Here) | |
Distributions | (Click Here) | |
Board Approval of Investment Advisory Contracts and Management Fees | (Click Here) | |
To view a fund's proxy voting guidelines and proxy voting record for the 12-month period ended June 30, visit http://www.fidelity.com/proxyvotingresults or visit the Securities and Exchange Commission's (SEC) web site at http://www.sec.gov. You may also call 1-800-544-8544 to request a free copy of the proxy voting guidelines.
Standard & Poor's, S&P and S&P 500 are registered service marks of The McGraw-Hill Companies, Inc. and have been licensed for use by Fidelity Distributors Corporation.
Other third party marks appearing herein are the property of their respective owners.
All other marks appearing herein are registered or unregistered trademarks or service marks of FMR LLC or an affiliated company.
Annual Report
This report and the financial statements contained herein are submitted for the general information of the shareholders of the fund. This report is not authorized for distribution to prospective investors in the fund unless preceded or accompanied by an effective prospectus.
A fund files its complete schedule of portfolio holdings with the SEC for the first and third quarters of each fiscal year on Form N-Q. Forms N-Q are available on the SEC's web site at http://www.sec.gov. A fund's Forms N-Q may be reviewed and copied at the SEC's Public Reference Room in Washington, DC. Information regarding the operation of the SEC's Public Reference Room may be obtained by calling 1-800-SEC-0330. For a complete list of a fund's portfolio holdings, view the most recent holdings listing, semiannual report, or annual report on Fidelity's web site at http://www.fidelity.com, http://www.advisor.fidelity.com, or http://www.401k.com, as applicable.
NOT FDIC INSURED • MAY LOSE VALUE • NO BANK GUARANTEE
Neither the fund nor Fidelity Distributors Corporation is a bank.
Annual Report
(Acting Chairman's Photograph)
Dear Shareholder:
Global equity markets began the fourth quarter on a strong note, sharply reversing course in October amid strong corporate earnings, better-than-expected economic news and the promise of a resolution to the sovereign debt crisis in Europe. The mini rally followed a third quarter marked by a significant downturn in July and August, which heightened investor anxiety and set off a wave of volatility that hampered most major asset classes through the end of September. Financial markets are difficult to predict, of course, but you can help put the odds in your favor by following these time-tested investment principles.
One of the basic tenets is to invest according to your time horizon. For long-term investors, riding out the markets' inevitable ups and downs has proven much more effective than making decisions based on short-term developments. If your goal is approaching, you can also benefit from patience and restraint, rather than attempting to time the market. No matter your time horizon, missing only a few of the markets' best days can significantly diminish returns. Patience also affords the benefits of compounding - earning interest on additional income or reinvested dividends and capital gains. While staying the course doesn't eliminate risk, it can considerably lessen the negative impact of short-term downturns.
Asset allocation is another principle to manage risk. As you spread your portfolio among the asset classes, be sure to consider your time horizon, risk tolerance and investment objectives. Younger investors may be better served by emphasizing equities, which historically have been the best-performing asset class over time. Investors who are nearing a specific goal, such as retirement or sending a child to college, may choose to favor bonds and other investments that have tended to be more stable. Studies indicate that asset allocation is the single most important determinant of a portfolio's long-term success. After deciding on a suitable allocation strategy, make sure your portfolio is adequately diversified, with exposure to stocks of small-, mid- and large-cap companies in a range of sectors, for example. And today, more than ever, geographic diversification should be taken into account.
Lastly, investing a certain amount of money on a regular basis - a principle known as dollar-cost averaging - can help lower the average cost of your purchases, while also giving you the discipline to avoid selling weak performers just prior to an upswing, or chasing a hot performer just before a correction.
We invite you to learn more by visiting us on the Internet, dropping by one of our Investor Centers or calling us by phone. It is our privilege to provide the resources you need to choose investments that are right for you.
Sincerely,
(Acting Chairman's Signature)
James C. Curvey
Acting Chairman
Annual Report
Average annual total return reflects the change in the value of an investment, assuming reinvestment of the class' distributions from dividend income and capital gains (the profits earned upon the sale of securities that have grown in value, if any) and assuming a constant rate of performance each year. The $10,000 table and the fund's returns do not reflect the deduction of taxes that a shareholder would pay on fund distributions or the redemption of fund shares. During periods of reimbursement by Fidelity, a fund's total return will be greater than it would be had the reimbursement not occurred. How a fund did yesterday is no guarantee of how it will do tomorrow.
Average Annual Total Returns
Periods ended October 31, 2011 | Past 1
year | Past 5
years | Life of fund A |
Fidelity® International Small Cap Opportunities Fund | 1.10% | -4.09% | 2.34% |
A From August 2, 2005
$10,000 Over Life of Class
Let's say hypothetically that $10,000 was invested in Fidelity® International Small Cap Opportunities Fund, a class of the fund, on August 2, 2005, when the fund started. The chart shows how the value of your investment would have changed, and also shows how the MSCI® EAFE® (Europe, Australasia, Far East) Small Cap Index performed over the same period.
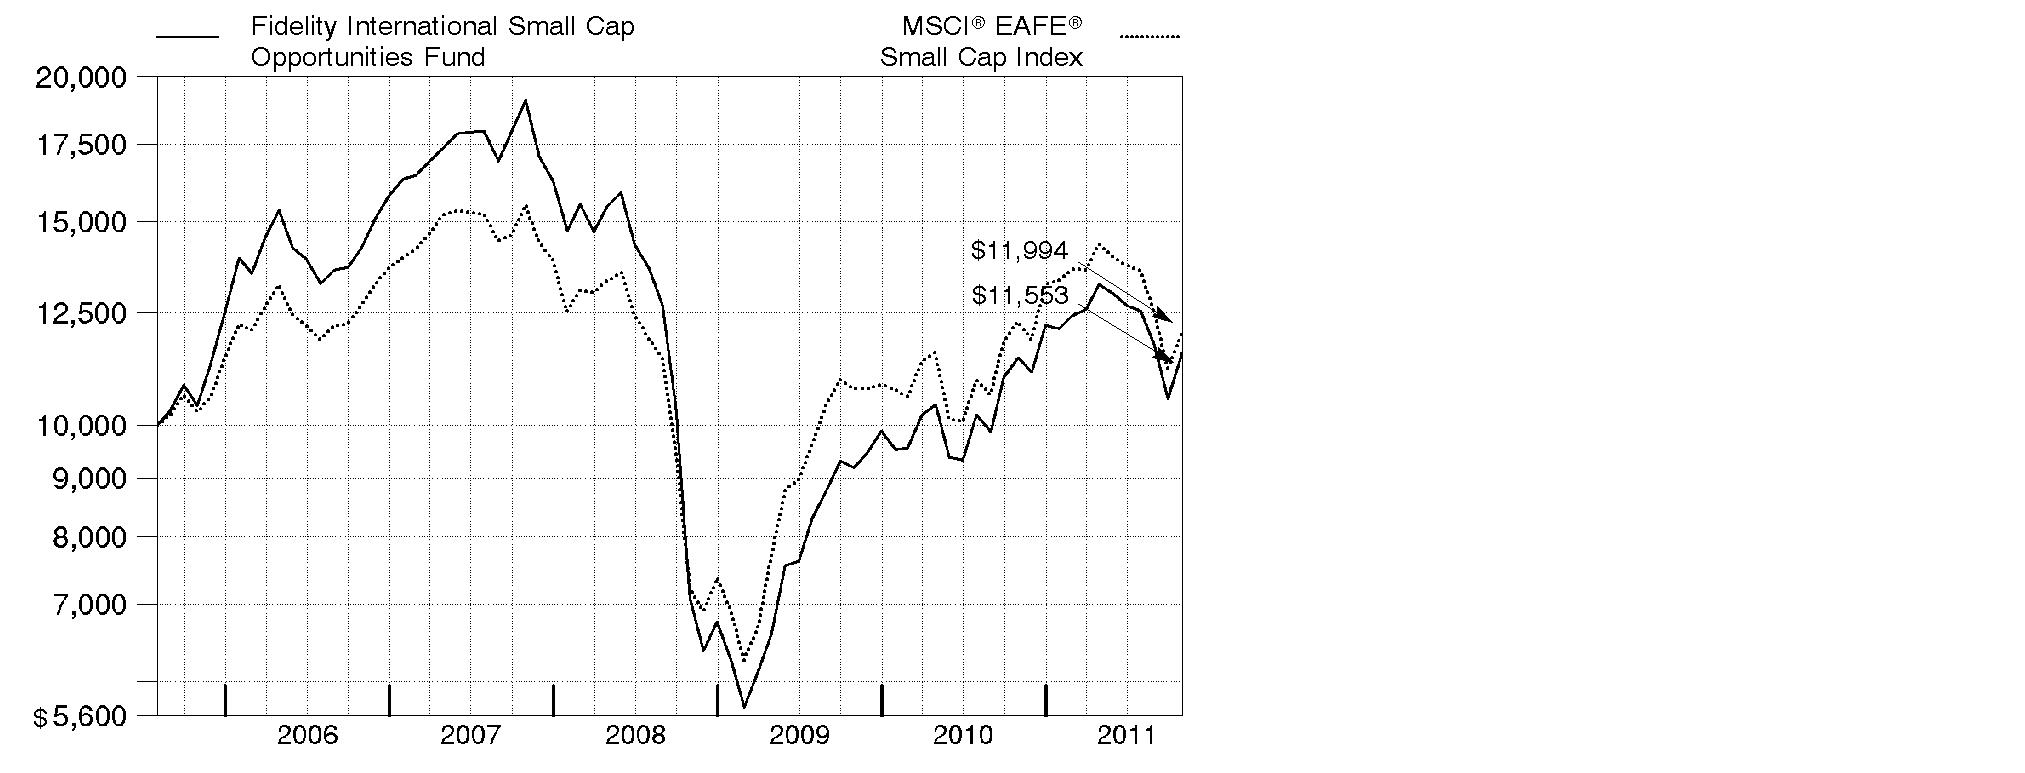
Annual Report
Market Recap: International equities were rocked by a number of headline events during the year ending October 31, 2011. Stocks posted a solid advance for the first half of the period, despite concern about the sovereign debt crisis in Europe, a devastating earthquake and tsunami in Japan, and political upheaval in the Middle East and North Africa. Sentiment turned decidedly negative in the second half, however, as fresh worries about Europe, inflation in China and a dimmed outlook for global growth caused foreign markets to suffer declines that intensified in August and September. October brought with it yet another dramatic swing, as eurozone policymakers appeared near a resolution to the debt debacle and buyers stormed back onto the scene in search of bargains. Still, those gains - along with favorable currency fluctuations overall - weren't enough to offset prior losses, and the MSCI® ACWI® (All Country World Index) ex USA Index finished the period down 4.56%. Within the MSCI index, Europe and emerging markets suffered the biggest declines, with many countries in these areas sustaining steep losses. By contrast, Japan showed resilience in the wake of its natural disasters, falling only 2%. Australia (+4%), Switzerland (+3%), the U.K. (+2%) and Canada, which produced a nominal return, were among the few major benchmark components to break into positive territory.
Comments from Jed Weiss, Portfolio Manager of Fidelity® International Small Cap Opportunities Fund: For the year, the fund's Retail Class shares returned 1.10%, versus -2.39% for the MSCI® EAFE® (Europe, Australasia, Far East) Small Cap Index. Security selection in continental Europe - especially Finland and Germany - helped, as did out-of-index stock picking in the U.S. In emerging markets, my positioning in non-index Turkey and benchmark component South Africa hurt the most. Out-of-benchmark security selection in Canada also was negative. In terms of sectors, good security selection in industrials and consumer discretionary, along with a favorable stance in consumer staples and information technology, helped, while relatively weak stock picking in energy and positioning in utilities hurt. The top individual contributor was U.S.-based PriceSmart, a dominant warehouse club retailer in Central America. Railroad Kansas City Southern (U.S.), Aozora Bank (Japan) and seismic solutions business ION Geophysical (U.S.) also helped. On the negative side, the fund was hurt by Canadian energy firms Petrobank Energy & Resources, which I sold before period end, and Niko Resources. Italian asset manager Azimut Holding, the only index component I've mentioned, also hurt.
The views expressed above reflect those of the portfolio manager(s) only through the end of the period as stated on the cover of this report and do not necessarily represent the views of Fidelity or any other person in the Fidelity organization. Any such views are subject to change at any time based upon market or other conditions and Fidelity disclaims any responsibility to update such views. These views may not be relied on as investment advice and, because investment decisions for a Fidelity fund are based on numerous factors, may not be relied on as an indication of trading intent on behalf of any Fidelity fund.
Annual Report
Shareholder Expense Example
As a shareholder of the Fund, you incur two types of costs: (1) transaction costs, including sales charges (loads) on purchase payments or redemption proceeds, redemption fees, and (2) ongoing costs, including management fees, distribution and/or service (12b-1) fees and other Fund expenses. This Example is intended to help you understand your ongoing costs (in dollars) of investing in the Fund and to compare these costs with the ongoing costs of investing in other mutual funds.
The Example is based on an investment of $1,000 invested at the beginning of the period and held for the entire period (May 1, 2011 to October 31, 2011).
Actual Expenses
The first line of the accompanying table for each class of the Fund provides information about actual account values and actual expenses. You may use the information in this line, together with the amount you invested, to estimate the expenses that you paid over the period. Simply divide your account value by $1,000.00 (for example, an $8,600 account value divided by $1,000.00 = 8.6), then multiply the result by the number in the first line for a class of the Fund under the heading entitled "Expenses Paid During Period" to estimate the expenses you paid on your account during this period. A small balance maintenance fee of $12.00 that is charged once a year may apply for certain accounts with a value of less than $2,000. This fee is not included in the table below. If it was, the estimate of expenses you paid during the period would be higher, and your ending account value lower, by this amount. In addition, the Fund, as a shareholder in the underlying Fidelity Central Funds, will indirectly bear its pro-rata share of the fees and expenses incurred by the underlying Fidelity Central Funds. These fees and expenses are not included in the Fund's annualized expense ratio used to calculate the expense estimate in the table below.
Hypothetical Example for Comparison Purposes
The second line of the accompanying table for each class of the Fund provides information about hypothetical account values and hypothetical expenses based on a Class' actual expense ratio and an assumed rate of return of 5% per year before expenses, which is not the Class' actual return. The hypothetical account values and expenses may not be used to estimate the actual ending account balance or expenses you paid for the period. You may use this information to compare the ongoing costs of investing in the Fund and other funds. To do so, compare this 5% hypothetical example with the 5% hypothetical examples that appear in the shareholder reports of the other funds. A small balance maintenance fee of $12.00 that is charged once a year may apply for certain accounts with a value of less than $2,000. This fee is not included in the table below. If it was, the estimate of expenses you paid during the period would be higher, and your ending account value lower, by this amount. In addition, the Fund, as a shareholder in the underlying Fidelity Central Funds, will indirectly bear its pro-rata share of the fees and expenses incurred by the underlying Fidelity Central Funds. These fees and expenses are not included in the Fund's annualized expense ratio used to calculate the expense estimate in the table below.
Please note that the expenses shown in the table are meant to highlight your ongoing costs only and do not reflect any transaction costs. Therefore, the second line of the table is useful in comparing ongoing costs only, and will not help you determine the relative total costs of owning different funds. In addition, if these transactional costs were included, your costs would have been higher.
Annual Report
Shareholder Expense Example - continued
| Annualized Expense Ratio | Beginning
Account Value
May 1, 2011 | Ending
Account Value
October 31, 2011 | Expenses Paid
During Period*
May 1, 2011 to
October 31, 2011 |
Class A | 1.36% | | | |
Actual | | $ 1,000.00 | $ 872.10 | $ 6.42 |
HypotheticalA | | $ 1,000.00 | $ 1,018.35 | $ 6.92 |
Class T | 1.62% | | | |
Actual | | $ 1,000.00 | $ 871.10 | $ 7.64 |
HypotheticalA | | $ 1,000.00 | $ 1,017.04 | $ 8.24 |
Class B | 2.11% | | | |
Actual | | $ 1,000.00 | $ 868.90 | $ 9.94 |
HypotheticalA | | $ 1,000.00 | $ 1,014.57 | $ 10.71 |
Class C | 2.11% | | | |
Actual | | $ 1,000.00 | $ 868.80 | $ 9.94 |
HypotheticalA | | $ 1,000.00 | $ 1,014.57 | $ 10.71 |
International Small Cap Opportunities | 1.10% | | | |
Actual | | $ 1,000.00 | $ 873.20 | $ 5.19 |
HypotheticalA | | $ 1,000.00 | $ 1,019.66 | $ 5.60 |
Institutional Class | 1.07% | | | |
Actual | | $ 1,000.00 | $ 873.30 | $ 5.05 |
HypotheticalA | | $ 1,000.00 | $ 1,019.81 | $ 5.45 |
A 5% return per year before expenses
* Expenses are equal to each Class' annualized expense ratio, multiplied by the average account value over the period, multiplied by 184/365 (to reflect the one-half year period).
Annual Report
Investment Changes (Unaudited)
Geographic Diversification (% of fund's net assets) |
As of October 31, 2011 |
| Japan 20.9% | |
| United Kingdom 16.7% | |
| United States of America 14.6% | |
| Canada 4.8% | |
| Brazil 4.7% | |
| Germany 4.3% | |
| France 3.8% | |
| Finland 2.4% | |
| South Africa 2.2% | |
| Other 25.6% | |
Percentages are adjusted for the effect of futures contracts, if applicable. |
As of April 30, 2011 |
| Japan 20.2% | |
| United Kingdom 16.2% | |
| United States of America 12.4% | |
| Canada 4.9% | |
| Brazil 4.8% | |
| France 3.9% | |
| Germany 3.6% | |
| Netherlands 3.2% | |
| Finland 3.0% | |
| Other 27.8% | |
Percentages are adjusted for the effect of futures contracts, if applicable. |
Asset Allocation |
| % of fund's
net assets | % of fund's net assets
6 months ago |
Stocks and Investment Companies | 97.9 | 98.4 |
Short-Term Investments and Net Other Assets | 2.1 | 1.6 |
Top Ten Stocks as of October 31, 2011 |
| % of fund's
net assets | % of fund's net assets
6 months ago |
PriceSmart, Inc. (United States of America, Food & Staples Retailing) | 2.0 | 1.5 |
USS Co. Ltd. (Japan, Specialty Retail) | 1.8 | 1.5 |
Osaka Securities Exchange Co. Ltd. (Japan, Diversified Financial Services) | 1.6 | 1.3 |
Kobayashi Pharmaceutical Co. Ltd. (Japan, Personal Products) | 1.6 | 1.3 |
Spirax-Sarco Engineering PLC (United Kingdom, Machinery) | 1.5 | 1.2 |
Meggitt PLC (United Kingdom, Aerospace & Defense) | 1.4 | 1.0 |
Bank Sarasin & Co. Ltd. Series B (Reg.) (Switzerland, Capital Markets) | 1.4 | 1.0 |
Prosegur Compania de Seguridad SA (Reg.) (Spain, Commercial Services & Supplies) | 1.4 | 1.2 |
Outotec Oyj (Finland, Construction & Engineering) | 1.3 | 1.3 |
Andritz AG (Austria, Machinery) | 1.3 | 1.3 |
| 15.3 | |
Market Sectors as of October 31, 2011 |
| % of fund's
net assets | % of fund's net assets
6 months ago |
Industrials | 22.4 | 23.0 |
Consumer Discretionary | 18.6 | 18.1 |
Financials | 16.4 | 17.7 |
Materials | 11.8 | 11.1 |
Consumer Staples | 9.9 | 8.4 |
Information Technology | 8.2 | 8.5 |
Health Care | 5.8 | 5.6 |
Energy | 4.8 | 5.6 |
Utilities | 0.0 | 0.4 |
Annual Report
Investments October 31, 2011
Showing Percentage of Net Assets
Common Stocks - 97.9% |
| Shares | | Value |
Australia - 1.7% |
MAp Group unit | 1,015,958 | | $ 3,625,576 |
OZ Minerals Ltd. | 138,943 | | 1,668,695 |
Ramsay Health Care Ltd. | 43,346 | | 852,149 |
TOTAL AUSTRALIA | | 6,146,420 |
Austria - 1.9% |
Andritz AG | 52,800 | | 4,678,667 |
Zumtobel AG | 113,981 | | 2,377,116 |
TOTAL AUSTRIA | | 7,055,783 |
Bailiwick of Guernsey - 0.7% |
Resolution Ltd. | 575,273 | | 2,544,174 |
Bailiwick of Jersey - 1.6% |
Informa PLC | 485,236 | | 2,828,012 |
Randgold Resources Ltd. sponsored ADR | 27,300 | | 2,991,261 |
TOTAL BAILIWICK OF JERSEY | | 5,819,273 |
Belgium - 1.2% |
Gimv NV | 34,800 | | 1,779,502 |
Umicore SA | 63,474 | | 2,733,194 |
TOTAL BELGIUM | | 4,512,696 |
Bermuda - 1.3% |
Aquarius Platinum Ltd. (Australia) | 406,589 | | 1,192,875 |
Lazard Ltd. Class A | 34,899 | | 954,139 |
Trinity Ltd. | 2,952,000 | | 2,675,575 |
TOTAL BERMUDA | | 4,822,589 |
Brazil - 4.7% |
Arezzo Industria e Comercio SA | 129,700 | | 1,714,529 |
Banco ABC Brasil SA | 260,300 | | 1,735,636 |
Banco Pine SA | 148,900 | | 989,372 |
BR Malls Participacoes SA | 83,500 | | 902,006 |
Braskem SA Class A sponsored ADR (d) | 217,200 | | 3,918,288 |
Cia.Hering SA | 39,600 | | 884,382 |
Iguatemi Empresa de Shopping Centers SA | 46,700 | | 904,792 |
Multiplan Empreendimentos Imobiliarios SA | 84,600 | | 1,710,524 |
Odontoprev SA | 131,500 | | 2,069,142 |
Restoque Comercio e Confeccoes de Roupas SA | 26,200 | | 411,950 |
T4F Entretenimento SA | 131,800 | | 921,034 |
Totvs SA | 58,800 | | 975,891 |
TOTAL BRAZIL | | 17,137,546 |
Common Stocks - continued |
| Shares | | Value |
Canada - 4.8% |
Agnico-Eagle Mines Ltd. (Canada) | 40,760 | | $ 1,768,032 |
Eldorado Gold Corp. | 127,800 | | 2,401,258 |
Fairfax Financial Holdings Ltd. (sub. vtg.) | 7,790 | | 3,256,116 |
Niko Resources Ltd. | 67,600 | | 3,718,220 |
Open Text Corp. (a) | 29,500 | | 1,805,482 |
Pan American Silver Corp. | 28,900 | | 808,044 |
Petrominerales Ltd. | 42,879 | | 1,131,281 |
Quadra FNX Mining Ltd. (a) | 75,200 | | 867,533 |
TAG Oil Ltd. (a) | 142,000 | | 880,333 |
Tuscany International Drilling, Inc. (a) | 1,139,200 | | 777,104 |
TOTAL CANADA | | 17,413,403 |
Cayman Islands - 1.6% |
China Lilang Ltd. | 1,309,000 | | 1,377,892 |
Intime Department Store Group Co. Ltd. | 563,000 | | 807,944 |
NVC Lighting Holdings Ltd. | 4,329,000 | | 1,879,620 |
Vantage Drilling Co. (a) | 625,331 | | 850,450 |
Wynn Macau Ltd. | 337,200 | | 944,793 |
TOTAL CAYMAN ISLANDS | | 5,860,699 |
Denmark - 0.8% |
William Demant Holding A/S (a) | 36,533 | | 2,914,894 |
Finland - 2.4% |
Metso Corp. | 25,700 | | 1,000,834 |
Nokian Tyres PLC | 82,500 | | 3,031,260 |
Outotec Oyj | 100,200 | | 4,684,164 |
TOTAL FINLAND | | 8,716,258 |
France - 3.8% |
Audika SA | 95,384 | | 2,109,391 |
Laurent-Perrier Group | 23,963 | | 2,470,599 |
Remy Cointreau SA | 38,298 | | 3,148,236 |
Saft Groupe SA | 92,419 | | 2,813,770 |
Vetoquinol SA | 28,212 | | 929,994 |
Virbac SA | 13,600 | | 2,354,136 |
TOTAL FRANCE | | 13,826,126 |
Germany - 4.3% |
alstria office REIT-AG | 135,300 | | 1,739,475 |
Bilfinger Berger AG | 36,159 | | 3,241,620 |
CompuGROUP Holding AG | 67,000 | | 862,308 |
CTS Eventim AG | 137,426 | | 4,550,148 |
Common Stocks - continued |
| Shares | | Value |
Germany - continued |
Fielmann AG (d) | 30,537 | | $ 3,216,420 |
Software AG (Bearer) | 50,281 | | 2,088,908 |
TOTAL GERMANY | | 15,698,879 |
India - 0.5% |
Apollo Tyres Ltd. | 642,892 | | 753,948 |
Jyothy Laboratories Ltd. | 433,677 | | 1,269,440 |
TOTAL INDIA | | 2,023,388 |
Ireland - 1.0% |
James Hardie Industries NV: | | | |
CDI (a) | 40,000 | | 259,101 |
sponsored ADR (a) | 102,775 | | 3,332,993 |
TOTAL IRELAND | | 3,592,094 |
Israel - 1.0% |
Azrieli Group | 72,005 | | 1,852,664 |
Ituran Location & Control Ltd. | 140,286 | | 1,867,207 |
TOTAL ISRAEL | | 3,719,871 |
Italy - 1.5% |
Azimut Holding SpA | 291,773 | | 2,281,383 |
Interpump Group SpA | 512,558 | | 3,301,217 |
TOTAL ITALY | | 5,582,600 |
Japan - 20.9% |
Air Water, Inc. | 62,000 | | 787,141 |
Aozora Bank Ltd. (d) | 1,120,000 | | 2,831,751 |
Asahi Co. Ltd. (d) | 58,000 | | 1,285,102 |
Autobacs Seven Co. Ltd. | 83,300 | | 3,814,879 |
Daikoku Denki Co. Ltd. | 128,700 | | 1,152,515 |
Daikokutenbussan Co. Ltd. | 109,200 | | 3,134,401 |
FCC Co. Ltd. | 149,300 | | 3,154,839 |
GCA Savvian Group Corp. (d) | 1,109 | | 1,298,210 |
Glory Ltd. | 60,300 | | 1,290,829 |
Goldcrest Co. Ltd. | 60,400 | | 1,108,271 |
Kamigumi Co. Ltd. | 273,000 | | 2,384,117 |
Kobayashi Pharmaceutical Co. Ltd. | 116,700 | | 5,785,472 |
Kyoto Kimono Yuzen Co. Ltd. | 109,900 | | 1,278,601 |
Meiko Network Japan Co. Ltd. | 120,500 | | 997,877 |
Miraial Co. Ltd. | 39,200 | | 609,201 |
Nabtesco Corp. | 156,400 | | 3,425,851 |
Nagaileben Co. Ltd. | 89,400 | | 1,232,168 |
Common Stocks - continued |
| Shares | | Value |
Japan - continued |
Nihon M&A Center, Inc. | 410 | | $ 2,314,525 |
Nihon Parkerizing Co. Ltd. | 157,000 | | 2,113,801 |
Nippon Seiki Co. Ltd. | 186,000 | | 1,868,967 |
Nippon Thompson Co. Ltd. | 537,000 | | 3,459,214 |
Obic Co. Ltd. | 16,030 | | 3,031,023 |
Osaka Securities Exchange Co. Ltd. | 1,276 | | 5,980,182 |
OSG Corp. | 90,300 | | 1,157,270 |
Seven Bank Ltd. | 594 | | 1,057,196 |
SHO-BOND Holdings Co. Ltd. | 98,200 | | 2,190,832 |
Shoei Co. Ltd. | 80,300 | | 540,394 |
The Nippon Synthetic Chemical Industry Co. Ltd. | 323,000 | | 1,794,495 |
Tsumura & Co. | 82,900 | | 2,331,871 |
Tsutsumi Jewelry Co. Ltd. | 43,900 | | 1,023,100 |
USS Co. Ltd. | 80,540 | | 6,659,028 |
Yamatake Corp. | 56,000 | | 1,239,082 |
Yamato Kogyo Co. Ltd. | 161,700 | | 4,090,648 |
TOTAL JAPAN | | 76,422,853 |
Korea (South) - 0.3% |
NCsoft Corp. | 3,895 | | 1,219,916 |
Luxembourg - 0.5% |
GlobeOp Financial Services SA | 367,600 | | 1,684,847 |
Netherlands - 1.6% |
Aalberts Industries NV | 177,200 | | 3,137,680 |
ASM International NV unit | 46,800 | | 1,320,696 |
QIAGEN NV (a)(d) | 109,200 | | 1,504,776 |
TOTAL NETHERLANDS | | 5,963,152 |
Papua New Guinea - 0.3% |
Oil Search Ltd. | 143,966 | | 982,258 |
Philippines - 0.4% |
Jollibee Food Corp. | 671,660 | | 1,427,287 |
Portugal - 0.7% |
Jeronimo Martins SGPS SA | 146,700 | | 2,537,727 |
Singapore - 0.3% |
Wing Tai Holdings Ltd. | 917,000 | | 929,875 |
South Africa - 2.2% |
African Rainbow Minerals Ltd. | 101,600 | | 2,348,131 |
City Lodge Hotels Ltd. | 4,722 | | 37,484 |
Clicks Group Ltd. | 390,659 | | 2,050,193 |
Common Stocks - continued |
| Shares | | Value |
South Africa - continued |
JSE Ltd. | 199,281 | | $ 1,764,735 |
Mr Price Group Ltd. | 207,500 | | 1,997,530 |
TOTAL SOUTH AFRICA | | 8,198,073 |
Spain - 1.5% |
Grifols SA (a) | 30,332 | | 566,053 |
Prosegur Compania de Seguridad SA (Reg.) | 101,209 | | 5,049,276 |
TOTAL SPAIN | | 5,615,329 |
Sweden - 2.1% |
Fagerhult AB | 85,150 | | 2,004,820 |
Intrum Justitia AB | 186,000 | | 3,059,797 |
Swedish Match Co. | 78,600 | | 2,719,844 |
TOTAL SWEDEN | | 7,784,461 |
Switzerland - 1.4% |
Bank Sarasin & Co. Ltd. Series B (Reg.) | 134,444 | | 5,132,328 |
Turkey - 1.5% |
Albaraka Turk Katilim Bankasi AS | 1,505,000 | | 1,591,602 |
Boyner Buyuk Magazacilik A/S (a) | 547,451 | | 919,513 |
Coca-Cola Icecek AS | 211,000 | | 2,863,848 |
TOTAL TURKEY | | 5,374,963 |
United Arab Emirates - 0.2% |
Dubai Financial Market PJSC (a) | 3,046,397 | | 854,285 |
United Kingdom - 16.7% |
AMEC PLC | 116,340 | | 1,731,592 |
Babcock International Group PLC | 299,700 | | 3,395,532 |
Bellway PLC | 203,172 | | 2,319,863 |
Britvic PLC | 556,200 | | 2,950,892 |
Dechra Pharmaceuticals PLC | 247,100 | | 1,947,192 |
Derwent London PLC | 57,900 | | 1,581,089 |
Great Portland Estates PLC | 417,489 | | 2,500,315 |
H&T Group PLC | 336,803 | | 1,684,521 |
InterContinental Hotel Group PLC ADR | 113,600 | | 2,099,328 |
Johnson Matthey PLC | 105,089 | | 3,175,588 |
Meggitt PLC | 836,669 | | 5,174,913 |
Micro Focus International PLC | 291,800 | | 1,593,650 |
Persimmon PLC | 221,563 | | 1,773,393 |
Rotork PLC | 97,500 | | 2,640,504 |
Serco Group PLC | 450,476 | | 3,763,546 |
Shaftesbury PLC | 301,232 | | 2,441,584 |
Common Stocks - continued |
| Shares | | Value |
United Kingdom - continued |
Spectris PLC | 124,487 | | $ 2,546,544 |
Spirax-Sarco Engineering PLC | 174,230 | | 5,374,172 |
Ted Baker PLC | 139,000 | | 1,724,051 |
Ultra Electronics Holdings PLC | 101,869 | | 2,608,106 |
Unite Group PLC | 1,474,170 | | 4,191,504 |
Victrex PLC | 188,582 | | 3,851,625 |
TOTAL UNITED KINGDOM | | 61,069,504 |
United States of America - 12.5% |
ANSYS, Inc. (a) | 19,285 | | 1,048,333 |
Autoliv, Inc. (d) | 54,900 | | 3,171,573 |
Broadridge Financial Solutions, Inc. | 48,705 | | 1,083,686 |
Cymer, Inc. (a) | 77,700 | | 3,376,065 |
Dril-Quip, Inc. (a) | 32,852 | | 2,138,665 |
Evercore Partners, Inc. Class A | 52,700 | | 1,446,088 |
Greenhill & Co., Inc. (d) | 21,295 | | 804,525 |
ION Geophysical Corp. (a) | 404,906 | | 3,085,384 |
Juniper Networks, Inc. (a) | 35,200 | | 861,344 |
Kansas City Southern (a) | 61,300 | | 3,872,321 |
Lam Research Corp. (a) | 32,003 | | 1,375,809 |
Martin Marietta Materials, Inc. (d) | 24,900 | | 1,797,033 |
Mohawk Industries, Inc. (a) | 86,000 | | 4,527,900 |
Oceaneering International, Inc. | 51,200 | | 2,141,696 |
PriceSmart, Inc. | 96,496 | | 7,337,557 |
ResMed, Inc. (a)(d) | 119,200 | | 3,373,360 |
Solera Holdings, Inc. | 46,600 | | 2,545,758 |
Solutia, Inc. (a) | 55,456 | | 901,160 |
SS&C Technologies Holdings, Inc. (a) | 55,600 | | 881,816 |
TOTAL UNITED STATES OF AMERICA | | 45,770,073 |
TOTAL COMMON STOCKS (Cost $305,074,765) |
358,353,624
|
Money Market Funds - 6.3% |
| Shares | | Value |
Fidelity Cash Central Fund, 0.12% (b) | 8,835,562 | | $ 8,835,562 |
Fidelity Securities Lending Cash Central Fund, 0.11% (b)(c) | 14,278,561 | | 14,278,561 |
TOTAL MONEY MARKET FUNDS (Cost $23,114,123) |
23,114,123
|
TOTAL INVESTMENT PORTFOLIO - 104.2% (Cost $328,188,888) | | 381,467,747 |
NET OTHER ASSETS (LIABILITIES) - (4.2)% | | (15,231,283) |
NET ASSETS - 100% | $ 366,236,464 |
Legend |
(a) Non-income producing |
(b) Affiliated fund that is available only to investment companies and other accounts managed by Fidelity Investments. The rate quoted is the annualized seven-day yield of the fund at period end. A complete unaudited listing of the fund's holdings as of its most recent quarter end is available upon request. In addition, each Fidelity Central Fund's financial statements, which are not covered by the Fund's Report of Independent Registered Public Accounting Firm, are available on the SEC's website or upon request. |
(c) Investment made with cash collateral received from securities on loan. |
(d) Security or a portion of the security is on loan at period end. |
Affiliated Central Funds |
Information regarding fiscal year to date income earned by the Fund from investments in Fidelity Central Funds is as follows: |
Fund | Income earned |
Fidelity Cash Central Fund | $ 13,915 |
Fidelity Securities Lending Cash Central Fund | 208,963 |
Total | $ 222,878 |
Other Information |
The following is a summary of the inputs used, as of October 31, 2011, involving the Fund's assets and liabilities carried at fair value. The inputs or methodology used for valuing securities may not be an indication of the risk associated with investing in those securities. For more information on valuation inputs, and their aggregation into the levels used in the table below, please refer to the Security Valuation section in the accompanying Notes to Financial Statements. |
Valuation Inputs at Reporting Date: |
Description | Total | Level 1 | Level 2 | Level 3 |
Investments in Securities: | | | | |
Equities: | | | | |
Japan | $ 76,422,853 | $ - | $ 76,422,853 | $ - |
United Kingdom | 61,069,504 | 61,069,504 | - | - |
United States of America | 45,770,073 | 45,770,073 | - | - |
Canada | 17,413,403 | 17,413,403 | - | - |
Brazil | 17,137,546 | 17,137,546 | - | - |
Germany | 15,698,879 | 15,698,879 | - | - |
France | 13,826,126 | 13,826,126 | - | - |
Finland | 8,716,258 | 8,716,258 | - | - |
South Africa | 8,198,073 | 8,198,073 | - | - |
Other | 94,100,909 | 73,661,252 | 20,439,657 | - |
Money Market Funds | 23,114,123 | 23,114,123 | - | - |
Total Investments in Securities: | $ 381,467,747 | $ 284,605,237 | $ 96,862,510 | $ - |
Transfers from Level 1 to Level 2 during the period were $99,465,787. |
Income Tax Information |
At October 31, 2011, the Fund had a capital loss carryforward of approximately $368,117,127 of which $37,615,219 and $330,501,908 will expire in fiscal 2016 and 2017, respectively. Capital loss carryforwards are only available to offset future capital gains of the Fund to the extent provided by regulations and may be limited. |
See accompanying notes which are an integral part of the financial statements.
Annual Report
Statement of Assets and Liabilities
| October 31, 2011 |
| | |
Assets | | |
Investment in securities, at value (including securities loaned of $13,325,034) - See accompanying schedule: Unaffiliated issuers (cost $305,074,765) | $ 358,353,624 | |
Fidelity Central Funds (cost $23,114,123) | 23,114,123 | |
Total Investments (cost $328,188,888) | | $ 381,467,747 |
Foreign currency held at value (cost $99,744) | | 99,510 |
Receivable for investments sold | | 195,546 |
Receivable for fund shares sold | | 166,806 |
Dividends receivable | | 961,741 |
Distributions receivable from Fidelity Central Funds | | 3,492 |
Prepaid expenses | | 1,455 |
Other receivables | | 12,370 |
Total assets | | 382,908,667 |
| | |
Liabilities | | |
Payable for investments purchased | $ 1,485,984 | |
Payable for fund shares redeemed | 489,719 | |
Accrued management fee | 235,802 | |
Distribution and service plan fees payable | 14,845 | |
Other affiliated payables | 105,135 | |
Other payables and accrued expenses | 62,157 | |
Collateral on securities loaned, at value | 14,278,561 | |
Total liabilities | | 16,672,203 |
| | |
Net Assets | | $ 366,236,464 |
Net Assets consist of: | | |
Paid in capital | | $ 678,939,230 |
Undistributed net investment income | | 4,428,178 |
Accumulated undistributed net realized gain (loss) on investments and foreign currency transactions | | (370,400,713) |
Net unrealized appreciation (depreciation) on investments and assets and liabilities in foreign currencies | | 53,269,769 |
Net Assets | | $ 366,236,464 |
See accompanying notes which are an integral part of the financial statements.
Annual Report
Statement of Assets and Liabilities - continued
| October 31, 2011 |
| | |
Calculation of Maximum Offering Price | | |
Class A:
Net Asset Value and redemption price per share ($18,686,336 ÷ 1,916,318 shares) | | $ 9.75 |
| | |
Maximum offering price per share (100/94.25 of $9.75) | | $ 10.34 |
Class T:
Net Asset Value and redemption price per share ($8,700,526 ÷ 900,706 shares) | | $ 9.66 |
| | |
Maximum offering price per share (100/96.50 of $9.66) | | $ 10.01 |
Class B:
Net Asset Value and offering price per share ($2,292,585 ÷ 241,853 shares)A | | $ 9.48 |
| | |
Class C:
Net Asset Value and offering price per share ($6,899,707 ÷ 728,884 shares)A | | $ 9.47 |
| | |
International Small Cap Opportunities:
Net Asset Value, offering price and redemption price per share ($328,261,845 ÷ 33,341,584 shares) | | $ 9.85 |
| | |
Institutional Class:
Net Asset Value, offering price and redemption price per share ($1,395,465 ÷ 141,546 shares) | | $ 9.86 |
A Redemption price per share is equal to net asset value less any applicable contingent deferred sales charge.
See accompanying notes which are an integral part of the financial statements.
Annual Report
Financial Statements - continued
Statement of Operations
| Year ended October 31, 2011 |
| | |
Investment Income | | |
Dividends | | $ 9,529,575 |
Special dividends | | 2,725,226 |
Income from Fidelity Central Funds | | 222,878 |
Income before foreign taxes withheld | | 12,477,679 |
Less foreign taxes withheld | | (650,585) |
Total income | | 11,827,094 |
| | |
Expenses | | |
Management fee
Basic fee | $ 3,680,170 | |
Performance adjustment | (837,875) | |
Transfer agent fees | 1,267,212 | |
Distribution and service plan fees | 216,627 | |
Accounting and security lending fees | 225,859 | |
Custodian fees and expenses | 123,008 | |
Independent trustees' compensation | 2,387 | |
Registration fees | 82,117 | |
Audit | 71,269 | |
Legal | 1,734 | |
Miscellaneous | 4,640 | |
Total expenses before reductions | 4,837,148 | |
Expense reductions | (53,631) | 4,783,517 |
Net investment income (loss) | | 7,043,577 |
Realized and Unrealized Gain (Loss) Net realized gain (loss) on: | | |
Investment securities: | | |
Unaffiliated issuers | 54,342,117 | |
Foreign currency transactions | (320,338) | |
Total net realized gain (loss) | | 54,021,779 |
Change in net unrealized appreciation (depreciation) on: Investment securities | (52,211,455) | |
Assets and liabilities in foreign currencies | (51,097) | |
Total change in net unrealized appreciation (depreciation) | | (52,262,552) |
Net gain (loss) | | 1,759,227 |
Net increase (decrease) in net assets resulting from operations | | $ 8,802,804 |
See accompanying notes which are an integral part of the financial statements.
Annual Report
Statement of Changes in Net Assets
| Year ended
October 31,
2011 | Year ended
October 31,
2010 |
Increase (Decrease) in Net Assets | | |
Operations | | |
Net investment income (loss) | $ 7,043,577 | $ 3,674,101 |
Net realized gain (loss) | 54,021,779 | 58,487,523 |
Change in net unrealized appreciation (depreciation) | (52,262,552) | 25,253,733 |
Net increase (decrease) in net assets resulting
from operations | 8,802,804 | 87,415,357 |
Distributions to shareholders from net investment income | (6,223,295) | (3,861,178) |
Distributions to shareholders from net realized gain | (1,761,993) | (4,067,493) |
Total distributions | (7,985,288) | (7,928,671) |
Share transactions - net increase (decrease) | (78,669,716) | (8,820,184) |
Redemption fees | 71,408 | 60,781 |
Total increase (decrease) in net assets | (77,780,792) | 70,727,283 |
| | |
Net Assets | | |
Beginning of period | 444,017,256 | 373,289,973 |
End of period (including undistributed net investment income of $4,428,178 and undistributed net investment income of $3,575,839, respectively) | $ 366,236,464 | $ 444,017,256 |
See accompanying notes which are an integral part of the financial statements.
Annual Report
Financial Highlights - Class A
Years ended October 31, | 2011 | 2010 | 2009 | 2008 | 2007 |
Selected Per-Share Data | | | | | |
Net asset value, beginning of period | $ 9.82 | $ 8.07 | $ 6.24 | $ 18.97 | $ 14.18 |
Income from Investment Operations | | | | | |
Net investment income (loss) C | .15 F | .06 | .06 | .02 | .02 |
Net realized and unrealized gain (loss) | (.07) | 1.85 | 1.77 | (10.85) | 4.76 |
Total from investment operations | .08 | 1.91 | 1.83 | (10.83) | 4.78 |
Distributions from net investment income | (.11) | (.07) | - | (.03) | - |
Distributions from net realized gain | (.04) | (.09) | - | (1.88) | - |
Total distributions | (.15) | (.16) | - | (1.90) I | - |
Redemption fees added to paid in capital C | - H | - H | - H | - H | .01 |
Net asset value, end of period | $ 9.75 | $ 9.82 | $ 8.07 | $ 6.24 | $ 18.97 |
Total ReturnA, B | .81% | 24.05% | 29.33% | (62.98)% | 33.78% |
Ratios to Average Net Assets D, G | | | | | |
Expenses before reductions | 1.34% | 1.16% | .94% | 1.75% | 1.63% |
Expenses net of fee waivers, if any | 1.33% | 1.16% | .94% | 1.66% | 1.63% |
Expenses net of all reductions | 1.32% | 1.15% | .89% | 1.62% | 1.59% |
Net investment income (loss) | 1.44% F | .74% | 1.00% | .13% | .10% |
Supplemental Data | | | | | |
Net assets, end of period (000 omitted) | $ 18,686 | $ 20,228 | $ 18,883 | $ 17,905 | $ 70,785 |
Portfolio turnover rate E | 24% | 49% | 174% | 61% | 107% |
A Total returns would have been lower if certain expenses had not been reduced during the applicable periods shown.
B Total returns do not include the effect of the sales charges.
C Calculated based on average shares outstanding during the period.
D Fees and expenses of any underlying Fidelity Central Funds are not included in the Fund's expense ratio. The Fund indirectly bears its proportionate share of the expenses of any underlying Fidelity Central Funds.
E Amount does not include the portfolio activity of any underlying Fidelity Central Funds.
F Investment income per share reflects a special dividend which amounted to $.06 per share. Excluding the special dividend, the ratio of net investment income (loss) to average net assets would have been .80%.
G Expense ratios reflect operating expenses of the class. Expenses before reductions do not reflect amounts reimbursed by the investment adviser or reductions from brokerage service arrangements or reductions from other expense offset arrangements and do not represent the amount paid by the class during periods when reimbursements or reductions occur. Expenses net of fee waivers reflect expenses after reimbursement by the investment adviser but prior to reductions from brokerage service arrangements or other expense offset arrangements. Expenses net of all reductions represent the net expenses paid by the class.
H Amount represents less than $.01 per share.
I Total distributions of $1.90 per share is comprised of distributions from net investment income of $.025 and distributions from net realized gain of $1.878 per share.
See accompanying notes which are an integral part of the financial statements.
Annual Report
Financial Highlights - Class T
Years ended October 31, | 2011 | 2010 | 2009 | 2008 | 2007 |
Selected Per-Share Data | | | | | |
Net asset value, beginning of period | $ 9.72 | $ 8.00 | $ 6.20 | $ 18.85 | $ 14.12 |
Income from Investment Operations | | | | | |
Net investment income (loss) C | .12 F | .04 | .05 | (.02) | (.02) |
Net realized and unrealized gain (loss) | (.06) | 1.83 | 1.75 | (10.78) | 4.74 |
Total from investment operations | .06 | 1.87 | 1.80 | (10.80) | 4.72 |
Distributions from net investment income | (.08) | (.06) | - | - | - |
Distributions from net realized gain | (.04) | (.09) | - | (1.85) | - |
Total distributions | (.12) | (.15) | - | (1.85) I | - |
Redemption fees added to paid in capital C | - H | - H | - H | - H | .01 |
Net asset value, end of period | $ 9.66 | $ 9.72 | $ 8.00 | $ 6.20 | $ 18.85 |
Total Return A, B | .60% | 23.65% | 29.03% | (63.08)% | 33.50% |
Ratios to Average Net Assets D, G | | | | | |
Expenses before reductions | 1.60% | 1.43% | 1.20% | 2.00% | 1.85% |
Expenses net of fee waivers, if any | 1.60% | 1.43% | 1.20% | 1.91% | 1.85% |
Expenses net of all reductions | 1.59% | 1.41% | 1.15% | 1.87% | 1.81% |
Net investment income (loss) | 1.17% F | .48% | .74% | (.12)% | (.13)% |
Supplemental Data | | | | | |
Net assets, end of period (000 omitted) | $ 8,701 | $ 11,202 | $ 11,915 | $ 11,614 | $ 46,568 |
Portfolio turnover rate E | 24% | 49% | 174% | 61% | 107% |
A Total returns would have been lower if certain expenses had not been reduced during the applicable periods shown.
B Total returns do not include the effect of the sales charges.
C Calculated based on average shares outstanding during the period.
D Fees and expenses of any underlying Fidelity Central Funds are not included in the Fund's expense ratio. The Fund indirectly bears its proportionate share of the expenses of any underlying Fidelity Central Funds.
E Amount does not include the portfolio activity of any underlying Fidelity Central Funds.
F Investment income per share reflects a special dividend which amounted to $.06 per share. Excluding the special dividend, the ratio of net investment income (loss) to average net assets would have been .54%.
G Expense ratios reflect operating expenses of the class. Expenses before reductions do not reflect amounts reimbursed by the investment adviser or reductions from brokerage service arrangements or reductions from other expense offset arrangements and do not represent the amount paid by the class during periods when reimbursements or reductions occur. Expenses net of fee waivers reflect expenses after reimbursement by the investment adviser but prior to reductions from brokerage service arrangements or other expense offset arrangements. Expenses net of all reductions represent the net expenses paid by the class.
H Amount represents less than $.01 per share.
I Total distributions of $1.85 per share is comprised of distributions from net realized gain of $1.852 per share.
See accompanying notes which are an integral part of the financial statements.
Annual Report
Financial Highlights - Class B
Years ended October 31, | 2011 | 2010 | 2009 | 2008 | 2007 |
Selected Per-Share Data | | | | | |
Net asset value, beginning of period | $ 9.54 | $ 7.87 | $ 6.12 | $ 18.64 | $ 14.04 |
Income from Investment Operations | | | | | |
Net investment income (loss) C | .07 F | - H | .02 | (.08) | (.11) |
Net realized and unrealized gain (loss) | (.06) | 1.79 | 1.73 | (10.68) | 4.70 |
Total from investment operations | .01 | 1.79 | 1.75 | (10.76) | 4.59 |
Distributions from net investment income | (.06) | (.03) | - | - | - |
Distributions from net realized gain | (.02) | (.09) | - | (1.76) | - |
Total distributions | (.07) J | (.12) | - | (1.76) I | - |
Redemption fees added to paid in capital C | - H | - H | - H | - H | .01 |
Net asset value, end of period | $ 9.48 | $ 9.54 | $ 7.87 | $ 6.12 | $ 18.64 |
Total Return A, B | .10% | 23.03% | 28.59% | (63.32)% | 32.76% |
Ratios to Average Net Assets D, G | | | | | |
Expenses before reductions | 2.09% | 1.91% | 1.69% | 2.51% | 2.40% |
Expenses net of fee waivers, if any | 2.09% | 1.91% | 1.69% | 2.41% | 2.40% |
Expenses net of all reductions | 2.07% | 1.90% | 1.64% | 2.38% | 2.36% |
Net investment income (loss) | .68% F | (.01)% | .25% | (.62)% | (.67)% |
Supplemental Data | | | | | |
Net assets, end of period (000 omitted) | $ 2,293 | $ 2,902 | $ 2,799 | $ 2,687 | $ 10,975 |
Portfolio turnover rate E | 24% | 49% | 174% | 61% | 107% |
A Total returns would have been lower if certain expenses had not been reduced during the applicable periods shown.
B Total returns do not include the effect of the contingent deferred sales charge.
C Calculated based on average shares outstanding during the period.
D Fees and expenses of any underlying Fidelity Central Funds are not included in the Fund's expense ratio. The Fund indirectly bears its proportionate share of the expenses of any underlying Fidelity Central Funds.
E Amount does not include the portfolio activity of any underlying Fidelity Central Funds.
F Investment income per share reflects a special dividend which amounted to $.06 per share. Excluding the special dividend, the ratio of net investment income (loss) to average net assets would have been .05%.
G Expense ratios reflect operating expenses of the class. Expenses before reductions do not reflect amounts reimbursed by the investment adviser or reductions from brokerage service arrangements or reductions from other expense offset arrangements and do not represent the amount paid by the class during periods when reimbursements or reductions occur. Expenses net of fee waivers reflect expenses after reimbursement by the investment adviser but prior to reductions from brokerage service arrangements or other expense offset arrangements. Expenses net of all reductions represent the net expenses paid by the class.
H Amount represents less than $.01 per share.
I Total distributions of $1.76 per share is comprised of distributions from net realized gain of $1.760 per share.
J Total distribution of $.07 per share is comprised of distributions from net investment income of $.058 and distributions from net realized gain of $.015 per share.
See accompanying notes which are an integral part of the financial statements.
Annual Report
Financial Highlights - Class C
Years ended October 31, | 2011 | 2010 | 2009 | 2008 | 2007 |
Selected Per-Share Data | | | | | |
Net asset value, beginning of period | $ 9.53 | $ 7.86 | $ 6.11 | $ 18.63 | $ 14.03 |
Income from Investment Operations | | | | | |
Net investment income (loss) C | .07 F | - H | .02 | (.08) | (.11) |
Net realized and unrealized gain (loss) | (.06) | 1.79 | 1.73 | (10.66) | 4.70 |
Total from investment operations | .01 | 1.79 | 1.75 | (10.74) | 4.59 |
Distributions from net investment income | (.06) | (.03) | - | - | - |
Distributions from net realized gain | (.02) | (.09) | - | (1.78) | - |
Total distributions | (.07) J | (.12) | - | (1.78) I | - |
Redemption fees added to paid in capital C | - H | - H | - H | - H | .01 |
Net asset value, end of period | $ 9.47 | $ 9.53 | $ 7.86 | $ 6.11 | $ 18.63 |
Total Return A, B | .10% | 23.06% | 28.64% | (63.32)% | 32.79% |
Ratios to Average Net Assets D, G | | | | | |
Expenses before reductions | 2.09% | 1.91% | 1.68% | 2.51% | 2.38% |
Expenses net of fee waivers, if any | 2.09% | 1.91% | 1.68% | 2.41% | 2.38% |
Expenses net of all reductions | 2.07% | 1.90% | 1.63% | 2.38% | 2.34% |
Net investment income (loss) | .68% F | (.01)% | .26% | (.62)% | (.66)% |
Supplemental Data | | | | | |
Net assets, end of period (000 omitted) | $ 6,900 | $ 8,936 | $ 8,543 | $ 9,497 | $ 40,894 |
Portfolio turnover rate E | 24% | 49% | 174% | 61% | 107% |
A Total returns would have been lower if certain expenses had not been reduced during the applicable periods shown.
B Total returns do not include the effect of the contingent deferred sales charge.
C Calculated based on average shares outstanding during the period.
D Fees and expenses of any underlying Fidelity Central Funds are not included in the Fund's expense ratio. The Fund indirectly bears its proportionate share of the expenses of any underlying Fidelity Central Funds.
E Amount does not include the portfolio activity of any underlying Fidelity Central Funds.
F Investment income per share reflects a special dividend which amounted to $.06 per share. Excluding the special dividend, the ratio of net investment income (loss) to average net assets would have been .05%.
G Expense ratios reflect operating expenses of the class. Expenses before reductions do not reflect amounts reimbursed by the investment adviser or reductions from brokerage service arrangements or reductions from other expense offset arrangements and do not represent the amount paid by the class during periods when reimbursements or reductions occur. Expenses net of fee waivers reflect expenses after reimbursement by the investment adviser but prior to reductions from brokerage service arrangements or other expense offset arrangements. Expenses net of all reductions represent the net expenses paid by the class.
H Amount represents less than $.01 per share.
I Total distributions of $1.78 per share is comprised of distributions from net realized gain of $1.775 per share.
J Total distributions of $.07 per share is comprised of distribution from net investment income of $.058 and distributions from net realized gain of $.015 per share.
See accompanying notes which are an integral part of the financial statements.
Annual Report
Financial Highlights - International Small Cap Opportunities
Years ended October 31, | 2011 | 2010 | 2009 | 2008 | 2007 |
Selected Per-Share Data | | | | | |
Net asset value, beginning of period | $ 9.92 | $ 8.14 | $ 6.28 | $ 19.09 | $ 14.23 |
Income from Investment Operations | | | | | |
Net investment income (loss) B | .17 E | .09 | .08 | .05 | .07 |
Net realized and unrealized gain (loss) | (.06) | 1.87 | 1.78 | (10.92) | 4.78 |
Total from investment operations | .11 | 1.96 | 1.86 | (10.87) | 4.85 |
Distributions from net investment income | (.14) | (.09) | - G | (.06) | - |
Distributions from net realized gain | (.04) | (.09) | - | (1.88) | - |
Total distributions | (.18) | (.18) | - G | (1.94) H | - |
Redemption fees added to paid in capital B | - G | - G | - G | - G | .01 |
Net asset value, end of period | $ 9.85 | $ 9.92 | $ 8.14 | $ 6.28 | $ 19.09 |
Total Return A | 1.10% | 24.43% | 29.68% | (62.91)% | 34.15% |
Ratios to Average Net Assets C, F | | | | | |
Expenses before reductions | 1.08% | .91% | .68% | 1.44% | 1.30% |
Expenses net of fee waivers, if any | 1.08% | .91% | .68% | 1.44% | 1.30% |
Expenses net of all reductions | 1.06% | .89% | .64% | 1.40% | 1.25% |
Net investment income (loss) | 1.69% E | 1.00% | 1.25% | .36% | .43% |
Supplemental Data | | | | | |
Net assets, end of period (000 omitted) | $ 328,262 | $ 398,331 | $ 329,128 | $ 312,376 | $ 1,433,844 |
Portfolio turnover rate D | 24% | 49% | 174% | 61% | 107% |
A Total returns would have been lower if certain expenses had not been reduced during the applicable periods shown.
B Calculated based on average shares outstanding during the period.
C Fees and expenses of any underlying Fidelity Central Funds are not included in the Fund's expense ratio. The Fund indirectly bears its proportionate share of the expenses of any underlying Fidelity Central Funds.
D Amount does not include the portfolio activity of any underlying Fidelity Central Funds.
E Investment income per share reflects a special dividend which amounted to $.07 per share. Excluding the special dividend, the ratio of net investment income (loss) to average net assets would have been 1.06%.
F Expense ratios reflect operating expenses of the class. Expenses before reductions do not reflect amounts reimbursed by the investment adviser or reductions from brokerage service arrangements or reductions from other expense offset arrangements and do not represent the amount paid by the class during periods when reimbursements or reductions occur. Expenses net of fee waivers reflect expenses after reimbursement by the investment adviser but prior to reductions from brokerage service arrangements or other expense offset arrangements. Expenses net of all reductions represent the net expenses paid by the class.
G Amount represents less than $.01 per share.
H Total distributions of $1.94 per share is comprised of distributions from net investment income of $.064 and distributions from net realized gain of $1.878 per share.
See accompanying notes which are an integral part of the financial statements.
Annual Report
Financial Highlights - Institutional Class
Years ended October 31, | 2011 | 2010 | 2009 | 2008 | 2007 |
Selected Per-Share Data | | | | | |
Net asset value, beginning of period | $ 9.93 | $ 8.14 | $ 6.27 | $ 19.09 | $ 14.22 |
Income from Investment Operations | | | | | |
Net investment income (loss) B | .18 E | .09 | .08 | .05 | .08 |
Net realized and unrealized gain (loss) | (.06) | 1.86 | 1.79 | (10.92) | 4.78 |
Total from investment operations | .12 | 1.95 | 1.87 | (10.87) | 4.86 |
Distributions from net investment income | (.15) | (.07) | - G | (.07) | - |
Distributions from net realized gain | (.04) | (.09) | - | (1.88) | - |
Total distributions | (.19) | (.16) | - G | (1.95) H | - |
Redemption fees added to paid in capital B | - G | - G | - G | - G | .01 |
Net asset value, end of period | $ 9.86 | $ 9.93 | $ 8.14 | $ 6.27 | $ 19.09 |
Total Return A | 1.13% | 24.33% | 29.87% | (62.95)% | 34.25% |
Ratios to Average Net Assets C, F | | | | | |
Expenses before reductions | 1.03% | .90% | .68% | 1.40% | 1.29% |
Expenses net of fee waivers, if any | 1.03% | .90% | .68% | 1.40% | 1.29% |
Expenses net of all reductions | 1.02% | .88% | .64% | 1.37% | 1.25% |
Net investment income (loss) | 1.74% E | 1.01% | 1.25% | .39% | .44% |
Supplemental Data | | | | | |
Net assets, end of period (000 omitted) | $ 1,395 | $ 2,418 | $ 2,022 | $ 8,117 | $ 27,609 |
Portfolio turnover rate D | 24% | 49% | 174% | 61% | 107% |
A Total returns would have been lower if certain expenses had not been reduced during the applicable periods shown.
B Calculated based on average shares outstanding during the period.
C Fees and expenses of any underlying Fidelity Central Funds are not included in the Fund's expense ratio. The Fund indirectly bears its proportionate share of the expenses of any underlying Fidelity Central Funds.
D Amount does not include the portfolio activity of any underlying Fidelity Central Funds.
E Investment income per share reflects a special dividend which amounted to $.07 per share. Excluding the special dividend, the ratio of net investment income (loss) to average net assets would have been 1.11%.
F Expense ratios reflect operating expenses of the class. Expenses before reductions do not reflect amounts reimbursed by the investment adviser or reductions from brokerage service arrangements or reductions from other expense offset arrangements and do not represent the amount paid by the class during periods when reimbursements or reductions occur. Expenses net of fee waivers reflect expenses after reimbursement by the investment adviser but prior to reductions from brokerage service arrangements or other expense offset arrangements. Expenses net of all reductions represent the net expenses paid by the class.
G Amount represents less than $.01 per share.
H Total distributions of $1.95 per share is comprised of distributions from net investment income of $.074 and distributions from net realized gain of $1.878 per share.
See accompanying notes which are an integral part of the financial statements.
Annual Report
Notes to Financial Statements
For the period ended October 31, 2011
1. Organization.
Fidelity International Small Cap Opportunities Fund (the Fund) is a fund of Fidelity Investment Trust (the Trust) and is authorized to issue an unlimited number of shares. The Trust is registered under the Investment Company Act of 1940, as amended (the 1940 Act), as an open-end management investment company organized as a Massachusetts business trust. The Fund offers Class A, Class T, Class C, International Small Cap Opportunities and Institutional Class shares, each of which, along with Class B shares, has equal rights as to assets and voting privileges. Effective after the close of business on September 1, 2010, Class B shares were closed to new accounts and additional purchases, except for exchanges and reinvestments by existing shareholders. Each class has exclusive voting rights with respect to matters that affect that class. Class B shares will automatically convert to Class A shares after a holding period of seven years from the initial date of purchase. Investment income, realized and unrealized capital gains and losses, the common expenses of the Fund, and certain fund-level expense reductions, if any, are allocated on a pro-rata basis to each class based on the relative net assets of each class to the total net assets of the Fund. Each class differs with respect to transfer agent and distribution and service plan fees incurred. Certain expense reductions may also differ by class. The Fund's investments in emerging markets can be subject to social, economic, regulatory, and political uncertainties and can be extremely volatile.
2. Investments in Fidelity Central Funds.
The Fund invests in Fidelity Central Funds, which are open-end investment companies available only to other investment companies and accounts managed by Fidelity Management & Research Company (FMR) and its affiliates. The Fund's Schedule of Investments lists each of the Fidelity Central Funds held as of period end, if any, as an investment of the Fund, but does not include the underlying holdings of each Fidelity Central Fund. As an Investing Fund, the Fund indirectly bears its proportionate share of the expenses of the underlying Fidelity Central Funds.
The Money Market Central Funds seek preservation of capital and current income and are managed by Fidelity Investments Money Management, Inc. (FIMM), an affiliate of FMR.
A complete unaudited list of holdings for each Fidelity Central Fund is available upon request or at the Securities and Exchange Commission (the SEC) web site at www.sec.gov. In addition, the financial statements of the Fidelity Central Funds, which are not covered by the Fund's Report of Independent Registered Public Accounting Firm, are available on the SEC web site or upon request.
Annual Report
Notes to Financial Statements - continued
3. Significant Accounting Policies.
The financial statements have been prepared in conformity with accounting principles generally accepted in the United States of America (GAAP), which require management to make certain estimates and assumptions at the date of the financial statements. Actual results could differ from those estimates. Subsequent events, if any, through the date that the financial statements were issued have been evaluated in the preparation of the financial statements. The following summarizes the significant accounting policies of the Fund:
Security Valuation. Investments are valued as of 4:00 p.m. Eastern time on the last calendar day of the period. The Fund uses independent pricing services approved by the Board of Trustees to value its investments. When current market prices or quotations are not readily available or reliable, valuations may be determined in good faith in accordance with procedures adopted by the Board of Trustees. Factors used in determining value may include market or security specific events. The frequency with which these procedures are used cannot be predicted and they may be utilized to a significant extent. The value used for net asset value (NAV) calculation under these procedures may differ from published prices for the same securities.
The Fund categorizes the inputs to valuation techniques used to value its investments into a disclosure hierarchy consisting of three levels as shown below:
Level 1 - quoted prices in active markets for identical investments
Level 2 - other significant observable inputs (including quoted prices for similar investments, interest rates, prepayment speeds, etc.)
Level 3 - unobservable inputs (including the Fund's own assumptions based on the best information available)
Changes in valuation techniques may result in transfers in or out of an assigned level within the disclosure hierarchy. The aggregate value of investments by input level, as of October 31, 2011, is included at the end of the Fund's Schedule of Investments. Valuation techniques used to value the Fund's investments by major category are as follows:
Equity securities, including restricted securities, for which market quotations are readily available, are valued at the last reported sale price or official closing price as reported by an independent pricing service on the primary market or exchange on which they are traded and are categorized as Level 1 in the hierarchy. In the event there were no sales during the day or closing prices are not available, securities are valued at the last quoted bid price or may be valued using the last available price and are generally categorized as Level 2 in the hierarchy. For foreign equity securities, when significant market or security specific events arise, comparisons to the valuation of American Depositary Receipts (ADRs), futures contracts, Exchange-traded funds (ETFs) and certain indexes as well as
Annual Report
3. Significant Accounting Policies - continued
Security Valuation - continued
quoted prices for similar securities are used and are categorized as Level 2 in the hierarchy in these circumstances. Utilizing these techniques may result in transfers between Level 1 and Level 2. For restricted equity securities and private placements where observable inputs are limited, assumptions about market activity and risk are used and are categorized as Level 3 in the hierarchy.
Investments in open-end mutual funds, including the Fidelity Central Funds, are valued at their closing net asset value each business day and are categorized as Level 1 in the hierarchy.
Foreign Currency. The Fund may use foreign currency contracts to facilitate transactions in foreign-denominated securities. Gains and losses from these transactions may arise from changes in the value of the foreign currency or if the counterparties do not perform under the contracts' terms.
Foreign-denominated assets, including investment securities, and liabilities are translated into U.S. dollars at the exchange rate at period end. Purchases and sales of investment securities, income and dividends received and expenses denominated in foreign currencies are translated into U.S. dollars at the exchange rate in effect on the transaction date.
The effects of exchange rate fluctuations on investments are included with the net realized and unrealized gain (loss) on investment securities. Other foreign currency transactions resulting in realized and unrealized gain (loss) are disclosed separately.
Investment Transactions and Income. For financial reporting purposes, the Fund's investment holdings and NAV include trades executed through the end of the last business day of the period. The NAV per share for processing shareholder transactions is calculated as of the close of business of the New York Stock Exchange (NYSE), normally 4:00 p.m. Eastern time and includes trades executed through the end of the prior business day. Gains and losses on securities sold are determined on the basis of identified cost and may include proceeds received from litigation. Dividend income is recorded on the ex-dividend date, except for certain dividends from foreign securities where the ex-dividend date may have passed, which are recorded as soon as the Fund is informed of the ex-dividend date. Non-cash dividends included in dividend income, if any, are recorded at the fair market value of the securities received. Distributions received on securities that represent a return of capital or capital gain are recorded as a reduction of cost of investments and/or as a realized gain. The Fund estimates the components of distributions received that may be considered return of capital distributions or capital gain distributions. Large, non-recurring dividends recognized by the Fund are presented
Annual Report
Notes to Financial Statements - continued
3. Significant Accounting Policies - continued
Investment Transactions and Income - continued
separately on the Statement of Operations as "Special Dividends" and the impact of these dividends is presented in the Financial Highlights. Interest income and distributions from the Fidelity Central Funds are accrued as earned. Interest income includes coupon interest and amortization of premium and accretion of discount on debt securities. Investment income is recorded net of foreign taxes withheld where recovery of such taxes is uncertain.
Expenses. Expenses directly attributable to a fund are charged to that fund. Expenses attributable to more than one fund are allocated among the respective funds on the basis of relative net assets or other appropriate methods. Expense estimates are accrued in the period to which they relate and adjustments are made when actual amounts are known.
Income Tax Information and Distributions to Shareholders. Each year, the Fund intends to qualify as a regulated investment company, including distributing substantially all of its taxable income and realized gains under Subchapter M of the Internal Revenue Code and filing its U.S. federal tax return. As a result, no provision for income taxes is required. As of October 31, 2011, the Fund did not have any unrecognized tax benefits in the financial statements. A fund's federal tax return is subject to examination by the Internal Revenue Service (IRS) for a period of three years. Foreign taxes are provided for based on the Fund's understanding of the tax rules and rates that exist in the foreign markets in which it invests.
Distributions are declared and recorded on the ex-dividend date. Income dividends and capital gain distributions are declared separately for each class. Income and capital gain distributions are determined in accordance with income tax regulations, which may differ from GAAP.
Capital accounts within the financial statements are adjusted for permanent book-tax differences. These adjustments have no impact on net assets or the results of operations. Temporary book-tax differences will reverse in a subsequent period.
Book-tax differences are primarily due to foreign currency transactions, passive foreign investment companies (PFIC), partnerships, capital loss carryforwards and losses deferred due to wash sales.
The federal tax cost of investment securities and unrealized appreciation (depreciation) as of period end were as follows:
Gross unrealized appreciation | $ 73,513,976 |
Gross unrealized depreciation | (22,795,694) |
Net unrealized appreciation (depreciation) on securities and other investments | $ 50,718,282 |
| |
Tax Cost | $ 330,749,465 |
Annual Report
3. Significant Accounting Policies - continued
Income Tax Information and Distributions to Shareholders - continued
The tax-based components of distributable earnings as of period end were as follows:
Undistributed ordinary income | $ 4,705,169 |
Capital loss carryforward | $ (368,117,127) |
Net unrealized appreciation (depreciation) | $ 50,709,192 |
Under the recently enacted Regulated Investment Company Modernization Act of 2010 (the Act), the Fund will be permitted to carry forward capital losses incurred in taxable years beginning after December 22, 2010 for an unlimited period. However, any losses incurred during those future taxable years will be required to be utilized prior to any losses incurred in pre-enactment taxable years, which generally expire after eight years from when they are incurred. Additionally, post-enactment capital losses that are carried forward will retain their character as either short-term or long-term capital losses rather than being considered all short-term as under previous law. The Fund's first fiscal year end subject to the Act will be October 31, 2012.
The tax character of distributions paid was as follows:
| October 31, 2011 | October 31, 2010 |
Ordinary Income | $ 7,985,288 | $ 7,928,671 |
Short-Term Trading (Redemption) Fees. Shares held by investors in the Fund less than 90 Days are subject to a redemption fee equal to 2.00% of the net asset value of shares redeemed. All redemption fees, which reduce the proceeds of the shareholder redemption, are retained by the Fund and accounted for as an addition to paid in capital.
New Accounting Pronouncement. In May 2011, the Financial Accounting Standards Board issued Accounting Standard Update No. 2011-04, Fair Value Measurement (Topic 820) - Amendments to Achieve Common Fair Value Measurement and Disclosure Requirements in U.S. GAAP and IFRSs. The update changes the wording used to describe the requirements in GAAP for measuring fair value and for disclosing information about fair value measurements. The update is effective during interim and annual periods beginning after December 15, 2011. Management is currently evaluating the impact of the update's adoption on the Fund's financial statement disclosures.
Annual Report
Notes to Financial Statements - continued
4. Purchases and Sales of Investments.
Purchases and sales of securities, other than short-term securities, aggregated $100,138,660 and $177,442,934, respectively.
5. Fees and Other Transactions with Affiliates.
Management Fee. FMR and its affiliates provide the Fund with investment management related services for which the Fund pays a monthly management fee. The management fee is the sum of an individual fund fee rate that is based on an annual rate of .60% of the Fund's average net assets and a group fee rate that averaged .26% during the period. The group fee rate is based upon the average net assets of all the mutual funds advised by FMR. The group fee rate decreases as assets under management increase and increases as assets under management decrease. In addition, the management fee is subject to a performance adjustment (up to a maximum of ± .20% of the Fund's average net assets over a 36 month performance period). The upward or downward adjustment to the management fee is based on the relative investment performance of International Small Cap Opportunities as compared to an appropriate benchmark index. For the period, the total annual management fee rate, including the performance adjustment, was .66% of the Fund's average net assets.
Distribution and Service Plan Fees. In accordance with Rule 12b-1 of the 1940 Act, the Fund has adopted separate Distribution and Service Plans for each class of shares. Certain classes pay Fidelity Distributors Corporation (FDC), an affiliate of FMR, separate Distribution and Service Fees, each of which is based on an annual percentage of each class' average net assets. In addition, FDC may pay financial intermediaries for selling shares of the Fund and providing shareholder support services. For the period, the Distribution and Service Fee rates, total fees and amounts retained by FDC were as follows:
| Distribution
Fee | Service
Fee | Total
Fees | Retained
by FDC |
Class A | -% | .25% | $ 51,958 | $ 413 |
Class T | .25% | .25% | 53,522 | 308 |
Class B | .75% | .25% | 27,423 | 20,595 |
Class C | .75% | .25% | 83,724 | 6,165 |
| | | $ 216,627 | $ 27,481 |
Sales Load. FDC may receive a front-end sales charge of up to 5.75% for selling Class A shares, and 3.50% for selling Class T shares, some of which is paid to financial intermediaries for selling shares of the Fund. Depending on the holding period, FDC may receive contingent deferred sales charges levied on Class A, Class T, Class B, and Class C redemptions. The deferred sales charges range from 5% to 1% for Class B, 1% for Class C, 1.00% for certain purchases of Class A shares and .25% for certain purchases of Class T shares.
Annual Report
5. Fees and Other Transactions with Affiliates - continued
Sales Load - continued
For the period, sales charge amounts retained by FDC were as follows:
| Retained
by FDC |
Class A | $ 8,326 |
Class T | 2,104 |
Class B* | 5,991 |
Class C* | 326 |
| $ 16,747 |
* When Class B and Class C shares are initially sold, FDC pays commissions from its own resources to financial intermediaries through which the sales are made.
Transfer Agent Fees. Fidelity Investments Institutional Operations Company, Inc. (FIIOC), an affiliate of FMR, is the transfer, dividend disbursing and shareholder servicing agent for each class of the Fund. FIIOC receives account fees and asset-based fees that vary according to the account size and type of account of the shareholders of the respective classes of the Fund. FIIOC pays for typesetting, printing and mailing of shareholder reports, except proxy statements. For the period, transfer agent fees for each class were as follows:
| Amount | % of
Average
Net Assets |
Class A | $ 62,852 | .30 |
Class T | 33,760 | .32 |
Class B | 8,293 | .30 |
Class C | 25,383 | .30 |
International Small Cap Opportunities | 1,132,318 | .29 |
Institutional Class | 4,606 | .25 |
| $ 1,267,212 | |
Accounting and Security Lending Fees. Fidelity Service Company, Inc. (FSC), an affiliate of FMR, maintains the Fund's accounting records. The accounting fee is based on the level of average net assets for the month. Under a separate contract, FSC administers the security lending program. The security lending fee is based on the number and duration of lending transactions.
Brokerage Commissions. The Fund placed a portion of its portfolio transactions with brokerage firms which are affiliates of the investment adviser. The commissions paid to these affiliated firms were $1,185 for the period.
Annual Report
Notes to Financial Statements - continued
6. Committed Line of Credit.
The Fund participates with other funds managed by FMR or an affiliate in a $4.0 billion credit facility (the "line of credit") to be utilized for temporary or emergency purposes to fund shareholder redemptions or for other short-term liquidity purposes. The Fund has agreed to pay commitment fees on its pro-rata portion of the line of credit, which amounted to $1,348 and is reflected in Miscellaneous expenses on the Statement of Operations. During the period, there were no borrowings on this line of credit.
7. Security Lending.
The Fund lends portfolio securities through a lending agent from time to time in order to earn additional income. For equity securities, a lending agent is used and may loan securities to certain qualified borrowers, including Fidelity Capital Markets (FCM), a broker-dealer affiliated with the Fund. On the settlement date of the loan, the Fund receives collateral (in the form of U.S. Treasury obligations, letters of credit and/or cash) against the loaned securities and maintains collateral in an amount not less than 100% of the market value of the loaned securities during the period of the loan. The market value of the loaned securities is determined at the close of business of the Fund and any additional required collateral is delivered to the Fund on the next business day. If the borrower defaults on its obligation to return the securities loaned because of insolvency or other reasons, a fund could experience delays and costs in recovering the securities loaned or in gaining access to the collateral. Any cash collateral received is invested in the Fidelity Securities Lending Cash Central Fund. The value of loaned securities and cash collateral at period end are disclosed on the Fund's Statement of Assets and Liabilities. Security lending income represents the income earned on investing cash collateral, less rebates paid to borrowers and any lending agent fees associated with the loan, plus any premium payments received for lending certain types of securities. Security lending income is presented in the Statement of Operations as a component of income from Fidelity Central Funds. Total security lending income during the period amounted to $208,963. During the period, there were no securities loaned to FCM.
8. Expense Reductions.
FMR voluntarily agreed to reimburse a portion of its management fee. For the period, the amount of this reimbursement was $5,729.
Many of the brokers with whom FMR places trades on behalf of the Fund provided services to the Fund in addition to trade execution. These services included payments of certain expenses on behalf of the Fund totaling $47,857 for the period. In addition, through arrangements with the Fund's custodian, credits realized as a result of uninvested cash balances were used to reduce the Fund's expenses. During the period, these credits reduced the Fund's expenses by $45.
Annual Report
9. Distributions to Shareholders.
Distributions to shareholders of each class were as follows:
Years ended October 31, | 2011 | 2010 |
From net investment income | | |
Class A | $ 234,699 | $ 167,529 |
Class T | 95,132 | 81,809 |
Class B | 17,225 | 11,651 |
Class C | 53,555 | 35,378 |
International Small Cap Opportunities | 5,789,167 | 3,548,259 |
Institutional Class | 33,517 | 16,552 |
Total | $ 6,223,295 | $ 3,861,178 |
From net realized gain | | |
Class A | $ 81,710 | $ 203,751 |
Class T | 45,784 | 126,944 |
Class B | 4,543 | 31,778 |
Class C | 13,930 | 96,486 |
International Small Cap Opportunities | 1,606,951 | 3,588,127 |
Institutional Class | 9,075 | 20,407 |
Total | $ 1,761,993 | $ 4,067,493 |
10. Share Transactions.
Transactions for each class of shares were as follows:
| Shares | Dollars |
Years ended October 31, | 2011 | 2010 | 2011 | 2010 |
Class A | | | | |
Shares sold | 414,528 | 502,676 | $ 4,258,719 | $ 4,331,157 |
Reinvestment of distributions | 27,655 | 39,668 | 279,266 | 334,402 |
Shares redeemed | (586,134) | (821,208) | (5,964,528) | (7,086,973) |
Net increase (decrease) | (143,951) | (278,864) | $ (1,426,543) | $ (2,421,414) |
Class T | | | | |
Shares sold | 106,538 | 202,721 | $ 1,079,217 | $ 1,752,774 |
Reinvestment of distributions | 13,404 | 24,207 | 134,702 | 202,613 |
Shares redeemed | (371,432) | (563,942) | (3,710,229) | (4,787,797) |
Net increase (decrease) | (251,490) | (337,014) | $ (2,496,310) | $ (2,832,410) |
Class B | | | | |
Shares sold | 6,900 | 33,509 | $ 67,544 | $ 282,738 |
Reinvestment of distributions | 1,989 | 4,957 | 19,877 | 40,893 |
Shares redeemed | (71,270) | (89,943) | (711,316) | (751,714) |
Net increase (decrease) | (62,381) | (51,477) | $ (623,895) | $ (428,083) |
Annual Report
Notes to Financial Statements - continued
10. Share Transactions - continued
| Shares | Dollars |
Years ended October 31, | 2011 | 2010 | 2011 | 2010 |
Class C | | | | |
Shares sold | 80,402 | 138,774 | $ 802,688 | $ 1,172,961 |
Reinvestment of distributions | 5,984 | 13,874 | 59,727 | 114,325 |
Shares redeemed | (295,393) | (301,965) | (2,919,335) | (2,545,004) |
Net increase (decrease) | (209,007) | (149,317) | $ (2,056,920) | $ (1,257,718) |
International Small Cap Opportunities | | | | |
Shares sold | 4,054,816 | 11,750,215 | $ 41,630,046 | $ 101,991,968 |
Reinvestment of distributions | 693,159 | 792,800 | 7,035,420 | 6,738,804 |
Shares redeemed | (11,579,067) | (12,779,026) | (119,651,010) | (110,633,144) |
Net increase (decrease) | (6,831,092) | (236,011) | $ (70,985,544) | $ (1,902,372) |
Institutional Class | | | | |
Shares sold | 36,278 | 111,833 | $ 362,488 | $ 1,028,388 |
Reinvestment of distributions | 3,294 | 3,263 | 33,471 | 27,765 |
Shares redeemed | (141,623) | (119,898) | (1,476,463) | (1,034,340) |
Net increase (decrease) | (102,051) | (4,802) | $ (1,080,504) | $ 21,813 |
11. Other.
The Fund's organizational documents provide former and current trustees and officers with a limited indemnification against liabilities arising in connection with the performance of their duties to the Fund. In the normal course of business, the Fund may also enter into contracts that provide general indemnifications. The Fund's maximum exposure under these arrangements is unknown as this would be dependent on future claims that may be made against the Fund. The risk of material loss from such claims is considered remote.
Annual Report
To the Trustees of Fidelity Investment Trust and Shareholders of Fidelity International Small Cap Opportunities Fund:
We have audited the accompanying statement of assets and liabilities of Fidelity International Small Cap Opportunities Fund (the Fund), a fund of Fidelity Investment Trust, including the schedule of investments, as of October 31, 2011, and the related statement of operations for the year then ended, the statement of changes in net assets for each of the two years in the period then ended, and the financial highlights for each of the five years in the period then ended. These financial statements and financial highlights are the responsibility of the Fund's management. Our responsibility is to express an opinion on these financial statements and financial highlights based on our audits.
We conducted our audits in accordance with the standards of the Public Company Accounting Oversight Board (United States). Those standards require that we plan and perform the audit to obtain reasonable assurance about whether the financial statements and financial highlights are free of material misstatement. The Fund is not required to have, nor were we engaged to perform, an audit of its internal control over financial reporting. Our audits included consideration of internal control over financial reporting as a basis for designing audit procedures that are appropriate in the circumstances, but not for the purpose of expressing an opinion on the effectiveness of the Fund's internal control over financial reporting. Accordingly, we express no such opinion. An audit also includes examining, on a test basis, evidence supporting the amounts and disclosures in the financial statements, assessing the accounting principles used and significant estimates made by management, as well as evaluating the overall financial statement presentation. Our procedures included confirmation of securities owned as of October 31, 2011, by correspondence with the custodians and brokers; where replies were not received from brokers, we performed other auditing procedures. We believe that our audits provide a reasonable basis for our opinion.
In our opinion, the financial statements and financial highlights referred to above present fairly, in all material respects, the financial position of Fidelity International Small Cap Opportunities Fund as of October 31, 2011, the results of its operations for the year then ended, the changes in its net assets for each of the two years in the period then ended, and the financial highlights for each of the five years in the period then ended, in conformity with accounting principles generally accepted in the United States of America.
DELOITTE & TOUCHE LLP
Boston, Massachusetts
December 12, 2011
Annual Report
The Trustees, Members of the Advisory Board, and executive officers of the trust and fund, as applicable, are listed below. The Board of Trustees governs the fund and is responsible for protecting the interests of shareholders. The Trustees are experienced executives who meet periodically throughout the year to oversee the fund's activities, review contractual arrangements with companies that provide services to the fund, oversee management of the risks associated with such activities and contractual arrangements, and review the fund's performance. Except for James C. Curvey, each of the Trustees oversees 226 funds advised by FMR or an affiliate. Mr. Curvey oversees 429 funds advised by FMR or an affiliate.
The Trustees hold office without limit in time except that (a) any Trustee may resign; (b) any Trustee may be removed by written instrument, signed by at least two-thirds of the number of Trustees prior to such removal; (c) any Trustee who requests to be retired or who has become incapacitated by illness or injury may be retired by written instrument signed by a majority of the other Trustees; and (d) any Trustee may be removed at any special meeting of shareholders by a two-thirds vote of the outstanding voting securities of the trust. Each Trustee who is not an interested person (as defined in the 1940 Act) (Independent Trustee), shall retire not later than the last day of the calendar year in which his or her 75th birthday occurs. The Independent Trustees may waive this mandatory retirement age policy with respect to individual Trustees. The executive officers and Advisory Board Members hold office without limit in time, except that any officer and Advisory Board Member may resign or may be removed by a vote of a majority of the Trustees at any regular meeting or any special meeting of the Trustees. Except as indicated, each individual has held the office shown or other offices in the same company for the past five years.
Experience, Skills, Attributes, and Qualifications of the Fund's Trustees. The Governance and Nominating Committee has adopted a statement of policy that describes the experience, qualifications, attributes, and skills that are necessary and desirable for potential Independent Trustee candidates (Statement of Policy). The Board believes that each Trustee satisfied at the time he or she was initially elected or appointed a Trustee, and continues to satisfy, the standards contemplated by the Statement of Policy. The Governance and Nominating Committee also engages professional search firms to help identify potential Independent Trustee candidates who have the experience, qualifications, attributes, and skills consistent with the Statement of Policy. From time to time, additional criteria based on the composition and skills of the current Independent Trustees, as well as experience or skills that may be appropriate in light of future changes to board composition, business conditions, and regulatory or other developments, have also been considered by the professional search firms and the Governance and Nominating Committee. In addition, the Board takes into account the Trustees' commitment and participation in Board and committee meetings, as well as their leadership of standing and ad hoc committees throughout their tenure.
In determining that a particular Trustee was and continues to be qualified to serve as a Trustee, the Board has considered a variety of criteria, none of which, in isolation, was controlling. The Board believes that, collectively, the Trustees have balanced and diverse experience, qualifications, attributes, and skills, which allow the Board to operate effectively in governing the fund and protecting the interests of shareholders. Information about the specific experience, skills, attributes, and qualifications of each Trustee, which in each case led to the Board's conclusion that the Trustee should serve (or continue to serve) as a trustee of the fund, is provided below.
Annual Report
Board Structure and Oversight Function. James C. Curvey is an interested person (as defined in the 1940 Act) and currently serves as Acting Chairman. The Trustees have determined that an interested Chairman is appropriate and benefits shareholders because an interested Chairman has a personal and professional stake in the quality and continuity of services provided to the fund. Independent Trustees exercise their informed business judgment to appoint an individual of their choosing to serve as Chairman, regardless of whether the Trustee happens to be independent or a member of management. The Independent Trustees have determined that they can act independently and effectively without having an Independent Trustee serve as Chairman and that a key structural component for assuring that they are in a position to do so is for the Independent Trustees to constitute a substantial majority for the Board. The Independent Trustees also regularly meet in executive session. Ned C. Lautenbach serves as Chairman of the Independent Trustees and as such (i) acts as a liaison between the Independent Trustees and management with respect to matters important to the Independent Trustees and (ii) with management prepares agendas for Board meetings.
Fidelity funds are overseen by different Boards of Trustees. The fund's Board oversees Fidelity's equity and high income funds and another Board oversees Fidelity's investment-grade bond, money market, and asset allocation funds. The asset allocation funds may invest in Fidelity funds overseen by the fund's Board. The use of separate Boards, each with its own committee structure, allows the Trustees of each group of Fidelity funds to focus on the unique issues of the funds they oversee, including common research, investment, and operational issues. On occasion, the separate Boards establish joint committees to address issues of overlapping consequences for the Fidelity funds overseen by each Board.
The Trustees operate using a system of committees to facilitate the timely and efficient consideration of all matters of importance to the Trustees, the fund, and fund shareholders and to facilitate compliance with legal and regulatory requirements and oversight of the fund's activities and associated risks. The Board, acting through its committees, has charged FMR and its affiliates with (i) identifying events or circumstances the occurrence of which could have demonstrably adverse effects on the fund's business and/or reputation; (ii) implementing processes and controls to lessen the possibility that such events or circumstances occur or to mitigate the effects of such events or circumstances if they do occur; and (iii) creating and maintaining a system designed to evaluate continuously business and market conditions in order to facilitate the identification and implementation processes described in (i) and (ii) above. Because the day-to-day operations and activities of the fund are carried out by or through FMR, its affiliates and other service providers, the fund's exposure to risks is mitigated but not eliminated by the processes overseen by the Trustees. While each of the Board's committees has responsibility for overseeing different aspects of the fund's activities, oversight is exercised primarily through the Operations, Audit, and Compliance Committees. In addition, the Independent Trustees have worked with FMR to enhance the Board's oversight of investment and financial risks, legal and regulatory risks, technology risks, and operational risks, including the development of additional risk reporting to the Board. For example, a working group comprised of Independent Trustees and FMR has worked and continues to work to review the Fidelity funds' valuation-related activities, reporting and risk management. Appropriate personnel, including but not limited to the fund's Chief Compliance Officer (CCO), FMR's internal auditor, the independent accountants, the fund's Treasurer and portfolio management personnel, make periodic reports to the Board's committees, as appropriate, including an annual review of FMR's risk management program for the Fidelity funds. The responsibilities of each standing committee, including their oversight responsibilities, are described further under "Standing Committees of the Fund's Trustees."
Annual Report
Trustees and Officers - continued
The fund's Statement of Additional Information (SAI) includes more information about the Trustees. To request a free copy, call Fidelity at 1-800-544-8544.
Interested Trustees*:
Correspondence intended for each Trustee who is an interested person may be sent to Fidelity Investments, 82 Devonshire Street, Boston, Massachusetts 02109.
Name, Age; Principal Occupations and Other Relevant Experience+ |
James C. Curvey (76) |
| Year of Election or Appointment: 2007 Mr. Curvey is Trustee and Acting Chairman of the Board of Trustees of certain Trusts. Mr. Curvey also serves as Trustee (2007-present) of other investment companies advised by FMR. Mr. Curvey is a Director of Fidelity Investments Money Management, Inc. (2009-present), Director of Fidelity Research & Analysis Co. (2009-present) and Director of FMR and FMR Co., Inc. (2007-present). Mr. Curvey is also Vice Chairman (2007-present) and Director of FMR LLC. In addition, Mr. Curvey serves as an Overseer for the Boston Symphony Orchestra and a member of the Trustees of Villanova University. Previously, Mr. Curvey was the Vice Chairman (2006-2007) and Director (2000-2007) of FMR Corp. |
Ronald P. O'Hanley (54) |
| Year of Election or Appointment: 2011 Mr. O'Hanley is Director of FMR Co., Inc. (2010-present), Director of Fidelity Investments Money Management, Inc. (2010-present), Director of Fidelity Research & Analysis Company (2010-present), President of Fidelity Asset Management and Corporate Services and a member of Fidelity's Executive Committee (2010-present). Previously, Mr. O'Hanley served as President and Chief Executive Officer of BNY Mellon Asset Management (2007-2010). Mr. O'Hanley also served as Vice Chairman of Bank New York Mellon Corp. and a member of that firm's Executive Committee. Prior to the 2007 merger of The Bank of New York and Mellon Financial Corporation, he was Vice Chairman of Mellon Financial Corporation and President and Chief Executive Officer of Mellon Asset Management. He joined Mellon in February 1997. Mr. O'Hanley currently serves as Chairman of the Boston Public Library Foundation Board of Directors and sits on the Board of Directors of Beth Israel Deaconess Medical Center, the Board of Trustees of the Marine Biological Laboratory and the Advisory Board of the Maxwell School of Citizenship and Public Administration at Syracuse University. Mr. O'Hanley also chairs the Council on Asset Management for the Financial Services Roundtable and is a member of the Board of Directors of Institutional Investor's U.S. Institute. |
* Trustees have been determined to be "Interested Trustees" by virtue of, among other things, their affiliation with the trust or various entities under common control with FMR.
+ The information above includes each Trustee's principal occupation during the last five years and other information relating to the experience, attributes, and skills relevant to each Trustee's qualifications to serve as a Trustee, which led to the conclusion that each Trustee should serve as a Trustee for the fund.
Annual Report
Trustees and Officers - continued
Independent Trustees:
Correspondence intended for each Independent Trustee (that is, the Trustees other than the Interested Trustees) may be sent to Fidelity Investments, P.O. Box 55235, Boston, Massachusetts 02205-5235.
Name, Age; Principal Occupations and Other Relevant Experience+ |
Dennis J. Dirks (63) |
| Year of Election or Appointment: 2005 Prior to his retirement in May 2003, Mr. Dirks was Chief Operating Officer and a member of the Board of The Depository Trust & Clearing Corporation (DTCC). He also served as President, Chief Operating Officer, and Board member of The Depository Trust Company (DTC) and President and Board member of the National Securities Clearing Corporation (NSCC). In addition, Mr. Dirks served as Chief Executive Officer and Board member of the Government Securities Clearing Corporation, Chief Executive Officer and Board member of the Mortgage-Backed Securities Clearing Corporation, as a Trustee and a member of the Finance Committee of Manhattan College (2005-2008), and as a Trustee and a member of the Finance Committee of AHRC of Nassau County (2006-2008). Mr. Dirks is a member of the Independent Directors Council (IDC) Governing Council (2010-Present) and Board of Directors for The Brookville Center for Children's Services, Inc. (2009-present). |
Alan J. Lacy (58) |
| Year of Election or Appointment: 2008 Mr. Lacy serves as Senior Adviser (2007-present) of Oak Hill Capital Partners, L.P. (private equity). Mr. Lacy also served as Chief Executive Officer (2000-2005) and Vice Chairman (2005-2006) of Sears Holdings Corporation and Sears, Roebuck and Co. (retail). In addition, Mr. Lacy serves as a member of the Board of Directors of Dave & Buster's, Inc. (restaurant and entertainment complexes, 2010-present), The Hillman Companies, Inc. (hardware wholesalers, 2010-present), and Bristol-Myers Squibb Company (global pharmaceuticals, 2007-present). Mr. Lacy is a member of the Board of Trustees of The National Parks Conservation Association (2006-Present). Previously, Mr. Lacy served as Chairman of the Board of Trustees of the National Parks Conservation Association (2008-2011) and as a member of the Board of Directors for the Western Union Company (global money transfer, 2006-2011). |
Ned C. Lautenbach (67) |
| Year of Election or Appointment: 2000 Mr. Lautenbach is Chairman of the Independent Trustees of the Equity and High Income Funds (2006-present). Mr. Lautenbach currently serves as the Lead Director of the Eaton Corporation Board of Directors (diversified industrial, 1997-present). Mr. Lautenbach is also a member of the Board of Directors of the Philharmonic Center for the Arts in Naples, Florida (1999-present); a member of the Board of Trustees of Fairfield University (2005-present); and a member of the Council on Foreign Relations (1994-present). Previously, Mr. Lautenbach was a Partner/Advisory Partner at Clayton, Dubilier & Rice, LLC (private equity investment, 1998-2010), as well as a Director of Sony Corporation (2006-2007). |
Joseph Mauriello (67) |
| Year of Election or Appointment: 2008 Prior to his retirement in January 2006, Mr. Mauriello served in numerous senior management positions including Deputy Chairman and Chief Operating Officer (2004-2005), and Vice Chairman of Financial Services (2002-2004) of KPMG LLP US (professional services, 1965-2005). Mr. Mauriello currently serves as a member of the Board of Directors of XL Group plc. (global insurance and re-insurance, 2006-present) and of Arcadia Resources Inc. (health care services and products, 2007-present). Previously, Mr. Mauriello served as a Director of the Hamilton Funds of the Bank of New York (2006-2007). |
Robert W. Selander (61) |
| Year of Election or Appointment: 2011 Previously, Mr. Selander served as a Member of the Advisory Board of Fidelity's Equity and High Income Funds (2011), Executive Vice Chairman (2010), Chief Executive Officer (2009-2010), and President and Chief Executive Officer (1997-2009) of Mastercard, Inc. |
Cornelia M. Small (67) |
| Year of Election or Appointment: 2005 Ms. Small is a member of the Board of Directors of the Teagle Foundation (2009-present). Ms. Small is also a member of the Investment Committee, and Chair (2008-present) and a member of the Board of Trustees of Smith College. In addition, Ms. Small serves on the Investment Committee of the Berkshire Taconic Community Foundation (2008-present). Previously, Ms. Small served as Chairperson of the Investment Committee (2002-2008) of Smith College. In addition, Ms. Small served as Chief Investment Officer, Director of Global Equity Investments, and a member of the Board of Directors of Scudder, Stevens & Clark and Scudder Kemper Investments. |
William S. Stavropoulos (72) |
| Year of Election or Appointment: 2001 Mr. Stavropoulos is Vice Chairman of the Independent Trustees of the Equity and High Income Funds (2006-present). Mr. Stavropoulos serves as President and Founder of the Michigan Baseball Foundation, the Great Lakes Loons (2007-present). Mr. Stavropoulos is Chairman Emeritus of the Board of Directors of The Dow Chemical Company, where he previously served in numerous senior management positions, including President, CEO (1995-2000; 2002-2004), Chairman of the Executive Committee (2000-2006), and as a member of the Board of Directors (1990-2006). Currently, Mr. Stavropoulos is Chairman of Univar (global distributor of commodity and specialty chemicals, 2010-present), a Director of Teradata Corporation (data warehousing and technology solutions, 2008-present), Chemical Financial Corporation, Maersk Inc. (industrial conglomerate), Tyco International, Inc. (multinational manufacturing and services, 2007-present), and a member of the Advisory Board for Metalmark Capital (private equity investment, 2005-present). Mr. Stavropoulos is a special advisor to Clayton, Dubilier & Rice, LLC (private equity investment). In addition, Mr. Stavropoulos is a member of the University of Notre Dame Advisory Council for the College of Science. |
David M. Thomas (62) |
| Year of Election or Appointment: 2008 Previously, Mr. Thomas served as Executive Chairman (2005-2006) and Chairman and Chief Executive Officer (2000-2005) of IMS Health, Inc. (pharmaceutical and healthcare information solutions). In addition, Mr. Thomas serves as a member of the Board of Directors of Fortune Brands, Inc. (consumer products), and Interpublic Group of Companies, Inc. (marketing communication, 2004-present). |
Michael E. Wiley (61) |
| Year of Election or Appointment: 2008 Mr. Wiley also serves as a Director of Asia Pacific Exploration Consolidated (international oil and gas exploration and production, 2008-present). Mr. Wiley serves as a Director of Tesoro Corporation (independent oil refiner and marketer, 2005-present), and a Director of Bill Barrett Corporation (exploration and production, 2005-present). In addition, Mr. Wiley also serves as a Director of Post Oak Bank (privately-held bank, 2004-present). Previously, Mr. Wiley served as a member of the Board of Trustees of the University of Tulsa (2000-2006; 2007-2010), as a Senior Energy Advisor of Katzenbach Partners, LLC (consulting, 2006-2007), as an Advisory Director of Riverstone Holdings (private investment), Chairman, President, and CEO of Baker Hughes, Inc. (oilfield services, 2000-2004), and as Director of Spinnaker Exploration Company (exploration and production, 2001-2005). |
Annual Report
+ The information above includes each Trustee's principal occupation during the last five years and other information relating to the experience, attributes, and skills relevant to each Trustee's qualifications to serve as a Trustee, which led to the conclusion that each Trustee should serve as a Trustee for the fund.
Advisory Board Members and Executive Officers:
Correspondence intended for each executive officer, Edward C. Johnson 3d, and Peter S. Lynch may be sent to Fidelity Investments, 82 Devonshire Street, Boston, Massachusetts 02109.
Name, Age; Principal Occupation |
Edward C. Johnson 3d (81) |
| Year of Election or Appointment: 2011 Member of the Advisory Board of Fidelity's Equity and High Income Funds. Mr. Johnson serves as Chief Executive Officer, Chairman, and a Director of FMR LLC, and also serves as Chairman and Director of FIL Limited. Previously, Mr. Johnson served as a Trustee and Chairman of the Board of certain Fidelity Trusts, Chairman and a Director of FMR, Chairman and a Director of FMR Co., Inc., and President of FMR LLC (2006-2007). |
Peter S. Lynch (67) |
| Year of Election or Appointment: 2003 Member of the Advisory Board of Fidelity's Equity and High Income Funds. Mr. Lynch is Vice Chairman and a Director of FMR and FMR Co., Inc. In addition, Mr. Lynch serves as a Trustee of Boston College and as the Chairman of the Inner-City Scholarship Fund. Previously, Mr. Lynch served on the Special Olympics International Board of Directors (1997-2006). |
Kenneth B. Robins (42) |
| Year of Election or Appointment: 2008 President and Treasurer of Fidelity's Equity and High Income Funds. Mr. Robins also serves as President and Treasurer (2010-present) and Assistant Treasurer (2009-present) of other Fidelity funds and is an employee of Fidelity Investments (2004-present). Previously, Mr. Robins served as Deputy Treasurer of the Fidelity funds (2005-2008) and Treasurer and Chief Financial Officer of The North Carolina Capital Management Trust: Cash and Term Portfolios (2006-2008). |
Brian B. Hogan (47) |
| Year of Election or Appointment: 2009 Vice President of Equity and High Income Funds. Mr. Hogan also serves as President of FMR's Equity Division (2009-present). Previously, Mr. Hogan served as Senior Vice President, Equity Research of FMR (2006-2009) and as a portfolio manager. |
Thomas C. Hense (47) |
| Year of Election or Appointment: 2008 or 2010 Vice President of Fidelity's High Income (2008), Small Cap (2008), and Value (2010) Funds. Previously, Mr. Hense served as a portfolio manager for Fidelity's Institutional Money Management Group (Pyramis) (2003-2008). |
Scott C. Goebel (43) |
| Year of Election or Appointment: 2008 Secretary and Chief Legal Officer (CLO) of the Fidelity funds. Mr. Goebel also serves as Secretary of Fidelity Investments Money Management, Inc. (FIMM) (2010-present) and Fidelity Research and Analysis Company (FRAC) (2010-present); Secretary and CLO of The North Carolina Capital Management Trust: Cash and Term Portfolios (2008-present); General Counsel, Secretary, and Senior Vice President of FMR (2008-present) and FMR Co., Inc. (2008-present); employed by FMR LLC or an affiliate (2001-present); Chief Legal Officer of Fidelity Management & Research (Hong Kong) Limited (2008-present) and Assistant Secretary of Fidelity Management & Research (Japan) Inc. (2008-present), and Fidelity Management & Research (U.K.) Inc. (2008-present). Previously, Mr. Goebel served as Assistant Secretary of FIMM (2008-2010), FRAC (2008-2010), and the Funds (2007-2008) and as Vice President and Secretary of Fidelity Distributors Corporation (FDC) (2005-2007). |
William C. Coffey (42) |
| Year of Election or Appointment: 2009 Assistant Secretary of Fidelity's Equity and High Income Funds. Mr. Coffey also serves as Senior Vice President and Deputy General Counsel of FMR LLC (2010-present), and is an employee of Fidelity Investments. Previously, Mr. Coffey served as Vice President and Associate General Counsel of FMR LLC (2005-2009). |
Holly C. Laurent (57) |
| Year of Election or Appointment: 2008 Anti-Money Laundering (AML) Officer of the Fidelity funds. Ms. Laurent also serves as AML Officer of The North Carolina Capital Management Trust: Cash and Term Portfolios (2008-present) and is an employee of Fidelity Investments. Previously, Ms. Laurent was Senior Vice President and Head of Legal for Fidelity Business Services India Pvt. Ltd. (2006-2008), and Senior Vice President, Deputy General Counsel and Group Head for FMR LLC (2005-2006). |
Christine Reynolds (53) |
| Year of Election or Appointment: 2008 Chief Financial Officer of the Fidelity funds. Ms. Reynolds became President of Fidelity Pricing and Cash Management Services (FPCMS) in August 2008. Ms. Reynolds served as Chief Operating Officer of FPCMS (2007-2008). Previously, Ms. Reynolds served as President, Treasurer, and Anti-Money Laundering officer of the Fidelity funds (2004-2007). |
Kenneth A. Rathgeber (64) |
| Year of Election or Appointment: 2004 Chief Compliance Officer of Fidelity's Equity and High Income Funds. Mr. Rathgeber is Chief Compliance Officer of Fidelity Management & Research (Hong Kong) Limited (2008-present), Fidelity Management & Research (Japan) Inc. (2008-present), FMR (2005-present), FMR Co., Inc. (2005-present), Fidelity Management & Research (U.K.) Inc. (2005-present), Fidelity Research & Analysis Company (2005-present), Fidelity Investments Money Management, Inc. (2005-present), Pyramis Global Advisors, LLC (2005-present), and Strategic Advisers, Inc. (2005-present). |
Jeffrey S. Christian (50) |
| Year of Election or Appointment: 2009 Deputy Treasurer of the Fidelity funds. Mr. Christian is an employee of Fidelity Investments. Previously, Mr. Christian served as Chief Financial Officer (2008-2009) of certain Fidelity funds and Senior Vice President of Fidelity Pricing and Cash Management Services (FPCMS) (2004-2009). |
Joseph F. Zambello (54) |
| Year of Election or Appointment: 2011 Deputy Treasurer of the Fidelity funds. Mr. Zambello is an employee of Fidelity Investments. Previously, Mr. Zambello served as Vice President of FMR's Program Management Group (2009-2011) and Vice President of the Transfer Agent Oversight Group (2005-2009). |
Adrien E. Deberghes (44) |
| Year of Election or Appointment: 2008 Deputy Treasurer of Fidelity's Equity and High Income Funds. Mr. Deberghes also serves as Vice President and Assistant Treasurer of Fidelity Rutland Square Trust II and Fidelity Commonwealth Trust II (2011-present), Assistant Treasurer of other Fidelity funds (2010-present), and is an employee of Fidelity Investments (2008-present). Previously, Mr. Deberghes served as Senior Vice President of Mutual Fund Administration at State Street Corporation (2007-2008), Senior Director of Mutual Fund Administration at Investors Bank & Trust (2005-2007), and Director of Finance for Dunkin' Brands (2000-2005). |
Stephanie J. Dorsey (42) |
| Year of Election or Appointment: 2010 Assistant Treasurer of Fidelity's Equity and High Income Funds. Ms. Dorsey also serves as Deputy Treasurer of other Fidelity funds (2008-present) and is an employee of Fidelity Investments (2008-present). Previously, Ms. Dorsey served as Treasurer (2004-2008) of the JPMorgan Mutual Funds and Vice President (2004-2008) of JPMorgan Chase Bank. |
John R. Hebble (53) |
| Year of Election or Appointment: 2009 Assistant Treasurer of Fidelity's Equity and High Income Funds. Mr. Hebble also serves as President (2011-present), Treasurer, and Chief Financial Officer of The North Carolina Capital Management Trust: Cash and Term Portfolios (2008-present), President and Treasurer of other Fidelity funds (2008-present) and is an employee of Fidelity Investments. |
Gary W. Ryan (53) |
| Year of Election or Appointment: 2005 Assistant Treasurer of the Fidelity funds. Mr. Ryan is an employee of Fidelity Investments. Previously, Mr. Ryan served as Vice President of Fund Reporting in Fidelity Pricing and Cash Management Services (FPCMS) (1999-2005). |
Jonathan Davis (43) |
| Year of Election or Appointment: 2010 Assistant Treasurer of the Fidelity funds. Mr. Davis is also Assistant Treasurer of Fidelity Rutland Square Trust II and Fidelity Commonwealth Trust II. Mr. Davis is an employee of Fidelity Investments. Previously, Mr. Davis served as Vice President and Associate General Counsel of FMR LLC (2003-2010). |
Annual Report
The Board of Trustees of International Small Cap Opportunities Fund voted to pay to shareholders of record at the opening of business on record date, the following distributions per share derived from capital gains realized from sales of portfolio securities, and dividends derived from net investment income:
| Pay Date | Record Date | Dividends | Capital Gains |
International Small Cap Opportunities | 12/05/11 | 12/02/11 | $0.138 | $0.01 |
International Small Cap Opportunities designates 76% and 100% of the dividends distributed on December 3, 2010 and December 30, 2010, respectively during the fiscal year as amounts which may be taken into account as a dividend for purposes of the maximum rate under section 1(h) (11) of the Internal Revenue Code.
The amounts per share which represent income derived from sources within, and taxes paid to, foreign countries or possessions of the United States are as follows:
| Pay Date | Income | Taxes |
International Small Cap Opportunities | 12/06/10 | $0.107 | $0.0076 |
| 12/31/10 | $0.046 | $0.0000 |
The fund will notify shareholders in January 2012 of amounts for use in preparing 2011 income tax returns.
Annual Report
Board Approval of Investment Advisory Contracts and Management Fees
Fidelity International Small Cap Opportunities Fund
Each year, the Board of Trustees, including the Independent Trustees (together, the Board), votes on the renewal of the management contract and sub-advisory agreements (together, the Advisory Contracts) for the fund. The Board, assisted by the advice of fund counsel and Independent Trustees' counsel, requests and considers a broad range of information relevant to the renewal of the Advisory Contracts throughout the year.
The Board meets regularly and considers at each of its meetings factors that are relevant to its annual consideration of the renewal of the fund's Advisory Contracts, including the services and support provided to the fund and its shareholders. The Board has established various standing committees, each composed of Independent Trustees with varying backgrounds, to which the Board has assigned specific subject matter responsibilities in order to enhance effective decision-making by the Board. The Board, acting directly and through its Committees, requests and receives information concerning the annual consideration of the renewal of the fund's Advisory Contracts. The Board also meets as needed to consider matters specifically related to the Board's annual consideration of the renewal of Advisory Contracts. Members of the Board may also meet with trustees of other Fidelity funds through ad hoc joint committees to discuss certain matters relevant to the Fidelity funds.
At its July 2011 meeting, the Board of Trustees, including the Independent Trustees, unanimously determined to renew the fund's Advisory Contracts. In reaching its determination, the Board considered all factors it believed relevant, including (i) the nature, extent, and quality of the services to be provided to the fund and its shareholders (including the investment performance of the fund); (ii) the competitiveness of the fund's management fee and total expense ratio; (iii) the total costs of the services to be provided by and the profits to be realized by Fidelity from its relationship with the fund; (iv) the extent to which economies of scale would be realized as the fund grows; and (v) whether fee levels reflect these economies of scale, if any, for the benefit of fund shareholders.
In considering whether to renew the Advisory Contracts for the fund, the Board reached a determination, with the assistance of fund counsel and Independent Trustees' counsel and through the exercise of its business judgment, that the renewal of the Advisory Contracts is in the best interests of the fund and its shareholders and that the compensation payable under the Advisory Contracts is fair and reasonable. The Board's decision to renew the Advisory Contracts was not based on any single factor, but rather was based on a comprehensive consideration of all the information provided to the Board at its meetings throughout the year. The Board, in reaching its determination to renew the Advisory Contracts, is aware that shareholders in the fund have a broad range of investment choices available to them, including a wide choice among mutual funds offered by Fidelity's competitors, and that the fund's shareholders, who have the opportunity to review and weigh the disclosure provided by the fund in its prospectus and other public disclosures, have chosen to invest in this fund, managed by Fidelity.
Annual Report
Nature, Extent, and Quality of Services Provided. The Board considered the staffing within the investment adviser, FMR, and the sub-advisers (together, the Investment Advisers), including the backgrounds of the fund's investment personnel and the fund's investment objective and discipline. The Independent Trustees also had discussions with senior management of Fidelity's investment operations and investment groups. The Board considered the structure of the portfolio manager compensation program and whether this structure provides appropriate incentives to act in the best interests of the fund.
Resources Dedicated to Investment Management and Support Services. The Board and the Fund Oversight and Research Committees reviewed the general qualifications and capabilities of the Investment Advisers' investment staff, including its size, education, experience, and resources, as well as the Investment Advisers' approach to recruiting, training, managing, and compensating investment personnel. The Board also noted that FMR has devoted increased resources to non-U.S. offices. The Board noted that Fidelity's analysts have extensive resources, tools and capabilities which allow them to conduct sophisticated quantitative and fundamental analysis, as well as credit analysis of issuers, counterparties and enhancers. The Board also believes that Fidelity's investment professionals have sufficient access to global information and data so as to provide competitive investment results over time, and that those professionals also have access to sophisticated tools which permit them to assess portfolio construction and risk and performance attribution characteristics continuously, as well as to transmit new information and research conclusions rapidly around the world. Additionally, in their deliberations, the Board considered the Investment Advisers' trading capabilities and resources which are an integral part of the investment management process.
Shareholder and Administrative Services. The Board considered (i) the nature, extent, quality, and cost of advisory, administrative, and shareholder services performed by the Investment Advisers and their affiliates under the Advisory Contracts and under separate agreements covering transfer agency, pricing and bookkeeping, and securities lending services for the fund; (ii) the nature and extent of the investment adviser's supervision of third party service providers, principally custodians and subcustodians; and (iii) the resources devoted to, and the record of compliance with, the fund's compliance policies and procedures. The Board also reviewed the allocation of fund brokerage, including allocations to brokers affiliated with the Investment Advisers, the use of brokerage commissions to pay fund expenses, and the use of "soft" commission dollars to pay for research services.
The Board noted that the growth of fund assets over time across the complex allows Fidelity to reinvest in the development of services designed to enhance the value or convenience of the Fidelity funds as investment vehicles. These services include 24-hour access to account information and market information through telephone representatives and over the Internet, investor education materials and asset allocation tools, and the expanded availability of Fidelity Investor Centers, with 35 new branches opening since 2010.
Annual Report
Board Approval of Investment Advisory Contracts and
Management Fees - continued
Investment in a Large Fund Family. The Board considered the benefits to shareholders of investing in a Fidelity fund, including the benefits of investing in a fund that is part of a large family of funds offering a variety of investment disciplines and providing a large variety of mutual fund investor services. The Board noted that Fidelity had taken, or had made recommendations that resulted in the Fidelity funds taking, a number of actions over the previous year that benefited particular funds, including (i) continuing to dedicate additional resources to investment research and support of the senior management team that oversees asset management; (ii) rationalizing product lines through the mergers of six funds into other funds; (iii) continuing to migrate the Freedom Funds to dedicated lower cost underlying funds; (iv) obtaining shareholder approval to broaden the investment strategies for Fidelity Consumer Finance Portfolio, Fidelity Emerging Asia Fund, and Fidelity Environment and Alternative Energy Portfolio; (v) contractually agreeing to reduce the management fees and impose other expense limitations on Spartan 500 Index Fund and U.S. Bond Index Fund in connection with launching new institutional classes of these funds; (vi) changing the name, primary and supplemental benchmarks, and investment policies of Fidelity Global Strategies Fund to support the fund's flexible investment mandate and global orientation; and (vii) reducing the transfer agency account fee rates on certain accounts.
Investment Performance. The Board considered whether the fund has operated in accordance with its investment objective, as well as its record of compliance with its investment restrictions. It also reviewed the fund's absolute investment performance for each class, as well as the fund's relative investment performance for each class measured over multiple periods against (i) a broad-based securities market index, and (ii) a peer group of mutual funds deemed appropriate by Fidelity and reviewed by the Board. The following charts considered by the Board show, over the one-, three-, and five-year periods ended December 31, 2010, the cumulative total returns of the retail class and Class B of the fund, the cumulative total returns of a broad-based securities market index ("benchmark"), and a range of cumulative total returns of a peer group of mutual funds identified by Lipper Inc. as having an investment objective similar to that of the fund. The returns of the retail class and Class B show the performance of the highest and lowest performing classes, respectively (based on five-year performance). The box within each chart shows the 25th percentile return (bottom of box) and the 75th percentile return (top of box) of the peer group. Returns shown above the box are in the first quartile and returns shown below the box are in the fourth quartile. The percentage beaten numbers noted below each chart correspond to the percentile box and represent the percentage of funds in the peer group whose performance was equal to or lower than that of the class indicated.
Annual Report
Fidelity International Small Cap Opportunities Fund
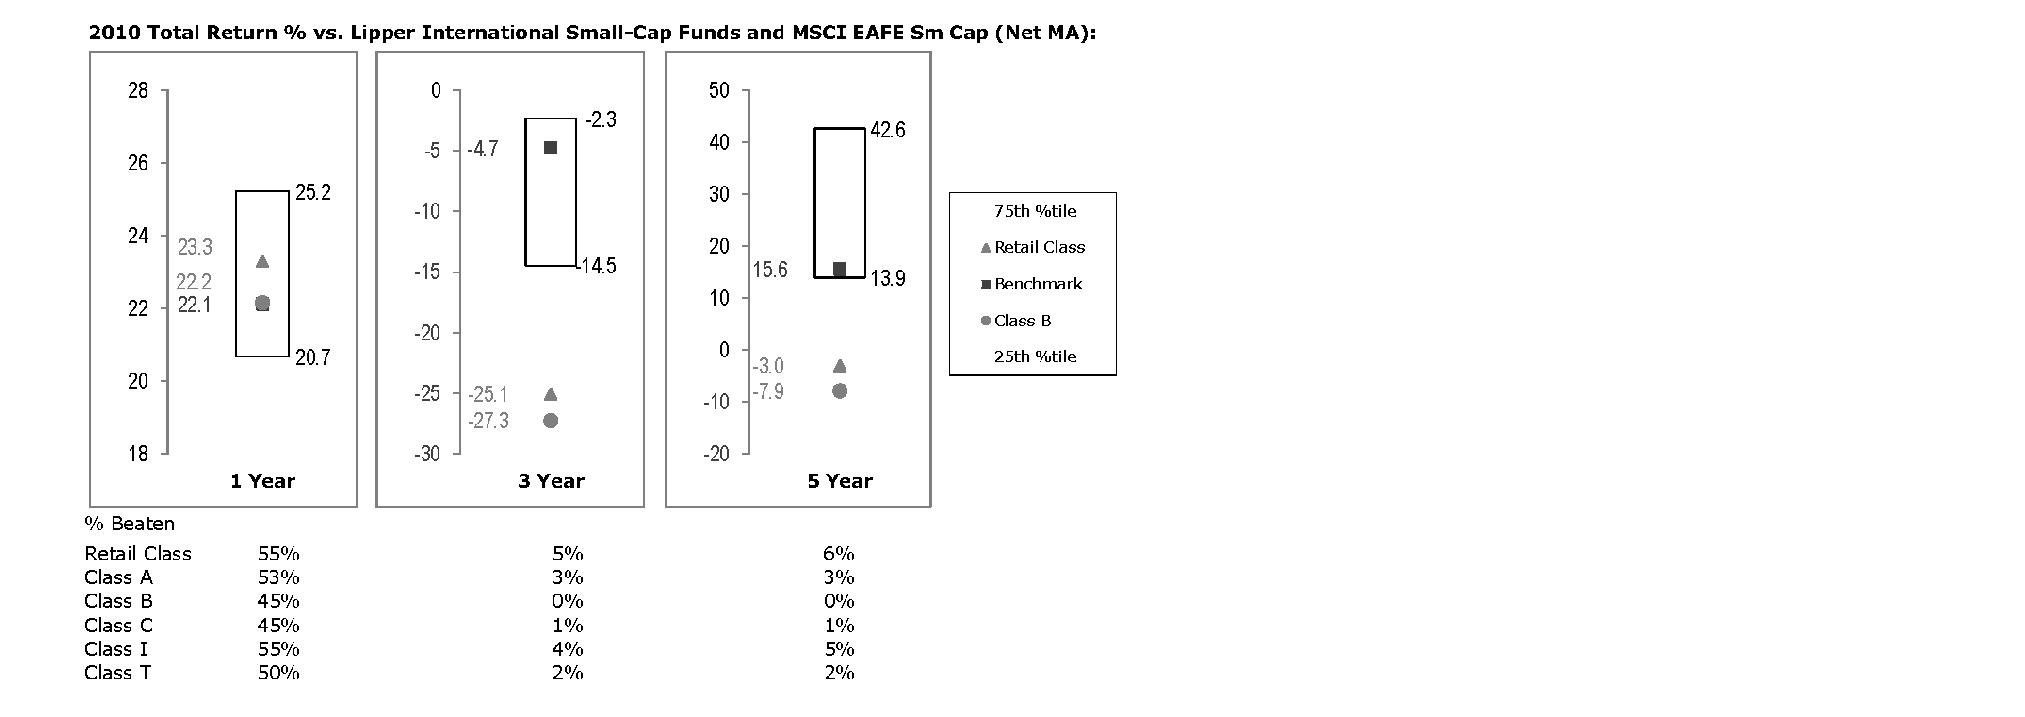
The Board reviewed the fund's relative investment performance against its peer group and noted that the performance of the retail class of the fund was in the second quartile for the one-year period and the fourth quartile for the three- and five-year periods. The Board also noted that the investment performance of the fund was lower than its benchmark for the three- and five-year periods although the one-year total return of the retail class compared favorably to its benchmark. The Board considered that the variations in performance among the fund's classes reflect the variations in class expenses, which result in lower performance for higher expense classes. The Board also reviewed the fund's performance since inception as well as performance in the current year.
The Board also considered that the fund's management fee is subject to upward or downward adjustment depending upon whether, and to what extent, the fund's investment performance for the performance period exceeds, or is exceeded by, the record (over the same period) of a Board-approved performance adjustment index. The Board noted that the performance adjustment provides FMR with a strong economic incentive to seek to achieve superior performance for the fund's shareholders and helps to more closely align the interests of FMR and the fund's shareholders.
Based on its review, the Board concluded that the nature, extent, and quality of services provided to the fund under the Advisory Contracts should benefit the fund's shareholders.
Annual Report
Board Approval of Investment Advisory Contracts and
Management Fees - continued
Competitiveness of Management Fee and Total Expense Ratio. The Board considered the fund's management fee and total expense ratio compared to "mapped groups" of competitive funds and classes. Fidelity creates "mapped groups" by combining similar Lipper investment objective categories that have comparable management fee characteristics. Combining Lipper investment objective categories aids the Board's management fee and total expense ratio comparisons by broadening the competitive group used for comparison and by reducing the number of universes to which various Fidelity funds are compared.
Management Fee. The Board considered two proprietary management fee comparisons for the 12-month periods shown in the chart below. The group of Lipper funds used by the Board for management fee comparisons is referred to below as the "Total Mapped Group." The Total Mapped Group is broader than the Lipper peer group used by the Board for performance comparisons because the Total Mapped Group combines several Lipper investment objective categories while the Lipper peer group does not. The Total Mapped Group comparison focuses on a fund's standing relative to the total universe of comparable funds available to investors in terms of gross management fees before expense reimbursements or caps, and without giving effect to the fund's performance adjustment. "TMG %" represents the percentage of funds in the Total Mapped Group that had management fees that were lower than the fund's. For example, a TMG % of 19% means that 81% of the funds in the Total Mapped Group had higher management fees than the fund. The "Asset-Size Peer Group" (ASPG) comparison focuses on a fund's standing relative to non-Fidelity funds similar in size to the fund within the Total Mapped Group. The ASPG represents at least 15% of the funds in the Total Mapped Group with comparable asset size and management fee characteristics, subject to a minimum of 50 funds (or all funds in the Total Mapped Group if fewer than 50). Additional information, such as the ASPG quartile in which the fund's management fee ranked and the impact of the fund's performance adjustment, is also included in the chart and considered by the Board.
Annual Report
Fidelity International Small Cap Opportunities Fund
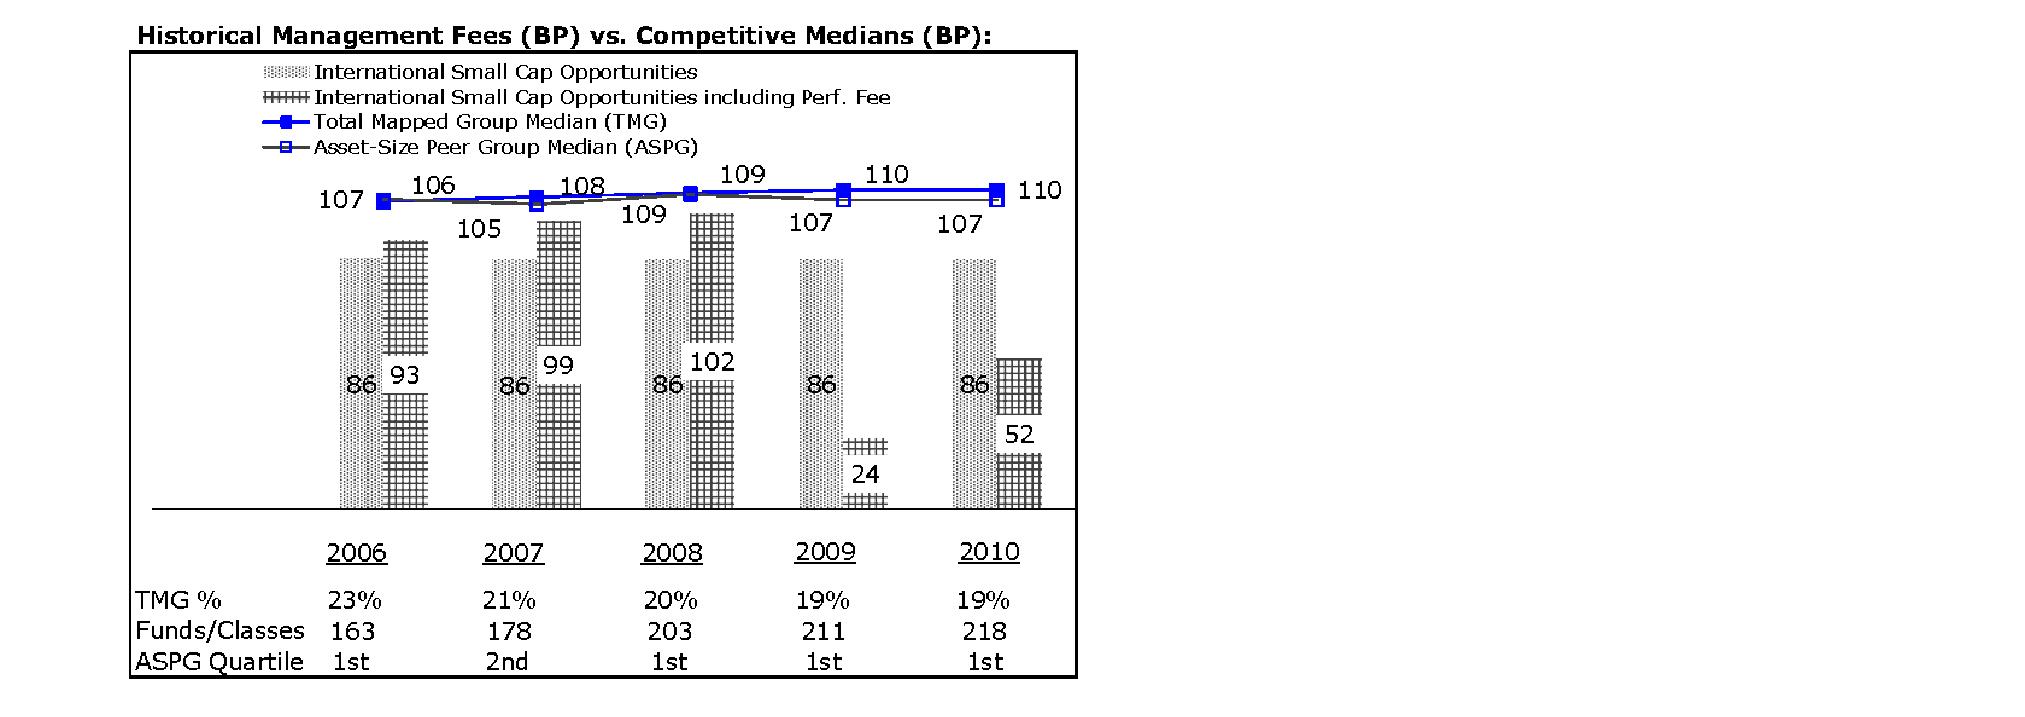
The Board noted that the fund's management fee ranked below the median of its Total Mapped Group and below the median of its ASPG for 2010. The Board also noted the effect of the fund's negative performance adjustment on the fund's management fee ranking. The Board noted that the performance adjustment for each year represents calculations for performance periods that differ from the periods shown in the performance charts above.
Based on its review, the Board concluded that the fund's management fee is fair and reasonable in light of the services that the fund receives and the other factors considered.
Total Expense Ratio. In its review of each class's total expense ratio, the Board considered the fund's management fee as well as other fund or class expenses, as applicable, such as transfer agent fees, pricing and bookkeeping fees, fund-paid 12b-1 fees, and custodial, legal, and audit fees. The Board also noted the effects of any waivers and reimbursements on fees and expenses, as well as the impact of the fund's performance adjustment. As part of its review, the Board also considered the current and historical total expense ratios of each class of the fund compared to competitive fund median expenses. Each class of the fund is compared to those funds and classes in the Total Mapped Group (used by the Board for management fee comparisons) that have a similar sales load structure.
The Board noted that the total expense ratio of each class ranked below its competitive median for 2010. The Board considered that various factors, including 12b-1 fees, positive or negative performance adjustments, and relatively higher other expenses in the case of small fund size, can affect total expense ratios.
Annual Report
Board Approval of Investment Advisory Contracts and
Management Fees - continued
Fees Charged to Other Fidelity Clients. The Board also considered Fidelity fee structures and other information with respect to clients of FMR and its affiliates, such as other mutual funds advised or subadvised by FMR or its affiliates, pension plan clients, and other institutional clients. In March 2010, the Board created an ad hoc joint committee with the board of other Fidelity funds (the Committee) to review and compare Fidelity's institutional investment advisory business with its business of providing services to the Fidelity funds, including the differences in services provided, fees charged, and costs incurred, as well as competition in their respective marketplaces.
Based on its review of total expense ratios and fees charged to other Fidelity clients, the Board concluded that the total expense ratio of each class of the fund was reasonable in light of the services that the fund and its shareholders receive and the other factors considered, including the findings of the Committee.
Costs of the Services and Profitability. The Board considered the revenues earned and the expenses incurred by Fidelity in conducting the business of developing, marketing, distributing, managing, administering and servicing the fund and its shareholders. The Board also considered the level of Fidelity's profits in respect of all the Fidelity funds.
On an annual basis, FMR presents to the Board Fidelity's profitability for the fund. Fidelity calculates the profitability for each fund, as well as aggregate profitability for groups of Fidelity funds and all Fidelity funds, using a series of detailed revenue and cost allocation methodologies which originate with the books and records of Fidelity on which Fidelity's audited financial statements are based. The Audit Committee of the Board reviews any significant changes from the prior year's methodologies.
PricewaterhouseCoopers LLP (PwC), independent registered public accounting firm and auditor to Fidelity and certain Fidelity funds, has been engaged annually by the Board as part of the Board's assessment of Fidelity's profitability analysis. PwC's engagement includes the review and assessment of Fidelity's methodologies used in determining the revenues and expenses attributable to Fidelity's mutual fund business, and completion of agreed-upon procedures surrounding the mathematical accuracy of fund profitability and its conformity to allocation methodologies. After considering PwC's reports issued under the engagement and information provided by Fidelity, the Board concluded that while other allocation methods may also be reasonable, Fidelity's profitability methodologies are reasonable in all material respects.
The Board also reviewed Fidelity's non-fund businesses and fall-out benefits related to the mutual fund business as well as cases where Fidelity's affiliates may benefit from or be related to the fund's business.
Annual Report
The Board considered the costs of the services provided by and the profits realized by Fidelity in connection with the operation of the fund and was satisfied that the profitability was not excessive in the circumstances.
Economies of Scale. The Board considered whether there have been economies of scale in respect of the management of the Fidelity funds, whether the Fidelity funds (including the fund) have appropriately benefited from any such economies of scale, and whether there is potential for realization of any further economies of scale. The Board considered the extent to which the fund will benefit from economies of scale through increased services to the fund, through waivers or reimbursements, or through fee or expense reductions. The Board also noted that in 2009, it and the board of other Fidelity funds created an ad hoc committee (the Economies of Scale Committee) to analyze whether FMR attains economies of scale in respect of the management and servicing of the Fidelity funds, whether the Fidelity funds have appropriately benefited from such economies of scale, and whether there is potential for realization of any further economies of scale.
The Board recognized that the fund's management contract incorporates a "group fee" structure, which provides for lower group fee rates as total fund assets under FMR's management increase, and for higher group fee rates as total fund assets under FMR's management decrease. FMR calculates the group fee rates based on a tiered asset "breakpoint" schedule that varies based on asset class. The Board considered that the group fee is designed to deliver the benefits of economies of scale to fund shareholders when total Fidelity fund assets increase, even if assets of any particular fund are unchanged or have declined, because some portion of Fidelity's costs are attributable to services provided to all Fidelity funds, and all funds benefit if those costs can be allocated among more assets. The Board concluded that, given the group fee structure, fund shareholders will benefit from lower management fees as assets under FMR's management increase at the fund complex level, regardless of whether Fidelity achieves any such economies of scale.
The Board concluded, taking into account the analysis of the Economies of Scale Committee, that any potential economies of scale are being appropriately shared between fund shareholders and Fidelity.
Additional Information Requested by the Board. In order to develop fully the factual basis for consideration of the Fidelity funds' Advisory Contracts, the Board requested and received additional information on certain topics, including (i) fund performance trends, actions to be taken by FMR to improve certain funds' overall performance, and Fidelity's long-term strategies for certain funds; (ii) portfolio manager changes that have occurred during the past year and length of portfolio manager tenure for different categories of funds over time; (iii) Fidelity's compensation structure for portfolio managers and other key personnel and strategies for attracting and retaining non-investment personnel; (iv) the amount of the investment that each portfolio manager has made in the Fidelity fund(s) that he or she manages; (v) historical trends in Fidelity's realization of fall-out benefits; (vi) Fidelity's group fee structures and the rationale for the individual fee rates of certain funds; (vii) fund profitability methodology and the impact of certain factors on fund profitability results; (viii) trends regarding industry use of performance fee structures and Fidelity's compliance practices with respect to performance adjustment calculations; (ix) the fee structures in place for certain other Fidelity clients; and (x) explanations regarding the relative total expense ratios of certain funds and classes, total expense competitive trends, and actions that might be taken by FMR to reduce total expense ratios for certain funds and classes.
Annual Report
Board Approval of Investment Advisory Contracts and
Management Fees - continued
Based on its evaluation of all of the conclusions noted above, and after considering all factors it believed relevant, the Board ultimately concluded that the advisory fee structures are fair and reasonable, and that the fund's Advisory Contracts should be renewed.
Annual Report
Managing Your Investments
Fidelity offers several ways to conveniently manage your personal investments via your telephone or PC. You can access your account information, conduct trades and research your investments 24 hours a day.
By Phone
Fidelity Automated Service Telephone provides a single toll-free number to access account balances, positions, quotes and trading. It's easy to navigate the service, and on your first call, the system will help you create a personal identification number (PIN) for security.
(phone graphic)
Fidelity Automated
Service Telephone (FAST®)
1-800-544-5555
Press
1 For mutual fund and brokerage trading.
2 For quotes.*
3 For account balances and holdings.
4 To review orders and mutual
fund activity.
5 To change your PIN.
*0 To speak to a Fidelity representative.
By PC
Fidelity's web site on the Internet provides a wide range of information, including daily financial news, fund performance, interactive planning tools and news about Fidelity products and services.
(computer graphic)
Fidelity's Web Site
www.fidelity.com
* When you call the quotes line, please remember that a fund's yield and return will vary and, except for money market funds, share price will also vary. This means that you may have a gain or loss when you sell your shares. There is no assurance that money market funds will be able to maintain a stable $1 share price; an investment in a money market fund is not insured or guaranteed by the U.S. government. Total returns are historical and include changes in share price, reinvestment of dividends and capital gains distributions, and the effects of any sales charges.
Annual Report
To Visit Fidelity
For directions and hours,
please call 1-800-544-9797.
Arizona
7001 West Ray Road
Chandler, AZ
15445 N. Scottsdale Road
Scottsdale, AZ
17550 North 75th Avenue
Glendale, AZ
5330 E. Broadway Blvd
Tucson, AZ
California
815 East Birch Street
Brea, CA
1411 Chapin Avenue
Burlingame, CA
851 East Hamilton Avenue
Campbell, CA
601 Larkspur Landing Circle
Larkspur, CA
2000 Avenue of the Stars
Los Angeles, CA
27101 Puerta Real
Mission Viejo, CA
73575 El Paseo
Palm Desert, CA
251 University Avenue
Palo Alto, CA
123 South Lake Avenue
Pasadena, CA
16656 Bernardo Ctr. Drive
Rancho Bernardo, CA
1220 Roseville Parkway
Roseville, CA
1740 Arden Way
Sacramento, CA
7676 Hazard Center Drive
San Diego, CA
11943 El Camino Real
San Diego, CA
8 Montgomery Street
San Francisco, CA
3793 State Street
Santa Barbara, CA
1200 Wilshire Boulevard
Santa Monica, CA
398 West El Camino Real
Sunnyvale, CA
111 South Westlake Blvd
Thousand Oaks, CA
21701 Hawthorne Boulevard
Torrance, CA
2001 North Main Street
Walnut Creek, CA
6326 Canoga Avenue
Woodland Hills, CA
2211 Michelson Drive
Irvine, CA
Colorado
281 East Flatiron Circle
Broomfield, CO
1625 Broadway
Denver, CO
9185 Westview Road
Lone Tree, CO
Connecticut
48 West Putnam Avenue
Greenwich, CT
265 Church Street
New Haven, CT
300 Atlantic Street
Stamford, CT
29 South Main Street
West Hartford, CT
1261 Post Road
Fairfield, CT
Delaware
400 Delaware Avenue
Wilmington, DE
Florida
175 East Altamonte Drive
Altamonte Springs, FL
1400 Glades Road
Boca Raton, FL
121 Alhambra Plaza
Coral Gables, FL
2948 N. Federal Highway
Ft. Lauderdale, FL
4671 Town Center Parkway
Jacksonville, FL
8880 Tamiami Trail, North
Naples, FL
230 Royal Palm Way
Palm Beach, FL
3501 PGA Boulevard
Palm Beach Gardens, FL
3550 Tamiami Trail, South
Sarasota, FL
1502 N. Westshore Blvd.
Tampa, FL
2465 State Road 7
Wellington, FL
Georgia
3242 Peachtree Road
Atlanta, GA
1000 Abernathy Road
Atlanta, GA
Illinois
One North LaSalle Street
Chicago, IL
401 North Michigan Avenue
Chicago, IL
One Skokie Valley Road
Highland Park, IL
1415 West 22nd Street
Oak Brook, IL
15105 S LaGrange Road
Orland Park, IL
1572 East Golf Road
Schaumburg, IL
1823 Freedom Drive
Naperville, IL
Indiana
8480 Keystone Crossing
Indianapolis, IN
Kansas
5400 College Boulevard
Overland Park, KS
Maine
Three Canal Plaza
Portland, ME
Maryland
7315 Wisconsin Avenue
Bethesda, MD
610 York Road
Towson, MD
Massachusetts
801 Boylston Street
Boston, MA
155 Congress Street
Boston, MA
300 Granite Street
Braintree, MA
44 Mall Road
Burlington, MA
238 Main Street
Cambridge, MA
200 Endicott Street
Danvers, MA
Fidelity Brokerage Services, Inc., 100 Summer St., Boston, MA 02110 Member NYSE/SIPC
Annual Report
405 Cochituate Road
Framingham, MA
551 Boston Turnpike
Shrewsbury, MA
Michigan
500 E. Eisenhower Pkwy.
Ann Arbor, MI
280 N. Old Woodward Ave.
Birmingham, MI
30200 Northwestern Hwy.
Farmington Hills, MI
43420 Grand River Avenue
Novi, MI
3480 28th Street
Grand Rapids, MI
2425 S. Linden Road STE E
Flint, MI
Minnesota
7740 France Avenue South
Edina, MN
8342 3rd Street North
Oakdale, MN
Missouri
1524 South Lindbergh Blvd.
St. Louis, MO
Nevada
2225 Village Walk Drive
Henderson, NV
New Jersey
501 Route 73 South
Marlton, NJ
150 Essex Street
Millburn, NJ
35 Morris Street
Morristown, NJ
396 Route 17, North
Paramus, NJ
3518 Route 1 North
Princeton, NJ
530 Broad Street
Shrewsbury, NJ
New Mexico
2261 Q Street NE
Albuquerque, NM
New York
1130 Franklin Avenue
Garden City, NY
37 West Jericho Turnpike
Huntington Station, NY
1271 Avenue of the Americas
New York, NY
980 Madison Avenue
New York, NY
61 Broadway
New York, NY
350 Park Avenue
New York, NY
200 Fifth Avenue
New York, NY
733 Third Avenue
New York, NY
2070 Broadway
New York, NY
1075 Northern Blvd.
Roslyn, NY
799 Central Park Avenue
Scarsdale, NY
3349 Monroe Avenue
Rochester, NY
North Carolina
4611 Sharon Road
Charlotte, NC
7011 Fayetteville Road
Durham, NC
Ohio
3805 Edwards Road
Cincinnati, OH
1324 Polaris Parkway
Columbus, OH
1800 Crocker Road
Westlake, OH
28699 Chagrin Boulevard
Woodmere Village, OH
Oregon
7493 SW Bridgeport Road
Tigard, OR
Pennsylvania
600 West DeKalb Pike
King of Prussia, PA
1735 Market Street
Philadelphia, PA
12001 Perry Highway
Wexford, PA
Rhode Island
10 Memorial Boulevard
Providence, RI
Tennessee
3018 Peoples Street
Johnson City, TN
7628 West Farmington Blvd.
Germantown, TN
2035 Mallory Lane
Franklin, TN
Texas
10000 Research Boulevard
Austin, TX
4001 Northwest Parkway
Dallas, TX
12532 Memorial Drive
Houston, TX
2701 Drexel Drive
Houston, TX
6560 Fannin Street
Houston, TX
1701 Lake Robbins Drive
The Woodlands, TX
6500 N. MacArthur Blvd.
Irving, TX
6005 West Park Boulevard
Plano, TX
1576 East Southlake Blvd.
Southlake, TX
15600 Southwest Freeway
Sugar Land, TX
139 N. Loop 1604 East
San Antonio, TX
Utah
279 West South Temple
Salt Lake City, UT
Virginia
1861 International Drive
McLean, VA
11957 Democracy Drive
Reston, VA
Washington
10500 NE 8th Street
Bellevue, WA
1518 6th Avenue
Seattle, WA
304 Strander Blvd
Tukwila, WA
Washington, DC
1900 K Street, N.W.
Washington, DC
Wisconsin
16020 West Bluemound Road
Brookfield, WI
Annual Report
Investment Adviser
Fidelity Management & Research Company
Boston, MA
Investment Sub-Advisers
FMR Co., Inc.
Fidelity Management & Research
(Hong Kong) Limited
Fidelity Management & Research
(Japan) Inc.
Fidelity Management & Research
(U.K.) Inc.
FIL Investments (Japan) Limited
FIL Investment Advisors
FIL Investment Advisors (U.K.) Limited
General Distributor
Fidelity Distributors Corporation
Boston, MA
Transfer and Service Agents
Fidelity Investments Institutional
Operations Company, Inc.
Boston, MA
Fidelity Service Company, Inc.
Boston, MA
Custodian
The Northern Trust Company
Chicago, IL
The Fidelity Telephone Connection
Mutual Fund 24-Hour Service
Exchanges/Redemptions
and Account Assistance 1-800-544-6666
Product Information 1-800-544-6666
Retirement Accounts 1-800-544-4774
(8 a.m. - 9 p.m.)
TDD Service 1-800-544-0118
for the deaf and hearing impaired
(9 a.m. - 9 p.m. Eastern time)
Fidelity Automated Service
Telephone (FAST®)(automated service graphic) 1-800-544-5555
(automated service graphic) Automated line for quickest service
(Fidelity Logo)
Corporate Headquarters
82 Devonshire St., Boston, MA 02109
www.fidelity.com
ILS-UANN-1211
1.815061.107
(Fidelity Logo)
Fidelity Advisor®
International Small Cap Opportunities
Fund - Class A, Class T, Class B
and Class C
Annual Report
October 31, 2011
(Fidelity Cover Art)
Class A, Class T, Class B
and Class C are classes of
Fidelity® International
Small Cap Opportunities Fund
Contents
Chairman's Message | (Click Here) | The Chairman's message to shareholders. |
Performance | (Click Here) | How the fund has done over time. |
Management's Discussion of Fund Performance | (Click Here) | The Portfolio Manager's review of fundperformance and strategy. |
Shareholder Expense Example | (Click Here) | An example of shareholder expenses. |
Investment Changes | (Click Here) | A summary of major shifts in the fund's investments over the past six months. |
Investments | (Click Here) | A complete list of the fund's investments with their market values. |
Financial Statements | (Click Here) | Statements of assets and liabilities, operations, and changes in net assets, as well as financial highlights. |
Notes | (Click Here) | Notes to the financial statements. |
Report of Independent Registered Public Accounting Firm | (Click Here) | |
Trustees and Officers | (Click Here) | |
Distributions | (Click Here) | |
Board Approval of Investment Advisory Contracts and Management Fees | (Click Here) | |
To view a fund's proxy voting guidelines and proxy voting record for the 12-month period ended June 30, visit http://www.fidelity.com/proxyvotingresults or visit the Securities and Exchange Commission's (SEC) web site at http://www.sec.gov. You may also call 1-877-208-0098 to request a free copy of the proxy voting guidelines.
Standard & Poor's, S&P and S&P 500 are registered service marks of The McGraw-Hill Companies, Inc. and have been licensed for use by Fidelity Distributors Corporation.
Other third party marks appearing herein are the property of their respective owners.
All other marks appearing herein are registered or unregistered trademarks or service marks of FMR LLC or an affiliated company.
Annual Report
This report and the financial statements contained herein are submitted for the general information of the shareholders of the fund. This report is not authorized for distribution to prospective investors in the fund unless preceded or accompanied by an effective prospectus.
A fund files its complete schedule of portfolio holdings with the SEC for the first and third quarters of each fiscal year on Form N-Q. Forms N-Q are available on the SEC's web site at http://www.sec.gov. A fund's Forms N-Q may be reviewed and copied at the SEC's Public Reference Room in Washington, DC. Information regarding the operation of the SEC's Public Reference Room may be obtained by calling 1-800-SEC-0330. For a complete list of a fund's portfolio holdings, view the most recent holdings listing, semiannual report, or annual report on Fidelity's web site at http://www.fidelity.com, http://www.advisor.fidelity.com, or http://www.401k.com, as applicable.
NOT FDIC INSURED • MAY LOSE VALUE • NO BANK GUARANTEE
Neither the fund nor Fidelity Distributors Corporation is a bank.
Annual Report
(Acting Chairman's Photograph)
Dear Shareholder:
Global equity markets began the fourth quarter on a strong note, sharply reversing course in October amid strong corporate earnings, better-than-expected economic news and the promise of a resolution to the sovereign debt crisis in Europe. The mini rally followed a third quarter marked by a significant downturn in July and August, which heightened investor anxiety and set off a wave of volatility that hampered most major asset classes through the end of September. Financial markets are difficult to predict, of course, but you can help put the odds in your favor by following these time-tested investment principles.
One of the basic tenets is to invest according to your time horizon. For long-term investors, riding out the markets' inevitable ups and downs has proven much more effective than making decisions based on short-term developments. If your goal is approaching, you can also benefit from patience and restraint, rather than attempting to time the market. No matter your time horizon, missing only a few of the markets' best days can significantly diminish returns. Patience also affords the benefits of compounding - earning interest on additional income or reinvested dividends and capital gains. While staying the course doesn't eliminate risk, it can considerably lessen the negative impact of short-term downturns.
Asset allocation is another principle to manage risk. As you spread your portfolio among the asset classes, be sure to consider your time horizon, risk tolerance and investment objectives. Younger investors may be better served by emphasizing equities, which historically have been the best-performing asset class over time. Investors who are nearing a specific goal, such as retirement or sending a child to college, may choose to favor bonds and other investments that have tended to be more stable. Studies indicate that asset allocation is the single most important determinant of a portfolio's long-term success. After deciding on a suitable allocation strategy, make sure your portfolio is adequately diversified, with exposure to stocks of small-, mid- and large-cap companies in a range of sectors, for example. And today, more than ever, geographic diversification should be taken into account.
Lastly, investing a certain amount of money on a regular basis - a principle known as dollar-cost averaging - can help lower the average cost of your purchases, while also giving you the discipline to avoid selling weak performers just prior to an upswing, or chasing a hot performer just before a correction.
We invite you to learn more by visiting us on the Internet, dropping by one of our Investor Centers or calling us by phone. It is our privilege to provide the resources you need to choose investments that are right for you.
Sincerely,
(Acting Chairman's Signature)
James C. Curvey
Acting Chairman
Annual Report
Average annual total return reflects the change in the value of an investment, assuming reinvestment of the class' distributions from dividend income and capital gains (the profits earned upon the sale of securities that have grown in value, if any) and assuming a constant rate of performance each year. The $10,000 table and the fund's returns do not reflect the deduction of taxes that a shareholder would pay on fund distributions or the redemption of fund shares. During periods of reimbursement by Fidelity, a fund's total return will be greater than it would be had the reimbursement not occurred. How a fund did yesterday is no guarantee of how it will do tomorrow.
Average Annual Total Returns
Periods ended October 31, 2011 | Past 1
year | Past 5
years | Life of
fundA |
Class A (incl. 5.75% sales charge) | -4.99% | -5.47% | 1.10% |
Class T (incl. 3.50% sales charge) | -2.92% | -5.25% | 1.21% |
Class B (incl. contingent deferred sales charge) B | -4.87% | -5.40% | 1.28% |
Class C (incl. contingent deferred sales charge) C | -0.90% | -5.05% | 1.28% |
A From August 2, 2005.
B Class B shares' contingent deferred sales charges included in the past one year, past five years, and life of fund total return figures are 5%, 2%, and 0%, respectively.
C Class C shares' contingent deferred sales charge included in the past one year, past five years, and life of fund total return figures are 1%, 0%, and 0%, respectively.
Annual Report
$10,000 Over Life of Class
Let's say hypothetically that $10,000 was invested in Fidelity Advisor® International Small Cap Opportunities Fund - Class A on August 2, 2005, when the fund started, and the current 5.75% sales charge was paid. The chart shows how the value of your investment would have changed, and also shows how the MSCI® EAFE® (Europe, Australasia, Far East) Small Cap Index performed over the same period.
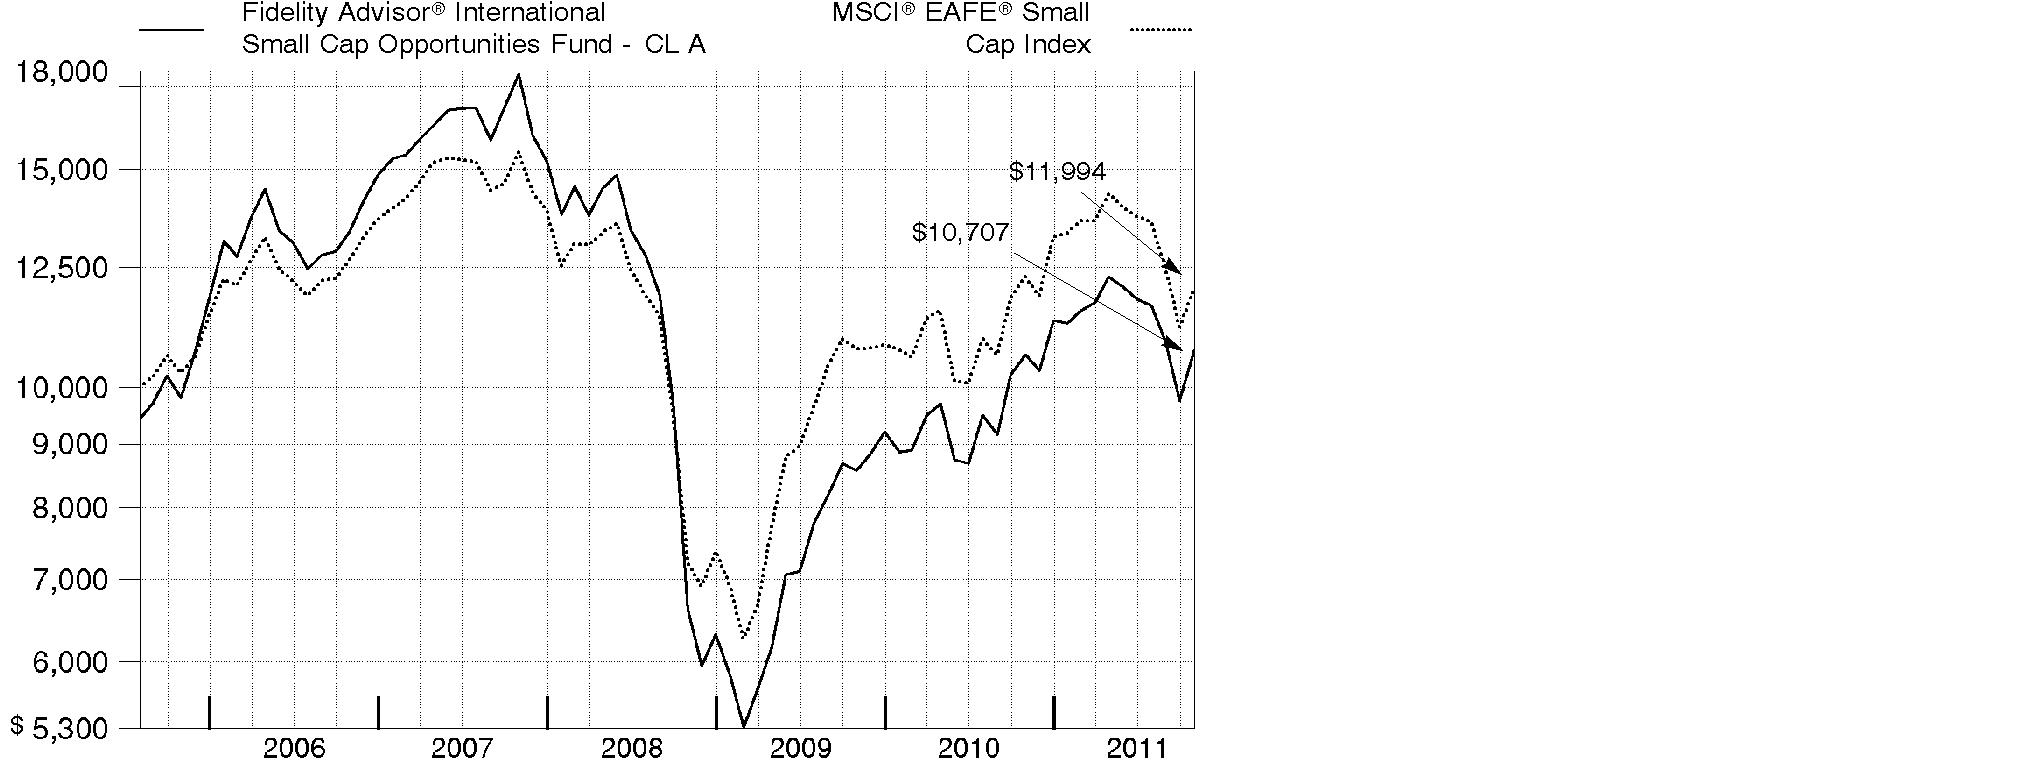
Annual Report
Market Recap: International equities were rocked by a number of headline events during the year ending October 31, 2011. Stocks posted a solid advance for the first half of the period, despite concern about the sovereign debt crisis in Europe, a devastating earthquake and tsunami in Japan, and political upheaval in the Middle East and North Africa. Sentiment turned decidedly negative in the second half, however, as fresh worries about Europe, inflation in China and a dimmed outlook for global growth caused foreign markets to suffer declines that intensified in August and September. October brought with it yet another dramatic swing, as eurozone policymakers appeared near a resolution to the debt debacle and buyers stormed back onto the scene in search of bargains. Still, those gains - along with favorable currency fluctuations overall - weren't enough to offset prior losses, and the MSCI® ACWI® (All Country World Index) ex USA Index finished the period down 4.56%. Within the MSCI index, Europe and emerging markets suffered the biggest declines, with many countries in these areas sustaining steep losses. By contrast, Japan showed resilience in the wake of its natural disasters, falling only 2%. Australia (+4%), Switzerland (+3%), the U.K. (+2%) and Canada, which produced a nominal return, were among the few major benchmark components to break into positive territory.
Comments from Jed Weiss, Portfolio Manager of Fidelity Advisor® International Small Cap Opportunities Fund: For the year, the fund's Class A, Class T, Class B and Class C shares returned 0.81%, 0.60%, 0.10% and 0.10%, respectively (excluding sales charges), versus -2.39% for the MSCI® EAFE® (Europe, Australasia, Far East) Small Cap Index. Security selection in continental Europe - especially Finland and Germany - helped, as did out-of-index stock picking in the U.S. In emerging markets, my positioning in non-index Turkey and benchmark component South Africa hurt the most. Out-of-benchmark security selection in Canada also was negative. In terms of sectors, good security selection in industrials and consumer discretionary, along with a favorable stance in consumer staples and information technology, helped, while relatively weak stock picking in energy and positioning in utilities hurt. The top individual contributor was U.S.-based PriceSmart, a dominant warehouse club retailer in Central America. Railroad Kansas City Southern (U.S.), Aozora Bank (Japan) and seismic solutions business ION Geophysical (U.S.) also helped. On the negative side, the fund was hurt by Canadian energy firms Petrobank Energy & Resources, which I sold before period end, and Niko Resources. Italian asset manager Azimut Holdings, the only index component I've mentioned, also hurt.
The views expressed above reflect those of the portfolio manager(s) only through the end of the period as stated on the cover of this report and do not necessarily represent the views of Fidelity or any other person in the Fidelity organization. Any such views are subject to change at any time based upon market or other conditions and Fidelity disclaims any responsibility to update such views. These views may not be relied on as investment advice and, because investment decisions for a Fidelity fund are based on numerous factors, may not be relied on as an indication of trading intent on behalf of any Fidelity fund.
Annual Report
Shareholder Expense Example
As a shareholder of the Fund, you incur two types of costs: (1) transaction costs, including sales charges (loads) on purchase payments or redemption proceeds, redemption fees, and (2) ongoing costs, including management fees, distribution and/or service (12b-1) fees and other Fund expenses. This Example is intended to help you understand your ongoing costs (in dollars) of investing in the Fund and to compare these costs with the ongoing costs of investing in other mutual funds.
The Example is based on an investment of $1,000 invested at the beginning of the period and held for the entire period (May 1, 2011 to October 31, 2011).
Actual Expenses
The first line of the accompanying table for each class of the Fund provides information about actual account values and actual expenses. You may use the information in this line, together with the amount you invested, to estimate the expenses that you paid over the period. Simply divide your account value by $1,000.00 (for example, an $8,600 account value divided by $1,000.00 = 8.6), then multiply the result by the number in the first line for a class of the Fund under the heading entitled "Expenses Paid During Period" to estimate the expenses you paid on your account during this period. A small balance maintenance fee of $12.00 that is charged once a year may apply for certain accounts with a value of less than $2,000. This fee is not included in the table below. If it was, the estimate of expenses you paid during the period would be higher, and your ending account value lower, by this amount. In addition, the Fund, as a shareholder in the underlying Fidelity Central Funds, will indirectly bear its pro-rata share of the fees and expenses incurred by the underlying Fidelity Central Funds. These fees and expenses are not included in the Fund's annualized expense ratio used to calculate the expense estimate in the table below.
Hypothetical Example for Comparison Purposes
The second line of the accompanying table for each class of the Fund provides information about hypothetical account values and hypothetical expenses based on a Class' actual expense ratio and an assumed rate of return of 5% per year before expenses, which is not the Class' actual return. The hypothetical account values and expenses may not be used to estimate the actual ending account balance or expenses you paid for the period. You may use this information to compare the ongoing costs of investing in the Fund and other funds. To do so, compare this 5% hypothetical example with the 5% hypothetical examples that appear in the shareholder reports of the other funds. A small balance maintenance fee of $12.00 that is charged once a year may apply for certain accounts with a value of less than $2,000. This fee is not included in the table below. If it was, the estimate of expenses you paid during the period would be higher, and your ending account value lower, by this amount. In addition, the Fund, as a shareholder in the underlying Fidelity Central Funds, will indirectly bear its pro-rata share of the fees and expenses incurred by the underlying Fidelity Central Funds. These fees and expenses are not included in the Fund's annualized expense ratio used to calculate the expense estimate in the table below.
Please note that the expenses shown in the table are meant to highlight your ongoing costs only and do not reflect any transaction costs. Therefore, the second line of the table is useful in comparing ongoing costs only, and will not help you determine the relative total costs of owning different funds. In addition, if these transactional costs were included, your costs would have been higher.
Annual Report
| Annualized Expense Ratio | Beginning
Account Value
May 1, 2011 | Ending
Account Value
October 31, 2011 | Expenses Paid
During Period*
May 1, 2011 to
October 31, 2011 |
Class A | 1.36% | | | |
Actual | | $ 1,000.00 | $ 872.10 | $ 6.42 |
HypotheticalA | | $ 1,000.00 | $ 1,018.35 | $ 6.92 |
Class T | 1.62% | | | |
Actual | | $ 1,000.00 | $ 871.10 | $ 7.64 |
HypotheticalA | | $ 1,000.00 | $ 1,017.04 | $ 8.24 |
Class B | 2.11% | | | |
Actual | | $ 1,000.00 | $ 868.90 | $ 9.94 |
HypotheticalA | | $ 1,000.00 | $ 1,014.57 | $ 10.71 |
Class C | 2.11% | | | |
Actual | | $ 1,000.00 | $ 868.80 | $ 9.94 |
HypotheticalA | | $ 1,000.00 | $ 1,014.57 | $ 10.71 |
International Small Cap Opportunities | 1.10% | | | |
Actual | | $ 1,000.00 | $ 873.20 | $ 5.19 |
HypotheticalA | | $ 1,000.00 | $ 1,019.66 | $ 5.60 |
Institutional Class | 1.07% | | | |
Actual | | $ 1,000.00 | $ 873.30 | $ 5.05 |
HypotheticalA | | $ 1,000.00 | $ 1,019.81 | $ 5.45 |
A 5% return per year before expenses
* Expenses are equal to each Class' annualized expense ratio, multiplied by the average account value over the period, multiplied by 184/365 (to reflect the one-half year period).
Annual Report
Investment Changes (Unaudited)
Geographic Diversification (% of fund's net assets) |
As of October 31, 2011 |
| Japan 20.9% | |
| United Kingdom 16.7% | |
| United States of America 14.6% | |
| Canada 4.8% | |
| Brazil 4.7% | |
| Germany 4.3% | |
| France 3.8% | |
| Finland 2.4% | |
| South Africa 2.2% | |
| Other 25.6% | |
Percentages are adjusted for the effect of futures contracts, if applicable. |
As of April 30, 2011 |
| Japan 20.2% | |
| United Kingdom 16.2% | |
 | United States of America 12.4% | |
| Canada 4.9% | |
| Brazil 4.8% | |
| France 3.9% | |
| Germany 3.6% | |
| Netherlands 3.2% | |
| Finland 3.0% | |
| Other 27.8% | |
Percentages are adjusted for the effect of futures contracts, if applicable. |
Asset Allocation |
| % of fund's
net assets | % of fund's net assets
6 months ago |
Stocks and Investment Companies | 97.9 | 98.4 |
Short-Term Investments and Net Other Assets | 2.1 | 1.6 |
Top Ten Stocks as of October 31, 2011 |
| % of fund's
net assets | % of fund's net assets
6 months ago |
PriceSmart, Inc. (United States of America, Food & Staples Retailing) | 2.0 | 1.5 |
USS Co. Ltd. (Japan, Specialty Retail) | 1.8 | 1.5 |
Osaka Securities Exchange Co. Ltd. (Japan, Diversified Financial Services) | 1.6 | 1.3 |
Kobayashi Pharmaceutical Co. Ltd. (Japan, Personal Products) | 1.6 | 1.3 |
Spirax-Sarco Engineering PLC (United Kingdom, Machinery) | 1.5 | 1.2 |
Meggitt PLC (United Kingdom, Aerospace & Defense) | 1.4 | 1.0 |
Bank Sarasin & Co. Ltd. Series B (Reg.) (Switzerland, Capital Markets) | 1.4 | 1.0 |
Prosegur Compania de Seguridad SA (Reg.) (Spain, Commercial Services & Supplies) | 1.4 | 1.2 |
Outotec Oyj (Finland, Construction & Engineering) | 1.3 | 1.3 |
Andritz AG (Austria, Machinery) | 1.3 | 1.3 |
| 15.3 | |
Market Sectors as of October 31, 2011 |
| % of fund's
net assets | % of fund's net assets
6 months ago |
Industrials | 22.4 | 23.0 |
Consumer Discretionary | 18.6 | 18.1 |
Financials | 16.4 | 17.7 |
Materials | 11.8 | 11.1 |
Consumer Staples | 9.9 | 8.4 |
Information Technology | 8.2 | 8.5 |
Health Care | 5.8 | 5.6 |
Energy | 4.8 | 5.6 |
Utilities | 0.0 | 0.4 |
Annual Report
Investments October 31, 2011
Showing Percentage of Net Assets
Common Stocks - 97.9% |
| Shares | | Value |
Australia - 1.7% |
MAp Group unit | 1,015,958 | | $ 3,625,576 |
OZ Minerals Ltd. | 138,943 | | 1,668,695 |
Ramsay Health Care Ltd. | 43,346 | | 852,149 |
TOTAL AUSTRALIA | | 6,146,420 |
Austria - 1.9% |
Andritz AG | 52,800 | | 4,678,667 |
Zumtobel AG | 113,981 | | 2,377,116 |
TOTAL AUSTRIA | | 7,055,783 |
Bailiwick of Guernsey - 0.7% |
Resolution Ltd. | 575,273 | | 2,544,174 |
Bailiwick of Jersey - 1.6% |
Informa PLC | 485,236 | | 2,828,012 |
Randgold Resources Ltd. sponsored ADR | 27,300 | | 2,991,261 |
TOTAL BAILIWICK OF JERSEY | | 5,819,273 |
Belgium - 1.2% |
Gimv NV | 34,800 | | 1,779,502 |
Umicore SA | 63,474 | | 2,733,194 |
TOTAL BELGIUM | | 4,512,696 |
Bermuda - 1.3% |
Aquarius Platinum Ltd. (Australia) | 406,589 | | 1,192,875 |
Lazard Ltd. Class A | 34,899 | | 954,139 |
Trinity Ltd. | 2,952,000 | | 2,675,575 |
TOTAL BERMUDA | | 4,822,589 |
Brazil - 4.7% |
Arezzo Industria e Comercio SA | 129,700 | | 1,714,529 |
Banco ABC Brasil SA | 260,300 | | 1,735,636 |
Banco Pine SA | 148,900 | | 989,372 |
BR Malls Participacoes SA | 83,500 | | 902,006 |
Braskem SA Class A sponsored ADR (d) | 217,200 | | 3,918,288 |
Cia.Hering SA | 39,600 | | 884,382 |
Iguatemi Empresa de Shopping Centers SA | 46,700 | | 904,792 |
Multiplan Empreendimentos Imobiliarios SA | 84,600 | | 1,710,524 |
Odontoprev SA | 131,500 | | 2,069,142 |
Restoque Comercio e Confeccoes de Roupas SA | 26,200 | | 411,950 |
T4F Entretenimento SA | 131,800 | | 921,034 |
Totvs SA | 58,800 | | 975,891 |
TOTAL BRAZIL | | 17,137,546 |
Common Stocks - continued |
| Shares | | Value |
Canada - 4.8% |
Agnico-Eagle Mines Ltd. (Canada) | 40,760 | | $ 1,768,032 |
Eldorado Gold Corp. | 127,800 | | 2,401,258 |
Fairfax Financial Holdings Ltd. (sub. vtg.) | 7,790 | | 3,256,116 |
Niko Resources Ltd. | 67,600 | | 3,718,220 |
Open Text Corp. (a) | 29,500 | | 1,805,482 |
Pan American Silver Corp. | 28,900 | | 808,044 |
Petrominerales Ltd. | 42,879 | | 1,131,281 |
Quadra FNX Mining Ltd. (a) | 75,200 | | 867,533 |
TAG Oil Ltd. (a) | 142,000 | | 880,333 |
Tuscany International Drilling, Inc. (a) | 1,139,200 | | 777,104 |
TOTAL CANADA | | 17,413,403 |
Cayman Islands - 1.6% |
China Lilang Ltd. | 1,309,000 | | 1,377,892 |
Intime Department Store Group Co. Ltd. | 563,000 | | 807,944 |
NVC Lighting Holdings Ltd. | 4,329,000 | | 1,879,620 |
Vantage Drilling Co. (a) | 625,331 | | 850,450 |
Wynn Macau Ltd. | 337,200 | | 944,793 |
TOTAL CAYMAN ISLANDS | | 5,860,699 |
Denmark - 0.8% |
William Demant Holding A/S (a) | 36,533 | | 2,914,894 |
Finland - 2.4% |
Metso Corp. | 25,700 | | 1,000,834 |
Nokian Tyres PLC | 82,500 | | 3,031,260 |
Outotec Oyj | 100,200 | | 4,684,164 |
TOTAL FINLAND | | 8,716,258 |
France - 3.8% |
Audika SA | 95,384 | | 2,109,391 |
Laurent-Perrier Group | 23,963 | | 2,470,599 |
Remy Cointreau SA | 38,298 | | 3,148,236 |
Saft Groupe SA | 92,419 | | 2,813,770 |
Vetoquinol SA | 28,212 | | 929,994 |
Virbac SA | 13,600 | | 2,354,136 |
TOTAL FRANCE | | 13,826,126 |
Germany - 4.3% |
alstria office REIT-AG | 135,300 | | 1,739,475 |
Bilfinger Berger AG | 36,159 | | 3,241,620 |
CompuGROUP Holding AG | 67,000 | | 862,308 |
CTS Eventim AG | 137,426 | | 4,550,148 |
Common Stocks - continued |
| Shares | | Value |
Germany - continued |
Fielmann AG (d) | 30,537 | | $ 3,216,420 |
Software AG (Bearer) | 50,281 | | 2,088,908 |
TOTAL GERMANY | | 15,698,879 |
India - 0.5% |
Apollo Tyres Ltd. | 642,892 | | 753,948 |
Jyothy Laboratories Ltd. | 433,677 | | 1,269,440 |
TOTAL INDIA | | 2,023,388 |
Ireland - 1.0% |
James Hardie Industries NV: | | | |
CDI (a) | 40,000 | | 259,101 |
sponsored ADR (a) | 102,775 | | 3,332,993 |
TOTAL IRELAND | | 3,592,094 |
Israel - 1.0% |
Azrieli Group | 72,005 | | 1,852,664 |
Ituran Location & Control Ltd. | 140,286 | | 1,867,207 |
TOTAL ISRAEL | | 3,719,871 |
Italy - 1.5% |
Azimut Holding SpA | 291,773 | | 2,281,383 |
Interpump Group SpA | 512,558 | | 3,301,217 |
TOTAL ITALY | | 5,582,600 |
Japan - 20.9% |
Air Water, Inc. | 62,000 | | 787,141 |
Aozora Bank Ltd. (d) | 1,120,000 | | 2,831,751 |
Asahi Co. Ltd. (d) | 58,000 | | 1,285,102 |
Autobacs Seven Co. Ltd. | 83,300 | | 3,814,879 |
Daikoku Denki Co. Ltd. | 128,700 | | 1,152,515 |
Daikokutenbussan Co. Ltd. | 109,200 | | 3,134,401 |
FCC Co. Ltd. | 149,300 | | 3,154,839 |
GCA Savvian Group Corp. (d) | 1,109 | | 1,298,210 |
Glory Ltd. | 60,300 | | 1,290,829 |
Goldcrest Co. Ltd. | 60,400 | | 1,108,271 |
Kamigumi Co. Ltd. | 273,000 | | 2,384,117 |
Kobayashi Pharmaceutical Co. Ltd. | 116,700 | | 5,785,472 |
Kyoto Kimono Yuzen Co. Ltd. | 109,900 | | 1,278,601 |
Meiko Network Japan Co. Ltd. | 120,500 | | 997,877 |
Miraial Co. Ltd. | 39,200 | | 609,201 |
Nabtesco Corp. | 156,400 | | 3,425,851 |
Nagaileben Co. Ltd. | 89,400 | | 1,232,168 |
Common Stocks - continued |
| Shares | | Value |
Japan - continued |
Nihon M&A Center, Inc. | 410 | | $ 2,314,525 |
Nihon Parkerizing Co. Ltd. | 157,000 | | 2,113,801 |
Nippon Seiki Co. Ltd. | 186,000 | | 1,868,967 |
Nippon Thompson Co. Ltd. | 537,000 | | 3,459,214 |
Obic Co. Ltd. | 16,030 | | 3,031,023 |
Osaka Securities Exchange Co. Ltd. | 1,276 | | 5,980,182 |
OSG Corp. | 90,300 | | 1,157,270 |
Seven Bank Ltd. | 594 | | 1,057,196 |
SHO-BOND Holdings Co. Ltd. | 98,200 | | 2,190,832 |
Shoei Co. Ltd. | 80,300 | | 540,394 |
The Nippon Synthetic Chemical Industry Co. Ltd. | 323,000 | | 1,794,495 |
Tsumura & Co. | 82,900 | | 2,331,871 |
Tsutsumi Jewelry Co. Ltd. | 43,900 | | 1,023,100 |
USS Co. Ltd. | 80,540 | | 6,659,028 |
Yamatake Corp. | 56,000 | | 1,239,082 |
Yamato Kogyo Co. Ltd. | 161,700 | | 4,090,648 |
TOTAL JAPAN | | 76,422,853 |
Korea (South) - 0.3% |
NCsoft Corp. | 3,895 | | 1,219,916 |
Luxembourg - 0.5% |
GlobeOp Financial Services SA | 367,600 | | 1,684,847 |
Netherlands - 1.6% |
Aalberts Industries NV | 177,200 | | 3,137,680 |
ASM International NV unit | 46,800 | | 1,320,696 |
QIAGEN NV (a)(d) | 109,200 | | 1,504,776 |
TOTAL NETHERLANDS | | 5,963,152 |
Papua New Guinea - 0.3% |
Oil Search Ltd. | 143,966 | | 982,258 |
Philippines - 0.4% |
Jollibee Food Corp. | 671,660 | | 1,427,287 |
Portugal - 0.7% |
Jeronimo Martins SGPS SA | 146,700 | | 2,537,727 |
Singapore - 0.3% |
Wing Tai Holdings Ltd. | 917,000 | | 929,875 |
South Africa - 2.2% |
African Rainbow Minerals Ltd. | 101,600 | | 2,348,131 |
City Lodge Hotels Ltd. | 4,722 | | 37,484 |
Clicks Group Ltd. | 390,659 | | 2,050,193 |
Common Stocks - continued |
| Shares | | Value |
South Africa - continued |
JSE Ltd. | 199,281 | | $ 1,764,735 |
Mr Price Group Ltd. | 207,500 | | 1,997,530 |
TOTAL SOUTH AFRICA | | 8,198,073 |
Spain - 1.5% |
Grifols SA (a) | 30,332 | | 566,053 |
Prosegur Compania de Seguridad SA (Reg.) | 101,209 | | 5,049,276 |
TOTAL SPAIN | | 5,615,329 |
Sweden - 2.1% |
Fagerhult AB | 85,150 | | 2,004,820 |
Intrum Justitia AB | 186,000 | | 3,059,797 |
Swedish Match Co. | 78,600 | | 2,719,844 |
TOTAL SWEDEN | | 7,784,461 |
Switzerland - 1.4% |
Bank Sarasin & Co. Ltd. Series B (Reg.) | 134,444 | | 5,132,328 |
Turkey - 1.5% |
Albaraka Turk Katilim Bankasi AS | 1,505,000 | | 1,591,602 |
Boyner Buyuk Magazacilik A/S (a) | 547,451 | | 919,513 |
Coca-Cola Icecek AS | 211,000 | | 2,863,848 |
TOTAL TURKEY | | 5,374,963 |
United Arab Emirates - 0.2% |
Dubai Financial Market PJSC (a) | 3,046,397 | | 854,285 |
United Kingdom - 16.7% |
AMEC PLC | 116,340 | | 1,731,592 |
Babcock International Group PLC | 299,700 | | 3,395,532 |
Bellway PLC | 203,172 | | 2,319,863 |
Britvic PLC | 556,200 | | 2,950,892 |
Dechra Pharmaceuticals PLC | 247,100 | | 1,947,192 |
Derwent London PLC | 57,900 | | 1,581,089 |
Great Portland Estates PLC | 417,489 | | 2,500,315 |
H&T Group PLC | 336,803 | | 1,684,521 |
InterContinental Hotel Group PLC ADR | 113,600 | | 2,099,328 |
Johnson Matthey PLC | 105,089 | | 3,175,588 |
Meggitt PLC | 836,669 | | 5,174,913 |
Micro Focus International PLC | 291,800 | | 1,593,650 |
Persimmon PLC | 221,563 | | 1,773,393 |
Rotork PLC | 97,500 | | 2,640,504 |
Serco Group PLC | 450,476 | | 3,763,546 |
Shaftesbury PLC | 301,232 | | 2,441,584 |
Common Stocks - continued |
| Shares | | Value |
United Kingdom - continued |
Spectris PLC | 124,487 | | $ 2,546,544 |
Spirax-Sarco Engineering PLC | 174,230 | | 5,374,172 |
Ted Baker PLC | 139,000 | | 1,724,051 |
Ultra Electronics Holdings PLC | 101,869 | | 2,608,106 |
Unite Group PLC | 1,474,170 | | 4,191,504 |
Victrex PLC | 188,582 | | 3,851,625 |
TOTAL UNITED KINGDOM | | 61,069,504 |
United States of America - 12.5% |
ANSYS, Inc. (a) | 19,285 | | 1,048,333 |
Autoliv, Inc. (d) | 54,900 | | 3,171,573 |
Broadridge Financial Solutions, Inc. | 48,705 | | 1,083,686 |
Cymer, Inc. (a) | 77,700 | | 3,376,065 |
Dril-Quip, Inc. (a) | 32,852 | | 2,138,665 |
Evercore Partners, Inc. Class A | 52,700 | | 1,446,088 |
Greenhill & Co., Inc. (d) | 21,295 | | 804,525 |
ION Geophysical Corp. (a) | 404,906 | | 3,085,384 |
Juniper Networks, Inc. (a) | 35,200 | | 861,344 |
Kansas City Southern (a) | 61,300 | | 3,872,321 |
Lam Research Corp. (a) | 32,003 | | 1,375,809 |
Martin Marietta Materials, Inc. (d) | 24,900 | | 1,797,033 |
Mohawk Industries, Inc. (a) | 86,000 | | 4,527,900 |
Oceaneering International, Inc. | 51,200 | | 2,141,696 |
PriceSmart, Inc. | 96,496 | | 7,337,557 |
ResMed, Inc. (a)(d) | 119,200 | | 3,373,360 |
Solera Holdings, Inc. | 46,600 | | 2,545,758 |
Solutia, Inc. (a) | 55,456 | | 901,160 |
SS&C Technologies Holdings, Inc. (a) | 55,600 | | 881,816 |
TOTAL UNITED STATES OF AMERICA | | 45,770,073 |
TOTAL COMMON STOCKS (Cost $305,074,765) |
358,353,624
|
Money Market Funds - 6.3% |
| Shares | | Value |
Fidelity Cash Central Fund, 0.12% (b) | 8,835,562 | | $ 8,835,562 |
Fidelity Securities Lending Cash Central Fund, 0.11% (b)(c) | 14,278,561 | | 14,278,561 |
TOTAL MONEY MARKET FUNDS (Cost $23,114,123) |
23,114,123
|
TOTAL INVESTMENT PORTFOLIO - 104.2% (Cost $328,188,888) | | 381,467,747 |
NET OTHER ASSETS (LIABILITIES) - (4.2)% | | (15,231,283) |
NET ASSETS - 100% | $ 366,236,464 |
Legend |
(a) Non-income producing |
(b) Affiliated fund that is available only to investment companies and other accounts managed by Fidelity Investments. The rate quoted is the annualized seven-day yield of the fund at period end. A complete unaudited listing of the fund's holdings as of its most recent quarter end is available upon request. In addition, each Fidelity Central Fund's financial statements, which are not covered by the Fund's Report of Independent Registered Public Accounting Firm, are available on the SEC's website or upon request. |
(c) Investment made with cash collateral received from securities on loan. |
(d) Security or a portion of the security is on loan at period end. |
Affiliated Central Funds |
Information regarding fiscal year to date income earned by the Fund from investments in Fidelity Central Funds is as follows: |
Fund | Income earned |
Fidelity Cash Central Fund | $ 13,915 |
Fidelity Securities Lending Cash Central Fund | 208,963 |
Total | $ 222,878 |
Other Information |
The following is a summary of the inputs used, as of October 31, 2011, involving the Fund's assets and liabilities carried at fair value. The inputs or methodology used for valuing securities may not be an indication of the risk associated with investing in those securities. For more information on valuation inputs, and their aggregation into the levels used in the table below, please refer to the Security Valuation section in the accompanying Notes to Financial Statements. |
Valuation Inputs at Reporting Date: |
Description | Total | Level 1 | Level 2 | Level 3 |
Investments in Securities: | | | | |
Equities: | | | | |
Japan | $ 76,422,853 | $ - | $ 76,422,853 | $ - |
United Kingdom | 61,069,504 | 61,069,504 | - | - |
United States of America | 45,770,073 | 45,770,073 | - | - |
Canada | 17,413,403 | 17,413,403 | - | - |
Brazil | 17,137,546 | 17,137,546 | - | - |
Germany | 15,698,879 | 15,698,879 | - | - |
France | 13,826,126 | 13,826,126 | - | - |
Finland | 8,716,258 | 8,716,258 | - | - |
South Africa | 8,198,073 | 8,198,073 | - | - |
Other | 94,100,909 | 73,661,252 | 20,439,657 | - |
Money Market Funds | 23,114,123 | 23,114,123 | - | - |
Total Investments in Securities: | $ 381,467,747 | $ 284,605,237 | $ 96,862,510 | $ - |
Transfers from Level 1 to Level 2 during the period were $99,465,787. |
Income Tax Information |
At October 31, 2011, the Fund had a capital loss carryforward of approximately $368,117,127 of which $37,615,219 and $330,501,908 will expire in fiscal 2016 and 2017, respectively. Capital loss carryforwards are only available to offset future capital gains of the Fund to the extent provided by regulations and may be limited. |
See accompanying notes which are an integral part of the financial statements.
Annual Report
Statement of Assets and Liabilities
| October 31, 2011 |
| | |
Assets | | |
Investment in securities, at value (including securities loaned of $13,325,034) - See accompanying schedule: Unaffiliated issuers (cost $305,074,765) | $ 358,353,624 | |
Fidelity Central Funds (cost $23,114,123) | 23,114,123 | |
Total Investments (cost $328,188,888) | | $ 381,467,747 |
Foreign currency held at value (cost $99,744) | | 99,510 |
Receivable for investments sold | | 195,546 |
Receivable for fund shares sold | | 166,806 |
Dividends receivable | | 961,741 |
Distributions receivable from Fidelity Central Funds | | 3,492 |
Prepaid expenses | | 1,455 |
Other receivables | | 12,370 |
Total assets | | 382,908,667 |
| | |
Liabilities | | |
Payable for investments purchased | $ 1,485,984 | |
Payable for fund shares redeemed | 489,719 | |
Accrued management fee | 235,802 | |
Distribution and service plan fees payable | 14,845 | |
Other affiliated payables | 105,135 | |
Other payables and accrued expenses | 62,157 | |
Collateral on securities loaned, at value | 14,278,561 | |
Total liabilities | | 16,672,203 |
| | |
Net Assets | | $ 366,236,464 |
Net Assets consist of: | | |
Paid in capital | | $ 678,939,230 |
Undistributed net investment income | | 4,428,178 |
Accumulated undistributed net realized gain (loss) on investments and foreign currency transactions | | (370,400,713) |
Net unrealized appreciation (depreciation) on investments and assets and liabilities in foreign currencies | | 53,269,769 |
Net Assets | | $ 366,236,464 |
See accompanying notes which are an integral part of the financial statements.
Annual Report
Financial Statements - continued
Statement of Assets and Liabilities - continued
| October 31, 2011 |
| | |
Calculation of Maximum Offering Price | | |
Class A:
Net Asset Value and redemption price per share ($18,686,336 ÷ 1,916,318 shares) | | $ 9.75 |
| | |
Maximum offering price per share (100/94.25 of $9.75) | | $ 10.34 |
Class T:
Net Asset Value and redemption price per share ($8,700,526 ÷ 900,706 shares) | | $ 9.66 |
| | |
Maximum offering price per share (100/96.50 of $9.66) | | $ 10.01 |
Class B:
Net Asset Value and offering price per share ($2,292,585 ÷ 241,853 shares)A | | $ 9.48 |
| | |
Class C:
Net Asset Value and offering price per share ($6,899,707 ÷ 728,884 shares)A | | $ 9.47 |
| | |
International Small Cap Opportunities:
Net Asset Value, offering price and redemption price per share ($328,261,845 ÷ 33,341,584 shares) | | $ 9.85 |
| | |
Institutional Class:
Net Asset Value, offering price and redemption price per share ($1,395,465 ÷ 141,546 shares) | | $ 9.86 |
A Redemption price per share is equal to net asset value less any applicable contingent deferred sales charge.
See accompanying notes which are an integral part of the financial statements.
Annual Report
Statement of Operations
| Year ended October 31, 2011 |
| | |
Investment Income | | |
Dividends | | $ 9,529,575 |
Special dividends | | 2,725,226 |
Income from Fidelity Central Funds | | 222,878 |
Income before foreign taxes withheld | | 12,477,679 |
Less foreign taxes withheld | | (650,585) |
Total income | | 11,827,094 |
| | |
Expenses | | |
Management fee
Basic fee | $ 3,680,170 | |
Performance adjustment | (837,875) | |
Transfer agent fees | 1,267,212 | |
Distribution and service plan fees | 216,627 | |
Accounting and security lending fees | 225,859 | |
Custodian fees and expenses | 123,008 | |
Independent trustees' compensation | 2,387 | |
Registration fees | 82,117 | |
Audit | 71,269 | |
Legal | 1,734 | |
Miscellaneous | 4,640 | |
Total expenses before reductions | 4,837,148 | |
Expense reductions | (53,631) | 4,783,517 |
Net investment income (loss) | | 7,043,577 |
Realized and Unrealized Gain (Loss) Net realized gain (loss) on: | | |
Investment securities: | | |
Unaffiliated issuers | 54,342,117 | |
Foreign currency transactions | (320,338) | |
Total net realized gain (loss) | | 54,021,779 |
Change in net unrealized appreciation (depreciation) on: Investment securities | (52,211,455) | |
Assets and liabilities in foreign currencies | (51,097) | |
Total change in net unrealized appreciation (depreciation) | | (52,262,552) |
Net gain (loss) | | 1,759,227 |
Net increase (decrease) in net assets resulting from operations | | $ 8,802,804 |
See accompanying notes which are an integral part of the financial statements.
Annual Report
Financial Statements - continued
Statement of Changes in Net Assets
| Year ended
October 31,
2011 | Year ended
October 31,
2010 |
Increase (Decrease) in Net Assets | | |
Operations | | |
Net investment income (loss) | $ 7,043,577 | $ 3,674,101 |
Net realized gain (loss) | 54,021,779 | 58,487,523 |
Change in net unrealized appreciation (depreciation) | (52,262,552) | 25,253,733 |
Net increase (decrease) in net assets resulting
from operations | 8,802,804 | 87,415,357 |
Distributions to shareholders from net investment income | (6,223,295) | (3,861,178) |
Distributions to shareholders from net realized gain | (1,761,993) | (4,067,493) |
Total distributions | (7,985,288) | (7,928,671) |
Share transactions - net increase (decrease) | (78,669,716) | (8,820,184) |
Redemption fees | 71,408 | 60,781 |
Total increase (decrease) in net assets | (77,780,792) | 70,727,283 |
| | |
Net Assets | | |
Beginning of period | 444,017,256 | 373,289,973 |
End of period (including undistributed net investment income of $4,428,178 and undistributed net investment income of $3,575,839, respectively) | $ 366,236,464 | $ 444,017,256 |
See accompanying notes which are an integral part of the financial statements.
Annual Report
Financial Highlights - Class A
Years ended October 31, | 2011 | 2010 | 2009 | 2008 | 2007 |
Selected Per-Share Data | | | | | |
Net asset value, beginning of period | $ 9.82 | $ 8.07 | $ 6.24 | $ 18.97 | $ 14.18 |
Income from Investment Operations | | | | | |
Net investment income (loss) C | .15 F | .06 | .06 | .02 | .02 |
Net realized and unrealized gain (loss) | (.07) | 1.85 | 1.77 | (10.85) | 4.76 |
Total from investment operations | .08 | 1.91 | 1.83 | (10.83) | 4.78 |
Distributions from net investment income | (.11) | (.07) | - | (.03) | - |
Distributions from net realized gain | (.04) | (.09) | - | (1.88) | - |
Total distributions | (.15) | (.16) | - | (1.90) I | - |
Redemption fees added to paid in capital C | - H | - H | - H | - H | .01 |
Net asset value, end of period | $ 9.75 | $ 9.82 | $ 8.07 | $ 6.24 | $ 18.97 |
Total ReturnA, B | .81% | 24.05% | 29.33% | (62.98)% | 33.78% |
Ratios to Average Net Assets D, G | | | | | |
Expenses before reductions | 1.34% | 1.16% | .94% | 1.75% | 1.63% |
Expenses net of fee waivers, if any | 1.33% | 1.16% | .94% | 1.66% | 1.63% |
Expenses net of all reductions | 1.32% | 1.15% | .89% | 1.62% | 1.59% |
Net investment income (loss) | 1.44% F | .74% | 1.00% | .13% | .10% |
Supplemental Data | | | | | |
Net assets, end of period (000 omitted) | $ 18,686 | $ 20,228 | $ 18,883 | $ 17,905 | $ 70,785 |
Portfolio turnover rate E | 24% | 49% | 174% | 61% | 107% |
A Total returns would have been lower if certain expenses had not been reduced during the applicable periods shown.
B Total returns do not include the effect of the sales charges.
C Calculated based on average shares outstanding during the period.
D Fees and expenses of any underlying Fidelity Central Funds are not included in the Fund's expense ratio. The Fund indirectly bears its proportionate share of the expenses of any underlying Fidelity Central Funds.
E Amount does not include the portfolio activity of any underlying Fidelity Central Funds.
F Investment income per share reflects a special dividend which amounted to $.06 per share. Excluding the special dividend, the ratio of net investment income (loss) to average net assets would have been .80%.
G Expense ratios reflect operating expenses of the class. Expenses before reductions do not reflect amounts reimbursed by the investment adviser or reductions from brokerage service arrangements or reductions from other expense offset arrangements and do not represent the amount paid by the class during periods when reimbursements or reductions occur. Expenses net of fee waivers reflect expenses after reimbursement by the investment adviser but prior to reductions from brokerage service arrangements or other expense offset arrangements. Expenses net of all reductions represent the net expenses paid by the class.
H Amount represents less than $.01 per share.
I Total distributions of $1.90 per share is comprised of distributions from net investment income of $.025 and distributions from net realized gain of $1.878 per share.
See accompanying notes which are an integral part of the financial statements.
Annual Report
Financial Highlights - Class T
Years ended October 31, | 2011 | 2010 | 2009 | 2008 | 2007 |
Selected Per-Share Data | | | | | |
Net asset value, beginning of period | $ 9.72 | $ 8.00 | $ 6.20 | $ 18.85 | $ 14.12 |
Income from Investment Operations | | | | | |
Net investment income (loss) C | .12 F | .04 | .05 | (.02) | (.02) |
Net realized and unrealized gain (loss) | (.06) | 1.83 | 1.75 | (10.78) | 4.74 |
Total from investment operations | .06 | 1.87 | 1.80 | (10.80) | 4.72 |
Distributions from net investment income | (.08) | (.06) | - | - | - |
Distributions from net realized gain | (.04) | (.09) | - | (1.85) | - |
Total distributions | (.12) | (.15) | - | (1.85) I | - |
Redemption fees added to paid in capital C | - H | - H | - H | - H | .01 |
Net asset value, end of period | $ 9.66 | $ 9.72 | $ 8.00 | $ 6.20 | $ 18.85 |
Total Return A, B | .60% | 23.65% | 29.03% | (63.08)% | 33.50% |
Ratios to Average Net Assets D, G | | | | | |
Expenses before reductions | 1.60% | 1.43% | 1.20% | 2.00% | 1.85% |
Expenses net of fee waivers, if any | 1.60% | 1.43% | 1.20% | 1.91% | 1.85% |
Expenses net of all reductions | 1.59% | 1.41% | 1.15% | 1.87% | 1.81% |
Net investment income (loss) | 1.17% F | .48% | .74% | (.12)% | (.13)% |
Supplemental Data | | | | | |
Net assets, end of period (000 omitted) | $ 8,701 | $ 11,202 | $ 11,915 | $ 11,614 | $ 46,568 |
Portfolio turnover rate E | 24% | 49% | 174% | 61% | 107% |
A Total returns would have been lower if certain expenses had not been reduced during the applicable periods shown.
B Total returns do not include the effect of the sales charges.
C Calculated based on average shares outstanding during the period.
D Fees and expenses of any underlying Fidelity Central Funds are not included in the Fund's expense ratio. The Fund indirectly bears its proportionate share of the expenses of any underlying Fidelity Central Funds.
E Amount does not include the portfolio activity of any underlying Fidelity Central Funds.
F Investment income per share reflects a special dividend which amounted to $.06 per share. Excluding the special dividend, the ratio of net investment income (loss) to average net assets would have been .54%.
G Expense ratios reflect operating expenses of the class. Expenses before reductions do not reflect amounts reimbursed by the investment adviser or reductions from brokerage service arrangements or reductions from other expense offset arrangements and do not represent the amount paid by the class during periods when reimbursements or reductions occur. Expenses net of fee waivers reflect expenses after reimbursement by the investment adviser but prior to reductions from brokerage service arrangements or other expense offset arrangements. Expenses net of all reductions represent the net expenses paid by the class.
H Amount represents less than $.01 per share.
I Total distributions of $1.85 per share is comprised of distributions from net realized gain of $1.852 per share.
See accompanying notes which are an integral part of the financial statements.
Annual Report
Financial Highlights - Class B
Years ended October 31, | 2011 | 2010 | 2009 | 2008 | 2007 |
Selected Per-Share Data | | | | | |
Net asset value, beginning of period | $ 9.54 | $ 7.87 | $ 6.12 | $ 18.64 | $ 14.04 |
Income from Investment Operations | | | | | |
Net investment income (loss) C | .07 F | - H | .02 | (.08) | (.11) |
Net realized and unrealized gain (loss) | (.06) | 1.79 | 1.73 | (10.68) | 4.70 |
Total from investment operations | .01 | 1.79 | 1.75 | (10.76) | 4.59 |
Distributions from net investment income | (.06) | (.03) | - | - | - |
Distributions from net realized gain | (.02) | (.09) | - | (1.76) | - |
Total distributions | (.07) J | (.12) | - | (1.76) I | - |
Redemption fees added to paid in capital C | - H | - H | - H | - H | .01 |
Net asset value, end of period | $ 9.48 | $ 9.54 | $ 7.87 | $ 6.12 | $ 18.64 |
Total Return A, B | .10% | 23.03% | 28.59% | (63.32)% | 32.76% |
Ratios to Average Net Assets D, G | | | | | |
Expenses before reductions | 2.09% | 1.91% | 1.69% | 2.51% | 2.40% |
Expenses net of fee waivers, if any | 2.09% | 1.91% | 1.69% | 2.41% | 2.40% |
Expenses net of all reductions | 2.07% | 1.90% | 1.64% | 2.38% | 2.36% |
Net investment income (loss) | .68% F | (.01)% | .25% | (.62)% | (.67)% |
Supplemental Data | | | | | |
Net assets, end of period (000 omitted) | $ 2,293 | $ 2,902 | $ 2,799 | $ 2,687 | $ 10,975 |
Portfolio turnover rate E | 24% | 49% | 174% | 61% | 107% |
A Total returns would have been lower if certain expenses had not been reduced during the applicable periods shown.
B Total returns do not include the effect of the contingent deferred sales charge.
C Calculated based on average shares outstanding during the period.
D Fees and expenses of any underlying Fidelity Central Funds are not included in the Fund's expense ratio. The Fund indirectly bears its proportionate share of the expenses of any underlying Fidelity Central Funds.
E Amount does not include the portfolio activity of any underlying Fidelity Central Funds.
F Investment income per share reflects a special dividend which amounted to $.06 per share. Excluding the special dividend, the ratio of net investment income (loss) to average net assets would have been .05%.
G Expense ratios reflect operating expenses of the class. Expenses before reductions do not reflect amounts reimbursed by the investment adviser or reductions from brokerage service arrangements or reductions from other expense offset arrangements and do not represent the amount paid by the class during periods when reimbursements or reductions occur. Expenses net of fee waivers reflect expenses after reimbursement by the investment adviser but prior to reductions from brokerage service arrangements or other expense offset arrangements. Expenses net of all reductions represent the net expenses paid by the class.
H Amount represents less than $.01 per share.
I Total distributions of $1.76 per share is comprised of distributions from net realized gain of $1.760 per share.
J Total distribution of $.07 per share is comprised of distributions from net investment income of $.058 and distributions from net realized gain of $.015 per share.
See accompanying notes which are an integral part of the financial statements.
Annual Report
Financial Highlights - Class C
Years ended October 31, | 2011 | 2010 | 2009 | 2008 | 2007 |
Selected Per-Share Data | | | | | |
Net asset value, beginning of period | $ 9.53 | $ 7.86 | $ 6.11 | $ 18.63 | $ 14.03 |
Income from Investment Operations | | | | | |
Net investment income (loss) C | .07 F | - H | .02 | (.08) | (.11) |
Net realized and unrealized gain (loss) | (.06) | 1.79 | 1.73 | (10.66) | 4.70 |
Total from investment operations | .01 | 1.79 | 1.75 | (10.74) | 4.59 |
Distributions from net investment income | (.06) | (.03) | - | - | - |
Distributions from net realized gain | (.02) | (.09) | - | (1.78) | - |
Total distributions | (.07) J | (.12) | - | (1.78) I | - |
Redemption fees added to paid in capital C | - H | - H | - H | - H | .01 |
Net asset value, end of period | $ 9.47 | $ 9.53 | $ 7.86 | $ 6.11 | $ 18.63 |
Total Return A, B | .10% | 23.06% | 28.64% | (63.32)% | 32.79% |
Ratios to Average Net Assets D, G | | | | | |
Expenses before reductions | 2.09% | 1.91% | 1.68% | 2.51% | 2.38% |
Expenses net of fee waivers, if any | 2.09% | 1.91% | 1.68% | 2.41% | 2.38% |
Expenses net of all reductions | 2.07% | 1.90% | 1.63% | 2.38% | 2.34% |
Net investment income (loss) | .68% F | (.01)% | .26% | (.62)% | (.66)% |
Supplemental Data | | | | | |
Net assets, end of period (000 omitted) | $ 6,900 | $ 8,936 | $ 8,543 | $ 9,497 | $ 40,894 |
Portfolio turnover rate E | 24% | 49% | 174% | 61% | 107% |
A Total returns would have been lower if certain expenses had not been reduced during the applicable periods shown.
B Total returns do not include the effect of the contingent deferred sales charge.
C Calculated based on average shares outstanding during the period.
D Fees and expenses of any underlying Fidelity Central Funds are not included in the Fund's expense ratio. The Fund indirectly bears its proportionate share of the expenses of any underlying Fidelity Central Funds.
E Amount does not include the portfolio activity of any underlying Fidelity Central Funds.
F Investment income per share reflects a special dividend which amounted to $.06 per share. Excluding the special dividend, the ratio of net investment income (loss) to average net assets would have been .05%.
G Expense ratios reflect operating expenses of the class. Expenses before reductions do not reflect amounts reimbursed by the investment adviser or reductions from brokerage service arrangements or reductions from other expense offset arrangements and do not represent the amount paid by the class during periods when reimbursements or reductions occur. Expenses net of fee waivers reflect expenses after reimbursement by the investment adviser but prior to reductions from brokerage service arrangements or other expense offset arrangements. Expenses net of all reductions represent the net expenses paid by the class.
H Amount represents less than $.01 per share.
I Total distributions of $1.78 per share is comprised of distributions from net realized gain of $1.775 per share.
J Total distributions of $.07 per share is comprised of distribution from net investment income of $.058 and distributions from net realized gain of $.015 per share.
See accompanying notes which are an integral part of the financial statements.
Annual Report
Financial Highlights - International Small Cap Opportunities
Years ended October 31, | 2011 | 2010 | 2009 | 2008 | 2007 |
Selected Per-Share Data | | | | | |
Net asset value, beginning of period | $ 9.92 | $ 8.14 | $ 6.28 | $ 19.09 | $ 14.23 |
Income from Investment Operations | | | | | |
Net investment income (loss) B | .17 E | .09 | .08 | .05 | .07 |
Net realized and unrealized gain (loss) | (.06) | 1.87 | 1.78 | (10.92) | 4.78 |
Total from investment operations | .11 | 1.96 | 1.86 | (10.87) | 4.85 |
Distributions from net investment income | (.14) | (.09) | - G | (.06) | - |
Distributions from net realized gain | (.04) | (.09) | - | (1.88) | - |
Total distributions | (.18) | (.18) | - G | (1.94) H | - |
Redemption fees added to paid in capital B | - G | - G | - G | - G | .01 |
Net asset value, end of period | $ 9.85 | $ 9.92 | $ 8.14 | $ 6.28 | $ 19.09 |
Total Return A | 1.10% | 24.43% | 29.68% | (62.91)% | 34.15% |
Ratios to Average Net Assets C, F | | | | | |
Expenses before reductions | 1.08% | .91% | .68% | 1.44% | 1.30% |
Expenses net of fee waivers, if any | 1.08% | .91% | .68% | 1.44% | 1.30% |
Expenses net of all reductions | 1.06% | .89% | .64% | 1.40% | 1.25% |
Net investment income (loss) | 1.69% E | 1.00% | 1.25% | .36% | .43% |
Supplemental Data | | | | | |
Net assets, end of period (000 omitted) | $ 328,262 | $ 398,331 | $ 329,128 | $ 312,376 | $ 1,433,844 |
Portfolio turnover rate D | 24% | 49% | 174% | 61% | 107% |
A Total returns would have been lower if certain expenses had not been reduced during the applicable periods shown.
B Calculated based on average shares outstanding during the period.
C Fees and expenses of any underlying Fidelity Central Funds are not included in the Fund's expense ratio. The Fund indirectly bears its proportionate share of the expenses of any underlying Fidelity Central Funds.
D Amount does not include the portfolio activity of any underlying Fidelity Central Funds.
E Investment income per share reflects a special dividend which amounted to $.07 per share. Excluding the special dividend, the ratio of net investment income (loss) to average net assets would have been 1.06%.
F Expense ratios reflect operating expenses of the class. Expenses before reductions do not reflect amounts reimbursed by the investment adviser or reductions from brokerage service arrangements or reductions from other expense offset arrangements and do not represent the amount paid by the class during periods when reimbursements or reductions occur. Expenses net of fee waivers reflect expenses after reimbursement by the investment adviser but prior to reductions from brokerage service arrangements or other expense offset arrangements. Expenses net of all reductions represent the net expenses paid by the class.
G Amount represents less than $.01 per share.
H Total distributions of $1.94 per share is comprised of distributions from net investment income of $.064 and distributions from net realized gain of $1.878 per share.
See accompanying notes which are an integral part of the financial statements.
Annual Report
Financial Highlights - Institutional Class
Years ended October 31, | 2011 | 2010 | 2009 | 2008 | 2007 |
Selected Per-Share Data | | | | | |
Net asset value, beginning of period | $ 9.93 | $ 8.14 | $ 6.27 | $ 19.09 | $ 14.22 |
Income from Investment Operations | | | | | |
Net investment income (loss) B | .18 E | .09 | .08 | .05 | .08 |
Net realized and unrealized gain (loss) | (.06) | 1.86 | 1.79 | (10.92) | 4.78 |
Total from investment operations | .12 | 1.95 | 1.87 | (10.87) | 4.86 |
Distributions from net investment income | (.15) | (.07) | - G | (.07) | - |
Distributions from net realized gain | (.04) | (.09) | - | (1.88) | - |
Total distributions | (.19) | (.16) | - G | (1.95) H | - |
Redemption fees added to paid in capital B | - G | - G | - G | - G | .01 |
Net asset value, end of period | $ 9.86 | $ 9.93 | $ 8.14 | $ 6.27 | $ 19.09 |
Total Return A | 1.13% | 24.33% | 29.87% | (62.95)% | 34.25% |
Ratios to Average Net Assets C, F | | | | | |
Expenses before reductions | 1.03% | .90% | .68% | 1.40% | 1.29% |
Expenses net of fee waivers, if any | 1.03% | .90% | .68% | 1.40% | 1.29% |
Expenses net of all reductions | 1.02% | .88% | .64% | 1.37% | 1.25% |
Net investment income (loss) | 1.74% E | 1.01% | 1.25% | .39% | .44% |
Supplemental Data | | | | | |
Net assets, end of period (000 omitted) | $ 1,395 | $ 2,418 | $ 2,022 | $ 8,117 | $ 27,609 |
Portfolio turnover rate D | 24% | 49% | 174% | 61% | 107% |
A Total returns would have been lower if certain expenses had not been reduced during the applicable periods shown.
B Calculated based on average shares outstanding during the period.
C Fees and expenses of any underlying Fidelity Central Funds are not included in the Fund's expense ratio. The Fund indirectly bears its proportionate share of the expenses of any underlying Fidelity Central Funds.
D Amount does not include the portfolio activity of any underlying Fidelity Central Funds.
E Investment income per share reflects a special dividend which amounted to $.07 per share. Excluding the special dividend, the ratio of net investment income (loss) to average net assets would have been 1.11%.
F Expense ratios reflect operating expenses of the class. Expenses before reductions do not reflect amounts reimbursed by the investment adviser or reductions from brokerage service arrangements or reductions from other expense offset arrangements and do not represent the amount paid by the class during periods when reimbursements or reductions occur. Expenses net of fee waivers reflect expenses after reimbursement by the investment adviser but prior to reductions from brokerage service arrangements or other expense offset arrangements. Expenses net of all reductions represent the net expenses paid by the class.
G Amount represents less than $.01 per share.
H Total distributions of $1.95 per share is comprised of distributions from net investment income of $.074 and distributions from net realized gain of $1.878 per share.
See accompanying notes which are an integral part of the financial statements.
Annual Report
Notes to Financial Statements
For the period ended October 31, 2011
1. Organization.
Fidelity International Small Cap Opportunities Fund (the Fund) is a fund of Fidelity Investment Trust (the Trust) and is authorized to issue an unlimited number of shares. The Trust is registered under the Investment Company Act of 1940, as amended (the 1940 Act), as an open-end management investment company organized as a Massachusetts business trust. The Fund offers Class A, Class T, Class C, International Small Cap Opportunities and Institutional Class shares, each of which, along with Class B shares, has equal rights as to assets and voting privileges. Effective after the close of business on September 1, 2010, Class B shares were closed to new accounts and additional purchases, except for exchanges and reinvestments by existing shareholders. Each class has exclusive voting rights with respect to matters that affect that class. Class B shares will automatically convert to Class A shares after a holding period of seven years from the initial date of purchase. Investment income, realized and unrealized capital gains and losses, the common expenses of the Fund, and certain fund-level expense reductions, if any, are allocated on a pro-rata basis to each class based on the relative net assets of each class to the total net assets of the Fund. Each class differs with respect to transfer agent and distribution and service plan fees incurred. Certain expense reductions may also differ by class. The Fund's investments in emerging markets can be subject to social, economic, regulatory, and political uncertainties and can be extremely volatile.
2. Investments in Fidelity Central Funds.
The Fund invests in Fidelity Central Funds, which are open-end investment companies available only to other investment companies and accounts managed by Fidelity Management & Research Company (FMR) and its affiliates. The Fund's Schedule of Investments lists each of the Fidelity Central Funds held as of period end, if any, as an investment of the Fund, but does not include the underlying holdings of each Fidelity Central Fund. As an Investing Fund, the Fund indirectly bears its proportionate share of the expenses of the underlying Fidelity Central Funds.
The Money Market Central Funds seek preservation of capital and current income and are managed by Fidelity Investments Money Management, Inc. (FIMM), an affiliate of FMR.
A complete unaudited list of holdings for each Fidelity Central Fund is available upon request or at the Securities and Exchange Commission (the SEC) web site at www.sec.gov. In addition, the financial statements of the Fidelity Central Funds, which are not covered by the Fund's Report of Independent Registered Public Accounting Firm, are available on the SEC web site or upon request.
Annual Report
Notes to Financial Statements - continued
3. Significant Accounting Policies.
The financial statements have been prepared in conformity with accounting principles generally accepted in the United States of America (GAAP), which require management to make certain estimates and assumptions at the date of the financial statements. Actual results could differ from those estimates. Subsequent events, if any, through the date that the financial statements were issued have been evaluated in the preparation of the financial statements. The following summarizes the significant accounting policies of the Fund:
Security Valuation. Investments are valued as of 4:00 p.m. Eastern time on the last calendar day of the period. The Fund uses independent pricing services approved by the Board of Trustees to value its investments. When current market prices or quotations are not readily available or reliable, valuations may be determined in good faith in accordance with procedures adopted by the Board of Trustees. Factors used in determining value may include market or security specific events. The frequency with which these procedures are used cannot be predicted and they may be utilized to a significant extent. The value used for net asset value (NAV) calculation under these procedures may differ from published prices for the same securities.
The Fund categorizes the inputs to valuation techniques used to value its investments into a disclosure hierarchy consisting of three levels as shown below:
Level 1 - quoted prices in active markets for identical investments
Level 2 - other significant observable inputs (including quoted prices for similar investments, interest rates, prepayment speeds, etc.)
Level 3 - unobservable inputs (including the Fund's own assumptions based on the best information available)
Changes in valuation techniques may result in transfers in or out of an assigned level within the disclosure hierarchy. The aggregate value of investments by input level, as of October 31, 2011, is included at the end of the Fund's Schedule of Investments. Valuation techniques used to value the Fund's investments by major category are as follows:
Equity securities, including restricted securities, for which market quotations are readily available, are valued at the last reported sale price or official closing price as reported by an independent pricing service on the primary market or exchange on which they are traded and are categorized as Level 1 in the hierarchy. In the event there were no sales during the day or closing prices are not available, securities are valued at the last quoted bid price or may be valued using the last available price and are generally categorized as Level 2 in the hierarchy. For foreign equity securities, when significant market or security specific events arise, comparisons to the valuation of American Depositary Receipts (ADRs), futures contracts, Exchange-traded funds (ETFs) and certain indexes as well as
Annual Report
3. Significant Accounting Policies - continued
Security Valuation - continued
quoted prices for similar securities are used and are categorized as Level 2 in the hierarchy in these circumstances. Utilizing these techniques may result in transfers between Level 1 and Level 2. For restricted equity securities and private placements where observable inputs are limited, assumptions about market activity and risk are used and are categorized as Level 3 in the hierarchy.
Investments in open-end mutual funds, including the Fidelity Central Funds, are valued at their closing net asset value each business day and are categorized as Level 1 in the hierarchy.
Foreign Currency. The Fund may use foreign currency contracts to facilitate transactions in foreign-denominated securities. Gains and losses from these transactions may arise from changes in the value of the foreign currency or if the counterparties do not perform under the contracts' terms.
Foreign-denominated assets, including investment securities, and liabilities are translated into U.S. dollars at the exchange rate at period end. Purchases and sales of investment securities, income and dividends received and expenses denominated in foreign currencies are translated into U.S. dollars at the exchange rate in effect on the transaction date.
The effects of exchange rate fluctuations on investments are included with the net realized and unrealized gain (loss) on investment securities. Other foreign currency transactions resulting in realized and unrealized gain (loss) are disclosed separately.
Investment Transactions and Income. For financial reporting purposes, the Fund's investment holdings and NAV include trades executed through the end of the last business day of the period. The NAV per share for processing shareholder transactions is calculated as of the close of business of the New York Stock Exchange (NYSE), normally 4:00 p.m. Eastern time and includes trades executed through the end of the prior business day. Gains and losses on securities sold are determined on the basis of identified cost and may include proceeds received from litigation. Dividend income is recorded on the ex-dividend date, except for certain dividends from foreign securities where the ex-dividend date may have passed, which are recorded as soon as the Fund is informed of the ex-dividend date. Non-cash dividends included in dividend income, if any, are recorded at the fair market value of the securities received. Distributions received on securities that represent a return of capital or capital gain are recorded as a reduction of cost of investments and/or as a realized gain. The Fund estimates the components of distributions received that may be considered return of capital distributions or capital gain distributions. Large, non-recurring dividends recognized by the Fund are presented
Annual Report
Notes to Financial Statements - continued
3. Significant Accounting Policies - continued
Investment Transactions and Income - continued
separately on the Statement of Operations as "Special Dividends" and the impact of these dividends is presented in the Financial Highlights. Interest income and distributions from the Fidelity Central Funds are accrued as earned. Interest income includes coupon interest and amortization of premium and accretion of discount on debt securities. Investment income is recorded net of foreign taxes withheld where recovery of such taxes is uncertain.
Expenses. Expenses directly attributable to a fund are charged to that fund. Expenses attributable to more than one fund are allocated among the respective funds on the basis of relative net assets or other appropriate methods. Expense estimates are accrued in the period to which they relate and adjustments are made when actual amounts are known.
Income Tax Information and Distributions to Shareholders. Each year, the Fund intends to qualify as a regulated investment company, including distributing substantially all of its taxable income and realized gains under Subchapter M of the Internal Revenue Code and filing its U.S. federal tax return. As a result, no provision for income taxes is required. As of October 31, 2011, the Fund did not have any unrecognized tax benefits in the financial statements. A fund's federal tax return is subject to examination by the Internal Revenue Service (IRS) for a period of three years. Foreign taxes are provided for based on the Fund's understanding of the tax rules and rates that exist in the foreign markets in which it invests.
Distributions are declared and recorded on the ex-dividend date. Income dividends and capital gain distributions are declared separately for each class. Income and capital gain distributions are determined in accordance with income tax regulations, which may differ from GAAP.
Capital accounts within the financial statements are adjusted for permanent book-tax differences. These adjustments have no impact on net assets or the results of operations. Temporary book-tax differences will reverse in a subsequent period.
Book-tax differences are primarily due to foreign currency transactions, passive foreign investment companies (PFIC), partnerships, capital loss carryforwards and losses deferred due to wash sales.
The federal tax cost of investment securities and unrealized appreciation (depreciation) as of period end were as follows:
Gross unrealized appreciation | $ 73,513,976 |
Gross unrealized depreciation | (22,795,694) |
Net unrealized appreciation (depreciation) on securities and other investments | $ 50,718,282 |
| |
Tax Cost | $ 330,749,465 |
Annual Report
3. Significant Accounting Policies - continued
Income Tax Information and Distributions to Shareholders - continued
The tax-based components of distributable earnings as of period end were as follows:
Undistributed ordinary income | $ 4,705,169 |
Capital loss carryforward | $ (368,117,127) |
Net unrealized appreciation (depreciation) | $ 50,709,192 |
Under the recently enacted Regulated Investment Company Modernization Act of 2010 (the Act), the Fund will be permitted to carry forward capital losses incurred in taxable years beginning after December 22, 2010 for an unlimited period. However, any losses incurred during those future taxable years will be required to be utilized prior to any losses incurred in pre-enactment taxable years, which generally expire after eight years from when they are incurred. Additionally, post-enactment capital losses that are carried forward will retain their character as either short-term or long-term capital losses rather than being considered all short-term as under previous law. The Fund's first fiscal year end subject to the Act will be October 31, 2012.
The tax character of distributions paid was as follows:
| October 31, 2011 | October 31, 2010 |
Ordinary Income | $ 7,985,288 | $ 7,928,671 |
Short-Term Trading (Redemption) Fees. Shares held by investors in the Fund less than 90 Days are subject to a redemption fee equal to 2.00% of the net asset value of shares redeemed. All redemption fees, which reduce the proceeds of the shareholder redemption, are retained by the Fund and accounted for as an addition to paid in capital.
New Accounting Pronouncement. In May 2011, the Financial Accounting Standards Board issued Accounting Standard Update No. 2011-04, Fair Value Measurement (Topic 820) - Amendments to Achieve Common Fair Value Measurement and Disclosure Requirements in U.S. GAAP and IFRSs. The update changes the wording used to describe the requirements in GAAP for measuring fair value and for disclosing information about fair value measurements. The update is effective during interim and annual periods beginning after December 15, 2011. Management is currently evaluating the impact of the update's adoption on the Fund's financial statement disclosures.
Annual Report
Notes to Financial Statements - continued
4. Purchases and Sales of Investments.
Purchases and sales of securities, other than short-term securities, aggregated $100,138,660 and $177,442,934, respectively.
5. Fees and Other Transactions with Affiliates.
Management Fee. FMR and its affiliates provide the Fund with investment management related services for which the Fund pays a monthly management fee. The management fee is the sum of an individual fund fee rate that is based on an annual rate of .60% of the Fund's average net assets and a group fee rate that averaged .26% during the period. The group fee rate is based upon the average net assets of all the mutual funds advised by FMR. The group fee rate decreases as assets under management increase and increases as assets under management decrease. In addition, the management fee is subject to a performance adjustment (up to a maximum of ± .20% of the Fund's average net assets over a 36 month performance period). The upward or downward adjustment to the management fee is based on the relative investment performance of International Small Cap Opportunities as compared to an appropriate benchmark index. For the period, the total annual management fee rate, including the performance adjustment, was .66% of the Fund's average net assets.
Distribution and Service Plan Fees. In accordance with Rule 12b-1 of the 1940 Act, the Fund has adopted separate Distribution and Service Plans for each class of shares. Certain classes pay Fidelity Distributors Corporation (FDC), an affiliate of FMR, separate Distribution and Service Fees, each of which is based on an annual percentage of each class' average net assets. In addition, FDC may pay financial intermediaries for selling shares of the Fund and providing shareholder support services. For the period, the Distribution and Service Fee rates, total fees and amounts retained by FDC were as follows:
| Distribution
Fee | Service
Fee | Total
Fees | Retained
by FDC |
Class A | -% | .25% | $ 51,958 | $ 413 |
Class T | .25% | .25% | 53,522 | 308 |
Class B | .75% | .25% | 27,423 | 20,595 |
Class C | .75% | .25% | 83,724 | 6,165 |
| | | $ 216,627 | $ 27,481 |
Sales Load. FDC may receive a front-end sales charge of up to 5.75% for selling Class A shares, and 3.50% for selling Class T shares, some of which is paid to financial intermediaries for selling shares of the Fund. Depending on the holding period, FDC may receive contingent deferred sales charges levied on Class A, Class T, Class B, and Class C redemptions. The deferred sales charges range from 5% to 1% for Class B, 1% for Class C, 1.00% for certain purchases of Class A shares and .25% for certain purchases of Class T shares.
Annual Report
5. Fees and Other Transactions with Affiliates - continued
Sales Load - continued
For the period, sales charge amounts retained by FDC were as follows:
| Retained
by FDC |
Class A | $ 8,326 |
Class T | 2,104 |
Class B* | 5,991 |
Class C* | 326 |
| $ 16,747 |
* When Class B and Class C shares are initially sold, FDC pays commissions from its own resources to financial intermediaries through which the sales are made.
Transfer Agent Fees. Fidelity Investments Institutional Operations Company, Inc. (FIIOC), an affiliate of FMR, is the transfer, dividend disbursing and shareholder servicing agent for each class of the Fund. FIIOC receives account fees and asset-based fees that vary according to the account size and type of account of the shareholders of the respective classes of the Fund. FIIOC pays for typesetting, printing and mailing of shareholder reports, except proxy statements. For the period, transfer agent fees for each class were as follows:
| Amount | % of
Average
Net Assets |
Class A | $ 62,852 | .30 |
Class T | 33,760 | .32 |
Class B | 8,293 | .30 |
Class C | 25,383 | .30 |
International Small Cap Opportunities | 1,132,318 | .29 |
Institutional Class | 4,606 | .25 |
| $ 1,267,212 | |
Accounting and Security Lending Fees. Fidelity Service Company, Inc. (FSC), an affiliate of FMR, maintains the Fund's accounting records. The accounting fee is based on the level of average net assets for the month. Under a separate contract, FSC administers the security lending program. The security lending fee is based on the number and duration of lending transactions.
Brokerage Commissions. The Fund placed a portion of its portfolio transactions with brokerage firms which are affiliates of the investment adviser. The commissions paid to these affiliated firms were $1,185 for the period.
Annual Report
Notes to Financial Statements - continued
6. Committed Line of Credit.
The Fund participates with other funds managed by FMR or an affiliate in a $4.0 billion credit facility (the "line of credit") to be utilized for temporary or emergency purposes to fund shareholder redemptions or for other short-term liquidity purposes. The Fund has agreed to pay commitment fees on its pro-rata portion of the line of credit, which amounted to $1,348 and is reflected in Miscellaneous expenses on the Statement of Operations. During the period, there were no borrowings on this line of credit.
7. Security Lending.
The Fund lends portfolio securities through a lending agent from time to time in order to earn additional income. For equity securities, a lending agent is used and may loan securities to certain qualified borrowers, including Fidelity Capital Markets (FCM), a broker-dealer affiliated with the Fund. On the settlement date of the loan, the Fund receives collateral (in the form of U.S. Treasury obligations, letters of credit and/or cash) against the loaned securities and maintains collateral in an amount not less than 100% of the market value of the loaned securities during the period of the loan. The market value of the loaned securities is determined at the close of business of the Fund and any additional required collateral is delivered to the Fund on the next business day. If the borrower defaults on its obligation to return the securities loaned because of insolvency or other reasons, a fund could experience delays and costs in recovering the securities loaned or in gaining access to the collateral. Any cash collateral received is invested in the Fidelity Securities Lending Cash Central Fund. The value of loaned securities and cash collateral at period end are disclosed on the Fund's Statement of Assets and Liabilities. Security lending income represents the income earned on investing cash collateral, less rebates paid to borrowers and any lending agent fees associated with the loan, plus any premium payments received for lending certain types of securities. Security lending income is presented in the Statement of Operations as a component of income from Fidelity Central Funds. Total security lending income during the period amounted to $208,963. During the period, there were no securities loaned to FCM.
8. Expense Reductions.
FMR voluntarily agreed to reimburse a portion of its management fee. For the period, the amount of this reimbursement was $5,729.
Many of the brokers with whom FMR places trades on behalf of the Fund provided services to the Fund in addition to trade execution. These services included payments of certain expenses on behalf of the Fund totaling $47,857 for the period. In addition, through arrangements with the Fund's custodian, credits realized as a result of uninvested cash balances were used to reduce the Fund's expenses. During the period, these credits reduced the Fund's expenses by $45.
Annual Report
9. Distributions to Shareholders.
Distributions to shareholders of each class were as follows:
Years ended October 31, | 2011 | 2010 |
From net investment income | | |
Class A | $ 234,699 | $ 167,529 |
Class T | 95,132 | 81,809 |
Class B | 17,225 | 11,651 |
Class C | 53,555 | 35,378 |
International Small Cap Opportunities | 5,789,167 | 3,548,259 |
Institutional Class | 33,517 | 16,552 |
Total | $ 6,223,295 | $ 3,861,178 |
From net realized gain | | |
Class A | $ 81,710 | $ 203,751 |
Class T | 45,784 | 126,944 |
Class B | 4,543 | 31,778 |
Class C | 13,930 | 96,486 |
International Small Cap Opportunities | 1,606,951 | 3,588,127 |
Institutional Class | 9,075 | 20,407 |
Total | $ 1,761,993 | $ 4,067,493 |
10. Share Transactions.
Transactions for each class of shares were as follows:
| Shares | Dollars |
Years ended October 31, | 2011 | 2010 | 2011 | 2010 |
Class A | | | | |
Shares sold | 414,528 | 502,676 | $ 4,258,719 | $ 4,331,157 |
Reinvestment of distributions | 27,655 | 39,668 | 279,266 | 334,402 |
Shares redeemed | (586,134) | (821,208) | (5,964,528) | (7,086,973) |
Net increase (decrease) | (143,951) | (278,864) | $ (1,426,543) | $ (2,421,414) |
Class T | | | | |
Shares sold | 106,538 | 202,721 | $ 1,079,217 | $ 1,752,774 |
Reinvestment of distributions | 13,404 | 24,207 | 134,702 | 202,613 |
Shares redeemed | (371,432) | (563,942) | (3,710,229) | (4,787,797) |
Net increase (decrease) | (251,490) | (337,014) | $ (2,496,310) | $ (2,832,410) |
Class B | | | | |
Shares sold | 6,900 | 33,509 | $ 67,544 | $ 282,738 |
Reinvestment of distributions | 1,989 | 4,957 | 19,877 | 40,893 |
Shares redeemed | (71,270) | (89,943) | (711,316) | (751,714) |
Net increase (decrease) | (62,381) | (51,477) | $ (623,895) | $ (428,083) |
Annual Report
Notes to Financial Statements - continued
10. Share Transactions - continued
| Shares | Dollars |
Years ended October 31, | 2011 | 2010 | 2011 | 2010 |
Class C | | | | |
Shares sold | 80,402 | 138,774 | $ 802,688 | $ 1,172,961 |
Reinvestment of distributions | 5,984 | 13,874 | 59,727 | 114,325 |
Shares redeemed | (295,393) | (301,965) | (2,919,335) | (2,545,004) |
Net increase (decrease) | (209,007) | (149,317) | $ (2,056,920) | $ (1,257,718) |
International Small Cap Opportunities | | | | |
Shares sold | 4,054,816 | 11,750,215 | $ 41,630,046 | $ 101,991,968 |
Reinvestment of distributions | 693,159 | 792,800 | 7,035,420 | 6,738,804 |
Shares redeemed | (11,579,067) | (12,779,026) | (119,651,010) | (110,633,144) |
Net increase (decrease) | (6,831,092) | (236,011) | $ (70,985,544) | $ (1,902,372) |
Institutional Class | | | | |
Shares sold | 36,278 | 111,833 | $ 362,488 | $ 1,028,388 |
Reinvestment of distributions | 3,294 | 3,263 | 33,471 | 27,765 |
Shares redeemed | (141,623) | (119,898) | (1,476,463) | (1,034,340) |
Net increase (decrease) | (102,051) | (4,802) | $ (1,080,504) | $ 21,813 |
11. Other.
The Fund's organizational documents provide former and current trustees and officers with a limited indemnification against liabilities arising in connection with the performance of their duties to the Fund. In the normal course of business, the Fund may also enter into contracts that provide general indemnifications. The Fund's maximum exposure under these arrangements is unknown as this would be dependent on future claims that may be made against the Fund. The risk of material loss from such claims is considered remote.
Annual Report
To the Trustees of Fidelity Investment Trust and Shareholders of Fidelity International Small Cap Opportunities Fund:
We have audited the accompanying statement of assets and liabilities of Fidelity International Small Cap Opportunities Fund (the Fund), a fund of Fidelity Investment Trust, including the schedule of investments, as of October 31, 2011, and the related statement of operations for the year then ended, the statement of changes in net assets for each of the two years in the period then ended, and the financial highlights for each of the five years in the period then ended. These financial statements and financial highlights are the responsibility of the Fund's management. Our responsibility is to express an opinion on these financial statements and financial highlights based on our audits.
We conducted our audits in accordance with the standards of the Public Company Accounting Oversight Board (United States). Those standards require that we plan and perform the audit to obtain reasonable assurance about whether the financial statements and financial highlights are free of material misstatement. The Fund is not required to have, nor were we engaged to perform, an audit of its internal control over financial reporting. Our audits included consideration of internal control over financial reporting as a basis for designing audit procedures that are appropriate in the circumstances, but not for the purpose of expressing an opinion on the effectiveness of the Fund's internal control over financial reporting. Accordingly, we express no such opinion. An audit also includes examining, on a test basis, evidence supporting the amounts and disclosures in the financial statements, assessing the accounting principles used and significant estimates made by management, as well as evaluating the overall financial statement presentation. Our procedures included confirmation of securities owned as of October 31, 2011, by correspondence with the custodians and brokers; where replies were not received from brokers, we performed other auditing procedures. We believe that our audits provide a reasonable basis for our opinion.
In our opinion, the financial statements and financial highlights referred to above present fairly, in all material respects, the financial position of Fidelity International Small Cap Opportunities Fund as of October 31, 2011, the results of its operations for the year then ended, the changes in its net assets for each of the two years in the period then ended, and the financial highlights for each of the five years in the period then ended, in conformity with accounting principles generally accepted in the United States of America.
DELOITTE & TOUCHE LLP
Boston, Massachusetts
December 12, 2011
Annual Report
The Trustees, Members of the Advisory Board, and executive officers of the trust and fund, as applicable, are listed below. The Board of Trustees governs the fund and is responsible for protecting the interests of shareholders. The Trustees are experienced executives who meet periodically throughout the year to oversee the fund's activities, review contractual arrangements with companies that provide services to the fund, oversee management of the risks associated with such activities and contractual arrangements, and review the fund's performance. Except for James C. Curvey, each of the Trustees oversees 226 funds advised by FMR or an affiliate. Mr. Curvey oversees 429 funds advised by FMR or an affiliate.
The Trustees hold office without limit in time except that (a) any Trustee may resign; (b) any Trustee may be removed by written instrument, signed by at least two-thirds of the number of Trustees prior to such removal; (c) any Trustee who requests to be retired or who has become incapacitated by illness or injury may be retired by written instrument signed by a majority of the other Trustees; and (d) any Trustee may be removed at any special meeting of shareholders by a two-thirds vote of the outstanding voting securities of the trust. Each Trustee who is not an interested person (as defined in the 1940 Act) (Independent Trustee), shall retire not later than the last day of the calendar year in which his or her 75th birthday occurs. The Independent Trustees may waive this mandatory retirement age policy with respect to individual Trustees. The executive officers and Advisory Board Members hold office without limit in time, except that any officer and Advisory Board Member may resign or may be removed by a vote of a majority of the Trustees at any regular meeting or any special meeting of the Trustees. Except as indicated, each individual has held the office shown or other offices in the same company for the past five years.
Experience, Skills, Attributes, and Qualifications of the Fund's Trustees. The Governance and Nominating Committee has adopted a statement of policy that describes the experience, qualifications, attributes, and skills that are necessary and desirable for potential Independent Trustee candidates (Statement of Policy). The Board believes that each Trustee satisfied at the time he or she was initially elected or appointed a Trustee, and continues to satisfy, the standards contemplated by the Statement of Policy. The Governance and Nominating Committee also engages professional search firms to help identify potential Independent Trustee candidates who have the experience, qualifications, attributes, and skills consistent with the Statement of Policy. From time to time, additional criteria based on the composition and skills of the current Independent Trustees, as well as experience or skills that may be appropriate in light of future changes to board composition, business conditions, and regulatory or other developments, have also been considered by the professional search firms and the Governance and Nominating Committee. In addition, the Board takes into account the Trustees' commitment and participation in Board and committee meetings, as well as their leadership of standing and ad hoc committees throughout their tenure.
In determining that a particular Trustee was and continues to be qualified to serve as a Trustee, the Board has considered a variety of criteria, none of which, in isolation, was controlling. The Board believes that, collectively, the Trustees have balanced and diverse experience, qualifications, attributes, and skills, which allow the Board to operate effectively in governing the fund and protecting the interests of shareholders. Information about the specific experience, skills, attributes, and qualifications of each Trustee, which in each case led to the Board's conclusion that the Trustee should serve (or continue to serve) as a trustee of the fund, is provided below.
Annual Report
Board Structure and Oversight Function. James C. Curvey is an interested person (as defined in the 1940 Act) and currently serves as Acting Chairman. The Trustees have determined that an interested Chairman is appropriate and benefits shareholders because an interested Chairman has a personal and professional stake in the quality and continuity of services provided to the fund. Independent Trustees exercise their informed business judgment to appoint an individual of their choosing to serve as Chairman, regardless of whether the Trustee happens to be independent or a member of management. The Independent Trustees have determined that they can act independently and effectively without having an Independent Trustee serve as Chairman and that a key structural component for assuring that they are in a position to do so is for the Independent Trustees to constitute a substantial majority for the Board. The Independent Trustees also regularly meet in executive session. Ned C. Lautenbach serves as Chairman of the Independent Trustees and as such (i) acts as a liaison between the Independent Trustees and management with respect to matters important to the Independent Trustees and (ii) with management prepares agendas for Board meetings.
Fidelity funds are overseen by different Boards of Trustees. The fund's Board oversees Fidelity's equity and high income funds and another Board oversees Fidelity's investment-grade bond, money market, and asset allocation funds. The asset allocation funds may invest in Fidelity funds overseen by the fund's Board. The use of separate Boards, each with its own committee structure, allows the Trustees of each group of Fidelity funds to focus on the unique issues of the funds they oversee, including common research, investment, and operational issues. On occasion, the separate Boards establish joint committees to address issues of overlapping consequences for the Fidelity funds overseen by each Board.
The Trustees operate using a system of committees to facilitate the timely and efficient consideration of all matters of importance to the Trustees, the fund, and fund shareholders and to facilitate compliance with legal and regulatory requirements and oversight of the fund's activities and associated risks. The Board, acting through its committees, has charged FMR and its affiliates with (i) identifying events or circumstances the occurrence of which could have demonstrably adverse effects on the fund's business and/or reputation; (ii) implementing processes and controls to lessen the possibility that such events or circumstances occur or to mitigate the effects of such events or circumstances if they do occur; and (iii) creating and maintaining a system designed to evaluate continuously business and market conditions in order to facilitate the identification and implementation processes described in (i) and (ii) above. Because the day-to-day operations and activities of the fund are carried out by or through FMR, its affiliates and other service providers, the fund's exposure to risks is mitigated but not eliminated by the processes overseen by the Trustees. While each of the Board's committees has responsibility for overseeing different aspects of the fund's activities, oversight is exercised primarily through the Operations, Audit, and Compliance Committees. In addition, the Independent Trustees have worked with FMR to enhance the Board's oversight of investment and financial risks, legal and regulatory risks, technology risks, and operational risks, including the development of additional risk reporting to the Board. For example, a working group comprised of Independent Trustees and FMR has worked and continues to work to review the Fidelity funds' valuation-related activities, reporting and risk management. Appropriate personnel, including but not limited to the fund's Chief Compliance Officer (CCO), FMR's internal auditor, the independent accountants, the fund's Treasurer and portfolio management personnel, make periodic reports to the Board's committees, as appropriate, including an annual review of FMR's risk management program for the Fidelity funds. The responsibilities of each standing committee, including their oversight responsibilities, are described further under "Standing Committees of the Fund's Trustees."
Annual Report
Trustees and Officers - continued
The fund's Statement of Additional Information (SAI) includes more information about the Trustees. To request a free copy, call Fidelity at 1-877-208-0098.
Interested Trustees*:
Correspondence intended for each Trustee who is an interested person may be sent to Fidelity Investments, 82 Devonshire Street, Boston, Massachusetts 02109.
Name, Age; Principal Occupations and Other Relevant Experience+ |
James C. Curvey (76) |
| Year of Election or Appointment: 2007 Mr. Curvey is Trustee and Acting Chairman of the Board of Trustees of certain Trusts. Mr. Curvey also serves as Trustee (2007-present) of other investment companies advised by FMR. Mr. Curvey is a Director of Fidelity Investments Money Management, Inc. (2009-present), Director of Fidelity Research & Analysis Co. (2009-present) and Director of FMR and FMR Co., Inc. (2007-present). Mr. Curvey is also Vice Chairman (2007-present) and Director of FMR LLC. In addition, Mr. Curvey serves as an Overseer for the Boston Symphony Orchestra and a member of the Trustees of Villanova University. Previously, Mr. Curvey was the Vice Chairman (2006-2007) and Director (2000-2007) of FMR Corp. |
Ronald P. O'Hanley (54) |
| Year of Election or Appointment: 2011 Mr. O'Hanley is Director of FMR Co., Inc. (2010-present), Director of Fidelity Investments Money Management, Inc. (2010-present), Director of Fidelity Research & Analysis Company (2010-present), President of Fidelity Asset Management and Corporate Services and a member of Fidelity's Executive Committee (2010-present). Previously, Mr. O'Hanley served as President and Chief Executive Officer of BNY Mellon Asset Management (2007-2010). Mr. O'Hanley also served as Vice Chairman of Bank New York Mellon Corp. and a member of that firm's Executive Committee. Prior to the 2007 merger of The Bank of New York and Mellon Financial Corporation, he was Vice Chairman of Mellon Financial Corporation and President and Chief Executive Officer of Mellon Asset Management. He joined Mellon in February 1997. Mr. O'Hanley currently serves as Chairman of the Boston Public Library Foundation Board of Directors and sits on the Board of Directors of Beth Israel Deaconess Medical Center, the Board of Trustees of the Marine Biological Laboratory and the Advisory Board of the Maxwell School of Citizenship and Public Administration at Syracuse University. Mr. O'Hanley also chairs the Council on Asset Management for the Financial Services Roundtable and is a member of the Board of Directors of Institutional Investor's U.S. Institute. |
* Trustees have been determined to be "Interested Trustees" by virtue of, among other things, their affiliation with the trust or various entities under common control with FMR.
+ The information above includes each Trustee's principal occupation during the last five years and other information relating to the experience, attributes, and skills relevant to each Trustee's qualifications to serve as a Trustee, which led to the conclusion that each Trustee should serve as a Trustee for the fund.
Annual Report
Trustees and Officers - continued
Independent Trustees:
Correspondence intended for each Independent Trustee (that is, the Trustees other than the Interested Trustees) may be sent to Fidelity Investments, P.O. Box 55235, Boston, Massachusetts 02205-5235.
Name, Age; Principal Occupations and Other Relevant Experience+ |
Dennis J. Dirks (63) |
| Year of Election or Appointment: 2005 Prior to his retirement in May 2003, Mr. Dirks was Chief Operating Officer and a member of the Board of The Depository Trust & Clearing Corporation (DTCC). He also served as President, Chief Operating Officer, and Board member of The Depository Trust Company (DTC) and President and Board member of the National Securities Clearing Corporation (NSCC). In addition, Mr. Dirks served as Chief Executive Officer and Board member of the Government Securities Clearing Corporation, Chief Executive Officer and Board member of the Mortgage-Backed Securities Clearing Corporation, as a Trustee and a member of the Finance Committee of Manhattan College (2005-2008), and as a Trustee and a member of the Finance Committee of AHRC of Nassau County (2006-2008). Mr. Dirks is a member of the Independent Directors Council (IDC) Governing Council (2010-Present) and Board of Directors for The Brookville Center for Children's Services, Inc. (2009-present). |
Alan J. Lacy (58) |
| Year of Election or Appointment: 2008 Mr. Lacy serves as Senior Adviser (2007-present) of Oak Hill Capital Partners, L.P. (private equity). Mr. Lacy also served as Chief Executive Officer (2000-2005) and Vice Chairman (2005-2006) of Sears Holdings Corporation and Sears, Roebuck and Co. (retail). In addition, Mr. Lacy serves as a member of the Board of Directors of Dave & Buster's, Inc. (restaurant and entertainment complexes, 2010-present), The Hillman Companies, Inc. (hardware wholesalers, 2010-present), and Bristol-Myers Squibb Company (global pharmaceuticals, 2007-present). Mr. Lacy is a member of the Board of Trustees of The National Parks Conservation Association (2006-Present). Previously, Mr. Lacy served as Chairman of the Board of Trustees of the National Parks Conservation Association (2008-2011) and as a member of the Board of Directors for the Western Union Company (global money transfer, 2006-2011). |
Ned C. Lautenbach (67) |
| Year of Election or Appointment: 2000 Mr. Lautenbach is Chairman of the Independent Trustees of the Equity and High Income Funds (2006-present). Mr. Lautenbach currently serves as the Lead Director of the Eaton Corporation Board of Directors (diversified industrial, 1997-present). Mr. Lautenbach is also a member of the Board of Directors of the Philharmonic Center for the Arts in Naples, Florida (1999-present); a member of the Board of Trustees of Fairfield University (2005-present); and a member of the Council on Foreign Relations (1994-present). Previously, Mr. Lautenbach was a Partner/Advisory Partner at Clayton, Dubilier & Rice, LLC (private equity investment, 1998-2010), as well as a Director of Sony Corporation (2006-2007). |
Joseph Mauriello (67) |
| Year of Election or Appointment: 2008 Prior to his retirement in January 2006, Mr. Mauriello served in numerous senior management positions including Deputy Chairman and Chief Operating Officer (2004-2005), and Vice Chairman of Financial Services (2002-2004) of KPMG LLP US (professional services, 1965-2005). Mr. Mauriello currently serves as a member of the Board of Directors of XL Group plc. (global insurance and re-insurance, 2006-present) and of Arcadia Resources Inc. (health care services and products, 2007-present). Previously, Mr. Mauriello served as a Director of the Hamilton Funds of the Bank of New York (2006-2007). |
Robert W. Selander (61) |
| Year of Election or Appointment: 2011 Previously, Mr. Selander served as a Member of the Advisory Board of Fidelity's Equity and High Income Funds (2011), Executive Vice Chairman (2010), Chief Executive Officer (2009-2010), and President and Chief Executive Officer (1997-2009) of Mastercard, Inc. |
Cornelia M. Small (67) |
| Year of Election or Appointment: 2005 Ms. Small is a member of the Board of Directors of the Teagle Foundation (2009-present). Ms. Small is also a member of the Investment Committee, and Chair (2008-present) and a member of the Board of Trustees of Smith College. In addition, Ms. Small serves on the Investment Committee of the Berkshire Taconic Community Foundation (2008-present). Previously, Ms. Small served as Chairperson of the Investment Committee (2002-2008) of Smith College. In addition, Ms. Small served as Chief Investment Officer, Director of Global Equity Investments, and a member of the Board of Directors of Scudder, Stevens & Clark and Scudder Kemper Investments. |
William S. Stavropoulos (72) |
| Year of Election or Appointment: 2001 Mr. Stavropoulos is Vice Chairman of the Independent Trustees of the Equity and High Income Funds (2006-present). Mr. Stavropoulos serves as President and Founder of the Michigan Baseball Foundation, the Great Lakes Loons (2007-present). Mr. Stavropoulos is Chairman Emeritus of the Board of Directors of The Dow Chemical Company, where he previously served in numerous senior management positions, including President, CEO (1995-2000; 2002-2004), Chairman of the Executive Committee (2000-2006), and as a member of the Board of Directors (1990-2006). Currently, Mr. Stavropoulos is Chairman of Univar (global distributor of commodity and specialty chemicals, 2010-present), a Director of Teradata Corporation (data warehousing and technology solutions, 2008-present), Chemical Financial Corporation, Maersk Inc. (industrial conglomerate), Tyco International, Inc. (multinational manufacturing and services, 2007-present), and a member of the Advisory Board for Metalmark Capital (private equity investment, 2005-present). Mr. Stavropoulos is a special advisor to Clayton, Dubilier & Rice, LLC (private equity investment). In addition, Mr. Stavropoulos is a member of the University of Notre Dame Advisory Council for the College of Science. |
David M. Thomas (62) |
| Year of Election or Appointment: 2008 Previously, Mr. Thomas served as Executive Chairman (2005-2006) and Chairman and Chief Executive Officer (2000-2005) of IMS Health, Inc. (pharmaceutical and healthcare information solutions). In addition, Mr. Thomas serves as a member of the Board of Directors of Fortune Brands, Inc. (consumer products), and Interpublic Group of Companies, Inc. (marketing communication, 2004-present). |
Michael E. Wiley (61) |
| Year of Election or Appointment: 2008 Mr. Wiley also serves as a Director of Asia Pacific Exploration Consolidated (international oil and gas exploration and production, 2008-present). Mr. Wiley serves as a Director of Tesoro Corporation (independent oil refiner and marketer, 2005-present), and a Director of Bill Barrett Corporation (exploration and production, 2005-present). In addition, Mr. Wiley also serves as a Director of Post Oak Bank (privately-held bank, 2004-present). Previously, Mr. Wiley served as a member of the Board of Trustees of the University of Tulsa (2000-2006; 2007-2010), as a Senior Energy Advisor of Katzenbach Partners, LLC (consulting, 2006-2007), as an Advisory Director of Riverstone Holdings (private investment), Chairman, President, and CEO of Baker Hughes, Inc. (oilfield services, 2000-2004), and as Director of Spinnaker Exploration Company (exploration and production, 2001-2005). |
Annual Report
+ The information above includes each Trustee's principal occupation during the last five years and other information relating to the experience, attributes, and skills relevant to each Trustee's qualifications to serve as a Trustee, which led to the conclusion that each Trustee should serve as a Trustee for the fund.
Advisory Board Members and Executive Officers:
Correspondence intended for each executive officer, Edward C. Johnson 3d, and Peter S. Lynch may be sent to Fidelity Investments, 82 Devonshire Street, Boston, Massachusetts 02109.
Name, Age; Principal Occupation |
Edward C. Johnson 3d (81) |
| Year of Election or Appointment: 2011 Member of the Advisory Board of Fidelity's Equity and High Income Funds. Mr. Johnson serves as Chief Executive Officer, Chairman, and a Director of FMR LLC, and also serves as Chairman and Director of FIL Limited. Previously, Mr. Johnson served as a Trustee and Chairman of the Board of certain Fidelity Trusts, Chairman and a Director of FMR, Chairman and a Director of FMR Co., Inc., and President of FMR LLC (2006-2007). |
Peter S. Lynch (67) |
| Year of Election or Appointment: 2003 Member of the Advisory Board of Fidelity's Equity and High Income Funds. Mr. Lynch is Vice Chairman and a Director of FMR and FMR Co., Inc. In addition, Mr. Lynch serves as a Trustee of Boston College and as the Chairman of the Inner-City Scholarship Fund. Previously, Mr. Lynch served on the Special Olympics International Board of Directors (1997-2006). |
Kenneth B. Robins (42) |
| Year of Election or Appointment: 2008 President and Treasurer of Fidelity's Equity and High Income Funds. Mr. Robins also serves as President and Treasurer (2010-present) and Assistant Treasurer (2009-present) of other Fidelity funds and is an employee of Fidelity Investments (2004-present). Previously, Mr. Robins served as Deputy Treasurer of the Fidelity funds (2005-2008) and Treasurer and Chief Financial Officer of The North Carolina Capital Management Trust: Cash and Term Portfolios (2006-2008). |
Brian B. Hogan (47) |
| Year of Election or Appointment: 2009 Vice President of Equity and High Income Funds. Mr. Hogan also serves as President of FMR's Equity Division (2009-present). Previously, Mr. Hogan served as Senior Vice President, Equity Research of FMR (2006-2009) and as a portfolio manager. |
Thomas C. Hense (47) |
| Year of Election or Appointment: 2008 or 2010 Vice President of Fidelity's High Income (2008), Small Cap (2008), and Value (2010) Funds. Previously, Mr. Hense served as a portfolio manager for Fidelity's Institutional Money Management Group (Pyramis) (2003-2008). |
Scott C. Goebel (43) |
| Year of Election or Appointment: 2008 Secretary and Chief Legal Officer (CLO) of the Fidelity funds. Mr. Goebel also serves as Secretary of Fidelity Investments Money Management, Inc. (FIMM) (2010-present) and Fidelity Research and Analysis Company (FRAC) (2010-present); Secretary and CLO of The North Carolina Capital Management Trust: Cash and Term Portfolios (2008-present); General Counsel, Secretary, and Senior Vice President of FMR (2008-present) and FMR Co., Inc. (2008-present); employed by FMR LLC or an affiliate (2001-present); Chief Legal Officer of Fidelity Management & Research (Hong Kong) Limited (2008-present) and Assistant Secretary of Fidelity Management & Research (Japan) Inc. (2008-present), and Fidelity Management & Research (U.K.) Inc. (2008-present). Previously, Mr. Goebel served as Assistant Secretary of FIMM (2008-2010), FRAC (2008-2010), and the Funds (2007-2008) and as Vice President and Secretary of Fidelity Distributors Corporation (FDC) (2005-2007). |
William C. Coffey (42) |
| Year of Election or Appointment: 2009 Assistant Secretary of Fidelity's Equity and High Income Funds. Mr. Coffey also serves as Senior Vice President and Deputy General Counsel of FMR LLC (2010-present), and is an employee of Fidelity Investments. Previously, Mr. Coffey served as Vice President and Associate General Counsel of FMR LLC (2005-2009). |
Holly C. Laurent (57) |
| Year of Election or Appointment: 2008 Anti-Money Laundering (AML) Officer of the Fidelity funds. Ms. Laurent also serves as AML Officer of The North Carolina Capital Management Trust: Cash and Term Portfolios (2008-present) and is an employee of Fidelity Investments. Previously, Ms. Laurent was Senior Vice President and Head of Legal for Fidelity Business Services India Pvt. Ltd. (2006-2008), and Senior Vice President, Deputy General Counsel and Group Head for FMR LLC (2005-2006). |
Christine Reynolds (53) |
| Year of Election or Appointment: 2008 Chief Financial Officer of the Fidelity funds. Ms. Reynolds became President of Fidelity Pricing and Cash Management Services (FPCMS) in August 2008. Ms. Reynolds served as Chief Operating Officer of FPCMS (2007-2008). Previously, Ms. Reynolds served as President, Treasurer, and Anti-Money Laundering officer of the Fidelity funds (2004-2007). |
Kenneth A. Rathgeber (64) |
| Year of Election or Appointment: 2004 Chief Compliance Officer of Fidelity's Equity and High Income Funds. Mr. Rathgeber is Chief Compliance Officer of Fidelity Management & Research (Hong Kong) Limited (2008-present), Fidelity Management & Research (Japan) Inc. (2008-present), FMR (2005-present), FMR Co., Inc. (2005-present), Fidelity Management & Research (U.K.) Inc. (2005-present), Fidelity Research & Analysis Company (2005-present), Fidelity Investments Money Management, Inc. (2005-present), Pyramis Global Advisors, LLC (2005-present), and Strategic Advisers, Inc. (2005-present). |
Jeffrey S. Christian (50) |
| Year of Election or Appointment: 2009 Deputy Treasurer of the Fidelity funds. Mr. Christian is an employee of Fidelity Investments. Previously, Mr. Christian served as Chief Financial Officer (2008-2009) of certain Fidelity funds and Senior Vice President of Fidelity Pricing and Cash Management Services (FPCMS) (2004-2009). |
Joseph F. Zambello (54) |
| Year of Election or Appointment: 2011 Deputy Treasurer of the Fidelity funds. Mr. Zambello is an employee of Fidelity Investments. Previously, Mr. Zambello served as Vice President of FMR's Program Management Group (2009-2011) and Vice President of the Transfer Agent Oversight Group (2005-2009). |
Adrien E. Deberghes (44) |
| Year of Election or Appointment: 2008 Deputy Treasurer of Fidelity's Equity and High Income Funds. Mr. Deberghes also serves as Vice President and Assistant Treasurer of Fidelity Rutland Square Trust II and Fidelity Commonwealth Trust II (2011-present), Assistant Treasurer of other Fidelity funds (2010-present), and is an employee of Fidelity Investments (2008-present). Previously, Mr. Deberghes served as Senior Vice President of Mutual Fund Administration at State Street Corporation (2007-2008), Senior Director of Mutual Fund Administration at Investors Bank & Trust (2005-2007), and Director of Finance for Dunkin' Brands (2000-2005). |
Stephanie J. Dorsey (42) |
| Year of Election or Appointment: 2010 Assistant Treasurer of Fidelity's Equity and High Income Funds. Ms. Dorsey also serves as Deputy Treasurer of other Fidelity funds (2008-present) and is an employee of Fidelity Investments (2008-present). Previously, Ms. Dorsey served as Treasurer (2004-2008) of the JPMorgan Mutual Funds and Vice President (2004-2008) of JPMorgan Chase Bank. |
John R. Hebble (53) |
| Year of Election or Appointment: 2009 Assistant Treasurer of Fidelity's Equity and High Income Funds. Mr. Hebble also serves as President (2011-present), Treasurer, and Chief Financial Officer of The North Carolina Capital Management Trust: Cash and Term Portfolios (2008-present), President and Treasurer of other Fidelity funds (2008-present) and is an employee of Fidelity Investments. |
Gary W. Ryan (53) |
| Year of Election or Appointment: 2005 Assistant Treasurer of the Fidelity funds. Mr. Ryan is an employee of Fidelity Investments. Previously, Mr. Ryan served as Vice President of Fund Reporting in Fidelity Pricing and Cash Management Services (FPCMS) (1999-2005). |
Jonathan Davis (43) |
| Year of Election or Appointment: 2010 Assistant Treasurer of the Fidelity funds. Mr. Davis is also Assistant Treasurer of Fidelity Rutland Square Trust II and Fidelity Commonwealth Trust II. Mr. Davis is an employee of Fidelity Investments. Previously, Mr. Davis served as Vice President and Associate General Counsel of FMR LLC (2003-2010). |
Annual Report
The Board of Trustees of Advisor International Small Cap Opportunities Fund voted to pay to shareholders of record at the opening of business on record date, the following distributions per share derived from capital gains realized from sales of portfolio securities, and dividends derived from net investment income:
| Pay Date | Record Date | Dividends | Capital Gains |
Class A | 12/05/11 | 12/02/11 | $0.111 | $0.01 |
Class T | 12/05/11 | 12/02/11 | $0.078 | $0.01 |
Class B | 12/05/11 | 12/02/11 | $0.027 | $0.01 |
Class C | 12/05/11 | 12/02/11 | $0.028 | $0.01 |
Class A designates 98% and 100%, Class T designates 100% and 100%, Class B designates 100% and 100% and Class C designates 100% and 100% of the dividends distributed on December 3, 2010 and December 30, 2010, respectively during the fiscal year as amounts which may be taken into account as a dividend for purposes of the maximum rate under section 1(h) (11) of the Internal Revenue Code.
The amounts per share which represent income derived from sources within, and taxes paid to, foreign countries or possessions of the United States are as follows:
| Pay Date | Income | Taxes |
Class A | 12/06/10 | $0.083 | $0.0076 |
| 12/31/10 | $0.046 | $0.0000 |
Class T | 12/06/10 | $0.058 | $0.0076 |
| 12/31/10 | $0.046 | $0.0000 |
Class B | 12/06/10 | $0.018 | $0.0076 |
| 12/31/10 | $0.046 | $0.0000 |
Class C | 12/06/10 | $0.018 | $0.0076 |
| 12/31/10 | $0.046 | $0.0000 |
The fund will notify shareholders in January 2012 of amounts for use in preparing 2011 income tax returns.
Annual Report
Board Approval of Investment Advisory Contracts and Management Fees
Fidelity International Small Cap Opportunities Fund
Each year, the Board of Trustees, including the Independent Trustees (together, the Board), votes on the renewal of the management contract and sub-advisory agreements (together, the Advisory Contracts) for the fund. The Board, assisted by the advice of fund counsel and Independent Trustees' counsel, requests and considers a broad range of information relevant to the renewal of the Advisory Contracts throughout the year.
The Board meets regularly and considers at each of its meetings factors that are relevant to its annual consideration of the renewal of the fund's Advisory Contracts, including the services and support provided to the fund and its shareholders. The Board has established various standing committees, each composed of Independent Trustees with varying backgrounds, to which the Board has assigned specific subject matter responsibilities in order to enhance effective decision-making by the Board. The Board, acting directly and through its Committees, requests and receives information concerning the annual consideration of the renewal of the fund's Advisory Contracts. The Board also meets as needed to consider matters specifically related to the Board's annual consideration of the renewal of Advisory Contracts. Members of the Board may also meet with trustees of other Fidelity funds through ad hoc joint committees to discuss certain matters relevant to the Fidelity funds.
At its July 2011 meeting, the Board of Trustees, including the Independent Trustees, unanimously determined to renew the fund's Advisory Contracts. In reaching its determination, the Board considered all factors it believed relevant, including (i) the nature, extent, and quality of the services to be provided to the fund and its shareholders (including the investment performance of the fund); (ii) the competitiveness of the fund's management fee and total expense ratio; (iii) the total costs of the services to be provided by and the profits to be realized by Fidelity from its relationship with the fund; (iv) the extent to which economies of scale would be realized as the fund grows; and (v) whether fee levels reflect these economies of scale, if any, for the benefit of fund shareholders.
In considering whether to renew the Advisory Contracts for the fund, the Board reached a determination, with the assistance of fund counsel and Independent Trustees' counsel and through the exercise of its business judgment, that the renewal of the Advisory Contracts is in the best interests of the fund and its shareholders and that the compensation payable under the Advisory Contracts is fair and reasonable. The Board's decision to renew the Advisory Contracts was not based on any single factor, but rather was based on a comprehensive consideration of all the information provided to the Board at its meetings throughout the year. The Board, in reaching its determination to renew the Advisory Contracts, is aware that shareholders in the fund have a broad range of investment choices available to them, including a wide choice among mutual funds offered by Fidelity's competitors, and that the fund's shareholders, who have the opportunity to review and weigh the disclosure provided by the fund in its prospectus and other public disclosures, have chosen to invest in this fund, managed by Fidelity.
Annual Report
Nature, Extent, and Quality of Services Provided. The Board considered the staffing within the investment adviser, FMR, and the sub-advisers (together, the Investment Advisers), including the backgrounds of the fund's investment personnel and the fund's investment objective and discipline. The Independent Trustees also had discussions with senior management of Fidelity's investment operations and investment groups. The Board considered the structure of the portfolio manager compensation program and whether this structure provides appropriate incentives to act in the best interests of the fund.
Resources Dedicated to Investment Management and Support Services. The Board and the Fund Oversight and Research Committees reviewed the general qualifications and capabilities of the Investment Advisers' investment staff, including its size, education, experience, and resources, as well as the Investment Advisers' approach to recruiting, training, managing, and compensating investment personnel. The Board also noted that FMR has devoted increased resources to non-U.S. offices. The Board noted that Fidelity's analysts have extensive resources, tools and capabilities which allow them to conduct sophisticated quantitative and fundamental analysis, as well as credit analysis of issuers, counterparties and enhancers. The Board also believes that Fidelity's investment professionals have sufficient access to global information and data so as to provide competitive investment results over time, and that those professionals also have access to sophisticated tools which permit them to assess portfolio construction and risk and performance attribution characteristics continuously, as well as to transmit new information and research conclusions rapidly around the world. Additionally, in their deliberations, the Board considered the Investment Advisers' trading capabilities and resources which are an integral part of the investment management process.
Shareholder and Administrative Services. The Board considered (i) the nature, extent, quality, and cost of advisory, administrative, and shareholder services performed by the Investment Advisers and their affiliates under the Advisory Contracts and under separate agreements covering transfer agency, pricing and bookkeeping, and securities lending services for the fund; (ii) the nature and extent of the investment adviser's supervision of third party service providers, principally custodians and subcustodians; and (iii) the resources devoted to, and the record of compliance with, the fund's compliance policies and procedures. The Board also reviewed the allocation of fund brokerage, including allocations to brokers affiliated with the Investment Advisers, the use of brokerage commissions to pay fund expenses, and the use of "soft" commission dollars to pay for research services.
The Board noted that the growth of fund assets over time across the complex allows Fidelity to reinvest in the development of services designed to enhance the value or convenience of the Fidelity funds as investment vehicles. These services include 24-hour access to account information and market information through telephone representatives and over the Internet, investor education materials and asset allocation tools, and the expanded availability of Fidelity Investor Centers, with 35 new branches opening since 2010.
Annual Report
Board Approval of Investment Advisory Contracts and
Management Fees - continued
Investment in a Large Fund Family. The Board considered the benefits to shareholders of investing in a Fidelity fund, including the benefits of investing in a fund that is part of a large family of funds offering a variety of investment disciplines and providing a large variety of mutual fund investor services. The Board noted that Fidelity had taken, or had made recommendations that resulted in the Fidelity funds taking, a number of actions over the previous year that benefited particular funds, including (i) continuing to dedicate additional resources to investment research and support of the senior management team that oversees asset management; (ii) rationalizing product lines through the mergers of six funds into other funds; (iii) continuing to migrate the Freedom Funds to dedicated lower cost underlying funds; (iv) obtaining shareholder approval to broaden the investment strategies for Fidelity Consumer Finance Portfolio, Fidelity Emerging Asia Fund, and Fidelity Environment and Alternative Energy Portfolio; (v) contractually agreeing to reduce the management fees and impose other expense limitations on Spartan 500 Index Fund and U.S. Bond Index Fund in connection with launching new institutional classes of these funds; (vi) changing the name, primary and supplemental benchmarks, and investment policies of Fidelity Global Strategies Fund to support the fund's flexible investment mandate and global orientation; and (vii) reducing the transfer agency account fee rates on certain accounts.
Investment Performance. The Board considered whether the fund has operated in accordance with its investment objective, as well as its record of compliance with its investment restrictions. It also reviewed the fund's absolute investment performance for each class, as well as the fund's relative investment performance for each class measured over multiple periods against (i) a broad-based securities market index, and (ii) a peer group of mutual funds deemed appropriate by Fidelity and reviewed by the Board. The following charts considered by the Board show, over the one-, three-, and five-year periods ended December 31, 2010, the cumulative total returns of the retail class and Class B of the fund, the cumulative total returns of a broad-based securities market index ("benchmark"), and a range of cumulative total returns of a peer group of mutual funds identified by Lipper Inc. as having an investment objective similar to that of the fund. The returns of the retail class and Class B show the performance of the highest and lowest performing classes, respectively (based on five-year performance). The box within each chart shows the 25th percentile return (bottom of box) and the 75th percentile return (top of box) of the peer group. Returns shown above the box are in the first quartile and returns shown below the box are in the fourth quartile. The percentage beaten numbers noted below each chart correspond to the percentile box and represent the percentage of funds in the peer group whose performance was equal to or lower than that of the class indicated.
Annual Report
Fidelity International Small Cap Opportunities Fund
The Board reviewed the fund's relative investment performance against its peer group and noted that the performance of the retail class of the fund was in the second quartile for the one-year period and the fourth quartile for the three- and five-year periods. The Board also noted that the investment performance of the fund was lower than its benchmark for the three- and five-year periods although the one-year total return of the retail class compared favorably to its benchmark. The Board considered that the variations in performance among the fund's classes reflect the variations in class expenses, which result in lower performance for higher expense classes. The Board also reviewed the fund's performance since inception as well as performance in the current year.
The Board also considered that the fund's management fee is subject to upward or downward adjustment depending upon whether, and to what extent, the fund's investment performance for the performance period exceeds, or is exceeded by, the record (over the same period) of a Board-approved performance adjustment index. The Board noted that the performance adjustment provides FMR with a strong economic incentive to seek to achieve superior performance for the fund's shareholders and helps to more closely align the interests of FMR and the fund's shareholders.
Based on its review, the Board concluded that the nature, extent, and quality of services provided to the fund under the Advisory Contracts should benefit the fund's shareholders.
Annual Report
Board Approval of Investment Advisory Contracts and
Management Fees - continued
Competitiveness of Management Fee and Total Expense Ratio. The Board considered the fund's management fee and total expense ratio compared to "mapped groups" of competitive funds and classes. Fidelity creates "mapped groups" by combining similar Lipper investment objective categories that have comparable management fee characteristics. Combining Lipper investment objective categories aids the Board's management fee and total expense ratio comparisons by broadening the competitive group used for comparison and by reducing the number of universes to which various Fidelity funds are compared.
Management Fee. The Board considered two proprietary management fee comparisons for the 12-month periods shown in the chart below. The group of Lipper funds used by the Board for management fee comparisons is referred to below as the "Total Mapped Group." The Total Mapped Group is broader than the Lipper peer group used by the Board for performance comparisons because the Total Mapped Group combines several Lipper investment objective categories while the Lipper peer group does not. The Total Mapped Group comparison focuses on a fund's standing relative to the total universe of comparable funds available to investors in terms of gross management fees before expense reimbursements or caps, and without giving effect to the fund's performance adjustment. "TMG %" represents the percentage of funds in the Total Mapped Group that had management fees that were lower than the fund's. For example, a TMG % of 19% means that 81% of the funds in the Total Mapped Group had higher management fees than the fund. The "Asset-Size Peer Group" (ASPG) comparison focuses on a fund's standing relative to non-Fidelity funds similar in size to the fund within the Total Mapped Group. The ASPG represents at least 15% of the funds in the Total Mapped Group with comparable asset size and management fee characteristics, subject to a minimum of 50 funds (or all funds in the Total Mapped Group if fewer than 50). Additional information, such as the ASPG quartile in which the fund's management fee ranked and the impact of the fund's performance adjustment, is also included in the chart and considered by the Board.
Annual Report
Fidelity International Small Cap Opportunities Fund
The Board noted that the fund's management fee ranked below the median of its Total Mapped Group and below the median of its ASPG for 2010. The Board also noted the effect of the fund's negative performance adjustment on the fund's management fee ranking. The Board noted that the performance adjustment for each year represents calculations for performance periods that differ from the periods shown in the performance charts above.
Based on its review, the Board concluded that the fund's management fee is fair and reasonable in light of the services that the fund receives and the other factors considered.
Total Expense Ratio. In its review of each class's total expense ratio, the Board considered the fund's management fee as well as other fund or class expenses, as applicable, such as transfer agent fees, pricing and bookkeeping fees, fund-paid 12b-1 fees, and custodial, legal, and audit fees. The Board also noted the effects of any waivers and reimbursements on fees and expenses, as well as the impact of the fund's performance adjustment. As part of its review, the Board also considered the current and historical total expense ratios of each class of the fund compared to competitive fund median expenses. Each class of the fund is compared to those funds and classes in the Total Mapped Group (used by the Board for management fee comparisons) that have a similar sales load structure.
The Board noted that the total expense ratio of each class ranked below its competitive median for 2010. The Board considered that various factors, including 12b-1 fees, positive or negative performance adjustments, and relatively higher other expenses in the case of small fund size, can affect total expense ratios.
Annual Report
Board Approval of Investment Advisory Contracts and
Management Fees - continued
Fees Charged to Other Fidelity Clients. The Board also considered Fidelity fee structures and other information with respect to clients of FMR and its affiliates, such as other mutual funds advised or subadvised by FMR or its affiliates, pension plan clients, and other institutional clients. In March 2010, the Board created an ad hoc joint committee with the board of other Fidelity funds (the Committee) to review and compare Fidelity's institutional investment advisory business with its business of providing services to the Fidelity funds, including the differences in services provided, fees charged, and costs incurred, as well as competition in their respective marketplaces.
Based on its review of total expense ratios and fees charged to other Fidelity clients, the Board concluded that the total expense ratio of each class of the fund was reasonable in light of the services that the fund and its shareholders receive and the other factors considered, including the findings of the Committee.
Costs of the Services and Profitability. The Board considered the revenues earned and the expenses incurred by Fidelity in conducting the business of developing, marketing, distributing, managing, administering and servicing the fund and its shareholders. The Board also considered the level of Fidelity's profits in respect of all the Fidelity funds.
On an annual basis, FMR presents to the Board Fidelity's profitability for the fund. Fidelity calculates the profitability for each fund, as well as aggregate profitability for groups of Fidelity funds and all Fidelity funds, using a series of detailed revenue and cost allocation methodologies which originate with the books and records of Fidelity on which Fidelity's audited financial statements are based. The Audit Committee of the Board reviews any significant changes from the prior year's methodologies.
PricewaterhouseCoopers LLP (PwC), independent registered public accounting firm and auditor to Fidelity and certain Fidelity funds, has been engaged annually by the Board as part of the Board's assessment of Fidelity's profitability analysis. PwC's engagement includes the review and assessment of Fidelity's methodologies used in determining the revenues and expenses attributable to Fidelity's mutual fund business, and completion of agreed-upon procedures surrounding the mathematical accuracy of fund profitability and its conformity to allocation methodologies. After considering PwC's reports issued under the engagement and information provided by Fidelity, the Board concluded that while other allocation methods may also be reasonable, Fidelity's profitability methodologies are reasonable in all material respects.
The Board also reviewed Fidelity's non-fund businesses and fall-out benefits related to the mutual fund business as well as cases where Fidelity's affiliates may benefit from or be related to the fund's business.
Annual Report
The Board considered the costs of the services provided by and the profits realized by Fidelity in connection with the operation of the fund and was satisfied that the profitability was not excessive in the circumstances.
Economies of Scale. The Board considered whether there have been economies of scale in respect of the management of the Fidelity funds, whether the Fidelity funds (including the fund) have appropriately benefited from any such economies of scale, and whether there is potential for realization of any further economies of scale. The Board considered the extent to which the fund will benefit from economies of scale through increased services to the fund, through waivers or reimbursements, or through fee or expense reductions. The Board also noted that in 2009, it and the board of other Fidelity funds created an ad hoc committee (the Economies of Scale Committee) to analyze whether FMR attains economies of scale in respect of the management and servicing of the Fidelity funds, whether the Fidelity funds have appropriately benefited from such economies of scale, and whether there is potential for realization of any further economies of scale.
The Board recognized that the fund's management contract incorporates a "group fee" structure, which provides for lower group fee rates as total fund assets under FMR's management increase, and for higher group fee rates as total fund assets under FMR's management decrease. FMR calculates the group fee rates based on a tiered asset "breakpoint" schedule that varies based on asset class. The Board considered that the group fee is designed to deliver the benefits of economies of scale to fund shareholders when total Fidelity fund assets increase, even if assets of any particular fund are unchanged or have declined, because some portion of Fidelity's costs are attributable to services provided to all Fidelity funds, and all funds benefit if those costs can be allocated among more assets. The Board concluded that, given the group fee structure, fund shareholders will benefit from lower management fees as assets under FMR's management increase at the fund complex level, regardless of whether Fidelity achieves any such economies of scale.
The Board concluded, taking into account the analysis of the Economies of Scale Committee, that any potential economies of scale are being appropriately shared between fund shareholders and Fidelity.
Additional Information Requested by the Board. In order to develop fully the factual basis for consideration of the Fidelity funds' Advisory Contracts, the Board requested and received additional information on certain topics, including (i) fund performance trends, actions to be taken by FMR to improve certain funds' overall performance, and Fidelity's long-term strategies for certain funds; (ii) portfolio manager changes that have occurred during the past year and length of portfolio manager tenure for different categories of funds over time; (iii) Fidelity's compensation structure for portfolio managers and other key personnel and strategies for attracting and retaining non-investment personnel; (iv) the amount of the investment that each portfolio manager has made in the Fidelity fund(s) that he or she manages; (v) historical trends in Fidelity's realization of fall-out benefits; (vi) Fidelity's group fee structures and the rationale for the individual fee rates of certain funds; (vii) fund profitability methodology and the impact of certain factors on fund profitability results; (viii) trends regarding industry use of performance fee structures and Fidelity's compliance practices with respect to performance adjustment calculations; (ix) the fee structures in place for certain other Fidelity clients; and (x) explanations regarding the relative total expense ratios of certain funds and classes, total expense competitive trends, and actions that might be taken by FMR to reduce total expense ratios for certain funds and classes.
Annual Report
Board Approval of Investment Advisory Contracts and
Management Fees - continued
Based on its evaluation of all of the conclusions noted above, and after considering all factors it believed relevant, the Board ultimately concluded that the advisory fee structures are fair and reasonable, and that the fund's Advisory Contracts should be renewed.
Annual Report
Investment Adviser
Fidelity Management & Research Company
Boston, MA
Investment Sub-Advisers
FMR Co., Inc.
Fidelity Management & Research
(Hong Kong) Limited
Fidelity Management & Research
(Japan) Inc.
Fidelity Management & Research
(U.K.) Inc.
FIL Investment Advisors
FIL Investments (Japan) Limited
FIL Investment Advisors (U.K.) Limited
General Distributor
Fidelity Distributors Corporation
Boston, MA
Transfer and Service Agents
Fidelity Investments Institutional
Operations Company, Inc.
Boston, MA
Fidelity Service Company, Inc.
Boston, MA
Custodian
The Northern Trust Company
Chicago, IL
AILS-UANN-1211
1.815089.106
(Fidelity Logo)
Fidelity Advisor®
International Small Cap Opportunities
Fund - Institutional Class
Annual Report
October 31, 2011
(Fidelity Cover Art)
Institutional Class
is a class of Fidelity®
International Small Cap
Opportunities Fund
Contents
Chairman's Message | (Click Here) | The Chairman's message to shareholders. |
Performance | (Click Here) | How the fund has done over time. |
Management's Discussion of Fund Performance | (Click Here) | The Portfolio Manager's review of fundperformance and strategy. |
Shareholder Expense Example | (Click Here) | An example of shareholder expenses. |
Investment Changes | (Click Here) | A summary of major shifts in the fund's investments over the past six months. |
Investments | (Click Here) | A complete list of the fund's investments with their market values. |
Financial Statements | (Click Here) | Statements of assets and liabilities, operations, and changes in net assets, as well as financial highlights. |
Notes | (Click Here) | Notes to the financial statements. |
Report of Independent Registered Public Accounting Firm | (Click Here) | |
Trustees and Officers | (Click Here) | |
Distributions | (Click Here) | |
Board Approval of Investment Advisory Contracts and Management Fees | (Click Here) | |
To view a fund's proxy voting guidelines and proxy voting record for the 12-month period ended June 30, visit http://www.fidelity.com/proxyvotingresults or visit the Securities and Exchange Commission's (SEC) web site at http://www.sec.gov. You may also call 1-877-208-0098 to request a free copy of the proxy voting guidelines.
Standard & Poor's, S&P and S&P 500 are registered service marks of The McGraw-Hill Companies, Inc. and have been licensed for use by Fidelity Distributors Corporation.
Other third party marks appearing herein are the property of their respective owners.
All other marks appearing herein are registered or unregistered trademarks or service marks of FMR LLC or an affiliated company.
Annual Report
This report and the financial statements contained herein are submitted for the general information of the shareholders of the fund. This report is not authorized for distribution to prospective investors in the fund unless preceded or accompanied by an effective prospectus.
A fund files its complete schedule of portfolio holdings with the SEC for the first and third quarters of each fiscal year on Form N-Q. Forms N-Q are available on the SEC's web site at http://www.sec.gov. A fund's Forms N-Q may be reviewed and copied at the SEC's Public Reference Room in Washington, DC. Information regarding the operation of the SEC's Public Reference Room may be obtained by calling 1-800-SEC-0330. For a complete list of a fund's portfolio holdings, view the most recent holdings listing, semiannual report, or annual report on Fidelity's web site at http://www.fidelity.com, http://www.advisor.fidelity.com, or http://www.401k.com, as applicable.
NOT FDIC INSURED • MAY LOSE VALUE • NO BANK GUARANTEE
Neither the fund nor Fidelity Distributors Corporation is a bank.
Annual Report
(Acting Chairman's Photograph)
Dear Shareholder:
Global equity markets began the fourth quarter on a strong note, sharply reversing course in October amid strong corporate earnings, better-than-expected economic news and the promise of a resolution to the sovereign debt crisis in Europe. The mini rally followed a third quarter marked by a significant downturn in July and August, which heightened investor anxiety and set off a wave of volatility that hampered most major asset classes through the end of September. Financial markets are difficult to predict, of course, but you can help put the odds in your favor by following these time-tested investment principles.
One of the basic tenets is to invest according to your time horizon. For long-term investors, riding out the markets' inevitable ups and downs has proven much more effective than making decisions based on short-term developments. If your goal is approaching, you can also benefit from patience and restraint, rather than attempting to time the market. No matter your time horizon, missing only a few of the markets' best days can significantly diminish returns. Patience also affords the benefits of compounding - earning interest on additional income or reinvested dividends and capital gains. While staying the course doesn't eliminate risk, it can considerably lessen the negative impact of short-term downturns.
Asset allocation is another principle to manage risk. As you spread your portfolio among the asset classes, be sure to consider your time horizon, risk tolerance and investment objectives. Younger investors may be better served by emphasizing equities, which historically have been the best-performing asset class over time. Investors who are nearing a specific goal, such as retirement or sending a child to college, may choose to favor bonds and other investments that have tended to be more stable. Studies indicate that asset allocation is the single most important determinant of a portfolio's long-term success. After deciding on a suitable allocation strategy, make sure your portfolio is adequately diversified, with exposure to stocks of small-, mid- and large-cap companies in a range of sectors, for example. And today, more than ever, geographic diversification should be taken into account.
Lastly, investing a certain amount of money on a regular basis - a principle known as dollar-cost averaging - can help lower the average cost of your purchases, while also giving you the discipline to avoid selling weak performers just prior to an upswing, or chasing a hot performer just before a correction.
We invite you to learn more by visiting us on the Internet, dropping by one of our Investor Centers or calling us by phone. It is our privilege to provide the resources you need to choose investments that are right for you.
Sincerely,
(Acting Chairman's Signature)
James C. Curvey
Acting Chairman
Annual Report
Average annual total return reflects the change in the value of an investment, assuming reinvestment of the class' distributions from dividend income and capital gains (the profits earned upon the sale of securities that have grown in value, if any) and assuming a constant rate of performance each year. The $10,000 table and the fund's returns do not reflect the deduction of taxes that a shareholder would pay on fund distributions or the redemption of fund shares. During periods of reimbursement by Fidelity, a fund's total return will be greater than it would be had the reimbursement not occurred. How a fund did yesterday is no guarantee of how it will do tomorrow.
Average Annual Total Returns
Periods ended October 31, 2011 | Past 1
year | Past 5
years | Life of
fund A |
Institutional Class | 1.13% | -4.08% | 2.34% |
A From August 2, 2005.
$10,000 Over Life of Class
Let's say hypothetically that $10,000 was invested in Fidelity Advisor® International Small Cap Opportunities Fund - Institutional Class on August 2, 2005, when the fund started. The chart shows how the value of your investment would have changed, and also shows how the MSCI® EAFE® (Europe, Australasia, Far East) Small Cap Index performed over the same period.
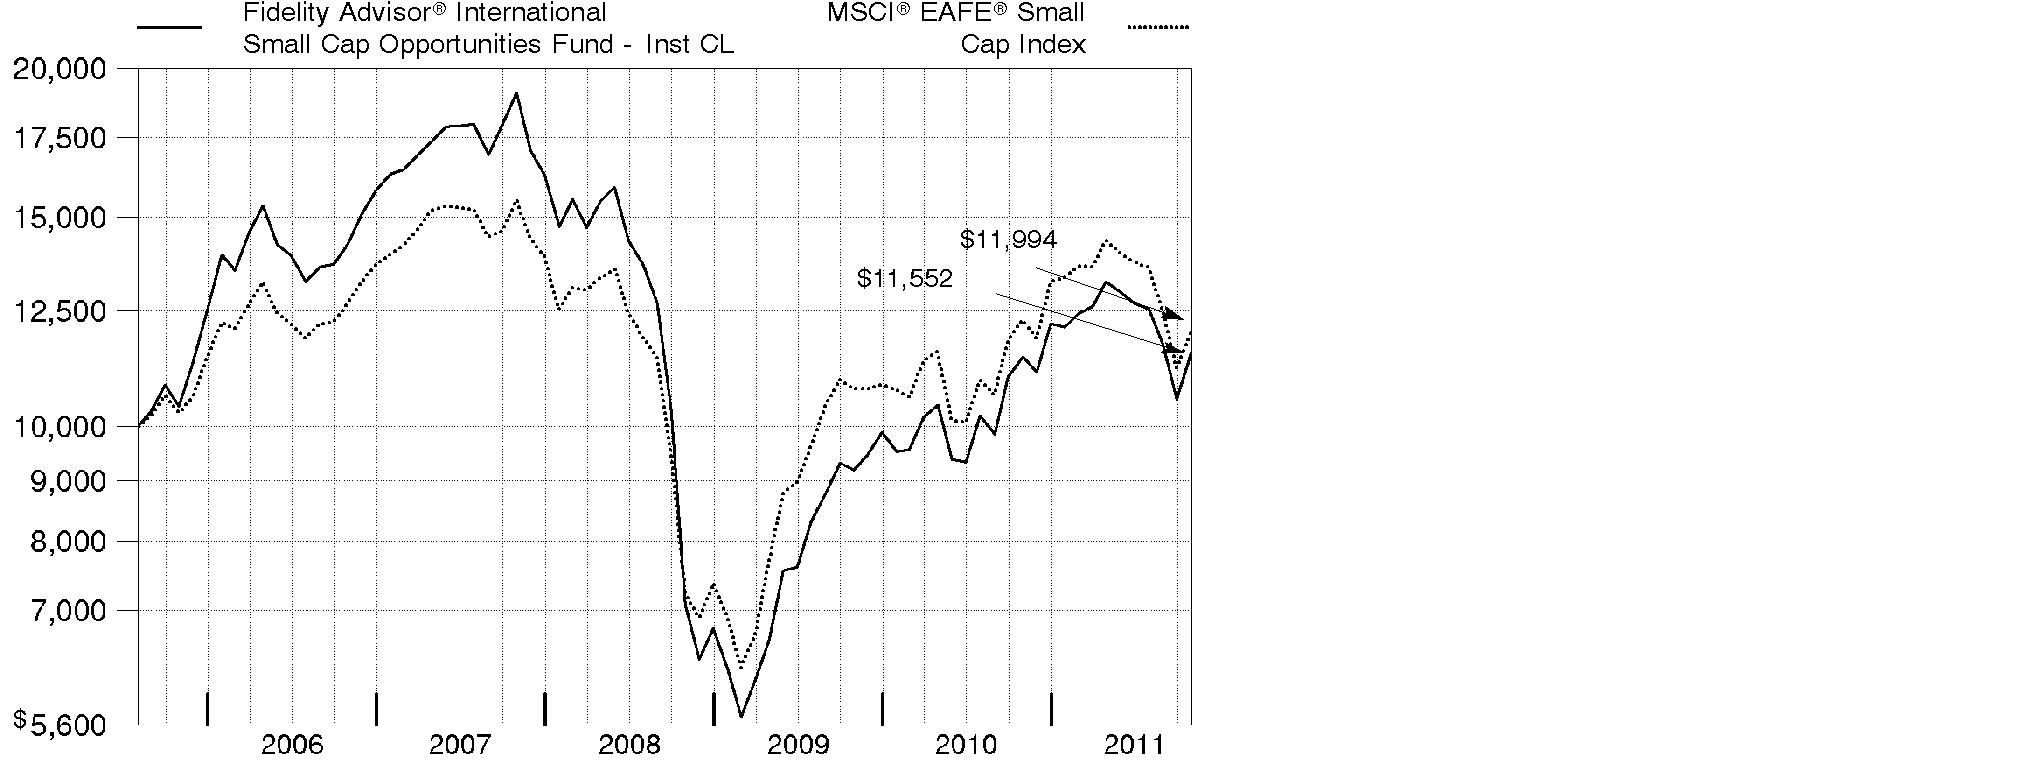
Annual Report
Market Recap: International equities were rocked by a number of headline events during the year ending October 31, 2011. Stocks posted a solid advance for the first half of the period, despite concern about the sovereign debt crisis in Europe, a devastating earthquake and tsunami in Japan, and political upheaval in the Middle East and North Africa. Sentiment turned decidedly negative in the second half, however, as fresh worries about Europe, inflation in China and a dimmed outlook for global growth caused foreign markets to suffer declines that intensified in August and September. October brought with it yet another dramatic swing, as eurozone policymakers appeared near a resolution to the debt debacle and buyers stormed back onto the scene in search of bargains. Still, those gains - along with favorable currency fluctuations overall - weren't enough to offset prior losses, and the MSCI® ACWI® (All Country World Index) ex USA Index finished the period down 4.56%. Within the MSCI index, Europe and emerging markets suffered the biggest declines, with many countries in these areas sustaining steep losses. By contrast, Japan showed resilience in the wake of its natural disasters, falling only 2%. Australia (+4%), Switzerland (+3%), the U.K. (+2%) and Canada, which produced a nominal return, were among the few major benchmark components to break into positive territory.
Comments from Jed Weiss, Portfolio Manager of Fidelity Advisor® International Small Cap Opportunities Fund: For the year, the fund's Institutional Class shares returned 1.13%, respectively (excluding sales charges), versus -2.39% for the MSCI® EAFE® (Europe, Australasia, Far East) Small Cap Index. Security selection in continental Europe - especially Finland and Germany - helped, as did out-of-index stock picking in the U.S. In emerging markets, my positioning in non-index Turkey and benchmark component South Africa hurt the most. Out-of-benchmark security selection in Canada also was negative. In terms of sectors, good security selection in industrials and consumer discretionary, along with a favorable stance in consumer staples and information technology, helped, while relatively weak stock picking in energy and positioning in utilities hurt. The top individual contributor was U.S.-based PriceSmart, a dominant warehouse club retailer in Central America. Railroad Kansas City Southern (U.S.), bank Aozora (Japan) and seismic solutions business ION Geophysical (U.S.) also helped. On the negative side, the fund was hurt by Canadian energy firms Petrobank Energy & Resources, which I sold before period end, and Niko Resources. Italian asset manager Azimut Holdings, the only index component I've mentioned, also hurt.
The views expressed above reflect those of the portfolio manager(s) only through the end of the period as stated on the cover of this report and do not necessarily represent the views of Fidelity or any other person in the Fidelity organization. Any such views are subject to change at any time based upon market or other conditions and Fidelity disclaims any responsibility to update such views. These views may not be relied on as investment advice and, because investment decisions for a Fidelity fund are based on numerous factors, may not be relied on as an indication of trading intent on behalf of any Fidelity fund.
Annual Report
Shareholder Expense Example
As a shareholder of the Fund, you incur two types of costs: (1) transaction costs, including sales charges (loads) on purchase payments or redemption proceeds, redemption fees, and (2) ongoing costs, including management fees, distribution and/or service (12b-1) fees and other Fund expenses. This Example is intended to help you understand your ongoing costs (in dollars) of investing in the Fund and to compare these costs with the ongoing costs of investing in other mutual funds.
The Example is based on an investment of $1,000 invested at the beginning of the period and held for the entire period (May 1, 2011 to October 31, 2011).
Actual Expenses
The first line of the accompanying table for each class of the Fund provides information about actual account values and actual expenses. You may use the information in this line, together with the amount you invested, to estimate the expenses that you paid over the period. Simply divide your account value by $1,000.00 (for example, an $8,600 account value divided by $1,000.00 = 8.6), then multiply the result by the number in the first line for a class of the Fund under the heading entitled "Expenses Paid During Period" to estimate the expenses you paid on your account during this period. A small balance maintenance fee of $12.00 that is charged once a year may apply for certain accounts with a value of less than $2,000. This fee is not included in the table below. If it was, the estimate of expenses you paid during the period would be higher, and your ending account value lower, by this amount. In addition, the Fund, as a shareholder in the underlying Fidelity Central Funds, will indirectly bear its pro-rata share of the fees and expenses incurred by the underlying Fidelity Central Funds. These fees and expenses are not included in the Fund's annualized expense ratio used to calculate the expense estimate in the table below.
Hypothetical Example for Comparison Purposes
The second line of the accompanying table for each class of the Fund provides information about hypothetical account values and hypothetical expenses based on a Class' actual expense ratio and an assumed rate of return of 5% per year before expenses, which is not the Class' actual return. The hypothetical account values and expenses may not be used to estimate the actual ending account balance or expenses you paid for the period. You may use this information to compare the ongoing costs of investing in the Fund and other funds. To do so, compare this 5% hypothetical example with the 5% hypothetical examples that appear in the shareholder reports of the other funds. A small balance maintenance fee of $12.00 that is charged once a year may apply for certain accounts with a value of less than $2,000. This fee is not included in the table below. If it was, the estimate of expenses you paid during the period would be higher, and your ending account value lower, by this amount. In addition, the Fund, as a shareholder in the underlying Fidelity Central Funds, will indirectly bear its pro-rata share of the fees and expenses incurred by the underlying Fidelity Central Funds. These fees and expenses are not included in the Fund's annualized expense ratio used to calculate the expense estimate in the table below.
Please note that the expenses shown in the table are meant to highlight your ongoing costs only and do not reflect any transaction costs. Therefore, the second line of the table is useful in comparing ongoing costs only, and will not help you determine the relative total costs of owning different funds. In addition, if these transactional costs were included, your costs would have been higher.
Annual Report
| Annualized Expense Ratio | Beginning
Account Value
May 1, 2011 | Ending
Account Value
October 31, 2011 | Expenses Paid
During Period*
May 1, 2011 to
October 31, 2011 |
Class A | 1.36% | | | |
Actual | | $ 1,000.00 | $ 872.10 | $ 6.42 |
HypotheticalA | | $ 1,000.00 | $ 1,018.35 | $ 6.92 |
Class T | 1.62% | | | |
Actual | | $ 1,000.00 | $ 871.10 | $ 7.64 |
HypotheticalA | | $ 1,000.00 | $ 1,017.04 | $ 8.24 |
Class B | 2.11% | | | |
Actual | | $ 1,000.00 | $ 868.90 | $ 9.94 |
HypotheticalA | | $ 1,000.00 | $ 1,014.57 | $ 10.71 |
Class C | 2.11% | | | |
Actual | | $ 1,000.00 | $ 868.80 | $ 9.94 |
HypotheticalA | | $ 1,000.00 | $ 1,014.57 | $ 10.71 |
International Small Cap Opportunities | 1.10% | | | |
Actual | | $ 1,000.00 | $ 873.20 | $ 5.19 |
HypotheticalA | | $ 1,000.00 | $ 1,019.66 | $ 5.60 |
Institutional Class | 1.07% | | | |
Actual | | $ 1,000.00 | $ 873.30 | $ 5.05 |
HypotheticalA | | $ 1,000.00 | $ 1,019.81 | $ 5.45 |
A 5% return per year before expenses
* Expenses are equal to each Class' annualized expense ratio, multiplied by the average account value over the period, multiplied by 184/365 (to reflect the one-half year period).
Annual Report
Investment Changes (Unaudited)
Geographic Diversification (% of fund's net assets) |
As of October 31, 2011 |
| Japan 20.9% | |
| United Kingdom 16.7% | |
| United States of America 14.6% | |
| Canada 4.8% | |
| Brazil 4.7% | |
| Germany 4.3% | |
| France 3.8% | |
| Finland 2.4% | |
| South Africa 2.2% | |
| Other 25.6% | |
Percentages are adjusted for the effect of futures contracts, if applicable. |
As of April 30, 2011 |
| Japan 20.2% | |
| United Kingdom 16.2% | |
| United States of America 12.4% | |
| Canada 4.9% | |
| Brazil 4.8% | |
| France 3.9% | |
| Germany 3.6% | |
| Netherlands 3.2% | |
| Finland 3.0% | |
| Other 27.8% | |
Percentages are adjusted for the effect of futures contracts, if applicable. |
Asset Allocation |
| % of fund's
net assets | % of fund's net assets
6 months ago |
Stocks and Investment Companies | 97.9 | 98.4 |
Short-Term Investments and Net Other Assets | 2.1 | 1.6 |
Top Ten Stocks as of October 31, 2011 |
| % of fund's
net assets | % of fund's net assets
6 months ago |
PriceSmart, Inc. (United States of America, Food & Staples Retailing) | 2.0 | 1.5 |
USS Co. Ltd. (Japan, Specialty Retail) | 1.8 | 1.5 |
Osaka Securities Exchange Co. Ltd. (Japan, Diversified Financial Services) | 1.6 | 1.3 |
Kobayashi Pharmaceutical Co. Ltd. (Japan, Personal Products) | 1.6 | 1.3 |
Spirax-Sarco Engineering PLC (United Kingdom, Machinery) | 1.5 | 1.2 |
Meggitt PLC (United Kingdom, Aerospace & Defense) | 1.4 | 1.0 |
Bank Sarasin & Co. Ltd. Series B (Reg.) (Switzerland, Capital Markets) | 1.4 | 1.0 |
Prosegur Compania de Seguridad SA (Reg.) (Spain, Commercial Services & Supplies) | 1.4 | 1.2 |
Outotec Oyj (Finland, Construction & Engineering) | 1.3 | 1.3 |
Andritz AG (Austria, Machinery) | 1.3 | 1.3 |
| 15.3 | |
Market Sectors as of October 31, 2011 |
| % of fund's
net assets | % of fund's net assets
6 months ago |
Industrials | 22.4 | 23.0 |
Consumer Discretionary | 18.6 | 18.1 |
Financials | 16.4 | 17.7 |
Materials | 11.8 | 11.1 |
Consumer Staples | 9.9 | 8.4 |
Information Technology | 8.2 | 8.5 |
Health Care | 5.8 | 5.6 |
Energy | 4.8 | 5.6 |
Utilities | 0.0 | 0.4 |
Annual Report
Investments October 31, 2011
Showing Percentage of Net Assets
Common Stocks - 97.9% |
| Shares | | Value |
Australia - 1.7% |
MAp Group unit | 1,015,958 | | $ 3,625,576 |
OZ Minerals Ltd. | 138,943 | | 1,668,695 |
Ramsay Health Care Ltd. | 43,346 | | 852,149 |
TOTAL AUSTRALIA | | 6,146,420 |
Austria - 1.9% |
Andritz AG | 52,800 | | 4,678,667 |
Zumtobel AG | 113,981 | | 2,377,116 |
TOTAL AUSTRIA | | 7,055,783 |
Bailiwick of Guernsey - 0.7% |
Resolution Ltd. | 575,273 | | 2,544,174 |
Bailiwick of Jersey - 1.6% |
Informa PLC | 485,236 | | 2,828,012 |
Randgold Resources Ltd. sponsored ADR | 27,300 | | 2,991,261 |
TOTAL BAILIWICK OF JERSEY | | 5,819,273 |
Belgium - 1.2% |
Gimv NV | 34,800 | | 1,779,502 |
Umicore SA | 63,474 | | 2,733,194 |
TOTAL BELGIUM | | 4,512,696 |
Bermuda - 1.3% |
Aquarius Platinum Ltd. (Australia) | 406,589 | | 1,192,875 |
Lazard Ltd. Class A | 34,899 | | 954,139 |
Trinity Ltd. | 2,952,000 | | 2,675,575 |
TOTAL BERMUDA | | 4,822,589 |
Brazil - 4.7% |
Arezzo Industria e Comercio SA | 129,700 | | 1,714,529 |
Banco ABC Brasil SA | 260,300 | | 1,735,636 |
Banco Pine SA | 148,900 | | 989,372 |
BR Malls Participacoes SA | 83,500 | | 902,006 |
Braskem SA Class A sponsored ADR (d) | 217,200 | | 3,918,288 |
Cia.Hering SA | 39,600 | | 884,382 |
Iguatemi Empresa de Shopping Centers SA | 46,700 | | 904,792 |
Multiplan Empreendimentos Imobiliarios SA | 84,600 | | 1,710,524 |
Odontoprev SA | 131,500 | | 2,069,142 |
Restoque Comercio e Confeccoes de Roupas SA | 26,200 | | 411,950 |
T4F Entretenimento SA | 131,800 | | 921,034 |
Totvs SA | 58,800 | | 975,891 |
TOTAL BRAZIL | | 17,137,546 |
Common Stocks - continued |
| Shares | | Value |
Canada - 4.8% |
Agnico-Eagle Mines Ltd. (Canada) | 40,760 | | $ 1,768,032 |
Eldorado Gold Corp. | 127,800 | | 2,401,258 |
Fairfax Financial Holdings Ltd. (sub. vtg.) | 7,790 | | 3,256,116 |
Niko Resources Ltd. | 67,600 | | 3,718,220 |
Open Text Corp. (a) | 29,500 | | 1,805,482 |
Pan American Silver Corp. | 28,900 | | 808,044 |
Petrominerales Ltd. | 42,879 | | 1,131,281 |
Quadra FNX Mining Ltd. (a) | 75,200 | | 867,533 |
TAG Oil Ltd. (a) | 142,000 | | 880,333 |
Tuscany International Drilling, Inc. (a) | 1,139,200 | | 777,104 |
TOTAL CANADA | | 17,413,403 |
Cayman Islands - 1.6% |
China Lilang Ltd. | 1,309,000 | | 1,377,892 |
Intime Department Store Group Co. Ltd. | 563,000 | | 807,944 |
NVC Lighting Holdings Ltd. | 4,329,000 | | 1,879,620 |
Vantage Drilling Co. (a) | 625,331 | | 850,450 |
Wynn Macau Ltd. | 337,200 | | 944,793 |
TOTAL CAYMAN ISLANDS | | 5,860,699 |
Denmark - 0.8% |
William Demant Holding A/S (a) | 36,533 | | 2,914,894 |
Finland - 2.4% |
Metso Corp. | 25,700 | | 1,000,834 |
Nokian Tyres PLC | 82,500 | | 3,031,260 |
Outotec Oyj | 100,200 | | 4,684,164 |
TOTAL FINLAND | | 8,716,258 |
France - 3.8% |
Audika SA | 95,384 | | 2,109,391 |
Laurent-Perrier Group | 23,963 | | 2,470,599 |
Remy Cointreau SA | 38,298 | | 3,148,236 |
Saft Groupe SA | 92,419 | | 2,813,770 |
Vetoquinol SA | 28,212 | | 929,994 |
Virbac SA | 13,600 | | 2,354,136 |
TOTAL FRANCE | | 13,826,126 |
Germany - 4.3% |
alstria office REIT-AG | 135,300 | | 1,739,475 |
Bilfinger Berger AG | 36,159 | | 3,241,620 |
CompuGROUP Holding AG | 67,000 | | 862,308 |
CTS Eventim AG | 137,426 | | 4,550,148 |
Common Stocks - continued |
| Shares | | Value |
Germany - continued |
Fielmann AG (d) | 30,537 | | $ 3,216,420 |
Software AG (Bearer) | 50,281 | | 2,088,908 |
TOTAL GERMANY | | 15,698,879 |
India - 0.5% |
Apollo Tyres Ltd. | 642,892 | | 753,948 |
Jyothy Laboratories Ltd. | 433,677 | | 1,269,440 |
TOTAL INDIA | | 2,023,388 |
Ireland - 1.0% |
James Hardie Industries NV: | | | |
CDI (a) | 40,000 | | 259,101 |
sponsored ADR (a) | 102,775 | | 3,332,993 |
TOTAL IRELAND | | 3,592,094 |
Israel - 1.0% |
Azrieli Group | 72,005 | | 1,852,664 |
Ituran Location & Control Ltd. | 140,286 | | 1,867,207 |
TOTAL ISRAEL | | 3,719,871 |
Italy - 1.5% |
Azimut Holding SpA | 291,773 | | 2,281,383 |
Interpump Group SpA | 512,558 | | 3,301,217 |
TOTAL ITALY | | 5,582,600 |
Japan - 20.9% |
Air Water, Inc. | 62,000 | | 787,141 |
Aozora Bank Ltd. (d) | 1,120,000 | | 2,831,751 |
Asahi Co. Ltd. (d) | 58,000 | | 1,285,102 |
Autobacs Seven Co. Ltd. | 83,300 | | 3,814,879 |
Daikoku Denki Co. Ltd. | 128,700 | | 1,152,515 |
Daikokutenbussan Co. Ltd. | 109,200 | | 3,134,401 |
FCC Co. Ltd. | 149,300 | | 3,154,839 |
GCA Savvian Group Corp. (d) | 1,109 | | 1,298,210 |
Glory Ltd. | 60,300 | | 1,290,829 |
Goldcrest Co. Ltd. | 60,400 | | 1,108,271 |
Kamigumi Co. Ltd. | 273,000 | | 2,384,117 |
Kobayashi Pharmaceutical Co. Ltd. | 116,700 | | 5,785,472 |
Kyoto Kimono Yuzen Co. Ltd. | 109,900 | | 1,278,601 |
Meiko Network Japan Co. Ltd. | 120,500 | | 997,877 |
Miraial Co. Ltd. | 39,200 | | 609,201 |
Nabtesco Corp. | 156,400 | | 3,425,851 |
Nagaileben Co. Ltd. | 89,400 | | 1,232,168 |
Common Stocks - continued |
| Shares | | Value |
Japan - continued |
Nihon M&A Center, Inc. | 410 | | $ 2,314,525 |
Nihon Parkerizing Co. Ltd. | 157,000 | | 2,113,801 |
Nippon Seiki Co. Ltd. | 186,000 | | 1,868,967 |
Nippon Thompson Co. Ltd. | 537,000 | | 3,459,214 |
Obic Co. Ltd. | 16,030 | | 3,031,023 |
Osaka Securities Exchange Co. Ltd. | 1,276 | | 5,980,182 |
OSG Corp. | 90,300 | | 1,157,270 |
Seven Bank Ltd. | 594 | | 1,057,196 |
SHO-BOND Holdings Co. Ltd. | 98,200 | | 2,190,832 |
Shoei Co. Ltd. | 80,300 | | 540,394 |
The Nippon Synthetic Chemical Industry Co. Ltd. | 323,000 | | 1,794,495 |
Tsumura & Co. | 82,900 | | 2,331,871 |
Tsutsumi Jewelry Co. Ltd. | 43,900 | | 1,023,100 |
USS Co. Ltd. | 80,540 | | 6,659,028 |
Yamatake Corp. | 56,000 | | 1,239,082 |
Yamato Kogyo Co. Ltd. | 161,700 | | 4,090,648 |
TOTAL JAPAN | | 76,422,853 |
Korea (South) - 0.3% |
NCsoft Corp. | 3,895 | | 1,219,916 |
Luxembourg - 0.5% |
GlobeOp Financial Services SA | 367,600 | | 1,684,847 |
Netherlands - 1.6% |
Aalberts Industries NV | 177,200 | | 3,137,680 |
ASM International NV unit | 46,800 | | 1,320,696 |
QIAGEN NV (a)(d) | 109,200 | | 1,504,776 |
TOTAL NETHERLANDS | | 5,963,152 |
Papua New Guinea - 0.3% |
Oil Search Ltd. | 143,966 | | 982,258 |
Philippines - 0.4% |
Jollibee Food Corp. | 671,660 | | 1,427,287 |
Portugal - 0.7% |
Jeronimo Martins SGPS SA | 146,700 | | 2,537,727 |
Singapore - 0.3% |
Wing Tai Holdings Ltd. | 917,000 | | 929,875 |
South Africa - 2.2% |
African Rainbow Minerals Ltd. | 101,600 | | 2,348,131 |
City Lodge Hotels Ltd. | 4,722 | | 37,484 |
Clicks Group Ltd. | 390,659 | | 2,050,193 |
Common Stocks - continued |
| Shares | | Value |
South Africa - continued |
JSE Ltd. | 199,281 | | $ 1,764,735 |
Mr Price Group Ltd. | 207,500 | | 1,997,530 |
TOTAL SOUTH AFRICA | | 8,198,073 |
Spain - 1.5% |
Grifols SA (a) | 30,332 | | 566,053 |
Prosegur Compania de Seguridad SA (Reg.) | 101,209 | | 5,049,276 |
TOTAL SPAIN | | 5,615,329 |
Sweden - 2.1% |
Fagerhult AB | 85,150 | | 2,004,820 |
Intrum Justitia AB | 186,000 | | 3,059,797 |
Swedish Match Co. | 78,600 | | 2,719,844 |
TOTAL SWEDEN | | 7,784,461 |
Switzerland - 1.4% |
Bank Sarasin & Co. Ltd. Series B (Reg.) | 134,444 | | 5,132,328 |
Turkey - 1.5% |
Albaraka Turk Katilim Bankasi AS | 1,505,000 | | 1,591,602 |
Boyner Buyuk Magazacilik A/S (a) | 547,451 | | 919,513 |
Coca-Cola Icecek AS | 211,000 | | 2,863,848 |
TOTAL TURKEY | | 5,374,963 |
United Arab Emirates - 0.2% |
Dubai Financial Market PJSC (a) | 3,046,397 | | 854,285 |
United Kingdom - 16.7% |
AMEC PLC | 116,340 | | 1,731,592 |
Babcock International Group PLC | 299,700 | | 3,395,532 |
Bellway PLC | 203,172 | | 2,319,863 |
Britvic PLC | 556,200 | | 2,950,892 |
Dechra Pharmaceuticals PLC | 247,100 | | 1,947,192 |
Derwent London PLC | 57,900 | | 1,581,089 |
Great Portland Estates PLC | 417,489 | | 2,500,315 |
H&T Group PLC | 336,803 | | 1,684,521 |
InterContinental Hotel Group PLC ADR | 113,600 | | 2,099,328 |
Johnson Matthey PLC | 105,089 | | 3,175,588 |
Meggitt PLC | 836,669 | | 5,174,913 |
Micro Focus International PLC | 291,800 | | 1,593,650 |
Persimmon PLC | 221,563 | | 1,773,393 |
Rotork PLC | 97,500 | | 2,640,504 |
Serco Group PLC | 450,476 | | 3,763,546 |
Shaftesbury PLC | 301,232 | | 2,441,584 |
Common Stocks - continued |
| Shares | | Value |
United Kingdom - continued |
Spectris PLC | 124,487 | | $ 2,546,544 |
Spirax-Sarco Engineering PLC | 174,230 | | 5,374,172 |
Ted Baker PLC | 139,000 | | 1,724,051 |
Ultra Electronics Holdings PLC | 101,869 | | 2,608,106 |
Unite Group PLC | 1,474,170 | | 4,191,504 |
Victrex PLC | 188,582 | | 3,851,625 |
TOTAL UNITED KINGDOM | | 61,069,504 |
United States of America - 12.5% |
ANSYS, Inc. (a) | 19,285 | | 1,048,333 |
Autoliv, Inc. (d) | 54,900 | | 3,171,573 |
Broadridge Financial Solutions, Inc. | 48,705 | | 1,083,686 |
Cymer, Inc. (a) | 77,700 | | 3,376,065 |
Dril-Quip, Inc. (a) | 32,852 | | 2,138,665 |
Evercore Partners, Inc. Class A | 52,700 | | 1,446,088 |
Greenhill & Co., Inc. (d) | 21,295 | | 804,525 |
ION Geophysical Corp. (a) | 404,906 | | 3,085,384 |
Juniper Networks, Inc. (a) | 35,200 | | 861,344 |
Kansas City Southern (a) | 61,300 | | 3,872,321 |
Lam Research Corp. (a) | 32,003 | | 1,375,809 |
Martin Marietta Materials, Inc. (d) | 24,900 | | 1,797,033 |
Mohawk Industries, Inc. (a) | 86,000 | | 4,527,900 |
Oceaneering International, Inc. | 51,200 | | 2,141,696 |
PriceSmart, Inc. | 96,496 | | 7,337,557 |
ResMed, Inc. (a)(d) | 119,200 | | 3,373,360 |
Solera Holdings, Inc. | 46,600 | | 2,545,758 |
Solutia, Inc. (a) | 55,456 | | 901,160 |
SS&C Technologies Holdings, Inc. (a) | 55,600 | | 881,816 |
TOTAL UNITED STATES OF AMERICA | | 45,770,073 |
TOTAL COMMON STOCKS (Cost $305,074,765) |
358,353,624
|
Money Market Funds - 6.3% |
| Shares | | Value |
Fidelity Cash Central Fund, 0.12% (b) | 8,835,562 | | $ 8,835,562 |
Fidelity Securities Lending Cash Central Fund, 0.11% (b)(c) | 14,278,561 | | 14,278,561 |
TOTAL MONEY MARKET FUNDS (Cost $23,114,123) |
23,114,123
|
TOTAL INVESTMENT PORTFOLIO - 104.2% (Cost $328,188,888) | | 381,467,747 |
NET OTHER ASSETS (LIABILITIES) - (4.2)% | | (15,231,283) |
NET ASSETS - 100% | $ 366,236,464 |
Legend |
(a) Non-income producing |
(b) Affiliated fund that is available only to investment companies and other accounts managed by Fidelity Investments. The rate quoted is the annualized seven-day yield of the fund at period end. A complete unaudited listing of the fund's holdings as of its most recent quarter end is available upon request. In addition, each Fidelity Central Fund's financial statements, which are not covered by the Fund's Report of Independent Registered Public Accounting Firm, are available on the SEC's website or upon request. |
(c) Investment made with cash collateral received from securities on loan. |
(d) Security or a portion of the security is on loan at period end. |
Affiliated Central Funds |
Information regarding fiscal year to date income earned by the Fund from investments in Fidelity Central Funds is as follows: |
Fund | Income earned |
Fidelity Cash Central Fund | $ 13,915 |
Fidelity Securities Lending Cash Central Fund | 208,963 |
Total | $ 222,878 |
Other Information |
The following is a summary of the inputs used, as of October 31, 2011, involving the Fund's assets and liabilities carried at fair value. The inputs or methodology used for valuing securities may not be an indication of the risk associated with investing in those securities. For more information on valuation inputs, and their aggregation into the levels used in the table below, please refer to the Security Valuation section in the accompanying Notes to Financial Statements. |
Valuation Inputs at Reporting Date: |
Description | Total | Level 1 | Level 2 | Level 3 |
Investments in Securities: | | | | |
Equities: | | | | |
Japan | $ 76,422,853 | $ - | $ 76,422,853 | $ - |
United Kingdom | 61,069,504 | 61,069,504 | - | - |
United States of America | 45,770,073 | 45,770,073 | - | - |
Canada | 17,413,403 | 17,413,403 | - | - |
Brazil | 17,137,546 | 17,137,546 | - | - |
Germany | 15,698,879 | 15,698,879 | - | - |
France | 13,826,126 | 13,826,126 | - | - |
Finland | 8,716,258 | 8,716,258 | - | - |
South Africa | 8,198,073 | 8,198,073 | - | - |
Other | 94,100,909 | 73,661,252 | 20,439,657 | - |
Money Market Funds | 23,114,123 | 23,114,123 | - | - |
Total Investments in Securities: | $ 381,467,747 | $ 284,605,237 | $ 96,862,510 | $ - |
Transfers from Level 1 to Level 2 during the period were $99,465,787. |
Income Tax Information |
At October 31, 2011, the Fund had a capital loss carryforward of approximately $368,117,127 of which $37,615,219 and $330,501,908 will expire in fiscal 2016 and 2017, respectively. Capital loss carryforwards are only available to offset future capital gains of the Fund to the extent provided by regulations and may be limited. |
See accompanying notes which are an integral part of the financial statements.
Annual Report
Statement of Assets and Liabilities
| October 31, 2011 |
| | |
Assets | | |
Investment in securities, at value (including securities loaned of $13,325,034) - See accompanying schedule: Unaffiliated issuers (cost $305,074,765) | $ 358,353,624 | |
Fidelity Central Funds (cost $23,114,123) | 23,114,123 | |
Total Investments (cost $328,188,888) | | $ 381,467,747 |
Foreign currency held at value (cost $99,744) | | 99,510 |
Receivable for investments sold | | 195,546 |
Receivable for fund shares sold | | 166,806 |
Dividends receivable | | 961,741 |
Distributions receivable from Fidelity Central Funds | | 3,492 |
Prepaid expenses | | 1,455 |
Other receivables | | 12,370 |
Total assets | | 382,908,667 |
| | |
Liabilities | | |
Payable for investments purchased | $ 1,485,984 | |
Payable for fund shares redeemed | 489,719 | |
Accrued management fee | 235,802 | |
Distribution and service plan fees payable | 14,845 | |
Other affiliated payables | 105,135 | |
Other payables and accrued expenses | 62,157 | |
Collateral on securities loaned, at value | 14,278,561 | |
Total liabilities | | 16,672,203 |
| | |
Net Assets | | $ 366,236,464 |
Net Assets consist of: | | |
Paid in capital | | $ 678,939,230 |
Undistributed net investment income | | 4,428,178 |
Accumulated undistributed net realized gain (loss) on investments and foreign currency transactions | | (370,400,713) |
Net unrealized appreciation (depreciation) on investments and assets and liabilities in foreign currencies | | 53,269,769 |
Net Assets | | $ 366,236,464 |
See accompanying notes which are an integral part of the financial statements.
Annual Report
Financial Statements - continued
Statement of Assets and Liabilities - continued
| October 31, 2011 |
| | |
Calculation of Maximum Offering Price | | |
Class A:
Net Asset Value and redemption price per share ($18,686,336 ÷ 1,916,318 shares) | | $ 9.75 |
| | |
Maximum offering price per share (100/94.25 of $9.75) | | $ 10.34 |
Class T:
Net Asset Value and redemption price per share ($8,700,526 ÷ 900,706 shares) | | $ 9.66 |
| | |
Maximum offering price per share (100/96.50 of $9.66) | | $ 10.01 |
Class B:
Net Asset Value and offering price per share ($2,292,585 ÷ 241,853 shares)A | | $ 9.48 |
| | |
Class C:
Net Asset Value and offering price per share ($6,899,707 ÷ 728,884 shares)A | | $ 9.47 |
| | |
International Small Cap Opportunities:
Net Asset Value, offering price and redemption price per share ($328,261,845 ÷ 33,341,584 shares) | | $ 9.85 |
| | |
Institutional Class:
Net Asset Value, offering price and redemption price per share ($1,395,465 ÷ 141,546 shares) | | $ 9.86 |
A Redemption price per share is equal to net asset value less any applicable contingent deferred sales charge.
See accompanying notes which are an integral part of the financial statements.
Annual Report
Statement of Operations
| Year ended October 31, 2011 |
| | |
Investment Income | | |
Dividends | | $ 9,529,575 |
Special dividends | | 2,725,226 |
Income from Fidelity Central Funds | | 222,878 |
Income before foreign taxes withheld | | 12,477,679 |
Less foreign taxes withheld | | (650,585) |
Total income | | 11,827,094 |
| | |
Expenses | | |
Management fee
Basic fee | $ 3,680,170 | |
Performance adjustment | (837,875) | |
Transfer agent fees | 1,267,212 | |
Distribution and service plan fees | 216,627 | |
Accounting and security lending fees | 225,859 | |
Custodian fees and expenses | 123,008 | |
Independent trustees' compensation | 2,387 | |
Registration fees | 82,117 | |
Audit | 71,269 | |
Legal | 1,734 | |
Miscellaneous | 4,640 | |
Total expenses before reductions | 4,837,148 | |
Expense reductions | (53,631) | 4,783,517 |
Net investment income (loss) | | 7,043,577 |
Realized and Unrealized Gain (Loss) Net realized gain (loss) on: | | |
Investment securities: | | |
Unaffiliated issuers | 54,342,117 | |
Foreign currency transactions | (320,338) | |
Total net realized gain (loss) | | 54,021,779 |
Change in net unrealized appreciation (depreciation) on: Investment securities | (52,211,455) | |
Assets and liabilities in foreign currencies | (51,097) | |
Total change in net unrealized appreciation (depreciation) | | (52,262,552) |
Net gain (loss) | | 1,759,227 |
Net increase (decrease) in net assets resulting from operations | | $ 8,802,804 |
See accompanying notes which are an integral part of the financial statements.
Annual Report
Financial Statements - continued
Statement of Changes in Net Assets
| Year ended
October 31,
2011 | Year ended
October 31,
2010 |
Increase (Decrease) in Net Assets | | |
Operations | | |
Net investment income (loss) | $ 7,043,577 | $ 3,674,101 |
Net realized gain (loss) | 54,021,779 | 58,487,523 |
Change in net unrealized appreciation (depreciation) | (52,262,552) | 25,253,733 |
Net increase (decrease) in net assets resulting
from operations | 8,802,804 | 87,415,357 |
Distributions to shareholders from net investment income | (6,223,295) | (3,861,178) |
Distributions to shareholders from net realized gain | (1,761,993) | (4,067,493) |
Total distributions | (7,985,288) | (7,928,671) |
Share transactions - net increase (decrease) | (78,669,716) | (8,820,184) |
Redemption fees | 71,408 | 60,781 |
Total increase (decrease) in net assets | (77,780,792) | 70,727,283 |
| | |
Net Assets | | |
Beginning of period | 444,017,256 | 373,289,973 |
End of period (including undistributed net investment income of $4,428,178 and undistributed net investment income of $3,575,839, respectively) | $ 366,236,464 | $ 444,017,256 |
See accompanying notes which are an integral part of the financial statements.
Annual Report
Financial Highlights - Class A
Years ended October 31, | 2011 | 2010 | 2009 | 2008 | 2007 |
Selected Per-Share Data | | | | | |
Net asset value, beginning of period | $ 9.82 | $ 8.07 | $ 6.24 | $ 18.97 | $ 14.18 |
Income from Investment Operations | | | | | |
Net investment income (loss) C | .15 F | .06 | .06 | .02 | .02 |
Net realized and unrealized gain (loss) | (.07) | 1.85 | 1.77 | (10.85) | 4.76 |
Total from investment operations | .08 | 1.91 | 1.83 | (10.83) | 4.78 |
Distributions from net investment income | (.11) | (.07) | - | (.03) | - |
Distributions from net realized gain | (.04) | (.09) | - | (1.88) | - |
Total distributions | (.15) | (.16) | - | (1.90) I | - |
Redemption fees added to paid in capital C | - H | - H | - H | - H | .01 |
Net asset value, end of period | $ 9.75 | $ 9.82 | $ 8.07 | $ 6.24 | $ 18.97 |
Total ReturnA, B | .81% | 24.05% | 29.33% | (62.98)% | 33.78% |
Ratios to Average Net Assets D, G | | | | | |
Expenses before reductions | 1.34% | 1.16% | .94% | 1.75% | 1.63% |
Expenses net of fee waivers, if any | 1.33% | 1.16% | .94% | 1.66% | 1.63% |
Expenses net of all reductions | 1.32% | 1.15% | .89% | 1.62% | 1.59% |
Net investment income (loss) | 1.44% F | .74% | 1.00% | .13% | .10% |
Supplemental Data | | | | | |
Net assets, end of period (000 omitted) | $ 18,686 | $ 20,228 | $ 18,883 | $ 17,905 | $ 70,785 |
Portfolio turnover rate E | 24% | 49% | 174% | 61% | 107% |
A Total returns would have been lower if certain expenses had not been reduced during the applicable periods shown.
B Total returns do not include the effect of the sales charges.
C Calculated based on average shares outstanding during the period.
D Fees and expenses of any underlying Fidelity Central Funds are not included in the Fund's expense ratio. The Fund indirectly bears its proportionate share of the expenses of any underlying Fidelity Central Funds.
E Amount does not include the portfolio activity of any underlying Fidelity Central Funds.
F Investment income per share reflects a special dividend which amounted to $.06 per share. Excluding the special dividend, the ratio of net investment income (loss) to average net assets would have been .80%.
G Expense ratios reflect operating expenses of the class. Expenses before reductions do not reflect amounts reimbursed by the investment adviser or reductions from brokerage service arrangements or reductions from other expense offset arrangements and do not represent the amount paid by the class during periods when reimbursements or reductions occur. Expenses net of fee waivers reflect expenses after reimbursement by the investment adviser but prior to reductions from brokerage service arrangements or other expense offset arrangements. Expenses net of all reductions represent the net expenses paid by the class.
H Amount represents less than $.01 per share.
I Total distributions of $1.90 per share is comprised of distributions from net investment income of $.025 and distributions from net realized gain of $1.878 per share.
See accompanying notes which are an integral part of the financial statements.
Annual Report
Financial Highlights - Class T
Years ended October 31, | 2011 | 2010 | 2009 | 2008 | 2007 |
Selected Per-Share Data | | | | | |
Net asset value, beginning of period | $ 9.72 | $ 8.00 | $ 6.20 | $ 18.85 | $ 14.12 |
Income from Investment Operations | | | | | |
Net investment income (loss) C | .12 F | .04 | .05 | (.02) | (.02) |
Net realized and unrealized gain (loss) | (.06) | 1.83 | 1.75 | (10.78) | 4.74 |
Total from investment operations | .06 | 1.87 | 1.80 | (10.80) | 4.72 |
Distributions from net investment income | (.08) | (.06) | - | - | - |
Distributions from net realized gain | (.04) | (.09) | - | (1.85) | - |
Total distributions | (.12) | (.15) | - | (1.85) I | - |
Redemption fees added to paid in capital C | - H | - H | - H | - H | .01 |
Net asset value, end of period | $ 9.66 | $ 9.72 | $ 8.00 | $ 6.20 | $ 18.85 |
Total Return A, B | .60% | 23.65% | 29.03% | (63.08)% | 33.50% |
Ratios to Average Net Assets D, G | | | | | |
Expenses before reductions | 1.60% | 1.43% | 1.20% | 2.00% | 1.85% |
Expenses net of fee waivers, if any | 1.60% | 1.43% | 1.20% | 1.91% | 1.85% |
Expenses net of all reductions | 1.59% | 1.41% | 1.15% | 1.87% | 1.81% |
Net investment income (loss) | 1.17% F | .48% | .74% | (.12)% | (.13)% |
Supplemental Data | | | | | |
Net assets, end of period (000 omitted) | $ 8,701 | $ 11,202 | $ 11,915 | $ 11,614 | $ 46,568 |
Portfolio turnover rate E | 24% | 49% | 174% | 61% | 107% |
A Total returns would have been lower if certain expenses had not been reduced during the applicable periods shown.
B Total returns do not include the effect of the sales charges.
C Calculated based on average shares outstanding during the period.
D Fees and expenses of any underlying Fidelity Central Funds are not included in the Fund's expense ratio. The Fund indirectly bears its proportionate share of the expenses of any underlying Fidelity Central Funds.
E Amount does not include the portfolio activity of any underlying Fidelity Central Funds.
F Investment income per share reflects a special dividend which amounted to $.06 per share. Excluding the special dividend, the ratio of net investment income (loss) to average net assets would have been .54%.
G Expense ratios reflect operating expenses of the class. Expenses before reductions do not reflect amounts reimbursed by the investment adviser or reductions from brokerage service arrangements or reductions from other expense offset arrangements and do not represent the amount paid by the class during periods when reimbursements or reductions occur. Expenses net of fee waivers reflect expenses after reimbursement by the investment adviser but prior to reductions from brokerage service arrangements or other expense offset arrangements. Expenses net of all reductions represent the net expenses paid by the class.
H Amount represents less than $.01 per share.
I Total distributions of $1.85 per share is comprised of distributions from net realized gain of $1.852 per share.
See accompanying notes which are an integral part of the financial statements.
Annual Report
Financial Highlights - Class B
Years ended October 31, | 2011 | 2010 | 2009 | 2008 | 2007 |
Selected Per-Share Data | | | | | |
Net asset value, beginning of period | $ 9.54 | $ 7.87 | $ 6.12 | $ 18.64 | $ 14.04 |
Income from Investment Operations | | | | | |
Net investment income (loss) C | .07 F | - H | .02 | (.08) | (.11) |
Net realized and unrealized gain (loss) | (.06) | 1.79 | 1.73 | (10.68) | 4.70 |
Total from investment operations | .01 | 1.79 | 1.75 | (10.76) | 4.59 |
Distributions from net investment income | (.06) | (.03) | - | - | - |
Distributions from net realized gain | (.02) | (.09) | - | (1.76) | - |
Total distributions | (.07) J | (.12) | - | (1.76) I | - |
Redemption fees added to paid in capital C | - H | - H | - H | - H | .01 |
Net asset value, end of period | $ 9.48 | $ 9.54 | $ 7.87 | $ 6.12 | $ 18.64 |
Total Return A, B | .10% | 23.03% | 28.59% | (63.32)% | 32.76% |
Ratios to Average Net Assets D, G | | | | | |
Expenses before reductions | 2.09% | 1.91% | 1.69% | 2.51% | 2.40% |
Expenses net of fee waivers, if any | 2.09% | 1.91% | 1.69% | 2.41% | 2.40% |
Expenses net of all reductions | 2.07% | 1.90% | 1.64% | 2.38% | 2.36% |
Net investment income (loss) | .68% F | (.01)% | .25% | (.62)% | (.67)% |
Supplemental Data | | | | | |
Net assets, end of period (000 omitted) | $ 2,293 | $ 2,902 | $ 2,799 | $ 2,687 | $ 10,975 |
Portfolio turnover rate E | 24% | 49% | 174% | 61% | 107% |
A Total returns would have been lower if certain expenses had not been reduced during the applicable periods shown.
B Total returns do not include the effect of the contingent deferred sales charge.
C Calculated based on average shares outstanding during the period.
D Fees and expenses of any underlying Fidelity Central Funds are not included in the Fund's expense ratio. The Fund indirectly bears its proportionate share of the expenses of any underlying Fidelity Central Funds.
E Amount does not include the portfolio activity of any underlying Fidelity Central Funds.
F Investment income per share reflects a special dividend which amounted to $.06 per share. Excluding the special dividend, the ratio of net investment income (loss) to average net assets would have been .05%.
G Expense ratios reflect operating expenses of the class. Expenses before reductions do not reflect amounts reimbursed by the investment adviser or reductions from brokerage service arrangements or reductions from other expense offset arrangements and do not represent the amount paid by the class during periods when reimbursements or reductions occur. Expenses net of fee waivers reflect expenses after reimbursement by the investment adviser but prior to reductions from brokerage service arrangements or other expense offset arrangements. Expenses net of all reductions represent the net expenses paid by the class.
H Amount represents less than $.01 per share.
I Total distributions of $1.76 per share is comprised of distributions from net realized gain of $1.760 per share.
J Total distribution of $.07 per share is comprised of distributions from net investment income of $.058 and distributions from net realized gain of $.015 per share.
See accompanying notes which are an integral part of the financial statements.
Annual Report
Financial Highlights - Class C
Years ended October 31, | 2011 | 2010 | 2009 | 2008 | 2007 |
Selected Per-Share Data | | | | | |
Net asset value, beginning of period | $ 9.53 | $ 7.86 | $ 6.11 | $ 18.63 | $ 14.03 |
Income from Investment Operations | | | | | |
Net investment income (loss) C | .07 F | - H | .02 | (.08) | (.11) |
Net realized and unrealized gain (loss) | (.06) | 1.79 | 1.73 | (10.66) | 4.70 |
Total from investment operations | .01 | 1.79 | 1.75 | (10.74) | 4.59 |
Distributions from net investment income | (.06) | (.03) | - | - | - |
Distributions from net realized gain | (.02) | (.09) | - | (1.78) | - |
Total distributions | (.07) J | (.12) | - | (1.78) I | - |
Redemption fees added to paid in capital C | - H | - H | - H | - H | .01 |
Net asset value, end of period | $ 9.47 | $ 9.53 | $ 7.86 | $ 6.11 | $ 18.63 |
Total Return A, B | .10% | 23.06% | 28.64% | (63.32)% | 32.79% |
Ratios to Average Net Assets D, G | | | | | |
Expenses before reductions | 2.09% | 1.91% | 1.68% | 2.51% | 2.38% |
Expenses net of fee waivers, if any | 2.09% | 1.91% | 1.68% | 2.41% | 2.38% |
Expenses net of all reductions | 2.07% | 1.90% | 1.63% | 2.38% | 2.34% |
Net investment income (loss) | .68% F | (.01)% | .26% | (.62)% | (.66)% |
Supplemental Data | | | | | |
Net assets, end of period (000 omitted) | $ 6,900 | $ 8,936 | $ 8,543 | $ 9,497 | $ 40,894 |
Portfolio turnover rate E | 24% | 49% | 174% | 61% | 107% |
A Total returns would have been lower if certain expenses had not been reduced during the applicable periods shown.
B Total returns do not include the effect of the contingent deferred sales charge.
C Calculated based on average shares outstanding during the period.
D Fees and expenses of any underlying Fidelity Central Funds are not included in the Fund's expense ratio. The Fund indirectly bears its proportionate share of the expenses of any underlying Fidelity Central Funds.
E Amount does not include the portfolio activity of any underlying Fidelity Central Funds.
F Investment income per share reflects a special dividend which amounted to $.06 per share. Excluding the special dividend, the ratio of net investment income (loss) to average net assets would have been .05%.
G Expense ratios reflect operating expenses of the class. Expenses before reductions do not reflect amounts reimbursed by the investment adviser or reductions from brokerage service arrangements or reductions from other expense offset arrangements and do not represent the amount paid by the class during periods when reimbursements or reductions occur. Expenses net of fee waivers reflect expenses after reimbursement by the investment adviser but prior to reductions from brokerage service arrangements or other expense offset arrangements. Expenses net of all reductions represent the net expenses paid by the class.
H Amount represents less than $.01 per share.
I Total distributions of $1.78 per share is comprised of distributions from net realized gain of $1.775 per share.
J Total distributions of $.07 per share is comprised of distribution from net investment income of $.058 and distributions from net realized gain of $.015 per share.
See accompanying notes which are an integral part of the financial statements.
Annual Report
Financial Highlights - International Small Cap Opportunities
Years ended October 31, | 2011 | 2010 | 2009 | 2008 | 2007 |
Selected Per-Share Data | | | | | |
Net asset value, beginning of period | $ 9.92 | $ 8.14 | $ 6.28 | $ 19.09 | $ 14.23 |
Income from Investment Operations | | | | | |
Net investment income (loss) B | .17 E | .09 | .08 | .05 | .07 |
Net realized and unrealized gain (loss) | (.06) | 1.87 | 1.78 | (10.92) | 4.78 |
Total from investment operations | .11 | 1.96 | 1.86 | (10.87) | 4.85 |
Distributions from net investment income | (.14) | (.09) | - G | (.06) | - |
Distributions from net realized gain | (.04) | (.09) | - | (1.88) | - |
Total distributions | (.18) | (.18) | - G | (1.94) H | - |
Redemption fees added to paid in capital B | - G | - G | - G | - G | .01 |
Net asset value, end of period | $ 9.85 | $ 9.92 | $ 8.14 | $ 6.28 | $ 19.09 |
Total Return A | 1.10% | 24.43% | 29.68% | (62.91)% | 34.15% |
Ratios to Average Net Assets C, F | | | | | |
Expenses before reductions | 1.08% | .91% | .68% | 1.44% | 1.30% |
Expenses net of fee waivers, if any | 1.08% | .91% | .68% | 1.44% | 1.30% |
Expenses net of all reductions | 1.06% | .89% | .64% | 1.40% | 1.25% |
Net investment income (loss) | 1.69% E | 1.00% | 1.25% | .36% | .43% |
Supplemental Data | | | | | |
Net assets, end of period (000 omitted) | $ 328,262 | $ 398,331 | $ 329,128 | $ 312,376 | $ 1,433,844 |
Portfolio turnover rate D | 24% | 49% | 174% | 61% | 107% |
A Total returns would have been lower if certain expenses had not been reduced during the applicable periods shown.
B Calculated based on average shares outstanding during the period.
C Fees and expenses of any underlying Fidelity Central Funds are not included in the Fund's expense ratio. The Fund indirectly bears its proportionate share of the expenses of any underlying Fidelity Central Funds.
D Amount does not include the portfolio activity of any underlying Fidelity Central Funds.
E Investment income per share reflects a special dividend which amounted to $.07 per share. Excluding the special dividend, the ratio of net investment income (loss) to average net assets would have been 1.06%.
F Expense ratios reflect operating expenses of the class. Expenses before reductions do not reflect amounts reimbursed by the investment adviser or reductions from brokerage service arrangements or reductions from other expense offset arrangements and do not represent the amount paid by the class during periods when reimbursements or reductions occur. Expenses net of fee waivers reflect expenses after reimbursement by the investment adviser but prior to reductions from brokerage service arrangements or other expense offset arrangements. Expenses net of all reductions represent the net expenses paid by the class.
G Amount represents less than $.01 per share.
H Total distributions of $1.94 per share is comprised of distributions from net investment income of $.064 and distributions from net realized gain of $1.878 per share.
See accompanying notes which are an integral part of the financial statements.
Annual Report
Financial Highlights - Institutional Class
Years ended October 31, | 2011 | 2010 | 2009 | 2008 | 2007 |
Selected Per-Share Data | | | | | |
Net asset value, beginning of period | $ 9.93 | $ 8.14 | $ 6.27 | $ 19.09 | $ 14.22 |
Income from Investment Operations | | | | | |
Net investment income (loss) B | .18 E | .09 | .08 | .05 | .08 |
Net realized and unrealized gain (loss) | (.06) | 1.86 | 1.79 | (10.92) | 4.78 |
Total from investment operations | .12 | 1.95 | 1.87 | (10.87) | 4.86 |
Distributions from net investment income | (.15) | (.07) | - G | (.07) | - |
Distributions from net realized gain | (.04) | (.09) | - | (1.88) | - |
Total distributions | (.19) | (.16) | - G | (1.95) H | - |
Redemption fees added to paid in capital B | - G | - G | - G | - G | .01 |
Net asset value, end of period | $ 9.86 | $ 9.93 | $ 8.14 | $ 6.27 | $ 19.09 |
Total Return A | 1.13% | 24.33% | 29.87% | (62.95)% | 34.25% |
Ratios to Average Net Assets C, F | | | | | |
Expenses before reductions | 1.03% | .90% | .68% | 1.40% | 1.29% |
Expenses net of fee waivers, if any | 1.03% | .90% | .68% | 1.40% | 1.29% |
Expenses net of all reductions | 1.02% | .88% | .64% | 1.37% | 1.25% |
Net investment income (loss) | 1.74% E | 1.01% | 1.25% | .39% | .44% |
Supplemental Data | | | | | |
Net assets, end of period (000 omitted) | $ 1,395 | $ 2,418 | $ 2,022 | $ 8,117 | $ 27,609 |
Portfolio turnover rate D | 24% | 49% | 174% | 61% | 107% |
A Total returns would have been lower if certain expenses had not been reduced during the applicable periods shown.
B Calculated based on average shares outstanding during the period.
C Fees and expenses of any underlying Fidelity Central Funds are not included in the Fund's expense ratio. The Fund indirectly bears its proportionate share of the expenses of any underlying Fidelity Central Funds.
D Amount does not include the portfolio activity of any underlying Fidelity Central Funds.
E Investment income per share reflects a special dividend which amounted to $.07 per share. Excluding the special dividend, the ratio of net investment income (loss) to average net assets would have been 1.11%.
F Expense ratios reflect operating expenses of the class. Expenses before reductions do not reflect amounts reimbursed by the investment adviser or reductions from brokerage service arrangements or reductions from other expense offset arrangements and do not represent the amount paid by the class during periods when reimbursements or reductions occur. Expenses net of fee waivers reflect expenses after reimbursement by the investment adviser but prior to reductions from brokerage service arrangements or other expense offset arrangements. Expenses net of all reductions represent the net expenses paid by the class.
G Amount represents less than $.01 per share.
H Total distributions of $1.95 per share is comprised of distributions from net investment income of $.074 and distributions from net realized gain of $1.878 per share.
See accompanying notes which are an integral part of the financial statements.
Annual Report
Notes to Financial Statements
For the period ended October 31, 2011
1. Organization.
Fidelity International Small Cap Opportunities Fund (the Fund) is a fund of Fidelity Investment Trust (the Trust) and is authorized to issue an unlimited number of shares. The Trust is registered under the Investment Company Act of 1940, as amended (the 1940 Act), as an open-end management investment company organized as a Massachusetts business trust. The Fund offers Class A, Class T, Class C, International Small Cap Opportunities and Institutional Class shares, each of which, along with Class B shares, has equal rights as to assets and voting privileges. Effective after the close of business on September 1, 2010, Class B shares were closed to new accounts and additional purchases, except for exchanges and reinvestments by existing shareholders. Each class has exclusive voting rights with respect to matters that affect that class. Class B shares will automatically convert to Class A shares after a holding period of seven years from the initial date of purchase. Investment income, realized and unrealized capital gains and losses, the common expenses of the Fund, and certain fund-level expense reductions, if any, are allocated on a pro-rata basis to each class based on the relative net assets of each class to the total net assets of the Fund. Each class differs with respect to transfer agent and distribution and service plan fees incurred. Certain expense reductions may also differ by class. The Fund's investments in emerging markets can be subject to social, economic, regulatory, and political uncertainties and can be extremely volatile.
2. Investments in Fidelity Central Funds.
The Fund invests in Fidelity Central Funds, which are open-end investment companies available only to other investment companies and accounts managed by Fidelity Management & Research Company (FMR) and its affiliates. The Fund's Schedule of Investments lists each of the Fidelity Central Funds held as of period end, if any, as an investment of the Fund, but does not include the underlying holdings of each Fidelity Central Fund. As an Investing Fund, the Fund indirectly bears its proportionate share of the expenses of the underlying Fidelity Central Funds.
The Money Market Central Funds seek preservation of capital and current income and are managed by Fidelity Investments Money Management, Inc. (FIMM), an affiliate of FMR.
A complete unaudited list of holdings for each Fidelity Central Fund is available upon request or at the Securities and Exchange Commission (the SEC) web site at www.sec.gov. In addition, the financial statements of the Fidelity Central Funds, which are not covered by the Fund's Report of Independent Registered Public Accounting Firm, are available on the SEC web site or upon request.
Annual Report
Notes to Financial Statements - continued
3. Significant Accounting Policies.
The financial statements have been prepared in conformity with accounting principles generally accepted in the United States of America (GAAP), which require management to make certain estimates and assumptions at the date of the financial statements. Actual results could differ from those estimates. Subsequent events, if any, through the date that the financial statements were issued have been evaluated in the preparation of the financial statements. The following summarizes the significant accounting policies of the Fund:
Security Valuation. Investments are valued as of 4:00 p.m. Eastern time on the last calendar day of the period. The Fund uses independent pricing services approved by the Board of Trustees to value its investments. When current market prices or quotations are not readily available or reliable, valuations may be determined in good faith in accordance with procedures adopted by the Board of Trustees. Factors used in determining value may include market or security specific events. The frequency with which these procedures are used cannot be predicted and they may be utilized to a significant extent. The value used for net asset value (NAV) calculation under these procedures may differ from published prices for the same securities.
The Fund categorizes the inputs to valuation techniques used to value its investments into a disclosure hierarchy consisting of three levels as shown below:
Level 1 - quoted prices in active markets for identical investments
Level 2 - other significant observable inputs (including quoted prices for similar investments, interest rates, prepayment speeds, etc.)
Level 3 - unobservable inputs (including the Fund's own assumptions based on the best information available)
Changes in valuation techniques may result in transfers in or out of an assigned level within the disclosure hierarchy. The aggregate value of investments by input level, as of October 31, 2011, is included at the end of the Fund's Schedule of Investments. Valuation techniques used to value the Fund's investments by major category are as follows:
Equity securities, including restricted securities, for which market quotations are readily available, are valued at the last reported sale price or official closing price as reported by an independent pricing service on the primary market or exchange on which they are traded and are categorized as Level 1 in the hierarchy. In the event there were no sales during the day or closing prices are not available, securities are valued at the last quoted bid price or may be valued using the last available price and are generally categorized as Level 2 in the hierarchy. For foreign equity securities, when significant market or security specific events arise, comparisons to the valuation of American Depositary Receipts (ADRs), futures contracts, Exchange-traded funds (ETFs) and certain indexes as well as
Annual Report
3. Significant Accounting Policies - continued
Security Valuation - continued
quoted prices for similar securities are used and are categorized as Level 2 in the hierarchy in these circumstances. Utilizing these techniques may result in transfers between Level 1 and Level 2. For restricted equity securities and private placements where observable inputs are limited, assumptions about market activity and risk are used and are categorized as Level 3 in the hierarchy.
Investments in open-end mutual funds, including the Fidelity Central Funds, are valued at their closing net asset value each business day and are categorized as Level 1 in the hierarchy.
Foreign Currency. The Fund may use foreign currency contracts to facilitate transactions in foreign-denominated securities. Gains and losses from these transactions may arise from changes in the value of the foreign currency or if the counterparties do not perform under the contracts' terms.
Foreign-denominated assets, including investment securities, and liabilities are translated into U.S. dollars at the exchange rate at period end. Purchases and sales of investment securities, income and dividends received and expenses denominated in foreign currencies are translated into U.S. dollars at the exchange rate in effect on the transaction date.
The effects of exchange rate fluctuations on investments are included with the net realized and unrealized gain (loss) on investment securities. Other foreign currency transactions resulting in realized and unrealized gain (loss) are disclosed separately.
Investment Transactions and Income. For financial reporting purposes, the Fund's investment holdings and NAV include trades executed through the end of the last business day of the period. The NAV per share for processing shareholder transactions is calculated as of the close of business of the New York Stock Exchange (NYSE), normally 4:00 p.m. Eastern time and includes trades executed through the end of the prior business day. Gains and losses on securities sold are determined on the basis of identified cost and may include proceeds received from litigation. Dividend income is recorded on the ex-dividend date, except for certain dividends from foreign securities where the ex-dividend date may have passed, which are recorded as soon as the Fund is informed of the ex-dividend date. Non-cash dividends included in dividend income, if any, are recorded at the fair market value of the securities received. Distributions received on securities that represent a return of capital or capital gain are recorded as a reduction of cost of investments and/or as a realized gain. The Fund estimates the components of distributions received that may be considered return of capital distributions or capital gain distributions. Large, non-recurring dividends recognized by the Fund are presented
Annual Report
Notes to Financial Statements - continued
3. Significant Accounting Policies - continued
Investment Transactions and Income - continued
separately on the Statement of Operations as "Special Dividends" and the impact of these dividends is presented in the Financial Highlights. Interest income and distributions from the Fidelity Central Funds are accrued as earned. Interest income includes coupon interest and amortization of premium and accretion of discount on debt securities. Investment income is recorded net of foreign taxes withheld where recovery of such taxes is uncertain.
Expenses. Expenses directly attributable to a fund are charged to that fund. Expenses attributable to more than one fund are allocated among the respective funds on the basis of relative net assets or other appropriate methods. Expense estimates are accrued in the period to which they relate and adjustments are made when actual amounts are known.
Income Tax Information and Distributions to Shareholders. Each year, the Fund intends to qualify as a regulated investment company, including distributing substantially all of its taxable income and realized gains under Subchapter M of the Internal Revenue Code and filing its U.S. federal tax return. As a result, no provision for income taxes is required. As of October 31, 2011, the Fund did not have any unrecognized tax benefits in the financial statements. A fund's federal tax return is subject to examination by the Internal Revenue Service (IRS) for a period of three years. Foreign taxes are provided for based on the Fund's understanding of the tax rules and rates that exist in the foreign markets in which it invests.
Distributions are declared and recorded on the ex-dividend date. Income dividends and capital gain distributions are declared separately for each class. Income and capital gain distributions are determined in accordance with income tax regulations, which may differ from GAAP.
Capital accounts within the financial statements are adjusted for permanent book-tax differences. These adjustments have no impact on net assets or the results of operations. Temporary book-tax differences will reverse in a subsequent period.
Book-tax differences are primarily due to foreign currency transactions, passive foreign investment companies (PFIC), partnerships, capital loss carryforwards and losses deferred due to wash sales.
The federal tax cost of investment securities and unrealized appreciation (depreciation) as of period end were as follows:
Gross unrealized appreciation | $ 73,513,976 |
Gross unrealized depreciation | (22,795,694) |
Net unrealized appreciation (depreciation) on securities and other investments | $ 50,718,282 |
| |
Tax Cost | $ 330,749,465 |
Annual Report
3. Significant Accounting Policies - continued
Income Tax Information and Distributions to Shareholders - continued
The tax-based components of distributable earnings as of period end were as follows:
Undistributed ordinary income | $ 4,705,169 |
Capital loss carryforward | $ (368,117,127) |
Net unrealized appreciation (depreciation) | $ 50,709,192 |
Under the recently enacted Regulated Investment Company Modernization Act of 2010 (the Act), the Fund will be permitted to carry forward capital losses incurred in taxable years beginning after December 22, 2010 for an unlimited period. However, any losses incurred during those future taxable years will be required to be utilized prior to any losses incurred in pre-enactment taxable years, which generally expire after eight years from when they are incurred. Additionally, post-enactment capital losses that are carried forward will retain their character as either short-term or long-term capital losses rather than being considered all short-term as under previous law. The Fund's first fiscal year end subject to the Act will be October 31, 2012.
The tax character of distributions paid was as follows:
| October 31, 2011 | October 31, 2010 |
Ordinary Income | $ 7,985,288 | $ 7,928,671 |
Short-Term Trading (Redemption) Fees. Shares held by investors in the Fund less than 90 Days are subject to a redemption fee equal to 2.00% of the net asset value of shares redeemed. All redemption fees, which reduce the proceeds of the shareholder redemption, are retained by the Fund and accounted for as an addition to paid in capital.
New Accounting Pronouncement. In May 2011, the Financial Accounting Standards Board issued Accounting Standard Update No. 2011-04, Fair Value Measurement (Topic 820) - Amendments to Achieve Common Fair Value Measurement and Disclosure Requirements in U.S. GAAP and IFRSs. The update changes the wording used to describe the requirements in GAAP for measuring fair value and for disclosing information about fair value measurements. The update is effective during interim and annual periods beginning after December 15, 2011. Management is currently evaluating the impact of the update's adoption on the Fund's financial statement disclosures.
Annual Report
Notes to Financial Statements - continued
4. Purchases and Sales of Investments.
Purchases and sales of securities, other than short-term securities, aggregated $100,138,660 and $177,442,934, respectively.
5. Fees and Other Transactions with Affiliates.
Management Fee. FMR and its affiliates provide the Fund with investment management related services for which the Fund pays a monthly management fee. The management fee is the sum of an individual fund fee rate that is based on an annual rate of .60% of the Fund's average net assets and a group fee rate that averaged .26% during the period. The group fee rate is based upon the average net assets of all the mutual funds advised by FMR. The group fee rate decreases as assets under management increase and increases as assets under management decrease. In addition, the management fee is subject to a performance adjustment (up to a maximum of ± .20% of the Fund's average net assets over a 36 month performance period). The upward or downward adjustment to the management fee is based on the relative investment performance of International Small Cap Opportunities as compared to an appropriate benchmark index. For the period, the total annual management fee rate, including the performance adjustment, was .66% of the Fund's average net assets.
Distribution and Service Plan Fees. In accordance with Rule 12b-1 of the 1940 Act, the Fund has adopted separate Distribution and Service Plans for each class of shares. Certain classes pay Fidelity Distributors Corporation (FDC), an affiliate of FMR, separate Distribution and Service Fees, each of which is based on an annual percentage of each class' average net assets. In addition, FDC may pay financial intermediaries for selling shares of the Fund and providing shareholder support services. For the period, the Distribution and Service Fee rates, total fees and amounts retained by FDC were as follows:
| Distribution
Fee | Service
Fee | Total
Fees | Retained
by FDC |
Class A | -% | .25% | $ 51,958 | $ 413 |
Class T | .25% | .25% | 53,522 | 308 |
Class B | .75% | .25% | 27,423 | 20,595 |
Class C | .75% | .25% | 83,724 | 6,165 |
| | | $ 216,627 | $ 27,481 |
Sales Load. FDC may receive a front-end sales charge of up to 5.75% for selling Class A shares, and 3.50% for selling Class T shares, some of which is paid to financial intermediaries for selling shares of the Fund. Depending on the holding period, FDC may receive contingent deferred sales charges levied on Class A, Class T, Class B, and Class C redemptions. The deferred sales charges range from 5% to 1% for Class B, 1% for Class C, 1.00% for certain purchases of Class A shares and .25% for certain purchases of Class T shares.
Annual Report
5. Fees and Other Transactions with Affiliates - continued
Sales Load - continued
For the period, sales charge amounts retained by FDC were as follows:
| Retained
by FDC |
Class A | $ 8,326 |
Class T | 2,104 |
Class B* | 5,991 |
Class C* | 326 |
| $ 16,747 |
* When Class B and Class C shares are initially sold, FDC pays commissions from its own resources to financial intermediaries through which the sales are made.
Transfer Agent Fees. Fidelity Investments Institutional Operations Company, Inc. (FIIOC), an affiliate of FMR, is the transfer, dividend disbursing and shareholder servicing agent for each class of the Fund. FIIOC receives account fees and asset-based fees that vary according to the account size and type of account of the shareholders of the respective classes of the Fund. FIIOC pays for typesetting, printing and mailing of shareholder reports, except proxy statements. For the period, transfer agent fees for each class were as follows:
| Amount | % of
Average
Net Assets |
Class A | $ 62,852 | .30 |
Class T | 33,760 | .32 |
Class B | 8,293 | .30 |
Class C | 25,383 | .30 |
International Small Cap Opportunities | 1,132,318 | .29 |
Institutional Class | 4,606 | .25 |
| $ 1,267,212 | |
Accounting and Security Lending Fees. Fidelity Service Company, Inc. (FSC), an affiliate of FMR, maintains the Fund's accounting records. The accounting fee is based on the level of average net assets for the month. Under a separate contract, FSC administers the security lending program. The security lending fee is based on the number and duration of lending transactions.
Brokerage Commissions. The Fund placed a portion of its portfolio transactions with brokerage firms which are affiliates of the investment adviser. The commissions paid to these affiliated firms were $1,185 for the period.
Annual Report
Notes to Financial Statements - continued
6. Committed Line of Credit.
The Fund participates with other funds managed by FMR or an affiliate in a $4.0 billion credit facility (the "line of credit") to be utilized for temporary or emergency purposes to fund shareholder redemptions or for other short-term liquidity purposes. The Fund has agreed to pay commitment fees on its pro-rata portion of the line of credit, which amounted to $1,348 and is reflected in Miscellaneous expenses on the Statement of Operations. During the period, there were no borrowings on this line of credit.
7. Security Lending.
The Fund lends portfolio securities through a lending agent from time to time in order to earn additional income. For equity securities, a lending agent is used and may loan securities to certain qualified borrowers, including Fidelity Capital Markets (FCM), a broker-dealer affiliated with the Fund. On the settlement date of the loan, the Fund receives collateral (in the form of U.S. Treasury obligations, letters of credit and/or cash) against the loaned securities and maintains collateral in an amount not less than 100% of the market value of the loaned securities during the period of the loan. The market value of the loaned securities is determined at the close of business of the Fund and any additional required collateral is delivered to the Fund on the next business day. If the borrower defaults on its obligation to return the securities loaned because of insolvency or other reasons, a fund could experience delays and costs in recovering the securities loaned or in gaining access to the collateral. Any cash collateral received is invested in the Fidelity Securities Lending Cash Central Fund. The value of loaned securities and cash collateral at period end are disclosed on the Fund's Statement of Assets and Liabilities. Security lending income represents the income earned on investing cash collateral, less rebates paid to borrowers and any lending agent fees associated with the loan, plus any premium payments received for lending certain types of securities. Security lending income is presented in the Statement of Operations as a component of income from Fidelity Central Funds. Total security lending income during the period amounted to $208,963. During the period, there were no securities loaned to FCM.
8. Expense Reductions.
FMR voluntarily agreed to reimburse a portion of its management fee. For the period, the amount of this reimbursement was $5,729.
Many of the brokers with whom FMR places trades on behalf of the Fund provided services to the Fund in addition to trade execution. These services included payments of certain expenses on behalf of the Fund totaling $47,857 for the period. In addition, through arrangements with the Fund's custodian, credits realized as a result of uninvested cash balances were used to reduce the Fund's expenses. During the period, these credits reduced the Fund's expenses by $45.
Annual Report
9. Distributions to Shareholders.
Distributions to shareholders of each class were as follows:
Years ended October 31, | 2011 | 2010 |
From net investment income | | |
Class A | $ 234,699 | $ 167,529 |
Class T | 95,132 | 81,809 |
Class B | 17,225 | 11,651 |
Class C | 53,555 | 35,378 |
International Small Cap Opportunities | 5,789,167 | 3,548,259 |
Institutional Class | 33,517 | 16,552 |
Total | $ 6,223,295 | $ 3,861,178 |
From net realized gain | | |
Class A | $ 81,710 | $ 203,751 |
Class T | 45,784 | 126,944 |
Class B | 4,543 | 31,778 |
Class C | 13,930 | 96,486 |
International Small Cap Opportunities | 1,606,951 | 3,588,127 |
Institutional Class | 9,075 | 20,407 |
Total | $ 1,761,993 | $ 4,067,493 |
10. Share Transactions.
Transactions for each class of shares were as follows:
| Shares | Dollars |
Years ended October 31, | 2011 | 2010 | 2011 | 2010 |
Class A | | | | |
Shares sold | 414,528 | 502,676 | $ 4,258,719 | $ 4,331,157 |
Reinvestment of distributions | 27,655 | 39,668 | 279,266 | 334,402 |
Shares redeemed | (586,134) | (821,208) | (5,964,528) | (7,086,973) |
Net increase (decrease) | (143,951) | (278,864) | $ (1,426,543) | $ (2,421,414) |
Class T | | | | |
Shares sold | 106,538 | 202,721 | $ 1,079,217 | $ 1,752,774 |
Reinvestment of distributions | 13,404 | 24,207 | 134,702 | 202,613 |
Shares redeemed | (371,432) | (563,942) | (3,710,229) | (4,787,797) |
Net increase (decrease) | (251,490) | (337,014) | $ (2,496,310) | $ (2,832,410) |
Class B | | | | |
Shares sold | 6,900 | 33,509 | $ 67,544 | $ 282,738 |
Reinvestment of distributions | 1,989 | 4,957 | 19,877 | 40,893 |
Shares redeemed | (71,270) | (89,943) | (711,316) | (751,714) |
Net increase (decrease) | (62,381) | (51,477) | $ (623,895) | $ (428,083) |
Annual Report
Notes to Financial Statements - continued
10. Share Transactions - continued
| Shares | Dollars |
Years ended October 31, | 2011 | 2010 | 2011 | 2010 |
Class C | | | | |
Shares sold | 80,402 | 138,774 | $ 802,688 | $ 1,172,961 |
Reinvestment of distributions | 5,984 | 13,874 | 59,727 | 114,325 |
Shares redeemed | (295,393) | (301,965) | (2,919,335) | (2,545,004) |
Net increase (decrease) | (209,007) | (149,317) | $ (2,056,920) | $ (1,257,718) |
International Small Cap Opportunities | | | | |
Shares sold | 4,054,816 | 11,750,215 | $ 41,630,046 | $ 101,991,968 |
Reinvestment of distributions | 693,159 | 792,800 | 7,035,420 | 6,738,804 |
Shares redeemed | (11,579,067) | (12,779,026) | (119,651,010) | (110,633,144) |
Net increase (decrease) | (6,831,092) | (236,011) | $ (70,985,544) | $ (1,902,372) |
Institutional Class | | | | |
Shares sold | 36,278 | 111,833 | $ 362,488 | $ 1,028,388 |
Reinvestment of distributions | 3,294 | 3,263 | 33,471 | 27,765 |
Shares redeemed | (141,623) | (119,898) | (1,476,463) | (1,034,340) |
Net increase (decrease) | (102,051) | (4,802) | $ (1,080,504) | $ 21,813 |
11. Other.
The Fund's organizational documents provide former and current trustees and officers with a limited indemnification against liabilities arising in connection with the performance of their duties to the Fund. In the normal course of business, the Fund may also enter into contracts that provide general indemnifications. The Fund's maximum exposure under these arrangements is unknown as this would be dependent on future claims that may be made against the Fund. The risk of material loss from such claims is considered remote.
Annual Report
To the Trustees of Fidelity Investment Trust and Shareholders of Fidelity International Small Cap Opportunities Fund:
We have audited the accompanying statement of assets and liabilities of Fidelity International Small Cap Opportunities Fund (the Fund), a fund of Fidelity Investment Trust, including the schedule of investments, as of October 31, 2011, and the related statement of operations for the year then ended, the statement of changes in net assets for each of the two years in the period then ended, and the financial highlights for each of the five years in the period then ended. These financial statements and financial highlights are the responsibility of the Fund's management. Our responsibility is to express an opinion on these financial statements and financial highlights based on our audits.
We conducted our audits in accordance with the standards of the Public Company Accounting Oversight Board (United States). Those standards require that we plan and perform the audit to obtain reasonable assurance about whether the financial statements and financial highlights are free of material misstatement. The Fund is not required to have, nor were we engaged to perform, an audit of its internal control over financial reporting. Our audits included consideration of internal control over financial reporting as a basis for designing audit procedures that are appropriate in the circumstances, but not for the purpose of expressing an opinion on the effectiveness of the Fund's internal control over financial reporting. Accordingly, we express no such opinion. An audit also includes examining, on a test basis, evidence supporting the amounts and disclosures in the financial statements, assessing the accounting principles used and significant estimates made by management, as well as evaluating the overall financial statement presentation. Our procedures included confirmation of securities owned as of October 31, 2011, by correspondence with the custodians and brokers; where replies were not received from brokers, we performed other auditing procedures. We believe that our audits provide a reasonable basis for our opinion.
In our opinion, the financial statements and financial highlights referred to above present fairly, in all material respects, the financial position of Fidelity International Small Cap Opportunities Fund as of October 31, 2011, the results of its operations for the year then ended, the changes in its net assets for each of the two years in the period then ended, and the financial highlights for each of the five years in the period then ended, in conformity with accounting principles generally accepted in the United States of America.
DELOITTE & TOUCHE LLP
Boston, Massachusetts
December 12, 2011
Annual Report
The Trustees, Members of the Advisory Board, and executive officers of the trust and fund, as applicable, are listed below. The Board of Trustees governs the fund and is responsible for protecting the interests of shareholders. The Trustees are experienced executives who meet periodically throughout the year to oversee the fund's activities, review contractual arrangements with companies that provide services to the fund, oversee management of the risks associated with such activities and contractual arrangements, and review the fund's performance. Except for James C. Curvey, each of the Trustees oversees 226 funds advised by FMR or an affiliate. Mr. Curvey oversees 429 funds advised by FMR or an affiliate.
The Trustees hold office without limit in time except that (a) any Trustee may resign; (b) any Trustee may be removed by written instrument, signed by at least two-thirds of the number of Trustees prior to such removal; (c) any Trustee who requests to be retired or who has become incapacitated by illness or injury may be retired by written instrument signed by a majority of the other Trustees; and (d) any Trustee may be removed at any special meeting of shareholders by a two-thirds vote of the outstanding voting securities of the trust. Each Trustee who is not an interested person (as defined in the 1940 Act) (Independent Trustee), shall retire not later than the last day of the calendar year in which his or her 75th birthday occurs. The Independent Trustees may waive this mandatory retirement age policy with respect to individual Trustees. The executive officers and Advisory Board Members hold office without limit in time, except that any officer and Advisory Board Member may resign or may be removed by a vote of a majority of the Trustees at any regular meeting or any special meeting of the Trustees. Except as indicated, each individual has held the office shown or other offices in the same company for the past five years.
Experience, Skills, Attributes, and Qualifications of the Fund's Trustees. The Governance and Nominating Committee has adopted a statement of policy that describes the experience, qualifications, attributes, and skills that are necessary and desirable for potential Independent Trustee candidates (Statement of Policy). The Board believes that each Trustee satisfied at the time he or she was initially elected or appointed a Trustee, and continues to satisfy, the standards contemplated by the Statement of Policy. The Governance and Nominating Committee also engages professional search firms to help identify potential Independent Trustee candidates who have the experience, qualifications, attributes, and skills consistent with the Statement of Policy. From time to time, additional criteria based on the composition and skills of the current Independent Trustees, as well as experience or skills that may be appropriate in light of future changes to board composition, business conditions, and regulatory or other developments, have also been considered by the professional search firms and the Governance and Nominating Committee. In addition, the Board takes into account the Trustees' commitment and participation in Board and committee meetings, as well as their leadership of standing and ad hoc committees throughout their tenure.
In determining that a particular Trustee was and continues to be qualified to serve as a Trustee, the Board has considered a variety of criteria, none of which, in isolation, was controlling. The Board believes that, collectively, the Trustees have balanced and diverse experience, qualifications, attributes, and skills, which allow the Board to operate effectively in governing the fund and protecting the interests of shareholders. Information about the specific experience, skills, attributes, and qualifications of each Trustee, which in each case led to the Board's conclusion that the Trustee should serve (or continue to serve) as a trustee of the fund, is provided below.
Annual Report
Board Structure and Oversight Function. James C. Curvey is an interested person (as defined in the 1940 Act) and currently serves as Acting Chairman. The Trustees have determined that an interested Chairman is appropriate and benefits shareholders because an interested Chairman has a personal and professional stake in the quality and continuity of services provided to the fund. Independent Trustees exercise their informed business judgment to appoint an individual of their choosing to serve as Chairman, regardless of whether the Trustee happens to be independent or a member of management. The Independent Trustees have determined that they can act independently and effectively without having an Independent Trustee serve as Chairman and that a key structural component for assuring that they are in a position to do so is for the Independent Trustees to constitute a substantial majority for the Board. The Independent Trustees also regularly meet in executive session. Ned C. Lautenbach serves as Chairman of the Independent Trustees and as such (i) acts as a liaison between the Independent Trustees and management with respect to matters important to the Independent Trustees and (ii) with management prepares agendas for Board meetings.
Fidelity funds are overseen by different Boards of Trustees. The fund's Board oversees Fidelity's equity and high income funds and another Board oversees Fidelity's investment-grade bond, money market, and asset allocation funds. The asset allocation funds may invest in Fidelity funds overseen by the fund's Board. The use of separate Boards, each with its own committee structure, allows the Trustees of each group of Fidelity funds to focus on the unique issues of the funds they oversee, including common research, investment, and operational issues. On occasion, the separate Boards establish joint committees to address issues of overlapping consequences for the Fidelity funds overseen by each Board.
The Trustees operate using a system of committees to facilitate the timely and efficient consideration of all matters of importance to the Trustees, the fund, and fund shareholders and to facilitate compliance with legal and regulatory requirements and oversight of the fund's activities and associated risks. The Board, acting through its committees, has charged FMR and its affiliates with (i) identifying events or circumstances the occurrence of which could have demonstrably adverse effects on the fund's business and/or reputation; (ii) implementing processes and controls to lessen the possibility that such events or circumstances occur or to mitigate the effects of such events or circumstances if they do occur; and (iii) creating and maintaining a system designed to evaluate continuously business and market conditions in order to facilitate the identification and implementation processes described in (i) and (ii) above. Because the day-to-day operations and activities of the fund are carried out by or through FMR, its affiliates and other service providers, the fund's exposure to risks is mitigated but not eliminated by the processes overseen by the Trustees. While each of the Board's committees has responsibility for overseeing different aspects of the fund's activities, oversight is exercised primarily through the Operations, Audit, and Compliance Committees. In addition, the Independent Trustees have worked with FMR to enhance the Board's oversight of investment and financial risks, legal and regulatory risks, technology risks, and operational risks, including the development of additional risk reporting to the Board. For example, a working group comprised of Independent Trustees and FMR has worked and continues to work to review the Fidelity funds' valuation-related activities, reporting and risk management. Appropriate personnel, including but not limited to the fund's Chief Compliance Officer (CCO), FMR's internal auditor, the independent accountants, the fund's Treasurer and portfolio management personnel, make periodic reports to the Board's committees, as appropriate, including an annual review of FMR's risk management program for the Fidelity funds. The responsibilities of each standing committee, including their oversight responsibilities, are described further under "Standing Committees of the Fund's Trustees."
Annual Report
Trustees and Officers - continued
The fund's Statement of Additional Information (SAI) includes more information about the Trustees. To request a free copy, call Fidelity at 1-877-208-0098.
Interested Trustees*:
Correspondence intended for each Trustee who is an interested person may be sent to Fidelity Investments, 82 Devonshire Street, Boston, Massachusetts 02109.
Name, Age; Principal Occupations and Other Relevant Experience+ |
James C. Curvey (76) |
| Year of Election or Appointment: 2007 Mr. Curvey is Trustee and Acting Chairman of the Board of Trustees of certain Trusts. Mr. Curvey also serves as Trustee (2007-present) of other investment companies advised by FMR. Mr. Curvey is a Director of Fidelity Investments Money Management, Inc. (2009-present), Director of Fidelity Research & Analysis Co. (2009-present) and Director of FMR and FMR Co., Inc. (2007-present). Mr. Curvey is also Vice Chairman (2007-present) and Director of FMR LLC. In addition, Mr. Curvey serves as an Overseer for the Boston Symphony Orchestra and a member of the Trustees of Villanova University. Previously, Mr. Curvey was the Vice Chairman (2006-2007) and Director (2000-2007) of FMR Corp. |
Ronald P. O'Hanley (54) |
| Year of Election or Appointment: 2011 Mr. O'Hanley is Director of FMR Co., Inc. (2010-present), Director of Fidelity Investments Money Management, Inc. (2010-present), Director of Fidelity Research & Analysis Company (2010-present), President of Fidelity Asset Management and Corporate Services and a member of Fidelity's Executive Committee (2010-present). Previously, Mr. O'Hanley served as President and Chief Executive Officer of BNY Mellon Asset Management (2007-2010). Mr. O'Hanley also served as Vice Chairman of Bank New York Mellon Corp. and a member of that firm's Executive Committee. Prior to the 2007 merger of The Bank of New York and Mellon Financial Corporation, he was Vice Chairman of Mellon Financial Corporation and President and Chief Executive Officer of Mellon Asset Management. He joined Mellon in February 1997. Mr. O'Hanley currently serves as Chairman of the Boston Public Library Foundation Board of Directors and sits on the Board of Directors of Beth Israel Deaconess Medical Center, the Board of Trustees of the Marine Biological Laboratory and the Advisory Board of the Maxwell School of Citizenship and Public Administration at Syracuse University. Mr. O'Hanley also chairs the Council on Asset Management for the Financial Services Roundtable and is a member of the Board of Directors of Institutional Investor's U.S. Institute. |
* Trustees have been determined to be "Interested Trustees" by virtue of, among other things, their affiliation with the trust or various entities under common control with FMR.
+ The information above includes each Trustee's principal occupation during the last five years and other information relating to the experience, attributes, and skills relevant to each Trustee's qualifications to serve as a Trustee, which led to the conclusion that each Trustee should serve as a Trustee for the fund.
Annual Report
Trustees and Officers - continued
Independent Trustees:
Correspondence intended for each Independent Trustee (that is, the Trustees other than the Interested Trustees) may be sent to Fidelity Investments, P.O. Box 55235, Boston, Massachusetts 02205-5235.
Name, Age; Principal Occupations and Other Relevant Experience+ |
Dennis J. Dirks (63) |
| Year of Election or Appointment: 2005 Prior to his retirement in May 2003, Mr. Dirks was Chief Operating Officer and a member of the Board of The Depository Trust & Clearing Corporation (DTCC). He also served as President, Chief Operating Officer, and Board member of The Depository Trust Company (DTC) and President and Board member of the National Securities Clearing Corporation (NSCC). In addition, Mr. Dirks served as Chief Executive Officer and Board member of the Government Securities Clearing Corporation, Chief Executive Officer and Board member of the Mortgage-Backed Securities Clearing Corporation, as a Trustee and a member of the Finance Committee of Manhattan College (2005-2008), and as a Trustee and a member of the Finance Committee of AHRC of Nassau County (2006-2008). Mr. Dirks is a member of the Independent Directors Council (IDC) Governing Council (2010-Present) and Board of Directors for The Brookville Center for Children's Services, Inc. (2009-present). |
Alan J. Lacy (58) |
| Year of Election or Appointment: 2008 Mr. Lacy serves as Senior Adviser (2007-present) of Oak Hill Capital Partners, L.P. (private equity). Mr. Lacy also served as Chief Executive Officer (2000-2005) and Vice Chairman (2005-2006) of Sears Holdings Corporation and Sears, Roebuck and Co. (retail). In addition, Mr. Lacy serves as a member of the Board of Directors of Dave & Buster's, Inc. (restaurant and entertainment complexes, 2010-present), The Hillman Companies, Inc. (hardware wholesalers, 2010-present), and Bristol-Myers Squibb Company (global pharmaceuticals, 2007-present). Mr. Lacy is a member of the Board of Trustees of The National Parks Conservation Association (2006-Present). Previously, Mr. Lacy served as Chairman of the Board of Trustees of the National Parks Conservation Association (2008-2011) and as a member of the Board of Directors for the Western Union Company (global money transfer, 2006-2011). |
Ned C. Lautenbach (67) |
| Year of Election or Appointment: 2000 Mr. Lautenbach is Chairman of the Independent Trustees of the Equity and High Income Funds (2006-present). Mr. Lautenbach currently serves as the Lead Director of the Eaton Corporation Board of Directors (diversified industrial, 1997-present). Mr. Lautenbach is also a member of the Board of Directors of the Philharmonic Center for the Arts in Naples, Florida (1999-present); a member of the Board of Trustees of Fairfield University (2005-present); and a member of the Council on Foreign Relations (1994-present). Previously, Mr. Lautenbach was a Partner/Advisory Partner at Clayton, Dubilier & Rice, LLC (private equity investment, 1998-2010), as well as a Director of Sony Corporation (2006-2007). |
Joseph Mauriello (67) |
| Year of Election or Appointment: 2008 Prior to his retirement in January 2006, Mr. Mauriello served in numerous senior management positions including Deputy Chairman and Chief Operating Officer (2004-2005), and Vice Chairman of Financial Services (2002-2004) of KPMG LLP US (professional services, 1965-2005). Mr. Mauriello currently serves as a member of the Board of Directors of XL Group plc. (global insurance and re-insurance, 2006-present) and of Arcadia Resources Inc. (health care services and products, 2007-present). Previously, Mr. Mauriello served as a Director of the Hamilton Funds of the Bank of New York (2006-2007). |
Robert W. Selander (61) |
| Year of Election or Appointment: 2011 Previously, Mr. Selander served as a Member of the Advisory Board of Fidelity's Equity and High Income Funds (2011), Executive Vice Chairman (2010), Chief Executive Officer (2009-2010), and President and Chief Executive Officer (1997-2009) of Mastercard, Inc. |
Cornelia M. Small (67) |
| Year of Election or Appointment: 2005 Ms. Small is a member of the Board of Directors of the Teagle Foundation (2009-present). Ms. Small is also a member of the Investment Committee, and Chair (2008-present) and a member of the Board of Trustees of Smith College. In addition, Ms. Small serves on the Investment Committee of the Berkshire Taconic Community Foundation (2008-present). Previously, Ms. Small served as Chairperson of the Investment Committee (2002-2008) of Smith College. In addition, Ms. Small served as Chief Investment Officer, Director of Global Equity Investments, and a member of the Board of Directors of Scudder, Stevens & Clark and Scudder Kemper Investments. |
William S. Stavropoulos (72) |
| Year of Election or Appointment: 2001 Mr. Stavropoulos is Vice Chairman of the Independent Trustees of the Equity and High Income Funds (2006-present). Mr. Stavropoulos serves as President and Founder of the Michigan Baseball Foundation, the Great Lakes Loons (2007-present). Mr. Stavropoulos is Chairman Emeritus of the Board of Directors of The Dow Chemical Company, where he previously served in numerous senior management positions, including President, CEO (1995-2000; 2002-2004), Chairman of the Executive Committee (2000-2006), and as a member of the Board of Directors (1990-2006). Currently, Mr. Stavropoulos is Chairman of Univar (global distributor of commodity and specialty chemicals, 2010-present), a Director of Teradata Corporation (data warehousing and technology solutions, 2008-present), Chemical Financial Corporation, Maersk Inc. (industrial conglomerate), Tyco International, Inc. (multinational manufacturing and services, 2007-present), and a member of the Advisory Board for Metalmark Capital (private equity investment, 2005-present). Mr. Stavropoulos is a special advisor to Clayton, Dubilier & Rice, LLC (private equity investment). In addition, Mr. Stavropoulos is a member of the University of Notre Dame Advisory Council for the College of Science. |
David M. Thomas (62) |
| Year of Election or Appointment: 2008 Previously, Mr. Thomas served as Executive Chairman (2005-2006) and Chairman and Chief Executive Officer (2000-2005) of IMS Health, Inc. (pharmaceutical and healthcare information solutions). In addition, Mr. Thomas serves as a member of the Board of Directors of Fortune Brands, Inc. (consumer products), and Interpublic Group of Companies, Inc. (marketing communication, 2004-present). |
Michael E. Wiley (61) |
| Year of Election or Appointment: 2008 Mr. Wiley also serves as a Director of Asia Pacific Exploration Consolidated (international oil and gas exploration and production, 2008-present). Mr. Wiley serves as a Director of Tesoro Corporation (independent oil refiner and marketer, 2005-present), and a Director of Bill Barrett Corporation (exploration and production, 2005-present). In addition, Mr. Wiley also serves as a Director of Post Oak Bank (privately-held bank, 2004-present). Previously, Mr. Wiley served as a member of the Board of Trustees of the University of Tulsa (2000-2006; 2007-2010), as a Senior Energy Advisor of Katzenbach Partners, LLC (consulting, 2006-2007), as an Advisory Director of Riverstone Holdings (private investment), Chairman, President, and CEO of Baker Hughes, Inc. (oilfield services, 2000-2004), and as Director of Spinnaker Exploration Company (exploration and production, 2001-2005). |
Annual Report
+ The information above includes each Trustee's principal occupation during the last five years and other information relating to the experience, attributes, and skills relevant to each Trustee's qualifications to serve as a Trustee, which led to the conclusion that each Trustee should serve as a Trustee for the fund.
Advisory Board Members and Executive Officers:
Correspondence intended for each executive officer, Edward C. Johnson 3d, and Peter S. Lynch may be sent to Fidelity Investments, 82 Devonshire Street, Boston, Massachusetts 02109.
Name, Age; Principal Occupation |
Edward C. Johnson 3d (81) |
| Year of Election or Appointment: 2011 Member of the Advisory Board of Fidelity's Equity and High Income Funds. Mr. Johnson serves as Chief Executive Officer, Chairman, and a Director of FMR LLC, and also serves as Chairman and Director of FIL Limited. Previously, Mr. Johnson served as a Trustee and Chairman of the Board of certain Fidelity Trusts, Chairman and a Director of FMR, Chairman and a Director of FMR Co., Inc., and President of FMR LLC (2006-2007). |
Peter S. Lynch (67) |
| Year of Election or Appointment: 2003 Member of the Advisory Board of Fidelity's Equity and High Income Funds. Mr. Lynch is Vice Chairman and a Director of FMR and FMR Co., Inc. In addition, Mr. Lynch serves as a Trustee of Boston College and as the Chairman of the Inner-City Scholarship Fund. Previously, Mr. Lynch served on the Special Olympics International Board of Directors (1997-2006). |
Kenneth B. Robins (42) |
| Year of Election or Appointment: 2008 President and Treasurer of Fidelity's Equity and High Income Funds. Mr. Robins also serves as President and Treasurer (2010-present) and Assistant Treasurer (2009-present) of other Fidelity funds and is an employee of Fidelity Investments (2004-present). Previously, Mr. Robins served as Deputy Treasurer of the Fidelity funds (2005-2008) and Treasurer and Chief Financial Officer of The North Carolina Capital Management Trust: Cash and Term Portfolios (2006-2008). |
Brian B. Hogan (47) |
| Year of Election or Appointment: 2009 Vice President of Equity and High Income Funds. Mr. Hogan also serves as President of FMR's Equity Division (2009-present). Previously, Mr. Hogan served as Senior Vice President, Equity Research of FMR (2006-2009) and as a portfolio manager. |
Thomas C. Hense (47) |
| Year of Election or Appointment: 2008 or 2010 Vice President of Fidelity's High Income (2008), Small Cap (2008), and Value (2010) Funds. Previously, Mr. Hense served as a portfolio manager for Fidelity's Institutional Money Management Group (Pyramis) (2003-2008). |
Scott C. Goebel (43) |
| Year of Election or Appointment: 2008 Secretary and Chief Legal Officer (CLO) of the Fidelity funds. Mr. Goebel also serves as Secretary of Fidelity Investments Money Management, Inc. (FIMM) (2010-present) and Fidelity Research and Analysis Company (FRAC) (2010-present); Secretary and CLO of The North Carolina Capital Management Trust: Cash and Term Portfolios (2008-present); General Counsel, Secretary, and Senior Vice President of FMR (2008-present) and FMR Co., Inc. (2008-present); employed by FMR LLC or an affiliate (2001-present); Chief Legal Officer of Fidelity Management & Research (Hong Kong) Limited (2008-present) and Assistant Secretary of Fidelity Management & Research (Japan) Inc. (2008-present), and Fidelity Management & Research (U.K.) Inc. (2008-present). Previously, Mr. Goebel served as Assistant Secretary of FIMM (2008-2010), FRAC (2008-2010), and the Funds (2007-2008) and as Vice President and Secretary of Fidelity Distributors Corporation (FDC) (2005-2007). |
William C. Coffey (42) |
| Year of Election or Appointment: 2009 Assistant Secretary of Fidelity's Equity and High Income Funds. Mr. Coffey also serves as Senior Vice President and Deputy General Counsel of FMR LLC (2010-present), and is an employee of Fidelity Investments. Previously, Mr. Coffey served as Vice President and Associate General Counsel of FMR LLC (2005-2009). |
Holly C. Laurent (57) |
| Year of Election or Appointment: 2008 Anti-Money Laundering (AML) Officer of the Fidelity funds. Ms. Laurent also serves as AML Officer of The North Carolina Capital Management Trust: Cash and Term Portfolios (2008-present) and is an employee of Fidelity Investments. Previously, Ms. Laurent was Senior Vice President and Head of Legal for Fidelity Business Services India Pvt. Ltd. (2006-2008), and Senior Vice President, Deputy General Counsel and Group Head for FMR LLC (2005-2006). |
Christine Reynolds (53) |
| Year of Election or Appointment: 2008 Chief Financial Officer of the Fidelity funds. Ms. Reynolds became President of Fidelity Pricing and Cash Management Services (FPCMS) in August 2008. Ms. Reynolds served as Chief Operating Officer of FPCMS (2007-2008). Previously, Ms. Reynolds served as President, Treasurer, and Anti-Money Laundering officer of the Fidelity funds (2004-2007). |
Kenneth A. Rathgeber (64) |
| Year of Election or Appointment: 2004 Chief Compliance Officer of Fidelity's Equity and High Income Funds. Mr. Rathgeber is Chief Compliance Officer of Fidelity Management & Research (Hong Kong) Limited (2008-present), Fidelity Management & Research (Japan) Inc. (2008-present), FMR (2005-present), FMR Co., Inc. (2005-present), Fidelity Management & Research (U.K.) Inc. (2005-present), Fidelity Research & Analysis Company (2005-present), Fidelity Investments Money Management, Inc. (2005-present), Pyramis Global Advisors, LLC (2005-present), and Strategic Advisers, Inc. (2005-present). |
Jeffrey S. Christian (50) |
| Year of Election or Appointment: 2009 Deputy Treasurer of the Fidelity funds. Mr. Christian is an employee of Fidelity Investments. Previously, Mr. Christian served as Chief Financial Officer (2008-2009) of certain Fidelity funds and Senior Vice President of Fidelity Pricing and Cash Management Services (FPCMS) (2004-2009). |
Joseph F. Zambello (54) |
| Year of Election or Appointment: 2011 Deputy Treasurer of the Fidelity funds. Mr. Zambello is an employee of Fidelity Investments. Previously, Mr. Zambello served as Vice President of FMR's Program Management Group (2009-2011) and Vice President of the Transfer Agent Oversight Group (2005-2009). |
Adrien E. Deberghes (44) |
| Year of Election or Appointment: 2008 Deputy Treasurer of Fidelity's Equity and High Income Funds. Mr. Deberghes also serves as Vice President and Assistant Treasurer of Fidelity Rutland Square Trust II and Fidelity Commonwealth Trust II (2011-present), Assistant Treasurer of other Fidelity funds (2010-present), and is an employee of Fidelity Investments (2008-present). Previously, Mr. Deberghes served as Senior Vice President of Mutual Fund Administration at State Street Corporation (2007-2008), Senior Director of Mutual Fund Administration at Investors Bank & Trust (2005-2007), and Director of Finance for Dunkin' Brands (2000-2005). |
Stephanie J. Dorsey (42) |
| Year of Election or Appointment: 2010 Assistant Treasurer of Fidelity's Equity and High Income Funds. Ms. Dorsey also serves as Deputy Treasurer of other Fidelity funds (2008-present) and is an employee of Fidelity Investments (2008-present). Previously, Ms. Dorsey served as Treasurer (2004-2008) of the JPMorgan Mutual Funds and Vice President (2004-2008) of JPMorgan Chase Bank. |
John R. Hebble (53) |
| Year of Election or Appointment: 2009 Assistant Treasurer of Fidelity's Equity and High Income Funds. Mr. Hebble also serves as President (2011-present), Treasurer, and Chief Financial Officer of The North Carolina Capital Management Trust: Cash and Term Portfolios (2008-present), President and Treasurer of other Fidelity funds (2008-present) and is an employee of Fidelity Investments. |
Gary W. Ryan (53) |
| Year of Election or Appointment: 2005 Assistant Treasurer of the Fidelity funds. Mr. Ryan is an employee of Fidelity Investments. Previously, Mr. Ryan served as Vice President of Fund Reporting in Fidelity Pricing and Cash Management Services (FPCMS) (1999-2005). |
Jonathan Davis (43) |
| Year of Election or Appointment: 2010 Assistant Treasurer of the Fidelity funds. Mr. Davis is also Assistant Treasurer of Fidelity Rutland Square Trust II and Fidelity Commonwealth Trust II. Mr. Davis is an employee of Fidelity Investments. Previously, Mr. Davis served as Vice President and Associate General Counsel of FMR LLC (2003-2010). |
Annual Report
The Board of Trustees of Advisor International Small Cap Opportunities Fund voted to pay to shareholders of record at the opening of business on record date, the following distributions per share derived from capital gains realized from sales of portfolio securities, and dividends derived from net investment income:
| Pay Date | Record Date | Dividends | Capital Gains |
Institutional Class | 12/05/11 | 12/02/11 | $0.14 | $0.01 |
Institutional Class designates 74% and 100% of the dividends distributed on December 3, 2010 and December 30, 2010, respectively during the fiscal year as amounts which may be taken into account as a dividend for purposes of the maximum rate under section 1(h) (11) of the Internal Revenue Code.
The amounts per share which represent income derived from sources within, and taxes paid to, foreign countries or possessions of the United States are as follows:
| Pay Date | Income | Taxes |
Institutional Class | 12/06/10 | $0.109 | $0.0076 |
| 12/31/10 | $0.046 | $0.0000 |
The fund will notify shareholders in January 2012 of amounts for use in preparing 2011 income tax returns.
Annual Report
Board Approval of Investment Advisory Contracts and Management Fees
Fidelity International Small Cap Opportunities Fund
Each year, the Board of Trustees, including the Independent Trustees (together, the Board), votes on the renewal of the management contract and sub-advisory agreements (together, the Advisory Contracts) for the fund. The Board, assisted by the advice of fund counsel and Independent Trustees' counsel, requests and considers a broad range of information relevant to the renewal of the Advisory Contracts throughout the year.
The Board meets regularly and considers at each of its meetings factors that are relevant to its annual consideration of the renewal of the fund's Advisory Contracts, including the services and support provided to the fund and its shareholders. The Board has established various standing committees, each composed of Independent Trustees with varying backgrounds, to which the Board has assigned specific subject matter responsibilities in order to enhance effective decision-making by the Board. The Board, acting directly and through its Committees, requests and receives information concerning the annual consideration of the renewal of the fund's Advisory Contracts. The Board also meets as needed to consider matters specifically related to the Board's annual consideration of the renewal of Advisory Contracts. Members of the Board may also meet with trustees of other Fidelity funds through ad hoc joint committees to discuss certain matters relevant to the Fidelity funds.
At its July 2011 meeting, the Board of Trustees, including the Independent Trustees, unanimously determined to renew the fund's Advisory Contracts. In reaching its determination, the Board considered all factors it believed relevant, including (i) the nature, extent, and quality of the services to be provided to the fund and its shareholders (including the investment performance of the fund); (ii) the competitiveness of the fund's management fee and total expense ratio; (iii) the total costs of the services to be provided by and the profits to be realized by Fidelity from its relationship with the fund; (iv) the extent to which economies of scale would be realized as the fund grows; and (v) whether fee levels reflect these economies of scale, if any, for the benefit of fund shareholders.
In considering whether to renew the Advisory Contracts for the fund, the Board reached a determination, with the assistance of fund counsel and Independent Trustees' counsel and through the exercise of its business judgment, that the renewal of the Advisory Contracts is in the best interests of the fund and its shareholders and that the compensation payable under the Advisory Contracts is fair and reasonable. The Board's decision to renew the Advisory Contracts was not based on any single factor, but rather was based on a comprehensive consideration of all the information provided to the Board at its meetings throughout the year. The Board, in reaching its determination to renew the Advisory Contracts, is aware that shareholders in the fund have a broad range of investment choices available to them, including a wide choice among mutual funds offered by Fidelity's competitors, and that the fund's shareholders, who have the opportunity to review and weigh the disclosure provided by the fund in its prospectus and other public disclosures, have chosen to invest in this fund, managed by Fidelity.
Annual Report
Nature, Extent, and Quality of Services Provided. The Board considered the staffing within the investment adviser, FMR, and the sub-advisers (together, the Investment Advisers), including the backgrounds of the fund's investment personnel and the fund's investment objective and discipline. The Independent Trustees also had discussions with senior management of Fidelity's investment operations and investment groups. The Board considered the structure of the portfolio manager compensation program and whether this structure provides appropriate incentives to act in the best interests of the fund.
Resources Dedicated to Investment Management and Support Services. The Board and the Fund Oversight and Research Committees reviewed the general qualifications and capabilities of the Investment Advisers' investment staff, including its size, education, experience, and resources, as well as the Investment Advisers' approach to recruiting, training, managing, and compensating investment personnel. The Board also noted that FMR has devoted increased resources to non-U.S. offices. The Board noted that Fidelity's analysts have extensive resources, tools and capabilities which allow them to conduct sophisticated quantitative and fundamental analysis, as well as credit analysis of issuers, counterparties and enhancers. The Board also believes that Fidelity's investment professionals have sufficient access to global information and data so as to provide competitive investment results over time, and that those professionals also have access to sophisticated tools which permit them to assess portfolio construction and risk and performance attribution characteristics continuously, as well as to transmit new information and research conclusions rapidly around the world. Additionally, in their deliberations, the Board considered the Investment Advisers' trading capabilities and resources which are an integral part of the investment management process.
Shareholder and Administrative Services. The Board considered (i) the nature, extent, quality, and cost of advisory, administrative, and shareholder services performed by the Investment Advisers and their affiliates under the Advisory Contracts and under separate agreements covering transfer agency, pricing and bookkeeping, and securities lending services for the fund; (ii) the nature and extent of the investment adviser's supervision of third party service providers, principally custodians and subcustodians; and (iii) the resources devoted to, and the record of compliance with, the fund's compliance policies and procedures. The Board also reviewed the allocation of fund brokerage, including allocations to brokers affiliated with the Investment Advisers, the use of brokerage commissions to pay fund expenses, and the use of "soft" commission dollars to pay for research services.
The Board noted that the growth of fund assets over time across the complex allows Fidelity to reinvest in the development of services designed to enhance the value or convenience of the Fidelity funds as investment vehicles. These services include 24-hour access to account information and market information through telephone representatives and over the Internet, investor education materials and asset allocation tools, and the expanded availability of Fidelity Investor Centers, with 35 new branches opening since 2010.
Annual Report
Board Approval of Investment Advisory Contracts and
Management Fees - continued
Investment in a Large Fund Family. The Board considered the benefits to shareholders of investing in a Fidelity fund, including the benefits of investing in a fund that is part of a large family of funds offering a variety of investment disciplines and providing a large variety of mutual fund investor services. The Board noted that Fidelity had taken, or had made recommendations that resulted in the Fidelity funds taking, a number of actions over the previous year that benefited particular funds, including (i) continuing to dedicate additional resources to investment research and support of the senior management team that oversees asset management; (ii) rationalizing product lines through the mergers of six funds into other funds; (iii) continuing to migrate the Freedom Funds to dedicated lower cost underlying funds; (iv) obtaining shareholder approval to broaden the investment strategies for Fidelity Consumer Finance Portfolio, Fidelity Emerging Asia Fund, and Fidelity Environment and Alternative Energy Portfolio; (v) contractually agreeing to reduce the management fees and impose other expense limitations on Spartan 500 Index Fund and U.S. Bond Index Fund in connection with launching new institutional classes of these funds; (vi) changing the name, primary and supplemental benchmarks, and investment policies of Fidelity Global Strategies Fund to support the fund's flexible investment mandate and global orientation; and (vii) reducing the transfer agency account fee rates on certain accounts.
Investment Performance. The Board considered whether the fund has operated in accordance with its investment objective, as well as its record of compliance with its investment restrictions. It also reviewed the fund's absolute investment performance for each class, as well as the fund's relative investment performance for each class measured over multiple periods against (i) a broad-based securities market index, and (ii) a peer group of mutual funds deemed appropriate by Fidelity and reviewed by the Board. The following charts considered by the Board show, over the one-, three-, and five-year periods ended December 31, 2010, the cumulative total returns of the retail class and Class B of the fund, the cumulative total returns of a broad-based securities market index ("benchmark"), and a range of cumulative total returns of a peer group of mutual funds identified by Lipper Inc. as having an investment objective similar to that of the fund. The returns of the retail class and Class B show the performance of the highest and lowest performing classes, respectively (based on five-year performance). The box within each chart shows the 25th percentile return (bottom of box) and the 75th percentile return (top of box) of the peer group. Returns shown above the box are in the first quartile and returns shown below the box are in the fourth quartile. The percentage beaten numbers noted below each chart correspond to the percentile box and represent the percentage of funds in the peer group whose performance was equal to or lower than that of the class indicated.
Annual Report
Fidelity International Small Cap Opportunities Fund
The Board reviewed the fund's relative investment performance against its peer group and noted that the performance of the retail class of the fund was in the second quartile for the one-year period and the fourth quartile for the three- and five-year periods. The Board also noted that the investment performance of the fund was lower than its benchmark for the three- and five-year periods although the one-year total return of the retail class compared favorably to its benchmark. The Board considered that the variations in performance among the fund's classes reflect the variations in class expenses, which result in lower performance for higher expense classes. The Board also reviewed the fund's performance since inception as well as performance in the current year.
The Board also considered that the fund's management fee is subject to upward or downward adjustment depending upon whether, and to what extent, the fund's investment performance for the performance period exceeds, or is exceeded by, the record (over the same period) of a Board-approved performance adjustment index. The Board noted that the performance adjustment provides FMR with a strong economic incentive to seek to achieve superior performance for the fund's shareholders and helps to more closely align the interests of FMR and the fund's shareholders.
Based on its review, the Board concluded that the nature, extent, and quality of services provided to the fund under the Advisory Contracts should benefit the fund's shareholders.
Annual Report
Board Approval of Investment Advisory Contracts and
Management Fees - continued
Competitiveness of Management Fee and Total Expense Ratio. The Board considered the fund's management fee and total expense ratio compared to "mapped groups" of competitive funds and classes. Fidelity creates "mapped groups" by combining similar Lipper investment objective categories that have comparable management fee characteristics. Combining Lipper investment objective categories aids the Board's management fee and total expense ratio comparisons by broadening the competitive group used for comparison and by reducing the number of universes to which various Fidelity funds are compared.
Management Fee. The Board considered two proprietary management fee comparisons for the 12-month periods shown in the chart below. The group of Lipper funds used by the Board for management fee comparisons is referred to below as the "Total Mapped Group." The Total Mapped Group is broader than the Lipper peer group used by the Board for performance comparisons because the Total Mapped Group combines several Lipper investment objective categories while the Lipper peer group does not. The Total Mapped Group comparison focuses on a fund's standing relative to the total universe of comparable funds available to investors in terms of gross management fees before expense reimbursements or caps, and without giving effect to the fund's performance adjustment. "TMG %" represents the percentage of funds in the Total Mapped Group that had management fees that were lower than the fund's. For example, a TMG % of 19% means that 81% of the funds in the Total Mapped Group had higher management fees than the fund. The "Asset-Size Peer Group" (ASPG) comparison focuses on a fund's standing relative to non-Fidelity funds similar in size to the fund within the Total Mapped Group. The ASPG represents at least 15% of the funds in the Total Mapped Group with comparable asset size and management fee characteristics, subject to a minimum of 50 funds (or all funds in the Total Mapped Group if fewer than 50). Additional information, such as the ASPG quartile in which the fund's management fee ranked and the impact of the fund's performance adjustment, is also included in the chart and considered by the Board.
Annual Report
Fidelity International Small Cap Opportunities Fund
The Board noted that the fund's management fee ranked below the median of its Total Mapped Group and below the median of its ASPG for 2010. The Board also noted the effect of the fund's negative performance adjustment on the fund's management fee ranking. The Board noted that the performance adjustment for each year represents calculations for performance periods that differ from the periods shown in the performance charts above.
Based on its review, the Board concluded that the fund's management fee is fair and reasonable in light of the services that the fund receives and the other factors considered.
Total Expense Ratio. In its review of each class's total expense ratio, the Board considered the fund's management fee as well as other fund or class expenses, as applicable, such as transfer agent fees, pricing and bookkeeping fees, fund-paid 12b-1 fees, and custodial, legal, and audit fees. The Board also noted the effects of any waivers and reimbursements on fees and expenses, as well as the impact of the fund's performance adjustment. As part of its review, the Board also considered the current and historical total expense ratios of each class of the fund compared to competitive fund median expenses. Each class of the fund is compared to those funds and classes in the Total Mapped Group (used by the Board for management fee comparisons) that have a similar sales load structure.
The Board noted that the total expense ratio of each class ranked below its competitive median for 2010. The Board considered that various factors, including 12b-1 fees, positive or negative performance adjustments, and relatively higher other expenses in the case of small fund size, can affect total expense ratios.
Annual Report
Board Approval of Investment Advisory Contracts and
Management Fees - continued
Fees Charged to Other Fidelity Clients. The Board also considered Fidelity fee structures and other information with respect to clients of FMR and its affiliates, such as other mutual funds advised or subadvised by FMR or its affiliates, pension plan clients, and other institutional clients. In March 2010, the Board created an ad hoc joint committee with the board of other Fidelity funds (the Committee) to review and compare Fidelity's institutional investment advisory business with its business of providing services to the Fidelity funds, including the differences in services provided, fees charged, and costs incurred, as well as competition in their respective marketplaces.
Based on its review of total expense ratios and fees charged to other Fidelity clients, the Board concluded that the total expense ratio of each class of the fund was reasonable in light of the services that the fund and its shareholders receive and the other factors considered, including the findings of the Committee.
Costs of the Services and Profitability. The Board considered the revenues earned and the expenses incurred by Fidelity in conducting the business of developing, marketing, distributing, managing, administering and servicing the fund and its shareholders. The Board also considered the level of Fidelity's profits in respect of all the Fidelity funds.
On an annual basis, FMR presents to the Board Fidelity's profitability for the fund. Fidelity calculates the profitability for each fund, as well as aggregate profitability for groups of Fidelity funds and all Fidelity funds, using a series of detailed revenue and cost allocation methodologies which originate with the books and records of Fidelity on which Fidelity's audited financial statements are based. The Audit Committee of the Board reviews any significant changes from the prior year's methodologies.
PricewaterhouseCoopers LLP (PwC), independent registered public accounting firm and auditor to Fidelity and certain Fidelity funds, has been engaged annually by the Board as part of the Board's assessment of Fidelity's profitability analysis. PwC's engagement includes the review and assessment of Fidelity's methodologies used in determining the revenues and expenses attributable to Fidelity's mutual fund business, and completion of agreed-upon procedures surrounding the mathematical accuracy of fund profitability and its conformity to allocation methodologies. After considering PwC's reports issued under the engagement and information provided by Fidelity, the Board concluded that while other allocation methods may also be reasonable, Fidelity's profitability methodologies are reasonable in all material respects.
The Board also reviewed Fidelity's non-fund businesses and fall-out benefits related to the mutual fund business as well as cases where Fidelity's affiliates may benefit from or be related to the fund's business.
Annual Report
The Board considered the costs of the services provided by and the profits realized by Fidelity in connection with the operation of the fund and was satisfied that the profitability was not excessive in the circumstances.
Economies of Scale. The Board considered whether there have been economies of scale in respect of the management of the Fidelity funds, whether the Fidelity funds (including the fund) have appropriately benefited from any such economies of scale, and whether there is potential for realization of any further economies of scale. The Board considered the extent to which the fund will benefit from economies of scale through increased services to the fund, through waivers or reimbursements, or through fee or expense reductions. The Board also noted that in 2009, it and the board of other Fidelity funds created an ad hoc committee (the Economies of Scale Committee) to analyze whether FMR attains economies of scale in respect of the management and servicing of the Fidelity funds, whether the Fidelity funds have appropriately benefited from such economies of scale, and whether there is potential for realization of any further economies of scale.
The Board recognized that the fund's management contract incorporates a "group fee" structure, which provides for lower group fee rates as total fund assets under FMR's management increase, and for higher group fee rates as total fund assets under FMR's management decrease. FMR calculates the group fee rates based on a tiered asset "breakpoint" schedule that varies based on asset class. The Board considered that the group fee is designed to deliver the benefits of economies of scale to fund shareholders when total Fidelity fund assets increase, even if assets of any particular fund are unchanged or have declined, because some portion of Fidelity's costs are attributable to services provided to all Fidelity funds, and all funds benefit if those costs can be allocated among more assets. The Board concluded that, given the group fee structure, fund shareholders will benefit from lower management fees as assets under FMR's management increase at the fund complex level, regardless of whether Fidelity achieves any such economies of scale.
The Board concluded, taking into account the analysis of the Economies of Scale Committee, that any potential economies of scale are being appropriately shared between fund shareholders and Fidelity.
Additional Information Requested by the Board. In order to develop fully the factual basis for consideration of the Fidelity funds' Advisory Contracts, the Board requested and received additional information on certain topics, including (i) fund performance trends, actions to be taken by FMR to improve certain funds' overall performance, and Fidelity's long-term strategies for certain funds; (ii) portfolio manager changes that have occurred during the past year and length of portfolio manager tenure for different categories of funds over time; (iii) Fidelity's compensation structure for portfolio managers and other key personnel and strategies for attracting and retaining non-investment personnel; (iv) the amount of the investment that each portfolio manager has made in the Fidelity fund(s) that he or she manages; (v) historical trends in Fidelity's realization of fall-out benefits; (vi) Fidelity's group fee structures and the rationale for the individual fee rates of certain funds; (vii) fund profitability methodology and the impact of certain factors on fund profitability results; (viii) trends regarding industry use of performance fee structures and Fidelity's compliance practices with respect to performance adjustment calculations; (ix) the fee structures in place for certain other Fidelity clients; and (x) explanations regarding the relative total expense ratios of certain funds and classes, total expense competitive trends, and actions that might be taken by FMR to reduce total expense ratios for certain funds and classes.
Annual Report
Board Approval of Investment Advisory Contracts and
Management Fees - continued
Based on its evaluation of all of the conclusions noted above, and after considering all factors it believed relevant, the Board ultimately concluded that the advisory fee structures are fair and reasonable, and that the fund's Advisory Contracts should be renewed.
Annual Report
Investment Adviser
Fidelity Management & Research Company
Boston, MA
Investment Sub-Advisers
FMR Co., Inc.
Fidelity Management & Research
(U.K.) Inc.
Fidelity Management & Research
(Hong Kong) Limited
Fidelity Management & Research
(Japan) Inc.
FIL Investment Advisors
FIL Investments (Japan) Limited
FIL Investment Advisors (U.K.) Limited
General Distributor
Fidelity Distributors Corporation
Boston, MA
Transfer and Service Agents
Fidelity Investments Institutional
Operations Company, Inc.
Boston, MA
Fidelity Service Company, Inc.
Boston, MA
Custodian
The Northern Trust Company
Chicago, IL
AILSI-UANN-1211
1.815081.106
Fidelity®
International Value
Fund
Annual Report
October 31, 2011
Contents
Chairman's Message | (Click Here) | The Chairman's message to shareholders. |
Performance | (Click Here) | How the fund has done over time. |
Management's Discussion of Fund Performance | (Click Here) | The Portfolio Manager's review of fund performance and strategy. |
Shareholder Expense Example | (Click Here) | An example of shareholder expenses. |
Investment Changes | (Click Here) | A summary of major shifts in the fund's investments over the past six months. |
Investments | (Click Here) | A complete list of the fund's investments with their market values. |
Financial Statements | (Click Here) | Statements of assets and liabilities, operations, and changes in net assets, as well as financial highlights. |
Notes | (Click Here) | Notes to financial statements. |
Report of Independent Registered Public Accounting Firm | (Click Here) | |
Trustees and Officers | (Click Here) | |
Distributions | (Click Here) | |
Board Approval of Investment Advisory Contracts and Management Fees | (Click Here) | |
To view a fund's proxy voting guidelines and proxy voting record for the 12-month period ended June 30, visit http://www.fidelity.com/proxyvotingresults or visit the Securities and Exchange Commission's (SEC) web site at http://www.sec.gov. You may also call 1-800-544-8544 to request a free copy of the proxy voting guidelines.
Standard & Poor's, S&P and S&P 500 are registered service marks of The McGraw-Hill Companies, Inc. and have been licensed for use by Fidelity Distributors Corporation.
Other third party marks appearing herein are the property of their respective owners.
All other marks appearing herein are registered or unregistered trademarks or service marks of FMR LLC or an affiliated company.
Annual Report
This report and the financial statements contained herein are submitted for the general information of the shareholders of the fund. This report is not authorized for distribution to prospective investors in the fund unless preceded or accompanied by an effective prospectus.
A fund files its complete schedule of portfolio holdings with the SEC for the first and third quarters of each fiscal year on Form N-Q. Forms N-Q are available on the SEC's web site at http://www.sec.gov. A fund's Forms N-Q may be reviewed and copied at the SEC's Public Reference Room in Washington, DC. Information regarding the operation of the SEC's Public Reference Room may be obtained by calling 1-800-SEC-0330. For a complete list of a fund's portfolio holdings, view the most recent holdings listing, semiannual report, or annual report on Fidelity's web site at http://www.fidelity.com, http://www.advisor.fidelity.com, or http://www.401k.com, as applicable.
NOT FDIC INSURED • MAY LOSE VALUE • NO BANK GUARANTEE
Neither the fund nor Fidelity Distributors Corporation is a bank.
Annual Report
(Acting Chairman's Photograph)
Dear Shareholder:
Global equity markets began the fourth quarter on a strong note, sharply reversing course in October amid strong corporate earnings, better-than-expected economic news and the promise of a resolution to the sovereign debt crisis in Europe. The mini rally followed a third quarter marked by a significant downturn in July and August, which heightened investor anxiety and set off a wave of volatility that hampered most major asset classes through the end of September. Financial markets are difficult to predict, of course, but you can help put the odds in your favor by following these time-tested investment principles.
One of the basic tenets is to invest according to your time horizon. For long-term investors, riding out the markets' inevitable ups and downs has proven much more effective than making decisions based on short-term developments. If your goal is approaching, you can also benefit from patience and restraint, rather than attempting to time the market. No matter your time horizon, missing only a few of the markets' best days can significantly diminish returns. Patience also affords the benefits of compounding - earning interest on additional income or reinvested dividends and capital gains. While staying the course doesn't eliminate risk, it can considerably lessen the negative impact of short-term downturns.
Asset allocation is another principle to manage risk. As you spread your portfolio among the asset classes, be sure to consider your time horizon, risk tolerance and investment objectives. Younger investors may be better served by emphasizing equities, which historically have been the best-performing asset class over time. Investors who are nearing a specific goal, such as retirement or sending a child to college, may choose to favor bonds and other investments that have tended to be more stable. Studies indicate that asset allocation is the single most important determinant of a portfolio's long-term success. After deciding on a suitable allocation strategy, make sure your portfolio is adequately diversified, with exposure to stocks of small-, mid- and large-cap companies in a range of sectors, for example. And today, more than ever, geographic diversification should be taken into account.
Lastly, investing a certain amount of money on a regular basis - a principle known as dollar-cost averaging - can help lower the average cost of your purchases, while also giving you the discipline to avoid selling weak performers just prior to an upswing, or chasing a hot performer just before a correction.
We invite you to learn more by visiting us on the Internet, dropping by one of our Investor Centers or calling us by phone. It is our privilege to provide the resources you need to choose investments that are right for you.
Sincerely,
(Acting Chairman's Signature)
James C. Curvey
Acting Chairman
Annual Report
Average annual total return reflects the change in the value of an investment, assuming reinvestment of the class' distributions from dividend income and capital gains (the profits earned upon the sale of securities that have grown in value, if any) and assuming a constant rate of performance each year. The $10,000 table and the fund's returns do not reflect the deduction of taxes that a shareholder would pay on fund distributions or the redemption of fund shares. During periods of reimbursement by Fidelity, a fund's total return will be greater than it would be had the reimbursement not occurred. How a fund did yesterday is no guarantee of how it will do tomorrow.
Average Annual Total Returns
Periods ended October 31, 2011 | Past 1
year | Past 5
years | Life of
classA |
Fidelity® International Value Fund | -11.91% | -5.28% | -3.81% |
A From May 18, 2006
$10,000 Over Life of Fund
Let's say hypothetically that $10,000 was invested in Fidelity® International Value Fund, a class of the fund, on May 18, 2006, when the fund started. The chart shows how the value of your investment would have changed, and also shows how the MSCI® EAFE® (Europe, Australasia, Far East) Value Index performed over the same period.
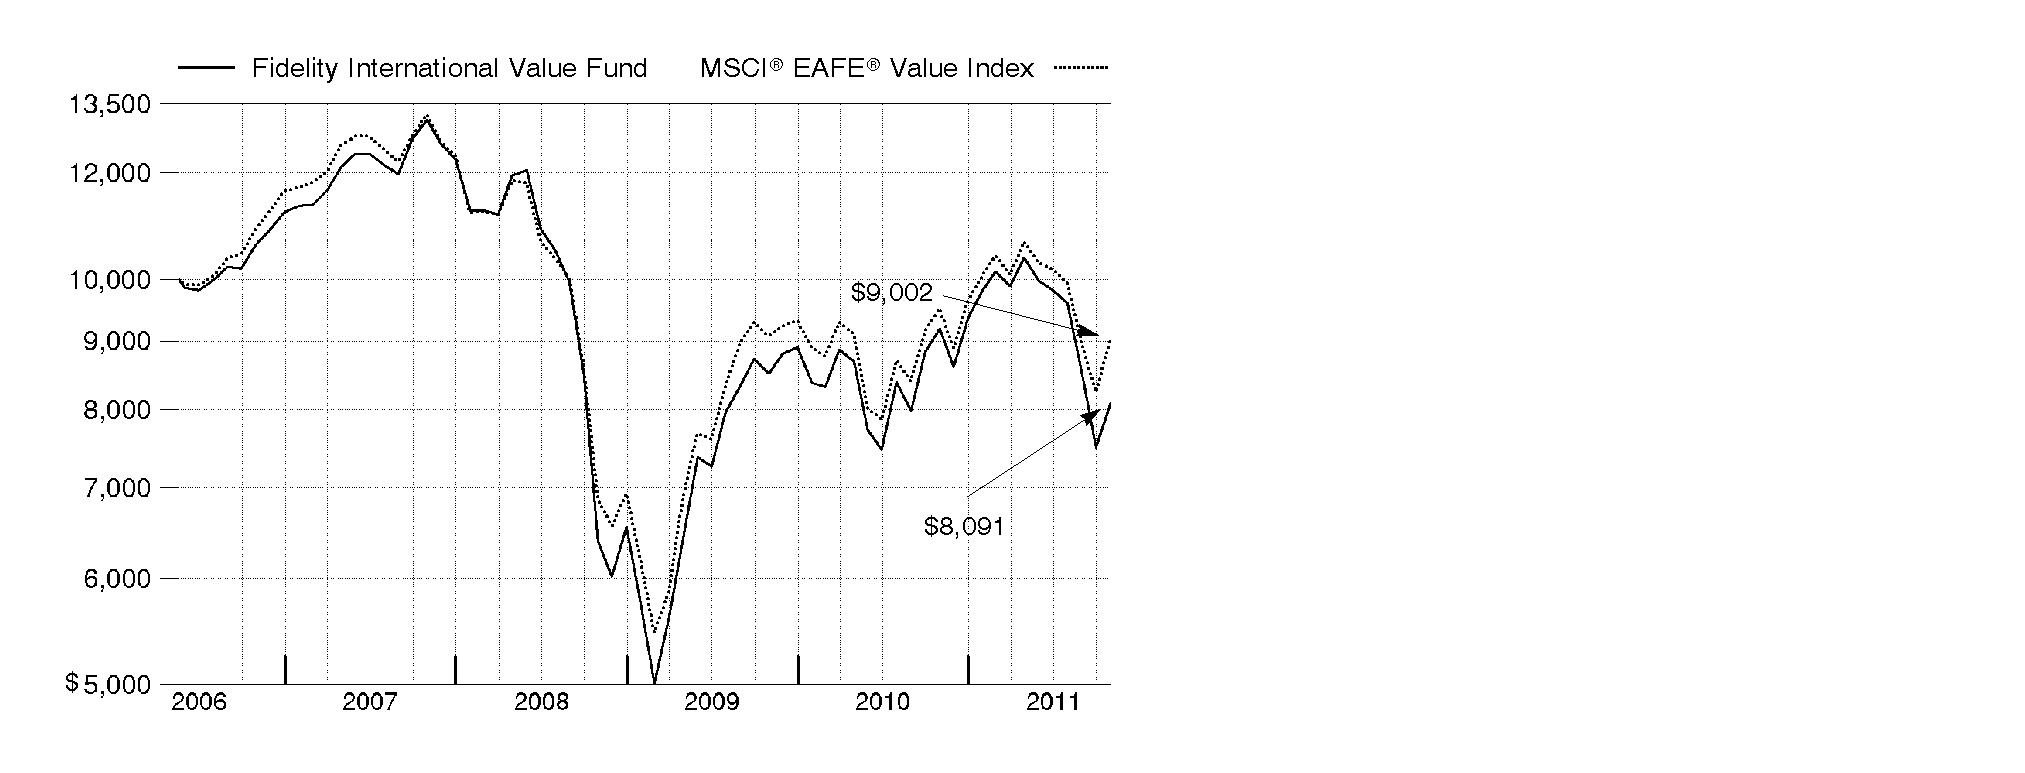
Annual Report
Market Recap: International equities were rocked by a number of headline events during the year ending October 31, 2011. Stocks posted a solid advance for the first half of the period, despite concern about the sovereign debt crisis in Europe, a devastating earthquake and tsunami in Japan, and political upheaval in the Middle East and North Africa. Sentiment turned decidedly negative in the second half, however, as fresh worries about Europe, inflation in China and a dimmed outlook for global growth caused foreign markets to suffer declines that intensified in August and September. October brought with it yet another dramatic swing, as eurozone policymakers appeared near a resolution to the debt debacle and buyers stormed back onto the scene in search of bargains. Still, those gains - along with favorable currency fluctuations overall - weren't enough to offset prior losses, and the MSCIr ACWIr (All Country World Index) ex USA Index finished the period down 4.56%. Within the MSCI index, Europe and emerging markets suffered the biggest declines, with many countries in these areas sustaining steep losses. By contrast, Japan showed resilience in the wake of its natural disasters, falling only 2%. Australia (+4%), Switzerland (+3%), the U.K. (+2%) and Canada, which produced a nominal return, were among the few major benchmark components to break into positive territory.
Comments from Alex Zavratsky, who became Portfolio Manager of Fidelity® International Value Fund on September 6, 2011: For the year, the fund's Retail Class shares fell 11.91%, trailing the 5.33% drop of the benchmark MSCI® EAFE® (Europe, Australasia, Far East) Value Index. In geographic terms, weak stock picking in and a lack of exposure to the comparatively healthy Asia Pacific ex Japan region, especially Australia, was detrimental to performance. Stock selection also was detrimental in the U.K., continental Europe - particularly France - and Japan. Sector-wise, the biggest source of weakness was the financials sector, where holdings in several European banks were among the biggest detractors, including France-based Societe Generale, Italy's Intesa Sanpaolo and an out-of-index stake in Lloyds Banking Group in the U.K. Elsewhere within financials, French insurance firm AXA and ING Groep, a diversified financials company in the Netherlands, hampered results. Picks in energy, consumer discretionary and industrials also hurt. However, positioning in utilities was a bright spot. Here, the fund's lack of exposure to Japanese utility Tokyo Electric Power, a benchmark component, was the biggest individual contributor, while out-of-index stakes in Swiss pharma firm Roche Holding and Canada-based miner Yamana Gold also aided results. Some of the stocks I've mentioned in this report were sold from the fund by period end.
The views expressed above reflect those of the portfolio manager(s) only through the end of the period as stated on the cover of this report and do not necessarily represent the views of Fidelity or any other person in the Fidelity organization. Any such views are subject to change at any time based upon market or other conditions and Fidelity disclaims any responsibility to update such views. These views may not be relied on as investment advice and, because investment decisions for a Fidelity fund are based on numerous factors, may not be relied on as an indication of trading intent on behalf of any Fidelity fund.
Annual Report
Shareholder Expense Example
As a shareholder of the Fund, you incur two types of costs: (1) transaction costs, including sales charges (loads) on purchase payments or redemption proceeds, redemption fees, and (2) ongoing costs, including management fees, distribution and/or service (12b-1) fees and other Fund expenses. This Example is intended to help you understand your ongoing costs (in dollars) of investing in the Fund and to compare these costs with the ongoing costs of investing in other mutual funds.
The Example is based on an investment of $1,000 invested at the beginning of the period and held for the entire period (May 1, 2011 to October 31, 2011).
Actual Expenses
The first line of the accompanying table for each class of the Fund provides information about actual account values and actual expenses. You may use the information in this line, together with the amount you invested, to estimate the expenses that you paid over the period. Simply divide your account value by $1,000.00 (for example, an $8,600 account value divided by $1,000.00 = 8.6), then multiply the result by the number in the first line for a class of the Fund under the heading entitled "Expenses Paid During Period" to estimate the expenses you paid on your account during this period. A small balance maintenance fee of $12.00 that is charged once a year may apply for certain accounts with a value of less than $2,000. This fee is not included in the table below. If it was, the estimate of expenses you paid during the period would be higher, and your ending account value lower, by this amount. In addition, the Fund, as a shareholder in the underlying Fidelity Central Funds, will indirectly bear its pro-rata share of the fees and expenses incurred by the underlying Fidelity Central Funds. These fees and expenses are not included in the Fund's annualized expense ratio used to calculate the expense estimate in the table below.
Hypothetical Example for Comparison Purposes
The second line of the accompanying table for each class of the Fund provides information about hypothetical account values and hypothetical expenses based on a Class' actual expense ratio and an assumed rate of return of 5% per year before expenses, which is not the Class' actual return. The hypothetical account values and expenses may not be used to estimate the actual ending account balance or expenses you paid for the period. You may use this information to compare the ongoing costs of investing in the Fund and other funds. To do so, compare this 5% hypothetical example with the 5% hypothetical examples that appear in the shareholder reports of the other funds. A small balance maintenance fee of $12.00 that is charged once a year may apply for certain accounts with a value of less than $2,000. This fee is not included in the table below. If it was, the estimate of expenses you paid during the period would be higher, and your ending account value lower, by this amount. In addition, the Fund, as a shareholder in the underlying Fidelity Central Funds, will indirectly bear its pro-rata share of the fees and expenses incurred by the underlying Fidelity Central Funds. These fees and expenses are not included in the Fund's annualized expense ratio used to calculate the expense estimate in the table below.
Please note that the expenses shown in the table are meant to highlight your ongoing costs only and do not reflect any transaction costs. Therefore, the second line of the table is useful in comparing ongoing costs only, and will not help you determine the relative total costs of owning different funds. In addition, if these transactional costs were included, your costs would have been higher.
Annual Report
| Annualized Expense Ratio | Beginning
Account Value
May 1, 2011 | Ending
Account Value
October 31, 2011 | Expenses Paid
During Period*
May 1, 2011 to
October 31, 2011 |
Class A | 1.35% | | | |
Actual | | $ 1,000.00 | $ 778.30 | $ 6.05 |
Hypothetical A | | $ 1,000.00 | $ 1,018.40 | $ 6.87 |
Class T | 1.62% | | | |
Actual | | $ 1,000.00 | $ 776.90 | $ 7.26 |
Hypothetical A | | $ 1,000.00 | $ 1,017.04 | $ 8.24 |
Class B | 2.09% | | | |
Actual | | $ 1,000.00 | $ 774.30 | $ 9.35 |
Hypothetical A | | $ 1,000.00 | $ 1,014.67 | $ 10.61 |
Class C | 2.10% | | | |
Actual | | $ 1,000.00 | $ 774.30 | $ 9.39 |
Hypothetical A | | $ 1,000.00 | $ 1,014.62 | $ 10.66 |
International Value | 1.02% | | | |
Actual | | $ 1,000.00 | $ 779.40 | $ 4.57 |
Hypothetical A | | $ 1,000.00 | $ 1,020.06 | $ 5.19 |
Institutional Class | .98% | | | |
Actual | | $ 1,000.00 | $ 778.80 | $ 4.39 |
Hypothetical A | | $ 1,000.00 | $ 1,020.27 | $ 4.99 |
A 5% return per year before expenses
* Expenses are equal to each Class' annualized expense ratio, multiplied by the average account value over the period, multiplied by 184/365 (to reflect the one-half year period).
Annual Report
Investment Changes (Unaudited)
Geographic Diversification (% of fund's net assets) |
As of October 31, 2011 |
| United Kingdom 27.1% | |
| Japan 21.8% | |
| Germany 10.6% | |
| France 8.5% | |
| Switzerland 7.6% | |
| Australia 6.3% | |
| Norway 2.9% | |
| Netherlands 2.8% | |
| Italy 2.7% | |
| Other 9.7% | |

Percentages are adjusted for the effect of futures contracts, if applicable. |
As of April 30, 2011 |
| United Kingdom 20.1% | |
| Japan 17.0% | |
| France 9.9% | |
| Germany 7.5% | |
| Spain 6.3% | |
| Switzerland 4.8% | |
| Netherlands 4.0% | |
| Canada 3.3% | |
| Hong Kong 3.2% | |
| Other 23.9% | |

Percentages are adjusted for the effect of futures contracts, if applicable. |
Asset Allocation |
| % of fund's
net assets | % of fund's net assets
6 months ago |
Stocks | 99.2 | 98.0 |
Short-Term Investments and Net Other Assets | 0.8 | 2.0 |
Top Ten Stocks as of October 31, 2011 |
| % of fund's
net assets | % of fund's net assets
6 months ago |
Royal Dutch Shell PLC Class A sponsored ADR (United Kingdom, Oil, Gas & Consumable Fuels) | 5.9 | 4.4 |
Vodafone Group PLC sponsored ADR (United Kingdom, Wireless Telecommunication Services) | 3.5 | 2.3 |
GlaxoSmithKline PLC sponsored ADR (United Kingdom, Pharmaceuticals) | 3.5 | 1.8 |
Commonwealth Bank of Australia (Australia, Commercial Banks) | 2.9 | 0.3 |
Sanofi-aventis (France, Pharmaceuticals) | 2.9 | 0.0 |
BP PLC sponsored ADR (United Kingdom, Oil, Gas & Consumable Fuels) | 2.8 | 2.4 |
Roche Holding AG (participation certificate) (Switzerland, Pharmaceuticals) | 2.8 | 1.9 |
Nestle SA (Switzerland, Food Products) | 2.2 | 0.0 |
Allianz AG (Germany, Insurance) | 2.0 | 0.0 |
Australia & New Zealand Banking Group Ltd. (Australia, Commercial Banks) | 1.9 | 0.0 |
| 30.4 | |
Market Sectors as of October 31, 2011 |
| % of fund's
net assets | % of fund's net assets
6 months ago |
Financials | 24.1 | 35.6 |
Energy | 13.2 | 12.6 |
Health Care | 11.7 | 5.3 |
Telecommunication Services | 11.6 | 6.0 |
Consumer Staples | 9.1 | 1.8 |
Utilities | 7.8 | 5.3 |
Consumer Discretionary | 7.5 | 10.3 |
Industrials | 6.4 | 8.8 |
Materials | 5.1 | 7.6 |
Information Technology | 2.7 | 4.7 |
Annual Report
Investments October 31, 2011
Showing Percentage of Net Assets
Common Stocks - 98.6% |
| Shares | | Value |
Australia - 6.3% |
Australia & New Zealand Banking Group Ltd. | 138,811 | | $ 3,136,930 |
Commonwealth Bank of Australia | 90,577 | | 4,653,389 |
Macquarie Group Ltd. | 29,691 | | 764,505 |
Telstra Corp. Ltd. | 508,385 | | 1,650,851 |
TOTAL AUSTRALIA | | 10,205,675 |
Bailiwick of Guernsey - 0.3% |
Resolution Ltd. | 112,600 | | 497,979 |
Bailiwick of Jersey - 0.5% |
Wolseley PLC | 29,862 | | 863,473 |
France - 8.5% |
Atos Origin SA | 13,608 | | 659,501 |
BNP Paribas SA | 45,993 | | 2,090,893 |
Casino Guichard Perrachon et Compagnie | 8,507 | | 799,611 |
Compagnie de St. Gobain | 13,677 | | 637,671 |
Euler Hermes SA | 4,358 | | 315,785 |
GDF Suez | 52,500 | | 1,490,512 |
Pernod-Ricard SA | 9,200 | | 859,402 |
PPR SA | 8,725 | | 1,363,214 |
Sanofi-aventis | 64,860 | | 4,640,692 |
Unibail-Rodamco | 4,566 | | 913,079 |
TOTAL FRANCE | | 13,770,360 |
Germany - 10.3% |
Allianz AG | 24,614 | | 2,766,282 |
Allianz AG sponsored ADR | 43,400 | | 486,080 |
BASF AG | 41,646 | | 3,065,547 |
Bayer AG | 31,246 | | 2,001,858 |
Daimler AG (United States) (d) | 30,700 | | 1,560,788 |
Deutsche Telekom AG | 119,500 | | 1,520,467 |
E.ON AG | 72,160 | | 1,748,588 |
HeidelbergCement AG | 15,400 | | 702,872 |
Metro AG | 12,500 | | 582,795 |
Siemens AG | 15,311 | | 1,605,145 |
Volkswagen AG | 3,535 | | 556,719 |
TOTAL GERMANY | | 16,597,141 |
Hong Kong - 0.6% |
Henderson Land Development Co. Ltd. | 20,000 | | 109,321 |
Power Assets Holdings Ltd. | 114,500 | | 870,064 |
TOTAL HONG KONG | | 979,385 |
Common Stocks - continued |
| Shares | | Value |
Ireland - 0.7% |
CRH PLC sponsored ADR (d) | 56,800 | | $ 1,045,688 |
Italy - 2.4% |
ENI SpA | 138,600 | | 3,064,045 |
Intesa Sanpaolo SpA | 457,645 | | 817,635 |
TOTAL ITALY | | 3,881,680 |
Japan - 21.8% |
ABC-Mart, Inc. | 13,900 | | 544,420 |
Aeon Credit Service Co. Ltd. | 51,800 | | 772,586 |
Air Water, Inc. | 63,000 | | 799,836 |
Aisin Seiki Co. Ltd. | 15,800 | | 499,770 |
Aozora Bank Ltd. | 482,000 | | 1,218,664 |
Asahi Glass Co. Ltd. | 58,000 | | 507,967 |
Canon, Inc. | 25,800 | | 1,171,413 |
Chubu Electric Power Co., Inc. | 42,600 | | 779,498 |
Credit Saison Co. Ltd. | 45,000 | | 878,236 |
Denso Corp. | 38,300 | | 1,178,001 |
Dentsu, Inc. | 23,700 | | 713,704 |
Fanuc Corp. | 4,900 | | 792,384 |
Honda Motor Co. Ltd. | 49,900 | | 1,492,388 |
INPEX Corp. | 150 | | 990,439 |
Itochu Corp. | 172,500 | | 1,706,320 |
Japan Retail Fund Investment Corp. | 1,012 | | 1,566,749 |
Japan Tobacco, Inc. | 516 | | 2,579,382 |
JSR Corp. | 42,300 | | 807,615 |
JX Holdings, Inc. | 200,600 | | 1,168,621 |
KDDI Corp. | 285 | | 2,087,994 |
Mitsubishi Corp. | 41,800 | | 859,809 |
Mitsubishi Tanabe Pharma Corp. | 73,400 | | 1,269,783 |
Nippon Telegraph & Telephone Corp. | 42,900 | | 2,200,873 |
Obic Co. Ltd. | 3,870 | | 731,757 |
ORIX Corp. | 9,540 | | 832,713 |
Santen Pharmaceutical Co. Ltd. | 19,900 | | 742,635 |
Seven & i Holdings Co., Ltd. | 39,300 | | 1,048,884 |
Tokio Marine Holdings, Inc. | 28,800 | | 686,809 |
Tokyo Gas Co. Ltd. | 313,000 | | 1,348,051 |
Toray Industries, Inc. | 127,000 | | 904,026 |
USS Co. Ltd. | 9,290 | | 768,095 |
West Japan Railway Co. | 37,700 | | 1,597,689 |
TOTAL JAPAN | | 35,247,111 |
Common Stocks - continued |
| Shares | | Value |
Korea (South) - 0.6% |
Samsung Electronics Co. Ltd. | 1,050 | | $ 900,532 |
Mexico - 0.7% |
Grupo Modelo SAB de CV Series C | 163,000 | | 1,033,913 |
Netherlands - 2.8% |
ING Groep NV: | | | |
(Certificaten Van Aandelen) (a) | 177,668 | | 1,531,893 |
sponsored ADR (a) | 57,141 | | 493,698 |
Koninklijke KPN NV | 58,620 | | 770,356 |
Koninklijke Philips Electronics NV | 38,000 | | 791,149 |
Unilever NV (Certificaten Van Aandelen) (Bearer) unit | 28,900 | | 997,878 |
TOTAL NETHERLANDS | | 4,584,974 |
Norway - 2.9% |
Aker Solutions ASA | 39,270 | | 456,702 |
DnB NOR ASA | 110,200 | | 1,285,561 |
Orkla ASA (A Shares) (d) | 114,700 | | 999,165 |
Telenor ASA | 111,600 | | 1,992,428 |
TOTAL NORWAY | | 4,733,856 |
Portugal - 0.2% |
Energias de Portugal SA | 119,836 | | 378,947 |
Singapore - 1.9% |
Singapore Telecommunications Ltd. | 686,000 | | 1,733,801 |
United Overseas Bank Ltd. | 102,480 | | 1,389,391 |
TOTAL SINGAPORE | | 3,123,192 |
Spain - 2.5% |
Banco Bilbao Vizcaya Argentaria SA sponsored ADR (d) | 249,725 | | 2,257,514 |
Red Electrica Corporacion SA | 11,600 | | 561,462 |
Repsol YPF SA | 37,297 | | 1,130,375 |
TOTAL SPAIN | | 3,949,351 |
Sweden - 0.9% |
Tele2 AB (B Shares) | 29,100 | | 614,177 |
Telefonaktiebolaget LM Ericsson (B Shares) | 73,030 | | 760,985 |
TOTAL SWEDEN | | 1,375,162 |
Switzerland - 7.6% |
Nestle SA | 61,138 | | 3,546,150 |
Roche Holding AG (participation certificate) | 27,505 | | 4,535,324 |
Syngenta AG (Switzerland) | 2,900 | | 883,943 |
Transocean Ltd. (United States) | 7,839 | | 447,999 |
Common Stocks - continued |
| Shares | | Value |
Switzerland - continued |
UBS AG (NY Shares) (a) | 77,800 | | $ 981,836 |
Zurich Financial Services AG | 8,111 | | 1,883,678 |
TOTAL SWITZERLAND | | 12,278,930 |
United Kingdom - 27.1% |
Aegis Group PLC | 176,727 | | 389,939 |
Aviva PLC | 212,728 | | 1,160,768 |
Barclays PLC | 592,002 | | 1,835,515 |
BP PLC sponsored ADR | 103,035 | | 4,552,086 |
British American Tobacco PLC (United Kingdom) | 17,400 | | 797,944 |
British Land Co. PLC | 80,100 | | 657,610 |
Centrica PLC | 161,725 | | 771,676 |
Compass Group PLC | 90,200 | | 821,038 |
GlaxoSmithKline PLC sponsored ADR | 125,600 | | 5,625,624 |
HSBC Holdings PLC sponsored ADR | 29,770 | | 1,299,758 |
Imperial Tobacco Group PLC | 46,179 | | 1,688,788 |
International Power PLC | 201,018 | | 1,093,323 |
National Grid PLC | 207,100 | | 2,059,381 |
Next PLC | 11,800 | | 485,046 |
Prudential PLC | 170,349 | | 1,759,882 |
Reed Elsevier PLC | 164,300 | | 1,412,295 |
Royal Dutch Shell PLC Class A sponsored ADR (d) | 133,400 | | 9,459,392 |
Scottish & Southern Energy PLC | 68,827 | | 1,487,641 |
Tesco PLC | 129,900 | | 839,277 |
Vodafone Group PLC sponsored ADR | 202,766 | | 5,645,005 |
TOTAL UNITED KINGDOM | | 43,841,988 |
TOTAL COMMON STOCKS (Cost $170,522,198) | 159,289,337 |
Nonconvertible Preferred Stocks - 0.6% |
| | | |
Germany - 0.3% |
Volkswagen AG | 3,327 | | 583,817 |
Italy - 0.3% |
Telecom Italia SpA (Risparmio Shares) | 489,900 | | 514,204 |
TOTAL NONCONVERTIBLE PREFERRED STOCKS (Cost $1,433,774) | 1,098,021 |
Money Market Funds - 7.3% |
| Shares | | | Value |
Fidelity Cash Central Fund, 0.12% (b) | 143,971 | | $ 143,971 |
Fidelity Securities Lending Cash Central Fund, 0.11% (b)(c) | 11,625,914 | | 11,625,914 |
TOTAL MONEY MARKET FUNDS (Cost $11,769,885) | | 11,769,885 |
TOTAL INVESTMENT PORTFOLIO - 106.5% (Cost $183,725,857) | 172,157,243 |
NET OTHER ASSETS (LIABILITIES) - (6.5)% | (10,572,704) |
NET ASSETS - 100% | $ 161,584,539 |
Legend |
(a) Non-income producing |
(b) Affiliated fund that is available only to investment companies and other accounts managed by Fidelity Investments. The rate quoted is the annualized seven-day yield of the fund at period end. A complete unaudited listing of the fund's holdings as of its most recent quarter end is available upon request. In addition, each Fidelity Central Fund's financial statements, which are not covered by the Fund's Report of Independent Registered Public Accounting Firm, are available on the SEC's website or upon request. |
(c) Investment made with cash collateral received from securities on loan. |
(d) Security or a portion of the security is on loan at period end. |
Affiliated Central Funds |
Information regarding fiscal year to date income earned by the Fund from investments in Fidelity Central Funds is as follows: |
Fund | Income earned |
Fidelity Cash Central Fund | $ 3,498 |
Fidelity Securities Lending Cash Central Fund | 221,316 |
Total | $ 224,814 |
Other Information |
The following is a summary of the inputs used, as of October 31, 2011, involving the Fund's assets and liabilities carried at fair value. The inputs or methodology used for valuing securities may not be an indication of the risk associated with investing in those securities. For more information on valuation inputs, and their aggregation into the levels used in the table below, please refer to the Security Valuation section in the accompanying Notes to Financial Statements. |
Valuation Inputs at Reporting Date: |
Description | Total | Level 1 | Level 2 | Level 3 |
Investments in Securities: | | | | |
Equities: | | | | |
United Kingdom | $ 43,841,988 | $ 36,228,498 | $ 7,613,490 | $ - |
Japan | 35,247,111 | - | 35,247,111 | - |
Germany | 17,180,958 | 15,575,813 | 1,605,145 | - |
France | 13,770,360 | 9,129,668 | 4,640,692 | - |
Switzerland | 12,278,930 | 11,394,987 | 883,943 | - |
Australia | 10,205,675 | - | 10,205,675 | - |
Norway | 4,733,856 | 4,733,856 | - | - |
Netherlands | 4,584,974 | 1,264,054 | 3,320,920 | - |
Italy | 4,395,884 | 817,635 | 3,578,249 | - |
Other | 14,147,622 | 8,383,528 | 5,764,094 | - |
Money Market Funds | 11,769,885 | 11,769,885 | - | - |
Total Investments in Securities: | $ 172,157,243 | $ 99,297,924 | $ 72,859,319 | $ - |
Income Tax Information |
At October 31, 2011, the Fund had a capital loss carryforward of approximately $117,406,155 of which $17,089,067, $65,376,972, $3,571,319 and $31,368,797 will expire in fiscal 2016, 2017, 2018 and 2019, respectively. Capital loss carryforwards are only available to offset future capital gains of the Fund to the extent provided by regulations and may be limited. |
See accompanying notes which are an integral part of the financial statements.
Annual Report
Statement of Assets and Liabilities
| October 31, 2011 |
Assets | | |
Investment in securities, at value (including securities loaned of $11,205,139) - See accompanying schedule: Unaffiliated issuers (cost $171,955,972) | $ 160,387,358 | |
Fidelity Central Funds (cost $11,769,885) | 11,769,885 | |
Total Investments (cost $183,725,857) | | $ 172,157,243 |
Foreign currency held at value (cost $6,508) | | 6,508 |
Receivable for investments sold | | 2,643,297 |
Receivable for fund shares sold | | 68,159 |
Dividends receivable | | 742,086 |
Distributions receivable from Fidelity Central Funds | | 1,186 |
Prepaid expenses | | 754 |
Other receivables | | 24,694 |
Total assets | | 175,643,927 |
| | |
Liabilities | | |
Payable to custodian bank | $ 578 | |
Payable for investments purchased | 2,093,650 | |
Payable for fund shares redeemed | 155,013 | |
Accrued management fee | 82,006 | |
Distribution and service plan fees payable | 4,397 | |
Other affiliated payables | 40,042 | |
Other payables and accrued expenses | 57,788 | |
Collateral on securities loaned, at value | 11,625,914 | |
Total liabilities | | 14,059,388 |
| | |
Net Assets | | $ 161,584,539 |
Net Assets consist of: | | |
Paid in capital | | $ 286,936,774 |
Undistributed net investment income | | 4,796,682 |
Accumulated undistributed net realized gain (loss) on investments and foreign currency transactions | | (118,590,823) |
Net unrealized appreciation (depreciation) on investments and assets and liabilities in foreign currencies | | (11,558,094) |
Net Assets | | $ 161,584,539 |
See accompanying notes which are an integral part of the financial statements.
Annual Report
Financial Statements - continued
Statement of Assets and Liabilities - continued
| October 31, 2011 |
| | |
Calculation of Maximum Offering Price Class A:
Net Asset Value and redemption price per share ($4,667,585 ÷ 665,122 shares) | | $ 7.02 |
| | |
Maximum offering price per share (100/94.25 of $7.02) | | $ 7.45 |
Class T:
Net Asset Value and redemption price per share ($2,467,516 ÷ 352,476 shares) | | $ 7.00 |
| | |
Maximum offering price per share (100/96.50 of $7.00) | | $ 7.25 |
Class B:
Net Asset Value and offering price per share ($901,346 ÷ 128,716 shares)A | | $ 7.00 |
| | |
Class C:
Net Asset Value and offering price per share ($2,108,020 ÷ 301,130 shares)A | | $ 7.00 |
| | |
International Value:
Net Asset Value, offering price and redemption price per share ($150,966,942 ÷ 21,486,993 shares) | | $ 7.03 |
| | |
Institutional Class:
Net Asset Value, offering price and redemption price per share ($473,130 ÷ 67,196 shares) | | $ 7.04 |
A Redemption price per share is equal to net asset value less any applicable contingent deferred sales charge.
See accompanying notes which are an integral part of the financial statements.
Annual Report
Statement of Operations
| Year ended October 31, 2011 |
Investment Income | | |
Dividends | | $ 8,421,712 |
Interest | | 4,722 |
Income from Fidelity Central Funds | | 224,814 |
Income before foreign taxes withheld | | 8,651,248 |
Less foreign taxes withheld | | (673,231) |
Total income | | 7,978,017 |
| | |
Expenses | | |
Management fee
Basic fee | $ 1,368,135 | |
Performance adjustment | (134,111) | |
Transfer agent fees | 451,985 | |
Distribution and service plan fees | 60,436 | |
Accounting and security lending fees | 110,463 | |
Custodian fees and expenses | 73,442 | |
Independent trustees' compensation | 1,067 | |
Registration fees | 73,513 | |
Audit | 70,906 | |
Legal | 763 | |
Interest | 381 | |
Miscellaneous | 1,736 | |
Total expenses before reductions | 2,078,716 | |
Expense reductions | (53,706) | 2,025,010 |
Net investment income (loss) | | 5,953,007 |
Realized and Unrealized Gain (Loss) Net realized gain (loss) on: | | |
Investment securities: | | |
Unaffiliated issuers | (31,191,099) | |
Foreign currency transactions | (23,323) | |
Total net realized gain (loss) | | (31,214,422) |
Change in net unrealized appreciation (depreciation) on: Investment securities (net of decrease in deferred foreign taxes of $30,988) | (366,851) | |
Assets and liabilities in foreign currencies | (16,031) | |
Total change in net unrealized appreciation (depreciation) | | (382,882) |
Net gain (loss) | | (31,597,304) |
Net increase (decrease) in net assets resulting from operations | | $ (25,644,297) |
See accompanying notes which are an integral part of the financial statements.
Annual Report
Financial Statements - continued
Statement of Changes in Net Assets
| Year ended
October 31,
2011 | Year ended
October 31,
2010 |
Increase (Decrease) in Net Assets | | |
Operations | | |
Net investment income (loss) | $ 5,953,007 | $ 3,860,059 |
Net realized gain (loss) | (31,214,422) | (3,221,958) |
Change in net unrealized appreciation (depreciation) | (382,882) | 12,417,837 |
Net increase (decrease) in net assets resulting
from operations | (25,644,297) | 13,055,938 |
Distributions to shareholders from net investment income | (4,441,935) | (3,135,757) |
Distributions to shareholders from net realized gain | (710,581) | (123,529) |
Total distributions | (5,152,516) | (3,259,286) |
Share transactions - net increase (decrease) | 18,454,243 | (27,172,209) |
Redemption fees | 3,151 | 3,410 |
Total increase (decrease) in net assets | (12,339,419) | (17,372,147) |
| | |
Net Assets | | |
Beginning of period | 173,923,958 | 191,296,105 |
End of period (including undistributed net investment income of $4,796,681 and undistributed net investment income of $3,475,373, respectively) | $ 161,584,539 | $ 173,923,958 |
See accompanying notes which are an integral part of the financial statements.
Annual Report
Financial Highlights - Class A
Years ended October 31, | 2011 | 2010 | 2009 | 2008 | 2007 |
Selected Per-Share Data | | | | | |
Net asset value, beginning of period | $ 8.22 | $ 7.75 | $ 5.93 | $ 13.02 | $ 10.60 |
Income from Investment Operations | | | | | |
Net investment income (loss) C | .22 | .15 | .12 | .21 | .18 |
Net realized and unrealized gain (loss) | (1.19) | .44 | 1.78 | (6.53) | 2.29 |
Total from investment operations | (.97) | .59 | 1.90 | (6.32) | 2.47 |
Distributions from net investment income | (.19) | (.11) | (.08) | (.15) | (.03) |
Distributions from net realized gain | (.03) | (.01) | - | (.62) | (.02) |
Total distributions | (.23) H | (.12) | (.08) | (.77) | (.05) |
Redemption fees added to paid in capital C,G | - | - | - | - | - |
Net asset value, end of period | $ 7.02 | $ 8.22 | $ 7.75 | $ 5.93 | $ 13.02 |
Total Return A,B | (12.19)% | 7.60% | 32.71% | (51.50)% | 23.43% |
Ratios to Average Net Assets D,F | | | | | |
Expenses before reductions | 1.36% | 1.40% | 1.34% | 1.42% | 1.38% |
Expenses net of fee waivers, if any | 1.36% | 1.40% | 1.34% | 1.42% | 1.38% |
Expenses net of all reductions | 1.34% | 1.38% | 1.32% | 1.41% | 1.37% |
Net investment income (loss) | 2.79% | 1.93% | 1.86% | 2.05% | 1.49% |
Supplemental Data | | | | | |
Net assets, end of period (000 omitted) | $ 4,668 | $ 4,699 | $ 4,456 | $ 2,854 | $ 6,052 |
Portfolio turnover rate E | 83% | 43% | 46% | 68% | 59% |
A Total returns would have been lower if certain expenses had not been reduced during the applicable periods shown.
B Total returns do not include the effect of the sales charges.
C Calculated based on average shares outstanding during the period.
D Fees and expenses of any underlying Fidelity Central Funds are not included in the Fund's expense ratio. The Fund indirectly bears its proportionate share of the expenses of any underlying Fidelity Central Funds.
E Amount does not include the portfolio activity of any underlying Fidelity Central Funds.
F Expense ratios reflect operating expenses of the class. Expenses before reductions do not reflect amounts reimbursed by the investment adviser or reductions from brokerage service arrangements or reductions from other expense offset arrangements and do not represent the amount paid by the class during periods when reimbursements or reductions occur. Expenses net of fee waivers reflect expenses after reimbursement by the investment adviser but prior to reductions from brokerage service arrangements or other expense offset arrangements. Expenses net of all reductions represent the net expenses paid by the class.
G Amount represents less than $.01 per share.
H Total distributions of $.23 per share is comprised of distributions from net investment income of $.191 and distributions from net realized gain of $.034 per share.
See accompanying notes which are an integral part of the financial statements.
Annual Report
Financial Highlights - Class T
Years ended October 31, | 2011 | 2010 | 2009 | 2008 | 2007 |
Selected Per-Share Data | | | | | |
Net asset value, beginning of period | $ 8.20 | $ 7.73 | $ 5.91 | $ 12.99 | $ 10.59 |
Income from Investment Operations | | | | | |
Net investment income (loss) C | .20 | .13 | .10 | .18 | .15 |
Net realized and unrealized gain (loss) | (1.19) | .44 | 1.77 | (6.50) | 2.29 |
Total from investment operations | (.99) | .57 | 1.87 | (6.32) | 2.44 |
Distributions from net investment income | (.17) | (.09) | (.05) | (.14) | (.02) |
Distributions from net realized gain | (.03) | (.01) | - | (.62) | (.02) |
Total distributions | (.21) H | (.10) | (.05) | (.76) | (.04) |
Redemption fees added to paid in capital C,G | - | - | - | - | - |
Net asset value, end of period | $ 7.00 | $ 8.20 | $ 7.73 | $ 5.91 | $ 12.99 |
Total Return A,B | (12.42)% | 7.32% | 32.14% | (51.60)% | 23.13% |
Ratios to Average Net Assets D,F | | | | | |
Expenses before reductions | 1.63% | 1.67% | 1.60% | 1.67% | 1.60% |
Expenses net of fee waivers, if any | 1.62% | 1.67% | 1.60% | 1.67% | 1.60% |
Expenses net of all reductions | 1.60% | 1.65% | 1.59% | 1.66% | 1.58% |
Net investment income (loss) | 2.52% | 1.65% | 1.59% | 1.80% | 1.27% |
Supplemental Data | | | | | |
Net assets, end of period (000 omitted) | $ 2,468 | $ 2,276 | $ 2,395 | $ 2,087 | $ 5,081 |
Portfolio turnover rate E | 83% | 43% | 46% | 68% | 59% |
A Total returns would have been lower if certain expenses had not been reduced during the applicable periods shown.
B Total returns do not include the effect of the sales charges.
C Calculated based on average shares outstanding during the period.
D Fees and expenses of any underlying Fidelity Central Funds are not included in the Fund's expense ratio. The Fund indirectly bears its proportionate share of the expenses of any underlying Fidelity Central Funds.
E Amount does not include the portfolio activity of any underlying Fidelity Central Funds.
F Expense ratios reflect operating expenses of the class. Expenses before reductions do not reflect amounts reimbursed by the investment adviser or reductions from brokerage service arrangements or reductions from other expense offset arrangements and do not represent the amount paid by the class during periods when reimbursements or reductions occur. Expenses net of fee waivers reflect expenses after reimbursement by the investment adviser but prior to reductions from brokerage service arrangements or other expense offset arrangements. Expenses net of all reductions represent the net expenses paid by the class.
G Amount represents less than $.01 per share.
H Total distributions of $.21 per share is comprised of distributions from net investment income of $.173 and distributions from net realized gain of $.034 per share.
See accompanying notes which are an integral part of the financial statements.
Annual Report
Financial Highlights - Class B
Years ended October 31, | 2011 | 2010 | 2009 | 2008 | 2007 |
Selected Per-Share Data | | | | | |
Net asset value, beginning of period | $ 8.20 | $ 7.74 | $ 5.88 | $ 12.93 | $ 10.56 |
Income from Investment Operations | | | | | |
Net investment income (loss) C | .17 | .09 | .07 | .13 | .09 |
Net realized and unrealized gain (loss) | (1.20) | .44 | 1.79 | (6.48) | 2.29 |
Total from investment operations | (1.03) | .53 | 1.86 | (6.35) | 2.38 |
Distributions from net investment income | (.13) | (.06) | - | (.08) | - |
Distributions from net realized gain | (.03) | (.01) | - | (.62) | (.01) |
Total distributions | (.17) H | (.07) | - | (.70) | (.01) |
Redemption fees added to paid in capital C,G | - | - | - | - | - |
Net asset value, end of period | $ 7.00 | $ 8.20 | $ 7.74 | $ 5.88 | $ 12.93 |
Total Return A,B | (12.88)% | 6.82% | 31.63% | (51.85)% | 22.59% |
Ratios to Average Net Assets D,F | | | | | |
Expenses before reductions | 2.11% | 2.15% | 2.08% | 2.18% | 2.10% |
Expenses net of fee waivers, if any | 2.11% | 2.15% | 2.08% | 2.18% | 2.10% |
Expenses net of all reductions | 2.09% | 2.13% | 2.07% | 2.17% | 2.08% |
Net investment income (loss) | 2.04% | 1.18% | 1.11% | 1.29% | .77% |
Supplemental Data | | | | | |
Net assets, end of period (000 omitted) | $ 901 | $ 1,216 | $ 1,076 | $ 931 | $ 2,651 |
Portfolio turnover rate E | 83% | 43% | 46% | 68% | 59% |
A Total returns would have been lower if certain expenses had not been reduced during the applicable periods shown.
B Total returns do not include the effect of the contingent deferred sales charge.
C Calculated based on average shares outstanding during the period.
D Fees and expenses of any underlying Fidelity Central Funds are not included in the Fund's expense ratio. The Fund indirectly bears its proportionate share of the expenses of any underlying Fidelity Central Funds.
E Amount does not include the portfolio activity of any underlying Fidelity Central Funds.
F Expense ratios reflect operating expenses of the class. Expenses before reductions do not reflect amounts reimbursed by the investment adviser or reductions from brokerage service arrangements or reductions from other expense offset arrangements and do not represent the amount paid by the class during periods when reimbursements or reductions occur. Expenses net of fee waivers reflect expenses after reimbursement by the investment adviser but prior to reductions from brokerage service arrangements or other expense offset arrangements. Expenses net of all reductions represent the net expenses paid by the class.
G Amount represents less than $.01 per share.
H Total distributions of $.17 per share is comprised of distributions from net investment income of $.131 and distributions from net realized gain of $.034 per share.
See accompanying notes which are an integral part of the financial statements.
Annual Report
Financial Highlights - Class C
Years ended October 31, | 2011 | 2010 | 2009 | 2008 | 2007 |
Selected Per-Share Data | | | | | |
Net asset value, beginning of period | $ 8.20 | $ 7.73 | $ 5.88 | $ 12.92 | $ 10.56 |
Income from Investment Operations | | | | | |
Net investment income (loss) C | .16 | .09 | .07 | .13 | .09 |
Net realized and unrealized gain (loss) | (1.19) | .44 | 1.78 | (6.47) | 2.29 |
Total from investment operations | (1.03) | .53 | 1.85 | (6.34) | 2.38 |
Distributions from net investment income | (.14) | (.05) | - | (.08) | - |
Distributions from net realized gain | (.03) | (.01) | - | (.62) | (.02) |
Total distributions | (.17) | (.06) | - | (.70) | (.02) |
Redemption fees added to paid in capital C,G | - | - | - | - | - |
Net asset value, end of period | $ 7.00 | $ 8.20 | $ 7.73 | $ 5.88 | $ 12.92 |
Total Return A,B | (12.84)% | 6.84% | 31.46% | (51.80)% | 22.56% |
Ratios to Average Net Assets D,F | | | | | |
Expenses before reductions | 2.12% | 2.15% | 2.08% | 2.17% | 2.07% |
Expenses net of fee waivers, if any | 2.11% | 2.15% | 2.08% | 2.17% | 2.07% |
Expenses net of all reductions | 2.09% | 2.13% | 2.06% | 2.16% | 2.05% |
Net investment income (loss) | 2.04% | 1.18% | 1.12% | 1.30% | .80% |
Supplemental Data | | | | | |
Net assets, end of period (000 omitted) | $ 2,108 | $ 2,123 | $ 2,108 | $ 1,784 | $ 5,996 |
Portfolio turnover rate E | 83% | 43% | 46% | 68% | 59% |
A Total returns would have been lower if certain expenses had not been reduced during the applicable periods shown.
B Total returns do not include the effect of the contingent deferred sales charge.
C Calculated based on average shares outstanding during the period.
D Fees and expenses of any underlying Fidelity Central Funds are not included in the Fund's expense ratio. The Fund indirectly bears its proportionate share of the expenses of any underlying Fidelity Central Funds.
E Amount does not include the portfolio activity of any underlying Fidelity Central Funds.
F Expense ratios reflect operating expenses of the class. Expenses before reductions do not reflect amounts reimbursed by the investment adviser or reductions from brokerage service arrangements or reductions from other expense offset arrangements and do not represent the amount paid by the class during periods when reimbursements or reductions occur. Expenses net of fee waivers reflect expenses after reimbursement by the investment adviser but prior to reductions from brokerage service arrangements or other expense offset arrangements. Expenses net of all reductions represent the net expenses paid by the class.
G Amount represents less than $.01 per share.
See accompanying notes which are an integral part of the financial statements.
Annual Report
Financial Highlights - International Value
Years ended October 31, | 2011 | 2010 | 2009 | 2008 | 2007 |
Selected Per-Share Data | | | | | |
Net asset value, beginning of period | $ 8.23 | $ 7.75 | $ 5.95 | $ 13.06 | $ 10.61 |
Income from Investment Operations | | | | | |
Net investment income (loss) B | .25 | .17 | .13 | .24 | .22 |
Net realized and unrealized gain (loss) | (1.20) | .44 | 1.78 | (6.54) | 2.29 |
Total from investment operations | (.95) | .61 | 1.91 | (6.30) | 2.51 |
Distributions from net investment income | (.22) | (.13) | (.11) | (.19) | (.04) |
Distributions from net realized gain | (.03) | (.01) | - | (.62) | (.02) |
Total distributions | (.25) | (.13) G | (.11) | (.81) | (.06) |
Redemption fees added to paid in capital B,F | - | - | - | - | - |
Net asset value, end of period | $ 7.03 | $ 8.23 | $ 7.75 | $ 5.95 | $ 13.06 |
Total Return A | (11.91)% | 7.95% | 33.09% | (51.34)% | 23.81% |
Ratios to Average Net Assets C,E | | | | | |
Expenses before reductions | 1.04% | 1.09% | 1.07% | 1.10% | 1.03% |
Expenses net of fee waivers, if any | 1.03% | 1.09% | 1.07% | 1.10% | 1.03% |
Expenses net of all reductions | 1.01% | 1.08% | 1.06% | 1.09% | 1.02% |
Net investment income (loss) | 3.11% | 2.23% | 2.12% | 2.37% | 1.84% |
Supplemental Data | | | | | |
Net assets, end of period (000 omitted) | $ 150,967 | $ 163,090 | $ 180,447 | $ 160,777 | $ 381,148 |
Portfolio turnover rate D | 83% | 43% | 46% | 68% | 59% |
A Total returns would have been lower if certain expenses had not been reduced during the applicable periods shown.
B Calculated based on average shares outstanding during the period.
C Fees and expenses of any underlying Fidelity Central Funds are not included in the Fund's expense ratio. The Fund indirectly bears its proportionate share of the expenses of any underlying Fidelity Central Funds.
D Amount does not include the portfolio activity of any underlying Fidelity Central Funds.
E Expense ratios reflect operating expenses of the class. Expenses before reductions do not reflect amounts reimbursed by the investment adviser or reductions from brokerage service arrangements or reductions from other expense offset arrangements and do not represent the amount paid by the class during periods when reimbursements or reductions occur. Expenses net of fee waivers reflect expenses after reimbursement by the investment adviser but prior to reductions from brokerage service arrangements or other expense offset arrangements. Expenses net of all reductions represent the net expenses paid by the class.
F Amount represents less than $.01 per share.
G Total distributions of $.13 per share is comprised of distributions from net investment income of $.129 and distributions from net realized gain of $.005 per share.
See accompanying notes which are an integral part of the financial statements.
Annual Report
Financial Highlights - Institutional Class
Years ended October 31, | 2011 | 2010 | 2009 | 2008 | 2007 |
Selected Per-Share Data | | | | | |
Net asset value, beginning of period | $ 8.24 | $ 7.76 | $ 5.96 | $ 13.07 | $ 10.61 |
Income from Investment Operations | | | | | |
Net investment income (loss) B | .25 | .18 | .14 | .25 | .22 |
Net realized and unrealized gain (loss) | (1.19) | .44 | 1.78 | (6.54) | 2.30 |
Total from investment operations | (.94) | .62 | 1.92 | (6.29) | 2.52 |
Distributions from net investment income | (.22) | (.14) | (.12) | (.20) | (.04) |
Distributions from net realized gain | (.03) | (.01) | - | (.62) | (.02) |
Total distributions | (.26) H | (.14) G | (.12) | (.82) | (.06) |
Redemption fees added to paid in capital B,F | - | - | - | - | - |
Net asset value, end of period | $ 7.04 | $ 8.24 | $ 7.76 | $ 5.96 | $ 13.07 |
Total Return A | (11.83)% | 8.05% | 33.06% | (51.27)% | 23.91% |
Ratios to Average Net Assets C,E | | | | | |
Expenses before reductions | .98% | .98% | .93% | 1.02% | .98% |
Expenses net of fee waivers, if any | .98% | .98% | .93% | 1.02% | .98% |
Expenses net of all reductions | .96% | .97% | .92% | 1.01% | .96% |
Net investment income (loss) | 3.17% | 2.34% | 2.26% | 2.45% | 1.89% |
Supplemental Data | | | | | |
Net assets, end of period (000 omitted) | $ 473 | $ 519 | $ 814 | $ 1,052 | $ 3,965 |
Portfolio turnover rate D | 83% | 43% | 46% | 68% | 59% |
A Total returns would have been lower if certain expenses had not been reduced during the applicable periods shown.
B Calculated based on average shares outstanding during the period.
C Fees and expenses of any underlying Fidelity Central Funds are not included in the Fund's expense ratio. The Fund indirectly bears its proportionate share of the expenses of any underlying Fidelity Central Funds.
D Amount does not include the portfolio activity of any underlying Fidelity Central Funds.
E Expense ratios reflect operating expenses of the class. Expenses before reductions do not reflect amounts reimbursed by the investment adviser or reductions from brokerage service arrangements or reductions from other expense offset arrangements and do not represent the amount paid by the class during periods when reimbursements or reductions occur. Expenses net of fee waivers reflect expenses after reimbursement by the investment adviser but prior to reductions from brokerage service arrangements or other expense offset arrangements. Expenses net of all reductions represent the net expenses paid by the class.
F Amount represents less than $.01 per share.
G Total distributions of $.14 per share is comprised of distributions from net investment income of $.137 and distributions from net realized gain of $.005 per share.
H Total distributions of $.26 per share is comprised of distributions from net investment income of $.221 and distributions from net realized gain of $.034 per share.
See accompanying notes which are an integral part of the financial statements.
Annual Report
Notes to Financial Statements
For the period ended October 31, 2011
1. Organization.
Fidelity International Value Fund (the Fund) is a fund of Fidelity Investment Trust (the Trust) and is authorized to issue an unlimited number of shares. The Trust is registered under the Investment Company Act of 1940, as amended (the 1940 Act), as an open-end management investment company organized as a Massachusetts business trust. The Fund offers Class A, Class T, Class C, International Value and Institutional Class shares, each of which, along with Class B shares, has equal rights as to assets and voting privileges. Effective after the close of business on September 1, 2010, Class B shares were closed to new accounts and additional purchases, except for exchanges and reinvestments by existing shareholders. Each class has exclusive voting rights with respect to matters that affect that class. Class B shares will automatically convert to Class A shares after a holding period of seven years from the initial date of purchase. Investment income, realized and unrealized capital gains and losses, the common expenses of the Fund, and certain fund-level expense reductions, if any, are allocated on a pro-rata basis to each class based on the relative net assets of each class to the total net assets of the Fund. Each class differs with respect to transfer agent and distribution and service plan fees incurred. Certain expense reductions may also differ by class. The Fund's investments in emerging markets can be subject to social, economic, regulatory, and political uncertainties and can be extremely volatile.
2. Investments in Fidelity Central Funds.
The Fund invests in Fidelity Central Funds, which are open-end investment companies available only to other investment companies and accounts managed by Fidelity Management & Research Company (FMR) and its affiliates. The Fund's Schedule of Investments lists each of the Fidelity Central Funds held as of period end, if any, as an investment of the Fund, but does not include the underlying holdings of each Fidelity Central Fund. As an Investing Fund, the Fund indirectly bears its proportionate share of the expenses of the underlying Fidelity Central Funds.
The Money Market Central Funds seek preservation of capital and current income and are managed by Fidelity Investments Money Management, Inc. (FIMM), an affiliate of FMR.
A complete unaudited list of holdings for each Fidelity Central Fund is available upon request or at the Securities and Exchange Commission (the SEC) web site at www.sec.gov. In addition, the financial statements of the Fidelity Central Funds, which are not covered by the Fund's Report of Independent Registered Public Accounting Firm, are available on the SEC web site or upon request.
Annual Report
3. Significant Accounting Policies.
The financial statements have been prepared in conformity with accounting principles generally accepted in the United States of America (GAAP), which require management to make certain estimates and assumptions at the date of the financial statements. Actual results could differ from those estimates. Subsequent events, if any, through the date that the financial statements were issued have been evaluated in the preparation of the financial statements. The following summarizes the significant accounting policies of the Fund:
Security Valuation. Investments are valued as of 4:00 p.m. Eastern time on the last calendar day of the period. The Fund uses independent pricing services approved by the Board of Trustees to value its investments. When current market prices or quotations are not readily available or reliable, valuations may be determined in good faith in accordance with procedures adopted by the Board of Trustees. Factors used in determining value may include market or security specific events. The frequency with which these procedures are used cannot be predicted and they may be utilized to a significant extent. The value used for net asset value (NAV) calculation under these procedures may differ from published prices for the same securities.
The Fund categorizes the inputs to valuation techniques used to value its investments into a disclosure hierarchy consisting of three levels as shown below:
Level 1 - quoted prices in active markets for identical investments
Level 2 - other significant observable inputs (including quoted prices for similar investments, interest rates, prepayment speeds, etc.)
Level 3 - unobservable inputs (including the Fund's own assumptions based on the best information available)
Changes in valuation techniques may result in transfers in or out of an assigned level within the disclosure hierarchy. The aggregate value of investments by input level, as of October 31, 2011, is included at the end of the Fund's Schedule of Investments. Valuation techniques used to value the Fund's investments by major category are as follows:
Equity securities, including restricted securities, for which market quotations are readily available, are valued at the last reported sale price or official closing price as reported by an independent pricing service on the primary market or exchange on which they are traded and are categorized as Level 1 in the hierarchy. In the event there were no sales during the day or closing prices are not available, securities are valued at the last quoted bid price or may be valued using the last available price and are generally categorized as Level 2 in the hierarchy. For foreign equity securities, when significant market or security specific events arise, comparisons to the valuation of American Depositary Receipts (ADRs), futures contracts, Exchange-traded funds (ETFs) and certain indexes as well as
Annual Report
Notes to Financial Statements - continued
3. Significant Accounting Policies - continued
Security Valuation - continued
quoted prices for similar securities are used and are categorized as Level 2 in the hierarchy in these circumstances. Utilizing these techniques may result in transfers between Level 1 and Level 2. For restricted equity securities and private placements where observable inputs are limited, assumptions about market activity and risk are used and are categorized as Level 3 in the hierarchy.
Investments in open-end mutual funds, including the Fidelity Central Funds, are valued at their closing net asset value each business day and are categorized as Level 1 in the hierarchy.
Foreign Currency. The Fund may use foreign currency contracts to facilitate transactions in foreign-denominated securities. Gains and losses from these transactions may arise from changes in the value of the foreign currency or if the counterparties do not perform under the contracts' terms.
Foreign-denominated assets, including investment securities, and liabilities are translated into U.S. dollars at the exchange rate at period end. Purchases and sales of investment securities, income and dividends received and expenses denominated in foreign currencies are translated into U.S. dollars at the exchange rate in effect on the transaction date.
The effects of exchange rate fluctuations on investments are included with the net realized and unrealized gain (loss) on investment securities. Other foreign currency transactions resulting in realized and unrealized gain (loss) are disclosed separately.
Investment Transactions and Income. For financial reporting purposes, the Fund's investment holdings and NAV include trades executed through the end of the last business day of the period. The NAV per share for processing shareholder transactions is calculated as of the close of business of the New York Stock Exchange (NYSE), normally 4:00 p.m. Eastern time and includes trades executed through the end of the prior business day. Gains and losses on securities sold are determined on the basis of identified cost. Dividend income is recorded on the ex-dividend date, except for certain dividends from foreign securities where the ex-dividend date may have passed, which are recorded as soon as the Fund is informed of the ex-dividend date. Non-cash dividends included in dividend income, if any, are recorded at the fair market value of the securities received. Interest income and distributions from the Fidelity Central Funds are accrued as earned. Interest income includes coupon interest and amortization of premium and accretion of discount on debt securities. Investment income is recorded net of foreign taxes withheld where recovery of such taxes is uncertain.
Annual Report
3. Significant Accounting Policies - continued
Expenses. Expenses directly attributable to a fund are charged to that fund. Expenses attributable to more than one fund are allocated among the respective funds on the basis of relative net assets or other appropriate methods. Expense estimates are accrued in the period to which they relate and adjustments are made when actual amounts are known.
Income Tax Information and Distributions to Shareholders. Each year, the Fund intends to qualify as a regulated investment company, including distributing substantially all of its taxable income and realized gains under Subchapter M of the Internal Revenue Code and filing its U.S. federal tax return. As a result, no provision for income taxes is required. As of October 31, 2011, the Fund did not have any unrecognized tax benefits in the financial statements. A fund's federal tax return is subject to examination by the Internal Revenue Service (IRS) for a period of three years. Foreign taxes are provided for based on the Fund's understanding of the tax rules and rates that exist in the foreign markets in which it invests.
Distributions are declared and recorded on the ex-dividend date. Income dividends and capital gain distributions are declared separately for each class. Income and capital gain distributions are determined in accordance with income tax regulations, which may differ from GAAP.
Capital accounts within the financial statements are adjusted for permanent book-tax differences. These adjustments have no impact on net assets or the results of operations. Temporary book-tax differences will reverse in a subsequent period.
Book-tax differences are primarily due to foreign currency transactions, passive foreign investment companies (PFIC), capital loss carryforwards and losses deferred due to wash sales.
The federal tax cost of investment securities and unrealized appreciation (depreciation) as of period end were as follows:
Gross unrealized appreciation | $ 5,442,169 |
Gross unrealized depreciation | (18,195,451) |
Net unrealized appreciation (depreciation) on securities and other investments | $ (12,753,282) |
| |
Tax Cost | $ 184,910,525 |
Annual Report
Notes to Financial Statements - continued
3. Significant Accounting Policies - continued
Income Tax Information and Distributions to Shareholders - continued
The tax-based components of distributable earnings as of period end were as follows:
Undistributed ordinary income | $ 4,796,682 |
Capital loss carryforward | $ (117,406,155) |
Net unrealized appreciation (depreciation) | $ (12,742,762) |
Under the recently enacted Regulated Investment Company Modernization Act of 2010 (the Act), the Fund will be permitted to carry forward capital losses incurred in taxable years beginning after December 22, 2010 for an unlimited period. However, any losses incurred during those future taxable years will be required to be utilized prior to any losses incurred in pre-enactment taxable years, which generally expire after eight years from when they are incurred. Additionally, post-enactment capital losses that are carried forward will retain their character as either short-term or long-term capital losses rather than being considered all short-term as under previous law. The Fund's first fiscal year end subject to the Act will be October 31, 2012.
The tax character of distributions paid was as follows:
| October 31, 2011 | October 31, 2010 |
Ordinary Income | $ 5,152,516 | $ 3,259,286 |
Short-Term Trading (Redemption) Fees. Shares held by investors in the Fund less than 30 days are subject to a redemption fee equal to 1.00% of the net asset value of shares redeemed. All redemption fees, which reduce the proceeds of the shareholder redemption, are retained by the Fund and accounted for as an addition to paid in capital.
New Accounting Pronouncement. In May 2011, the Financial Accounting Standards Board issued Accounting Standard Update No. 2011-04, Fair Value Measurement (Topic 820) - Amendments to Achieve Common Fair Value Measurement and Disclosure Requirements in U.S. GAAP and IFRSs. The update changes the wording used to describe the requirements in GAAP for measuring fair value and for disclosing information about fair value measurements. The update is effective during interim and annual periods beginning after December 15, 2011. Management is currently evaluating the impact of the update's adoption on the Fund's financial statement disclosures.
4. Purchases and Sales of Investments.
Purchases and sales of securities, other than short-term securities, aggregated $179,038,500 and $159,238,201, respectively.
Annual Report
5. Fees and Other Transactions with Affiliates.
Management Fee. FMR and its affiliates provide the Fund with investment management related services for which the Fund pays a monthly management fee. The management fee is the sum of an individual fund fee rate that is based on an annual rate of .45% of the Fund's average net assets and a group fee rate that averaged .26% during the period. The group fee rate is based upon the average net assets of all the mutual funds advised by FMR. The group fee rate decreases as assets under management increase and increases as assets under management decrease. In addition, the management fee is subject to a performance adjustment (up to a maximum of +/- .20% of the Fund's average net assets over a 36 month performance period). The upward or downward adjustment to the management fee is based on relative investment performance of International Value as compared to an appropriate benchmark index. For the period, the total annual management fee rate, including the performance adjustment, was .64% of the Fund's average net assets.
Distribution and Service Plan Fees. In accordance with Rule 12b-1 of the 1940 Act, the Fund has adopted separate Distribution and Service Plans for each class of shares. Certain classes pay Fidelity Distributors Corporation (FDC), an affiliate of FMR, separate Distribution and Service Fees, each of which is based on an annual percentage of each class' average net assets. In addition, FDC may pay financial intermediaries for selling shares of the Fund and providing shareholder support services. For the period, the Distribution and Service Fee rates, total fees and amounts retained by FDC were as follows:
| Distribution
Fee | Service
Fee | Total Fees | Retained
by FDC |
Class A | -% | .25% | $ 12,861 | $ 112 |
Class T | .25% | .25% | 14,090 | - |
Class B | .75% | .25% | 11,042 | 8,286 |
Class C | .75% | .25% | 22,443 | 5,109 |
| | | $ 60,436 | $ 13,507 |
Sales Load. FDC may receive a front-end sales charge of up to 5.75% for selling Class A shares, and 3.50% for selling Class T shares, some of which is paid to financial intermediaries for selling shares of the Fund. Depending on the holding period, FDC may receive contingent deferred sales charges levied on Class A, Class T, Class B, and Class C redemptions. The deferred sales charges range from 5% to 1% for Class B, 1% for Class C, 1.00% for certain purchases of Class A shares and .25% for certain purchases of Class T shares.
Annual Report
Notes to Financial Statements - continued
5. Fees and Other Transactions with Affiliates - continued
Sales Load - continued
For the period, sales charge amounts retained by FDC were as follows:
| Retained
by FDC |
Class A | $ 5,585 |
Class T | 1,051 |
Class B* | 2,211 |
Class C* | 426 |
| $ 9,273 |
* When Class B and Class C shares are initially sold, FDC pays commissions from its own resources to financial intermediaries through which the sales are made.
Transfer Agent Fees. Fidelity Investments Institutional Operations Company, Inc. (FIIOC), an affiliate of FMR, is the transfer, dividend disbursing and shareholder servicing agent for each class of the Fund. FIIOC receives account fees and asset-based fees that vary according to the account size and type of account of the shareholders of the respective classes of the Fund. FIIOC pays for typesetting, printing and mailing of shareholder reports, except proxy statements. For the period, transfer agent fees for each class were as follows:
| Amount | % of
Average
Net Assets |
Class A | $ 15,549 | .30 |
Class T | 9,051 | .32 |
Class B | 3,337 | .30 |
Class C | 6,816 | .30 |
International Value | 416,398 | .23 |
Institutional Class | 834 | .17 |
| $ 451,985 | |
Accounting and Security Lending Fees. Fidelity Service Company, Inc. (FSC), an affiliate of FMR, maintains the Fund's accounting records. The accounting fee is based on the level of average net assets for the month. Under a separate contract, FSC administers the security lending program. The security lending fee is based on the number and duration of lending transactions.
Brokerage Commissions. The Fund placed a portion of its portfolio transactions with brokerage firms which are affiliates of the investment adviser. The commissions paid to these affiliated firms were $763 for the period.
Annual Report
5. Fees and Other Transactions with Affiliates - continued
Interfund Lending Program. Pursuant to an Exemptive Order issued by the SEC, the Fund, along with other registered investment companies having management contracts with FMR, may participate in an interfund lending program. This program provides an alternative credit facility allowing the funds to borrow from, or lend money to, other participating affiliated funds. At period end, there were no interfund loans outstanding. The Fund's activity in this program during the period for which loans were outstanding was as follows:
Borrower or Lender | Average Daily
Loan Balance | Weighted Average Interest Rate | Interest
Expense |
Borrower | $ 3,563,727 | .35% | $ 381 |
6. Committed Line of Credit.
The Fund participates with other funds managed by FMR or an affiliate in a $4.0 billion credit facility (the "line of credit") to be utilized for temporary or emergency purposes to fund shareholder redemptions or for other short-term liquidity purposes. The Fund has agreed to pay commitment fees on its pro-rata portion of the line of credit, which amounted to $590 and is reflected in Miscellaneous expenses on the Statement of Operations. During the period, there were no borrowings on this line of credit.
7. Security Lending.
The Fund lends portfolio securities through a lending agent from time to time in order to earn additional income. For equity securities, a lending agent is used and may loan securities to certain qualified borrowers, including Fidelity Capital Markets (FCM), a broker-dealer affiliated with the Fund. On the settlement date of the loan, the Fund receives collateral (in the form of U.S. Treasury obligations, letters of credit and/or cash) against the loaned securities and maintains collateral in an amount not less than 100% of the market value of the loaned securities during the period of the loan. The market value of the loaned securities is determined at the close of business of the Fund and any additional required collateral is delivered to the Fund on the next business day. If the borrower defaults on its obligation to return the securities loaned because of insolvency or other reasons, a fund could experience delays and costs in recovering the securities loaned or in gaining access to the collateral. Any cash collateral received is invested in the Fidelity Securities Lending Cash Central Fund. The value of loaned securities and cash collateral at period end are disclosed on the Fund's Statement of Assets and Liabilities. Security lending income represents the income earned on investing cash collateral, less rebates paid to borrowers and any lending agent fees associated with the loan, plus any premium payments received for lending certain types of securities. Security lending income is presented in the Statement of Operations as a component of income from
Annual Report
Notes to Financial Statements - continued
7. Security Lending - continued
Fidelity Central Funds. Total security lending income during the period amounted to $221,316. During the period, there were no securities loaned to FCM.
8. Expense Reductions.
FMR voluntarily agreed to reimburse a portion of its management fee. For the period, the amount of this reimbursement was $14,939.
Many of the brokers with whom FMR places trades on behalf of the Fund provided services in addition to trade execution. These services included payments of certain expenses on behalf of the Fund totaling $38,767 for the period.
9. Distributions to Shareholders.
Distributions to shareholders of each class were as follows:
Years ended October 31, | 2011 | 2010 |
From net investment income | | |
Class A | $ 109,917 | $ 64,929 |
Class T | 48,265 | 27,801 |
Class B | 18,831 | 8,869 |
Class C | 34,950 | 14,357 |
International Value | 4,218,039 | 3,006,248 |
Institutional Class | 11,933 | 13,553 |
Total | $ 4,441,935 | $ 3,135,757 |
From net realized gain | | |
Class A | $ 19,461 | $ 2,899 |
Class T | 9,435 | 1,544 |
Class B | 4,893 | 715 |
Class C | 8,796 | 1,354 |
International Value | 666,153 | 116,522 |
Institutional Class | 1,843 | 495 |
Total | $ 710,581 | $ 123,529 |
Annual Report
10. Share Transactions.
Transactions for each class of shares were as follows:
| Shares | Dollars |
Years ended October 31, | 2011 | 2010 | 2011 | 2010 |
Class A | | | | |
Shares sold | 297,051 | 216,581 | $ 2,472,449 | $ 1,676,019 |
Reinvestment of distributions | 14,168 | 7,621 | 113,424 | 61,732 |
Shares redeemed | (217,894) | (227,521) | (1,776,674) | (1,766,121) |
Net increase (decrease) | 93,325 | (3,319) | $ 809,199 | $ (28,370) |
Class T | | | | |
Shares sold | 184,684 | 82,344 | $ 1,564,957 | $ 635,080 |
Reinvestment of distributions | 7,104 | 3,507 | 56,884 | 28,408 |
Shares redeemed | (116,856) | (118,025) | (949,653) | (899,018) |
Net increase (decrease) | 74,932 | (32,174) | $ 672,188 | $ (235,530) |
Class B | | | | |
Shares sold | 10,615 | 44,963 | $ 84,177 | $ 346,949 |
Reinvestment of distributions | 2,474 | 980 | 19,918 | 7,981 |
Shares redeemed | (32,689) | (36,625) | (270,345) | (286,374) |
Net increase (decrease) | (19,600) | 9,318 | $ (166,250) | $ 68,556 |
Class C | | | | |
Shares sold | 94,118 | 56,757 | $ 764,274 | $ 434,910 |
Reinvestment of distributions | 4,468 | 1,540 | 35,965 | 12,532 |
Shares redeemed | (56,323) | (72,014) | (453,389) | (560,469) |
Net increase (decrease) | 42,263 | (13,717) | $ 346,850 | $ (113,027) |
International Value | | | | |
Shares sold | 9,000,450 | 3,662,730 | $ 76,813,955 | $ 28,403,948 |
Reinvestment of distributions | 587,427 | 369,795 | 4,695,920 | 2,987,943 |
Shares redeemed | (7,927,908) | (7,496,748) | (64,758,392) | (57,917,334) |
Net increase (decrease) | 1,659,969 | (3,464,223) | $ 16,751,483 | $ (26,525,443) |
Institutional Class | | | | |
Shares sold | 19,868 | 16,581 | $ 168,608 | $ 128,469 |
Reinvestment of distributions | 395 | 185 | 3,160 | 1,498 |
Shares redeemed | (16,071) | (58,573) | (130,995) | (468,362) |
Net increase (decrease) | 4,192 | (41,807) | $ 40,773 | $ (338,395) |
Annual Report
Notes to Financial Statements - continued
11. Other.
The Fund's organizational documents provide former and current trustees and officers with a limited indemnification against liabilities arising in connection with the performance of their duties to the Fund. In the normal course of business, the Fund may also enter into contracts that provide general indemnifications. The Fund's maximum exposure under these arrangements is unknown as this would be dependent on future claims that may be made against the Fund. The risk of material loss from such claims is considered remote.
At the end of the period, Strategic Advisers International II Fund and VIP FundsManager 60% Portfolio were owners of record of approximately 19% and 18%, respectively, of the total outstanding shares of the Fund.
The VIP FundsManager Portfolios were owners of record, in the aggregate, of approximately 26% of the total outstanding shares of the Fund.
Annual Report
To the Trustees of Fidelity Investment Trust and Shareholders of Fidelity International Value Fund:
We have audited the accompanying statement of assets and liabilities of Fidelity International Value Fund (the Fund), a fund of Fidelity Investment Trust, including the schedule of investments, as of October 31, 2011, and the related statement of operations for the year then ended, the statement of changes in net assets for each of the two years in the period then ended, and the financial highlights for each of the five years in the period then ended. These financial statements and financial highlights are the responsibility of the Fund's management. Our responsibility is to express an opinion on these financial statements and financial highlights based on our audits.
We conducted our audits in accordance with the standards of the Public Company Accounting Oversight Board (United States). Those standards require that we plan and perform the audit to obtain reasonable assurance about whether the financial statements and financial highlights are free of material misstatement. The Fund is not required to have, nor were we engaged to perform, an audit of its internal control over financial reporting. Our audits included consideration of internal control over financial reporting as a basis for designing audit procedures that are appropriate in the circumstances, but not for the purpose of expressing an opinion on the effectiveness of the Fund's internal control over financial reporting. Accordingly, we express no such opinion. An audit also includes examining, on a test basis, evidence supporting the amounts and disclosures in the financial statements, assessing the accounting principles used and significant estimates made by management, as well as evaluating the overall financial statement presentation. Our procedures included confirmation of securities owned as of October 31, 2011, by correspondence with the custodians and brokers; where replies were not received from brokers, we performed other auditing procedures. We believe that our audits provide a reasonable basis for our opinion.
In our opinion, the financial statements and financial highlights referred to above present fairly, in all material respects, the financial position of Fidelity International Value Fund as of October 31, 2011, the results of its operations for the year then ended, the changes in its net assets for each of the two years in the period then ended, and the financial highlights for each of the five years in the period then ended, in conformity with accounting principles generally accepted in the United States of America.
DELOITTE & TOUCHE LLP
Boston, Massachusetts
December 15, 2011
Annual Report
The Trustees, Members of the Advisory Board, and executive officers of the trust and fund, as applicable, are listed below. The Board of Trustees governs the fund and is responsible for protecting the interests of shareholders. The Trustees are experienced executives who meet periodically throughout the year to oversee the fund's activities, review contractual arrangements with companies that provide services to the fund, oversee management of the risks associated with such activities and contractual arrangements, and review the fund's performance. Except for James C. Curvey, each of the Trustees oversees 226 funds advised by FMR or an affiliate. Mr. Curvey oversees 429 funds advised by FMR or an affiliate.
The Trustees hold office without limit in time except that (a) any Trustee may resign; (b) any Trustee may be removed by written instrument, signed by at least two-thirds of the number of Trustees prior to such removal; (c) any Trustee who requests to be retired or who has become incapacitated by illness or injury may be retired by written instrument signed by a majority of the other Trustees; and (d) any Trustee may be removed at any special meeting of shareholders by a two-thirds vote of the outstanding voting securities of the trust. Each Trustee who is not an interested person (as defined in the 1940 Act) (Independent Trustee), shall retire not later than the last day of the calendar year in which his or her 75th birthday occurs. The Independent Trustees may waive this mandatory retirement age policy with respect to individual Trustees. The executive officers and Advisory Board Members hold office without limit in time, except that any officer and Advisory Board Member may resign or may be removed by a vote of a majority of the Trustees at any regular meeting or any special meeting of the Trustees. Except as indicated, each individual has held the office shown or other offices in the same company for the past five years.
Experience, Skills, Attributes, and Qualifications of the Fund's Trustees. The Governance and Nominating Committee has adopted a statement of policy that describes the experience, qualifications, attributes, and skills that are necessary and desirable for potential Independent Trustee candidates (Statement of Policy). The Board believes that each Trustee satisfied at the time he or she was initially elected or appointed a Trustee, and continues to satisfy, the standards contemplated by the Statement of Policy. The Governance and Nominating Committee also engages professional search firms to help identify potential Independent Trustee candidates who have the experience, qualifications, attributes, and skills consistent with the Statement of Policy. From time to time, additional criteria based on the composition and skills of the current Independent Trustees, as well as experience or skills that may be appropriate in light of future changes to board composition, business conditions, and regulatory or other developments, have also been considered by the professional search firms and the Governance and Nominating Committee. In addition, the Board takes into account the Trustees' commitment and participation in Board and committee meetings, as well as their leadership of standing and ad hoc committees throughout their tenure.
In determining that a particular Trustee was and continues to be qualified to serve as a Trustee, the Board has considered a variety of criteria, none of which, in isolation, was controlling. The Board believes that, collectively, the Trustees have balanced and diverse experience, qualifications, attributes, and skills, which allow the Board to operate effectively in governing the fund and protecting the interests of shareholders. Information about the specific experience, skills, attributes, and qualifications of each Trustee, which in each case led to the Board's conclusion that the Trustee should serve (or continue to serve) as a trustee of the fund, is provided below.
Annual Report
Trustees and Officers - continued
Board Structure and Oversight Function. James C. Curvey is an interested person (as defined in the 1940 Act) and currently serves as Acting Chairman. The Trustees have determined that an interested Chairman is appropriate and benefits shareholders because an interested Chairman has a personal and professional stake in the quality and continuity of services provided to the fund. Independent Trustees exercise their informed business judgment to appoint an individual of their choosing to serve as Chairman, regardless of whether the Trustee happens to be independent or a member of management. The Independent Trustees have determined that they can act independently and effectively without having an Independent Trustee serve as Chairman and that a key structural component for assuring that they are in a position to do so is for the Independent Trustees to constitute a substantial majority for the Board. The Independent Trustees also regularly meet in executive session. Ned C. Lautenbach serves as Chairman of the Independent Trustees and as such (i) acts as a liaison between the Independent Trustees and management with respect to matters important to the Independent Trustees and (ii) with management prepares agendas for Board meetings.
Fidelity funds are overseen by different Boards of Trustees. The fund's Board oversees Fidelity's equity and high income funds and another Board oversees Fidelity's investment-grade bond, money market, and asset allocation funds. The asset allocation funds may invest in Fidelity funds overseen by the fund's Board. The use of separate Boards, each with its own committee structure, allows the Trustees of each group of Fidelity funds to focus on the unique issues of the funds they oversee, including common research, investment, and operational issues. On occasion, the separate Boards establish joint committees to address issues of overlapping consequences for the Fidelity funds overseen by each Board.
The Trustees operate using a system of committees to facilitate the timely and efficient consideration of all matters of importance to the Trustees, the fund, and fund shareholders and to facilitate compliance with legal and regulatory requirements and oversight of the fund's activities and associated risks. The Board, acting through its committees, has charged FMR and its affiliates with (i) identifying events or circumstances the occurrence of which could have demonstrably adverse effects on the fund's business and/or reputation; (ii) implementing processes and controls to lessen the possibility that such events or circumstances occur or to mitigate the effects of such events or circumstances if they do occur; and (iii) creating and maintaining a system designed to evaluate continuously business and market conditions in order to facilitate the identification and implementation processes described in (i) and (ii) above. Because the day-to-day operations and activities of the fund are carried out by or through FMR, its affiliates and other service providers, the fund's exposure to risks is mitigated but not eliminated by the processes overseen by the Trustees. While each of the Board's committees has responsibility for overseeing different aspects of the fund's activities, oversight is exercised primarily through the Operations, Audit, and Compliance Committees. In addition, the Independent Trustees have worked with FMR to enhance the Board's oversight of investment and financial risks, legal and regulatory risks, technology risks, and operational risks, including the development of additional risk reporting to the Board. For example, a working group comprised of Independent Trustees and FMR has worked and continues to work to review the Fidelity funds' valuation-related activities, reporting and risk management. Appropriate personnel, including but not limited to the fund's Chief Compliance Officer (CCO), FMR's internal auditor, the independent accountants, the fund's Treasurer and portfolio management personnel, make periodic reports to the Board's committees, as appropriate, including an annual review of FMR's risk management program for the Fidelity funds. The responsibilities of each standing committee, including their oversight responsibilities, are described further under "Standing Committees of the Fund's Trustees."
Annual Report
The fund's Statement of Additional Information (SAI) includes more information about the Trustees. To request a free copy, call Fidelity at 1-800-544-8544.
Interested Trustees*:
Correspondence intended for each Trustee who is an interested person may be sent to Fidelity Investments, 82 Devonshire Street, Boston, Massachusetts 02109.
Name, Age; Principal Occupations and Other Relevant Experience+ |
James C. Curvey (76) |
| Year of Election or Appointment: 2007 Mr. Curvey is Trustee and Acting Chairman of the Board of Trustees of certain Trusts. Mr. Curvey also serves as Trustee (2007-present) of other investment companies advised by FMR. Mr. Curvey is a Director of Fidelity Investments Money Management, Inc. (2009-present), Director of Fidelity Research & Analysis Co. (2009-present) and Director of FMR and FMR Co., Inc. (2007-present). Mr. Curvey is also Vice Chairman (2007-present) and Director of FMR LLC. In addition, Mr. Curvey serves as an Overseer for the Boston Symphony Orchestra and a member of the Trustees of Villanova University. Previously, Mr. Curvey was the Vice Chairman (2006-2007) and Director (2000-2007) of FMR Corp. |
Ronald P. O'Hanley (54) |
| Year of Election or Appointment: 2011 Mr. O'Hanley is Director of FMR Co., Inc. (2010-present), Director of Fidelity Investments Money Management, Inc. (2010-present), Director of Fidelity Research & Analysis Company (2010-present), President of Fidelity Asset Management and Corporate Services and a member of Fidelity's Executive Committee (2010-present). Previously, Mr. O'Hanley served as President and Chief Executive Officer of BNY Mellon Asset Management (2007-2010). Mr. O'Hanley also served as Vice Chairman of Bank New York Mellon Corp. and a member of that firm's Executive Committee. Prior to the 2007 merger of The Bank of New York and Mellon Financial Corporation, he was Vice Chairman of Mellon Financial Corporation and President and Chief Executive Officer of Mellon Asset Management. He joined Mellon in February 1997. Mr. O'Hanley currently serves as Chairman of the Boston Public Library Foundation Board of Directors and sits on the Board of Directors of Beth Israel Deaconess Medical Center, the Board of Trustees of the Marine Biological Laboratory and the Advisory Board of the Maxwell School of Citizenship and Public Administration at Syracuse University. Mr. O'Hanley also chairs the Council on Asset Management for the Financial Services Roundtable and is a member of the Board of Directors of Institutional Investor's U.S. Institute. |
* Trustees have been determined to be "Interested Trustees" by virtue of, among other things, their affiliation with the trust or various entities under common control with FMR.
+ The information above includes each Trustee's principal occupation during the last five years and other information relating to the experience, attributes, and skills relevant to each Trustee's qualifications to serve as a Trustee, which led to the conclusion that each Trustee should serve as a Trustee for the fund.
Annual Report
Independent Trustees:
Correspondence intended for each Independent Trustee (that is, the Trustees other than the Interested Trustees) may be sent to Fidelity Investments, P.O. Box 55235, Boston, Massachusetts 02205-5235.
Name, Age; Principal Occupations and Other Relevant Experience+ |
Dennis J. Dirks (63) |
| Year of Election or Appointment: 2005 Prior to his retirement in May 2003, Mr. Dirks was Chief Operating Officer and a member of the Board of The Depository Trust & Clearing Corporation (DTCC). He also served as President, Chief Operating Officer, and Board member of The Depository Trust Company (DTC) and President and Board member of the National Securities Clearing Corporation (NSCC). In addition, Mr. Dirks served as Chief Executive Officer and Board member of the Government Securities Clearing Corporation, Chief Executive Officer and Board member of the Mortgage-Backed Securities Clearing Corporation, as a Trustee and a member of the Finance Committee of Manhattan College (2005-2008), and as a Trustee and a member of the Finance Committee of AHRC of Nassau County (2006-2008). Mr. Dirks is a member of the Independent Directors Council (IDC) Governing Council (2010-Present) and Board of Directors for The Brookville Center for Children's Services, Inc. (2009-present). |
Alan J. Lacy (58) |
| Year of Election or Appointment: 2008 Mr. Lacy serves as Senior Adviser (2007-present) of Oak Hill Capital Partners, L.P. (private equity). Mr. Lacy also served as Chief Executive Officer (2000-2005) and Vice Chairman (2005-2006) of Sears Holdings Corporation and Sears, Roebuck and Co. (retail). In addition, Mr. Lacy serves as a member of the Board of Directors of Dave & Buster's, Inc. (restaurant and entertainment complexes, 2010-present), The Hillman Companies, Inc. (hardware wholesalers, 2010-present), and Bristol-Myers Squibb Company (global pharmaceuticals, 2007-present). Mr. Lacy is a member of the Board of Trustees of The National Parks Conservation Association (2006-Present). Previously, Mr. Lacy served as Chairman of the Board of Trustees of the National Parks Conservation Association (2008-2011) and as a member of the Board of Directors for the Western Union Company (global money transfer, 2006-2011). |
Ned C. Lautenbach (67) |
| Year of Election or Appointment: 2000 Mr. Lautenbach is Chairman of the Independent Trustees of the Equity and High Income Funds (2006-present). Mr. Lautenbach currently serves as the Lead Director of the Eaton Corporation Board of Directors (diversified industrial, 1997-present). Mr. Lautenbach is also a member of the Board of Directors of the Philharmonic Center for the Arts in Naples, Florida (1999-present); a member of the Board of Trustees of Fairfield University (2005-present); and a member of the Council on Foreign Relations (1994-present). Previously, Mr. Lautenbach was a Partner/Advisory Partner at Clayton, Dubilier & Rice, LLC (private equity investment, 1998-2010), as well as a Director of Sony Corporation (2006-2007). |
Joseph Mauriello (67) |
| Year of Election or Appointment: 2008 Prior to his retirement in January 2006, Mr. Mauriello served in numerous senior management positions including Deputy Chairman and Chief Operating Officer (2004-2005), and Vice Chairman of Financial Services (2002-2004) of KPMG LLP US (professional services, 1965-2005). Mr. Mauriello currently serves as a member of the Board of Directors of XL Group plc. (global insurance and re-insurance, 2006-present) and of Arcadia Resources Inc. (health care services and products, 2007-present). Previously, Mr. Mauriello served as a Director of the Hamilton Funds of the Bank of New York (2006-2007). |
Robert W. Selander (61) |
| Year of Election or Appointment: 2011 Previously, Mr. Selander served as a Member of the Advisory Board of Fidelity's Equity and High Income Funds (2011), Executive Vice Chairman (2010), Chief Executive Officer (2009-2010), and President and Chief Executive Officer (1997-2009) of Mastercard, Inc. |
Cornelia M. Small (67) |
| Year of Election or Appointment: 2005 Ms. Small is a member of the Board of Directors of the Teagle Foundation (2009-present). Ms. Small is also a member of the Investment Committee, and Chair (2008-present) and a member of the Board of Trustees of Smith College. In addition, Ms. Small serves on the Investment Committee of the Berkshire Taconic Community Foundation (2008-present). Previously, Ms. Small served as Chairperson of the Investment Committee (2002-2008) of Smith College. In addition, Ms. Small served as Chief Investment Officer, Director of Global Equity Investments, and a member of the Board of Directors of Scudder, Stevens & Clark and Scudder Kemper Investments. |
William S. Stavropoulos (72) |
| Year of Election or Appointment: 2001 Mr. Stavropoulos is Vice Chairman of the Independent Trustees of the Equity and High Income Funds (2006-present). Mr. Stavropoulos serves as President and Founder of the Michigan Baseball Foundation, the Great Lakes Loons (2007-present). Mr. Stavropoulos is Chairman Emeritus of the Board of Directors of The Dow Chemical Company, where he previously served in numerous senior management positions, including President, CEO (1995-2000; 2002-2004), Chairman of the Executive Committee (2000-2006), and as a member of the Board of Directors (1990-2006). Currently, Mr. Stavropoulos is Chairman of Univar (global distributor of commodity and specialty chemicals, 2010-present), a Director of Teradata Corporation (data warehousing and technology solutions, 2008-present), Chemical Financial Corporation, Maersk Inc. (industrial conglomerate), Tyco International, Inc. (multinational manufacturing and services, 2007-present), and a member of the Advisory Board for Metalmark Capital (private equity investment, 2005-present). Mr. Stavropoulos is a special advisor to Clayton, Dubilier & Rice, LLC (private equity investment). In addition, Mr. Stavropoulos is a member of the University of Notre Dame Advisory Council for the College of Science. |
David M. Thomas (62) |
| Year of Election or Appointment: 2008 Previously, Mr. Thomas served as Executive Chairman (2005-2006) and Chairman and Chief Executive Officer (2000-2005) of IMS Health, Inc. (pharmaceutical and healthcare information solutions). In addition, Mr. Thomas serves as a member of the Board of Directors of Fortune Brands, Inc. (consumer products), and Interpublic Group of Companies, Inc. (marketing communication, 2004-present). |
Michael E. Wiley (61) |
| Year of Election or Appointment: 2008 Mr. Wiley also serves as a Director of Asia Pacific Exploration Consolidated (international oil and gas exploration and production, 2008-present). Mr. Wiley serves as a Director of Tesoro Corporation (independent oil refiner and marketer, 2005-present), and a Director of Bill Barrett Corporation (exploration and production, 2005-present). In addition, Mr. Wiley also serves as a Director of Post Oak Bank (privately-held bank, 2004-present). Previously, Mr. Wiley served as a member of the Board of Trustees of the University of Tulsa (2000-2006; 2007-2010), as a Senior Energy Advisor of Katzenbach Partners, LLC (consulting, 2006-2007), as an Advisory Director of Riverstone Holdings (private investment), Chairman, President, and CEO of Baker Hughes, Inc. (oilfield services, 2000-2004), and as Director of Spinnaker Exploration Company (exploration and production, 2001-2005). |
Annual Report
Trustees and Officers - continued
+ The information above includes each Trustee's principal occupation during the last five years and other information relating to the experience, attributes, and skills relevant to each Trustee's qualifications to serve as a Trustee, which led to the conclusion that each Trustee should serve as a Trustee for the fund.
Advisory Board Members and Executive Officers:
Correspondence intended for each executive officer, Edward C. Johnson 3d, and Peter S. Lynch may be sent to Fidelity Investments, 82 Devonshire Street, Boston, Massachusetts 02109.
Name, Age; Principal Occupation |
Edward C. Johnson 3d (81) |
| Year of Election or Appointment: 2011 Member of the Advisory Board of Fidelity's Equity and High Income Funds. Mr. Johnson serves as Chief Executive Officer, Chairman, and a Director of FMR LLC, and also serves as Chairman and Director of FIL Limited. Previously, Mr. Johnson served as a Trustee and Chairman of the Board of certain Fidelity Trusts, Chairman and a Director of FMR, Chairman and a Director of FMR Co., Inc., and President of FMR LLC (2006-2007). |
Peter S. Lynch (67) |
| Year of Election or Appointment: 2003 Member of the Advisory Board of Fidelity's Equity and High Income Funds. Mr. Lynch is Vice Chairman and a Director of FMR and FMR Co., Inc. In addition, Mr. Lynch serves as a Trustee of Boston College and as the Chairman of the Inner-City Scholarship Fund. Previously, Mr. Lynch served on the Special Olympics International Board of Directors (1997-2006). |
Kenneth B. Robins (42) |
| Year of Election or Appointment: 2008 President and Treasurer of Fidelity's Equity and High Income Funds. Mr. Robins also serves as President and Treasurer (2010-present) and Assistant Treasurer (2009-present) of other Fidelity funds and is an employee of Fidelity Investments (2004-present). Previously, Mr. Robins served as Deputy Treasurer of the Fidelity funds (2005-2008) and Treasurer and Chief Financial Officer of The North Carolina Capital Management Trust: Cash and Term Portfolios (2006-2008). |
Brian B. Hogan (47) |
| Year of Election or Appointment: 2009 Vice President of Equity and High Income Funds. Mr. Hogan also serves as President of FMR's Equity Division (2009-present). Previously, Mr. Hogan served as Senior Vice President, Equity Research of FMR (2006-2009) and as a portfolio manager. |
Thomas C. Hense (47) |
| Year of Election or Appointment: 2008 or 2010 Vice President of Fidelity's High Income (2008), Small Cap (2008), and Value (2010) Funds. Previously, Mr. Hense served as a portfolio manager for Fidelity's Institutional Money Management Group (Pyramis) (2003-2008). |
Scott C. Goebel (43) |
| Year of Election or Appointment: 2008 Secretary and Chief Legal Officer (CLO) of the Fidelity funds. Mr. Goebel also serves as Secretary of Fidelity Investments Money Management, Inc. (FIMM) (2010-present) and Fidelity Research and Analysis Company (FRAC) (2010-present); Secretary and CLO of The North Carolina Capital Management Trust: Cash and Term Portfolios (2008-present); General Counsel, Secretary, and Senior Vice President of FMR (2008-present) and FMR Co., Inc. (2008-present); employed by FMR LLC or an affiliate (2001-present); Chief Legal Officer of Fidelity Management & Research (Hong Kong) Limited (2008-present) and Assistant Secretary of Fidelity Management & Research (Japan) Inc. (2008-present), and Fidelity Management & Research (U.K.) Inc. (2008-present). Previously, Mr. Goebel served as Assistant Secretary of FIMM (2008-2010), FRAC (2008-2010), and the Funds (2007-2008) and as Vice President and Secretary of Fidelity Distributors Corporation (FDC) (2005-2007). |
William C. Coffey (42) |
| Year of Election or Appointment: 2009 Assistant Secretary of Fidelity's Equity and High Income Funds. Mr. Coffey also serves as Senior Vice President and Deputy General Counsel of FMR LLC (2010-present), and is an employee of Fidelity Investments. Previously, Mr. Coffey served as Vice President and Associate General Counsel of FMR LLC (2005-2009). |
Holly C. Laurent (57) |
| Year of Election or Appointment: 2008 Anti-Money Laundering (AML) Officer of the Fidelity funds. Ms. Laurent also serves as AML Officer of The North Carolina Capital Management Trust: Cash and Term Portfolios (2008-present) and is an employee of Fidelity Investments. Previously, Ms. Laurent was Senior Vice President and Head of Legal for Fidelity Business Services India Pvt. Ltd. (2006-2008), and Senior Vice President, Deputy General Counsel and Group Head for FMR LLC (2005-2006). |
Christine Reynolds (53) |
| Year of Election or Appointment: 2008 Chief Financial Officer of the Fidelity funds. Ms. Reynolds became President of Fidelity Pricing and Cash Management Services (FPCMS) in August 2008. Ms. Reynolds served as Chief Operating Officer of FPCMS (2007-2008). Previously, Ms. Reynolds served as President, Treasurer, and Anti-Money Laundering officer of the Fidelity funds (2004-2007). |
Kenneth A. Rathgeber (64) |
| Year of Election or Appointment: 2004 Chief Compliance Officer of Fidelity's Equity and High Income Funds. Mr. Rathgeber is Chief Compliance Officer of Fidelity Management & Research (Hong Kong) Limited (2008-present), Fidelity Management & Research (Japan) Inc. (2008-present), FMR (2005-present), FMR Co., Inc. (2005-present), Fidelity Management & Research (U.K.) Inc. (2005-present), Fidelity Research & Analysis Company (2005-present), Fidelity Investments Money Management, Inc. (2005-present), Pyramis Global Advisors, LLC (2005-present), and Strategic Advisers, Inc. (2005-present). |
Jeffrey S. Christian (50) |
| Year of Election or Appointment: 2009 Deputy Treasurer of the Fidelity funds. Mr. Christian is an employee of Fidelity Investments. Previously, Mr. Christian served as Chief Financial Officer (2008-2009) of certain Fidelity funds and Senior Vice President of Fidelity Pricing and Cash Management Services (FPCMS) (2004-2009). |
Joseph F. Zambello (54) |
| Year of Election or Appointment: 2011 Deputy Treasurer of the Fidelity funds. Mr. Zambello is an employee of Fidelity Investments. Previously, Mr. Zambello served as Vice President of FMR's Program Management Group (2009-2011) and Vice President of the Transfer Agent Oversight Group (2005-2009). |
Adrien E. Deberghes (44) |
| Year of Election or Appointment: 2008 Deputy Treasurer of Fidelity's Equity and High Income Funds. Mr. Deberghes also serves as Vice President and Assistant Treasurer of Fidelity Rutland Square Trust II and Fidelity Commonwealth Trust II (2011-present), Assistant Treasurer of other Fidelity funds (2010-present), and is an employee of Fidelity Investments (2008-present). Previously, Mr. Deberghes served as Senior Vice President of Mutual Fund Administration at State Street Corporation (2007-2008), Senior Director of Mutual Fund Administration at Investors Bank & Trust (2005-2007), and Director of Finance for Dunkin' Brands (2000-2005). |
Stephanie J. Dorsey (42) |
| Year of Election or Appointment: 2010 Assistant Treasurer of Fidelity's Equity and High Income Funds. Ms. Dorsey also serves as Deputy Treasurer of other Fidelity funds (2008-present) and is an employee of Fidelity Investments (2008-present). Previously, Ms. Dorsey served as Treasurer (2004-2008) of the JPMorgan Mutual Funds and Vice President (2004-2008) of JPMorgan Chase Bank. |
John R. Hebble (53) |
| Year of Election or Appointment: 2009 Assistant Treasurer of Fidelity's Equity and High Income Funds. Mr. Hebble also serves as President (2011-present), Treasurer, and Chief Financial Officer of The North Carolina Capital Management Trust: Cash and Term Portfolios (2008-present), President and Treasurer of other Fidelity funds (2008-present) and is an employee of Fidelity Investments. |
Gary W. Ryan (53) |
| Year of Election or Appointment: 2005 Assistant Treasurer of the Fidelity funds. Mr. Ryan is an employee of Fidelity Investments. Previously, Mr. Ryan served as Vice President of Fund Reporting in Fidelity Pricing and Cash Management Services (FPCMS) (1999-2005). |
Jonathan Davis (43) |
| Year of Election or Appointment: 2010 Assistant Treasurer of the Fidelity funds. Mr. Davis is also Assistant Treasurer of Fidelity Rutland Square Trust II and Fidelity Commonwealth Trust II. Mr. Davis is an employee of Fidelity Investments. Previously, Mr. Davis served as Vice President and Associate General Counsel of FMR LLC (2003-2010). |
Annual Report
A percentage of the dividends distributed during the fiscal year for the following fund may be taken into account as a dividend for the purpose of the maximum rate under section 1(h)(11) of the Internal Revenue Code.
| December 3, 2010 | December 30, 2010 |
International Value Fund | 66% | 78% |
The amounts per share which represent income derived from sources within, and taxes paid to, foreign countries or possessions of the United States are as follows:
| Pay Date | Income | Taxes |
International Value Fund | 12/06/2010 | $0.178 | $0.011 |
International Value Fund | 12/31/2010 | $0.021 | $0.000 |
The fund will notify shareholders in January 2012 of amounts for use in preparing 2011 income tax returns.
Annual Report
Board Approval of Investment Advisory Contracts and Management Fees
Fidelity International Value Fund
Each year, the Board of Trustees, including the Independent Trustees (together, the Board), votes on the renewal of the management contract and sub-advisory agreements (together, the Advisory Contracts) for the fund. The Board, assisted by the advice of fund counsel and Independent Trustees' counsel, requests and considers a broad range of information relevant to the renewal of the Advisory Contracts throughout the year.
The Board meets regularly and considers at each of its meetings factors that are relevant to its annual consideration of the renewal of the fund's Advisory Contracts, including the services and support provided to the fund and its shareholders. The Board has established various standing committees, each composed of Independent Trustees with varying backgrounds, to which the Board has assigned specific subject matter responsibilities in order to enhance effective decision-making by the Board. The Board, acting directly and through its Committees, requests and receives information concerning the annual consideration of the renewal of the fund's Advisory Contracts. The Board also meets as needed to consider matters specifically related to the Board's annual consideration of the renewal of Advisory Contracts. Members of the Board may also meet with trustees of other Fidelity funds through ad hoc joint committees to discuss certain matters relevant to the Fidelity funds.
At its July 2011 meeting, the Board of Trustees, including the Independent Trustees, unanimously determined to renew the fund's Advisory Contracts. In reaching its determination, the Board considered all factors it believed relevant, including (i) the nature, extent, and quality of the services to be provided to the fund and its shareholders (including the investment performance of the fund); (ii) the competitiveness of the fund's management fee and total expense ratio; (iii) the total costs of the services to be provided by and the profits to be realized by Fidelity from its relationship with the fund; (iv) the extent to which economies of scale would be realized as the fund grows; and (v) whether fee levels reflect these economies of scale, if any, for the benefit of fund shareholders.
In considering whether to renew the Advisory Contracts for the fund, the Board reached a determination, with the assistance of fund counsel and Independent Trustees' counsel and through the exercise of its business judgment, that the renewal of the Advisory Contracts is in the best interests of the fund and its shareholders and that the compensation payable under the Advisory Contracts is fair and reasonable. The Board's decision to renew the Advisory Contracts was not based on any single factor, but rather was based on a comprehensive consideration of all the information provided to the Board at its meetings throughout the year. The Board, in reaching its determination to renew the Advisory Contracts, is aware that shareholders in the fund have a broad range of investment choices available to them, including a wide choice among mutual funds offered by Fidelity's competitors, and that the fund's shareholders, who have the opportunity to review and weigh the disclosure provided by the fund in its prospectus and other public disclosures, have chosen to invest in this fund, managed by Fidelity.
Annual Report
Board Approval of Investment Advisory Contracts and
Management Fees - continued
Nature, Extent, and Quality of Services Provided. The Board considered the staffing within the investment adviser, FMR, and the sub-advisers (together, the Investment Advisers), including the backgrounds of the fund's investment personnel and the fund's investment objective and discipline. The Independent Trustees also had discussions with senior management of Fidelity's investment operations and investment groups. The Board considered the structure of the portfolio manager compensation program and whether this structure provides appropriate incentives to act in the best interests of the fund.
Resources Dedicated to Investment Management and Support Services. The Board and the Fund Oversight and Research Committees reviewed the general qualifications and capabilities of the Investment Advisers' investment staff, including its size, education, experience, and resources, as well as the Investment Advisers' approach to recruiting, training, managing, and compensating investment personnel. The Board also noted that FMR has devoted increased resources to non-U.S. offices. The Board noted that Fidelity's analysts have extensive resources, tools and capabilities which allow them to conduct sophisticated quantitative and fundamental analysis, as well as credit analysis of issuers, counterparties and enhancers. The Board also believes that Fidelity's investment professionals have sufficient access to global information and data so as to provide competitive investment results over time, and that those professionals also have access to sophisticated tools which permit them to assess portfolio construction and risk and performance attribution characteristics continuously, as well as to transmit new information and research conclusions rapidly around the world. Additionally, in their deliberations, the Board considered the Investment Advisers' trading capabilities and resources which are an integral part of the investment management process.
Shareholder and Administrative Services. The Board considered (i) the nature, extent, quality, and cost of advisory, administrative, and shareholder services performed by the Investment Advisers and their affiliates under the Advisory Contracts and under separate agreements covering transfer agency, pricing and bookkeeping, and securities lending services for the fund; (ii) the nature and extent of the investment adviser's supervision of third party service providers, principally custodians and subcustodians; and (iii) the resources devoted to, and the record of compliance with, the fund's compliance policies and procedures. The Board also reviewed the allocation of fund brokerage, including allocations to brokers affiliated with the Investment Advisers, the use of brokerage commissions to pay fund expenses, and the use of "soft" commission dollars to pay for research services.
The Board noted that the growth of fund assets over time across the complex allows Fidelity to reinvest in the development of services designed to enhance the value or convenience of the Fidelity funds as investment vehicles. These services include 24-hour access to account information and market information through telephone representatives and over the Internet, investor education materials and asset allocation tools, and the expanded availability of Fidelity Investor Centers, with 35 new branches opening since 2010.
Annual Report
Investment in a Large Fund Family. The Board considered the benefits to shareholders of investing in a Fidelity fund, including the benefits of investing in a fund that is part of a large family of funds offering a variety of investment disciplines and providing a large variety of mutual fund investor services. The Board noted that Fidelity had taken, or had made recommendations that resulted in the Fidelity funds taking, a number of actions over the previous year that benefited particular funds, including (i) continuing to dedicate additional resources to investment research and support of the senior management team that oversees asset management; (ii) rationalizing product lines through the mergers of six funds into other funds; (iii) continuing to migrate the Freedom Funds to dedicated lower cost underlying funds; (iv) obtaining shareholder approval to broaden the investment strategies for Fidelity Consumer Finance Portfolio, Fidelity Emerging Asia Fund, and Fidelity Environment and Alternative Energy Portfolio; (v) contractually agreeing to reduce the management fees and impose other expense limitations on Spartan 500 Index Fund and U.S. Bond Index Fund in connection with launching new institutional classes of these funds; (vi) changing the name, primary and supplemental benchmarks, and investment policies of Fidelity Global Strategies Fund to support the fund's flexible investment mandate and global orientation; and (vii) reducing the transfer agency account fee rates on certain accounts.
Investment Performance. The Board considered whether the fund has operated in accordance with its investment objective, as well as its record of compliance with its investment restrictions. It also reviewed the fund's absolute investment performance for each class, as well as the fund's relative investment performance for each class measured over multiple periods against (i) a broad-based securities market index, and (ii) a custom peer group of mutual funds deemed appropriate by Fidelity and reviewed by the Board. Because the fund had been in existence less than five calendar years, the following charts considered by the Board show, over the one- and three-year periods ended December 31, 2010, the cumulative total returns of Institutional Class (Class I) and Class C of the fund, the cumulative total returns of a broad-based securities market index ("benchmark"), and a range of cumulative total returns of a custom peer group of mutual funds defined by FMR based on categories assigned by Morningstar, Inc. The returns of Institutional Class (Class I) and Class C show the performance of the highest and lowest performing classes, respectively (based on three-year performance). The box within each chart shows the 25th percentile return (bottom of box) and the 75th percentile return (top of box) of the peer group. Returns shown above the box are in the first quartile and returns shown below the box are in the fourth quartile. The percentage beaten numbers noted below each chart correspond to the percentile box and represent the percentage of funds in the peer group whose performance was equal to or lower than that of the class indicated. The fund's custom peer group, defined by FMR, is a peer group that FMR believes provides a more meaningful performance comparison than the peer group assigned by Morningstar, Inc., which assigns mutual funds to categories based on their investment styles as measured by their underlying portfolio holdings.
Annual Report
Board Approval of Investment Advisory Contracts and
Management Fees - continued
Fidelity International Value Fund
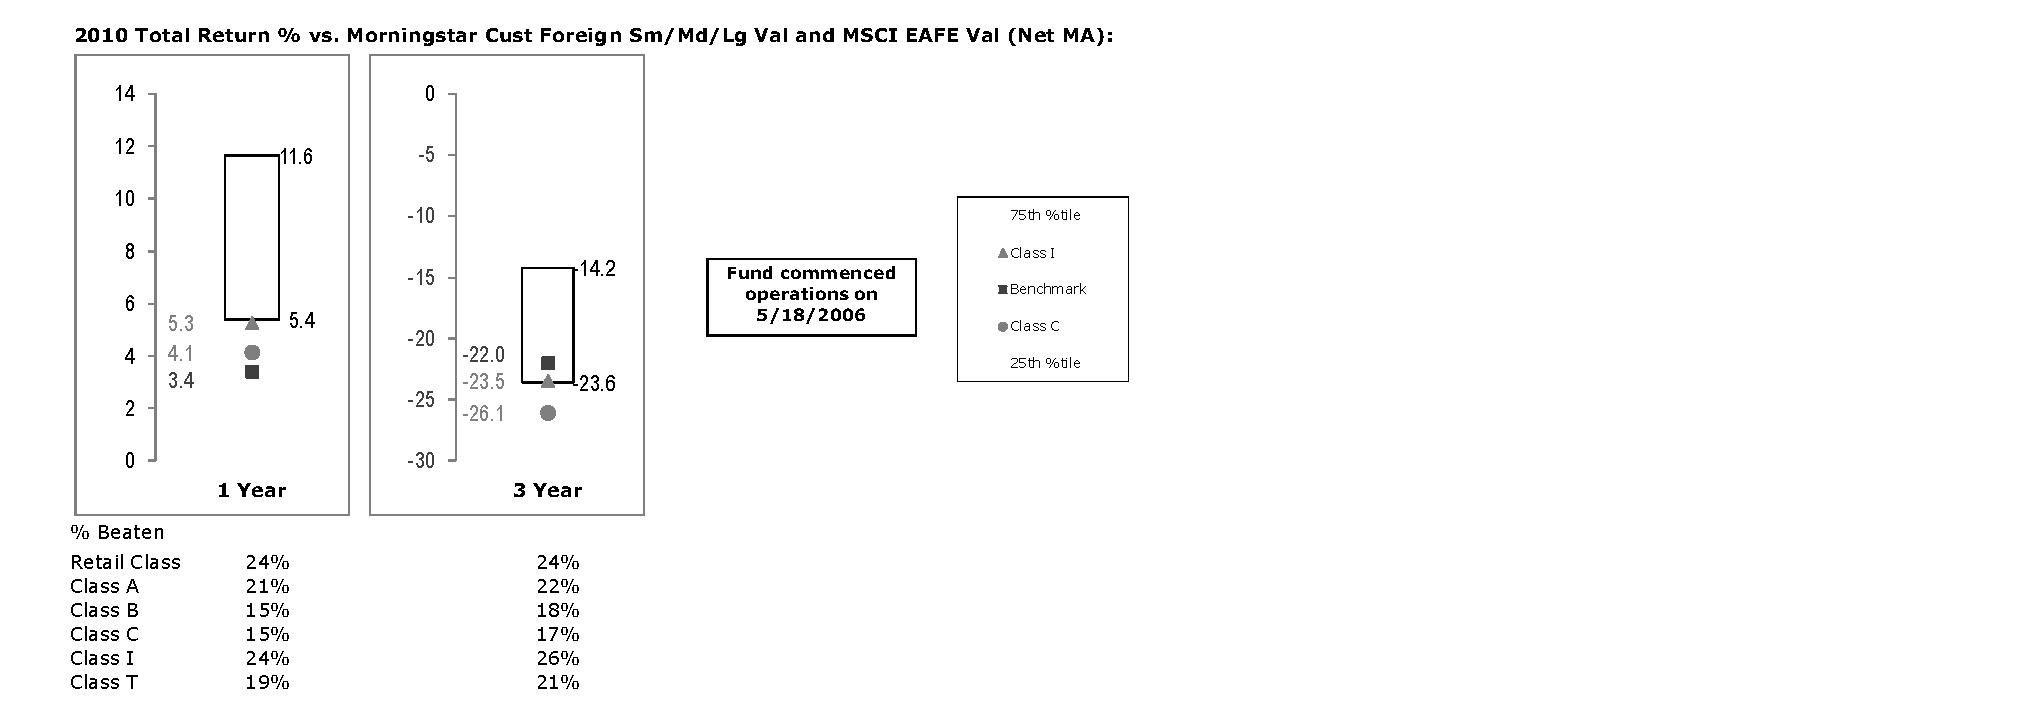
The Board reviewed the fund's relative investment performance against its peer group and noted that the performance of Institutional Class (Class I) of the fund was in the fourth quartile for the one-year period and the third quartile for the three-year period. The Board also noted that the investment performance of Institutional Class (Class I) of the fund compared favorably to its benchmark for the one-year period, although the fund's three-year cumulative total return was lower than its benchmark. The Board considered that the variations in performance among the fund's classes reflect the variations in class expenses, which result in lower performance for higher expense classes. The Board discussed with FMR actions that have been taken by FMR to improve the fund's disappointing performance relative to its peer group. The Board also reviewed the fund's performance since inception as well as performance in the current year. The Board will continue to closely monitor the performance of the fund in the coming year and discuss with FMR other appropriate actions to address the performance of the fund.
The Board also considered that the fund's management fee is subject to upward or downward adjustment depending upon whether, and to what extent, the fund's investment performance for the performance period exceeds, or is exceeded by, the record (over the same period) of a Board-approved performance adjustment index. The Board noted that the performance adjustment provides FMR with a strong economic incentive to seek to achieve superior performance for the fund's shareholders and helps to more closely align the interests of FMR and the fund's shareholders.
Annual Report
Based on its review, the Board concluded that the nature, extent, and quality of services provided to the fund under the Advisory Contracts should benefit the fund's shareholders.
Competitiveness of Management Fee and Total Expense Ratio. The Board considered the fund's management fee and total expense ratio compared to "mapped groups" of competitive funds and classes. Fidelity creates "mapped groups" by combining similar Lipper investment objective categories that have comparable management fee characteristics. Combining Lipper investment objective categories aids the Board's management fee and total expense ratio comparisons by broadening the competitive group used for comparison and by reducing the number of universes to which various Fidelity funds are compared.
Management Fee. The Board considered two proprietary management fee comparisons for the 12-month (or shorter) periods shown in the chart below. The group of Lipper funds used by the Board for management fee comparisons is referred to below as the "Total Mapped Group." The Total Mapped Group comparison focuses on a fund's standing relative to the total universe of comparable funds available to investors in terms of gross management fees before expense reimbursements or caps, and without giving effect to the fund's performance adjustment. "TMG %" represents the percentage of funds in the Total Mapped Group that had management fees that were lower than the fund's. For example, a TMG % of 16% means that 84% of the funds in the Total Mapped Group had higher management fees than the fund. The "Asset-Size Peer Group" (ASPG) comparison focuses on a fund's standing relative to non-Fidelity funds similar in size to the fund within the Total Mapped Group. The ASPG represents at least 15% of the funds in the Total Mapped Group with comparable asset size and management fee characteristics, subject to a minimum of 50 funds (or all funds in the Total Mapped Group if fewer than 50). Additional information, such as the ASPG quartile in which the fund's management fee ranked and the impact of the fund's performance adjustment, is also included in the chart and considered by the Board.
Annual Report
Board Approval of Investment Advisory Contracts and
Management Fees - continued
Fidelity International Value Fund
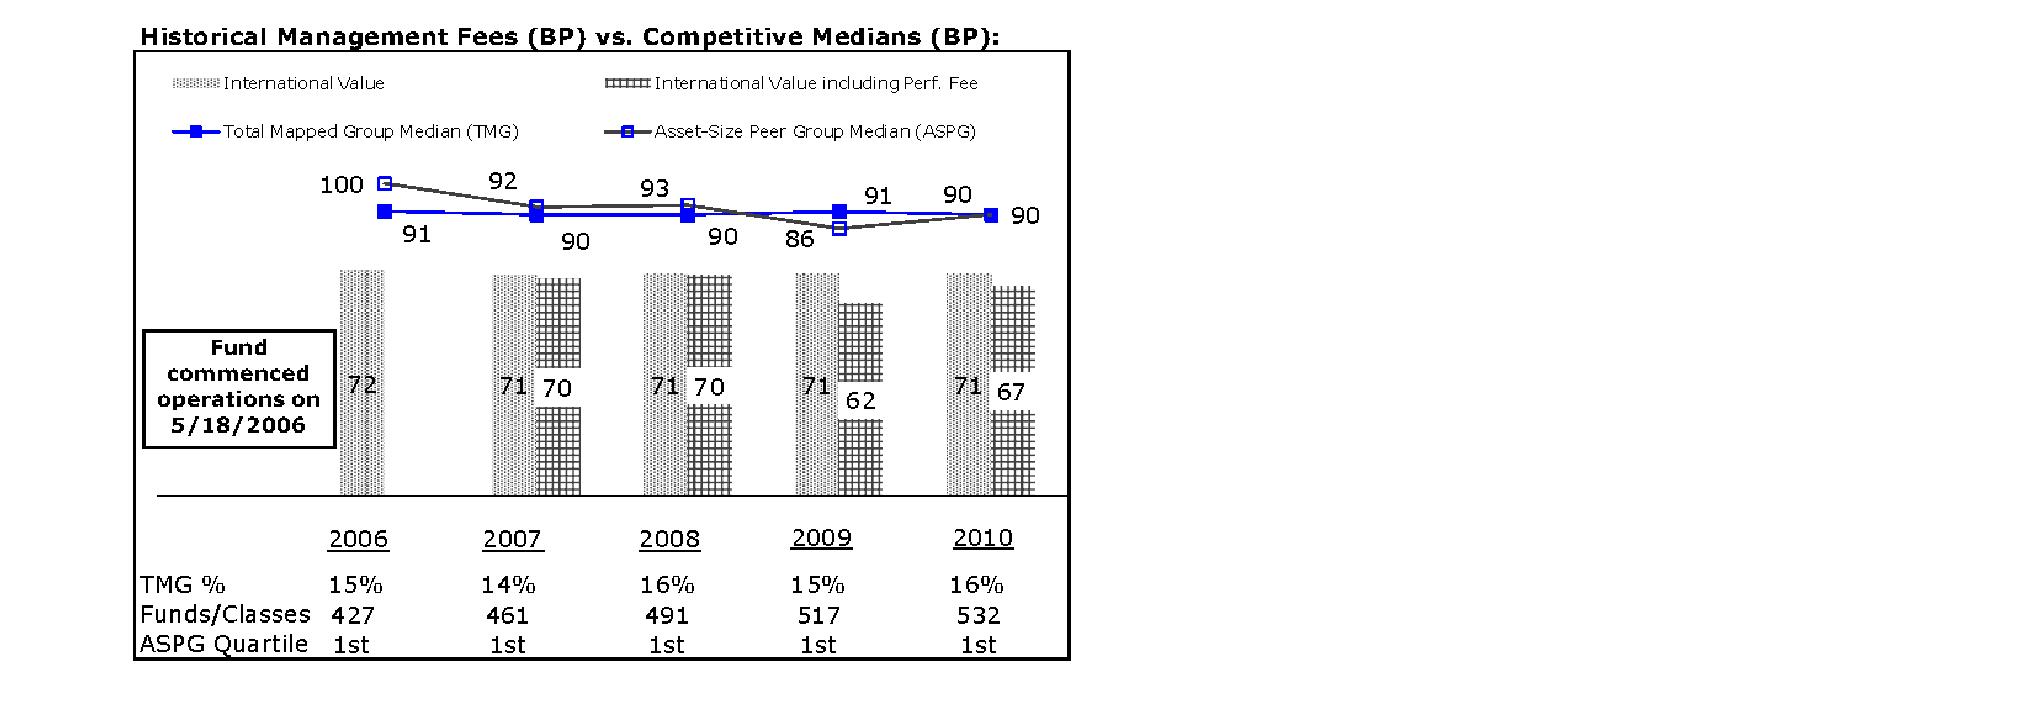
The Board noted that the fund's management fee ranked below the median of its Total Mapped Group and below the median of its ASPG for 2010. The Board also noted the effect of the fund's negative performance adjustment on the fund's management fee ranking. The Board noted that the performance adjustment for each year represents calculations for performance periods that differ from the periods shown in the performance charts above.
Based on its review, the Board concluded that the fund's management fee is fair and reasonable in light of the services that the fund receives and the other factors considered.
Total Expense Ratio. In its review of each class's total expense ratio, the Board considered the fund's management fee as well as other fund or class expenses, as applicable, such as transfer agent fees, pricing and bookkeeping fees, fund-paid 12b-1 fees, and custodial, legal, and audit fees. The Board also noted the effects of any waivers and reimbursements on fees and expenses, as well as the impact of the fund's performance adjustment. As part of its review, the Board also considered the current and historical total expense ratios of each class of the fund compared to competitive fund median expenses. Each class of the fund is compared to those funds and classes in the Total Mapped Group (used by the Board for management fee comparisons) that have a similar sales load structure.
The Board noted that the total expense ratio of each of Class A, Class B, Class C, Institutional Class, and the retail class ranked below its competitive median for 2010 and the total expense ratio of Class T ranked above its competitive median for 2010. The Board considered that various factors, including 12b-1 fees, positive or negative performance adjustments, and relatively higher other expenses in the case of small fund size, can affect total expense ratios. The Board noted that the total expense ratio of Class T was above the competitive median primarily because of higher 12b-1 fees on Class T. Class T has a higher 12b-1 fee, but a lower front-end sales charge, than traditionally priced front-end sales charge classes. The Board noted that the fund offers multiple classes, each of which has a different sales load and 12b-1 fee structure, and that the multiple structures are intended to offer a range of pricing options for the intermediary market. The Board also noted that the total expense ratios of the classes vary primarily by the level of their 12b-1 fees, although differences in transfer agent fees may also cause expenses to vary from class to class.
Annual Report
Fees Charged to Other Fidelity Clients. The Board also considered Fidelity fee structures and other information with respect to clients of FMR and its affiliates, such as other mutual funds advised or subadvised by FMR or its affiliates, pension plan clients, and other institutional clients. In March 2010, the Board created an ad hoc joint committee with the board of other Fidelity funds (the Committee) to review and compare Fidelity's institutional investment advisory business with its business of providing services to the Fidelity funds, including the differences in services provided, fees charged, and costs incurred, as well as competition in their respective marketplaces.
Based on its review of total expense ratios and fees charged to other Fidelity clients, the Board concluded that the total expense ratio of each class of the fund was reasonable, although Class T was above the median of the universe presented for comparison, in light of the services that the fund and its shareholders receive and the other factors considered, including the findings of the Committee.
Costs of the Services and Profitability. The Board considered the revenues earned and the expenses incurred by Fidelity in conducting the business of developing, marketing, distributing, managing, administering and servicing the fund and its shareholders. The Board also considered the level of Fidelity's profits in respect of all the Fidelity funds.
On an annual basis, FMR presents to the Board Fidelity's profitability for the fund. Fidelity calculates the profitability for each fund, as well as aggregate profitability for groups of Fidelity funds and all Fidelity funds, using a series of detailed revenue and cost allocation methodologies which originate with the books and records of Fidelity on which Fidelity's audited financial statements are based. The Audit Committee of the Board reviews any significant changes from the prior year's methodologies.
PricewaterhouseCoopers LLP (PwC), independent registered public accounting firm and auditor to Fidelity and certain Fidelity funds, has been engaged annually by the Board as part of the Board's assessment of Fidelity's profitability analysis. PwC's engagement includes the review and assessment of Fidelity's methodologies used in determining the revenues and expenses attributable to Fidelity's mutual fund business, and completion of agreed-upon procedures surrounding the mathematical accuracy of fund profitability and its conformity to allocation methodologies. After considering PwC's reports issued under the engagement and information provided by Fidelity, the Board concluded that while other allocation methods may also be reasonable, Fidelity's profitability methodologies are reasonable in all material respects.
Annual Report
Board Approval of Investment Advisory Contracts and
Management Fees - continued
The Board also reviewed Fidelity's non-fund businesses and fall-out benefits related to the mutual fund business as well as cases where Fidelity's affiliates may benefit from or be related to the fund's business.
The Board considered the costs of the services provided by and the profits realized by Fidelity in connection with the operation of the fund and was satisfied that the profitability was not excessive in the circumstances.
Economies of Scale. The Board considered whether there have been economies of scale in respect of the management of the Fidelity funds, whether the Fidelity funds (including the fund) have appropriately benefited from any such economies of scale, and whether there is potential for realization of any further economies of scale. The Board considered the extent to which the fund will benefit from economies of scale through increased services to the fund, through waivers or reimbursements, or through fee or expense reductions. The Board also noted that in 2009, it and the board of other Fidelity funds created an ad hoc committee (the Economies of Scale Committee) to analyze whether FMR attains economies of scale in respect of the management and servicing of the Fidelity funds, whether the Fidelity funds have appropriately benefited from such economies of scale, and whether there is potential for realization of any further economies of scale.
The Board recognized that the fund's management contract incorporates a "group fee" structure, which provides for lower group fee rates as total fund assets under FMR's management increase, and for higher group fee rates as total fund assets under FMR's management decrease. FMR calculates the group fee rates based on a tiered asset "breakpoint" schedule that varies based on asset class. The Board considered that the group fee is designed to deliver the benefits of economies of scale to fund shareholders when total Fidelity fund assets increase, even if assets of any particular fund are unchanged or have declined, because some portion of Fidelity's costs are attributable to services provided to all Fidelity funds, and all funds benefit if those costs can be allocated among more assets. The Board concluded that, given the group fee structure, fund shareholders will benefit from lower management fees as assets under FMR's management increase at the fund complex level, regardless of whether Fidelity achieves any such economies of scale.
The Board concluded, taking into account the analysis of the Economies of Scale Committee, that any potential economies of scale are being appropriately shared between fund shareholders and Fidelity.
Annual Report
Additional Information Requested by the Board. In order to develop fully the factual basis for consideration of the Fidelity funds' Advisory Contracts, the Board requested and received additional information on certain topics, including (i) fund performance trends, actions to be taken by FMR to improve certain funds' overall performance, and Fidelity's long-term strategies for certain funds; (ii) portfolio manager changes that have occurred during the past year and length of portfolio manager tenure for different categories of funds over time; (iii) Fidelity's compensation structure for portfolio managers and other key personnel and strategies for attracting and retaining non-investment personnel; (iv) the amount of the investment that each portfolio manager has made in the Fidelity fund(s) that he or she manages; (v) historical trends in Fidelity's realization of fall-out benefits; (vi) Fidelity's group fee structures and the rationale for the individual fee rates of certain funds; (vii) fund profitability methodology and the impact of certain factors on fund profitability results; (viii) trends regarding industry use of performance fee structures and Fidelity's compliance practices with respect to performance adjustment calculations; (ix) the fee structures in place for certain other Fidelity clients; and (x) explanations regarding the relative total expense ratios of certain funds and classes, total expense competitive trends, and actions that might be taken by FMR to reduce total expense ratios for certain funds and classes.
Based on its evaluation of all of the conclusions noted above, and after considering all factors it believed relevant, the Board ultimately concluded that the advisory fee structures are fair and reasonable, and that the fund's Advisory Contracts should be renewed.
Annual Report
Managing Your Investments
Fidelity offers several ways to conveniently manage your personal investments via your telephone or PC. You can access your account information, conduct trades and research your investments 24 hours a day.
By Phone
Fidelity Automated Service Telephone provides a single toll-free number to access account balances, positions, quotes and trading. It's easy to navigate the service, and on your first call, the system will help you create a personal identification number (PIN) for security.
(phone graphic)
Fidelity Automated
Service Telephone (FAST®)
1-800-544-5555
Press
1 For mutual fund and brokerage trading.
2 For quotes.*
3 For account balances and holdings.
4 To review orders and mutual
fund activity.
5 To change your PIN.
* 0 To speak to a Fidelity representative.
By PC
Fidelity's web site on the Internet provides a wide range of information, including daily financial news, fund performance, interactive planning tools and news about Fidelity products and services.
(computer graphic)
Fidelity's Web Site
www.fidelity.com
* When you call the quotes line, please remember that a fund's yield and return will vary and, except for money market funds, share price will also vary. This means that you may have a gain or loss when you sell your shares. There is no assurance that money market funds will be able to maintain a stable $1 share price; an investment in a money market fund is not insured or guaranteed by the U.S. government. Total returns are historical and include changes in share price, reinvestment of dividends and capital gains distributions, and the effects of any sales charges.
Annual Report
To Write Fidelity
We'll give your correspondence immediate attention and send you written confirmation upon completion of your request.
(letter graphic)
Making Changes
To Your Account
(such as changing name, address, bank, etc.)
Fidelity Investments
P.O. Box 770001
Cincinnati, OH 45277-0002
(letter graphic)
For Non-Retirement
Accounts
Buying shares
Fidelity Investments
P.O. Box 770001
Cincinnati, OH 45277-0003
Overnight Express
Fidelity Investments
Attn: Distribution Services
100 Crosby Parkway - KC1H
Covington, KY 41015
Selling shares
Fidelity Investments
P.O. Box 770001
Cincinnati, OH 45277-0035
Overnight Express
Fidelity Investments
Attn: Distribution Services
100 Crosby Parkway - KC1H
Covington, KY 41015
General Correspondence
Fidelity Investments
P.O. Box 500
Merrimack, NH 03054-0500
(letter graphic)
For Retirement
Accounts
Buying shares
Fidelity Investments
P.O. Box 770001
Cincinnati, OH 45277-0003
Selling shares
Fidelity Investments
P.O. Box 770001
Cincinnati, OH 45277-0035
Overnight Express
Fidelity Investments
Attn: Distribution Services
100 Crosby Parkway - KC1H
Covington, KY 41015
General Correspondence
Fidelity Investments
P.O. Box 500
Merrimack, NH 03054-0500
Annual Report
To Visit Fidelity
For directions and hours,
please call 1-800-544-9797.
Arizona
7001 West Ray Road
Chandler, AZ
15445 N. Scottsdale Road
Scottsdale, AZ
17550 North 75th Avenue
Glendale, AZ
5330 E. Broadway Blvd
Tucson, AZ
California
815 East Birch Street
Brea, CA
1411 Chapin Avenue
Burlingame, CA
851 East Hamilton Avenue
Campbell, CA
601 Larkspur Landing Circle
Larkspur, CA
2000 Avenue of the Stars
Los Angeles, CA
27101 Puerta Real
Mission Viejo, CA
73575 El Paseo
Palm Desert, CA
251 University Avenue
Palo Alto, CA
123 South Lake Avenue
Pasadena, CA
16656 Bernardo Ctr. Drive
Rancho Bernardo, CA
1220 Roseville Parkway
Roseville, CA
1740 Arden Way
Sacramento, CA
7676 Hazard Center Drive
San Diego, CA
11943 El Camino Real
San Diego, CA
8 Montgomery Street
San Francisco, CA
3793 State Street
Santa Barbara, CA
1200 Wilshire Boulevard
Santa Monica, CA
398 West El Camino Real
Sunnyvale, CA
111 South Westlake Blvd
Thousand Oaks, CA
21701 Hawthorne Boulevard
Torrance, CA
2001 North Main Street
Walnut Creek, CA
6326 Canoga Avenue
Woodland Hills, CA
2211 Michelson Drive
Irvine, CA
Colorado
281 East Flatiron Circle
Broomfield, CO
1625 Broadway
Denver, CO
9185 Westview Road
Lone Tree, CO
Connecticut
48 West Putnam Avenue
Greenwich, CT
265 Church Street
New Haven, CT
300 Atlantic Street
Stamford, CT
29 South Main Street
West Hartford, CT
1261 Post Road
Fairfield, CT
Delaware
400 Delaware Avenue
Wilmington, DE
Florida
175 East Altamonte Drive
Altamonte Springs, FL
1400 Glades Road
Boca Raton, FL
121 Alhambra Plaza
Coral Gables, FL
2948 N. Federal Highway
Ft. Lauderdale, FL
4671 Town Center Parkway
Jacksonville, FL
8880 Tamiami Trail, North
Naples, FL
230 Royal Palm Way
Palm Beach, FL
3501 PGA Boulevard
Palm Beach Gardens, FL
3550 Tamiami Trail, South
Sarasota, FL
1502 N. Westshore Blvd.
Tampa, FL
2465 State Road 7
Wellington, FL
Georgia
3242 Peachtree Road
Atlanta, GA
1000 Abernathy Road
Atlanta, GA
Illinois
One North LaSalle Street
Chicago, IL
401 North Michigan Avenue
Chicago, IL
One Skokie Valley Road
Highland Park, IL
1415 West 22nd Street
Oak Brook, IL
15105 S LaGrange Road
Orland Park, IL
1572 East Golf Road
Schaumburg, IL
1823 Freedom Drive
Naperville, IL
Indiana
8480 Keystone Crossing
Indianapolis, IN
Kansas
5400 College Boulevard
Overland Park, KS
Maine
Three Canal Plaza
Portland, ME
Maryland
7315 Wisconsin Avenue
Bethesda, MD
610 York Road
Towson, MD
Massachusetts
801 Boylston Street
Boston, MA
155 Congress Street
Boston, MA
300 Granite Street
Braintree, MA
44 Mall Road
Burlington, MA
238 Main Street
Cambridge, MA
200 Endicott Street
Danvers, MA
Annual Report
405 Cochituate Road
Framingham, MA
551 Boston Turnpike
Shrewsbury, MA
Michigan
500 E. Eisenhower Pkwy.
Ann Arbor, MI
280 N. Old Woodward Ave.
Birmingham, MI
30200 Northwestern Hwy.
Farmington Hills, MI
43420 Grand River Avenue
Novi, MI
3480 28th Street
Grand Rapids, MI
2425 S. Linden Road STE E
Flint, MI
Minnesota
7740 France Avenue South
Edina, MN
8342 3rd Street North
Oakdale, MN
Missouri
1524 South Lindbergh Blvd.
St. Louis, MO
Nevada
2225 Village Walk Drive
Henderson, NV
New Jersey
501 Route 73 South
Marlton, NJ
150 Essex Street
Millburn, NJ
35 Morris Street
Morristown, NJ
396 Route 17, North
Paramus, NJ
3518 Route 1 North
Princeton, NJ
530 Broad Street
Shrewsbury, NJ
New Mexico
2261 Q Street NE
Albuquerque, NM
New York
1130 Franklin Avenue
Garden City, NY
37 West Jericho Turnpike
Huntington Station, NY
1271 Avenue of the Americas
New York, NY
980 Madison Avenue
New York, NY
61 Broadway
New York, NY
350 Park Avenue
New York, NY
200 Fifth Avenue
New York, NY
733 Third Avenue
New York, NY
2070 Broadway
New York, NY
1075 Northern Blvd.
Roslyn, NY
799 Central Park Avenue
Scarsdale, NY
3349 Monroe Avenue
Rochester, NY
North Carolina
4611 Sharon Road
Charlotte, NC
7011 Fayetteville Road
Durham, NC
Ohio
3805 Edwards Road
Cincinnati, OH
1324 Polaris Parkway
Columbus, OH
1800 Crocker Road
Westlake, OH
28699 Chagrin Boulevard
Woodmere Village, OH
Oregon
7493 SW Bridgeport Road
Tigard, OR
Pennsylvania
600 West DeKalb Pike
King of Prussia, PA
1735 Market Street
Philadelphia, PA
12001 Perry Highway
Wexford, PA
Rhode Island
10 Memorial Boulevard
Providence, RI
Tennessee
3018 Peoples Street
Johnson City, TN
7628 West Farmington Blvd.
Germantown, TN
2035 Mallory Lane
Franklin, TN
Texas
10000 Research Boulevard
Austin, TX
4001 Northwest Parkway
Dallas, TX
12532 Memorial Drive
Houston, TX
2701 Drexel Drive
Houston, TX
6560 Fannin Street
Houston, TX
1701 Lake Robbins Drive
The Woodlands, TX
6500 N. MacArthur Blvd.
Irving, TX
6005 West Park Boulevard
Plano, TX
1576 East Southlake Blvd.
Southlake, TX
15600 Southwest Freeway
Sugar Land, TX
139 N. Loop 1604 East
San Antonio, TX
Utah
279 West South Temple
Salt Lake City, UT
Virginia
1861 International Drive
McLean, VA
11957 Democracy Drive
Reston, VA
Washington
10500 NE 8th Street
Bellevue, WA
1518 6th Avenue
Seattle, WA
304 Strander Blvd
Tukwila, WA
Washington, DC
1900 K Street, N.W.
Washington, DC
Wisconsin
16020 West Bluemound Road
Brookfield, WI
Fidelity Brokerage Services, Inc., 100 Summer St., Boston, MA 02110 Member NYSE/SIPC
Annual Report
Investment Adviser
Fidelity Management & Research Company
Boston, MA
Investment Sub-Advisers
FMR Co., Inc.
Fidelity Management & Research
(U.K.) Inc.
Fidelity Management & Research
(Hong Kong) Limited
Fidelity Management & Research
(Japan) Inc.
FIL Investment Advisors
FIL Investments (Japan) Limited
FIL Investment Advisors (U.K.) Ltd.
General Distributor
Fidelity Distributors Corporation
Boston, MA
Transfer and Service Agents
Fidelity Investments Institutional
Operations Company, Inc.
Boston, MA
Fidelity Service Company, Inc.
Boston, MA
Custodian
The Northern Trust Company
Chicago, Illinois
The Fidelity Telephone Connection
Mutual Fund 24-Hour Service
Exchanges/Redemptions
and Account Assistance 1-800-544-6666
Product Information 1-800-544-8888
Retirement Accounts 1-800-544-4774
(8 a.m. - 9 p.m.)
TDD Service 1-800-544-0118
for the deaf and hearing impaired
(9 a.m. - 9 p.m. Eastern time)
Fidelity Automated Service
Telephone (FAST®) (automated service graphic) 1-800-544-5555
(automated service graphic) Automated line for quickest service
(Fidelity Logo)
Corporate Headquarters
82 Devonshire St., Boston, MA 02109
www.fidelity.com
FIV-UANN-1211
1.827481.105
(Fidelity Logo)
Fidelity Advisor®
International Value
Fund - Class A, Class T, Class B
and Class C
Annual Report
October 31, 2011
(Fidelity Cover Art)
Class A, Class T, Class B, and Class C are classes of Fidelity® International Value Fund
Contents
Chairman's Message | (Click Here) | The Chairman's message to shareholders. |
Performance | (Click Here) | How the fund has done over time. |
Management's Discussion of Fund Performance | (Click Here) | The Portfolio Manager's review of fund performance and strategy. |
Shareholder Expense Example | (Click Here) | An example of shareholder expenses. |
Investment Changes | (Click Here) | A summary of major shifts in the fund's investments over the past six months. |
Investments | (Click Here) | A complete list of the fund's investments with their market values. |
Financial Statements | (Click Here) | Statements of assets and liabilities, operations, and changes in net assets, as well as financial highlights. |
Notes | (Click Here) | Notes to financial statements. |
Report of Independent Registered Public Accounting Firm | (Click Here) | |
Trustees and Officers | (Click Here) | |
Distributions | (Click Here) | |
Board Approval of Investment Advisory Contracts and Management Fees | (Click Here) | |
To view a fund's proxy voting guidelines and proxy voting record for the 12-month period ended June 30, visit http://www.fidelity.com/proxyvotingresults or visit the Securities and Exchange Commission's (SEC) web site at http://www.sec.gov. You may also call 1-877-208-0098 to request a free copy of the proxy voting guidelines.
Standard & Poor's, S&P and S&P 500 are registered service marks of The McGraw-Hill Companies, Inc. and have been licensed for use by Fidelity Distributors Corporation.
Other third party marks appearing herein are the property of their respective owners.
All other marks appearing herein are registered or unregistered trademarks or service marks of FMR LLC or an affiliated company.
Annual Report
This report and the financial statements contained herein are submitted for the general information of the shareholders of the fund. This report is not authorized for distribution to prospective investors in the fund unless preceded or accompanied by an effective prospectus.
A fund files its complete schedule of portfolio holdings with the SEC for the first and third quarters of each fiscal year on Form N-Q. Forms N-Q are available on the SEC's web site at http://www.sec.gov. A fund's Forms N-Q may be reviewed and copied at the SEC's Public Reference Room in Washington, DC. Information regarding the operation of the SEC's Public Reference Room may be obtained by calling 1-800-SEC-0330. For a complete list of a fund's portfolio holdings, view the most recent holdings listing, semiannual report, or annual report on Fidelity's web site at http://www.fidelity.com, http://www.advisor.fidelity.com, or http://www.401k.com, as applicable.
NOT FDIC INSURED • MAY LOSE VALUE • NO BANK GUARANTEE
Neither the fund nor Fidelity Distributors Corporation is a bank.
Annual Report
(Acting Chairman's Photograph)
Dear Shareholder:
Global equity markets began the fourth quarter on a strong note, sharply reversing course in October amid strong corporate earnings, better-than-expected economic news and the promise of a resolution to the sovereign debt crisis in Europe. The mini rally followed a third quarter marked by a significant downturn in July and August, which heightened investor anxiety and set off a wave of volatility that hampered most major asset classes through the end of September. Financial markets are difficult to predict, of course, but you can help put the odds in your favor by following these time-tested investment principles.
One of the basic tenets is to invest according to your time horizon. For long-term investors, riding out the markets' inevitable ups and downs has proven much more effective than making decisions based on short-term developments. If your goal is approaching, you can also benefit from patience and restraint, rather than attempting to time the market. No matter your time horizon, missing only a few of the markets' best days can significantly diminish returns. Patience also affords the benefits of compounding - earning interest on additional income or reinvested dividends and capital gains. While staying the course doesn't eliminate risk, it can considerably lessen the negative impact of short-term downturns.
Asset allocation is another principle to manage risk. As you spread your portfolio among the asset classes, be sure to consider your time horizon, risk tolerance and investment objectives. Younger investors may be better served by emphasizing equities, which historically have been the best-performing asset class over time. Investors who are nearing a specific goal, such as retirement or sending a child to college, may choose to favor bonds and other investments that have tended to be more stable. Studies indicate that asset allocation is the single most important determinant of a portfolio's long-term success. After deciding on a suitable allocation strategy, make sure your portfolio is adequately diversified, with exposure to stocks of small-, mid- and large-cap companies in a range of sectors, for example. And today, more than ever, geographic diversification should be taken into account.
Lastly, investing a certain amount of money on a regular basis - a principle known as dollar-cost averaging - can help lower the average cost of your purchases, while also giving you the discipline to avoid selling weak performers just prior to an upswing, or chasing a hot performer just before a correction.
We invite you to learn more by visiting us on the Internet, dropping by one of our Investor Centers or calling us by phone. It is our privilege to provide the resources you need to choose investments that are right for you.
Sincerely,
(Acting Chairman's Signature)
James C. Curvey
Acting Chairman
Annual Report
Average annual total return reflects the change in the value of an investment, assuming reinvestment of the class' distributions from dividend income and capital gains (the profits earned upon the sale of securities that have grown in value, if any) and assuming a constant rate of performance each year. The $10,000 table and the fund's returns do not reflect the deduction of taxes that a shareholder would pay on fund distributions or the redemption of fund shares. During periods of reimbursement by Fidelity, a fund's total return will be greater than it would be had the reimbursement not occurred. How a fund did yesterday is no guarantee of how it will do tomorrow.
Average Annual Total Returns
Periods ended October 31, 2011 | Past 1
year | Past 5
years | Life of
class A |
Class A (incl. 5.75% sales charge) | -17.24% | -6.69% | -5.14% |
Class T (incl. 3.50% sales charge) | -15.49% | -6.51% | -4.98% |
Class B (incl. contingent deferred sales charge)B | -17.15% | -6.63% | -4.98% |
Class C (incl. contingent deferred sales charge)C | -13.69% | -6.27% | -4.82% |
A From May 18, 2006.
B Class B shares' contingent deferred sales charges included in the past one year, past five years, and life of class total return figures are 5%, 2%, and 1%, respectively.
C Class C shares' contingent deferred sales charges included in the past one year, past five years, and life of class total return figures are 1%, 0%, and 0%, respectively.
Annual Report
$10,000 Over Life of Fund
Let's say hypothetically that $10,000 was invested in Fidelity Advisor® International Value Fund - Class A on May 18, 2006, when the fund started, and the current 5.75% sales charge was paid. The chart shows how the value of your investment would have changed, and also shows how the MSCI® EAFE® (Europe, Australasia, Far East) Value Index performed over the same period.
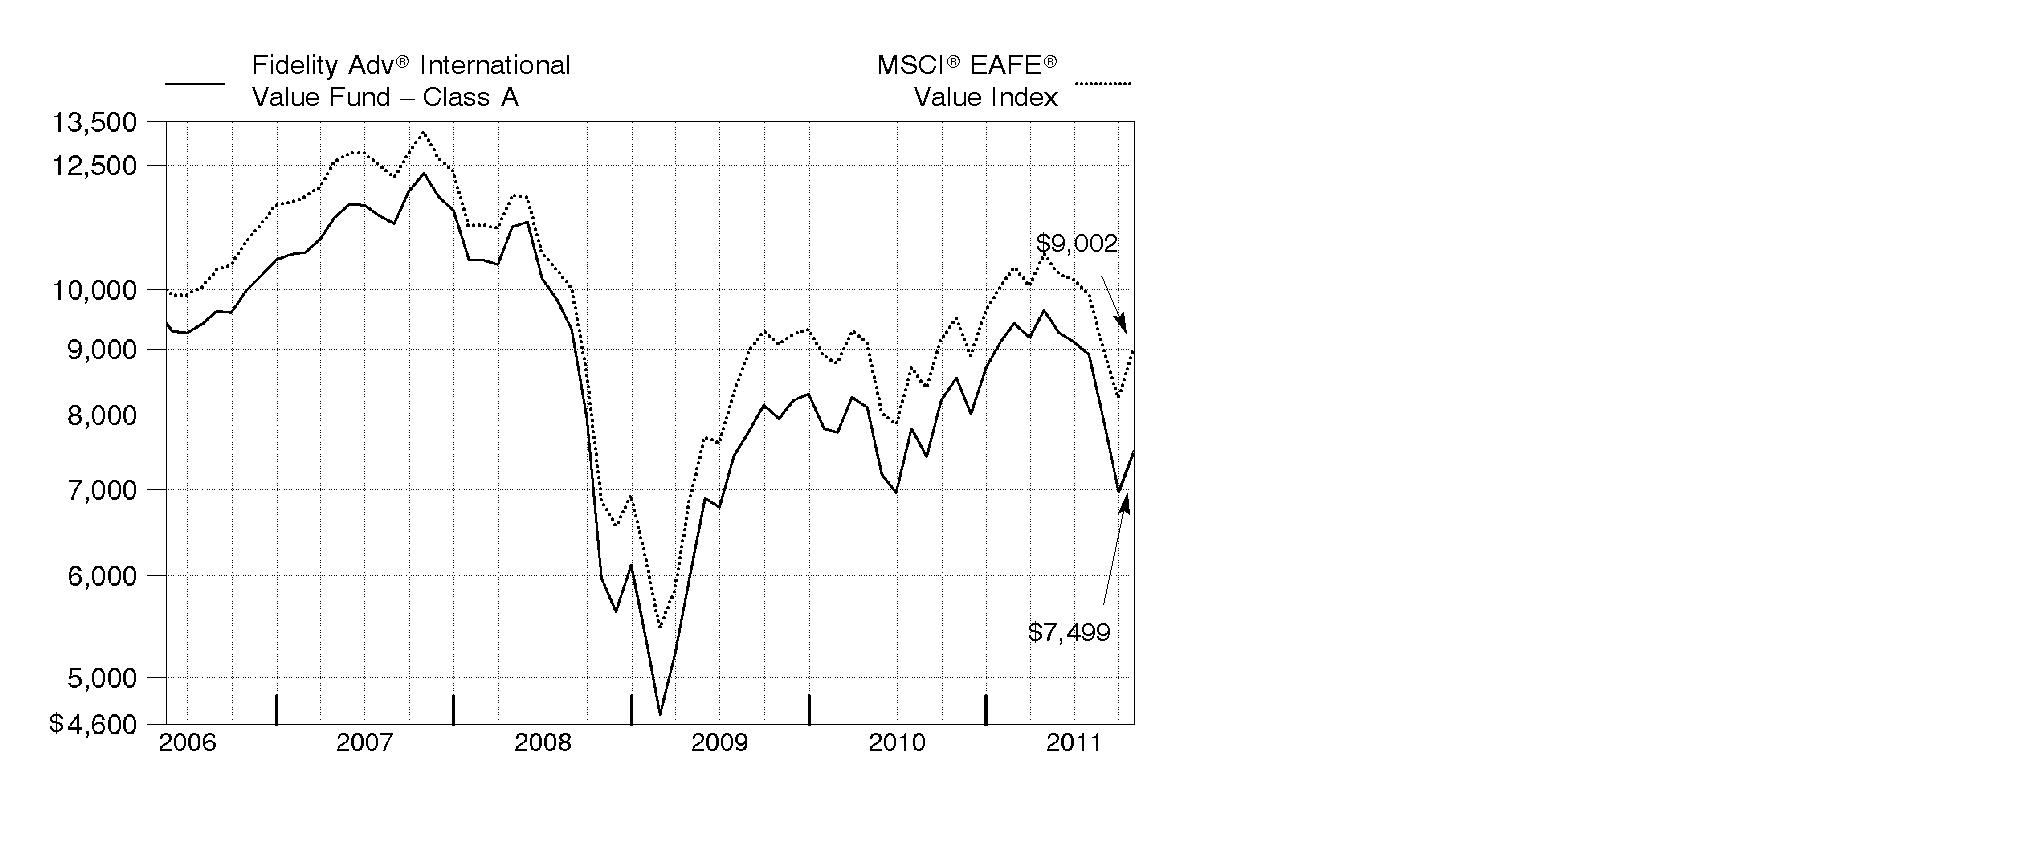
Annual Report
Market Recap: International equities were rocked by a number of headline events during the year ending October 31, 2011. Stocks posted a solid advance for the first half of the period, despite concern about the sovereign debt crisis in Europe, a devastating earthquake and tsunami in Japan, and political upheaval in the Middle East and North Africa. Sentiment turned decidedly negative in the second half, however, as fresh worries about Europe, inflation in China and a dimmed outlook for global growth caused foreign markets to suffer declines that intensified in August and September. October brought with it yet another dramatic swing, as eurozone policymakers appeared near a resolution to the debt debacle and buyers stormed back onto the scene in search of bargains. Still, those gains - along with favorable currency fluctuations overall - weren't enough to offset prior losses, and the MSCI® ACWI® (All Country World Index) ex USA Index finished the period down 4.56%. Within the MSCI index, Europe and emerging markets suffered the biggest declines, with many countries in these areas sustaining steep losses. By contrast, Japan showed resilience in the wake of its natural disasters, falling only 2%. Australia (+4%), Switzerland (+3%), the U.K. (+2%) and Canada, which produced a nominal return, were among the few major benchmark components to break into positive territory.
Comments from Alex Zavratsky, who became Portfolio Manager of Fidelity Advisor® International Value Fund on September 6, 2011: For the year, the fund's Class A, Class T, Class B and Class C shares declined 12.19%, 12.42%, 12.88% and 12.84%, respectively (excluding sales charges), trailing the 5.33% drop of the benchmark MSCI® EAFE® (Europe, Australasia, Far East) Value Index. In geographic terms, weak stock picking in and a lack of exposure to the comparatively healthy Asia Pacific ex Japan region, especially Australia, was detrimental to performance. Stock selection also was detrimental in the U.K., continental Europe - particularly France - and Japan. Sector-wise, the biggest source of weakness was the financials sector, where holdings in several European banks were among the biggest detractors, including France-based Societe Generale, Italy's Intesa Sanpaolo and an out-of-index stake in Lloyds Banking Group in the U.K. Elsewhere within financials, French insurance firm AXA and ING Groep, a diversified financials company in the Netherlands, hampered results. Picks in energy, consumer discretionary and industrials also hurt. However, positioning in utilities was a bright spot. Here, the fund's lack of exposure to Japanese utility Tokyo Electric Power, a benchmark component, was the biggest individual contributor, while out-of-index stakes in Swiss pharma firm Roche Holding and Canada-based miner Yamana Gold also aided results. Some of the stocks I've mentioned in this report were sold from the fund by period end.
The views expressed above reflect those of the portfolio manager(s) only through the end of the period as stated on the cover of this report and do not necessarily represent the views of Fidelity or any other person in the Fidelity organization. Any such views are subject to change at any time based upon market or other conditions and Fidelity disclaims any responsibility to update such views. These views may not be relied on as investment advice and, because investment decisions for a Fidelity fund are based on numerous factors, may not be relied on as an indication of trading intent on behalf of any Fidelity fund.
Annual Report
Shareholder Expense Example
As a shareholder of the Fund, you incur two types of costs: (1) transaction costs, including sales charges (loads) on purchase payments or redemption proceeds, redemption fees, and (2) ongoing costs, including management fees, distribution and/or service (12b-1) fees and other Fund expenses. This Example is intended to help you understand your ongoing costs (in dollars) of investing in the Fund and to compare these costs with the ongoing costs of investing in other mutual funds.
The Example is based on an investment of $1,000 invested at the beginning of the period and held for the entire period (May 1, 2011 to October 31, 2011).
Actual Expenses
The first line of the accompanying table for each class of the Fund provides information about actual account values and actual expenses. You may use the information in this line, together with the amount you invested, to estimate the expenses that you paid over the period. Simply divide your account value by $1,000.00 (for example, an $8,600 account value divided by $1,000.00 = 8.6), then multiply the result by the number in the first line for a class of the Fund under the heading entitled "Expenses Paid During Period" to estimate the expenses you paid on your account during this period. A small balance maintenance fee of $12.00 that is charged once a year may apply for certain accounts with a value of less than $2,000. This fee is not included in the table below. If it was, the estimate of expenses you paid during the period would be higher, and your ending account value lower, by this amount. In addition, the Fund, as a shareholder in the underlying Fidelity Central Funds, will indirectly bear its pro-rata share of the fees and expenses incurred by the underlying Fidelity Central Funds. These fees and expenses are not included in the Fund's annualized expense ratio used to calculate the expense estimate in the table below.
Hypothetical Example for Comparison Purposes
The second line of the accompanying table for each class of the Fund provides information about hypothetical account values and hypothetical expenses based on a Class' actual expense ratio and an assumed rate of return of 5% per year before expenses, which is not the Class' actual return. The hypothetical account values and expenses may not be used to estimate the actual ending account balance or expenses you paid for the period. You may use this information to compare the ongoing costs of investing in the Fund and other funds. To do so, compare this 5% hypothetical example with the 5% hypothetical examples that appear in the shareholder reports of the other funds. A small balance maintenance fee of $12.00 that is charged once a year may apply for certain accounts with a value of less than $2,000. This fee is not included in the table below. If it was, the estimate of expenses you paid during the period would be higher, and your ending account value lower, by this amount. In addition, the Fund, as a shareholder in the underlying Fidelity Central Funds, will indirectly bear its pro-rata share of the fees and expenses incurred by the underlying Fidelity Central Funds. These fees and expenses are not included in the Fund's annualized expense ratio used to calculate the expense estimate in the table below.
Please note that the expenses shown in the table are meant to highlight your ongoing costs only and do not reflect any transaction costs. Therefore, the second line of the table is useful in comparing ongoing costs only, and will not help you determine the relative total costs of owning different funds. In addition, if these transactional costs were included, your costs would have been higher.
Annual Report
| Annualized Expense Ratio | Beginning
Account Value
May 1, 2011 | Ending
Account Value
October 31, 2011 | Expenses Paid
During Period*
May 1, 2011 to
October 31, 2011 |
Class A | 1.35% | | | |
Actual | | $ 1,000.00 | $ 778.30 | $ 6.05 |
Hypothetical A | | $ 1,000.00 | $ 1,018.40 | $ 6.87 |
Class T | 1.62% | | | |
Actual | | $ 1,000.00 | $ 776.90 | $ 7.26 |
Hypothetical A | | $ 1,000.00 | $ 1,017.04 | $ 8.24 |
Class B | 2.09% | | | |
Actual | | $ 1,000.00 | $ 774.30 | $ 9.35 |
Hypothetical A | | $ 1,000.00 | $ 1,014.67 | $ 10.61 |
Class C | 2.10% | | | |
Actual | | $ 1,000.00 | $ 774.30 | $ 9.39 |
Hypothetical A | | $ 1,000.00 | $ 1,014.62 | $ 10.66 |
International Value | 1.02% | | | |
Actual | | $ 1,000.00 | $ 779.40 | $ 4.57 |
Hypothetical A | | $ 1,000.00 | $ 1,020.06 | $ 5.19 |
Institutional Class | .98% | | | |
Actual | | $ 1,000.00 | $ 778.80 | $ 4.39 |
Hypothetical A | | $ 1,000.00 | $ 1,020.27 | $ 4.99 |
A 5% return per year before expenses
* Expenses are equal to each Class' annualized expense ratio, multiplied by the average account value over the period, multiplied by 184/365 (to reflect the one-half year period).
Annual Report
Investment Changes (Unaudited)
Geographic Diversification (% of fund's net assets) |
As of October 31, 2011 |
| United Kingdom 27.1% | |
| Japan 21.8% | |
| Germany 10.6% | |
| France 8.5% | |
| Switzerland 7.6% | |
| Australia 6.3% | |
| Norway 2.9% | |
| Netherlands 2.8% | |
| Italy 2.7% | |
| Other 9.7% | |

Percentages are adjusted for the effect of futures contracts, if applicable. |
As of April 30, 2011 |
| United Kingdom 20.1% | |
| Japan 17.0% | |
| France 9.9% | |
| Germany 7.5% | |
| Spain 6.3% | |
| Switzerland 4.8% | |
| Netherlands 4.0% | |
| Canada 3.3% | |
| Hong Kong 3.2% | |
| Other 23.9% | |

Percentages are adjusted for the effect of futures contracts, if applicable. |
Asset Allocation |
| % of fund's
net assets | % of fund's net assets
6 months ago |
Stocks | 99.2 | 98.0 |
Short-Term Investments and Net Other Assets | 0.8 | 2.0 |
Top Ten Stocks as of October 31, 2011 |
| % of fund's
net assets | % of fund's net assets
6 months ago |
Royal Dutch Shell PLC Class A sponsored ADR (United Kingdom, Oil, Gas & Consumable Fuels) | 5.9 | 4.4 |
Vodafone Group PLC sponsored ADR (United Kingdom, Wireless Telecommunication Services) | 3.5 | 2.3 |
GlaxoSmithKline PLC sponsored ADR (United Kingdom, Pharmaceuticals) | 3.5 | 1.8 |
Commonwealth Bank of Australia (Australia, Commercial Banks) | 2.9 | 0.3 |
Sanofi-aventis (France, Pharmaceuticals) | 2.9 | 0.0 |
BP PLC sponsored ADR (United Kingdom, Oil, Gas & Consumable Fuels) | 2.8 | 2.4 |
Roche Holding AG (participation certificate) (Switzerland, Pharmaceuticals) | 2.8 | 1.9 |
Nestle SA (Switzerland, Food Products) | 2.2 | 0.0 |
Allianz AG (Germany, Insurance) | 2.0 | 0.0 |
Australia & New Zealand Banking Group Ltd. (Australia, Commercial Banks) | 1.9 | 0.0 |
| 30.4 | |
Market Sectors as of October 31, 2011 |
| % of fund's
net assets | % of fund's net assets
6 months ago |
Financials | 24.1 | 35.6 |
Energy | 13.2 | 12.6 |
Health Care | 11.7 | 5.3 |
Telecommunication Services | 11.6 | 6.0 |
Consumer Staples | 9.1 | 1.8 |
Utilities | 7.8 | 5.3 |
Consumer Discretionary | 7.5 | 10.3 |
Industrials | 6.4 | 8.8 |
Materials | 5.1 | 7.6 |
Information Technology | 2.7 | 4.7 |
Annual Report
Investments October 31, 2011
Showing Percentage of Net Assets
Common Stocks - 98.6% |
| Shares | | Value |
Australia - 6.3% |
Australia & New Zealand Banking Group Ltd. | 138,811 | | $ 3,136,930 |
Commonwealth Bank of Australia | 90,577 | | 4,653,389 |
Macquarie Group Ltd. | 29,691 | | 764,505 |
Telstra Corp. Ltd. | 508,385 | | 1,650,851 |
TOTAL AUSTRALIA | | 10,205,675 |
Bailiwick of Guernsey - 0.3% |
Resolution Ltd. | 112,600 | | 497,979 |
Bailiwick of Jersey - 0.5% |
Wolseley PLC | 29,862 | | 863,473 |
France - 8.5% |
Atos Origin SA | 13,608 | | 659,501 |
BNP Paribas SA | 45,993 | | 2,090,893 |
Casino Guichard Perrachon et Compagnie | 8,507 | | 799,611 |
Compagnie de St. Gobain | 13,677 | | 637,671 |
Euler Hermes SA | 4,358 | | 315,785 |
GDF Suez | 52,500 | | 1,490,512 |
Pernod-Ricard SA | 9,200 | | 859,402 |
PPR SA | 8,725 | | 1,363,214 |
Sanofi-aventis | 64,860 | | 4,640,692 |
Unibail-Rodamco | 4,566 | | 913,079 |
TOTAL FRANCE | | 13,770,360 |
Germany - 10.3% |
Allianz AG | 24,614 | | 2,766,282 |
Allianz AG sponsored ADR | 43,400 | | 486,080 |
BASF AG | 41,646 | | 3,065,547 |
Bayer AG | 31,246 | | 2,001,858 |
Daimler AG (United States) (d) | 30,700 | | 1,560,788 |
Deutsche Telekom AG | 119,500 | | 1,520,467 |
E.ON AG | 72,160 | | 1,748,588 |
HeidelbergCement AG | 15,400 | | 702,872 |
Metro AG | 12,500 | | 582,795 |
Siemens AG | 15,311 | | 1,605,145 |
Volkswagen AG | 3,535 | | 556,719 |
TOTAL GERMANY | | 16,597,141 |
Hong Kong - 0.6% |
Henderson Land Development Co. Ltd. | 20,000 | | 109,321 |
Power Assets Holdings Ltd. | 114,500 | | 870,064 |
TOTAL HONG KONG | | 979,385 |
Common Stocks - continued |
| Shares | | Value |
Ireland - 0.7% |
CRH PLC sponsored ADR (d) | 56,800 | | $ 1,045,688 |
Italy - 2.4% |
ENI SpA | 138,600 | | 3,064,045 |
Intesa Sanpaolo SpA | 457,645 | | 817,635 |
TOTAL ITALY | | 3,881,680 |
Japan - 21.8% |
ABC-Mart, Inc. | 13,900 | | 544,420 |
Aeon Credit Service Co. Ltd. | 51,800 | | 772,586 |
Air Water, Inc. | 63,000 | | 799,836 |
Aisin Seiki Co. Ltd. | 15,800 | | 499,770 |
Aozora Bank Ltd. | 482,000 | | 1,218,664 |
Asahi Glass Co. Ltd. | 58,000 | | 507,967 |
Canon, Inc. | 25,800 | | 1,171,413 |
Chubu Electric Power Co., Inc. | 42,600 | | 779,498 |
Credit Saison Co. Ltd. | 45,000 | | 878,236 |
Denso Corp. | 38,300 | | 1,178,001 |
Dentsu, Inc. | 23,700 | | 713,704 |
Fanuc Corp. | 4,900 | | 792,384 |
Honda Motor Co. Ltd. | 49,900 | | 1,492,388 |
INPEX Corp. | 150 | | 990,439 |
Itochu Corp. | 172,500 | | 1,706,320 |
Japan Retail Fund Investment Corp. | 1,012 | | 1,566,749 |
Japan Tobacco, Inc. | 516 | | 2,579,382 |
JSR Corp. | 42,300 | | 807,615 |
JX Holdings, Inc. | 200,600 | | 1,168,621 |
KDDI Corp. | 285 | | 2,087,994 |
Mitsubishi Corp. | 41,800 | | 859,809 |
Mitsubishi Tanabe Pharma Corp. | 73,400 | | 1,269,783 |
Nippon Telegraph & Telephone Corp. | 42,900 | | 2,200,873 |
Obic Co. Ltd. | 3,870 | | 731,757 |
ORIX Corp. | 9,540 | | 832,713 |
Santen Pharmaceutical Co. Ltd. | 19,900 | | 742,635 |
Seven & i Holdings Co., Ltd. | 39,300 | | 1,048,884 |
Tokio Marine Holdings, Inc. | 28,800 | | 686,809 |
Tokyo Gas Co. Ltd. | 313,000 | | 1,348,051 |
Toray Industries, Inc. | 127,000 | | 904,026 |
USS Co. Ltd. | 9,290 | | 768,095 |
West Japan Railway Co. | 37,700 | | 1,597,689 |
TOTAL JAPAN | | 35,247,111 |
Common Stocks - continued |
| Shares | | Value |
Korea (South) - 0.6% |
Samsung Electronics Co. Ltd. | 1,050 | | $ 900,532 |
Mexico - 0.7% |
Grupo Modelo SAB de CV Series C | 163,000 | | 1,033,913 |
Netherlands - 2.8% |
ING Groep NV: | | | |
(Certificaten Van Aandelen) (a) | 177,668 | | 1,531,893 |
sponsored ADR (a) | 57,141 | | 493,698 |
Koninklijke KPN NV | 58,620 | | 770,356 |
Koninklijke Philips Electronics NV | 38,000 | | 791,149 |
Unilever NV (Certificaten Van Aandelen) (Bearer) unit | 28,900 | | 997,878 |
TOTAL NETHERLANDS | | 4,584,974 |
Norway - 2.9% |
Aker Solutions ASA | 39,270 | | 456,702 |
DnB NOR ASA | 110,200 | | 1,285,561 |
Orkla ASA (A Shares) (d) | 114,700 | | 999,165 |
Telenor ASA | 111,600 | | 1,992,428 |
TOTAL NORWAY | | 4,733,856 |
Portugal - 0.2% |
Energias de Portugal SA | 119,836 | | 378,947 |
Singapore - 1.9% |
Singapore Telecommunications Ltd. | 686,000 | | 1,733,801 |
United Overseas Bank Ltd. | 102,480 | | 1,389,391 |
TOTAL SINGAPORE | | 3,123,192 |
Spain - 2.5% |
Banco Bilbao Vizcaya Argentaria SA sponsored ADR (d) | 249,725 | | 2,257,514 |
Red Electrica Corporacion SA | 11,600 | | 561,462 |
Repsol YPF SA | 37,297 | | 1,130,375 |
TOTAL SPAIN | | 3,949,351 |
Sweden - 0.9% |
Tele2 AB (B Shares) | 29,100 | | 614,177 |
Telefonaktiebolaget LM Ericsson (B Shares) | 73,030 | | 760,985 |
TOTAL SWEDEN | | 1,375,162 |
Switzerland - 7.6% |
Nestle SA | 61,138 | | 3,546,150 |
Roche Holding AG (participation certificate) | 27,505 | | 4,535,324 |
Syngenta AG (Switzerland) | 2,900 | | 883,943 |
Transocean Ltd. (United States) | 7,839 | | 447,999 |
Common Stocks - continued |
| Shares | | Value |
Switzerland - continued |
UBS AG (NY Shares) (a) | 77,800 | | $ 981,836 |
Zurich Financial Services AG | 8,111 | | 1,883,678 |
TOTAL SWITZERLAND | | 12,278,930 |
United Kingdom - 27.1% |
Aegis Group PLC | 176,727 | | 389,939 |
Aviva PLC | 212,728 | | 1,160,768 |
Barclays PLC | 592,002 | | 1,835,515 |
BP PLC sponsored ADR | 103,035 | | 4,552,086 |
British American Tobacco PLC (United Kingdom) | 17,400 | | 797,944 |
British Land Co. PLC | 80,100 | | 657,610 |
Centrica PLC | 161,725 | | 771,676 |
Compass Group PLC | 90,200 | | 821,038 |
GlaxoSmithKline PLC sponsored ADR | 125,600 | | 5,625,624 |
HSBC Holdings PLC sponsored ADR | 29,770 | | 1,299,758 |
Imperial Tobacco Group PLC | 46,179 | | 1,688,788 |
International Power PLC | 201,018 | | 1,093,323 |
National Grid PLC | 207,100 | | 2,059,381 |
Next PLC | 11,800 | | 485,046 |
Prudential PLC | 170,349 | | 1,759,882 |
Reed Elsevier PLC | 164,300 | | 1,412,295 |
Royal Dutch Shell PLC Class A sponsored ADR (d) | 133,400 | | 9,459,392 |
Scottish & Southern Energy PLC | 68,827 | | 1,487,641 |
Tesco PLC | 129,900 | | 839,277 |
Vodafone Group PLC sponsored ADR | 202,766 | | 5,645,005 |
TOTAL UNITED KINGDOM | | 43,841,988 |
TOTAL COMMON STOCKS (Cost $170,522,198) | 159,289,337 |
Nonconvertible Preferred Stocks - 0.6% |
| | | |
Germany - 0.3% |
Volkswagen AG | 3,327 | | 583,817 |
Italy - 0.3% |
Telecom Italia SpA (Risparmio Shares) | 489,900 | | 514,204 |
TOTAL NONCONVERTIBLE PREFERRED STOCKS (Cost $1,433,774) | 1,098,021 |
Money Market Funds - 7.3% |
| Shares | | | Value |
Fidelity Cash Central Fund, 0.12% (b) | 143,971 | | $ 143,971 |
Fidelity Securities Lending Cash Central Fund, 0.11% (b)(c) | 11,625,914 | | 11,625,914 |
TOTAL MONEY MARKET FUNDS (Cost $11,769,885) | | 11,769,885 |
TOTAL INVESTMENT PORTFOLIO - 106.5% (Cost $183,725,857) | 172,157,243 |
NET OTHER ASSETS (LIABILITIES) - (6.5)% | (10,572,704) |
NET ASSETS - 100% | $ 161,584,539 |
Legend |
(a) Non-income producing |
(b) Affiliated fund that is available only to investment companies and other accounts managed by Fidelity Investments. The rate quoted is the annualized seven-day yield of the fund at period end. A complete unaudited listing of the fund's holdings as of its most recent quarter end is available upon request. In addition, each Fidelity Central Fund's financial statements, which are not covered by the Fund's Report of Independent Registered Public Accounting Firm, are available on the SEC's website or upon request. |
(c) Investment made with cash collateral received from securities on loan. |
(d) Security or a portion of the security is on loan at period end. |
Affiliated Central Funds |
Information regarding fiscal year to date income earned by the Fund from investments in Fidelity Central Funds is as follows: |
Fund | Income earned |
Fidelity Cash Central Fund | $ 3,498 |
Fidelity Securities Lending Cash Central Fund | 221,316 |
Total | $ 224,814 |
Other Information |
The following is a summary of the inputs used, as of October 31, 2011, involving the Fund's assets and liabilities carried at fair value. The inputs or methodology used for valuing securities may not be an indication of the risk associated with investing in those securities. For more information on valuation inputs, and their aggregation into the levels used in the table below, please refer to the Security Valuation section in the accompanying Notes to Financial Statements. |
Valuation Inputs at Reporting Date: |
Description | Total | Level 1 | Level 2 | Level 3 |
Investments in Securities: | | | | |
Equities: | | | | |
United Kingdom | $ 43,841,988 | $ 36,228,498 | $ 7,613,490 | $ - |
Japan | 35,247,111 | - | 35,247,111 | - |
Germany | 17,180,958 | 15,575,813 | 1,605,145 | - |
France | 13,770,360 | 9,129,668 | 4,640,692 | - |
Switzerland | 12,278,930 | 11,394,987 | 883,943 | - |
Australia | 10,205,675 | - | 10,205,675 | - |
Norway | 4,733,856 | 4,733,856 | - | - |
Netherlands | 4,584,974 | 1,264,054 | 3,320,920 | - |
Italy | 4,395,884 | 817,635 | 3,578,249 | - |
Other | 14,147,622 | 8,383,528 | 5,764,094 | - |
Money Market Funds | 11,769,885 | 11,769,885 | - | - |
Total Investments in Securities: | $ 172,157,243 | $ 99,297,924 | $ 72,859,319 | $ - |
Income Tax Information |
At October 31, 2011, the Fund had a capital loss carryforward of approximately $117,406,155 of which $17,089,067, $65,376,972, $3,571,319 and $31,368,797 will expire in fiscal 2016, 2017, 2018 and 2019, respectively. Capital loss carryforwards are only available to offset future capital gains of the Fund to the extent provided by regulations and may be limited. |
See accompanying notes which are an integral part of the financial statements.
Annual Report
Statement of Assets and Liabilities
| October 31, 2011 |
Assets | | |
Investment in securities, at value (including securities loaned of $11,205,139) - See accompanying schedule: Unaffiliated issuers (cost $171,955,972) | $ 160,387,358 | |
Fidelity Central Funds (cost $11,769,885) | 11,769,885 | |
Total Investments (cost $183,725,857) | | $ 172,157,243 |
Foreign currency held at value (cost $6,508) | | 6,508 |
Receivable for investments sold | | 2,643,297 |
Receivable for fund shares sold | | 68,159 |
Dividends receivable | | 742,086 |
Distributions receivable from Fidelity Central Funds | | 1,186 |
Prepaid expenses | | 754 |
Other receivables | | 24,694 |
Total assets | | 175,643,927 |
| | |
Liabilities | | |
Payable to custodian bank | $ 578 | |
Payable for investments purchased | 2,093,650 | |
Payable for fund shares redeemed | 155,013 | |
Accrued management fee | 82,006 | |
Distribution and service plan fees payable | 4,397 | |
Other affiliated payables | 40,042 | |
Other payables and accrued expenses | 57,788 | |
Collateral on securities loaned, at value | 11,625,914 | |
Total liabilities | | 14,059,388 |
| | |
Net Assets | | $ 161,584,539 |
Net Assets consist of: | | |
Paid in capital | | $ 286,936,774 |
Undistributed net investment income | | 4,796,682 |
Accumulated undistributed net realized gain (loss) on investments and foreign currency transactions | | (118,590,823) |
Net unrealized appreciation (depreciation) on investments and assets and liabilities in foreign currencies | | (11,558,094) |
Net Assets | | $ 161,584,539 |
See accompanying notes which are an integral part of the financial statements.
Annual Report
Financial Statements - continued
Statement of Assets and Liabilities - continued
| October 31, 2011 |
| | |
Calculation of Maximum Offering Price Class A:
Net Asset Value and redemption price per share ($4,667,585 ÷ 665,122 shares) | | $ 7.02 |
| | |
Maximum offering price per share (100/94.25 of $7.02) | | $ 7.45 |
Class T:
Net Asset Value and redemption price per share ($2,467,516 ÷ 352,476 shares) | | $ 7.00 |
| | |
Maximum offering price per share (100/96.50 of $7.00) | | $ 7.25 |
Class B:
Net Asset Value and offering price per share ($901,346 ÷ 128,716 shares)A | | $ 7.00 |
| | |
Class C:
Net Asset Value and offering price per share ($2,108,020 ÷ 301,130 shares)A | | $ 7.00 |
| | |
International Value:
Net Asset Value, offering price and redemption price per share ($150,966,942 ÷ 21,486,993 shares) | | $ 7.03 |
| | |
Institutional Class:
Net Asset Value, offering price and redemption price per share ($473,130 ÷ 67,196 shares) | | $ 7.04 |
A Redemption price per share is equal to net asset value less any applicable contingent deferred sales charge.
See accompanying notes which are an integral part of the financial statements.
Annual Report
Statement of Operations
| Year ended October 31, 2011 |
Investment Income | | |
Dividends | | $ 8,421,712 |
Interest | | 4,722 |
Income from Fidelity Central Funds | | 224,814 |
Income before foreign taxes withheld | | 8,651,248 |
Less foreign taxes withheld | | (673,231) |
Total income | | 7,978,017 |
| | |
Expenses | | |
Management fee
Basic fee | $ 1,368,135 | |
Performance adjustment | (134,111) | |
Transfer agent fees | 451,985 | |
Distribution and service plan fees | 60,436 | |
Accounting and security lending fees | 110,463 | |
Custodian fees and expenses | 73,442 | |
Independent trustees' compensation | 1,067 | |
Registration fees | 73,513 | |
Audit | 70,906 | |
Legal | 763 | |
Interest | 381 | |
Miscellaneous | 1,736 | |
Total expenses before reductions | 2,078,716 | |
Expense reductions | (53,706) | 2,025,010 |
Net investment income (loss) | | 5,953,007 |
Realized and Unrealized Gain (Loss) Net realized gain (loss) on: | | |
Investment securities: | | |
Unaffiliated issuers | (31,191,099) | |
Foreign currency transactions | (23,323) | |
Total net realized gain (loss) | | (31,214,422) |
Change in net unrealized appreciation (depreciation) on: Investment securities (net of decrease in deferred foreign taxes of $30,988) | (366,851) | |
Assets and liabilities in foreign currencies | (16,031) | |
Total change in net unrealized appreciation (depreciation) | | (382,882) |
Net gain (loss) | | (31,597,304) |
Net increase (decrease) in net assets resulting from operations | | $ (25,644,297) |
See accompanying notes which are an integral part of the financial statements.
Annual Report
Financial Statements - continued
Statement of Changes in Net Assets
| Year ended
October 31,
2011 | Year ended
October 31,
2010 |
Increase (Decrease) in Net Assets | | |
Operations | | |
Net investment income (loss) | $ 5,953,007 | $ 3,860,059 |
Net realized gain (loss) | (31,214,422) | (3,221,958) |
Change in net unrealized appreciation (depreciation) | (382,882) | 12,417,837 |
Net increase (decrease) in net assets resulting
from operations | (25,644,297) | 13,055,938 |
Distributions to shareholders from net investment income | (4,441,935) | (3,135,757) |
Distributions to shareholders from net realized gain | (710,581) | (123,529) |
Total distributions | (5,152,516) | (3,259,286) |
Share transactions - net increase (decrease) | 18,454,243 | (27,172,209) |
Redemption fees | 3,151 | 3,410 |
Total increase (decrease) in net assets | (12,339,419) | (17,372,147) |
| | |
Net Assets | | |
Beginning of period | 173,923,958 | 191,296,105 |
End of period (including undistributed net investment income of $4,796,681 and undistributed net investment income of $3,475,373, respectively) | $ 161,584,539 | $ 173,923,958 |
See accompanying notes which are an integral part of the financial statements.
Annual Report
Financial Highlights - Class A
Years ended October 31, | 2011 | 2010 | 2009 | 2008 | 2007 |
Selected Per-Share Data | | | | | |
Net asset value, beginning of period | $ 8.22 | $ 7.75 | $ 5.93 | $ 13.02 | $ 10.60 |
Income from Investment Operations | | | | | |
Net investment income (loss) C | .22 | .15 | .12 | .21 | .18 |
Net realized and unrealized gain (loss) | (1.19) | .44 | 1.78 | (6.53) | 2.29 |
Total from investment operations | (.97) | .59 | 1.90 | (6.32) | 2.47 |
Distributions from net investment income | (.19) | (.11) | (.08) | (.15) | (.03) |
Distributions from net realized gain | (.03) | (.01) | - | (.62) | (.02) |
Total distributions | (.23) H | (.12) | (.08) | (.77) | (.05) |
Redemption fees added to paid in capital C,G | - | - | - | - | - |
Net asset value, end of period | $ 7.02 | $ 8.22 | $ 7.75 | $ 5.93 | $ 13.02 |
Total Return A,B | (12.19)% | 7.60% | 32.71% | (51.50)% | 23.43% |
Ratios to Average Net Assets D,F | | | | | |
Expenses before reductions | 1.36% | 1.40% | 1.34% | 1.42% | 1.38% |
Expenses net of fee waivers, if any | 1.36% | 1.40% | 1.34% | 1.42% | 1.38% |
Expenses net of all reductions | 1.34% | 1.38% | 1.32% | 1.41% | 1.37% |
Net investment income (loss) | 2.79% | 1.93% | 1.86% | 2.05% | 1.49% |
Supplemental Data | | | | | |
Net assets, end of period (000 omitted) | $ 4,668 | $ 4,699 | $ 4,456 | $ 2,854 | $ 6,052 |
Portfolio turnover rate E | 83% | 43% | 46% | 68% | 59% |
A Total returns would have been lower if certain expenses had not been reduced during the applicable periods shown.
B Total returns do not include the effect of the sales charges.
C Calculated based on average shares outstanding during the period.
D Fees and expenses of any underlying Fidelity Central Funds are not included in the Fund's expense ratio. The Fund indirectly bears its proportionate share of the expenses of any underlying Fidelity Central Funds.
E Amount does not include the portfolio activity of any underlying Fidelity Central Funds.
F Expense ratios reflect operating expenses of the class. Expenses before reductions do not reflect amounts reimbursed by the investment adviser or reductions from brokerage service arrangements or reductions from other expense offset arrangements and do not represent the amount paid by the class during periods when reimbursements or reductions occur. Expenses net of fee waivers reflect expenses after reimbursement by the investment adviser but prior to reductions from brokerage service arrangements or other expense offset arrangements. Expenses net of all reductions represent the net expenses paid by the class.
G Amount represents less than $.01 per share.
H Total distributions of $.23 per share is comprised of distributions from net investment income of $.191 and distributions from net realized gain of $.034 per share.
See accompanying notes which are an integral part of the financial statements.
Annual Report
Financial Highlights - Class T
Years ended October 31, | 2011 | 2010 | 2009 | 2008 | 2007 |
Selected Per-Share Data | | | | | |
Net asset value, beginning of period | $ 8.20 | $ 7.73 | $ 5.91 | $ 12.99 | $ 10.59 |
Income from Investment Operations | | | | | |
Net investment income (loss) C | .20 | .13 | .10 | .18 | .15 |
Net realized and unrealized gain (loss) | (1.19) | .44 | 1.77 | (6.50) | 2.29 |
Total from investment operations | (.99) | .57 | 1.87 | (6.32) | 2.44 |
Distributions from net investment income | (.17) | (.09) | (.05) | (.14) | (.02) |
Distributions from net realized gain | (.03) | (.01) | - | (.62) | (.02) |
Total distributions | (.21) H | (.10) | (.05) | (.76) | (.04) |
Redemption fees added to paid in capital C,G | - | - | - | - | - |
Net asset value, end of period | $ 7.00 | $ 8.20 | $ 7.73 | $ 5.91 | $ 12.99 |
Total Return A,B | (12.42)% | 7.32% | 32.14% | (51.60)% | 23.13% |
Ratios to Average Net Assets D,F | | | | | |
Expenses before reductions | 1.63% | 1.67% | 1.60% | 1.67% | 1.60% |
Expenses net of fee waivers, if any | 1.62% | 1.67% | 1.60% | 1.67% | 1.60% |
Expenses net of all reductions | 1.60% | 1.65% | 1.59% | 1.66% | 1.58% |
Net investment income (loss) | 2.52% | 1.65% | 1.59% | 1.80% | 1.27% |
Supplemental Data | | | | | |
Net assets, end of period (000 omitted) | $ 2,468 | $ 2,276 | $ 2,395 | $ 2,087 | $ 5,081 |
Portfolio turnover rate E | 83% | 43% | 46% | 68% | 59% |
A Total returns would have been lower if certain expenses had not been reduced during the applicable periods shown.
B Total returns do not include the effect of the sales charges.
C Calculated based on average shares outstanding during the period.
D Fees and expenses of any underlying Fidelity Central Funds are not included in the Fund's expense ratio. The Fund indirectly bears its proportionate share of the expenses of any underlying Fidelity Central Funds.
E Amount does not include the portfolio activity of any underlying Fidelity Central Funds.
F Expense ratios reflect operating expenses of the class. Expenses before reductions do not reflect amounts reimbursed by the investment adviser or reductions from brokerage service arrangements or reductions from other expense offset arrangements and do not represent the amount paid by the class during periods when reimbursements or reductions occur. Expenses net of fee waivers reflect expenses after reimbursement by the investment adviser but prior to reductions from brokerage service arrangements or other expense offset arrangements. Expenses net of all reductions represent the net expenses paid by the class.
G Amount represents less than $.01 per share.
H Total distributions of $.21 per share is comprised of distributions from net investment income of $.173 and distributions from net realized gain of $.034 per share.
See accompanying notes which are an integral part of the financial statements.
Annual Report
Financial Highlights - Class B
Years ended October 31, | 2011 | 2010 | 2009 | 2008 | 2007 |
Selected Per-Share Data | | | | | |
Net asset value, beginning of period | $ 8.20 | $ 7.74 | $ 5.88 | $ 12.93 | $ 10.56 |
Income from Investment Operations | | | | | |
Net investment income (loss) C | .17 | .09 | .07 | .13 | .09 |
Net realized and unrealized gain (loss) | (1.20) | .44 | 1.79 | (6.48) | 2.29 |
Total from investment operations | (1.03) | .53 | 1.86 | (6.35) | 2.38 |
Distributions from net investment income | (.13) | (.06) | - | (.08) | - |
Distributions from net realized gain | (.03) | (.01) | - | (.62) | (.01) |
Total distributions | (.17) H | (.07) | - | (.70) | (.01) |
Redemption fees added to paid in capital C,G | - | - | - | - | - |
Net asset value, end of period | $ 7.00 | $ 8.20 | $ 7.74 | $ 5.88 | $ 12.93 |
Total Return A,B | (12.88)% | 6.82% | 31.63% | (51.85)% | 22.59% |
Ratios to Average Net Assets D,F | | | | | |
Expenses before reductions | 2.11% | 2.15% | 2.08% | 2.18% | 2.10% |
Expenses net of fee waivers, if any | 2.11% | 2.15% | 2.08% | 2.18% | 2.10% |
Expenses net of all reductions | 2.09% | 2.13% | 2.07% | 2.17% | 2.08% |
Net investment income (loss) | 2.04% | 1.18% | 1.11% | 1.29% | .77% |
Supplemental Data | | | | | |
Net assets, end of period (000 omitted) | $ 901 | $ 1,216 | $ 1,076 | $ 931 | $ 2,651 |
Portfolio turnover rate E | 83% | 43% | 46% | 68% | 59% |
A Total returns would have been lower if certain expenses had not been reduced during the applicable periods shown.
B Total returns do not include the effect of the contingent deferred sales charge.
C Calculated based on average shares outstanding during the period.
D Fees and expenses of any underlying Fidelity Central Funds are not included in the Fund's expense ratio. The Fund indirectly bears its proportionate share of the expenses of any underlying Fidelity Central Funds.
E Amount does not include the portfolio activity of any underlying Fidelity Central Funds.
F Expense ratios reflect operating expenses of the class. Expenses before reductions do not reflect amounts reimbursed by the investment adviser or reductions from brokerage service arrangements or reductions from other expense offset arrangements and do not represent the amount paid by the class during periods when reimbursements or reductions occur. Expenses net of fee waivers reflect expenses after reimbursement by the investment adviser but prior to reductions from brokerage service arrangements or other expense offset arrangements. Expenses net of all reductions represent the net expenses paid by the class.
G Amount represents less than $.01 per share.
H Total distributions of $.17 per share is comprised of distributions from net investment income of $.131 and distributions from net realized gain of $.034 per share.
See accompanying notes which are an integral part of the financial statements.
Annual Report
Financial Highlights - Class C
Years ended October 31, | 2011 | 2010 | 2009 | 2008 | 2007 |
Selected Per-Share Data | | | | | |
Net asset value, beginning of period | $ 8.20 | $ 7.73 | $ 5.88 | $ 12.92 | $ 10.56 |
Income from Investment Operations | | | | | |
Net investment income (loss) C | .16 | .09 | .07 | .13 | .09 |
Net realized and unrealized gain (loss) | (1.19) | .44 | 1.78 | (6.47) | 2.29 |
Total from investment operations | (1.03) | .53 | 1.85 | (6.34) | 2.38 |
Distributions from net investment income | (.14) | (.05) | - | (.08) | - |
Distributions from net realized gain | (.03) | (.01) | - | (.62) | (.02) |
Total distributions | (.17) | (.06) | - | (.70) | (.02) |
Redemption fees added to paid in capital C,G | - | - | - | - | - |
Net asset value, end of period | $ 7.00 | $ 8.20 | $ 7.73 | $ 5.88 | $ 12.92 |
Total Return A,B | (12.84)% | 6.84% | 31.46% | (51.80)% | 22.56% |
Ratios to Average Net Assets D,F | | | | | |
Expenses before reductions | 2.12% | 2.15% | 2.08% | 2.17% | 2.07% |
Expenses net of fee waivers, if any | 2.11% | 2.15% | 2.08% | 2.17% | 2.07% |
Expenses net of all reductions | 2.09% | 2.13% | 2.06% | 2.16% | 2.05% |
Net investment income (loss) | 2.04% | 1.18% | 1.12% | 1.30% | .80% |
Supplemental Data | | | | | |
Net assets, end of period (000 omitted) | $ 2,108 | $ 2,123 | $ 2,108 | $ 1,784 | $ 5,996 |
Portfolio turnover rate E | 83% | 43% | 46% | 68% | 59% |
A Total returns would have been lower if certain expenses had not been reduced during the applicable periods shown.
B Total returns do not include the effect of the contingent deferred sales charge.
C Calculated based on average shares outstanding during the period.
D Fees and expenses of any underlying Fidelity Central Funds are not included in the Fund's expense ratio. The Fund indirectly bears its proportionate share of the expenses of any underlying Fidelity Central Funds.
E Amount does not include the portfolio activity of any underlying Fidelity Central Funds.
F Expense ratios reflect operating expenses of the class. Expenses before reductions do not reflect amounts reimbursed by the investment adviser or reductions from brokerage service arrangements or reductions from other expense offset arrangements and do not represent the amount paid by the class during periods when reimbursements or reductions occur. Expenses net of fee waivers reflect expenses after reimbursement by the investment adviser but prior to reductions from brokerage service arrangements or other expense offset arrangements. Expenses net of all reductions represent the net expenses paid by the class.
G Amount represents less than $.01 per share.
See accompanying notes which are an integral part of the financial statements.
Annual Report
Financial Highlights - International Value
Years ended October 31, | 2011 | 2010 | 2009 | 2008 | 2007 |
Selected Per-Share Data | | | | | |
Net asset value, beginning of period | $ 8.23 | $ 7.75 | $ 5.95 | $ 13.06 | $ 10.61 |
Income from Investment Operations | | | | | |
Net investment income (loss) B | .25 | .17 | .13 | .24 | .22 |
Net realized and unrealized gain (loss) | (1.20) | .44 | 1.78 | (6.54) | 2.29 |
Total from investment operations | (.95) | .61 | 1.91 | (6.30) | 2.51 |
Distributions from net investment income | (.22) | (.13) | (.11) | (.19) | (.04) |
Distributions from net realized gain | (.03) | (.01) | - | (.62) | (.02) |
Total distributions | (.25) | (.13) G | (.11) | (.81) | (.06) |
Redemption fees added to paid in capital B,F | - | - | - | - | - |
Net asset value, end of period | $ 7.03 | $ 8.23 | $ 7.75 | $ 5.95 | $ 13.06 |
Total Return A | (11.91)% | 7.95% | 33.09% | (51.34)% | 23.81% |
Ratios to Average Net Assets C,E | | | | | |
Expenses before reductions | 1.04% | 1.09% | 1.07% | 1.10% | 1.03% |
Expenses net of fee waivers, if any | 1.03% | 1.09% | 1.07% | 1.10% | 1.03% |
Expenses net of all reductions | 1.01% | 1.08% | 1.06% | 1.09% | 1.02% |
Net investment income (loss) | 3.11% | 2.23% | 2.12% | 2.37% | 1.84% |
Supplemental Data | | | | | |
Net assets, end of period (000 omitted) | $ 150,967 | $ 163,090 | $ 180,447 | $ 160,777 | $ 381,148 |
Portfolio turnover rate D | 83% | 43% | 46% | 68% | 59% |
A Total returns would have been lower if certain expenses had not been reduced during the applicable periods shown.
B Calculated based on average shares outstanding during the period.
C Fees and expenses of any underlying Fidelity Central Funds are not included in the Fund's expense ratio. The Fund indirectly bears its proportionate share of the expenses of any underlying Fidelity Central Funds.
D Amount does not include the portfolio activity of any underlying Fidelity Central Funds.
E Expense ratios reflect operating expenses of the class. Expenses before reductions do not reflect amounts reimbursed by the investment adviser or reductions from brokerage service arrangements or reductions from other expense offset arrangements and do not represent the amount paid by the class during periods when reimbursements or reductions occur. Expenses net of fee waivers reflect expenses after reimbursement by the investment adviser but prior to reductions from brokerage service arrangements or other expense offset arrangements. Expenses net of all reductions represent the net expenses paid by the class.
F Amount represents less than $.01 per share.
G Total distributions of $.13 per share is comprised of distributions from net investment income of $.129 and distributions from net realized gain of $.005 per share.
See accompanying notes which are an integral part of the financial statements.
Annual Report
Financial Highlights - Institutional Class
Years ended October 31, | 2011 | 2010 | 2009 | 2008 | 2007 |
Selected Per-Share Data | | | | | |
Net asset value, beginning of period | $ 8.24 | $ 7.76 | $ 5.96 | $ 13.07 | $ 10.61 |
Income from Investment Operations | | | | | |
Net investment income (loss) B | .25 | .18 | .14 | .25 | .22 |
Net realized and unrealized gain (loss) | (1.19) | .44 | 1.78 | (6.54) | 2.30 |
Total from investment operations | (.94) | .62 | 1.92 | (6.29) | 2.52 |
Distributions from net investment income | (.22) | (.14) | (.12) | (.20) | (.04) |
Distributions from net realized gain | (.03) | (.01) | - | (.62) | (.02) |
Total distributions | (.26) H | (.14) G | (.12) | (.82) | (.06) |
Redemption fees added to paid in capital B,F | - | - | - | - | - |
Net asset value, end of period | $ 7.04 | $ 8.24 | $ 7.76 | $ 5.96 | $ 13.07 |
Total Return A | (11.83)% | 8.05% | 33.06% | (51.27)% | 23.91% |
Ratios to Average Net Assets C,E | | | | | |
Expenses before reductions | .98% | .98% | .93% | 1.02% | .98% |
Expenses net of fee waivers, if any | .98% | .98% | .93% | 1.02% | .98% |
Expenses net of all reductions | .96% | .97% | .92% | 1.01% | .96% |
Net investment income (loss) | 3.17% | 2.34% | 2.26% | 2.45% | 1.89% |
Supplemental Data | | | | | |
Net assets, end of period (000 omitted) | $ 473 | $ 519 | $ 814 | $ 1,052 | $ 3,965 |
Portfolio turnover rate D | 83% | 43% | 46% | 68% | 59% |
A Total returns would have been lower if certain expenses had not been reduced during the applicable periods shown.
B Calculated based on average shares outstanding during the period.
C Fees and expenses of any underlying Fidelity Central Funds are not included in the Fund's expense ratio. The Fund indirectly bears its proportionate share of the expenses of any underlying Fidelity Central Funds.
D Amount does not include the portfolio activity of any underlying Fidelity Central Funds.
E Expense ratios reflect operating expenses of the class. Expenses before reductions do not reflect amounts reimbursed by the investment adviser or reductions from brokerage service arrangements or reductions from other expense offset arrangements and do not represent the amount paid by the class during periods when reimbursements or reductions occur. Expenses net of fee waivers reflect expenses after reimbursement by the investment adviser but prior to reductions from brokerage service arrangements or other expense offset arrangements. Expenses net of all reductions represent the net expenses paid by the class.
F Amount represents less than $.01 per share.
G Total distributions of $.14 per share is comprised of distributions from net investment income of $.137 and distributions from net realized gain of $.005 per share.
H Total distributions of $.26 per share is comprised of distributions from net investment income of $.221 and distributions from net realized gain of $.034 per share.
See accompanying notes which are an integral part of the financial statements.
Annual Report
Notes to Financial Statements
For the period ended October 31, 2011
1. Organization.
Fidelity International Value Fund (the Fund) is a fund of Fidelity Investment Trust (the Trust) and is authorized to issue an unlimited number of shares. The Trust is registered under the Investment Company Act of 1940, as amended (the 1940 Act), as an open-end management investment company organized as a Massachusetts business trust. The Fund offers Class A, Class T, Class C, International Value and Institutional Class shares, each of which, along with Class B shares, has equal rights as to assets and voting privileges. Effective after the close of business on September 1, 2010, Class B shares were closed to new accounts and additional purchases, except for exchanges and reinvestments by existing shareholders. Each class has exclusive voting rights with respect to matters that affect that class. Class B shares will automatically convert to Class A shares after a holding period of seven years from the initial date of purchase. Investment income, realized and unrealized capital gains and losses, the common expenses of the Fund, and certain fund-level expense reductions, if any, are allocated on a pro-rata basis to each class based on the relative net assets of each class to the total net assets of the Fund. Each class differs with respect to transfer agent and distribution and service plan fees incurred. Certain expense reductions may also differ by class. The Fund's investments in emerging markets can be subject to social, economic, regulatory, and political uncertainties and can be extremely volatile.
2. Investments in Fidelity Central Funds.
The Fund invests in Fidelity Central Funds, which are open-end investment companies available only to other investment companies and accounts managed by Fidelity Management & Research Company (FMR) and its affiliates. The Fund's Schedule of Investments lists each of the Fidelity Central Funds held as of period end, if any, as an investment of the Fund, but does not include the underlying holdings of each Fidelity Central Fund. As an Investing Fund, the Fund indirectly bears its proportionate share of the expenses of the underlying Fidelity Central Funds.
The Money Market Central Funds seek preservation of capital and current income and are managed by Fidelity Investments Money Management, Inc. (FIMM), an affiliate of FMR.
A complete unaudited list of holdings for each Fidelity Central Fund is available upon request or at the Securities and Exchange Commission (the SEC) web site at www.sec.gov. In addition, the financial statements of the Fidelity Central Funds, which are not covered by the Fund's Report of Independent Registered Public Accounting Firm, are available on the SEC web site or upon request.
Annual Report
3. Significant Accounting Policies.
The financial statements have been prepared in conformity with accounting principles generally accepted in the United States of America (GAAP), which require management to make certain estimates and assumptions at the date of the financial statements. Actual results could differ from those estimates. Subsequent events, if any, through the date that the financial statements were issued have been evaluated in the preparation of the financial statements. The following summarizes the significant accounting policies of the Fund:
Security Valuation. Investments are valued as of 4:00 p.m. Eastern time on the last calendar day of the period. The Fund uses independent pricing services approved by the Board of Trustees to value its investments. When current market prices or quotations are not readily available or reliable, valuations may be determined in good faith in accordance with procedures adopted by the Board of Trustees. Factors used in determining value may include market or security specific events. The frequency with which these procedures are used cannot be predicted and they may be utilized to a significant extent. The value used for net asset value (NAV) calculation under these procedures may differ from published prices for the same securities.
The Fund categorizes the inputs to valuation techniques used to value its investments into a disclosure hierarchy consisting of three levels as shown below:
Level 1 - quoted prices in active markets for identical investments
Level 2 - other significant observable inputs (including quoted prices for similar investments, interest rates, prepayment speeds, etc.)
Level 3 - unobservable inputs (including the Fund's own assumptions based on the best information available)
Changes in valuation techniques may result in transfers in or out of an assigned level within the disclosure hierarchy. The aggregate value of investments by input level, as of October 31, 2011, is included at the end of the Fund's Schedule of Investments. Valuation techniques used to value the Fund's investments by major category are as follows:
Equity securities, including restricted securities, for which market quotations are readily available, are valued at the last reported sale price or official closing price as reported by an independent pricing service on the primary market or exchange on which they are traded and are categorized as Level 1 in the hierarchy. In the event there were no sales during the day or closing prices are not available, securities are valued at the last quoted bid price or may be valued using the last available price and are generally categorized as Level 2 in the hierarchy. For foreign equity securities, when significant market or security specific events arise, comparisons to the valuation of American Depositary Receipts (ADRs), futures contracts, Exchange-traded funds (ETFs) and certain indexes as well as
Annual Report
Notes to Financial Statements - continued
3. Significant Accounting Policies - continued
Security Valuation - continued
quoted prices for similar securities are used and are categorized as Level 2 in the hierarchy in these circumstances. Utilizing these techniques may result in transfers between Level 1 and Level 2. For restricted equity securities and private placements where observable inputs are limited, assumptions about market activity and risk are used and are categorized as Level 3 in the hierarchy.
Investments in open-end mutual funds, including the Fidelity Central Funds, are valued at their closing net asset value each business day and are categorized as Level 1 in the hierarchy.
Foreign Currency. The Fund may use foreign currency contracts to facilitate transactions in foreign-denominated securities. Gains and losses from these transactions may arise from changes in the value of the foreign currency or if the counterparties do not perform under the contracts' terms.
Foreign-denominated assets, including investment securities, and liabilities are translated into U.S. dollars at the exchange rate at period end. Purchases and sales of investment securities, income and dividends received and expenses denominated in foreign currencies are translated into U.S. dollars at the exchange rate in effect on the transaction date.
The effects of exchange rate fluctuations on investments are included with the net realized and unrealized gain (loss) on investment securities. Other foreign currency transactions resulting in realized and unrealized gain (loss) are disclosed separately.
Investment Transactions and Income. For financial reporting purposes, the Fund's investment holdings and NAV include trades executed through the end of the last business day of the period. The NAV per share for processing shareholder transactions is calculated as of the close of business of the New York Stock Exchange (NYSE), normally 4:00 p.m. Eastern time and includes trades executed through the end of the prior business day. Gains and losses on securities sold are determined on the basis of identified cost. Dividend income is recorded on the ex-dividend date, except for certain dividends from foreign securities where the ex-dividend date may have passed, which are recorded as soon as the Fund is informed of the ex-dividend date. Non-cash dividends included in dividend income, if any, are recorded at the fair market value of the securities received. Interest income and distributions from the Fidelity Central Funds are accrued as earned. Interest income includes coupon interest and amortization of premium and accretion of discount on debt securities. Investment income is recorded net of foreign taxes withheld where recovery of such taxes is uncertain.
Annual Report
3. Significant Accounting Policies - continued
Expenses. Expenses directly attributable to a fund are charged to that fund. Expenses attributable to more than one fund are allocated among the respective funds on the basis of relative net assets or other appropriate methods. Expense estimates are accrued in the period to which they relate and adjustments are made when actual amounts are known.
Income Tax Information and Distributions to Shareholders. Each year, the Fund intends to qualify as a regulated investment company, including distributing substantially all of its taxable income and realized gains under Subchapter M of the Internal Revenue Code and filing its U.S. federal tax return. As a result, no provision for income taxes is required. As of October 31, 2011, the Fund did not have any unrecognized tax benefits in the financial statements. A fund's federal tax return is subject to examination by the Internal Revenue Service (IRS) for a period of three years. Foreign taxes are provided for based on the Fund's understanding of the tax rules and rates that exist in the foreign markets in which it invests.
Distributions are declared and recorded on the ex-dividend date. Income dividends and capital gain distributions are declared separately for each class. Income and capital gain distributions are determined in accordance with income tax regulations, which may differ from GAAP.
Capital accounts within the financial statements are adjusted for permanent book-tax differences. These adjustments have no impact on net assets or the results of operations. Temporary book-tax differences will reverse in a subsequent period.
Book-tax differences are primarily due to foreign currency transactions, passive foreign investment companies (PFIC), capital loss carryforwards and losses deferred due to wash sales.
The federal tax cost of investment securities and unrealized appreciation (depreciation) as of period end were as follows:
Gross unrealized appreciation | $ 5,442,169 |
Gross unrealized depreciation | (18,195,451) |
Net unrealized appreciation (depreciation) on securities and other investments | $ (12,753,282) |
| |
Tax Cost | $ 184,910,525 |
Annual Report
Notes to Financial Statements - continued
3. Significant Accounting Policies - continued
Income Tax Information and Distributions to Shareholders - continued
The tax-based components of distributable earnings as of period end were as follows:
Undistributed ordinary income | $ 4,796,682 |
Capital loss carryforward | $ (117,406,155) |
Net unrealized appreciation (depreciation) | $ (12,742,762) |
Under the recently enacted Regulated Investment Company Modernization Act of 2010 (the Act), the Fund will be permitted to carry forward capital losses incurred in taxable years beginning after December 22, 2010 for an unlimited period. However, any losses incurred during those future taxable years will be required to be utilized prior to any losses incurred in pre-enactment taxable years, which generally expire after eight years from when they are incurred. Additionally, post-enactment capital losses that are carried forward will retain their character as either short-term or long-term capital losses rather than being considered all short-term as under previous law. The Fund's first fiscal year end subject to the Act will be October 31, 2012.
The tax character of distributions paid was as follows:
| October 31, 2011 | October 31, 2010 |
Ordinary Income | $ 5,152,516 | $ 3,259,286 |
Short-Term Trading (Redemption) Fees. Shares held by investors in the Fund less than 30 days are subject to a redemption fee equal to 1.00% of the net asset value of shares redeemed. All redemption fees, which reduce the proceeds of the shareholder redemption, are retained by the Fund and accounted for as an addition to paid in capital.
New Accounting Pronouncement. In May 2011, the Financial Accounting Standards Board issued Accounting Standard Update No. 2011-04, Fair Value Measurement (Topic 820) - Amendments to Achieve Common Fair Value Measurement and Disclosure Requirements in U.S. GAAP and IFRSs. The update changes the wording used to describe the requirements in GAAP for measuring fair value and for disclosing information about fair value measurements. The update is effective during interim and annual periods beginning after December 15, 2011. Management is currently evaluating the impact of the update's adoption on the Fund's financial statement disclosures.
4. Purchases and Sales of Investments.
Purchases and sales of securities, other than short-term securities, aggregated $179,038,500 and $159,238,201, respectively.
Annual Report
5. Fees and Other Transactions with Affiliates.
Management Fee. FMR and its affiliates provide the Fund with investment management related services for which the Fund pays a monthly management fee. The management fee is the sum of an individual fund fee rate that is based on an annual rate of .45% of the Fund's average net assets and a group fee rate that averaged .26% during the period. The group fee rate is based upon the average net assets of all the mutual funds advised by FMR. The group fee rate decreases as assets under management increase and increases as assets under management decrease. In addition, the management fee is subject to a performance adjustment (up to a maximum of +/- .20% of the Fund's average net assets over a 36 month performance period). The upward or downward adjustment to the management fee is based on relative investment performance of International Value as compared to an appropriate benchmark index. For the period, the total annual management fee rate, including the performance adjustment, was .64% of the Fund's average net assets.
Distribution and Service Plan Fees. In accordance with Rule 12b-1 of the 1940 Act, the Fund has adopted separate Distribution and Service Plans for each class of shares. Certain classes pay Fidelity Distributors Corporation (FDC), an affiliate of FMR, separate Distribution and Service Fees, each of which is based on an annual percentage of each class' average net assets. In addition, FDC may pay financial intermediaries for selling shares of the Fund and providing shareholder support services. For the period, the Distribution and Service Fee rates, total fees and amounts retained by FDC were as follows:
| Distribution
Fee | Service
Fee | Total Fees | Retained
by FDC |
Class A | -% | .25% | $ 12,861 | $ 112 |
Class T | .25% | .25% | 14,090 | - |
Class B | .75% | .25% | 11,042 | 8,286 |
Class C | .75% | .25% | 22,443 | 5,109 |
| | | $ 60,436 | $ 13,507 |
Sales Load. FDC may receive a front-end sales charge of up to 5.75% for selling Class A shares, and 3.50% for selling Class T shares, some of which is paid to financial intermediaries for selling shares of the Fund. Depending on the holding period, FDC may receive contingent deferred sales charges levied on Class A, Class T, Class B, and Class C redemptions. The deferred sales charges range from 5% to 1% for Class B, 1% for Class C, 1.00% for certain purchases of Class A shares and .25% for certain purchases of Class T shares.
Annual Report
Notes to Financial Statements - continued
5. Fees and Other Transactions with Affiliates - continued
Sales Load - continued
For the period, sales charge amounts retained by FDC were as follows:
| Retained
by FDC |
Class A | $ 5,585 |
Class T | 1,051 |
Class B* | 2,211 |
Class C* | 426 |
| $ 9,273 |
* When Class B and Class C shares are initially sold, FDC pays commissions from its own resources to financial intermediaries through which the sales are made.
Transfer Agent Fees. Fidelity Investments Institutional Operations Company, Inc. (FIIOC), an affiliate of FMR, is the transfer, dividend disbursing and shareholder servicing agent for each class of the Fund. FIIOC receives account fees and asset-based fees that vary according to the account size and type of account of the shareholders of the respective classes of the Fund. FIIOC pays for typesetting, printing and mailing of shareholder reports, except proxy statements. For the period, transfer agent fees for each class were as follows:
| Amount | % of
Average
Net Assets |
Class A | $ 15,549 | .30 |
Class T | 9,051 | .32 |
Class B | 3,337 | .30 |
Class C | 6,816 | .30 |
International Value | 416,398 | .23 |
Institutional Class | 834 | .17 |
| $ 451,985 | |
Accounting and Security Lending Fees. Fidelity Service Company, Inc. (FSC), an affiliate of FMR, maintains the Fund's accounting records. The accounting fee is based on the level of average net assets for the month. Under a separate contract, FSC administers the security lending program. The security lending fee is based on the number and duration of lending transactions.
Brokerage Commissions. The Fund placed a portion of its portfolio transactions with brokerage firms which are affiliates of the investment adviser. The commissions paid to these affiliated firms were $763 for the period.
Annual Report
5. Fees and Other Transactions with Affiliates - continued
Interfund Lending Program. Pursuant to an Exemptive Order issued by the SEC, the Fund, along with other registered investment companies having management contracts with FMR, may participate in an interfund lending program. This program provides an alternative credit facility allowing the funds to borrow from, or lend money to, other participating affiliated funds. At period end, there were no interfund loans outstanding. The Fund's activity in this program during the period for which loans were outstanding was as follows:
Borrower or Lender | Average Daily
Loan Balance | Weighted Average Interest Rate | Interest
Expense |
Borrower | $ 3,563,727 | .35% | $ 381 |
6. Committed Line of Credit.
The Fund participates with other funds managed by FMR or an affiliate in a $4.0 billion credit facility (the "line of credit") to be utilized for temporary or emergency purposes to fund shareholder redemptions or for other short-term liquidity purposes. The Fund has agreed to pay commitment fees on its pro-rata portion of the line of credit, which amounted to $590 and is reflected in Miscellaneous expenses on the Statement of Operations. During the period, there were no borrowings on this line of credit.
7. Security Lending.
The Fund lends portfolio securities through a lending agent from time to time in order to earn additional income. For equity securities, a lending agent is used and may loan securities to certain qualified borrowers, including Fidelity Capital Markets (FCM), a broker-dealer affiliated with the Fund. On the settlement date of the loan, the Fund receives collateral (in the form of U.S. Treasury obligations, letters of credit and/or cash) against the loaned securities and maintains collateral in an amount not less than 100% of the market value of the loaned securities during the period of the loan. The market value of the loaned securities is determined at the close of business of the Fund and any additional required collateral is delivered to the Fund on the next business day. If the borrower defaults on its obligation to return the securities loaned because of insolvency or other reasons, a fund could experience delays and costs in recovering the securities loaned or in gaining access to the collateral. Any cash collateral received is invested in the Fidelity Securities Lending Cash Central Fund. The value of loaned securities and cash collateral at period end are disclosed on the Fund's Statement of Assets and Liabilities. Security lending income represents the income earned on investing cash collateral, less rebates paid to borrowers and any lending agent fees associated with the loan, plus any premium payments received for lending certain types of securities. Security lending income is presented in the Statement of Operations as a component of income from
Annual Report
Notes to Financial Statements - continued
7. Security Lending - continued
Fidelity Central Funds. Total security lending income during the period amounted to $221,316. During the period, there were no securities loaned to FCM.
8. Expense Reductions.
FMR voluntarily agreed to reimburse a portion of its management fee. For the period, the amount of this reimbursement was $14,939.
Many of the brokers with whom FMR places trades on behalf of the Fund provided services in addition to trade execution. These services included payments of certain expenses on behalf of the Fund totaling $38,767 for the period.
9. Distributions to Shareholders.
Distributions to shareholders of each class were as follows:
Years ended October 31, | 2011 | 2010 |
From net investment income | | |
Class A | $ 109,917 | $ 64,929 |
Class T | 48,265 | 27,801 |
Class B | 18,831 | 8,869 |
Class C | 34,950 | 14,357 |
International Value | 4,218,039 | 3,006,248 |
Institutional Class | 11,933 | 13,553 |
Total | $ 4,441,935 | $ 3,135,757 |
From net realized gain | | |
Class A | $ 19,461 | $ 2,899 |
Class T | 9,435 | 1,544 |
Class B | 4,893 | 715 |
Class C | 8,796 | 1,354 |
International Value | 666,153 | 116,522 |
Institutional Class | 1,843 | 495 |
Total | $ 710,581 | $ 123,529 |
Annual Report
10. Share Transactions.
Transactions for each class of shares were as follows:
| Shares | Dollars |
Years ended October 31, | 2011 | 2010 | 2011 | 2010 |
Class A | | | | |
Shares sold | 297,051 | 216,581 | $ 2,472,449 | $ 1,676,019 |
Reinvestment of distributions | 14,168 | 7,621 | 113,424 | 61,732 |
Shares redeemed | (217,894) | (227,521) | (1,776,674) | (1,766,121) |
Net increase (decrease) | 93,325 | (3,319) | $ 809,199 | $ (28,370) |
Class T | | | | |
Shares sold | 184,684 | 82,344 | $ 1,564,957 | $ 635,080 |
Reinvestment of distributions | 7,104 | 3,507 | 56,884 | 28,408 |
Shares redeemed | (116,856) | (118,025) | (949,653) | (899,018) |
Net increase (decrease) | 74,932 | (32,174) | $ 672,188 | $ (235,530) |
Class B | | | | |
Shares sold | 10,615 | 44,963 | $ 84,177 | $ 346,949 |
Reinvestment of distributions | 2,474 | 980 | 19,918 | 7,981 |
Shares redeemed | (32,689) | (36,625) | (270,345) | (286,374) |
Net increase (decrease) | (19,600) | 9,318 | $ (166,250) | $ 68,556 |
Class C | | | | |
Shares sold | 94,118 | 56,757 | $ 764,274 | $ 434,910 |
Reinvestment of distributions | 4,468 | 1,540 | 35,965 | 12,532 |
Shares redeemed | (56,323) | (72,014) | (453,389) | (560,469) |
Net increase (decrease) | 42,263 | (13,717) | $ 346,850 | $ (113,027) |
International Value | | | | |
Shares sold | 9,000,450 | 3,662,730 | $ 76,813,955 | $ 28,403,948 |
Reinvestment of distributions | 587,427 | 369,795 | 4,695,920 | 2,987,943 |
Shares redeemed | (7,927,908) | (7,496,748) | (64,758,392) | (57,917,334) |
Net increase (decrease) | 1,659,969 | (3,464,223) | $ 16,751,483 | $ (26,525,443) |
Institutional Class | | | | |
Shares sold | 19,868 | 16,581 | $ 168,608 | $ 128,469 |
Reinvestment of distributions | 395 | 185 | 3,160 | 1,498 |
Shares redeemed | (16,071) | (58,573) | (130,995) | (468,362) |
Net increase (decrease) | 4,192 | (41,807) | $ 40,773 | $ (338,395) |
Annual Report
Notes to Financial Statements - continued
11. Other.
The Fund's organizational documents provide former and current trustees and officers with a limited indemnification against liabilities arising in connection with the performance of their duties to the Fund. In the normal course of business, the Fund may also enter into contracts that provide general indemnifications. The Fund's maximum exposure under these arrangements is unknown as this would be dependent on future claims that may be made against the Fund. The risk of material loss from such claims is considered remote.
At the end of the period, Strategic Advisers International II Fund and VIP FundsManager 60% Portfolio were owners of record of approximately 19% and 18%, respectively, of the total outstanding shares of the Fund.
The VIP FundsManager Portfolios were owners of record, in the aggregate, of approximately 26% of the total outstanding shares of the Fund.
Annual Report
To the Trustees of Fidelity Investment Trust and Shareholders of Fidelity International Value Fund:
We have audited the accompanying statement of assets and liabilities of Fidelity International Value Fund (the Fund), a fund of Fidelity Investment Trust, including the schedule of investments, as of October 31, 2011, and the related statement of operations for the year then ended, the statement of changes in net assets for each of the two years in the period then ended, and the financial highlights for each of the five years in the period then ended. These financial statements and financial highlights are the responsibility of the Fund's management. Our responsibility is to express an opinion on these financial statements and financial highlights based on our audits.
We conducted our audits in accordance with the standards of the Public Company Accounting Oversight Board (United States). Those standards require that we plan and perform the audit to obtain reasonable assurance about whether the financial statements and financial highlights are free of material misstatement. The Fund is not required to have, nor were we engaged to perform, an audit of its internal control over financial reporting. Our audits included consideration of internal control over financial reporting as a basis for designing audit procedures that are appropriate in the circumstances, but not for the purpose of expressing an opinion on the effectiveness of the Fund's internal control over financial reporting. Accordingly, we express no such opinion. An audit also includes examining, on a test basis, evidence supporting the amounts and disclosures in the financial statements, assessing the accounting principles used and significant estimates made by management, as well as evaluating the overall financial statement presentation. Our procedures included confirmation of securities owned as of October 31, 2011, by correspondence with the custodians and brokers; where replies were not received from brokers, we performed other auditing procedures. We believe that our audits provide a reasonable basis for our opinion.
In our opinion, the financial statements and financial highlights referred to above present fairly, in all material respects, the financial position of Fidelity International Value Fund as of October 31, 2011, the results of its operations for the year then ended, the changes in its net assets for each of the two years in the period then ended, and the financial highlights for each of the five years in the period then ended, in conformity with accounting principles generally accepted in the United States of America.
DELOITTE & TOUCHE LLP
Boston, Massachusetts
December 15, 2011
Annual Report
The Trustees, Members of the Advisory Board, and executive officers of the trust and fund, as applicable, are listed below. The Board of Trustees governs the fund and is responsible for protecting the interests of shareholders. The Trustees are experienced executives who meet periodically throughout the year to oversee the fund's activities, review contractual arrangements with companies that provide services to the fund, oversee management of the risks associated with such activities and contractual arrangements, and review the fund's performance. Except for James C. Curvey, each of the Trustees oversees 226 funds advised by FMR or an affiliate. Mr. Curvey oversees 429 funds advised by FMR or an affiliate.
The Trustees hold office without limit in time except that (a) any Trustee may resign; (b) any Trustee may be removed by written instrument, signed by at least two-thirds of the number of Trustees prior to such removal; (c) any Trustee who requests to be retired or who has become incapacitated by illness or injury may be retired by written instrument signed by a majority of the other Trustees; and (d) any Trustee may be removed at any special meeting of shareholders by a two-thirds vote of the outstanding voting securities of the trust. Each Trustee who is not an interested person (as defined in the 1940 Act) (Independent Trustee), shall retire not later than the last day of the calendar year in which his or her 75th birthday occurs. The Independent Trustees may waive this mandatory retirement age policy with respect to individual Trustees. The executive officers and Advisory Board Members hold office without limit in time, except that any officer and Advisory Board Member may resign or may be removed by a vote of a majority of the Trustees at any regular meeting or any special meeting of the Trustees. Except as indicated, each individual has held the office shown or other offices in the same company for the past five years.
Experience, Skills, Attributes, and Qualifications of the Fund's Trustees. The Governance and Nominating Committee has adopted a statement of policy that describes the experience, qualifications, attributes, and skills that are necessary and desirable for potential Independent Trustee candidates (Statement of Policy). The Board believes that each Trustee satisfied at the time he or she was initially elected or appointed a Trustee, and continues to satisfy, the standards contemplated by the Statement of Policy. The Governance and Nominating Committee also engages professional search firms to help identify potential Independent Trustee candidates who have the experience, qualifications, attributes, and skills consistent with the Statement of Policy. From time to time, additional criteria based on the composition and skills of the current Independent Trustees, as well as experience or skills that may be appropriate in light of future changes to board composition, business conditions, and regulatory or other developments, have also been considered by the professional search firms and the Governance and Nominating Committee. In addition, the Board takes into account the Trustees' commitment and participation in Board and committee meetings, as well as their leadership of standing and ad hoc committees throughout their tenure.
In determining that a particular Trustee was and continues to be qualified to serve as a Trustee, the Board has considered a variety of criteria, none of which, in isolation, was controlling. The Board believes that, collectively, the Trustees have balanced and diverse experience, qualifications, attributes, and skills, which allow the Board to operate effectively in governing the fund and protecting the interests of shareholders. Information about the specific experience, skills, attributes, and qualifications of each Trustee, which in each case led to the Board's conclusion that the Trustee should serve (or continue to serve) as a trustee of the fund, is provided below.
Annual Report
Trustees and Officers - continued
Board Structure and Oversight Function. James C. Curvey is an interested person (as defined in the 1940 Act) and currently serves as Acting Chairman. The Trustees have determined that an interested Chairman is appropriate and benefits shareholders because an interested Chairman has a personal and professional stake in the quality and continuity of services provided to the fund. Independent Trustees exercise their informed business judgment to appoint an individual of their choosing to serve as Chairman, regardless of whether the Trustee happens to be independent or a member of management. The Independent Trustees have determined that they can act independently and effectively without having an Independent Trustee serve as Chairman and that a key structural component for assuring that they are in a position to do so is for the Independent Trustees to constitute a substantial majority for the Board. The Independent Trustees also regularly meet in executive session. Ned C. Lautenbach serves as Chairman of the Independent Trustees and as such (i) acts as a liaison between the Independent Trustees and management with respect to matters important to the Independent Trustees and (ii) with management prepares agendas for Board meetings.
Fidelity funds are overseen by different Boards of Trustees. The fund's Board oversees Fidelity's equity and high income funds and another Board oversees Fidelity's investment-grade bond, money market, and asset allocation funds. The asset allocation funds may invest in Fidelity funds overseen by the fund's Board. The use of separate Boards, each with its own committee structure, allows the Trustees of each group of Fidelity funds to focus on the unique issues of the funds they oversee, including common research, investment, and operational issues. On occasion, the separate Boards establish joint committees to address issues of overlapping consequences for the Fidelity funds overseen by each Board.
The Trustees operate using a system of committees to facilitate the timely and efficient consideration of all matters of importance to the Trustees, the fund, and fund shareholders and to facilitate compliance with legal and regulatory requirements and oversight of the fund's activities and associated risks. The Board, acting through its committees, has charged FMR and its affiliates with (i) identifying events or circumstances the occurrence of which could have demonstrably adverse effects on the fund's business and/or reputation; (ii) implementing processes and controls to lessen the possibility that such events or circumstances occur or to mitigate the effects of such events or circumstances if they do occur; and (iii) creating and maintaining a system designed to evaluate continuously business and market conditions in order to facilitate the identification and implementation processes described in (i) and (ii) above. Because the day-to-day operations and activities of the fund are carried out by or through FMR, its affiliates and other service providers, the fund's exposure to risks is mitigated but not eliminated by the processes overseen by the Trustees. While each of the Board's committees has responsibility for overseeing different aspects of the fund's activities, oversight is exercised primarily through the Operations, Audit, and Compliance Committees. In addition, the Independent Trustees have worked with FMR to enhance the Board's oversight of investment and financial risks, legal and regulatory risks, technology risks, and operational risks, including the development of additional risk reporting to the Board. For example, a working group comprised of Independent Trustees and FMR has worked and continues to work to review the Fidelity funds' valuation-related activities, reporting and risk management. Appropriate personnel, including but not limited to the fund's Chief Compliance Officer (CCO), FMR's internal auditor, the independent accountants, the fund's Treasurer and portfolio management personnel, make periodic reports to the Board's committees, as appropriate, including an annual review of FMR's risk management program for the Fidelity funds. The responsibilities of each standing committee, including their oversight responsibilities, are described further under "Standing Committees of the Fund's Trustees."
Annual Report
The fund's Statement of Additional Information (SAI) includes more information about the Trustees. To request a free copy, call Fidelity at 1-877-208-0098.
Interested Trustees*:
Correspondence intended for each Trustee who is an interested person may be sent to Fidelity Investments, 82 Devonshire Street, Boston, Massachusetts 02109.
Name, Age; Principal Occupations and Other Relevant Experience+ |
James C. Curvey (76) |
| Year of Election or Appointment: 2007 Mr. Curvey is Trustee and Acting Chairman of the Board of Trustees of certain Trusts. Mr. Curvey also serves as Trustee (2007-present) of other investment companies advised by FMR. Mr. Curvey is a Director of Fidelity Investments Money Management, Inc. (2009-present), Director of Fidelity Research & Analysis Co. (2009-present) and Director of FMR and FMR Co., Inc. (2007-present). Mr. Curvey is also Vice Chairman (2007-present) and Director of FMR LLC. In addition, Mr. Curvey serves as an Overseer for the Boston Symphony Orchestra and a member of the Trustees of Villanova University. Previously, Mr. Curvey was the Vice Chairman (2006-2007) and Director (2000-2007) of FMR Corp. |
Ronald P. O'Hanley (54) |
| Year of Election or Appointment: 2011 Mr. O'Hanley is Director of FMR Co., Inc. (2010-present), Director of Fidelity Investments Money Management, Inc. (2010-present), Director of Fidelity Research & Analysis Company (2010-present), President of Fidelity Asset Management and Corporate Services and a member of Fidelity's Executive Committee (2010-present). Previously, Mr. O'Hanley served as President and Chief Executive Officer of BNY Mellon Asset Management (2007-2010). Mr. O'Hanley also served as Vice Chairman of Bank New York Mellon Corp. and a member of that firm's Executive Committee. Prior to the 2007 merger of The Bank of New York and Mellon Financial Corporation, he was Vice Chairman of Mellon Financial Corporation and President and Chief Executive Officer of Mellon Asset Management. He joined Mellon in February 1997. Mr. O'Hanley currently serves as Chairman of the Boston Public Library Foundation Board of Directors and sits on the Board of Directors of Beth Israel Deaconess Medical Center, the Board of Trustees of the Marine Biological Laboratory and the Advisory Board of the Maxwell School of Citizenship and Public Administration at Syracuse University. Mr. O'Hanley also chairs the Council on Asset Management for the Financial Services Roundtable and is a member of the Board of Directors of Institutional Investor's U.S. Institute. |
* Trustees have been determined to be "Interested Trustees" by virtue of, among other things, their affiliation with the trust or various entities under common control with FMR.
+ The information above includes each Trustee's principal occupation during the last five years and other information relating to the experience, attributes, and skills relevant to each Trustee's qualifications to serve as a Trustee, which led to the conclusion that each Trustee should serve as a Trustee for the fund.
Annual Report
Independent Trustees:
Correspondence intended for each Independent Trustee (that is, the Trustees other than the Interested Trustees) may be sent to Fidelity Investments, P.O. Box 55235, Boston, Massachusetts 02205-5235.
Name, Age; Principal Occupations and Other Relevant Experience+ |
Dennis J. Dirks (63) |
| Year of Election or Appointment: 2005 Prior to his retirement in May 2003, Mr. Dirks was Chief Operating Officer and a member of the Board of The Depository Trust & Clearing Corporation (DTCC). He also served as President, Chief Operating Officer, and Board member of The Depository Trust Company (DTC) and President and Board member of the National Securities Clearing Corporation (NSCC). In addition, Mr. Dirks served as Chief Executive Officer and Board member of the Government Securities Clearing Corporation, Chief Executive Officer and Board member of the Mortgage-Backed Securities Clearing Corporation, as a Trustee and a member of the Finance Committee of Manhattan College (2005-2008), and as a Trustee and a member of the Finance Committee of AHRC of Nassau County (2006-2008). Mr. Dirks is a member of the Independent Directors Council (IDC) Governing Council (2010-Present) and Board of Directors for The Brookville Center for Children's Services, Inc. (2009-present). |
Alan J. Lacy (58) |
| Year of Election or Appointment: 2008 Mr. Lacy serves as Senior Adviser (2007-present) of Oak Hill Capital Partners, L.P. (private equity). Mr. Lacy also served as Chief Executive Officer (2000-2005) and Vice Chairman (2005-2006) of Sears Holdings Corporation and Sears, Roebuck and Co. (retail). In addition, Mr. Lacy serves as a member of the Board of Directors of Dave & Buster's, Inc. (restaurant and entertainment complexes, 2010-present), The Hillman Companies, Inc. (hardware wholesalers, 2010-present), and Bristol-Myers Squibb Company (global pharmaceuticals, 2007-present). Mr. Lacy is a member of the Board of Trustees of The National Parks Conservation Association (2006-Present). Previously, Mr. Lacy served as Chairman of the Board of Trustees of the National Parks Conservation Association (2008-2011) and as a member of the Board of Directors for the Western Union Company (global money transfer, 2006-2011). |
Ned C. Lautenbach (67) |
| Year of Election or Appointment: 2000 Mr. Lautenbach is Chairman of the Independent Trustees of the Equity and High Income Funds (2006-present). Mr. Lautenbach currently serves as the Lead Director of the Eaton Corporation Board of Directors (diversified industrial, 1997-present). Mr. Lautenbach is also a member of the Board of Directors of the Philharmonic Center for the Arts in Naples, Florida (1999-present); a member of the Board of Trustees of Fairfield University (2005-present); and a member of the Council on Foreign Relations (1994-present). Previously, Mr. Lautenbach was a Partner/Advisory Partner at Clayton, Dubilier & Rice, LLC (private equity investment, 1998-2010), as well as a Director of Sony Corporation (2006-2007). |
Joseph Mauriello (67) |
| Year of Election or Appointment: 2008 Prior to his retirement in January 2006, Mr. Mauriello served in numerous senior management positions including Deputy Chairman and Chief Operating Officer (2004-2005), and Vice Chairman of Financial Services (2002-2004) of KPMG LLP US (professional services, 1965-2005). Mr. Mauriello currently serves as a member of the Board of Directors of XL Group plc. (global insurance and re-insurance, 2006-present) and of Arcadia Resources Inc. (health care services and products, 2007-present). Previously, Mr. Mauriello served as a Director of the Hamilton Funds of the Bank of New York (2006-2007). |
Robert W. Selander (61) |
| Year of Election or Appointment: 2011 Previously, Mr. Selander served as a Member of the Advisory Board of Fidelity's Equity and High Income Funds (2011), Executive Vice Chairman (2010), Chief Executive Officer (2009-2010), and President and Chief Executive Officer (1997-2009) of Mastercard, Inc. |
Cornelia M. Small (67) |
| Year of Election or Appointment: 2005 Ms. Small is a member of the Board of Directors of the Teagle Foundation (2009-present). Ms. Small is also a member of the Investment Committee, and Chair (2008-present) and a member of the Board of Trustees of Smith College. In addition, Ms. Small serves on the Investment Committee of the Berkshire Taconic Community Foundation (2008-present). Previously, Ms. Small served as Chairperson of the Investment Committee (2002-2008) of Smith College. In addition, Ms. Small served as Chief Investment Officer, Director of Global Equity Investments, and a member of the Board of Directors of Scudder, Stevens & Clark and Scudder Kemper Investments. |
William S. Stavropoulos (72) |
| Year of Election or Appointment: 2001 Mr. Stavropoulos is Vice Chairman of the Independent Trustees of the Equity and High Income Funds (2006-present). Mr. Stavropoulos serves as President and Founder of the Michigan Baseball Foundation, the Great Lakes Loons (2007-present). Mr. Stavropoulos is Chairman Emeritus of the Board of Directors of The Dow Chemical Company, where he previously served in numerous senior management positions, including President, CEO (1995-2000; 2002-2004), Chairman of the Executive Committee (2000-2006), and as a member of the Board of Directors (1990-2006). Currently, Mr. Stavropoulos is Chairman of Univar (global distributor of commodity and specialty chemicals, 2010-present), a Director of Teradata Corporation (data warehousing and technology solutions, 2008-present), Chemical Financial Corporation, Maersk Inc. (industrial conglomerate), Tyco International, Inc. (multinational manufacturing and services, 2007-present), and a member of the Advisory Board for Metalmark Capital (private equity investment, 2005-present). Mr. Stavropoulos is a special advisor to Clayton, Dubilier & Rice, LLC (private equity investment). In addition, Mr. Stavropoulos is a member of the University of Notre Dame Advisory Council for the College of Science. |
David M. Thomas (62) |
| Year of Election or Appointment: 2008 Previously, Mr. Thomas served as Executive Chairman (2005-2006) and Chairman and Chief Executive Officer (2000-2005) of IMS Health, Inc. (pharmaceutical and healthcare information solutions). In addition, Mr. Thomas serves as a member of the Board of Directors of Fortune Brands, Inc. (consumer products), and Interpublic Group of Companies, Inc. (marketing communication, 2004-present). |
Michael E. Wiley (61) |
| Year of Election or Appointment: 2008 Mr. Wiley also serves as a Director of Asia Pacific Exploration Consolidated (international oil and gas exploration and production, 2008-present). Mr. Wiley serves as a Director of Tesoro Corporation (independent oil refiner and marketer, 2005-present), and a Director of Bill Barrett Corporation (exploration and production, 2005-present). In addition, Mr. Wiley also serves as a Director of Post Oak Bank (privately-held bank, 2004-present). Previously, Mr. Wiley served as a member of the Board of Trustees of the University of Tulsa (2000-2006; 2007-2010), as a Senior Energy Advisor of Katzenbach Partners, LLC (consulting, 2006-2007), as an Advisory Director of Riverstone Holdings (private investment), Chairman, President, and CEO of Baker Hughes, Inc. (oilfield services, 2000-2004), and as Director of Spinnaker Exploration Company (exploration and production, 2001-2005). |
Annual Report
Trustees and Officers - continued
+ The information above includes each Trustee's principal occupation during the last five years and other information relating to the experience, attributes, and skills relevant to each Trustee's qualifications to serve as a Trustee, which led to the conclusion that each Trustee should serve as a Trustee for the fund.
Advisory Board Members and Executive Officers:
Correspondence intended for each executive officer, Edward C. Johnson 3d, and Peter S. Lynch may be sent to Fidelity Investments, 82 Devonshire Street, Boston, Massachusetts 02109.
Name, Age; Principal Occupation |
Edward C. Johnson 3d (81) |
| Year of Election or Appointment: 2011 Member of the Advisory Board of Fidelity's Equity and High Income Funds. Mr. Johnson serves as Chief Executive Officer, Chairman, and a Director of FMR LLC, and also serves as Chairman and Director of FIL Limited. Previously, Mr. Johnson served as a Trustee and Chairman of the Board of certain Fidelity Trusts, Chairman and a Director of FMR, Chairman and a Director of FMR Co., Inc., and President of FMR LLC (2006-2007). |
Peter S. Lynch (67) |
| Year of Election or Appointment: 2003 Member of the Advisory Board of Fidelity's Equity and High Income Funds. Mr. Lynch is Vice Chairman and a Director of FMR and FMR Co., Inc. In addition, Mr. Lynch serves as a Trustee of Boston College and as the Chairman of the Inner-City Scholarship Fund. Previously, Mr. Lynch served on the Special Olympics International Board of Directors (1997-2006). |
Kenneth B. Robins (42) |
| Year of Election or Appointment: 2008 President and Treasurer of Fidelity's Equity and High Income Funds. Mr. Robins also serves as President and Treasurer (2010-present) and Assistant Treasurer (2009-present) of other Fidelity funds and is an employee of Fidelity Investments (2004-present). Previously, Mr. Robins served as Deputy Treasurer of the Fidelity funds (2005-2008) and Treasurer and Chief Financial Officer of The North Carolina Capital Management Trust: Cash and Term Portfolios (2006-2008). |
Brian B. Hogan (47) |
| Year of Election or Appointment: 2009 Vice President of Equity and High Income Funds. Mr. Hogan also serves as President of FMR's Equity Division (2009-present). Previously, Mr. Hogan served as Senior Vice President, Equity Research of FMR (2006-2009) and as a portfolio manager. |
Thomas C. Hense (47) |
| Year of Election or Appointment: 2008 or 2010 Vice President of Fidelity's High Income (2008), Small Cap (2008), and Value (2010) Funds. Previously, Mr. Hense served as a portfolio manager for Fidelity's Institutional Money Management Group (Pyramis) (2003-2008). |
Scott C. Goebel (43) |
| Year of Election or Appointment: 2008 Secretary and Chief Legal Officer (CLO) of the Fidelity funds. Mr. Goebel also serves as Secretary of Fidelity Investments Money Management, Inc. (FIMM) (2010-present) and Fidelity Research and Analysis Company (FRAC) (2010-present); Secretary and CLO of The North Carolina Capital Management Trust: Cash and Term Portfolios (2008-present); General Counsel, Secretary, and Senior Vice President of FMR (2008-present) and FMR Co., Inc. (2008-present); employed by FMR LLC or an affiliate (2001-present); Chief Legal Officer of Fidelity Management & Research (Hong Kong) Limited (2008-present) and Assistant Secretary of Fidelity Management & Research (Japan) Inc. (2008-present), and Fidelity Management & Research (U.K.) Inc. (2008-present). Previously, Mr. Goebel served as Assistant Secretary of FIMM (2008-2010), FRAC (2008-2010), and the Funds (2007-2008) and as Vice President and Secretary of Fidelity Distributors Corporation (FDC) (2005-2007). |
William C. Coffey (42) |
| Year of Election or Appointment: 2009 Assistant Secretary of Fidelity's Equity and High Income Funds. Mr. Coffey also serves as Senior Vice President and Deputy General Counsel of FMR LLC (2010-present), and is an employee of Fidelity Investments. Previously, Mr. Coffey served as Vice President and Associate General Counsel of FMR LLC (2005-2009). |
Holly C. Laurent (57) |
| Year of Election or Appointment: 2008 Anti-Money Laundering (AML) Officer of the Fidelity funds. Ms. Laurent also serves as AML Officer of The North Carolina Capital Management Trust: Cash and Term Portfolios (2008-present) and is an employee of Fidelity Investments. Previously, Ms. Laurent was Senior Vice President and Head of Legal for Fidelity Business Services India Pvt. Ltd. (2006-2008), and Senior Vice President, Deputy General Counsel and Group Head for FMR LLC (2005-2006). |
Christine Reynolds (53) |
| Year of Election or Appointment: 2008 Chief Financial Officer of the Fidelity funds. Ms. Reynolds became President of Fidelity Pricing and Cash Management Services (FPCMS) in August 2008. Ms. Reynolds served as Chief Operating Officer of FPCMS (2007-2008). Previously, Ms. Reynolds served as President, Treasurer, and Anti-Money Laundering officer of the Fidelity funds (2004-2007). |
Kenneth A. Rathgeber (64) |
| Year of Election or Appointment: 2004 Chief Compliance Officer of Fidelity's Equity and High Income Funds. Mr. Rathgeber is Chief Compliance Officer of Fidelity Management & Research (Hong Kong) Limited (2008-present), Fidelity Management & Research (Japan) Inc. (2008-present), FMR (2005-present), FMR Co., Inc. (2005-present), Fidelity Management & Research (U.K.) Inc. (2005-present), Fidelity Research & Analysis Company (2005-present), Fidelity Investments Money Management, Inc. (2005-present), Pyramis Global Advisors, LLC (2005-present), and Strategic Advisers, Inc. (2005-present). |
Jeffrey S. Christian (50) |
| Year of Election or Appointment: 2009 Deputy Treasurer of the Fidelity funds. Mr. Christian is an employee of Fidelity Investments. Previously, Mr. Christian served as Chief Financial Officer (2008-2009) of certain Fidelity funds and Senior Vice President of Fidelity Pricing and Cash Management Services (FPCMS) (2004-2009). |
Joseph F. Zambello (54) |
| Year of Election or Appointment: 2011 Deputy Treasurer of the Fidelity funds. Mr. Zambello is an employee of Fidelity Investments. Previously, Mr. Zambello served as Vice President of FMR's Program Management Group (2009-2011) and Vice President of the Transfer Agent Oversight Group (2005-2009). |
Adrien E. Deberghes (44) |
| Year of Election or Appointment: 2008 Deputy Treasurer of Fidelity's Equity and High Income Funds. Mr. Deberghes also serves as Vice President and Assistant Treasurer of Fidelity Rutland Square Trust II and Fidelity Commonwealth Trust II (2011-present), Assistant Treasurer of other Fidelity funds (2010-present), and is an employee of Fidelity Investments (2008-present). Previously, Mr. Deberghes served as Senior Vice President of Mutual Fund Administration at State Street Corporation (2007-2008), Senior Director of Mutual Fund Administration at Investors Bank & Trust (2005-2007), and Director of Finance for Dunkin' Brands (2000-2005). |
Stephanie J. Dorsey (42) |
| Year of Election or Appointment: 2010 Assistant Treasurer of Fidelity's Equity and High Income Funds. Ms. Dorsey also serves as Deputy Treasurer of other Fidelity funds (2008-present) and is an employee of Fidelity Investments (2008-present). Previously, Ms. Dorsey served as Treasurer (2004-2008) of the JPMorgan Mutual Funds and Vice President (2004-2008) of JPMorgan Chase Bank. |
John R. Hebble (53) |
| Year of Election or Appointment: 2009 Assistant Treasurer of Fidelity's Equity and High Income Funds. Mr. Hebble also serves as President (2011-present), Treasurer, and Chief Financial Officer of The North Carolina Capital Management Trust: Cash and Term Portfolios (2008-present), President and Treasurer of other Fidelity funds (2008-present) and is an employee of Fidelity Investments. |
Gary W. Ryan (53) |
| Year of Election or Appointment: 2005 Assistant Treasurer of the Fidelity funds. Mr. Ryan is an employee of Fidelity Investments. Previously, Mr. Ryan served as Vice President of Fund Reporting in Fidelity Pricing and Cash Management Services (FPCMS) (1999-2005). |
Jonathan Davis (43) |
| Year of Election or Appointment: 2010 Assistant Treasurer of the Fidelity funds. Mr. Davis is also Assistant Treasurer of Fidelity Rutland Square Trust II and Fidelity Commonwealth Trust II. Mr. Davis is an employee of Fidelity Investments. Previously, Mr. Davis served as Vice President and Associate General Counsel of FMR LLC (2003-2010). |
Annual Report
A percentage of the dividends distributed during the fiscal year for the following fund may be taken into account as a dividend for the purpose of the maximum rate under section 1(h)(11) of the Internal Revenue Code.
| December 3, 2010 | December 30, 2010 |
Class A | 73% | 78% |
Class T | 80% | 78% |
Class B | 100% | 78% |
Class C | 100% | 78% |
The amounts per share which represent income derived from sources within, and taxes paid to, foreign countries or possessions of the United States are as follows:
| Pay Date | Income | Taxes |
Class A | 12/06/2010 | $0.159 | $0.011 |
Class A | 12/31/2010 | $0.021 | $0.000 |
Class T | 12/06/2010 | $0.146 | $0.011 |
Class T | 12/31/2010 | $0.021 | $0.000 |
Class B | 12/06/2010 | $0.114 | $0.011 |
Class B | 12/31/2010 | $0.021 | $0.000 |
Class C | 12/06/2010 | $0.117 | $0.011 |
Class C | 12/31/2010 | $0.021 | $0.000 |
The fund will notify shareholders in January 2012 of amounts for use in preparing 2012 income tax returns.
Annual Report
Board Approval of Investment Advisory Contracts and Management Fees
Fidelity International Value Fund
Each year, the Board of Trustees, including the Independent Trustees (together, the Board), votes on the renewal of the management contract and sub-advisory agreements (together, the Advisory Contracts) for the fund. The Board, assisted by the advice of fund counsel and Independent Trustees' counsel, requests and considers a broad range of information relevant to the renewal of the Advisory Contracts throughout the year.
The Board meets regularly and considers at each of its meetings factors that are relevant to its annual consideration of the renewal of the fund's Advisory Contracts, including the services and support provided to the fund and its shareholders. The Board has established various standing committees, each composed of Independent Trustees with varying backgrounds, to which the Board has assigned specific subject matter responsibilities in order to enhance effective decision-making by the Board. The Board, acting directly and through its Committees, requests and receives information concerning the annual consideration of the renewal of the fund's Advisory Contracts. The Board also meets as needed to consider matters specifically related to the Board's annual consideration of the renewal of Advisory Contracts. Members of the Board may also meet with trustees of other Fidelity funds through ad hoc joint committees to discuss certain matters relevant to the Fidelity funds.
At its July 2011 meeting, the Board of Trustees, including the Independent Trustees, unanimously determined to renew the fund's Advisory Contracts. In reaching its determination, the Board considered all factors it believed relevant, including (i) the nature, extent, and quality of the services to be provided to the fund and its shareholders (including the investment performance of the fund); (ii) the competitiveness of the fund's management fee and total expense ratio; (iii) the total costs of the services to be provided by and the profits to be realized by Fidelity from its relationship with the fund; (iv) the extent to which economies of scale would be realized as the fund grows; and (v) whether fee levels reflect these economies of scale, if any, for the benefit of fund shareholders.
In considering whether to renew the Advisory Contracts for the fund, the Board reached a determination, with the assistance of fund counsel and Independent Trustees' counsel and through the exercise of its business judgment, that the renewal of the Advisory Contracts is in the best interests of the fund and its shareholders and that the compensation payable under the Advisory Contracts is fair and reasonable. The Board's decision to renew the Advisory Contracts was not based on any single factor, but rather was based on a comprehensive consideration of all the information provided to the Board at its meetings throughout the year. The Board, in reaching its determination to renew the Advisory Contracts, is aware that shareholders in the fund have a broad range of investment choices available to them, including a wide choice among mutual funds offered by Fidelity's competitors, and that the fund's shareholders, who have the opportunity to review and weigh the disclosure provided by the fund in its prospectus and other public disclosures, have chosen to invest in this fund, managed by Fidelity.
Annual Report
Board Approval of Investment Advisory Contracts and
Management Fees - continued
Nature, Extent, and Quality of Services Provided. The Board considered the staffing within the investment adviser, FMR, and the sub-advisers (together, the Investment Advisers), including the backgrounds of the fund's investment personnel and the fund's investment objective and discipline. The Independent Trustees also had discussions with senior management of Fidelity's investment operations and investment groups. The Board considered the structure of the portfolio manager compensation program and whether this structure provides appropriate incentives to act in the best interests of the fund.
Resources Dedicated to Investment Management and Support Services. The Board and the Fund Oversight and Research Committees reviewed the general qualifications and capabilities of the Investment Advisers' investment staff, including its size, education, experience, and resources, as well as the Investment Advisers' approach to recruiting, training, managing, and compensating investment personnel. The Board also noted that FMR has devoted increased resources to non-U.S. offices. The Board noted that Fidelity's analysts have extensive resources, tools and capabilities which allow them to conduct sophisticated quantitative and fundamental analysis, as well as credit analysis of issuers, counterparties and enhancers. The Board also believes that Fidelity's investment professionals have sufficient access to global information and data so as to provide competitive investment results over time, and that those professionals also have access to sophisticated tools which permit them to assess portfolio construction and risk and performance attribution characteristics continuously, as well as to transmit new information and research conclusions rapidly around the world. Additionally, in their deliberations, the Board considered the Investment Advisers' trading capabilities and resources which are an integral part of the investment management process.
Shareholder and Administrative Services. The Board considered (i) the nature, extent, quality, and cost of advisory, administrative, and shareholder services performed by the Investment Advisers and their affiliates under the Advisory Contracts and under separate agreements covering transfer agency, pricing and bookkeeping, and securities lending services for the fund; (ii) the nature and extent of the investment adviser's supervision of third party service providers, principally custodians and subcustodians; and (iii) the resources devoted to, and the record of compliance with, the fund's compliance policies and procedures. The Board also reviewed the allocation of fund brokerage, including allocations to brokers affiliated with the Investment Advisers, the use of brokerage commissions to pay fund expenses, and the use of "soft" commission dollars to pay for research services.
The Board noted that the growth of fund assets over time across the complex allows Fidelity to reinvest in the development of services designed to enhance the value or convenience of the Fidelity funds as investment vehicles. These services include 24-hour access to account information and market information through telephone representatives and over the Internet, investor education materials and asset allocation tools, and the expanded availability of Fidelity Investor Centers, with 35 new branches opening since 2010.
Annual Report
Investment in a Large Fund Family. The Board considered the benefits to shareholders of investing in a Fidelity fund, including the benefits of investing in a fund that is part of a large family of funds offering a variety of investment disciplines and providing a large variety of mutual fund investor services. The Board noted that Fidelity had taken, or had made recommendations that resulted in the Fidelity funds taking, a number of actions over the previous year that benefited particular funds, including (i) continuing to dedicate additional resources to investment research and support of the senior management team that oversees asset management; (ii) rationalizing product lines through the mergers of six funds into other funds; (iii) continuing to migrate the Freedom Funds to dedicated lower cost underlying funds; (iv) obtaining shareholder approval to broaden the investment strategies for Fidelity Consumer Finance Portfolio, Fidelity Emerging Asia Fund, and Fidelity Environment and Alternative Energy Portfolio; (v) contractually agreeing to reduce the management fees and impose other expense limitations on Spartan 500 Index Fund and U.S. Bond Index Fund in connection with launching new institutional classes of these funds; (vi) changing the name, primary and supplemental benchmarks, and investment policies of Fidelity Global Strategies Fund to support the fund's flexible investment mandate and global orientation; and (vii) reducing the transfer agency account fee rates on certain accounts.
Investment Performance. The Board considered whether the fund has operated in accordance with its investment objective, as well as its record of compliance with its investment restrictions. It also reviewed the fund's absolute investment performance for each class, as well as the fund's relative investment performance for each class measured over multiple periods against (i) a broad-based securities market index, and (ii) a custom peer group of mutual funds deemed appropriate by Fidelity and reviewed by the Board. Because the fund had been in existence less than five calendar years, the following charts considered by the Board show, over the one- and three-year periods ended December 31, 2010, the cumulative total returns of Institutional Class (Class I) and Class C of the fund, the cumulative total returns of a broad-based securities market index ("benchmark"), and a range of cumulative total returns of a custom peer group of mutual funds defined by FMR based on categories assigned by Morningstar, Inc. The returns of Institutional Class (Class I) and Class C show the performance of the highest and lowest performing classes, respectively (based on three-year performance). The box within each chart shows the 25th percentile return (bottom of box) and the 75th percentile return (top of box) of the peer group. Returns shown above the box are in the first quartile and returns shown below the box are in the fourth quartile. The percentage beaten numbers noted below each chart correspond to the percentile box and represent the percentage of funds in the peer group whose performance was equal to or lower than that of the class indicated. The fund's custom peer group, defined by FMR, is a peer group that FMR believes provides a more meaningful performance comparison than the peer group assigned by Morningstar, Inc., which assigns mutual funds to categories based on their investment styles as measured by their underlying portfolio holdings.
Annual Report
Board Approval of Investment Advisory Contracts and
Management Fees - continued
Fidelity International Value Fund
The Board reviewed the fund's relative investment performance against its peer group and noted that the performance of Institutional Class (Class I) of the fund was in the fourth quartile for the one-year period and the third quartile for the three-year period. The Board also noted that the investment performance of Institutional Class (Class I) of the fund compared favorably to its benchmark for the one-year period, although the fund's three-year cumulative total return was lower than its benchmark. The Board considered that the variations in performance among the fund's classes reflect the variations in class expenses, which result in lower performance for higher expense classes. The Board discussed with FMR actions that have been taken by FMR to improve the fund's disappointing performance relative to its peer group. The Board also reviewed the fund's performance since inception as well as performance in the current year. The Board will continue to closely monitor the performance of the fund in the coming year and discuss with FMR other appropriate actions to address the performance of the fund.
The Board also considered that the fund's management fee is subject to upward or downward adjustment depending upon whether, and to what extent, the fund's investment performance for the performance period exceeds, or is exceeded by, the record (over the same period) of a Board-approved performance adjustment index. The Board noted that the performance adjustment provides FMR with a strong economic incentive to seek to achieve superior performance for the fund's shareholders and helps to more closely align the interests of FMR and the fund's shareholders.
Annual Report
Based on its review, the Board concluded that the nature, extent, and quality of services provided to the fund under the Advisory Contracts should benefit the fund's shareholders.
Competitiveness of Management Fee and Total Expense Ratio. The Board considered the fund's management fee and total expense ratio compared to "mapped groups" of competitive funds and classes. Fidelity creates "mapped groups" by combining similar Lipper investment objective categories that have comparable management fee characteristics. Combining Lipper investment objective categories aids the Board's management fee and total expense ratio comparisons by broadening the competitive group used for comparison and by reducing the number of universes to which various Fidelity funds are compared.
Management Fee. The Board considered two proprietary management fee comparisons for the 12-month (or shorter) periods shown in the chart below. The group of Lipper funds used by the Board for management fee comparisons is referred to below as the "Total Mapped Group." The Total Mapped Group comparison focuses on a fund's standing relative to the total universe of comparable funds available to investors in terms of gross management fees before expense reimbursements or caps, and without giving effect to the fund's performance adjustment. "TMG %" represents the percentage of funds in the Total Mapped Group that had management fees that were lower than the fund's. For example, a TMG % of 16% means that 84% of the funds in the Total Mapped Group had higher management fees than the fund. The "Asset-Size Peer Group" (ASPG) comparison focuses on a fund's standing relative to non-Fidelity funds similar in size to the fund within the Total Mapped Group. The ASPG represents at least 15% of the funds in the Total Mapped Group with comparable asset size and management fee characteristics, subject to a minimum of 50 funds (or all funds in the Total Mapped Group if fewer than 50). Additional information, such as the ASPG quartile in which the fund's management fee ranked and the impact of the fund's performance adjustment, is also included in the chart and considered by the Board.
Annual Report
Board Approval of Investment Advisory Contracts and
Management Fees - continued
Fidelity International Value Fund
The Board noted that the fund's management fee ranked below the median of its Total Mapped Group and below the median of its ASPG for 2010. The Board also noted the effect of the fund's negative performance adjustment on the fund's management fee ranking. The Board noted that the performance adjustment for each year represents calculations for performance periods that differ from the periods shown in the performance charts above.
Based on its review, the Board concluded that the fund's management fee is fair and reasonable in light of the services that the fund receives and the other factors considered.
Total Expense Ratio. In its review of each class's total expense ratio, the Board considered the fund's management fee as well as other fund or class expenses, as applicable, such as transfer agent fees, pricing and bookkeeping fees, fund-paid 12b-1 fees, and custodial, legal, and audit fees. The Board also noted the effects of any waivers and reimbursements on fees and expenses, as well as the impact of the fund's performance adjustment. As part of its review, the Board also considered the current and historical total expense ratios of each class of the fund compared to competitive fund median expenses. Each class of the fund is compared to those funds and classes in the Total Mapped Group (used by the Board for management fee comparisons) that have a similar sales load structure.
The Board noted that the total expense ratio of each of Class A, Class B, Class C, Institutional Class, and the retail class ranked below its competitive median for 2010 and the total expense ratio of Class T ranked above its competitive median for 2010. The Board considered that various factors, including 12b-1 fees, positive or negative performance adjustments, and relatively higher other expenses in the case of small fund size, can affect total expense ratios. The Board noted that the total expense ratio of Class T was above the competitive median primarily because of higher 12b-1 fees on Class T. Class T has a higher 12b-1 fee, but a lower front-end sales charge, than traditionally priced front-end sales charge classes. The Board noted that the fund offers multiple classes, each of which has a different sales load and 12b-1 fee structure, and that the multiple structures are intended to offer a range of pricing options for the intermediary market. The Board also noted that the total expense ratios of the classes vary primarily by the level of their 12b-1 fees, although differences in transfer agent fees may also cause expenses to vary from class to class.
Annual Report
Fees Charged to Other Fidelity Clients. The Board also considered Fidelity fee structures and other information with respect to clients of FMR and its affiliates, such as other mutual funds advised or subadvised by FMR or its affiliates, pension plan clients, and other institutional clients. In March 2010, the Board created an ad hoc joint committee with the board of other Fidelity funds (the Committee) to review and compare Fidelity's institutional investment advisory business with its business of providing services to the Fidelity funds, including the differences in services provided, fees charged, and costs incurred, as well as competition in their respective marketplaces.
Based on its review of total expense ratios and fees charged to other Fidelity clients, the Board concluded that the total expense ratio of each class of the fund was reasonable, although Class T was above the median of the universe presented for comparison, in light of the services that the fund and its shareholders receive and the other factors considered, including the findings of the Committee.
Costs of the Services and Profitability. The Board considered the revenues earned and the expenses incurred by Fidelity in conducting the business of developing, marketing, distributing, managing, administering and servicing the fund and its shareholders. The Board also considered the level of Fidelity's profits in respect of all the Fidelity funds.
On an annual basis, FMR presents to the Board Fidelity's profitability for the fund. Fidelity calculates the profitability for each fund, as well as aggregate profitability for groups of Fidelity funds and all Fidelity funds, using a series of detailed revenue and cost allocation methodologies which originate with the books and records of Fidelity on which Fidelity's audited financial statements are based. The Audit Committee of the Board reviews any significant changes from the prior year's methodologies.
PricewaterhouseCoopers LLP (PwC), independent registered public accounting firm and auditor to Fidelity and certain Fidelity funds, has been engaged annually by the Board as part of the Board's assessment of Fidelity's profitability analysis. PwC's engagement includes the review and assessment of Fidelity's methodologies used in determining the revenues and expenses attributable to Fidelity's mutual fund business, and completion of agreed-upon procedures surrounding the mathematical accuracy of fund profitability and its conformity to allocation methodologies. After considering PwC's reports issued under the engagement and information provided by Fidelity, the Board concluded that while other allocation methods may also be reasonable, Fidelity's profitability methodologies are reasonable in all material respects.
Annual Report
Board Approval of Investment Advisory Contracts and
Management Fees - continued
The Board also reviewed Fidelity's non-fund businesses and fall-out benefits related to the mutual fund business as well as cases where Fidelity's affiliates may benefit from or be related to the fund's business.
The Board considered the costs of the services provided by and the profits realized by Fidelity in connection with the operation of the fund and was satisfied that the profitability was not excessive in the circumstances.
Economies of Scale. The Board considered whether there have been economies of scale in respect of the management of the Fidelity funds, whether the Fidelity funds (including the fund) have appropriately benefited from any such economies of scale, and whether there is potential for realization of any further economies of scale. The Board considered the extent to which the fund will benefit from economies of scale through increased services to the fund, through waivers or reimbursements, or through fee or expense reductions. The Board also noted that in 2009, it and the board of other Fidelity funds created an ad hoc committee (the Economies of Scale Committee) to analyze whether FMR attains economies of scale in respect of the management and servicing of the Fidelity funds, whether the Fidelity funds have appropriately benefited from such economies of scale, and whether there is potential for realization of any further economies of scale.
The Board recognized that the fund's management contract incorporates a "group fee" structure, which provides for lower group fee rates as total fund assets under FMR's management increase, and for higher group fee rates as total fund assets under FMR's management decrease. FMR calculates the group fee rates based on a tiered asset "breakpoint" schedule that varies based on asset class. The Board considered that the group fee is designed to deliver the benefits of economies of scale to fund shareholders when total Fidelity fund assets increase, even if assets of any particular fund are unchanged or have declined, because some portion of Fidelity's costs are attributable to services provided to all Fidelity funds, and all funds benefit if those costs can be allocated among more assets. The Board concluded that, given the group fee structure, fund shareholders will benefit from lower management fees as assets under FMR's management increase at the fund complex level, regardless of whether Fidelity achieves any such economies of scale.
The Board concluded, taking into account the analysis of the Economies of Scale Committee, that any potential economies of scale are being appropriately shared between fund shareholders and Fidelity.
Annual Report
Additional Information Requested by the Board. In order to develop fully the factual basis for consideration of the Fidelity funds' Advisory Contracts, the Board requested and received additional information on certain topics, including (i) fund performance trends, actions to be taken by FMR to improve certain funds' overall performance, and Fidelity's long-term strategies for certain funds; (ii) portfolio manager changes that have occurred during the past year and length of portfolio manager tenure for different categories of funds over time; (iii) Fidelity's compensation structure for portfolio managers and other key personnel and strategies for attracting and retaining non-investment personnel; (iv) the amount of the investment that each portfolio manager has made in the Fidelity fund(s) that he or she manages; (v) historical trends in Fidelity's realization of fall-out benefits; (vi) Fidelity's group fee structures and the rationale for the individual fee rates of certain funds; (vii) fund profitability methodology and the impact of certain factors on fund profitability results; (viii) trends regarding industry use of performance fee structures and Fidelity's compliance practices with respect to performance adjustment calculations; (ix) the fee structures in place for certain other Fidelity clients; and (x) explanations regarding the relative total expense ratios of certain funds and classes, total expense competitive trends, and actions that might be taken by FMR to reduce total expense ratios for certain funds and classes.
Based on its evaluation of all of the conclusions noted above, and after considering all factors it believed relevant, the Board ultimately concluded that the advisory fee structures are fair and reasonable, and that the fund's Advisory Contracts should be renewed.
Annual Report
Investment Adviser
Fidelity Management & Research Company
Boston, MA
Investment Sub-Advisers
FMR Co., Inc.
Fidelity Management & Research
(U.K.) Inc.
Fidelity Management & Research
(Hong Kong) Limited
Fidelity Management & Research
(Japan) Inc.
FIL Investment Advisors
FIL Investments (Japan) Limited
FIL Investment Advisors (U.K.) Ltd.
General Distributor
Fidelity Distributors Corporation
Boston, MA
Transfer and Service Agents
Fidelity Investments Institutional Operations Company, Inc.
Boston, MA
Fidelity Service Company, Inc.
Boston, MA
Custodian
The Northern Trust Company
Chicago, IL
AFIV-UANN-1211
1.827496.105
(Fidelity Logo)
Fidelity Advisor®
International Value
Fund - Institutional Class
Annual Report
October 31, 2011
(Fidelity Cover Art)
Institutional Class is
a class of Fidelity®
International Value Fund
Contents
Chairman's Message | (Click Here) | The Chairman's message to shareholders. |
Performance | (Click Here) | How the fund has done over time. |
Management's Discussion of Fund Performance | (Click Here) | The Portfolio Manager's review of fund performance and strategy. |
Shareholder Expense Example | (Click Here) | An example of shareholder expenses. |
Investment Changes | (Click Here) | A summary of major shifts in the fund's investments over the past six months. |
Investments | (Click Here) | A complete list of the fund's investments with their market values. |
Financial Statements | (Click Here) | Statements of assets and liabilities, operations, and changes in net assets, as well as financial highlights. |
Notes | (Click Here) | Notes to financial statements. |
Report of Independent Registered Public Accounting Firm | (Click Here) | |
Trustees and Officers | (Click Here) | |
Distributions | (Click Here) | |
Board Approval of Investment Advisory Contracts and Management Fees | (Click Here) | |
To view a fund's proxy voting guidelines and proxy voting record for the 12-month period ended June 30, visit http://www.fidelity.com/proxyvotingresults or visit the Securities and Exchange Commission's (SEC) web site at http://www.sec.gov. You may also call 1-877-208-0098 to request a free copy of the proxy voting guidelines.
Standard & Poor's, S&P and S&P 500 are registered service marks of The McGraw-Hill Companies, Inc. and have been licensed for use by Fidelity Distributors Corporation.
Other third party marks appearing herein are the property of their respective owners.
All other marks appearing herein are registered or unregistered trademarks or service marks of FMR LLC or an affiliated company.
Annual Report
This report and the financial statements contained herein are submitted for the general information of the shareholders of the fund. This report is not authorized for distribution to prospective investors in the fund unless preceded or accompanied by an effective prospectus.
A fund files its complete schedule of portfolio holdings with the SEC for the first and third quarters of each fiscal year on Form N-Q. Forms N-Q are available on the SEC's web site at http://www.sec.gov. A fund's Forms N-Q may be reviewed and copied at the SEC's Public Reference Room in Washington, DC. Information regarding the operation of the SEC's Public Reference Room may be obtained by calling 1-800-SEC-0330. For a complete list of a fund's portfolio holdings, view the most recent holdings listing, semiannual report, or annual report on Fidelity's web site at http://www.fidelity.com, http://www.advisor.fidelity.com, or http://www.401k.com, as applicable.
NOT FDIC INSURED • MAY LOSE VALUE • NO BANK GUARANTEE
Neither the fund nor Fidelity Distributors Corporation is a bank.
Annual Report
(Acting Chairman's Photograph)
Dear Shareholder:
Global equity markets began the fourth quarter on a strong note, sharply reversing course in October amid strong corporate earnings, better-than-expected economic news and the promise of a resolution to the sovereign debt crisis in Europe. The mini rally followed a third quarter marked by a significant downturn in July and August, which heightened investor anxiety and set off a wave of volatility that hampered most major asset classes through the end of September. Financial markets are difficult to predict, of course, but you can help put the odds in your favor by following these time-tested investment principles.
One of the basic tenets is to invest according to your time horizon. For long-term investors, riding out the markets' inevitable ups and downs has proven much more effective than making decisions based on short-term developments. If your goal is approaching, you can also benefit from patience and restraint, rather than attempting to time the market. No matter your time horizon, missing only a few of the markets' best days can significantly diminish returns. Patience also affords the benefits of compounding - earning interest on additional income or reinvested dividends and capital gains. While staying the course doesn't eliminate risk, it can considerably lessen the negative impact of short-term downturns.
Asset allocation is another principle to manage risk. As you spread your portfolio among the asset classes, be sure to consider your time horizon, risk tolerance and investment objectives. Younger investors may be better served by emphasizing equities, which historically have been the best-performing asset class over time. Investors who are nearing a specific goal, such as retirement or sending a child to college, may choose to favor bonds and other investments that have tended to be more stable. Studies indicate that asset allocation is the single most important determinant of a portfolio's long-term success. After deciding on a suitable allocation strategy, make sure your portfolio is adequately diversified, with exposure to stocks of small-, mid- and large-cap companies in a range of sectors, for example. And today, more than ever, geographic diversification should be taken into account.
Lastly, investing a certain amount of money on a regular basis - a principle known as dollar-cost averaging - can help lower the average cost of your purchases, while also giving you the discipline to avoid selling weak performers just prior to an upswing, or chasing a hot performer just before a correction.
We invite you to learn more by visiting us on the Internet, dropping by one of our Investor Centers or calling us by phone. It is our privilege to provide the resources you need to choose investments that are right for you.
Sincerely,
(Acting Chairman's Signature)
James C. Curvey
Acting Chairman
Annual Report
Average annual total return reflects the change in the value of an investment, assuming reinvestment of the class' distributions from dividend income and capital gains (the profits earned upon the sale of securities that have grown in value, if any) and assuming a constant rate of performance each year. The $10,000 table and the fund's returns do not reflect the deduction of taxes that a shareholder would pay on fund distributions or the redemption of fund shares. During periods of reimbursement by Fidelity, a fund's total return will be greater than it would be had the reimbursement not occurred. How a fund did yesterday is no guarantee of how it will do tomorrow.
Average Annual Total Returns
Periods ended October 31, 2011 | Past 1
year | Past 5
years | Life of
classA |
Institutional Class | -11.83% | -5.21% | -3.74% |
A From May 18, 2006.
$10,000 Over Life of Fund
Let's say hypothetically that $10,000 was invested in Fidelity Advisor® International Value Fund - Institutional Class on May 18, 2006, when the fund started. The chart shows how the value of your investment would have changed, and also shows how the MSCI® EAFE® (Europe, Australasia, Far East) Value Index performed over the same period.
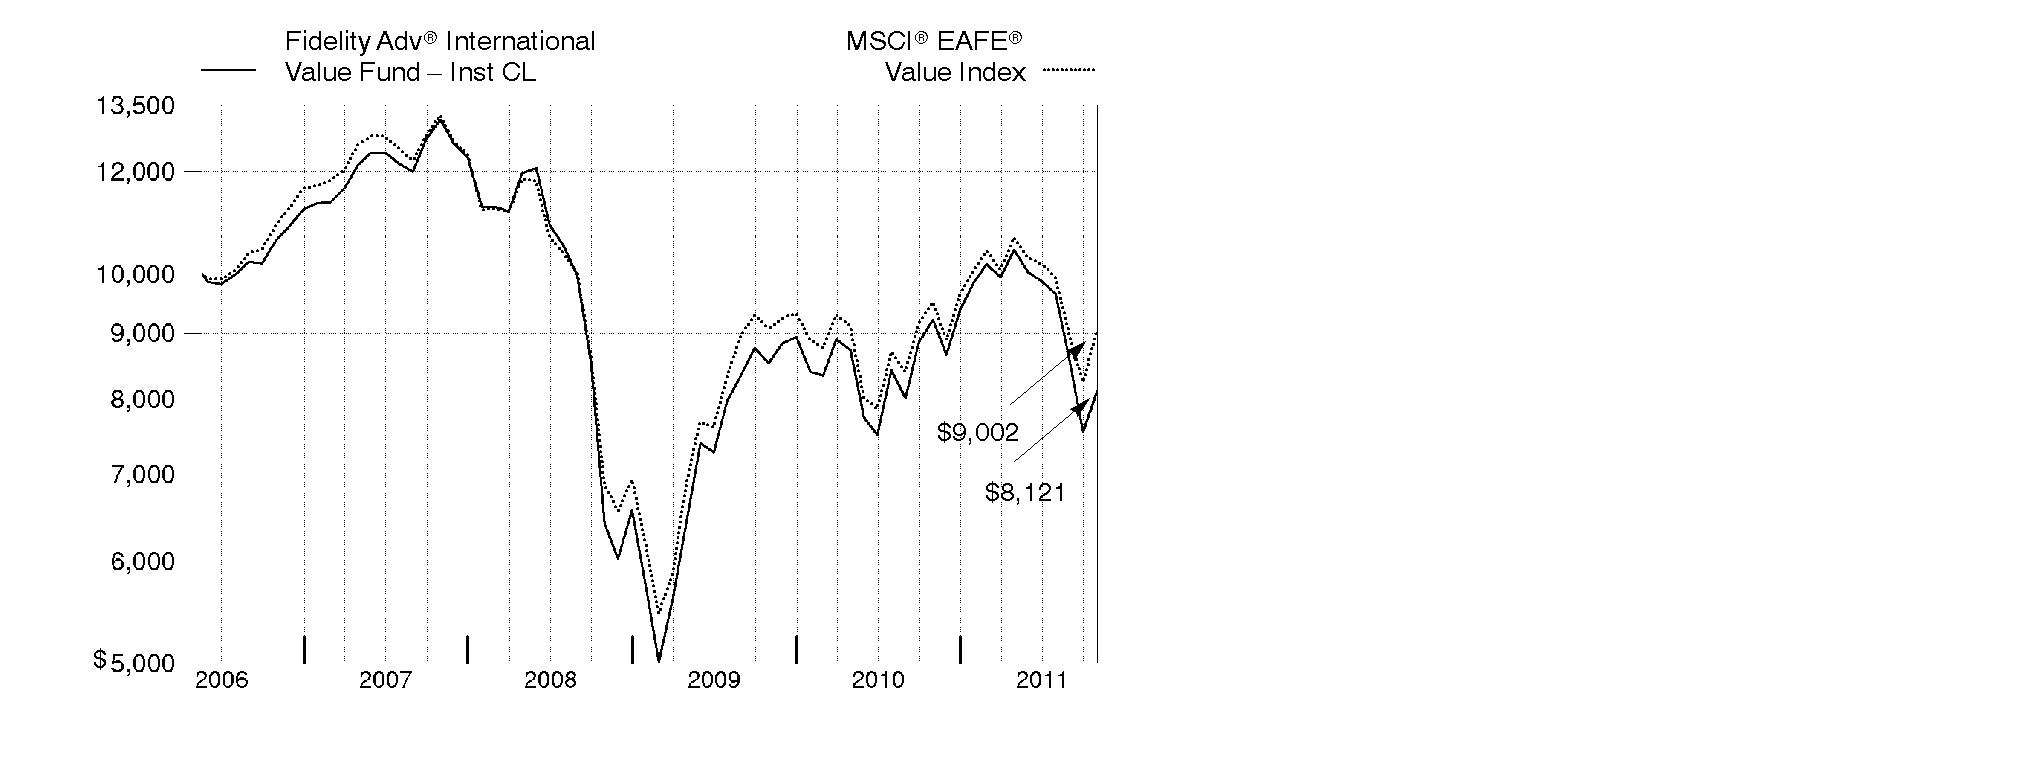
Annual Report
Market Recap: International equities were rocked by a number of headline events during the year ending October 31, 2011. Stocks posted a solid advance for the first half of the period, despite concern about the sovereign debt crisis in Europe, a devastating earthquake and tsunami in Japan, and political upheaval in the Middle East and North Africa. Sentiment turned decidedly negative in the second half, however, as fresh worries about Europe, inflation in China and a dimmed outlook for global growth caused foreign markets to suffer declines that intensified in August and September. October brought with it yet another dramatic swing, as eurozone policymakers appeared near a resolution to the debt debacle and buyers stormed back onto the scene in search of bargains. Still, those gains - along with favorable currency fluctuations overall - weren't enough to offset prior losses, and the MSCI® ACWI® (All Country World Index) ex USA Index finished the period down 4.56%. Within the MSCI index, Europe and emerging markets suffered the biggest declines, with many countries in these areas sustaining steep losses. By contrast, Japan showed resilience in the wake of its natural disasters, falling only 2%. Australia (+4%), Switzerland (+3%), the U.K. (+2%) and Canada, which produced a nominal return, were among the few major benchmark components to break into positive territory.
Comments from Alex Zavratsky, who became Portfolio Manager of Fidelity Advisor® International Value Fund on September 6, 2011: For the year, the fund's Institutional Class shares declined 11.83%, trailing the 5.33% drop of the benchmark MSCI® EAFE® (Europe, Australasia, Far East) Value Index. In geographic terms, weak stock picking in and a lack of exposure to the comparatively healthy Asia Pacific ex Japan region, especially Australia, was detrimental to performance. Stock selection also was detrimental in the U.K., continental Europe - particularly France - and Japan. Sector-wise, the biggest source of weakness was the financials sector, where holdings in several European banks were among the biggest detractors, including France-based Societe Generale, Italy's Intesa Sanpaolo and an out-of-index stake in Lloyds Banking Group in the U.K. Elsewhere within financials, French insurance firm AXA and ING Groep, a diversified financials company in the Netherlands, hampered results. Picks in energy, consumer discretionary and industrials also hurt. However, positioning in utilities was a bright spot. Here, the fund's lack of exposure to Japanese utility Tokyo Electric Power, a benchmark component, was the biggest individual contributor, while out-of-index stakes in Swiss pharma firm Roche Holding and Canada-based miner Yamana Gold also aided results. Some of the stocks I've mentioned in this report were sold from the fund by period end.
The views expressed above reflect those of the portfolio manager(s) only through the end of the period as stated on the cover of this report and do not necessarily represent the views of Fidelity or any other person in the Fidelity organization. Any such views are subject to change at any time based upon market or other conditions and Fidelity disclaims any responsibility to update such views. These views may not be relied on as investment advice and, because investment decisions for a Fidelity fund are based on numerous factors, may not be relied on as an indication of trading intent on behalf of any Fidelity fund.
Annual Report
Shareholder Expense Example
As a shareholder of the Fund, you incur two types of costs: (1) transaction costs, including sales charges (loads) on purchase payments or redemption proceeds, redemption fees, and (2) ongoing costs, including management fees, distribution and/or service (12b-1) fees and other Fund expenses. This Example is intended to help you understand your ongoing costs (in dollars) of investing in the Fund and to compare these costs with the ongoing costs of investing in other mutual funds.
The Example is based on an investment of $1,000 invested at the beginning of the period and held for the entire period (May 1, 2011 to October 31, 2011).
Actual Expenses
The first line of the accompanying table for each class of the Fund provides information about actual account values and actual expenses. You may use the information in this line, together with the amount you invested, to estimate the expenses that you paid over the period. Simply divide your account value by $1,000.00 (for example, an $8,600 account value divided by $1,000.00 = 8.6), then multiply the result by the number in the first line for a class of the Fund under the heading entitled "Expenses Paid During Period" to estimate the expenses you paid on your account during this period. A small balance maintenance fee of $12.00 that is charged once a year may apply for certain accounts with a value of less than $2,000. This fee is not included in the table below. If it was, the estimate of expenses you paid during the period would be higher, and your ending account value lower, by this amount. In addition, the Fund, as a shareholder in the underlying Fidelity Central Funds, will indirectly bear its pro-rata share of the fees and expenses incurred by the underlying Fidelity Central Funds. These fees and expenses are not included in the Fund's annualized expense ratio used to calculate the expense estimate in the table below.
Hypothetical Example for Comparison Purposes
The second line of the accompanying table for each class of the Fund provides information about hypothetical account values and hypothetical expenses based on a Class' actual expense ratio and an assumed rate of return of 5% per year before expenses, which is not the Class' actual return. The hypothetical account values and expenses may not be used to estimate the actual ending account balance or expenses you paid for the period. You may use this information to compare the ongoing costs of investing in the Fund and other funds. To do so, compare this 5% hypothetical example with the 5% hypothetical examples that appear in the shareholder reports of the other funds. A small balance maintenance fee of $12.00 that is charged once a year may apply for certain accounts with a value of less than $2,000. This fee is not included in the table below. If it was, the estimate of expenses you paid during the period would be higher, and your ending account value lower, by this amount. In addition, the Fund, as a shareholder in the underlying Fidelity Central Funds, will indirectly bear its pro-rata share of the fees and expenses incurred by the underlying Fidelity Central Funds. These fees and expenses are not included in the Fund's annualized expense ratio used to calculate the expense estimate in the table below.
Please note that the expenses shown in the table are meant to highlight your ongoing costs only and do not reflect any transaction costs. Therefore, the second line of the table is useful in comparing ongoing costs only, and will not help you determine the relative total costs of owning different funds. In addition, if these transactional costs were included, your costs would have been higher.
Annual Report
Shareholder Expense Example - continued
| Annualized Expense Ratio | Beginning
Account Value
May 1, 2011 | Ending
Account Value
October 31, 2011 | Expenses Paid
During Period*
May 1, 2011 to
October 31, 2011 |
Class A | 1.35% | | | |
Actual | | $ 1,000.00 | $ 778.30 | $ 6.05 |
Hypothetical A | | $ 1,000.00 | $ 1,018.40 | $ 6.87 |
Class T | 1.62% | | | |
Actual | | $ 1,000.00 | $ 776.90 | $ 7.26 |
Hypothetical A | | $ 1,000.00 | $ 1,017.04 | $ 8.24 |
Class B | 2.09% | | | |
Actual | | $ 1,000.00 | $ 774.30 | $ 9.35 |
Hypothetical A | | $ 1,000.00 | $ 1,014.67 | $ 10.61 |
Class C | 2.10% | | | |
Actual | | $ 1,000.00 | $ 774.30 | $ 9.39 |
Hypothetical A | | $ 1,000.00 | $ 1,014.62 | $ 10.66 |
International Value | 1.02% | | | |
Actual | | $ 1,000.00 | $ 779.40 | $ 4.57 |
Hypothetical A | | $ 1,000.00 | $ 1,020.06 | $ 5.19 |
Institutional Class | .98% | | | |
Actual | | $ 1,000.00 | $ 778.80 | $ 4.39 |
Hypothetical A | | $ 1,000.00 | $ 1,020.27 | $ 4.99 |
A 5% return per year before expenses
* Expenses are equal to each Class' annualized expense ratio, multiplied by the average account value over the period, multiplied by 184/365 (to reflect the one-half year period).
Annual Report
Investment Changes (Unaudited)
Geographic Diversification (% of fund's net assets) |
As of October 31, 2011 |
| United Kingdom 27.1% | |
| Japan 21.8% | |
| Germany 10.6% | |
| France 8.5% | |
| Switzerland 7.6% | |
| Australia 6.3% | |
| Norway 2.9% | |
| Netherlands 2.8% | |
| Italy 2.7% | |
| Other 9.7% | |

Percentages are adjusted for the effect of futures contracts, if applicable. |
As of April 30, 2011 |
| United Kingdom 20.1% | |
| Japan 17.0% | |
| France 9.9% | |
| Germany 7.5% | |
| Spain 6.3% | |
| Switzerland 4.8% | |
| Netherlands 4.0% | |
| Canada 3.3% | |
| Hong Kong 3.2% | |
| Other 23.9% | |

Percentages are adjusted for the effect of futures contracts, if applicable. |
Asset Allocation |
| % of fund's
net assets | % of fund's net assets
6 months ago |
Stocks | 99.2 | 98.0 |
Short-Term Investments and Net Other Assets | 0.8 | 2.0 |
Top Ten Stocks as of October 31, 2011 |
| % of fund's
net assets | % of fund's net assets
6 months ago |
Royal Dutch Shell PLC Class A sponsored ADR (United Kingdom, Oil, Gas & Consumable Fuels) | 5.9 | 4.4 |
Vodafone Group PLC sponsored ADR (United Kingdom, Wireless Telecommunication Services) | 3.5 | 2.3 |
GlaxoSmithKline PLC sponsored ADR (United Kingdom, Pharmaceuticals) | 3.5 | 1.8 |
Commonwealth Bank of Australia (Australia, Commercial Banks) | 2.9 | 0.3 |
Sanofi-aventis (France, Pharmaceuticals) | 2.9 | 0.0 |
BP PLC sponsored ADR (United Kingdom, Oil, Gas & Consumable Fuels) | 2.8 | 2.4 |
Roche Holding AG (participation certificate) (Switzerland, Pharmaceuticals) | 2.8 | 1.9 |
Nestle SA (Switzerland, Food Products) | 2.2 | 0.0 |
Allianz AG (Germany, Insurance) | 2.0 | 0.0 |
Australia & New Zealand Banking Group Ltd. (Australia, Commercial Banks) | 1.9 | 0.0 |
| 30.4 | |
Market Sectors as of October 31, 2011 |
| % of fund's
net assets | % of fund's net assets
6 months ago |
Financials | 24.1 | 35.6 |
Energy | 13.2 | 12.6 |
Health Care | 11.7 | 5.3 |
Telecommunication Services | 11.6 | 6.0 |
Consumer Staples | 9.1 | 1.8 |
Utilities | 7.8 | 5.3 |
Consumer Discretionary | 7.5 | 10.3 |
Industrials | 6.4 | 8.8 |
Materials | 5.1 | 7.6 |
Information Technology | 2.7 | 4.7 |
Annual Report
Investments October 31, 2011
Showing Percentage of Net Assets
Common Stocks - 98.6% |
| Shares | | Value |
Australia - 6.3% |
Australia & New Zealand Banking Group Ltd. | 138,811 | | $ 3,136,930 |
Commonwealth Bank of Australia | 90,577 | | 4,653,389 |
Macquarie Group Ltd. | 29,691 | | 764,505 |
Telstra Corp. Ltd. | 508,385 | | 1,650,851 |
TOTAL AUSTRALIA | | 10,205,675 |
Bailiwick of Guernsey - 0.3% |
Resolution Ltd. | 112,600 | | 497,979 |
Bailiwick of Jersey - 0.5% |
Wolseley PLC | 29,862 | | 863,473 |
France - 8.5% |
Atos Origin SA | 13,608 | | 659,501 |
BNP Paribas SA | 45,993 | | 2,090,893 |
Casino Guichard Perrachon et Compagnie | 8,507 | | 799,611 |
Compagnie de St. Gobain | 13,677 | | 637,671 |
Euler Hermes SA | 4,358 | | 315,785 |
GDF Suez | 52,500 | | 1,490,512 |
Pernod-Ricard SA | 9,200 | | 859,402 |
PPR SA | 8,725 | | 1,363,214 |
Sanofi-aventis | 64,860 | | 4,640,692 |
Unibail-Rodamco | 4,566 | | 913,079 |
TOTAL FRANCE | | 13,770,360 |
Germany - 10.3% |
Allianz AG | 24,614 | | 2,766,282 |
Allianz AG sponsored ADR | 43,400 | | 486,080 |
BASF AG | 41,646 | | 3,065,547 |
Bayer AG | 31,246 | | 2,001,858 |
Daimler AG (United States) (d) | 30,700 | | 1,560,788 |
Deutsche Telekom AG | 119,500 | | 1,520,467 |
E.ON AG | 72,160 | | 1,748,588 |
HeidelbergCement AG | 15,400 | | 702,872 |
Metro AG | 12,500 | | 582,795 |
Siemens AG | 15,311 | | 1,605,145 |
Volkswagen AG | 3,535 | | 556,719 |
TOTAL GERMANY | | 16,597,141 |
Hong Kong - 0.6% |
Henderson Land Development Co. Ltd. | 20,000 | | 109,321 |
Power Assets Holdings Ltd. | 114,500 | | 870,064 |
TOTAL HONG KONG | | 979,385 |
Common Stocks - continued |
| Shares | | Value |
Ireland - 0.7% |
CRH PLC sponsored ADR (d) | 56,800 | | $ 1,045,688 |
Italy - 2.4% |
ENI SpA | 138,600 | | 3,064,045 |
Intesa Sanpaolo SpA | 457,645 | | 817,635 |
TOTAL ITALY | | 3,881,680 |
Japan - 21.8% |
ABC-Mart, Inc. | 13,900 | | 544,420 |
Aeon Credit Service Co. Ltd. | 51,800 | | 772,586 |
Air Water, Inc. | 63,000 | | 799,836 |
Aisin Seiki Co. Ltd. | 15,800 | | 499,770 |
Aozora Bank Ltd. | 482,000 | | 1,218,664 |
Asahi Glass Co. Ltd. | 58,000 | | 507,967 |
Canon, Inc. | 25,800 | | 1,171,413 |
Chubu Electric Power Co., Inc. | 42,600 | | 779,498 |
Credit Saison Co. Ltd. | 45,000 | | 878,236 |
Denso Corp. | 38,300 | | 1,178,001 |
Dentsu, Inc. | 23,700 | | 713,704 |
Fanuc Corp. | 4,900 | | 792,384 |
Honda Motor Co. Ltd. | 49,900 | | 1,492,388 |
INPEX Corp. | 150 | | 990,439 |
Itochu Corp. | 172,500 | | 1,706,320 |
Japan Retail Fund Investment Corp. | 1,012 | | 1,566,749 |
Japan Tobacco, Inc. | 516 | | 2,579,382 |
JSR Corp. | 42,300 | | 807,615 |
JX Holdings, Inc. | 200,600 | | 1,168,621 |
KDDI Corp. | 285 | | 2,087,994 |
Mitsubishi Corp. | 41,800 | | 859,809 |
Mitsubishi Tanabe Pharma Corp. | 73,400 | | 1,269,783 |
Nippon Telegraph & Telephone Corp. | 42,900 | | 2,200,873 |
Obic Co. Ltd. | 3,870 | | 731,757 |
ORIX Corp. | 9,540 | | 832,713 |
Santen Pharmaceutical Co. Ltd. | 19,900 | | 742,635 |
Seven & i Holdings Co., Ltd. | 39,300 | | 1,048,884 |
Tokio Marine Holdings, Inc. | 28,800 | | 686,809 |
Tokyo Gas Co. Ltd. | 313,000 | | 1,348,051 |
Toray Industries, Inc. | 127,000 | | 904,026 |
USS Co. Ltd. | 9,290 | | 768,095 |
West Japan Railway Co. | 37,700 | | 1,597,689 |
TOTAL JAPAN | | 35,247,111 |
Common Stocks - continued |
| Shares | | Value |
Korea (South) - 0.6% |
Samsung Electronics Co. Ltd. | 1,050 | | $ 900,532 |
Mexico - 0.7% |
Grupo Modelo SAB de CV Series C | 163,000 | | 1,033,913 |
Netherlands - 2.8% |
ING Groep NV: | | | |
(Certificaten Van Aandelen) (a) | 177,668 | | 1,531,893 |
sponsored ADR (a) | 57,141 | | 493,698 |
Koninklijke KPN NV | 58,620 | | 770,356 |
Koninklijke Philips Electronics NV | 38,000 | | 791,149 |
Unilever NV (Certificaten Van Aandelen) (Bearer) unit | 28,900 | | 997,878 |
TOTAL NETHERLANDS | | 4,584,974 |
Norway - 2.9% |
Aker Solutions ASA | 39,270 | | 456,702 |
DnB NOR ASA | 110,200 | | 1,285,561 |
Orkla ASA (A Shares) (d) | 114,700 | | 999,165 |
Telenor ASA | 111,600 | | 1,992,428 |
TOTAL NORWAY | | 4,733,856 |
Portugal - 0.2% |
Energias de Portugal SA | 119,836 | | 378,947 |
Singapore - 1.9% |
Singapore Telecommunications Ltd. | 686,000 | | 1,733,801 |
United Overseas Bank Ltd. | 102,480 | | 1,389,391 |
TOTAL SINGAPORE | | 3,123,192 |
Spain - 2.5% |
Banco Bilbao Vizcaya Argentaria SA sponsored ADR (d) | 249,725 | | 2,257,514 |
Red Electrica Corporacion SA | 11,600 | | 561,462 |
Repsol YPF SA | 37,297 | | 1,130,375 |
TOTAL SPAIN | | 3,949,351 |
Sweden - 0.9% |
Tele2 AB (B Shares) | 29,100 | | 614,177 |
Telefonaktiebolaget LM Ericsson (B Shares) | 73,030 | | 760,985 |
TOTAL SWEDEN | | 1,375,162 |
Switzerland - 7.6% |
Nestle SA | 61,138 | | 3,546,150 |
Roche Holding AG (participation certificate) | 27,505 | | 4,535,324 |
Syngenta AG (Switzerland) | 2,900 | | 883,943 |
Transocean Ltd. (United States) | 7,839 | | 447,999 |
Common Stocks - continued |
| Shares | | Value |
Switzerland - continued |
UBS AG (NY Shares) (a) | 77,800 | | $ 981,836 |
Zurich Financial Services AG | 8,111 | | 1,883,678 |
TOTAL SWITZERLAND | | 12,278,930 |
United Kingdom - 27.1% |
Aegis Group PLC | 176,727 | | 389,939 |
Aviva PLC | 212,728 | | 1,160,768 |
Barclays PLC | 592,002 | | 1,835,515 |
BP PLC sponsored ADR | 103,035 | | 4,552,086 |
British American Tobacco PLC (United Kingdom) | 17,400 | | 797,944 |
British Land Co. PLC | 80,100 | | 657,610 |
Centrica PLC | 161,725 | | 771,676 |
Compass Group PLC | 90,200 | | 821,038 |
GlaxoSmithKline PLC sponsored ADR | 125,600 | | 5,625,624 |
HSBC Holdings PLC sponsored ADR | 29,770 | | 1,299,758 |
Imperial Tobacco Group PLC | 46,179 | | 1,688,788 |
International Power PLC | 201,018 | | 1,093,323 |
National Grid PLC | 207,100 | | 2,059,381 |
Next PLC | 11,800 | | 485,046 |
Prudential PLC | 170,349 | | 1,759,882 |
Reed Elsevier PLC | 164,300 | | 1,412,295 |
Royal Dutch Shell PLC Class A sponsored ADR (d) | 133,400 | | 9,459,392 |
Scottish & Southern Energy PLC | 68,827 | | 1,487,641 |
Tesco PLC | 129,900 | | 839,277 |
Vodafone Group PLC sponsored ADR | 202,766 | | 5,645,005 |
TOTAL UNITED KINGDOM | | 43,841,988 |
TOTAL COMMON STOCKS (Cost $170,522,198) | 159,289,337 |
Nonconvertible Preferred Stocks - 0.6% |
| | | |
Germany - 0.3% |
Volkswagen AG | 3,327 | | 583,817 |
Italy - 0.3% |
Telecom Italia SpA (Risparmio Shares) | 489,900 | | 514,204 |
TOTAL NONCONVERTIBLE PREFERRED STOCKS (Cost $1,433,774) | 1,098,021 |
Money Market Funds - 7.3% |
| Shares | | | Value |
Fidelity Cash Central Fund, 0.12% (b) | 143,971 | | $ 143,971 |
Fidelity Securities Lending Cash Central Fund, 0.11% (b)(c) | 11,625,914 | | 11,625,914 |
TOTAL MONEY MARKET FUNDS (Cost $11,769,885) | | 11,769,885 |
TOTAL INVESTMENT PORTFOLIO - 106.5% (Cost $183,725,857) | 172,157,243 |
NET OTHER ASSETS (LIABILITIES) - (6.5)% | (10,572,704) |
NET ASSETS - 100% | $ 161,584,539 |
Legend |
(a) Non-income producing |
(b) Affiliated fund that is available only to investment companies and other accounts managed by Fidelity Investments. The rate quoted is the annualized seven-day yield of the fund at period end. A complete unaudited listing of the fund's holdings as of its most recent quarter end is available upon request. In addition, each Fidelity Central Fund's financial statements, which are not covered by the Fund's Report of Independent Registered Public Accounting Firm, are available on the SEC's website or upon request. |
(c) Investment made with cash collateral received from securities on loan. |
(d) Security or a portion of the security is on loan at period end. |
Affiliated Central Funds |
Information regarding fiscal year to date income earned by the Fund from investments in Fidelity Central Funds is as follows: |
Fund | Income earned |
Fidelity Cash Central Fund | $ 3,498 |
Fidelity Securities Lending Cash Central Fund | 221,316 |
Total | $ 224,814 |
Other Information |
The following is a summary of the inputs used, as of October 31, 2011, involving the Fund's assets and liabilities carried at fair value. The inputs or methodology used for valuing securities may not be an indication of the risk associated with investing in those securities. For more information on valuation inputs, and their aggregation into the levels used in the table below, please refer to the Security Valuation section in the accompanying Notes to Financial Statements. |
Valuation Inputs at Reporting Date: |
Description | Total | Level 1 | Level 2 | Level 3 |
Investments in Securities: | | | | |
Equities: | | | | |
United Kingdom | $ 43,841,988 | $ 36,228,498 | $ 7,613,490 | $ - |
Japan | 35,247,111 | - | 35,247,111 | - |
Germany | 17,180,958 | 15,575,813 | 1,605,145 | - |
France | 13,770,360 | 9,129,668 | 4,640,692 | - |
Switzerland | 12,278,930 | 11,394,987 | 883,943 | - |
Australia | 10,205,675 | - | 10,205,675 | - |
Norway | 4,733,856 | 4,733,856 | - | - |
Netherlands | 4,584,974 | 1,264,054 | 3,320,920 | - |
Italy | 4,395,884 | 817,635 | 3,578,249 | - |
Other | 14,147,622 | 8,383,528 | 5,764,094 | - |
Money Market Funds | 11,769,885 | 11,769,885 | - | - |
Total Investments in Securities: | $ 172,157,243 | $ 99,297,924 | $ 72,859,319 | $ - |
Income Tax Information |
At October 31, 2011, the Fund had a capital loss carryforward of approximately $117,406,155 of which $17,089,067, $65,376,972, $3,571,319 and $31,368,797 will expire in fiscal 2016, 2017, 2018 and 2019, respectively. Capital loss carryforwards are only available to offset future capital gains of the Fund to the extent provided by regulations and may be limited. |
See accompanying notes which are an integral part of the financial statements.
Annual Report
Statement of Assets and Liabilities
| October 31, 2011 |
Assets | | |
Investment in securities, at value (including securities loaned of $11,205,139) - See accompanying schedule: Unaffiliated issuers (cost $171,955,972) | $ 160,387,358 | |
Fidelity Central Funds (cost $11,769,885) | 11,769,885 | |
Total Investments (cost $183,725,857) | | $ 172,157,243 |
Foreign currency held at value (cost $6,508) | | 6,508 |
Receivable for investments sold | | 2,643,297 |
Receivable for fund shares sold | | 68,159 |
Dividends receivable | | 742,086 |
Distributions receivable from Fidelity Central Funds | | 1,186 |
Prepaid expenses | | 754 |
Other receivables | | 24,694 |
Total assets | | 175,643,927 |
| | |
Liabilities | | |
Payable to custodian bank | $ 578 | |
Payable for investments purchased | 2,093,650 | |
Payable for fund shares redeemed | 155,013 | |
Accrued management fee | 82,006 | |
Distribution and service plan fees payable | 4,397 | |
Other affiliated payables | 40,042 | |
Other payables and accrued expenses | 57,788 | |
Collateral on securities loaned, at value | 11,625,914 | |
Total liabilities | | 14,059,388 |
| | |
Net Assets | | $ 161,584,539 |
Net Assets consist of: | | |
Paid in capital | | $ 286,936,774 |
Undistributed net investment income | | 4,796,682 |
Accumulated undistributed net realized gain (loss) on investments and foreign currency transactions | | (118,590,823) |
Net unrealized appreciation (depreciation) on investments and assets and liabilities in foreign currencies | | (11,558,094) |
Net Assets | | $ 161,584,539 |
See accompanying notes which are an integral part of the financial statements.
Annual Report
Statement of Assets and Liabilities - continued
| October 31, 2011 |
| | |
Calculation of Maximum Offering Price Class A:
Net Asset Value and redemption price per share ($4,667,585 ÷ 665,122 shares) | | $ 7.02 |
| | |
Maximum offering price per share (100/94.25 of $7.02) | | $ 7.45 |
Class T:
Net Asset Value and redemption price per share ($2,467,516 ÷ 352,476 shares) | | $ 7.00 |
| | |
Maximum offering price per share (100/96.50 of $7.00) | | $ 7.25 |
Class B:
Net Asset Value and offering price per share ($901,346 ÷ 128,716 shares)A | | $ 7.00 |
| | |
Class C:
Net Asset Value and offering price per share ($2,108,020 ÷ 301,130 shares)A | | $ 7.00 |
| | |
International Value:
Net Asset Value, offering price and redemption price per share ($150,966,942 ÷ 21,486,993 shares) | | $ 7.03 |
| | |
Institutional Class:
Net Asset Value, offering price and redemption price per share ($473,130 ÷ 67,196 shares) | | $ 7.04 |
A Redemption price per share is equal to net asset value less any applicable contingent deferred sales charge.
See accompanying notes which are an integral part of the financial statements.
Annual Report
Financial Statements - continued
Statement of Operations
| Year ended October 31, 2011 |
Investment Income | | |
Dividends | | $ 8,421,712 |
Interest | | 4,722 |
Income from Fidelity Central Funds | | 224,814 |
Income before foreign taxes withheld | | 8,651,248 |
Less foreign taxes withheld | | (673,231) |
Total income | | 7,978,017 |
| | |
Expenses | | |
Management fee
Basic fee | $ 1,368,135 | |
Performance adjustment | (134,111) | |
Transfer agent fees | 451,985 | |
Distribution and service plan fees | 60,436 | |
Accounting and security lending fees | 110,463 | |
Custodian fees and expenses | 73,442 | |
Independent trustees' compensation | 1,067 | |
Registration fees | 73,513 | |
Audit | 70,906 | |
Legal | 763 | |
Interest | 381 | |
Miscellaneous | 1,736 | |
Total expenses before reductions | 2,078,716 | |
Expense reductions | (53,706) | 2,025,010 |
Net investment income (loss) | | 5,953,007 |
Realized and Unrealized Gain (Loss) Net realized gain (loss) on: | | |
Investment securities: | | |
Unaffiliated issuers | (31,191,099) | |
Foreign currency transactions | (23,323) | |
Total net realized gain (loss) | | (31,214,422) |
Change in net unrealized appreciation (depreciation) on: Investment securities (net of decrease in deferred foreign taxes of $30,988) | (366,851) | |
Assets and liabilities in foreign currencies | (16,031) | |
Total change in net unrealized appreciation (depreciation) | | (382,882) |
Net gain (loss) | | (31,597,304) |
Net increase (decrease) in net assets resulting from operations | | $ (25,644,297) |
See accompanying notes which are an integral part of the financial statements.
Annual Report
Statement of Changes in Net Assets
| Year ended
October 31,
2011 | Year ended
October 31,
2010 |
Increase (Decrease) in Net Assets | | |
Operations | | |
Net investment income (loss) | $ 5,953,007 | $ 3,860,059 |
Net realized gain (loss) | (31,214,422) | (3,221,958) |
Change in net unrealized appreciation (depreciation) | (382,882) | 12,417,837 |
Net increase (decrease) in net assets resulting
from operations | (25,644,297) | 13,055,938 |
Distributions to shareholders from net investment income | (4,441,935) | (3,135,757) |
Distributions to shareholders from net realized gain | (710,581) | (123,529) |
Total distributions | (5,152,516) | (3,259,286) |
Share transactions - net increase (decrease) | 18,454,243 | (27,172,209) |
Redemption fees | 3,151 | 3,410 |
Total increase (decrease) in net assets | (12,339,419) | (17,372,147) |
| | |
Net Assets | | |
Beginning of period | 173,923,958 | 191,296,105 |
End of period (including undistributed net investment income of $4,796,681 and undistributed net investment income of $3,475,373, respectively) | $ 161,584,539 | $ 173,923,958 |
See accompanying notes which are an integral part of the financial statements.
Annual Report
Financial Highlights - Class A
Years ended October 31, | 2011 | 2010 | 2009 | 2008 | 2007 |
Selected Per-Share Data | | | | | |
Net asset value, beginning of period | $ 8.22 | $ 7.75 | $ 5.93 | $ 13.02 | $ 10.60 |
Income from Investment Operations | | | | | |
Net investment income (loss) C | .22 | .15 | .12 | .21 | .18 |
Net realized and unrealized gain (loss) | (1.19) | .44 | 1.78 | (6.53) | 2.29 |
Total from investment operations | (.97) | .59 | 1.90 | (6.32) | 2.47 |
Distributions from net investment income | (.19) | (.11) | (.08) | (.15) | (.03) |
Distributions from net realized gain | (.03) | (.01) | - | (.62) | (.02) |
Total distributions | (.23) H | (.12) | (.08) | (.77) | (.05) |
Redemption fees added to paid in capital C,G | - | - | - | - | - |
Net asset value, end of period | $ 7.02 | $ 8.22 | $ 7.75 | $ 5.93 | $ 13.02 |
Total Return A,B | (12.19)% | 7.60% | 32.71% | (51.50)% | 23.43% |
Ratios to Average Net Assets D,F | | | | | |
Expenses before reductions | 1.36% | 1.40% | 1.34% | 1.42% | 1.38% |
Expenses net of fee waivers, if any | 1.36% | 1.40% | 1.34% | 1.42% | 1.38% |
Expenses net of all reductions | 1.34% | 1.38% | 1.32% | 1.41% | 1.37% |
Net investment income (loss) | 2.79% | 1.93% | 1.86% | 2.05% | 1.49% |
Supplemental Data | | | | | |
Net assets, end of period (000 omitted) | $ 4,668 | $ 4,699 | $ 4,456 | $ 2,854 | $ 6,052 |
Portfolio turnover rate E | 83% | 43% | 46% | 68% | 59% |
A Total returns would have been lower if certain expenses had not been reduced during the applicable periods shown.
B Total returns do not include the effect of the sales charges.
C Calculated based on average shares outstanding during the period.
D Fees and expenses of any underlying Fidelity Central Funds are not included in the Fund's expense ratio. The Fund indirectly bears its proportionate share of the expenses of any underlying Fidelity Central Funds.
E Amount does not include the portfolio activity of any underlying Fidelity Central Funds.
F Expense ratios reflect operating expenses of the class. Expenses before reductions do not reflect amounts reimbursed by the investment adviser or reductions from brokerage service arrangements or reductions from other expense offset arrangements and do not represent the amount paid by the class during periods when reimbursements or reductions occur. Expenses net of fee waivers reflect expenses after reimbursement by the investment adviser but prior to reductions from brokerage service arrangements or other expense offset arrangements. Expenses net of all reductions represent the net expenses paid by the class.
G Amount represents less than $.01 per share.
H Total distributions of $.23 per share is comprised of distributions from net investment income of $.191 and distributions from net realized gain of $.034 per share.
See accompanying notes which are an integral part of the financial statements.
Annual Report
Financial Highlights - Class T
Years ended October 31, | 2011 | 2010 | 2009 | 2008 | 2007 |
Selected Per-Share Data | | | | | |
Net asset value, beginning of period | $ 8.20 | $ 7.73 | $ 5.91 | $ 12.99 | $ 10.59 |
Income from Investment Operations | | | | | |
Net investment income (loss) C | .20 | .13 | .10 | .18 | .15 |
Net realized and unrealized gain (loss) | (1.19) | .44 | 1.77 | (6.50) | 2.29 |
Total from investment operations | (.99) | .57 | 1.87 | (6.32) | 2.44 |
Distributions from net investment income | (.17) | (.09) | (.05) | (.14) | (.02) |
Distributions from net realized gain | (.03) | (.01) | - | (.62) | (.02) |
Total distributions | (.21) H | (.10) | (.05) | (.76) | (.04) |
Redemption fees added to paid in capital C,G | - | - | - | - | - |
Net asset value, end of period | $ 7.00 | $ 8.20 | $ 7.73 | $ 5.91 | $ 12.99 |
Total Return A,B | (12.42)% | 7.32% | 32.14% | (51.60)% | 23.13% |
Ratios to Average Net Assets D,F | | | | | |
Expenses before reductions | 1.63% | 1.67% | 1.60% | 1.67% | 1.60% |
Expenses net of fee waivers, if any | 1.62% | 1.67% | 1.60% | 1.67% | 1.60% |
Expenses net of all reductions | 1.60% | 1.65% | 1.59% | 1.66% | 1.58% |
Net investment income (loss) | 2.52% | 1.65% | 1.59% | 1.80% | 1.27% |
Supplemental Data | | | | | |
Net assets, end of period (000 omitted) | $ 2,468 | $ 2,276 | $ 2,395 | $ 2,087 | $ 5,081 |
Portfolio turnover rate E | 83% | 43% | 46% | 68% | 59% |
A Total returns would have been lower if certain expenses had not been reduced during the applicable periods shown.
B Total returns do not include the effect of the sales charges.
C Calculated based on average shares outstanding during the period.
D Fees and expenses of any underlying Fidelity Central Funds are not included in the Fund's expense ratio. The Fund indirectly bears its proportionate share of the expenses of any underlying Fidelity Central Funds.
E Amount does not include the portfolio activity of any underlying Fidelity Central Funds.
F Expense ratios reflect operating expenses of the class. Expenses before reductions do not reflect amounts reimbursed by the investment adviser or reductions from brokerage service arrangements or reductions from other expense offset arrangements and do not represent the amount paid by the class during periods when reimbursements or reductions occur. Expenses net of fee waivers reflect expenses after reimbursement by the investment adviser but prior to reductions from brokerage service arrangements or other expense offset arrangements. Expenses net of all reductions represent the net expenses paid by the class.
G Amount represents less than $.01 per share.
H Total distributions of $.21 per share is comprised of distributions from net investment income of $.173 and distributions from net realized gain of $.034 per share.
See accompanying notes which are an integral part of the financial statements.
Annual Report
Financial Highlights - Class B
Years ended October 31, | 2011 | 2010 | 2009 | 2008 | 2007 |
Selected Per-Share Data | | | | | |
Net asset value, beginning of period | $ 8.20 | $ 7.74 | $ 5.88 | $ 12.93 | $ 10.56 |
Income from Investment Operations | | | | | |
Net investment income (loss) C | .17 | .09 | .07 | .13 | .09 |
Net realized and unrealized gain (loss) | (1.20) | .44 | 1.79 | (6.48) | 2.29 |
Total from investment operations | (1.03) | .53 | 1.86 | (6.35) | 2.38 |
Distributions from net investment income | (.13) | (.06) | - | (.08) | - |
Distributions from net realized gain | (.03) | (.01) | - | (.62) | (.01) |
Total distributions | (.17) H | (.07) | - | (.70) | (.01) |
Redemption fees added to paid in capital C,G | - | - | - | - | - |
Net asset value, end of period | $ 7.00 | $ 8.20 | $ 7.74 | $ 5.88 | $ 12.93 |
Total Return A,B | (12.88)% | 6.82% | 31.63% | (51.85)% | 22.59% |
Ratios to Average Net Assets D,F | | | | | |
Expenses before reductions | 2.11% | 2.15% | 2.08% | 2.18% | 2.10% |
Expenses net of fee waivers, if any | 2.11% | 2.15% | 2.08% | 2.18% | 2.10% |
Expenses net of all reductions | 2.09% | 2.13% | 2.07% | 2.17% | 2.08% |
Net investment income (loss) | 2.04% | 1.18% | 1.11% | 1.29% | .77% |
Supplemental Data | | | | | |
Net assets, end of period (000 omitted) | $ 901 | $ 1,216 | $ 1,076 | $ 931 | $ 2,651 |
Portfolio turnover rate E | 83% | 43% | 46% | 68% | 59% |
A Total returns would have been lower if certain expenses had not been reduced during the applicable periods shown.
B Total returns do not include the effect of the contingent deferred sales charge.
C Calculated based on average shares outstanding during the period.
D Fees and expenses of any underlying Fidelity Central Funds are not included in the Fund's expense ratio. The Fund indirectly bears its proportionate share of the expenses of any underlying Fidelity Central Funds.
E Amount does not include the portfolio activity of any underlying Fidelity Central Funds.
F Expense ratios reflect operating expenses of the class. Expenses before reductions do not reflect amounts reimbursed by the investment adviser or reductions from brokerage service arrangements or reductions from other expense offset arrangements and do not represent the amount paid by the class during periods when reimbursements or reductions occur. Expenses net of fee waivers reflect expenses after reimbursement by the investment adviser but prior to reductions from brokerage service arrangements or other expense offset arrangements. Expenses net of all reductions represent the net expenses paid by the class.
G Amount represents less than $.01 per share.
H Total distributions of $.17 per share is comprised of distributions from net investment income of $.131 and distributions from net realized gain of $.034 per share.
See accompanying notes which are an integral part of the financial statements.
Annual Report
Financial Highlights - Class C
Years ended October 31, | 2011 | 2010 | 2009 | 2008 | 2007 |
Selected Per-Share Data | | | | | |
Net asset value, beginning of period | $ 8.20 | $ 7.73 | $ 5.88 | $ 12.92 | $ 10.56 |
Income from Investment Operations | | | | | |
Net investment income (loss) C | .16 | .09 | .07 | .13 | .09 |
Net realized and unrealized gain (loss) | (1.19) | .44 | 1.78 | (6.47) | 2.29 |
Total from investment operations | (1.03) | .53 | 1.85 | (6.34) | 2.38 |
Distributions from net investment income | (.14) | (.05) | - | (.08) | - |
Distributions from net realized gain | (.03) | (.01) | - | (.62) | (.02) |
Total distributions | (.17) | (.06) | - | (.70) | (.02) |
Redemption fees added to paid in capital C,G | - | - | - | - | - |
Net asset value, end of period | $ 7.00 | $ 8.20 | $ 7.73 | $ 5.88 | $ 12.92 |
Total Return A,B | (12.84)% | 6.84% | 31.46% | (51.80)% | 22.56% |
Ratios to Average Net Assets D,F | | | | | |
Expenses before reductions | 2.12% | 2.15% | 2.08% | 2.17% | 2.07% |
Expenses net of fee waivers, if any | 2.11% | 2.15% | 2.08% | 2.17% | 2.07% |
Expenses net of all reductions | 2.09% | 2.13% | 2.06% | 2.16% | 2.05% |
Net investment income (loss) | 2.04% | 1.18% | 1.12% | 1.30% | .80% |
Supplemental Data | | | | | |
Net assets, end of period (000 omitted) | $ 2,108 | $ 2,123 | $ 2,108 | $ 1,784 | $ 5,996 |
Portfolio turnover rate E | 83% | 43% | 46% | 68% | 59% |
A Total returns would have been lower if certain expenses had not been reduced during the applicable periods shown.
B Total returns do not include the effect of the contingent deferred sales charge.
C Calculated based on average shares outstanding during the period.
D Fees and expenses of any underlying Fidelity Central Funds are not included in the Fund's expense ratio. The Fund indirectly bears its proportionate share of the expenses of any underlying Fidelity Central Funds.
E Amount does not include the portfolio activity of any underlying Fidelity Central Funds.
F Expense ratios reflect operating expenses of the class. Expenses before reductions do not reflect amounts reimbursed by the investment adviser or reductions from brokerage service arrangements or reductions from other expense offset arrangements and do not represent the amount paid by the class during periods when reimbursements or reductions occur. Expenses net of fee waivers reflect expenses after reimbursement by the investment adviser but prior to reductions from brokerage service arrangements or other expense offset arrangements. Expenses net of all reductions represent the net expenses paid by the class.
G Amount represents less than $.01 per share.
See accompanying notes which are an integral part of the financial statements.
Annual Report
Financial Highlights - International Value
Years ended October 31, | 2011 | 2010 | 2009 | 2008 | 2007 |
Selected Per-Share Data | | | | | |
Net asset value, beginning of period | $ 8.23 | $ 7.75 | $ 5.95 | $ 13.06 | $ 10.61 |
Income from Investment Operations | | | | | |
Net investment income (loss) B | .25 | .17 | .13 | .24 | .22 |
Net realized and unrealized gain (loss) | (1.20) | .44 | 1.78 | (6.54) | 2.29 |
Total from investment operations | (.95) | .61 | 1.91 | (6.30) | 2.51 |
Distributions from net investment income | (.22) | (.13) | (.11) | (.19) | (.04) |
Distributions from net realized gain | (.03) | (.01) | - | (.62) | (.02) |
Total distributions | (.25) | (.13) G | (.11) | (.81) | (.06) |
Redemption fees added to paid in capital B,F | - | - | - | - | - |
Net asset value, end of period | $ 7.03 | $ 8.23 | $ 7.75 | $ 5.95 | $ 13.06 |
Total Return A | (11.91)% | 7.95% | 33.09% | (51.34)% | 23.81% |
Ratios to Average Net Assets C,E | | | | | |
Expenses before reductions | 1.04% | 1.09% | 1.07% | 1.10% | 1.03% |
Expenses net of fee waivers, if any | 1.03% | 1.09% | 1.07% | 1.10% | 1.03% |
Expenses net of all reductions | 1.01% | 1.08% | 1.06% | 1.09% | 1.02% |
Net investment income (loss) | 3.11% | 2.23% | 2.12% | 2.37% | 1.84% |
Supplemental Data | | | | | |
Net assets, end of period (000 omitted) | $ 150,967 | $ 163,090 | $ 180,447 | $ 160,777 | $ 381,148 |
Portfolio turnover rate D | 83% | 43% | 46% | 68% | 59% |
A Total returns would have been lower if certain expenses had not been reduced during the applicable periods shown.
B Calculated based on average shares outstanding during the period.
C Fees and expenses of any underlying Fidelity Central Funds are not included in the Fund's expense ratio. The Fund indirectly bears its proportionate share of the expenses of any underlying Fidelity Central Funds.
D Amount does not include the portfolio activity of any underlying Fidelity Central Funds.
E Expense ratios reflect operating expenses of the class. Expenses before reductions do not reflect amounts reimbursed by the investment adviser or reductions from brokerage service arrangements or reductions from other expense offset arrangements and do not represent the amount paid by the class during periods when reimbursements or reductions occur. Expenses net of fee waivers reflect expenses after reimbursement by the investment adviser but prior to reductions from brokerage service arrangements or other expense offset arrangements. Expenses net of all reductions represent the net expenses paid by the class.
F Amount represents less than $.01 per share.
G Total distributions of $.13 per share is comprised of distributions from net investment income of $.129 and distributions from net realized gain of $.005 per share.
See accompanying notes which are an integral part of the financial statements.
Annual Report
Financial Highlights - Institutional Class
Years ended October 31, | 2011 | 2010 | 2009 | 2008 | 2007 |
Selected Per-Share Data | | | | | |
Net asset value, beginning of period | $ 8.24 | $ 7.76 | $ 5.96 | $ 13.07 | $ 10.61 |
Income from Investment Operations | | | | | |
Net investment income (loss) B | .25 | .18 | .14 | .25 | .22 |
Net realized and unrealized gain (loss) | (1.19) | .44 | 1.78 | (6.54) | 2.30 |
Total from investment operations | (.94) | .62 | 1.92 | (6.29) | 2.52 |
Distributions from net investment income | (.22) | (.14) | (.12) | (.20) | (.04) |
Distributions from net realized gain | (.03) | (.01) | - | (.62) | (.02) |
Total distributions | (.26) H | (.14) G | (.12) | (.82) | (.06) |
Redemption fees added to paid in capital B,F | - | - | - | - | - |
Net asset value, end of period | $ 7.04 | $ 8.24 | $ 7.76 | $ 5.96 | $ 13.07 |
Total Return A | (11.83)% | 8.05% | 33.06% | (51.27)% | 23.91% |
Ratios to Average Net Assets C,E | | | | | |
Expenses before reductions | .98% | .98% | .93% | 1.02% | .98% |
Expenses net of fee waivers, if any | .98% | .98% | .93% | 1.02% | .98% |
Expenses net of all reductions | .96% | .97% | .92% | 1.01% | .96% |
Net investment income (loss) | 3.17% | 2.34% | 2.26% | 2.45% | 1.89% |
Supplemental Data | | | | | |
Net assets, end of period (000 omitted) | $ 473 | $ 519 | $ 814 | $ 1,052 | $ 3,965 |
Portfolio turnover rate D | 83% | 43% | 46% | 68% | 59% |
A Total returns would have been lower if certain expenses had not been reduced during the applicable periods shown.
B Calculated based on average shares outstanding during the period.
C Fees and expenses of any underlying Fidelity Central Funds are not included in the Fund's expense ratio. The Fund indirectly bears its proportionate share of the expenses of any underlying Fidelity Central Funds.
D Amount does not include the portfolio activity of any underlying Fidelity Central Funds.
E Expense ratios reflect operating expenses of the class. Expenses before reductions do not reflect amounts reimbursed by the investment adviser or reductions from brokerage service arrangements or reductions from other expense offset arrangements and do not represent the amount paid by the class during periods when reimbursements or reductions occur. Expenses net of fee waivers reflect expenses after reimbursement by the investment adviser but prior to reductions from brokerage service arrangements or other expense offset arrangements. Expenses net of all reductions represent the net expenses paid by the class.
F Amount represents less than $.01 per share.
G Total distributions of $.14 per share is comprised of distributions from net investment income of $.137 and distributions from net realized gain of $.005 per share.
H Total distributions of $.26 per share is comprised of distributions from net investment income of $.221 and distributions from net realized gain of $.034 per share.
See accompanying notes which are an integral part of the financial statements.
Annual Report
Notes to Financial Statements
For the period ended October 31, 2011
1. Organization.
Fidelity International Value Fund (the Fund) is a fund of Fidelity Investment Trust (the Trust) and is authorized to issue an unlimited number of shares. The Trust is registered under the Investment Company Act of 1940, as amended (the 1940 Act), as an open-end management investment company organized as a Massachusetts business trust. The Fund offers Class A, Class T, Class C, International Value and Institutional Class shares, each of which, along with Class B shares, has equal rights as to assets and voting privileges. Effective after the close of business on September 1, 2010, Class B shares were closed to new accounts and additional purchases, except for exchanges and reinvestments by existing shareholders. Each class has exclusive voting rights with respect to matters that affect that class. Class B shares will automatically convert to Class A shares after a holding period of seven years from the initial date of purchase. Investment income, realized and unrealized capital gains and losses, the common expenses of the Fund, and certain fund-level expense reductions, if any, are allocated on a pro-rata basis to each class based on the relative net assets of each class to the total net assets of the Fund. Each class differs with respect to transfer agent and distribution and service plan fees incurred. Certain expense reductions may also differ by class. The Fund's investments in emerging markets can be subject to social, economic, regulatory, and political uncertainties and can be extremely volatile.
2. Investments in Fidelity Central Funds.
The Fund invests in Fidelity Central Funds, which are open-end investment companies available only to other investment companies and accounts managed by Fidelity Management & Research Company (FMR) and its affiliates. The Fund's Schedule of Investments lists each of the Fidelity Central Funds held as of period end, if any, as an investment of the Fund, but does not include the underlying holdings of each Fidelity Central Fund. As an Investing Fund, the Fund indirectly bears its proportionate share of the expenses of the underlying Fidelity Central Funds.
The Money Market Central Funds seek preservation of capital and current income and are managed by Fidelity Investments Money Management, Inc. (FIMM), an affiliate of FMR.
A complete unaudited list of holdings for each Fidelity Central Fund is available upon request or at the Securities and Exchange Commission (the SEC) web site at www.sec.gov. In addition, the financial statements of the Fidelity Central Funds, which are not covered by the Fund's Report of Independent Registered Public Accounting Firm, are available on the SEC web site or upon request.
Annual Report
3. Significant Accounting Policies.
The financial statements have been prepared in conformity with accounting principles generally accepted in the United States of America (GAAP), which require management to make certain estimates and assumptions at the date of the financial statements. Actual results could differ from those estimates. Subsequent events, if any, through the date that the financial statements were issued have been evaluated in the preparation of the financial statements. The following summarizes the significant accounting policies of the Fund:
Security Valuation. Investments are valued as of 4:00 p.m. Eastern time on the last calendar day of the period. The Fund uses independent pricing services approved by the Board of Trustees to value its investments. When current market prices or quotations are not readily available or reliable, valuations may be determined in good faith in accordance with procedures adopted by the Board of Trustees. Factors used in determining value may include market or security specific events. The frequency with which these procedures are used cannot be predicted and they may be utilized to a significant extent. The value used for net asset value (NAV) calculation under these procedures may differ from published prices for the same securities.
The Fund categorizes the inputs to valuation techniques used to value its investments into a disclosure hierarchy consisting of three levels as shown below:
Level 1 - quoted prices in active markets for identical investments
Level 2 - other significant observable inputs (including quoted prices for similar investments, interest rates, prepayment speeds, etc.)
Level 3 - unobservable inputs (including the Fund's own assumptions based on the best information available)
Changes in valuation techniques may result in transfers in or out of an assigned level within the disclosure hierarchy. The aggregate value of investments by input level, as of October 31, 2011, is included at the end of the Fund's Schedule of Investments. Valuation techniques used to value the Fund's investments by major category are as follows:
Equity securities, including restricted securities, for which market quotations are readily available, are valued at the last reported sale price or official closing price as reported by an independent pricing service on the primary market or exchange on which they are traded and are categorized as Level 1 in the hierarchy. In the event there were no sales during the day or closing prices are not available, securities are valued at the last quoted bid price or may be valued using the last available price and are generally categorized as Level 2 in the hierarchy. For foreign equity securities, when significant market or security specific events arise, comparisons to the valuation of American Depositary Receipts (ADRs), futures contracts, Exchange-traded funds (ETFs) and certain indexes as well as
Annual Report
Notes to Financial Statements - continued
3. Significant Accounting Policies - continued
Security Valuation - continued
quoted prices for similar securities are used and are categorized as Level 2 in the hierarchy in these circumstances. Utilizing these techniques may result in transfers between Level 1 and Level 2. For restricted equity securities and private placements where observable inputs are limited, assumptions about market activity and risk are used and are categorized as Level 3 in the hierarchy.
Investments in open-end mutual funds, including the Fidelity Central Funds, are valued at their closing net asset value each business day and are categorized as Level 1 in the hierarchy.
Foreign Currency. The Fund may use foreign currency contracts to facilitate transactions in foreign-denominated securities. Gains and losses from these transactions may arise from changes in the value of the foreign currency or if the counterparties do not perform under the contracts' terms.
Foreign-denominated assets, including investment securities, and liabilities are translated into U.S. dollars at the exchange rate at period end. Purchases and sales of investment securities, income and dividends received and expenses denominated in foreign currencies are translated into U.S. dollars at the exchange rate in effect on the transaction date.
The effects of exchange rate fluctuations on investments are included with the net realized and unrealized gain (loss) on investment securities. Other foreign currency transactions resulting in realized and unrealized gain (loss) are disclosed separately.
Investment Transactions and Income. For financial reporting purposes, the Fund's investment holdings and NAV include trades executed through the end of the last business day of the period. The NAV per share for processing shareholder transactions is calculated as of the close of business of the New York Stock Exchange (NYSE), normally 4:00 p.m. Eastern time and includes trades executed through the end of the prior business day. Gains and losses on securities sold are determined on the basis of identified cost. Dividend income is recorded on the ex-dividend date, except for certain dividends from foreign securities where the ex-dividend date may have passed, which are recorded as soon as the Fund is informed of the ex-dividend date. Non-cash dividends included in dividend income, if any, are recorded at the fair market value of the securities received. Interest income and distributions from the Fidelity Central Funds are accrued as earned. Interest income includes coupon interest and amortization of premium and accretion of discount on debt securities. Investment income is recorded net of foreign taxes withheld where recovery of such taxes is uncertain.
Annual Report
3. Significant Accounting Policies - continued
Expenses. Expenses directly attributable to a fund are charged to that fund. Expenses attributable to more than one fund are allocated among the respective funds on the basis of relative net assets or other appropriate methods. Expense estimates are accrued in the period to which they relate and adjustments are made when actual amounts are known.
Income Tax Information and Distributions to Shareholders. Each year, the Fund intends to qualify as a regulated investment company, including distributing substantially all of its taxable income and realized gains under Subchapter M of the Internal Revenue Code and filing its U.S. federal tax return. As a result, no provision for income taxes is required. As of October 31, 2011, the Fund did not have any unrecognized tax benefits in the financial statements. A fund's federal tax return is subject to examination by the Internal Revenue Service (IRS) for a period of three years. Foreign taxes are provided for based on the Fund's understanding of the tax rules and rates that exist in the foreign markets in which it invests.
Distributions are declared and recorded on the ex-dividend date. Income dividends and capital gain distributions are declared separately for each class. Income and capital gain distributions are determined in accordance with income tax regulations, which may differ from GAAP.
Capital accounts within the financial statements are adjusted for permanent book-tax differences. These adjustments have no impact on net assets or the results of operations. Temporary book-tax differences will reverse in a subsequent period.
Book-tax differences are primarily due to foreign currency transactions, passive foreign investment companies (PFIC), capital loss carryforwards and losses deferred due to wash sales.
The federal tax cost of investment securities and unrealized appreciation (depreciation) as of period end were as follows:
Gross unrealized appreciation | $ 5,442,169 |
Gross unrealized depreciation | (18,195,451) |
Net unrealized appreciation (depreciation) on securities and other investments | $ (12,753,282) |
| |
Tax Cost | $ 184,910,525 |
Annual Report
Notes to Financial Statements - continued
3. Significant Accounting Policies - continued
Income Tax Information and Distributions to Shareholders - continued
The tax-based components of distributable earnings as of period end were as follows:
Undistributed ordinary income | $ 4,796,682 |
Capital loss carryforward | $ (117,406,155) |
Net unrealized appreciation (depreciation) | $ (12,742,762) |
Under the recently enacted Regulated Investment Company Modernization Act of 2010 (the Act), the Fund will be permitted to carry forward capital losses incurred in taxable years beginning after December 22, 2010 for an unlimited period. However, any losses incurred during those future taxable years will be required to be utilized prior to any losses incurred in pre-enactment taxable years, which generally expire after eight years from when they are incurred. Additionally, post-enactment capital losses that are carried forward will retain their character as either short-term or long-term capital losses rather than being considered all short-term as under previous law. The Fund's first fiscal year end subject to the Act will be October 31, 2012.
The tax character of distributions paid was as follows:
| October 31, 2011 | October 31, 2010 |
Ordinary Income | $ 5,152,516 | $ 3,259,286 |
Short-Term Trading (Redemption) Fees. Shares held by investors in the Fund less than 30 days are subject to a redemption fee equal to 1.00% of the net asset value of shares redeemed. All redemption fees, which reduce the proceeds of the shareholder redemption, are retained by the Fund and accounted for as an addition to paid in capital.
New Accounting Pronouncement. In May 2011, the Financial Accounting Standards Board issued Accounting Standard Update No. 2011-04, Fair Value Measurement (Topic 820) - Amendments to Achieve Common Fair Value Measurement and Disclosure Requirements in U.S. GAAP and IFRSs. The update changes the wording used to describe the requirements in GAAP for measuring fair value and for disclosing information about fair value measurements. The update is effective during interim and annual periods beginning after December 15, 2011. Management is currently evaluating the impact of the update's adoption on the Fund's financial statement disclosures.
4. Purchases and Sales of Investments.
Purchases and sales of securities, other than short-term securities, aggregated $179,038,500 and $159,238,201, respectively.
Annual Report
5. Fees and Other Transactions with Affiliates.
Management Fee. FMR and its affiliates provide the Fund with investment management related services for which the Fund pays a monthly management fee. The management fee is the sum of an individual fund fee rate that is based on an annual rate of .45% of the Fund's average net assets and a group fee rate that averaged .26% during the period. The group fee rate is based upon the average net assets of all the mutual funds advised by FMR. The group fee rate decreases as assets under management increase and increases as assets under management decrease. In addition, the management fee is subject to a performance adjustment (up to a maximum of +/- .20% of the Fund's average net assets over a 36 month performance period). The upward or downward adjustment to the management fee is based on relative investment performance of International Value as compared to an appropriate benchmark index. For the period, the total annual management fee rate, including the performance adjustment, was .64% of the Fund's average net assets.
Distribution and Service Plan Fees. In accordance with Rule 12b-1 of the 1940 Act, the Fund has adopted separate Distribution and Service Plans for each class of shares. Certain classes pay Fidelity Distributors Corporation (FDC), an affiliate of FMR, separate Distribution and Service Fees, each of which is based on an annual percentage of each class' average net assets. In addition, FDC may pay financial intermediaries for selling shares of the Fund and providing shareholder support services. For the period, the Distribution and Service Fee rates, total fees and amounts retained by FDC were as follows:
| Distribution
Fee | Service
Fee | Total Fees | Retained
by FDC |
Class A | -% | .25% | $ 12,861 | $ 112 |
Class T | .25% | .25% | 14,090 | - |
Class B | .75% | .25% | 11,042 | 8,286 |
Class C | .75% | .25% | 22,443 | 5,109 |
| | | $ 60,436 | $ 13,507 |
Sales Load. FDC may receive a front-end sales charge of up to 5.75% for selling Class A shares, and 3.50% for selling Class T shares, some of which is paid to financial intermediaries for selling shares of the Fund. Depending on the holding period, FDC may receive contingent deferred sales charges levied on Class A, Class T, Class B, and Class C redemptions. The deferred sales charges range from 5% to 1% for Class B, 1% for Class C, 1.00% for certain purchases of Class A shares and .25% for certain purchases of Class T shares.
Annual Report
Notes to Financial Statements - continued
5. Fees and Other Transactions with Affiliates - continued
Sales Load - continued
For the period, sales charge amounts retained by FDC were as follows:
| Retained
by FDC |
Class A | $ 5,585 |
Class T | 1,051 |
Class B* | 2,211 |
Class C* | 426 |
| $ 9,273 |
* When Class B and Class C shares are initially sold, FDC pays commissions from its own resources to financial intermediaries through which the sales are made.
Transfer Agent Fees. Fidelity Investments Institutional Operations Company, Inc. (FIIOC), an affiliate of FMR, is the transfer, dividend disbursing and shareholder servicing agent for each class of the Fund. FIIOC receives account fees and asset-based fees that vary according to the account size and type of account of the shareholders of the respective classes of the Fund. FIIOC pays for typesetting, printing and mailing of shareholder reports, except proxy statements. For the period, transfer agent fees for each class were as follows:
| Amount | % of
Average
Net Assets |
Class A | $ 15,549 | .30 |
Class T | 9,051 | .32 |
Class B | 3,337 | .30 |
Class C | 6,816 | .30 |
International Value | 416,398 | .23 |
Institutional Class | 834 | .17 |
| $ 451,985 | |
Accounting and Security Lending Fees. Fidelity Service Company, Inc. (FSC), an affiliate of FMR, maintains the Fund's accounting records. The accounting fee is based on the level of average net assets for the month. Under a separate contract, FSC administers the security lending program. The security lending fee is based on the number and duration of lending transactions.
Brokerage Commissions. The Fund placed a portion of its portfolio transactions with brokerage firms which are affiliates of the investment adviser. The commissions paid to these affiliated firms were $763 for the period.
Annual Report
5. Fees and Other Transactions with Affiliates - continued
Interfund Lending Program. Pursuant to an Exemptive Order issued by the SEC, the Fund, along with other registered investment companies having management contracts with FMR, may participate in an interfund lending program. This program provides an alternative credit facility allowing the funds to borrow from, or lend money to, other participating affiliated funds. At period end, there were no interfund loans outstanding. The Fund's activity in this program during the period for which loans were outstanding was as follows:
Borrower or Lender | Average Daily
Loan Balance | Weighted Average Interest Rate | Interest
Expense |
Borrower | $ 3,563,727 | .35% | $ 381 |
6. Committed Line of Credit.
The Fund participates with other funds managed by FMR or an affiliate in a $4.0 billion credit facility (the "line of credit") to be utilized for temporary or emergency purposes to fund shareholder redemptions or for other short-term liquidity purposes. The Fund has agreed to pay commitment fees on its pro-rata portion of the line of credit, which amounted to $590 and is reflected in Miscellaneous expenses on the Statement of Operations. During the period, there were no borrowings on this line of credit.
7. Security Lending.
The Fund lends portfolio securities through a lending agent from time to time in order to earn additional income. For equity securities, a lending agent is used and may loan securities to certain qualified borrowers, including Fidelity Capital Markets (FCM), a broker-dealer affiliated with the Fund. On the settlement date of the loan, the Fund receives collateral (in the form of U.S. Treasury obligations, letters of credit and/or cash) against the loaned securities and maintains collateral in an amount not less than 100% of the market value of the loaned securities during the period of the loan. The market value of the loaned securities is determined at the close of business of the Fund and any additional required collateral is delivered to the Fund on the next business day. If the borrower defaults on its obligation to return the securities loaned because of insolvency or other reasons, a fund could experience delays and costs in recovering the securities loaned or in gaining access to the collateral. Any cash collateral received is invested in the Fidelity Securities Lending Cash Central Fund. The value of loaned securities and cash collateral at period end are disclosed on the Fund's Statement of Assets and Liabilities. Security lending income represents the income earned on investing cash collateral, less rebates paid to borrowers and any lending agent fees associated with the loan, plus any premium payments received for lending certain types of securities. Security lending income is presented in the Statement of Operations as a component of income from
Annual Report
Notes to Financial Statements - continued
7. Security Lending - continued
Fidelity Central Funds. Total security lending income during the period amounted to $221,316. During the period, there were no securities loaned to FCM.
8. Expense Reductions.
FMR voluntarily agreed to reimburse a portion of its management fee. For the period, the amount of this reimbursement was $14,939.
Many of the brokers with whom FMR places trades on behalf of the Fund provided services in addition to trade execution. These services included payments of certain expenses on behalf of the Fund totaling $38,767 for the period.
9. Distributions to Shareholders.
Distributions to shareholders of each class were as follows:
Years ended October 31, | 2011 | 2010 |
From net investment income | | |
Class A | $ 109,917 | $ 64,929 |
Class T | 48,265 | 27,801 |
Class B | 18,831 | 8,869 |
Class C | 34,950 | 14,357 |
International Value | 4,218,039 | 3,006,248 |
Institutional Class | 11,933 | 13,553 |
Total | $ 4,441,935 | $ 3,135,757 |
From net realized gain | | |
Class A | $ 19,461 | $ 2,899 |
Class T | 9,435 | 1,544 |
Class B | 4,893 | 715 |
Class C | 8,796 | 1,354 |
International Value | 666,153 | 116,522 |
Institutional Class | 1,843 | 495 |
Total | $ 710,581 | $ 123,529 |
Annual Report
10. Share Transactions.
Transactions for each class of shares were as follows:
| Shares | Dollars |
Years ended October 31, | 2011 | 2010 | 2011 | 2010 |
Class A | | | | |
Shares sold | 297,051 | 216,581 | $ 2,472,449 | $ 1,676,019 |
Reinvestment of distributions | 14,168 | 7,621 | 113,424 | 61,732 |
Shares redeemed | (217,894) | (227,521) | (1,776,674) | (1,766,121) |
Net increase (decrease) | 93,325 | (3,319) | $ 809,199 | $ (28,370) |
Class T | | | | |
Shares sold | 184,684 | 82,344 | $ 1,564,957 | $ 635,080 |
Reinvestment of distributions | 7,104 | 3,507 | 56,884 | 28,408 |
Shares redeemed | (116,856) | (118,025) | (949,653) | (899,018) |
Net increase (decrease) | 74,932 | (32,174) | $ 672,188 | $ (235,530) |
Class B | | | | |
Shares sold | 10,615 | 44,963 | $ 84,177 | $ 346,949 |
Reinvestment of distributions | 2,474 | 980 | 19,918 | 7,981 |
Shares redeemed | (32,689) | (36,625) | (270,345) | (286,374) |
Net increase (decrease) | (19,600) | 9,318 | $ (166,250) | $ 68,556 |
Class C | | | | |
Shares sold | 94,118 | 56,757 | $ 764,274 | $ 434,910 |
Reinvestment of distributions | 4,468 | 1,540 | 35,965 | 12,532 |
Shares redeemed | (56,323) | (72,014) | (453,389) | (560,469) |
Net increase (decrease) | 42,263 | (13,717) | $ 346,850 | $ (113,027) |
International Value | | | | |
Shares sold | 9,000,450 | 3,662,730 | $ 76,813,955 | $ 28,403,948 |
Reinvestment of distributions | 587,427 | 369,795 | 4,695,920 | 2,987,943 |
Shares redeemed | (7,927,908) | (7,496,748) | (64,758,392) | (57,917,334) |
Net increase (decrease) | 1,659,969 | (3,464,223) | $ 16,751,483 | $ (26,525,443) |
Institutional Class | | | | |
Shares sold | 19,868 | 16,581 | $ 168,608 | $ 128,469 |
Reinvestment of distributions | 395 | 185 | 3,160 | 1,498 |
Shares redeemed | (16,071) | (58,573) | (130,995) | (468,362) |
Net increase (decrease) | 4,192 | (41,807) | $ 40,773 | $ (338,395) |
Annual Report
Notes to Financial Statements - continued
11. Other.
The Fund's organizational documents provide former and current trustees and officers with a limited indemnification against liabilities arising in connection with the performance of their duties to the Fund. In the normal course of business, the Fund may also enter into contracts that provide general indemnifications. The Fund's maximum exposure under these arrangements is unknown as this would be dependent on future claims that may be made against the Fund. The risk of material loss from such claims is considered remote.
At the end of the period, Strategic Advisers International II Fund and VIP FundsManager 60% Portfolio were owners of record of approximately 19% and 18%, respectively, of the total outstanding shares of the Fund.
The VIP FundsManager Portfolios were owners of record, in the aggregate, of approximately 26% of the total outstanding shares of the Fund.
Annual Report
To the Trustees of Fidelity Investment Trust and Shareholders of Fidelity International Value Fund:
We have audited the accompanying statement of assets and liabilities of Fidelity International Value Fund (the Fund), a fund of Fidelity Investment Trust, including the schedule of investments, as of October 31, 2011, and the related statement of operations for the year then ended, the statement of changes in net assets for each of the two years in the period then ended, and the financial highlights for each of the five years in the period then ended. These financial statements and financial highlights are the responsibility of the Fund's management. Our responsibility is to express an opinion on these financial statements and financial highlights based on our audits.
We conducted our audits in accordance with the standards of the Public Company Accounting Oversight Board (United States). Those standards require that we plan and perform the audit to obtain reasonable assurance about whether the financial statements and financial highlights are free of material misstatement. The Fund is not required to have, nor were we engaged to perform, an audit of its internal control over financial reporting. Our audits included consideration of internal control over financial reporting as a basis for designing audit procedures that are appropriate in the circumstances, but not for the purpose of expressing an opinion on the effectiveness of the Fund's internal control over financial reporting. Accordingly, we express no such opinion. An audit also includes examining, on a test basis, evidence supporting the amounts and disclosures in the financial statements, assessing the accounting principles used and significant estimates made by management, as well as evaluating the overall financial statement presentation. Our procedures included confirmation of securities owned as of October 31, 2011, by correspondence with the custodians and brokers; where replies were not received from brokers, we performed other auditing procedures. We believe that our audits provide a reasonable basis for our opinion.
In our opinion, the financial statements and financial highlights referred to above present fairly, in all material respects, the financial position of Fidelity International Value Fund as of October 31, 2011, the results of its operations for the year then ended, the changes in its net assets for each of the two years in the period then ended, and the financial highlights for each of the five years in the period then ended, in conformity with accounting principles generally accepted in the United States of America.
DELOITTE & TOUCHE LLP
Boston, Massachusetts
December 15, 2011
Annual Report
The Trustees, Members of the Advisory Board, and executive officers of the trust and fund, as applicable, are listed below. The Board of Trustees governs the fund and is responsible for protecting the interests of shareholders. The Trustees are experienced executives who meet periodically throughout the year to oversee the fund's activities, review contractual arrangements with companies that provide services to the fund, oversee management of the risks associated with such activities and contractual arrangements, and review the fund's performance. Except for James C. Curvey, each of the Trustees oversees 226 funds advised by FMR or an affiliate. Mr. Curvey oversees 429 funds advised by FMR or an affiliate.
The Trustees hold office without limit in time except that (a) any Trustee may resign; (b) any Trustee may be removed by written instrument, signed by at least two-thirds of the number of Trustees prior to such removal; (c) any Trustee who requests to be retired or who has become incapacitated by illness or injury may be retired by written instrument signed by a majority of the other Trustees; and (d) any Trustee may be removed at any special meeting of shareholders by a two-thirds vote of the outstanding voting securities of the trust. Each Trustee who is not an interested person (as defined in the 1940 Act) (Independent Trustee), shall retire not later than the last day of the calendar year in which his or her 75th birthday occurs. The Independent Trustees may waive this mandatory retirement age policy with respect to individual Trustees. The executive officers and Advisory Board Members hold office without limit in time, except that any officer and Advisory Board Member may resign or may be removed by a vote of a majority of the Trustees at any regular meeting or any special meeting of the Trustees. Except as indicated, each individual has held the office shown or other offices in the same company for the past five years.
Experience, Skills, Attributes, and Qualifications of the Fund's Trustees. The Governance and Nominating Committee has adopted a statement of policy that describes the experience, qualifications, attributes, and skills that are necessary and desirable for potential Independent Trustee candidates (Statement of Policy). The Board believes that each Trustee satisfied at the time he or she was initially elected or appointed a Trustee, and continues to satisfy, the standards contemplated by the Statement of Policy. The Governance and Nominating Committee also engages professional search firms to help identify potential Independent Trustee candidates who have the experience, qualifications, attributes, and skills consistent with the Statement of Policy. From time to time, additional criteria based on the composition and skills of the current Independent Trustees, as well as experience or skills that may be appropriate in light of future changes to board composition, business conditions, and regulatory or other developments, have also been considered by the professional search firms and the Governance and Nominating Committee. In addition, the Board takes into account the Trustees' commitment and participation in Board and committee meetings, as well as their leadership of standing and ad hoc committees throughout their tenure.
In determining that a particular Trustee was and continues to be qualified to serve as a Trustee, the Board has considered a variety of criteria, none of which, in isolation, was controlling. The Board believes that, collectively, the Trustees have balanced and diverse experience, qualifications, attributes, and skills, which allow the Board to operate effectively in governing the fund and protecting the interests of shareholders. Information about the specific experience, skills, attributes, and qualifications of each Trustee, which in each case led to the Board's conclusion that the Trustee should serve (or continue to serve) as a trustee of the fund, is provided below.
Annual Report
Trustees and Officers - continued
Board Structure and Oversight Function. James C. Curvey is an interested person (as defined in the 1940 Act) and currently serves as Acting Chairman. The Trustees have determined that an interested Chairman is appropriate and benefits shareholders because an interested Chairman has a personal and professional stake in the quality and continuity of services provided to the fund. Independent Trustees exercise their informed business judgment to appoint an individual of their choosing to serve as Chairman, regardless of whether the Trustee happens to be independent or a member of management. The Independent Trustees have determined that they can act independently and effectively without having an Independent Trustee serve as Chairman and that a key structural component for assuring that they are in a position to do so is for the Independent Trustees to constitute a substantial majority for the Board. The Independent Trustees also regularly meet in executive session. Ned C. Lautenbach serves as Chairman of the Independent Trustees and as such (i) acts as a liaison between the Independent Trustees and management with respect to matters important to the Independent Trustees and (ii) with management prepares agendas for Board meetings.
Fidelity funds are overseen by different Boards of Trustees. The fund's Board oversees Fidelity's equity and high income funds and another Board oversees Fidelity's investment-grade bond, money market, and asset allocation funds. The asset allocation funds may invest in Fidelity funds overseen by the fund's Board. The use of separate Boards, each with its own committee structure, allows the Trustees of each group of Fidelity funds to focus on the unique issues of the funds they oversee, including common research, investment, and operational issues. On occasion, the separate Boards establish joint committees to address issues of overlapping consequences for the Fidelity funds overseen by each Board.
The Trustees operate using a system of committees to facilitate the timely and efficient consideration of all matters of importance to the Trustees, the fund, and fund shareholders and to facilitate compliance with legal and regulatory requirements and oversight of the fund's activities and associated risks. The Board, acting through its committees, has charged FMR and its affiliates with (i) identifying events or circumstances the occurrence of which could have demonstrably adverse effects on the fund's business and/or reputation; (ii) implementing processes and controls to lessen the possibility that such events or circumstances occur or to mitigate the effects of such events or circumstances if they do occur; and (iii) creating and maintaining a system designed to evaluate continuously business and market conditions in order to facilitate the identification and implementation processes described in (i) and (ii) above. Because the day-to-day operations and activities of the fund are carried out by or through FMR, its affiliates and other service providers, the fund's exposure to risks is mitigated but not eliminated by the processes overseen by the Trustees. While each of the Board's committees has responsibility for overseeing different aspects of the fund's activities, oversight is exercised primarily through the Operations, Audit, and Compliance Committees. In addition, the Independent Trustees have worked with FMR to enhance the Board's oversight of investment and financial risks, legal and regulatory risks, technology risks, and operational risks, including the development of additional risk reporting to the Board. For example, a working group comprised of Independent Trustees and FMR has worked and continues to work to review the Fidelity funds' valuation-related activities, reporting and risk management. Appropriate personnel, including but not limited to the fund's Chief Compliance Officer (CCO), FMR's internal auditor, the independent accountants, the fund's Treasurer and portfolio management personnel, make periodic reports to the Board's committees, as appropriate, including an annual review of FMR's risk management program for the Fidelity funds. The responsibilities of each standing committee, including their oversight responsibilities, are described further under "Standing Committees of the Fund's Trustees."
Annual Report
The fund's Statement of Additional Information (SAI) includes more information about the Trustees. To request a free copy, call Fidelity at 1-877-208-0098.
Interested Trustees*:
Correspondence intended for each Trustee who is an interested person may be sent to Fidelity Investments, 82 Devonshire Street, Boston, Massachusetts 02109.
Name, Age; Principal Occupations and Other Relevant Experience+ |
James C. Curvey (76) |
| Year of Election or Appointment: 2007 Mr. Curvey is Trustee and Acting Chairman of the Board of Trustees of certain Trusts. Mr. Curvey also serves as Trustee (2007-present) of other investment companies advised by FMR. Mr. Curvey is a Director of Fidelity Investments Money Management, Inc. (2009-present), Director of Fidelity Research & Analysis Co. (2009-present) and Director of FMR and FMR Co., Inc. (2007-present). Mr. Curvey is also Vice Chairman (2007-present) and Director of FMR LLC. In addition, Mr. Curvey serves as an Overseer for the Boston Symphony Orchestra and a member of the Trustees of Villanova University. Previously, Mr. Curvey was the Vice Chairman (2006-2007) and Director (2000-2007) of FMR Corp. |
Ronald P. O'Hanley (54) |
| Year of Election or Appointment: 2011 Mr. O'Hanley is Director of FMR Co., Inc. (2010-present), Director of Fidelity Investments Money Management, Inc. (2010-present), Director of Fidelity Research & Analysis Company (2010-present), President of Fidelity Asset Management and Corporate Services and a member of Fidelity's Executive Committee (2010-present). Previously, Mr. O'Hanley served as President and Chief Executive Officer of BNY Mellon Asset Management (2007-2010). Mr. O'Hanley also served as Vice Chairman of Bank New York Mellon Corp. and a member of that firm's Executive Committee. Prior to the 2007 merger of The Bank of New York and Mellon Financial Corporation, he was Vice Chairman of Mellon Financial Corporation and President and Chief Executive Officer of Mellon Asset Management. He joined Mellon in February 1997. Mr. O'Hanley currently serves as Chairman of the Boston Public Library Foundation Board of Directors and sits on the Board of Directors of Beth Israel Deaconess Medical Center, the Board of Trustees of the Marine Biological Laboratory and the Advisory Board of the Maxwell School of Citizenship and Public Administration at Syracuse University. Mr. O'Hanley also chairs the Council on Asset Management for the Financial Services Roundtable and is a member of the Board of Directors of Institutional Investor's U.S. Institute. |
* Trustees have been determined to be "Interested Trustees" by virtue of, among other things, their affiliation with the trust or various entities under common control with FMR.
+ The information above includes each Trustee's principal occupation during the last five years and other information relating to the experience, attributes, and skills relevant to each Trustee's qualifications to serve as a Trustee, which led to the conclusion that each Trustee should serve as a Trustee for the fund.
Annual Report
Independent Trustees:
Correspondence intended for each Independent Trustee (that is, the Trustees other than the Interested Trustees) may be sent to Fidelity Investments, P.O. Box 55235, Boston, Massachusetts 02205-5235.
Name, Age; Principal Occupations and Other Relevant Experience+ |
Dennis J. Dirks (63) |
| Year of Election or Appointment: 2005 Prior to his retirement in May 2003, Mr. Dirks was Chief Operating Officer and a member of the Board of The Depository Trust & Clearing Corporation (DTCC). He also served as President, Chief Operating Officer, and Board member of The Depository Trust Company (DTC) and President and Board member of the National Securities Clearing Corporation (NSCC). In addition, Mr. Dirks served as Chief Executive Officer and Board member of the Government Securities Clearing Corporation, Chief Executive Officer and Board member of the Mortgage-Backed Securities Clearing Corporation, as a Trustee and a member of the Finance Committee of Manhattan College (2005-2008), and as a Trustee and a member of the Finance Committee of AHRC of Nassau County (2006-2008). Mr. Dirks is a member of the Independent Directors Council (IDC) Governing Council (2010-Present) and Board of Directors for The Brookville Center for Children's Services, Inc. (2009-present). |
Alan J. Lacy (58) |
| Year of Election or Appointment: 2008 Mr. Lacy serves as Senior Adviser (2007-present) of Oak Hill Capital Partners, L.P. (private equity). Mr. Lacy also served as Chief Executive Officer (2000-2005) and Vice Chairman (2005-2006) of Sears Holdings Corporation and Sears, Roebuck and Co. (retail). In addition, Mr. Lacy serves as a member of the Board of Directors of Dave & Buster's, Inc. (restaurant and entertainment complexes, 2010-present), The Hillman Companies, Inc. (hardware wholesalers, 2010-present), and Bristol-Myers Squibb Company (global pharmaceuticals, 2007-present). Mr. Lacy is a member of the Board of Trustees of The National Parks Conservation Association (2006-Present). Previously, Mr. Lacy served as Chairman of the Board of Trustees of the National Parks Conservation Association (2008-2011) and as a member of the Board of Directors for the Western Union Company (global money transfer, 2006-2011). |
Ned C. Lautenbach (67) |
| Year of Election or Appointment: 2000 Mr. Lautenbach is Chairman of the Independent Trustees of the Equity and High Income Funds (2006-present). Mr. Lautenbach currently serves as the Lead Director of the Eaton Corporation Board of Directors (diversified industrial, 1997-present). Mr. Lautenbach is also a member of the Board of Directors of the Philharmonic Center for the Arts in Naples, Florida (1999-present); a member of the Board of Trustees of Fairfield University (2005-present); and a member of the Council on Foreign Relations (1994-present). Previously, Mr. Lautenbach was a Partner/Advisory Partner at Clayton, Dubilier & Rice, LLC (private equity investment, 1998-2010), as well as a Director of Sony Corporation (2006-2007). |
Joseph Mauriello (67) |
| Year of Election or Appointment: 2008 Prior to his retirement in January 2006, Mr. Mauriello served in numerous senior management positions including Deputy Chairman and Chief Operating Officer (2004-2005), and Vice Chairman of Financial Services (2002-2004) of KPMG LLP US (professional services, 1965-2005). Mr. Mauriello currently serves as a member of the Board of Directors of XL Group plc. (global insurance and re-insurance, 2006-present) and of Arcadia Resources Inc. (health care services and products, 2007-present). Previously, Mr. Mauriello served as a Director of the Hamilton Funds of the Bank of New York (2006-2007). |
Robert W. Selander (61) |
| Year of Election or Appointment: 2011 Previously, Mr. Selander served as a Member of the Advisory Board of Fidelity's Equity and High Income Funds (2011), Executive Vice Chairman (2010), Chief Executive Officer (2009-2010), and President and Chief Executive Officer (1997-2009) of Mastercard, Inc. |
Cornelia M. Small (67) |
| Year of Election or Appointment: 2005 Ms. Small is a member of the Board of Directors of the Teagle Foundation (2009-present). Ms. Small is also a member of the Investment Committee, and Chair (2008-present) and a member of the Board of Trustees of Smith College. In addition, Ms. Small serves on the Investment Committee of the Berkshire Taconic Community Foundation (2008-present). Previously, Ms. Small served as Chairperson of the Investment Committee (2002-2008) of Smith College. In addition, Ms. Small served as Chief Investment Officer, Director of Global Equity Investments, and a member of the Board of Directors of Scudder, Stevens & Clark and Scudder Kemper Investments. |
William S. Stavropoulos (72) |
| Year of Election or Appointment: 2001 Mr. Stavropoulos is Vice Chairman of the Independent Trustees of the Equity and High Income Funds (2006-present). Mr. Stavropoulos serves as President and Founder of the Michigan Baseball Foundation, the Great Lakes Loons (2007-present). Mr. Stavropoulos is Chairman Emeritus of the Board of Directors of The Dow Chemical Company, where he previously served in numerous senior management positions, including President, CEO (1995-2000; 2002-2004), Chairman of the Executive Committee (2000-2006), and as a member of the Board of Directors (1990-2006). Currently, Mr. Stavropoulos is Chairman of Univar (global distributor of commodity and specialty chemicals, 2010-present), a Director of Teradata Corporation (data warehousing and technology solutions, 2008-present), Chemical Financial Corporation, Maersk Inc. (industrial conglomerate), Tyco International, Inc. (multinational manufacturing and services, 2007-present), and a member of the Advisory Board for Metalmark Capital (private equity investment, 2005-present). Mr. Stavropoulos is a special advisor to Clayton, Dubilier & Rice, LLC (private equity investment). In addition, Mr. Stavropoulos is a member of the University of Notre Dame Advisory Council for the College of Science. |
David M. Thomas (62) |
| Year of Election or Appointment: 2008 Previously, Mr. Thomas served as Executive Chairman (2005-2006) and Chairman and Chief Executive Officer (2000-2005) of IMS Health, Inc. (pharmaceutical and healthcare information solutions). In addition, Mr. Thomas serves as a member of the Board of Directors of Fortune Brands, Inc. (consumer products), and Interpublic Group of Companies, Inc. (marketing communication, 2004-present). |
Michael E. Wiley (61) |
| Year of Election or Appointment: 2008 Mr. Wiley also serves as a Director of Asia Pacific Exploration Consolidated (international oil and gas exploration and production, 2008-present). Mr. Wiley serves as a Director of Tesoro Corporation (independent oil refiner and marketer, 2005-present), and a Director of Bill Barrett Corporation (exploration and production, 2005-present). In addition, Mr. Wiley also serves as a Director of Post Oak Bank (privately-held bank, 2004-present). Previously, Mr. Wiley served as a member of the Board of Trustees of the University of Tulsa (2000-2006; 2007-2010), as a Senior Energy Advisor of Katzenbach Partners, LLC (consulting, 2006-2007), as an Advisory Director of Riverstone Holdings (private investment), Chairman, President, and CEO of Baker Hughes, Inc. (oilfield services, 2000-2004), and as Director of Spinnaker Exploration Company (exploration and production, 2001-2005). |
Annual Report
Trustees and Officers - continued
+ The information above includes each Trustee's principal occupation during the last five years and other information relating to the experience, attributes, and skills relevant to each Trustee's qualifications to serve as a Trustee, which led to the conclusion that each Trustee should serve as a Trustee for the fund.
Advisory Board Members and Executive Officers:
Correspondence intended for each executive officer, Edward C. Johnson 3d, and Peter S. Lynch may be sent to Fidelity Investments, 82 Devonshire Street, Boston, Massachusetts 02109.
Name, Age; Principal Occupation |
Edward C. Johnson 3d (81) |
| Year of Election or Appointment: 2011 Member of the Advisory Board of Fidelity's Equity and High Income Funds. Mr. Johnson serves as Chief Executive Officer, Chairman, and a Director of FMR LLC, and also serves as Chairman and Director of FIL Limited. Previously, Mr. Johnson served as a Trustee and Chairman of the Board of certain Fidelity Trusts, Chairman and a Director of FMR, Chairman and a Director of FMR Co., Inc., and President of FMR LLC (2006-2007). |
Peter S. Lynch (67) |
| Year of Election or Appointment: 2003 Member of the Advisory Board of Fidelity's Equity and High Income Funds. Mr. Lynch is Vice Chairman and a Director of FMR and FMR Co., Inc. In addition, Mr. Lynch serves as a Trustee of Boston College and as the Chairman of the Inner-City Scholarship Fund. Previously, Mr. Lynch served on the Special Olympics International Board of Directors (1997-2006). |
Kenneth B. Robins (42) |
| Year of Election or Appointment: 2008 President and Treasurer of Fidelity's Equity and High Income Funds. Mr. Robins also serves as President and Treasurer (2010-present) and Assistant Treasurer (2009-present) of other Fidelity funds and is an employee of Fidelity Investments (2004-present). Previously, Mr. Robins served as Deputy Treasurer of the Fidelity funds (2005-2008) and Treasurer and Chief Financial Officer of The North Carolina Capital Management Trust: Cash and Term Portfolios (2006-2008). |
Brian B. Hogan (47) |
| Year of Election or Appointment: 2009 Vice President of Equity and High Income Funds. Mr. Hogan also serves as President of FMR's Equity Division (2009-present). Previously, Mr. Hogan served as Senior Vice President, Equity Research of FMR (2006-2009) and as a portfolio manager. |
Thomas C. Hense (47) |
| Year of Election or Appointment: 2008 or 2010 Vice President of Fidelity's High Income (2008), Small Cap (2008), and Value (2010) Funds. Previously, Mr. Hense served as a portfolio manager for Fidelity's Institutional Money Management Group (Pyramis) (2003-2008). |
Scott C. Goebel (43) |
| Year of Election or Appointment: 2008 Secretary and Chief Legal Officer (CLO) of the Fidelity funds. Mr. Goebel also serves as Secretary of Fidelity Investments Money Management, Inc. (FIMM) (2010-present) and Fidelity Research and Analysis Company (FRAC) (2010-present); Secretary and CLO of The North Carolina Capital Management Trust: Cash and Term Portfolios (2008-present); General Counsel, Secretary, and Senior Vice President of FMR (2008-present) and FMR Co., Inc. (2008-present); employed by FMR LLC or an affiliate (2001-present); Chief Legal Officer of Fidelity Management & Research (Hong Kong) Limited (2008-present) and Assistant Secretary of Fidelity Management & Research (Japan) Inc. (2008-present), and Fidelity Management & Research (U.K.) Inc. (2008-present). Previously, Mr. Goebel served as Assistant Secretary of FIMM (2008-2010), FRAC (2008-2010), and the Funds (2007-2008) and as Vice President and Secretary of Fidelity Distributors Corporation (FDC) (2005-2007). |
William C. Coffey (42) |
| Year of Election or Appointment: 2009 Assistant Secretary of Fidelity's Equity and High Income Funds. Mr. Coffey also serves as Senior Vice President and Deputy General Counsel of FMR LLC (2010-present), and is an employee of Fidelity Investments. Previously, Mr. Coffey served as Vice President and Associate General Counsel of FMR LLC (2005-2009). |
Holly C. Laurent (57) |
| Year of Election or Appointment: 2008 Anti-Money Laundering (AML) Officer of the Fidelity funds. Ms. Laurent also serves as AML Officer of The North Carolina Capital Management Trust: Cash and Term Portfolios (2008-present) and is an employee of Fidelity Investments. Previously, Ms. Laurent was Senior Vice President and Head of Legal for Fidelity Business Services India Pvt. Ltd. (2006-2008), and Senior Vice President, Deputy General Counsel and Group Head for FMR LLC (2005-2006). |
Christine Reynolds (53) |
| Year of Election or Appointment: 2008 Chief Financial Officer of the Fidelity funds. Ms. Reynolds became President of Fidelity Pricing and Cash Management Services (FPCMS) in August 2008. Ms. Reynolds served as Chief Operating Officer of FPCMS (2007-2008). Previously, Ms. Reynolds served as President, Treasurer, and Anti-Money Laundering officer of the Fidelity funds (2004-2007). |
Kenneth A. Rathgeber (64) |
| Year of Election or Appointment: 2004 Chief Compliance Officer of Fidelity's Equity and High Income Funds. Mr. Rathgeber is Chief Compliance Officer of Fidelity Management & Research (Hong Kong) Limited (2008-present), Fidelity Management & Research (Japan) Inc. (2008-present), FMR (2005-present), FMR Co., Inc. (2005-present), Fidelity Management & Research (U.K.) Inc. (2005-present), Fidelity Research & Analysis Company (2005-present), Fidelity Investments Money Management, Inc. (2005-present), Pyramis Global Advisors, LLC (2005-present), and Strategic Advisers, Inc. (2005-present). |
Jeffrey S. Christian (50) |
| Year of Election or Appointment: 2009 Deputy Treasurer of the Fidelity funds. Mr. Christian is an employee of Fidelity Investments. Previously, Mr. Christian served as Chief Financial Officer (2008-2009) of certain Fidelity funds and Senior Vice President of Fidelity Pricing and Cash Management Services (FPCMS) (2004-2009). |
Joseph F. Zambello (54) |
| Year of Election or Appointment: 2011 Deputy Treasurer of the Fidelity funds. Mr. Zambello is an employee of Fidelity Investments. Previously, Mr. Zambello served as Vice President of FMR's Program Management Group (2009-2011) and Vice President of the Transfer Agent Oversight Group (2005-2009). |
Adrien E. Deberghes (44) |
| Year of Election or Appointment: 2008 Deputy Treasurer of Fidelity's Equity and High Income Funds. Mr. Deberghes also serves as Vice President and Assistant Treasurer of Fidelity Rutland Square Trust II and Fidelity Commonwealth Trust II (2011-present), Assistant Treasurer of other Fidelity funds (2010-present), and is an employee of Fidelity Investments (2008-present). Previously, Mr. Deberghes served as Senior Vice President of Mutual Fund Administration at State Street Corporation (2007-2008), Senior Director of Mutual Fund Administration at Investors Bank & Trust (2005-2007), and Director of Finance for Dunkin' Brands (2000-2005). |
Stephanie J. Dorsey (42) |
| Year of Election or Appointment: 2010 Assistant Treasurer of Fidelity's Equity and High Income Funds. Ms. Dorsey also serves as Deputy Treasurer of other Fidelity funds (2008-present) and is an employee of Fidelity Investments (2008-present). Previously, Ms. Dorsey served as Treasurer (2004-2008) of the JPMorgan Mutual Funds and Vice President (2004-2008) of JPMorgan Chase Bank. |
John R. Hebble (53) |
| Year of Election or Appointment: 2009 Assistant Treasurer of Fidelity's Equity and High Income Funds. Mr. Hebble also serves as President (2011-present), Treasurer, and Chief Financial Officer of The North Carolina Capital Management Trust: Cash and Term Portfolios (2008-present), President and Treasurer of other Fidelity funds (2008-present) and is an employee of Fidelity Investments. |
Gary W. Ryan (53) |
| Year of Election or Appointment: 2005 Assistant Treasurer of the Fidelity funds. Mr. Ryan is an employee of Fidelity Investments. Previously, Mr. Ryan served as Vice President of Fund Reporting in Fidelity Pricing and Cash Management Services (FPCMS) (1999-2005). |
Jonathan Davis (43) |
| Year of Election or Appointment: 2010 Assistant Treasurer of the Fidelity funds. Mr. Davis is also Assistant Treasurer of Fidelity Rutland Square Trust II and Fidelity Commonwealth Trust II. Mr. Davis is an employee of Fidelity Investments. Previously, Mr. Davis served as Vice President and Associate General Counsel of FMR LLC (2003-2010). |
Annual Report
A percentage of the dividends distributed during the fiscal year for the following fund may be taken into account as a dividend for the purpose of the maximum rate under section 1(h)(11) of the Internal Revenue Code.
| December 3, 2010 | December 30, 2010 |
Institutional Class | 64% | 78% |
The amounts per share which represent income derived from sources within, and taxes paid to, foreign countries or possessions of the United States are as follows:
| Pay Date | Income | Taxes |
Institutional Class | 12/06/2010 | $0.182 | $0.011 |
Institutional Class | 12/31/2010 | $0.021 | $0.000 |
The fund will notify shareholders in January 2012 of amounts for use in preparing 2011 income tax returns.
Annual Report
Board Approval of Investment Advisory Contracts and Management Fees
Fidelity International Value Fund
Each year, the Board of Trustees, including the Independent Trustees (together, the Board), votes on the renewal of the management contract and sub-advisory agreements (together, the Advisory Contracts) for the fund. The Board, assisted by the advice of fund counsel and Independent Trustees' counsel, requests and considers a broad range of information relevant to the renewal of the Advisory Contracts throughout the year.
The Board meets regularly and considers at each of its meetings factors that are relevant to its annual consideration of the renewal of the fund's Advisory Contracts, including the services and support provided to the fund and its shareholders. The Board has established various standing committees, each composed of Independent Trustees with varying backgrounds, to which the Board has assigned specific subject matter responsibilities in order to enhance effective decision-making by the Board. The Board, acting directly and through its Committees, requests and receives information concerning the annual consideration of the renewal of the fund's Advisory Contracts. The Board also meets as needed to consider matters specifically related to the Board's annual consideration of the renewal of Advisory Contracts. Members of the Board may also meet with trustees of other Fidelity funds through ad hoc joint committees to discuss certain matters relevant to the Fidelity funds.
At its July 2011 meeting, the Board of Trustees, including the Independent Trustees, unanimously determined to renew the fund's Advisory Contracts. In reaching its determination, the Board considered all factors it believed relevant, including (i) the nature, extent, and quality of the services to be provided to the fund and its shareholders (including the investment performance of the fund); (ii) the competitiveness of the fund's management fee and total expense ratio; (iii) the total costs of the services to be provided by and the profits to be realized by Fidelity from its relationship with the fund; (iv) the extent to which economies of scale would be realized as the fund grows; and (v) whether fee levels reflect these economies of scale, if any, for the benefit of fund shareholders.
In considering whether to renew the Advisory Contracts for the fund, the Board reached a determination, with the assistance of fund counsel and Independent Trustees' counsel and through the exercise of its business judgment, that the renewal of the Advisory Contracts is in the best interests of the fund and its shareholders and that the compensation payable under the Advisory Contracts is fair and reasonable. The Board's decision to renew the Advisory Contracts was not based on any single factor, but rather was based on a comprehensive consideration of all the information provided to the Board at its meetings throughout the year. The Board, in reaching its determination to renew the Advisory Contracts, is aware that shareholders in the fund have a broad range of investment choices available to them, including a wide choice among mutual funds offered by Fidelity's competitors, and that the fund's shareholders, who have the opportunity to review and weigh the disclosure provided by the fund in its prospectus and other public disclosures, have chosen to invest in this fund, managed by Fidelity.
Annual Report
Board Approval of Investment Advisory Contracts and
Management Fees - continued
Nature, Extent, and Quality of Services Provided. The Board considered the staffing within the investment adviser, FMR, and the sub-advisers (together, the Investment Advisers), including the backgrounds of the fund's investment personnel and the fund's investment objective and discipline. The Independent Trustees also had discussions with senior management of Fidelity's investment operations and investment groups. The Board considered the structure of the portfolio manager compensation program and whether this structure provides appropriate incentives to act in the best interests of the fund.
Resources Dedicated to Investment Management and Support Services. The Board and the Fund Oversight and Research Committees reviewed the general qualifications and capabilities of the Investment Advisers' investment staff, including its size, education, experience, and resources, as well as the Investment Advisers' approach to recruiting, training, managing, and compensating investment personnel. The Board also noted that FMR has devoted increased resources to non-U.S. offices. The Board noted that Fidelity's analysts have extensive resources, tools and capabilities which allow them to conduct sophisticated quantitative and fundamental analysis, as well as credit analysis of issuers, counterparties and enhancers. The Board also believes that Fidelity's investment professionals have sufficient access to global information and data so as to provide competitive investment results over time, and that those professionals also have access to sophisticated tools which permit them to assess portfolio construction and risk and performance attribution characteristics continuously, as well as to transmit new information and research conclusions rapidly around the world. Additionally, in their deliberations, the Board considered the Investment Advisers' trading capabilities and resources which are an integral part of the investment management process.
Shareholder and Administrative Services. The Board considered (i) the nature, extent, quality, and cost of advisory, administrative, and shareholder services performed by the Investment Advisers and their affiliates under the Advisory Contracts and under separate agreements covering transfer agency, pricing and bookkeeping, and securities lending services for the fund; (ii) the nature and extent of the investment adviser's supervision of third party service providers, principally custodians and subcustodians; and (iii) the resources devoted to, and the record of compliance with, the fund's compliance policies and procedures. The Board also reviewed the allocation of fund brokerage, including allocations to brokers affiliated with the Investment Advisers, the use of brokerage commissions to pay fund expenses, and the use of "soft" commission dollars to pay for research services.
The Board noted that the growth of fund assets over time across the complex allows Fidelity to reinvest in the development of services designed to enhance the value or convenience of the Fidelity funds as investment vehicles. These services include 24-hour access to account information and market information through telephone representatives and over the Internet, investor education materials and asset allocation tools, and the expanded availability of Fidelity Investor Centers, with 35 new branches opening since 2010.
Annual Report
Investment in a Large Fund Family. The Board considered the benefits to shareholders of investing in a Fidelity fund, including the benefits of investing in a fund that is part of a large family of funds offering a variety of investment disciplines and providing a large variety of mutual fund investor services. The Board noted that Fidelity had taken, or had made recommendations that resulted in the Fidelity funds taking, a number of actions over the previous year that benefited particular funds, including (i) continuing to dedicate additional resources to investment research and support of the senior management team that oversees asset management; (ii) rationalizing product lines through the mergers of six funds into other funds; (iii) continuing to migrate the Freedom Funds to dedicated lower cost underlying funds; (iv) obtaining shareholder approval to broaden the investment strategies for Fidelity Consumer Finance Portfolio, Fidelity Emerging Asia Fund, and Fidelity Environment and Alternative Energy Portfolio; (v) contractually agreeing to reduce the management fees and impose other expense limitations on Spartan 500 Index Fund and U.S. Bond Index Fund in connection with launching new institutional classes of these funds; (vi) changing the name, primary and supplemental benchmarks, and investment policies of Fidelity Global Strategies Fund to support the fund's flexible investment mandate and global orientation; and (vii) reducing the transfer agency account fee rates on certain accounts.
Investment Performance. The Board considered whether the fund has operated in accordance with its investment objective, as well as its record of compliance with its investment restrictions. It also reviewed the fund's absolute investment performance for each class, as well as the fund's relative investment performance for each class measured over multiple periods against (i) a broad-based securities market index, and (ii) a custom peer group of mutual funds deemed appropriate by Fidelity and reviewed by the Board. Because the fund had been in existence less than five calendar years, the following charts considered by the Board show, over the one- and three-year periods ended December 31, 2010, the cumulative total returns of Institutional Class (Class I) and Class C of the fund, the cumulative total returns of a broad-based securities market index ("benchmark"), and a range of cumulative total returns of a custom peer group of mutual funds defined by FMR based on categories assigned by Morningstar, Inc. The returns of Institutional Class (Class I) and Class C show the performance of the highest and lowest performing classes, respectively (based on three-year performance). The box within each chart shows the 25th percentile return (bottom of box) and the 75th percentile return (top of box) of the peer group. Returns shown above the box are in the first quartile and returns shown below the box are in the fourth quartile. The percentage beaten numbers noted below each chart correspond to the percentile box and represent the percentage of funds in the peer group whose performance was equal to or lower than that of the class indicated. The fund's custom peer group, defined by FMR, is a peer group that FMR believes provides a more meaningful performance comparison than the peer group assigned by Morningstar, Inc., which assigns mutual funds to categories based on their investment styles as measured by their underlying portfolio holdings.
Annual Report
Board Approval of Investment Advisory Contracts and
Management Fees - continued
Fidelity International Value Fund
The Board reviewed the fund's relative investment performance against its peer group and noted that the performance of Institutional Class (Class I) of the fund was in the fourth quartile for the one-year period and the third quartile for the three-year period. The Board also noted that the investment performance of Institutional Class (Class I) of the fund compared favorably to its benchmark for the one-year period, although the fund's three-year cumulative total return was lower than its benchmark. The Board considered that the variations in performance among the fund's classes reflect the variations in class expenses, which result in lower performance for higher expense classes. The Board discussed with FMR actions that have been taken by FMR to improve the fund's disappointing performance relative to its peer group. The Board also reviewed the fund's performance since inception as well as performance in the current year. The Board will continue to closely monitor the performance of the fund in the coming year and discuss with FMR other appropriate actions to address the performance of the fund.
The Board also considered that the fund's management fee is subject to upward or downward adjustment depending upon whether, and to what extent, the fund's investment performance for the performance period exceeds, or is exceeded by, the record (over the same period) of a Board-approved performance adjustment index. The Board noted that the performance adjustment provides FMR with a strong economic incentive to seek to achieve superior performance for the fund's shareholders and helps to more closely align the interests of FMR and the fund's shareholders.
Annual Report
Based on its review, the Board concluded that the nature, extent, and quality of services provided to the fund under the Advisory Contracts should benefit the fund's shareholders.
Competitiveness of Management Fee and Total Expense Ratio. The Board considered the fund's management fee and total expense ratio compared to "mapped groups" of competitive funds and classes. Fidelity creates "mapped groups" by combining similar Lipper investment objective categories that have comparable management fee characteristics. Combining Lipper investment objective categories aids the Board's management fee and total expense ratio comparisons by broadening the competitive group used for comparison and by reducing the number of universes to which various Fidelity funds are compared.
Management Fee. The Board considered two proprietary management fee comparisons for the 12-month (or shorter) periods shown in the chart below. The group of Lipper funds used by the Board for management fee comparisons is referred to below as the "Total Mapped Group." The Total Mapped Group comparison focuses on a fund's standing relative to the total universe of comparable funds available to investors in terms of gross management fees before expense reimbursements or caps, and without giving effect to the fund's performance adjustment. "TMG %" represents the percentage of funds in the Total Mapped Group that had management fees that were lower than the fund's. For example, a TMG % of 16% means that 84% of the funds in the Total Mapped Group had higher management fees than the fund. The "Asset-Size Peer Group" (ASPG) comparison focuses on a fund's standing relative to non-Fidelity funds similar in size to the fund within the Total Mapped Group. The ASPG represents at least 15% of the funds in the Total Mapped Group with comparable asset size and management fee characteristics, subject to a minimum of 50 funds (or all funds in the Total Mapped Group if fewer than 50). Additional information, such as the ASPG quartile in which the fund's management fee ranked and the impact of the fund's performance adjustment, is also included in the chart and considered by the Board.
Annual Report
Board Approval of Investment Advisory Contracts and
Management Fees - continued
Fidelity International Value Fund
The Board noted that the fund's management fee ranked below the median of its Total Mapped Group and below the median of its ASPG for 2010. The Board also noted the effect of the fund's negative performance adjustment on the fund's management fee ranking. The Board noted that the performance adjustment for each year represents calculations for performance periods that differ from the periods shown in the performance charts above.
Based on its review, the Board concluded that the fund's management fee is fair and reasonable in light of the services that the fund receives and the other factors considered.
Total Expense Ratio. In its review of each class's total expense ratio, the Board considered the fund's management fee as well as other fund or class expenses, as applicable, such as transfer agent fees, pricing and bookkeeping fees, fund-paid 12b-1 fees, and custodial, legal, and audit fees. The Board also noted the effects of any waivers and reimbursements on fees and expenses, as well as the impact of the fund's performance adjustment. As part of its review, the Board also considered the current and historical total expense ratios of each class of the fund compared to competitive fund median expenses. Each class of the fund is compared to those funds and classes in the Total Mapped Group (used by the Board for management fee comparisons) that have a similar sales load structure.
The Board noted that the total expense ratio of each of Class A, Class B, Class C, Institutional Class, and the retail class ranked below its competitive median for 2010 and the total expense ratio of Class T ranked above its competitive median for 2010. The Board considered that various factors, including 12b-1 fees, positive or negative performance adjustments, and relatively higher other expenses in the case of small fund size, can affect total expense ratios. The Board noted that the total expense ratio of Class T was above the competitive median primarily because of higher 12b-1 fees on Class T. Class T has a higher 12b-1 fee, but a lower front-end sales charge, than traditionally priced front-end sales charge classes. The Board noted that the fund offers multiple classes, each of which has a different sales load and 12b-1 fee structure, and that the multiple structures are intended to offer a range of pricing options for the intermediary market. The Board also noted that the total expense ratios of the classes vary primarily by the level of their 12b-1 fees, although differences in transfer agent fees may also cause expenses to vary from class to class.
Annual Report
Fees Charged to Other Fidelity Clients. The Board also considered Fidelity fee structures and other information with respect to clients of FMR and its affiliates, such as other mutual funds advised or subadvised by FMR or its affiliates, pension plan clients, and other institutional clients. In March 2010, the Board created an ad hoc joint committee with the board of other Fidelity funds (the Committee) to review and compare Fidelity's institutional investment advisory business with its business of providing services to the Fidelity funds, including the differences in services provided, fees charged, and costs incurred, as well as competition in their respective marketplaces.
Based on its review of total expense ratios and fees charged to other Fidelity clients, the Board concluded that the total expense ratio of each class of the fund was reasonable, although Class T was above the median of the universe presented for comparison, in light of the services that the fund and its shareholders receive and the other factors considered, including the findings of the Committee.
Costs of the Services and Profitability. The Board considered the revenues earned and the expenses incurred by Fidelity in conducting the business of developing, marketing, distributing, managing, administering and servicing the fund and its shareholders. The Board also considered the level of Fidelity's profits in respect of all the Fidelity funds.
On an annual basis, FMR presents to the Board Fidelity's profitability for the fund. Fidelity calculates the profitability for each fund, as well as aggregate profitability for groups of Fidelity funds and all Fidelity funds, using a series of detailed revenue and cost allocation methodologies which originate with the books and records of Fidelity on which Fidelity's audited financial statements are based. The Audit Committee of the Board reviews any significant changes from the prior year's methodologies.
PricewaterhouseCoopers LLP (PwC), independent registered public accounting firm and auditor to Fidelity and certain Fidelity funds, has been engaged annually by the Board as part of the Board's assessment of Fidelity's profitability analysis. PwC's engagement includes the review and assessment of Fidelity's methodologies used in determining the revenues and expenses attributable to Fidelity's mutual fund business, and completion of agreed-upon procedures surrounding the mathematical accuracy of fund profitability and its conformity to allocation methodologies. After considering PwC's reports issued under the engagement and information provided by Fidelity, the Board concluded that while other allocation methods may also be reasonable, Fidelity's profitability methodologies are reasonable in all material respects.
Annual Report
Board Approval of Investment Advisory Contracts and
Management Fees - continued
The Board also reviewed Fidelity's non-fund businesses and fall-out benefits related to the mutual fund business as well as cases where Fidelity's affiliates may benefit from or be related to the fund's business.
The Board considered the costs of the services provided by and the profits realized by Fidelity in connection with the operation of the fund and was satisfied that the profitability was not excessive in the circumstances.
Economies of Scale. The Board considered whether there have been economies of scale in respect of the management of the Fidelity funds, whether the Fidelity funds (including the fund) have appropriately benefited from any such economies of scale, and whether there is potential for realization of any further economies of scale. The Board considered the extent to which the fund will benefit from economies of scale through increased services to the fund, through waivers or reimbursements, or through fee or expense reductions. The Board also noted that in 2009, it and the board of other Fidelity funds created an ad hoc committee (the Economies of Scale Committee) to analyze whether FMR attains economies of scale in respect of the management and servicing of the Fidelity funds, whether the Fidelity funds have appropriately benefited from such economies of scale, and whether there is potential for realization of any further economies of scale.
The Board recognized that the fund's management contract incorporates a "group fee" structure, which provides for lower group fee rates as total fund assets under FMR's management increase, and for higher group fee rates as total fund assets under FMR's management decrease. FMR calculates the group fee rates based on a tiered asset "breakpoint" schedule that varies based on asset class. The Board considered that the group fee is designed to deliver the benefits of economies of scale to fund shareholders when total Fidelity fund assets increase, even if assets of any particular fund are unchanged or have declined, because some portion of Fidelity's costs are attributable to services provided to all Fidelity funds, and all funds benefit if those costs can be allocated among more assets. The Board concluded that, given the group fee structure, fund shareholders will benefit from lower management fees as assets under FMR's management increase at the fund complex level, regardless of whether Fidelity achieves any such economies of scale.
The Board concluded, taking into account the analysis of the Economies of Scale Committee, that any potential economies of scale are being appropriately shared between fund shareholders and Fidelity.
Annual Report
Additional Information Requested by the Board. In order to develop fully the factual basis for consideration of the Fidelity funds' Advisory Contracts, the Board requested and received additional information on certain topics, including (i) fund performance trends, actions to be taken by FMR to improve certain funds' overall performance, and Fidelity's long-term strategies for certain funds; (ii) portfolio manager changes that have occurred during the past year and length of portfolio manager tenure for different categories of funds over time; (iii) Fidelity's compensation structure for portfolio managers and other key personnel and strategies for attracting and retaining non-investment personnel; (iv) the amount of the investment that each portfolio manager has made in the Fidelity fund(s) that he or she manages; (v) historical trends in Fidelity's realization of fall-out benefits; (vi) Fidelity's group fee structures and the rationale for the individual fee rates of certain funds; (vii) fund profitability methodology and the impact of certain factors on fund profitability results; (viii) trends regarding industry use of performance fee structures and Fidelity's compliance practices with respect to performance adjustment calculations; (ix) the fee structures in place for certain other Fidelity clients; and (x) explanations regarding the relative total expense ratios of certain funds and classes, total expense competitive trends, and actions that might be taken by FMR to reduce total expense ratios for certain funds and classes.
Based on its evaluation of all of the conclusions noted above, and after considering all factors it believed relevant, the Board ultimately concluded that the advisory fee structures are fair and reasonable, and that the fund's Advisory Contracts should be renewed.
Annual Report
Investment Adviser
Fidelity Management & Research Company
Boston, MA
Investment Sub-Advisers
FMR Co., Inc.
Fidelity Management & Research
(U.K.) Inc.
Fidelity Management & Research
(Hong Kong) Limited
Fidelity Management & Research
(Japan) Inc.
FIL Investment Advisors
FIL Investments (Japan) Limited
FIL Investment Advisors (U.K.) Ltd.
General Distributor
Fidelity Distributors Corporation
Boston, MA
Transfer and Service Agents
Fidelity Investments Institutional Operations Company, Inc.
Boston, MA
Fidelity Service Company, Inc.
Boston, MA
Custodian
The Northern Trust Company
Chicago, IL
AFIVI-UANN-1211
1.827488.105
Fidelity®
Overseas
Fund -
Class K
Annual Report
October 31, 2011
(Fidelity Cover Art)
Contents
Chairman's Message | (Click Here) | The Chairman's message to shareholders. |
Performance | (Click Here) | How the fund has done over time. |
Management's Discussion of Fund Performance | (Click Here) | The Portfolio Manager's review of fundperformance and strategy. |
Shareholder Expense Example | (Click Here) | An example of shareholder expenses. |
Investment Changes | (Click Here) | A summary of major shifts in the fund's investments over the past six months. |
Investments | (Click Here) | A complete list of the fund's investments with their market values. |
Financial Statements | (Click Here) | Statements of assets and liabilities, operations, and changes in net assets, as well as financial highlights. |
Notes | (Click Here) | Notes to the financial statements. |
Report of Independent Registered Public Accounting Firm | (Click Here) | |
Trustees and Officers | (Click Here) | |
Distributions | (Click Here) | |
Board Approval of Investment Advisory Contracts and Management Fees | (Click Here) | |
To view a fund's proxy voting guidelines and proxy voting record for the 12-month period ended June 30, visit http://www.fidelity.com/proxyvotingresults or visit the Securities and Exchange Commission's (SEC) web site at http://www.sec.gov. You may also call 1-800-835-5092 to request a free copy of the proxy voting guidelines.
Standard & Poor's, S&P and S&P 500 are registered service marks of The McGraw-Hill Companies, Inc. and have been licensed for use by Fidelity Distributors Corporation.
Other third party marks appearing herein are the property of their respective owners.
All other marks appearing herein are registered or unregistered trademarks or service marks of FMR LLC or an affiliated company.
This report and the financial statements contained herein are submitted for the general information of the shareholders of the fund. This report is not authorized for distribution to prospective investors in the fund unless preceded or accompanied by an effective prospectus.
A fund files its complete schedule of portfolio holdings with the SEC for the first and third quarters of each fiscal year on Form N-Q. Forms N-Q are available on the SEC's web site at http://www.sec.gov. A fund's Forms N-Q may be reviewed and copied at the SEC's Public Reference Room in Washington, DC. Information regarding the operation of the SEC's Public Reference Room may be obtained by calling 1-800-SEC-0330. For a complete list of a fund's portfolio holdings, view the most recent holdings listing, semiannual report, or annual report on Fidelity's web site at http://www.fidelity.com, http://www.advisor.fidelity.com, or http://www.401k.com, as applicable.
NOT FDIC INSURED • MAY LOSE VALUE • NO BANK GUARANTEE
Neither the fund nor Fidelity Distributors Corporation is a bank.
Annual Report
(Acting Chairman's Photograph)
Dear Shareholder:
Global equity markets began the fourth quarter on a strong note, sharply reversing course in October amid strong corporate earnings, better-than-expected economic news and the promise of a resolution to the sovereign debt crisis in Europe. The mini rally followed a third quarter marked by a significant downturn in July and August, which heightened investor anxiety and set off a wave of volatility that hampered most major asset classes through the end of September. Financial markets are difficult to predict, of course, but you can help put the odds in your favor by following these time-tested investment principles.
One of the basic tenets is to invest according to your time horizon. For long-term investors, riding out the markets' inevitable ups and downs has proven much more effective than making decisions based on short-term developments. If your goal is approaching, you can also benefit from patience and restraint, rather than attempting to time the market. No matter your time horizon, missing only a few of the markets' best days can significantly diminish returns. Patience also affords the benefits of compounding - earning interest on additional income or reinvested dividends and capital gains. While staying the course doesn't eliminate risk, it can considerably lessen the negative impact of short-term downturns.
Asset allocation is another principle to manage risk. As you spread your portfolio among the asset classes, be sure to consider your time horizon, risk tolerance and investment objectives. Younger investors may be better served by emphasizing equities, which historically have been the best-performing asset class over time. Investors who are nearing a specific goal, such as retirement or sending a child to college, may choose to favor bonds and other investments that have tended to be more stable. Studies indicate that asset allocation is the single most important determinant of a portfolio's long-term success. After deciding on a suitable allocation strategy, make sure your portfolio is adequately diversified, with exposure to stocks of small-, mid- and large-cap companies in a range of sectors, for example. And today, more than ever, geographic diversification should be taken into account.
Lastly, investing a certain amount of money on a regular basis - a principle known as dollar-cost averaging - can help lower the average cost of your purchases, while also giving you the discipline to avoid selling weak performers just prior to an upswing, or chasing a hot performer just before a correction.
We invite you to learn more by visiting us on the Internet, dropping by one of our Investor Centers or calling us by phone. It is our privilege to provide the resources you need to choose investments that are right for you.
Sincerely,
(Acting Chairman's Signature)
James C. Curvey
Acting Chairman
Annual Report
Average annual total return reflects the change in the value of an investment, assuming reinvestment of the class' distributions from dividend income and capital gains (the profits earned upon the sale of securities that have grown in value, if any) and assuming a constant rate of performance each year. The $10,000 table and the fund's returns do not reflect the deduction of taxes that a shareholder would pay on fund distributions or the redemption of fund shares. During periods of reimbursement by Fidelity, a fund's total return will be greater than it would be had the reimbursement not occurred. How a fund did yesterday is no guarantee of how it will do tomorrow.
Average Annual Total Returns
Periods ended October 31, 2011 | Past 1
year | Past 5
years | Past 10
years |
Class K A | -5.67% | -3.71% | 4.52% |
A The initial offering of Class K shares took place on May 9, 2008. Returns prior to May 9, 2008 are those of Fidelity® Overseas Fund, the original class of the fund.
$10,000 Over 10 Years
Let's say hypothetically that $10,000 was invested in Fidelity® Overseas Fund - Class K on October 31, 2001. The chart shows how the value of your investment would have changed, and also shows how the MSCI® EAFE® (Europe, Australasia, Far East) Index performed over the same period. The initial offering of Class K took place on May 9, 2008. See above for additional information regarding the performance of Class K.
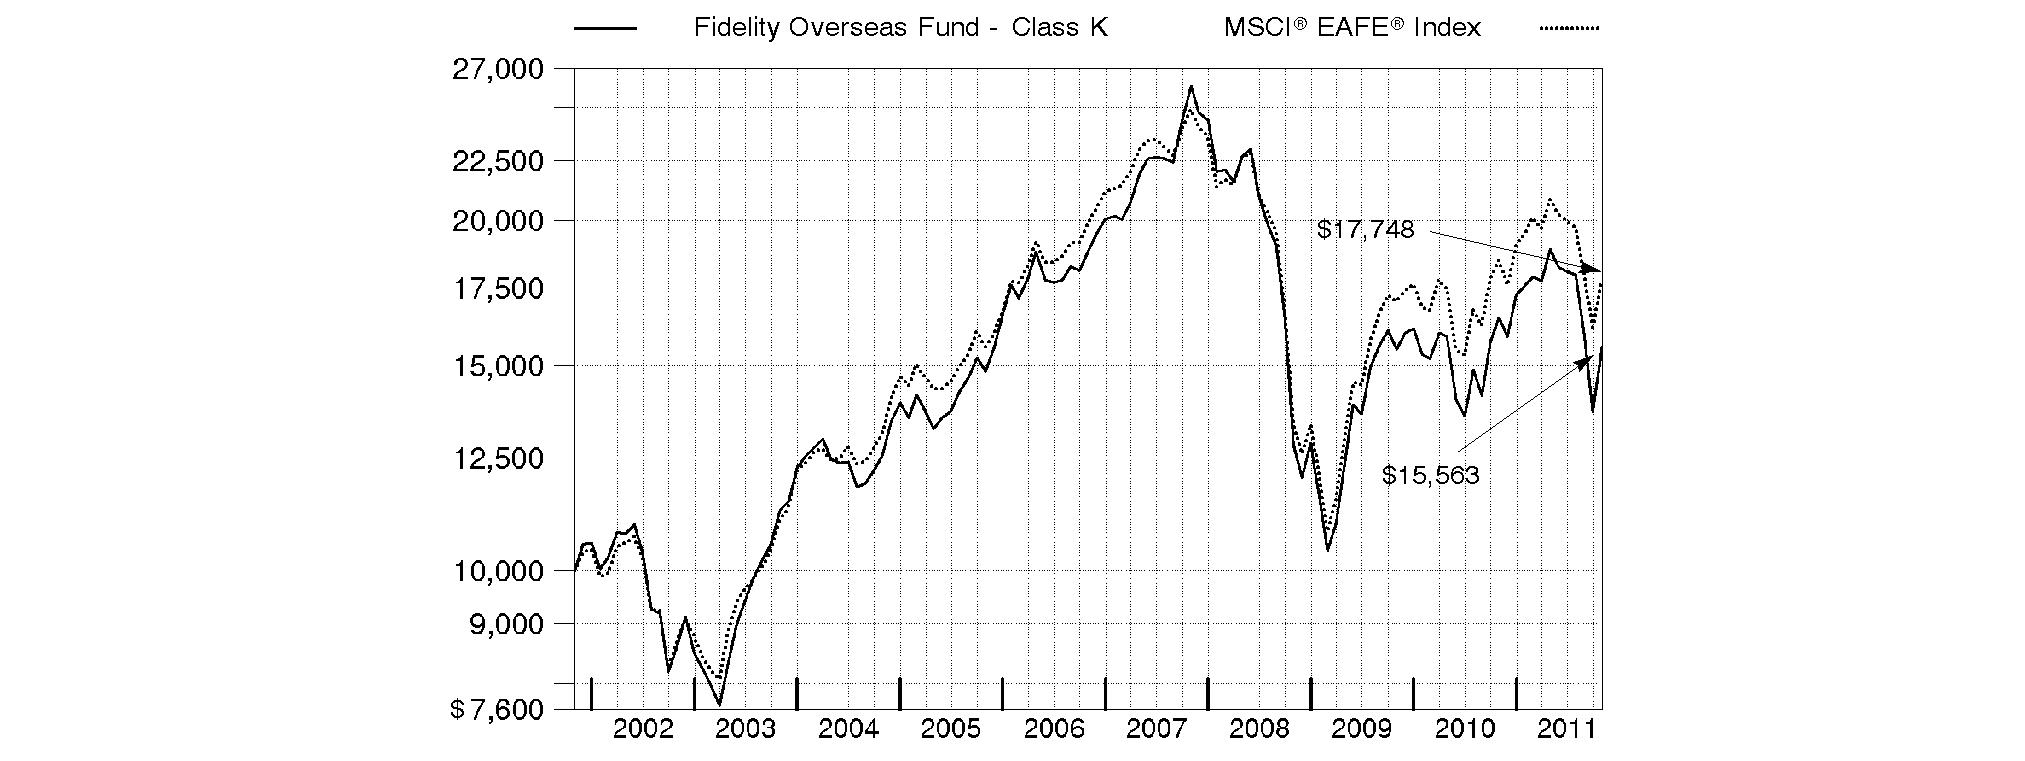
Annual Report
Market Recap: International equities were rocked by a number of headline events during the year ending October 31, 2011. Stocks posted a solid advance for the first half of the period, despite concern about the sovereign debt crisis in Europe, a devastating earthquake and tsunami in Japan, and political upheaval in the Middle East and North Africa. Sentiment turned decidedly negative in the second half, however, as fresh worries about Europe, inflation in China and a dimmed outlook for global growth caused foreign markets to suffer declines that intensified in August and September. October brought with it yet another dramatic swing, as eurozone policymakers appeared near a resolution to the debt debacle and buyers stormed back onto the scene in search of bargains. Still, those gains - along with favorable currency fluctuations overall - weren't enough to offset prior losses, and the MSCI® ACWI® (All Country World Index) ex USA Index finished the period down 4.56%. Within the MSCI index, Europe and emerging markets suffered the biggest declines, with many countries in these areas sustaining steep losses. By contrast, Japan showed resilience in the wake of its natural disasters, falling only 2%. Australia (+4%), Switzerland (+3%), the U.K. (+2%) and Canada, which produced a nominal return, were among the few major benchmark components to break into positive territory.
Comments from Ian Hart, Portfolio Manager of Fidelity® Overseas Fund: For the year, the fund's Class K shares returned -5.67%, underperforming the -3.97% return of the MSCI® EAFE® (Europe, Australasia, Far East) Index. Stock picks in energy, information technology, telecommunication services and financials hurt, although my decision to underweight banks partially offset losses in the latter category. Geographically, security selection in the U.K. detracted, due in part to underweighting several mega-cap stocks such as oil producer and index component BP, which posted a double-digit gain. I sold BP by period end. Out-of-benchmark picks in emerging markets also held back performance. On an individual stock level, the fund was hurt by an overweighting in offshore drilling company Transocean, which owned the Deepwater Horizon rig that exploded in the Gulf of Mexico last year; NII Holdings, a U.S.-based operator of mobile networks in Latin America; and a small position in Norwegian oil-services company Sevan Marine, which I sold in June. Conversely, positioning in consumer discretionary aided performance, as did good stock picks and a sizable overweighting in food/beverage/tobacco. The fund's top relative contributor was Japan Tobacco, a strong defensive stock. In the luxury goods area, contributions included an out-of-index stake in luxury goods maker Bulgari, which was acquired in the period, and sold from the fund after the deal's March announcement, and stakes in spirits maker Pernod Ricard and luxury apparel maker Christian Dior, the fund's two largest holdings at period end. Strong security selection in Europe ex U.K. easily overshadowed the negative impact of various market weightings in some countries there.
The views expressed above reflect those of the portfolio manager(s) only through the end of the period as stated on the cover of this report and do not necessarily represent the views of Fidelity or any other person in the Fidelity organization. Any such views are subject to change at any time based upon market or other conditions and Fidelity disclaims any responsibility to update such views. These views may not be relied on as investment advice and, because investment decisions for a Fidelity fund are based on numerous factors, may not be relied on as an indication of trading intent on behalf of any Fidelity fund.
Annual Report
Fidelity Overseas Fund
As a shareholder of the Fund, you incur two types of costs: (1) transaction costs, including redemption fees, and (2) ongoing costs, including management fees and other Fund expenses. This Example is intended to help you understand your ongoing costs (in dollars) of investing in the Fund and to compare these costs with the ongoing costs of investing in other mutual funds.
The Example is based on an investment of $1,000 invested at the beginning of the period and held for the entire period (May 1, 2011 to October 31, 2011).
Actual Expenses
The first line of the accompanying table for each class of the Fund provides information about actual account values and actual expenses. You may use the information in this line, together with the amount you invested, to estimate the expenses that you paid over the period. Simply divide your account value by $1,000.00 (for example, an $8,600 account value divided by $1,000.00 = 8.6), then multiply the result by the number in the first line for a class of the Fund under the heading entitled "Expenses Paid During Period" to estimate the expenses you paid on your account during this period. A small balance maintenance fee of $12.00 that is charged once a year may apply for certain accounts with a value of less than $2,000. This fee is not included in the table below. If it was, the estimate of expenses you paid during the period would be higher, and your ending account value lower, by this amount. In addition, the Fund, as a shareholder in the underlying Fidelity Central Funds, will indirectly bear its pro-rata share of the fees and expenses incurred by the underlying Fidelity Central Funds. These fees and expenses are not included in the Fund's annualized expense ratio used to calculate the expense estimate in the table below.
Hypothetical Example for Comparison Purposes
The second line of the accompanying table for each class of the Fund provides information about hypothetical account values and hypothetical expenses based on a Class' actual expense ratio and an assumed rate of return of 5% per year before expenses, which is not the Class' actual return. The hypothetical account values and expenses may not be used to estimate the actual ending account balance or expenses you paid for the period. You may use this information to compare the ongoing costs of investing in the Fund and other funds. To do so, compare this 5% hypothetical example with the 5% hypothetical examples that appear in the shareholder reports of the other funds. A small balance maintenance fee of $12.00 that is charged once a year may apply for certain accounts with a value of less than $2,000. This fee is not included in the table below. If it was, the estimate of expenses you paid during the period would be higher, and your ending account value lower, by this amount. In addition, the Fund, as a shareholder in the underlying Fidelity Central Funds, will indirectly bear its pro-rata share of the fees and expenses incurred by the underlying Fidelity Central Funds. These fees and expenses are not included in the Fund's annualized expense ratio used to calculate the expense estimate in the table below.
Please note that the expenses shown in the table are meant to highlight your ongoing costs only and do not reflect any transaction costs. Therefore, the second line of the table is useful in comparing ongoing costs only, and will not help you determine the relative total costs of owning different funds. In addition, if these transactional costs were included, your costs would have been higher.
| Annualized Expense Ratio | Beginning
Account Value
May 1, 2011 | Ending
Account Value
October 31, 2011 | Expenses Paid
During Period*
May 1, 2011 to October 31, 2011 |
Overseas | .69% | | | |
Actual | | $ 1,000.00 | $ 823.40 | $ 3.17 |
HypotheticalA | | $ 1,000.00 | $ 1,021.73 | $ 3.52 |
Class K | .52% | | | |
Actual | | $ 1,000.00 | $ 823.90 | $ 2.39 |
HypotheticalA | | $ 1,000.00 | $ 1,022.58 | $ 2.65 |
Class F | .46% | | | |
Actual | | $ 1,000.00 | $ 824.10 | $ 2.11 |
HypotheticalA | | $ 1,000.00 | $ 1,022.89 | $ 2.35 |
A 5% return per year before expenses
* Expenses are equal to each Class' annualized expense ratio, multiplied by the average account value over the period, multiplied by 184/365 (to reflect the one-half year period).
Annual Report
Fidelity Overseas Fund
Investment Changes (Unaudited)
Geographic Diversification (% of fund's net assets) |
As of October 31, 2011 |
 | France | 21.4% | |
 | Germany | 16.3% | |
 | Japan | 11.7% | |
 | United Kingdom | 11.6% | |
 | United States of America | 8.6% | |
 | Australia | 4.4% | |
 | Switzerland | 4.1% | |
 | Italy | 3.8% | |
 | Spain | 2.6% | |
 | Other | 15.5% | |

Percentages are adjusted for the effect of futures contracts, if applicable. |
As of April 30, 2011 |
| France | 21.7% | |
| Germany | 14.6% | |
| United Kingdom | 14.5% | |
| Japan | 14.2% | |
| Switzerland | 5.5% | |
| Italy | 3.9% | |
| United States of America | 3.4% | |
| Cayman Islands | 3.0% | |
| Norway | 2.4% | |
| Other | 16.8% | |

Percentages are adjusted for the effect of futures contracts, if applicable. |
Asset Allocation |
| % of fund's
net assets | % of fund's net assets
6 months ago |
Stocks | 91.8 | 97.6 |
Short-Term Investments and Net Other Assets | 8.2 | 2.4 |
Top Ten Stocks as of October 31, 2011 |
| % of fund's
net assets | % of fund's net assets
6 months ago |
Pernod Ricard SA (France, Beverages) | 7.0 | 5.7 |
Christian Dior SA (France, Textiles, Apparel & Luxury Goods) | 6.2 | 4.0 |
Porsche Automobil Holding SE (Germany) (Germany, Automobiles) | 5.6 | 1.3 |
SAP AG (Germany, Software) | 2.7 | 2.9 |
Mazda Motor Corp. (Japan, Automobiles) | 2.3 | 2.6 |
Saipem SpA (Italy, Energy Equipment & Services) | 1.5 | 2.3 |
The Swatch Group AG (Bearer) (Switzerland, Textiles, Apparel & Luxury Goods) | 1.5 | 1.5 |
Imperial Tobacco Group PLC (United Kingdom, Tobacco) | 1.5 | 1.9 |
BG Group PLC (United Kingdom, Oil, Gas & Consumable Fuels) | 1.4 | 1.0 |
WPP PLC (Bailiwick of Jersey, Media) | 1.4 | 1.2 |
| 31.1 | |
Market Sectors as of October 31, 2011 |
| % of fund's
net assets | % of fund's net assets
6 months ago |
Consumer Discretionary | 23.3 | 20.6 |
Financials | 15.4 | 13.7 |
Consumer Staples | 11.4 | 12.1 |
Materials | 10.1 | 12.6 |
Industrials | 7.5 | 10.8 |
Energy | 6.6 | 14.6 |
Information Technology | 6.6 | 7.6 |
Telecommunication Services | 5.9 | 2.2 |
Health Care | 3.1 | 2.1 |
Utilities | 1.9 | 1.3 |
Annual Report
Fidelity Overseas Fund
Investments October 31, 2011
Showing Percentage of Net Assets
Common Stocks - 85.5% |
| Shares | | Value |
Australia - 4.4% |
Australia & New Zealand Banking Group Ltd. | 1,214,597 | | $ 27,448,154 |
BHP Billiton Ltd. | 659,177 | | 25,805,692 |
Commonwealth Bank of Australia | 543,974 | | 27,946,636 |
Macquarie Group Ltd. | 439,886 | | 11,326,499 |
Newcrest Mining Ltd. | 667,135 | | 23,580,019 |
TOTAL AUSTRALIA | | 116,107,000 |
Bailiwick of Jersey - 1.6% |
Wolseley PLC | 189,900 | | 5,491,041 |
WPP PLC | 3,658,375 | | 37,875,145 |
TOTAL BAILIWICK OF JERSEY | | 43,366,186 |
Belgium - 2.5% |
Anheuser-Busch InBev SA NV | 557,112 | | 30,899,753 |
Groupe Bruxelles Lambert SA | 468,500 | | 36,204,263 |
TOTAL BELGIUM | | 67,104,016 |
Bermuda - 0.3% |
Li & Fung Ltd. | 4,008,000 | | 7,724,195 |
Brazil - 0.2% |
BM&F Bovespa SA | 1,062,400 | | 6,341,486 |
Canada - 0.6% |
Potash Corp. of Saskatchewan, Inc. | 320,200 | | 15,154,774 |
Cayman Islands - 2.3% |
3SBio, Inc. sponsored ADR (a) | 440,300 | | 5,067,853 |
China Medical System Holding Ltd. | 7,584,250 | | 5,568,755 |
Melco PBL Entertainment (Macau) Ltd. sponsored ADR (a)(d) | 2,693,500 | | 30,894,445 |
Minth Group Ltd. | 11,902,000 | | 12,349,112 |
Yingde Gases Group Co. Ltd. | 7,799,100 | | 8,317,251 |
TOTAL CAYMAN ISLANDS | | 62,197,416 |
Denmark - 0.9% |
Danske Bank A/S (a) | 493,663 | | 6,840,172 |
Novo Nordisk A/S Series B | 170,100 | | 18,061,767 |
TOTAL DENMARK | | 24,901,939 |
Finland - 0.5% |
Outotec Oyj | 258,300 | | 12,075,045 |
France - 21.4% |
Accor SA | 188,600 | | 6,200,139 |
Alcatel-Lucent SA sponsored ADR (a) | 4,144,600 | | 11,356,204 |
Alstom SA | 833,508 | | 31,259,626 |
Atos Origin SA | 205,351 | | 9,952,167 |
AXA SA | 882,837 | | 14,380,093 |
BNP Paribas SA | 387,126 | | 17,599,180 |
Cap Gemini SA | 253,800 | | 9,736,202 |
Christian Dior SA | 1,177,000 | | 166,631,386 |
Compagnie Generale de Geophysique SA (a) | 285,800 | | 6,245,460 |
EDF SA | 349,100 | | 10,488,524 |
GDF Suez | 272,000 | | 7,722,273 |
|
| Shares | | Value |
JC Decaux SA (a) | 289,800 | | $ 7,766,415 |
Laurent-Perrier Group | 100,819 | | 10,394,494 |
Pernod Ricard SA | 1,987,126 | | 185,623,904 |
Safran SA | 649,100 | | 21,262,512 |
Sanofi-aventis | 504,882 | | 36,123,991 |
Vivendi | 333,479 | | 7,499,401 |
Wendel SA | 152,300 | | 11,373,040 |
TOTAL FRANCE | | 571,615,011 |
Germany - 10.0% |
Allianz AG | 330,245 | | 37,115,086 |
BASF AG | 177,414 | | 13,059,381 |
Bayer AG | 305,997 | | 19,604,509 |
Deutsche Boerse AG | 201,492 | | 11,153,791 |
E.ON AG | 670,598 | | 16,249,990 |
HeidelbergCement AG | 325,329 | | 14,848,348 |
Linde AG | 181,207 | | 28,826,284 |
Metro AG | 118,700 | | 5,534,220 |
Munich Re Group | 120,668 | | 16,275,084 |
Puma AG | 34,100 | | 10,995,501 |
RWE AG | 171,000 | | 7,323,038 |
SAP AG | 1,175,607 | | 71,096,806 |
Siemens AG | 147,088 | | 15,420,124 |
TOTAL GERMANY | | 267,502,162 |
Hong Kong - 0.4% |
China Unicom (Hong Kong) Ltd. sponsored ADR (d) | 555,000 | | 11,161,050 |
India - 0.6% |
Bharti Airtel Ltd. | 1,886,222 | | 15,106,224 |
Ireland - 0.3% |
CRH PLC | 515,000 | | 9,319,038 |
Italy - 3.8% |
Ansaldo STS SpA | 334,000 | | 3,542,936 |
Assicurazioni Generali SpA | 327,500 | | 5,905,551 |
ENI SpA | 772,300 | | 17,073,321 |
Fiat Industrial SpA (a) | 1,326,000 | | 11,569,999 |
Intesa Sanpaolo SpA | 4,961,601 | | 8,864,470 |
Saipem SpA | 911,169 | | 40,855,324 |
Telecom Italia SpA | 10,512,400 | | 13,082,222 |
TOTAL ITALY | | 100,893,823 |
Japan - 11.7% |
Hitachi Ltd. | 4,459,000 | | 23,895,659 |
Honda Motor Co. Ltd. sponsored ADR | 918,500 | | 27,463,150 |
Japan Tobacco, Inc. | 5,295 | | 26,468,654 |
Keyence Corp. | 79,200 | | 20,136,072 |
Komatsu Ltd. | 448,400 | | 11,088,024 |
Kubota Corp. | 832,000 | | 6,853,386 |
Mazda Motor Corp. (a)(d) | 28,643,000 | | 60,213,771 |
Mitsubishi Corp. | 985,600 | | 20,273,393 |
Mitsubishi UFJ Financial Group, Inc. | 1,824,400 | | 7,929,742 |
Mitsui & Co. Ltd. | 629,200 | | 9,184,049 |
NTT DoCoMo, Inc. | 11,689 | | 20,762,821 |
Common Stocks - continued |
| Shares | | Value |
Japan - continued |
Rakuten, Inc. | 21,988 | | $ 24,107,109 |
SOFTBANK CORP. | 734,600 | | 23,844,961 |
Tokyo Electron Ltd. | 227,100 | | 12,079,516 |
Toshiba Corp. | 2,648,000 | | 11,550,453 |
Toto Ltd. | 727,000 | | 6,045,774 |
TOTAL JAPAN | | 311,896,534 |
Luxembourg - 0.5% |
ArcelorMittal SA Class A unit (d) | 585,300 | | 12,133,269 |
Mexico - 0.4% |
Cemex SA de CV sponsored ADR (d) | 2,631,800 | | 11,500,966 |
Netherlands - 0.8% |
AEGON NV (a) | 1,703,200 | | 8,123,645 |
ING Groep NV (Certificaten Van Aandelen) (a) | 1,512,300 | | 13,039,389 |
TOTAL NETHERLANDS | | 21,163,034 |
Norway - 1.3% |
Aker Solutions ASA | 1,572,717 | | 18,290,363 |
DnB NOR ASA | 752,800 | | 8,781,946 |
Kvaerner ASA (a) | 3,388,500 | | 6,530,391 |
TOTAL NORWAY | | 33,602,700 |
Spain - 2.6% |
Banco Bilbao Vizcaya Argentaria SA | 1,194,607 | | 10,752,920 |
Banco Santander SA: | | | |
rights 10/31/11 | 1,238,625 | | 214,267 |
(Spain) | 1,238,625 | | 10,485,066 |
Distribuidora Internacional de Alimentacion SA (a) | 377,987 | | 1,728,833 |
Iberdrola SA | 1,198,900 | | 8,723,851 |
Inditex SA | 142,852 | | 13,000,284 |
Telefonica SA sponsored ADR (d) | 1,113,900 | | 23,804,043 |
TOTAL SPAIN | | 68,709,264 |
Sweden - 0.8% |
Svenska Handelsbanken AB (A Shares) | 454,400 | | 13,096,266 |
Swedbank AB (A Shares) | 534,900 | | 7,535,883 |
TOTAL SWEDEN | | 20,632,149 |
Switzerland - 4.1% |
Credit Suisse Group | 318,706 | | 9,194,430 |
Julius Baer Group Ltd. | 125,480 | | 4,767,253 |
Pargesa Holding SA | 98,450 | | 7,724,098 |
The Swatch Group AG (Bearer) | 96,350 | | 40,799,567 |
Transocean Ltd. (United States) | 429,100 | | 24,523,065 |
UBS AG (a) | 894,783 | | 11,311,676 |
Zurich Financial Services AG | 47,010 | | 10,917,484 |
TOTAL SWITZERLAND | | 109,237,573 |
Taiwan - 0.2% |
HTC Corp. | 252,000 | | 5,663,335 |
|
| Shares | | Value |
Turkey - 1.3% |
Turkcell Iletisim Hizmet AS sponsored ADR (a) | 2,312,300 | | $ 28,487,536 |
Turkiye Garanti Bankasi AS | 1,580,000 | | 5,575,682 |
TOTAL TURKEY | | 34,063,218 |
United Kingdom - 11.6% |
AMEC PLC | 541,579 | | 8,060,803 |
Anglo American PLC (United Kingdom) | 421,000 | | 15,528,192 |
Barclays PLC | 6,045,110 | | 18,742,991 |
BG Group PLC | 1,749,782 | | 38,171,902 |
BHP Billiton PLC | 985,136 | | 31,027,214 |
British Sky Broadcasting Group PLC | 880,300 | | 9,966,517 |
Cairn Energy PLC (a) | 3,409,715 | | 16,154,402 |
Imperial Tobacco Group PLC | 1,081,219 | | 39,540,685 |
Lloyds Banking Group PLC (a) | 18,687,110 | | 9,665,340 |
Prudential PLC | 899,265 | | 9,290,341 |
Rio Tinto PLC | 623,310 | | 33,726,681 |
Rolls-Royce Group PLC | 2,829,400 | | 31,965,443 |
Rolls-Royce Group PLC Class C | 195,228,600 | | 313,967 |
Standard Chartered PLC (United Kingdom) | 952,374 | | 22,346,159 |
Xstrata PLC | 1,514,900 | | 25,471,121 |
TOTAL UNITED KINGDOM | | 309,971,758 |
United States of America - 0.4% |
NII Holdings, Inc. (a) | 420,700 | | 9,899,071 |
TOTAL COMMON STOCKS (Cost $2,415,469,001) |
2,279,042,236
|
Nonconvertible Preferred Stocks - 6.3% |
| | | |
Germany - 6.3% |
Porsche Automobil Holding SE (Germany) | 2,531,750 | | 148,503,851 |
Volkswagen AG | 115,668 | | 20,297,250 |
TOTAL NONCONVERTIBLE PREFERRED STOCKS (Cost $177,964,851) |
168,801,101
|
Money Market Funds - 6.2% |
| | | |
Fidelity Cash Central Fund, 0.12% (b) | 110,810,907 | | 110,810,907 |
Fidelity Securities Lending Cash Central Fund, 0.11% (b)(c) | 53,871,515 | | 53,871,515 |
TOTAL MONEY MARKET FUNDS (Cost $164,682,422) |
164,682,422
|
TOTAL INVESTMENT PORTFOLIO - 98.0% (Cost $2,758,116,274) | 2,612,525,759 |
NET OTHER ASSETS (LIABILITIES) - 2.0% | 53,129,568 |
NET ASSETS - 100% | $ 2,665,655,327 |
Legend |
(a) Non-income producing |
(b) Affiliated fund that is available only to investment companies and other accounts managed by Fidelity Investments. The rate quoted is the annualized seven-day yield of the fund at period end. A complete unaudited listing of the fund's holdings as of its most recent quarter end is available upon request. In addition, each Fidelity Central Fund's financial statements, which are not covered by the Fund's Report of Independent Registered Public Accounting Firm, are available on the SEC's website or upon request. |
(c) Investment made with cash collateral received from securities on loan. |
(d) Security or a portion of the security is on loan at period end. |
Affiliated Central Funds |
Information regarding fiscal year to date income earned by the Fund from investments in Fidelity Central Funds is as follows: |
Fund | Income earned |
Fidelity Cash Central Fund | $ 160,159 |
Fidelity Securities Lending Cash Central Fund | 5,191,463 |
Total | $ 5,351,622 |
Other Affiliated Issuers |
An affiliated company is a company in which the Fund has ownership of at least 5% of the voting securities. Fiscal year to date transactions with companies which are or were affiliates are as follows: |
Affiliate | Value,
beginning of period | Purchases | Sales
Proceeds | Dividend
Income | Value,
end of
period |
Bulgari SpA | $ 203,182,267 | $ - | $ 281,121,110 | $ - | $ - |
Other Information |
The following is a summary of the inputs used, as of October 31, 2011, involving the Fund's assets and liabilities carried at fair value. The inputs or methodology used for valuing securities may not be an indication of the risk associated with investing in those securities. For more information on valuation inputs, and their aggregation into the levels used in the table below, please refer to the Security Valuation section in the accompanying Notes to Financial Statements. |
Valuation Inputs at Reporting Date: |
Description | Total | Level 1 | Level 2 | Level 3 |
Investments in Securities: | | | | |
Equities: | | | | |
France | $ 571,615,011 | $ 529,245,560 | $ 42,369,451 | $ - |
Germany | 436,303,263 | 349,786,333 | 86,516,930 | - |
Japan | 311,896,534 | 27,463,150 | 284,433,384 | - |
United Kingdom | 309,971,758 | 207,519,191 | 102,452,567 | - |
Australia | 116,107,000 | - | 116,107,000 | - |
Switzerland | 109,237,573 | 88,731,467 | 20,506,106 | - |
Italy | 100,893,823 | 70,738,280 | 30,155,543 | - |
Spain | 68,709,264 | 47,471,278 | 21,237,986 | - |
Belgium | 67,104,016 | 36,204,263 | 30,899,753 | - |
Other | 356,005,095 | 214,857,239 | 141,147,856 | - |
Money Market Funds | 164,682,422 | 164,682,422 | - | - |
Total Investments in Securities: | $ 2,612,525,759 | $ 1,736,699,183 | $ 875,826,576 | $ - |
Income Tax Information |
At October 31, 2011, the Fund had a capital loss carryforward of approximately $1,404,099,728 of which $464,379,963 and $939,719,765 will expire in fiscal 2016 and 2017, respectively. Capital loss carryforwards are only available to offset future capital gains of the Fund to the extent provided by regulations and may be limited. |
See accompanying notes which are an integral part of the financial statements.
Annual Report
Fidelity Overseas Fund
Statement of Assets and Liabilities
| October 31, 2011 |
| | |
Assets | | |
Investment in securities, at value (including securities loaned of $50,400,053) - See accompanying schedule: Unaffiliated issuers (cost $2,593,433,852) | $ 2,447,843,337 | |
Fidelity Central Funds (cost $164,682,422) | 164,682,422 | |
Total Investments (cost $2,758,116,274) | | $ 2,612,525,759 |
Receivable for investments sold | | 110,952,123 |
Receivable for fund shares sold | | 1,634,900 |
Dividends receivable | | 5,965,239 |
Distributions receivable from Fidelity Central Funds | | 23,470 |
Prepaid expenses | | 9,074 |
Other receivables | | 678,463 |
Total assets | | 2,731,789,028 |
| | |
Liabilities | | |
Payable for investments purchased | $ 6,836,279 | |
Payable for fund shares redeemed | 3,967,436 | |
Accrued management fee | 600,742 | |
Other affiliated payables | 587,074 | |
Other payables and accrued expenses | 270,655 | |
Collateral on securities loaned, at value | 53,871,515 | |
Total liabilities | | 66,133,701 |
| | |
Net Assets | | $ 2,665,655,327 |
Net Assets consist of: | | |
Paid in capital | | $ 4,192,677,485 |
Undistributed net investment income | | 64,516,366 |
Accumulated undistributed net realized gain (loss) on investments and foreign currency transactions | | (1,445,970,878) |
Net unrealized appreciation (depreciation) on investments and assets and liabilities in foreign currencies | | (145,567,646) |
Net Assets | | $ 2,665,655,327 |
| | |
Overseas:
Net Asset Value, offering price and redemption price per share ($2,215,717,141 ÷ 75,674,848 shares) | | $ 29.28 |
| | |
Class K:
Net Asset Value, offering price and redemption price per share ($291,322,522 ÷ 9,945,947 shares) | | $ 29.29 |
| | |
Class F:
Net Asset Value, offering price and redemption price per share ($158,615,664 ÷ 5,416,305 shares) | | $ 29.28 |
Statement of Operations
| Year ended October 31, 2011 |
| | |
Investment Income | | |
Dividends | | $ 106,408,357 |
Interest | | 341 |
Income from Fidelity Central Funds (including $5,191,463 from security lending) | | 5,351,622 |
Income before foreign taxes withheld | | 111,760,320 |
Less foreign taxes withheld | | (10,352,518) |
Total income | | 101,407,802 |
| | |
Expenses | | |
Management fee
Basic fee | $ 33,992,894 | |
Performance adjustment | (12,048,698) | |
Transfer agent fees | 9,056,901 | |
Accounting and security lending fees | 1,552,334 | |
Custodian fees and expenses | 591,988 | |
Independent trustees' compensation | 28,317 | |
Depreciation in deferred trustee compensation account | (202) | |
Registration fees | 55,135 | |
Audit | 96,290 | |
Legal | 31,934 | |
Interest | 11,891 | |
Miscellaneous | 69,904 | |
Total expenses before reductions | 33,438,688 | |
Expense reductions | (2,850,941) | 30,587,747 |
Net investment income (loss) | | 70,820,055 |
Realized and Unrealized Gain (Loss) Net realized gain (loss) on: | | |
Investment securities: | | |
Unaffiliated issuers | 153,344,292 | |
Other affiliated issuers | 128,743,195 | |
Foreign currency transactions | 507,807 | |
Total net realized gain (loss) | | 282,595,294 |
Change in net unrealized appreciation (depreciation) on: Investment securities | (435,576,882) | |
Assets and liabilities in foreign currencies | (825,030) | |
Total change in net unrealized appreciation (depreciation) | | (436,401,912) |
Net gain (loss) | | (153,806,618) |
Net increase (decrease) in net assets resulting from operations | | $ (82,986,563) |
See accompanying notes which are an integral part of the financial statements.
Annual Report
Fidelity Overseas Fund
Financial Statements - continued
Statement of Changes in Net Assets
| Year ended
October 31,
2011 | Year ended
October 31,
2010 |
Increase (Decrease) in Net Assets | | |
Operations | | |
Net investment income (loss) | $ 70,820,055 | $ 98,164,015 |
Net realized gain (loss) | 282,595,294 | 180,555,258 |
Change in net unrealized appreciation (depreciation) | (436,401,912) | 94,849,228 |
Net increase (decrease) in net assets resulting from operations | (82,986,563) | 373,568,501 |
Distributions to shareholders from net investment income | (92,196,839) | (108,455,793) |
Distributions to shareholders from net realized gain | - | (2,308,848) |
Total distributions | (92,196,839) | (110,764,641) |
Share transactions - net increase (decrease) | (3,671,962,139) | (771,649,789) |
Redemption fees | 112,180 | 54,523 |
Total increase (decrease) in net assets | (3,847,033,361) | (508,791,406) |
| | |
Net Assets | | |
Beginning of period | 6,512,688,688 | 7,021,480,094 |
End of period (including undistributed net investment income of $64,516,366 and undistributed net investment income of $85,893,161, respectively) | $ 2,665,655,327 | $ 6,512,688,688 |
Financial Highlights - Overseas
Years ended October 31, | 2011 | 2010 | 2009 | 2008 | 2007 |
Selected Per-Share Data | | | | | |
Net asset value, beginning of period | $ 31.56 | $ 30.13 | $ 25.43 | $ 58.39 | $ 47.08 |
Income from Investment Operations | | | | | |
Net investment income (loss) B | .47 | .42 | .52 | .55 | .70 |
Net realized and unrealized gain (loss) | (2.27) | 1.49 | 4.55 | (27.19) | 15.80 |
Total from investment operations | (1.80) | 1.91 | 5.07 | (26.64) | 16.50 |
Distributions from net investment income | (.48) | (.47) | (.37) | (.57) | (.55) |
Distributions from net realized gain | - | (.01) | - | (5.75) | (4.64) |
Total distributions | (.48) | (.48) | (.37) | (6.32) | (5.19) |
Redemption fees added to paid in capital B,F | - | - | - | - | - |
Net asset value, end of period | $ 29.28 | $ 31.56 | $ 30.13 | $ 25.43 | $ 58.39 |
Total Return A | (5.83)% | 6.33% | 20.44% | (50.88)% | 38.79% |
Ratios to Average Net Assets C,E | | | | | |
Expenses before reductions | .73% | .89% | 1.02% | 1.13% | .95% |
Expenses net of fee waivers, if any | .73% | .89% | 1.02% | 1.13% | .95% |
Expenses net of all reductions | .67% | .85% | .98% | 1.10% | .91% |
Net investment income (loss) | 1.44% | 1.41% | 2.01% | 1.33% | 1.43% |
Supplemental Data | | | | | |
Net assets, end of period (000 omitted) | $ 2,215,717 | $ 5,548,689 | $ 6,602,017 | $ 5,464,901 | $ 9,543,353 |
Portfolio turnover rate D | 77% | 111% | 115% | 113% | 87% |
A Total returns would have been lower if certain expenses had not been reduced during the applicable periods shown.
B Calculated based on average shares outstanding during the period.
C Fees and expenses of any underlying Fidelity Central Funds are not included in the Fund's expense ratio. The Fund indirectly bears its proportionate share of the expenses of any underlying Fidelity Central Funds.
D Amount does not include the portfolio activity of any underlying Fidelity Central Funds.
E Expense ratios reflect operating expenses of the class. Expenses before reductions do not reflect amounts reimbursed by the investment adviser or reductions from brokerage service arrangements or reductions from other expense offset arrangements and do not represent the amount paid by the class during periods when reimbursements or reductions occur. Expenses net of fee waivers reflect expenses after reimbursement by the investment adviser but prior to reductions from brokerage service arrangements or other expense offset arrangements. Expenses net of all reductions represent the net expenses paid by the class.
F Amount represents less than $.01 per share.
See accompanying notes which are an integral part of the financial statements.
Annual Report
Financial Highlights - Class K
Years ended October 31, | 2011 | 2010 | 2009 | 2008 G |
Selected Per-Share Data | | | | |
Net asset value, beginning of period | $ 31.59 | $ 30.16 | $ 25.45 | $ 45.00 |
Income from Investment Operations | | | | |
Net investment income (loss) D | .52 | .47 | .59 | .13 |
Net realized and unrealized gain (loss) | (2.27) | 1.50 | 4.54 | (19.68) |
Total from investment operations | (1.75) | 1.97 | 5.13 | (19.55) |
Distributions from net investment income | (.55) | (.53) | (.42) | - |
Distributions from net realized gain | - | (.01) | - | - |
Total distributions | (.55) | (.54) | (.42) | - |
Redemption fees added to paid in capital D,I | - | - | - | - |
Net asset value, end of period | $ 29.29 | $ 31.59 | $ 30.16 | $ 25.45 |
Total Return B,C | (5.67)% | 6.55% | 20.73% | (43.44)% |
Ratios to Average Net Assets E,H | | | | |
Expenses before reductions | .56% | .69% | .78% | .96% A |
Expenses net of fee waivers, if any | .55% | .69% | .78% | .96% A |
Expenses net of all reductions | .50% | .66% | .74% | .93% A |
Net investment income (loss) | 1.61% | 1.60% | 2.25% | 1.08% A |
Supplemental Data | | | | |
Net assets, end of period (000 omitted) | $ 291,323 | $ 368,004 | $ 383,048 | $ 44,277 |
Portfolio turnover rate F | 77% | 111% | 115% | 113% |
A Annualized
B Total returns for periods of less than one year are not annualized.
C Total returns would have been lower if certain expenses had not been reduced during the applicable periods shown.
D Calculated based on average shares outstanding during the period.
E Fees and expenses of any underlying Fidelity Central Funds are not included in the Fund's expense ratio. The Fund indirectly bears its proportionate share of the expenses of any underlying Fidelity Central Funds.
F Amount does not include the portfolio activity of any underlying Fidelity Central Funds.
G For the period May 9, 2008 (commencement of sale of shares) to October 31, 2008.
H Expense ratios reflect operating expenses of the class. Expenses before reductions do not reflect amounts reimbursed by the investment adviser or reductions from brokerage service arrangements or reductions from other expense offset arrangements and do not represent the amount paid by the class during periods when reimbursements or reductions occur. Expense ratios before reductions for start-up periods may not be representative of longer-term operating periods. Expenses net of fee waivers reflect expenses after reimbursement by the investment adviser but prior to reductions from brokerage service arrangements or other expense offset arrangements. Expenses net of all reductions represent the net expenses paid by the class.
I Amount represents less than $.01 per share.
Financial Highlights - Class F
Years ended October 31, | 2011 | 2010 | 2009 G |
Selected Per-Share Data | | | |
Net asset value, beginning of period | $ 31.58 | $ 30.15 | $ 26.62 |
Income from Investment Operations | | | |
Net investment income (loss) D | .54 | .48 | .07 |
Net realized and unrealized gain (loss) | (2.27) | 1.51 | 3.46 |
Total from investment operations | (1.73) | 1.99 | 3.53 |
Distributions from net investment income | (.57) | (.55) | - |
Distributions from net realized gain | - | (.01) | - |
Total distributions | (.57) | (.56) | - |
Redemption fees added to paid in capital D,I | - | - | - |
Net asset value, end of period | $ 29.28 | $ 31.58 | $ 30.15 |
Total Return B,C | (5.62)% | 6.60% | 13.26% |
Ratios to Average Net Assets E,H | | | |
Expenses before reductions | .51% | .64% | .68% A |
Expenses net of fee waivers, if any | .50% | .64% | .68% A |
Expenses net of all reductions | .45% | .60% | .64% A |
Net investment income (loss) | 1.67% | 1.66% | .70% A |
Supplemental Data | | | |
Net assets, end of period (000 omitted) | $ 158,616 | $ 595,995 | $ 36,415 |
Portfolio turnover rate F | 77% | 111% | 115% |
A Annualized
B Total returns for periods of less than one year are not annualized.
C Total returns would have been lower if certain expenses had not been reduced during the applicable periods shown.
D Calculated based on average shares outstanding during the period.
E Fees and expenses of any underlying Fidelity Central Funds are not included in the Fund's expense ratio. The Fund indirectly bears its proportionate share of the expenses of any underlying Fidelity Central Funds.
F Amount does not include the portfolio activity of any underlying Fidelity Central Funds.
G For the period June 26, 2009 (commencement of sale of shares) to October 31, 2009.
H Expense ratios reflect operating expenses of the class. Expenses before reductions do not reflect amounts reimbursed by the investment adviser or reductions from brokerage service arrangements or reductions from other expense offset arrangements and do not represent the amount paid by the class during periods when reimbursements or reductions occur. Expense ratios before reductions for start-up periods may not be representative of longer-term operating periods. Expenses net of fee waivers reflect expenses after reimbursement by the investment adviser but prior to reductions from brokerage service arrangements or other expense offset arrangements. Expenses net of all reductions represent the net expenses paid by the class.
I Amount represents less than $.01 per share.
See accompanying notes which are an integral part of the financial statements.
Annual Report
Notes to Financial Statements
For the period ended October 31, 2011
1. Organization.
Fidelity Overseas Fund (the Fund) is a fund of Fidelity Investment Trust (the Trust) and is authorized to issue an unlimited number of shares. The Trust is registered under the Investment Company Act of 1940, as amended (the 1940 Act), as an open-end management investment company organized as a Massachusetts business trust. The Fund offers Overseas, Class K and Class F shares, each of which has equal rights as to assets and voting privileges. Each class has exclusive voting rights with respect to matters that affect that class. Class F shares of the Fund are only available for purchase by mutual funds for which Fidelity Management & Research Company (FMR) or an affiliate serves as investment manager. Investment income, realized and unrealized capital gains and losses, the common expenses of the Fund, and certain fund-level expense reductions, if any, are allocated on a pro-rata basis to each class based on the relative net assets of each class to the total net assets of the Fund. Each class differs with respect to transfer agent fees incurred. Certain expense reductions may also differ by class. The Fund's investments in emerging markets can be subject to social, economic, regulatory, and political uncertainties and can be extremely volatile.
2. Investments in Fidelity Central Funds.
The Fund invests in Fidelity Central Funds, which are open-end investment companies available only to other investment companies and accounts managed by Fidelity Management & Research Company (FMR) and its affiliates. The Fund's Schedule of Investments lists each of the Fidelity Central Funds held as of period end, if any, as an investment of the Fund, but does not include the underlying holdings of each Fidelity Central Fund. As an Investing Fund, the Fund indirectly bears its proportionate share of the expenses of the underlying Fidelity Central Funds.
The Money Market Central Funds seek preservation of capital and current income and are managed by Fidelity Investments Money Management, Inc. (FIMM), an affiliate of FMR.
A complete unaudited list of holdings for each Fidelity Central Fund is available upon request or at the Securities and Exchange Commission (the SEC) web site at www.sec.gov. In addition, the financial statements of the Fidelity Central Funds, which are not covered by the Fund's Report of Independent Registered Public Accounting Firm are available on the SEC web site or upon request.
3. Significant Accounting Policies.
The financial statements have been prepared in conformity with accounting principles generally accepted in the United States of America (GAAP), which require management to make certain estimates and assumptions at the date of the financial statements. Actual results could differ from those estimates. Subsequent events, if any, through the date that the financial statements were issued have been evaluated in the preparation of the financial statements. The following summarizes the significant accounting policies of the Fund:
Security Valuation. Investments are valued as of 4:00 p.m. Eastern time on the last calendar day of the period. The Fund uses independent pricing services approved by the Board of Trustees to value its investments. When current market prices or quotations are not readily available or reliable, valuations may be determined in good faith in accordance with procedures adopted by the Board of Trustees. Factors used in determining value may include market or security specific events. The frequency with which these procedures are used cannot be predicted and they may be utilized to a significant extent. The value used for net asset value (NAV) calculation under these procedures may differ from published prices for the same securities.
The Fund categorizes the inputs to valuation techniques used to value its investments into a disclosure hierarchy consisting of three levels as shown below:
Level 1 - quoted prices in active markets for identical investments
Level 2 - other significant observable inputs (including quoted prices for similar investments, interest rates, prepayment speeds, etc.)
Level 3 - unobservable inputs (including the Fund's own assumptions based on the best information available)
Changes in valuation techniques may result in transfers in or out of an assigned level within the disclosure hierarchy. The aggregate value of investments by input level, as of October 31, 2011, is included at the end of the Fund's Schedule of Investments. Valuation techniques used to value the Fund's investments by major category are as follows:
Equity securities, including restricted securities, for which market quotations are readily available, are valued at the last reported sale price or official closing price as reported by an independent pricing service on the primary market or exchange on which they are traded and are categorized as Level 1 in the hierarchy. In the event there were no sales during the day or closing prices are not available, securities are valued at the last quoted bid price or may be valued using the last available price and are generally categorized as Level 2 in the hierarchy. For foreign equity securities, when significant market or security specific events arise, comparisons to the valuation of American Depositary Receipts (ADRs), futures contracts, Exchange-traded funds (ETFs) and certain indexes as well as quoted prices for similar securities are used and are categorized as Level 2 in the hierarchy in these circumstances. Utilizing these techniques may result in transfers between Level 1 and Level 2. For restricted equity securities and private placements where observable inputs are limited, assumptions about market activity and risk are used and are categorized as Level 3 in the hierarchy.
Annual Report
3. Significant Accounting Policies - continued
Security Valuation - continued
Investments in open-end mutual funds, including Fidelity Central Funds, are valued at their closing net asset value each business day and are categorized as Level 1 in the hierarchy.
Foreign Currency. The Fund may use foreign currency contracts to facilitate transactions in foreign-denominated securities. Gains and losses from these transactions may arise from changes in the value of the foreign currency or if the counterparties do not perform under the contracts' terms.
Foreign-denominated assets, including investment securities, and liabilities are translated into U.S. dollars at the exchange rate at period end. Purchases and sales of investment securities, income and dividends received and expenses denominated in foreign currencies are translated into U.S. dollars at the exchange rate in effect on the transaction date.
The effects of exchange rate fluctuations on investments are included with the net realized and unrealized gain (loss) on investment securities. Other foreign currency transactions resulting in realized and unrealized gain (loss) are disclosed separately.
Investment Transactions and Income. For financial reporting purposes, the Fund's investment holdings and NAV include trades executed through the end of the last business day of the period. The NAV per share for processing shareholder transactions is calculated as of the close of business of the New York Stock Exchange (NYSE), normally 4:00 p.m. Eastern time and includes trades executed through the end of the prior business day. Gains and losses on securities sold are determined on the basis of identified cost and may include proceeds received from litigation. Dividend income is recorded on the ex-dividend date, except for certain dividends from foreign securities where the ex-dividend date may have passed, which are recorded as soon as the Fund is informed of the ex-dividend date. Non-cash dividends included in dividend income, if any, are recorded at the fair market value of the securities received. Distributions received on securities that represent a return of capital or capital gain are recorded as a reduction of cost of investments and/or as a realized gain. The Fund estimates the components of distributions received that may be considered return of capital distributions or capital gain distributions. Interest income and distributions from the Fidelity Central Funds are accrued as earned. Interest income includes coupon interest and amortization of premium and accretion of discount on debt securities. Investment income is recorded net of foreign taxes withheld where recovery of such taxes is uncertain.
Expenses. Expenses directly attributable to a fund are charged to that fund. Expenses attributable to more than one fund are allocated among the respective funds on the basis of relative net assets or other appropriate methods. Expense estimates are accrued in the period to which they relate and adjustments are made when actual amounts are known.
Deferred Trustee Compensation. Under a Deferred Compensation Plan (the Plan), independent Trustees may elect to defer receipt of a portion of their annual compensation. Deferred amounts are invested in a cross-section of Fidelity funds, are marked-to-market and remain in the Fund until distributed in accordance with the Plan. The investment of deferred amounts and the offsetting payable to the Trustees are included in the accompanying Statement of Assets and Liabilities.
Income Tax Information and Distributions to Shareholders. Each year, the Fund intends to qualify as a regulated investment company, including distributing substantially all of its taxable income and realized gains under Subchapter M of the Internal Revenue Code and filing its U.S. federal tax return. As a result, no provision for income taxes is required. As of October 31, 2011, the Fund did not have any unrecognized tax benefits in the financial statements. A fund's federal tax return is subject to examination by the Internal Revenue Service (IRS) for a period of three years. Foreign taxes are provided for based on the Fund's understanding of the tax rules and rates that exist in the foreign markets in which it invests.
Distributions are declared and recorded on the ex-dividend date. Income dividends and capital gain distributions are declared separately for each class. Income and capital gain distributions are determined in accordance with income tax regulations, which may differ from GAAP.
Capital accounts within the financial statements are adjusted for permanent book-tax differences. These adjustments have no impact on net assets or the results of operations. Temporary book-tax differences will reverse in a subsequent period.
Book-tax differences are primarily due to foreign currency transactions, passive foreign investment companies (PFIC), deferred trustees compensation, capital loss carryforwards and losses deferred due to wash sales.
The federal tax cost of investment securities and unrealized appreciation (depreciation) as of period end were as follows:
Gross unrealized appreciation | $ 141,984,065 |
Gross unrealized depreciation | (330,927,046) |
Net unrealized appreciation (depreciation) on securities and other investments | $ (188,942,981) |
| |
Tax Cost | $ 2,801,468,740 |
Annual Report
Notes to Financial Statements - continued
3. Significant Accounting Policies - continued
Income Tax Information and Distributions to Shareholders - continued
The tax-based components of distributable earnings as of period end were as follows:
Undistributed ordinary income | $ 66,157,333 |
Capital Loss Carryfoward | $ (1,404,099,728) |
Net unrealized appreciation (depreciation) | $ (188,920,112) |
Under the recently enacted Regulated Investment Company Modernization Act of 2010 (the Act), the Fund will be permitted to carry forward capital losses incurred in taxable years beginning after December 22, 2010 for an unlimited period. However, any losses incurred during those future taxable years will be required to be utilized prior to any losses incurred in pre-enactment taxable years, which generally expire after eight years from when they are incurred. Additionally, post-enactment capital losses that are carried forward will retain their character as either short-term or long-term capital losses rather than being considered all short-term as under previous law. The Fund's first fiscal year end subject to the Act will be October 31, 2012.
The tax character of distributions paid was as follows:
| October 31, 2011 | October 31, 2010 |
Ordinary Income | $ 92,196,839 | $ 110,764,641 |
Short-Term Trading (Redemption) Fees. Shares held by investors in the Fund less than 30 days are subject to a redemption fee equal to 1.00% of the net asset value of shares redeemed. All redemption fees, which reduce the proceeds of the shareholder redemption, are retained by the Fund and accounted for as an addition to paid in capital.
New Accounting Pronouncement. In May 2011, the Financial Accounting Standards Board issued Accounting Standard Update No. 2011-04, Fair Value Measurement (Topic 820) - Amendments to Achieve Common Fair Value Measurement and Disclosure Requirements in U.S. GAAP and IFRSs. The update changes the wording used to describe the requirements in GAAP for measuring fair value and for disclosing information about fair value measurements. The update is effective during interim and annual periods beginning after December 15, 2011. Management is currently evaluating the impact of the update's adoption on the Fund's financial statement disclosures.
4. Purchases and Sales of Investments.
Purchases and sales of securities, other than short-term securities, aggregated $3,586,445,773 and $7,406,044,368, respectively.
5. Fees and Other Transactions with Affiliates.
Management Fee. FMR and its affiliates provide the Fund with investment management related services for which the Fund pays a monthly management fee. The management fee is the sum of an individual fund fee rate that is based on an annual rate of .45% of the Fund's average net assets and a group fee rate that averaged .26% during the period. The group fee rate is based upon the average net assets of all the mutual funds advised by FMR. The group fee rate decreases as assets under management increase and increases as assets under management decrease. In addition, the management fee is subject to a performance adjustment (up to a maximum of ± .20% of the Fund's average net assets over a 36 month performance period). The upward or downward adjustment to the management fee is based on the relative investment performance of Overseas as compared to an appropriate benchmark index. For the period, the total annual management fee rate, including the performance adjustment, was .46% of the Fund's average net assets.
Transfer Agent Fees. Fidelity Investments Institutional Operations Company, Inc. (FIIOC), an affiliate of FMR, is the transfer, dividend disbursing and shareholder servicing agent for each class of the Fund. FIIOC receives account fees and asset-based fees that vary according to the account size and type of account of the shareholders of Overseas. FIIOC receives an asset-based fee of Class K's average net assets. FIIOC receives no fees for providing transfer agency services to Class F. FIIOC pays for typesetting, printing and mailing of shareholder reports, except proxy statements. For the period, transfer agent fees for each class were as follows:
| Amount | % of
Average
Net Assets |
Overseas | $ 8,886,248 | .23 |
Class K | 170,653 | .05 |
| $ 9,056,901 | |
Annual Report
5. Fees and Other Transactions with Affiliates - continued
Accounting and Security Lending Fees. Fidelity Service Company, Inc. (FSC), an affiliate of FMR, maintains the Fund's accounting records. The accounting fee is based on the level of average net assets for the month. Under a separate contract, FSC administers the security lending program. The security lending fee is based on the number and duration of lending transactions.
Brokerage Commissions. The Fund placed a portion of its portfolio transactions with brokerage firms which are affiliates of the investment adviser. The commissions paid to these affiliated firms were $9,611 for the period.
Interfund Lending Program. Pursuant to an Exemptive Order issued by the SEC, the Fund, along with other registered investment companies having management contracts with FMR, may participate in an interfund lending program. This program provides an alternative credit facility allowing the funds to borrow from, or lend money to, other participating affiliated funds. At period end, there were no interfund loans outstanding. The Fund's activity in this program during the period for which loans were outstanding was as follows:
Borrower or Lender | Average Daily
Loan Balance | Weighted Average Interest Rate | Interest
Expense |
Borrower | $ 29,270,410 | .38% | $ 11,891 |
6. Committed Line of Credit.
The Fund participates with other funds managed by FMR or an affiliate in a $4.0 billion credit facility (the "line of credit") to be utilized for temporary or emergency purposes to fund shareholder redemptions or for other short-term liquidity purposes. The Fund has agreed to pay commitment fees on its pro-rata portion of the line of credit, which amounted to $16,069 and is reflected in Miscellaneous expenses on the Statement of Operations. During the period, there were no borrowings on this line of credit.
7. Security Lending.
The Fund lends portfolio securities through a lending agent from time to time in order to earn additional income. For equity securities, a lending agent is used and may loan securities to certain qualified borrowers, including Fidelity Capital Markets (FCM), a broker-dealer affiliated with the Fund. On the settlement date of the loan, the Fund receives collateral (in the form of U.S. Treasury obligations, letters of credit and/or cash) against the loaned securities and maintains collateral in an amount not less than 100% of the market value of the loaned securities during the period of the loan. The market value of the loaned securities is determined at the close of business of the Fund and any additional required collateral is delivered to the Fund on the next business day. If the borrower defaults on its obligation to return the securities loaned because of insolvency or other reasons, a fund could experience delays and costs in recovering the securities loaned or in gaining access to the collateral. Any cash collateral received is invested in the Fidelity Securities Lending Cash Central Fund. The value of loaned securities and cash collateral at period end are disclosed on the Fund's Statement of Assets and Liabilities. Security lending income represents the income earned on investing cash collateral, less rebates paid to borrowers and any lending agent fees associated with the loan, plus any premium payments received for lending certain types of securities. Security lending income is presented in the Statement of Operations as a component of income from Fidelity Central Funds and includes $7,328 from securities loaned to FCM.
8. Expense Reductions.
FMR voluntarily agreed to reimburse a portion of its management fee. For the period, the amount of this reimbursement was $375,674.
Many of the brokers with whom FMR places trades on behalf of the Fund provided services in addition to trade execution. These services included payments of certain expenses on behalf of the Fund totaling $2,474,743 for the period. In addition through arrangements with the Fund's custodian, credits realized as a result of uninvested cash balances were used to reduce the Fund's expenses. During the period, these credits reduced the Fund's custody expenses by $524.
Annual Report
Notes to Financial Statements - continued
9. Distributions to Shareholders.
Distributions to shareholders of each class were as follows:
Years ended October 31, | 2011 | 2010 |
From net investment income | | |
Overseas | $ 75,897,727 | $ 100,374,591 |
Class K | 6,408,873 | 6,711,130 |
Class F | 9,890,239 | 1,370,072 |
Total | $ 92,196,839 | $ 108,455,793 |
From net realized gain | | |
Overseas | $ - | $ 2,158,312 |
Class K | - | 126,111 |
Class F | - | 24,425 |
Total | $ - | $ 2,308,848 |
10. Share Transactions.
Transactions for each class of shares were as follows:
| Shares | Dollars |
Years ended October 31, | 2011 | 2010 | 2011 | 2010 |
Overseas | | | | |
Shares sold | 10,588,919 | 36,113,789 | $ 338,680,110 | $ 1,067,886,397 |
Reinvestment of distributions | 2,356,512 | 3,238,247 | 75,196,294 | 101,747,555 |
Shares redeemed | (113,084,725) | (82,678,886) | (3,611,089,764) | (2,430,908,864) |
Net increase (decrease) | (100,139,294) | (43,326,850) | $ (3,197,213,360) | $ (1,261,274,912) |
Class K | | | | |
Shares sold | 4,129,689 | 5,090,117 | $ 128,992,232 | $ 151,156,491 |
Reinvestment of distributions | 201,094 | 217,803 | 6,408,873 | 6,837,242 |
Shares redeemed | (6,034,878) | (6,358,836) | (198,074,826) | (189,093,826) |
Net increase (decrease) | (1,704,095) | (1,050,916) | $ (62,673,721) | $ (31,100,093) |
Class F | | | | |
Shares sold | 12,066,248 | 22,173,982 | $ 388,123,231 | $ 652,570,206 |
Reinvestment of distributions | 310,526 | 44,465 | 9,890,239 | 1,394,498 |
Shares redeemed | (25,830,866) | (4,555,729) | (810,088,528) | (133,239,488) |
Net increase (decrease) | (13,454,092) | 17,662,718 | $ (412,075,058) | $ 520,725,216 |
11. Other.
The Fund's organizational documents provide former and current trustees and officers with a limited indemnification against liabilities arising in connection with the performance of their duties to the Fund. In the normal course of business, the Fund may also enter into contracts that provide general indemnifications. The Fund's maximum exposure under these arrangements is unknown as this would be dependent on future claims that may be made against the Fund. The risk of material loss from such claims is considered remote.
Annual Report
Report of Independent Registered Public Accounting Firm
To the Trustees of Fidelity Investment Trust and the Shareholders of Fidelity Overseas Fund:
In our opinion, the accompanying statement of assets and liabilities, including the schedule of investments, and the related statements of operations and of changes in net assets and the financial highlights present fairly, in all material respects, the financial position of Fidelity Overseas Fund (a fund of Fidelity Investment Trust) at October 31, 2011, the results of its operations for the year then ended, the changes in its net assets for each of the two years in the period then ended and the financial highlights for each of the periods indicated, in conformity with accounting principles generally accepted in the United States of America. These financial statements and financial highlights (hereafter referred to as "financial statements") are the responsibility of the Fidelity Overseas Fund's management. Our responsibility is to express an opinion on these financial statements based on our audits. We conducted our audits of these financial statements in accordance with the standards of the Public Company Accounting Oversight Board (United States). Those standards require that we plan and perform the audit to obtain reasonable assurance about whether the financial statements are free of material misstatement. An audit includes examining, on a test basis, evidence supporting the amounts and disclosures in the financial statements, assessing the accounting principles used and significant estimates made by management, and evaluating the overall financial statement presentation. We believe that our audits, which included confirmation of securities at October 31, 2011 by correspondence with the custodian and brokers, provide a reasonable basis for our opinion.
PricewaterhouseCoopers LLP
Boston, Massachusetts
December 16, 2011
Annual Report
The Trustees, Members of the Advisory Board, and executive officers of the trust and fund, as applicable, are listed below. The Board of Trustees governs the fund and is responsible for protecting the interests of shareholders. The Trustees are experienced executives who meet periodically throughout the year to oversee the fund's activities, review contractual arrangements with companies that provide services to the fund, oversee management of the risks associated with such activities and contractual arrangements, and review the fund's performance. Except for James C. Curvey, each of the Trustees oversees 226 funds advised by FMR or an affiliate. Mr. Curvey oversees 429 funds advised by FMR or an affiliate.
The Trustees hold office without limit in time except that (a) any Trustee may resign; (b) any Trustee may be removed by written instrument, signed by at least two-thirds of the number of Trustees prior to such removal; (c) any Trustee who requests to be retired or who has become incapacitated by illness or injury may be retired by written instrument signed by a majority of the other Trustees; and (d) any Trustee may be removed at any special meeting of shareholders by a two-thirds vote of the outstanding voting securities of the trust. Each Trustee who is not an interested person (as defined in the 1940 Act) (Independent Trustee), shall retire not later than the last day of the calendar year in which his or her 75th birthday occurs. The Independent Trustees may waive this mandatory retirement age policy with respect to individual Trustees. The executive officers and Advisory Board Members hold office without limit in time, except that any officer and Advisory Board Member may resign or may be removed by a vote of a majority of the Trustees at any regular meeting or any special meeting of the Trustees. Except as indicated, each individual has held the office shown or other offices in the same company for the past five years.
Experience, Skills, Attributes, and Qualifications of the Fund's Trustees. The Governance and Nominating Committee has adopted a statement of policy that describes the experience, qualifications, attributes, and skills that are necessary and desirable for potential Independent Trustee candidates (Statement of Policy). The Board believes that each Trustee satisfied at the time he or she was initially elected or appointed a Trustee, and continues to satisfy, the standards contemplated by the Statement of Policy. The Governance and Nominating Committee also engages professional search firms to help identify potential Independent Trustee candidates who have the experience, qualifications, attributes, and skills consistent with the Statement of Policy. From time to time, additional criteria based on the composition and skills of the current Independent Trustees, as well as experience or skills that may be appropriate in light of future changes to board composition, business conditions, and regulatory or other developments, have also been considered by the professional search firms and the Governance and Nominating Committee. In addition, the Board takes into account the Trustees' commitment and participation in Board and committee meetings, as well as their leadership of standing and ad hoc committees throughout their tenure.
In determining that a particular Trustee was and continues to be qualified to serve as a Trustee, the Board has considered a variety of criteria, none of which, in isolation, was controlling. The Board believes that, collectively, the Trustees have balanced and diverse experience, qualifications, attributes, and skills, which allow the Board to operate effectively in governing the fund and protecting the interests of shareholders. Information about the specific experience, skills, attributes, and qualifications of each Trustee, which in each case led to the Board's conclusion that the Trustee should serve (or continue to serve) as a trustee of the fund, is provided below.
Board Structure and Oversight Function. James C. Curvey is an interested person (as defined in the 1940 Act) and currently serves as Acting Chairman. The Trustees have determined that an interested Chairman is appropriate and benefits shareholders because an interested Chairman has a personal and professional stake in the quality and continuity of services provided to the fund. Independent Trustees exercise their informed business judgment to appoint an individual of their choosing to serve as Chairman, regardless of whether the Trustee happens to be independent or a member of management. The Independent Trustees have determined that they can act independently and effectively without having an Independent Trustee serve as Chairman and that a key structural component for assuring that they are in a position to do so is for the Independent Trustees to constitute a substantial majority for the Board. The Independent Trustees also regularly meet in executive session. Ned C. Lautenbach serves as Chairman of the Independent Trustees and as such (i) acts as a liaison between the Independent Trustees and management with respect to matters important to the Independent Trustees and (ii) with management prepares agendas for Board meetings.
Fidelity funds are overseen by different Boards of Trustees. The fund's Board oversees Fidelity's equity and high income funds and another Board oversees Fidelity's investment-grade bond, money market, and asset allocation funds. The asset allocation funds may invest in Fidelity funds overseen by the fund's Board. The use of separate Boards, each with its own committee structure, allows the Trustees of each group of Fidelity funds to focus on the unique issues of the funds they oversee, including common research, investment, and operational issues. On occasion, the separate Boards establish joint committees to address issues of overlapping consequences for the Fidelity funds overseen by each Board.
The Trustees operate using a system of committees to facilitate the timely and efficient consideration of all matters of importance to the Trustees, the fund, and fund shareholders and to facilitate compliance with legal and regulatory requirements and oversight of the fund's activities and associated risks. The Board, acting through its committees, has charged FMR and its affiliates with (i) identifying events or circumstances the occurrence of which could have demonstrably adverse effects on the fund's business and/or reputation; (ii) implementing processes and controls to lessen the possibility that such events or circumstances occur or to mitigate the effects of such events or circumstances if they do occur; and (iii) creating and maintaining a system designed to evaluate continuously business and market conditions in order to facilitate the identification and implementation processes described in (i) and (ii) above. Because the day-to-day operations and activities of the fund are carried out by or through FMR, its affiliates and other service providers, the fund's exposure to risks is mitigated but not eliminated by the processes overseen by the Trustees. While each of the Board's committees has responsibility for overseeing different aspects of the fund's activities, oversight is exercised primarily through the Operations, Audit, and Compliance Committees. In addition, the Independent Trustees have worked with FMR to enhance the Board's oversight of investment and financial risks, legal and regulatory risks, technology risks, and operational risks, including the development of additional risk reporting to the Board. For example, a working group comprised of Independent Trustees and FMR has worked and continues to work to review the Fidelity funds' valuation-related activities, reporting and risk management. Appropriate personnel, including but not limited to the fund's Chief Compliance Officer (CCO), FMR's internal auditor, the independent accountants, the fund's Treasurer and portfolio management personnel, make periodic reports to the Board's committees, as appropriate, including an annual review of FMR's risk management program for the Fidelity funds. The responsibilities of each standing committee, including their oversight responsibilities, are described further under "Standing Committees of the Fund's Trustees."
Annual Report
Trustees and Officers - continued
The fund's Statement of Additional Information (SAI) includes more information about the Trustees. To request a free copy, call Fidelity at 1-800-835-5092.
Interested Trustees*:
Correspondence intended for each Trustee who is an interested person may be sent to Fidelity Investments, 82 Devonshire Street, Boston, Massachusetts 02109.
Name, Age; Principal Occupations and Other Relevant Experience+ |
James C. Curvey (76) |
| Year of Election or Appointment: 2007 Mr. Curvey is Trustee and Acting Chairman of the Board of Trustees of certain Trusts. Mr. Curvey also serves as Trustee (2007-present) of other investment companies advised by FMR. Mr. Curvey is a Director of Fidelity Investments Money Management, Inc. (2009-present), Director of Fidelity Research & Analysis Co. (2009-present) and Director of FMR and FMR Co., Inc. (2007-present). Mr. Curvey is also Vice Chairman (2007-present) and Director of FMR LLC. In addition, Mr. Curvey serves as an Overseer for the Boston Symphony Orchestra and a member of the Trustees of Villanova University. Previously, Mr. Curvey was the Vice Chairman (2006-2007) and Director (2000-2007) of FMR Corp. |
Ronald P. O'Hanley (54) |
| Year of Election or Appointment: 2011 Mr. O'Hanley is Director of FMR Co., Inc. (2010-present), Director of Fidelity Investments Money Management, Inc. (2010-present), Director of Fidelity Research & Analysis Company (2010-present), President of Fidelity Asset Management and Corporate Services and a member of Fidelity's Executive Committee (2010-present). Previously, Mr. O'Hanley served as President and Chief Executive Officer of BNY Mellon Asset Management (2007-2010). Mr. O'Hanley also served as Vice Chairman of Bank New York Mellon Corp. and a member of that firm's Executive Committee. Prior to the 2007 merger of The Bank of New York and Mellon Financial Corporation, he was Vice Chairman of Mellon Financial Corporation and President and Chief Executive Officer of Mellon Asset Management. He joined Mellon in February 1997. Mr. O'Hanley currently serves as Chairman of the Boston Public Library Foundation Board of Directors and sits on the Board of Directors of Beth Israel Deaconess Medical Center, the Board of Trustees of the Marine Biological Laboratory and the Advisory Board of the Maxwell School of Citizenship and Public Administration at Syracuse University. Mr. O'Hanley also chairs the Council on Asset Management for the Financial Services Roundtable and is a member of the Board of Directors of Institutional Investor's U.S. Institute. |
* Trustees have been determined to be "Interested Trustees" by virtue of, among other things, their affiliation with the trust or various entities under common control with FMR.
+ The information above includes each Trustee's principal occupation during the last five years and other information relating to the experience, attributes, and skills relevant to each Trustee's qualifications to serve as a Trustee, which led to the conclusion that each Trustee should serve as a Trustee for the fund.
Independent Trustees:
Correspondence intended for each Independent Trustee (that is, the Trustees other than the Interested Trustees) may be sent to Fidelity Investments, P.O. Box 55235, Boston, Massachusetts 02205-5235.
Name, Age; Principal Occupations and Other Relevant Experience+ |
Dennis J. Dirks (63) |
| Year of Election or Appointment: 2005 Prior to his retirement in May 2003, Mr. Dirks was Chief Operating Officer and a member of the Board of The Depository Trust & Clearing Corporation (DTCC). He also served as President, Chief Operating Officer, and Board member of The Depository Trust Company (DTC) and President and Board member of the National Securities Clearing Corporation (NSCC). In addition, Mr. Dirks served as Chief Executive Officer and Board member of the Government Securities Clearing Corporation, Chief Executive Officer and Board member of the Mortgage-Backed Securities Clearing Corporation, as a Trustee and a member of the Finance Committee of Manhattan College (2005-2008), and as a Trustee and a member of the Finance Committee of AHRC of Nassau County (2006-2008). Mr. Dirks is a member of the Independent Directors Council (IDC) Governing Council (2010-Present) and Board of Directors for The Brookville Center for Children's Services, Inc. (2009-present). |
Alan J. Lacy (58) |
| Year of Election or Appointment: 2008 Mr. Lacy serves as Senior Adviser (2007-present) of Oak Hill Capital Partners, L.P. (private equity). Mr. Lacy also served as Chief Executive Officer (2000-2005) and Vice Chairman (2005-2006) of Sears Holdings Corporation and Sears, Roebuck and Co. (retail). In addition, Mr. Lacy serves as a member of the Board of Directors of Dave & Buster's, Inc. (restaurant and entertainment complexes, 2010-present), The Hillman Companies, Inc. (hardware wholesalers, 2010-present), and Bristol-Myers Squibb Company (global pharmaceuticals, 2007-present). Mr. Lacy is a member of the Board of Trustees of The National Parks Conservation Association (2006-Present). Previously, Mr. Lacy served as Chairman of the Board of Trustees of the National Parks Conservation Association (2008-2011) and as a member of the Board of Directors for the Western Union Company (global money transfer, 2006-2011). |
Ned C. Lautenbach (67) |
| Year of Election or Appointment: 2000 Mr. Lautenbach is Chairman of the Independent Trustees of the Equity and High Income Funds (2006-present). Mr. Lautenbach currently serves as the Lead Director of the Eaton Corporation Board of Directors (diversified industrial, 1997-present). Mr. Lautenbach is also a member of the Board of Directors of the Philharmonic Center for the Arts in Naples, Florida (1999-present); a member of the Board of Trustees of Fairfield University (2005-present); and a member of the Council on Foreign Relations (1994-present). Previously, Mr. Lautenbach was a Partner/Advisory Partner at Clayton, Dubilier & Rice, LLC (private equity investment, 1998-2010), as well as a Director of Sony Corporation (2006-2007). |
Joseph Mauriello (67) |
| Year of Election or Appointment: 2008 Prior to his retirement in January 2006, Mr. Mauriello served in numerous senior management positions including Deputy Chairman and Chief Operating Officer (2004-2005), and Vice Chairman of Financial Services (2002-2004) of KPMG LLP US (professional services, 1965-2005). Mr. Mauriello currently serves as a member of the Board of Directors of XL Group plc. (global insurance and re-insurance, 2006-present) and of Arcadia Resources Inc. (health care services and products, 2007-present). Previously, Mr. Mauriello served as a Director of the Hamilton Funds of the Bank of New York (2006-2007). |
Robert W. Selander (61) |
| Year of Election or Appointment: 2011 Previously, Mr. Selander served as a Member of the Advisory Board of Fidelity's Equity and High Income Funds (2011), Executive Vice Chairman (2010), Chief Executive Officer (2009-2010), and President and Chief Executive Officer (1997-2009) of Mastercard, Inc. |
Cornelia M. Small (67) |
| Year of Election or Appointment: 2005 Ms. Small is a member of the Board of Directors of the Teagle Foundation (2009-present). Ms. Small is also a member of the Investment Committee, and Chair (2008-present) and a member of the Board of Trustees of Smith College. In addition, Ms. Small serves on the Investment Committee of the Berkshire Taconic Community Foundation (2008-present). Previously, Ms. Small served as Chairperson of the Investment Committee (2002-2008) of Smith College. In addition, Ms. Small served as Chief Investment Officer, Director of Global Equity Investments, and a member of the Board of Directors of Scudder, Stevens & Clark and Scudder Kemper Investments. |
William S. Stavropoulos (72) |
| Year of Election or Appointment: 2001 Mr. Stavropoulos is Vice Chairman of the Independent Trustees of the Equity and High Income Funds (2006-present). Mr. Stavropoulos serves as President and Founder of the Michigan Baseball Foundation, the Great Lakes Loons (2007-present). Mr. Stavropoulos is Chairman Emeritus of the Board of Directors of The Dow Chemical Company, where he previously served in numerous senior management positions, including President, CEO (1995-2000; 2002-2004), Chairman of the Executive Committee (2000-2006), and as a member of the Board of Directors (1990-2006). Currently, Mr. Stavropoulos is Chairman of Univar (global distributor of commodity and specialty chemicals, 2010-present), a Director of Teradata Corporation (data warehousing and technology solutions, 2008-present), Chemical Financial Corporation, Maersk Inc. (industrial conglomerate), Tyco International, Inc. (multinational manufacturing and services, 2007-present), and a member of the Advisory Board for Metalmark Capital (private equity investment, 2005-present). Mr. Stavropoulos is a special advisor to Clayton, Dubilier & Rice, LLC (private equity investment). In addition, Mr. Stavropoulos is a member of the University of Notre Dame Advisory Council for the College of Science. |
David M. Thomas (62) |
| Year of Election or Appointment: 2008 Previously, Mr. Thomas served as Executive Chairman (2005-2006) and Chairman and Chief Executive Officer (2000-2005) of IMS Health, Inc. (pharmaceutical and healthcare information solutions). In addition, Mr. Thomas serves as a member of the Board of Directors of Fortune Brands, Inc. (consumer products), and Interpublic Group of Companies, Inc. (marketing communication, 2004-present). |
Michael E. Wiley (61) |
| Year of Election or Appointment: 2008 Mr. Wiley also serves as a Director of Asia Pacific Exploration Consolidated (international oil and gas exploration and production, 2008-present). Mr. Wiley serves as a Director of Tesoro Corporation (independent oil refiner and marketer, 2005-present), and a Director of Bill Barrett Corporation (exploration and production, 2005-present). In addition, Mr. Wiley also serves as a Director of Post Oak Bank (privately-held bank, 2004-present). Previously, Mr. Wiley served as a member of the Board of Trustees of the University of Tulsa (2000-2006; 2007-2010), as a Senior Energy Advisor of Katzenbach Partners, LLC (consulting, 2006-2007), as an Advisory Director of Riverstone Holdings (private investment), Chairman, President, and CEO of Baker Hughes, Inc. (oilfield services, 2000-2004), and as Director of Spinnaker Exploration Company (exploration and production, 2001-2005). |
+ The information above includes each Trustee's principal occupation during the last five years and other information relating to the experience, attributes, and skills relevant to each Trustee's qualifications to serve as a Trustee, which led to the conclusion that each Trustee should serve as a Trustee for the fund.
Advisory Board Members and Executive Officers:
Correspondence intended for each executive officer, Edward C. Johnson 3d, and Peter S. Lynch may be sent to Fidelity Investments, 82 Devonshire Street, Boston, Massachusetts 02109.
Name, Age; Principal Occupation |
Edward C. Johnson 3d (81) |
| Year of Election or Appointment: 2011 Member of the Advisory Board of Fidelity's Equity and High Income Funds. Mr. Johnson serves as Chief Executive Officer, Chairman, and a Director of FMR LLC, and also serves as Chairman and Director of FIL Limited. Previously, Mr. Johnson served as a Trustee and Chairman of the Board of certain Fidelity Trusts, Chairman and a Director of FMR, Chairman and a Director of FMR Co., Inc., and President of FMR LLC (2006-2007). |
Peter S. Lynch (67) |
| Year of Election or Appointment: 2003 Member of the Advisory Board of Fidelity's Equity and High Income Funds. Mr. Lynch is Vice Chairman and a Director of FMR and FMR Co., Inc. In addition, Mr. Lynch serves as a Trustee of Boston College and as the Chairman of the Inner-City Scholarship Fund. Previously, Mr. Lynch served on the Special Olympics International Board of Directors (1997-2006). |
Kenneth B. Robins (42) |
| Year of Election or Appointment: 2008 President and Treasurer of Fidelity's Equity and High Income Funds. Mr. Robins also serves as President and Treasurer (2010-present) and Assistant Treasurer (2009-present) of other Fidelity funds and is an employee of Fidelity Investments (2004-present). Previously, Mr. Robins served as Deputy Treasurer of the Fidelity funds (2005-2008) and Treasurer and Chief Financial Officer of The North Carolina Capital Management Trust: Cash and Term Portfolios (2006-2008). |
Bruce T. Herring (46) |
| Year of Election or Appointment: 2006 Vice President of certain Equity Funds. Mr. Herring also serves as Chief Investment Officer and Director of Fidelity Management & Research (U.K.) Inc. (2010-present) and Group Chief Investments Officer of FMR. Previously, Mr. Herring served as Vice President (2005-2006) and Senior Vice President (2006-2007) of Fidelity Management & Research Company, Vice President of FMR Co., Inc. (2001-2007) and as a portfolio manager for Fidelity U.S. Equity Funds. |
Brian B. Hogan (47) |
| Year of Election or Appointment: 2009 Vice President of Equity and High Income Funds. Mr. Hogan also serves as President of FMR's Equity Division (2009-present). Previously, Mr. Hogan served as Senior Vice President, Equity Research of FMR (2006-2009) and as a portfolio manager. |
Scott C. Goebel (43) |
| Year of Election or Appointment: 2008 Secretary and Chief Legal Officer (CLO) of the Fidelity funds. Mr. Goebel also serves as Secretary of Fidelity Investments Money Management, Inc. (FIMM) (2010-present) and Fidelity Research and Analysis Company (FRAC) (2010-present); Secretary and CLO of The North Carolina Capital Management Trust: Cash and Term Portfolios (2008-present); General Counsel, Secretary, and Senior Vice President of FMR (2008-present) and FMR Co., Inc. (2008-present); employed by FMR LLC or an affiliate (2001-present); Chief Legal Officer of Fidelity Management & Research (Hong Kong) Limited (2008-present) and Assistant Secretary of Fidelity Management & Research (Japan) Inc. (2008-present), and Fidelity Management & Research (U.K.) Inc. (2008-present). Previously, Mr. Goebel served as Assistant Secretary of FIMM (2008-2010), FRAC (2008-2010), and the Funds (2007-2008) and as Vice President and Secretary of Fidelity Distributors Corporation (FDC) (2005-2007). |
William C. Coffey (42) |
| Year of Election or Appointment: 2009 Assistant Secretary of Fidelity's Equity and High Income Funds. Mr. Coffey also serves as Senior Vice President and Deputy General Counsel of FMR LLC (2010-present), and is an employee of Fidelity Investments. Previously, Mr. Coffey served as Vice President and Associate General Counsel of FMR LLC (2005-2009). |
Holly C. Laurent (57) |
| Year of Election or Appointment: 2008 Anti-Money Laundering (AML) Officer of the Fidelity funds. Ms. Laurent also serves as AML Officer of The North Carolina Capital Management Trust: Cash and Term Portfolios (2008-present) and is an employee of Fidelity Investments. Previously, Ms. Laurent was Senior Vice President and Head of Legal for Fidelity Business Services India Pvt. Ltd. (2006-2008), and Senior Vice President, Deputy General Counsel and Group Head for FMR LLC (2005-2006). |
Christine Reynolds (53) |
| Year of Election or Appointment: 2008 Chief Financial Officer of the Fidelity funds. Ms. Reynolds became President of Fidelity Pricing and Cash Management Services (FPCMS) in August 2008. Ms. Reynolds served as Chief Operating Officer of FPCMS (2007-2008). Previously, Ms. Reynolds served as President, Treasurer, and Anti-Money Laundering officer of the Fidelity funds (2004-2007). |
Kenneth A. Rathgeber (64) |
| Year of Election or Appointment: 2004 Chief Compliance Officer of Fidelity's Equity and High Income Funds. Mr. Rathgeber is Chief Compliance Officer of Fidelity Management & Research (Hong Kong) Limited (2008-present), Fidelity Management & Research (Japan) Inc. (2008-present), FMR (2005-present), FMR Co., Inc. (2005-present), Fidelity Management & Research (U.K.) Inc. (2005-present), Fidelity Research & Analysis Company (2005-present), Fidelity Investments Money Management, Inc. (2005-present), Pyramis Global Advisors, LLC (2005-present), and Strategic Advisers, Inc. (2005-present). |
Jeffrey S. Christian (50) |
| Year of Election or Appointment: 2009 Deputy Treasurer of the Fidelity funds. Mr. Christian is an employee of Fidelity Investments. Previously, Mr. Christian served as Chief Financial Officer (2008-2009) of certain Fidelity funds and Senior Vice President of Fidelity Pricing and Cash Management Services (FPCMS) (2004-2009). |
Joseph F. Zambello (54) |
| Year of Election or Appointment: 2011 Deputy Treasurer of the Fidelity funds. Mr. Zambello is an employee of Fidelity Investments. Previously, Mr. Zambello served as Vice President of FMR's Program Management Group (2009-2011) and Vice President of the Transfer Agent Oversight Group (2005-2009). |
Adrien E. Deberghes (44) |
| Year of Election or Appointment: 2008 Deputy Treasurer of Fidelity's Equity and High Income Funds. Mr. Deberghes also serves as Vice President and Assistant Treasurer of Fidelity Rutland Square Trust II and Fidelity Commonwealth Trust II (2011-present), Assistant Treasurer of other Fidelity funds (2010-present), and is an employee of Fidelity Investments (2008-present). Previously, Mr. Deberghes served as Senior Vice President of Mutual Fund Administration at State Street Corporation (2007-2008), Senior Director of Mutual Fund Administration at Investors Bank & Trust (2005-2007), and Director of Finance for Dunkin' Brands (2000-2005). |
Stephanie J. Dorsey (42) |
| Year of Election or Appointment: 2010 Assistant Treasurer of Fidelity's Equity and High Income Funds. Ms. Dorsey also serves as Deputy Treasurer of other Fidelity funds (2008-present) and is an employee of Fidelity Investments (2008-present). Previously, Ms. Dorsey served as Treasurer (2004-2008) of the JPMorgan Mutual Funds and Vice President (2004-2008) of JPMorgan Chase Bank. |
John R. Hebble (53) |
| Year of Election or Appointment: 2009 Assistant Treasurer of Fidelity's Equity and High Income Funds. Mr. Hebble also serves as President (2011-present), Treasurer, and Chief Financial Officer of The North Carolina Capital Management Trust: Cash and Term Portfolios (2008-present), President and Treasurer of other Fidelity funds (2008-present) and is an employee of Fidelity Investments. |
Gary W. Ryan (53) |
| Year of Election or Appointment: 2005 Assistant Treasurer of the Fidelity funds. Mr. Ryan is an employee of Fidelity Investments. Previously, Mr. Ryan served as Vice President of Fund Reporting in Fidelity Pricing and Cash Management Services (FPCMS) (1999-2005). |
Jonathan Davis (43) |
| Year of Election or Appointment: 2010 Assistant Treasurer of the Fidelity funds. Mr. Davis is also Assistant Treasurer of Fidelity Rutland Square Trust II and Fidelity Commonwealth Trust II. Mr. Davis is an employee of Fidelity Investments. Previously, Mr. Davis served as Vice President and Associate General Counsel of FMR LLC (2003-2010). |
Annual Report
The Board of Trustees of Fidelity Overseas Fund voted to pay to shareholders of record at the opening of business on record date, the following distributions per share derived from capital gains realized from sales of portfolio securities and dividends derived from net investment income:
| Pay Date | Record Date | Dividends | Capital Gains |
Class K | 12/05/11 | 12/02/11 | $0.918 | $0.020 |
Class K designates 100% of the dividend distributed during the fiscal year as amounts which may be taken into account as a dividend for purposes of the maximum rate under section 1(h)(11) of the Internal Revenue Code.
The amounts per share which represent income derived from sources within, and taxes paid to, foreign countries or possessions of the United States are $0.536 and $0.0294 for the dividend paid December 6th, 2010.
The fund will notify shareholders in January 2012 of amounts for use in preparing 2011 income tax returns.
Annual Report
Board Approval of Investment Advisory Contracts and Management Fees
Fidelity Overseas Fund
Each year, the Board of Trustees, including the Independent Trustees (together, the Board), votes on the renewal of the management contract and sub-advisory agreements (together, the Advisory Contracts) for the fund. The Board, assisted by the advice of fund counsel and Independent Trustees' counsel, requests and considers a broad range of information relevant to the renewal of the Advisory Contracts throughout the year.
The Board meets regularly and considers at each of its meetings factors that are relevant to its annual consideration of the renewal of the fund's Advisory Contracts, including the services and support provided to the fund and its shareholders. The Board has established various standing committees, each composed of Independent Trustees with varying backgrounds, to which the Board has assigned specific subject matter responsibilities in order to enhance effective decision-making by the Board. The Board, acting directly and through its Committees, requests and receives information concerning the annual consideration of the renewal of the fund's Advisory Contracts. The Board also meets as needed to consider matters specifically related to the Board's annual consideration of the renewal of Advisory Contracts. Members of the Board may also meet with trustees of other Fidelity funds through ad hoc joint committees to discuss certain matters relevant to the Fidelity funds.
At its July 2011 meeting, the Board of Trustees, including the Independent Trustees, unanimously determined to renew the fund's Advisory Contracts. In reaching its determination, the Board considered all factors it believed relevant, including (i) the nature, extent, and quality of the services to be provided to the fund and its shareholders (including the investment performance of the fund); (ii) the competitiveness of the fund's management fee and total expense ratio; (iii) the total costs of the services to be provided by and the profits to be realized by Fidelity from its relationship with the fund; (iv) the extent to which economies of scale would be realized as the fund grows; and (v) whether fee levels reflect these economies of scale, if any, for the benefit of fund shareholders.
In considering whether to renew the Advisory Contracts for the fund, the Board reached a determination, with the assistance of fund counsel and Independent Trustees' counsel and through the exercise of its business judgment, that the renewal of the Advisory Contracts is in the best interests of the fund and its shareholders and that the compensation payable under the Advisory Contracts is fair and reasonable. The Board's decision to renew the Advisory Contracts was not based on any single factor, but rather was based on a comprehensive consideration of all the information provided to the Board at its meetings throughout the year. The Board, in reaching its determination to renew the Advisory Contracts, is aware that shareholders in the fund have a broad range of investment choices available to them, including a wide choice among mutual funds offered by Fidelity's competitors, and that the fund's shareholders, who have the opportunity to review and weigh the disclosure provided by the fund in its prospectus and other public disclosures, have chosen to invest in this fund, managed by Fidelity.
Nature, Extent, and Quality of Services Provided. The Board considered the staffing within the investment adviser, FMR, and the sub-advisers (together, the Investment Advisers), including the backgrounds of the fund's investment personnel and the fund's investment objective and discipline. The Independent Trustees also had discussions with senior management of Fidelity's investment operations and investment groups. The Board considered the structure of the portfolio manager compensation program and whether this structure provides appropriate incentives to act in the best interests of the fund.
Resources Dedicated to Investment Management and Support Services. The Board and the Fund Oversight and Research Committees reviewed the general qualifications and capabilities of the Investment Advisers' investment staff, including its size, education, experience, and resources, as well as the Investment Advisers' approach to recruiting, training, managing, and compensating investment personnel. The Board also noted that FMR has devoted increased resources to non-U.S. offices. The Board noted that Fidelity's analysts have extensive resources, tools and capabilities which allow them to conduct sophisticated quantitative and fundamental analysis, as well as credit analysis of issuers, counterparties and enhancers. The Board also believes that Fidelity's investment professionals have sufficient access to global information and data so as to provide competitive investment results over time, and that those professionals also have access to sophisticated tools which permit them to assess portfolio construction and risk and performance attribution characteristics continuously, as well as to transmit new information and research conclusions rapidly around the world. Additionally, in their deliberations, the Board considered the Investment Advisers' trading capabilities and resources which are an integral part of the investment management process.
Shareholder and Administrative Services. The Board considered (i) the nature, extent, quality, and cost of advisory, administrative, and shareholder services performed by the Investment Advisers and their affiliates under the Advisory Contracts and under separate agreements covering transfer agency, pricing and bookkeeping, and securities lending services for the fund; (ii) the nature and extent of the investment adviser's supervision of third party service providers, principally custodians and subcustodians; and (iii) the resources devoted to, and the record of compliance with, the fund's compliance policies and procedures. The Board also reviewed the allocation of fund brokerage, including allocations to brokers affiliated with the Investment Advisers, the use of brokerage commissions to pay fund expenses, and the use of "soft" commission dollars to pay for research services.
The Board noted that the growth of fund assets over time across the complex allows Fidelity to reinvest in the development of services designed to enhance the value or convenience of the Fidelity funds as investment vehicles. These services include 24-hour access to account information and market information through telephone representatives and over the Internet, investor education materials and asset allocation tools, and the expanded availability of Fidelity Investor Centers, with 35 new branches opening since 2010.
Annual Report
Board Approval of Investment Advisory Contracts and Management Fees - continued
Investment in a Large Fund Family. The Board considered the benefits to shareholders of investing in a Fidelity fund, including the benefits of investing in a fund that is part of a large family of funds offering a variety of investment disciplines and providing a large variety of mutual fund investor services. The Board noted that Fidelity had taken, or had made recommendations that resulted in the Fidelity funds taking, a number of actions over the previous year that benefited particular funds, including (i) continuing to dedicate additional resources to investment research and support of the senior management team that oversees asset management; (ii) rationalizing product lines through the mergers of six funds into other funds; (iii) continuing to migrate the Freedom Funds to dedicated lower cost underlying funds; (iv) obtaining shareholder approval to broaden the investment strategies for Fidelity Consumer Finance Portfolio, Fidelity Emerging Asia Fund, and Fidelity Environment and Alternative Energy Portfolio; (v) contractually agreeing to reduce the management fees and impose other expense limitations on Spartan 500 Index Fund and U.S. Bond Index Fund in connection with launching new institutional classes of these funds; (vi) changing the name, primary and supplemental benchmarks, and investment policies of Fidelity Global Strategies Fund to support the fund's flexible investment mandate and global orientation; and (vii) reducing the transfer agency account fee rates on certain accounts.
Investment Performance. The Board considered whether the fund has operated in accordance with its investment objective, as well as its record of compliance with its investment restrictions. It also reviewed the fund's absolute investment performance for each class, as well as the fund's relative investment performance for each class measured over multiple periods against (i) a broad-based securities market index, and (ii) a peer group of mutual funds deemed appropriate by Fidelity and reviewed by the Board. The following charts considered by the Board show, over the one-, three-, and five-year periods ended December 31, 2010, as available, the cumulative total returns of Class F and the retail class of the fund, the cumulative total returns of a broad-based securities market index ("benchmark"), and a range of cumulative total returns of a peer group of mutual funds identified by Morningstar, Inc. as having an investment style similar to that of the fund based on underlying portfolio holdings. The returns of Class F and the retail class show the performance of the highest and lowest performing classes, respectively (based on one-year performance). The box within each chart shows the 25th percentile return (bottom of box) and the 75th percentile return (top of box) of the peer group. Returns shown above the box are in the first quartile and returns shown below the box are in the fourth quartile. The percentage beaten numbers noted below each chart correspond to the percentile box and represent the percentage of funds in the peer group whose performance was equal to or lower than that of the class indicated.
Fidelity Overseas Fund

The Board reviewed the fund's relative investment performance against its peer group and noted that the performance of the retail class of the fund (the class with the longest performance record) was in the fourth quartile for all the periods shown. The Board also noted that the investment performance of the fund was lower than its benchmark for all the periods shown. The Board considered that the variations in performance among the fund's classes reflect the variations in class expenses, which result in lower performance for higher expense classes. The Board discussed with FMR actions that have been taken by FMR to improve the fund's disappointing performance relative to its peer group and benchmark. The Board noted that this fund had underperformed in 2009 and discussed with FMR its disappointment with the continued underperformance of the fund. The Board also reviewed the fund's performance since inception as well as performance in the current year. The Board will continue to closely monitor the performance of the fund in the coming year and discuss with FMR other appropriate actions to address the performance of the fund.
The Board also considered that the fund's management fee is subject to upward or downward adjustment depending upon whether, and to what extent, the fund's investment performance for the performance period exceeds, or is exceeded by, the record (over the same period) of a Board-approved performance adjustment index. The Board noted that the performance adjustment provides FMR with a strong economic incentive to seek to achieve superior performance for the fund's shareholders and helps to more closely align the interests of FMR and the fund's shareholders.
Annual Report
Based on its review, the Board concluded that the nature, extent, and quality of services provided to the fund under the Advisory Contracts should benefit the fund's shareholders.
Competitiveness of Management Fee and Total Expense Ratio. The Board considered the fund's management fee and total expense ratio compared to "mapped groups" of competitive funds and classes. Fidelity creates "mapped groups" by combining similar Lipper investment objective categories that have comparable management fee characteristics. Combining Lipper investment objective categories aids the Board's management fee and total expense ratio comparisons by broadening the competitive group used for comparison and by reducing the number of universes to which various Fidelity funds are compared.
Management Fee. The Board considered two proprietary management fee comparisons for the 12-month periods shown in the chart below. The group of Lipper funds used by the Board for management fee comparisons is referred to below as the "Total Mapped Group." The Total Mapped Group comparison focuses on a fund's standing relative to the total universe of comparable funds available to investors in terms of gross management fees before expense reimbursements or caps, and without giving effect to the fund's performance adjustment. "TMG %" represents the percentage of funds in the Total Mapped Group that had management fees that were lower than the fund's. For example, a TMG % of 16% means that 84% of the funds in the Total Mapped Group had higher management fees than the fund. The "Asset-Size Peer Group" (ASPG) comparison focuses on a fund's standing relative to non-Fidelity funds similar in size to the fund within the Total Mapped Group. The ASPG represents at least 15% of the funds in the Total Mapped Group with comparable asset size and management fee characteristics, subject to a minimum of 50 funds (or all funds in the Total Mapped Group if fewer than 50). Additional information, such as the ASPG quartile in which the fund's management fee ranked and the impact of the fund's performance adjustment, is also included in the chart and considered by the Board.
Fidelity Overseas Fund

The Board noted that the fund's management fee ranked below the median of its Total Mapped Group and below the median of its ASPG for 2010. The Board also noted the effect of the fund's negative performance adjustment on the fund's management fee ranking. The Board noted that the performance adjustment for each year represents calculations for performance periods that differ from the periods shown in the performance charts above.
Based on its review, the Board concluded that the fund's management fee is fair and reasonable in light of the services that the fund receives and the other factors considered.
Total Expense Ratio. In its review of each class's total expense ratio, the Board considered the fund's management fee as well as other fund or class expenses, as applicable, such as transfer agent fees, pricing and bookkeeping fees, and custodial, legal, and audit fees. The Board also noted the effects of any waivers and reimbursements on fees and expenses, as well as the impact of the fund's performance adjustment. As part of its review, the Board also considered the current and historical total expense ratios of each class of the fund compared to competitive fund median expenses. Each class of the fund is compared to those funds and classes in the Total Mapped Group (used by the Board for management fee comparisons) that have a similar sales load structure.
Annual Report
Board Approval of Investment Advisory Contracts and Management Fees - continued
The Board noted that the total expense ratio of each class ranked below its competitive median for 2010. The Board considered that various factors, including 12b-1 fees, positive or negative performance adjustments, and relatively higher other expenses in the case of small fund size, can affect total expense ratios.
Fees Charged to Other Fidelity Clients. The Board also considered Fidelity fee structures and other information with respect to clients of FMR and its affiliates, such as other mutual funds advised or subadvised by FMR or its affiliates, pension plan clients, and other institutional clients. In March 2010, the Board created an ad hoc joint committee with the board of other Fidelity funds (the Committee) to review and compare Fidelity's institutional investment advisory business with its business of providing services to the Fidelity funds, including the differences in services provided, fees charged, and costs incurred, as well as competition in their respective marketplaces.
Based on its review of total expense ratios and fees charged to other Fidelity clients, the Board concluded that the total expense ratio of each class of the fund was reasonable in light of the services that the fund and its shareholders receive and the other factors considered, including the findings of the Committee.
Costs of the Services and Profitability. The Board considered the revenues earned and the expenses incurred by Fidelity in conducting the business of developing, marketing, distributing, managing, administering and servicing the fund and its shareholders. The Board also considered the level of Fidelity's profits in respect of all the Fidelity funds.
On an annual basis, FMR presents to the Board Fidelity's profitability for the fund. Fidelity calculates the profitability for each fund, as well as aggregate profitability for groups of Fidelity funds and all Fidelity funds, using a series of detailed revenue and cost allocation methodologies which originate with the books and records of Fidelity on which Fidelity's audited financial statements are based. The Audit Committee of the Board reviews any significant changes from the prior year's methodologies.
PricewaterhouseCoopers LLP (PwC), independent registered public accounting firm and auditor to Fidelity and certain Fidelity funds, has been engaged annually by the Board as part of the Board's assessment of Fidelity's profitability analysis. PwC's engagement includes the review and assessment of Fidelity's methodologies used in determining the revenues and expenses attributable to Fidelity's mutual fund business, and completion of agreed-upon procedures surrounding the mathematical accuracy of fund profitability and its conformity to allocation methodologies. After considering PwC's reports issued under the engagement and information provided by Fidelity, the Board concluded that while other allocation methods may also be reasonable, Fidelity's profitability methodologies are reasonable in all material respects.
The Board also reviewed Fidelity's non-fund businesses and fall-out benefits related to the mutual fund business as well as cases where Fidelity's affiliates may benefit from or be related to the fund's business.
The Board considered the costs of the services provided by and the profits realized by Fidelity in connection with the operation of the fund and was satisfied that the profitability was not excessive in the circumstances.
Economies of Scale. The Board considered whether there have been economies of scale in respect of the management of the Fidelity funds, whether the Fidelity funds (including the fund) have appropriately benefited from any such economies of scale, and whether there is potential for realization of any further economies of scale. The Board considered the extent to which the fund will benefit from economies of scale through increased services to the fund, through waivers or reimbursements, or through fee or expense reductions. The Board also noted that in 2009, it and the board of other Fidelity funds created an ad hoc committee (the Economies of Scale Committee) to analyze whether FMR attains economies of scale in respect of the management and servicing of the Fidelity funds, whether the Fidelity funds have appropriately benefited from such economies of scale, and whether there is potential for realization of any further economies of scale.
The Board recognized that the fund's management contract incorporates a "group fee" structure, which provides for lower group fee rates as total fund assets under FMR's management increase, and for higher group fee rates as total fund assets under FMR's management decrease. FMR calculates the group fee rates based on a tiered asset "breakpoint" schedule that varies based on asset class. The Board considered that the group fee is designed to deliver the benefits of economies of scale to fund shareholders when total Fidelity fund assets increase, even if assets of any particular fund are unchanged or have declined, because some portion of Fidelity's costs are attributable to services provided to all Fidelity funds, and all funds benefit if those costs can be allocated among more assets. The Board concluded that, given the group fee structure, fund shareholders will benefit from lower management fees as assets under FMR's management increase at the fund complex level, regardless of whether Fidelity achieves any such economies of scale.
The Board concluded, taking into account the analysis of the Economies of Scale Committee, that any potential economies of scale are being appropriately shared between fund shareholders and Fidelity.
Additional Information Requested by the Board. In order to develop fully the factual basis for consideration of the Fidelity funds' Advisory Contracts, the Board requested and received additional information on certain topics, including (i) fund performance trends, actions to be taken by FMR to improve certain funds' overall performance, and Fidelity's long-term strategies for certain funds; (ii) portfolio manager changes that have occurred during the past year and length of portfolio manager tenure for different categories of funds over time; (iii) Fidelity's compensation structure for portfolio managers and other key personnel and strategies for attracting and retaining non-investment personnel; (iv) the amount of the investment that each portfolio manager has made in the Fidelity fund(s) that he or she manages; (v) historical trends in Fidelity's realization of fall-out benefits; (vi) Fidelity's group fee structures and the rationale for the individual fee rates of certain funds; (vii) fund profitability methodology and the impact of certain factors on fund profitability results; (viii) trends regarding industry use of performance fee structures and Fidelity's compliance practices with respect to performance adjustment calculations; (ix) the fee structures in place for certain other Fidelity clients; and (x) explanations regarding the relative total expense ratios of certain funds and classes, total expense competitive trends, and actions that might be taken by FMR to reduce total expense ratios for certain funds and classes.
Annual Report
Based on its evaluation of all of the conclusions noted above, and after considering all factors it believed relevant, the Board ultimately concluded that the advisory fee structures are fair and reasonable, and that the fund's Advisory Contracts should be renewed.
Annual Report
Managing Your Investments
Fidelity offers several ways to conveniently manage your workplace benefits (including your workplace savings plan, investments, and additional services) via your telephone or PC. You can access your plan and account information and research your investments 24 hours a day.
By Phone
Fidelity provides a single toll-free number to access plan information, account balances, positions, and quotes*. It's easy to navigate the service, and on your first call, the system will help you create a personal identification number (PIN) for security.
(phone graphic)
Fidelity Workplace Investing
1-800-835-5092
By PC
Fidelity's web site on the Internet provides a wide range of information, including plan information, daily financial news, fund performance, interactive planning tools, and news about Fidelity products and services.
(computer graphic)
Fidelity's Web Site
www.401k.com
* When you call the quotes line, please remember that a fund's yield and return will vary and, except for money market funds, share price will also vary. This means that you may have a gain or loss when you sell your shares. There is no assurance that money market funds will be able to maintain a stable $1 share price; an investment in a money market fund is not insured or guaranteed by the U.S. government. Total returns are historical and include changes in share price, reinvestment of dividends and capital gains distributions, and the effects of any sales charges.
Annual Report
To Write Fidelity
We'll give your correspondence immediate attention and send you written confirmation upon completion of your request.
(letter graphic)
For Non-Retirement
Accounts
Buying shares
Fidelity Investments
P.O. Box 770001
Cincinnati, OH 45277-0003
Overnight Express
Fidelity Investments
Attn: Distribution Services
100 Crosby Parkway - KC1H
Covington, KY 41015
Selling shares
Fidelity Investments
P.O. Box 770001
Cincinnati, OH 45277-0035
Overnight Express
Fidelity Investments
Attn: Distribution Services
100 Crosby Parkway - KC1H
Covington, KY 41015
General Correspondence
Fidelity Investments
P.O. Box 500
Merrimack, NH 03054-0500
(letter graphic)
For Retirement
Accounts
Buying shares
Fidelity Investments
P.O. Box 770001
Cincinnati, OH 45277-0003
Selling shares
Fidelity Investments
P.O. Box 770001
Cincinnati, OH 45277-0035
Overnight Express
Fidelity Investments
Attn: Distribution Services
100 Crosby Parkway - KC1H
Covington, KY 41015
General Correspondence
Fidelity Investments
P.O. Box 500
Merrimack, NH 03054-0500
Annual Report
Investment Adviser
Fidelity Management & Research Company
Boston, MA
Investment Sub-Advisers
FMR Co., Inc.
Fidelity Management & Research (U.K.) Inc.
Fidelity Management & Research
(Hong Kong) Limited
Fidelity Management & Research
(Japan) Inc.
FIL Investment Advisors
FIL Investment Advisors (UK) Limited
FIL Investments (Japan) Limited
General Distributor
Fidelity Distributors Corporation
Boston, MA
Transfer and Service Agents
Fidelity Investments Institutional
Operations Company, Inc.
Boston, MA
Fidelity Service Company, Inc.
Boston, MA
Custodian
JPMorgan Chase Bank
New York, NY
(Fidelity Logo)
Corporate Headquarters
82 Devonshire St., Boston, MA 02109
www.fidelity.com
OVE-K-UANN-1211
1.863317.103
Fidelity®
Overseas
Fund -
Class F
Annual Report
October 31, 2011
(Fidelity Cover Art)
Contents
Performance | 4 | How the fund has done over time. |
Management's Discussion of Fund Performance | 5 | The Portfolio Manager's review of fundperformance and strategy. |
Shareholder Expense Example | 6 | An example of shareholder expenses. |
Investment Changes | 7 | A summary of major shifts in the fund's investments over the past six months. |
Investments | 9 | A complete list of the fund's investments with their market values. |
Financial Statements | 11 | Statements of assets and liabilities, operations, and changes in net assets, as well as financial highlights. |
Notes | 27 | Notes to the financial statements. |
Report of Independent Registered Public Accounting Firm | 37 | |
Trustees and Officers | 49 | |
Distributions | 50 | |
Board Approval of Investment Advisory Contracts and Management Fees | 61 | |
To view a fund's proxy voting guidelines and proxy voting record for the 12-month period ended June 30, visit http://www.fidelity.com/proxyvotingresults or visit the Securities and Exchange Commission's (SEC) web site at http://www.sec.gov. You may also call 1-800-835-5092 to request a free copy of the proxy voting guidelines.
Standard & Poor's, S&P and S&P 500 are registered service marks of The McGraw-Hill Companies, Inc. and have been licensed for use by Fidelity Distributors Corporation.
Other third party marks appearing herein are the property of their respective owners.
All other marks appearing herein are registered or unregistered trademarks or service marks of FMR LLC or an affiliated company.
This report and the financial statements contained herein are submitted for the general information of the shareholders of the fund. This report is not authorized for distribution to prospective investors in the fund unless preceded or accompanied by an effective prospectus.
A fund files its complete schedule of portfolio holdings with the SEC for the first and third quarters of each fiscal year on Form N-Q. Forms N-Q are available on the SEC's web site at http://www.sec.gov. A fund's Forms N-Q may be reviewed and copied at the SEC's Public Reference Room in Washington, DC. Information regarding the operation of the SEC's Public Reference Room may be obtained by calling 1-800-SEC-0330. For a complete list of a fund's portfolio holdings, view the most recent holdings listing, semiannual report, or annual report on Fidelity's web site at http://www.fidelity.com, http://www.advisor.fidelity.com, or http://www.401k.com, as applicable.
NOT FDIC INSURED • MAY LOSE VALUE • NO BANK GUARANTEE
Neither the fund nor Fidelity Distributors Corporation is a bank.
Annual Report
Performance: The Bottom Line
Average annual total return reflects the change in the value of an investment, assuming reinvestment of the class' distributions from dividend income and capital gains (the profits earned upon the sale of securities that have grown in value, if any) and assuming a constant rate of performance each year. The $10,000 table and the fund's returns do not reflect the deduction of taxes that a shareholder would pay on fund distributions or the redemption of fund shares. During periods of reimbursement by Fidelity, a fund's total returns will be greater than it would be had the reimbursement not occurred. How a fund did yesterday is no guarantee of how it will do tomorrow.
Average Annual Total Returns
Periods ended October 31, 2011 | Past 1
year | Past 5
years | Past 10
years |
Class F A | -5.62% | -3.74% | 4.51% |
A The initial offering of Class F shares took place on June 26, 2009. Returns prior to June 26, 2009 are those of Fidelity® Overseas Fund, the original class of the fund.
$10,000 Over 10 Years
Let's say hypothetically that $10,000 was invested in Fidelity® Overseas Fund - Class F, a class of the fund, on October 31, 2001. The chart shows how the value of your investment would have changed, and also shows how the MSCI® EAFE® (Europe, Australasia, Far East) Index performed over the same period. The initial offering of Class F took place on June 26, 2009. See above for additional information regarding the performance of Class F.
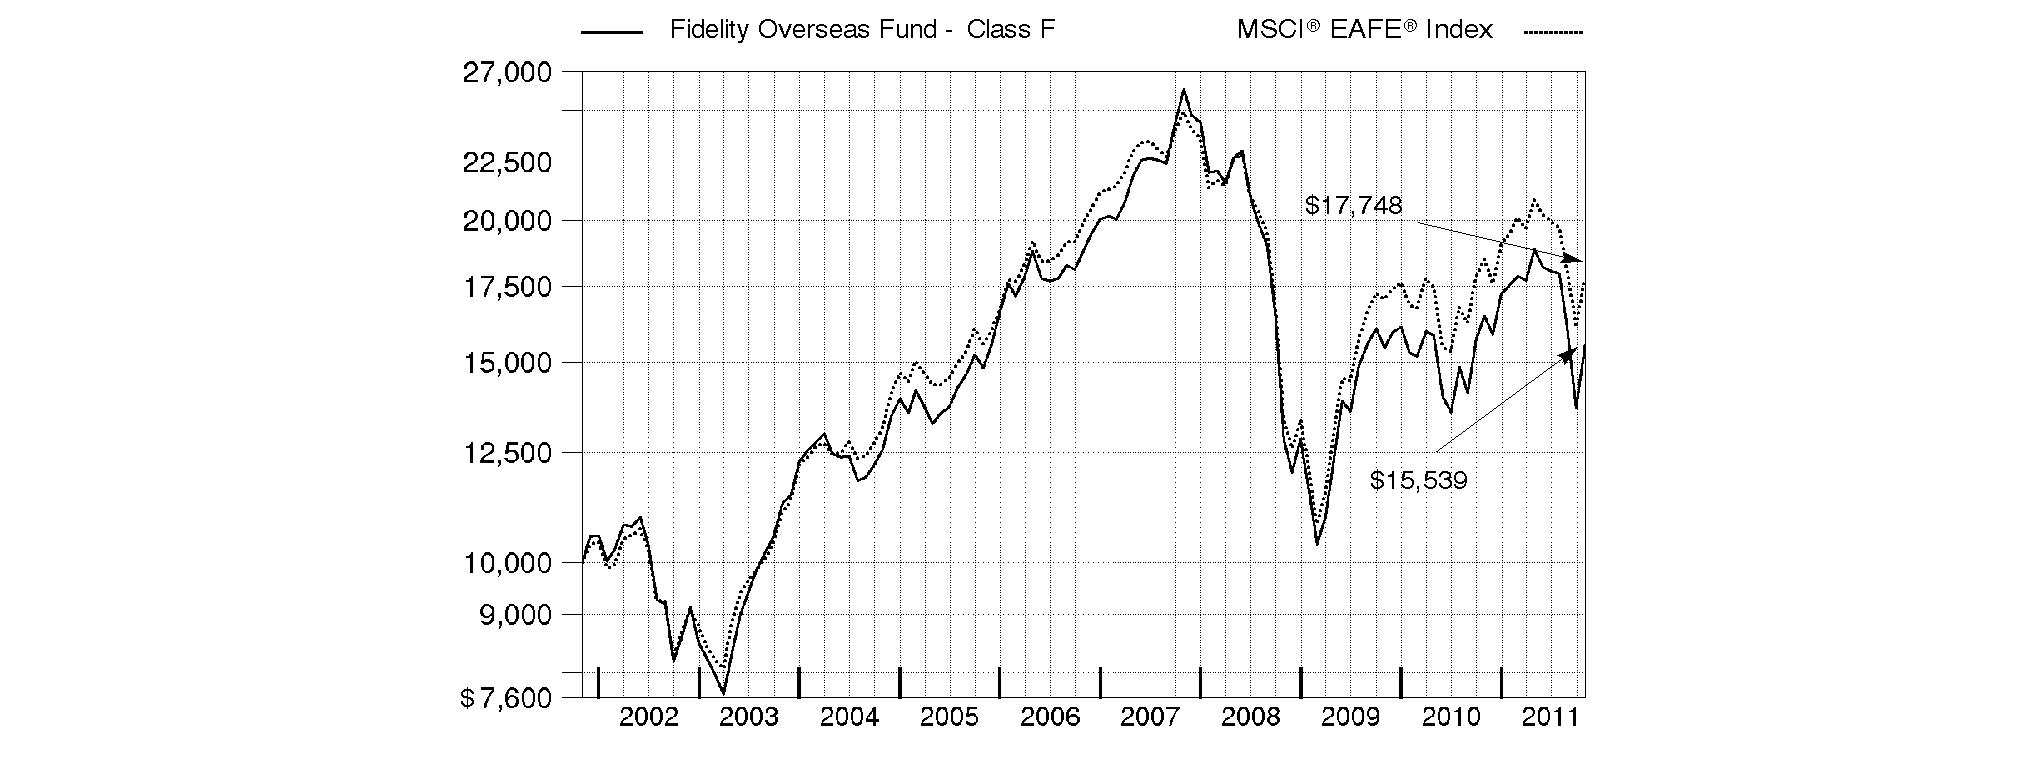
Annual Report
Management's Discussion of Fund Performance
Market Recap: International equities were rocked by a number of headline events during the year ending October 31, 2011. Stocks posted a solid advance for the first half of the period, despite concern about the sovereign debt crisis in Europe, a devastating earthquake and tsunami in Japan, and political upheaval in the Middle East and North Africa. Sentiment turned decidedly negative in the second half, however, as fresh worries about Europe, inflation in China and a dimmed outlook for global growth caused foreign markets to suffer declines that intensified in August and September. October brought with it yet another dramatic swing, as eurozone policymakers appeared near a resolution to the debt debacle and buyers stormed back onto the scene in search of bargains. Still, those gains - along with favorable currency fluctuations overall - weren't enough to offset prior losses, and the MSCI® ACWI® (All Country World Index) ex USA Index finished the period down 4.56%. Within the MSCI index, Europe and emerging markets suffered the biggest declines, with many countries in these areas sustaining steep losses. By contrast, Japan showed resilience in the wake of its natural disasters, falling only 2%. Australia (+4%), Switzerland (+3%), the U.K. (+2%) and Canada, which produced a nominal return, were among the few major benchmark components to break into positive territory.
Comments from Ian Hart, Portfolio Manager of Fidelity® Overseas Fund: For the year, the fund's Class F shares returned -5.62%, underperforming the -3.97% return of the MSCI® EAFE® (Europe, Australasia, Far East) Index. Stock picks in energy, information technology, telecommunication services and financials hurt, although my decision to underweight banks partially offset losses in the latter category. Geographically, security selection in the U.K. detracted, due in part to underweighting several mega-cap stocks such as oil producer and index component BP, which posted a double-digit gain. I sold BP by period end. Out-of-benchmark picks in emerging markets also held back performance. On an individual stock level, the fund was hurt by an overweighting in offshore drilling company Transocean, which owned the Deepwater Horizon rig that exploded in the Gulf of Mexico last year; NII Holdings, a U.S.-based operator of mobile networks in Latin America; and a small position in Norwegian oil-services company Sevan Marine, which I sold in June. Conversely, positioning in consumer discretionary aided performance, as did good stock picks and a sizable overweighting in food/beverage/tobacco. The fund's top relative contributor was Japan Tobacco, a strong defensive stock. In the luxury goods area, contributions included an out-of-index stake in luxury goods maker Bulgari, which was acquired in the period, and sold from the fund after the deal's March announcement, and stakes in spirits maker Pernod Ricard and luxury apparel maker Christian Dior, the fund's two largest holdings at period end. Strong security selection in Europe ex U.K. easily overshadowed the negative impact of various market weightings in some countries there.
The views expressed above reflect those of the portfolio manager(s) only through the end of the period as stated on the cover of this report and do not necessarily represent the views of Fidelity or any other person in the Fidelity organization. Any such views are subject to change at any time based upon market or other conditions and Fidelity disclaims any responsibility to update such views. These views may not be relied on as investment advice and, because investment decisions for a Fidelity fund are based on numerous factors, may not be relied on as an indication of trading intent on behalf of any Fidelity fund.
Annual Report
Fidelity Overseas Fund
Shareholder Expense Example
As a shareholder of the Fund, you incur two types of costs: (1) transaction costs, including redemption fees, and (2) ongoing costs, including management fees and other Fund expenses. This Example is intended to help you understand your ongoing costs (in dollars) of investing in the Fund and to compare these costs with the ongoing costs of investing in other mutual funds.
The Example is based on an investment of $1,000 invested at the beginning of the period and held for the entire period (May 1, 2011 to October 31, 2011).
Actual Expenses
The first line of the accompanying table for each class of the Fund provides information about actual account values and actual expenses. You may use the information in this line, together with the amount you invested, to estimate the expenses that you paid over the period. Simply divide your account value by $1,000.00 (for example, an $8,600 account value divided by $1,000.00 = 8.6), then multiply the result by the number in the first line for a class of the Fund under the heading entitled "Expenses Paid During Period" to estimate the expenses you paid on your account during this period. A small balance maintenance fee of $12.00 that is charged once a year may apply for certain accounts with a value of less than $2,000. This fee is not included in the table below. If it was, the estimate of expenses you paid during the period would be higher, and your ending account value lower, by this amount. In addition, the Fund, as a shareholder in the underlying Fidelity Central Funds, will indirectly bear its pro-rata share of the fees and expenses incurred by the underlying Fidelity Central Funds. These fees and expenses are not included in the Fund's annualized expense ratio used to calculate the expense estimate in the table below.
Hypothetical Example for Comparison Purposes
The second line of the accompanying table for each class of the Fund provides information about hypothetical account values and hypothetical expenses based on a Class' actual expense ratio and an assumed rate of return of 5% per year before expenses, which is not the Class' actual return. The hypothetical account values and expenses may not be used to estimate the actual ending account balance or expenses you paid for the period. You may use this information to compare the ongoing costs of investing in the Fund and other funds. To do so, compare this 5% hypothetical example with the 5% hypothetical examples that appear in the shareholder reports of the other funds. A small balance maintenance fee of $12.00 that is charged once a year may apply for certain accounts with a value of less than $2,000. This fee is not included in the table below. If it was, the estimate of expenses you paid during the period would be higher, and your ending account value lower, by this amount. In addition, the Fund, as a shareholder in the underlying Fidelity Central Funds, will indirectly bear its pro-rata share of the fees and expenses incurred by the underlying Fidelity Central Funds. These fees and expenses are not included in the Fund's annualized expense ratio used to calculate the expense estimate in the table below.
Please note that the expenses shown in the table are meant to highlight your ongoing costs only and do not reflect any transaction costs. Therefore, the second line of the table is useful in comparing ongoing costs only, and will not help you determine the relative total costs of owning different funds. In addition, if these transactional costs were included, your costs would have been higher.
| Annualized Expense Ratio | Beginning
Account Value
May 1, 2011 | Ending
Account Value
October 31, 2011 | Expenses Paid
During Period*
May 1, 2011 to October 31, 2011 |
Overseas | .69% | | | |
Actual | | $ 1,000.00 | $ 823.40 | $ 3.17 |
HypotheticalA | | $ 1,000.00 | $ 1,021.73 | $ 3.52 |
Class K | .52% | | | |
Actual | | $ 1,000.00 | $ 823.90 | $ 2.39 |
HypotheticalA | | $ 1,000.00 | $ 1,022.58 | $ 2.65 |
Class F | .46% | | | |
Actual | | $ 1,000.00 | $ 824.10 | $ 2.11 |
HypotheticalA | | $ 1,000.00 | $ 1,022.89 | $ 2.35 |
A 5% return per year before expenses
* Expenses are equal to each Class' annualized expense ratio, multiplied by the average account value over the period, multiplied by 184/365 (to reflect the one-half year period).
Annual Report
Fidelity Overseas Fund
Investment Changes (Unaudited)
Geographic Diversification (% of fund's net assets) |
As of October 31, 2011 |
| France | 21.4% | |
| Germany | 16.3% | |
| Japan | 11.7% | |
| United Kingdom | 11.6% | |
| United States of America | 8.6% | |
| Australia | 4.4% | |
| Switzerland | 4.1% | |
| Italy | 3.8% | |
| Spain | 2.6% | |
| Other | 15.5% | |

Percentages are adjusted for the effect of futures contracts, if applicable. |
As of April 30, 2011 |
| France | 21.7% | |
| Germany | 14.6% | |
| United Kingdom | 14.5% | |
| Japan | 14.2% | |
| Switzerland | 5.5% | |
| Italy | 3.9% | |
| United States of America | 3.4% | |
| Cayman Islands | 3.0% | |
| Norway | 2.4% | |
| Other | 16.8% | |

Percentages are adjusted for the effect of futures contracts, if applicable. |
Asset Allocation |
| % of fund's
net assets | % of fund's net assets
6 months ago |
Stocks | 91.8 | 97.6 |
Short-Term Investments and Net Other Assets | 8.2 | 2.4 |
Top Ten Stocks as of October 31, 2011 |
| % of fund's
net assets | % of fund's net assets
6 months ago |
Pernod Ricard SA (France, Beverages) | 7.0 | 5.7 |
Christian Dior SA (France, Textiles, Apparel & Luxury Goods) | 6.2 | 4.0 |
Porsche Automobil Holding SE (Germany) (Germany, Automobiles) | 5.6 | 1.3 |
SAP AG (Germany, Software) | 2.7 | 2.9 |
Mazda Motor Corp. (Japan, Automobiles) | 2.3 | 2.6 |
Saipem SpA (Italy, Energy Equipment & Services) | 1.5 | 2.3 |
The Swatch Group AG (Bearer) (Switzerland, Textiles, Apparel & Luxury Goods) | 1.5 | 1.5 |
Imperial Tobacco Group PLC (United Kingdom, Tobacco) | 1.5 | 1.9 |
BG Group PLC (United Kingdom, Oil, Gas & Consumable Fuels) | 1.4 | 1.0 |
WPP PLC (Bailiwick of Jersey, Media) | 1.4 | 1.2 |
| 31.1 | |
Market Sectors as of October 31, 2011 |
| % of fund's
net assets | % of fund's net assets
6 months ago |
Consumer Discretionary | 23.3 | 20.6 |
Financials | 15.4 | 13.7 |
Consumer Staples | 11.4 | 12.1 |
Materials | 10.1 | 12.6 |
Industrials | 7.5 | 10.8 |
Energy | 6.6 | 14.6 |
Information Technology | 6.6 | 7.6 |
Telecommunication Services | 5.9 | 2.2 |
Health Care | 3.1 | 2.1 |
Utilities | 1.9 | 1.3 |
Annual Report
Fidelity Overseas Fund
Investments October 31, 2011
Showing Percentage of Net Assets
Common Stocks - 85.5% |
| Shares | | Value |
Australia - 4.4% |
Australia & New Zealand Banking Group Ltd. | 1,214,597 | | $ 27,448,154 |
BHP Billiton Ltd. | 659,177 | | 25,805,692 |
Commonwealth Bank of Australia | 543,974 | | 27,946,636 |
Macquarie Group Ltd. | 439,886 | | 11,326,499 |
Newcrest Mining Ltd. | 667,135 | | 23,580,019 |
TOTAL AUSTRALIA | | 116,107,000 |
Bailiwick of Jersey - 1.6% |
Wolseley PLC | 189,900 | | 5,491,041 |
WPP PLC | 3,658,375 | | 37,875,145 |
TOTAL BAILIWICK OF JERSEY | | 43,366,186 |
Belgium - 2.5% |
Anheuser-Busch InBev SA NV | 557,112 | | 30,899,753 |
Groupe Bruxelles Lambert SA | 468,500 | | 36,204,263 |
TOTAL BELGIUM | | 67,104,016 |
Bermuda - 0.3% |
Li & Fung Ltd. | 4,008,000 | | 7,724,195 |
Brazil - 0.2% |
BM&F Bovespa SA | 1,062,400 | | 6,341,486 |
Canada - 0.6% |
Potash Corp. of Saskatchewan, Inc. | 320,200 | | 15,154,774 |
Cayman Islands - 2.3% |
3SBio, Inc. sponsored ADR (a) | 440,300 | | 5,067,853 |
China Medical System Holding Ltd. | 7,584,250 | | 5,568,755 |
Melco PBL Entertainment (Macau) Ltd. sponsored ADR (a)(d) | 2,693,500 | | 30,894,445 |
Minth Group Ltd. | 11,902,000 | | 12,349,112 |
Yingde Gases Group Co. Ltd. | 7,799,100 | | 8,317,251 |
TOTAL CAYMAN ISLANDS | | 62,197,416 |
Denmark - 0.9% |
Danske Bank A/S (a) | 493,663 | | 6,840,172 |
Novo Nordisk A/S Series B | 170,100 | | 18,061,767 |
TOTAL DENMARK | | 24,901,939 |
Finland - 0.5% |
Outotec Oyj | 258,300 | | 12,075,045 |
France - 21.4% |
Accor SA | 188,600 | | 6,200,139 |
Alcatel-Lucent SA sponsored ADR (a) | 4,144,600 | | 11,356,204 |
Alstom SA | 833,508 | | 31,259,626 |
Atos Origin SA | 205,351 | | 9,952,167 |
AXA SA | 882,837 | | 14,380,093 |
BNP Paribas SA | 387,126 | | 17,599,180 |
Cap Gemini SA | 253,800 | | 9,736,202 |
Christian Dior SA | 1,177,000 | | 166,631,386 |
Compagnie Generale de Geophysique SA (a) | 285,800 | | 6,245,460 |
EDF SA | 349,100 | | 10,488,524 |
GDF Suez | 272,000 | | 7,722,273 |
|
| Shares | | Value |
JC Decaux SA (a) | 289,800 | | $ 7,766,415 |
Laurent-Perrier Group | 100,819 | | 10,394,494 |
Pernod Ricard SA | 1,987,126 | | 185,623,904 |
Safran SA | 649,100 | | 21,262,512 |
Sanofi-aventis | 504,882 | | 36,123,991 |
Vivendi | 333,479 | | 7,499,401 |
Wendel SA | 152,300 | | 11,373,040 |
TOTAL FRANCE | | 571,615,011 |
Germany - 10.0% |
Allianz AG | 330,245 | | 37,115,086 |
BASF AG | 177,414 | | 13,059,381 |
Bayer AG | 305,997 | | 19,604,509 |
Deutsche Boerse AG | 201,492 | | 11,153,791 |
E.ON AG | 670,598 | | 16,249,990 |
HeidelbergCement AG | 325,329 | | 14,848,348 |
Linde AG | 181,207 | | 28,826,284 |
Metro AG | 118,700 | | 5,534,220 |
Munich Re Group | 120,668 | | 16,275,084 |
Puma AG | 34,100 | | 10,995,501 |
RWE AG | 171,000 | | 7,323,038 |
SAP AG | 1,175,607 | | 71,096,806 |
Siemens AG | 147,088 | | 15,420,124 |
TOTAL GERMANY | | 267,502,162 |
Hong Kong - 0.4% |
China Unicom (Hong Kong) Ltd. sponsored ADR (d) | 555,000 | | 11,161,050 |
India - 0.6% |
Bharti Airtel Ltd. | 1,886,222 | | 15,106,224 |
Ireland - 0.3% |
CRH PLC | 515,000 | | 9,319,038 |
Italy - 3.8% |
Ansaldo STS SpA | 334,000 | | 3,542,936 |
Assicurazioni Generali SpA | 327,500 | | 5,905,551 |
ENI SpA | 772,300 | | 17,073,321 |
Fiat Industrial SpA (a) | 1,326,000 | | 11,569,999 |
Intesa Sanpaolo SpA | 4,961,601 | | 8,864,470 |
Saipem SpA | 911,169 | | 40,855,324 |
Telecom Italia SpA | 10,512,400 | | 13,082,222 |
TOTAL ITALY | | 100,893,823 |
Japan - 11.7% |
Hitachi Ltd. | 4,459,000 | | 23,895,659 |
Honda Motor Co. Ltd. sponsored ADR | 918,500 | | 27,463,150 |
Japan Tobacco, Inc. | 5,295 | | 26,468,654 |
Keyence Corp. | 79,200 | | 20,136,072 |
Komatsu Ltd. | 448,400 | | 11,088,024 |
Kubota Corp. | 832,000 | | 6,853,386 |
Mazda Motor Corp. (a)(d) | 28,643,000 | | 60,213,771 |
Mitsubishi Corp. | 985,600 | | 20,273,393 |
Mitsubishi UFJ Financial Group, Inc. | 1,824,400 | | 7,929,742 |
Mitsui & Co. Ltd. | 629,200 | | 9,184,049 |
NTT DoCoMo, Inc. | 11,689 | | 20,762,821 |
Common Stocks - continued |
| Shares | | Value |
Japan - continued |
Rakuten, Inc. | 21,988 | | $ 24,107,109 |
SOFTBANK CORP. | 734,600 | | 23,844,961 |
Tokyo Electron Ltd. | 227,100 | | 12,079,516 |
Toshiba Corp. | 2,648,000 | | 11,550,453 |
Toto Ltd. | 727,000 | | 6,045,774 |
TOTAL JAPAN | | 311,896,534 |
Luxembourg - 0.5% |
ArcelorMittal SA Class A unit (d) | 585,300 | | 12,133,269 |
Mexico - 0.4% |
Cemex SA de CV sponsored ADR (d) | 2,631,800 | | 11,500,966 |
Netherlands - 0.8% |
AEGON NV (a) | 1,703,200 | | 8,123,645 |
ING Groep NV (Certificaten Van Aandelen) (a) | 1,512,300 | | 13,039,389 |
TOTAL NETHERLANDS | | 21,163,034 |
Norway - 1.3% |
Aker Solutions ASA | 1,572,717 | | 18,290,363 |
DnB NOR ASA | 752,800 | | 8,781,946 |
Kvaerner ASA (a) | 3,388,500 | | 6,530,391 |
TOTAL NORWAY | | 33,602,700 |
Spain - 2.6% |
Banco Bilbao Vizcaya Argentaria SA | 1,194,607 | | 10,752,920 |
Banco Santander SA: | | | |
rights 10/31/11 | 1,238,625 | | 214,267 |
(Spain) | 1,238,625 | | 10,485,066 |
Distribuidora Internacional de Alimentacion SA (a) | 377,987 | | 1,728,833 |
Iberdrola SA | 1,198,900 | | 8,723,851 |
Inditex SA | 142,852 | | 13,000,284 |
Telefonica SA sponsored ADR (d) | 1,113,900 | | 23,804,043 |
TOTAL SPAIN | | 68,709,264 |
Sweden - 0.8% |
Svenska Handelsbanken AB (A Shares) | 454,400 | | 13,096,266 |
Swedbank AB (A Shares) | 534,900 | | 7,535,883 |
TOTAL SWEDEN | | 20,632,149 |
Switzerland - 4.1% |
Credit Suisse Group | 318,706 | | 9,194,430 |
Julius Baer Group Ltd. | 125,480 | | 4,767,253 |
Pargesa Holding SA | 98,450 | | 7,724,098 |
The Swatch Group AG (Bearer) | 96,350 | | 40,799,567 |
Transocean Ltd. (United States) | 429,100 | | 24,523,065 |
UBS AG (a) | 894,783 | | 11,311,676 |
Zurich Financial Services AG | 47,010 | | 10,917,484 |
TOTAL SWITZERLAND | | 109,237,573 |
Taiwan - 0.2% |
HTC Corp. | 252,000 | | 5,663,335 |
|
| Shares | | Value |
Turkey - 1.3% |
Turkcell Iletisim Hizmet AS sponsored ADR (a) | 2,312,300 | | $ 28,487,536 |
Turkiye Garanti Bankasi AS | 1,580,000 | | 5,575,682 |
TOTAL TURKEY | | 34,063,218 |
United Kingdom - 11.6% |
AMEC PLC | 541,579 | | 8,060,803 |
Anglo American PLC (United Kingdom) | 421,000 | | 15,528,192 |
Barclays PLC | 6,045,110 | | 18,742,991 |
BG Group PLC | 1,749,782 | | 38,171,902 |
BHP Billiton PLC | 985,136 | | 31,027,214 |
British Sky Broadcasting Group PLC | 880,300 | | 9,966,517 |
Cairn Energy PLC (a) | 3,409,715 | | 16,154,402 |
Imperial Tobacco Group PLC | 1,081,219 | | 39,540,685 |
Lloyds Banking Group PLC (a) | 18,687,110 | | 9,665,340 |
Prudential PLC | 899,265 | | 9,290,341 |
Rio Tinto PLC | 623,310 | | 33,726,681 |
Rolls-Royce Group PLC | 2,829,400 | | 31,965,443 |
Rolls-Royce Group PLC Class C | 195,228,600 | | 313,967 |
Standard Chartered PLC (United Kingdom) | 952,374 | | 22,346,159 |
Xstrata PLC | 1,514,900 | | 25,471,121 |
TOTAL UNITED KINGDOM | | 309,971,758 |
United States of America - 0.4% |
NII Holdings, Inc. (a) | 420,700 | | 9,899,071 |
TOTAL COMMON STOCKS (Cost $2,415,469,001) |
2,279,042,236
|
Nonconvertible Preferred Stocks - 6.3% |
| | | |
Germany - 6.3% |
Porsche Automobil Holding SE (Germany) | 2,531,750 | | 148,503,851 |
Volkswagen AG | 115,668 | | 20,297,250 |
TOTAL NONCONVERTIBLE PREFERRED STOCKS (Cost $177,964,851) |
168,801,101
|
Money Market Funds - 6.2% |
| | | |
Fidelity Cash Central Fund, 0.12% (b) | 110,810,907 | | 110,810,907 |
Fidelity Securities Lending Cash Central Fund, 0.11% (b)(c) | 53,871,515 | | 53,871,515 |
TOTAL MONEY MARKET FUNDS (Cost $164,682,422) |
164,682,422
|
TOTAL INVESTMENT PORTFOLIO - 98.0% (Cost $2,758,116,274) | 2,612,525,759 |
NET OTHER ASSETS (LIABILITIES) - 2.0% | 53,129,568 |
NET ASSETS - 100% | $ 2,665,655,327 |
Legend |
(a) Non-income producing |
(b) Affiliated fund that is available only to investment companies and other accounts managed by Fidelity Investments. The rate quoted is the annualized seven-day yield of the fund at period end. A complete unaudited listing of the fund's holdings as of its most recent quarter end is available upon request. In addition, each Fidelity Central Fund's financial statements, which are not covered by the Fund's Report of Independent Registered Public Accounting Firm, are available on the SEC's website or upon request. |
(c) Investment made with cash collateral received from securities on loan. |
(d) Security or a portion of the security is on loan at period end. |
Affiliated Central Funds |
Information regarding fiscal year to date income earned by the Fund from investments in Fidelity Central Funds is as follows: |
Fund | Income earned |
Fidelity Cash Central Fund | $ 160,159 |
Fidelity Securities Lending Cash Central Fund | 5,191,463 |
Total | $ 5,351,622 |
Other Affiliated Issuers |
An affiliated company is a company in which the Fund has ownership of at least 5% of the voting securities. Fiscal year to date transactions with companies which are or were affiliates are as follows: |
Affiliate | Value,
beginning of period | Purchases | Sales
Proceeds | Dividend
Income | Value,
end of
period |
Bulgari SpA | $ 203,182,267 | $ - | $ 281,121,110 | $ - | $ - |
Other Information |
The following is a summary of the inputs used, as of October 31, 2011, involving the Fund's assets and liabilities carried at fair value. The inputs or methodology used for valuing securities may not be an indication of the risk associated with investing in those securities. For more information on valuation inputs, and their aggregation into the levels used in the table below, please refer to the Security Valuation section in the accompanying Notes to Financial Statements. |
Valuation Inputs at Reporting Date: |
Description | Total | Level 1 | Level 2 | Level 3 |
Investments in Securities: | | | | |
Equities: | | | | |
France | $ 571,615,011 | $ 529,245,560 | $ 42,369,451 | $ - |
Germany | 436,303,263 | 349,786,333 | 86,516,930 | - |
Japan | 311,896,534 | 27,463,150 | 284,433,384 | - |
United Kingdom | 309,971,758 | 207,519,191 | 102,452,567 | - |
Australia | 116,107,000 | - | 116,107,000 | - |
Switzerland | 109,237,573 | 88,731,467 | 20,506,106 | - |
Italy | 100,893,823 | 70,738,280 | 30,155,543 | - |
Spain | 68,709,264 | 47,471,278 | 21,237,986 | - |
Belgium | 67,104,016 | 36,204,263 | 30,899,753 | - |
Other | 356,005,095 | 214,857,239 | 141,147,856 | - |
Money Market Funds | 164,682,422 | 164,682,422 | - | - |
Total Investments in Securities: | $ 2,612,525,759 | $ 1,736,699,183 | $ 875,826,576 | $ - |
Income Tax Information |
At October 31, 2011, the Fund had a capital loss carryforward of approximately $1,404,099,728 of which $464,379,963 and $939,719,765 will expire in fiscal 2016 and 2017, respectively. Capital loss carryforwards are only available to offset future capital gains of the Fund to the extent provided by regulations and may be limited. |
See accompanying notes which are an integral part of the financial statements.
Annual Report
Fidelity Overseas Fund
Financial Statements
Statement of Assets and Liabilities
| October 31, 2011 |
| | |
Assets | | |
Investment in securities, at value (including securities loaned of $50,400,053) - See accompanying schedule: Unaffiliated issuers (cost $2,593,433,852) | $ 2,447,843,337 | |
Fidelity Central Funds (cost $164,682,422) | 164,682,422 | |
Total Investments (cost $2,758,116,274) | | $ 2,612,525,759 |
Receivable for investments sold | | 110,952,123 |
Receivable for fund shares sold | | 1,634,900 |
Dividends receivable | | 5,965,239 |
Distributions receivable from Fidelity Central Funds | | 23,470 |
Prepaid expenses | | 9,074 |
Other receivables | | 678,463 |
Total assets | | 2,731,789,028 |
| | |
Liabilities | | |
Payable for investments purchased | $ 6,836,279 | |
Payable for fund shares redeemed | 3,967,436 | |
Accrued management fee | 600,742 | |
Other affiliated payables | 587,074 | |
Other payables and accrued expenses | 270,655 | |
Collateral on securities loaned, at value | 53,871,515 | |
Total liabilities | | 66,133,701 |
| | |
Net Assets | | $ 2,665,655,327 |
Net Assets consist of: | | |
Paid in capital | | $ 4,192,677,485 |
Undistributed net investment income | | 64,516,366 |
Accumulated undistributed net realized gain (loss) on investments and foreign currency transactions | | (1,445,970,878) |
Net unrealized appreciation (depreciation) on investments and assets and liabilities in foreign currencies | | (145,567,646) |
Net Assets | | $ 2,665,655,327 |
| | |
Overseas:
Net Asset Value, offering price and redemption price per share ($2,215,717,141 ÷ 75,674,848 shares) | | $ 29.28 |
| | |
Class K:
Net Asset Value, offering price and redemption price per share ($291,322,522 ÷ 9,945,947 shares) | | $ 29.29 |
| | |
Class F:
Net Asset Value, offering price and redemption price per share ($158,615,664 ÷ 5,416,305 shares) | | $ 29.28 |
Statement of Operations
| Year ended October 31, 2011 |
| | |
Investment Income | | |
Dividends | | $ 106,408,357 |
Interest | | 341 |
Income from Fidelity Central Funds (including $5,191,463 from security lending) | | 5,351,622 |
Income before foreign taxes withheld | | 111,760,320 |
Less foreign taxes withheld | | (10,352,518) |
Total income | | 101,407,802 |
| | |
Expenses | | |
Management fee
Basic fee | $ 33,992,894 | |
Performance adjustment | (12,048,698) | |
Transfer agent fees | 9,056,901 | |
Accounting and security lending fees | 1,552,334 | |
Custodian fees and expenses | 591,988 | |
Independent trustees' compensation | 28,317 | |
Depreciation in deferred trustee compensation account | (202) | |
Registration fees | 55,135 | |
Audit | 96,290 | |
Legal | 31,934 | |
Interest | 11,891 | |
Miscellaneous | 69,904 | |
Total expenses before reductions | 33,438,688 | |
Expense reductions | (2,850,941) | 30,587,747 |
Net investment income (loss) | | 70,820,055 |
Realized and Unrealized Gain (Loss) Net realized gain (loss) on: | | |
Investment securities: | | |
Unaffiliated issuers | 153,344,292 | |
Other affiliated issuers | 128,743,195 | |
Foreign currency transactions | 507,807 | |
Total net realized gain (loss) | | 282,595,294 |
Change in net unrealized appreciation (depreciation) on: Investment securities | (435,576,882) | |
Assets and liabilities in foreign currencies | (825,030) | |
Total change in net unrealized appreciation (depreciation) | | (436,401,912) |
Net gain (loss) | | (153,806,618) |
Net increase (decrease) in net assets resulting from operations | | $ (82,986,563) |
See accompanying notes which are an integral part of the financial statements.
Annual Report
Statement of Changes in Net Assets
| Year ended
October 31,
2011 | Year ended
October 31,
2010 |
Increase (Decrease) in Net Assets | | |
Operations | | |
Net investment income (loss) | $ 70,820,055 | $ 98,164,015 |
Net realized gain (loss) | 282,595,294 | 180,555,258 |
Change in net unrealized appreciation (depreciation) | (436,401,912) | 94,849,228 |
Net increase (decrease) in net assets resulting from operations | (82,986,563) | 373,568,501 |
Distributions to shareholders from net investment income | (92,196,839) | (108,455,793) |
Distributions to shareholders from net realized gain | - | (2,308,848) |
Total distributions | (92,196,839) | (110,764,641) |
Share transactions - net increase (decrease) | (3,671,962,139) | (771,649,789) |
Redemption fees | 112,180 | 54,523 |
Total increase (decrease) in net assets | (3,847,033,361) | (508,791,406) |
| | |
Net Assets | | |
Beginning of period | 6,512,688,688 | 7,021,480,094 |
End of period (including undistributed net investment income of $64,516,366 and undistributed net investment income of $85,893,161, respectively) | $ 2,665,655,327 | $ 6,512,688,688 |
Financial Highlights - Overseas
Years ended October 31, | 2011 | 2010 | 2009 | 2008 | 2007 |
Selected Per-Share Data | | | | | |
Net asset value, beginning of period | $ 31.56 | $ 30.13 | $ 25.43 | $ 58.39 | $ 47.08 |
Income from Investment Operations | | | | | |
Net investment income (loss) B | .47 | .42 | .52 | .55 | .70 |
Net realized and unrealized gain (loss) | (2.27) | 1.49 | 4.55 | (27.19) | 15.80 |
Total from investment operations | (1.80) | 1.91 | 5.07 | (26.64) | 16.50 |
Distributions from net investment income | (.48) | (.47) | (.37) | (.57) | (.55) |
Distributions from net realized gain | - | (.01) | - | (5.75) | (4.64) |
Total distributions | (.48) | (.48) | (.37) | (6.32) | (5.19) |
Redemption fees added to paid in capital B,F | - | - | - | - | - |
Net asset value, end of period | $ 29.28 | $ 31.56 | $ 30.13 | $ 25.43 | $ 58.39 |
Total Return A | (5.83)% | 6.33% | 20.44% | (50.88)% | 38.79% |
Ratios to Average Net Assets C,E | | | | | |
Expenses before reductions | .73% | .89% | 1.02% | 1.13% | .95% |
Expenses net of fee waivers, if any | .73% | .89% | 1.02% | 1.13% | .95% |
Expenses net of all reductions | .67% | .85% | .98% | 1.10% | .91% |
Net investment income (loss) | 1.44% | 1.41% | 2.01% | 1.33% | 1.43% |
Supplemental Data | | | | | |
Net assets, end of period (000 omitted) | $ 2,215,717 | $ 5,548,689 | $ 6,602,017 | $ 5,464,901 | $ 9,543,353 |
Portfolio turnover rate D | 77% | 111% | 115% | 113% | 87% |
A Total returns would have been lower if certain expenses had not been reduced during the applicable periods shown.
B Calculated based on average shares outstanding during the period.
C Fees and expenses of any underlying Fidelity Central Funds are not included in the Fund's expense ratio. The Fund indirectly bears its proportionate share of the expenses of any underlying Fidelity Central Funds.
D Amount does not include the portfolio activity of any underlying Fidelity Central Funds.
E Expense ratios reflect operating expenses of the class. Expenses before reductions do not reflect amounts reimbursed by the investment adviser or reductions from brokerage service arrangements or reductions from other expense offset arrangements and do not represent the amount paid by the class during periods when reimbursements or reductions occur. Expenses net of fee waivers reflect expenses after reimbursement by the investment adviser but prior to reductions from brokerage service arrangements or other expense offset arrangements. Expenses net of all reductions represent the net expenses paid by the class.
F Amount represents less than $.01 per share.
See accompanying notes which are an integral part of the financial statements.
Annual Report
Financial Highlights - Class K
Years ended October 31, | 2011 | 2010 | 2009 | 2008 G |
Selected Per-Share Data | | | | |
Net asset value, beginning of period | $ 31.59 | $ 30.16 | $ 25.45 | $ 45.00 |
Income from Investment Operations | | | | |
Net investment income (loss) D | .52 | .47 | .59 | .13 |
Net realized and unrealized gain (loss) | (2.27) | 1.50 | 4.54 | (19.68) |
Total from investment operations | (1.75) | 1.97 | 5.13 | (19.55) |
Distributions from net investment income | (.55) | (.53) | (.42) | - |
Distributions from net realized gain | - | (.01) | - | - |
Total distributions | (.55) | (.54) | (.42) | - |
Redemption fees added to paid in capital D,I | - | - | - | - |
Net asset value, end of period | $ 29.29 | $ 31.59 | $ 30.16 | $ 25.45 |
Total Return B,C | (5.67)% | 6.55% | 20.73% | (43.44)% |
Ratios to Average Net Assets E,H | | | | |
Expenses before reductions | .56% | .69% | .78% | .96% A |
Expenses net of fee waivers, if any | .55% | .69% | .78% | .96% A |
Expenses net of all reductions | .50% | .66% | .74% | .93% A |
Net investment income (loss) | 1.61% | 1.60% | 2.25% | 1.08% A |
Supplemental Data | | | | |
Net assets, end of period (000 omitted) | $ 291,323 | $ 368,004 | $ 383,048 | $ 44,277 |
Portfolio turnover rate F | 77% | 111% | 115% | 113% |
A Annualized
B Total returns for periods of less than one year are not annualized.
C Total returns would have been lower if certain expenses had not been reduced during the applicable periods shown.
D Calculated based on average shares outstanding during the period.
E Fees and expenses of any underlying Fidelity Central Funds are not included in the Fund's expense ratio. The Fund indirectly bears its proportionate share of the expenses of any underlying Fidelity Central Funds.
F Amount does not include the portfolio activity of any underlying Fidelity Central Funds.
G For the period May 9, 2008 (commencement of sale of shares) to October 31, 2008.
H Expense ratios reflect operating expenses of the class. Expenses before reductions do not reflect amounts reimbursed by the investment adviser or reductions from brokerage service arrangements or reductions from other expense offset arrangements and do not represent the amount paid by the class during periods when reimbursements or reductions occur. Expense ratios before reductions for start-up periods may not be representative of longer-term operating periods. Expenses net of fee waivers reflect expenses after reimbursement by the investment adviser but prior to reductions from brokerage service arrangements or other expense offset arrangements. Expenses net of all reductions represent the net expenses paid by the class.
I Amount represents less than $.01 per share.
Financial Highlights - Class F
Years ended October 31, | 2011 | 2010 | 2009 G |
Selected Per-Share Data | | | |
Net asset value, beginning of period | $ 31.58 | $ 30.15 | $ 26.62 |
Income from Investment Operations | | | |
Net investment income (loss) D | .54 | .48 | .07 |
Net realized and unrealized gain (loss) | (2.27) | 1.51 | 3.46 |
Total from investment operations | (1.73) | 1.99 | 3.53 |
Distributions from net investment income | (.57) | (.55) | - |
Distributions from net realized gain | - | (.01) | - |
Total distributions | (.57) | (.56) | - |
Redemption fees added to paid in capital D,I | - | - | - |
Net asset value, end of period | $ 29.28 | $ 31.58 | $ 30.15 |
Total Return B,C | (5.62)% | 6.60% | 13.26% |
Ratios to Average Net Assets E,H | | | |
Expenses before reductions | .51% | .64% | .68% A |
Expenses net of fee waivers, if any | .50% | .64% | .68% A |
Expenses net of all reductions | .45% | .60% | .64% A |
Net investment income (loss) | 1.67% | 1.66% | .70% A |
Supplemental Data | | | |
Net assets, end of period (000 omitted) | $ 158,616 | $ 595,995 | $ 36,415 |
Portfolio turnover rate F | 77% | 111% | 115% |
A Annualized
B Total returns for periods of less than one year are not annualized.
C Total returns would have been lower if certain expenses had not been reduced during the applicable periods shown.
D Calculated based on average shares outstanding during the period.
E Fees and expenses of any underlying Fidelity Central Funds are not included in the Fund's expense ratio. The Fund indirectly bears its proportionate share of the expenses of any underlying Fidelity Central Funds.
F Amount does not include the portfolio activity of any underlying Fidelity Central Funds.
G For the period June 26, 2009 (commencement of sale of shares) to October 31, 2009.
H Expense ratios reflect operating expenses of the class. Expenses before reductions do not reflect amounts reimbursed by the investment adviser or reductions from brokerage service arrangements or reductions from other expense offset arrangements and do not represent the amount paid by the class during periods when reimbursements or reductions occur. Expense ratios before reductions for start-up periods may not be representative of longer-term operating periods. Expenses net of fee waivers reflect expenses after reimbursement by the investment adviser but prior to reductions from brokerage service arrangements or other expense offset arrangements. Expenses net of all reductions represent the net expenses paid by the class.
I Amount represents less than $.01 per share.
See accompanying notes which are an integral part of the financial statements.
Annual Report
Notes to Financial Statements
For the period ended October 31, 2011
1. Organization.
Fidelity Overseas Fund (the Fund) is a fund of Fidelity Investment Trust (the Trust) and is authorized to issue an unlimited number of shares. The Trust is registered under the Investment Company Act of 1940, as amended (the 1940 Act), as an open-end management investment company organized as a Massachusetts business trust. The Fund offers Overseas, Class K and Class F shares, each of which has equal rights as to assets and voting privileges. Each class has exclusive voting rights with respect to matters that affect that class. Class F shares of the Fund are only available for purchase by mutual funds for which Fidelity Management & Research Company (FMR) or an affiliate serves as investment manager. Investment income, realized and unrealized capital gains and losses, the common expenses of the Fund, and certain fund-level expense reductions, if any, are allocated on a pro-rata basis to each class based on the relative net assets of each class to the total net assets of the Fund. Each class differs with respect to transfer agent fees incurred. Certain expense reductions may also differ by class. The Fund's investments in emerging markets can be subject to social, economic, regulatory, and political uncertainties and can be extremely volatile.
2. Investments in Fidelity Central Funds.
The Fund invests in Fidelity Central Funds, which are open-end investment companies available only to other investment companies and accounts managed by Fidelity Management & Research Company (FMR) and its affiliates. The Fund's Schedule of Investments lists each of the Fidelity Central Funds held as of period end, if any, as an investment of the Fund, but does not include the underlying holdings of each Fidelity Central Fund. As an Investing Fund, the Fund indirectly bears its proportionate share of the expenses of the underlying Fidelity Central Funds.
The Money Market Central Funds seek preservation of capital and current income and are managed by Fidelity Investments Money Management, Inc. (FIMM), an affiliate of FMR.
A complete unaudited list of holdings for each Fidelity Central Fund is available upon request or at the Securities and Exchange Commission (the SEC) web site at www.sec.gov. In addition, the financial statements of the Fidelity Central Funds, which are not covered by the Fund's Report of Independent Registered Public Accounting Firm are available on the SEC web site or upon request.
3. Significant Accounting Policies.
The financial statements have been prepared in conformity with accounting principles generally accepted in the United States of America (GAAP), which require management to make certain estimates and assumptions at the date of the financial statements. Actual results could differ from those estimates. Subsequent events, if any, through the date that the financial statements were issued have been evaluated in the preparation of the financial statements. The following summarizes the significant accounting policies of the Fund:
Security Valuation. Investments are valued as of 4:00 p.m. Eastern time on the last calendar day of the period. The Fund uses independent pricing services approved by the Board of Trustees to value its investments. When current market prices or quotations are not readily available or reliable, valuations may be determined in good faith in accordance with procedures adopted by the Board of Trustees. Factors used in determining value may include market or security specific events. The frequency with which these procedures are used cannot be predicted and they may be utilized to a significant extent. The value used for net asset value (NAV) calculation under these procedures may differ from published prices for the same securities.
The Fund categorizes the inputs to valuation techniques used to value its investments into a disclosure hierarchy consisting of three levels as shown below:
Level 1 - quoted prices in active markets for identical investments
Level 2 - other significant observable inputs (including quoted prices for similar investments, interest rates, prepayment speeds, etc.)
Level 3 - unobservable inputs (including the Fund's own assumptions based on the best information available)
Changes in valuation techniques may result in transfers in or out of an assigned level within the disclosure hierarchy. The aggregate value of investments by input level, as of October 31, 2011, is included at the end of the Fund's Schedule of Investments. Valuation techniques used to value the Fund's investments by major category are as follows:
Equity securities, including restricted securities, for which market quotations are readily available, are valued at the last reported sale price or official closing price as reported by an independent pricing service on the primary market or exchange on which they are traded and are categorized as Level 1 in the hierarchy. In the event there were no sales during the day or closing prices are not available, securities are valued at the last quoted bid price or may be valued using the last available price and are generally categorized as Level 2 in the hierarchy. For foreign equity securities, when significant market or security specific events arise, comparisons to the valuation of American Depositary Receipts (ADRs), futures contracts, Exchange-traded funds (ETFs) and certain indexes as well as quoted prices for similar securities are used and are categorized as Level 2 in the hierarchy in these circumstances. Utilizing these techniques may result in transfers between Level 1 and Level 2. For restricted equity securities and private placements where observable inputs are limited, assumptions about market activity and risk are used and are categorized as Level 3 in the hierarchy.
Annual Report
Notes to Financial Statements - continued
3. Significant Accounting Policies - continued
Security Valuation - continued
Investments in open-end mutual funds, including Fidelity Central Funds, are valued at their closing net asset value each business day and are categorized as Level 1 in the hierarchy.
Foreign Currency. The Fund may use foreign currency contracts to facilitate transactions in foreign-denominated securities. Gains and losses from these transactions may arise from changes in the value of the foreign currency or if the counterparties do not perform under the contracts' terms.
Foreign-denominated assets, including investment securities, and liabilities are translated into U.S. dollars at the exchange rate at period end. Purchases and sales of investment securities, income and dividends received and expenses denominated in foreign currencies are translated into U.S. dollars at the exchange rate in effect on the transaction date.
The effects of exchange rate fluctuations on investments are included with the net realized and unrealized gain (loss) on investment securities. Other foreign currency transactions resulting in realized and unrealized gain (loss) are disclosed separately.
Investment Transactions and Income. For financial reporting purposes, the Fund's investment holdings and NAV include trades executed through the end of the last business day of the period. The NAV per share for processing shareholder transactions is calculated as of the close of business of the New York Stock Exchange (NYSE), normally 4:00 p.m. Eastern time and includes trades executed through the end of the prior business day. Gains and losses on securities sold are determined on the basis of identified cost and may include proceeds received from litigation. Dividend income is recorded on the ex-dividend date, except for certain dividends from foreign securities where the ex-dividend date may have passed, which are recorded as soon as the Fund is informed of the ex-dividend date. Non-cash dividends included in dividend income, if any, are recorded at the fair market value of the securities received. Distributions received on securities that represent a return of capital or capital gain are recorded as a reduction of cost of investments and/or as a realized gain. The Fund estimates the components of distributions received that may be considered return of capital distributions or capital gain distributions. Interest income and distributions from the Fidelity Central Funds are accrued as earned. Interest income includes coupon interest and amortization of premium and accretion of discount on debt securities. Investment income is recorded net of foreign taxes withheld where recovery of such taxes is uncertain.
Expenses. Expenses directly attributable to a fund are charged to that fund. Expenses attributable to more than one fund are allocated among the respective funds on the basis of relative net assets or other appropriate methods. Expense estimates are accrued in the period to which they relate and adjustments are made when actual amounts are known.
Deferred Trustee Compensation. Under a Deferred Compensation Plan (the Plan), independent Trustees may elect to defer receipt of a portion of their annual compensation. Deferred amounts are invested in a cross-section of Fidelity funds, are marked-to-market and remain in the Fund until distributed in accordance with the Plan. The investment of deferred amounts and the offsetting payable to the Trustees are included in the accompanying Statement of Assets and Liabilities.
Income Tax Information and Distributions to Shareholders. Each year, the Fund intends to qualify as a regulated investment company, including distributing substantially all of its taxable income and realized gains under Subchapter M of the Internal Revenue Code and filing its U.S. federal tax return. As a result, no provision for income taxes is required. As of October 31, 2011, the Fund did not have any unrecognized tax benefits in the financial statements. A fund's federal tax return is subject to examination by the Internal Revenue Service (IRS) for a period of three years. Foreign taxes are provided for based on the Fund's understanding of the tax rules and rates that exist in the foreign markets in which it invests.
Distributions are declared and recorded on the ex-dividend date. Income dividends and capital gain distributions are declared separately for each class. Income and capital gain distributions are determined in accordance with income tax regulations, which may differ from GAAP.
Capital accounts within the financial statements are adjusted for permanent book-tax differences. These adjustments have no impact on net assets or the results of operations. Temporary book-tax differences will reverse in a subsequent period.
Book-tax differences are primarily due to foreign currency transactions, passive foreign investment companies (PFIC), deferred trustees compensation, capital loss carryforwards and losses deferred due to wash sales.
The federal tax cost of investment securities and unrealized appreciation (depreciation) as of period end were as follows:
Gross unrealized appreciation | $ 141,984,065 |
Gross unrealized depreciation | (330,927,046) |
Net unrealized appreciation (depreciation) on securities and other investments | $ (188,942,981) |
| |
Tax Cost | $ 2,801,468,740 |
Annual Report
3. Significant Accounting Policies - continued
Income Tax Information and Distributions to Shareholders - continued
The tax-based components of distributable earnings as of period end were as follows:
Undistributed ordinary income | $ 66,157,333 |
Capital Loss Carryfoward | $ (1,404,099,728) |
Net unrealized appreciation (depreciation) | $ (188,920,112) |
Under the recently enacted Regulated Investment Company Modernization Act of 2010 (the Act), the Fund will be permitted to carry forward capital losses incurred in taxable years beginning after December 22, 2010 for an unlimited period. However, any losses incurred during those future taxable years will be required to be utilized prior to any losses incurred in pre-enactment taxable years, which generally expire after eight years from when they are incurred. Additionally, post-enactment capital losses that are carried forward will retain their character as either short-term or long-term capital losses rather than being considered all short-term as under previous law. The Fund's first fiscal year end subject to the Act will be October 31, 2012.
The tax character of distributions paid was as follows:
| October 31, 2011 | October 31, 2010 |
Ordinary Income | $ 92,196,839 | $ 110,764,641 |
Short-Term Trading (Redemption) Fees. Shares held by investors in the Fund less than 30 days are subject to a redemption fee equal to 1.00% of the net asset value of shares redeemed. All redemption fees, which reduce the proceeds of the shareholder redemption, are retained by the Fund and accounted for as an addition to paid in capital.
New Accounting Pronouncement. In May 2011, the Financial Accounting Standards Board issued Accounting Standard Update No. 2011-04, Fair Value Measurement (Topic 820) - Amendments to Achieve Common Fair Value Measurement and Disclosure Requirements in U.S. GAAP and IFRSs. The update changes the wording used to describe the requirements in GAAP for measuring fair value and for disclosing information about fair value measurements. The update is effective during interim and annual periods beginning after December 15, 2011. Management is currently evaluating the impact of the update's adoption on the Fund's financial statement disclosures.
4. Purchases and Sales of Investments.
Purchases and sales of securities, other than short-term securities, aggregated $3,586,445,773 and $7,406,044,368, respectively.
5. Fees and Other Transactions with Affiliates.
Management Fee. FMR and its affiliates provide the Fund with investment management related services for which the Fund pays a monthly management fee. The management fee is the sum of an individual fund fee rate that is based on an annual rate of .45% of the Fund's average net assets and a group fee rate that averaged .26% during the period. The group fee rate is based upon the average net assets of all the mutual funds advised by FMR. The group fee rate decreases as assets under management increase and increases as assets under management decrease. In addition, the management fee is subject to a performance adjustment (up to a maximum of ± .20% of the Fund's average net assets over a 36 month performance period). The upward or downward adjustment to the management fee is based on the relative investment performance of Overseas as compared to an appropriate benchmark index. For the period, the total annual management fee rate, including the performance adjustment, was .46% of the Fund's average net assets.
Transfer Agent Fees. Fidelity Investments Institutional Operations Company, Inc. (FIIOC), an affiliate of FMR, is the transfer, dividend disbursing and shareholder servicing agent for each class of the Fund. FIIOC receives account fees and asset-based fees that vary according to the account size and type of account of the shareholders of Overseas. FIIOC receives an asset-based fee of Class K's average net assets. FIIOC receives no fees for providing transfer agency services to Class F. FIIOC pays for typesetting, printing and mailing of shareholder reports, except proxy statements. For the period, transfer agent fees for each class were as follows:
| Amount | % of
Average
Net Assets |
Overseas | $ 8,886,248 | .23 |
Class K | 170,653 | .05 |
| $ 9,056,901 | |
Annual Report
Notes to Financial Statements - continued
5. Fees and Other Transactions with Affiliates - continued
Accounting and Security Lending Fees. Fidelity Service Company, Inc. (FSC), an affiliate of FMR, maintains the Fund's accounting records. The accounting fee is based on the level of average net assets for the month. Under a separate contract, FSC administers the security lending program. The security lending fee is based on the number and duration of lending transactions.
Brokerage Commissions. The Fund placed a portion of its portfolio transactions with brokerage firms which are affiliates of the investment adviser. The commissions paid to these affiliated firms were $9,611 for the period.
Interfund Lending Program. Pursuant to an Exemptive Order issued by the SEC, the Fund, along with other registered investment companies having management contracts with FMR, may participate in an interfund lending program. This program provides an alternative credit facility allowing the funds to borrow from, or lend money to, other participating affiliated funds. At period end, there were no interfund loans outstanding. The Fund's activity in this program during the period for which loans were outstanding was as follows:
Borrower or Lender | Average Daily
Loan Balance | Weighted Average Interest Rate | Interest
Expense |
Borrower | $ 29,270,410 | .38% | $ 11,891 |
6. Committed Line of Credit.
The Fund participates with other funds managed by FMR or an affiliate in a $4.0 billion credit facility (the "line of credit") to be utilized for temporary or emergency purposes to fund shareholder redemptions or for other short-term liquidity purposes. The Fund has agreed to pay commitment fees on its pro-rata portion of the line of credit, which amounted to $16,069 and is reflected in Miscellaneous expenses on the Statement of Operations. During the period, there were no borrowings on this line of credit.
7. Security Lending.
The Fund lends portfolio securities through a lending agent from time to time in order to earn additional income. For equity securities, a lending agent is used and may loan securities to certain qualified borrowers, including Fidelity Capital Markets (FCM), a broker-dealer affiliated with the Fund. On the settlement date of the loan, the Fund receives collateral (in the form of U.S. Treasury obligations, letters of credit and/or cash) against the loaned securities and maintains collateral in an amount not less than 100% of the market value of the loaned securities during the period of the loan. The market value of the loaned securities is determined at the close of business of the Fund and any additional required collateral is delivered to the Fund on the next business day. If the borrower defaults on its obligation to return the securities loaned because of insolvency or other reasons, a fund could experience delays and costs in recovering the securities loaned or in gaining access to the collateral. Any cash collateral received is invested in the Fidelity Securities Lending Cash Central Fund. The value of loaned securities and cash collateral at period end are disclosed on the Fund's Statement of Assets and Liabilities. Security lending income represents the income earned on investing cash collateral, less rebates paid to borrowers and any lending agent fees associated with the loan, plus any premium payments received for lending certain types of securities. Security lending income is presented in the Statement of Operations as a component of income from Fidelity Central Funds and includes $7,328 from securities loaned to FCM.
8. Expense Reductions.
FMR voluntarily agreed to reimburse a portion of its management fee. For the period, the amount of this reimbursement was $375,674.
Many of the brokers with whom FMR places trades on behalf of the Fund provided services in addition to trade execution. These services included payments of certain expenses on behalf of the Fund totaling $2,474,743 for the period. In addition through arrangements with the Fund's custodian, credits realized as a result of uninvested cash balances were used to reduce the Fund's expenses. During the period, these credits reduced the Fund's custody expenses by $524.
Annual Report
9. Distributions to Shareholders.
Distributions to shareholders of each class were as follows:
Years ended October 31, | 2011 | 2010 |
From net investment income | | |
Overseas | $ 75,897,727 | $ 100,374,591 |
Class K | 6,408,873 | 6,711,130 |
Class F | 9,890,239 | 1,370,072 |
Total | $ 92,196,839 | $ 108,455,793 |
From net realized gain | | |
Overseas | $ - | $ 2,158,312 |
Class K | - | 126,111 |
Class F | - | 24,425 |
Total | $ - | $ 2,308,848 |
10. Share Transactions.
Transactions for each class of shares were as follows:
| Shares | Dollars |
Years ended October 31, | 2011 | 2010 | 2011 | 2010 |
Overseas | | | | |
Shares sold | 10,588,919 | 36,113,789 | $ 338,680,110 | $ 1,067,886,397 |
Reinvestment of distributions | 2,356,512 | 3,238,247 | 75,196,294 | 101,747,555 |
Shares redeemed | (113,084,725) | (82,678,886) | (3,611,089,764) | (2,430,908,864) |
Net increase (decrease) | (100,139,294) | (43,326,850) | $ (3,197,213,360) | $ (1,261,274,912) |
Class K | | | | |
Shares sold | 4,129,689 | 5,090,117 | $ 128,992,232 | $ 151,156,491 |
Reinvestment of distributions | 201,094 | 217,803 | 6,408,873 | 6,837,242 |
Shares redeemed | (6,034,878) | (6,358,836) | (198,074,826) | (189,093,826) |
Net increase (decrease) | (1,704,095) | (1,050,916) | $ (62,673,721) | $ (31,100,093) |
Class F | | | | |
Shares sold | 12,066,248 | 22,173,982 | $ 388,123,231 | $ 652,570,206 |
Reinvestment of distributions | 310,526 | 44,465 | 9,890,239 | 1,394,498 |
Shares redeemed | (25,830,866) | (4,555,729) | (810,088,528) | (133,239,488) |
Net increase (decrease) | (13,454,092) | 17,662,718 | $ (412,075,058) | $ 520,725,216 |
11. Other.
The Fund's organizational documents provide former and current trustees and officers with a limited indemnification against liabilities arising in connection with the performance of their duties to the Fund. In the normal course of business, the Fund may also enter into contracts that provide general indemnifications. The Fund's maximum exposure under these arrangements is unknown as this would be dependent on future claims that may be made against the Fund. The risk of material loss from such claims is considered remote.
Annual Report
Report of Independent Registered Public Accounting Firm
To the Trustees of Fidelity Investment Trust and the Shareholders of Fidelity Overseas Fund:
In our opinion, the accompanying statement of assets and liabilities, including the schedule of investments, and the related statements of operations and of changes in net assets and the financial highlights present fairly, in all material respects, the financial position of Fidelity Overseas Fund (a fund of Fidelity Investment Trust) at October 31, 2011, the results of its operations for the year then ended, the changes in its net assets for each of the two years in the period then ended and the financial highlights for each of the periods indicated, in conformity with accounting principles generally accepted in the United States of America. These financial statements and financial highlights (hereafter referred to as "financial statements") are the responsibility of the Fidelity Overseas Fund's management. Our responsibility is to express an opinion on these financial statements based on our audits. We conducted our audits of these financial statements in accordance with the standards of the Public Company Accounting Oversight Board (United States). Those standards require that we plan and perform the audit to obtain reasonable assurance about whether the financial statements are free of material misstatement. An audit includes examining, on a test basis, evidence supporting the amounts and disclosures in the financial statements, assessing the accounting principles used and significant estimates made by management, and evaluating the overall financial statement presentation. We believe that our audits, which included confirmation of securities at October 31, 2011 by correspondence with the custodian and brokers, provide a reasonable basis for our opinion.
PricewaterhouseCoopers LLP
Boston, Massachusetts
December 16, 2011
Annual Report
Trustees and Officers
The Trustees, Members of the Advisory Board, and executive officers of the trust and fund, as applicable, are listed below. The Board of Trustees governs the fund and is responsible for protecting the interests of shareholders. The Trustees are experienced executives who meet periodically throughout the year to oversee the fund's activities, review contractual arrangements with companies that provide services to the fund, oversee management of the risks associated with such activities and contractual arrangements, and review the fund's performance. Except for James C. Curvey, each of the Trustees oversees 226 funds advised by FMR or an affiliate. Mr. Curvey oversees 429 funds advised by FMR or an affiliate.
The Trustees hold office without limit in time except that (a) any Trustee may resign; (b) any Trustee may be removed by written instrument, signed by at least two-thirds of the number of Trustees prior to such removal; (c) any Trustee who requests to be retired or who has become incapacitated by illness or injury may be retired by written instrument signed by a majority of the other Trustees; and (d) any Trustee may be removed at any special meeting of shareholders by a two-thirds vote of the outstanding voting securities of the trust. Each Trustee who is not an interested person (as defined in the 1940 Act) (Independent Trustee), shall retire not later than the last day of the calendar year in which his or her 75th birthday occurs. The Independent Trustees may waive this mandatory retirement age policy with respect to individual Trustees. The executive officers and Advisory Board Members hold office without limit in time, except that any officer and Advisory Board Member may resign or may be removed by a vote of a majority of the Trustees at any regular meeting or any special meeting of the Trustees. Except as indicated, each individual has held the office shown or other offices in the same company for the past five years.
Experience, Skills, Attributes, and Qualifications of the Fund's Trustees. The Governance and Nominating Committee has adopted a statement of policy that describes the experience, qualifications, attributes, and skills that are necessary and desirable for potential Independent Trustee candidates (Statement of Policy). The Board believes that each Trustee satisfied at the time he or she was initially elected or appointed a Trustee, and continues to satisfy, the standards contemplated by the Statement of Policy. The Governance and Nominating Committee also engages professional search firms to help identify potential Independent Trustee candidates who have the experience, qualifications, attributes, and skills consistent with the Statement of Policy. From time to time, additional criteria based on the composition and skills of the current Independent Trustees, as well as experience or skills that may be appropriate in light of future changes to board composition, business conditions, and regulatory or other developments, have also been considered by the professional search firms and the Governance and Nominating Committee. In addition, the Board takes into account the Trustees' commitment and participation in Board and committee meetings, as well as their leadership of standing and ad hoc committees throughout their tenure.
In determining that a particular Trustee was and continues to be qualified to serve as a Trustee, the Board has considered a variety of criteria, none of which, in isolation, was controlling. The Board believes that, collectively, the Trustees have balanced and diverse experience, qualifications, attributes, and skills, which allow the Board to operate effectively in governing the fund and protecting the interests of shareholders. Information about the specific experience, skills, attributes, and qualifications of each Trustee, which in each case led to the Board's conclusion that the Trustee should serve (or continue to serve) as a trustee of the fund, is provided below.
Board Structure and Oversight Function. James C. Curvey is an interested person (as defined in the 1940 Act) and currently serves as Acting Chairman. The Trustees have determined that an interested Chairman is appropriate and benefits shareholders because an interested Chairman has a personal and professional stake in the quality and continuity of services provided to the fund. Independent Trustees exercise their informed business judgment to appoint an individual of their choosing to serve as Chairman, regardless of whether the Trustee happens to be independent or a member of management. The Independent Trustees have determined that they can act independently and effectively without having an Independent Trustee serve as Chairman and that a key structural component for assuring that they are in a position to do so is for the Independent Trustees to constitute a substantial majority for the Board. The Independent Trustees also regularly meet in executive session. Ned C. Lautenbach serves as Chairman of the Independent Trustees and as such (i) acts as a liaison between the Independent Trustees and management with respect to matters important to the Independent Trustees and (ii) with management prepares agendas for Board meetings.
Fidelity funds are overseen by different Boards of Trustees. The fund's Board oversees Fidelity's equity and high income funds and another Board oversees Fidelity's investment-grade bond, money market, and asset allocation funds. The asset allocation funds may invest in Fidelity funds overseen by the fund's Board. The use of separate Boards, each with its own committee structure, allows the Trustees of each group of Fidelity funds to focus on the unique issues of the funds they oversee, including common research, investment, and operational issues. On occasion, the separate Boards establish joint committees to address issues of overlapping consequences for the Fidelity funds overseen by each Board.
The Trustees operate using a system of committees to facilitate the timely and efficient consideration of all matters of importance to the Trustees, the fund, and fund shareholders and to facilitate compliance with legal and regulatory requirements and oversight of the fund's activities and associated risks. The Board, acting through its committees, has charged FMR and its affiliates with (i) identifying events or circumstances the occurrence of which could have demonstrably adverse effects on the fund's business and/or reputation; (ii) implementing processes and controls to lessen the possibility that such events or circumstances occur or to mitigate the effects of such events or circumstances if they do occur; and (iii) creating and maintaining a system designed to evaluate continuously business and market conditions in order to facilitate the identification and implementation processes described in (i) and (ii) above. Because the day-to-day operations and activities of the funds are carried out by or through FMR, its affiliates and other service providers, the fund's exposure to risks is mitigated but not eliminated by the processes overseen by the Trustees. While each of the Board's committees has responsibility for overseeing different aspects of the fund's activities, oversight is exercised primarily through the Operations, Audit, and Compliance Committees. In addition, the Independent Trustees have worked with FMR to enhance the Board's oversight of investment and financial risks, legal and regulatory risks, technology risks, and operational risks, including the development of additional risk reporting to the Board. For example, a working group comprised of Independent Trustees and FMR has worked and continues to work to review the Fidelity fund's valuation-related activities, reporting and risk management. Appropriate personnel, including but not limited to the fund's Chief Compliance Officer (CCO), FMR's internal auditor, the independent accountants, the fund's Treasurer and portfolio management personnel, make periodic reports to the Board's committees, as appropriate, including an annual review of FMR's risk management program for the Fidelity funds. The responsibilities of each standing committee, including their oversight responsibilities, are described further under "Standing Committees of the Fund's Trustees."
Annual Report
The fund's Statement of Additional Information (SAI) includes more information about the Trustees. To request a free copy, call Fidelity at 1-800-835-5092.
Interested Trustees*:
Correspondence intended for each Trustee who is an interested person may be sent to Fidelity Investments, 82 Devonshire Street, Boston, Massachusetts 02109.
Name, Age; Principal Occupations and Other Relevant Experience+ |
James C. Curvey (76) |
| Year of Election or Appointment: 2007 Mr. Curvey is Trustee and Acting Chairman of the Board of Trustees of certain Trusts. Mr. Curvey also serves as Trustee (2007-present) of other investment companies advised by FMR. Mr. Curvey is a Director of Fidelity Investments Money Management, Inc. (2009-present), Director of Fidelity Research & Analysis Co. (2009-present) and Director of FMR and FMR Co., Inc. (2007-present). Mr. Curvey is also Vice Chairman (2007-present) and Director of FMR LLC. In addition, Mr. Curvey serves as an Overseer for the Boston Symphony Orchestra and a member of the Trustees of Villanova University. Previously, Mr. Curvey was the Vice Chairman (2006-2007) and Director (2000-2007) of FMR Corp. |
Ronald P. O'Hanley (54) |
| Year of Election or Appointment: 2011 Mr. O'Hanley is Director of FMR Co., Inc. (2010-present), Director of Fidelity Investments Money Management, Inc. (2010-present), Director of Fidelity Research & Analysis Company (2010-present), President of Fidelity Asset Management and Corporate Services and a member of Fidelity's Executive Committee (2010-present). Previously, Mr. O'Hanley served as President and Chief Executive Officer of BNY Mellon Asset Management (2007-2010). Mr. O'Hanley also served as Vice Chairman of Bank New York Mellon Corp. and a member of that firm's Executive Committee. Prior to the 2007 merger of The Bank of New York and Mellon Financial Corporation, he was Vice Chairman of Mellon Financial Corporation and President and Chief Executive Officer of Mellon Asset Management. He joined Mellon in February 1997. Mr. O'Hanley currently serves as Chairman of the Boston Public Library Foundation Board of Directors and sits on the Board of Directors of Beth Israel Deaconess Medical Center, the Board of Trustees of the Marine Biological Laboratory and the Advisory Board of the Maxwell School of Citizenship and Public Administration at Syracuse University. Mr. O'Hanley also chairs the Council on Asset Management for the Financial Services Roundtable and is a member of the Board of Directors of Institutional Investor's U.S. Institute. |
* Trustees have been determined to be "Interested Trustees" by virtue of, among other things, their affiliation with the trust or various entities under common control with FMR.
+ The information above includes each Trustee's principal occupation during the last five years and other information relating to the experience, attributes, and skills relevant to each Trustee's qualifications to serve as a Trustee, which led to the conclusion that each Trustee should serve as a Trustee for the fund.
Independent Trustees:
Correspondence intended for each Independent Trustee (that is, the Trustees other than the Interested Trustees) may be sent to Fidelity Investments, P.O. Box 55235, Boston, Massachusetts 02205-5235.
Name, Age; Principal Occupations and Other Relevant Experience+ |
Dennis J. Dirks (63) |
| Year of Election or Appointment: 2005 Prior to his retirement in May 2003, Mr. Dirks was Chief Operating Officer and a member of the Board of The Depository Trust & Clearing Corporation (DTCC). He also served as President, Chief Operating Officer, and Board member of The Depository Trust Company (DTC) and President and Board member of the National Securities Clearing Corporation (NSCC). In addition, Mr. Dirks served as Chief Executive Officer and Board member of the Government Securities Clearing Corporation, Chief Executive Officer and Board member of the Mortgage-Backed Securities Clearing Corporation, as a Trustee and a member of the Finance Committee of Manhattan College (2005-2008), and as a Trustee and a member of the Finance Committee of AHRC of Nassau County (2006-2008). Mr. Dirks is a member of the Independent Directors Council (IDC) Governing Council (2010-Present) and Board of Directors for The Brookville Center for Children's Services, Inc. (2009-present). |
Alan J. Lacy (58) |
| Year of Election or Appointment: 2008 Mr. Lacy serves as Senior Adviser (2007-present) of Oak Hill Capital Partners, L.P. (private equity). Mr. Lacy also served as Chief Executive Officer (2000-2005) and Vice Chairman (2005-2006) of Sears Holdings Corporation and Sears, Roebuck and Co. (retail). In addition, Mr. Lacy serves as a member of the Board of Directors of Dave & Buster's, Inc. (restaurant and entertainment complexes, 2010-present), The Hillman Companies, Inc. (hardware wholesalers, 2010-present), and Bristol-Myers Squibb Company (global pharmaceuticals, 2007-present). Mr. Lacy is a member of the Board of Trustees of The National Parks Conservation Association (2006-Present). Previously, Mr. Lacy served as Chairman of the Board of Trustees of the National Parks Conservation Association (2008-2011) and as a member of the Board of Directors for the Western Union Company (global money transfer, 2006-2011). |
Ned C. Lautenbach (67) |
| Year of Election or Appointment: 2000 Mr. Lautenbach is Chairman of the Independent Trustees of the Equity and High Income Funds (2006-present). Mr. Lautenbach currently serves as the Lead Director of the Eaton Corporation Board of Directors (diversified industrial, 1997-present). Mr. Lautenbach is also a member of the Board of Directors of the Philharmonic Center for the Arts in Naples, Florida (1999-present); a member of the Board of Trustees of Fairfield University (2005-present); and a member of the Council on Foreign Relations (1994-present). Previously, Mr. Lautenbach was a Partner/Advisory Partner at Clayton, Dubilier & Rice, LLC (private equity investment, 1998-2010), as well as a Director of Sony Corporation (2006-2007). |
Joseph Mauriello (67) |
| Year of Election or Appointment: 2008 Prior to his retirement in January 2006, Mr. Mauriello served in numerous senior management positions including Deputy Chairman and Chief Operating Officer (2004-2005), and Vice Chairman of Financial Services (2002-2004) of KPMG LLP US (professional services, 1965-2005). Mr. Mauriello currently serves as a member of the Board of Directors of XL Group plc. (global insurance and re-insurance, 2006-present) and of Arcadia Resources Inc. (health care services and products, 2007-present). Previously, Mr. Mauriello served as a Director of the Hamilton Funds of the Bank of New York (2006-2007). |
Robert W. Selander (61) |
| Year of Election or Appointment: 2011 Previously, Mr. Selander served as a Member of the Advisory Board of Fidelity's Equity and High Income Funds (2011), Executive Vice Chairman (2010), Chief Executive Officer (2009-2010), and President and Chief Executive Officer (1997-2009) of Mastercard, Inc. |
Cornelia M. Small (67) |
| Year of Election or Appointment: 2005 Ms. Small is a member of the Board of Directors of the Teagle Foundation (2009-present). Ms. Small is also a member of the Investment Committee, and Chair (2008-present) and a member of the Board of Trustees of Smith College. In addition, Ms. Small serves on the Investment Committee of the Berkshire Taconic Community Foundation (2008-present). Previously, Ms. Small served as Chairperson of the Investment Committee (2002-2008) of Smith College. In addition, Ms. Small served as Chief Investment Officer, Director of Global Equity Investments, and a member of the Board of Directors of Scudder, Stevens & Clark and Scudder Kemper Investments. |
William S. Stavropoulos (72) |
| Year of Election or Appointment: 2001 Mr. Stavropoulos is Vice Chairman of the Independent Trustees of the Equity and High Income Funds (2006-present). Mr. Stavropoulos serves as President and Founder of the Michigan Baseball Foundation, the Great Lakes Loons (2007-present). Mr. Stavropoulos is Chairman Emeritus of the Board of Directors of The Dow Chemical Company, where he previously served in numerous senior management positions, including President, CEO (1995-2000; 2002-2004), Chairman of the Executive Committee (2000-2006), and as a member of the Board of Directors (1990-2006). Currently, Mr. Stavropoulos is Chairman of Univar (global distributor of commodity and specialty chemicals, 2010-present), a Director of Teradata Corporation (data warehousing and technology solutions, 2008-present), Chemical Financial Corporation, Maersk Inc. (industrial conglomerate), Tyco International, Inc. (multinational manufacturing and services, 2007-present), and a member of the Advisory Board for Metalmark Capital (private equity investment, 2005-present). Mr. Stavropoulos is a special advisor to Clayton, Dubilier & Rice, LLC (private equity investment). In addition, Mr. Stavropoulos is a member of the University of Notre Dame Advisory Council for the College of Science. |
Name, Age; Principal Occupations and Other Relevant Experience+ |
David M. Thomas (62) |
| Year of Election or Appointment: 2008 Previously, Mr. Thomas served as Executive Chairman (2005-2006) and Chairman and Chief Executive Officer (2000-2005) of IMS Health, Inc. (pharmaceutical and healthcare information solutions). In addition, Mr. Thomas serves as a member of the Board of Directors of Fortune Brands, Inc. (consumer products), and Interpublic Group of Companies, Inc. (marketing communication, 2004-present). |
Michael E. Wiley (61) |
| Year of Election or Appointment: 2008 Mr. Wiley also serves as a Director of Asia Pacific Exploration Consolidated (international oil and gas exploration and production, 2008-present). Mr. Wiley serves as a Director of Tesoro Corporation (independent oil refiner and marketer, 2005-present), and a Director of Bill Barrett Corporation (exploration and production, 2005-present). In addition, Mr. Wiley also serves as a Director of Post Oak Bank (privately-held bank, 2004-present). Previously, Mr. Wiley served as a member of the Board of Trustees of the University of Tulsa (2000-2006; 2007-2010), as a Senior Energy Advisor of Katzenbach Partners, LLC (consulting, 2006-2007), as an Advisory Director of Riverstone Holdings (private investment), Chairman, President, and CEO of Baker Hughes, Inc. (oilfield services, 2000-2004), and as Director of Spinnaker Exploration Company (exploration and production, 2001-2005). |
+ The information above includes each Trustee's principal occupation during the last five years and other information relating to the experience, attributes, and skills relevant to each Trustee's qualifications to serve as a Trustee, which led to the conclusion that each Trustee should serve as a Trustee for the fund.
Advisory Board Members and Executive Officers:
Correspondence intended for each executive officer, Edward C. Johnson 3d, and Peter S. Lynch may be sent to Fidelity Investments, 82 Devonshire Street, Boston, Massachusetts 02109.
Name, Age; Principal Occupation |
Edward C. Johnson 3d (81) |
| Year of Election or Appointment: 2011 Member of the Advisory Board of Fidelity's Equity and High Income Funds. Mr. Johnson serves as Chief Executive Officer, Chairman, and a Director of FMR LLC, and also serves as Chairman and Director of FIL Limited. Previously, Mr. Johnson served as a Trustee and Chairman of the Board of certain Fidelity Trusts, Chairman and a Director of FMR, Chairman and a Director of FMR Co., Inc., and President of FMR LLC (2006-2007). |
Peter S. Lynch (67) |
| Year of Election or Appointment: 2003 Member of the Advisory Board of Fidelity's Equity and High Income Funds. Mr. Lynch is Vice Chairman and a Director of FMR and FMR Co., Inc. In addition, Mr. Lynch serves as a Trustee of Boston College and as the Chairman of the Inner-City Scholarship Fund. Previously, Mr. Lynch served on the Special Olympics International Board of Directors (1997-2006). |
Kenneth B. Robins (42) |
| Year of Election or Appointment: 2008 President and Treasurer of Fidelity's Equity and High Income Funds. Mr. Robins also serves as President and Treasurer (2010-present) and Assistant Treasurer (2009-present) of other Fidelity funds and is an employee of Fidelity Investments (2004-present). Previously, Mr. Robins served as Deputy Treasurer of the Fidelity funds (2005-2008) and Treasurer and Chief Financial Officer of The North Carolina Capital Management Trust: Cash and Term Portfolios (2006-2008). |
Bruce T. Herring (46) |
| Year of Election or Appointment: 2006 Vice President of certain Equity Funds. Mr. Herring also serves as Chief Investment Officer and Director of Fidelity Management & Research (U.K.) Inc. (2010-present) and Group Chief Investments Officer of FMR. Previously, Mr. Herring served as Vice President (2005-2006) and Senior Vice President (2006-2007) of Fidelity Management & Research Company, Vice President of FMR Co., Inc. (2001-2007) and as a portfolio manager for Fidelity U.S. Equity Funds. |
Brian B. Hogan (47) |
| Year of Election or Appointment: 2009 Vice President of Equity and High Income Funds. Mr. Hogan also serves as President of FMR's Equity Division (2009-present). Previously, Mr. Hogan served as Senior Vice President, Equity Research of FMR (2006-2009) and as a portfolio manager. |
Scott C. Goebel (43) |
| Year of Election or Appointment: 2008 Secretary and Chief Legal Officer (CLO) of the Fidelity funds. Mr. Goebel also serves as Secretary of Fidelity Investments Money Management, Inc. (FIMM) (2010-present) and Fidelity Research and Analysis Company (FRAC) (2010-present); Secretary and CLO of The North Carolina Capital Management Trust: Cash and Term Portfolios (2008-present); General Counsel, Secretary, and Senior Vice President of FMR (2008-present) and FMR Co., Inc. (2008-present); employed by FMR LLC or an affiliate (2001-present); Chief Legal Officer of Fidelity Management & Research (Hong Kong) Limited (2008-present) and Assistant Secretary of Fidelity Management & Research (Japan) Inc. (2008-present), and Fidelity Management & Research (U.K.) Inc. (2008-present). Previously, Mr. Goebel served as Assistant Secretary of FIMM (2008-2010), FRAC (2008-2010), and the Funds (2007-2008) and as Vice President and Secretary of Fidelity Distributors Corporation (FDC) (2005-2007). |
William C. Coffey (42) |
| Year of Election or Appointment: 2009 Assistant Secretary of Fidelity's Equity and High Income Funds. Mr. Coffey also serves as Senior Vice President and Deputy General Counsel of FMR LLC (2010-present), and is an employee of Fidelity Investments. Previously, Mr. Coffey served as Vice President and Associate General Counsel of FMR LLC (2005-2009). |
Holly C. Laurent (57) |
| Year of Election or Appointment: 2008 Anti-Money Laundering (AML) Officer of the Fidelity funds. Ms. Laurent also serves as AML Officer of The North Carolina Capital Management Trust: Cash and Term Portfolios (2008-present) and is an employee of Fidelity Investments. Previously, Ms. Laurent was Senior Vice President and Head of Legal for Fidelity Business Services India Pvt. Ltd. (2006-2008), and Senior Vice President, Deputy General Counsel and Group Head for FMR LLC (2005-2006). |
Christine Reynolds (53) |
| Year of Election or Appointment: 2008 Chief Financial Officer of the Fidelity funds. Ms. Reynolds became President of Fidelity Pricing and Cash Management Services (FPCMS) in August 2008. Ms. Reynolds served as Chief Operating Officer of FPCMS (2007-2008). Previously, Ms. Reynolds served as President, Treasurer, and Anti-Money Laundering officer of the Fidelity funds (2004-2007). |
Kenneth A. Rathgeber (64) |
| Year of Election or Appointment: 2004 Chief Compliance Officer of Fidelity's Equity and High Income Funds. Mr. Rathgeber is Chief Compliance Officer of Fidelity Management & Research (Hong Kong) Limited (2008-present), Fidelity Management & Research (Japan) Inc. (2008-present), FMR (2005-present), FMR Co., Inc. (2005-present), Fidelity Management & Research (U.K.) Inc. (2005-present), Fidelity Research & Analysis Company (2005-present), Fidelity Investments Money Management, Inc. (2005-present), Pyramis Global Advisors, LLC (2005-present), and Strategic Advisers, Inc. (2005-present). |
Jeffrey S. Christian (50) |
| Year of Election or Appointment: 2009 Deputy Treasurer of the Fidelity funds. Mr. Christian is an employee of Fidelity Investments. Previously, Mr. Christian served as Chief Financial Officer (2008-2009) of certain Fidelity funds and Senior Vice President of Fidelity Pricing and Cash Management Services (FPCMS) (2004-2009). |
Joseph F. Zambello (54) |
| Year of Election or Appointment: 2011 Deputy Treasurer of the Fidelity funds. Mr. Zambello is an employee of Fidelity Investments. Previously, Mr. Zambello served as Vice President of FMR's Program Management Group (2009-2011) and Vice President of the Transfer Agent Oversight Group (2005-2009). |
Adrien E. Deberghes (44) |
| Year of Election or Appointment: 2008 Deputy Treasurer of Fidelity's Equity and High Income Funds. Mr. Deberghes also serves as Vice President and Assistant Treasurer of Fidelity Rutland Square Trust II and Fidelity Commonwealth Trust II (2011-present), Assistant Treasurer of other Fidelity funds (2010-present), and is an employee of Fidelity Investments (2008-present). Previously, Mr. Deberghes served as Senior Vice President of Mutual Fund Administration at State Street Corporation (2007-2008), Senior Director of Mutual Fund Administration at Investors Bank & Trust (2005-2007), and Director of Finance for Dunkin' Brands (2000-2005). |
Stephanie J. Dorsey (42) |
| Year of Election or Appointment: 2010 Assistant Treasurer of Fidelity's Equity and High Income Funds. Ms. Dorsey also serves as Deputy Treasurer of other Fidelity funds (2008-present) and is an employee of Fidelity Investments (2008-present). Previously, Ms. Dorsey served as Treasurer (2004-2008) of the JPMorgan Mutual Funds and Vice President (2004-2008) of JPMorgan Chase Bank. |
John R. Hebble (53) |
| Year of Election or Appointment: 2009 Assistant Treasurer of Fidelity's Equity and High Income Funds. Mr. Hebble also serves as President (2011-present), Treasurer, and Chief Financial Officer of The North Carolina Capital Management Trust: Cash and Term Portfolios (2008-present), President and Treasurer of other Fidelity funds (2008-present) and is an employee of Fidelity Investments. |
Gary W. Ryan (53) |
| Year of Election or Appointment: 2005 Assistant Treasurer of the Fidelity funds. Mr. Ryan is an employee of Fidelity Investments. Previously, Mr. Ryan served as Vice President of Fund Reporting in Fidelity Pricing and Cash Management Services (FPCMS) (1999-2005). |
Jonathan Davis (43) |
| Year of Election or Appointment: 2010 Assistant Treasurer of the Fidelity funds. Mr. Davis is also Assistant Treasurer of Fidelity Rutland Square Trust II and Fidelity Commonwealth Trust II. Mr. Davis is an employee of Fidelity Investments. Previously, Mr. Davis served as Vice President and Associate General Counsel of FMR LLC (2003-2010). |
Annual Report
Distributions (Unaudited)
The Board of Trustees of Fidelity Overseas Fund voted to pay to shareholders of record at the opening of business on record date, the following distributions per share derived from capital gains realized from sales of portfolio securities and dividends derived from net investment income:
| Pay Date | Record Date | Dividends | Capital Gains |
Class F | 12/05/11 | 12/02/11 | $0.934 | $0.020 |
Class F designates 100% of the dividend distributed during the fiscal year as amounts which may be taken into account as a dividend for purposes of the maximum rate under section 1(h)(11) of the Internal Revenue Code.
The amounts per share which represent income derived from sources within, and taxes paid to, foreign countries or possessions of the United States are $0.553 and $0.0294 for the dividend paid December 6th, 2010.
The fund will notify shareholders in January 2012 of amounts for use in preparing 2011 income tax returns.
Annual Report
Board Approval of Investment Advisory Contracts and Management Fees
Fidelity Overseas Fund
Each year, the Board of Trustees, including the Independent Trustees (together, the Board), votes on the renewal of the management contract and sub-advisory agreements (together, the Advisory Contracts) for the fund. The Board, assisted by the advice of fund counsel and Independent Trustees' counsel, requests and considers a broad range of information relevant to the renewal of the Advisory Contracts throughout the year.
The Board meets regularly and considers at each of its meetings factors that are relevant to its annual consideration of the renewal of the fund's Advisory Contracts, including the services and support provided to the fund and its shareholders. The Board has established various standing committees, each composed of Independent Trustees with varying backgrounds, to which the Board has assigned specific subject matter responsibilities in order to enhance effective decision-making by the Board. The Board, acting directly and through its Committees, requests and receives information concerning the annual consideration of the renewal of the fund's Advisory Contracts. The Board also meets as needed to consider matters specifically related to the Board's annual consideration of the renewal of Advisory Contracts. Members of the Board may also meet with trustees of other Fidelity funds through ad hoc joint committees to discuss certain matters relevant to the Fidelity funds.
At its July 2011 meeting, the Board of Trustees, including the Independent Trustees, unanimously determined to renew the fund's Advisory Contracts. In reaching its determination, the Board considered all factors it believed relevant, including (i) the nature, extent, and quality of the services to be provided to the fund and its shareholders (including the investment performance of the fund); (ii) the competitiveness of the fund's management fee and total expense ratio; (iii) the total costs of the services to be provided by and the profits to be realized by Fidelity from its relationship with the fund; (iv) the extent to which economies of scale would be realized as the fund grows; and (v) whether fee levels reflect these economies of scale, if any, for the benefit of fund shareholders.
In considering whether to renew the Advisory Contracts for the fund, the Board reached a determination, with the assistance of fund counsel and Independent Trustees' counsel and through the exercise of its business judgment, that the renewal of the Advisory Contracts is in the best interests of the fund and its shareholders and that the compensation payable under the Advisory Contracts is fair and reasonable. The Board's decision to renew the Advisory Contracts was not based on any single factor, but rather was based on a comprehensive consideration of all the information provided to the Board at its meetings throughout the year. The Board, in reaching its determination to renew the Advisory Contracts, is aware that shareholders in the fund have a broad range of investment choices available to them, including a wide choice among mutual funds offered by Fidelity's competitors, and that the fund's shareholders, who have the opportunity to review and weigh the disclosure provided by the fund in its prospectus and other public disclosures, have chosen to invest in this fund, managed by Fidelity.
Nature, Extent, and Quality of Services Provided. The Board considered the staffing within the investment adviser, FMR, and the sub-advisers (together, the Investment Advisers), including the backgrounds of the fund's investment personnel and the fund's investment objective and discipline. The Independent Trustees also had discussions with senior management of Fidelity's investment operations and investment groups. The Board considered the structure of the portfolio manager compensation program and whether this structure provides appropriate incentives to act in the best interests of the fund.
Resources Dedicated to Investment Management and Support Services. The Board and the Fund Oversight and Research Committees reviewed the general qualifications and capabilities of the Investment Advisers' investment staff, including its size, education, experience, and resources, as well as the Investment Advisers' approach to recruiting, training, managing, and compensating investment personnel. The Board also noted that FMR has devoted increased resources to non-U.S. offices. The Board noted that Fidelity's analysts have extensive resources, tools and capabilities which allow them to conduct sophisticated quantitative and fundamental analysis, as well as credit analysis of issuers, counterparties and enhancers. The Board also believes that Fidelity's investment professionals have sufficient access to global information and data so as to provide competitive investment results over time, and that those professionals also have access to sophisticated tools which permit them to assess portfolio construction and risk and performance attribution characteristics continuously, as well as to transmit new information and research conclusions rapidly around the world. Additionally, in their deliberations, the Board considered the Investment Advisers' trading capabilities and resources which are an integral part of the investment management process.
Shareholder and Administrative Services. The Board considered (i) the nature, extent, quality, and cost of advisory, administrative, and shareholder services performed by the Investment Advisers and their affiliates under the Advisory Contracts and under separate agreements covering transfer agency, pricing and bookkeeping, and securities lending services for the fund; (ii) the nature and extent of the investment adviser's supervision of third party service providers, principally custodians and subcustodians; and (iii) the resources devoted to, and the record of compliance with, the fund's compliance policies and procedures. The Board also reviewed the allocation of fund brokerage, including allocations to brokers affiliated with the Investment Advisers, the use of brokerage commissions to pay fund expenses, and the use of "soft" commission dollars to pay for research services.
The Board noted that the growth of fund assets over time across the complex allows Fidelity to reinvest in the development of services designed to enhance the value or convenience of the Fidelity funds as investment vehicles. These services include 24-hour access to account information and market information through telephone representatives and over the Internet, investor education materials and asset allocation tools, and the expanded availability of Fidelity Investor Centers, with 35 new branches opening since 2010.
Annual Report
Board Approval of Investment Advisory Contracts and Management Fees - continued
Investment in a Large Fund Family. The Board considered the benefits to shareholders of investing in a Fidelity fund, including the benefits of investing in a fund that is part of a large family of funds offering a variety of investment disciplines and providing a large variety of mutual fund investor services. The Board noted that Fidelity had taken, or had made recommendations that resulted in the Fidelity funds taking, a number of actions over the previous year that benefited particular funds, including (i) continuing to dedicate additional resources to investment research and support of the senior management team that oversees asset management; (ii) rationalizing product lines through the mergers of six funds into other funds; (iii) continuing to migrate the Freedom Funds to dedicated lower cost underlying funds; (iv) obtaining shareholder approval to broaden the investment strategies for Fidelity Consumer Finance Portfolio, Fidelity Emerging Asia Fund, and Fidelity Environment and Alternative Energy Portfolio; (v) contractually agreeing to reduce the management fees and impose other expense limitations on Spartan 500 Index Fund and U.S. Bond Index Fund in connection with launching new institutional classes of these funds; (vi) changing the name, primary and supplemental benchmarks, and investment policies of Fidelity Global Strategies Fund to support the fund's flexible investment mandate and global orientation; and (vii) reducing the transfer agency account fee rates on certain accounts.
Investment Performance. The Board considered whether the fund has operated in accordance with its investment objective, as well as its record of compliance with its investment restrictions. It also reviewed the fund's absolute investment performance for each class, as well as the fund's relative investment performance for each class measured over multiple periods against (i) a broad-based securities market index, and (ii) a peer group of mutual funds deemed appropriate by Fidelity and reviewed by the Board. The following charts considered by the Board show, over the one-, three-, and five-year periods ended December 31, 2010, as available, the cumulative total returns of Class F and the retail class of the fund, the cumulative total returns of a broad-based securities market index ("benchmark"), and a range of cumulative total returns of a peer group of mutual funds identified by Morningstar, Inc. as having an investment style similar to that of the fund based on underlying portfolio holdings. The returns of Class F and the retail class show the performance of the highest and lowest performing classes, respectively (based on one-year performance). The box within each chart shows the 25th percentile return (bottom of box) and the 75th percentile return (top of box) of the peer group. Returns shown above the box are in the first quartile and returns shown below the box are in the fourth quartile. The percentage beaten numbers noted below each chart correspond to the percentile box and represent the percentage of funds in the peer group whose performance was equal to or lower than that of the class indicated.
Fidelity Overseas Fund
The Board reviewed the fund's relative investment performance against its peer group and noted that the performance of the retail class of the fund (the class with the longest performance record) was in the fourth quartile for all the periods shown. The Board also noted that the investment performance of the fund was lower than its benchmark for all the periods shown. The Board considered that the variations in performance among the fund's classes reflect the variations in class expenses, which result in lower performance for higher expense classes. The Board discussed with FMR actions that have been taken by FMR to improve the fund's disappointing performance relative to its peer group and benchmark. The Board noted that this fund had underperformed in 2009 and discussed with FMR its disappointment with the continued underperformance of the fund. The Board also reviewed the fund's performance since inception as well as performance in the current year. The Board will continue to closely monitor the performance of the fund in the coming year and discuss with FMR other appropriate actions to address the performance of the fund.
The Board also considered that the fund's management fee is subject to upward or downward adjustment depending upon whether, and to what extent, the fund's investment performance for the performance period exceeds, or is exceeded by, the record (over the same period) of a Board-approved performance adjustment index. The Board noted that the performance adjustment provides FMR with a strong economic incentive to seek to achieve superior performance for the fund's shareholders and helps to more closely align the interests of FMR and the fund's shareholders.
Annual Report
Based on its review, the Board concluded that the nature, extent, and quality of services provided to the fund under the Advisory Contracts should benefit the fund's shareholders.
Competitiveness of Management Fee and Total Expense Ratio. The Board considered the fund's management fee and total expense ratio compared to "mapped groups" of competitive funds and classes. Fidelity creates "mapped groups" by combining similar Lipper investment objective categories that have comparable management fee characteristics. Combining Lipper investment objective categories aids the Board's management fee and total expense ratio comparisons by broadening the competitive group used for comparison and by reducing the number of universes to which various Fidelity funds are compared.
Management Fee. The Board considered two proprietary management fee comparisons for the 12-month periods shown in the chart below. The group of Lipper funds used by the Board for management fee comparisons is referred to below as the "Total Mapped Group." The Total Mapped Group comparison focuses on a fund's standing relative to the total universe of comparable funds available to investors in terms of gross management fees before expense reimbursements or caps, and without giving effect to the fund's performance adjustment. "TMG %" represents the percentage of funds in the Total Mapped Group that had management fees that were lower than the fund's. For example, a TMG % of 16% means that 84% of the funds in the Total Mapped Group had higher management fees than the fund. The "Asset-Size Peer Group" (ASPG) comparison focuses on a fund's standing relative to non-Fidelity funds similar in size to the fund within the Total Mapped Group. The ASPG represents at least 15% of the funds in the Total Mapped Group with comparable asset size and management fee characteristics, subject to a minimum of 50 funds (or all funds in the Total Mapped Group if fewer than 50). Additional information, such as the ASPG quartile in which the fund's management fee ranked and the impact of the fund's performance adjustment, is also included in the chart and considered by the Board.
Fidelity Overseas Fund
The Board noted that the fund's management fee ranked below the median of its Total Mapped Group and below the median of its ASPG for 2010. The Board also noted the effect of the fund's negative performance adjustment on the fund's management fee ranking. The Board noted that the performance adjustment for each year represents calculations for performance periods that differ from the periods shown in the performance charts above.
Based on its review, the Board concluded that the fund's management fee is fair and reasonable in light of the services that the fund receives and the other factors considered.
Total Expense Ratio. In its review of each class's total expense ratio, the Board considered the fund's management fee as well as other fund or class expenses, as applicable, such as transfer agent fees, pricing and bookkeeping fees, and custodial, legal, and audit fees. The Board also noted the effects of any waivers and reimbursements on fees and expenses, as well as the impact of the fund's performance adjustment. As part of its review, the Board also considered the current and historical total expense ratios of each class of the fund compared to competitive fund median expenses. Each class of the fund is compared to those funds and classes in the Total Mapped Group (used by the Board for management fee comparisons) that have a similar sales load structure.
Annual Report
Board Approval of Investment Advisory Contracts and Management Fees - continued
The Board noted that the total expense ratio of each class ranked below its competitive median for 2010. The Board considered that various factors, including 12b-1 fees, positive or negative performance adjustments, and relatively higher other expenses in the case of small fund size, can affect total expense ratios.
Fees Charged to Other Fidelity Clients. The Board also considered Fidelity fee structures and other information with respect to clients of FMR and its affiliates, such as other mutual funds advised or subadvised by FMR or its affiliates, pension plan clients, and other institutional clients. In March 2010, the Board created an ad hoc joint committee with the board of other Fidelity funds (the Committee) to review and compare Fidelity's institutional investment advisory business with its business of providing services to the Fidelity funds, including the differences in services provided, fees charged, and costs incurred, as well as competition in their respective marketplaces.
Based on its review of total expense ratios and fees charged to other Fidelity clients, the Board concluded that the total expense ratio of each class of the fund was reasonable in light of the services that the fund and its shareholders receive and the other factors considered, including the findings of the Committee.
Costs of the Services and Profitability. The Board considered the revenues earned and the expenses incurred by Fidelity in conducting the business of developing, marketing, distributing, managing, administering and servicing the fund and its shareholders. The Board also considered the level of Fidelity's profits in respect of all the Fidelity funds.
On an annual basis, FMR presents to the Board Fidelity's profitability for the fund. Fidelity calculates the profitability for each fund, as well as aggregate profitability for groups of Fidelity funds and all Fidelity funds, using a series of detailed revenue and cost allocation methodologies which originate with the books and records of Fidelity on which Fidelity's audited financial statements are based. The Audit Committee of the Board reviews any significant changes from the prior year's methodologies.
PricewaterhouseCoopers LLP (PwC), independent registered public accounting firm and auditor to Fidelity and certain Fidelity funds, has been engaged annually by the Board as part of the Board's assessment of Fidelity's profitability analysis. PwC's engagement includes the review and assessment of Fidelity's methodologies used in determining the revenues and expenses attributable to Fidelity's mutual fund business, and completion of agreed-upon procedures surrounding the mathematical accuracy of fund profitability and its conformity to allocation methodologies. After considering PwC's reports issued under the engagement and information provided by Fidelity, the Board concluded that while other allocation methods may also be reasonable, Fidelity's profitability methodologies are reasonable in all material respects.
The Board also reviewed Fidelity's non-fund businesses and fall-out benefits related to the mutual fund business as well as cases where Fidelity's affiliates may benefit from or be related to the fund's business.
The Board considered the costs of the services provided by and the profits realized by Fidelity in connection with the operation of the fund and was satisfied that the profitability was not excessive in the circumstances.
Economies of Scale. The Board considered whether there have been economies of scale in respect of the management of the Fidelity funds, whether the Fidelity funds (including the fund) have appropriately benefited from any such economies of scale, and whether there is potential for realization of any further economies of scale. The Board considered the extent to which the fund will benefit from economies of scale through increased services to the fund, through waivers or reimbursements, or through fee or expense reductions. The Board also noted that in 2009, it and the board of other Fidelity funds created an ad hoc committee (the Economies of Scale Committee) to analyze whether FMR attains economies of scale in respect of the management and servicing of the Fidelity funds, whether the Fidelity funds have appropriately benefited from such economies of scale, and whether there is potential for realization of any further economies of scale.
The Board recognized that the fund's management contract incorporates a "group fee" structure, which provides for lower group fee rates as total fund assets under FMR's management increase, and for higher group fee rates as total fund assets under FMR's management decrease. FMR calculates the group fee rates based on a tiered asset "breakpoint" schedule that varies based on asset class. The Board considered that the group fee is designed to deliver the benefits of economies of scale to fund shareholders when total Fidelity fund assets increase, even if assets of any particular fund are unchanged or have declined, because some portion of Fidelity's costs are attributable to services provided to all Fidelity funds, and all funds benefit if those costs can be allocated among more assets. The Board concluded that, given the group fee structure, fund shareholders will benefit from lower management fees as assets under FMR's management increase at the fund complex level, regardless of whether Fidelity achieves any such economies of scale.
The Board concluded, taking into account the analysis of the Economies of Scale Committee, that any potential economies of scale are being appropriately shared between fund shareholders and Fidelity.
Additional Information Requested by the Board. In order to develop fully the factual basis for consideration of the Fidelity funds' Advisory Contracts, the Board requested and received additional information on certain topics, including (i) fund performance trends, actions to be taken by FMR to improve certain funds' overall performance, and Fidelity's long-term strategies for certain funds; (ii) portfolio manager changes that have occurred during the past year and length of portfolio manager tenure for different categories of funds over time; (iii) Fidelity's compensation structure for portfolio managers and other key personnel and strategies for attracting and retaining non-investment personnel; (iv) the amount of the investment that each portfolio manager has made in the Fidelity fund(s) that he or she manages; (v) historical trends in Fidelity's realization of fall-out benefits; (vi) Fidelity's group fee structures and the rationale for the individual fee rates of certain funds; (vii) fund profitability methodology and the impact of certain factors on fund profitability results; (viii) trends regarding industry use of performance fee structures and Fidelity's compliance practices with respect to performance adjustment calculations; (ix) the fee structures in place for certain other Fidelity clients; and (x) explanations regarding the relative total expense ratios of certain funds and classes, total expense competitive trends, and actions that might be taken by FMR to reduce total expense ratios for certain funds and classes.
Annual Report
Based on its evaluation of all of the conclusions noted above, and after considering all factors it believed relevant, the Board ultimately concluded that the advisory fee structures are fair and reasonable, and that the fund's Advisory Contracts should be renewed.
Annual Report
Managing Your Investments
Fidelity offers several ways to conveniently manage your workplace benefits (including your workplace savings plan, investments, and additional services) via your telephone or PC. You can access your plan and account information and research your investments 24 hours a day.
By Phone
Fidelity provides a single toll-free number to access plan information, account balances, positions, and quotes*. It's easy to navigate the service, and on your first call, the system will help you create a personal identification number (PIN) for security.
(phone graphic)
Fidelity Workplace Investing
1-800-835-5092
By PC
Fidelity's web site on the Internet provides a wide range of information, including plan information, daily financial news, fund performance, interactive planning tools, and news about Fidelity products and services.
(computer graphic)
Fidelity's Web Site
www.401k.com
* When you call the quotes line, please remember that a fund's yield and return will vary and, except for money market funds, share price will also vary. This means that you may have a gain or loss when you sell your shares. There is no assurance that money market funds will be able to maintain a stable $1 share price; an investment in a money market fund is not insured or guaranteed by the U.S. government. Total returns are historical and include changes in share price, reinvestment of dividends and capital gains distributions, and the effects of any sales charges.
Annual Report
Investment Adviser
Fidelity Management & Research Company
Boston, MA
Investment Sub-Advisers
FMR Co., Inc.
Fidelity Management & Research (U.K.) Inc.
Fidelity Management & Research
(Hong Kong) Limited
Fidelity Management & Research
(Japan) Inc.
FIL Investment Advisors
FIL Investment Advisors (UK) Limited
FIL Investments (Japan) Limited
General Distributor
Fidelity Distributors Corporation
Boston, MA
Transfer and Service Agents
Fidelity Investments Institutional
Operations Company, Inc.
Boston, MA
Fidelity Service Company, Inc.
Boston, MA
Custodian
JPMorgan Chase Bank
New York, NY
(Fidelity Logo)
Corporate Headquarters
82 Devonshire St., Boston, MA 02109
www.fidelity.com
OVE-F-ANN-1211
1.891736.102
Fidelity®
Total International Equity Fund
Annual Report
October 31, 2011
Contents
Chairman's Message | (Click Here) | The Chairman's message to shareholders. |
Performance | (Click Here) | How the fund has done over time. |
Management's Discussion of Fund Performance | (Click Here) | The Portfolio Manager's review of fund performance and strategy. |
Shareholder Expense Example | (Click Here) | An example of shareholder expenses. |
Investment Changes | (Click Here) | A summary of major shifts in the fund's investments over the past six months. |
Investments | (Click Here) | A complete list of the fund's investments with their market values. |
Financial Statements | (Click Here) | Statements of assets and liabilities, operations, and changes in net assets, as well as financial highlights. |
Notes | (Click Here) | Notes to the financial statements. |
Report of Independent Registered Public Accounting Firm | (Click Here) | |
Trustees and Officers | (Click Here) | |
Distributions | (Click Here) | |
Board Approval of Investment Advisory Contracts and Management Fees | (Click Here) | |
To view a fund's proxy voting guidelines and proxy voting record for the 12-month period ended June 30, visit http://www.fidelity.com/proxyvotingresults or visit the Securities and Exchange Commission's (SEC) web site at http://www.sec.gov. You may also call 1-800-544-8544 to request a free copy of the proxy voting guidelines.
Standard & Poor's, S&P and S&P 500 are registered service marks of The McGraw-Hill Companies, Inc. and have been licensed for use by Fidelity Distributors Corporation.
Other third party marks appearing herein are the property of their respective owners.
All other marks appearing herein are registered or unregistered trademarks or service marks of FMR LLC or an affiliated company.
Annual Report
This report and the financial statements contained herein are submitted for the general information of the shareholders of the fund. This report is not authorized for distribution to prospective investors in the fund unless preceded or accompanied by an effective prospectus.
A fund files its complete schedule of portfolio holdings with the SEC for the first and third quarters of each fiscal year on Form N-Q. Forms N-Q are available on the SEC's web site at http://www.sec.gov. A fund's Forms N-Q may be reviewed and copied at the SEC's Public Reference Room in Washington, DC. Information regarding the operation of the SEC's Public Reference Room may be obtained by calling 1-800-SEC-0330. For a complete list of a fund's portfolio holdings, view the most recent holdings listing, semiannual report, or annual report on Fidelity's web site at http://www.fidelity.com, http://www.advisor.fidelity.com, or http://www.401k.com, as applicable.
NOT FDIC INSURED • MAY LOSE VALUE • NO BANK GUARANTEE
Neither the fund nor Fidelity Distributors Corporation is a bank.
Annual Report
(Acting Chairman's Photograph)
Dear Shareholder:
Global equity markets began the fourth quarter on a strong note, sharply reversing course in October amid strong corporate earnings, better-than-expected economic news and the promise of a resolution to the sovereign debt crisis in Europe. The mini rally followed a third quarter marked by a significant downturn in July and August, which heightened investor anxiety and set off a wave of volatility that hampered most major asset classes through the end of September. Financial markets are difficult to predict, of course, but you can help put the odds in your favor by following these time-tested investment principles.
One of the basic tenets is to invest according to your time horizon. For long-term investors, riding out the markets' inevitable ups and downs has proven much more effective than making decisions based on short-term developments. If your goal is approaching, you can also benefit from patience and restraint, rather than attempting to time the market. No matter your time horizon, missing only a few of the markets' best days can significantly diminish returns. Patience also affords the benefits of compounding - earning interest on additional income or reinvested dividends and capital gains. While staying the course doesn't eliminate risk, it can considerably lessen the negative impact of short-term downturns.
Asset allocation is another principle to manage risk. As you spread your portfolio among the asset classes, be sure to consider your time horizon, risk tolerance and investment objectives. Younger investors may be better served by emphasizing equities, which historically have been the best-performing asset class over time. Investors who are nearing a specific goal, such as retirement or sending a child to college, may choose to favor bonds and other investments that have tended to be more stable. Studies indicate that asset allocation is the single most important determinant of a portfolio's long-term success. After deciding on a suitable allocation strategy, make sure your portfolio is adequately diversified, with exposure to stocks of small-, mid- and large-cap companies in a range of sectors, for example. And today, more than ever, geographic diversification should be taken into account.
Lastly, investing a certain amount of money on a regular basis - a principle known as dollar-cost averaging - can help lower the average cost of your purchases, while also giving you the discipline to avoid selling weak performers just prior to an upswing, or chasing a hot performer just before a correction.
We invite you to learn more by visiting us on the Internet, dropping by one of our Investor Centers or calling us by phone. It is our privilege to provide the resources you need to choose investments that are right for you.
Sincerely,
(Acting Chairman's Signature)
James C. Curvey
Acting Chairman
Annual Report
Average annual total return reflects the change in the value of an investment, assuming reinvestment of the class' distributions from dividend income and capital gains (the profits earned upon the sale of securities that have grown in value, if any) and assuming a constant rate of performance each year. The $10,000 table and the fund's returns do not reflect the deduction of taxes that a shareholder would pay on fund distributions or the redemption of fund shares. During periods of reimbursement by Fidelity, a fund's total return will be greater than it would be had the reimbursement not occurred. How a fund did yesterday is no guarantee of how it will do tomorrow.
Average Annual Total Returns
Periods ended October 31, 2011 | Past 1
year | Life of
fund A |
Fidelity® Total International Equity Fund | -7.70% | -8.24% |
A From November 1, 2007.
$10,000 Over Life of Fund
Let's say hypothetically that $10,000 was invested in Fidelity® Total International Equity Fund, a class of the fund, on November 1, 2007, when the fund started. The chart shows how the value of your investment would have changed, and also shows how the MSCI® ACWI® (All Country World Index) ex USA Index performed over the same period.
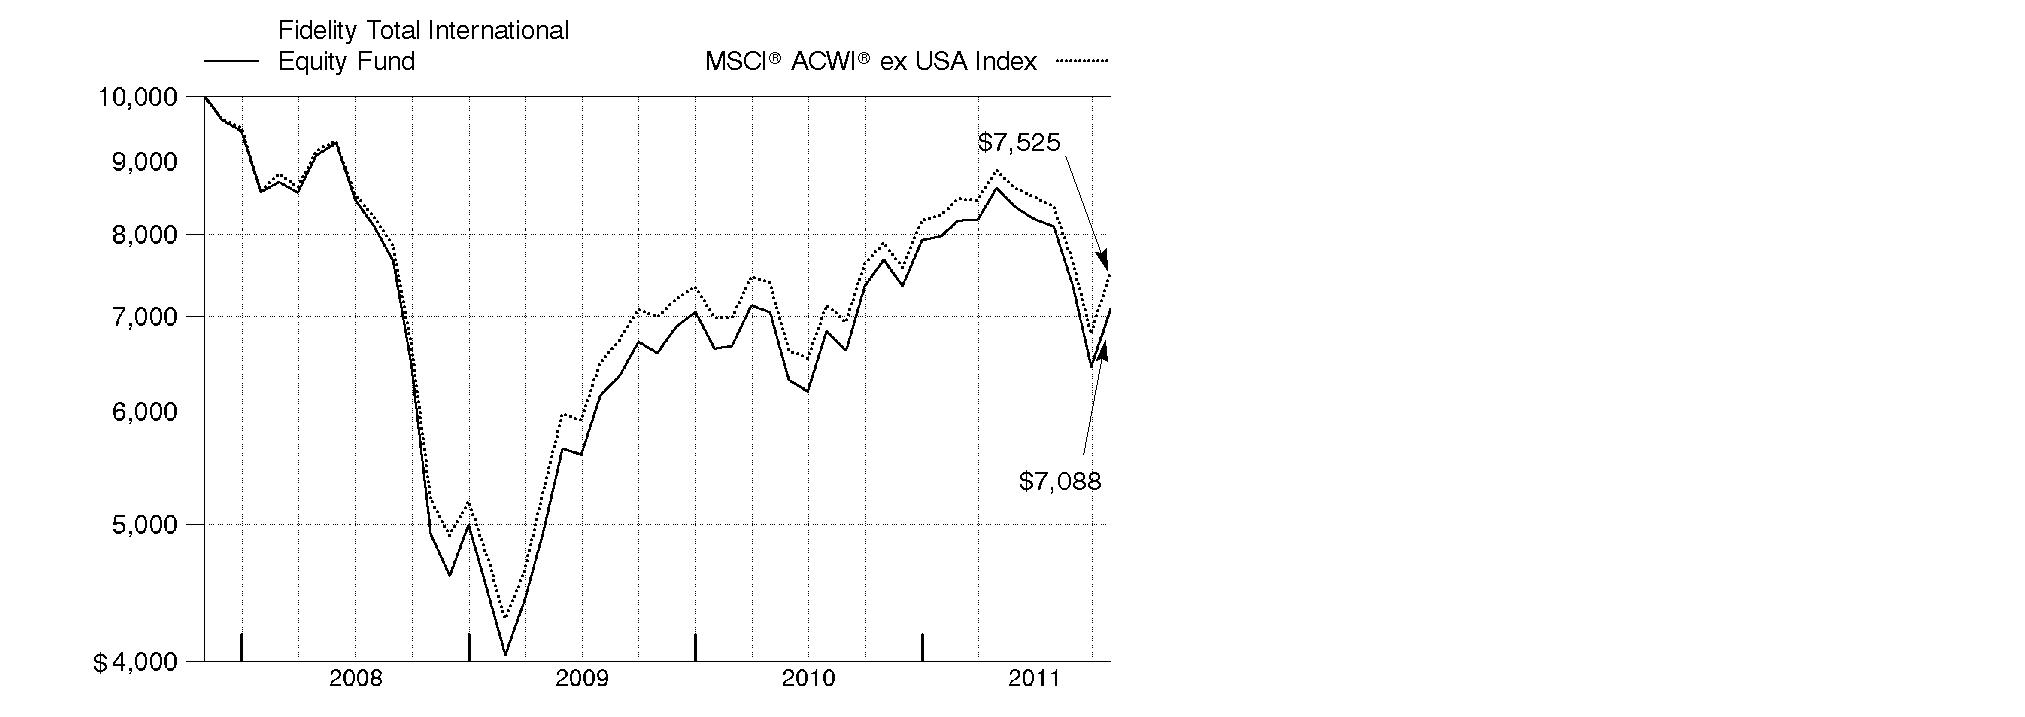
Annual Report
Market Recap: International equities were rocked by a number of headline events during the year ending October 31, 2011. Stocks posted a solid advance for the first half of the period, despite concern about the sovereign debt crisis in Europe, a devastating earthquake and tsunami in Japan, and political upheaval in the Middle East and North Africa. Sentiment turned decidedly negative in the second half, however, as fresh worries about Europe, inflation in China and a dimmed outlook for global growth caused foreign markets to suffer declines that intensified in August and September. October brought with it yet another dramatic swing, as eurozone policymakers appeared near a resolution to the debt debacle and buyers stormed back onto the scene in search of bargains. Still, those gains - along with favorable currency fluctuations overall - weren't enough to offset prior losses, and the MSCI® ACWI® (All Country World Index) ex USA Index finished the period down 4.56%. Within the MSCI index, Europe and emerging markets suffered the biggest declines, with many countries in these areas sustaining steep losses. By contrast, Japan showed resilience in the wake of its natural disasters, falling only 2%. Australia (+4%), Switzerland (+3%), the U.K. (+2%) and Canada, which produced a nominal return, were among the few major benchmark components to break into positive territory.
Comments from Jed Weiss, Co-Portfolio Manager of Fidelity® Total International Equity Fund: For the year, the fund's Retail Class shares fell 7.70%, lagging the MSCI index. Security selection in the U.K. and France detracted the most, as did positioning in Canada. An overweighting in the U.S. also hurt, but good picks there more than compensated. Selection in Japan and Finland also helped. On a sector basis, our choices in financials detracted, including various European firms - Societe Generale (France), Turkiye Garanti Bankasi (Turkey), Intesa Sanpaolo (Italy) and AXA (France). Stock picking in consumer staples and industrials hurt, as did our energy positioning. Our stance in information technology and consumer discretionary, however, was positive. Other individual detractors included underweighting U.K.-based British American Tobacco and Canadian energy firm Niko Resources. On the positive side, not owning weak-performing benchmark component Tokyo Electric Power helped, as did an out-of-benchmark stake in U.S. credit card processor MasterCard and an overweighting in French drug maker Roche Holding. Some of the stocks mentioned in this report were not owned at period end.
The views expressed above reflect those of the portfolio manager(s) only through the end of the period as stated on the cover of this report and do not necessarily represent the views of Fidelity or any other person in the Fidelity organization. Any such views are subject to change at any time based upon market or other conditions and Fidelity disclaims any responsibility to update such views. These views may not be relied on as investment advice and, because investment decisions for a Fidelity fund are based on numerous factors, may not be relied on as an indication of trading intent on behalf of any Fidelity fund.
Annual Report
Shareholder Expense Example
As a shareholder of the Fund, you incur two types of costs: (1) transaction costs, including sales charges (loads) on purchase payments or redemption proceeds, redemption fees, and (2) ongoing costs, including management fees, distribution and/or service (12b-1) fees and other Fund expenses. This Example is intended to help you understand your ongoing costs (in dollars) of investing in the Fund and to compare these costs with the ongoing costs of investing in other mutual funds.
The Example is based on an investment of $1,000 invested at the beginning of the period and held for the entire period (May 1, 2011 to October 31, 2011).
Actual Expenses
The first line of the accompanying table for each class of the Fund provides information about actual account values and actual expenses. You may use the information in this line, together with the amount you invested, to estimate the expenses that you paid over the period. Simply divide your account value by $1,000.00 (for example, an $8,600 account value divided by $1,000.00 = 8.6), then multiply the result by the number in the first line for a class of the Fund under the heading entitled "Expenses Paid During Period" to estimate the expenses you paid on your account during this period. A small balance maintenance fee of $12.00 that is charged once a year may apply for certain accounts with a value of less than $2,000. This fee is not included in the table below. If it was, the estimate of expenses you paid during the period would be higher, and your ending account value lower, by this amount. In addition, the Fund, as a shareholder in the underlying Fidelity Central Funds, will indirectly bear its pro-rata share of the fees and expenses incurred by the underlying Fidelity Central Funds. These fees and expenses are not included in the Fund's annualized expense ratio used to calculate the expense estimate in the table below.
Hypothetical Example for Comparison Purposes
The second line of the accompanying table for each class of the Fund provides information about hypothetical account values and hypothetical expenses based on a Class' actual expense ratio and an assumed rate of return of 5% per year before expenses, which is not the Class' actual return. The hypothetical account values and expenses may not be used to estimate the actual ending account balance or expenses you paid for the period. You may use this information to compare the ongoing costs of investing in the Fund and other funds. To do so, compare this 5% hypothetical example with the 5% hypothetical examples that appear in the shareholder reports of the other funds. A small balance maintenance fee of $12.00 that is charged once a year may apply for certain accounts with a value of less than $2,000. This fee is not included in the table below. If it was, the estimate of expenses you paid during the period would be higher, and your ending account value lower, by this amount. In addition, the Fund, as a shareholder in the underlying Fidelity Central Funds, will indirectly bear its pro-rata share of the fees and expenses incurred by the underlying Fidelity Central Funds. These fees and expenses are not included in the Fund's annualized expense ratio used to calculate the expense estimate in the table below.
Please note that the expenses shown in the table are meant to highlight your ongoing costs only and do not reflect any transaction costs. Therefore, the second line of the table is useful in comparing ongoing costs only, and will not help you determine the relative total costs of owning different funds. In addition, if these transactional costs were included, your costs would have been higher.
Annual Report
Shareholder Expense Example - continued
| Annualized
Expense Ratio | Beginning
Account Value
May 1, 2011 | Ending
Account Value
October 31, 2011 | Expenses Paid
During Period*
May 1, 2011 to October 31, 2011 |
Class A | 1.45% | | | |
Actual | | $ 1,000.00 | $ 819.40 | $ 6.65 |
Hypothetical A | | $ 1,000.00 | $ 1,017.90 | $ 7.38 |
Class T | 1.70% | | | |
Actual | | $ 1,000.00 | $ 819.70 | $ 7.80 |
Hypothetical A | | $ 1,000.00 | $ 1,016.64 | $ 8.64 |
Class B | 2.20% | | | |
Actual | | $ 1,000.00 | $ 816.60 | $ 10.07 |
Hypothetical A | | $ 1,000.00 | $ 1,014.12 | $ 11.17 |
Class C | 2.20% | | | |
Actual | | $ 1,000.00 | $ 816.40 | $ 10.07 |
Hypothetical A | | $ 1,000.00 | $ 1,014.12 | $ 11.17 |
Total International Equity | 1.20% | | | |
Actual | | $ 1,000.00 | $ 821.90 | $ 5.51 |
Hypothetical A | | $ 1,000.00 | $ 1,019.16 | $ 6.11 |
Institutional Class | 1.20% | | | |
Actual | | $ 1,000.00 | $ 821.40 | $ 5.51 |
Hypothetical A | | $ 1,000.00 | $ 1,019.16 | $ 6.11 |
A 5% return per year before expenses
* Expenses are equal to each Class' annualized expense ratio, multiplied by the average account value over the period, multiplied by 184/365 (to reflect the one-half year period).
Annual Report
Investment Changes (Unaudited)
Geographic Diversification (% of fund's net assets) |
As of October 31, 2011 |
| United Kingdom 18.1% | |
| Japan 11.7% | |
| United States of America 9.0% | |
| Switzerland 6.6% | |
| Germany 5.9% | |
| France 4.9% | |
| Australia 4.3% | |
| Korea (South) 4.2% | |
| Brazil 4.1% | |
| Other 31.2% | |

Percentages are adjusted for the effect of futures contracts, if applicable. |
As of April 30, 2011 |
| United Kingdom 16.4% | |
| Japan 10.3% | |
| United States of America 7.4% | |
| Switzerland 5.6% | |
| France 5.3% | |
| Germany 5.2% | |
| Brazil 4.4% | |
| Korea (South) 3.6% | |
| Spain 3.0% | |
| Other 38.8% | |

Percentages are adjusted for the effect of futures contracts, if applicable. |
Asset Allocation |
| % of fund's
net assets | % of fund's net assets
6 months ago |
Stocks and Investment Companies | 96.7 | 97.6 |
Short-Term Investments and Net Other Assets | 3.3 | 2.4 |
Top Ten Stocks as of October 31, 2011 |
| % of fund's
net assets | % of fund's net assets
6 months ago |
Nestle SA (Switzerland, Food Products) | 2.7 | 1.8 |
Royal Dutch Shell PLC Class A sponsored ADR (United Kingdom, Oil, Gas & Consumable Fuels) | 2.2 | 1.7 |
Roche Holding AG (participation certificate) (Switzerland, Pharmaceuticals) | 1.8 | 1.3 |
GlaxoSmithKline PLC sponsored ADR (United Kingdom, Pharmaceuticals) | 1.6 | 0.9 |
BHP Billiton PLC ADR (United Kingdom, Metals & Mining) | 1.4 | 1.7 |
Vodafone Group PLC sponsored ADR (United Kingdom, Wireless Telecommunication Services) | 1.3 | 0.9 |
Anheuser-Busch InBev SA NV (Belgium, Beverages) | 1.1 | 1.1 |
Sanofi-aventis (France, Pharmaceuticals) | 1.1 | 0.0 |
Commonwealth Bank of Australia (Australia, Commercial Banks) | 1.1 | 0.1 |
BP PLC sponsored ADR (United Kingdom, Oil, Gas & Consumable Fuels) | 1.1 | 1.0 |
| 15.4 | |
Market Sectors as of October 31, 2011 |
| % of fund's
net assets | % of fund's net assets
6 months ago |
Financials | 18.2 | 23.8 |
Consumer Staples | 12.9 | 8.8 |
Materials | 10.6 | 13.5 |
Energy | 10.0 | 10.0 |
Consumer Discretionary | 9.9 | 10.8 |
Industrials | 9.9 | 11.3 |
Health Care | 8.0 | 5.1 |
Information Technology | 6.8 | 7.7 |
Telecommunication Services | 6.7 | 3.7 |
Utilities | 3.7 | 2.6 |
Annual Report
Investments October 31, 2011
Showing Percentage of Net Assets
Common Stocks - 96.5% |
| Shares | | Value |
Australia - 4.3% |
Australia & New Zealand Banking Group Ltd. | 43,841 | | $ 990,744 |
Coca-Cola Amatil Ltd. | 20,575 | | 265,625 |
Commonwealth Bank of Australia | 28,630 | | 1,470,865 |
CSL Ltd. | 20,431 | | 615,420 |
Macquarie Group Ltd. | 9,104 | | 234,416 |
MAp Group unit | 66,645 | | 237,831 |
Newcrest Mining Ltd. | 12,208 | | 431,494 |
Newcrest Mining Ltd. sponsored ADR | 6,284 | | 220,883 |
OZ Minerals Ltd. | 19,949 | | 239,586 |
QBE Insurance Group Ltd. | 9,595 | | 147,709 |
Ramsay Health Care Ltd. | 619 | | 12,169 |
Telstra Corp. Ltd. | 160,903 | | 522,492 |
Woolworths Ltd. | 8,510 | | 212,752 |
WorleyParsons Ltd. | 14,070 | | 408,417 |
TOTAL AUSTRALIA | | 6,010,403 |
Austria - 0.4% |
Andritz AG | 4,229 | | 374,736 |
Zumtobel AG | 8,900 | | 185,613 |
TOTAL AUSTRIA | | 560,349 |
Bailiwick of Guernsey - 0.2% |
Resolution Ltd. | 66,466 | | 293,949 |
Bailiwick of Jersey - 0.9% |
Informa PLC | 27,581 | | 160,745 |
Randgold Resources Ltd. sponsored ADR | 6,860 | | 751,650 |
Wolseley PLC | 9,363 | | 270,735 |
TOTAL BAILIWICK OF JERSEY | | 1,183,130 |
Belgium - 1.4% |
Anheuser-Busch InBev SA NV | 27,471 | | 1,523,656 |
Gimv NV | 520 | | 26,590 |
Umicore SA | 8,973 | | 386,378 |
TOTAL BELGIUM | | 1,936,624 |
Bermuda - 0.9% |
Aquarius Platinum Ltd. (Australia) | 6,424 | | 18,847 |
Cheung Kong Infrastructure Holdings Ltd. | 27,000 | | 144,631 |
CNPC (Hong Kong) Ltd. | 92,000 | | 128,872 |
Great Eagle Holdings Ltd. | 30,089 | | 66,826 |
Lazard Ltd. Class A | 7,950 | | 217,353 |
Li & Fung Ltd. | 212,000 | | 408,565 |
Common Stocks - continued |
| Shares | | Value |
Bermuda - continued |
NWS Holdings Ltd. | 48,000 | | $ 72,786 |
Trinity Ltd. | 214,000 | | 193,961 |
TOTAL BERMUDA | | 1,251,841 |
Brazil - 4.1% |
Arezzo Industria e Comercio SA | 12,100 | | 159,952 |
Banco ABC Brasil SA | 3,900 | | 26,005 |
Banco Bradesco SA (PN) sponsored ADR | 31,200 | | 567,840 |
Banco do Estado do Rio Grande do Sul SA | 15,600 | | 164,430 |
Banco Pine SA | 2,300 | | 15,282 |
BM&F Bovespa SA | 45,900 | | 273,978 |
BR Malls Participacoes SA | 26,900 | | 290,586 |
Braskem SA Class A sponsored ADR | 18,280 | | 329,771 |
Cia.Hering SA | 600 | | 13,400 |
Companhia de Bebidas das Americas (AmBev) (PN) sponsored ADR | 9,800 | | 330,456 |
Companhia de Saneamento Basico do Estado de Sao Paulo (SABESP) | 6,900 | | 189,256 |
Companhia de Saneamento de Minas Gerais | 2,400 | | 45,059 |
Eletropaulo Metropolitana SA (PN-B) | 8,300 | | 148,870 |
Embraer SA sponsored ADR | 4,200 | | 116,844 |
Gol Linhas Aereas Inteligentes SA sponsored ADR | 15,900 | | 127,518 |
Iguatemi Empresa de Shopping Centers SA | 7,700 | | 149,184 |
Itau Unibanco Banco Multiplo SA sponsored ADR | 11,970 | | 228,866 |
Klabin SA (PN) (non-vtg.) | 7,500 | | 27,603 |
Localiza Rent A Car SA | 3,200 | | 48,358 |
Marcopolo SA (PN) | 13,300 | | 58,863 |
Mills Estruturas e Servicos de Engenharia SA | 3,300 | | 32,958 |
Multiplan Empreendimentos Imobiliarios SA | 11,800 | | 238,584 |
Multiplus SA | 5,100 | | 86,129 |
Odontoprev SA | 1,900 | | 29,896 |
OGX Petroleo e Gas Participacoes SA (a) | 32,800 | | 271,232 |
Petroleo Brasileiro SA - Petrobras (PN) sponsored ADR | 24,300 | | 614,547 |
Qualicorp SA | 5,000 | | 45,714 |
Restoque Comercio e Confeccoes de Roupas SA | 200 | | 3,145 |
T4F Entretenimento SA | 1,800 | | 12,579 |
Tegma Gestao Logistica | 7,900 | | 102,591 |
Telefonica Brasil SA sponsored ADR (a) | 4,300 | | 124,786 |
TIM Participacoes SA sponsored ADR | 9,906 | | 257,952 |
Totvs SA | 800 | | 13,277 |
Common Stocks - continued |
| Shares | | Value |
Brazil - continued |
Ultrapar Participacoes SA | 8,300 | | $ 147,904 |
Vale SA (PN-A) sponsored ADR | 16,700 | | 394,120 |
TOTAL BRAZIL | | 5,687,535 |
British Virgin Islands - 0.1% |
Mail.ru Group Ltd.: | | | |
GDR (a)(e) | 3,500 | | 120,575 |
GDR (Reg. S) | 100 | | 3,445 |
TOTAL BRITISH VIRGIN ISLANDS | | 124,020 |
Canada - 1.5% |
Agnico-Eagle Mines Ltd. (Canada) | 6,690 | | 290,190 |
Eldorado Gold Corp. | 12,300 | | 231,107 |
Fairfax Financial Holdings Ltd. (sub. vtg.) | 865 | | 361,558 |
First Quantum Minerals Ltd. | 7,200 | | 151,028 |
Goldcorp, Inc. | 3,800 | | 184,882 |
Niko Resources Ltd. | 6,070 | | 333,870 |
Open Text Corp. (a) | 4,750 | | 290,713 |
Pan American Silver Corp. | 4,300 | | 120,228 |
Petrominerales Ltd. | 4,725 | | 124,660 |
Quadra FNX Mining Ltd. (a) | 1,100 | | 12,690 |
TAG Oil Ltd. (a) | 2,000 | | 12,399 |
Tuscany International Drilling, Inc. (a) | 16,400 | | 11,187 |
Tuscany International Drilling, Inc. (a)(e) | 1,900 | | 1,296 |
TOTAL CANADA | | 2,125,808 |
Cayman Islands - 1.3% |
Belle International Holdings Ltd. | 44,000 | | 86,294 |
Central China Real Estate Ltd. | 111,050 | | 25,077 |
China Lilang Ltd. | 20,000 | | 21,053 |
China Shanghui Cement Group Ltd. | 195,000 | | 149,365 |
Country Garden Holdings Co. Ltd. | 290,000 | | 114,822 |
Eurasia Drilling Co. Ltd. GDR (Reg. S) | 6,400 | | 151,040 |
EVA Precision Industrial Holdings Ltd. | 298,000 | | 76,959 |
Haitian International Holdings Ltd. | 57,000 | | 50,644 |
Intime Department Store Group Co. Ltd. | 9,000 | | 12,916 |
NVC Lighting Holdings Ltd. | 415,000 | | 180,190 |
Sands China Ltd. (a) | 85,000 | | 255,441 |
Shenguan Holdings Group Ltd. | 166,000 | | 89,184 |
Silver Base Group Holdings Ltd. | 81,000 | | 86,264 |
SOHO China Ltd. | 153,000 | | 109,084 |
Common Stocks - continued |
| Shares | | Value |
Cayman Islands - continued |
Vantage Drilling Co. (a) | 8,900 | | $ 12,104 |
Wynn Macau Ltd. | 113,000 | | 316,612 |
TOTAL CAYMAN ISLANDS | | 1,737,049 |
Chile - 0.4% |
Banco Santander Chile sponsored ADR | 2,900 | | 236,872 |
CFR Pharmaceuticals SA | 488,397 | | 115,632 |
Empresa Nacional de Telecomunicaciones SA (ENTEL) | 8,423 | | 166,758 |
TOTAL CHILE | | 519,262 |
China - 1.8% |
Baidu.com, Inc. sponsored ADR (a) | 3,115 | | 436,661 |
China Communications Construction Co. Ltd. (H Shares) | 187,000 | | 141,046 |
China Communications Services Corp. Ltd. (H Shares) | 270,000 | | 124,520 |
China Construction Bank Corp. (H Shares) | 587,000 | | 431,290 |
China Minsheng Banking Corp. Ltd. (H Shares) | 274,000 | | 223,206 |
China National Building Materials Co. Ltd. (H Shares) | 90,000 | | 115,282 |
China Pacific Insurance Group Co. Ltd. (H Shares) | 26,600 | | 81,627 |
China Petroleum & Chemical Corp.: | | | |
(H Shares) | 152,000 | | 143,751 |
sponsored ADR (H Shares) | 1,200 | | 113,280 |
China Southern Airlines Ltd. (H Shares) (a) | 200,000 | | 111,612 |
Great Wall Motor Co. Ltd. (H Shares) | 88,000 | | 119,496 |
Harbin Power Equipment Co. Ltd. (H Shares) | 142,000 | | 143,099 |
Industrial & Commercial Bank of China Ltd. (H Shares) | 235,285 | | 146,927 |
SINA Corp. (a) | 900 | | 73,161 |
Sinopec Shanghai Petrochemical Co. Ltd. (H Shares) | 216,000 | | 79,304 |
Yantai Changyu Pioneer Wine Co. (B Shares) | 6,290 | | 70,769 |
TOTAL CHINA | | 2,555,031 |
Czech Republic - 0.4% |
Ceske Energeticke Zavody AS | 7,500 | | 317,178 |
Komercni Banka AS | 600 | | 115,720 |
Philip Morris CR A/S | 100 | | 65,661 |
TOTAL CZECH REPUBLIC | | 498,559 |
Denmark - 1.2% |
Novo Nordisk A/S Series B sponsored ADR | 11,100 | | 1,179,930 |
William Demant Holding A/S (a) | 5,310 | | 423,674 |
TOTAL DENMARK | | 1,603,604 |
Egypt - 0.1% |
Commercial International Bank Ltd. sponsored GDR | 30,509 | | 134,789 |
Common Stocks - continued |
| Shares | | Value |
Finland - 0.7% |
Metso Corp. | 4,520 | | $ 176,022 |
Nokian Tyres PLC | 11,302 | | 415,264 |
Outotec Oyj | 7,812 | | 365,196 |
TOTAL FINLAND | | 956,482 |
France - 4.9% |
Alstom SA | 12,669 | | 475,134 |
Atos Origin SA | 4,113 | | 199,333 |
Audika SA | 1,000 | | 22,115 |
BNP Paribas SA | 14,551 | | 661,505 |
Casino Guichard Perrachon et Compagnie | 2,608 | | 245,138 |
Compagnie de St. Gobain | 4,179 | | 194,840 |
Danone | 12,580 | | 875,696 |
Euler Hermes SA | 1,414 | | 102,460 |
GDF Suez | 16,600 | | 471,286 |
Laurent-Perrier Group | 359 | | 37,013 |
Pernod-Ricard SA | 2,800 | | 261,557 |
PPR SA | 2,700 | | 421,854 |
Remy Cointreau SA | 3,752 | | 308,428 |
Safran SA | 17,914 | | 586,807 |
Saft Groupe SA | 1,329 | | 40,462 |
Sanofi-aventis | 20,892 | | 1,494,810 |
Unibail-Rodamco | 1,421 | | 284,162 |
Vetoquinol SA | 400 | | 13,186 |
Virbac SA | 190 | | 32,889 |
TOTAL FRANCE | | 6,728,675 |
Georgia - 0.0% |
Bank of Georgia GDR (Reg. S) | 3,800 | | 48,450 |
Germany - 5.8% |
Allianz AG | 7,752 | | 871,220 |
Allianz AG sponsored ADR | 13,600 | | 152,320 |
alstria office REIT-AG | 12,500 | | 160,705 |
BASF AG | 13,415 | | 987,473 |
Bayer AG | 10,037 | | 643,047 |
Bayerische Motoren Werke AG (BMW) | 2,605 | | 212,915 |
Bilfinger Berger AG | 512 | | 45,900 |
CompuGROUP Holding AG | 946 | | 12,175 |
CTS Eventim AG | 1,974 | | 65,359 |
Daimler AG (United States) | 9,900 | | 503,316 |
Deutsche Telekom AG | 37,500 | | 477,134 |
E.ON AG | 23,710 | | 574,543 |
Common Stocks - continued |
| Shares | | Value |
Germany - continued |
Fielmann AG | 479 | | $ 50,452 |
HeidelbergCement AG | 4,700 | | 214,513 |
Linde AG | 7,449 | | 1,184,982 |
MAN SE | 1,872 | | 166,035 |
Metro AG | 3,800 | | 177,170 |
Siemens AG | 4,900 | | 513,697 |
Siemens AG sponsored ADR | 8,100 | | 850,257 |
Software AG (Bearer) | 759 | | 31,532 |
Volkswagen AG | 1,217 | | 191,663 |
TOTAL GERMANY | | 8,086,408 |
Hong Kong - 1.6% |
China Insurance International Holdings Co. Ltd. (a) | 60,600 | | 131,415 |
China Mobile (Hong Kong) Ltd. | 67,500 | | 641,543 |
China Power International Development Ltd. | 607,000 | | 128,441 |
CNOOC Ltd. | 223,000 | | 421,550 |
CNOOC Ltd. sponsored ADR | 500 | | 94,305 |
Dah Chong Hong Holdings Ltd. | 47,000 | | 57,078 |
Henderson Land Development Co. Ltd. | 6,000 | | 32,796 |
Hong Kong Exchanges and Clearing Ltd. | 27,100 | | 459,396 |
Lenovo Group Ltd. | 48,000 | | 32,271 |
Power Assets Holdings Ltd. | 35,000 | | 265,958 |
TOTAL HONG KONG | | 2,264,753 |
Hungary - 0.0% |
Magyar Telekom PLC | 11,000 | | 25,599 |
India - 1.0% |
Apollo Tyres Ltd. | 8,934 | | 10,477 |
Bank of Baroda | 11,133 | | 175,541 |
Bharti Airtel Ltd. | 54,055 | | 432,911 |
Housing Development Finance Corp. Ltd. | 18,488 | | 260,178 |
Indian Overseas Bank | 43,467 | | 91,094 |
Jain Irrigation Systems Ltd. | 3,152 | | 8,031 |
Jyothy Laboratories Ltd. | 6,140 | | 17,973 |
Punjab National Bank | 2,820 | | 57,448 |
Tata Consultancy Services Ltd. | 9,254 | | 210,508 |
Tata Steel Ltd. | 6,075 | | 59,823 |
Ultratech Cement Ltd. | 4,746 | | 112,057 |
TOTAL INDIA | | 1,436,041 |
Indonesia - 1.1% |
PT Astra International Tbk | 40,000 | | 308,430 |
Common Stocks - continued |
| Shares | | Value |
Indonesia - continued |
PT Bank Negara Indonesia (Persero) Tbk | 281,000 | | $ 125,933 |
PT Bank Rakyat Indonesia Tbk | 439,000 | | 330,061 |
PT Bank Tabungan Negara Tbk | 425,000 | | 68,412 |
PT Bumi Serpong Damai Tbk | 627,900 | | 64,613 |
PT Ciputra Development Tbk | 779,000 | | 42,712 |
PT Gadjah Tunggal Tbk | 146,500 | | 44,799 |
PT Indofood Sukses Makmur Tbk | 213,000 | | 126,437 |
PT Indosat Tbk | 207,000 | | 123,978 |
PT Summarecon Agung Tbk | 260,000 | | 34,025 |
PT Tower Bersama Infrastructure Tbk | 318,000 | | 74,009 |
PT XL Axiata Tbk | 207,000 | | 115,773 |
TOTAL INDONESIA | | 1,459,182 |
Ireland - 0.7% |
CRH PLC sponsored ADR (d) | 33,204 | | 611,286 |
James Hardie Industries NV sponsored ADR (a) | 11,165 | | 362,081 |
TOTAL IRELAND | | 973,367 |
Israel - 0.2% |
Azrieli Group | 5,882 | | 151,342 |
Check Point Software Technologies Ltd. (a) | 2,100 | | 121,023 |
Ituran Location & Control Ltd. | 2,061 | | 27,432 |
TOTAL ISRAEL | | 299,797 |
Italy - 1.5% |
Azimut Holding SpA | 4,314 | | 33,731 |
ENI SpA | 44,600 | | 985,977 |
Fiat Industrial SpA (a) | 32,899 | | 287,060 |
Interpump Group SpA | 28,825 | | 185,652 |
Intesa Sanpaolo SpA | 145,265 | | 259,533 |
Saipem SpA | 5,356 | | 240,154 |
Telecom Italia SpA | 119,900 | | 149,210 |
TOTAL ITALY | | 2,141,317 |
Japan - 11.7% |
ABC-Mart, Inc. | 4,300 | | 168,418 |
Aeon Credit Service Co. Ltd. | 15,900 | | 237,145 |
Air Water, Inc. | 26,000 | | 330,091 |
Aisin Seiki Co. Ltd. | 5,500 | | 173,971 |
Aozora Bank Ltd. | 164,000 | | 414,649 |
Asahi Co. Ltd. | 800 | | 17,726 |
Asahi Glass Co. Ltd. | 19,000 | | 166,403 |
Autobacs Seven Co. Ltd. | 7,200 | | 329,737 |
Common Stocks - continued |
| Shares | | Value |
Japan - continued |
Canon, Inc. | 8,100 | | $ 367,769 |
Chubu Electric Power Co., Inc. | 13,400 | | 245,194 |
Credit Saison Co. Ltd. | 14,300 | | 279,084 |
Daikoku Denki Co. Ltd. | 2,000 | | 17,910 |
Daikokutenbussan Co. Ltd. | 1,500 | | 43,055 |
Denso Corp. | 25,300 | | 778,157 |
Dentsu, Inc. | 7,300 | | 219,833 |
Fanuc Corp. | 6,100 | | 986,437 |
Fast Retailing Co. Ltd. | 1,300 | | 233,556 |
FCC Co. Ltd. | 2,300 | | 48,601 |
GCA Savvian Group Corp. | 16 | | 18,730 |
Glory Ltd. | 900 | | 19,266 |
Goldcrest Co. Ltd. | 860 | | 15,780 |
Honda Motor Co. Ltd. | 15,600 | | 466,558 |
INPEX Corp. | 46 | | 303,735 |
Itochu Corp. | 55,600 | | 549,979 |
Japan Retail Fund Investment Corp. | 318 | | 492,318 |
Japan Tobacco, Inc. | 196 | | 979,765 |
JSR Corp. | 13,000 | | 248,203 |
JX Holdings, Inc. | 61,500 | | 358,276 |
Kamigumi Co. Ltd. | 4,000 | | 34,932 |
KDDI Corp. | 87 | | 637,388 |
Keyence Corp. | 2,010 | | 511,029 |
Kobayashi Pharmaceutical Co. Ltd. | 6,800 | | 337,114 |
Kyoto Kimono Yuzen Co. Ltd. | 1,600 | | 18,615 |
Meiko Network Japan Co. Ltd. | 1,300 | | 10,765 |
Miraial Co. Ltd. | 300 | | 4,662 |
Mitsubishi Corp. | 13,200 | | 271,519 |
Mitsubishi Tanabe Pharma Corp. | 22,400 | | 387,509 |
Nabtesco Corp. | 2,400 | | 52,571 |
Nagaileben Co. Ltd. | 1,200 | | 16,539 |
Nihon M&A Center, Inc. | 6 | | 33,871 |
Nihon Parkerizing Co. Ltd. | 2,000 | | 26,927 |
Nippon Seiki Co. Ltd. | 3,000 | | 30,145 |
Nippon Telegraph & Telephone Corp. | 13,500 | | 692,582 |
Nippon Thompson Co. Ltd. | 8,000 | | 51,534 |
Obic Co. Ltd. | 1,430 | | 270,391 |
ORIX Corp. | 2,930 | | 255,749 |
Osaka Securities Exchange Co. Ltd. | 72 | | 337,440 |
OSG Corp. | 1,300 | | 16,661 |
Santen Pharmaceutical Co. Ltd. | 6,200 | | 231,374 |
Seven & i Holdings Co., Ltd. | 12,000 | | 320,270 |
Common Stocks - continued |
| Shares | | Value |
Japan - continued |
Seven Bank Ltd. | 8 | | $ 14,238 |
SHO-BOND Holdings Co. Ltd. | 6,300 | | 140,552 |
Shoei Co. Ltd. | 1,100 | | 7,403 |
The Nippon Synthetic Chemical Industry Co. Ltd. | 5,000 | | 27,779 |
Tokio Marine Holdings, Inc. | 9,200 | | 219,397 |
Tokyo Gas Co. Ltd. | 98,000 | | 422,074 |
Toray Industries, Inc. | 40,000 | | 284,732 |
Tsumura & Co. | 1,200 | | 33,754 |
Tsutsumi Jewelry Co. Ltd. | 600 | | 13,983 |
Unicharm Corp. | 8,200 | | 367,275 |
USS Co. Ltd. | 9,880 | | 816,876 |
West Japan Railway Co. | 11,800 | | 500,072 |
Yamatake Corp. | 900 | | 19,914 |
Yamato Kogyo Co. Ltd. | 12,900 | | 326,341 |
TOTAL JAPAN | | 16,254,323 |
Kazakhstan - 0.1% |
KazMunaiGas Exploration & Production JSC (Reg. S) GDR | 8,100 | | 137,538 |
Korea (South) - 4.2% |
BS Financial Group, Inc. (a) | 11,160 | | 122,369 |
Cheil Worldwide, Inc. | 6,620 | | 107,992 |
CJ CheilJedang Corp. | 153 | | 42,065 |
CJ Corp. | 2,289 | | 163,382 |
Daum Communications Corp. | 665 | | 80,267 |
Doosan Co. Ltd. | 1,290 | | 162,511 |
GS Holdings Corp. | 2,952 | | 169,406 |
Hana Financial Group, Inc. | 6,920 | | 246,284 |
Hankook Tire Co. Ltd. | 2,340 | | 93,051 |
Hyundai Department Store Co. Ltd. | 1,186 | | 169,409 |
Hyundai Fire & Marine Insurance Co. Ltd. | 2,950 | | 85,101 |
Hyundai Heavy Industries Co. Ltd. | 917 | | 244,075 |
Hyundai Hysco Co. Ltd. | 2,860 | | 110,296 |
Hyundai Mobis | 986 | | 281,132 |
Hyundai Motor Co. | 2,901 | | 582,048 |
Industrial Bank of Korea | 15,910 | | 208,092 |
Kia Motors Corp. | 4,180 | | 266,988 |
Korea Zinc Co. Ltd. | 286 | | 83,516 |
KT&G Corp. | 4,353 | | 271,291 |
LG Chemical Ltd. | 1 | | 321 |
LIG Non-Life Insurance Co. Ltd. | 3,220 | | 68,289 |
Lotte Samkang Co. Ltd. | 104 | | 30,999 |
NCsoft Corp. | 58 | | 18,166 |
Common Stocks - continued |
| Shares | | Value |
Korea (South) - continued |
Nong Shim Co. Ltd. | 600 | | $ 117,135 |
Paradise Co. Ltd. | 14,371 | | 100,625 |
Samsung Card Co. Ltd. | 3,154 | | 117,749 |
Samsung Electronics Co. Ltd. | 1,689 | | 1,448,571 |
Shinhan Financial Group Co. Ltd. | 8,060 | | 319,890 |
SK Chemicals Co. Ltd. | 1,642 | | 104,655 |
TOTAL KOREA (SOUTH) | | 5,815,675 |
Luxembourg - 0.2% |
GlobeOp Financial Services SA | 5,400 | | 24,750 |
Millicom International Cellular SA (depositary receipt) | 1,700 | | 187,352 |
TOTAL LUXEMBOURG | | 212,102 |
Malaysia - 0.1% |
Axiata Group Bhd | 117,600 | | 185,873 |
Mexico - 0.7% |
Embotelladoras Arca SAB de CC | 19,200 | | 91,098 |
Grupo Modelo SAB de CV Series C | 51,500 | | 326,666 |
Wal-Mart de Mexico SA de CV Series V | 218,500 | | 564,452 |
TOTAL MEXICO | | 982,216 |
Netherlands - 1.7% |
Aalberts Industries NV | 2,600 | | 46,038 |
ASM International NV unit | 650 | | 18,343 |
ASML Holding NV | 13,700 | | 574,441 |
ING Groep NV: | | | |
(Certificaten Van Aandelen) (a) | 56,010 | | 482,931 |
sponsored ADR (a) | 17,982 | | 155,364 |
Koninklijke KPN NV | 18,515 | | 243,315 |
Koninklijke Philips Electronics NV | 11,400 | | 237,345 |
QIAGEN NV (a) | 13,700 | | 188,786 |
Unilever NV (Certificaten Van Aandelen) (Bearer) unit | 9,200 | | 317,664 |
Yandex NV | 2,100 | | 57,792 |
TOTAL NETHERLANDS | | 2,322,019 |
Nigeria - 0.1% |
Guaranty Trust Bank PLC GDR (Reg. S) | 23,046 | | 106,012 |
Norway - 1.1% |
Aker Solutions ASA | 12,307 | | 143,128 |
DnB NOR ASA | 33,700 | | 393,134 |
Common Stocks - continued |
| Shares | | Value |
Norway - continued |
Orkla ASA (A Shares) (d) | 36,200 | | $ 315,342 |
Telenor ASA | 36,000 | | 642,719 |
TOTAL NORWAY | | 1,494,323 |
Panama - 0.1% |
Copa Holdings SA Class A | 2,000 | | 138,140 |
Papua New Guinea - 0.0% |
Oil Search Ltd. | 2,098 | | 14,314 |
Peru - 0.1% |
Compania de Minas Buenaventura SA sponsored ADR | 4,900 | | 200,557 |
Philippines - 0.1% |
Globe Telecom, Inc. | 2,500 | | 53,301 |
Jollibee Food Corp. | 9,600 | | 20,400 |
Megaworld Corp. | 70,000 | | 3,087 |
TOTAL PHILIPPINES | | 76,788 |
Poland - 0.1% |
Polska Grupa Energetyczna SA | 16,300 | | 100,453 |
TVN SA | 21,075 | | 84,356 |
TOTAL POLAND | | 184,809 |
Portugal - 0.4% |
Energias de Portugal SA | 38,038 | | 120,284 |
Jeronimo Martins SGPS SA | 28,525 | | 493,447 |
TOTAL PORTUGAL | | 613,731 |
Qatar - 0.0% |
Commercial Bank of Qatar GDR (Reg. S) | 3,576 | | 16,401 |
Russia - 1.1% |
Cherkizovo Group OJSC GDR (a) | 3,818 | | 53,247 |
Lukoil Oil Co. sponsored ADR | 5,212 | | 300,732 |
Mostotrest OAO (a) | 5,300 | | 30,466 |
Gazprom OAO sponsored ADR | 14,921 | | 173,233 |
NOVATEK OAO GDR | 2,900 | | 407,160 |
Rosneft Oil Co. OJSC GDR (Reg. S) | 9,700 | | 69,016 |
Sberbank of Russia (f) | 122,300 | | 331,865 |
TNK-BP Holding | 5,700 | | 15,595 |
Uralkali JSC GDR (Reg. S) | 4,653 | | 201,940 |
TOTAL RUSSIA | | 1,583,254 |
Singapore - 0.8% |
Sakari Resources Ltd. | 33,000 | | 61,621 |
Common Stocks - continued |
| Shares | | Value |
Singapore - continued |
Singapore Telecommunications Ltd. | 221,000 | | $ 558,557 |
United Overseas Bank Ltd. | 31,746 | | 430,402 |
Wing Tai Holdings Ltd. | 12,000 | | 12,168 |
TOTAL SINGAPORE | | 1,062,748 |
South Africa - 1.3% |
African Bank Investments Ltd. | 37,000 | | 160,563 |
African Rainbow Minerals Ltd. | 13,763 | | 318,084 |
Clicks Group Ltd. | 28,266 | | 148,341 |
Foschini Ltd. | 13,098 | | 165,270 |
Imperial Holdings Ltd. | 5,800 | | 85,871 |
JSE Ltd. | 28,200 | | 249,725 |
Life Healthcare Group Holdings Ltd. | 41,607 | | 101,235 |
Mr Price Group Ltd. | 34,600 | | 333,082 |
MTN Group Ltd. | 5,500 | | 95,997 |
Northam Platinum Ltd. | 18,107 | | 70,157 |
TOTAL SOUTH AFRICA | | 1,728,325 |
Spain - 1.5% |
Banco Bilbao Vizcaya Argentaria SA sponsored ADR | 79,238 | | 716,312 |
Grifols SA (a) | 446 | | 8,323 |
Inditex SA | 4,959 | | 451,295 |
Prosegur Compania de Seguridad SA (Reg.) | 6,451 | | 321,838 |
Red Electrica Corporacion SA | 3,500 | | 169,407 |
Repsol YPF SA | 14,179 | | 429,729 |
TOTAL SPAIN | | 2,096,904 |
Sweden - 1.1% |
Fagerhult AB | 5,900 | | 138,913 |
H&M Hennes & Mauritz AB (B Shares) | 18,196 | | 602,575 |
Intrum Justitia AB | 2,800 | | 46,061 |
Swedish Match Co. | 9,350 | | 323,544 |
Tele2 AB (B Shares) | 8,900 | | 187,841 |
Telefonaktiebolaget LM Ericsson (B Shares) | 23,067 | | 240,362 |
TOTAL SWEDEN | | 1,539,296 |
Switzerland - 6.6% |
Bank Sarasin & Co. Ltd. Series B (Reg.) | 1,907 | | 72,799 |
Nestle SA | 63,792 | | 3,700,093 |
Novartis AG sponsored ADR | 4,000 | | 225,880 |
Roche Holding AG (participation certificate) | 14,705 | | 2,424,721 |
Schindler Holding AG: | | | |
(participation certificate) | 2,002 | | 235,435 |
Common Stocks - continued |
| Shares | | Value |
Switzerland - continued |
Schindler Holding AG: - continued | | | |
(Reg.) | 570 | | $ 67,097 |
Syngenta AG (Switzerland) | 890 | | 271,279 |
The Swatch Group AG (Bearer) | 1,780 | | 753,744 |
Transocean Ltd. (United States) | 2,502 | | 142,989 |
UBS AG (NY Shares) (a) | 45,062 | | 568,682 |
Zurich Financial Services AG | 2,668 | | 619,610 |
TOTAL SWITZERLAND | | 9,082,329 |
Taiwan - 1.3% |
Catcher Technology Co. Ltd. | 32,000 | | 178,288 |
Chroma ATE, Inc. | 32,116 | | 64,078 |
Formosa Plastics Corp. | 77,000 | | 226,464 |
Hotai Motor Co. Ltd. | 3,000 | | 13,051 |
HTC Corp. | 8,565 | | 192,486 |
Kinsus Interconnect Technology Corp. | 24,000 | | 82,891 |
Leofoo Development Co. Ltd. (a) | 45,000 | | 29,619 |
President Chain Store Corp. | 24,000 | | 133,458 |
SIMPLO Technology Co. Ltd. | 10,400 | | 61,195 |
Taishin Financial Holdings Co. Ltd. | 489,222 | | 207,145 |
Taiwan Cement Corp. | 173,179 | | 216,280 |
Taiwan Semiconductor Manufacturing Co. Ltd. | 145,035 | | 353,432 |
TOTAL TAIWAN | | 1,758,387 |
Thailand - 0.8% |
Advanced Info Service PCL (For. Reg.) | 62,600 | | 263,003 |
Asian Property Development PCL (For. Reg.) | 428,660 | | 62,653 |
Bangkok Expressway PCL (For.Reg.) | 46,700 | | 24,657 |
Banpu PCL (For. Reg.) | 3,550 | | 72,066 |
Charoen Pokphand Foods PCL (For. Reg.) | 66,400 | | 64,665 |
Krung Thai Bank PCL (For. Reg.) | 174,500 | | 85,391 |
PTT Global Chemical PCL (For. Reg.) (a) | 8,911 | | 18,791 |
PTT PCL (For. Reg.) | 17,300 | | 170,429 |
Siam Cement PCL (For. Reg.) | 10,000 | | 119,896 |
Siam Commercial Bank PCL (For. Reg.) | 73,500 | | 278,036 |
Total Access Communication PCL (For. Reg.) | 200 | | 476 |
TOTAL THAILAND | | 1,160,063 |
Turkey - 1.0% |
Albaraka Turk Katilim Bankasi AS | 21,000 | | 22,208 |
Anadolu Efes Biracilik ve Malt Sanayii AS | 10,000 | | 121,589 |
Aygaz A/S | 15,010 | | 82,000 |
Boyner Buyuk Magazacilik A/S (a) | 9,049 | | 15,199 |
Common Stocks - continued |
| Shares | | Value |
Turkey - continued |
Coca-Cola Icecek AS | 20,489 | | $ 278,092 |
Koc Holding AS | 18,000 | | 64,335 |
Tofas Turk Otomobil Fabrikasi AS | 21,655 | | 83,767 |
Tupras-Turkiye Petrol Rafinerileri AS | 5,313 | | 120,187 |
Turkiye Garanti Bankasi AS | 151,200 | | 533,572 |
TOTAL TURKEY | | 1,320,949 |
United Arab Emirates - 0.0% |
Dubai Financial Market PJSC (a) | 43,463 | | 12,188 |
United Kingdom - 18.1% |
Aegis Group PLC | 54,149 | | 119,477 |
AMEC PLC | 1,801 | | 26,806 |
Anglo American PLC (United Kingdom) | 11,000 | | 405,725 |
Aviva PLC | 65,272 | | 356,162 |
Babcock International Group PLC | 36,100 | | 409,005 |
Barclays PLC | 185,919 | | 576,446 |
Bellway PLC | 2,828 | | 32,291 |
BG Group PLC | 67,077 | | 1,463,300 |
BHP Billiton PLC ADR | 30,000 | | 1,889,100 |
BP PLC sponsored ADR | 33,187 | | 1,466,202 |
British American Tobacco PLC (United Kingdom) | 7,400 | | 339,356 |
British Land Co. PLC | 24,600 | | 201,963 |
Britvic PLC | 8,000 | | 42,444 |
Centrica PLC | 49,175 | | 234,640 |
Compass Group PLC | 28,500 | | 259,419 |
Dechra Pharmaceuticals PLC | 3,500 | | 27,581 |
Derwent London PLC | 800 | | 21,846 |
GlaxoSmithKline PLC sponsored ADR | 49,300 | | 2,208,147 |
Great Portland Estates PLC | 6,372 | | 38,162 |
H&T Group PLC | 4,764 | | 23,827 |
HSBC Holdings PLC sponsored ADR | 9,151 | | 399,533 |
Imperial Tobacco Group PLC | 21,721 | | 794,347 |
InterContinental Hotel Group PLC ADR | 23,450 | | 433,356 |
International Personal Finance PLC | 13,642 | | 60,157 |
International Power PLC | 63,805 | | 347,031 |
Johnson Matthey PLC | 14,092 | | 425,833 |
Kazakhmys PLC | 9,000 | | 134,244 |
Meggitt PLC | 12,298 | | 76,065 |
Micro Focus International PLC | 3,800 | | 20,754 |
National Grid PLC | 65,397 | | 650,301 |
Next PLC | 3,700 | | 152,091 |
Persimmon PLC | 3,137 | | 25,109 |
Common Stocks - continued |
| Shares | | Value |
United Kingdom - continued |
Prudential PLC | 54,997 | | $ 568,176 |
Reckitt Benckiser Group PLC | 10,638 | | 547,115 |
Reed Elsevier PLC | 53,000 | | 455,579 |
Rio Tinto PLC sponsored ADR | 10,360 | | 560,062 |
Rolls-Royce Group PLC | 44,052 | | 497,682 |
Rolls-Royce Group PLC Class C | 3,039,588 | | 4,888 |
Rotork PLC | 9,403 | | 254,653 |
Royal Dutch Shell PLC Class A sponsored ADR | 43,000 | | 3,049,130 |
SABMiller PLC | 15,463 | | 564,867 |
Scottish & Southern Energy PLC | 21,452 | | 463,668 |
Serco Group PLC | 42,839 | | 357,903 |
Shaftesbury PLC | 21,733 | | 176,153 |
Spectris PLC | 1,770 | | 36,208 |
Spirax-Sarco Engineering PLC | 2,404 | | 74,152 |
Standard Chartered PLC (United Kingdom) | 32,873 | | 771,320 |
Ted Baker PLC | 3,075 | | 38,140 |
Tesco PLC | 112,083 | | 724,162 |
Ultra Electronics Holdings PLC | 1,400 | | 35,844 |
Unite Group PLC | 60,302 | | 171,457 |
Victrex PLC | 9,318 | | 190,312 |
Vodafone Group PLC sponsored ADR | 65,347 | | 1,819,260 |
TOTAL UNITED KINGDOM | | 25,021,451 |
United States of America - 5.7% |
Allergan, Inc. | 2,600 | | 218,712 |
ANSYS, Inc. (a) | 300 | | 16,308 |
Autoliv, Inc. | 7,700 | | 444,829 |
Berkshire Hathaway, Inc. Class B (a) | 6,845 | | 532,952 |
Broadridge Financial Solutions, Inc. | 690 | | 15,353 |
Cognizant Technology Solutions Corp. Class A (a) | 1,910 | | 138,953 |
Cymer, Inc. (a) | 4,150 | | 180,318 |
Dril-Quip, Inc. (a) | 490 | | 31,899 |
eBay, Inc. (a) | 8,164 | | 259,860 |
Evercore Partners, Inc. Class A | 920 | | 25,245 |
Freeport-McMoRan Copper & Gold, Inc. | 1,300 | | 52,338 |
Google, Inc. Class A (a) | 520 | | 308,173 |
Greenhill & Co., Inc. | 300 | | 11,334 |
ION Geophysical Corp. (a) | 35,141 | | 267,774 |
JPMorgan Chase & Co. | 5,298 | | 184,158 |
Juniper Networks, Inc. (a) | 19,260 | | 471,292 |
Kansas City Southern (a) | 920 | | 58,116 |
Lam Research Corp. (a) | 4,708 | | 202,397 |
Common Stocks - continued |
| Shares | | Value |
United States of America - continued |
Martin Marietta Materials, Inc. | 2,190 | | $ 158,052 |
MasterCard, Inc. Class A | 2,009 | | 697,605 |
Mead Johnson Nutrition Co. Class A | 8,000 | | 574,800 |
Mohawk Industries, Inc. (a) | 6,930 | | 364,865 |
Nuance Communications, Inc. (a) | 4,251 | | 112,566 |
Oceaneering International, Inc. | 820 | | 34,301 |
Philip Morris International, Inc. | 11,700 | | 817,479 |
PriceSmart, Inc. | 1,400 | | 106,456 |
ResMed, Inc. (a) | 10,370 | | 293,471 |
Solera Holdings, Inc. | 3,121 | | 170,500 |
Solutia, Inc. (a) | 884 | | 14,365 |
SS&C Technologies Holdings, Inc. (a) | 954 | | 15,130 |
Union Pacific Corp. | 4,700 | | 467,979 |
Visa, Inc. Class A | 6,901 | | 643,587 |
TOTAL UNITED STATES OF AMERICA | | 7,891,167 |
TOTAL COMMON STOCKS (Cost $138,836,607) |
133,653,906
|
Nonconvertible Preferred Stocks - 0.2% |
| | | |
Germany - 0.1% |
Volkswagen AG | 1,034 | | 181,445 |
Italy - 0.1% |
Telecom Italia SpA (Risparmio Shares) | 143,000 | | 150,094 |
TOTAL NONCONVERTIBLE PREFERRED STOCKS (Cost $392,992) |
331,539
|
Money Market Funds - 3.6% |
| Shares | | Value |
Fidelity Cash Central Fund, 0.12% (b) | 4,609,098 | | $ 4,609,098 |
Fidelity Securities Lending Cash Central Fund, 0.11% (b)(c) | 363,225 | | 363,225 |
TOTAL MONEY MARKET FUNDS (Cost $4,972,323) |
4,972,323
|
TOTAL INVESTMENT PORTFOLIO - 100.3% (Cost $144,201,922) | | 138,957,768 |
NET OTHER ASSETS (LIABILITIES) - (0.3)% | | (468,208) |
NET ASSETS - 100% | $ 138,489,560 |
Legend |
(a) Non-income producing |
(b) Affiliated fund that is available only to investment companies and other accounts managed by Fidelity Investments. The rate quoted is the annualized seven-day yield of the fund at period end. A complete unaudited listing of the fund's holdings as of its most recent quarter end is available upon request. In addition, each Fidelity Central Fund's financial statements, which are not covered by the Fund's Report of Independent Registered Public Accounting Firm, are available on the SEC's website or upon request. |
(c) Investment made with cash collateral received from securities on loan. |
(d) Security or a portion of the security is on loan at period end. |
(e) Security exempt from registration under Rule 144A of the Securities Act of 1933. These securities may be resold in transactions exempt from registration, normally to qualified institutional buyers. At the end of the period, the value of these securities amounted to $121,871 or 0.1% of net assets. |
(f) Security or a portion of the security purchased on a delayed delivery or when-issued basis. |
Affiliated Central Funds |
Information regarding fiscal year to date income earned by the Fund from investments in Fidelity Central Funds is as follows: |
Fund | Income earned |
Fidelity Cash Central Fund | $ 181 |
Fidelity Securities Lending Cash Central Fund | 31,105 |
Total | $ 31,286 |
Other Information |
The following is a summary of the inputs used, as of October 31, 2011, involving the Fund's assets and liabilities carried at fair value. The inputs or methodology used for valuing securities may not be an indication of the risk associated with investing in those securities. For more information on valuation inputs, and their aggregation into the levels used in the table below, please refer to the Security Valuation section in the accompanying Notes to Financial Statements. |
Valuation Inputs at Reporting Date: |
Description | Total | Level 1 | Level 2 | Level 3 |
Investments in Securities: | | | | |
Equities: | | | | |
United Kingdom | $ 25,021,451 | $ 22,531,010 | $ 2,490,441 | $ - |
Japan | 16,254,323 | - | 16,254,323 | - |
Switzerland | 9,082,329 | 8,811,050 | 271,279 | - |
Germany | 8,267,853 | 7,754,156 | 513,697 | - |
United States of America | 7,891,167 | 7,891,167 | - | - |
France | 6,728,675 | 5,233,865 | 1,494,810 | - |
Australia | 6,010,403 | 220,883 | 5,789,520 | - |
Korea (South) | 5,815,675 | - | 5,815,675 | - |
Brazil | 5,687,535 | 5,687,535 | - | - |
Other | 43,226,034 | 25,351,417 | 17,874,617 | - |
Money Market Funds | 4,972,323 | 4,972,323 | - | - |
Total Investments in Securities: | $ 138,957,768 | $ 88,453,406 | $ 50,504,362 | $ - |
Income Tax Information |
At October 31, 2011, the Fund had a capital loss carryforward of approximately $33,183,732 of which $8,618,744, $15,708,944 and $8,856,044 will expire in fiscal 2016, 2017 and 2019, respectively. Capital loss carryforwards are only available to offset future capital gains of the Fund to the extent provided by regulations and may be limited. |
See accompanying notes which are an integral part of the financial statements.
Annual Report
Statement of Assets and Liabilities
| October 31, 2011 |
| | |
Assets | | |
Investment in securities, at value (including securities loaned of $332,595) - See accompanying schedule: Unaffiliated issuers (cost $139,229,599) | $ 133,985,445 | |
Fidelity Central Funds (cost $4,972,323) | 4,972,323 | |
Total Investments (cost $144,201,922) | | $ 138,957,768 |
Foreign currency held at value (cost $450,490) | | 463,177 |
Receivable for investments sold | | 1,171,368 |
Receivable for fund shares sold | | 684,946 |
Dividends receivable | | 284,271 |
Distributions receivable from Fidelity Central Funds | | 1,137 |
Prepaid expenses | | 689 |
Receivable from investment adviser for expense reductions | | 57,911 |
Other receivables | | 29,554 |
Total assets | | 141,650,821 |
| | |
Liabilities | | |
Payable to custodian bank | $ 54,666 | |
Payable for investments purchased
Regular delivery | 1,969,977 | |
Delayed delivery | 55,088 | |
Payable for fund shares redeemed | 506,258 | |
Accrued management fee | 77,502 | |
Distribution and service plan fees payable | 2,583 | |
Other affiliated payables | 30,824 | |
Other payables and accrued expenses | 101,138 | |
Collateral on securities loaned, at value | 363,225 | |
Total liabilities | | 3,161,261 |
| | |
Net Assets | | $ 138,489,560 |
Net Assets consist of: | | |
Paid in capital | | $ 176,367,284 |
Undistributed net investment income | | 1,552,849 |
Accumulated undistributed net realized gain (loss) on investments and foreign currency transactions | | (34,194,366) |
Net unrealized appreciation (depreciation) on investments and assets and liabilities in foreign currencies | | (5,236,207) |
Net Assets | | $ 138,489,560 |
See accompanying notes which are an integral part of the financial statements.
Annual Report
Financial Statements - continued
Statement of Assets and Liabilities - continued
| October 31, 2011 |
| | |
Calculation of Maximum Offering Price Class A:
Net Asset Value and redemption price per share ($4,307,161 ÷ 645,276 shares) | | $ 6.67 |
| | |
Maximum offering price per share (100/94.25 of $6.67) | | $ 7.08 |
Class T:
Net Asset Value and redemption price per share ($996,899 ÷ 148,175 shares) | | $ 6.73 |
| | |
Maximum offering price per share (100/96.50 of $6.73) | | $ 6.97 |
Class B:
Net Asset Value and offering price per share ($254,279 ÷ 38,057 shares)A | | $ 6.68 |
| | |
Class C:
Net Asset Value and offering price per share ($1,395,692 ÷ 209,094 shares)A | | $ 6.67 |
| | |
Total International Equity:
Net Asset Value, offering price and redemption price per share ($131,338,267 ÷ 19,645,402 shares) | | $ 6.69 |
| | |
Institutional Class:
Net Asset Value, offering price and redemption price per share ($197,262 ÷ 29,577 shares) | | $ 6.67 |
A Redemption price per share is equal to net asset value less any applicable contingent deferred sales charge.
See accompanying notes which are an integral part of the financial statements.
Annual Report
Statement of Operations
| Year ended October 31, 2011 |
| | |
Investment Income | | |
Dividends | | $ 3,448,845 |
Interest | | 1,597 |
Income from Fidelity Central Funds | | 31,286 |
Income before foreign taxes withheld | | 3,481,728 |
Less foreign taxes withheld | | (260,512) |
Total income | | 3,221,216 |
| | |
Expenses | | |
Management fee
Basic fee | $ 797,169 | |
Performance adjustment | (22,587) | |
Transfer agent fees | 274,385 | |
Distribution and service plan fees | 36,441 | |
Accounting and security lending fees | 58,516 | |
Custodian fees and expenses | 310,251 | |
Independent trustees' compensation | 597 | |
Registration fees | 80,712 | |
Audit | 106,913 | |
Legal | 401 | |
Miscellaneous | 731 | |
Total expenses before reductions | 1,643,529 | |
Expense reductions | (287,161) | 1,356,368 |
Net investment income (loss) | | 1,864,848 |
Realized and Unrealized Gain (Loss) Net realized gain (loss) on: | | |
Investment securities: | | |
Unaffiliated issuers | (8,922,239) | |
Foreign currency transactions | (75,788) | |
Total net realized gain (loss) | | (8,998,027) |
Change in net unrealized appreciation (depreciation) on: Investment securities | (8,598,208) | |
Assets and liabilities in foreign currencies | 299 | |
Total change in net unrealized appreciation (depreciation) | | (8,597,909) |
Net gain (loss) | | (17,595,936) |
Net increase (decrease) in net assets resulting from operations | | $ (15,731,088) |
See accompanying notes which are an integral part of the financial statements.
Annual Report
Financial Statements - continued
Statement of Changes in Net Assets
| Year ended
October 31,
2011 | Year ended
October 31,
2010 |
Increase (Decrease) in Net Assets | | |
Operations | | |
Net investment income (loss) | $ 1,864,848 | $ 773,945 |
Net realized gain (loss) | (8,998,027) | 1,906,137 |
Change in net unrealized appreciation (depreciation) | (8,597,909) | 5,447,726 |
Net increase (decrease) in net assets resulting
from operations | (15,731,088) | 8,127,808 |
Distributions to shareholders from net investment income | (953,041) | (411,223) |
Distributions to shareholders from net realized gain | (220,294) | (169,935) |
Total distributions | (1,173,335) | (581,158) |
Share transactions - net increase (decrease) | 86,742,563 | 18,410,630 |
Redemption fees | 14,195 | 6,300 |
Total increase (decrease) in net assets | 69,852,335 | 25,963,580 |
| | |
Net Assets | | |
Beginning of period | 68,637,225 | 42,673,645 |
End of period (including undistributed net investment income of $1,552,849 and undistributed net investment income of $724,017, respectively) | $ 138,489,560 | $ 68,637,225 |
See accompanying notes which are an integral part of the financial statements.
Annual Report
Financial Highlights - Class A
Years ended October 31, | 2011 | 2010 | 2009 | 2008 F |
Selected Per-Share Data | | | | |
Net asset value, beginning of period | $ 7.36 | $ 6.40 | $ 4.90 | $ 10.00 |
Income from Investment Operations | | | | |
Net investment income (loss) C | .11 | .08 | .06 | .11 |
Net realized and unrealized gain (loss) | (.69) | .95 | 1.55 | (5.21) |
Total from investment operations | (.58) | 1.03 | 1.61 | (5.10) |
Distributions from net investment income | (.09) | (.04) | (.11) | - |
Distributions from net realized gain | (.02) | (.03) | - | - |
Total distributions | (.11) | (.07) | (.11) | - |
Redemption fees added to paid in capital C,H | - | - | - | - |
Net asset value, end of period | $ 6.67 | $ 7.36 | $ 6.40 | $ 4.90 |
Total Return A,B | (8.03)% | 16.17% | 33.87% | (51.00)% |
Ratios to Average Net Assets D,G | | | | |
Expenses before reductions | 1.73% | 2.02% | 2.09% | 2.00% |
Expenses net of fee waivers, if any | 1.45% | 1.50% | 1.50% | 1.50% |
Expenses net of all reductions | 1.42% | 1.47% | 1.47% | 1.48% |
Net investment income (loss) | 1.44% | 1.15% | 1.13% | 1.35% |
Supplemental Data | | | | |
Net assets, end of period (000 omitted) | $ 4,307 | $ 5,029 | $ 3,727 | $ 5,944 |
Portfolio turnover rate E | 75% | 67% | 98% | 91% |
A Total returns would have been lower if certain expenses had not been reduced during the applicable periods shown.
B Total returns do not include the effect of the sales charges.
C Calculated based on average shares outstanding during the period.
D Fees and expenses of any underlying Fidelity Central Funds are not included in the Fund's expense ratio. The Fund indirectly bears its proportionate share of the expenses of any underlying Fidelity Central Funds.
E Amount does not include the portfolio activity of any underlying Fidelity Central Funds.
F For the period November 1, 2007 (commencement of operations) to October 31, 2008.
G Expense ratios reflect operating expenses of the class. Expenses before reductions do not reflect amounts reimbursed by the investment adviser or reductions from brokerage service arrangements or reductions from other expense offset arrangements and do not represent the amount paid by the class during periods when reimbursements or reductions occur. Expense ratios before reductions for start-up periods may not be representative of longer-term operating periods. Expenses net of fee waivers reflect expenses after reimbursement by the investment adviser but prior to reductions from brokerage service arrangements or other expense offset arrangements. Expenses net of all reductions represent the net expenses paid by the class.
H Amount represents less than $.01 per share.
See accompanying notes which are an integral part of the financial statements.
Annual Report
Financial Highlights - Class T
Years ended October 31, | 2011 | 2010 | 2009 | 2008 F |
Selected Per-Share Data | | | | |
Net asset value, beginning of period | $ 7.41 | $ 6.40 | $ 4.88 | $ 10.00 |
Income from Investment Operations | | | | |
Net investment income (loss) C | .09 | .06 | .04 | .09 |
Net realized and unrealized gain (loss) | (.68) | .95 | 1.57 | (5.21) |
Total from investment operations | (.59) | 1.01 | 1.61 | (5.12) |
Distributions from net investment income | (.07) | - | (.09) | - |
Distributions from net realized gain | (.02) | - | - | - |
Total distributions | (.09) | - | (.09) | - |
Redemption fees added to paid in capital C,H | - | - | - | - |
Net asset value, end of period | $ 6.73 | $ 7.41 | $ 6.40 | $ 4.88 |
Total Return A,B | (8.08)% | 15.78% | 33.74% | (51.20)% |
Ratios to Average Net Assets D,G | | | | |
Expenses before reductions | 2.02% | 2.31% | 2.34% | 2.42% |
Expenses net of fee waivers, if any | 1.70% | 1.75% | 1.75% | 1.75% |
Expenses net of all reductions | 1.67% | 1.72% | 1.72% | 1.73% |
Net investment income (loss) | 1.19% | .90% | .88% | 1.10% |
Supplemental Data | | | | |
Net assets, end of period (000 omitted) | $ 997 | $ 1,004 | $ 1,526 | $ 2,567 |
Portfolio turnover rate E | 75% | 67% | 98% | 91% |
A Total returns would have been lower if certain expenses had not been reduced during the applicable periods shown.
B Total returns do not include the effect of the sales charges.
C Calculated based on average shares outstanding during the period.
D Fees and expenses of any underlying Fidelity Central Funds are not included in the Fund's expense ratio. The Fund indirectly bears its proportionate share of the expenses of any underlying Fidelity Central Funds.
E Amount does not include the portfolio activity of any underlying Fidelity Central Funds.
F For the period November 1, 2007 (commencement of operations) to October 31, 2008.
G Expense ratios reflect operating expenses of the class. Expenses before reductions do not reflect amounts reimbursed by the investment adviser or reductions from brokerage service arrangements or reductions from other expense offset arrangements and do not represent the amount paid by the class during periods when reimbursements or reductions occur. Expense ratios before reductions for start-up periods may not be representative of longer-term operating periods. Expenses net of fee waivers reflect expenses after reimbursement by the investment adviser but prior to reductions from brokerage service arrangements or other expense offset arrangements. Expenses net of all reductions represent the net expenses paid by the class.
H Amount represents less than $.01 per share.
See accompanying notes which are an integral part of the financial statements.
Annual Report
Financial Highlights - Class B
Years ended October 31, | 2011 | 2010 | 2009 | 2008 F |
Selected Per-Share Data | | | | |
Net asset value, beginning of period | $ 7.37 | $ 6.39 | $ 4.86 | $ 10.00 |
Income from Investment Operations | | | | |
Net investment income (loss) C | .05 | .03 | .02 | .05 |
Net realized and unrealized gain (loss) | (.68) | .95 | 1.56 | (5.19) |
Total from investment operations | (.63) | .98 | 1.58 | (5.14) |
Distributions from net investment income | (.04) | - | (.05) | - |
Distributions from net realized gain | (.02) | - | - | - |
Total distributions | (.06) | - | (.05) | - |
Redemption fees added to paid in capital C,H | - | - | - | - |
Net asset value, end of period | $ 6.68 | $ 7.37 | $ 6.39 | $ 4.86 |
Total Return A,B | (8.66)% | 15.34% | 32.95% | (51.40)% |
Ratios to Average Net Assets D,G | | | | |
Expenses before reductions | 2.51% | 2.81% | 2.82% | 2.92% |
Expenses net of fee waivers, if any | 2.20% | 2.25% | 2.25% | 2.25% |
Expenses net of all reductions | 2.17% | 2.22% | 2.22% | 2.24% |
Net investment income (loss) | .69% | .40% | .38% | .60% |
Supplemental Data | | | | |
Net assets, end of period (000 omitted) | $ 254 | $ 327 | $ 1,337 | $ 2,505 |
Portfolio turnover rate E | 75% | 67% | 98% | 91% |
A Total returns would have been lower if certain expenses had not been reduced during the applicable periods shown.
B Total returns do not include the effect of the contingent deferred sales charge.
C Calculated based on average shares outstanding during the period.
D Fees and expenses of any underlying Fidelity Central Funds are not included in the Fund's expense ratio. The Fund indirectly bears its proportionate share of the expenses of any underlying Fidelity Central Funds.
E Amount does not include the portfolio activity of any underlying Fidelity Central Funds.
F For the period November 1, 2007 (commencement of operations) to October 31, 2008.
G Expense ratios reflect operating expenses of the class. Expenses before reductions do not reflect amounts reimbursed by the investment adviser or reductions from brokerage service arrangements or reductions from other expense offset arrangements and do not represent the amount paid by the class during periods when reimbursements or reductions occur. Expense ratios before reductions for start-up periods may not be representative of longer-term operating periods. Expenses net of fee waivers reflect expenses after reimbursement by the investment adviser but prior to reductions from brokerage service arrangements or other expense offset arrangements. Expenses net of all reductions represent the net expenses paid by the class.
H Amount represents less than $.01 per share.
See accompanying notes which are an integral part of the financial statements.
Annual Report
Financial Highlights - Class C
Years ended October 31, | 2011 | 2010 | 2009 | 2008 F |
Selected Per-Share Data | | | | |
Net asset value, beginning of period | $ 7.36 | $ 6.39 | $ 4.86 | $ 10.00 |
Income from Investment Operations | | | | |
Net investment income (loss) C | .05 | .03 | .02 | .05 |
Net realized and unrealized gain (loss) | (.69) | .94 | 1.56 | (5.19) |
Total from investment operations | (.64) | .97 | 1.58 | (5.14) |
Distributions from net investment income | (.03) | - | (.05) | - |
Distributions from net realized gain | (.02) | - | - | - |
Total distributions | (.05) | - | (.05) | - |
Redemption fees added to paid in capital C,H | - | - | - | - |
Net asset value, end of period | $ 6.67 | $ 7.36 | $ 6.39 | $ 4.86 |
Total Return A,B | (8.72)% | 15.18% | 33.10% | (51.40)% |
Ratios to Average Net Assets D,G | | | | |
Expenses before reductions | 2.51% | 2.80% | 2.85% | 2.92% |
Expenses net of fee waivers, if any | 2.20% | 2.25% | 2.25% | 2.25% |
Expenses net of all reductions | 2.17% | 2.22% | 2.22% | 2.23% |
Net investment income (loss) | .69% | .40% | .38% | .60% |
Supplemental Data | | | | |
Net assets, end of period (000 omitted) | $ 1,396 | $ 1,423 | $ 1,714 | $ 2,787 |
Portfolio turnover rate E | 75% | 67% | 98% | 91% |
A Total returns would have been lower if certain expenses had not been reduced during the applicable periods shown.
B Total returns do not include the effect of the contingent deferred sales charge.
C Calculated based on average shares outstanding during the period.
D Fees and expenses of any underlying Fidelity Central Funds are not included in the Fund's expense ratio. The Fund indirectly bears its proportionate share of the expenses of any underlying Fidelity Central Funds.
E Amount does not include the portfolio activity of any underlying Fidelity Central Funds.
F For the period November 1, 2007 (commencement of operations) to October 31, 2008.
G Expense ratios reflect operating expenses of the class. Expenses before reductions do not reflect amounts reimbursed by the investment adviser or reductions from brokerage service arrangements or reductions from other expense offset arrangements and do not represent the amount paid by the class during periods when reimbursements or reductions occur. Expense ratios before reductions for start-up periods may not be representative of longer-term operating periods. Expenses net of fee waivers reflect expenses after reimbursement by the investment adviser but prior to reductions from brokerage service arrangements or other expense offset arrangements. Expenses net of all reductions represent the net expenses paid by the class.
H Amount represents less than $.01 per share.
See accompanying notes which are an integral part of the financial statements.
Annual Report
Financial Highlights - Total International Equity
Years ended October 31, | 2011 | 2010 | 2009 | 2008 E |
Selected Per-Share Data | | | | |
Net asset value, beginning of period | $ 7.37 | $ 6.41 | $ 4.91 | $ 10.00 |
Income from Investment Operations | | | | |
Net investment income (loss) B | .12 | .09 | .07 | .13 |
Net realized and unrealized gain (loss) | (.68) | .96 | 1.55 | (5.21) |
Total from investment operations | (.56) | 1.05 | 1.62 | (5.08) |
Distributions from net investment income | (.10) | (.06) | (.12) | (.01) |
Distributions from net realized gain | (.02) | (.03) | - | - |
Total distributions | (.12) | (.09) | (.12) | (.01) |
Redemption fees added to paid in capital B,G | - | - | - | - |
Net asset value, end of period | $ 6.69 | $ 7.37 | $ 6.41 | $ 4.91 |
Total Return A | (7.70)% | 16.45% | 34.23% | (50.87)% |
Ratios to Average Net Assets C,F | | | | |
Expenses before reductions | 1.42% | 1.79% | 1.87% | 1.89% |
Expenses net of fee waivers, if any | 1.20% | 1.25% | 1.25% | 1.25% |
Expenses net of all reductions | 1.17% | 1.22% | 1.22% | 1.23% |
Net investment income (loss) | 1.69% | 1.40% | 1.38% | 1.60% |
Supplemental Data | | | | |
Net assets, end of period (000 omitted) | $ 131,338 | $ 60,826 | $ 33,061 | $ 23,226 |
Portfolio turnover rate D | 75% | 67% | 98% | 91% |
A Total returns would have been lower if certain expenses had not been reduced during the applicable periods shown.
B Calculated based on average shares outstanding during the period.
C Fees and expenses of any underlying Fidelity Central Funds are not included in the Fund's expense ratio. The Fund indirectly bears its proportionate share of the expenses of any underlying Fidelity Central Funds.
D Amount does not include the portfolio activity of any underlying Fidelity Central Funds.
E For the period November 1, 2007 (commencement of operations) to October 31, 2008.
F Expense ratios reflect operating expenses of the class. Expenses before reductions do not reflect amounts reimbursed by the investment adviser or reductions from brokerage service arrangements or reductions from other expense offset arrangements and do not represent the amount paid by the class during periods when reimbursements or reductions occur. Expense ratios before reductions for start-up periods may not be representative of longer-term operating periods. Expenses net of fee waivers reflect expenses after reimbursement by the investment adviser but prior to reductions from brokerage service arrangements or other expense offset arrangements. Expenses net of all reductions represent the net expenses paid by the class.
G Amount represents less than $.01 per share.
See accompanying notes which are an integral part of the financial statements.
Annual Report
Financial Highlights - Institutional Class
Years ended October 31, | 2011 | 2010 | 2009 | 2008 E |
Selected Per-Share Data | | | | |
Net asset value, beginning of period | $ 7.35 | $ 6.41 | $ 4.91 | $ 10.00 |
Income from Investment Operations | | | | |
Net investment income (loss) B | .12 | .10 | .07 | .13 |
Net realized and unrealized gain (loss) | (.68) | .95 | 1.55 | (5.21) |
Total from investment operations | (.56) | 1.05 | 1.62 | (5.08) |
Distributions from net investment income | (.10) | (.08) | (.12) | (.01) |
Distributions from net realized gain | (.02) | (.03) | - | - |
Total distributions | (.12) | (.11) | (.12) | (.01) |
Redemption fees added to paid in capital B,G | - | - | - | - |
Net asset value, end of period | $ 6.67 | $ 7.35 | $ 6.41 | $ 4.91 |
Total Return A | (7.72)% | 16.48% | 34.23% | (50.87)% |
Ratios to Average Net Assets C,F | | | | |
Expenses before reductions | 1.48% | 1.82% | 1.80% | 1.91% |
Expenses net of fee waivers, if any | 1.20% | 1.25% | 1.25% | 1.25% |
Expenses net of all reductions | 1.17% | 1.23% | 1.22% | 1.23% |
Net investment income (loss) | 1.69% | 1.40% | 1.38% | 1.60% |
Supplemental Data | | | | |
Net assets, end of period (000 omitted) | $ 197 | $ 28 | $ 1,308 | $ 2,733 |
Portfolio turnover rate D | 75% | 67% | 98% | 91% |
A Total returns would have been lower if certain expenses had not been reduced during the applicable periods shown.
B Calculated based on average shares outstanding during the period.
C Fees and expenses of any underlying Fidelity Central Funds are not included in the Fund's expense ratio. The Fund indirectly bears its proportionate share of the expenses of any underlying Fidelity Central Funds.
D Amount does not include the portfolio activity of any underlying Fidelity Central Funds.
E For the period November 1, 2007 (commencement of operations) to October 31, 2008.
F Expense ratios reflect operating expenses of the class. Expenses before reductions do not reflect amounts reimbursed by the investment adviser or reductions from brokerage service arrangements or reductions from other expense offset arrangements and do not represent the amount paid by the class during periods when reimbursements or reductions occur. Expense ratios before reductions for start-up periods may not be representative of longer-term operating periods. Expenses net of fee waivers reflect expenses after reimbursement by the investment adviser but prior to reductions from brokerage service arrangements or other expense offset arrangements. Expenses net of all reductions represent the net expenses paid by the class.
G Amount represents less than $.01 per share.
See accompanying notes which are an integral part of the financial statements.
Annual Report
Notes to Financial Statements
For the period ended October 31, 2011
1. Organization.
Fidelity Total International Equity Fund (the Fund) is a fund of Fidelity Investment Trust (the Trust) and is authorized to issue an unlimited number of shares. The Trust is registered under the Investment Company Act of 1940, as amended (the 1940 Act), as an open-end management investment company organized as a Massachusetts business trust. The Fund offers Class A, Class T, Class C, Total International Equity and Institutional Class shares, each of which, along with Class B shares, has equal rights as to assets and voting privileges. Effective after the close of business on September 1, 2010, Class B shares were closed to new accounts and additional purchases, except for exchanges and reinvestments by existing shareholders. Each class has exclusive voting rights with respect to matters that affect that class. Class B shares will automatically convert to Class A shares after a holding period of seven years from the initial date of purchase. Investment income, realized and unrealized capital gains and losses, the common expenses of the Fund, and certain fund-level expense reductions, if any, are allocated on a pro-rata basis to each class based on the relative net assets of each class to the total net assets of the Fund. Each class differs with respect to transfer agent and distribution and service plan fees incurred. Certain expense reductions may also differ by class. The Fund's investments in emerging markets can be subject to social, economic, regulatory, and political uncertainties and can be extremely volatile.
2. Investments in Fidelity Central Funds.
The Fund invests in Fidelity Central Funds, which are open-end investment companies available only to other investment companies and accounts managed by Fidelity Management & Research Company (FMR) and its affiliates. The Fund's Schedule of Investments lists each of the Fidelity Central Funds held as of period end, if any, as an investment of the Fund, but does not include the underlying holdings of each Fidelity Central Fund. As an Investing Fund, the Fund indirectly bears its proportionate share of the expenses of the underlying Fidelity Central Funds.
The Money Market Central Funds seek preservation of capital and current income and are managed by Fidelity Investments Money Management, Inc. (FIMM), an affiliate of FMR.
A complete unaudited list of holdings for each Fidelity Central Fund is available upon request or at the Securities and Exchange Commission (the SEC) web site at www.sec.gov. In addition, the financial statements of the Fidelity Central Funds, which are not covered by the Fund's Report of Independent Registered Public Accounting Firm are available on the SEC web site or upon request.
Annual Report
Notes to Financial Statements - continued
3. Significant Accounting Policies.
The financial statements have been prepared in conformity with accounting principles generally accepted in the United States of America (GAAP), which require management to make certain estimates and assumptions at the date of the financial statements. Actual results could differ from those estimates. Subsequent events, if any, through the date that the financial statements were issued have been evaluated in the preparation of the financial statements. The following summarizes the significant accounting policies of the Fund:
Security Valuation. Investments are valued as of 4:00 p.m. Eastern time on the last calendar day of the period. The Fund uses independent pricing services approved by the Board of Trustees to value its investments. When current market prices or quotations are not readily available or reliable, valuations may be determined in good faith in accordance with procedures adopted by the Board of Trustees. Factors used in determining value may include market or security specific events. The frequency with which these procedures are used cannot be predicted and they may be utilized to a significant extent. The value used for net asset value (NAV) calculation under these procedures may differ from published prices for the same securities.
The Fund categorizes the inputs to valuation techniques used to value its investments into a disclosure hierarchy consisting of three levels as shown below:
Level 1 - quoted prices in active markets for identical investments
Level 2 - other significant observable inputs (including quoted prices for similar investments, interest rates, prepayment speeds, etc.)
Level 3 - unobservable inputs (including the Fund's own assumptions based on the best information available)
Changes in valuation techniques may result in transfers in or out of an assigned level within the disclosure hierarchy. The aggregate value of investments by input level, as of October 31, 2011, is included at the end of the Fund's Schedule of Investments. Valuation techniques used to value the Fund's investments by major category are as follows:
Equity securities, including restricted securities, for which market quotations are readily available, are valued at the last reported sale price or official closing price as reported by an independent pricing service on the primary market or exchange on which they are traded and are categorized as Level 1 in the hierarchy. In the event there were no sales during the day or closing prices are not available, securities are valued at the last quoted bid price or may be valued using the last available price and are generally categorized as Level 2 in the hierarchy. For foreign equity securities, when significant market or security specific events arise, comparisons to the valuation of American Depositary Receipts
Annual Report
3. Significant Accounting Policies - continued
Security Valuation - continued
(ADRs), futures contracts, Exchange-traded funds (ETFs) and certain indexes as well as quoted prices for similar securities are used and are categorized as Level 2 in the hierarchy in these circumstances. Utilizing these techniques may result in transfers between Level 1 and Level 2. For restricted equity securities and private placements where observable inputs are limited, assumptions about market activity and risk are used and are categorized as Level 3 in the hierarchy.
Investments in open-end mutual funds, including the Fidelity Central Funds, are valued at their closing net asset value each business day and are categorized as Level 1 in the hierarchy.
Foreign Currency. The Fund may use foreign currency contracts to facilitate transactions in foreign-denominated securities. Gains and losses from these transactions may arise from changes in the value of the foreign currency or if the counterparties do not perform under the contracts' terms.
Foreign-denominated assets, including investment securities, and liabilities are translated into U.S. dollars at the exchange rate at period end. Purchases and sales of investment securities, income and dividends received and expenses denominated in foreign currencies are translated into U.S. dollars at the exchange rate in effect on the transaction date.
The effects of exchange rate fluctuations on investments are included with the net realized and unrealized gain (loss) on investment securities. Other foreign currency transactions resulting in realized and unrealized gain (loss) are disclosed separately.
Investment Transactions and Income. For financial reporting purposes, the Fund's investment holdings and NAV include trades executed through the end of the last business day of the period. The NAV per share for processing shareholder transactions is calculated as of the close of business of the New York Stock Exchange (NYSE), normally 4:00 p.m. Eastern time and includes trades executed through the end of the prior business day. Gains and losses on securities sold are determined on the basis of identified cost. Dividend income is recorded on the ex-dividend date, except for certain dividends from foreign securities where the ex-dividend date may have passed, which are recorded as soon as the Fund is informed of the ex-dividend date. Non-cash dividends included in dividend income, if any, are recorded at the fair market value of the securities received. Distributions received on securities that represent a return of capital or capital gain are recorded as a reduction of cost of investments and/or as a realized gain. The Fund estimates the components of distributions received that may be considered return of capital distributions or capital gain distributions. Interest income and distributions from the Fidelity Central Funds are accrued as earned. Interest income includes coupon
Annual Report
Notes to Financial Statements - continued
3. Significant Accounting Policies - continued
Investment Transactions and Income - continued
interest and amortization of premium and accretion of discount on debt securities. Investment income is recorded net of foreign taxes withheld where recovery of such taxes is uncertain.
Expenses. Expenses directly attributable to a fund are charged to that fund. Expenses attributable to more than one fund are allocated among the respective funds on the basis of relative net assets or other appropriate methods. Expense estimates are accrued in the period to which they relate and adjustments are made when actual amounts are known.
Income Tax Information and Distributions to Shareholders. Each year, the Fund intends to qualify as a regulated investment company, including distributing substantially all of its taxable income and realized gains under Subchapter M of the Internal Revenue Code and filing its U.S. federal tax return. As a result, no provision for income taxes is required. As of October 31, 2011, the Fund did not have any unrecognized tax benefits in the financial statements. A fund's federal tax return is subject to examination by the Internal Revenue Service (IRS) for a period of three years. Foreign taxes are provided for based on the Fund's understanding of the tax rules and rates that exist in the foreign markets in which it invests.
Distributions are declared and recorded on the ex-dividend date. Income dividends and capital gain distributions are declared separately for each class. Income and capital gain distributions are determined in accordance with income tax regulations, which may differ from GAAP.
Capital accounts within the financial statements are adjusted for permanent book-tax differences. These adjustments have no impact on net assets or the results of operations. Temporary book-tax differences will reverse in a subsequent period.
Book-tax differences are primarily due to foreign currency transactions, passive foreign investment companies (PFIC), partnerships, capital loss carryforwards and losses deferred due to wash sales.
The federal tax cost of investment securities and unrealized appreciation (depreciation) as of period end were as follows:
Gross unrealized appreciation | $ 7,855,689 |
Gross unrealized depreciation | (14,110,478) |
Net unrealized appreciation (depreciation) on securities and other investments | $ (6,254,789) |
| |
Tax Cost | $ 145,212,557 |
Annual Report
3. Significant Accounting Policies - continued
Income Tax Information and Distributions to Shareholders - continued
The tax-based components of distributable earnings as of period end were as follows:
Undistributed ordinary income | $ 1,552,850 |
Capital loss carryforward | $ (33,183,732) |
Net unrealized appreciation (depreciation) | $ (6,246,842) |
Under the recently enacted Regulated Investment Company Modernization Act of 2010 (the Act), the Fund will be permitted to carry forward capital losses incurred in taxable years beginning after December 22, 2010 for an unlimited period. However, any losses incurred during those future taxable years will be required to be utilized prior to any losses incurred in pre-enactment taxable years, which generally expire after eight years from when they are incurred. Additionally, post-enactment capital losses that are carried forward will retain their character as either short-term or long-term capital losses rather than being considered all short-term as under previous law. The Fund's first fiscal year end subject to the Act will be October 31, 2012.
The tax character of distributions paid was as follows:
| October 31, 2011 | October 31, 2010 |
Ordinary Income | $ 1,173,335 | $ 581,158 |
Short-Term Trading (Redemption) Fees. Shares held by investors in the Fund less than 30 days are subject to a redemption fee equal to 1.00% of the net asset value of shares redeemed. All redemption fees, which reduce the proceeds of the shareholder redemption, are retained by the Fund and accounted for as an addition to paid in capital.
New Accounting Pronouncement. In May 2011, the Financial Accounting Standards Board issued Accounting Standard Update No. 2011-04, Fair Value Measurement (Topic 820) - Amendments to Achieve Common Fair Value Measurement and Disclosure Requirements in U.S. GAAP and IFRSs. The update changes the wording used to describe the requirements in GAAP for measuring fair value and for disclosing information about fair value measurements. The update is effective during interim and annual periods beginning after December 15, 2011. Management is currently evaluating the impact of the update's adoption on the Fund's financial statement disclosures.
4. Operating Policies.
Delayed Delivery Transactions and When-Issued Securities. During the period, the Fund transacted in securities on a delayed delivery or when-issued basis. Payment and delivery may take place after the customary settlement period for that security. The
Annual Report
Notes to Financial Statements - continued
4. Operating Policies - continued
Delayed Delivery Transactions and When-Issued Securities - continued
price of the underlying securities and the date when the securities will be delivered and paid for are fixed at the time the transaction is negotiated. During the time a delayed delivery sell is outstanding, the contract is marked-to-market daily and equivalent deliverable securities are held for the transaction. The securities purchased on a delayed delivery or when-issued basis are identified as such in the Fund's Schedule of Investments. The Fund may receive compensation for interest forgone in the purchase of a delayed delivery or when-issued security. With respect to purchase commitments, the Fund identifies securities as segregated in its records with a value at least equal to the amount of the commitment. Losses may arise due to changes in the value of the underlying securities or if the counterparty does not perform under the contract's terms, or if the issuer does not issue the securities due to political, economic, or other factors.
Restricted Securities. The Fund may invest in securities that are subject to legal or contractual restrictions on resale. These securities generally may be resold in transactions exempt from registration or to the public if the securities are registered. Disposal of these securities may involve time-consuming negotiations and expense, and prompt sale at an acceptable price may be difficult. Information regarding restricted securities is included at the end of the Fund's Schedule of Investments.
5. Purchases and Sales of Investments.
Purchases and sales of securities, other than short-term securities, aggregated $169,182,591 and $84,756,770, respectively.
6. Fees and Other Transactions with Affiliates.
Management Fee. FMR and its affiliates provide the Fund with investment management related services for which the Fund pays a monthly management fee. The management fee is the sum of an individual fund fee rate that is based on an annual rate of .45% of the Fund's average net assets and a group fee rate that averaged .26% during the period. The group fee rate is based upon the average net assets of all the mutual funds advised by FMR. The group fee rate decreases as assets under management increase and increases as assets under management decrease. In addition, the management fee is subject to a performance adjustment (up to a maximum of ± .20% of the Fund's average net assets over a 36 month performance period). The upward or downward adjustment to the management fee is based on the relative investment performance of Total International Equity as compared to an appropriate benchmark index. For the period, the total annual management fee rate, including the performance adjustment, was .69% of the Fund's average net assets.
Annual Report
6. Fees and Other Transactions with Affiliates - continued
Distribution and Service Plan Fees. In accordance with Rule 12b-1 of the 1940 Act, the Fund has adopted separate Distribution and Service Plans for each class of shares. Certain classes pay Fidelity Distributors Corporation (FDC), an affiliate of FMR, separate Distribution and Service Fees, each of which is based on an annual percentage of each class' average net assets. In addition, FDC may pay financial intermediaries for selling shares of the Fund and providing shareholder support services. For the period, the Distribution and Service Fee rates, total fees and amounts retained by FDC were as follows:
| Distribution
Fee | Service
Fee | Total Fees | Retained
by FDC |
Class A | -% | .25% | $ 12,983 | $ 1,616 |
Class T | .25% | .25% | 5,374 | 38 |
Class B | .75% | .25% | 3,026 | 2,283 |
Class C | .75% | .25% | 15,058 | 2,823 |
| | | $ 36,441 | $ 6,760 |
Sales Load. FDC may receive a front-end sales charge of up to 5.75% for selling Class A shares, and 3.50% for selling Class T shares, some of which is paid to financial intermediaries for selling shares of the Fund. Depending on the holding period, FDC may receive contingent deferred sales charges levied on Class A, Class T, Class B, and Class C redemptions. The deferred sales charges range from 5% to 1% for Class B, 1% for Class C, 1.00% for certain purchases of Class A shares and .25% for certain purchases of Class T shares.
For the period, sales charge amounts retained by FDC were as follows:
| Retained
by FDC |
Class A | $ 2,591 |
Class T | 454 |
Class B* | 305 |
Class C* | 219 |
| $ 3,569 |
* When Class B and Class C shares are initially sold, FDC pays commissions from its own resources to financial intermediaries through which the sales are made.
Transfer Agent Fees. Fidelity Investments Institutional Operations Company, Inc. (FIIOC), an affiliate of FMR, is the transfer, dividend disbursing and shareholder servicing agent for each class of the Fund. FIIOC receives account fees and asset-based fees that vary according to the account size and type of account of the shareholders of the respective classes of the Fund. FIIOC pays for typesetting, printing and mailing of
Annual Report
Notes to Financial Statements - continued
6. Fees and Other Transactions with Affiliates - continued
Transfer Agent Fees - continued
shareholder reports, except proxy statements. For the period, transfer agent fees for each class were as follows:
| Amount | % of
Average
Net Assets |
Class A | $ 14,366 | .28 |
Class T | 3,388 | .32 |
Class B | 928 | .31 |
Class C | 4,603 | .31 |
Total International Equity | 250,636 | .24 |
Institutional Class | 464 | .30 |
| $ 274,385 | |
Accounting and Security Lending Fees. Fidelity Service Company, Inc. (FSC), an affiliate of FMR, maintains the Fund's accounting records. The accounting fee is based on the level of average net assets for the month. Under a separate contract, FSC administers the security lending program. The security lending fee is based on the number and duration of lending transactions.
Brokerage Commissions. The Fund placed a portion of its portfolio transactions with brokerage firms which are affiliates of the investment adviser. The commissions paid to these affiliated firms were $901 for the period.
7. Committed Line of Credit.
The Fund participates with other funds managed by FMR or an affiliate in a $4.0 billion credit facility (the "line of credit") to be utilized for temporary or emergency purposes to fund shareholder redemptions or for other short-term liquidity purposes. The Fund has agreed to pay commitment fees on its pro-rata portion of the line of credit, which amounted to $320 and is reflected in Miscellaneous expenses on the Statement of Operations. During the period, there were no borrowings on this line of credit.
8. Security Lending.
The Fund lends portfolio securities through a lending agent from time to time in order to earn additional income. For equity securities, a lending agent is used and may loan securities to certain qualified borrowers, including Fidelity Capital Markets (FCM), a broker-dealer affiliated with the Fund. On the settlement date of the loan, the Fund receives collateral (in the form of U.S. Treasury obligations, letters of credit and/or cash) against the loaned securities and maintains collateral in an amount not less than 100% of
Annual Report
8. Security Lending - continued
the market value of the loaned securities during the period of the loan. The market value of the loaned securities is determined at the close of business of the Fund and any additional required collateral is delivered to the Fund on the next business day. If the borrower defaults on its obligation to return the securities loaned because of insolvency or other reasons, a fund could experience delays and costs in recovering the securities loaned or in gaining access to the collateral. Any cash collateral received is invested in the Fidelity Securities Lending Cash Central Fund. The value of loaned securities and cash collateral at period end are disclosed on the Fund's Statement of Assets and Liabilities. Security lending income represents the income earned on investing cash collateral, less rebates paid to borrowers and any lending agent fees associated with the loan, plus any premium payments received for lending certain types of securities. Security lending income is presented in the Statement of Operations as a component of income from Fidelity Central Funds. Total security lending income during the period amounted to $31,105. During the period, there were no securities loaned to FCM.
9. Expense Reductions.
FMR contractually agreed to reimburse each class to the extent annual operating expenses exceeded certain levels of average net assets as noted in the table below. This reimbursement will remain in place through December 31, 2012. Some expenses, for example interest expense, including commitment fees, are excluded from this reimbursement.
The following classes were in reimbursement during the period:
| Expense
Limitations | Reimbursement
from adviser |
Class A | 1.45% | $ 14,721 |
Class T | 1.70% | 3,433 |
Class B | 2.20% | 954 |
Class C | 2.20% | 4,689 |
Total International Equity | 1.20% | 229,885 |
Institutional Class | 1.20% | 437 |
| | $ 254,119 |
In addition, FMR voluntarily agreed to reimburse a portion of its management fee. For the period, the amount of this reimbursement was $1,529.
Many of the brokers with whom FMR places trades on behalf of the Fund provided services to the Fund in addition to trade execution. These services included payments of certain expenses on behalf of the Fund totaling $31,513 for the period.
Annual Report
Notes to Financial Statements - continued
10. Distributions to Shareholders.
Distributions to shareholders of each class were as follows:
Years ended October 31, | 2011 | 2010 |
From net investment income | | |
Class A | $ 61,018 | $ 26,391 |
Class T | 9,414 | - |
Class B | 1,488 | - |
Class C | 6,263 | - |
Total International Equity | 873,280 | 382,451 |
Institutional Class | 1,578 | 2,381 |
Total | $ 953,041 | $ 411,223 |
From net realized gain | | |
Class A | $ 16,196 | $ 14,995 |
Class T | 3,213 | - |
Class B | 1,016 | - |
Class C | 4,485 | - |
Total International Equity | 195,026 | 154,214 |
Institutional Class | 358 | 726 |
Total | $ 220,294 | $ 169,935 |
11. Share Transactions.
Transactions for each class of shares were as follows:
| Shares | Dollars |
Years ended October 31, | 2011 | 2010 | 2011 | 2010 |
Class A | | | | |
Shares sold | 231,083 | 443,125 | $ 1,708,687 | $ 2,924,922 |
Reinvestment of distributions | 10,039 | 5,568 | 74,076 | 37,804 |
Shares redeemed | (279,366) | (347,260) | (2,035,449) | (2,296,503) |
Net increase (decrease) | (38,244) | 101,433 | $ (252,686) | $ 666,223 |
Class T | | | | |
Shares sold | 37,121 | 121,719 | $ 276,509 | $ 807,663 |
Reinvestment of distributions | 1,678 | - | 12,524 | - |
Shares redeemed | (25,970) | (224,749) | (191,826) | (1,531,457) |
Net increase (decrease) | 12,829 | (103,030) | $ 97,207 | $ (723,794) |
Class B | | | | |
Shares sold | 3,282 | 30,066 | $ 24,631 | $ 198,826 |
Reinvestment of distributions | 331 | - | 2,469 | - |
Shares redeemed | (9,973) | (194,792) | (73,676) | (1,332,260) |
Net increase (decrease) | (6,360) | (164,726) | $ (46,576) | $ (1,133,434) |
Annual Report
11. Share Transactions - continued
| Shares | Dollars |
Years ended October 31, | 2011 | 2010 | 2011 | 2010 |
Class C | | | | |
Shares sold | 66,879 | 86,496 | $ 498,161 | $ 580,588 |
Reinvestment of distributions | 1,425 | - | 10,610 | - |
Shares redeemed | (52,554) | (161,545) | (388,669) | (1,102,805) |
Net increase (decrease) | 15,750 | (75,049) | $ 120,102 | $ (522,217) |
Total International Equity | | | | |
Shares sold | 16,784,298 | 6,833,012 | $ 125,543,898 | $ 45,955,028 |
Reinvestment of distributions | 135,624 | 74,043 | 1,000,533 | 502,009 |
Shares redeemed | (5,532,363) | (3,806,841) | (39,913,646) | (24,965,317) |
Net increase (decrease) | 11,387,559 | 3,100,214 | $ 86,630,785 | $ 21,491,720 |
Institutional Class | | | | |
Shares sold | 26,909 | 377 | $ 202,383 | $ 2,481 |
Reinvestment of distributions | 263 | 460 | 1,936 | 3,106 |
Shares redeemed | (1,422) | (201,123) | (10,588) | (1,373,455) |
Net increase (decrease) | 25,750 | (200,286) | $ 193,731 | $ (1,367,868) |
12. Other.
The Fund's organizational documents provide former and current trustees and officers with a limited indemnification against liabilities arising in connection with the performance of their duties to the Fund. In the normal course of business, the Fund may also enter into contracts that provide general indemnifications. The Fund's maximum exposure under these arrangements is unknown as this would be dependent on future claims that may be made against the Fund. The risk of material loss from such claims is considered remote.
Annual Report
To the Trustees of Fidelity Investment Trust and Shareholders of Fidelity Total International Equity Fund:
We have audited the accompanying statement of assets and liabilities of Fidelity Total International Equity Fund (the Fund), a fund of Fidelity Investment Trust, including the schedule of investments, as of October 31, 2011, and the related statement of operations for the year then ended, the statement of changes in net assets for each of the two years in the period then ended, and the financial highlights for each of the four years in the period then ended. These financial statements and financial highlights are the responsibility of the Fund's management. Our responsibility is to express an opinion on these financial statements and financial highlights based on our audits.
We conducted our audits in accordance with the standards of the Public Company Accounting Oversight Board (United States). Those standards require that we plan and perform the audit to obtain reasonable assurance about whether the financial statements and financial highlights are free of material misstatement. The Fund is not required to have, nor were we engaged to perform, an audit of its internal control over financial reporting. Our audits included consideration of internal control over financial reporting as a basis for designing audit procedures that are appropriate in the circumstances, but not for the purpose of expressing an opinion on the effectiveness of the Fund's internal control over financial reporting. Accordingly, we express no such opinion. An audit also includes examining, on a test basis, evidence supporting the amounts and disclosures in the financial statements, assessing the accounting principles used and significant estimates made by management, as well as evaluating the overall financial statement presentation. Our procedures included confirmation of securities owned as of October 31, 2011, by correspondence with the custodians and brokers; where replies were not received from brokers, we performed other auditing procedures. We believe that our audits provide a reasonable basis for our opinion.
In our opinion, the financial statements and financial highlights referred to above present fairly, in all material respects, the financial position of Fidelity Total International Equity Fund as of October 31, 2011, the results of its operations for the year then ended, the changes in its net assets for each of the two years in the period then ended, and the financial highlights for each of the four years in the period then ended, in conformity with accounting principles generally accepted in the United States of America.
DELOITTE & TOUCHE LLP
Boston, Massachusetts
December 13, 2011
Annual Report
The Trustees, Members of the Advisory Board, and executive officers of the trust and funds, as applicable, are listed below. The Board of Trustees governs each fund and is responsible for protecting the interests of shareholders. The Trustees are experienced executives who meet periodically throughout the year to oversee each fund's activities, review contractual arrangements with companies that provide services to each fund, oversee management of the risks associated with such activities and contractual arrangements, and review each fund's performance. Except for James C. Curvey, each of the Trustees oversees 226 funds advised by FMR or an affiliate. Mr. Curvey oversees 429 funds advised by FMR or an affiliate.
The Trustees hold office without limit in time except that (a) any Trustee may resign; (b) any Trustee may be removed by written instrument, signed by at least two-thirds of the number of Trustees prior to such removal; (c) any Trustee who requests to be retired or who has become incapacitated by illness or injury may be retired by written instrument signed by a majority of the other Trustees; and (d) any Trustee may be removed at any special meeting of shareholders by a two-thirds vote of the outstanding voting securities of the trust. Each Trustee who is not an interested person (as defined in the 1940 Act) (Independent Trustee), shall retire not later than the last day of the calendar year in which his or her 75th birthday occurs. The Independent Trustees may waive this mandatory retirement age policy with respect to individual Trustees. The executive officers and Advisory Board Members hold office without limit in time, except that any officer and Advisory Board Member may resign or may be removed by a vote of a majority of the Trustees at any regular meeting or any special meeting of the Trustees. Except as indicated, each individual has held the office shown or other offices in the same company for the past five years.
Experience, Skills, Attributes, and Qualifications of the Funds' Trustees. The Governance and Nominating Committee has adopted a statement of policy that describes the experience, qualifications, attributes, and skills that are necessary and desirable for potential Independent Trustee candidates (Statement of Policy). The Board believes that each Trustee satisfied at the time he or she was initially elected or appointed a Trustee, and continues to satisfy, the standards contemplated by the Statement of Policy. The Governance and Nominating Committee also engages professional search firms to help identify potential Independent Trustee candidates who have the experience, qualifications, attributes, and skills consistent with the Statement of Policy. From time to time, additional criteria based on the composition and skills of the current Independent Trustees, as well as experience or skills that may be appropriate in light of future changes to board composition, business conditions, and regulatory or other developments, have also been considered by the professional search firms and the Governance and Nominating Committee. In addition, the Board takes into account the Trustees' commitment and participation in Board and committee meetings, as well as their leadership of standing and ad hoc committees throughout their tenure.
In determining that a particular Trustee was and continues to be qualified to serve as a Trustee, the Board has considered a variety of criteria, none of which, in isolation, was controlling. The Board believes that, collectively, the Trustees have balanced and diverse experience, qualifications, attributes, and skills, which allow the Board to operate effectively in governing each fund and protecting the interests of shareholders. Information about the specific experience, skills, attributes, and qualifications of each Trustee, which in each case led to the Board's conclusion that the Trustee should serve (or continue to serve) as a trustee of the funds, is provided below.
Annual Report
Board Structure and Oversight Function. James C. Curvey is an interested person (as defined in the 1940 Act) and currently serves as Acting Chairman. The Trustees have determined that an interested Chairman is appropriate and benefits shareholders because an interested Chairman has a personal and professional stake in the quality and continuity of services provided to the funds. Independent Trustees exercise their informed business judgment to appoint an individual of their choosing to serve as Chairman, regardless of whether the Trustee happens to be independent or a member of management. The Independent Trustees have determined that they can act independently and effectively without having an Independent Trustee serve as Chairman and that a key structural component for assuring that they are in a position to do so is for the Independent Trustees to constitute a substantial majority for the Board. The Independent Trustees also regularly meet in executive session. Ned C. Lautenbach serves as Chairman of the Independent Trustees and as such (i) acts as a liaison between the Independent Trustees and management with respect to matters important to the Independent Trustees and (ii) with management prepares agendas for Board meetings.
Fidelity funds are overseen by different Boards of Trustees. The funds' Board oversees Fidelity's equity and high income funds and another Board oversees Fidelity's investment-grade bond, money market, and asset allocation funds. The asset allocation funds may invest in Fidelity funds overseen by the funds' Board. The use of separate Boards, each with its own committee structure, allows the Trustees of each group of Fidelity funds to focus on the unique issues of the funds they oversee, including common research, investment, and operational issues. On occasion, the separate Boards establish joint committees to address issues of overlapping consequences for the Fidelity funds overseen by each Board.
The Trustees operate using a system of committees to facilitate the timely and efficient consideration of all matters of importance to the Trustees, each fund, and fund shareholders and to facilitate compliance with legal and regulatory requirements and oversight of the funds' activities and associated risks. The Board, acting through its committees, has charged FMR and its affiliates with (i) identifying events or circumstances the occurrence of which could have demonstrably adverse effects on the funds' business and/or reputation; (ii) implementing processes and controls to lessen the possibility that such events or circumstances occur or to mitigate the effects of such events or circumstances if they do occur; and (iii) creating and maintaining a system designed to evaluate continuously business and market conditions in order to facilitate the identification and implementation processes described in (i) and (ii) above. Because the day-to-day operations and activities of the funds are carried out by or through FMR, its affiliates and other service providers, the funds' exposure to risks is mitigated but not eliminated by the processes overseen by the Trustees. While each of the Board's committees has responsibility for overseeing different aspects of the funds' activities, oversight is exercised primarily through the Operations, Audit, and Compliance Committees. In addition, the Independent Trustees have worked with FMR to enhance the Board's oversight of investment and financial risks, legal and regulatory risks, technology risks, and operational risks, including the development of additional risk reporting to the Board. For example, a working group comprised of Independent Trustees and FMR has worked and continues to work to review the Fidelity funds' valuation-related activities, reporting and risk management. Appropriate personnel, including but not limited to the funds' Chief Compliance Officer (CCO), FMR's internal auditor, the independent accountants, the funds' Treasurer and portfolio management personnel, make periodic reports to the Board's committees, as appropriate, including an annual review of FMR's risk management program for the Fidelity funds. The responsibilities of each standing committee, including their oversight responsibilities, are described further under "Standing Committees of the Funds' Trustees."
Annual Report
Trustees and Officers - continued
The funds' Statement of Additional Information (SAI) includes more information about the Trustees. To request a free copy, call Fidelity at 1-800-544-8544.
Interested Trustees*:
Correspondence intended for each Trustee who is an interested person may be sent to Fidelity Investments, 82 Devonshire Street, Boston, Massachusetts 02109.
Name, Age; Principal Occupations and Other Relevant Experience+ |
James C. Curvey (76) |
| Year of Election or Appointment: 2007 Mr. Curvey is Trustee and Acting Chairman of the Board of Trustees of certain Trusts. Mr. Curvey also serves as Trustee (2007-present) of other investment companies advised by FMR. Mr. Curvey is a Director of Fidelity Investments Money Management, Inc. (2009-present), Director of Fidelity Research & Analysis Co. (2009-present) and Director of FMR and FMR Co., Inc. (2007-present). Mr. Curvey is also Vice Chairman (2007-present) and Director of FMR LLC. In addition, Mr. Curvey serves as an Overseer for the Boston Symphony Orchestra and a member of the Trustees of Villanova University. Previously, Mr. Curvey was the Vice Chairman (2006-2007) and Director (2000-2007) of FMR Corp. |
Ronald P. O'Hanley (54) |
| Year of Election or Appointment: 2011 Mr. O'Hanley is Director of FMR Co., Inc. (2010-present), Director of Fidelity Investments Money Management, Inc. (2010-present), Director of Fidelity Research & Analysis Company (2010-present), President of Fidelity Asset Management and Corporate Services and a member of Fidelity's Executive Committee (2010-present). Previously, Mr. O'Hanley served as President and Chief Executive Officer of BNY Mellon Asset Management (2007-2010). Mr. O'Hanley also served as Vice Chairman of Bank New York Mellon Corp. and a member of that firm's Executive Committee. Prior to the 2007 merger of The Bank of New York and Mellon Financial Corporation, he was Vice Chairman of Mellon Financial Corporation and President and Chief Executive Officer of Mellon Asset Management. He joined Mellon in February 1997. Mr. O'Hanley currently serves as Chairman of the Boston Public Library Foundation Board of Directors and sits on the Board of Directors of Beth Israel Deaconess Medical Center, the Board of Trustees of the Marine Biological Laboratory and the Advisory Board of the Maxwell School of Citizenship and Public Administration at Syracuse University. Mr. O'Hanley also chairs the Council on Asset Management for the Financial Services Roundtable and is a member of the Board of Directors of Institutional Investor's U.S. Institute. |
* Trustees have been determined to be "Interested Trustees" by virtue of, among other things, their affiliation with the trust or various entities under common control with FMR.
+ The information above includes each Trustee's principal occupation during the last five years and other information relating to the experience, attributes, and skills relevant to each Trustee's qualifications to serve as a Trustee, which led to the conclusion that each Trustee should serve as a Trustee for each fund.
Annual Report
Trustees and Officers - continued
Independent Trustees:
Correspondence intended for each Independent Trustee (that is, the Trustees other than the Interested Trustees) may be sent to Fidelity Investments, P.O. Box 55235, Boston, Massachusetts 02205-5235.
Name, Age; Principal Occupations and Other Relevant Experience+ |
Dennis J. Dirks (63) |
| Year of Election or Appointment: 2005 Prior to his retirement in May 2003, Mr. Dirks was Chief Operating Officer and a member of the Board of The Depository Trust & Clearing Corporation (DTCC). He also served as President, Chief Operating Officer, and Board member of The Depository Trust Company (DTC) and President and Board member of the National Securities Clearing Corporation (NSCC). In addition, Mr. Dirks served as Chief Executive Officer and Board member of the Government Securities Clearing Corporation, Chief Executive Officer and Board member of the Mortgage-Backed Securities Clearing Corporation, as a Trustee and a member of the Finance Committee of Manhattan College (2005-2008), and as a Trustee and a member of the Finance Committee of AHRC of Nassau County (2006-2008). Mr. Dirks is a member of the Independent Directors Council (IDC) Governing Council (2010-Present) and Board of Directors for The Brookville Center for Children's Services, Inc. (2009-present). |
Alan J. Lacy (58) |
| Year of Election or Appointment: 2008 Mr. Lacy serves as Senior Adviser (2007-present) of Oak Hill Capital Partners, L.P. (private equity). Mr. Lacy also served as Chief Executive Officer (2000-2005) and Vice Chairman (2005-2006) of Sears Holdings Corporation and Sears, Roebuck and Co. (retail). In addition, Mr. Lacy serves as a member of the Board of Directors of Dave & Buster's, Inc. (restaurant and entertainment complexes, 2010-present), The Hillman Companies, Inc. (hardware wholesalers, 2010-present), and Bristol-Myers Squibb Company (global pharmaceuticals, 2007-present). Mr. Lacy is a member of the Board of Trustees of The National Parks Conservation Association (2006-Present). Previously, Mr. Lacy served as Chairman of the Board of Trustees of the National Parks Conservation Association (2008-2011) and as a member of the Board of Directors for the Western Union Company (global money transfer, 2006-2011). |
Ned C. Lautenbach (67) |
| Year of Election or Appointment: 2000 Mr. Lautenbach is Chairman of the Independent Trustees of the Equity and High Income Funds (2006-present). Mr. Lautenbach currently serves as the Lead Director of the Eaton Corporation Board of Directors (diversified industrial, 1997-present). Mr. Lautenbach is also a member of the Board of Directors of the Philharmonic Center for the Arts in Naples, Florida (1999-present); a member of the Board of Trustees of Fairfield University (2005-present); and a member of the Council on Foreign Relations (1994-present). Previously, Mr. Lautenbach was a Partner/Advisory Partner at Clayton, Dubilier & Rice, LLC (private equity investment, 1998-2010), as well as a Director of Sony Corporation (2006-2007). |
Joseph Mauriello (67) |
| Year of Election or Appointment: 2008 Prior to his retirement in January 2006, Mr. Mauriello served in numerous senior management positions including Deputy Chairman and Chief Operating Officer (2004-2005), and Vice Chairman of Financial Services (2002-2004) of KPMG LLP US (professional services, 1965-2005). Mr. Mauriello currently serves as a member of the Board of Directors of XL Group plc. (global insurance and re-insurance, 2006-present) and of Arcadia Resources Inc. (health care services and products, 2007-present). Previously, Mr. Mauriello served as a Director of the Hamilton Funds of the Bank of New York (2006-2007). |
Robert W. Selander (61) |
| Year of Election or Appointment: 2011 Previously, Mr. Selander served as a Member of the Advisory Board of Fidelity's Equity and High Income Funds (2011), Executive Vice Chairman (2010), Chief Executive Officer (2009-2010), and President and Chief Executive Officer (1997-2009) of Mastercard, Inc. |
Cornelia M. Small (67) |
| Year of Election or Appointment: 2005 Ms. Small is a member of the Board of Directors of the Teagle Foundation (2009-present). Ms. Small is also a member of the Investment Committee, and Chair (2008-present) and a member of the Board of Trustees of Smith College. In addition, Ms. Small serves on the Investment Committee of the Berkshire Taconic Community Foundation (2008-present). Previously, Ms. Small served as Chairperson of the Investment Committee (2002-2008) of Smith College. In addition, Ms. Small served as Chief Investment Officer, Director of Global Equity Investments, and a member of the Board of Directors of Scudder, Stevens & Clark and Scudder Kemper Investments. |
William S. Stavropoulos (72) |
| Year of Election or Appointment: 2001 Mr. Stavropoulos is Vice Chairman of the Independent Trustees of the Equity and High Income Funds (2006-present). Mr. Stavropoulos serves as President and Founder of the Michigan Baseball Foundation, the Great Lakes Loons (2007-present). Mr. Stavropoulos is Chairman Emeritus of the Board of Directors of The Dow Chemical Company, where he previously served in numerous senior management positions, including President, CEO (1995-2000; 2002-2004), Chairman of the Executive Committee (2000-2006), and as a member of the Board of Directors (1990-2006). Currently, Mr. Stavropoulos is Chairman of Univar (global distributor of commodity and specialty chemicals, 2010-present), a Director of Teradata Corporation (data warehousing and technology solutions, 2008-present), Chemical Financial Corporation, Maersk Inc. (industrial conglomerate), Tyco International, Inc. (multinational manufacturing and services, 2007-present), and a member of the Advisory Board for Metalmark Capital (private equity investment, 2005-present). Mr. Stavropoulos is a special advisor to Clayton, Dubilier & Rice, LLC (private equity investment). In addition, Mr. Stavropoulos is a member of the University of Notre Dame Advisory Council for the College of Science. |
David M. Thomas (62) |
| Year of Election or Appointment: 2008 Previously, Mr. Thomas served as Executive Chairman (2005-2006) and Chairman and Chief Executive Officer (2000-2005) of IMS Health, Inc. (pharmaceutical and healthcare information solutions). In addition, Mr. Thomas serves as a member of the Board of Directors of Fortune Brands, Inc. (consumer products), and Interpublic Group of Companies, Inc. (marketing communication, 2004-present). |
Michael E. Wiley (61) |
| Year of Election or Appointment: 2008 Mr. Wiley also serves as a Director of Asia Pacific Exploration Consolidated (international oil and gas exploration and production, 2008-present). Mr. Wiley serves as a Director of Tesoro Corporation (independent oil refiner and marketer, 2005-present), and a Director of Bill Barrett Corporation (exploration and production, 2005-present). In addition, Mr. Wiley also serves as a Director of Post Oak Bank (privately-held bank, 2004-present). Previously, Mr. Wiley served as a member of the Board of Trustees of the University of Tulsa (2000-2006; 2007-2010), as a Senior Energy Advisor of Katzenbach Partners, LLC (consulting, 2006-2007), as an Advisory Director of Riverstone Holdings (private investment), Chairman, President, and CEO of Baker Hughes, Inc. (oilfield services, 2000-2004), and as Director of Spinnaker Exploration Company (exploration and production, 2001-2005). |
Annual Report
+ The information above includes each Trustee's principal occupation during the last five years and other information relating to the experience, attributes, and skills relevant to each Trustee's qualifications to serve as a Trustee, which led to the conclusion that each Trustee should serve as a Trustee for each fund.
Advisory Board Members and Executive Officers:
Correspondence intended for each executive officer, Edward C. Johnson 3d, and Peter S. Lynch, may be sent to Fidelity Investments, 82 Devonshire Street, Boston, Massachusetts 02109.
Name, Age; Principal Occupation |
Edward C. Johnson 3d (81) |
| Year of Election or Appointment: 2011 Member of the Advisory Board of Fidelity's Equity and High Income Funds. Mr. Johnson serves as Chief Executive Officer, Chairman, and a Director of FMR LLC, and also serves as Chairman and Director of FIL Limited. Previously, Mr. Johnson served as a Trustee and Chairman of the Board of certain Fidelity Trusts, Chairman and a Director of FMR, Chairman and a Director of FMR Co., Inc., and President of FMR LLC (2006-2007). |
Peter S. Lynch (67) |
| Year of Election or Appointment: 2003 Member of the Advisory Board of Fidelity's Equity and High Income Funds. Mr. Lynch is Vice Chairman and a Director of FMR and FMR Co., Inc. In addition, Mr. Lynch serves as a Trustee of Boston College and as the Chairman of the Inner-City Scholarship Fund. Previously, Mr. Lynch served on the Special Olympics International Board of Directors (1997-2006). |
Kenneth B. Robins (42) |
| Year of Election or Appointment: 2008 President and Treasurer of Fidelity's Equity and High Income Funds. Mr. Robins also serves as President and Treasurer (2010-present) and Assistant Treasurer (2009-present) of other Fidelity funds and is an employee of Fidelity Investments (2004-present). Previously, Mr. Robins served as Deputy Treasurer of the Fidelity funds (2005-2008) and Treasurer and Chief Financial Officer of The North Carolina Capital Management Trust: Cash and Term Portfolios (2006-2008). |
Bruce T. Herring (46) |
| Year of Election or Appointment: 2006 Vice President of certain Equity Funds. Mr. Herring also serves as Chief Investment Officer and Director of Fidelity Management & Research (U.K.) Inc. (2010-present) and Group Chief Investments Officer of FMR. Previously, Mr. Herring served as Vice President (2005-2006) and Senior Vice President (2006-2007) of Fidelity Management & Research Company, Vice President of FMR Co., Inc. (2001-2007) and as a portfolio manager for Fidelity U.S. Equity Funds. |
Brian B. Hogan (47) |
| Year of Election or Appointment: 2009 Vice President of Equity and High Income Funds. Mr. Hogan also serves as President of FMR's Equity Division (2009-present). Previously, Mr. Hogan served as Senior Vice President, Equity Research of FMR (2006-2009) and as a portfolio manager. |
Scott C. Goebel (43) |
| Year of Election or Appointment: 2008 Secretary and Chief Legal Officer (CLO) of the Fidelity funds. Mr. Goebel also serves as Secretary of Fidelity Investments Money Management, Inc. (FIMM) (2010-present) and Fidelity Research and Analysis Company (FRAC) (2010-present); Secretary and CLO of The North Carolina Capital Management Trust: Cash and Term Portfolios (2008-present); General Counsel, Secretary, and Senior Vice President of FMR (2008-present) and FMR Co., Inc. (2008-present); employed by FMR LLC or an affiliate (2001-present); Chief Legal Officer of Fidelity Management & Research (Hong Kong) Limited (2008-present) and Assistant Secretary of Fidelity Management & Research (Japan) Inc. (2008-present), and Fidelity Management & Research (U.K.) Inc. (2008-present). Previously, Mr. Goebel served as Assistant Secretary of FIMM (2008-2010), FRAC (2008-2010), and the Funds (2007-2008) and as Vice President and Secretary of Fidelity Distributors Corporation (FDC) (2005-2007). |
William C. Coffey (42) |
| Year of Election or Appointment: 2009 Assistant Secretary of Fidelity's Equity and High Income Funds. Mr. Coffey also serves as Senior Vice President and Deputy General Counsel of FMR LLC (2010-present), and is an employee of Fidelity Investments. Previously, Mr. Coffey served as Vice President and Associate General Counsel of FMR LLC (2005-2009). |
Holly C. Laurent (57) |
| Year of Election or Appointment: 2008 Anti-Money Laundering (AML) Officer of the Fidelity funds. Ms. Laurent also serves as AML Officer of The North Carolina Capital Management Trust: Cash and Term Portfolios (2008-present) and is an employee of Fidelity Investments. Previously, Ms. Laurent was Senior Vice President and Head of Legal for Fidelity Business Services India Pvt. Ltd. (2006-2008), and Senior Vice President, Deputy General Counsel and Group Head for FMR LLC (2005-2006). |
Christine Reynolds (53) |
| Year of Election or Appointment: 2008 Chief Financial Officer of the Fidelity funds. Ms. Reynolds became President of Fidelity Pricing and Cash Management Services (FPCMS) in August 2008. Ms. Reynolds served as Chief Operating Officer of FPCMS (2007-2008). Previously, Ms. Reynolds served as President, Treasurer, and Anti-Money Laundering officer of the Fidelity funds (2004-2007). |
Kenneth A. Rathgeber (64) |
| Year of Election or Appointment: 2004 Chief Compliance Officer of Fidelity's Equity and High Income Funds. Mr. Rathgeber is Chief Compliance Officer of Fidelity Management & Research (Hong Kong) Limited (2008-present), Fidelity Management & Research (Japan) Inc. (2008-present), FMR (2005-present), FMR Co., Inc. (2005-present), Fidelity Management & Research (U.K.) Inc. (2005-present), Fidelity Research & Analysis Company (2005-present), Fidelity Investments Money Management, Inc. (2005-present), Pyramis Global Advisors, LLC (2005-present), and Strategic Advisers, Inc. (2005-present). |
Jeffrey S. Christian (50) |
| Year of Election or Appointment: 2009 Deputy Treasurer of the Fidelity funds. Mr. Christian is an employee of Fidelity Investments. Previously, Mr. Christian served as Chief Financial Officer (2008-2009) of certain Fidelity funds and Senior Vice President of Fidelity Pricing and Cash Management Services (FPCMS) (2004-2009). |
Joseph F. Zambello (54) |
| Year of Election or Appointment: 2011 Deputy Treasurer of the Fidelity funds. Mr. Zambello is an employee of Fidelity Investments. Previously, Mr. Zambello served as Vice President of FMR's Program Management Group (2009-2011) and Vice President of the Transfer Agent Oversight Group (2005-2009). |
Adrien E. Deberghes (44) |
| Year of Election or Appointment: 2008 Deputy Treasurer of Fidelity's Equity and High Income Funds. Mr. Deberghes also serves as Vice President and Assistant Treasurer of Fidelity Rutland Square Trust II and Fidelity Commonwealth Trust II (2011-present), Assistant Treasurer of other Fidelity funds (2010-present), and is an employee of Fidelity Investments (2008-present). Previously, Mr. Deberghes served as Senior Vice President of Mutual Fund Administration at State Street Corporation (2007-2008), Senior Director of Mutual Fund Administration at Investors Bank & Trust (2005-2007), and Director of Finance for Dunkin' Brands (2000-2005). |
Stephanie J. Dorsey (42) |
| Year of Election or Appointment: 2010 Assistant Treasurer of Fidelity's Equity and High Income Funds. Ms. Dorsey also serves as Deputy Treasurer of other Fidelity funds (2008-present) and is an employee of Fidelity Investments (2008-present). Previously, Ms. Dorsey served as Treasurer (2004-2008) of the JPMorgan Mutual Funds and Vice President (2004-2008) of JPMorgan Chase Bank. |
John R. Hebble (53) |
| Year of Election or Appointment: 2009 Assistant Treasurer of Fidelity's Equity and High Income Funds. Mr. Hebble also serves as President (2011-present), Treasurer, and Chief Financial Officer of The North Carolina Capital Management Trust: Cash and Term Portfolios (2008-present), President and Treasurer of other Fidelity funds (2008-present) and is an employee of Fidelity Investments. |
Gary W. Ryan (53) |
| Year of Election or Appointment: 2005 Assistant Treasurer of the Fidelity funds. Mr. Ryan is an employee of Fidelity Investments. Previously, Mr. Ryan served as Vice President of Fund Reporting in Fidelity Pricing and Cash Management Services (FPCMS) (1999-2005). |
Jonathan Davis (43) |
| Year of Election or Appointment: 2010 Assistant Treasurer of the Fidelity funds. Mr. Davis is also Assistant Treasurer of Fidelity Rutland Square Trust II and Fidelity Commonwealth Trust II. Mr. Davis is an employee of Fidelity Investments. Previously, Mr. Davis served as Vice President and Associate General Counsel of FMR LLC (2003-2010). |
Annual Report
The fund designates 100% of the dividends distributed in December 2010 during the fiscal year as amounts which may be taken into account as a dividend for the purposes of the maximum rate under section 1(h)(11) of the Internal Revenue Code.
The amounts per share which represent income derived from sources within, and taxes paid to, foreign countries or possessions of the United States are as follows:
| Pay Date | Income | Taxes |
Total International Equity Fund | 12/06/10 | $0.085 | $0.0112 |
| 12/31/10 | 0.015 | 0.0000 |
The fund will notify shareholders in January 2012 of amounts for use in preparing 2011 income tax returns.
Annual Report
Board Approval of Investment Advisory Contracts and Management Fees
Fidelity Total International Equity Fund
Each year, the Board of Trustees, including the Independent Trustees (together, the Board), votes on the renewal of the management contract and sub-advisory agreements (together, the Advisory Contracts) for the fund. The Board, assisted by the advice of fund counsel and Independent Trustees' counsel, requests and considers a broad range of information relevant to the renewal of the Advisory Contracts throughout the year.
The Board meets regularly and considers at each of its meetings factors that are relevant to its annual consideration of the renewal of the fund's Advisory Contracts, including the services and support provided to the fund and its shareholders. The Board has established various standing committees, each composed of Independent Trustees with varying backgrounds, to which the Board has assigned specific subject matter responsibilities in order to enhance effective decision-making by the Board. The Board, acting directly and through its Committees, requests and receives information concerning the annual consideration of the renewal of the fund's Advisory Contracts. The Board also meets as needed to consider matters specifically related to the Board's annual consideration of the renewal of Advisory Contracts. Members of the Board may also meet with trustees of other Fidelity funds through ad hoc joint committees to discuss certain matters relevant to the Fidelity funds.
At its July 2011 meeting, the Board of Trustees, including the Independent Trustees, unanimously determined to renew the fund's Advisory Contracts. In reaching its determination, the Board considered all factors it believed relevant, including (i) the nature, extent, and quality of the services to be provided to the fund and its shareholders (including the investment performance of the fund); (ii) the competitiveness of the fund's management fee and total expense ratio; (iii) the total costs of the services to be provided by and the profits to be realized by Fidelity from its relationship with the fund; (iv) the extent to which economies of scale would be realized as the fund grows; and (v) whether fee levels reflect these economies of scale, if any, for the benefit of fund shareholders.
In considering whether to renew the Advisory Contracts for the fund, the Board reached a determination, with the assistance of fund counsel and Independent Trustees' counsel and through the exercise of its business judgment, that the renewal of the Advisory Contracts is in the best interests of the fund and its shareholders and that the compensation payable under the Advisory Contracts is fair and reasonable. The Board's decision to renew the Advisory Contracts was not based on any single factor, but rather was based on a comprehensive consideration of all the information provided to the Board at its meetings throughout the year. The Board, in reaching its determination to renew the Advisory Contracts, is aware that shareholders in the fund have a broad range of investment choices available to them, including a wide choice among mutual funds offered by Fidelity's competitors, and that the fund's shareholders, who have the opportunity to review and weigh the disclosure provided by the fund in its prospectus and other public disclosures, have chosen to invest in this fund, managed by Fidelity.
Annual Report
Nature, Extent, and Quality of Services Provided. The Board considered the staffing within the investment adviser, FMR, and the sub-advisers (together, the Investment Advisers), including the backgrounds of the fund's investment personnel and the fund's investment objective and discipline. The Independent Trustees also had discussions with senior management of Fidelity's investment operations and investment groups. The Board considered the structure of the portfolio manager compensation program and whether this structure provides appropriate incentives to act in the best interests of the fund.
Resources Dedicated to Investment Management and Support Services. The Board and the Fund Oversight and Research Committees reviewed the general qualifications and capabilities of the Investment Advisers' investment staff, including its size, education, experience, and resources, as well as the Investment Advisers' approach to recruiting, training, managing, and compensating investment personnel. The Board also noted that FMR has devoted increased resources to non-U.S. offices. The Board noted that Fidelity's analysts have extensive resources, tools and capabilities which allow them to conduct sophisticated quantitative and fundamental analysis, as well as credit analysis of issuers, counterparties and enhancers. The Board also believes that Fidelity's investment professionals have sufficient access to global information and data so as to provide competitive investment results over time, and that those professionals also have access to sophisticated tools which permit them to assess portfolio construction and risk and performance attribution characteristics continuously, as well as to transmit new information and research conclusions rapidly around the world. Additionally, in their deliberations, the Board considered the Investment Advisers' trading capabilities and resources which are an integral part of the investment management process.
Shareholder and Administrative Services. The Board considered (i) the nature, extent, quality, and cost of advisory, administrative, and shareholder services performed by the Investment Advisers and their affiliates under the Advisory Contracts and under separate agreements covering transfer agency, pricing and bookkeeping, and securities lending services for the fund; (ii) the nature and extent of the investment adviser's supervision of third party service providers, principally custodians and subcustodians; and (iii) the resources devoted to, and the record of compliance with, the fund's compliance policies and procedures. The Board also reviewed the allocation of fund brokerage, including allocations to brokers affiliated with the Investment Advisers, the use of brokerage commissions to pay fund expenses, and the use of "soft" commission dollars to pay for research services.
The Board noted that the growth of fund assets over time across the complex allows Fidelity to reinvest in the development of services designed to enhance the value or convenience of the Fidelity funds as investment vehicles. These services include 24-hour access to account information and market information through telephone representatives and over the Internet, investor education materials and asset allocation tools, and the expanded availability of Fidelity Investor Centers, with 35 new branches opening since 2010.
Annual Report
Board Approval of Investment Advisory Contracts and
Management Fees - continued
Investment in a Large Fund Family. The Board considered the benefits to shareholders of investing in a Fidelity fund, including the benefits of investing in a fund that is part of a large family of funds offering a variety of investment disciplines and providing a large variety of mutual fund investor services. The Board noted that Fidelity had taken, or had made recommendations that resulted in the Fidelity funds taking, a number of actions over the previous year that benefited particular funds, including (i) continuing to dedicate additional resources to investment research and support of the senior management team that oversees asset management; (ii) rationalizing product lines through the mergers of six funds into other funds; (iii) continuing to migrate the Freedom Funds to dedicated lower cost underlying funds; (iv) obtaining shareholder approval to broaden the investment strategies for Fidelity Consumer Finance Portfolio, Fidelity Emerging Asia Fund, and Fidelity Environment and Alternative Energy Portfolio; (v) contractually agreeing to reduce the management fees and impose other expense limitations on Spartan 500 Index Fund and U.S. Bond Index Fund in connection with launching new institutional classes of these funds; (vi) changing the name, primary and supplemental benchmarks, and investment policies of Fidelity Global Strategies Fund to support the fund's flexible investment mandate and global orientation; and (vii) reducing the transfer agency account fee rates on certain accounts.
Investment Performance. The Board considered whether the fund has operated in accordance with its investment objective, as well as its record of compliance with its investment restrictions. It also reviewed the fund's absolute investment performance for each class, as well as the fund's relative investment performance for each class measured over multiple periods against (i) a broad-based securities market index, and (ii) a peer group of mutual funds deemed appropriate by Fidelity and reviewed by the Board. Because the fund had been in existence less than five calendar years, the following charts considered by the Board show, over the one- and three-year periods ended December 31, 2010, the cumulative total returns of Institutional Class (Class I) and Class C of the fund, the cumulative total returns of a broad-based securities market index ("benchmark"), and a range of cumulative total returns of a peer group of mutual funds identified by Morningstar, Inc. as having an investment style similar to that of the fund based on underlying portfolio holdings. The returns of Institutional Class (Class I) and Class C show the performance of the highest and lowest performing classes, respectively (based on three-year performance). The box within each chart shows the 25th percentile return (bottom of box) and the 75th percentile return (top of box) of the peer group. Returns shown above the box are in the first quartile and returns shown below the box are in the fourth quartile. The percentage beaten numbers noted below each chart correspond to the percentile box and represent the percentage of funds in the peer group whose performance was equal to or lower than that of the class indicated.
Annual Report
Fidelity Total International Equity Fund
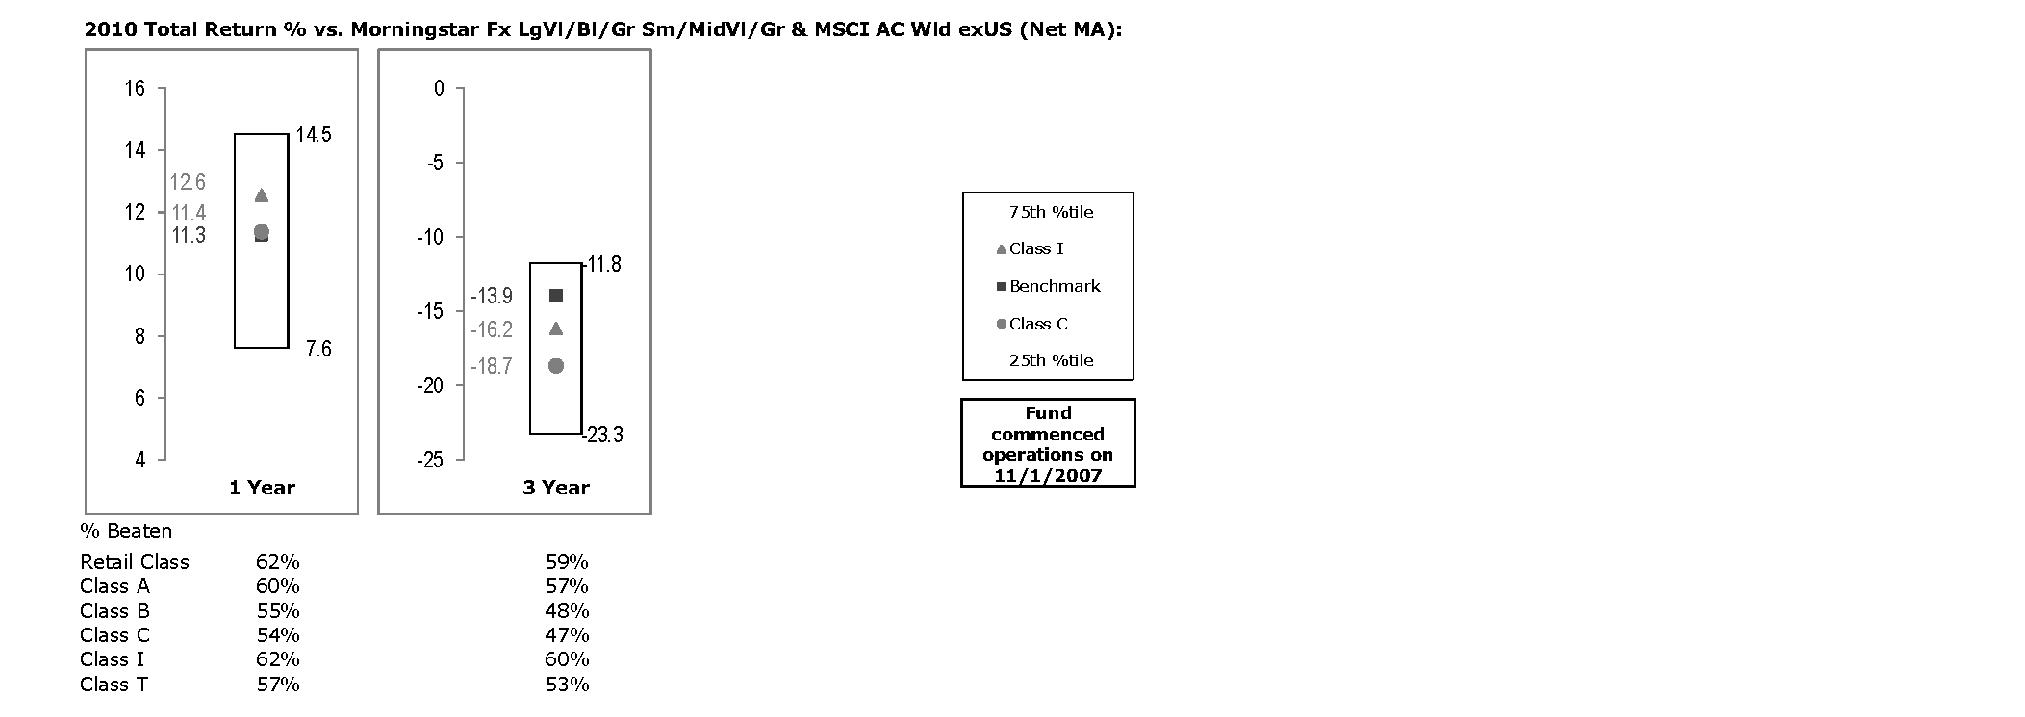
The Board reviewed the fund's relative investment performance against its peer group and noted that the performance of Institutional Class (Class I) of the fund was in the second quartile for all the periods shown. The Board also noted that the investment performance of Institutional Class (Class I) of the fund compared favorably to its benchmark for the one-year period, although the fund's three-year cumulative total return was lower than its benchmark. The Board considered that the variations in performance among the fund's classes reflect the variations in class expenses, which result in lower performance for higher expense classes. The Board also reviewed the fund's performance since inception as well as performance in the current year.
The Board also considered that the fund's management fee is subject to upward or downward adjustment depending upon whether, and to what extent, the fund's investment performance for the performance period exceeds, or is exceeded by, the record (over the same period) of a Board-approved performance adjustment index. The Board noted that the performance adjustment provides FMR with a strong economic incentive to seek to achieve superior performance for the fund's shareholders and helps to more closely align the interests of FMR and the fund's shareholders.
Based on its review, the Board concluded that the nature, extent, and quality of services provided to the fund under the Advisory Contracts should benefit the fund's shareholders.
Annual Report
Board Approval of Investment Advisory Contracts and
Management Fees - continued
Competitiveness of Management Fee and Total Expense Ratio. The Board considered the fund's management fee and total expense ratio compared to "mapped groups" of competitive funds and classes. Fidelity creates "mapped groups" by combining similar Lipper investment objective categories that have comparable management fee characteristics. Combining Lipper investment objective categories aids the Board's management fee and total expense ratio comparisons by broadening the competitive group used for comparison and by reducing the number of universes to which various Fidelity funds are compared.
Management Fee. The Board considered two proprietary management fee comparisons for the 12-month (or shorter) periods shown in the chart below. The group of Lipper funds used by the Board for management fee comparisons is referred to below as the "Total Mapped Group." The Total Mapped Group comparison focuses on a fund's standing relative to the total universe of comparable funds available to investors in terms of gross management fees before expense reimbursements or caps, and without giving effect to the fund's performance adjustment. "TMG %" represents the percentage of funds in the Total Mapped Group that had management fees that were lower than the fund's. For example, a TMG % of 16% means that 84% of the funds in the Total Mapped Group had higher management fees than the fund. The "Asset-Size Peer Group" (ASPG) comparison focuses on a fund's standing relative to non-Fidelity funds similar in size to the fund within the Total Mapped Group. The ASPG represents at least 15% of the funds in the Total Mapped Group with comparable asset size and management fee characteristics, subject to a minimum of 50 funds (or all funds in the Total Mapped Group if fewer than 50). Additional information, such as the ASPG quartile in which the fund's management fee ranked and the impact of the fund's performance adjustment, is also included in the chart and considered by the Board.
Annual Report
Fidelity Total International Equity Fund
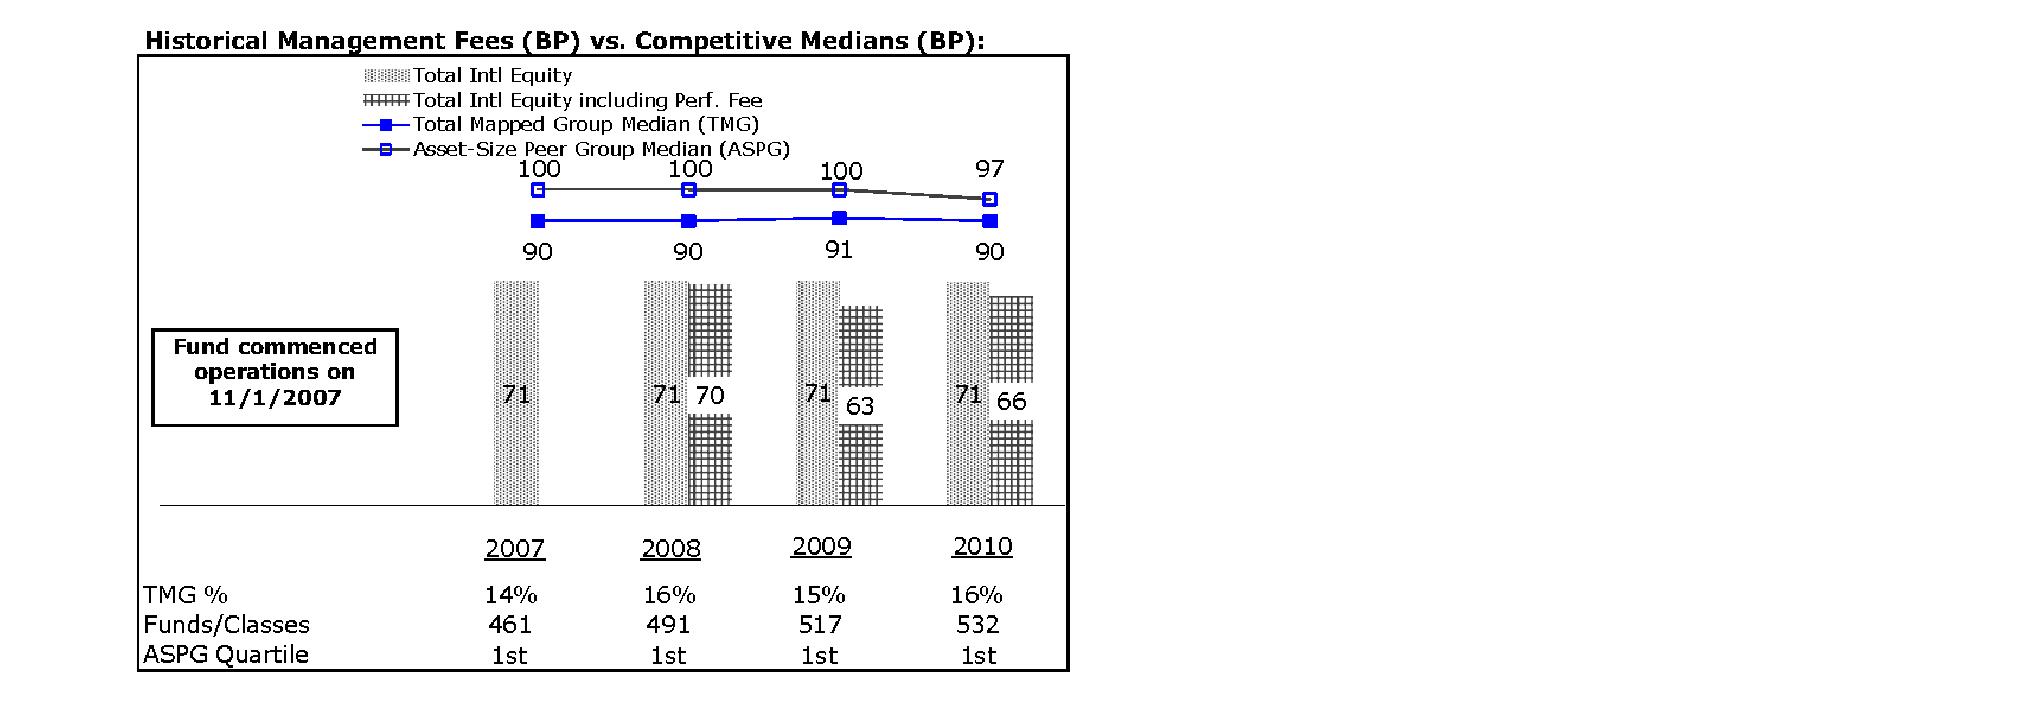
The Board noted that the fund's management fee ranked below the median of its Total Mapped Group and below the median of its ASPG for 2010. The Board also noted the effect of the fund's negative performance adjustment on the fund's management fee ranking. The Board noted that the performance adjustment for each year represents calculations for performance periods that differ from the periods shown in the performance charts above.
Based on its review, the Board concluded that the fund's management fee is fair and reasonable in light of the services that the fund receives and the other factors considered.
Total Expense Ratio. In its review of each class's total expense ratio, the Board considered the fund's management fee as well as other fund or class expenses, as applicable, such as transfer agent fees, pricing and bookkeeping fees, fund-paid 12b-1 fees, and custodial, legal, and audit fees. The Board also noted the effects of any waivers and reimbursements on fees and expenses, as well as the impact of the fund's performance adjustment. As part of its review, the Board also considered the current and historical total expense ratios of each class of the fund compared to competitive fund median expenses. Each class of the fund is compared to those funds and classes in the Total Mapped Group (used by the Board for management fee comparisons) that have a similar sales load structure.
The Board noted that the total expense ratio of each of Class A, Class B, and the retail class ranked below its competitive median for 2010, the total expense ratio of Class C ranked equal to its competitive median for 2010, and the total expense ratio of each of Class T and Institutional Class ranked above its competitive median for 2010. The Board considered that various factors, including 12b-1 fees, positive or negative performance adjustments, and relatively higher other expenses in the case of small fund size, can affect total expense ratios. The Board noted that the total expense ratio of Class T was above the competitive median primarily because of higher 12b-1 fees on Class T. Class T has a higher 12b-1 fee, but a lower front-end sales charge, than traditionally priced front-end sales charge classes. The Board noted that the fund offers multiple classes, each of which has a different sales load and 12b-1 fee structure, and that the multiple structures are intended to offer a range of pricing options for the intermediary market. The Board also noted that the total expense ratios of the classes vary primarily by the level of their 12b-1 fees, although differences in transfer agent fees may also cause expenses to vary from class to class.
Annual Report
Board Approval of Investment Advisory Contracts and
Management Fees - continued
Fees Charged to Other Fidelity Clients. The Board also considered Fidelity fee structures and other information with respect to clients of FMR and its affiliates, such as other mutual funds advised or subadvised by FMR or its affiliates, pension plan clients, and other institutional clients. In March 2010, the Board created an ad hoc joint committee with the board of other Fidelity funds (the Committee) to review and compare Fidelity's institutional investment advisory business with its business of providing services to the Fidelity funds, including the differences in services provided, fees charged, and costs incurred, as well as competition in their respective marketplaces.
Based on its review of total expense ratios and fees charged to other Fidelity clients, the Board concluded that the total expense ratio of each class of the fund was reasonable, although in some cases above the median of the universe presented for comparison, in light of the services that the fund and its shareholders receive and the other factors considered, including the findings of the Committee.
Costs of the Services and Profitability. The Board considered the revenues earned and the expenses incurred by Fidelity in conducting the business of developing, marketing, distributing, managing, administering and servicing the fund and its shareholders. The Board also considered the level of Fidelity's profits in respect of all the Fidelity funds.
On an annual basis, FMR presents to the Board Fidelity's profitability for the fund. Fidelity calculates the profitability for each fund, as well as aggregate profitability for groups of Fidelity funds and all Fidelity funds, using a series of detailed revenue and cost allocation methodologies which originate with the books and records of Fidelity on which Fidelity's audited financial statements are based. The Audit Committee of the Board reviews any significant changes from the prior year's methodologies.
PricewaterhouseCoopers LLP (PwC), independent registered public accounting firm and auditor to Fidelity and certain Fidelity funds, has been engaged annually by the Board as part of the Board's assessment of Fidelity's profitability analysis. PwC's engagement includes the review and assessment of Fidelity's methodologies used in determining the revenues and expenses attributable to Fidelity's mutual fund business, and completion of agreed-upon procedures surrounding the mathematical accuracy of fund profitability and its conformity to allocation methodologies. After considering PwC's reports issued under the engagement and information provided by Fidelity, the Board concluded that while other allocation methods may also be reasonable, Fidelity's profitability methodologies are reasonable in all material respects.
Annual Report
The Board also reviewed Fidelity's non-fund businesses and fall-out benefits related to the mutual fund business as well as cases where Fidelity's affiliates may benefit from or be related to the fund's business.
The Board considered the costs of the services provided by and the profits realized by Fidelity in connection with the operation of the fund and was satisfied that the profitability was not excessive in the circumstances.
Economies of Scale. The Board considered whether there have been economies of scale in respect of the management of the Fidelity funds, whether the Fidelity funds (including the fund) have appropriately benefited from any such economies of scale, and whether there is potential for realization of any further economies of scale. The Board considered the extent to which the fund will benefit from economies of scale through increased services to the fund, through waivers or reimbursements, or through fee or expense reductions. The Board also noted that in 2009, it and the board of other Fidelity funds created an ad hoc committee (the Economies of Scale Committee) to analyze whether FMR attains economies of scale in respect of the management and servicing of the Fidelity funds, whether the Fidelity funds have appropriately benefited from such economies of scale, and whether there is potential for realization of any further economies of scale.
The Board recognized that the fund's management contract incorporates a "group fee" structure, which provides for lower group fee rates as total fund assets under FMR's management increase, and for higher group fee rates as total fund assets under FMR's management decrease. FMR calculates the group fee rates based on a tiered asset "breakpoint" schedule that varies based on asset class. The Board considered that the group fee is designed to deliver the benefits of economies of scale to fund shareholders when total Fidelity fund assets increase, even if assets of any particular fund are unchanged or have declined, because some portion of Fidelity's costs are attributable to services provided to all Fidelity funds, and all funds benefit if those costs can be allocated among more assets. The Board concluded that, given the group fee structure, fund shareholders will benefit from lower management fees as assets under FMR's management increase at the fund complex level, regardless of whether Fidelity achieves any such economies of scale.
Annual Report
Board Approval of Investment Advisory Contracts and
Management Fees - continued
The Board concluded, taking into account the analysis of the Economies of Scale Committee, that any potential economies of scale are being appropriately shared between fund shareholders and Fidelity.
Additional Information Requested by the Board. In order to develop fully the factual basis for consideration of the Fidelity funds' Advisory Contracts, the Board requested and received additional information on certain topics, including (i) fund performance trends, actions to be taken by FMR to improve certain funds' overall performance, and Fidelity's long-term strategies for certain funds; (ii) portfolio manager changes that have occurred during the past year and length of portfolio manager tenure for different categories of funds over time; (iii) Fidelity's compensation structure for portfolio managers and other key personnel and strategies for attracting and retaining non-investment personnel; (iv) the amount of the investment that each portfolio manager has made in the Fidelity fund(s) that he or she manages; (v) historical trends in Fidelity's realization of fall-out benefits; (vi) Fidelity's group fee structures and the rationale for the individual fee rates of certain funds; (vii) fund profitability methodology and the impact of certain factors on fund profitability results; (viii) trends regarding industry use of performance fee structures and Fidelity's compliance practices with respect to performance adjustment calculations; (ix) the fee structures in place for certain other Fidelity clients; and (x) explanations regarding the relative total expense ratios of certain funds and classes, total expense competitive trends, and actions that might be taken by FMR to reduce total expense ratios for certain funds and classes.
Based on its evaluation of all of the conclusions noted above, and after considering all factors it believed relevant, the Board ultimately concluded that the advisory fee structures are fair and reasonable, and that the fund's Advisory Contracts should be renewed.
Annual Report
Investment Adviser
Fidelity Management & Research Company
Boston, MA
Investment Sub-Advisers
FMR Co., Inc.
Fidelity Management & Research
(U.K.) Inc.
Fidelity Management & Research
(Hong Kong) Limited
Fidelity Management & Research
(Japan) Inc.
FIL Investment Advisors
FIL Investments (Japan) Limited
FIL Investment Advisors (U.K.) Ltd.
General Distributor
Fidelity Distributors Corporation
Boston, MA
Transfer and Service Agent
Fidelity Investments Institutional
Operations Company, Inc.
Boston, MA
Fidelity Service Company, Inc.
Boston, MA
Custodian
State Street Bank and Trust Company
Quincy, MA
The Fidelity Telephone Connection
Mutual Fund 24-Hour Service
Exchanges/Redemptions
and Account Assistance 1-800-544-6666
Product Information 1-800-544-8888
Retirement Accounts 1-800-544-4774
(8 a.m. - 9 p.m.)
TDD Service 1-800-544-0118
for the deaf and hearing impaired
(9 a.m. - 9 p.m. Eastern time)
Fidelity Automated Service
Telephone (FAST®) (automated service graphic) 1-800-544-5555
(automated service graphic) Automated line for quickest service
(Fidelity Logo)
Corporate Headquarters
82 Devonshire St., Boston, MA 02109
www.fidelity.com
TIE-UANN-1211
1.912357.101
(Fidelity Logo)
Fidelity Advisor®
Total International Equity
Fund - Class A, Class T, Class B
and Class C
Annual Report
October 31, 2011
(Fidelity Cover Art)
Class A, Class T,
Class B, and Class C are
classes of Fidelity® Total
International Equity Fund
Contents
Chairman's Message | (Click Here) | The Chairman's message to shareholders. |
Performance | (Click Here) | How the fund has done over time. |
Management's Discussion of Fund Performance | (Click Here) | The Portfolio Manager's review of fund performance and strategy. |
Shareholder Expense Example | (Click Here) | An example of shareholder expenses. |
Investment Changes | (Click Here) | A summary of major shifts in the fund's investments over the past six months. |
Investments | (Click Here) | A complete list of the fund's investments with their market values. |
Financial Statements | (Click Here) | Statements of assets and liabilities, operations, and changes in net assets, as well as financial highlights. |
Notes | (Click Here) | Notes to the financial statements. |
Report of Independent Registered Public Accounting Firm | (Click Here) | |
Trustees and Officers | (Click Here) | |
Distributions | (Click Here) | |
Board Approval of Investment Advisory Contracts and Management Fees | (Click Here) | |
To view a fund's proxy voting guidelines and proxy voting record for the 12-month period ended June 30, visit http://www.fidelity.com/proxyvotingresults or visit the Securities and Exchange Commission's (SEC) web site at http://www.sec.gov. You may also call 1-877-208-0098 to request a free copy of the proxy voting guidelines.
Standard & Poor's, S&P and S&P 500 are registered service marks of The McGraw-Hill Companies, Inc. and have been licensed for use by Fidelity Distributors Corporation.
Other third party marks appearing herein are the property of their respective owners.
All other marks appearing herein are registered or unregistered trademarks or service marks of FMR LLC or an affiliated company.
Annual Report
This report and the financial statements contained herein are submitted for the general information of the shareholders of the fund. This report is not authorized for distribution to prospective investors in the fund unless preceded or accompanied by an effective prospectus.
A fund files its complete schedule of portfolio holdings with the SEC for the first and third quarters of each fiscal year on Form N-Q. Forms N-Q are available on the SEC's web site at http://www.sec.gov. A fund's Forms N-Q may be reviewed and copied at the SEC's Public Reference Room in Washington, DC. Information regarding the operation of the SEC's Public Reference Room may be obtained by calling 1-800-SEC-0330. For a complete list of a fund's portfolio holdings, view the most recent holdings listing, semiannual report, or annual report on Fidelity's web site at http://www.fidelity.com, http://www.advisor.fidelity.com, or http://www.401k.com, as applicable.
NOT FDIC INSURED • MAY LOSE VALUE • NO BANK GUARANTEE
Neither the fund nor Fidelity Distributors Corporation is a bank.
Annual Report
(Acting Chairman's Photograph)
Dear Shareholder:
Global equity markets began the fourth quarter on a strong note, sharply reversing course in October amid strong corporate earnings, better-than-expected economic news and the promise of a resolution to the sovereign debt crisis in Europe. The mini rally followed a third quarter marked by a significant downturn in July and August, which heightened investor anxiety and set off a wave of volatility that hampered most major asset classes through the end of September. Financial markets are difficult to predict, of course, but you can help put the odds in your favor by following these time-tested investment principles.
One of the basic tenets is to invest according to your time horizon. For long-term investors, riding out the markets' inevitable ups and downs has proven much more effective than making decisions based on short-term developments. If your goal is approaching, you can also benefit from patience and restraint, rather than attempting to time the market. No matter your time horizon, missing only a few of the markets' best days can significantly diminish returns. Patience also affords the benefits of compounding - earning interest on additional income or reinvested dividends and capital gains. While staying the course doesn't eliminate risk, it can considerably lessen the negative impact of short-term downturns.
Asset allocation is another principle to manage risk. As you spread your portfolio among the asset classes, be sure to consider your time horizon, risk tolerance and investment objectives. Younger investors may be better served by emphasizing equities, which historically have been the best-performing asset class over time. Investors who are nearing a specific goal, such as retirement or sending a child to college, may choose to favor bonds and other investments that have tended to be more stable. Studies indicate that asset allocation is the single most important determinant of a portfolio's long-term success. After deciding on a suitable allocation strategy, make sure your portfolio is adequately diversified, with exposure to stocks of small-, mid- and large-cap companies in a range of sectors, for example. And today, more than ever, geographic diversification should be taken into account.
Lastly, investing a certain amount of money on a regular basis - a principle known as dollar-cost averaging - can help lower the average cost of your purchases, while also giving you the discipline to avoid selling weak performers just prior to an upswing, or chasing a hot performer just before a correction.
We invite you to learn more by visiting us on the Internet, dropping by one of our Investor Centers or calling us by phone. It is our privilege to provide the resources you need to choose investments that are right for you.
Sincerely,
(Acting Chairman's Signature)
James C. Curvey
Acting Chairman
Annual Report
Average annual total return reflects the change in the value of an investment, assuming reinvestment of the class' distributions from dividend income and capital gains (the profits earned upon the sale of securities that have grown in value, if any) and assuming a constant rate of performance each year. The $10,000 table and the fund's returns do not reflect the deduction of taxes that a shareholder would pay on fund distributions or the redemption of fund shares. During periods of reimbursement by Fidelity, a fund's total return will be greater than it would be had the reimbursement not occurred. How a fund did yesterday is no guarantee of how it will do tomorrow.
Average Annual Total Returns
Periods ended October 31, 2011 | Past 1
year | Life of
fund A |
Class A (incl. 5.75% sales charge) | -13.32% | -9.85% |
Class T (incl. 3.50% sales charge) | -11.30% | -9.52% |
Class B (incl. contingent deferred sales charge) B | -13.19% | -9.84% |
Class C (incl. contingent deferred sales charge) C | -9.62% | -9.19% |
A From November 1, 2007.
B Class B shares' contingent deferred sales charge included in the past one year and life of fund total return figures are 5% and 3%, respectively.
C Class C shares' contingent deferred sales charge included in the past one year and life of fund total return figures are 1% and 0%, respectively.
Annual Report
$10,000 Over Life of Fund
Let's say hypothetically that $10,000 was invested in Fidelity Advisor® Total International Equity Fund - Class A on November 1, 2007, when the fund started, and the current 5.75% sales charge was paid. The chart shows how the value of your investment would have changed, and also shows how the MSCI® ACWI® (All Country World Index) ex USA Index performed over the same period.
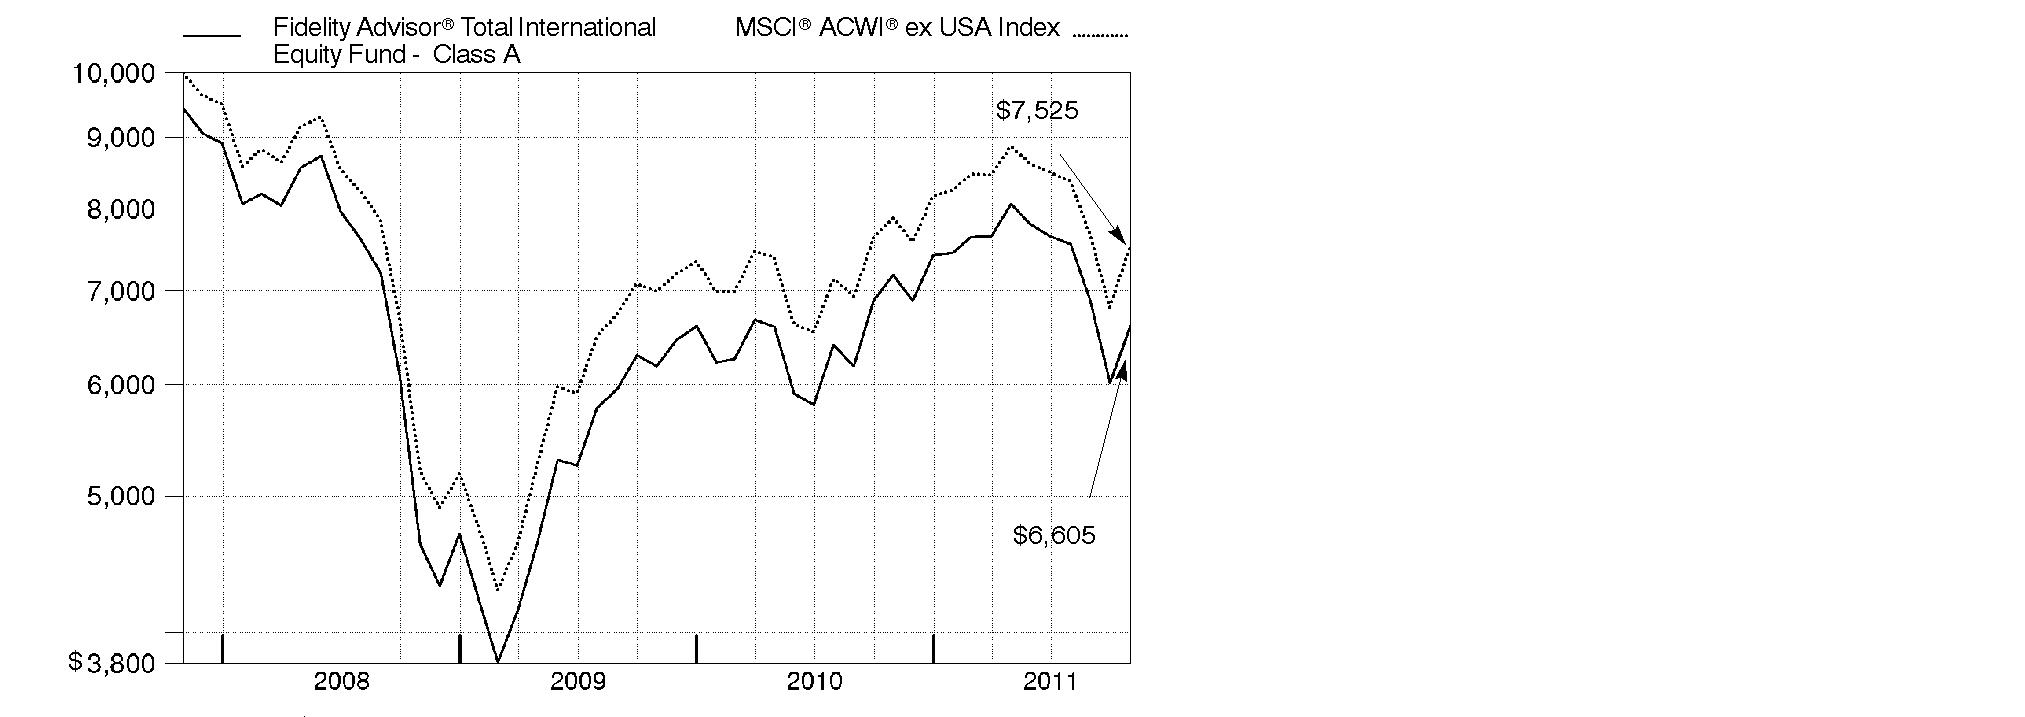
Annual Report
Market Recap: International equities were rocked by a number of headline events during the year ending October 31, 2011. Stocks posted a solid advance for the first half of the period, despite concern about the sovereign debt crisis in Europe, a devastating earthquake and tsunami in Japan, and political upheaval in the Middle East and North Africa. Sentiment turned decidedly negative in the second half, however, as fresh worries about Europe, inflation in China and a dimmed outlook for global growth caused foreign markets to suffer declines that intensified in August and September. October brought with it yet another dramatic swing, as eurozone policymakers appeared near a resolution to the debt debacle and buyers stormed back onto the scene in search of bargains. Still, those gains - along with favorable currency fluctuations overall - weren't enough to offset prior losses, and the MSCI® ACWI® (All Country World Index) ex USA Index finished the period down 4.56%. Within the MSCI index, Europe and emerging markets suffered the biggest declines, with many countries in these areas sustaining steep losses. By contrast, Japan showed resilience in the wake of its natural disasters, falling only 2%. Australia (+4%), Switzerland (+3%), the U.K. (+2%) and Canada, which produced a nominal return, were among the few major benchmark components to break into positive territory.
Comments from Jed Weiss, Co-Portfolio Manager of Fidelity Advisor® Total International Equity Fund: For the year, the fund's Class A, Class T, Class B and Class C shares returned -8.03%, -8.08%, -8.66% and -8.72%, respectively (excluding sales charges), lagging the MSCI index. Security selection in the U.K. and France detracted the most, as did positioning in Canada. An overweighting in the U.S. also hurt, but good picks there more than compensated. Selection in Japan and Finland also helped. On a sector basis, our choices in financials detracted, including various European firms - Societe Generale (France), Turkiye Garanti Bankasi (Turkey), Intesa Sanpaolo (Italy) and AXA (France). Stock picking in consumer staples and industrials hurt, as did our energy positioning. Our stance in information technology and consumer discretionary, however, was positive. Other individual detractors included underweighting U.K.-based British American Tobacco and Canadian energy firm Niko Resources. On the positive side, not owning weak-performing benchmark component Tokyo Electric Power helped, as did an out-of-benchmark stake in U.S. credit card processor MasterCard and an overweighting in French drug maker Roche Holding. Some of the stocks mentioned in this report were not owned at period end.
The views expressed above reflect those of the portfolio manager(s) only through the end of the period as stated on the cover of this report and do not necessarily represent the views of Fidelity or any other person in the Fidelity organization. Any such views are subject to change at any time based upon market or other conditions and Fidelity disclaims any responsibility to update such views. These views may not be relied on as investment advice and, because investment decisions for a Fidelity fund are based on numerous factors, may not be relied on as an indication of trading intent on behalf of any Fidelity fund.
Annual Report
Shareholder Expense Example
As a shareholder of the Fund, you incur two types of costs: (1) transaction costs, including sales charges (loads) on purchase payments or redemption proceeds, redemption fees, and (2) ongoing costs, including management fees, distribution and/or service (12b-1) fees and other Fund expenses. This Example is intended to help you understand your ongoing costs (in dollars) of investing in the Fund and to compare these costs with the ongoing costs of investing in other mutual funds.
The Example is based on an investment of $1,000 invested at the beginning of the period and held for the entire period (May 1, 2011 to October 31, 2011).
Actual Expenses
The first line of the accompanying table for each class of the Fund provides information about actual account values and actual expenses. You may use the information in this line, together with the amount you invested, to estimate the expenses that you paid over the period. Simply divide your account value by $1,000.00 (for example, an $8,600 account value divided by $1,000.00 = 8.6), then multiply the result by the number in the first line for a class of the Fund under the heading entitled "Expenses Paid During Period" to estimate the expenses you paid on your account during this period. A small balance maintenance fee of $12.00 that is charged once a year may apply for certain accounts with a value of less than $2,000. This fee is not included in the table below. If it was, the estimate of expenses you paid during the period would be higher, and your ending account value lower, by this amount. In addition, the Fund, as a shareholder in the underlying Fidelity Central Funds, will indirectly bear its pro-rata share of the fees and expenses incurred by the underlying Fidelity Central Funds. These fees and expenses are not included in the Fund's annualized expense ratio used to calculate the expense estimate in the table below.
Hypothetical Example for Comparison Purposes
The second line of the accompanying table for each class of the Fund provides information about hypothetical account values and hypothetical expenses based on a Class' actual expense ratio and an assumed rate of return of 5% per year before expenses, which is not the Class' actual return. The hypothetical account values and expenses may not be used to estimate the actual ending account balance or expenses you paid for the period. You may use this information to compare the ongoing costs of investing in the Fund and other funds. To do so, compare this 5% hypothetical example with the 5% hypothetical examples that appear in the shareholder reports of the other funds. A small balance maintenance fee of $12.00 that is charged once a year may apply for certain accounts with a value of less than $2,000. This fee is not included in the table below. If it was, the estimate of expenses you paid during the period would be higher, and your ending account value lower, by this amount. In addition, the Fund, as a shareholder in the underlying Fidelity Central Funds, will indirectly bear its pro-rata share of the fees and expenses incurred by the underlying Fidelity Central Funds. These fees and expenses are not included in the Fund's annualized expense ratio used to calculate the expense estimate in the table below.
Please note that the expenses shown in the table are meant to highlight your ongoing costs only and do not reflect any transaction costs. Therefore, the second line of the table is useful in comparing ongoing costs only, and will not help you determine the relative total costs of owning different funds. In addition, if these transactional costs were included, your costs would have been higher.
Annual Report
| Annualized
Expense Ratio | Beginning
Account Value
May 1, 2011 | Ending
Account Value
October 31, 2011 | Expenses Paid
During Period*
May 1, 2011 to October 31, 2011 |
Class A | 1.45% | | | |
Actual | | $ 1,000.00 | $ 819.40 | $ 6.65 |
Hypothetical A | | $ 1,000.00 | $ 1,017.90 | $ 7.38 |
Class T | 1.70% | | | |
Actual | | $ 1,000.00 | $ 819.70 | $ 7.80 |
Hypothetical A | | $ 1,000.00 | $ 1,016.64 | $ 8.64 |
Class B | 2.20% | | | |
Actual | | $ 1,000.00 | $ 816.60 | $ 10.07 |
Hypothetical A | | $ 1,000.00 | $ 1,014.12 | $ 11.17 |
Class C | 2.20% | | | |
Actual | | $ 1,000.00 | $ 816.40 | $ 10.07 |
Hypothetical A | | $ 1,000.00 | $ 1,014.12 | $ 11.17 |
Total International Equity | 1.20% | | | |
Actual | | $ 1,000.00 | $ 821.90 | $ 5.51 |
Hypothetical A | | $ 1,000.00 | $ 1,019.16 | $ 6.11 |
Institutional Class | 1.20% | | | |
Actual | | $ 1,000.00 | $ 821.40 | $ 5.51 |
Hypothetical A | | $ 1,000.00 | $ 1,019.16 | $ 6.11 |
A 5% return per year before expenses
* Expenses are equal to each Class' annualized expense ratio, multiplied by the average account value over the period, multiplied by 184/365 (to reflect the one-half year period).
Annual Report
Investment Changes (Unaudited)
Geographic Diversification (% of fund's net assets) |
As of October 31, 2011 |
| United Kingdom 18.1% | |
| Japan 11.7% | |
| United States of America 9.0% | |
| Switzerland 6.6% | |
| Germany 5.9% | |
| France 4.9% | |
| Australia 4.3% | |
| Korea (South) 4.2% | |
| Brazil 4.1% | |
| Other 31.2% | |

Percentages are adjusted for the effect of futures contracts, if applicable. |
As of April 30, 2011 |
| United Kingdom 16.4% | |
| Japan 10.3% | |
| United States of America 7.4% | |
| Switzerland 5.6% | |
| France 5.3% | |
| Germany 5.2% | |
| Brazil 4.4% | |
| Korea (South) 3.6% | |
| Spain 3.0% | |
| Other 38.8% | |

Percentages are adjusted for the effect of futures contracts, if applicable. |
Asset Allocation |
| % of fund's
net assets | % of fund's net assets
6 months ago |
Stocks and Investment Companies | 96.7 | 97.6 |
Short-Term Investments and Net Other Assets | 3.3 | 2.4 |
Top Ten Stocks as of October 31, 2011 |
| % of fund's
net assets | % of fund's net assets
6 months ago |
Nestle SA (Switzerland, Food Products) | 2.7 | 1.8 |
Royal Dutch Shell PLC Class A sponsored ADR (United Kingdom, Oil, Gas & Consumable Fuels) | 2.2 | 1.7 |
Roche Holding AG (participation certificate) (Switzerland, Pharmaceuticals) | 1.8 | 1.3 |
GlaxoSmithKline PLC sponsored ADR (United Kingdom, Pharmaceuticals) | 1.6 | 0.9 |
BHP Billiton PLC ADR (United Kingdom, Metals & Mining) | 1.4 | 1.7 |
Vodafone Group PLC sponsored ADR (United Kingdom, Wireless Telecommunication Services) | 1.3 | 0.9 |
Anheuser-Busch InBev SA NV (Belgium, Beverages) | 1.1 | 1.1 |
Sanofi-aventis (France, Pharmaceuticals) | 1.1 | 0.0 |
Commonwealth Bank of Australia (Australia, Commercial Banks) | 1.1 | 0.1 |
BP PLC sponsored ADR (United Kingdom, Oil, Gas & Consumable Fuels) | 1.1 | 1.0 |
| 15.4 | |
Market Sectors as of October 31, 2011 |
| % of fund's
net assets | % of fund's net assets
6 months ago |
Financials | 18.2 | 23.8 |
Consumer Staples | 12.9 | 8.8 |
Materials | 10.6 | 13.5 |
Energy | 10.0 | 10.0 |
Consumer Discretionary | 9.9 | 10.8 |
Industrials | 9.9 | 11.3 |
Health Care | 8.0 | 5.1 |
Information Technology | 6.8 | 7.7 |
Telecommunication Services | 6.7 | 3.7 |
Utilities | 3.7 | 2.6 |
Annual Report
Investments October 31, 2011
Showing Percentage of Net Assets
Common Stocks - 96.5% |
| Shares | | Value |
Australia - 4.3% |
Australia & New Zealand Banking Group Ltd. | 43,841 | | $ 990,744 |
Coca-Cola Amatil Ltd. | 20,575 | | 265,625 |
Commonwealth Bank of Australia | 28,630 | | 1,470,865 |
CSL Ltd. | 20,431 | | 615,420 |
Macquarie Group Ltd. | 9,104 | | 234,416 |
MAp Group unit | 66,645 | | 237,831 |
Newcrest Mining Ltd. | 12,208 | | 431,494 |
Newcrest Mining Ltd. sponsored ADR | 6,284 | | 220,883 |
OZ Minerals Ltd. | 19,949 | | 239,586 |
QBE Insurance Group Ltd. | 9,595 | | 147,709 |
Ramsay Health Care Ltd. | 619 | | 12,169 |
Telstra Corp. Ltd. | 160,903 | | 522,492 |
Woolworths Ltd. | 8,510 | | 212,752 |
WorleyParsons Ltd. | 14,070 | | 408,417 |
TOTAL AUSTRALIA | | 6,010,403 |
Austria - 0.4% |
Andritz AG | 4,229 | | 374,736 |
Zumtobel AG | 8,900 | | 185,613 |
TOTAL AUSTRIA | | 560,349 |
Bailiwick of Guernsey - 0.2% |
Resolution Ltd. | 66,466 | | 293,949 |
Bailiwick of Jersey - 0.9% |
Informa PLC | 27,581 | | 160,745 |
Randgold Resources Ltd. sponsored ADR | 6,860 | | 751,650 |
Wolseley PLC | 9,363 | | 270,735 |
TOTAL BAILIWICK OF JERSEY | | 1,183,130 |
Belgium - 1.4% |
Anheuser-Busch InBev SA NV | 27,471 | | 1,523,656 |
Gimv NV | 520 | | 26,590 |
Umicore SA | 8,973 | | 386,378 |
TOTAL BELGIUM | | 1,936,624 |
Bermuda - 0.9% |
Aquarius Platinum Ltd. (Australia) | 6,424 | | 18,847 |
Cheung Kong Infrastructure Holdings Ltd. | 27,000 | | 144,631 |
CNPC (Hong Kong) Ltd. | 92,000 | | 128,872 |
Great Eagle Holdings Ltd. | 30,089 | | 66,826 |
Lazard Ltd. Class A | 7,950 | | 217,353 |
Li & Fung Ltd. | 212,000 | | 408,565 |
Common Stocks - continued |
| Shares | | Value |
Bermuda - continued |
NWS Holdings Ltd. | 48,000 | | $ 72,786 |
Trinity Ltd. | 214,000 | | 193,961 |
TOTAL BERMUDA | | 1,251,841 |
Brazil - 4.1% |
Arezzo Industria e Comercio SA | 12,100 | | 159,952 |
Banco ABC Brasil SA | 3,900 | | 26,005 |
Banco Bradesco SA (PN) sponsored ADR | 31,200 | | 567,840 |
Banco do Estado do Rio Grande do Sul SA | 15,600 | | 164,430 |
Banco Pine SA | 2,300 | | 15,282 |
BM&F Bovespa SA | 45,900 | | 273,978 |
BR Malls Participacoes SA | 26,900 | | 290,586 |
Braskem SA Class A sponsored ADR | 18,280 | | 329,771 |
Cia.Hering SA | 600 | | 13,400 |
Companhia de Bebidas das Americas (AmBev) (PN) sponsored ADR | 9,800 | | 330,456 |
Companhia de Saneamento Basico do Estado de Sao Paulo (SABESP) | 6,900 | | 189,256 |
Companhia de Saneamento de Minas Gerais | 2,400 | | 45,059 |
Eletropaulo Metropolitana SA (PN-B) | 8,300 | | 148,870 |
Embraer SA sponsored ADR | 4,200 | | 116,844 |
Gol Linhas Aereas Inteligentes SA sponsored ADR | 15,900 | | 127,518 |
Iguatemi Empresa de Shopping Centers SA | 7,700 | | 149,184 |
Itau Unibanco Banco Multiplo SA sponsored ADR | 11,970 | | 228,866 |
Klabin SA (PN) (non-vtg.) | 7,500 | | 27,603 |
Localiza Rent A Car SA | 3,200 | | 48,358 |
Marcopolo SA (PN) | 13,300 | | 58,863 |
Mills Estruturas e Servicos de Engenharia SA | 3,300 | | 32,958 |
Multiplan Empreendimentos Imobiliarios SA | 11,800 | | 238,584 |
Multiplus SA | 5,100 | | 86,129 |
Odontoprev SA | 1,900 | | 29,896 |
OGX Petroleo e Gas Participacoes SA (a) | 32,800 | | 271,232 |
Petroleo Brasileiro SA - Petrobras (PN) sponsored ADR | 24,300 | | 614,547 |
Qualicorp SA | 5,000 | | 45,714 |
Restoque Comercio e Confeccoes de Roupas SA | 200 | | 3,145 |
T4F Entretenimento SA | 1,800 | | 12,579 |
Tegma Gestao Logistica | 7,900 | | 102,591 |
Telefonica Brasil SA sponsored ADR (a) | 4,300 | | 124,786 |
TIM Participacoes SA sponsored ADR | 9,906 | | 257,952 |
Totvs SA | 800 | | 13,277 |
Common Stocks - continued |
| Shares | | Value |
Brazil - continued |
Ultrapar Participacoes SA | 8,300 | | $ 147,904 |
Vale SA (PN-A) sponsored ADR | 16,700 | | 394,120 |
TOTAL BRAZIL | | 5,687,535 |
British Virgin Islands - 0.1% |
Mail.ru Group Ltd.: | | | |
GDR (a)(e) | 3,500 | | 120,575 |
GDR (Reg. S) | 100 | | 3,445 |
TOTAL BRITISH VIRGIN ISLANDS | | 124,020 |
Canada - 1.5% |
Agnico-Eagle Mines Ltd. (Canada) | 6,690 | | 290,190 |
Eldorado Gold Corp. | 12,300 | | 231,107 |
Fairfax Financial Holdings Ltd. (sub. vtg.) | 865 | | 361,558 |
First Quantum Minerals Ltd. | 7,200 | | 151,028 |
Goldcorp, Inc. | 3,800 | | 184,882 |
Niko Resources Ltd. | 6,070 | | 333,870 |
Open Text Corp. (a) | 4,750 | | 290,713 |
Pan American Silver Corp. | 4,300 | | 120,228 |
Petrominerales Ltd. | 4,725 | | 124,660 |
Quadra FNX Mining Ltd. (a) | 1,100 | | 12,690 |
TAG Oil Ltd. (a) | 2,000 | | 12,399 |
Tuscany International Drilling, Inc. (a) | 16,400 | | 11,187 |
Tuscany International Drilling, Inc. (a)(e) | 1,900 | | 1,296 |
TOTAL CANADA | | 2,125,808 |
Cayman Islands - 1.3% |
Belle International Holdings Ltd. | 44,000 | | 86,294 |
Central China Real Estate Ltd. | 111,050 | | 25,077 |
China Lilang Ltd. | 20,000 | | 21,053 |
China Shanghui Cement Group Ltd. | 195,000 | | 149,365 |
Country Garden Holdings Co. Ltd. | 290,000 | | 114,822 |
Eurasia Drilling Co. Ltd. GDR (Reg. S) | 6,400 | | 151,040 |
EVA Precision Industrial Holdings Ltd. | 298,000 | | 76,959 |
Haitian International Holdings Ltd. | 57,000 | | 50,644 |
Intime Department Store Group Co. Ltd. | 9,000 | | 12,916 |
NVC Lighting Holdings Ltd. | 415,000 | | 180,190 |
Sands China Ltd. (a) | 85,000 | | 255,441 |
Shenguan Holdings Group Ltd. | 166,000 | | 89,184 |
Silver Base Group Holdings Ltd. | 81,000 | | 86,264 |
SOHO China Ltd. | 153,000 | | 109,084 |
Common Stocks - continued |
| Shares | | Value |
Cayman Islands - continued |
Vantage Drilling Co. (a) | 8,900 | | $ 12,104 |
Wynn Macau Ltd. | 113,000 | | 316,612 |
TOTAL CAYMAN ISLANDS | | 1,737,049 |
Chile - 0.4% |
Banco Santander Chile sponsored ADR | 2,900 | | 236,872 |
CFR Pharmaceuticals SA | 488,397 | | 115,632 |
Empresa Nacional de Telecomunicaciones SA (ENTEL) | 8,423 | | 166,758 |
TOTAL CHILE | | 519,262 |
China - 1.8% |
Baidu.com, Inc. sponsored ADR (a) | 3,115 | | 436,661 |
China Communications Construction Co. Ltd. (H Shares) | 187,000 | | 141,046 |
China Communications Services Corp. Ltd. (H Shares) | 270,000 | | 124,520 |
China Construction Bank Corp. (H Shares) | 587,000 | | 431,290 |
China Minsheng Banking Corp. Ltd. (H Shares) | 274,000 | | 223,206 |
China National Building Materials Co. Ltd. (H Shares) | 90,000 | | 115,282 |
China Pacific Insurance Group Co. Ltd. (H Shares) | 26,600 | | 81,627 |
China Petroleum & Chemical Corp.: | | | |
(H Shares) | 152,000 | | 143,751 |
sponsored ADR (H Shares) | 1,200 | | 113,280 |
China Southern Airlines Ltd. (H Shares) (a) | 200,000 | | 111,612 |
Great Wall Motor Co. Ltd. (H Shares) | 88,000 | | 119,496 |
Harbin Power Equipment Co. Ltd. (H Shares) | 142,000 | | 143,099 |
Industrial & Commercial Bank of China Ltd. (H Shares) | 235,285 | | 146,927 |
SINA Corp. (a) | 900 | | 73,161 |
Sinopec Shanghai Petrochemical Co. Ltd. (H Shares) | 216,000 | | 79,304 |
Yantai Changyu Pioneer Wine Co. (B Shares) | 6,290 | | 70,769 |
TOTAL CHINA | | 2,555,031 |
Czech Republic - 0.4% |
Ceske Energeticke Zavody AS | 7,500 | | 317,178 |
Komercni Banka AS | 600 | | 115,720 |
Philip Morris CR A/S | 100 | | 65,661 |
TOTAL CZECH REPUBLIC | | 498,559 |
Denmark - 1.2% |
Novo Nordisk A/S Series B sponsored ADR | 11,100 | | 1,179,930 |
William Demant Holding A/S (a) | 5,310 | | 423,674 |
TOTAL DENMARK | | 1,603,604 |
Egypt - 0.1% |
Commercial International Bank Ltd. sponsored GDR | 30,509 | | 134,789 |
Common Stocks - continued |
| Shares | | Value |
Finland - 0.7% |
Metso Corp. | 4,520 | | $ 176,022 |
Nokian Tyres PLC | 11,302 | | 415,264 |
Outotec Oyj | 7,812 | | 365,196 |
TOTAL FINLAND | | 956,482 |
France - 4.9% |
Alstom SA | 12,669 | | 475,134 |
Atos Origin SA | 4,113 | | 199,333 |
Audika SA | 1,000 | | 22,115 |
BNP Paribas SA | 14,551 | | 661,505 |
Casino Guichard Perrachon et Compagnie | 2,608 | | 245,138 |
Compagnie de St. Gobain | 4,179 | | 194,840 |
Danone | 12,580 | | 875,696 |
Euler Hermes SA | 1,414 | | 102,460 |
GDF Suez | 16,600 | | 471,286 |
Laurent-Perrier Group | 359 | | 37,013 |
Pernod-Ricard SA | 2,800 | | 261,557 |
PPR SA | 2,700 | | 421,854 |
Remy Cointreau SA | 3,752 | | 308,428 |
Safran SA | 17,914 | | 586,807 |
Saft Groupe SA | 1,329 | | 40,462 |
Sanofi-aventis | 20,892 | | 1,494,810 |
Unibail-Rodamco | 1,421 | | 284,162 |
Vetoquinol SA | 400 | | 13,186 |
Virbac SA | 190 | | 32,889 |
TOTAL FRANCE | | 6,728,675 |
Georgia - 0.0% |
Bank of Georgia GDR (Reg. S) | 3,800 | | 48,450 |
Germany - 5.8% |
Allianz AG | 7,752 | | 871,220 |
Allianz AG sponsored ADR | 13,600 | | 152,320 |
alstria office REIT-AG | 12,500 | | 160,705 |
BASF AG | 13,415 | | 987,473 |
Bayer AG | 10,037 | | 643,047 |
Bayerische Motoren Werke AG (BMW) | 2,605 | | 212,915 |
Bilfinger Berger AG | 512 | | 45,900 |
CompuGROUP Holding AG | 946 | | 12,175 |
CTS Eventim AG | 1,974 | | 65,359 |
Daimler AG (United States) | 9,900 | | 503,316 |
Deutsche Telekom AG | 37,500 | | 477,134 |
E.ON AG | 23,710 | | 574,543 |
Common Stocks - continued |
| Shares | | Value |
Germany - continued |
Fielmann AG | 479 | | $ 50,452 |
HeidelbergCement AG | 4,700 | | 214,513 |
Linde AG | 7,449 | | 1,184,982 |
MAN SE | 1,872 | | 166,035 |
Metro AG | 3,800 | | 177,170 |
Siemens AG | 4,900 | | 513,697 |
Siemens AG sponsored ADR | 8,100 | | 850,257 |
Software AG (Bearer) | 759 | | 31,532 |
Volkswagen AG | 1,217 | | 191,663 |
TOTAL GERMANY | | 8,086,408 |
Hong Kong - 1.6% |
China Insurance International Holdings Co. Ltd. (a) | 60,600 | | 131,415 |
China Mobile (Hong Kong) Ltd. | 67,500 | | 641,543 |
China Power International Development Ltd. | 607,000 | | 128,441 |
CNOOC Ltd. | 223,000 | | 421,550 |
CNOOC Ltd. sponsored ADR | 500 | | 94,305 |
Dah Chong Hong Holdings Ltd. | 47,000 | | 57,078 |
Henderson Land Development Co. Ltd. | 6,000 | | 32,796 |
Hong Kong Exchanges and Clearing Ltd. | 27,100 | | 459,396 |
Lenovo Group Ltd. | 48,000 | | 32,271 |
Power Assets Holdings Ltd. | 35,000 | | 265,958 |
TOTAL HONG KONG | | 2,264,753 |
Hungary - 0.0% |
Magyar Telekom PLC | 11,000 | | 25,599 |
India - 1.0% |
Apollo Tyres Ltd. | 8,934 | | 10,477 |
Bank of Baroda | 11,133 | | 175,541 |
Bharti Airtel Ltd. | 54,055 | | 432,911 |
Housing Development Finance Corp. Ltd. | 18,488 | | 260,178 |
Indian Overseas Bank | 43,467 | | 91,094 |
Jain Irrigation Systems Ltd. | 3,152 | | 8,031 |
Jyothy Laboratories Ltd. | 6,140 | | 17,973 |
Punjab National Bank | 2,820 | | 57,448 |
Tata Consultancy Services Ltd. | 9,254 | | 210,508 |
Tata Steel Ltd. | 6,075 | | 59,823 |
Ultratech Cement Ltd. | 4,746 | | 112,057 |
TOTAL INDIA | | 1,436,041 |
Indonesia - 1.1% |
PT Astra International Tbk | 40,000 | | 308,430 |
Common Stocks - continued |
| Shares | | Value |
Indonesia - continued |
PT Bank Negara Indonesia (Persero) Tbk | 281,000 | | $ 125,933 |
PT Bank Rakyat Indonesia Tbk | 439,000 | | 330,061 |
PT Bank Tabungan Negara Tbk | 425,000 | | 68,412 |
PT Bumi Serpong Damai Tbk | 627,900 | | 64,613 |
PT Ciputra Development Tbk | 779,000 | | 42,712 |
PT Gadjah Tunggal Tbk | 146,500 | | 44,799 |
PT Indofood Sukses Makmur Tbk | 213,000 | | 126,437 |
PT Indosat Tbk | 207,000 | | 123,978 |
PT Summarecon Agung Tbk | 260,000 | | 34,025 |
PT Tower Bersama Infrastructure Tbk | 318,000 | | 74,009 |
PT XL Axiata Tbk | 207,000 | | 115,773 |
TOTAL INDONESIA | | 1,459,182 |
Ireland - 0.7% |
CRH PLC sponsored ADR (d) | 33,204 | | 611,286 |
James Hardie Industries NV sponsored ADR (a) | 11,165 | | 362,081 |
TOTAL IRELAND | | 973,367 |
Israel - 0.2% |
Azrieli Group | 5,882 | | 151,342 |
Check Point Software Technologies Ltd. (a) | 2,100 | | 121,023 |
Ituran Location & Control Ltd. | 2,061 | | 27,432 |
TOTAL ISRAEL | | 299,797 |
Italy - 1.5% |
Azimut Holding SpA | 4,314 | | 33,731 |
ENI SpA | 44,600 | | 985,977 |
Fiat Industrial SpA (a) | 32,899 | | 287,060 |
Interpump Group SpA | 28,825 | | 185,652 |
Intesa Sanpaolo SpA | 145,265 | | 259,533 |
Saipem SpA | 5,356 | | 240,154 |
Telecom Italia SpA | 119,900 | | 149,210 |
TOTAL ITALY | | 2,141,317 |
Japan - 11.7% |
ABC-Mart, Inc. | 4,300 | | 168,418 |
Aeon Credit Service Co. Ltd. | 15,900 | | 237,145 |
Air Water, Inc. | 26,000 | | 330,091 |
Aisin Seiki Co. Ltd. | 5,500 | | 173,971 |
Aozora Bank Ltd. | 164,000 | | 414,649 |
Asahi Co. Ltd. | 800 | | 17,726 |
Asahi Glass Co. Ltd. | 19,000 | | 166,403 |
Autobacs Seven Co. Ltd. | 7,200 | | 329,737 |
Common Stocks - continued |
| Shares | | Value |
Japan - continued |
Canon, Inc. | 8,100 | | $ 367,769 |
Chubu Electric Power Co., Inc. | 13,400 | | 245,194 |
Credit Saison Co. Ltd. | 14,300 | | 279,084 |
Daikoku Denki Co. Ltd. | 2,000 | | 17,910 |
Daikokutenbussan Co. Ltd. | 1,500 | | 43,055 |
Denso Corp. | 25,300 | | 778,157 |
Dentsu, Inc. | 7,300 | | 219,833 |
Fanuc Corp. | 6,100 | | 986,437 |
Fast Retailing Co. Ltd. | 1,300 | | 233,556 |
FCC Co. Ltd. | 2,300 | | 48,601 |
GCA Savvian Group Corp. | 16 | | 18,730 |
Glory Ltd. | 900 | | 19,266 |
Goldcrest Co. Ltd. | 860 | | 15,780 |
Honda Motor Co. Ltd. | 15,600 | | 466,558 |
INPEX Corp. | 46 | | 303,735 |
Itochu Corp. | 55,600 | | 549,979 |
Japan Retail Fund Investment Corp. | 318 | | 492,318 |
Japan Tobacco, Inc. | 196 | | 979,765 |
JSR Corp. | 13,000 | | 248,203 |
JX Holdings, Inc. | 61,500 | | 358,276 |
Kamigumi Co. Ltd. | 4,000 | | 34,932 |
KDDI Corp. | 87 | | 637,388 |
Keyence Corp. | 2,010 | | 511,029 |
Kobayashi Pharmaceutical Co. Ltd. | 6,800 | | 337,114 |
Kyoto Kimono Yuzen Co. Ltd. | 1,600 | | 18,615 |
Meiko Network Japan Co. Ltd. | 1,300 | | 10,765 |
Miraial Co. Ltd. | 300 | | 4,662 |
Mitsubishi Corp. | 13,200 | | 271,519 |
Mitsubishi Tanabe Pharma Corp. | 22,400 | | 387,509 |
Nabtesco Corp. | 2,400 | | 52,571 |
Nagaileben Co. Ltd. | 1,200 | | 16,539 |
Nihon M&A Center, Inc. | 6 | | 33,871 |
Nihon Parkerizing Co. Ltd. | 2,000 | | 26,927 |
Nippon Seiki Co. Ltd. | 3,000 | | 30,145 |
Nippon Telegraph & Telephone Corp. | 13,500 | | 692,582 |
Nippon Thompson Co. Ltd. | 8,000 | | 51,534 |
Obic Co. Ltd. | 1,430 | | 270,391 |
ORIX Corp. | 2,930 | | 255,749 |
Osaka Securities Exchange Co. Ltd. | 72 | | 337,440 |
OSG Corp. | 1,300 | | 16,661 |
Santen Pharmaceutical Co. Ltd. | 6,200 | | 231,374 |
Seven & i Holdings Co., Ltd. | 12,000 | | 320,270 |
Common Stocks - continued |
| Shares | | Value |
Japan - continued |
Seven Bank Ltd. | 8 | | $ 14,238 |
SHO-BOND Holdings Co. Ltd. | 6,300 | | 140,552 |
Shoei Co. Ltd. | 1,100 | | 7,403 |
The Nippon Synthetic Chemical Industry Co. Ltd. | 5,000 | | 27,779 |
Tokio Marine Holdings, Inc. | 9,200 | | 219,397 |
Tokyo Gas Co. Ltd. | 98,000 | | 422,074 |
Toray Industries, Inc. | 40,000 | | 284,732 |
Tsumura & Co. | 1,200 | | 33,754 |
Tsutsumi Jewelry Co. Ltd. | 600 | | 13,983 |
Unicharm Corp. | 8,200 | | 367,275 |
USS Co. Ltd. | 9,880 | | 816,876 |
West Japan Railway Co. | 11,800 | | 500,072 |
Yamatake Corp. | 900 | | 19,914 |
Yamato Kogyo Co. Ltd. | 12,900 | | 326,341 |
TOTAL JAPAN | | 16,254,323 |
Kazakhstan - 0.1% |
KazMunaiGas Exploration & Production JSC (Reg. S) GDR | 8,100 | | 137,538 |
Korea (South) - 4.2% |
BS Financial Group, Inc. (a) | 11,160 | | 122,369 |
Cheil Worldwide, Inc. | 6,620 | | 107,992 |
CJ CheilJedang Corp. | 153 | | 42,065 |
CJ Corp. | 2,289 | | 163,382 |
Daum Communications Corp. | 665 | | 80,267 |
Doosan Co. Ltd. | 1,290 | | 162,511 |
GS Holdings Corp. | 2,952 | | 169,406 |
Hana Financial Group, Inc. | 6,920 | | 246,284 |
Hankook Tire Co. Ltd. | 2,340 | | 93,051 |
Hyundai Department Store Co. Ltd. | 1,186 | | 169,409 |
Hyundai Fire & Marine Insurance Co. Ltd. | 2,950 | | 85,101 |
Hyundai Heavy Industries Co. Ltd. | 917 | | 244,075 |
Hyundai Hysco Co. Ltd. | 2,860 | | 110,296 |
Hyundai Mobis | 986 | | 281,132 |
Hyundai Motor Co. | 2,901 | | 582,048 |
Industrial Bank of Korea | 15,910 | | 208,092 |
Kia Motors Corp. | 4,180 | | 266,988 |
Korea Zinc Co. Ltd. | 286 | | 83,516 |
KT&G Corp. | 4,353 | | 271,291 |
LG Chemical Ltd. | 1 | | 321 |
LIG Non-Life Insurance Co. Ltd. | 3,220 | | 68,289 |
Lotte Samkang Co. Ltd. | 104 | | 30,999 |
NCsoft Corp. | 58 | | 18,166 |
Common Stocks - continued |
| Shares | | Value |
Korea (South) - continued |
Nong Shim Co. Ltd. | 600 | | $ 117,135 |
Paradise Co. Ltd. | 14,371 | | 100,625 |
Samsung Card Co. Ltd. | 3,154 | | 117,749 |
Samsung Electronics Co. Ltd. | 1,689 | | 1,448,571 |
Shinhan Financial Group Co. Ltd. | 8,060 | | 319,890 |
SK Chemicals Co. Ltd. | 1,642 | | 104,655 |
TOTAL KOREA (SOUTH) | | 5,815,675 |
Luxembourg - 0.2% |
GlobeOp Financial Services SA | 5,400 | | 24,750 |
Millicom International Cellular SA (depositary receipt) | 1,700 | | 187,352 |
TOTAL LUXEMBOURG | | 212,102 |
Malaysia - 0.1% |
Axiata Group Bhd | 117,600 | | 185,873 |
Mexico - 0.7% |
Embotelladoras Arca SAB de CC | 19,200 | | 91,098 |
Grupo Modelo SAB de CV Series C | 51,500 | | 326,666 |
Wal-Mart de Mexico SA de CV Series V | 218,500 | | 564,452 |
TOTAL MEXICO | | 982,216 |
Netherlands - 1.7% |
Aalberts Industries NV | 2,600 | | 46,038 |
ASM International NV unit | 650 | | 18,343 |
ASML Holding NV | 13,700 | | 574,441 |
ING Groep NV: | | | |
(Certificaten Van Aandelen) (a) | 56,010 | | 482,931 |
sponsored ADR (a) | 17,982 | | 155,364 |
Koninklijke KPN NV | 18,515 | | 243,315 |
Koninklijke Philips Electronics NV | 11,400 | | 237,345 |
QIAGEN NV (a) | 13,700 | | 188,786 |
Unilever NV (Certificaten Van Aandelen) (Bearer) unit | 9,200 | | 317,664 |
Yandex NV | 2,100 | | 57,792 |
TOTAL NETHERLANDS | | 2,322,019 |
Nigeria - 0.1% |
Guaranty Trust Bank PLC GDR (Reg. S) | 23,046 | | 106,012 |
Norway - 1.1% |
Aker Solutions ASA | 12,307 | | 143,128 |
DnB NOR ASA | 33,700 | | 393,134 |
Common Stocks - continued |
| Shares | | Value |
Norway - continued |
Orkla ASA (A Shares) (d) | 36,200 | | $ 315,342 |
Telenor ASA | 36,000 | | 642,719 |
TOTAL NORWAY | | 1,494,323 |
Panama - 0.1% |
Copa Holdings SA Class A | 2,000 | | 138,140 |
Papua New Guinea - 0.0% |
Oil Search Ltd. | 2,098 | | 14,314 |
Peru - 0.1% |
Compania de Minas Buenaventura SA sponsored ADR | 4,900 | | 200,557 |
Philippines - 0.1% |
Globe Telecom, Inc. | 2,500 | | 53,301 |
Jollibee Food Corp. | 9,600 | | 20,400 |
Megaworld Corp. | 70,000 | | 3,087 |
TOTAL PHILIPPINES | | 76,788 |
Poland - 0.1% |
Polska Grupa Energetyczna SA | 16,300 | | 100,453 |
TVN SA | 21,075 | | 84,356 |
TOTAL POLAND | | 184,809 |
Portugal - 0.4% |
Energias de Portugal SA | 38,038 | | 120,284 |
Jeronimo Martins SGPS SA | 28,525 | | 493,447 |
TOTAL PORTUGAL | | 613,731 |
Qatar - 0.0% |
Commercial Bank of Qatar GDR (Reg. S) | 3,576 | | 16,401 |
Russia - 1.1% |
Cherkizovo Group OJSC GDR (a) | 3,818 | | 53,247 |
Lukoil Oil Co. sponsored ADR | 5,212 | | 300,732 |
Mostotrest OAO (a) | 5,300 | | 30,466 |
Gazprom OAO sponsored ADR | 14,921 | | 173,233 |
NOVATEK OAO GDR | 2,900 | | 407,160 |
Rosneft Oil Co. OJSC GDR (Reg. S) | 9,700 | | 69,016 |
Sberbank of Russia (f) | 122,300 | | 331,865 |
TNK-BP Holding | 5,700 | | 15,595 |
Uralkali JSC GDR (Reg. S) | 4,653 | | 201,940 |
TOTAL RUSSIA | | 1,583,254 |
Singapore - 0.8% |
Sakari Resources Ltd. | 33,000 | | 61,621 |
Common Stocks - continued |
| Shares | | Value |
Singapore - continued |
Singapore Telecommunications Ltd. | 221,000 | | $ 558,557 |
United Overseas Bank Ltd. | 31,746 | | 430,402 |
Wing Tai Holdings Ltd. | 12,000 | | 12,168 |
TOTAL SINGAPORE | | 1,062,748 |
South Africa - 1.3% |
African Bank Investments Ltd. | 37,000 | | 160,563 |
African Rainbow Minerals Ltd. | 13,763 | | 318,084 |
Clicks Group Ltd. | 28,266 | | 148,341 |
Foschini Ltd. | 13,098 | | 165,270 |
Imperial Holdings Ltd. | 5,800 | | 85,871 |
JSE Ltd. | 28,200 | | 249,725 |
Life Healthcare Group Holdings Ltd. | 41,607 | | 101,235 |
Mr Price Group Ltd. | 34,600 | | 333,082 |
MTN Group Ltd. | 5,500 | | 95,997 |
Northam Platinum Ltd. | 18,107 | | 70,157 |
TOTAL SOUTH AFRICA | | 1,728,325 |
Spain - 1.5% |
Banco Bilbao Vizcaya Argentaria SA sponsored ADR | 79,238 | | 716,312 |
Grifols SA (a) | 446 | | 8,323 |
Inditex SA | 4,959 | | 451,295 |
Prosegur Compania de Seguridad SA (Reg.) | 6,451 | | 321,838 |
Red Electrica Corporacion SA | 3,500 | | 169,407 |
Repsol YPF SA | 14,179 | | 429,729 |
TOTAL SPAIN | | 2,096,904 |
Sweden - 1.1% |
Fagerhult AB | 5,900 | | 138,913 |
H&M Hennes & Mauritz AB (B Shares) | 18,196 | | 602,575 |
Intrum Justitia AB | 2,800 | | 46,061 |
Swedish Match Co. | 9,350 | | 323,544 |
Tele2 AB (B Shares) | 8,900 | | 187,841 |
Telefonaktiebolaget LM Ericsson (B Shares) | 23,067 | | 240,362 |
TOTAL SWEDEN | | 1,539,296 |
Switzerland - 6.6% |
Bank Sarasin & Co. Ltd. Series B (Reg.) | 1,907 | | 72,799 |
Nestle SA | 63,792 | | 3,700,093 |
Novartis AG sponsored ADR | 4,000 | | 225,880 |
Roche Holding AG (participation certificate) | 14,705 | | 2,424,721 |
Schindler Holding AG: | | | |
(participation certificate) | 2,002 | | 235,435 |
Common Stocks - continued |
| Shares | | Value |
Switzerland - continued |
Schindler Holding AG: - continued | | | |
(Reg.) | 570 | | $ 67,097 |
Syngenta AG (Switzerland) | 890 | | 271,279 |
The Swatch Group AG (Bearer) | 1,780 | | 753,744 |
Transocean Ltd. (United States) | 2,502 | | 142,989 |
UBS AG (NY Shares) (a) | 45,062 | | 568,682 |
Zurich Financial Services AG | 2,668 | | 619,610 |
TOTAL SWITZERLAND | | 9,082,329 |
Taiwan - 1.3% |
Catcher Technology Co. Ltd. | 32,000 | | 178,288 |
Chroma ATE, Inc. | 32,116 | | 64,078 |
Formosa Plastics Corp. | 77,000 | | 226,464 |
Hotai Motor Co. Ltd. | 3,000 | | 13,051 |
HTC Corp. | 8,565 | | 192,486 |
Kinsus Interconnect Technology Corp. | 24,000 | | 82,891 |
Leofoo Development Co. Ltd. (a) | 45,000 | | 29,619 |
President Chain Store Corp. | 24,000 | | 133,458 |
SIMPLO Technology Co. Ltd. | 10,400 | | 61,195 |
Taishin Financial Holdings Co. Ltd. | 489,222 | | 207,145 |
Taiwan Cement Corp. | 173,179 | | 216,280 |
Taiwan Semiconductor Manufacturing Co. Ltd. | 145,035 | | 353,432 |
TOTAL TAIWAN | | 1,758,387 |
Thailand - 0.8% |
Advanced Info Service PCL (For. Reg.) | 62,600 | | 263,003 |
Asian Property Development PCL (For. Reg.) | 428,660 | | 62,653 |
Bangkok Expressway PCL (For.Reg.) | 46,700 | | 24,657 |
Banpu PCL (For. Reg.) | 3,550 | | 72,066 |
Charoen Pokphand Foods PCL (For. Reg.) | 66,400 | | 64,665 |
Krung Thai Bank PCL (For. Reg.) | 174,500 | | 85,391 |
PTT Global Chemical PCL (For. Reg.) (a) | 8,911 | | 18,791 |
PTT PCL (For. Reg.) | 17,300 | | 170,429 |
Siam Cement PCL (For. Reg.) | 10,000 | | 119,896 |
Siam Commercial Bank PCL (For. Reg.) | 73,500 | | 278,036 |
Total Access Communication PCL (For. Reg.) | 200 | | 476 |
TOTAL THAILAND | | 1,160,063 |
Turkey - 1.0% |
Albaraka Turk Katilim Bankasi AS | 21,000 | | 22,208 |
Anadolu Efes Biracilik ve Malt Sanayii AS | 10,000 | | 121,589 |
Aygaz A/S | 15,010 | | 82,000 |
Boyner Buyuk Magazacilik A/S (a) | 9,049 | | 15,199 |
Common Stocks - continued |
| Shares | | Value |
Turkey - continued |
Coca-Cola Icecek AS | 20,489 | | $ 278,092 |
Koc Holding AS | 18,000 | | 64,335 |
Tofas Turk Otomobil Fabrikasi AS | 21,655 | | 83,767 |
Tupras-Turkiye Petrol Rafinerileri AS | 5,313 | | 120,187 |
Turkiye Garanti Bankasi AS | 151,200 | | 533,572 |
TOTAL TURKEY | | 1,320,949 |
United Arab Emirates - 0.0% |
Dubai Financial Market PJSC (a) | 43,463 | | 12,188 |
United Kingdom - 18.1% |
Aegis Group PLC | 54,149 | | 119,477 |
AMEC PLC | 1,801 | | 26,806 |
Anglo American PLC (United Kingdom) | 11,000 | | 405,725 |
Aviva PLC | 65,272 | | 356,162 |
Babcock International Group PLC | 36,100 | | 409,005 |
Barclays PLC | 185,919 | | 576,446 |
Bellway PLC | 2,828 | | 32,291 |
BG Group PLC | 67,077 | | 1,463,300 |
BHP Billiton PLC ADR | 30,000 | | 1,889,100 |
BP PLC sponsored ADR | 33,187 | | 1,466,202 |
British American Tobacco PLC (United Kingdom) | 7,400 | | 339,356 |
British Land Co. PLC | 24,600 | | 201,963 |
Britvic PLC | 8,000 | | 42,444 |
Centrica PLC | 49,175 | | 234,640 |
Compass Group PLC | 28,500 | | 259,419 |
Dechra Pharmaceuticals PLC | 3,500 | | 27,581 |
Derwent London PLC | 800 | | 21,846 |
GlaxoSmithKline PLC sponsored ADR | 49,300 | | 2,208,147 |
Great Portland Estates PLC | 6,372 | | 38,162 |
H&T Group PLC | 4,764 | | 23,827 |
HSBC Holdings PLC sponsored ADR | 9,151 | | 399,533 |
Imperial Tobacco Group PLC | 21,721 | | 794,347 |
InterContinental Hotel Group PLC ADR | 23,450 | | 433,356 |
International Personal Finance PLC | 13,642 | | 60,157 |
International Power PLC | 63,805 | | 347,031 |
Johnson Matthey PLC | 14,092 | | 425,833 |
Kazakhmys PLC | 9,000 | | 134,244 |
Meggitt PLC | 12,298 | | 76,065 |
Micro Focus International PLC | 3,800 | | 20,754 |
National Grid PLC | 65,397 | | 650,301 |
Next PLC | 3,700 | | 152,091 |
Persimmon PLC | 3,137 | | 25,109 |
Common Stocks - continued |
| Shares | | Value |
United Kingdom - continued |
Prudential PLC | 54,997 | | $ 568,176 |
Reckitt Benckiser Group PLC | 10,638 | | 547,115 |
Reed Elsevier PLC | 53,000 | | 455,579 |
Rio Tinto PLC sponsored ADR | 10,360 | | 560,062 |
Rolls-Royce Group PLC | 44,052 | | 497,682 |
Rolls-Royce Group PLC Class C | 3,039,588 | | 4,888 |
Rotork PLC | 9,403 | | 254,653 |
Royal Dutch Shell PLC Class A sponsored ADR | 43,000 | | 3,049,130 |
SABMiller PLC | 15,463 | | 564,867 |
Scottish & Southern Energy PLC | 21,452 | | 463,668 |
Serco Group PLC | 42,839 | | 357,903 |
Shaftesbury PLC | 21,733 | | 176,153 |
Spectris PLC | 1,770 | | 36,208 |
Spirax-Sarco Engineering PLC | 2,404 | | 74,152 |
Standard Chartered PLC (United Kingdom) | 32,873 | | 771,320 |
Ted Baker PLC | 3,075 | | 38,140 |
Tesco PLC | 112,083 | | 724,162 |
Ultra Electronics Holdings PLC | 1,400 | | 35,844 |
Unite Group PLC | 60,302 | | 171,457 |
Victrex PLC | 9,318 | | 190,312 |
Vodafone Group PLC sponsored ADR | 65,347 | | 1,819,260 |
TOTAL UNITED KINGDOM | | 25,021,451 |
United States of America - 5.7% |
Allergan, Inc. | 2,600 | | 218,712 |
ANSYS, Inc. (a) | 300 | | 16,308 |
Autoliv, Inc. | 7,700 | | 444,829 |
Berkshire Hathaway, Inc. Class B (a) | 6,845 | | 532,952 |
Broadridge Financial Solutions, Inc. | 690 | | 15,353 |
Cognizant Technology Solutions Corp. Class A (a) | 1,910 | | 138,953 |
Cymer, Inc. (a) | 4,150 | | 180,318 |
Dril-Quip, Inc. (a) | 490 | | 31,899 |
eBay, Inc. (a) | 8,164 | | 259,860 |
Evercore Partners, Inc. Class A | 920 | | 25,245 |
Freeport-McMoRan Copper & Gold, Inc. | 1,300 | | 52,338 |
Google, Inc. Class A (a) | 520 | | 308,173 |
Greenhill & Co., Inc. | 300 | | 11,334 |
ION Geophysical Corp. (a) | 35,141 | | 267,774 |
JPMorgan Chase & Co. | 5,298 | | 184,158 |
Juniper Networks, Inc. (a) | 19,260 | | 471,292 |
Kansas City Southern (a) | 920 | | 58,116 |
Lam Research Corp. (a) | 4,708 | | 202,397 |
Common Stocks - continued |
| Shares | | Value |
United States of America - continued |
Martin Marietta Materials, Inc. | 2,190 | | $ 158,052 |
MasterCard, Inc. Class A | 2,009 | | 697,605 |
Mead Johnson Nutrition Co. Class A | 8,000 | | 574,800 |
Mohawk Industries, Inc. (a) | 6,930 | | 364,865 |
Nuance Communications, Inc. (a) | 4,251 | | 112,566 |
Oceaneering International, Inc. | 820 | | 34,301 |
Philip Morris International, Inc. | 11,700 | | 817,479 |
PriceSmart, Inc. | 1,400 | | 106,456 |
ResMed, Inc. (a) | 10,370 | | 293,471 |
Solera Holdings, Inc. | 3,121 | | 170,500 |
Solutia, Inc. (a) | 884 | | 14,365 |
SS&C Technologies Holdings, Inc. (a) | 954 | | 15,130 |
Union Pacific Corp. | 4,700 | | 467,979 |
Visa, Inc. Class A | 6,901 | | 643,587 |
TOTAL UNITED STATES OF AMERICA | | 7,891,167 |
TOTAL COMMON STOCKS (Cost $138,836,607) |
133,653,906
|
Nonconvertible Preferred Stocks - 0.2% |
| | | |
Germany - 0.1% |
Volkswagen AG | 1,034 | | 181,445 |
Italy - 0.1% |
Telecom Italia SpA (Risparmio Shares) | 143,000 | | 150,094 |
TOTAL NONCONVERTIBLE PREFERRED STOCKS (Cost $392,992) |
331,539
|
Money Market Funds - 3.6% |
| Shares | | Value |
Fidelity Cash Central Fund, 0.12% (b) | 4,609,098 | | $ 4,609,098 |
Fidelity Securities Lending Cash Central Fund, 0.11% (b)(c) | 363,225 | | 363,225 |
TOTAL MONEY MARKET FUNDS (Cost $4,972,323) |
4,972,323
|
TOTAL INVESTMENT PORTFOLIO - 100.3% (Cost $144,201,922) | | 138,957,768 |
NET OTHER ASSETS (LIABILITIES) - (0.3)% | | (468,208) |
NET ASSETS - 100% | $ 138,489,560 |
Legend |
(a) Non-income producing |
(b) Affiliated fund that is available only to investment companies and other accounts managed by Fidelity Investments. The rate quoted is the annualized seven-day yield of the fund at period end. A complete unaudited listing of the fund's holdings as of its most recent quarter end is available upon request. In addition, each Fidelity Central Fund's financial statements, which are not covered by the Fund's Report of Independent Registered Public Accounting Firm, are available on the SEC's website or upon request. |
(c) Investment made with cash collateral received from securities on loan. |
(d) Security or a portion of the security is on loan at period end. |
(e) Security exempt from registration under Rule 144A of the Securities Act of 1933. These securities may be resold in transactions exempt from registration, normally to qualified institutional buyers. At the end of the period, the value of these securities amounted to $121,871 or 0.1% of net assets. |
(f) Security or a portion of the security purchased on a delayed delivery or when-issued basis. |
Affiliated Central Funds |
Information regarding fiscal year to date income earned by the Fund from investments in Fidelity Central Funds is as follows: |
Fund | Income earned |
Fidelity Cash Central Fund | $ 181 |
Fidelity Securities Lending Cash Central Fund | 31,105 |
Total | $ 31,286 |
Other Information |
The following is a summary of the inputs used, as of October 31, 2011, involving the Fund's assets and liabilities carried at fair value. The inputs or methodology used for valuing securities may not be an indication of the risk associated with investing in those securities. For more information on valuation inputs, and their aggregation into the levels used in the table below, please refer to the Security Valuation section in the accompanying Notes to Financial Statements. |
Valuation Inputs at Reporting Date: |
Description | Total | Level 1 | Level 2 | Level 3 |
Investments in Securities: | | | | |
Equities: | | | | |
United Kingdom | $ 25,021,451 | $ 22,531,010 | $ 2,490,441 | $ - |
Japan | 16,254,323 | - | 16,254,323 | - |
Switzerland | 9,082,329 | 8,811,050 | 271,279 | - |
Germany | 8,267,853 | 7,754,156 | 513,697 | - |
United States of America | 7,891,167 | 7,891,167 | - | - |
France | 6,728,675 | 5,233,865 | 1,494,810 | - |
Australia | 6,010,403 | 220,883 | 5,789,520 | - |
Korea (South) | 5,815,675 | - | 5,815,675 | - |
Brazil | 5,687,535 | 5,687,535 | - | - |
Other | 43,226,034 | 25,351,417 | 17,874,617 | - |
Money Market Funds | 4,972,323 | 4,972,323 | - | - |
Total Investments in Securities: | $ 138,957,768 | $ 88,453,406 | $ 50,504,362 | $ - |
Income Tax Information |
At October 31, 2011, the Fund had a capital loss carryforward of approximately $33,183,732 of which $8,618,744, $15,708,944 and $8,856,044 will expire in fiscal 2016, 2017 and 2019, respectively. Capital loss carryforwards are only available to offset future capital gains of the Fund to the extent provided by regulations and may be limited. |
See accompanying notes which are an integral part of the financial statements.
Annual Report
Statement of Assets and Liabilities
| October 31, 2011 |
| | |
Assets | | |
Investment in securities, at value (including securities loaned of $332,595) - See accompanying schedule: Unaffiliated issuers (cost $139,229,599) | $ 133,985,445 | |
Fidelity Central Funds (cost $4,972,323) | 4,972,323 | |
Total Investments (cost $144,201,922) | | $ 138,957,768 |
Foreign currency held at value (cost $450,490) | | 463,177 |
Receivable for investments sold | | 1,171,368 |
Receivable for fund shares sold | | 684,946 |
Dividends receivable | | 284,271 |
Distributions receivable from Fidelity Central Funds | | 1,137 |
Prepaid expenses | | 689 |
Receivable from investment adviser for expense reductions | | 57,911 |
Other receivables | | 29,554 |
Total assets | | 141,650,821 |
| | |
Liabilities | | |
Payable to custodian bank | $ 54,666 | |
Payable for investments purchased
Regular delivery | 1,969,977 | |
Delayed delivery | 55,088 | |
Payable for fund shares redeemed | 506,258 | |
Accrued management fee | 77,502 | |
Distribution and service plan fees payable | 2,583 | |
Other affiliated payables | 30,824 | |
Other payables and accrued expenses | 101,138 | |
Collateral on securities loaned, at value | 363,225 | |
Total liabilities | | 3,161,261 |
| | |
Net Assets | | $ 138,489,560 |
Net Assets consist of: | | |
Paid in capital | | $ 176,367,284 |
Undistributed net investment income | | 1,552,849 |
Accumulated undistributed net realized gain (loss) on investments and foreign currency transactions | | (34,194,366) |
Net unrealized appreciation (depreciation) on investments and assets and liabilities in foreign currencies | | (5,236,207) |
Net Assets | | $ 138,489,560 |
See accompanying notes which are an integral part of the financial statements.
Annual Report
Statement of Assets and Liabilities - continued
| October 31, 2011 |
| | |
Calculation of Maximum Offering Price Class A:
Net Asset Value and redemption price per share ($4,307,161 ÷ 645,276 shares) | | $ 6.67 |
| | |
Maximum offering price per share (100/94.25 of $6.67) | | $ 7.08 |
Class T:
Net Asset Value and redemption price per share ($996,899 ÷ 148,175 shares) | | $ 6.73 |
| | |
Maximum offering price per share (100/96.50 of $6.73) | | $ 6.97 |
Class B:
Net Asset Value and offering price per share ($254,279 ÷ 38,057 shares)A | | $ 6.68 |
| | |
Class C:
Net Asset Value and offering price per share ($1,395,692 ÷ 209,094 shares)A | | $ 6.67 |
| | |
Total International Equity:
Net Asset Value, offering price and redemption price per share ($131,338,267 ÷ 19,645,402 shares) | | $ 6.69 |
| | |
Institutional Class:
Net Asset Value, offering price and redemption price per share ($197,262 ÷ 29,577 shares) | | $ 6.67 |
A Redemption price per share is equal to net asset value less any applicable contingent deferred sales charge.
See accompanying notes which are an integral part of the financial statements.
Annual Report
Financial Statements - continued
Statement of Operations
| Year ended October 31, 2011 |
| | |
Investment Income | | |
Dividends | | $ 3,448,845 |
Interest | | 1,597 |
Income from Fidelity Central Funds | | 31,286 |
Income before foreign taxes withheld | | 3,481,728 |
Less foreign taxes withheld | | (260,512) |
Total income | | 3,221,216 |
| | |
Expenses | | |
Management fee
Basic fee | $ 797,169 | |
Performance adjustment | (22,587) | |
Transfer agent fees | 274,385 | |
Distribution and service plan fees | 36,441 | |
Accounting and security lending fees | 58,516 | |
Custodian fees and expenses | 310,251 | |
Independent trustees' compensation | 597 | |
Registration fees | 80,712 | |
Audit | 106,913 | |
Legal | 401 | |
Miscellaneous | 731 | |
Total expenses before reductions | 1,643,529 | |
Expense reductions | (287,161) | 1,356,368 |
Net investment income (loss) | | 1,864,848 |
Realized and Unrealized Gain (Loss) Net realized gain (loss) on: | | |
Investment securities: | | |
Unaffiliated issuers | (8,922,239) | |
Foreign currency transactions | (75,788) | |
Total net realized gain (loss) | | (8,998,027) |
Change in net unrealized appreciation (depreciation) on: Investment securities | (8,598,208) | |
Assets and liabilities in foreign currencies | 299 | |
Total change in net unrealized appreciation (depreciation) | | (8,597,909) |
Net gain (loss) | | (17,595,936) |
Net increase (decrease) in net assets resulting from operations | | $ (15,731,088) |
See accompanying notes which are an integral part of the financial statements.
Annual Report
Statement of Changes in Net Assets
| Year ended
October 31,
2011 | Year ended
October 31,
2010 |
Increase (Decrease) in Net Assets | | |
Operations | | |
Net investment income (loss) | $ 1,864,848 | $ 773,945 |
Net realized gain (loss) | (8,998,027) | 1,906,137 |
Change in net unrealized appreciation (depreciation) | (8,597,909) | 5,447,726 |
Net increase (decrease) in net assets resulting
from operations | (15,731,088) | 8,127,808 |
Distributions to shareholders from net investment income | (953,041) | (411,223) |
Distributions to shareholders from net realized gain | (220,294) | (169,935) |
Total distributions | (1,173,335) | (581,158) |
Share transactions - net increase (decrease) | 86,742,563 | 18,410,630 |
Redemption fees | 14,195 | 6,300 |
Total increase (decrease) in net assets | 69,852,335 | 25,963,580 |
| | |
Net Assets | | |
Beginning of period | 68,637,225 | 42,673,645 |
End of period (including undistributed net investment income of $1,552,849 and undistributed net investment income of $724,017, respectively) | $ 138,489,560 | $ 68,637,225 |
See accompanying notes which are an integral part of the financial statements.
Annual Report
Financial Highlights - Class A
Years ended October 31, | 2011 | 2010 | 2009 | 2008 F |
Selected Per-Share Data | | | | |
Net asset value, beginning of period | $ 7.36 | $ 6.40 | $ 4.90 | $ 10.00 |
Income from Investment Operations | | | | |
Net investment income (loss) C | .11 | .08 | .06 | .11 |
Net realized and unrealized gain (loss) | (.69) | .95 | 1.55 | (5.21) |
Total from investment operations | (.58) | 1.03 | 1.61 | (5.10) |
Distributions from net investment income | (.09) | (.04) | (.11) | - |
Distributions from net realized gain | (.02) | (.03) | - | - |
Total distributions | (.11) | (.07) | (.11) | - |
Redemption fees added to paid in capital C,H | - | - | - | - |
Net asset value, end of period | $ 6.67 | $ 7.36 | $ 6.40 | $ 4.90 |
Total Return A,B | (8.03)% | 16.17% | 33.87% | (51.00)% |
Ratios to Average Net Assets D,G | | | | |
Expenses before reductions | 1.73% | 2.02% | 2.09% | 2.00% |
Expenses net of fee waivers, if any | 1.45% | 1.50% | 1.50% | 1.50% |
Expenses net of all reductions | 1.42% | 1.47% | 1.47% | 1.48% |
Net investment income (loss) | 1.44% | 1.15% | 1.13% | 1.35% |
Supplemental Data | | | | |
Net assets, end of period (000 omitted) | $ 4,307 | $ 5,029 | $ 3,727 | $ 5,944 |
Portfolio turnover rate E | 75% | 67% | 98% | 91% |
A Total returns would have been lower if certain expenses had not been reduced during the applicable periods shown.
B Total returns do not include the effect of the sales charges.
C Calculated based on average shares outstanding during the period.
D Fees and expenses of any underlying Fidelity Central Funds are not included in the Fund's expense ratio. The Fund indirectly bears its proportionate share of the expenses of any underlying Fidelity Central Funds.
E Amount does not include the portfolio activity of any underlying Fidelity Central Funds.
F For the period November 1, 2007 (commencement of operations) to October 31, 2008.
G Expense ratios reflect operating expenses of the class. Expenses before reductions do not reflect amounts reimbursed by the investment adviser or reductions from brokerage service arrangements or reductions from other expense offset arrangements and do not represent the amount paid by the class during periods when reimbursements or reductions occur. Expense ratios before reductions for start-up periods may not be representative of longer-term operating periods. Expenses net of fee waivers reflect expenses after reimbursement by the investment adviser but prior to reductions from brokerage service arrangements or other expense offset arrangements. Expenses net of all reductions represent the net expenses paid by the class.
H Amount represents less than $.01 per share.
See accompanying notes which are an integral part of the financial statements.
Annual Report
Financial Highlights - Class T
Years ended October 31, | 2011 | 2010 | 2009 | 2008 F |
Selected Per-Share Data | | | | |
Net asset value, beginning of period | $ 7.41 | $ 6.40 | $ 4.88 | $ 10.00 |
Income from Investment Operations | | | | |
Net investment income (loss) C | .09 | .06 | .04 | .09 |
Net realized and unrealized gain (loss) | (.68) | .95 | 1.57 | (5.21) |
Total from investment operations | (.59) | 1.01 | 1.61 | (5.12) |
Distributions from net investment income | (.07) | - | (.09) | - |
Distributions from net realized gain | (.02) | - | - | - |
Total distributions | (.09) | - | (.09) | - |
Redemption fees added to paid in capital C,H | - | - | - | - |
Net asset value, end of period | $ 6.73 | $ 7.41 | $ 6.40 | $ 4.88 |
Total Return A,B | (8.08)% | 15.78% | 33.74% | (51.20)% |
Ratios to Average Net Assets D,G | | | | |
Expenses before reductions | 2.02% | 2.31% | 2.34% | 2.42% |
Expenses net of fee waivers, if any | 1.70% | 1.75% | 1.75% | 1.75% |
Expenses net of all reductions | 1.67% | 1.72% | 1.72% | 1.73% |
Net investment income (loss) | 1.19% | .90% | .88% | 1.10% |
Supplemental Data | | | | |
Net assets, end of period (000 omitted) | $ 997 | $ 1,004 | $ 1,526 | $ 2,567 |
Portfolio turnover rate E | 75% | 67% | 98% | 91% |
A Total returns would have been lower if certain expenses had not been reduced during the applicable periods shown.
B Total returns do not include the effect of the sales charges.
C Calculated based on average shares outstanding during the period.
D Fees and expenses of any underlying Fidelity Central Funds are not included in the Fund's expense ratio. The Fund indirectly bears its proportionate share of the expenses of any underlying Fidelity Central Funds.
E Amount does not include the portfolio activity of any underlying Fidelity Central Funds.
F For the period November 1, 2007 (commencement of operations) to October 31, 2008.
G Expense ratios reflect operating expenses of the class. Expenses before reductions do not reflect amounts reimbursed by the investment adviser or reductions from brokerage service arrangements or reductions from other expense offset arrangements and do not represent the amount paid by the class during periods when reimbursements or reductions occur. Expense ratios before reductions for start-up periods may not be representative of longer-term operating periods. Expenses net of fee waivers reflect expenses after reimbursement by the investment adviser but prior to reductions from brokerage service arrangements or other expense offset arrangements. Expenses net of all reductions represent the net expenses paid by the class.
H Amount represents less than $.01 per share.
See accompanying notes which are an integral part of the financial statements.
Annual Report
Financial Highlights - Class B
Years ended October 31, | 2011 | 2010 | 2009 | 2008 F |
Selected Per-Share Data | | | | |
Net asset value, beginning of period | $ 7.37 | $ 6.39 | $ 4.86 | $ 10.00 |
Income from Investment Operations | | | | |
Net investment income (loss) C | .05 | .03 | .02 | .05 |
Net realized and unrealized gain (loss) | (.68) | .95 | 1.56 | (5.19) |
Total from investment operations | (.63) | .98 | 1.58 | (5.14) |
Distributions from net investment income | (.04) | - | (.05) | - |
Distributions from net realized gain | (.02) | - | - | - |
Total distributions | (.06) | - | (.05) | - |
Redemption fees added to paid in capital C,H | - | - | - | - |
Net asset value, end of period | $ 6.68 | $ 7.37 | $ 6.39 | $ 4.86 |
Total Return A,B | (8.66)% | 15.34% | 32.95% | (51.40)% |
Ratios to Average Net Assets D,G | | | | |
Expenses before reductions | 2.51% | 2.81% | 2.82% | 2.92% |
Expenses net of fee waivers, if any | 2.20% | 2.25% | 2.25% | 2.25% |
Expenses net of all reductions | 2.17% | 2.22% | 2.22% | 2.24% |
Net investment income (loss) | .69% | .40% | .38% | .60% |
Supplemental Data | | | | |
Net assets, end of period (000 omitted) | $ 254 | $ 327 | $ 1,337 | $ 2,505 |
Portfolio turnover rate E | 75% | 67% | 98% | 91% |
A Total returns would have been lower if certain expenses had not been reduced during the applicable periods shown.
B Total returns do not include the effect of the contingent deferred sales charge.
C Calculated based on average shares outstanding during the period.
D Fees and expenses of any underlying Fidelity Central Funds are not included in the Fund's expense ratio. The Fund indirectly bears its proportionate share of the expenses of any underlying Fidelity Central Funds.
E Amount does not include the portfolio activity of any underlying Fidelity Central Funds.
F For the period November 1, 2007 (commencement of operations) to October 31, 2008.
G Expense ratios reflect operating expenses of the class. Expenses before reductions do not reflect amounts reimbursed by the investment adviser or reductions from brokerage service arrangements or reductions from other expense offset arrangements and do not represent the amount paid by the class during periods when reimbursements or reductions occur. Expense ratios before reductions for start-up periods may not be representative of longer-term operating periods. Expenses net of fee waivers reflect expenses after reimbursement by the investment adviser but prior to reductions from brokerage service arrangements or other expense offset arrangements. Expenses net of all reductions represent the net expenses paid by the class.
H Amount represents less than $.01 per share.
See accompanying notes which are an integral part of the financial statements.
Annual Report
Financial Highlights - Class C
Years ended October 31, | 2011 | 2010 | 2009 | 2008 F |
Selected Per-Share Data | | | | |
Net asset value, beginning of period | $ 7.36 | $ 6.39 | $ 4.86 | $ 10.00 |
Income from Investment Operations | | | | |
Net investment income (loss) C | .05 | .03 | .02 | .05 |
Net realized and unrealized gain (loss) | (.69) | .94 | 1.56 | (5.19) |
Total from investment operations | (.64) | .97 | 1.58 | (5.14) |
Distributions from net investment income | (.03) | - | (.05) | - |
Distributions from net realized gain | (.02) | - | - | - |
Total distributions | (.05) | - | (.05) | - |
Redemption fees added to paid in capital C,H | - | - | - | - |
Net asset value, end of period | $ 6.67 | $ 7.36 | $ 6.39 | $ 4.86 |
Total Return A,B | (8.72)% | 15.18% | 33.10% | (51.40)% |
Ratios to Average Net Assets D,G | | | | |
Expenses before reductions | 2.51% | 2.80% | 2.85% | 2.92% |
Expenses net of fee waivers, if any | 2.20% | 2.25% | 2.25% | 2.25% |
Expenses net of all reductions | 2.17% | 2.22% | 2.22% | 2.23% |
Net investment income (loss) | .69% | .40% | .38% | .60% |
Supplemental Data | | | | |
Net assets, end of period (000 omitted) | $ 1,396 | $ 1,423 | $ 1,714 | $ 2,787 |
Portfolio turnover rate E | 75% | 67% | 98% | 91% |
A Total returns would have been lower if certain expenses had not been reduced during the applicable periods shown.
B Total returns do not include the effect of the contingent deferred sales charge.
C Calculated based on average shares outstanding during the period.
D Fees and expenses of any underlying Fidelity Central Funds are not included in the Fund's expense ratio. The Fund indirectly bears its proportionate share of the expenses of any underlying Fidelity Central Funds.
E Amount does not include the portfolio activity of any underlying Fidelity Central Funds.
F For the period November 1, 2007 (commencement of operations) to October 31, 2008.
G Expense ratios reflect operating expenses of the class. Expenses before reductions do not reflect amounts reimbursed by the investment adviser or reductions from brokerage service arrangements or reductions from other expense offset arrangements and do not represent the amount paid by the class during periods when reimbursements or reductions occur. Expense ratios before reductions for start-up periods may not be representative of longer-term operating periods. Expenses net of fee waivers reflect expenses after reimbursement by the investment adviser but prior to reductions from brokerage service arrangements or other expense offset arrangements. Expenses net of all reductions represent the net expenses paid by the class.
H Amount represents less than $.01 per share.
See accompanying notes which are an integral part of the financial statements.
Annual Report
Financial Highlights - Total International Equity
Years ended October 31, | 2011 | 2010 | 2009 | 2008 E |
Selected Per-Share Data | | | | |
Net asset value, beginning of period | $ 7.37 | $ 6.41 | $ 4.91 | $ 10.00 |
Income from Investment Operations | | | | |
Net investment income (loss) B | .12 | .09 | .07 | .13 |
Net realized and unrealized gain (loss) | (.68) | .96 | 1.55 | (5.21) |
Total from investment operations | (.56) | 1.05 | 1.62 | (5.08) |
Distributions from net investment income | (.10) | (.06) | (.12) | (.01) |
Distributions from net realized gain | (.02) | (.03) | - | - |
Total distributions | (.12) | (.09) | (.12) | (.01) |
Redemption fees added to paid in capital B,G | - | - | - | - |
Net asset value, end of period | $ 6.69 | $ 7.37 | $ 6.41 | $ 4.91 |
Total Return A | (7.70)% | 16.45% | 34.23% | (50.87)% |
Ratios to Average Net Assets C,F | | | | |
Expenses before reductions | 1.42% | 1.79% | 1.87% | 1.89% |
Expenses net of fee waivers, if any | 1.20% | 1.25% | 1.25% | 1.25% |
Expenses net of all reductions | 1.17% | 1.22% | 1.22% | 1.23% |
Net investment income (loss) | 1.69% | 1.40% | 1.38% | 1.60% |
Supplemental Data | | | | |
Net assets, end of period (000 omitted) | $ 131,338 | $ 60,826 | $ 33,061 | $ 23,226 |
Portfolio turnover rate D | 75% | 67% | 98% | 91% |
A Total returns would have been lower if certain expenses had not been reduced during the applicable periods shown.
B Calculated based on average shares outstanding during the period.
C Fees and expenses of any underlying Fidelity Central Funds are not included in the Fund's expense ratio. The Fund indirectly bears its proportionate share of the expenses of any underlying Fidelity Central Funds.
D Amount does not include the portfolio activity of any underlying Fidelity Central Funds.
E For the period November 1, 2007 (commencement of operations) to October 31, 2008.
F Expense ratios reflect operating expenses of the class. Expenses before reductions do not reflect amounts reimbursed by the investment adviser or reductions from brokerage service arrangements or reductions from other expense offset arrangements and do not represent the amount paid by the class during periods when reimbursements or reductions occur. Expense ratios before reductions for start-up periods may not be representative of longer-term operating periods. Expenses net of fee waivers reflect expenses after reimbursement by the investment adviser but prior to reductions from brokerage service arrangements or other expense offset arrangements. Expenses net of all reductions represent the net expenses paid by the class.
G Amount represents less than $.01 per share.
See accompanying notes which are an integral part of the financial statements.
Annual Report
Financial Highlights - Institutional Class
Years ended October 31, | 2011 | 2010 | 2009 | 2008 E |
Selected Per-Share Data | | | | |
Net asset value, beginning of period | $ 7.35 | $ 6.41 | $ 4.91 | $ 10.00 |
Income from Investment Operations | | | | |
Net investment income (loss) B | .12 | .10 | .07 | .13 |
Net realized and unrealized gain (loss) | (.68) | .95 | 1.55 | (5.21) |
Total from investment operations | (.56) | 1.05 | 1.62 | (5.08) |
Distributions from net investment income | (.10) | (.08) | (.12) | (.01) |
Distributions from net realized gain | (.02) | (.03) | - | - |
Total distributions | (.12) | (.11) | (.12) | (.01) |
Redemption fees added to paid in capital B,G | - | - | - | - |
Net asset value, end of period | $ 6.67 | $ 7.35 | $ 6.41 | $ 4.91 |
Total Return A | (7.72)% | 16.48% | 34.23% | (50.87)% |
Ratios to Average Net Assets C,F | | | | |
Expenses before reductions | 1.48% | 1.82% | 1.80% | 1.91% |
Expenses net of fee waivers, if any | 1.20% | 1.25% | 1.25% | 1.25% |
Expenses net of all reductions | 1.17% | 1.23% | 1.22% | 1.23% |
Net investment income (loss) | 1.69% | 1.40% | 1.38% | 1.60% |
Supplemental Data | | | | |
Net assets, end of period (000 omitted) | $ 197 | $ 28 | $ 1,308 | $ 2,733 |
Portfolio turnover rate D | 75% | 67% | 98% | 91% |
A Total returns would have been lower if certain expenses had not been reduced during the applicable periods shown.
B Calculated based on average shares outstanding during the period.
C Fees and expenses of any underlying Fidelity Central Funds are not included in the Fund's expense ratio. The Fund indirectly bears its proportionate share of the expenses of any underlying Fidelity Central Funds.
D Amount does not include the portfolio activity of any underlying Fidelity Central Funds.
E For the period November 1, 2007 (commencement of operations) to October 31, 2008.
F Expense ratios reflect operating expenses of the class. Expenses before reductions do not reflect amounts reimbursed by the investment adviser or reductions from brokerage service arrangements or reductions from other expense offset arrangements and do not represent the amount paid by the class during periods when reimbursements or reductions occur. Expense ratios before reductions for start-up periods may not be representative of longer-term operating periods. Expenses net of fee waivers reflect expenses after reimbursement by the investment adviser but prior to reductions from brokerage service arrangements or other expense offset arrangements. Expenses net of all reductions represent the net expenses paid by the class.
G Amount represents less than $.01 per share.
See accompanying notes which are an integral part of the financial statements.
Annual Report
Notes to Financial Statements
For the period ended October 31, 2011
1. Organization.
Fidelity Total International Equity Fund (the Fund) is a fund of Fidelity Investment Trust (the Trust) and is authorized to issue an unlimited number of shares. The Trust is registered under the Investment Company Act of 1940, as amended (the 1940 Act), as an open-end management investment company organized as a Massachusetts business trust. The Fund offers Class A, Class T, Class C, Total International Equity and Institutional Class shares, each of which, along with Class B shares, has equal rights as to assets and voting privileges. Effective after the close of business on September 1, 2010, Class B shares were closed to new accounts and additional purchases, except for exchanges and reinvestments by existing shareholders. Each class has exclusive voting rights with respect to matters that affect that class. Class B shares will automatically convert to Class A shares after a holding period of seven years from the initial date of purchase. Investment income, realized and unrealized capital gains and losses, the common expenses of the Fund, and certain fund-level expense reductions, if any, are allocated on a pro-rata basis to each class based on the relative net assets of each class to the total net assets of the Fund. Each class differs with respect to transfer agent and distribution and service plan fees incurred. Certain expense reductions may also differ by class. The Fund's investments in emerging markets can be subject to social, economic, regulatory, and political uncertainties and can be extremely volatile.
2. Investments in Fidelity Central Funds.
The Fund invests in Fidelity Central Funds, which are open-end investment companies available only to other investment companies and accounts managed by Fidelity Management & Research Company (FMR) and its affiliates. The Fund's Schedule of Investments lists each of the Fidelity Central Funds held as of period end, if any, as an investment of the Fund, but does not include the underlying holdings of each Fidelity Central Fund. As an Investing Fund, the Fund indirectly bears its proportionate share of the expenses of the underlying Fidelity Central Funds.
The Money Market Central Funds seek preservation of capital and current income and are managed by Fidelity Investments Money Management, Inc. (FIMM), an affiliate of FMR.
A complete unaudited list of holdings for each Fidelity Central Fund is available upon request or at the Securities and Exchange Commission (the SEC) web site at www.sec.gov. In addition, the financial statements of the Fidelity Central Funds, which are not covered by the Fund's Report of Independent Registered Public Accounting Firm are available on the SEC web site or upon request.
Annual Report
3. Significant Accounting Policies.
The financial statements have been prepared in conformity with accounting principles generally accepted in the United States of America (GAAP), which require management to make certain estimates and assumptions at the date of the financial statements. Actual results could differ from those estimates. Subsequent events, if any, through the date that the financial statements were issued have been evaluated in the preparation of the financial statements. The following summarizes the significant accounting policies of the Fund:
Security Valuation. Investments are valued as of 4:00 p.m. Eastern time on the last calendar day of the period. The Fund uses independent pricing services approved by the Board of Trustees to value its investments. When current market prices or quotations are not readily available or reliable, valuations may be determined in good faith in accordance with procedures adopted by the Board of Trustees. Factors used in determining value may include market or security specific events. The frequency with which these procedures are used cannot be predicted and they may be utilized to a significant extent. The value used for net asset value (NAV) calculation under these procedures may differ from published prices for the same securities.
The Fund categorizes the inputs to valuation techniques used to value its investments into a disclosure hierarchy consisting of three levels as shown below:
Level 1 - quoted prices in active markets for identical investments
Level 2 - other significant observable inputs (including quoted prices for similar investments, interest rates, prepayment speeds, etc.)
Level 3 - unobservable inputs (including the Fund's own assumptions based on the best information available)
Changes in valuation techniques may result in transfers in or out of an assigned level within the disclosure hierarchy. The aggregate value of investments by input level, as of October 31, 2011, is included at the end of the Fund's Schedule of Investments. Valuation techniques used to value the Fund's investments by major category are as follows:
Equity securities, including restricted securities, for which market quotations are readily available, are valued at the last reported sale price or official closing price as reported by an independent pricing service on the primary market or exchange on which they are traded and are categorized as Level 1 in the hierarchy. In the event there were no sales during the day or closing prices are not available, securities are valued at the last quoted bid price or may be valued using the last available price and are generally categorized as Level 2 in the hierarchy. For foreign equity securities, when significant market or security specific events arise, comparisons to the valuation of American Depositary Receipts
Annual Report
Notes to Financial Statements - continued
3. Significant Accounting Policies - continued
Security Valuation - continued
(ADRs), futures contracts, Exchange-traded funds (ETFs) and certain indexes as well as quoted prices for similar securities are used and are categorized as Level 2 in the hierarchy in these circumstances. Utilizing these techniques may result in transfers between Level 1 and Level 2. For restricted equity securities and private placements where observable inputs are limited, assumptions about market activity and risk are used and are categorized as Level 3 in the hierarchy.
Investments in open-end mutual funds, including the Fidelity Central Funds, are valued at their closing net asset value each business day and are categorized as Level 1 in the hierarchy.
Foreign Currency. The Fund may use foreign currency contracts to facilitate transactions in foreign-denominated securities. Gains and losses from these transactions may arise from changes in the value of the foreign currency or if the counterparties do not perform under the contracts' terms.
Foreign-denominated assets, including investment securities, and liabilities are translated into U.S. dollars at the exchange rate at period end. Purchases and sales of investment securities, income and dividends received and expenses denominated in foreign currencies are translated into U.S. dollars at the exchange rate in effect on the transaction date.
The effects of exchange rate fluctuations on investments are included with the net realized and unrealized gain (loss) on investment securities. Other foreign currency transactions resulting in realized and unrealized gain (loss) are disclosed separately.
Investment Transactions and Income. For financial reporting purposes, the Fund's investment holdings and NAV include trades executed through the end of the last business day of the period. The NAV per share for processing shareholder transactions is calculated as of the close of business of the New York Stock Exchange (NYSE), normally 4:00 p.m. Eastern time and includes trades executed through the end of the prior business day. Gains and losses on securities sold are determined on the basis of identified cost. Dividend income is recorded on the ex-dividend date, except for certain dividends from foreign securities where the ex-dividend date may have passed, which are recorded as soon as the Fund is informed of the ex-dividend date. Non-cash dividends included in dividend income, if any, are recorded at the fair market value of the securities received. Distributions received on securities that represent a return of capital or capital gain are recorded as a reduction of cost of investments and/or as a realized gain. The Fund estimates the components of distributions received that may be considered return of capital distributions or capital gain distributions. Interest income and distributions from the Fidelity Central Funds are accrued as earned. Interest income includes coupon
Annual Report
3. Significant Accounting Policies - continued
Investment Transactions and Income - continued
interest and amortization of premium and accretion of discount on debt securities. Investment income is recorded net of foreign taxes withheld where recovery of such taxes is uncertain.
Expenses. Expenses directly attributable to a fund are charged to that fund. Expenses attributable to more than one fund are allocated among the respective funds on the basis of relative net assets or other appropriate methods. Expense estimates are accrued in the period to which they relate and adjustments are made when actual amounts are known.
Income Tax Information and Distributions to Shareholders. Each year, the Fund intends to qualify as a regulated investment company, including distributing substantially all of its taxable income and realized gains under Subchapter M of the Internal Revenue Code and filing its U.S. federal tax return. As a result, no provision for income taxes is required. As of October 31, 2011, the Fund did not have any unrecognized tax benefits in the financial statements. A fund's federal tax return is subject to examination by the Internal Revenue Service (IRS) for a period of three years. Foreign taxes are provided for based on the Fund's understanding of the tax rules and rates that exist in the foreign markets in which it invests.
Distributions are declared and recorded on the ex-dividend date. Income dividends and capital gain distributions are declared separately for each class. Income and capital gain distributions are determined in accordance with income tax regulations, which may differ from GAAP.
Capital accounts within the financial statements are adjusted for permanent book-tax differences. These adjustments have no impact on net assets or the results of operations. Temporary book-tax differences will reverse in a subsequent period.
Book-tax differences are primarily due to foreign currency transactions, passive foreign investment companies (PFIC), partnerships, capital loss carryforwards and losses deferred due to wash sales.
The federal tax cost of investment securities and unrealized appreciation (depreciation) as of period end were as follows:
Gross unrealized appreciation | $ 7,855,689 |
Gross unrealized depreciation | (14,110,478) |
Net unrealized appreciation (depreciation) on securities and other investments | $ (6,254,789) |
| |
Tax Cost | $ 145,212,557 |
Annual Report
Notes to Financial Statements - continued
3. Significant Accounting Policies - continued
Income Tax Information and Distributions to Shareholders - continued
The tax-based components of distributable earnings as of period end were as follows:
Undistributed ordinary income | $ 1,552,850 |
Capital loss carryforward | $ (33,183,732) |
Net unrealized appreciation (depreciation) | $ (6,246,842) |
Under the recently enacted Regulated Investment Company Modernization Act of 2010 (the Act), the Fund will be permitted to carry forward capital losses incurred in taxable years beginning after December 22, 2010 for an unlimited period. However, any losses incurred during those future taxable years will be required to be utilized prior to any losses incurred in pre-enactment taxable years, which generally expire after eight years from when they are incurred. Additionally, post-enactment capital losses that are carried forward will retain their character as either short-term or long-term capital losses rather than being considered all short-term as under previous law. The Fund's first fiscal year end subject to the Act will be October 31, 2012.
The tax character of distributions paid was as follows:
| October 31, 2011 | October 31, 2010 |
Ordinary Income | $ 1,173,335 | $ 581,158 |
Short-Term Trading (Redemption) Fees. Shares held by investors in the Fund less than 30 days are subject to a redemption fee equal to 1.00% of the net asset value of shares redeemed. All redemption fees, which reduce the proceeds of the shareholder redemption, are retained by the Fund and accounted for as an addition to paid in capital.
New Accounting Pronouncement. In May 2011, the Financial Accounting Standards Board issued Accounting Standard Update No. 2011-04, Fair Value Measurement (Topic 820) - Amendments to Achieve Common Fair Value Measurement and Disclosure Requirements in U.S. GAAP and IFRSs. The update changes the wording used to describe the requirements in GAAP for measuring fair value and for disclosing information about fair value measurements. The update is effective during interim and annual periods beginning after December 15, 2011. Management is currently evaluating the impact of the update's adoption on the Fund's financial statement disclosures.
4. Operating Policies.
Delayed Delivery Transactions and When-Issued Securities. During the period, the Fund transacted in securities on a delayed delivery or when-issued basis. Payment and delivery may take place after the customary settlement period for that security. The
Annual Report
4. Operating Policies - continued
Delayed Delivery Transactions and When-Issued Securities - continued
price of the underlying securities and the date when the securities will be delivered and paid for are fixed at the time the transaction is negotiated. During the time a delayed delivery sell is outstanding, the contract is marked-to-market daily and equivalent deliverable securities are held for the transaction. The securities purchased on a delayed delivery or when-issued basis are identified as such in the Fund's Schedule of Investments. The Fund may receive compensation for interest forgone in the purchase of a delayed delivery or when-issued security. With respect to purchase commitments, the Fund identifies securities as segregated in its records with a value at least equal to the amount of the commitment. Losses may arise due to changes in the value of the underlying securities or if the counterparty does not perform under the contract's terms, or if the issuer does not issue the securities due to political, economic, or other factors.
Restricted Securities. The Fund may invest in securities that are subject to legal or contractual restrictions on resale. These securities generally may be resold in transactions exempt from registration or to the public if the securities are registered. Disposal of these securities may involve time-consuming negotiations and expense, and prompt sale at an acceptable price may be difficult. Information regarding restricted securities is included at the end of the Fund's Schedule of Investments.
5. Purchases and Sales of Investments.
Purchases and sales of securities, other than short-term securities, aggregated $169,182,591 and $84,756,770, respectively.
6. Fees and Other Transactions with Affiliates.
Management Fee. FMR and its affiliates provide the Fund with investment management related services for which the Fund pays a monthly management fee. The management fee is the sum of an individual fund fee rate that is based on an annual rate of .45% of the Fund's average net assets and a group fee rate that averaged .26% during the period. The group fee rate is based upon the average net assets of all the mutual funds advised by FMR. The group fee rate decreases as assets under management increase and increases as assets under management decrease. In addition, the management fee is subject to a performance adjustment (up to a maximum of ± .20% of the Fund's average net assets over a 36 month performance period). The upward or downward adjustment to the management fee is based on the relative investment performance of Total International Equity as compared to an appropriate benchmark index. For the period, the total annual management fee rate, including the performance adjustment, was .69% of the Fund's average net assets.
Annual Report
Notes to Financial Statements - continued
6. Fees and Other Transactions with Affiliates - continued
Distribution and Service Plan Fees. In accordance with Rule 12b-1 of the 1940 Act, the Fund has adopted separate Distribution and Service Plans for each class of shares. Certain classes pay Fidelity Distributors Corporation (FDC), an affiliate of FMR, separate Distribution and Service Fees, each of which is based on an annual percentage of each class' average net assets. In addition, FDC may pay financial intermediaries for selling shares of the Fund and providing shareholder support services. For the period, the Distribution and Service Fee rates, total fees and amounts retained by FDC were as follows:
| Distribution
Fee | Service
Fee | Total Fees | Retained
by FDC |
Class A | -% | .25% | $ 12,983 | $ 1,616 |
Class T | .25% | .25% | 5,374 | 38 |
Class B | .75% | .25% | 3,026 | 2,283 |
Class C | .75% | .25% | 15,058 | 2,823 |
| | | $ 36,441 | $ 6,760 |
Sales Load. FDC may receive a front-end sales charge of up to 5.75% for selling Class A shares, and 3.50% for selling Class T shares, some of which is paid to financial intermediaries for selling shares of the Fund. Depending on the holding period, FDC may receive contingent deferred sales charges levied on Class A, Class T, Class B, and Class C redemptions. The deferred sales charges range from 5% to 1% for Class B, 1% for Class C, 1.00% for certain purchases of Class A shares and .25% for certain purchases of Class T shares.
For the period, sales charge amounts retained by FDC were as follows:
| Retained
by FDC |
Class A | $ 2,591 |
Class T | 454 |
Class B* | 305 |
Class C* | 219 |
| $ 3,569 |
* When Class B and Class C shares are initially sold, FDC pays commissions from its own resources to financial intermediaries through which the sales are made.
Transfer Agent Fees. Fidelity Investments Institutional Operations Company, Inc. (FIIOC), an affiliate of FMR, is the transfer, dividend disbursing and shareholder servicing agent for each class of the Fund. FIIOC receives account fees and asset-based fees that vary according to the account size and type of account of the shareholders of the respective classes of the Fund. FIIOC pays for typesetting, printing and mailing of
Annual Report
6. Fees and Other Transactions with Affiliates - continued
Transfer Agent Fees - continued
shareholder reports, except proxy statements. For the period, transfer agent fees for each class were as follows:
| Amount | % of
Average
Net Assets |
Class A | $ 14,366 | .28 |
Class T | 3,388 | .32 |
Class B | 928 | .31 |
Class C | 4,603 | .31 |
Total International Equity | 250,636 | .24 |
Institutional Class | 464 | .30 |
| $ 274,385 | |
Accounting and Security Lending Fees. Fidelity Service Company, Inc. (FSC), an affiliate of FMR, maintains the Fund's accounting records. The accounting fee is based on the level of average net assets for the month. Under a separate contract, FSC administers the security lending program. The security lending fee is based on the number and duration of lending transactions.
Brokerage Commissions. The Fund placed a portion of its portfolio transactions with brokerage firms which are affiliates of the investment adviser. The commissions paid to these affiliated firms were $901 for the period.
7. Committed Line of Credit.
The Fund participates with other funds managed by FMR or an affiliate in a $4.0 billion credit facility (the "line of credit") to be utilized for temporary or emergency purposes to fund shareholder redemptions or for other short-term liquidity purposes. The Fund has agreed to pay commitment fees on its pro-rata portion of the line of credit, which amounted to $320 and is reflected in Miscellaneous expenses on the Statement of Operations. During the period, there were no borrowings on this line of credit.
8. Security Lending.
The Fund lends portfolio securities through a lending agent from time to time in order to earn additional income. For equity securities, a lending agent is used and may loan securities to certain qualified borrowers, including Fidelity Capital Markets (FCM), a broker-dealer affiliated with the Fund. On the settlement date of the loan, the Fund receives collateral (in the form of U.S. Treasury obligations, letters of credit and/or cash) against the loaned securities and maintains collateral in an amount not less than 100% of
Annual Report
Notes to Financial Statements - continued
8. Security Lending - continued
the market value of the loaned securities during the period of the loan. The market value of the loaned securities is determined at the close of business of the Fund and any additional required collateral is delivered to the Fund on the next business day. If the borrower defaults on its obligation to return the securities loaned because of insolvency or other reasons, a fund could experience delays and costs in recovering the securities loaned or in gaining access to the collateral. Any cash collateral received is invested in the Fidelity Securities Lending Cash Central Fund. The value of loaned securities and cash collateral at period end are disclosed on the Fund's Statement of Assets and Liabilities. Security lending income represents the income earned on investing cash collateral, less rebates paid to borrowers and any lending agent fees associated with the loan, plus any premium payments received for lending certain types of securities. Security lending income is presented in the Statement of Operations as a component of income from Fidelity Central Funds. Total security lending income during the period amounted to $31,105. During the period, there were no securities loaned to FCM.
9. Expense Reductions.
FMR contractually agreed to reimburse each class to the extent annual operating expenses exceeded certain levels of average net assets as noted in the table below. This reimbursement will remain in place through December 31, 2012. Some expenses, for example interest expense, including commitment fees, are excluded from this reimbursement.
The following classes were in reimbursement during the period:
| Expense
Limitations | Reimbursement
from adviser |
Class A | 1.45% | $ 14,721 |
Class T | 1.70% | 3,433 |
Class B | 2.20% | 954 |
Class C | 2.20% | 4,689 |
Total International Equity | 1.20% | 229,885 |
Institutional Class | 1.20% | 437 |
| | $ 254,119 |
In addition, FMR voluntarily agreed to reimburse a portion of its management fee. For the period, the amount of this reimbursement was $1,529.
Many of the brokers with whom FMR places trades on behalf of the Fund provided services to the Fund in addition to trade execution. These services included payments of certain expenses on behalf of the Fund totaling $31,513 for the period.
Annual Report
10. Distributions to Shareholders.
Distributions to shareholders of each class were as follows:
Years ended October 31, | 2011 | 2010 |
From net investment income | | |
Class A | $ 61,018 | $ 26,391 |
Class T | 9,414 | - |
Class B | 1,488 | - |
Class C | 6,263 | - |
Total International Equity | 873,280 | 382,451 |
Institutional Class | 1,578 | 2,381 |
Total | $ 953,041 | $ 411,223 |
From net realized gain | | |
Class A | $ 16,196 | $ 14,995 |
Class T | 3,213 | - |
Class B | 1,016 | - |
Class C | 4,485 | - |
Total International Equity | 195,026 | 154,214 |
Institutional Class | 358 | 726 |
Total | $ 220,294 | $ 169,935 |
11. Share Transactions.
Transactions for each class of shares were as follows:
| Shares | Dollars |
Years ended October 31, | 2011 | 2010 | 2011 | 2010 |
Class A | | | | |
Shares sold | 231,083 | 443,125 | $ 1,708,687 | $ 2,924,922 |
Reinvestment of distributions | 10,039 | 5,568 | 74,076 | 37,804 |
Shares redeemed | (279,366) | (347,260) | (2,035,449) | (2,296,503) |
Net increase (decrease) | (38,244) | 101,433 | $ (252,686) | $ 666,223 |
Class T | | | | |
Shares sold | 37,121 | 121,719 | $ 276,509 | $ 807,663 |
Reinvestment of distributions | 1,678 | - | 12,524 | - |
Shares redeemed | (25,970) | (224,749) | (191,826) | (1,531,457) |
Net increase (decrease) | 12,829 | (103,030) | $ 97,207 | $ (723,794) |
Class B | | | | |
Shares sold | 3,282 | 30,066 | $ 24,631 | $ 198,826 |
Reinvestment of distributions | 331 | - | 2,469 | - |
Shares redeemed | (9,973) | (194,792) | (73,676) | (1,332,260) |
Net increase (decrease) | (6,360) | (164,726) | $ (46,576) | $ (1,133,434) |
Annual Report
Notes to Financial Statements - continued
11. Share Transactions - continued
| Shares | Dollars |
Years ended October 31, | 2011 | 2010 | 2011 | 2010 |
Class C | | | | |
Shares sold | 66,879 | 86,496 | $ 498,161 | $ 580,588 |
Reinvestment of distributions | 1,425 | - | 10,610 | - |
Shares redeemed | (52,554) | (161,545) | (388,669) | (1,102,805) |
Net increase (decrease) | 15,750 | (75,049) | $ 120,102 | $ (522,217) |
Total International Equity | | | | |
Shares sold | 16,784,298 | 6,833,012 | $ 125,543,898 | $ 45,955,028 |
Reinvestment of distributions | 135,624 | 74,043 | 1,000,533 | 502,009 |
Shares redeemed | (5,532,363) | (3,806,841) | (39,913,646) | (24,965,317) |
Net increase (decrease) | 11,387,559 | 3,100,214 | $ 86,630,785 | $ 21,491,720 |
Institutional Class | | | | |
Shares sold | 26,909 | 377 | $ 202,383 | $ 2,481 |
Reinvestment of distributions | 263 | 460 | 1,936 | 3,106 |
Shares redeemed | (1,422) | (201,123) | (10,588) | (1,373,455) |
Net increase (decrease) | 25,750 | (200,286) | $ 193,731 | $ (1,367,868) |
12. Other.
The Fund's organizational documents provide former and current trustees and officers with a limited indemnification against liabilities arising in connection with the performance of their duties to the Fund. In the normal course of business, the Fund may also enter into contracts that provide general indemnifications. The Fund's maximum exposure under these arrangements is unknown as this would be dependent on future claims that may be made against the Fund. The risk of material loss from such claims is considered remote.
Annual Report
To the Trustees of Fidelity Investment Trust and Shareholders of Fidelity Total International Equity Fund:
We have audited the accompanying statement of assets and liabilities of Fidelity Total International Equity Fund (the Fund), a fund of Fidelity Investment Trust, including the schedule of investments, as of October 31, 2011, and the related statement of operations for the year then ended, the statement of changes in net assets for each of the two years in the period then ended, and the financial highlights for each of the four years in the period then ended. These financial statements and financial highlights are the responsibility of the Fund's management. Our responsibility is to express an opinion on these financial statements and financial highlights based on our audits.
We conducted our audits in accordance with the standards of the Public Company Accounting Oversight Board (United States). Those standards require that we plan and perform the audit to obtain reasonable assurance about whether the financial statements and financial highlights are free of material misstatement. The Fund is not required to have, nor were we engaged to perform, an audit of its internal control over financial reporting. Our audits included consideration of internal control over financial reporting as a basis for designing audit procedures that are appropriate in the circumstances, but not for the purpose of expressing an opinion on the effectiveness of the Fund's internal control over financial reporting. Accordingly, we express no such opinion. An audit also includes examining, on a test basis, evidence supporting the amounts and disclosures in the financial statements, assessing the accounting principles used and significant estimates made by management, as well as evaluating the overall financial statement presentation. Our procedures included confirmation of securities owned as of October 31, 2011, by correspondence with the custodians and brokers; where replies were not received from brokers, we performed other auditing procedures. We believe that our audits provide a reasonable basis for our opinion.
In our opinion, the financial statements and financial highlights referred to above present fairly, in all material respects, the financial position of Fidelity Total International Equity Fund as of October 31, 2011, the results of its operations for the year then ended, the changes in its net assets for each of the two years in the period then ended, and the financial highlights for each of the four years in the period then ended, in conformity with accounting principles generally accepted in the United States of America.
DELOITTE & TOUCHE LLP
Boston, Massachusetts
December 13, 2011
Annual Report
The Trustees, Members of the Advisory Board, and executive officers of the trust and fund, as applicable, are listed below. The Board of Trustees governs the fund and is responsible for protecting the interests of shareholders. The Trustees are experienced executives who meet periodically throughout the year to oversee the fund's activities, review contractual arrangements with companies that provide services to the fund, oversee management of the risks associated with such activities and contractual arrangements, and review the fund's performance. Except for James C. Curvey, each of the Trustees oversees 226 funds advised by FMR or an affiliate. Mr. Curvey oversees 429 funds advised by FMR or an affiliate.
The Trustees hold office without limit in time except that (a) any Trustee may resign; (b) any Trustee may be removed by written instrument, signed by at least two-thirds of the number of Trustees prior to such removal; (c) any Trustee who requests to be retired or who has become incapacitated by illness or injury may be retired by written instrument signed by a majority of the other Trustees; and (d) any Trustee may be removed at any special meeting of shareholders by a two-thirds vote of the outstanding voting securities of the trust. Each Trustee who is not an interested person (as defined in the 1940 Act) (Independent Trustee), shall retire not later than the last day of the calendar year in which his or her 75th birthday occurs. The Independent Trustees may waive this mandatory retirement age policy with respect to individual Trustees. The executive officers and Advisory Board Members hold office without limit in time, except that any officer and Advisory Board Member may resign or may be removed by a vote of a majority of the Trustees at any regular meeting or any special meeting of the Trustees. Except as indicated, each individual has held the office shown or other offices in the same company for the past five years.
Experience, Skills, Attributes, and Qualifications of the Fund's Trustees. The Governance and Nominating Committee has adopted a statement of policy that describes the experience, qualifications, attributes, and skills that are necessary and desirable for potential Independent Trustee candidates (Statement of Policy). The Board believes that each Trustee satisfied at the time he or she was initially elected or appointed a Trustee, and continues to satisfy, the standards contemplated by the Statement of Policy. The Governance and Nominating Committee also engages professional search firms to help identify potential Independent Trustee candidates who have the experience, qualifications, attributes, and skills consistent with the Statement of Policy. From time to time, additional criteria based on the composition and skills of the current Independent Trustees, as well as experience or skills that may be appropriate in light of future changes to board composition, business conditions, and regulatory or other developments, have also been considered by the professional search firms and the Governance and Nominating Committee. In addition, the Board takes into account the Trustees' commitment and participation in Board and committee meetings, as well as their leadership of standing and ad hoc committees throughout their tenure.
In determining that a particular Trustee was and continues to be qualified to serve as a Trustee, the Board has considered a variety of criteria, none of which, in isolation, was controlling. The Board believes that, collectively, the Trustees have balanced and diverse experience, qualifications, attributes, and skills, which allow the Board to operate effectively in governing the fund and protecting the interests of shareholders. Information about the specific experience, skills, attributes, and qualifications of each Trustee, which in each case led to the Board's conclusion that the Trustee should serve (or continue to serve) as a trustee of the fund, is provided below.
Annual Report
Board Structure and Oversight Function. James C. Curvey is an interested person (as defined in the 1940 Act) and currently serves as Acting Chairman. The Trustees have determined that an interested Chairman is appropriate and benefits shareholders because an interested Chairman has a personal and professional stake in the quality and continuity of services provided to the fund. Independent Trustees exercise their informed business judgment to appoint an individual of their choosing to serve as Chairman, regardless of whether the Trustee happens to be independent or a member of management. The Independent Trustees have determined that they can act independently and effectively without having an Independent Trustee serve as Chairman and that a key structural component for assuring that they are in a position to do so is for the Independent Trustees to constitute a substantial majority for the Board. The Independent Trustees also regularly meet in executive session. Ned C. Lautenbach serves as Chairman of the Independent Trustees and as such (i) acts as a liaison between the Independent Trustees and management with respect to matters important to the Independent Trustees and (ii) with management prepares agendas for Board meetings.
Fidelity funds are overseen by different Boards of Trustees. The fund's Board oversees Fidelity's equity and high income funds and another Board oversees Fidelity's investment-grade bond, money market, and asset allocation funds. The asset allocation funds may invest in Fidelity funds overseen by the fund's Board. The use of separate Boards, each with its own committee structure, allows the Trustees of each group of Fidelity funds to focus on the unique issues of the funds they oversee, including common research, investment, and operational issues. On occasion, the separate Boards establish joint committees to address issues of overlapping consequences for the Fidelity funds overseen by each Board.
The Trustees operate using a system of committees to facilitate the timely and efficient consideration of all matters of importance to the Trustees, the fund, and fund shareholders and to facilitate compliance with legal and regulatory requirements and oversight of the fund's activities and associated risks. The Board, acting through its committees, has charged FMR and its affiliates with (i) identifying events or circumstances the occurrence of which could have demonstrably adverse effects on the fund's business and/or reputation; (ii) implementing processes and controls to lessen the possibility that such events or circumstances occur or to mitigate the effects of such events or circumstances if they do occur; and (iii) creating and maintaining a system designed to evaluate continuously business and market conditions in order to facilitate the identification and implementation processes described in (i) and (ii) above. Because the day-to-day operations and activities of the fund are carried out by or through FMR, its affiliates and other service providers, the fund's exposure to risks is mitigated but not eliminated by the processes overseen by the Trustees. While each of the Board's committees has responsibility for overseeing different aspects of the fund's activities, oversight is exercised primarily through the Operations, Audit, and Compliance Committees. In addition, the Independent Trustees have worked with FMR to enhance the Board's oversight of investment and financial risks, legal and regulatory risks, technology risks, and operational risks, including the development of additional risk reporting to the Board. For example, a working group comprised of Independent Trustees and FMR has worked and continues to work to review the Fidelity funds' valuation-related activities, reporting and risk management. Appropriate personnel, including but not limited to the fund's Chief Compliance Officer (CCO), FMR's internal auditor, the independent accountants, the fund's Treasurer and portfolio management personnel, make periodic reports to the Board's committees, as appropriate, including an annual review of FMR's risk management program for the Fidelity funds. The responsibilities of each standing committee, including their oversight responsibilities, are described further under "Standing Committees of the Fund's Trustees."
Annual Report
Trustees and Officers - continued
The fund's Statement of Additional Information (SAI) includes more information about the Trustees. To request a free copy, call Fidelity at 1-877-208-0098.
Interested Trustees*:
Correspondence intended for each Trustee who is an interested person may be sent to Fidelity Investments, 82 Devonshire Street, Boston, Massachusetts 02109.
Name, Age; Principal Occupations and Other Relevant Experience+ |
James C. Curvey (76) |
| Year of Election or Appointment: 2007 Mr. Curvey is Trustee and Acting Chairman of the Board of Trustees of certain Trusts. Mr. Curvey also serves as Trustee (2007-present) of other investment companies advised by FMR. Mr. Curvey is a Director of Fidelity Investments Money Management, Inc. (2009-present), Director of Fidelity Research & Analysis Co. (2009-present) and Director of FMR and FMR Co., Inc. (2007-present). Mr. Curvey is also Vice Chairman (2007-present) and Director of FMR LLC. In addition, Mr. Curvey serves as an Overseer for the Boston Symphony Orchestra and a member of the Trustees of Villanova University. Previously, Mr. Curvey was the Vice Chairman (2006-2007) and Director (2000-2007) of FMR Corp. |
Ronald P. O'Hanley (54) |
| Year of Election or Appointment: 2011 Mr. O'Hanley is Director of FMR Co., Inc. (2010-present), Director of Fidelity Investments Money Management, Inc. (2010-present), Director of Fidelity Research & Analysis Company (2010-present), President of Fidelity Asset Management and Corporate Services and a member of Fidelity's Executive Committee (2010-present). Previously, Mr. O'Hanley served as President and Chief Executive Officer of BNY Mellon Asset Management (2007-2010). Mr. O'Hanley also served as Vice Chairman of Bank New York Mellon Corp. and a member of that firm's Executive Committee. Prior to the 2007 merger of The Bank of New York and Mellon Financial Corporation, he was Vice Chairman of Mellon Financial Corporation and President and Chief Executive Officer of Mellon Asset Management. He joined Mellon in February 1997. Mr. O'Hanley currently serves as Chairman of the Boston Public Library Foundation Board of Directors and sits on the Board of Directors of Beth Israel Deaconess Medical Center, the Board of Trustees of the Marine Biological Laboratory and the Advisory Board of the Maxwell School of Citizenship and Public Administration at Syracuse University. Mr. O'Hanley also chairs the Council on Asset Management for the Financial Services Roundtable and is a member of the Board of Directors of Institutional Investor's U.S. Institute. |
* Trustees have been determined to be "Interested Trustees" by virtue of, among other things, their affiliation with the trust or various entities under common control with FMR.
+ The information above includes each Trustee's principal occupation during the last five years and other information relating to the experience, attributes, and skills relevant to each Trustee's qualifications to serve as a Trustee, which led to the conclusion that each Trustee should serve as a Trustee for the fund.
Annual Report
Trustees and Officers - continued
Independent Trustees:
Correspondence intended for each Independent Trustee (that is, the Trustees other than the Interested Trustees) may be sent to Fidelity Investments, P.O. Box 55235, Boston, Massachusetts 02205-5235.
Name, Age; Principal Occupations and Other Relevant Experience+ |
Dennis J. Dirks (63) |
| Year of Election or Appointment: 2005 Prior to his retirement in May 2003, Mr. Dirks was Chief Operating Officer and a member of the Board of The Depository Trust & Clearing Corporation (DTCC). He also served as President, Chief Operating Officer, and Board member of The Depository Trust Company (DTC) and President and Board member of the National Securities Clearing Corporation (NSCC). In addition, Mr. Dirks served as Chief Executive Officer and Board member of the Government Securities Clearing Corporation, Chief Executive Officer and Board member of the Mortgage-Backed Securities Clearing Corporation, as a Trustee and a member of the Finance Committee of Manhattan College (2005-2008), and as a Trustee and a member of the Finance Committee of AHRC of Nassau County (2006-2008). Mr. Dirks is a member of the Independent Directors Council (IDC) Governing Council (2010-Present) and Board of Directors for The Brookville Center for Children's Services, Inc. (2009-present). |
Alan J. Lacy (58) |
| Year of Election or Appointment: 2008 Mr. Lacy serves as Senior Adviser (2007-present) of Oak Hill Capital Partners, L.P. (private equity). Mr. Lacy also served as Chief Executive Officer (2000-2005) and Vice Chairman (2005-2006) of Sears Holdings Corporation and Sears, Roebuck and Co. (retail). In addition, Mr. Lacy serves as a member of the Board of Directors of Dave & Buster's, Inc. (restaurant and entertainment complexes, 2010-present), The Hillman Companies, Inc. (hardware wholesalers, 2010-present), and Bristol-Myers Squibb Company (global pharmaceuticals, 2007-present). Mr. Lacy is a member of the Board of Trustees of The National Parks Conservation Association (2006-Present). Previously, Mr. Lacy served as Chairman of the Board of Trustees of the National Parks Conservation Association (2008-2011) and as a member of the Board of Directors for the Western Union Company (global money transfer, 2006-2011). |
Ned C. Lautenbach (67) |
| Year of Election or Appointment: 2000 Mr. Lautenbach is Chairman of the Independent Trustees of the Equity and High Income Funds (2006-present). Mr. Lautenbach currently serves as the Lead Director of the Eaton Corporation Board of Directors (diversified industrial, 1997-present). Mr. Lautenbach is also a member of the Board of Directors of the Philharmonic Center for the Arts in Naples, Florida (1999-present); a member of the Board of Trustees of Fairfield University (2005-present); and a member of the Council on Foreign Relations (1994-present). Previously, Mr. Lautenbach was a Partner/Advisory Partner at Clayton, Dubilier & Rice, LLC (private equity investment, 1998-2010), as well as a Director of Sony Corporation (2006-2007). |
Joseph Mauriello (67) |
| Year of Election or Appointment: 2008 Prior to his retirement in January 2006, Mr. Mauriello served in numerous senior management positions including Deputy Chairman and Chief Operating Officer (2004-2005), and Vice Chairman of Financial Services (2002-2004) of KPMG LLP US (professional services, 1965-2005). Mr. Mauriello currently serves as a member of the Board of Directors of XL Group plc. (global insurance and re-insurance, 2006-present) and of Arcadia Resources Inc. (health care services and products, 2007-present). Previously, Mr. Mauriello served as a Director of the Hamilton Funds of the Bank of New York (2006-2007). |
Robert W. Selander (61) |
| Year of Election or Appointment: 2011 Previously, Mr. Selander served as a Member of the Advisory Board of Fidelity's Equity and High Income Funds (2011), Executive Vice Chairman (2010), Chief Executive Officer (2009-2010), and President and Chief Executive Officer (1997-2009) of Mastercard, Inc. |
Cornelia M. Small (67) |
| Year of Election or Appointment: 2005 Ms. Small is a member of the Board of Directors of the Teagle Foundation (2009-present). Ms. Small is also a member of the Investment Committee, and Chair (2008-present) and a member of the Board of Trustees of Smith College. In addition, Ms. Small serves on the Investment Committee of the Berkshire Taconic Community Foundation (2008-present). Previously, Ms. Small served as Chairperson of the Investment Committee (2002-2008) of Smith College. In addition, Ms. Small served as Chief Investment Officer, Director of Global Equity Investments, and a member of the Board of Directors of Scudder, Stevens & Clark and Scudder Kemper Investments. |
William S. Stavropoulos (72) |
| Year of Election or Appointment: 2001 Mr. Stavropoulos is Vice Chairman of the Independent Trustees of the Equity and High Income Funds (2006-present). Mr. Stavropoulos serves as President and Founder of the Michigan Baseball Foundation, the Great Lakes Loons (2007-present). Mr. Stavropoulos is Chairman Emeritus of the Board of Directors of The Dow Chemical Company, where he previously served in numerous senior management positions, including President, CEO (1995-2000; 2002-2004), Chairman of the Executive Committee (2000-2006), and as a member of the Board of Directors (1990-2006). Currently, Mr. Stavropoulos is Chairman of Univar (global distributor of commodity and specialty chemicals, 2010-present), a Director of Teradata Corporation (data warehousing and technology solutions, 2008-present), Chemical Financial Corporation, Maersk Inc. (industrial conglomerate), Tyco International, Inc. (multinational manufacturing and services, 2007-present), and a member of the Advisory Board for Metalmark Capital (private equity investment, 2005-present). Mr. Stavropoulos is a special advisor to Clayton, Dubilier & Rice, LLC (private equity investment). In addition, Mr. Stavropoulos is a member of the University of Notre Dame Advisory Council for the College of Science. |
David M. Thomas (62) |
| Year of Election or Appointment: 2008 Previously, Mr. Thomas served as Executive Chairman (2005-2006) and Chairman and Chief Executive Officer (2000-2005) of IMS Health, Inc. (pharmaceutical and healthcare information solutions). In addition, Mr. Thomas serves as a member of the Board of Directors of Fortune Brands, Inc. (consumer products), and Interpublic Group of Companies, Inc. (marketing communication, 2004-present). |
Michael E. Wiley (61) |
| Year of Election or Appointment: 2008 Mr. Wiley also serves as a Director of Asia Pacific Exploration Consolidated (international oil and gas exploration and production, 2008-present). Mr. Wiley serves as a Director of Tesoro Corporation (independent oil refiner and marketer, 2005-present), and a Director of Bill Barrett Corporation (exploration and production, 2005-present). In addition, Mr. Wiley also serves as a Director of Post Oak Bank (privately-held bank, 2004-present). Previously, Mr. Wiley served as a member of the Board of Trustees of the University of Tulsa (2000-2006; 2007-2010), as a Senior Energy Advisor of Katzenbach Partners, LLC (consulting, 2006-2007), as an Advisory Director of Riverstone Holdings (private investment), Chairman, President, and CEO of Baker Hughes, Inc. (oilfield services, 2000-2004), and as Director of Spinnaker Exploration Company (exploration and production, 2001-2005). |
Annual Report
+ The information above includes each Trustee's principal occupation during the last five years and other information relating to the experience, attributes, and skills relevant to each Trustee's qualifications to serve as a Trustee, which led to the conclusion that each Trustee should serve as a Trustee for the fund.
Advisory Board Members and Executive Officers:
Correspondence intended for each executive officer, Edward C. Johnson 3d, and Peter S. Lynch may be sent to Fidelity Investments, 82 Devonshire Street, Boston, Massachusetts 02109.
Name, Age; Principal Occupation |
Edward C. Johnson 3d (81) |
| Year of Election or Appointment: 2011 Member of the Advisory Board of Fidelity's Equity and High Income Funds. Mr. Johnson serves as Chief Executive Officer, Chairman, and a Director of FMR LLC, and also serves as Chairman and Director of FIL Limited. Previously, Mr. Johnson served as a Trustee and Chairman of the Board of certain Fidelity Trusts, Chairman and a Director of FMR, Chairman and a Director of FMR Co., Inc., and President of FMR LLC (2006-2007). |
Peter S. Lynch (67) |
| Year of Election or Appointment: 2003 Member of the Advisory Board of Fidelity's Equity and High Income Funds. Mr. Lynch is Vice Chairman and a Director of FMR and FMR Co., Inc. In addition, Mr. Lynch serves as a Trustee of Boston College and as the Chairman of the Inner-City Scholarship Fund. Previously, Mr. Lynch served on the Special Olympics International Board of Directors (1997-2006). |
Kenneth B. Robins (42) |
| Year of Election or Appointment: 2008 President and Treasurer of Fidelity's Equity and High Income Funds. Mr. Robins also serves as President and Treasurer (2010-present) and Assistant Treasurer (2009-present) of other Fidelity funds and is an employee of Fidelity Investments (2004-present). Previously, Mr. Robins served as Deputy Treasurer of the Fidelity funds (2005-2008) and Treasurer and Chief Financial Officer of The North Carolina Capital Management Trust: Cash and Term Portfolios (2006-2008). |
Bruce T. Herring (46) |
| Year of Election or Appointment: 2006 Vice President of certain Equity Funds. Mr. Herring also serves as Chief Investment Officer and Director of Fidelity Management & Research (U.K.) Inc. (2010-present) and Group Chief Investments Officer of FMR. Previously, Mr. Herring served as Vice President (2005-2006) and Senior Vice President (2006-2007) of Fidelity Management & Research Company, Vice President of FMR Co., Inc. (2001-2007) and as a portfolio manager for Fidelity U.S. Equity Funds. |
Brian B. Hogan (47) |
| Year of Election or Appointment: 2009 Vice President of Equity and High Income Funds. Mr. Hogan also serves as President of FMR's Equity Division (2009-present). Previously, Mr. Hogan served as Senior Vice President, Equity Research of FMR (2006-2009) and as a portfolio manager. |
Scott C. Goebel (43) |
| Year of Election or Appointment: 2008 Secretary and Chief Legal Officer (CLO) of the Fidelity funds. Mr. Goebel also serves as Secretary of Fidelity Investments Money Management, Inc. (FIMM) (2010-present) and Fidelity Research and Analysis Company (FRAC) (2010-present); Secretary and CLO of The North Carolina Capital Management Trust: Cash and Term Portfolios (2008-present); General Counsel, Secretary, and Senior Vice President of FMR (2008-present) and FMR Co., Inc. (2008-present); employed by FMR LLC or an affiliate (2001-present); Chief Legal Officer of Fidelity Management & Research (Hong Kong) Limited (2008-present) and Assistant Secretary of Fidelity Management & Research (Japan) Inc. (2008-present), and Fidelity Management & Research (U.K.) Inc. (2008-present). Previously, Mr. Goebel served as Assistant Secretary of FIMM (2008-2010), FRAC (2008-2010), and the Funds (2007-2008) and as Vice President and Secretary of Fidelity Distributors Corporation (FDC) (2005-2007). |
William C. Coffey (42) |
| Year of Election or Appointment: 2009 Assistant Secretary of Fidelity's Equity and High Income Funds. Mr. Coffey also serves as Senior Vice President and Deputy General Counsel of FMR LLC (2010-present), and is an employee of Fidelity Investments. Previously, Mr. Coffey served as Vice President and Associate General Counsel of FMR LLC (2005-2009). |
Holly C. Laurent (57) |
| Year of Election or Appointment: 2008 Anti-Money Laundering (AML) Officer of the Fidelity funds. Ms. Laurent also serves as AML Officer of The North Carolina Capital Management Trust: Cash and Term Portfolios (2008-present) and is an employee of Fidelity Investments. Previously, Ms. Laurent was Senior Vice President and Head of Legal for Fidelity Business Services India Pvt. Ltd. (2006-2008), and Senior Vice President, Deputy General Counsel and Group Head for FMR LLC (2005-2006). |
Christine Reynolds (53) |
| Year of Election or Appointment: 2008 Chief Financial Officer of the Fidelity funds. Ms. Reynolds became President of Fidelity Pricing and Cash Management Services (FPCMS) in August 2008. Ms. Reynolds served as Chief Operating Officer of FPCMS (2007-2008). Previously, Ms. Reynolds served as President, Treasurer, and Anti-Money Laundering officer of the Fidelity funds (2004-2007). |
Kenneth A. Rathgeber (64) |
| Year of Election or Appointment: 2004 Chief Compliance Officer of Fidelity's Equity and High Income Funds. Mr. Rathgeber is Chief Compliance Officer of Fidelity Management & Research (Hong Kong) Limited (2008-present), Fidelity Management & Research (Japan) Inc. (2008-present), FMR (2005-present), FMR Co., Inc. (2005-present), Fidelity Management & Research (U.K.) Inc. (2005-present), Fidelity Research & Analysis Company (2005-present), Fidelity Investments Money Management, Inc. (2005-present), Pyramis Global Advisors, LLC (2005-present), and Strategic Advisers, Inc. (2005-present). |
Jeffrey S. Christian (50) |
| Year of Election or Appointment: 2009 Deputy Treasurer of the Fidelity funds. Mr. Christian is an employee of Fidelity Investments. Previously, Mr. Christian served as Chief Financial Officer (2008-2009) of certain Fidelity funds and Senior Vice President of Fidelity Pricing and Cash Management Services (FPCMS) (2004-2009). |
Joseph F. Zambello (54) |
| Year of Election or Appointment: 2011 Deputy Treasurer of the Fidelity funds. Mr. Zambello is an employee of Fidelity Investments. Previously, Mr. Zambello served as Vice President of FMR's Program Management Group (2009-2011) and Vice President of the Transfer Agent Oversight Group (2005-2009). |
Adrien E. Deberghes (44) |
| Year of Election or Appointment: 2008 Deputy Treasurer of Fidelity's Equity and High Income Funds. Mr. Deberghes also serves as Vice President and Assistant Treasurer of Fidelity Rutland Square Trust II and Fidelity Commonwealth Trust II (2011-present), Assistant Treasurer of other Fidelity funds (2010-present), and is an employee of Fidelity Investments (2008-present). Previously, Mr. Deberghes served as Senior Vice President of Mutual Fund Administration at State Street Corporation (2007-2008), Senior Director of Mutual Fund Administration at Investors Bank & Trust (2005-2007), and Director of Finance for Dunkin' Brands (2000-2005). |
Stephanie J. Dorsey (42) |
| Year of Election or Appointment: 2010 Assistant Treasurer of Fidelity's Equity and High Income Funds. Ms. Dorsey also serves as Deputy Treasurer of other Fidelity funds (2008-present) and is an employee of Fidelity Investments (2008-present). Previously, Ms. Dorsey served as Treasurer (2004-2008) of the JPMorgan Mutual Funds and Vice President (2004-2008) of JPMorgan Chase Bank. |
John R. Hebble (53) |
| Year of Election or Appointment: 2009 Assistant Treasurer of Fidelity's Equity and High Income Funds. Mr. Hebble also serves as President (2011-present), Treasurer, and Chief Financial Officer of The North Carolina Capital Management Trust: Cash and Term Portfolios (2008-present), President and Treasurer of other Fidelity funds (2008-present) and is an employee of Fidelity Investments. |
Gary W. Ryan (53) |
| Year of Election or Appointment: 2005 Assistant Treasurer of the Fidelity funds. Mr. Ryan is an employee of Fidelity Investments. Previously, Mr. Ryan served as Vice President of Fund Reporting in Fidelity Pricing and Cash Management Services (FPCMS) (1999-2005). |
Jonathan Davis (43) |
| Year of Election or Appointment: 2010 Assistant Treasurer of the Fidelity funds. Mr. Davis is also Assistant Treasurer of Fidelity Rutland Square Trust II and Fidelity Commonwealth Trust II. Mr. Davis is an employee of Fidelity Investments. Previously, Mr. Davis served as Vice President and Associate General Counsel of FMR LLC (2003-2010). |
Annual Report
Class A, Class T, Class B, and Class C designates 100% of the dividends distributed in December 2010 during the fiscal year as amounts which may be taken into account as a dividend for purposes of the maximum rate under section 1(h)(11) of the Internal Revenue Code.
The amounts per share which represent income derived from sources within, and taxes paid to, foreign countries or possessions of the United States are as follows:
| Pay Date | Income | Taxes |
Class A | 12/06/10
12/31/10 | $0.074
0.015 | $0.0112
0.0000 |
| | | |
Class T | 12/06/10
12/31/10 | $0.060
0.015 | $0.0112
0.0000 |
| | | |
Class B | 12/06/10
12/31/10 | $0.036
0.015 | $0.0112
0.0000 |
| | | |
Class C | 12/06/10
12/31/10 | $0.033
0.015 | $0.0112
0.0000 |
The fund will notify shareholders in January 2012 of amounts for use in preparing 2011 income tax returns.
Annual Report
Board Approval of Investment Advisory Contracts and Management Fees
Fidelity Total International Equity Fund
Each year, the Board of Trustees, including the Independent Trustees (together, the Board), votes on the renewal of the management contract and sub-advisory agreements (together, the Advisory Contracts) for the fund. The Board, assisted by the advice of fund counsel and Independent Trustees' counsel, requests and considers a broad range of information relevant to the renewal of the Advisory Contracts throughout the year.
The Board meets regularly and considers at each of its meetings factors that are relevant to its annual consideration of the renewal of the fund's Advisory Contracts, including the services and support provided to the fund and its shareholders. The Board has established various standing committees, each composed of Independent Trustees with varying backgrounds, to which the Board has assigned specific subject matter responsibilities in order to enhance effective decision-making by the Board. The Board, acting directly and through its Committees, requests and receives information concerning the annual consideration of the renewal of the fund's Advisory Contracts. The Board also meets as needed to consider matters specifically related to the Board's annual consideration of the renewal of Advisory Contracts. Members of the Board may also meet with trustees of other Fidelity funds through ad hoc joint committees to discuss certain matters relevant to the Fidelity funds.
At its July 2011 meeting, the Board of Trustees, including the Independent Trustees, unanimously determined to renew the fund's Advisory Contracts. In reaching its determination, the Board considered all factors it believed relevant, including (i) the nature, extent, and quality of the services to be provided to the fund and its shareholders (including the investment performance of the fund); (ii) the competitiveness of the fund's management fee and total expense ratio; (iii) the total costs of the services to be provided by and the profits to be realized by Fidelity from its relationship with the fund; (iv) the extent to which economies of scale would be realized as the fund grows; and (v) whether fee levels reflect these economies of scale, if any, for the benefit of fund shareholders.
In considering whether to renew the Advisory Contracts for the fund, the Board reached a determination, with the assistance of fund counsel and Independent Trustees' counsel and through the exercise of its business judgment, that the renewal of the Advisory Contracts is in the best interests of the fund and its shareholders and that the compensation payable under the Advisory Contracts is fair and reasonable. The Board's decision to renew the Advisory Contracts was not based on any single factor, but rather was based on a comprehensive consideration of all the information provided to the Board at its meetings throughout the year. The Board, in reaching its determination to renew the Advisory Contracts, is aware that shareholders in the fund have a broad range of investment choices available to them, including a wide choice among mutual funds offered by Fidelity's competitors, and that the fund's shareholders, who have the opportunity to review and weigh the disclosure provided by the fund in its prospectus and other public disclosures, have chosen to invest in this fund, managed by Fidelity.
Annual Report
Nature, Extent, and Quality of Services Provided. The Board considered the staffing within the investment adviser, FMR, and the sub-advisers (together, the Investment Advisers), including the backgrounds of the fund's investment personnel and the fund's investment objective and discipline. The Independent Trustees also had discussions with senior management of Fidelity's investment operations and investment groups. The Board considered the structure of the portfolio manager compensation program and whether this structure provides appropriate incentives to act in the best interests of the fund.
Resources Dedicated to Investment Management and Support Services. The Board and the Fund Oversight and Research Committees reviewed the general qualifications and capabilities of the Investment Advisers' investment staff, including its size, education, experience, and resources, as well as the Investment Advisers' approach to recruiting, training, managing, and compensating investment personnel. The Board also noted that FMR has devoted increased resources to non-U.S. offices. The Board noted that Fidelity's analysts have extensive resources, tools and capabilities which allow them to conduct sophisticated quantitative and fundamental analysis, as well as credit analysis of issuers, counterparties and enhancers. The Board also believes that Fidelity's investment professionals have sufficient access to global information and data so as to provide competitive investment results over time, and that those professionals also have access to sophisticated tools which permit them to assess portfolio construction and risk and performance attribution characteristics continuously, as well as to transmit new information and research conclusions rapidly around the world. Additionally, in their deliberations, the Board considered the Investment Advisers' trading capabilities and resources which are an integral part of the investment management process.
Shareholder and Administrative Services. The Board considered (i) the nature, extent, quality, and cost of advisory, administrative, and shareholder services performed by the Investment Advisers and their affiliates under the Advisory Contracts and under separate agreements covering transfer agency, pricing and bookkeeping, and securities lending services for the fund; (ii) the nature and extent of the investment adviser's supervision of third party service providers, principally custodians and subcustodians; and (iii) the resources devoted to, and the record of compliance with, the fund's compliance policies and procedures. The Board also reviewed the allocation of fund brokerage, including allocations to brokers affiliated with the Investment Advisers, the use of brokerage commissions to pay fund expenses, and the use of "soft" commission dollars to pay for research services.
The Board noted that the growth of fund assets over time across the complex allows Fidelity to reinvest in the development of services designed to enhance the value or convenience of the Fidelity funds as investment vehicles. These services include 24-hour access to account information and market information through telephone representatives and over the Internet, investor education materials and asset allocation tools, and the expanded availability of Fidelity Investor Centers, with 35 new branches opening since 2010.
Annual Report
Board Approval of Investment Advisory Contracts and
Management Fees - continued
Investment in a Large Fund Family. The Board considered the benefits to shareholders of investing in a Fidelity fund, including the benefits of investing in a fund that is part of a large family of funds offering a variety of investment disciplines and providing a large variety of mutual fund investor services. The Board noted that Fidelity had taken, or had made recommendations that resulted in the Fidelity funds taking, a number of actions over the previous year that benefited particular funds, including (i) continuing to dedicate additional resources to investment research and support of the senior management team that oversees asset management; (ii) rationalizing product lines through the mergers of six funds into other funds; (iii) continuing to migrate the Freedom Funds to dedicated lower cost underlying funds; (iv) obtaining shareholder approval to broaden the investment strategies for Fidelity Consumer Finance Portfolio, Fidelity Emerging Asia Fund, and Fidelity Environment and Alternative Energy Portfolio; (v) contractually agreeing to reduce the management fees and impose other expense limitations on Spartan 500 Index Fund and U.S. Bond Index Fund in connection with launching new institutional classes of these funds; (vi) changing the name, primary and supplemental benchmarks, and investment policies of Fidelity Global Strategies Fund to support the fund's flexible investment mandate and global orientation; and (vii) reducing the transfer agency account fee rates on certain accounts.
Investment Performance. The Board considered whether the fund has operated in accordance with its investment objective, as well as its record of compliance with its investment restrictions. It also reviewed the fund's absolute investment performance for each class, as well as the fund's relative investment performance for each class measured over multiple periods against (i) a broad-based securities market index, and (ii) a peer group of mutual funds deemed appropriate by Fidelity and reviewed by the Board. Because the fund had been in existence less than five calendar years, the following charts considered by the Board show, over the one- and three-year periods ended December 31, 2010, the cumulative total returns of Institutional Class (Class I) and Class C of the fund, the cumulative total returns of a broad-based securities market index ("benchmark"), and a range of cumulative total returns of a peer group of mutual funds identified by Morningstar, Inc. as having an investment style similar to that of the fund based on underlying portfolio holdings. The returns of Institutional Class (Class I) and Class C show the performance of the highest and lowest performing classes, respectively (based on three-year performance). The box within each chart shows the 25th percentile return (bottom of box) and the 75th percentile return (top of box) of the peer group. Returns shown above the box are in the first quartile and returns shown below the box are in the fourth quartile. The percentage beaten numbers noted below each chart correspond to the percentile box and represent the percentage of funds in the peer group whose performance was equal to or lower than that of the class indicated.
Annual Report
Fidelity Total International Equity Fund
The Board reviewed the fund's relative investment performance against its peer group and noted that the performance of Institutional Class (Class I) of the fund was in the second quartile for all the periods shown. The Board also noted that the investment performance of Institutional Class (Class I) of the fund compared favorably to its benchmark for the one-year period, although the fund's three-year cumulative total return was lower than its benchmark. The Board considered that the variations in performance among the fund's classes reflect the variations in class expenses, which result in lower performance for higher expense classes. The Board also reviewed the fund's performance since inception as well as performance in the current year.
The Board also considered that the fund's management fee is subject to upward or downward adjustment depending upon whether, and to what extent, the fund's investment performance for the performance period exceeds, or is exceeded by, the record (over the same period) of a Board-approved performance adjustment index. The Board noted that the performance adjustment provides FMR with a strong economic incentive to seek to achieve superior performance for the fund's shareholders and helps to more closely align the interests of FMR and the fund's shareholders.
Based on its review, the Board concluded that the nature, extent, and quality of services provided to the fund under the Advisory Contracts should benefit the fund's shareholders.
Annual Report
Board Approval of Investment Advisory Contracts and
Management Fees - continued
Competitiveness of Management Fee and Total Expense Ratio. The Board considered the fund's management fee and total expense ratio compared to "mapped groups" of competitive funds and classes. Fidelity creates "mapped groups" by combining similar Lipper investment objective categories that have comparable management fee characteristics. Combining Lipper investment objective categories aids the Board's management fee and total expense ratio comparisons by broadening the competitive group used for comparison and by reducing the number of universes to which various Fidelity funds are compared.
Management Fee. The Board considered two proprietary management fee comparisons for the 12-month (or shorter) periods shown in the chart below. The group of Lipper funds used by the Board for management fee comparisons is referred to below as the "Total Mapped Group." The Total Mapped Group comparison focuses on a fund's standing relative to the total universe of comparable funds available to investors in terms of gross management fees before expense reimbursements or caps, and without giving effect to the fund's performance adjustment. "TMG %" represents the percentage of funds in the Total Mapped Group that had management fees that were lower than the fund's. For example, a TMG % of 16% means that 84% of the funds in the Total Mapped Group had higher management fees than the fund. The "Asset-Size Peer Group" (ASPG) comparison focuses on a fund's standing relative to non-Fidelity funds similar in size to the fund within the Total Mapped Group. The ASPG represents at least 15% of the funds in the Total Mapped Group with comparable asset size and management fee characteristics, subject to a minimum of 50 funds (or all funds in the Total Mapped Group if fewer than 50). Additional information, such as the ASPG quartile in which the fund's management fee ranked and the impact of the fund's performance adjustment, is also included in the chart and considered by the Board.
Annual Report
Fidelity Total International Equity Fund
The Board noted that the fund's management fee ranked below the median of its Total Mapped Group and below the median of its ASPG for 2010. The Board also noted the effect of the fund's negative performance adjustment on the fund's management fee ranking. The Board noted that the performance adjustment for each year represents calculations for performance periods that differ from the periods shown in the performance charts above.
Based on its review, the Board concluded that the fund's management fee is fair and reasonable in light of the services that the fund receives and the other factors considered.
Total Expense Ratio. In its review of each class's total expense ratio, the Board considered the fund's management fee as well as other fund or class expenses, as applicable, such as transfer agent fees, pricing and bookkeeping fees, fund-paid 12b-1 fees, and custodial, legal, and audit fees. The Board also noted the effects of any waivers and reimbursements on fees and expenses, as well as the impact of the fund's performance adjustment. As part of its review, the Board also considered the current and historical total expense ratios of each class of the fund compared to competitive fund median expenses. Each class of the fund is compared to those funds and classes in the Total Mapped Group (used by the Board for management fee comparisons) that have a similar sales load structure.
The Board noted that the total expense ratio of each of Class A, Class B, and the retail class ranked below its competitive median for 2010, the total expense ratio of Class C ranked equal to its competitive median for 2010, and the total expense ratio of each of Class T and Institutional Class ranked above its competitive median for 2010. The Board considered that various factors, including 12b-1 fees, positive or negative performance adjustments, and relatively higher other expenses in the case of small fund size, can affect total expense ratios. The Board noted that the total expense ratio of Class T was above the competitive median primarily because of higher 12b-1 fees on Class T. Class T has a higher 12b-1 fee, but a lower front-end sales charge, than traditionally priced front-end sales charge classes. The Board noted that the fund offers multiple classes, each of which has a different sales load and 12b-1 fee structure, and that the multiple structures are intended to offer a range of pricing options for the intermediary market. The Board also noted that the total expense ratios of the classes vary primarily by the level of their 12b-1 fees, although differences in transfer agent fees may also cause expenses to vary from class to class.
Annual Report
Board Approval of Investment Advisory Contracts and
Management Fees - continued
Fees Charged to Other Fidelity Clients. The Board also considered Fidelity fee structures and other information with respect to clients of FMR and its affiliates, such as other mutual funds advised or subadvised by FMR or its affiliates, pension plan clients, and other institutional clients. In March 2010, the Board created an ad hoc joint committee with the board of other Fidelity funds (the Committee) to review and compare Fidelity's institutional investment advisory business with its business of providing services to the Fidelity funds, including the differences in services provided, fees charged, and costs incurred, as well as competition in their respective marketplaces.
Based on its review of total expense ratios and fees charged to other Fidelity clients, the Board concluded that the total expense ratio of each class of the fund was reasonable, although in some cases above the median of the universe presented for comparison, in light of the services that the fund and its shareholders receive and the other factors considered, including the findings of the Committee.
Costs of the Services and Profitability. The Board considered the revenues earned and the expenses incurred by Fidelity in conducting the business of developing, marketing, distributing, managing, administering and servicing the fund and its shareholders. The Board also considered the level of Fidelity's profits in respect of all the Fidelity funds.
On an annual basis, FMR presents to the Board Fidelity's profitability for the fund. Fidelity calculates the profitability for each fund, as well as aggregate profitability for groups of Fidelity funds and all Fidelity funds, using a series of detailed revenue and cost allocation methodologies which originate with the books and records of Fidelity on which Fidelity's audited financial statements are based. The Audit Committee of the Board reviews any significant changes from the prior year's methodologies.
PricewaterhouseCoopers LLP (PwC), independent registered public accounting firm and auditor to Fidelity and certain Fidelity funds, has been engaged annually by the Board as part of the Board's assessment of Fidelity's profitability analysis. PwC's engagement includes the review and assessment of Fidelity's methodologies used in determining the revenues and expenses attributable to Fidelity's mutual fund business, and completion of agreed-upon procedures surrounding the mathematical accuracy of fund profitability and its conformity to allocation methodologies. After considering PwC's reports issued under the engagement and information provided by Fidelity, the Board concluded that while other allocation methods may also be reasonable, Fidelity's profitability methodologies are reasonable in all material respects.
Annual Report
The Board also reviewed Fidelity's non-fund businesses and fall-out benefits related to the mutual fund business as well as cases where Fidelity's affiliates may benefit from or be related to the fund's business.
The Board considered the costs of the services provided by and the profits realized by Fidelity in connection with the operation of the fund and was satisfied that the profitability was not excessive in the circumstances.
Economies of Scale. The Board considered whether there have been economies of scale in respect of the management of the Fidelity funds, whether the Fidelity funds (including the fund) have appropriately benefited from any such economies of scale, and whether there is potential for realization of any further economies of scale. The Board considered the extent to which the fund will benefit from economies of scale through increased services to the fund, through waivers or reimbursements, or through fee or expense reductions. The Board also noted that in 2009, it and the board of other Fidelity funds created an ad hoc committee (the Economies of Scale Committee) to analyze whether FMR attains economies of scale in respect of the management and servicing of the Fidelity funds, whether the Fidelity funds have appropriately benefited from such economies of scale, and whether there is potential for realization of any further economies of scale.
The Board recognized that the fund's management contract incorporates a "group fee" structure, which provides for lower group fee rates as total fund assets under FMR's management increase, and for higher group fee rates as total fund assets under FMR's management decrease. FMR calculates the group fee rates based on a tiered asset "breakpoint" schedule that varies based on asset class. The Board considered that the group fee is designed to deliver the benefits of economies of scale to fund shareholders when total Fidelity fund assets increase, even if assets of any particular fund are unchanged or have declined, because some portion of Fidelity's costs are attributable to services provided to all Fidelity funds, and all funds benefit if those costs can be allocated among more assets. The Board concluded that, given the group fee structure, fund shareholders will benefit from lower management fees as assets under FMR's management increase at the fund complex level, regardless of whether Fidelity achieves any such economies of scale.
Annual Report
Board Approval of Investment Advisory Contracts and
Management Fees - continued
The Board concluded, taking into account the analysis of the Economies of Scale Committee, that any potential economies of scale are being appropriately shared between fund shareholders and Fidelity.
Additional Information Requested by the Board. In order to develop fully the factual basis for consideration of the Fidelity funds' Advisory Contracts, the Board requested and received additional information on certain topics, including (i) fund performance trends, actions to be taken by FMR to improve certain funds' overall performance, and Fidelity's long-term strategies for certain funds; (ii) portfolio manager changes that have occurred during the past year and length of portfolio manager tenure for different categories of funds over time; (iii) Fidelity's compensation structure for portfolio managers and other key personnel and strategies for attracting and retaining non-investment personnel; (iv) the amount of the investment that each portfolio manager has made in the Fidelity fund(s) that he or she manages; (v) historical trends in Fidelity's realization of fall-out benefits; (vi) Fidelity's group fee structures and the rationale for the individual fee rates of certain funds; (vii) fund profitability methodology and the impact of certain factors on fund profitability results; (viii) trends regarding industry use of performance fee structures and Fidelity's compliance practices with respect to performance adjustment calculations; (ix) the fee structures in place for certain other Fidelity clients; and (x) explanations regarding the relative total expense ratios of certain funds and classes, total expense competitive trends, and actions that might be taken by FMR to reduce total expense ratios for certain funds and classes.
Based on its evaluation of all of the conclusions noted above, and after considering all factors it believed relevant, the Board ultimately concluded that the advisory fee structures are fair and reasonable, and that the fund's Advisory Contracts should be renewed.
Annual Report
Investment Adviser
Fidelity Management & Research Company
Boston, MA
Investment Sub-Advisers
FMR Co., Inc.
Fidelity Management & Research
(U.K.) Inc.
FIL Investment Advisors
FIL Investments (Japan) Limited
FIL Investment Advisors
(U.K.) Limited
Fidelity Management & Research
(Hong Kong) Limited
Fidelity Management & Research
(Japan) Inc.
General Distributor
Fidelity Distributors Corporation
Boston, MA
Transfer and Service Agents
Fidelity Investments Institutional Operations Company, Inc.
Boston, MA
Fidelity Service Company, Inc.
Boston, MA
Custodian
State Street Bank & Trust Company
Quincy, MA
ATIE-UANN-1211
1.853363.103
(Fidelity Logo)
Fidelity Advisor®
Total International Equity
Fund - Institutional Class
Annual Report
October 31, 2011
(Fidelity Cover Art)
Institutional Class is
a class of Fidelity®
Total International Equity Fund
Contents
Chairman's Message | (Click Here) | The Chairman's message to shareholders. |
Performance | (Click Here) | How the fund has done over time. |
Management's Discussion of Fund Performance | (Click Here) | The Portfolio Manager's review of fund performance and strategy. |
Shareholder Expense Example | (Click Here) | An example of shareholder expenses. |
Investment Changes | (Click Here) | A summary of major shifts in the fund's investments over the past six months. |
Investments | (Click Here) | A complete list of the fund's investments with their market values. |
Financial Statements | (Click Here) | Statements of assets and liabilities, operations, and changes in net assets, as well as financial highlights. |
Notes | (Click Here) | Notes to the financial statements. |
Report of Independent Registered Public Accounting Firm | (Click Here) | |
Trustees and Officers | (Click Here) | |
Distributions | (Click Here) | |
Board Approval of Investment Advisory Contracts and Management Fees | (Click Here) | |
To view a fund's proxy voting guidelines and proxy voting record for the 12-month period ended June 30, visit http://www.fidelity.com/proxyvotingresults or visit the Securities and Exchange Commission's (SEC) web site at http://www.sec.gov. You may also call 1-877-208-0098 to request a free copy of the proxy voting guidelines.
Standard & Poor's, S&P and S&P 500 are registered service marks of The McGraw-Hill Companies, Inc. and have been licensed for use by Fidelity Distributors Corporation.
Other third party marks appearing herein are the property of their respective owners.
All other marks appearing herein are registered or unregistered trademarks or service marks of FMR LLC or an affiliated company.
Annual Report
This report and the financial statements contained herein are submitted for the general information of the shareholders of the fund. This report is not authorized for distribution to prospective investors in the fund unless preceded or accompanied by an effective prospectus.
A fund files its complete schedule of portfolio holdings with the SEC for the first and third quarters of each fiscal year on Form N-Q. Forms N-Q are available on the SEC's web site at http://www.sec.gov. A fund's Forms N-Q may be reviewed and copied at the SEC's Public Reference Room in Washington, DC. Information regarding the operation of the SEC's Public Reference Room may be obtained by calling 1-800-SEC-0330. For a complete list of a fund's portfolio holdings, view the most recent holdings listing, semiannual report, or annual report on Fidelity's web site at http://www.fidelity.com, http://www.advisor.fidelity.com, or http://www.401k.com, as applicable.
NOT FDIC INSURED • MAY LOSE VALUE • NO BANK GUARANTEE
Neither the fund nor Fidelity Distributors Corporation is a bank.
Annual Report
(Acting Chairman's Photograph)
Dear Shareholder:
Global equity markets began the fourth quarter on a strong note, sharply reversing course in October amid strong corporate earnings, better-than-expected economic news and the promise of a resolution to the sovereign debt crisis in Europe. The mini rally followed a third quarter marked by a significant downturn in July and August, which heightened investor anxiety and set off a wave of volatility that hampered most major asset classes through the end of September. Financial markets are difficult to predict, of course, but you can help put the odds in your favor by following these time-tested investment principles.
One of the basic tenets is to invest according to your time horizon. For long-term investors, riding out the markets' inevitable ups and downs has proven much more effective than making decisions based on short-term developments. If your goal is approaching, you can also benefit from patience and restraint, rather than attempting to time the market. No matter your time horizon, missing only a few of the markets' best days can significantly diminish returns. Patience also affords the benefits of compounding - earning interest on additional income or reinvested dividends and capital gains. While staying the course doesn't eliminate risk, it can considerably lessen the negative impact of short-term downturns.
Asset allocation is another principle to manage risk. As you spread your portfolio among the asset classes, be sure to consider your time horizon, risk tolerance and investment objectives. Younger investors may be better served by emphasizing equities, which historically have been the best-performing asset class over time. Investors who are nearing a specific goal, such as retirement or sending a child to college, may choose to favor bonds and other investments that have tended to be more stable. Studies indicate that asset allocation is the single most important determinant of a portfolio's long-term success. After deciding on a suitable allocation strategy, make sure your portfolio is adequately diversified, with exposure to stocks of small-, mid- and large-cap companies in a range of sectors, for example. And today, more than ever, geographic diversification should be taken into account.
Lastly, investing a certain amount of money on a regular basis - a principle known as dollar-cost averaging - can help lower the average cost of your purchases, while also giving you the discipline to avoid selling weak performers just prior to an upswing, or chasing a hot performer just before a correction.
We invite you to learn more by visiting us on the Internet, dropping by one of our Investor Centers or calling us by phone. It is our privilege to provide the resources you need to choose investments that are right for you.
Sincerely,
(Acting Chairman's Signature)
James C. Curvey
Acting Chairman
Annual Report
Average annual total return reflects the change in the value of an investment, assuming reinvestment of the class' distributions from dividend income and capital gains (the profits earned upon the sale of securities that have grown in value, if any) and assuming a constant rate of performance each year. The $10,000 table and the fund's returns do not reflect the deduction of taxes that a shareholder would pay on fund distributions or the redemption of fund shares. During periods of reimbursement by Fidelity, a fund's total return will be greater than it would be had the reimbursement not occurred. How a fund did yesterday is no guarantee of how it will do tomorrow.
Average Annual Total Returns
Periods ended October 31, 2011 | Past 1
year | Life of
fund A |
Institutional Class | -7.72% | -8.24% |
A From November 1, 2007.
$10,000 Over Life of Fund
Let's say hypothetically that $10,000 was invested in Fidelity Advisor® Total International Equity Fund - Institutional Class on November 1, 2007, when the fund started. The chart shows how the value of your investment would have changed, and also shows how the MSCI® ACWI® (All Country World Index) ex USA Index performed over the same period.
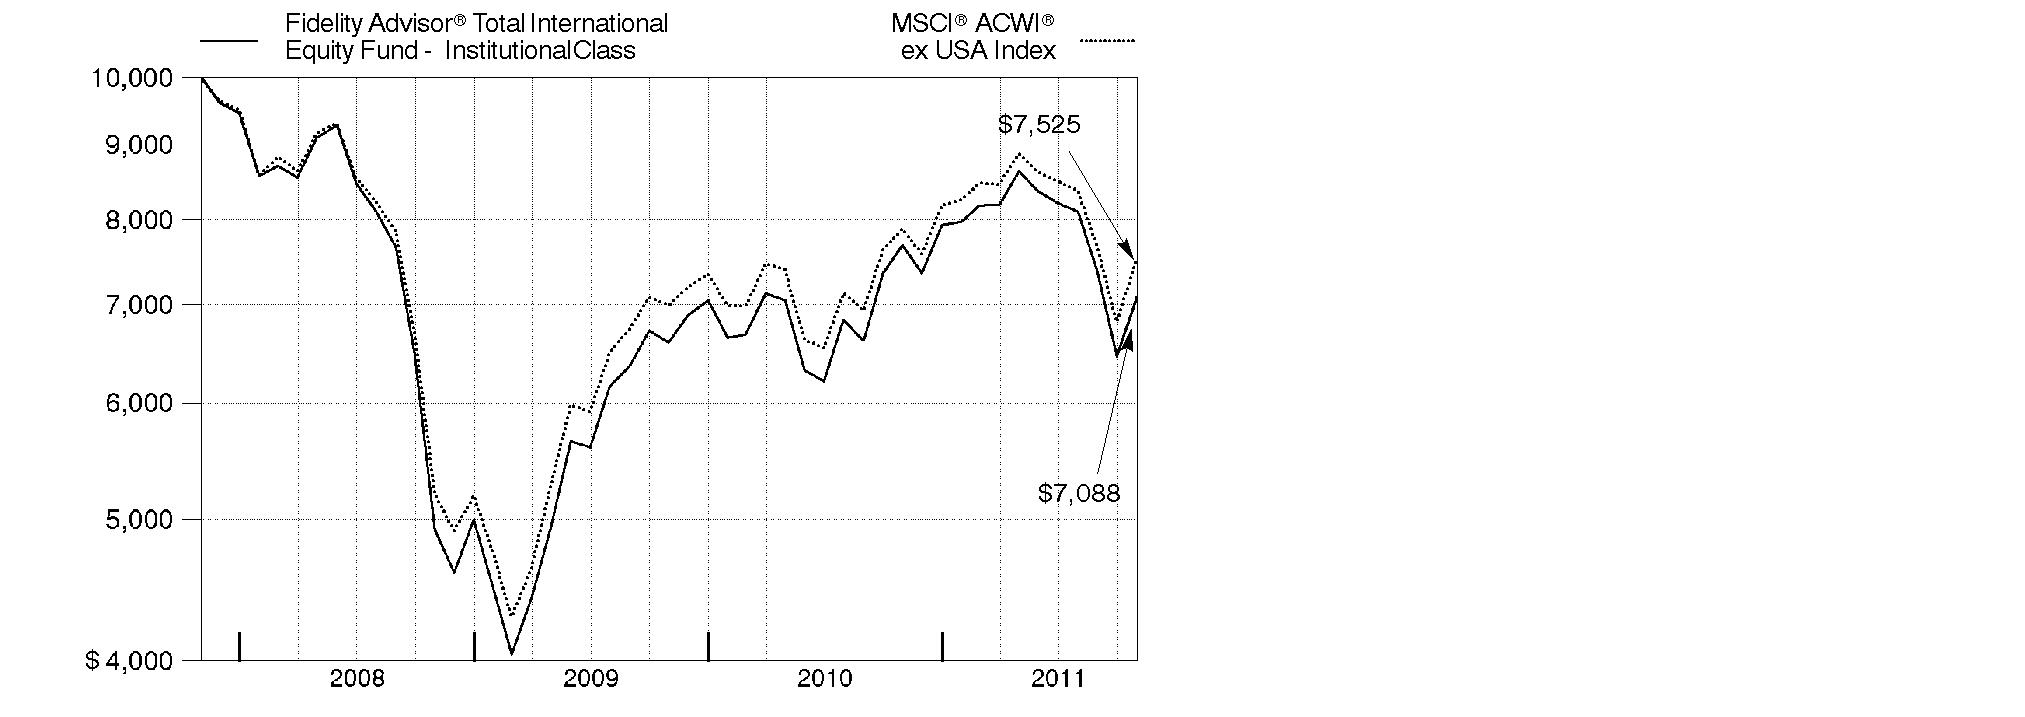
Annual Report
Market Recap: International equities were rocked by a number of headline events during the year ending October 31, 2011. Stocks posted a solid advance for the first half of the period, despite concern about the sovereign debt crisis in Europe, a devastating earthquake and tsunami in Japan, and political upheaval in the Middle East and North Africa. Sentiment turned decidedly negative in the second half, however, as fresh worries about Europe, inflation in China and a dimmed outlook for global growth caused foreign markets to suffer declines that intensified in August and September. October brought with it yet another dramatic swing, as eurozone policymakers appeared near a resolution to the debt debacle and buyers stormed back onto the scene in search of bargains. Still, those gains - along with favorable currency fluctuations overall - weren't enough to offset prior losses, and the MSCI® ACWI® (All Country World Index) ex USA Index finished the period down 4.56%. Within the MSCI index, Europe and emerging markets suffered the biggest declines, with many countries in these areas sustaining steep losses. By contrast, Japan showed resilience in the wake of its natural disasters, falling only 2%. Australia (+4%), Switzerland (+3%), the U.K. (+2%) and Canada, which produced a nominal return, were among the few major benchmark components to break into positive territory.
Comments from Jed Weiss, Co-Portfolio Manager of Fidelity Advisor® Total International Equity Fund: For the year, the fund's Institutional Class shares returned -7.72%, lagging the MSCI index. Security selection in the U.K. and France detracted the most, as did positioning in Canada. An overweighting in the U.S. also hurt, but good picks there more than compensated. Selection in Japan and Finland also helped. On a sector basis, our choices in financials detracted, including various European firms - Societe Generale (France), Turkiye Garanti Bankasi (Turkey), Intesa Sanpaolo (Italy) and AXA (France). Stock picking in consumer staples and industrials hurt, as did our energy positioning. Our stance in information technology and consumer discretionary, however, was positive. Other individual detractors included underweighting U.K.-based British American Tobacco and Canadian energy firm Niko Resources. On the positive side, not owning weak-performing benchmark component Tokyo Electric Power helped, as did an out-of-benchmark stake in U.S. credit card processor MasterCard and an overweighting in French drug maker Roche Holding. Some of the stocks mentioned in this report were not owned at period end.
The views expressed above reflect those of the portfolio manager(s) only through the end of the period as stated on the cover of this report and do not necessarily represent the views of Fidelity or any other person in the Fidelity organization. Any such views are subject to change at any time based upon market or other conditions and Fidelity disclaims any responsibility to update such views. These views may not be relied on as investment advice and, because investment decisions for a Fidelity fund are based on numerous factors, may not be relied on as an indication of trading intent on behalf of any Fidelity fund.
Annual Report
Shareholder Expense Example
As a shareholder of the Fund, you incur two types of costs: (1) transaction costs, including sales charges (loads) on purchase payments or redemption proceeds, redemption fees, and (2) ongoing costs, including management fees, distribution and/or service (12b-1) fees and other Fund expenses. This Example is intended to help you understand your ongoing costs (in dollars) of investing in the Fund and to compare these costs with the ongoing costs of investing in other mutual funds.
The Example is based on an investment of $1,000 invested at the beginning of the period and held for the entire period (May 1, 2011 to October 31, 2011).
Actual Expenses
The first line of the accompanying table for each class of the Fund provides information about actual account values and actual expenses. You may use the information in this line, together with the amount you invested, to estimate the expenses that you paid over the period. Simply divide your account value by $1,000.00 (for example, an $8,600 account value divided by $1,000.00 = 8.6), then multiply the result by the number in the first line for a class of the Fund under the heading entitled "Expenses Paid During Period" to estimate the expenses you paid on your account during this period. A small balance maintenance fee of $12.00 that is charged once a year may apply for certain accounts with a value of less than $2,000. This fee is not included in the table below. If it was, the estimate of expenses you paid during the period would be higher, and your ending account value lower, by this amount. In addition, the Fund, as a shareholder in the underlying Fidelity Central Funds, will indirectly bear its pro-rata share of the fees and expenses incurred by the underlying Fidelity Central Funds. These fees and expenses are not included in the Fund's annualized expense ratio used to calculate the expense estimate in the table below.
Hypothetical Example for Comparison Purposes
The second line of the accompanying table for each class of the Fund provides information about hypothetical account values and hypothetical expenses based on a Class' actual expense ratio and an assumed rate of return of 5% per year before expenses, which is not the Class' actual return. The hypothetical account values and expenses may not be used to estimate the actual ending account balance or expenses you paid for the period. You may use this information to compare the ongoing costs of investing in the Fund and other funds. To do so, compare this 5% hypothetical example with the 5% hypothetical examples that appear in the shareholder reports of the other funds. A small balance maintenance fee of $12.00 that is charged once a year may apply for certain accounts with a value of less than $2,000. This fee is not included in the table below. If it was, the estimate of expenses you paid during the period would be higher, and your ending account value lower, by this amount. In addition, the Fund, as a shareholder in the underlying Fidelity Central Funds, will indirectly bear its pro-rata share of the fees and expenses incurred by the underlying Fidelity Central Funds. These fees and expenses are not included in the Fund's annualized expense ratio used to calculate the expense estimate in the table below.
Please note that the expenses shown in the table are meant to highlight your ongoing costs only and do not reflect any transaction costs. Therefore, the second line of the table is useful in comparing ongoing costs only, and will not help you determine the relative total costs of owning different funds. In addition, if these transactional costs were included, your costs would have been higher.
Annual Report
Shareholder Expense Example - continued
| Annualized
Expense Ratio | Beginning
Account Value
May 1, 2011 | Ending
Account Value
October 31, 2011 | Expenses Paid
During Period*
May 1, 2011 to October 31, 2011 |
Class A | 1.45% | | | |
Actual | | $ 1,000.00 | $ 819.40 | $ 6.65 |
Hypothetical A | | $ 1,000.00 | $ 1,017.90 | $ 7.38 |
Class T | 1.70% | | | |
Actual | | $ 1,000.00 | $ 819.70 | $ 7.80 |
Hypothetical A | | $ 1,000.00 | $ 1,016.64 | $ 8.64 |
Class B | 2.20% | | | |
Actual | | $ 1,000.00 | $ 816.60 | $ 10.07 |
Hypothetical A | | $ 1,000.00 | $ 1,014.12 | $ 11.17 |
Class C | 2.20% | | | |
Actual | | $ 1,000.00 | $ 816.40 | $ 10.07 |
Hypothetical A | | $ 1,000.00 | $ 1,014.12 | $ 11.17 |
Total International Equity | 1.20% | | | |
Actual | | $ 1,000.00 | $ 821.90 | $ 5.51 |
Hypothetical A | | $ 1,000.00 | $ 1,019.16 | $ 6.11 |
Institutional Class | 1.20% | | | |
Actual | | $ 1,000.00 | $ 821.40 | $ 5.51 |
Hypothetical A | | $ 1,000.00 | $ 1,019.16 | $ 6.11 |
A 5% return per year before expenses
* Expenses are equal to each Class' annualized expense ratio, multiplied by the average account value over the period, multiplied by 184/365 (to reflect the one-half year period).
Annual Report
Investment Changes (Unaudited)
Geographic Diversification (% of fund's net assets) |
As of October 31, 2011 |
| United Kingdom 18.1% | |
| Japan 11.7% | |
| United States of America 9.0% | |
| Switzerland 6.6% | |
| Germany 5.9% | |
| France 4.9% | |
| Australia 4.3% | |
| Korea (South) 4.2% | |
| Brazil 4.1% | |
| Other 31.2% | |

Percentages are adjusted for the effect of futures contracts, if applicable. |
As of April 30, 2011 |
| United Kingdom 16.4% | |
| Japan 10.3% | |
| United States of America 7.4% | |
| Switzerland 5.6% | |
| France 5.3% | |
| Germany 5.2% | |
| Brazil 4.4% | |
| Korea (South) 3.6% | |
| Spain 3.0% | |
| Other 38.8% | |

Percentages are adjusted for the effect of futures contracts, if applicable. |
Asset Allocation |
| % of fund's
net assets | % of fund's net assets
6 months ago |
Stocks and Investment Companies | 96.7 | 97.6 |
Short-Term Investments and Net Other Assets | 3.3 | 2.4 |
Top Ten Stocks as of October 31, 2011 |
| % of fund's
net assets | % of fund's net assets
6 months ago |
Nestle SA (Switzerland, Food Products) | 2.7 | 1.8 |
Royal Dutch Shell PLC Class A sponsored ADR (United Kingdom, Oil, Gas & Consumable Fuels) | 2.2 | 1.7 |
Roche Holding AG (participation certificate) (Switzerland, Pharmaceuticals) | 1.8 | 1.3 |
GlaxoSmithKline PLC sponsored ADR (United Kingdom, Pharmaceuticals) | 1.6 | 0.9 |
BHP Billiton PLC ADR (United Kingdom, Metals & Mining) | 1.4 | 1.7 |
Vodafone Group PLC sponsored ADR (United Kingdom, Wireless Telecommunication Services) | 1.3 | 0.9 |
Anheuser-Busch InBev SA NV (Belgium, Beverages) | 1.1 | 1.1 |
Sanofi-aventis (France, Pharmaceuticals) | 1.1 | 0.0 |
Commonwealth Bank of Australia (Australia, Commercial Banks) | 1.1 | 0.1 |
BP PLC sponsored ADR (United Kingdom, Oil, Gas & Consumable Fuels) | 1.1 | 1.0 |
| 15.4 | |
Market Sectors as of October 31, 2011 |
| % of fund's
net assets | % of fund's net assets
6 months ago |
Financials | 18.2 | 23.8 |
Consumer Staples | 12.9 | 8.8 |
Materials | 10.6 | 13.5 |
Energy | 10.0 | 10.0 |
Consumer Discretionary | 9.9 | 10.8 |
Industrials | 9.9 | 11.3 |
Health Care | 8.0 | 5.1 |
Information Technology | 6.8 | 7.7 |
Telecommunication Services | 6.7 | 3.7 |
Utilities | 3.7 | 2.6 |
Annual Report
Investments October 31, 2011
Showing Percentage of Net Assets
Common Stocks - 96.5% |
| Shares | | Value |
Australia - 4.3% |
Australia & New Zealand Banking Group Ltd. | 43,841 | | $ 990,744 |
Coca-Cola Amatil Ltd. | 20,575 | | 265,625 |
Commonwealth Bank of Australia | 28,630 | | 1,470,865 |
CSL Ltd. | 20,431 | | 615,420 |
Macquarie Group Ltd. | 9,104 | | 234,416 |
MAp Group unit | 66,645 | | 237,831 |
Newcrest Mining Ltd. | 12,208 | | 431,494 |
Newcrest Mining Ltd. sponsored ADR | 6,284 | | 220,883 |
OZ Minerals Ltd. | 19,949 | | 239,586 |
QBE Insurance Group Ltd. | 9,595 | | 147,709 |
Ramsay Health Care Ltd. | 619 | | 12,169 |
Telstra Corp. Ltd. | 160,903 | | 522,492 |
Woolworths Ltd. | 8,510 | | 212,752 |
WorleyParsons Ltd. | 14,070 | | 408,417 |
TOTAL AUSTRALIA | | 6,010,403 |
Austria - 0.4% |
Andritz AG | 4,229 | | 374,736 |
Zumtobel AG | 8,900 | | 185,613 |
TOTAL AUSTRIA | | 560,349 |
Bailiwick of Guernsey - 0.2% |
Resolution Ltd. | 66,466 | | 293,949 |
Bailiwick of Jersey - 0.9% |
Informa PLC | 27,581 | | 160,745 |
Randgold Resources Ltd. sponsored ADR | 6,860 | | 751,650 |
Wolseley PLC | 9,363 | | 270,735 |
TOTAL BAILIWICK OF JERSEY | | 1,183,130 |
Belgium - 1.4% |
Anheuser-Busch InBev SA NV | 27,471 | | 1,523,656 |
Gimv NV | 520 | | 26,590 |
Umicore SA | 8,973 | | 386,378 |
TOTAL BELGIUM | | 1,936,624 |
Bermuda - 0.9% |
Aquarius Platinum Ltd. (Australia) | 6,424 | | 18,847 |
Cheung Kong Infrastructure Holdings Ltd. | 27,000 | | 144,631 |
CNPC (Hong Kong) Ltd. | 92,000 | | 128,872 |
Great Eagle Holdings Ltd. | 30,089 | | 66,826 |
Lazard Ltd. Class A | 7,950 | | 217,353 |
Li & Fung Ltd. | 212,000 | | 408,565 |
Common Stocks - continued |
| Shares | | Value |
Bermuda - continued |
NWS Holdings Ltd. | 48,000 | | $ 72,786 |
Trinity Ltd. | 214,000 | | 193,961 |
TOTAL BERMUDA | | 1,251,841 |
Brazil - 4.1% |
Arezzo Industria e Comercio SA | 12,100 | | 159,952 |
Banco ABC Brasil SA | 3,900 | | 26,005 |
Banco Bradesco SA (PN) sponsored ADR | 31,200 | | 567,840 |
Banco do Estado do Rio Grande do Sul SA | 15,600 | | 164,430 |
Banco Pine SA | 2,300 | | 15,282 |
BM&F Bovespa SA | 45,900 | | 273,978 |
BR Malls Participacoes SA | 26,900 | | 290,586 |
Braskem SA Class A sponsored ADR | 18,280 | | 329,771 |
Cia.Hering SA | 600 | | 13,400 |
Companhia de Bebidas das Americas (AmBev) (PN) sponsored ADR | 9,800 | | 330,456 |
Companhia de Saneamento Basico do Estado de Sao Paulo (SABESP) | 6,900 | | 189,256 |
Companhia de Saneamento de Minas Gerais | 2,400 | | 45,059 |
Eletropaulo Metropolitana SA (PN-B) | 8,300 | | 148,870 |
Embraer SA sponsored ADR | 4,200 | | 116,844 |
Gol Linhas Aereas Inteligentes SA sponsored ADR | 15,900 | | 127,518 |
Iguatemi Empresa de Shopping Centers SA | 7,700 | | 149,184 |
Itau Unibanco Banco Multiplo SA sponsored ADR | 11,970 | | 228,866 |
Klabin SA (PN) (non-vtg.) | 7,500 | | 27,603 |
Localiza Rent A Car SA | 3,200 | | 48,358 |
Marcopolo SA (PN) | 13,300 | | 58,863 |
Mills Estruturas e Servicos de Engenharia SA | 3,300 | | 32,958 |
Multiplan Empreendimentos Imobiliarios SA | 11,800 | | 238,584 |
Multiplus SA | 5,100 | | 86,129 |
Odontoprev SA | 1,900 | | 29,896 |
OGX Petroleo e Gas Participacoes SA (a) | 32,800 | | 271,232 |
Petroleo Brasileiro SA - Petrobras (PN) sponsored ADR | 24,300 | | 614,547 |
Qualicorp SA | 5,000 | | 45,714 |
Restoque Comercio e Confeccoes de Roupas SA | 200 | | 3,145 |
T4F Entretenimento SA | 1,800 | | 12,579 |
Tegma Gestao Logistica | 7,900 | | 102,591 |
Telefonica Brasil SA sponsored ADR (a) | 4,300 | | 124,786 |
TIM Participacoes SA sponsored ADR | 9,906 | | 257,952 |
Totvs SA | 800 | | 13,277 |
Common Stocks - continued |
| Shares | | Value |
Brazil - continued |
Ultrapar Participacoes SA | 8,300 | | $ 147,904 |
Vale SA (PN-A) sponsored ADR | 16,700 | | 394,120 |
TOTAL BRAZIL | | 5,687,535 |
British Virgin Islands - 0.1% |
Mail.ru Group Ltd.: | | | |
GDR (a)(e) | 3,500 | | 120,575 |
GDR (Reg. S) | 100 | | 3,445 |
TOTAL BRITISH VIRGIN ISLANDS | | 124,020 |
Canada - 1.5% |
Agnico-Eagle Mines Ltd. (Canada) | 6,690 | | 290,190 |
Eldorado Gold Corp. | 12,300 | | 231,107 |
Fairfax Financial Holdings Ltd. (sub. vtg.) | 865 | | 361,558 |
First Quantum Minerals Ltd. | 7,200 | | 151,028 |
Goldcorp, Inc. | 3,800 | | 184,882 |
Niko Resources Ltd. | 6,070 | | 333,870 |
Open Text Corp. (a) | 4,750 | | 290,713 |
Pan American Silver Corp. | 4,300 | | 120,228 |
Petrominerales Ltd. | 4,725 | | 124,660 |
Quadra FNX Mining Ltd. (a) | 1,100 | | 12,690 |
TAG Oil Ltd. (a) | 2,000 | | 12,399 |
Tuscany International Drilling, Inc. (a) | 16,400 | | 11,187 |
Tuscany International Drilling, Inc. (a)(e) | 1,900 | | 1,296 |
TOTAL CANADA | | 2,125,808 |
Cayman Islands - 1.3% |
Belle International Holdings Ltd. | 44,000 | | 86,294 |
Central China Real Estate Ltd. | 111,050 | | 25,077 |
China Lilang Ltd. | 20,000 | | 21,053 |
China Shanghui Cement Group Ltd. | 195,000 | | 149,365 |
Country Garden Holdings Co. Ltd. | 290,000 | | 114,822 |
Eurasia Drilling Co. Ltd. GDR (Reg. S) | 6,400 | | 151,040 |
EVA Precision Industrial Holdings Ltd. | 298,000 | | 76,959 |
Haitian International Holdings Ltd. | 57,000 | | 50,644 |
Intime Department Store Group Co. Ltd. | 9,000 | | 12,916 |
NVC Lighting Holdings Ltd. | 415,000 | | 180,190 |
Sands China Ltd. (a) | 85,000 | | 255,441 |
Shenguan Holdings Group Ltd. | 166,000 | | 89,184 |
Silver Base Group Holdings Ltd. | 81,000 | | 86,264 |
SOHO China Ltd. | 153,000 | | 109,084 |
Common Stocks - continued |
| Shares | | Value |
Cayman Islands - continued |
Vantage Drilling Co. (a) | 8,900 | | $ 12,104 |
Wynn Macau Ltd. | 113,000 | | 316,612 |
TOTAL CAYMAN ISLANDS | | 1,737,049 |
Chile - 0.4% |
Banco Santander Chile sponsored ADR | 2,900 | | 236,872 |
CFR Pharmaceuticals SA | 488,397 | | 115,632 |
Empresa Nacional de Telecomunicaciones SA (ENTEL) | 8,423 | | 166,758 |
TOTAL CHILE | | 519,262 |
China - 1.8% |
Baidu.com, Inc. sponsored ADR (a) | 3,115 | | 436,661 |
China Communications Construction Co. Ltd. (H Shares) | 187,000 | | 141,046 |
China Communications Services Corp. Ltd. (H Shares) | 270,000 | | 124,520 |
China Construction Bank Corp. (H Shares) | 587,000 | | 431,290 |
China Minsheng Banking Corp. Ltd. (H Shares) | 274,000 | | 223,206 |
China National Building Materials Co. Ltd. (H Shares) | 90,000 | | 115,282 |
China Pacific Insurance Group Co. Ltd. (H Shares) | 26,600 | | 81,627 |
China Petroleum & Chemical Corp.: | | | |
(H Shares) | 152,000 | | 143,751 |
sponsored ADR (H Shares) | 1,200 | | 113,280 |
China Southern Airlines Ltd. (H Shares) (a) | 200,000 | | 111,612 |
Great Wall Motor Co. Ltd. (H Shares) | 88,000 | | 119,496 |
Harbin Power Equipment Co. Ltd. (H Shares) | 142,000 | | 143,099 |
Industrial & Commercial Bank of China Ltd. (H Shares) | 235,285 | | 146,927 |
SINA Corp. (a) | 900 | | 73,161 |
Sinopec Shanghai Petrochemical Co. Ltd. (H Shares) | 216,000 | | 79,304 |
Yantai Changyu Pioneer Wine Co. (B Shares) | 6,290 | | 70,769 |
TOTAL CHINA | | 2,555,031 |
Czech Republic - 0.4% |
Ceske Energeticke Zavody AS | 7,500 | | 317,178 |
Komercni Banka AS | 600 | | 115,720 |
Philip Morris CR A/S | 100 | | 65,661 |
TOTAL CZECH REPUBLIC | | 498,559 |
Denmark - 1.2% |
Novo Nordisk A/S Series B sponsored ADR | 11,100 | | 1,179,930 |
William Demant Holding A/S (a) | 5,310 | | 423,674 |
TOTAL DENMARK | | 1,603,604 |
Egypt - 0.1% |
Commercial International Bank Ltd. sponsored GDR | 30,509 | | 134,789 |
Common Stocks - continued |
| Shares | | Value |
Finland - 0.7% |
Metso Corp. | 4,520 | | $ 176,022 |
Nokian Tyres PLC | 11,302 | | 415,264 |
Outotec Oyj | 7,812 | | 365,196 |
TOTAL FINLAND | | 956,482 |
France - 4.9% |
Alstom SA | 12,669 | | 475,134 |
Atos Origin SA | 4,113 | | 199,333 |
Audika SA | 1,000 | | 22,115 |
BNP Paribas SA | 14,551 | | 661,505 |
Casino Guichard Perrachon et Compagnie | 2,608 | | 245,138 |
Compagnie de St. Gobain | 4,179 | | 194,840 |
Danone | 12,580 | | 875,696 |
Euler Hermes SA | 1,414 | | 102,460 |
GDF Suez | 16,600 | | 471,286 |
Laurent-Perrier Group | 359 | | 37,013 |
Pernod-Ricard SA | 2,800 | | 261,557 |
PPR SA | 2,700 | | 421,854 |
Remy Cointreau SA | 3,752 | | 308,428 |
Safran SA | 17,914 | | 586,807 |
Saft Groupe SA | 1,329 | | 40,462 |
Sanofi-aventis | 20,892 | | 1,494,810 |
Unibail-Rodamco | 1,421 | | 284,162 |
Vetoquinol SA | 400 | | 13,186 |
Virbac SA | 190 | | 32,889 |
TOTAL FRANCE | | 6,728,675 |
Georgia - 0.0% |
Bank of Georgia GDR (Reg. S) | 3,800 | | 48,450 |
Germany - 5.8% |
Allianz AG | 7,752 | | 871,220 |
Allianz AG sponsored ADR | 13,600 | | 152,320 |
alstria office REIT-AG | 12,500 | | 160,705 |
BASF AG | 13,415 | | 987,473 |
Bayer AG | 10,037 | | 643,047 |
Bayerische Motoren Werke AG (BMW) | 2,605 | | 212,915 |
Bilfinger Berger AG | 512 | | 45,900 |
CompuGROUP Holding AG | 946 | | 12,175 |
CTS Eventim AG | 1,974 | | 65,359 |
Daimler AG (United States) | 9,900 | | 503,316 |
Deutsche Telekom AG | 37,500 | | 477,134 |
E.ON AG | 23,710 | | 574,543 |
Common Stocks - continued |
| Shares | | Value |
Germany - continued |
Fielmann AG | 479 | | $ 50,452 |
HeidelbergCement AG | 4,700 | | 214,513 |
Linde AG | 7,449 | | 1,184,982 |
MAN SE | 1,872 | | 166,035 |
Metro AG | 3,800 | | 177,170 |
Siemens AG | 4,900 | | 513,697 |
Siemens AG sponsored ADR | 8,100 | | 850,257 |
Software AG (Bearer) | 759 | | 31,532 |
Volkswagen AG | 1,217 | | 191,663 |
TOTAL GERMANY | | 8,086,408 |
Hong Kong - 1.6% |
China Insurance International Holdings Co. Ltd. (a) | 60,600 | | 131,415 |
China Mobile (Hong Kong) Ltd. | 67,500 | | 641,543 |
China Power International Development Ltd. | 607,000 | | 128,441 |
CNOOC Ltd. | 223,000 | | 421,550 |
CNOOC Ltd. sponsored ADR | 500 | | 94,305 |
Dah Chong Hong Holdings Ltd. | 47,000 | | 57,078 |
Henderson Land Development Co. Ltd. | 6,000 | | 32,796 |
Hong Kong Exchanges and Clearing Ltd. | 27,100 | | 459,396 |
Lenovo Group Ltd. | 48,000 | | 32,271 |
Power Assets Holdings Ltd. | 35,000 | | 265,958 |
TOTAL HONG KONG | | 2,264,753 |
Hungary - 0.0% |
Magyar Telekom PLC | 11,000 | | 25,599 |
India - 1.0% |
Apollo Tyres Ltd. | 8,934 | | 10,477 |
Bank of Baroda | 11,133 | | 175,541 |
Bharti Airtel Ltd. | 54,055 | | 432,911 |
Housing Development Finance Corp. Ltd. | 18,488 | | 260,178 |
Indian Overseas Bank | 43,467 | | 91,094 |
Jain Irrigation Systems Ltd. | 3,152 | | 8,031 |
Jyothy Laboratories Ltd. | 6,140 | | 17,973 |
Punjab National Bank | 2,820 | | 57,448 |
Tata Consultancy Services Ltd. | 9,254 | | 210,508 |
Tata Steel Ltd. | 6,075 | | 59,823 |
Ultratech Cement Ltd. | 4,746 | | 112,057 |
TOTAL INDIA | | 1,436,041 |
Indonesia - 1.1% |
PT Astra International Tbk | 40,000 | | 308,430 |
Common Stocks - continued |
| Shares | | Value |
Indonesia - continued |
PT Bank Negara Indonesia (Persero) Tbk | 281,000 | | $ 125,933 |
PT Bank Rakyat Indonesia Tbk | 439,000 | | 330,061 |
PT Bank Tabungan Negara Tbk | 425,000 | | 68,412 |
PT Bumi Serpong Damai Tbk | 627,900 | | 64,613 |
PT Ciputra Development Tbk | 779,000 | | 42,712 |
PT Gadjah Tunggal Tbk | 146,500 | | 44,799 |
PT Indofood Sukses Makmur Tbk | 213,000 | | 126,437 |
PT Indosat Tbk | 207,000 | | 123,978 |
PT Summarecon Agung Tbk | 260,000 | | 34,025 |
PT Tower Bersama Infrastructure Tbk | 318,000 | | 74,009 |
PT XL Axiata Tbk | 207,000 | | 115,773 |
TOTAL INDONESIA | | 1,459,182 |
Ireland - 0.7% |
CRH PLC sponsored ADR (d) | 33,204 | | 611,286 |
James Hardie Industries NV sponsored ADR (a) | 11,165 | | 362,081 |
TOTAL IRELAND | | 973,367 |
Israel - 0.2% |
Azrieli Group | 5,882 | | 151,342 |
Check Point Software Technologies Ltd. (a) | 2,100 | | 121,023 |
Ituran Location & Control Ltd. | 2,061 | | 27,432 |
TOTAL ISRAEL | | 299,797 |
Italy - 1.5% |
Azimut Holding SpA | 4,314 | | 33,731 |
ENI SpA | 44,600 | | 985,977 |
Fiat Industrial SpA (a) | 32,899 | | 287,060 |
Interpump Group SpA | 28,825 | | 185,652 |
Intesa Sanpaolo SpA | 145,265 | | 259,533 |
Saipem SpA | 5,356 | | 240,154 |
Telecom Italia SpA | 119,900 | | 149,210 |
TOTAL ITALY | | 2,141,317 |
Japan - 11.7% |
ABC-Mart, Inc. | 4,300 | | 168,418 |
Aeon Credit Service Co. Ltd. | 15,900 | | 237,145 |
Air Water, Inc. | 26,000 | | 330,091 |
Aisin Seiki Co. Ltd. | 5,500 | | 173,971 |
Aozora Bank Ltd. | 164,000 | | 414,649 |
Asahi Co. Ltd. | 800 | | 17,726 |
Asahi Glass Co. Ltd. | 19,000 | | 166,403 |
Autobacs Seven Co. Ltd. | 7,200 | | 329,737 |
Common Stocks - continued |
| Shares | | Value |
Japan - continued |
Canon, Inc. | 8,100 | | $ 367,769 |
Chubu Electric Power Co., Inc. | 13,400 | | 245,194 |
Credit Saison Co. Ltd. | 14,300 | | 279,084 |
Daikoku Denki Co. Ltd. | 2,000 | | 17,910 |
Daikokutenbussan Co. Ltd. | 1,500 | | 43,055 |
Denso Corp. | 25,300 | | 778,157 |
Dentsu, Inc. | 7,300 | | 219,833 |
Fanuc Corp. | 6,100 | | 986,437 |
Fast Retailing Co. Ltd. | 1,300 | | 233,556 |
FCC Co. Ltd. | 2,300 | | 48,601 |
GCA Savvian Group Corp. | 16 | | 18,730 |
Glory Ltd. | 900 | | 19,266 |
Goldcrest Co. Ltd. | 860 | | 15,780 |
Honda Motor Co. Ltd. | 15,600 | | 466,558 |
INPEX Corp. | 46 | | 303,735 |
Itochu Corp. | 55,600 | | 549,979 |
Japan Retail Fund Investment Corp. | 318 | | 492,318 |
Japan Tobacco, Inc. | 196 | | 979,765 |
JSR Corp. | 13,000 | | 248,203 |
JX Holdings, Inc. | 61,500 | | 358,276 |
Kamigumi Co. Ltd. | 4,000 | | 34,932 |
KDDI Corp. | 87 | | 637,388 |
Keyence Corp. | 2,010 | | 511,029 |
Kobayashi Pharmaceutical Co. Ltd. | 6,800 | | 337,114 |
Kyoto Kimono Yuzen Co. Ltd. | 1,600 | | 18,615 |
Meiko Network Japan Co. Ltd. | 1,300 | | 10,765 |
Miraial Co. Ltd. | 300 | | 4,662 |
Mitsubishi Corp. | 13,200 | | 271,519 |
Mitsubishi Tanabe Pharma Corp. | 22,400 | | 387,509 |
Nabtesco Corp. | 2,400 | | 52,571 |
Nagaileben Co. Ltd. | 1,200 | | 16,539 |
Nihon M&A Center, Inc. | 6 | | 33,871 |
Nihon Parkerizing Co. Ltd. | 2,000 | | 26,927 |
Nippon Seiki Co. Ltd. | 3,000 | | 30,145 |
Nippon Telegraph & Telephone Corp. | 13,500 | | 692,582 |
Nippon Thompson Co. Ltd. | 8,000 | | 51,534 |
Obic Co. Ltd. | 1,430 | | 270,391 |
ORIX Corp. | 2,930 | | 255,749 |
Osaka Securities Exchange Co. Ltd. | 72 | | 337,440 |
OSG Corp. | 1,300 | | 16,661 |
Santen Pharmaceutical Co. Ltd. | 6,200 | | 231,374 |
Seven & i Holdings Co., Ltd. | 12,000 | | 320,270 |
Common Stocks - continued |
| Shares | | Value |
Japan - continued |
Seven Bank Ltd. | 8 | | $ 14,238 |
SHO-BOND Holdings Co. Ltd. | 6,300 | | 140,552 |
Shoei Co. Ltd. | 1,100 | | 7,403 |
The Nippon Synthetic Chemical Industry Co. Ltd. | 5,000 | | 27,779 |
Tokio Marine Holdings, Inc. | 9,200 | | 219,397 |
Tokyo Gas Co. Ltd. | 98,000 | | 422,074 |
Toray Industries, Inc. | 40,000 | | 284,732 |
Tsumura & Co. | 1,200 | | 33,754 |
Tsutsumi Jewelry Co. Ltd. | 600 | | 13,983 |
Unicharm Corp. | 8,200 | | 367,275 |
USS Co. Ltd. | 9,880 | | 816,876 |
West Japan Railway Co. | 11,800 | | 500,072 |
Yamatake Corp. | 900 | | 19,914 |
Yamato Kogyo Co. Ltd. | 12,900 | | 326,341 |
TOTAL JAPAN | | 16,254,323 |
Kazakhstan - 0.1% |
KazMunaiGas Exploration & Production JSC (Reg. S) GDR | 8,100 | | 137,538 |
Korea (South) - 4.2% |
BS Financial Group, Inc. (a) | 11,160 | | 122,369 |
Cheil Worldwide, Inc. | 6,620 | | 107,992 |
CJ CheilJedang Corp. | 153 | | 42,065 |
CJ Corp. | 2,289 | | 163,382 |
Daum Communications Corp. | 665 | | 80,267 |
Doosan Co. Ltd. | 1,290 | | 162,511 |
GS Holdings Corp. | 2,952 | | 169,406 |
Hana Financial Group, Inc. | 6,920 | | 246,284 |
Hankook Tire Co. Ltd. | 2,340 | | 93,051 |
Hyundai Department Store Co. Ltd. | 1,186 | | 169,409 |
Hyundai Fire & Marine Insurance Co. Ltd. | 2,950 | | 85,101 |
Hyundai Heavy Industries Co. Ltd. | 917 | | 244,075 |
Hyundai Hysco Co. Ltd. | 2,860 | | 110,296 |
Hyundai Mobis | 986 | | 281,132 |
Hyundai Motor Co. | 2,901 | | 582,048 |
Industrial Bank of Korea | 15,910 | | 208,092 |
Kia Motors Corp. | 4,180 | | 266,988 |
Korea Zinc Co. Ltd. | 286 | | 83,516 |
KT&G Corp. | 4,353 | | 271,291 |
LG Chemical Ltd. | 1 | | 321 |
LIG Non-Life Insurance Co. Ltd. | 3,220 | | 68,289 |
Lotte Samkang Co. Ltd. | 104 | | 30,999 |
NCsoft Corp. | 58 | | 18,166 |
Common Stocks - continued |
| Shares | | Value |
Korea (South) - continued |
Nong Shim Co. Ltd. | 600 | | $ 117,135 |
Paradise Co. Ltd. | 14,371 | | 100,625 |
Samsung Card Co. Ltd. | 3,154 | | 117,749 |
Samsung Electronics Co. Ltd. | 1,689 | | 1,448,571 |
Shinhan Financial Group Co. Ltd. | 8,060 | | 319,890 |
SK Chemicals Co. Ltd. | 1,642 | | 104,655 |
TOTAL KOREA (SOUTH) | | 5,815,675 |
Luxembourg - 0.2% |
GlobeOp Financial Services SA | 5,400 | | 24,750 |
Millicom International Cellular SA (depositary receipt) | 1,700 | | 187,352 |
TOTAL LUXEMBOURG | | 212,102 |
Malaysia - 0.1% |
Axiata Group Bhd | 117,600 | | 185,873 |
Mexico - 0.7% |
Embotelladoras Arca SAB de CC | 19,200 | | 91,098 |
Grupo Modelo SAB de CV Series C | 51,500 | | 326,666 |
Wal-Mart de Mexico SA de CV Series V | 218,500 | | 564,452 |
TOTAL MEXICO | | 982,216 |
Netherlands - 1.7% |
Aalberts Industries NV | 2,600 | | 46,038 |
ASM International NV unit | 650 | | 18,343 |
ASML Holding NV | 13,700 | | 574,441 |
ING Groep NV: | | | |
(Certificaten Van Aandelen) (a) | 56,010 | | 482,931 |
sponsored ADR (a) | 17,982 | | 155,364 |
Koninklijke KPN NV | 18,515 | | 243,315 |
Koninklijke Philips Electronics NV | 11,400 | | 237,345 |
QIAGEN NV (a) | 13,700 | | 188,786 |
Unilever NV (Certificaten Van Aandelen) (Bearer) unit | 9,200 | | 317,664 |
Yandex NV | 2,100 | | 57,792 |
TOTAL NETHERLANDS | | 2,322,019 |
Nigeria - 0.1% |
Guaranty Trust Bank PLC GDR (Reg. S) | 23,046 | | 106,012 |
Norway - 1.1% |
Aker Solutions ASA | 12,307 | | 143,128 |
DnB NOR ASA | 33,700 | | 393,134 |
Common Stocks - continued |
| Shares | | Value |
Norway - continued |
Orkla ASA (A Shares) (d) | 36,200 | | $ 315,342 |
Telenor ASA | 36,000 | | 642,719 |
TOTAL NORWAY | | 1,494,323 |
Panama - 0.1% |
Copa Holdings SA Class A | 2,000 | | 138,140 |
Papua New Guinea - 0.0% |
Oil Search Ltd. | 2,098 | | 14,314 |
Peru - 0.1% |
Compania de Minas Buenaventura SA sponsored ADR | 4,900 | | 200,557 |
Philippines - 0.1% |
Globe Telecom, Inc. | 2,500 | | 53,301 |
Jollibee Food Corp. | 9,600 | | 20,400 |
Megaworld Corp. | 70,000 | | 3,087 |
TOTAL PHILIPPINES | | 76,788 |
Poland - 0.1% |
Polska Grupa Energetyczna SA | 16,300 | | 100,453 |
TVN SA | 21,075 | | 84,356 |
TOTAL POLAND | | 184,809 |
Portugal - 0.4% |
Energias de Portugal SA | 38,038 | | 120,284 |
Jeronimo Martins SGPS SA | 28,525 | | 493,447 |
TOTAL PORTUGAL | | 613,731 |
Qatar - 0.0% |
Commercial Bank of Qatar GDR (Reg. S) | 3,576 | | 16,401 |
Russia - 1.1% |
Cherkizovo Group OJSC GDR (a) | 3,818 | | 53,247 |
Lukoil Oil Co. sponsored ADR | 5,212 | | 300,732 |
Mostotrest OAO (a) | 5,300 | | 30,466 |
Gazprom OAO sponsored ADR | 14,921 | | 173,233 |
NOVATEK OAO GDR | 2,900 | | 407,160 |
Rosneft Oil Co. OJSC GDR (Reg. S) | 9,700 | | 69,016 |
Sberbank of Russia (f) | 122,300 | | 331,865 |
TNK-BP Holding | 5,700 | | 15,595 |
Uralkali JSC GDR (Reg. S) | 4,653 | | 201,940 |
TOTAL RUSSIA | | 1,583,254 |
Singapore - 0.8% |
Sakari Resources Ltd. | 33,000 | | 61,621 |
Common Stocks - continued |
| Shares | | Value |
Singapore - continued |
Singapore Telecommunications Ltd. | 221,000 | | $ 558,557 |
United Overseas Bank Ltd. | 31,746 | | 430,402 |
Wing Tai Holdings Ltd. | 12,000 | | 12,168 |
TOTAL SINGAPORE | | 1,062,748 |
South Africa - 1.3% |
African Bank Investments Ltd. | 37,000 | | 160,563 |
African Rainbow Minerals Ltd. | 13,763 | | 318,084 |
Clicks Group Ltd. | 28,266 | | 148,341 |
Foschini Ltd. | 13,098 | | 165,270 |
Imperial Holdings Ltd. | 5,800 | | 85,871 |
JSE Ltd. | 28,200 | | 249,725 |
Life Healthcare Group Holdings Ltd. | 41,607 | | 101,235 |
Mr Price Group Ltd. | 34,600 | | 333,082 |
MTN Group Ltd. | 5,500 | | 95,997 |
Northam Platinum Ltd. | 18,107 | | 70,157 |
TOTAL SOUTH AFRICA | | 1,728,325 |
Spain - 1.5% |
Banco Bilbao Vizcaya Argentaria SA sponsored ADR | 79,238 | | 716,312 |
Grifols SA (a) | 446 | | 8,323 |
Inditex SA | 4,959 | | 451,295 |
Prosegur Compania de Seguridad SA (Reg.) | 6,451 | | 321,838 |
Red Electrica Corporacion SA | 3,500 | | 169,407 |
Repsol YPF SA | 14,179 | | 429,729 |
TOTAL SPAIN | | 2,096,904 |
Sweden - 1.1% |
Fagerhult AB | 5,900 | | 138,913 |
H&M Hennes & Mauritz AB (B Shares) | 18,196 | | 602,575 |
Intrum Justitia AB | 2,800 | | 46,061 |
Swedish Match Co. | 9,350 | | 323,544 |
Tele2 AB (B Shares) | 8,900 | | 187,841 |
Telefonaktiebolaget LM Ericsson (B Shares) | 23,067 | | 240,362 |
TOTAL SWEDEN | | 1,539,296 |
Switzerland - 6.6% |
Bank Sarasin & Co. Ltd. Series B (Reg.) | 1,907 | | 72,799 |
Nestle SA | 63,792 | | 3,700,093 |
Novartis AG sponsored ADR | 4,000 | | 225,880 |
Roche Holding AG (participation certificate) | 14,705 | | 2,424,721 |
Schindler Holding AG: | | | |
(participation certificate) | 2,002 | | 235,435 |
Common Stocks - continued |
| Shares | | Value |
Switzerland - continued |
Schindler Holding AG: - continued | | | |
(Reg.) | 570 | | $ 67,097 |
Syngenta AG (Switzerland) | 890 | | 271,279 |
The Swatch Group AG (Bearer) | 1,780 | | 753,744 |
Transocean Ltd. (United States) | 2,502 | | 142,989 |
UBS AG (NY Shares) (a) | 45,062 | | 568,682 |
Zurich Financial Services AG | 2,668 | | 619,610 |
TOTAL SWITZERLAND | | 9,082,329 |
Taiwan - 1.3% |
Catcher Technology Co. Ltd. | 32,000 | | 178,288 |
Chroma ATE, Inc. | 32,116 | | 64,078 |
Formosa Plastics Corp. | 77,000 | | 226,464 |
Hotai Motor Co. Ltd. | 3,000 | | 13,051 |
HTC Corp. | 8,565 | | 192,486 |
Kinsus Interconnect Technology Corp. | 24,000 | | 82,891 |
Leofoo Development Co. Ltd. (a) | 45,000 | | 29,619 |
President Chain Store Corp. | 24,000 | | 133,458 |
SIMPLO Technology Co. Ltd. | 10,400 | | 61,195 |
Taishin Financial Holdings Co. Ltd. | 489,222 | | 207,145 |
Taiwan Cement Corp. | 173,179 | | 216,280 |
Taiwan Semiconductor Manufacturing Co. Ltd. | 145,035 | | 353,432 |
TOTAL TAIWAN | | 1,758,387 |
Thailand - 0.8% |
Advanced Info Service PCL (For. Reg.) | 62,600 | | 263,003 |
Asian Property Development PCL (For. Reg.) | 428,660 | | 62,653 |
Bangkok Expressway PCL (For.Reg.) | 46,700 | | 24,657 |
Banpu PCL (For. Reg.) | 3,550 | | 72,066 |
Charoen Pokphand Foods PCL (For. Reg.) | 66,400 | | 64,665 |
Krung Thai Bank PCL (For. Reg.) | 174,500 | | 85,391 |
PTT Global Chemical PCL (For. Reg.) (a) | 8,911 | | 18,791 |
PTT PCL (For. Reg.) | 17,300 | | 170,429 |
Siam Cement PCL (For. Reg.) | 10,000 | | 119,896 |
Siam Commercial Bank PCL (For. Reg.) | 73,500 | | 278,036 |
Total Access Communication PCL (For. Reg.) | 200 | | 476 |
TOTAL THAILAND | | 1,160,063 |
Turkey - 1.0% |
Albaraka Turk Katilim Bankasi AS | 21,000 | | 22,208 |
Anadolu Efes Biracilik ve Malt Sanayii AS | 10,000 | | 121,589 |
Aygaz A/S | 15,010 | | 82,000 |
Boyner Buyuk Magazacilik A/S (a) | 9,049 | | 15,199 |
Common Stocks - continued |
| Shares | | Value |
Turkey - continued |
Coca-Cola Icecek AS | 20,489 | | $ 278,092 |
Koc Holding AS | 18,000 | | 64,335 |
Tofas Turk Otomobil Fabrikasi AS | 21,655 | | 83,767 |
Tupras-Turkiye Petrol Rafinerileri AS | 5,313 | | 120,187 |
Turkiye Garanti Bankasi AS | 151,200 | | 533,572 |
TOTAL TURKEY | | 1,320,949 |
United Arab Emirates - 0.0% |
Dubai Financial Market PJSC (a) | 43,463 | | 12,188 |
United Kingdom - 18.1% |
Aegis Group PLC | 54,149 | | 119,477 |
AMEC PLC | 1,801 | | 26,806 |
Anglo American PLC (United Kingdom) | 11,000 | | 405,725 |
Aviva PLC | 65,272 | | 356,162 |
Babcock International Group PLC | 36,100 | | 409,005 |
Barclays PLC | 185,919 | | 576,446 |
Bellway PLC | 2,828 | | 32,291 |
BG Group PLC | 67,077 | | 1,463,300 |
BHP Billiton PLC ADR | 30,000 | | 1,889,100 |
BP PLC sponsored ADR | 33,187 | | 1,466,202 |
British American Tobacco PLC (United Kingdom) | 7,400 | | 339,356 |
British Land Co. PLC | 24,600 | | 201,963 |
Britvic PLC | 8,000 | | 42,444 |
Centrica PLC | 49,175 | | 234,640 |
Compass Group PLC | 28,500 | | 259,419 |
Dechra Pharmaceuticals PLC | 3,500 | | 27,581 |
Derwent London PLC | 800 | | 21,846 |
GlaxoSmithKline PLC sponsored ADR | 49,300 | | 2,208,147 |
Great Portland Estates PLC | 6,372 | | 38,162 |
H&T Group PLC | 4,764 | | 23,827 |
HSBC Holdings PLC sponsored ADR | 9,151 | | 399,533 |
Imperial Tobacco Group PLC | 21,721 | | 794,347 |
InterContinental Hotel Group PLC ADR | 23,450 | | 433,356 |
International Personal Finance PLC | 13,642 | | 60,157 |
International Power PLC | 63,805 | | 347,031 |
Johnson Matthey PLC | 14,092 | | 425,833 |
Kazakhmys PLC | 9,000 | | 134,244 |
Meggitt PLC | 12,298 | | 76,065 |
Micro Focus International PLC | 3,800 | | 20,754 |
National Grid PLC | 65,397 | | 650,301 |
Next PLC | 3,700 | | 152,091 |
Persimmon PLC | 3,137 | | 25,109 |
Common Stocks - continued |
| Shares | | Value |
United Kingdom - continued |
Prudential PLC | 54,997 | | $ 568,176 |
Reckitt Benckiser Group PLC | 10,638 | | 547,115 |
Reed Elsevier PLC | 53,000 | | 455,579 |
Rio Tinto PLC sponsored ADR | 10,360 | | 560,062 |
Rolls-Royce Group PLC | 44,052 | | 497,682 |
Rolls-Royce Group PLC Class C | 3,039,588 | | 4,888 |
Rotork PLC | 9,403 | | 254,653 |
Royal Dutch Shell PLC Class A sponsored ADR | 43,000 | | 3,049,130 |
SABMiller PLC | 15,463 | | 564,867 |
Scottish & Southern Energy PLC | 21,452 | | 463,668 |
Serco Group PLC | 42,839 | | 357,903 |
Shaftesbury PLC | 21,733 | | 176,153 |
Spectris PLC | 1,770 | | 36,208 |
Spirax-Sarco Engineering PLC | 2,404 | | 74,152 |
Standard Chartered PLC (United Kingdom) | 32,873 | | 771,320 |
Ted Baker PLC | 3,075 | | 38,140 |
Tesco PLC | 112,083 | | 724,162 |
Ultra Electronics Holdings PLC | 1,400 | | 35,844 |
Unite Group PLC | 60,302 | | 171,457 |
Victrex PLC | 9,318 | | 190,312 |
Vodafone Group PLC sponsored ADR | 65,347 | | 1,819,260 |
TOTAL UNITED KINGDOM | | 25,021,451 |
United States of America - 5.7% |
Allergan, Inc. | 2,600 | | 218,712 |
ANSYS, Inc. (a) | 300 | | 16,308 |
Autoliv, Inc. | 7,700 | | 444,829 |
Berkshire Hathaway, Inc. Class B (a) | 6,845 | | 532,952 |
Broadridge Financial Solutions, Inc. | 690 | | 15,353 |
Cognizant Technology Solutions Corp. Class A (a) | 1,910 | | 138,953 |
Cymer, Inc. (a) | 4,150 | | 180,318 |
Dril-Quip, Inc. (a) | 490 | | 31,899 |
eBay, Inc. (a) | 8,164 | | 259,860 |
Evercore Partners, Inc. Class A | 920 | | 25,245 |
Freeport-McMoRan Copper & Gold, Inc. | 1,300 | | 52,338 |
Google, Inc. Class A (a) | 520 | | 308,173 |
Greenhill & Co., Inc. | 300 | | 11,334 |
ION Geophysical Corp. (a) | 35,141 | | 267,774 |
JPMorgan Chase & Co. | 5,298 | | 184,158 |
Juniper Networks, Inc. (a) | 19,260 | | 471,292 |
Kansas City Southern (a) | 920 | | 58,116 |
Lam Research Corp. (a) | 4,708 | | 202,397 |
Common Stocks - continued |
| Shares | | Value |
United States of America - continued |
Martin Marietta Materials, Inc. | 2,190 | | $ 158,052 |
MasterCard, Inc. Class A | 2,009 | | 697,605 |
Mead Johnson Nutrition Co. Class A | 8,000 | | 574,800 |
Mohawk Industries, Inc. (a) | 6,930 | | 364,865 |
Nuance Communications, Inc. (a) | 4,251 | | 112,566 |
Oceaneering International, Inc. | 820 | | 34,301 |
Philip Morris International, Inc. | 11,700 | | 817,479 |
PriceSmart, Inc. | 1,400 | | 106,456 |
ResMed, Inc. (a) | 10,370 | | 293,471 |
Solera Holdings, Inc. | 3,121 | | 170,500 |
Solutia, Inc. (a) | 884 | | 14,365 |
SS&C Technologies Holdings, Inc. (a) | 954 | | 15,130 |
Union Pacific Corp. | 4,700 | | 467,979 |
Visa, Inc. Class A | 6,901 | | 643,587 |
TOTAL UNITED STATES OF AMERICA | | 7,891,167 |
TOTAL COMMON STOCKS (Cost $138,836,607) |
133,653,906
|
Nonconvertible Preferred Stocks - 0.2% |
| | | |
Germany - 0.1% |
Volkswagen AG | 1,034 | | 181,445 |
Italy - 0.1% |
Telecom Italia SpA (Risparmio Shares) | 143,000 | | 150,094 |
TOTAL NONCONVERTIBLE PREFERRED STOCKS (Cost $392,992) |
331,539
|
Money Market Funds - 3.6% |
| Shares | | Value |
Fidelity Cash Central Fund, 0.12% (b) | 4,609,098 | | $ 4,609,098 |
Fidelity Securities Lending Cash Central Fund, 0.11% (b)(c) | 363,225 | | 363,225 |
TOTAL MONEY MARKET FUNDS (Cost $4,972,323) |
4,972,323
|
TOTAL INVESTMENT PORTFOLIO - 100.3% (Cost $144,201,922) | | 138,957,768 |
NET OTHER ASSETS (LIABILITIES) - (0.3)% | | (468,208) |
NET ASSETS - 100% | $ 138,489,560 |
Legend |
(a) Non-income producing |
(b) Affiliated fund that is available only to investment companies and other accounts managed by Fidelity Investments. The rate quoted is the annualized seven-day yield of the fund at period end. A complete unaudited listing of the fund's holdings as of its most recent quarter end is available upon request. In addition, each Fidelity Central Fund's financial statements, which are not covered by the Fund's Report of Independent Registered Public Accounting Firm, are available on the SEC's website or upon request. |
(c) Investment made with cash collateral received from securities on loan. |
(d) Security or a portion of the security is on loan at period end. |
(e) Security exempt from registration under Rule 144A of the Securities Act of 1933. These securities may be resold in transactions exempt from registration, normally to qualified institutional buyers. At the end of the period, the value of these securities amounted to $121,871 or 0.1% of net assets. |
(f) Security or a portion of the security purchased on a delayed delivery or when-issued basis. |
Affiliated Central Funds |
Information regarding fiscal year to date income earned by the Fund from investments in Fidelity Central Funds is as follows: |
Fund | Income earned |
Fidelity Cash Central Fund | $ 181 |
Fidelity Securities Lending Cash Central Fund | 31,105 |
Total | $ 31,286 |
Other Information |
The following is a summary of the inputs used, as of October 31, 2011, involving the Fund's assets and liabilities carried at fair value. The inputs or methodology used for valuing securities may not be an indication of the risk associated with investing in those securities. For more information on valuation inputs, and their aggregation into the levels used in the table below, please refer to the Security Valuation section in the accompanying Notes to Financial Statements. |
Valuation Inputs at Reporting Date: |
Description | Total | Level 1 | Level 2 | Level 3 |
Investments in Securities: | | | | |
Equities: | | | | |
United Kingdom | $ 25,021,451 | $ 22,531,010 | $ 2,490,441 | $ - |
Japan | 16,254,323 | - | 16,254,323 | - |
Switzerland | 9,082,329 | 8,811,050 | 271,279 | - |
Germany | 8,267,853 | 7,754,156 | 513,697 | - |
United States of America | 7,891,167 | 7,891,167 | - | - |
France | 6,728,675 | 5,233,865 | 1,494,810 | - |
Australia | 6,010,403 | 220,883 | 5,789,520 | - |
Korea (South) | 5,815,675 | - | 5,815,675 | - |
Brazil | 5,687,535 | 5,687,535 | - | - |
Other | 43,226,034 | 25,351,417 | 17,874,617 | - |
Money Market Funds | 4,972,323 | 4,972,323 | - | - |
Total Investments in Securities: | $ 138,957,768 | $ 88,453,406 | $ 50,504,362 | $ - |
Income Tax Information |
At October 31, 2011, the Fund had a capital loss carryforward of approximately $33,183,732 of which $8,618,744, $15,708,944 and $8,856,044 will expire in fiscal 2016, 2017 and 2019, respectively. Capital loss carryforwards are only available to offset future capital gains of the Fund to the extent provided by regulations and may be limited. |
See accompanying notes which are an integral part of the financial statements.
Annual Report
Statement of Assets and Liabilities
| October 31, 2011 |
| | |
Assets | | |
Investment in securities, at value (including securities loaned of $332,595) - See accompanying schedule: Unaffiliated issuers (cost $139,229,599) | $ 133,985,445 | |
Fidelity Central Funds (cost $4,972,323) | 4,972,323 | |
Total Investments (cost $144,201,922) | | $ 138,957,768 |
Foreign currency held at value (cost $450,490) | | 463,177 |
Receivable for investments sold | | 1,171,368 |
Receivable for fund shares sold | | 684,946 |
Dividends receivable | | 284,271 |
Distributions receivable from Fidelity Central Funds | | 1,137 |
Prepaid expenses | | 689 |
Receivable from investment adviser for expense reductions | | 57,911 |
Other receivables | | 29,554 |
Total assets | | 141,650,821 |
| | |
Liabilities | | |
Payable to custodian bank | $ 54,666 | |
Payable for investments purchased
Regular delivery | 1,969,977 | |
Delayed delivery | 55,088 | |
Payable for fund shares redeemed | 506,258 | |
Accrued management fee | 77,502 | |
Distribution and service plan fees payable | 2,583 | |
Other affiliated payables | 30,824 | |
Other payables and accrued expenses | 101,138 | |
Collateral on securities loaned, at value | 363,225 | |
Total liabilities | | 3,161,261 |
| | |
Net Assets | | $ 138,489,560 |
Net Assets consist of: | | |
Paid in capital | | $ 176,367,284 |
Undistributed net investment income | | 1,552,849 |
Accumulated undistributed net realized gain (loss) on investments and foreign currency transactions | | (34,194,366) |
Net unrealized appreciation (depreciation) on investments and assets and liabilities in foreign currencies | | (5,236,207) |
Net Assets | | $ 138,489,560 |
See accompanying notes which are an integral part of the financial statements.
Annual Report
Financial Statements - continued
Statement of Assets and Liabilities - continued
| October 31, 2011 |
| | |
Calculation of Maximum Offering Price Class A:
Net Asset Value and redemption price per share ($4,307,161 ÷ 645,276 shares) | | $ 6.67 |
| | |
Maximum offering price per share (100/94.25 of $6.67) | | $ 7.08 |
Class T:
Net Asset Value and redemption price per share ($996,899 ÷ 148,175 shares) | | $ 6.73 |
| | |
Maximum offering price per share (100/96.50 of $6.73) | | $ 6.97 |
Class B:
Net Asset Value and offering price per share ($254,279 ÷ 38,057 shares)A | | $ 6.68 |
| | |
Class C:
Net Asset Value and offering price per share ($1,395,692 ÷ 209,094 shares)A | | $ 6.67 |
| | |
Total International Equity:
Net Asset Value, offering price and redemption price per share ($131,338,267 ÷ 19,645,402 shares) | | $ 6.69 |
| | |
Institutional Class:
Net Asset Value, offering price and redemption price per share ($197,262 ÷ 29,577 shares) | | $ 6.67 |
A Redemption price per share is equal to net asset value less any applicable contingent deferred sales charge.
See accompanying notes which are an integral part of the financial statements.
Annual Report
Statement of Operations
| Year ended October 31, 2011 |
| | |
Investment Income | | |
Dividends | | $ 3,448,845 |
Interest | | 1,597 |
Income from Fidelity Central Funds | | 31,286 |
Income before foreign taxes withheld | | 3,481,728 |
Less foreign taxes withheld | | (260,512) |
Total income | | 3,221,216 |
| | |
Expenses | | |
Management fee
Basic fee | $ 797,169 | |
Performance adjustment | (22,587) | |
Transfer agent fees | 274,385 | |
Distribution and service plan fees | 36,441 | |
Accounting and security lending fees | 58,516 | |
Custodian fees and expenses | 310,251 | |
Independent trustees' compensation | 597 | |
Registration fees | 80,712 | |
Audit | 106,913 | |
Legal | 401 | |
Miscellaneous | 731 | |
Total expenses before reductions | 1,643,529 | |
Expense reductions | (287,161) | 1,356,368 |
Net investment income (loss) | | 1,864,848 |
Realized and Unrealized Gain (Loss) Net realized gain (loss) on: | | |
Investment securities: | | |
Unaffiliated issuers | (8,922,239) | |
Foreign currency transactions | (75,788) | |
Total net realized gain (loss) | | (8,998,027) |
Change in net unrealized appreciation (depreciation) on: Investment securities | (8,598,208) | |
Assets and liabilities in foreign currencies | 299 | |
Total change in net unrealized appreciation (depreciation) | | (8,597,909) |
Net gain (loss) | | (17,595,936) |
Net increase (decrease) in net assets resulting from operations | | $ (15,731,088) |
See accompanying notes which are an integral part of the financial statements.
Annual Report
Financial Statements - continued
Statement of Changes in Net Assets
| Year ended
October 31,
2011 | Year ended
October 31,
2010 |
Increase (Decrease) in Net Assets | | |
Operations | | |
Net investment income (loss) | $ 1,864,848 | $ 773,945 |
Net realized gain (loss) | (8,998,027) | 1,906,137 |
Change in net unrealized appreciation (depreciation) | (8,597,909) | 5,447,726 |
Net increase (decrease) in net assets resulting
from operations | (15,731,088) | 8,127,808 |
Distributions to shareholders from net investment income | (953,041) | (411,223) |
Distributions to shareholders from net realized gain | (220,294) | (169,935) |
Total distributions | (1,173,335) | (581,158) |
Share transactions - net increase (decrease) | 86,742,563 | 18,410,630 |
Redemption fees | 14,195 | 6,300 |
Total increase (decrease) in net assets | 69,852,335 | 25,963,580 |
| | |
Net Assets | | |
Beginning of period | 68,637,225 | 42,673,645 |
End of period (including undistributed net investment income of $1,552,849 and undistributed net investment income of $724,017, respectively) | $ 138,489,560 | $ 68,637,225 |
See accompanying notes which are an integral part of the financial statements.
Annual Report
Financial Highlights - Class A
Years ended October 31, | 2011 | 2010 | 2009 | 2008 F |
Selected Per-Share Data | | | | |
Net asset value, beginning of period | $ 7.36 | $ 6.40 | $ 4.90 | $ 10.00 |
Income from Investment Operations | | | | |
Net investment income (loss) C | .11 | .08 | .06 | .11 |
Net realized and unrealized gain (loss) | (.69) | .95 | 1.55 | (5.21) |
Total from investment operations | (.58) | 1.03 | 1.61 | (5.10) |
Distributions from net investment income | (.09) | (.04) | (.11) | - |
Distributions from net realized gain | (.02) | (.03) | - | - |
Total distributions | (.11) | (.07) | (.11) | - |
Redemption fees added to paid in capital C,H | - | - | - | - |
Net asset value, end of period | $ 6.67 | $ 7.36 | $ 6.40 | $ 4.90 |
Total Return A,B | (8.03)% | 16.17% | 33.87% | (51.00)% |
Ratios to Average Net Assets D,G | | | | |
Expenses before reductions | 1.73% | 2.02% | 2.09% | 2.00% |
Expenses net of fee waivers, if any | 1.45% | 1.50% | 1.50% | 1.50% |
Expenses net of all reductions | 1.42% | 1.47% | 1.47% | 1.48% |
Net investment income (loss) | 1.44% | 1.15% | 1.13% | 1.35% |
Supplemental Data | | | | |
Net assets, end of period (000 omitted) | $ 4,307 | $ 5,029 | $ 3,727 | $ 5,944 |
Portfolio turnover rate E | 75% | 67% | 98% | 91% |
A Total returns would have been lower if certain expenses had not been reduced during the applicable periods shown.
B Total returns do not include the effect of the sales charges.
C Calculated based on average shares outstanding during the period.
D Fees and expenses of any underlying Fidelity Central Funds are not included in the Fund's expense ratio. The Fund indirectly bears its proportionate share of the expenses of any underlying Fidelity Central Funds.
E Amount does not include the portfolio activity of any underlying Fidelity Central Funds.
F For the period November 1, 2007 (commencement of operations) to October 31, 2008.
G Expense ratios reflect operating expenses of the class. Expenses before reductions do not reflect amounts reimbursed by the investment adviser or reductions from brokerage service arrangements or reductions from other expense offset arrangements and do not represent the amount paid by the class during periods when reimbursements or reductions occur. Expense ratios before reductions for start-up periods may not be representative of longer-term operating periods. Expenses net of fee waivers reflect expenses after reimbursement by the investment adviser but prior to reductions from brokerage service arrangements or other expense offset arrangements. Expenses net of all reductions represent the net expenses paid by the class.
H Amount represents less than $.01 per share.
See accompanying notes which are an integral part of the financial statements.
Annual Report
Financial Highlights - Class T
Years ended October 31, | 2011 | 2010 | 2009 | 2008 F |
Selected Per-Share Data | | | | |
Net asset value, beginning of period | $ 7.41 | $ 6.40 | $ 4.88 | $ 10.00 |
Income from Investment Operations | | | | |
Net investment income (loss) C | .09 | .06 | .04 | .09 |
Net realized and unrealized gain (loss) | (.68) | .95 | 1.57 | (5.21) |
Total from investment operations | (.59) | 1.01 | 1.61 | (5.12) |
Distributions from net investment income | (.07) | - | (.09) | - |
Distributions from net realized gain | (.02) | - | - | - |
Total distributions | (.09) | - | (.09) | - |
Redemption fees added to paid in capital C,H | - | - | - | - |
Net asset value, end of period | $ 6.73 | $ 7.41 | $ 6.40 | $ 4.88 |
Total Return A,B | (8.08)% | 15.78% | 33.74% | (51.20)% |
Ratios to Average Net Assets D,G | | | | |
Expenses before reductions | 2.02% | 2.31% | 2.34% | 2.42% |
Expenses net of fee waivers, if any | 1.70% | 1.75% | 1.75% | 1.75% |
Expenses net of all reductions | 1.67% | 1.72% | 1.72% | 1.73% |
Net investment income (loss) | 1.19% | .90% | .88% | 1.10% |
Supplemental Data | | | | |
Net assets, end of period (000 omitted) | $ 997 | $ 1,004 | $ 1,526 | $ 2,567 |
Portfolio turnover rate E | 75% | 67% | 98% | 91% |
A Total returns would have been lower if certain expenses had not been reduced during the applicable periods shown.
B Total returns do not include the effect of the sales charges.
C Calculated based on average shares outstanding during the period.
D Fees and expenses of any underlying Fidelity Central Funds are not included in the Fund's expense ratio. The Fund indirectly bears its proportionate share of the expenses of any underlying Fidelity Central Funds.
E Amount does not include the portfolio activity of any underlying Fidelity Central Funds.
F For the period November 1, 2007 (commencement of operations) to October 31, 2008.
G Expense ratios reflect operating expenses of the class. Expenses before reductions do not reflect amounts reimbursed by the investment adviser or reductions from brokerage service arrangements or reductions from other expense offset arrangements and do not represent the amount paid by the class during periods when reimbursements or reductions occur. Expense ratios before reductions for start-up periods may not be representative of longer-term operating periods. Expenses net of fee waivers reflect expenses after reimbursement by the investment adviser but prior to reductions from brokerage service arrangements or other expense offset arrangements. Expenses net of all reductions represent the net expenses paid by the class.
H Amount represents less than $.01 per share.
See accompanying notes which are an integral part of the financial statements.
Annual Report
Financial Highlights - Class B
Years ended October 31, | 2011 | 2010 | 2009 | 2008 F |
Selected Per-Share Data | | | | |
Net asset value, beginning of period | $ 7.37 | $ 6.39 | $ 4.86 | $ 10.00 |
Income from Investment Operations | | | | |
Net investment income (loss) C | .05 | .03 | .02 | .05 |
Net realized and unrealized gain (loss) | (.68) | .95 | 1.56 | (5.19) |
Total from investment operations | (.63) | .98 | 1.58 | (5.14) |
Distributions from net investment income | (.04) | - | (.05) | - |
Distributions from net realized gain | (.02) | - | - | - |
Total distributions | (.06) | - | (.05) | - |
Redemption fees added to paid in capital C,H | - | - | - | - |
Net asset value, end of period | $ 6.68 | $ 7.37 | $ 6.39 | $ 4.86 |
Total Return A,B | (8.66)% | 15.34% | 32.95% | (51.40)% |
Ratios to Average Net Assets D,G | | | | |
Expenses before reductions | 2.51% | 2.81% | 2.82% | 2.92% |
Expenses net of fee waivers, if any | 2.20% | 2.25% | 2.25% | 2.25% |
Expenses net of all reductions | 2.17% | 2.22% | 2.22% | 2.24% |
Net investment income (loss) | .69% | .40% | .38% | .60% |
Supplemental Data | | | | |
Net assets, end of period (000 omitted) | $ 254 | $ 327 | $ 1,337 | $ 2,505 |
Portfolio turnover rate E | 75% | 67% | 98% | 91% |
A Total returns would have been lower if certain expenses had not been reduced during the applicable periods shown.
B Total returns do not include the effect of the contingent deferred sales charge.
C Calculated based on average shares outstanding during the period.
D Fees and expenses of any underlying Fidelity Central Funds are not included in the Fund's expense ratio. The Fund indirectly bears its proportionate share of the expenses of any underlying Fidelity Central Funds.
E Amount does not include the portfolio activity of any underlying Fidelity Central Funds.
F For the period November 1, 2007 (commencement of operations) to October 31, 2008.
G Expense ratios reflect operating expenses of the class. Expenses before reductions do not reflect amounts reimbursed by the investment adviser or reductions from brokerage service arrangements or reductions from other expense offset arrangements and do not represent the amount paid by the class during periods when reimbursements or reductions occur. Expense ratios before reductions for start-up periods may not be representative of longer-term operating periods. Expenses net of fee waivers reflect expenses after reimbursement by the investment adviser but prior to reductions from brokerage service arrangements or other expense offset arrangements. Expenses net of all reductions represent the net expenses paid by the class.
H Amount represents less than $.01 per share.
See accompanying notes which are an integral part of the financial statements.
Annual Report
Financial Highlights - Class C
Years ended October 31, | 2011 | 2010 | 2009 | 2008 F |
Selected Per-Share Data | | | | |
Net asset value, beginning of period | $ 7.36 | $ 6.39 | $ 4.86 | $ 10.00 |
Income from Investment Operations | | | | |
Net investment income (loss) C | .05 | .03 | .02 | .05 |
Net realized and unrealized gain (loss) | (.69) | .94 | 1.56 | (5.19) |
Total from investment operations | (.64) | .97 | 1.58 | (5.14) |
Distributions from net investment income | (.03) | - | (.05) | - |
Distributions from net realized gain | (.02) | - | - | - |
Total distributions | (.05) | - | (.05) | - |
Redemption fees added to paid in capital C,H | - | - | - | - |
Net asset value, end of period | $ 6.67 | $ 7.36 | $ 6.39 | $ 4.86 |
Total Return A,B | (8.72)% | 15.18% | 33.10% | (51.40)% |
Ratios to Average Net Assets D,G | | | | |
Expenses before reductions | 2.51% | 2.80% | 2.85% | 2.92% |
Expenses net of fee waivers, if any | 2.20% | 2.25% | 2.25% | 2.25% |
Expenses net of all reductions | 2.17% | 2.22% | 2.22% | 2.23% |
Net investment income (loss) | .69% | .40% | .38% | .60% |
Supplemental Data | | | | |
Net assets, end of period (000 omitted) | $ 1,396 | $ 1,423 | $ 1,714 | $ 2,787 |
Portfolio turnover rate E | 75% | 67% | 98% | 91% |
A Total returns would have been lower if certain expenses had not been reduced during the applicable periods shown.
B Total returns do not include the effect of the contingent deferred sales charge.
C Calculated based on average shares outstanding during the period.
D Fees and expenses of any underlying Fidelity Central Funds are not included in the Fund's expense ratio. The Fund indirectly bears its proportionate share of the expenses of any underlying Fidelity Central Funds.
E Amount does not include the portfolio activity of any underlying Fidelity Central Funds.
F For the period November 1, 2007 (commencement of operations) to October 31, 2008.
G Expense ratios reflect operating expenses of the class. Expenses before reductions do not reflect amounts reimbursed by the investment adviser or reductions from brokerage service arrangements or reductions from other expense offset arrangements and do not represent the amount paid by the class during periods when reimbursements or reductions occur. Expense ratios before reductions for start-up periods may not be representative of longer-term operating periods. Expenses net of fee waivers reflect expenses after reimbursement by the investment adviser but prior to reductions from brokerage service arrangements or other expense offset arrangements. Expenses net of all reductions represent the net expenses paid by the class.
H Amount represents less than $.01 per share.
See accompanying notes which are an integral part of the financial statements.
Annual Report
Financial Highlights - Total International Equity
Years ended October 31, | 2011 | 2010 | 2009 | 2008 E |
Selected Per-Share Data | | | | |
Net asset value, beginning of period | $ 7.37 | $ 6.41 | $ 4.91 | $ 10.00 |
Income from Investment Operations | | | | |
Net investment income (loss) B | .12 | .09 | .07 | .13 |
Net realized and unrealized gain (loss) | (.68) | .96 | 1.55 | (5.21) |
Total from investment operations | (.56) | 1.05 | 1.62 | (5.08) |
Distributions from net investment income | (.10) | (.06) | (.12) | (.01) |
Distributions from net realized gain | (.02) | (.03) | - | - |
Total distributions | (.12) | (.09) | (.12) | (.01) |
Redemption fees added to paid in capital B,G | - | - | - | - |
Net asset value, end of period | $ 6.69 | $ 7.37 | $ 6.41 | $ 4.91 |
Total Return A | (7.70)% | 16.45% | 34.23% | (50.87)% |
Ratios to Average Net Assets C,F | | | | |
Expenses before reductions | 1.42% | 1.79% | 1.87% | 1.89% |
Expenses net of fee waivers, if any | 1.20% | 1.25% | 1.25% | 1.25% |
Expenses net of all reductions | 1.17% | 1.22% | 1.22% | 1.23% |
Net investment income (loss) | 1.69% | 1.40% | 1.38% | 1.60% |
Supplemental Data | | | | |
Net assets, end of period (000 omitted) | $ 131,338 | $ 60,826 | $ 33,061 | $ 23,226 |
Portfolio turnover rate D | 75% | 67% | 98% | 91% |
A Total returns would have been lower if certain expenses had not been reduced during the applicable periods shown.
B Calculated based on average shares outstanding during the period.
C Fees and expenses of any underlying Fidelity Central Funds are not included in the Fund's expense ratio. The Fund indirectly bears its proportionate share of the expenses of any underlying Fidelity Central Funds.
D Amount does not include the portfolio activity of any underlying Fidelity Central Funds.
E For the period November 1, 2007 (commencement of operations) to October 31, 2008.
F Expense ratios reflect operating expenses of the class. Expenses before reductions do not reflect amounts reimbursed by the investment adviser or reductions from brokerage service arrangements or reductions from other expense offset arrangements and do not represent the amount paid by the class during periods when reimbursements or reductions occur. Expense ratios before reductions for start-up periods may not be representative of longer-term operating periods. Expenses net of fee waivers reflect expenses after reimbursement by the investment adviser but prior to reductions from brokerage service arrangements or other expense offset arrangements. Expenses net of all reductions represent the net expenses paid by the class.
G Amount represents less than $.01 per share.
See accompanying notes which are an integral part of the financial statements.
Annual Report
Financial Highlights - Institutional Class
Years ended October 31, | 2011 | 2010 | 2009 | 2008 E |
Selected Per-Share Data | | | | |
Net asset value, beginning of period | $ 7.35 | $ 6.41 | $ 4.91 | $ 10.00 |
Income from Investment Operations | | | | |
Net investment income (loss) B | .12 | .10 | .07 | .13 |
Net realized and unrealized gain (loss) | (.68) | .95 | 1.55 | (5.21) |
Total from investment operations | (.56) | 1.05 | 1.62 | (5.08) |
Distributions from net investment income | (.10) | (.08) | (.12) | (.01) |
Distributions from net realized gain | (.02) | (.03) | - | - |
Total distributions | (.12) | (.11) | (.12) | (.01) |
Redemption fees added to paid in capital B,G | - | - | - | - |
Net asset value, end of period | $ 6.67 | $ 7.35 | $ 6.41 | $ 4.91 |
Total Return A | (7.72)% | 16.48% | 34.23% | (50.87)% |
Ratios to Average Net Assets C,F | | | | |
Expenses before reductions | 1.48% | 1.82% | 1.80% | 1.91% |
Expenses net of fee waivers, if any | 1.20% | 1.25% | 1.25% | 1.25% |
Expenses net of all reductions | 1.17% | 1.23% | 1.22% | 1.23% |
Net investment income (loss) | 1.69% | 1.40% | 1.38% | 1.60% |
Supplemental Data | | | | |
Net assets, end of period (000 omitted) | $ 197 | $ 28 | $ 1,308 | $ 2,733 |
Portfolio turnover rate D | 75% | 67% | 98% | 91% |
A Total returns would have been lower if certain expenses had not been reduced during the applicable periods shown.
B Calculated based on average shares outstanding during the period.
C Fees and expenses of any underlying Fidelity Central Funds are not included in the Fund's expense ratio. The Fund indirectly bears its proportionate share of the expenses of any underlying Fidelity Central Funds.
D Amount does not include the portfolio activity of any underlying Fidelity Central Funds.
E For the period November 1, 2007 (commencement of operations) to October 31, 2008.
F Expense ratios reflect operating expenses of the class. Expenses before reductions do not reflect amounts reimbursed by the investment adviser or reductions from brokerage service arrangements or reductions from other expense offset arrangements and do not represent the amount paid by the class during periods when reimbursements or reductions occur. Expense ratios before reductions for start-up periods may not be representative of longer-term operating periods. Expenses net of fee waivers reflect expenses after reimbursement by the investment adviser but prior to reductions from brokerage service arrangements or other expense offset arrangements. Expenses net of all reductions represent the net expenses paid by the class.
G Amount represents less than $.01 per share.
See accompanying notes which are an integral part of the financial statements.
Annual Report
Notes to Financial Statements
For the period ended October 31, 2011
1. Organization.
Fidelity Total International Equity Fund (the Fund) is a fund of Fidelity Investment Trust (the Trust) and is authorized to issue an unlimited number of shares. The Trust is registered under the Investment Company Act of 1940, as amended (the 1940 Act), as an open-end management investment company organized as a Massachusetts business trust. The Fund offers Class A, Class T, Class C, Total International Equity and Institutional Class shares, each of which, along with Class B shares, has equal rights as to assets and voting privileges. Effective after the close of business on September 1, 2010, Class B shares were closed to new accounts and additional purchases, except for exchanges and reinvestments by existing shareholders. Each class has exclusive voting rights with respect to matters that affect that class. Class B shares will automatically convert to Class A shares after a holding period of seven years from the initial date of purchase. Investment income, realized and unrealized capital gains and losses, the common expenses of the Fund, and certain fund-level expense reductions, if any, are allocated on a pro-rata basis to each class based on the relative net assets of each class to the total net assets of the Fund. Each class differs with respect to transfer agent and distribution and service plan fees incurred. Certain expense reductions may also differ by class. The Fund's investments in emerging markets can be subject to social, economic, regulatory, and political uncertainties and can be extremely volatile.
2. Investments in Fidelity Central Funds.
The Fund invests in Fidelity Central Funds, which are open-end investment companies available only to other investment companies and accounts managed by Fidelity Management & Research Company (FMR) and its affiliates. The Fund's Schedule of Investments lists each of the Fidelity Central Funds held as of period end, if any, as an investment of the Fund, but does not include the underlying holdings of each Fidelity Central Fund. As an Investing Fund, the Fund indirectly bears its proportionate share of the expenses of the underlying Fidelity Central Funds.
The Money Market Central Funds seek preservation of capital and current income and are managed by Fidelity Investments Money Management, Inc. (FIMM), an affiliate of FMR.
A complete unaudited list of holdings for each Fidelity Central Fund is available upon request or at the Securities and Exchange Commission (the SEC) web site at www.sec.gov. In addition, the financial statements of the Fidelity Central Funds, which are not covered by the Fund's Report of Independent Registered Public Accounting Firm are available on the SEC web site or upon request.
Annual Report
Notes to Financial Statements - continued
3. Significant Accounting Policies.
The financial statements have been prepared in conformity with accounting principles generally accepted in the United States of America (GAAP), which require management to make certain estimates and assumptions at the date of the financial statements. Actual results could differ from those estimates. Subsequent events, if any, through the date that the financial statements were issued have been evaluated in the preparation of the financial statements. The following summarizes the significant accounting policies of the Fund:
Security Valuation. Investments are valued as of 4:00 p.m. Eastern time on the last calendar day of the period. The Fund uses independent pricing services approved by the Board of Trustees to value its investments. When current market prices or quotations are not readily available or reliable, valuations may be determined in good faith in accordance with procedures adopted by the Board of Trustees. Factors used in determining value may include market or security specific events. The frequency with which these procedures are used cannot be predicted and they may be utilized to a significant extent. The value used for net asset value (NAV) calculation under these procedures may differ from published prices for the same securities.
The Fund categorizes the inputs to valuation techniques used to value its investments into a disclosure hierarchy consisting of three levels as shown below:
Level 1 - quoted prices in active markets for identical investments
Level 2 - other significant observable inputs (including quoted prices for similar investments, interest rates, prepayment speeds, etc.)
Level 3 - unobservable inputs (including the Fund's own assumptions based on the best information available)
Changes in valuation techniques may result in transfers in or out of an assigned level within the disclosure hierarchy. The aggregate value of investments by input level, as of October 31, 2011, is included at the end of the Fund's Schedule of Investments. Valuation techniques used to value the Fund's investments by major category are as follows:
Equity securities, including restricted securities, for which market quotations are readily available, are valued at the last reported sale price or official closing price as reported by an independent pricing service on the primary market or exchange on which they are traded and are categorized as Level 1 in the hierarchy. In the event there were no sales during the day or closing prices are not available, securities are valued at the last quoted bid price or may be valued using the last available price and are generally categorized as Level 2 in the hierarchy. For foreign equity securities, when significant market or security specific events arise, comparisons to the valuation of American Depositary Receipts
Annual Report
3. Significant Accounting Policies - continued
Security Valuation - continued
(ADRs), futures contracts, Exchange-traded funds (ETFs) and certain indexes as well as quoted prices for similar securities are used and are categorized as Level 2 in the hierarchy in these circumstances. Utilizing these techniques may result in transfers between Level 1 and Level 2. For restricted equity securities and private placements where observable inputs are limited, assumptions about market activity and risk are used and are categorized as Level 3 in the hierarchy.
Investments in open-end mutual funds, including the Fidelity Central Funds, are valued at their closing net asset value each business day and are categorized as Level 1 in the hierarchy.
Foreign Currency. The Fund may use foreign currency contracts to facilitate transactions in foreign-denominated securities. Gains and losses from these transactions may arise from changes in the value of the foreign currency or if the counterparties do not perform under the contracts' terms.
Foreign-denominated assets, including investment securities, and liabilities are translated into U.S. dollars at the exchange rate at period end. Purchases and sales of investment securities, income and dividends received and expenses denominated in foreign currencies are translated into U.S. dollars at the exchange rate in effect on the transaction date.
The effects of exchange rate fluctuations on investments are included with the net realized and unrealized gain (loss) on investment securities. Other foreign currency transactions resulting in realized and unrealized gain (loss) are disclosed separately.
Investment Transactions and Income. For financial reporting purposes, the Fund's investment holdings and NAV include trades executed through the end of the last business day of the period. The NAV per share for processing shareholder transactions is calculated as of the close of business of the New York Stock Exchange (NYSE), normally 4:00 p.m. Eastern time and includes trades executed through the end of the prior business day. Gains and losses on securities sold are determined on the basis of identified cost. Dividend income is recorded on the ex-dividend date, except for certain dividends from foreign securities where the ex-dividend date may have passed, which are recorded as soon as the Fund is informed of the ex-dividend date. Non-cash dividends included in dividend income, if any, are recorded at the fair market value of the securities received. Distributions received on securities that represent a return of capital or capital gain are recorded as a reduction of cost of investments and/or as a realized gain. The Fund estimates the components of distributions received that may be considered return of capital distributions or capital gain distributions. Interest income and distributions from the Fidelity Central Funds are accrued as earned. Interest income includes coupon
Annual Report
Notes to Financial Statements - continued
3. Significant Accounting Policies - continued
Investment Transactions and Income - continued
interest and amortization of premium and accretion of discount on debt securities. Investment income is recorded net of foreign taxes withheld where recovery of such taxes is uncertain.
Expenses. Expenses directly attributable to a fund are charged to that fund. Expenses attributable to more than one fund are allocated among the respective funds on the basis of relative net assets or other appropriate methods. Expense estimates are accrued in the period to which they relate and adjustments are made when actual amounts are known.
Income Tax Information and Distributions to Shareholders. Each year, the Fund intends to qualify as a regulated investment company, including distributing substantially all of its taxable income and realized gains under Subchapter M of the Internal Revenue Code and filing its U.S. federal tax return. As a result, no provision for income taxes is required. As of October 31, 2011, the Fund did not have any unrecognized tax benefits in the financial statements. A fund's federal tax return is subject to examination by the Internal Revenue Service (IRS) for a period of three years. Foreign taxes are provided for based on the Fund's understanding of the tax rules and rates that exist in the foreign markets in which it invests.
Distributions are declared and recorded on the ex-dividend date. Income dividends and capital gain distributions are declared separately for each class. Income and capital gain distributions are determined in accordance with income tax regulations, which may differ from GAAP.
Capital accounts within the financial statements are adjusted for permanent book-tax differences. These adjustments have no impact on net assets or the results of operations. Temporary book-tax differences will reverse in a subsequent period.
Book-tax differences are primarily due to foreign currency transactions, passive foreign investment companies (PFIC), partnerships, capital loss carryforwards and losses deferred due to wash sales.
The federal tax cost of investment securities and unrealized appreciation (depreciation) as of period end were as follows:
Gross unrealized appreciation | $ 7,855,689 |
Gross unrealized depreciation | (14,110,478) |
Net unrealized appreciation (depreciation) on securities and other investments | $ (6,254,789) |
| |
Tax Cost | $ 145,212,557 |
Annual Report
3. Significant Accounting Policies - continued
Income Tax Information and Distributions to Shareholders - continued
The tax-based components of distributable earnings as of period end were as follows:
Undistributed ordinary income | $ 1,552,850 |
Capital loss carryforward | $ (33,183,732) |
Net unrealized appreciation (depreciation) | $ (6,246,842) |
Under the recently enacted Regulated Investment Company Modernization Act of 2010 (the Act), the Fund will be permitted to carry forward capital losses incurred in taxable years beginning after December 22, 2010 for an unlimited period. However, any losses incurred during those future taxable years will be required to be utilized prior to any losses incurred in pre-enactment taxable years, which generally expire after eight years from when they are incurred. Additionally, post-enactment capital losses that are carried forward will retain their character as either short-term or long-term capital losses rather than being considered all short-term as under previous law. The Fund's first fiscal year end subject to the Act will be October 31, 2012.
The tax character of distributions paid was as follows:
| October 31, 2011 | October 31, 2010 |
Ordinary Income | $ 1,173,335 | $ 581,158 |
Short-Term Trading (Redemption) Fees. Shares held by investors in the Fund less than 30 days are subject to a redemption fee equal to 1.00% of the net asset value of shares redeemed. All redemption fees, which reduce the proceeds of the shareholder redemption, are retained by the Fund and accounted for as an addition to paid in capital.
New Accounting Pronouncement. In May 2011, the Financial Accounting Standards Board issued Accounting Standard Update No. 2011-04, Fair Value Measurement (Topic 820) - Amendments to Achieve Common Fair Value Measurement and Disclosure Requirements in U.S. GAAP and IFRSs. The update changes the wording used to describe the requirements in GAAP for measuring fair value and for disclosing information about fair value measurements. The update is effective during interim and annual periods beginning after December 15, 2011. Management is currently evaluating the impact of the update's adoption on the Fund's financial statement disclosures.
4. Operating Policies.
Delayed Delivery Transactions and When-Issued Securities. During the period, the Fund transacted in securities on a delayed delivery or when-issued basis. Payment and delivery may take place after the customary settlement period for that security. The
Annual Report
Notes to Financial Statements - continued
4. Operating Policies - continued
Delayed Delivery Transactions and When-Issued Securities - continued
price of the underlying securities and the date when the securities will be delivered and paid for are fixed at the time the transaction is negotiated. During the time a delayed delivery sell is outstanding, the contract is marked-to-market daily and equivalent deliverable securities are held for the transaction. The securities purchased on a delayed delivery or when-issued basis are identified as such in the Fund's Schedule of Investments. The Fund may receive compensation for interest forgone in the purchase of a delayed delivery or when-issued security. With respect to purchase commitments, the Fund identifies securities as segregated in its records with a value at least equal to the amount of the commitment. Losses may arise due to changes in the value of the underlying securities or if the counterparty does not perform under the contract's terms, or if the issuer does not issue the securities due to political, economic, or other factors.
Restricted Securities. The Fund may invest in securities that are subject to legal or contractual restrictions on resale. These securities generally may be resold in transactions exempt from registration or to the public if the securities are registered. Disposal of these securities may involve time-consuming negotiations and expense, and prompt sale at an acceptable price may be difficult. Information regarding restricted securities is included at the end of the Fund's Schedule of Investments.
5. Purchases and Sales of Investments.
Purchases and sales of securities, other than short-term securities, aggregated $169,182,591 and $84,756,770, respectively.
6. Fees and Other Transactions with Affiliates.
Management Fee. FMR and its affiliates provide the Fund with investment management related services for which the Fund pays a monthly management fee. The management fee is the sum of an individual fund fee rate that is based on an annual rate of .45% of the Fund's average net assets and a group fee rate that averaged .26% during the period. The group fee rate is based upon the average net assets of all the mutual funds advised by FMR. The group fee rate decreases as assets under management increase and increases as assets under management decrease. In addition, the management fee is subject to a performance adjustment (up to a maximum of ± .20% of the Fund's average net assets over a 36 month performance period). The upward or downward adjustment to the management fee is based on the relative investment performance of Total International Equity as compared to an appropriate benchmark index. For the period, the total annual management fee rate, including the performance adjustment, was .69% of the Fund's average net assets.
Annual Report
6. Fees and Other Transactions with Affiliates - continued
Distribution and Service Plan Fees. In accordance with Rule 12b-1 of the 1940 Act, the Fund has adopted separate Distribution and Service Plans for each class of shares. Certain classes pay Fidelity Distributors Corporation (FDC), an affiliate of FMR, separate Distribution and Service Fees, each of which is based on an annual percentage of each class' average net assets. In addition, FDC may pay financial intermediaries for selling shares of the Fund and providing shareholder support services. For the period, the Distribution and Service Fee rates, total fees and amounts retained by FDC were as follows:
| Distribution
Fee | Service
Fee | Total Fees | Retained
by FDC |
Class A | -% | .25% | $ 12,983 | $ 1,616 |
Class T | .25% | .25% | 5,374 | 38 |
Class B | .75% | .25% | 3,026 | 2,283 |
Class C | .75% | .25% | 15,058 | 2,823 |
| | | $ 36,441 | $ 6,760 |
Sales Load. FDC may receive a front-end sales charge of up to 5.75% for selling Class A shares, and 3.50% for selling Class T shares, some of which is paid to financial intermediaries for selling shares of the Fund. Depending on the holding period, FDC may receive contingent deferred sales charges levied on Class A, Class T, Class B, and Class C redemptions. The deferred sales charges range from 5% to 1% for Class B, 1% for Class C, 1.00% for certain purchases of Class A shares and .25% for certain purchases of Class T shares.
For the period, sales charge amounts retained by FDC were as follows:
| Retained
by FDC |
Class A | $ 2,591 |
Class T | 454 |
Class B* | 305 |
Class C* | 219 |
| $ 3,569 |
* When Class B and Class C shares are initially sold, FDC pays commissions from its own resources to financial intermediaries through which the sales are made.
Transfer Agent Fees. Fidelity Investments Institutional Operations Company, Inc. (FIIOC), an affiliate of FMR, is the transfer, dividend disbursing and shareholder servicing agent for each class of the Fund. FIIOC receives account fees and asset-based fees that vary according to the account size and type of account of the shareholders of the respective classes of the Fund. FIIOC pays for typesetting, printing and mailing of
Annual Report
Notes to Financial Statements - continued
6. Fees and Other Transactions with Affiliates - continued
Transfer Agent Fees - continued
shareholder reports, except proxy statements. For the period, transfer agent fees for each class were as follows:
| Amount | % of
Average
Net Assets |
Class A | $ 14,366 | .28 |
Class T | 3,388 | .32 |
Class B | 928 | .31 |
Class C | 4,603 | .31 |
Total International Equity | 250,636 | .24 |
Institutional Class | 464 | .30 |
| $ 274,385 | |
Accounting and Security Lending Fees. Fidelity Service Company, Inc. (FSC), an affiliate of FMR, maintains the Fund's accounting records. The accounting fee is based on the level of average net assets for the month. Under a separate contract, FSC administers the security lending program. The security lending fee is based on the number and duration of lending transactions.
Brokerage Commissions. The Fund placed a portion of its portfolio transactions with brokerage firms which are affiliates of the investment adviser. The commissions paid to these affiliated firms were $901 for the period.
7. Committed Line of Credit.
The Fund participates with other funds managed by FMR or an affiliate in a $4.0 billion credit facility (the "line of credit") to be utilized for temporary or emergency purposes to fund shareholder redemptions or for other short-term liquidity purposes. The Fund has agreed to pay commitment fees on its pro-rata portion of the line of credit, which amounted to $320 and is reflected in Miscellaneous expenses on the Statement of Operations. During the period, there were no borrowings on this line of credit.
8. Security Lending.
The Fund lends portfolio securities through a lending agent from time to time in order to earn additional income. For equity securities, a lending agent is used and may loan securities to certain qualified borrowers, including Fidelity Capital Markets (FCM), a broker-dealer affiliated with the Fund. On the settlement date of the loan, the Fund receives collateral (in the form of U.S. Treasury obligations, letters of credit and/or cash) against the loaned securities and maintains collateral in an amount not less than 100% of
Annual Report
8. Security Lending - continued
the market value of the loaned securities during the period of the loan. The market value of the loaned securities is determined at the close of business of the Fund and any additional required collateral is delivered to the Fund on the next business day. If the borrower defaults on its obligation to return the securities loaned because of insolvency or other reasons, a fund could experience delays and costs in recovering the securities loaned or in gaining access to the collateral. Any cash collateral received is invested in the Fidelity Securities Lending Cash Central Fund. The value of loaned securities and cash collateral at period end are disclosed on the Fund's Statement of Assets and Liabilities. Security lending income represents the income earned on investing cash collateral, less rebates paid to borrowers and any lending agent fees associated with the loan, plus any premium payments received for lending certain types of securities. Security lending income is presented in the Statement of Operations as a component of income from Fidelity Central Funds. Total security lending income during the period amounted to $31,105. During the period, there were no securities loaned to FCM.
9. Expense Reductions.
FMR contractually agreed to reimburse each class to the extent annual operating expenses exceeded certain levels of average net assets as noted in the table below. This reimbursement will remain in place through December 31, 2012. Some expenses, for example interest expense, including commitment fees, are excluded from this reimbursement.
The following classes were in reimbursement during the period:
| Expense
Limitations | Reimbursement
from adviser |
Class A | 1.45% | $ 14,721 |
Class T | 1.70% | 3,433 |
Class B | 2.20% | 954 |
Class C | 2.20% | 4,689 |
Total International Equity | 1.20% | 229,885 |
Institutional Class | 1.20% | 437 |
| | $ 254,119 |
In addition, FMR voluntarily agreed to reimburse a portion of its management fee. For the period, the amount of this reimbursement was $1,529.
Many of the brokers with whom FMR places trades on behalf of the Fund provided services to the Fund in addition to trade execution. These services included payments of certain expenses on behalf of the Fund totaling $31,513 for the period.
Annual Report
Notes to Financial Statements - continued
10. Distributions to Shareholders.
Distributions to shareholders of each class were as follows:
Years ended October 31, | 2011 | 2010 |
From net investment income | | |
Class A | $ 61,018 | $ 26,391 |
Class T | 9,414 | - |
Class B | 1,488 | - |
Class C | 6,263 | - |
Total International Equity | 873,280 | 382,451 |
Institutional Class | 1,578 | 2,381 |
Total | $ 953,041 | $ 411,223 |
From net realized gain | | |
Class A | $ 16,196 | $ 14,995 |
Class T | 3,213 | - |
Class B | 1,016 | - |
Class C | 4,485 | - |
Total International Equity | 195,026 | 154,214 |
Institutional Class | 358 | 726 |
Total | $ 220,294 | $ 169,935 |
11. Share Transactions.
Transactions for each class of shares were as follows:
| Shares | Dollars |
Years ended October 31, | 2011 | 2010 | 2011 | 2010 |
Class A | | | | |
Shares sold | 231,083 | 443,125 | $ 1,708,687 | $ 2,924,922 |
Reinvestment of distributions | 10,039 | 5,568 | 74,076 | 37,804 |
Shares redeemed | (279,366) | (347,260) | (2,035,449) | (2,296,503) |
Net increase (decrease) | (38,244) | 101,433 | $ (252,686) | $ 666,223 |
Class T | | | | |
Shares sold | 37,121 | 121,719 | $ 276,509 | $ 807,663 |
Reinvestment of distributions | 1,678 | - | 12,524 | - |
Shares redeemed | (25,970) | (224,749) | (191,826) | (1,531,457) |
Net increase (decrease) | 12,829 | (103,030) | $ 97,207 | $ (723,794) |
Class B | | | | |
Shares sold | 3,282 | 30,066 | $ 24,631 | $ 198,826 |
Reinvestment of distributions | 331 | - | 2,469 | - |
Shares redeemed | (9,973) | (194,792) | (73,676) | (1,332,260) |
Net increase (decrease) | (6,360) | (164,726) | $ (46,576) | $ (1,133,434) |
Annual Report
11. Share Transactions - continued
| Shares | Dollars |
Years ended October 31, | 2011 | 2010 | 2011 | 2010 |
Class C | | | | |
Shares sold | 66,879 | 86,496 | $ 498,161 | $ 580,588 |
Reinvestment of distributions | 1,425 | - | 10,610 | - |
Shares redeemed | (52,554) | (161,545) | (388,669) | (1,102,805) |
Net increase (decrease) | 15,750 | (75,049) | $ 120,102 | $ (522,217) |
Total International Equity | | | | |
Shares sold | 16,784,298 | 6,833,012 | $ 125,543,898 | $ 45,955,028 |
Reinvestment of distributions | 135,624 | 74,043 | 1,000,533 | 502,009 |
Shares redeemed | (5,532,363) | (3,806,841) | (39,913,646) | (24,965,317) |
Net increase (decrease) | 11,387,559 | 3,100,214 | $ 86,630,785 | $ 21,491,720 |
Institutional Class | | | | |
Shares sold | 26,909 | 377 | $ 202,383 | $ 2,481 |
Reinvestment of distributions | 263 | 460 | 1,936 | 3,106 |
Shares redeemed | (1,422) | (201,123) | (10,588) | (1,373,455) |
Net increase (decrease) | 25,750 | (200,286) | $ 193,731 | $ (1,367,868) |
12. Other.
The Fund's organizational documents provide former and current trustees and officers with a limited indemnification against liabilities arising in connection with the performance of their duties to the Fund. In the normal course of business, the Fund may also enter into contracts that provide general indemnifications. The Fund's maximum exposure under these arrangements is unknown as this would be dependent on future claims that may be made against the Fund. The risk of material loss from such claims is considered remote.
Annual Report
To the Trustees of Fidelity Investment Trust and Shareholders of Fidelity Total International Equity Fund:
We have audited the accompanying statement of assets and liabilities of Fidelity Total International Equity Fund (the Fund), a fund of Fidelity Investment Trust, including the schedule of investments, as of October 31, 2011, and the related statement of operations for the year then ended, the statement of changes in net assets for each of the two years in the period then ended, and the financial highlights for each of the four years in the period then ended. These financial statements and financial highlights are the responsibility of the Fund's management. Our responsibility is to express an opinion on these financial statements and financial highlights based on our audits.
We conducted our audits in accordance with the standards of the Public Company Accounting Oversight Board (United States). Those standards require that we plan and perform the audit to obtain reasonable assurance about whether the financial statements and financial highlights are free of material misstatement. The Fund is not required to have, nor were we engaged to perform, an audit of its internal control over financial reporting. Our audits included consideration of internal control over financial reporting as a basis for designing audit procedures that are appropriate in the circumstances, but not for the purpose of expressing an opinion on the effectiveness of the Fund's internal control over financial reporting. Accordingly, we express no such opinion. An audit also includes examining, on a test basis, evidence supporting the amounts and disclosures in the financial statements, assessing the accounting principles used and significant estimates made by management, as well as evaluating the overall financial statement presentation. Our procedures included confirmation of securities owned as of October 31, 2011, by correspondence with the custodians and brokers; where replies were not received from brokers, we performed other auditing procedures. We believe that our audits provide a reasonable basis for our opinion.
In our opinion, the financial statements and financial highlights referred to above present fairly, in all material respects, the financial position of Fidelity Total International Equity Fund as of October 31, 2011, the results of its operations for the year then ended, the changes in its net assets for each of the two years in the period then ended, and the financial highlights for each of the four years in the period then ended, in conformity with accounting principles generally accepted in the United States of America.
DELOITTE & TOUCHE LLP
Boston, Massachusetts
December 13, 2011
Annual Report
The Trustees, Members of the Advisory Board, and executive officers of the trust and fund, as applicable, are listed below. The Board of Trustees governs the fund and is responsible for protecting the interests of shareholders. The Trustees are experienced executives who meet periodically throughout the year to oversee the fund's activities, review contractual arrangements with companies that provide services to the fund, oversee management of the risks associated with such activities and contractual arrangements, and review the fund's performance. Except for James C. Curvey, each of the Trustees oversees 226 funds advised by FMR or an affiliate. Mr. Curvey oversees 429 funds advised by FMR or an affiliate.
The Trustees hold office without limit in time except that (a) any Trustee may resign; (b) any Trustee may be removed by written instrument, signed by at least two-thirds of the number of Trustees prior to such removal; (c) any Trustee who requests to be retired or who has become incapacitated by illness or injury may be retired by written instrument signed by a majority of the other Trustees; and (d) any Trustee may be removed at any special meeting of shareholders by a two-thirds vote of the outstanding voting securities of the trust. Each Trustee who is not an interested person (as defined in the 1940 Act) (Independent Trustee), shall retire not later than the last day of the calendar year in which his or her 75th birthday occurs. The Independent Trustees may waive this mandatory retirement age policy with respect to individual Trustees. The executive officers and Advisory Board Members hold office without limit in time, except that any officer and Advisory Board Member may resign or may be removed by a vote of a majority of the Trustees at any regular meeting or any special meeting of the Trustees. Except as indicated, each individual has held the office shown or other offices in the same company for the past five years.
Experience, Skills, Attributes, and Qualifications of the Fund's Trustees. The Governance and Nominating Committee has adopted a statement of policy that describes the experience, qualifications, attributes, and skills that are necessary and desirable for potential Independent Trustee candidates (Statement of Policy). The Board believes that each Trustee satisfied at the time he or she was initially elected or appointed a Trustee, and continues to satisfy, the standards contemplated by the Statement of Policy. The Governance and Nominating Committee also engages professional search firms to help identify potential Independent Trustee candidates who have the experience, qualifications, attributes, and skills consistent with the Statement of Policy. From time to time, additional criteria based on the composition and skills of the current Independent Trustees, as well as experience or skills that may be appropriate in light of future changes to board composition, business conditions, and regulatory or other developments, have also been considered by the professional search firms and the Governance and Nominating Committee. In addition, the Board takes into account the Trustees' commitment and participation in Board and committee meetings, as well as their leadership of standing and ad hoc committees throughout their tenure.
In determining that a particular Trustee was and continues to be qualified to serve as a Trustee, the Board has considered a variety of criteria, none of which, in isolation, was controlling. The Board believes that, collectively, the Trustees have balanced and diverse experience, qualifications, attributes, and skills, which allow the Board to operate effectively in governing the fund and protecting the interests of shareholders. Information about the specific experience, skills, attributes, and qualifications of each Trustee, which in each case led to the Board's conclusion that the Trustee should serve (or continue to serve) as a trustee of the fund, is provided below.
Annual Report
Board Structure and Oversight Function. James C. Curvey is an interested person (as defined in the 1940 Act) and currently serves as Acting Chairman. The Trustees have determined that an interested Chairman is appropriate and benefits shareholders because an interested Chairman has a personal and professional stake in the quality and continuity of services provided to the fund. Independent Trustees exercise their informed business judgment to appoint an individual of their choosing to serve as Chairman, regardless of whether the Trustee happens to be independent or a member of management. The Independent Trustees have determined that they can act independently and effectively without having an Independent Trustee serve as Chairman and that a key structural component for assuring that they are in a position to do so is for the Independent Trustees to constitute a substantial majority for the Board. The Independent Trustees also regularly meet in executive session. Ned C. Lautenbach serves as Chairman of the Independent Trustees and as such (i) acts as a liaison between the Independent Trustees and management with respect to matters important to the Independent Trustees and (ii) with management prepares agendas for Board meetings.
Fidelity funds are overseen by different Boards of Trustees. The fund's Board oversees Fidelity's equity and high income funds and another Board oversees Fidelity's investment-grade bond, money market, and asset allocation funds. The asset allocation funds may invest in Fidelity funds overseen by the fund's Board. The use of separate Boards, each with its own committee structure, allows the Trustees of each group of Fidelity funds to focus on the unique issues of the funds they oversee, including common research, investment, and operational issues. On occasion, the separate Boards establish joint committees to address issues of overlapping consequences for the Fidelity funds overseen by each Board.
The Trustees operate using a system of committees to facilitate the timely and efficient consideration of all matters of importance to the Trustees, the fund, and fund shareholders and to facilitate compliance with legal and regulatory requirements and oversight of the fund's activities and associated risks. The Board, acting through its committees, has charged FMR and its affiliates with (i) identifying events or circumstances the occurrence of which could have demonstrably adverse effects on the fund's business and/or reputation; (ii) implementing processes and controls to lessen the possibility that such events or circumstances occur or to mitigate the effects of such events or circumstances if they do occur; and (iii) creating and maintaining a system designed to evaluate continuously business and market conditions in order to facilitate the identification and implementation processes described in (i) and (ii) above. Because the day-to-day operations and activities of the fund are carried out by or through FMR, its affiliates and other service providers, the fund's exposure to risks is mitigated but not eliminated by the processes overseen by the Trustees. While each of the Board's committees has responsibility for overseeing different aspects of the fund's activities, oversight is exercised primarily through the Operations, Audit, and Compliance Committees. In addition, the Independent Trustees have worked with FMR to enhance the Board's oversight of investment and financial risks, legal and regulatory risks, technology risks, and operational risks, including the development of additional risk reporting to the Board. For example, a working group comprised of Independent Trustees and FMR has worked and continues to work to review the Fidelity funds' valuation-related activities, reporting and risk management. Appropriate personnel, including but not limited to the fund's Chief Compliance Officer (CCO), FMR's internal auditor, the independent accountants, the fund's Treasurer and portfolio management personnel, make periodic reports to the Board's committees, as appropriate, including an annual review of FMR's risk management program for the Fidelity funds. The responsibilities of each standing committee, including their oversight responsibilities, are described further under "Standing Committees of the Fund's Trustees."
Annual Report
Trustees and Officers - continued
The fund's Statement of Additional Information (SAI) includes more information about the Trustees. To request a free copy, call Fidelity at 1-877-208-0098.
Interested Trustees*:
Correspondence intended for each Trustee who is an interested person may be sent to Fidelity Investments, 82 Devonshire Street, Boston, Massachusetts 02109.
Name, Age; Principal Occupations and Other Relevant Experience+ |
James C. Curvey (76) |
| Year of Election or Appointment: 2007 Mr. Curvey is Trustee and Acting Chairman of the Board of Trustees of certain Trusts. Mr. Curvey also serves as Trustee (2007-present) of other investment companies advised by FMR. Mr. Curvey is a Director of Fidelity Investments Money Management, Inc. (2009-present), Director of Fidelity Research & Analysis Co. (2009-present) and Director of FMR and FMR Co., Inc. (2007-present). Mr. Curvey is also Vice Chairman (2007-present) and Director of FMR LLC. In addition, Mr. Curvey serves as an Overseer for the Boston Symphony Orchestra and a member of the Trustees of Villanova University. Previously, Mr. Curvey was the Vice Chairman (2006-2007) and Director (2000-2007) of FMR Corp. |
Ronald P. O'Hanley (54) |
| Year of Election or Appointment: 2011 Mr. O'Hanley is Director of FMR Co., Inc. (2010-present), Director of Fidelity Investments Money Management, Inc. (2010-present), Director of Fidelity Research & Analysis Company (2010-present), President of Fidelity Asset Management and Corporate Services and a member of Fidelity's Executive Committee (2010-present). Previously, Mr. O'Hanley served as President and Chief Executive Officer of BNY Mellon Asset Management (2007-2010). Mr. O'Hanley also served as Vice Chairman of Bank New York Mellon Corp. and a member of that firm's Executive Committee. Prior to the 2007 merger of The Bank of New York and Mellon Financial Corporation, he was Vice Chairman of Mellon Financial Corporation and President and Chief Executive Officer of Mellon Asset Management. He joined Mellon in February 1997. Mr. O'Hanley currently serves as Chairman of the Boston Public Library Foundation Board of Directors and sits on the Board of Directors of Beth Israel Deaconess Medical Center, the Board of Trustees of the Marine Biological Laboratory and the Advisory Board of the Maxwell School of Citizenship and Public Administration at Syracuse University. Mr. O'Hanley also chairs the Council on Asset Management for the Financial Services Roundtable and is a member of the Board of Directors of Institutional Investor's U.S. Institute. |
* Trustees have been determined to be "Interested Trustees" by virtue of, among other things, their affiliation with the trust or various entities under common control with FMR.
+ The information above includes each Trustee's principal occupation during the last five years and other information relating to the experience, attributes, and skills relevant to each Trustee's qualifications to serve as a Trustee, which led to the conclusion that each Trustee should serve as a Trustee for the fund.
Annual Report
Trustees and Officers - continued
Independent Trustees:
Correspondence intended for each Independent Trustee (that is, the Trustees other than the Interested Trustees) may be sent to Fidelity Investments, P.O. Box 55235, Boston, Massachusetts 02205-5235.
Name, Age; Principal Occupations and Other Relevant Experience+ |
Dennis J. Dirks (63) |
| Year of Election or Appointment: 2005 Prior to his retirement in May 2003, Mr. Dirks was Chief Operating Officer and a member of the Board of The Depository Trust & Clearing Corporation (DTCC). He also served as President, Chief Operating Officer, and Board member of The Depository Trust Company (DTC) and President and Board member of the National Securities Clearing Corporation (NSCC). In addition, Mr. Dirks served as Chief Executive Officer and Board member of the Government Securities Clearing Corporation, Chief Executive Officer and Board member of the Mortgage-Backed Securities Clearing Corporation, as a Trustee and a member of the Finance Committee of Manhattan College (2005-2008), and as a Trustee and a member of the Finance Committee of AHRC of Nassau County (2006-2008). Mr. Dirks is a member of the Independent Directors Council (IDC) Governing Council (2010-Present) and Board of Directors for The Brookville Center for Children's Services, Inc. (2009-present). |
Alan J. Lacy (58) |
| Year of Election or Appointment: 2008 Mr. Lacy serves as Senior Adviser (2007-present) of Oak Hill Capital Partners, L.P. (private equity). Mr. Lacy also served as Chief Executive Officer (2000-2005) and Vice Chairman (2005-2006) of Sears Holdings Corporation and Sears, Roebuck and Co. (retail). In addition, Mr. Lacy serves as a member of the Board of Directors of Dave & Buster's, Inc. (restaurant and entertainment complexes, 2010-present), The Hillman Companies, Inc. (hardware wholesalers, 2010-present), and Bristol-Myers Squibb Company (global pharmaceuticals, 2007-present). Mr. Lacy is a member of the Board of Trustees of The National Parks Conservation Association (2006-Present). Previously, Mr. Lacy served as Chairman of the Board of Trustees of the National Parks Conservation Association (2008-2011) and as a member of the Board of Directors for the Western Union Company (global money transfer, 2006-2011). |
Ned C. Lautenbach (67) |
| Year of Election or Appointment: 2000 Mr. Lautenbach is Chairman of the Independent Trustees of the Equity and High Income Funds (2006-present). Mr. Lautenbach currently serves as the Lead Director of the Eaton Corporation Board of Directors (diversified industrial, 1997-present). Mr. Lautenbach is also a member of the Board of Directors of the Philharmonic Center for the Arts in Naples, Florida (1999-present); a member of the Board of Trustees of Fairfield University (2005-present); and a member of the Council on Foreign Relations (1994-present). Previously, Mr. Lautenbach was a Partner/Advisory Partner at Clayton, Dubilier & Rice, LLC (private equity investment, 1998-2010), as well as a Director of Sony Corporation (2006-2007). |
Joseph Mauriello (67) |
| Year of Election or Appointment: 2008 Prior to his retirement in January 2006, Mr. Mauriello served in numerous senior management positions including Deputy Chairman and Chief Operating Officer (2004-2005), and Vice Chairman of Financial Services (2002-2004) of KPMG LLP US (professional services, 1965-2005). Mr. Mauriello currently serves as a member of the Board of Directors of XL Group plc. (global insurance and re-insurance, 2006-present) and of Arcadia Resources Inc. (health care services and products, 2007-present). Previously, Mr. Mauriello served as a Director of the Hamilton Funds of the Bank of New York (2006-2007). |
Robert W. Selander (61) |
| Year of Election or Appointment: 2011 Previously, Mr. Selander served as a Member of the Advisory Board of Fidelity's Equity and High Income Funds (2011), Executive Vice Chairman (2010), Chief Executive Officer (2009-2010), and President and Chief Executive Officer (1997-2009) of Mastercard, Inc. |
Cornelia M. Small (67) |
| Year of Election or Appointment: 2005 Ms. Small is a member of the Board of Directors of the Teagle Foundation (2009-present). Ms. Small is also a member of the Investment Committee, and Chair (2008-present) and a member of the Board of Trustees of Smith College. In addition, Ms. Small serves on the Investment Committee of the Berkshire Taconic Community Foundation (2008-present). Previously, Ms. Small served as Chairperson of the Investment Committee (2002-2008) of Smith College. In addition, Ms. Small served as Chief Investment Officer, Director of Global Equity Investments, and a member of the Board of Directors of Scudder, Stevens & Clark and Scudder Kemper Investments. |
William S. Stavropoulos (72) |
| Year of Election or Appointment: 2001 Mr. Stavropoulos is Vice Chairman of the Independent Trustees of the Equity and High Income Funds (2006-present). Mr. Stavropoulos serves as President and Founder of the Michigan Baseball Foundation, the Great Lakes Loons (2007-present). Mr. Stavropoulos is Chairman Emeritus of the Board of Directors of The Dow Chemical Company, where he previously served in numerous senior management positions, including President, CEO (1995-2000; 2002-2004), Chairman of the Executive Committee (2000-2006), and as a member of the Board of Directors (1990-2006). Currently, Mr. Stavropoulos is Chairman of Univar (global distributor of commodity and specialty chemicals, 2010-present), a Director of Teradata Corporation (data warehousing and technology solutions, 2008-present), Chemical Financial Corporation, Maersk Inc. (industrial conglomerate), Tyco International, Inc. (multinational manufacturing and services, 2007-present), and a member of the Advisory Board for Metalmark Capital (private equity investment, 2005-present). Mr. Stavropoulos is a special advisor to Clayton, Dubilier & Rice, LLC (private equity investment). In addition, Mr. Stavropoulos is a member of the University of Notre Dame Advisory Council for the College of Science. |
David M. Thomas (62) |
| Year of Election or Appointment: 2008 Previously, Mr. Thomas served as Executive Chairman (2005-2006) and Chairman and Chief Executive Officer (2000-2005) of IMS Health, Inc. (pharmaceutical and healthcare information solutions). In addition, Mr. Thomas serves as a member of the Board of Directors of Fortune Brands, Inc. (consumer products), and Interpublic Group of Companies, Inc. (marketing communication, 2004-present). |
Michael E. Wiley (61) |
| Year of Election or Appointment: 2008 Mr. Wiley also serves as a Director of Asia Pacific Exploration Consolidated (international oil and gas exploration and production, 2008-present). Mr. Wiley serves as a Director of Tesoro Corporation (independent oil refiner and marketer, 2005-present), and a Director of Bill Barrett Corporation (exploration and production, 2005-present). In addition, Mr. Wiley also serves as a Director of Post Oak Bank (privately-held bank, 2004-present). Previously, Mr. Wiley served as a member of the Board of Trustees of the University of Tulsa (2000-2006; 2007-2010), as a Senior Energy Advisor of Katzenbach Partners, LLC (consulting, 2006-2007), as an Advisory Director of Riverstone Holdings (private investment), Chairman, President, and CEO of Baker Hughes, Inc. (oilfield services, 2000-2004), and as Director of Spinnaker Exploration Company (exploration and production, 2001-2005). |
Annual Report
+ The information above includes each Trustee's principal occupation during the last five years and other information relating to the experience, attributes, and skills relevant to each Trustee's qualifications to serve as a Trustee, which led to the conclusion that each Trustee should serve as a Trustee for the fund.
Advisory Board Members and Executive Officers:
Correspondence intended for each executive officer, Edward C. Johnson 3d, and Peter S. Lynch may be sent to Fidelity Investments, 82 Devonshire Street, Boston, Massachusetts 02109.
Name, Age; Principal Occupation |
Edward C. Johnson 3d (81) |
| Year of Election or Appointment: 2011 Member of the Advisory Board of Fidelity's Equity and High Income Funds. Mr. Johnson serves as Chief Executive Officer, Chairman, and a Director of FMR LLC, and also serves as Chairman and Director of FIL Limited. Previously, Mr. Johnson served as a Trustee and Chairman of the Board of certain Fidelity Trusts, Chairman and a Director of FMR, Chairman and a Director of FMR Co., Inc., and President of FMR LLC (2006-2007). |
Peter S. Lynch (67) |
| Year of Election or Appointment: 2003 Member of the Advisory Board of Fidelity's Equity and High Income Funds. Mr. Lynch is Vice Chairman and a Director of FMR and FMR Co., Inc. In addition, Mr. Lynch serves as a Trustee of Boston College and as the Chairman of the Inner-City Scholarship Fund. Previously, Mr. Lynch served on the Special Olympics International Board of Directors (1997-2006). |
Kenneth B. Robins (42) |
| Year of Election or Appointment: 2008 President and Treasurer of Fidelity's Equity and High Income Funds. Mr. Robins also serves as President and Treasurer (2010-present) and Assistant Treasurer (2009-present) of other Fidelity funds and is an employee of Fidelity Investments (2004-present). Previously, Mr. Robins served as Deputy Treasurer of the Fidelity funds (2005-2008) and Treasurer and Chief Financial Officer of The North Carolina Capital Management Trust: Cash and Term Portfolios (2006-2008). |
Bruce T. Herring (46) |
| Year of Election or Appointment: 2006 Vice President of certain Equity Funds. Mr. Herring also serves as Chief Investment Officer and Director of Fidelity Management & Research (U.K.) Inc. (2010-present) and Group Chief Investments Officer of FMR. Previously, Mr. Herring served as Vice President (2005-2006) and Senior Vice President (2006-2007) of Fidelity Management & Research Company, Vice President of FMR Co., Inc. (2001-2007) and as a portfolio manager for Fidelity U.S. Equity Funds. |
Brian B. Hogan (47) |
| Year of Election or Appointment: 2009 Vice President of Equity and High Income Funds. Mr. Hogan also serves as President of FMR's Equity Division (2009-present). Previously, Mr. Hogan served as Senior Vice President, Equity Research of FMR (2006-2009) and as a portfolio manager. |
Scott C. Goebel (43) |
| Year of Election or Appointment: 2008 Secretary and Chief Legal Officer (CLO) of the Fidelity funds. Mr. Goebel also serves as Secretary of Fidelity Investments Money Management, Inc. (FIMM) (2010-present) and Fidelity Research and Analysis Company (FRAC) (2010-present); Secretary and CLO of The North Carolina Capital Management Trust: Cash and Term Portfolios (2008-present); General Counsel, Secretary, and Senior Vice President of FMR (2008-present) and FMR Co., Inc. (2008-present); employed by FMR LLC or an affiliate (2001-present); Chief Legal Officer of Fidelity Management & Research (Hong Kong) Limited (2008-present) and Assistant Secretary of Fidelity Management & Research (Japan) Inc. (2008-present), and Fidelity Management & Research (U.K.) Inc. (2008-present). Previously, Mr. Goebel served as Assistant Secretary of FIMM (2008-2010), FRAC (2008-2010), and the Funds (2007-2008) and as Vice President and Secretary of Fidelity Distributors Corporation (FDC) (2005-2007). |
William C. Coffey (42) |
| Year of Election or Appointment: 2009 Assistant Secretary of Fidelity's Equity and High Income Funds. Mr. Coffey also serves as Senior Vice President and Deputy General Counsel of FMR LLC (2010-present), and is an employee of Fidelity Investments. Previously, Mr. Coffey served as Vice President and Associate General Counsel of FMR LLC (2005-2009). |
Holly C. Laurent (57) |
| Year of Election or Appointment: 2008 Anti-Money Laundering (AML) Officer of the Fidelity funds. Ms. Laurent also serves as AML Officer of The North Carolina Capital Management Trust: Cash and Term Portfolios (2008-present) and is an employee of Fidelity Investments. Previously, Ms. Laurent was Senior Vice President and Head of Legal for Fidelity Business Services India Pvt. Ltd. (2006-2008), and Senior Vice President, Deputy General Counsel and Group Head for FMR LLC (2005-2006). |
Christine Reynolds (53) |
| Year of Election or Appointment: 2008 Chief Financial Officer of the Fidelity funds. Ms. Reynolds became President of Fidelity Pricing and Cash Management Services (FPCMS) in August 2008. Ms. Reynolds served as Chief Operating Officer of FPCMS (2007-2008). Previously, Ms. Reynolds served as President, Treasurer, and Anti-Money Laundering officer of the Fidelity funds (2004-2007). |
Kenneth A. Rathgeber (64) |
| Year of Election or Appointment: 2004 Chief Compliance Officer of Fidelity's Equity and High Income Funds. Mr. Rathgeber is Chief Compliance Officer of Fidelity Management & Research (Hong Kong) Limited (2008-present), Fidelity Management & Research (Japan) Inc. (2008-present), FMR (2005-present), FMR Co., Inc. (2005-present), Fidelity Management & Research (U.K.) Inc. (2005-present), Fidelity Research & Analysis Company (2005-present), Fidelity Investments Money Management, Inc. (2005-present), Pyramis Global Advisors, LLC (2005-present), and Strategic Advisers, Inc. (2005-present). |
Jeffrey S. Christian (50) |
| Year of Election or Appointment: 2009 Deputy Treasurer of the Fidelity funds. Mr. Christian is an employee of Fidelity Investments. Previously, Mr. Christian served as Chief Financial Officer (2008-2009) of certain Fidelity funds and Senior Vice President of Fidelity Pricing and Cash Management Services (FPCMS) (2004-2009). |
Joseph F. Zambello (54) |
| Year of Election or Appointment: 2011 Deputy Treasurer of the Fidelity funds. Mr. Zambello is an employee of Fidelity Investments. Previously, Mr. Zambello served as Vice President of FMR's Program Management Group (2009-2011) and Vice President of the Transfer Agent Oversight Group (2005-2009). |
Adrien E. Deberghes (44) |
| Year of Election or Appointment: 2008 Deputy Treasurer of Fidelity's Equity and High Income Funds. Mr. Deberghes also serves as Vice President and Assistant Treasurer of Fidelity Rutland Square Trust II and Fidelity Commonwealth Trust II (2011-present), Assistant Treasurer of other Fidelity funds (2010-present), and is an employee of Fidelity Investments (2008-present). Previously, Mr. Deberghes served as Senior Vice President of Mutual Fund Administration at State Street Corporation (2007-2008), Senior Director of Mutual Fund Administration at Investors Bank & Trust (2005-2007), and Director of Finance for Dunkin' Brands (2000-2005). |
Stephanie J. Dorsey (42) |
| Year of Election or Appointment: 2010 Assistant Treasurer of Fidelity's Equity and High Income Funds. Ms. Dorsey also serves as Deputy Treasurer of other Fidelity funds (2008-present) and is an employee of Fidelity Investments (2008-present). Previously, Ms. Dorsey served as Treasurer (2004-2008) of the JPMorgan Mutual Funds and Vice President (2004-2008) of JPMorgan Chase Bank. |
John R. Hebble (53) |
| Year of Election or Appointment: 2009 Assistant Treasurer of Fidelity's Equity and High Income Funds. Mr. Hebble also serves as President (2011-present), Treasurer, and Chief Financial Officer of The North Carolina Capital Management Trust: Cash and Term Portfolios (2008-present), President and Treasurer of other Fidelity funds (2008-present) and is an employee of Fidelity Investments. |
Gary W. Ryan (53) |
| Year of Election or Appointment: 2005 Assistant Treasurer of the Fidelity funds. Mr. Ryan is an employee of Fidelity Investments. Previously, Mr. Ryan served as Vice President of Fund Reporting in Fidelity Pricing and Cash Management Services (FPCMS) (1999-2005). |
Jonathan Davis (43) |
| Year of Election or Appointment: 2010 Assistant Treasurer of the Fidelity funds. Mr. Davis is also Assistant Treasurer of Fidelity Rutland Square Trust II and Fidelity Commonwealth Trust II. Mr. Davis is an employee of Fidelity Investments. Previously, Mr. Davis served as Vice President and Associate General Counsel of FMR LLC (2003-2010). |
Annual Report
Institutional Class designates 100% of the dividends distributed in December 2010 during the fiscal year as amounts which may be taken into account as a dividend for purposes of the maximum rate under section 1(h)(11) of the Internal Revenue Code.
The amounts per share which represent income derived from sources within, and taxes paid to, foreign countries or possessions of the United States are as follows:
| Pay Date | Income | Taxes |
Institutional Class | 12/06/10
12/31/10 | $0.085
0.015 | $0.0112
0.0000 |
The fund will notify shareholders in January 2012 of amounts for use in preparing 2011 income tax returns.
Annual Report
Board Approval of Investment Advisory Contracts and Management Fees
Fidelity Total International Equity Fund
Each year, the Board of Trustees, including the Independent Trustees (together, the Board), votes on the renewal of the management contract and sub-advisory agreements (together, the Advisory Contracts) for the fund. The Board, assisted by the advice of fund counsel and Independent Trustees' counsel, requests and considers a broad range of information relevant to the renewal of the Advisory Contracts throughout the year.
The Board meets regularly and considers at each of its meetings factors that are relevant to its annual consideration of the renewal of the fund's Advisory Contracts, including the services and support provided to the fund and its shareholders. The Board has established various standing committees, each composed of Independent Trustees with varying backgrounds, to which the Board has assigned specific subject matter responsibilities in order to enhance effective decision-making by the Board. The Board, acting directly and through its Committees, requests and receives information concerning the annual consideration of the renewal of the fund's Advisory Contracts. The Board also meets as needed to consider matters specifically related to the Board's annual consideration of the renewal of Advisory Contracts. Members of the Board may also meet with trustees of other Fidelity funds through ad hoc joint committees to discuss certain matters relevant to the Fidelity funds.
At its July 2011 meeting, the Board of Trustees, including the Independent Trustees, unanimously determined to renew the fund's Advisory Contracts. In reaching its determination, the Board considered all factors it believed relevant, including (i) the nature, extent, and quality of the services to be provided to the fund and its shareholders (including the investment performance of the fund); (ii) the competitiveness of the fund's management fee and total expense ratio; (iii) the total costs of the services to be provided by and the profits to be realized by Fidelity from its relationship with the fund; (iv) the extent to which economies of scale would be realized as the fund grows; and (v) whether fee levels reflect these economies of scale, if any, for the benefit of fund shareholders.
In considering whether to renew the Advisory Contracts for the fund, the Board reached a determination, with the assistance of fund counsel and Independent Trustees' counsel and through the exercise of its business judgment, that the renewal of the Advisory Contracts is in the best interests of the fund and its shareholders and that the compensation payable under the Advisory Contracts is fair and reasonable. The Board's decision to renew the Advisory Contracts was not based on any single factor, but rather was based on a comprehensive consideration of all the information provided to the Board at its meetings throughout the year. The Board, in reaching its determination to renew the Advisory Contracts, is aware that shareholders in the fund have a broad range of investment choices available to them, including a wide choice among mutual funds offered by Fidelity's competitors, and that the fund's shareholders, who have the opportunity to review and weigh the disclosure provided by the fund in its prospectus and other public disclosures, have chosen to invest in this fund, managed by Fidelity.
Annual Report
Nature, Extent, and Quality of Services Provided. The Board considered the staffing within the investment adviser, FMR, and the sub-advisers (together, the Investment Advisers), including the backgrounds of the fund's investment personnel and the fund's investment objective and discipline. The Independent Trustees also had discussions with senior management of Fidelity's investment operations and investment groups. The Board considered the structure of the portfolio manager compensation program and whether this structure provides appropriate incentives to act in the best interests of the fund.
Resources Dedicated to Investment Management and Support Services. The Board and the Fund Oversight and Research Committees reviewed the general qualifications and capabilities of the Investment Advisers' investment staff, including its size, education, experience, and resources, as well as the Investment Advisers' approach to recruiting, training, managing, and compensating investment personnel. The Board also noted that FMR has devoted increased resources to non-U.S. offices. The Board noted that Fidelity's analysts have extensive resources, tools and capabilities which allow them to conduct sophisticated quantitative and fundamental analysis, as well as credit analysis of issuers, counterparties and enhancers. The Board also believes that Fidelity's investment professionals have sufficient access to global information and data so as to provide competitive investment results over time, and that those professionals also have access to sophisticated tools which permit them to assess portfolio construction and risk and performance attribution characteristics continuously, as well as to transmit new information and research conclusions rapidly around the world. Additionally, in their deliberations, the Board considered the Investment Advisers' trading capabilities and resources which are an integral part of the investment management process.
Shareholder and Administrative Services. The Board considered (i) the nature, extent, quality, and cost of advisory, administrative, and shareholder services performed by the Investment Advisers and their affiliates under the Advisory Contracts and under separate agreements covering transfer agency, pricing and bookkeeping, and securities lending services for the fund; (ii) the nature and extent of the investment adviser's supervision of third party service providers, principally custodians and subcustodians; and (iii) the resources devoted to, and the record of compliance with, the fund's compliance policies and procedures. The Board also reviewed the allocation of fund brokerage, including allocations to brokers affiliated with the Investment Advisers, the use of brokerage commissions to pay fund expenses, and the use of "soft" commission dollars to pay for research services.
The Board noted that the growth of fund assets over time across the complex allows Fidelity to reinvest in the development of services designed to enhance the value or convenience of the Fidelity funds as investment vehicles. These services include 24-hour access to account information and market information through telephone representatives and over the Internet, investor education materials and asset allocation tools, and the expanded availability of Fidelity Investor Centers, with 35 new branches opening since 2010.
Annual Report
Board Approval of Investment Advisory Contracts and
Management Fees - continued
Investment in a Large Fund Family. The Board considered the benefits to shareholders of investing in a Fidelity fund, including the benefits of investing in a fund that is part of a large family of funds offering a variety of investment disciplines and providing a large variety of mutual fund investor services. The Board noted that Fidelity had taken, or had made recommendations that resulted in the Fidelity funds taking, a number of actions over the previous year that benefited particular funds, including (i) continuing to dedicate additional resources to investment research and support of the senior management team that oversees asset management; (ii) rationalizing product lines through the mergers of six funds into other funds; (iii) continuing to migrate the Freedom Funds to dedicated lower cost underlying funds; (iv) obtaining shareholder approval to broaden the investment strategies for Fidelity Consumer Finance Portfolio, Fidelity Emerging Asia Fund, and Fidelity Environment and Alternative Energy Portfolio; (v) contractually agreeing to reduce the management fees and impose other expense limitations on Spartan 500 Index Fund and U.S. Bond Index Fund in connection with launching new institutional classes of these funds; (vi) changing the name, primary and supplemental benchmarks, and investment policies of Fidelity Global Strategies Fund to support the fund's flexible investment mandate and global orientation; and (vii) reducing the transfer agency account fee rates on certain accounts.
Investment Performance. The Board considered whether the fund has operated in accordance with its investment objective, as well as its record of compliance with its investment restrictions. It also reviewed the fund's absolute investment performance for each class, as well as the fund's relative investment performance for each class measured over multiple periods against (i) a broad-based securities market index, and (ii) a peer group of mutual funds deemed appropriate by Fidelity and reviewed by the Board. Because the fund had been in existence less than five calendar years, the following charts considered by the Board show, over the one- and three-year periods ended December 31, 2010, the cumulative total returns of Institutional Class (Class I) and Class C of the fund, the cumulative total returns of a broad-based securities market index ("benchmark"), and a range of cumulative total returns of a peer group of mutual funds identified by Morningstar, Inc. as having an investment style similar to that of the fund based on underlying portfolio holdings. The returns of Institutional Class (Class I) and Class C show the performance of the highest and lowest performing classes, respectively (based on three-year performance). The box within each chart shows the 25th percentile return (bottom of box) and the 75th percentile return (top of box) of the peer group. Returns shown above the box are in the first quartile and returns shown below the box are in the fourth quartile. The percentage beaten numbers noted below each chart correspond to the percentile box and represent the percentage of funds in the peer group whose performance was equal to or lower than that of the class indicated.
Annual Report
Fidelity Total International Equity Fund
The Board reviewed the fund's relative investment performance against its peer group and noted that the performance of Institutional Class (Class I) of the fund was in the second quartile for all the periods shown. The Board also noted that the investment performance of Institutional Class (Class I) of the fund compared favorably to its benchmark for the one-year period, although the fund's three-year cumulative total return was lower than its benchmark. The Board considered that the variations in performance among the fund's classes reflect the variations in class expenses, which result in lower performance for higher expense classes. The Board also reviewed the fund's performance since inception as well as performance in the current year.
The Board also considered that the fund's management fee is subject to upward or downward adjustment depending upon whether, and to what extent, the fund's investment performance for the performance period exceeds, or is exceeded by, the record (over the same period) of a Board-approved performance adjustment index. The Board noted that the performance adjustment provides FMR with a strong economic incentive to seek to achieve superior performance for the fund's shareholders and helps to more closely align the interests of FMR and the fund's shareholders.
Based on its review, the Board concluded that the nature, extent, and quality of services provided to the fund under the Advisory Contracts should benefit the fund's shareholders.
Annual Report
Board Approval of Investment Advisory Contracts and
Management Fees - continued
Competitiveness of Management Fee and Total Expense Ratio. The Board considered the fund's management fee and total expense ratio compared to "mapped groups" of competitive funds and classes. Fidelity creates "mapped groups" by combining similar Lipper investment objective categories that have comparable management fee characteristics. Combining Lipper investment objective categories aids the Board's management fee and total expense ratio comparisons by broadening the competitive group used for comparison and by reducing the number of universes to which various Fidelity funds are compared.
Management Fee. The Board considered two proprietary management fee comparisons for the 12-month (or shorter) periods shown in the chart below. The group of Lipper funds used by the Board for management fee comparisons is referred to below as the "Total Mapped Group." The Total Mapped Group comparison focuses on a fund's standing relative to the total universe of comparable funds available to investors in terms of gross management fees before expense reimbursements or caps, and without giving effect to the fund's performance adjustment. "TMG %" represents the percentage of funds in the Total Mapped Group that had management fees that were lower than the fund's. For example, a TMG % of 16% means that 84% of the funds in the Total Mapped Group had higher management fees than the fund. The "Asset-Size Peer Group" (ASPG) comparison focuses on a fund's standing relative to non-Fidelity funds similar in size to the fund within the Total Mapped Group. The ASPG represents at least 15% of the funds in the Total Mapped Group with comparable asset size and management fee characteristics, subject to a minimum of 50 funds (or all funds in the Total Mapped Group if fewer than 50). Additional information, such as the ASPG quartile in which the fund's management fee ranked and the impact of the fund's performance adjustment, is also included in the chart and considered by the Board.
Annual Report
Fidelity Total International Equity Fund
The Board noted that the fund's management fee ranked below the median of its Total Mapped Group and below the median of its ASPG for 2010. The Board also noted the effect of the fund's negative performance adjustment on the fund's management fee ranking. The Board noted that the performance adjustment for each year represents calculations for performance periods that differ from the periods shown in the performance charts above.
Based on its review, the Board concluded that the fund's management fee is fair and reasonable in light of the services that the fund receives and the other factors considered.
Total Expense Ratio. In its review of each class's total expense ratio, the Board considered the fund's management fee as well as other fund or class expenses, as applicable, such as transfer agent fees, pricing and bookkeeping fees, fund-paid 12b-1 fees, and custodial, legal, and audit fees. The Board also noted the effects of any waivers and reimbursements on fees and expenses, as well as the impact of the fund's performance adjustment. As part of its review, the Board also considered the current and historical total expense ratios of each class of the fund compared to competitive fund median expenses. Each class of the fund is compared to those funds and classes in the Total Mapped Group (used by the Board for management fee comparisons) that have a similar sales load structure.
The Board noted that the total expense ratio of each of Class A, Class B, and the retail class ranked below its competitive median for 2010, the total expense ratio of Class C ranked equal to its competitive median for 2010, and the total expense ratio of each of Class T and Institutional Class ranked above its competitive median for 2010. The Board considered that various factors, including 12b-1 fees, positive or negative performance adjustments, and relatively higher other expenses in the case of small fund size, can affect total expense ratios. The Board noted that the total expense ratio of Class T was above the competitive median primarily because of higher 12b-1 fees on Class T. Class T has a higher 12b-1 fee, but a lower front-end sales charge, than traditionally priced front-end sales charge classes. The Board noted that the fund offers multiple classes, each of which has a different sales load and 12b-1 fee structure, and that the multiple structures are intended to offer a range of pricing options for the intermediary market. The Board also noted that the total expense ratios of the classes vary primarily by the level of their 12b-1 fees, although differences in transfer agent fees may also cause expenses to vary from class to class.
Annual Report
Board Approval of Investment Advisory Contracts and
Management Fees - continued
Fees Charged to Other Fidelity Clients. The Board also considered Fidelity fee structures and other information with respect to clients of FMR and its affiliates, such as other mutual funds advised or subadvised by FMR or its affiliates, pension plan clients, and other institutional clients. In March 2010, the Board created an ad hoc joint committee with the board of other Fidelity funds (the Committee) to review and compare Fidelity's institutional investment advisory business with its business of providing services to the Fidelity funds, including the differences in services provided, fees charged, and costs incurred, as well as competition in their respective marketplaces.
Based on its review of total expense ratios and fees charged to other Fidelity clients, the Board concluded that the total expense ratio of each class of the fund was reasonable, although in some cases above the median of the universe presented for comparison, in light of the services that the fund and its shareholders receive and the other factors considered, including the findings of the Committee.
Costs of the Services and Profitability. The Board considered the revenues earned and the expenses incurred by Fidelity in conducting the business of developing, marketing, distributing, managing, administering and servicing the fund and its shareholders. The Board also considered the level of Fidelity's profits in respect of all the Fidelity funds.
On an annual basis, FMR presents to the Board Fidelity's profitability for the fund. Fidelity calculates the profitability for each fund, as well as aggregate profitability for groups of Fidelity funds and all Fidelity funds, using a series of detailed revenue and cost allocation methodologies which originate with the books and records of Fidelity on which Fidelity's audited financial statements are based. The Audit Committee of the Board reviews any significant changes from the prior year's methodologies.
PricewaterhouseCoopers LLP (PwC), independent registered public accounting firm and auditor to Fidelity and certain Fidelity funds, has been engaged annually by the Board as part of the Board's assessment of Fidelity's profitability analysis. PwC's engagement includes the review and assessment of Fidelity's methodologies used in determining the revenues and expenses attributable to Fidelity's mutual fund business, and completion of agreed-upon procedures surrounding the mathematical accuracy of fund profitability and its conformity to allocation methodologies. After considering PwC's reports issued under the engagement and information provided by Fidelity, the Board concluded that while other allocation methods may also be reasonable, Fidelity's profitability methodologies are reasonable in all material respects.
Annual Report
The Board also reviewed Fidelity's non-fund businesses and fall-out benefits related to the mutual fund business as well as cases where Fidelity's affiliates may benefit from or be related to the fund's business.
The Board considered the costs of the services provided by and the profits realized by Fidelity in connection with the operation of the fund and was satisfied that the profitability was not excessive in the circumstances.
Economies of Scale. The Board considered whether there have been economies of scale in respect of the management of the Fidelity funds, whether the Fidelity funds (including the fund) have appropriately benefited from any such economies of scale, and whether there is potential for realization of any further economies of scale. The Board considered the extent to which the fund will benefit from economies of scale through increased services to the fund, through waivers or reimbursements, or through fee or expense reductions. The Board also noted that in 2009, it and the board of other Fidelity funds created an ad hoc committee (the Economies of Scale Committee) to analyze whether FMR attains economies of scale in respect of the management and servicing of the Fidelity funds, whether the Fidelity funds have appropriately benefited from such economies of scale, and whether there is potential for realization of any further economies of scale.
The Board recognized that the fund's management contract incorporates a "group fee" structure, which provides for lower group fee rates as total fund assets under FMR's management increase, and for higher group fee rates as total fund assets under FMR's management decrease. FMR calculates the group fee rates based on a tiered asset "breakpoint" schedule that varies based on asset class. The Board considered that the group fee is designed to deliver the benefits of economies of scale to fund shareholders when total Fidelity fund assets increase, even if assets of any particular fund are unchanged or have declined, because some portion of Fidelity's costs are attributable to services provided to all Fidelity funds, and all funds benefit if those costs can be allocated among more assets. The Board concluded that, given the group fee structure, fund shareholders will benefit from lower management fees as assets under FMR's management increase at the fund complex level, regardless of whether Fidelity achieves any such economies of scale.
Annual Report
Board Approval of Investment Advisory Contracts and
Management Fees - continued
The Board concluded, taking into account the analysis of the Economies of Scale Committee, that any potential economies of scale are being appropriately shared between fund shareholders and Fidelity.
Additional Information Requested by the Board. In order to develop fully the factual basis for consideration of the Fidelity funds' Advisory Contracts, the Board requested and received additional information on certain topics, including (i) fund performance trends, actions to be taken by FMR to improve certain funds' overall performance, and Fidelity's long-term strategies for certain funds; (ii) portfolio manager changes that have occurred during the past year and length of portfolio manager tenure for different categories of funds over time; (iii) Fidelity's compensation structure for portfolio managers and other key personnel and strategies for attracting and retaining non-investment personnel; (iv) the amount of the investment that each portfolio manager has made in the Fidelity fund(s) that he or she manages; (v) historical trends in Fidelity's realization of fall-out benefits; (vi) Fidelity's group fee structures and the rationale for the individual fee rates of certain funds; (vii) fund profitability methodology and the impact of certain factors on fund profitability results; (viii) trends regarding industry use of performance fee structures and Fidelity's compliance practices with respect to performance adjustment calculations; (ix) the fee structures in place for certain other Fidelity clients; and (x) explanations regarding the relative total expense ratios of certain funds and classes, total expense competitive trends, and actions that might be taken by FMR to reduce total expense ratios for certain funds and classes.
Based on its evaluation of all of the conclusions noted above, and after considering all factors it believed relevant, the Board ultimately concluded that the advisory fee structures are fair and reasonable, and that the fund's Advisory Contracts should be renewed.
Annual Report
Investment Adviser
Fidelity Management & Research Company
Boston, MA
Investment Sub-Advisers
FMR Co., Inc.
Fidelity Management & Research
(U.K.) Inc.
FIL Investment Advisors
FIL Investments (Japan) Limited
FIL Investment Advisors
(U.K.) Limited
Fidelity Management & Research
(Hong Kong) Limited
Fidelity Management & Research
(Japan) Inc.
General Distributor
Fidelity Distributors Corporation
Boston, MA
Transfer and Service Agents
Fidelity Investments Institutional Operations Company, Inc.
Boston, MA
Fidelity Service Company, Inc.
Boston, MA
Custodian
State Street Bank & Trust Company
Quincy, MA
ATIEI-UANN-1211
1.853356.103
(Fidelity Logo)
Fidelity Advisor®
Worldwide Fund
Class A, Class T, Class B, and Class C
Annual Report
October 31, 2011
(Fidelity Cover Art)
(Fidelity Cover Art)
Class A, Class T, Class B, and Class C are
classes of Fidelity® Worldwide Fund
Contents
Chairman's Message | (Click Here) | The Chairman's message to shareholders. |
Performance | (Click Here) | How the fund has done over time. |
Management's Discussion of Fund Performance | (Click Here) | The Portfolio Managers' review of fundperformance and strategy. |
Shareholder Expense Example | (Click Here) | An example of shareholder expenses. |
Investment Changes | (Click Here) | A summary of major shifts in the fund's investments over the past six months. |
Investments | (Click Here) | A complete list of the fund's investments with their market values. |
Financial Statements | (Click Here) | Statements of assets and liabilities, operations, and changes in net assets, as well as financial highlights. |
Notes | (Click Here) | Notes to the financial statements. |
Report of Independent Registered Public Accounting Firm | (Click Here) | |
Trustees and Officers | (Click Here) | |
Distributions | (Click Here) | |
Board Approval of Investment Advisory Contracts and Management Fees | (Click Here) | |
To view a fund's proxy voting guidelines and proxy voting record for the 12-month period ended June 30, visit http://www.fidelity.com/proxyvotingresults or visit the Securities and Exchange Commission's (SEC) web site at http://www.sec.gov. You may also call 1-877-208-0098 to request a free copy of the proxy voting guidelines.
Standard & Poor's, S&P and S&P 500 are registered service marks of The McGraw-Hill Companies, Inc. and have been licensed for use by Fidelity Distributors Corporation.
Other third party marks appearing herein are the property of their respective owners.
All other marks appearing herein are registered or unregistered trademarks or service marks of FMR LLC or an affiliated company.
This report and the financial statements contained herein are submitted for the general information of the shareholders of the fund. This report is not authorized for distribution to prospective investors in the fund unless preceded or accompanied by an effective prospectus.
A fund files its complete schedule of portfolio holdings with the SEC for the first and third quarters of each fiscal year on Form N-Q. Forms N-Q are available on the SEC's web site at http://www.sec.gov. A fund's Forms N-Q may be reviewed and copied at the SEC's Public Reference Room in Washington, DC. Information regarding the operation of the SEC's Public Reference Room may be obtained by calling 1-800-SEC-0330. For a complete list of a fund's portfolio holdings, view the most recent holdings listing, semiannual report, or annual report on Fidelity's web site at http://www.fidelity.com, http://www.advisor.fidelity.com, or http://www.401k.com, as applicable.
NOT FDIC INSURED • MAY LOSE VALUE • NO BANK GUARANTEE
Neither the fund nor Fidelity Distributors Corporation is a bank.
Annual Report
(Acting Chairman's Photograph)
Dear Shareholder:
Global equity markets began the fourth quarter on a strong note, sharply reversing course in October amid strong corporate earnings, better-than-expected economic news and the promise of a resolution to the sovereign debt crisis in Europe. The mini rally followed a third quarter marked by a significant downturn in July and August, which heightened investor anxiety and set off a wave of volatility that hampered most major asset classes through the end of September. Financial markets are difficult to predict, of course, but you can help put the odds in your favor by following these time-tested investment principles.
One of the basic tenets is to invest according to your time horizon. For long-term investors, riding out the markets' inevitable ups and downs has proven much more effective than making decisions based on short-term developments. If your goal is approaching, you can also benefit from patience and restraint, rather than attempting to time the market. No matter your time horizon, missing only a few of the markets' best days can significantly diminish returns. Patience also affords the benefits of compounding - earning interest on additional income or reinvested dividends and capital gains. While staying the course doesn't eliminate risk, it can considerably lessen the negative impact of short-term downturns.
Asset allocation is another principle to manage risk. As you spread your portfolio among the asset classes, be sure to consider your time horizon, risk tolerance and investment objectives. Younger investors may be better served by emphasizing equities, which historically have been the best-performing asset class over time. Investors who are nearing a specific goal, such as retirement or sending a child to college, may choose to favor bonds and other investments that have tended to be more stable. Studies indicate that asset allocation is the single most important determinant of a portfolio's long-term success. After deciding on a suitable allocation strategy, make sure your portfolio is adequately diversified, with exposure to stocks of small-, mid- and large-cap companies in a range of sectors, for example. And today, more than ever, geographic diversification should be taken into account.
Lastly, investing a certain amount of money on a regular basis - a principle known as dollar-cost averaging - can help lower the average cost of your purchases, while also giving you the discipline to avoid selling weak performers just prior to an upswing, or chasing a hot performer just before a correction.
We invite you to learn more by visiting us on the Internet, dropping by one of our Investor Centers or calling us by phone. It is our privilege to provide the resources you need to choose investments that are right for you.
Sincerely,
(Acting Chairman's Signature)
James C. Curvey
Acting Chairman
Annual Report
Performance: The Bottom Line
Average annual total return reflects the change in the value of an investment, assuming reinvestment of the class' distributions from dividend income and capital gains (the profits earned upon the sale of securities that have grown in value, if any) and assuming a constant rate of performance each year. The $10,000 table and the fund's returns do not reflect the deduction of taxes that a shareholder would pay on fund distributions or the redemption of fund shares. During periods of reimbursement by Fidelity, a fund's total return will be greater than it would be had the reimbursement not occurred. How a fund did yesterday is no guarantee of how it will do tomorrow.
Average Annual Total Returns
Periods ended October 31, 2011 | Past 1
year | Past 5
years | Past 10 years |
Class A (incl. 5.75% sales charge) A | -2.98% | 0.26% | 5.81% |
Class T (incl. 3.50% sales charge) B | -0.98% | 0.59% | 5.98% |
Class B (incl. contingent deferred sales charge) C | -2.81% | 0.74% | 6.23% |
Class C (incl. contingent deferred sales charge) D | 1.19% | 1.06% | 6.23% |
A Class A shares bear a 0.25% 12b-1 fee. The initial offering of Class A took place on February 19, 2009. Returns prior to February 19, 2009 are those of Fidelity® Worldwide Fund, the original class of the fund, which does not bear a 12b-1 fee. Had Class A shares' 12b-1 fee been reflected, returns prior to February 19, 2009 would have been lower.
B Class T shares bear a 0.50% 12b-1 fee. The initial offering of Class T took place on February 19, 2009. Returns prior to February 19, 2009 are those of Fidelity Worldwide Fund, the original class of the fund, which does not bear a 12b-1 fee. Had Class T shares' 12b-1 fee been reflected, returns prior to February 19, 2009 would have been lower.
C Class B shares bear a 1.00% 12b-1 fee. The initial offering of Class B took place on February 19, 2009. Returns prior to February 19, 2009 are those of Fidelity Worldwide Fund, the original class of the fund, which does not bear a 12b-1 fee. Had Class B shares' 12b-1 fee been reflected, returns prior to February 19, 2009 would have been lower. Class B shares' contingent deferred sales charges included in the past one year, past five years, and past ten years total return figures are 5%, 2%, and 0%, respectively.
D Class C shares bear a 1.00% 12b-1 fee. The initial offering of Class C took place on February 19, 2009. Returns prior to February 19, 2009 are those of Fidelity Worldwide Fund, the original class of the fund, which does not bear a 12b-1 fee. Had Class C shares' 12b-1 fee been reflected, returns prior to February 19, 2009 would have been lower. Class C shares' contingent deferred sales charges included in the past one year, past five years, and past ten years total return figures are 1%, 0%, and 0%, respectively.
$10,000 Over 10 Years
Let's say hypothetically that $10,000 was invested in Fidelity Advisor® Worldwide Fund - Class A, on October 31, 2001, and the current 5.75% sales charge was paid. The chart shows how the value of your investment would have changed, and also shows how the MSCI® World Index performed over the same period. The initial offering of Class A took place on February 19, 2009. See above for additional information regarding the performance of Class A.
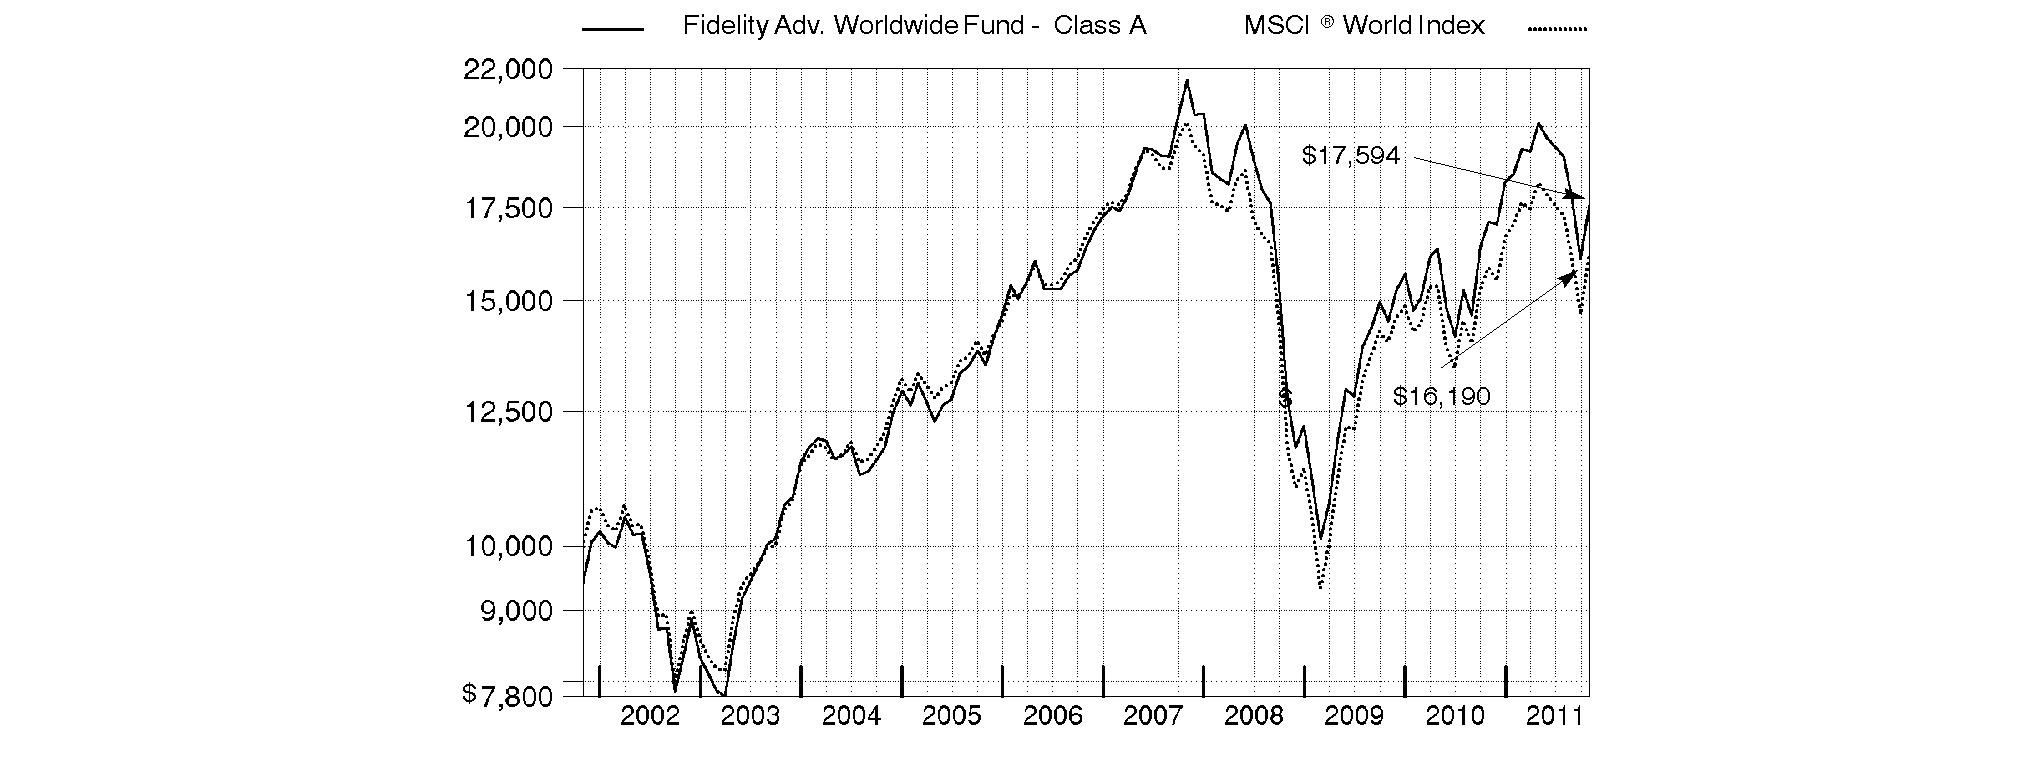
Annual Report
Market Recap: Global equities were rocked by a number of headline events during the year ending October 31, 2011. Stocks posted a solid advance for the first half of the period, despite concern about sovereign debt in Europe, a devastating earthquake/tsunami in Japan, and political upheaval in the Middle East and North Africa. Sentiment turned decidedly negative in the second half, however, as fresh worries about Europe, inflation in China, gridlock over raising the debt ceiling in the U.S. - along with Standard & Poor's downgrade of the nation's long-term sovereign credit rating - and a dimmed outlook for global growth caused markets to suffer declines that intensified in August and September. October brought with it yet another dramatic swing, as better-than-expected U.S. economic data and prospects for a resolution to the European debt debacle prompted buyers to storm back onto the scene in search of bargains. Those gains - along with favorable currency fluctuations overall - helped lift the MSCI® ACWI® (All Country World Index) Index 0.75% for the year. Within the index, Europe and emerging markets declined the most, with many countries in these areas sustaining steep losses. By contrast, the U.S. (+8%), which dominates the index, delivered a positive result, as did Australia (+4%) and Switzerland (+3%). Japan showed resilience in the wake of its natural disasters, falling only 2%.
Comments from William Kennedy, Lead Portfolio Manager of Fidelity Advisor® Worldwide Fund and manager of its non-U.S. equity subportfolio, and Co-Portfolio Manager Stephen DuFour, who manages the fund's U.S. equity subportfolio: For the 12 months ending October 31, 2011, the fund's Class A, Class T, Class B and Class C shares returned 2.94%, 2.61%, 2.19% and 2.19%, respectively (excluding sales charges), compared to 2.12% for the MSCI® World Index. Stock selection aided relative results, particularly in the U.S., but also in Japan and Canada. Standouts included Green Mountain Coffee Roasters, maker of the Keurig® coffee system, whose stock rallied during our ownership, following the launch of a new machine and new brands. Shares of beauty products company Estee Lauder benefited from growing overseas demand, product introductions and improved operations. Card processor MasterCard saw a sizable share price gain, fueled by strong volume growth as more payments worldwide were made with plastic. Conversely, security selection and currency exposure in emerging markets detracted, as did positioning in Europe and Asia Pacific ex Japan. The fund's small cash position also hurt. Individual disappointments included France-based network equipment company Alcatel-Lucent, whose stock declined when the company failed to execute on its turnaround plan. Untimely ownership of commercial roofing supplier Carlisle Companies detracted, as did our lack of exposure to tech giant and index component International Business Machines, which rallied nicely. Some of the stocks mentioned were not in the index, and some were not in the portfolio at period end.
The views expressed above reflect those of the portfolio manager(s) only through the end of the period as stated on the cover of this report and do not necessarily represent the views of Fidelity or any other person in the Fidelity organization. Any such views are subject to change at any time based upon market or other conditions and Fidelity disclaims any responsibility to update such views. These views may not be relied on as investment advice and, because investment decisions for a Fidelity fund are based on numerous factors, may not be relied on as an indication of trading intent on behalf of any Fidelity fund.
Annual Report
Fidelity Worldwide Fund
As a shareholder of the Fund, you incur two types of costs: (1) transaction costs, including sales charges (loads) on purchase payments or redemption proceeds, redemption fees, and (2) ongoing costs, including management fees, distribution and/or service (12b-1) fees and other Fund expenses. This Example is intended to help you understand your ongoing costs (in dollars) of investing in the Fund and to compare these costs with the ongoing costs of investing in other mutual funds.
The Example is based on an investment of $1,000 invested at the beginning of the period and held for the entire period (May 1, 2011 to October 31, 2011).
Actual Expenses
The first line of the accompanying table for each class of the Fund provides information about actual account values and actual expenses. You may use the information in this line, together with the amount you invested, to estimate the expenses that you paid over the period. Simply divide your account value by $1,000.00 (for example, an $8,600 account value divided by $1,000.00 = 8.6), then multiply the result by the number in the first line for a class of the Fund under the heading entitled "Expenses Paid During Period" to estimate the expenses you paid on your account during this period. A small balance maintenance fee of $12.00 that is charged once a year may apply for certain accounts with a value of less than $2,000. This fee is not included in the table below. If it was, the estimate of expenses you paid during the period would be higher, and your ending account value lower, by this amount. In addition, the Fund, as a shareholder in the underlying Fidelity Central Funds, will indirectly bear its pro-rata share of the fees and expenses incurred by the underlying Fidelity Central Funds. These fees and expenses are not included in the Fund's annualized expense ratio used to calculate the expense estimate in the table below.
Hypothetical Example for Comparison Purposes
The second line of the accompanying table for each class of the Fund provides information about hypothetical account values and hypothetical expenses based on a Class' actual expense ratio and an assumed rate of return of 5% per year before expenses, which is not the Class' actual return. The hypothetical account values and expenses may not be used to estimate the actual ending account balance or expenses you paid for the period. You may use this information to compare the ongoing costs of investing in the Fund and other funds. To do so, compare this 5% hypothetical example with the 5% hypothetical examples that appear in the shareholder reports of the other funds. A small balance maintenance fee of $12.00 that is charged once a year may apply for certain accounts with a value of less than $2,000. This fee is not included in the table below. If it was, the estimate of expenses you paid during the period would be higher, and your ending account value lower, by this amount. In addition, the Fund, as a shareholder in the underlying Fidelity Central Funds, will indirectly bear its pro-rata share of the fees and expenses incurred by the underlying Fidelity Central Funds. These fees and expenses are not included in the Fund's annualized expense ratio used to calculate the expense estimate in the table below.
Please note that the expenses shown in the table are meant to highlight your ongoing costs only and do not reflect any transaction costs. Therefore, the second line of the table is useful in comparing ongoing costs only, and will not help you determine the relative total costs of owning different funds. In addition, if these transactional costs were included, your costs would have been higher.
| Annualized
Expense Ratio | Beginning
Account Value
May 1, 2011 | Ending
Account Value
October 31, 2011 | Expenses Paid
During Period*
May 1, 2011
to October 31, 2011 |
Class A | 1.39% | | | |
Actual | | $ 1,000.00 | $ 874.80 | $ 6.57 |
HypotheticalA | | $ 1,000.00 | $ 1,018.20 | $ 7.07 |
Class T | 1.69% | | | |
Actual | | $ 1,000.00 | $ 873.20 | $ 7.98 |
HypotheticalA | | $ 1,000.00 | $ 1,016.69 | $ 8.59 |
Class B | 2.12% | | | |
Actual | | $ 1,000.00 | $ 871.50 | $ 10.00 |
HypotheticalA | | $ 1,000.00 | $ 1,014.52 | $ 10.76 |
Class C | 2.14% | | | |
Actual | | $ 1,000.00 | $ 871.70 | $ 10.10 |
HypotheticalA | | $ 1,000.00 | $ 1,014.42 | $ 10.87 |
Worldwide | 1.05% | | | |
Actual | | $ 1,000.00 | $ 876.50 | $ 4.97 |
HypotheticalA | | $ 1,000.00 | $ 1,019.91 | $ 5.35 |
Institutional Class | 1.11% | | | |
Actual | | $ 1,000.00 | $ 876.20 | $ 5.25 |
HypotheticalA | | $ 1,000.00 | $ 1,019.61 | $ 5.65 |
A 5% return per year before expenses
* Expenses are equal to each Class' annualized expense ratio, multiplied by the average account value over the period, multiplied by 184/365 (to reflect the one-half year period).
Annual Report
Fidelity Worldwide Fund
Investment Changes (Unaudited)
Geographic Diversification (% of fund's net assets) |
As of October 31, 2011 |
| United States of America | 52.8% | |
| United Kingdom | 9.8% | |
| Japan | 7.0% | |
| France | 4.3% | |
| Switzerland | 3.2% | |
| Germany | 2.7% | |
| Canada | 2.1% | |
| Netherlands | 1.6% | |
| Australia | 1.5% | |
| Other | 15.0% | |

Percentages are adjusted for the effect of futures contracts, if applicable. |
As of April 30, 2011 |
| United States of America | 48.4% | |
| United Kingdom | 9.9% | |
| Japan | 7.4% | |
| France | 5.9% | |
| Germany | 4.1% | |
| Canada | 3.2% | |
| Switzerland | 2.4% | |
| Netherlands | 2.1% | |
| Australia | 1.9% | |
| Other | 14.7% | |

Percentages are adjusted for the effect of futures contracts, if applicable. |
Asset Allocation |
| % of fund's
net assets | % of fund's net assets
6 months ago |
Stocks | 96.6 | 94.8 |
Bonds | 0.0 | 0.1 |
Short-Term Investments and Net Other Assets | 3.4 | 5.1 |
Top Ten Stocks as of October 31, 2011 |
| % of fund's
net assets | % of fund's net assets
6 months ago |
Intuit, Inc. (United States of America, Software) | 2.7 | 1.1 |
Citigroup, Inc. (United States of America, Diversified Financial Services) | 2.6 | 0.0 |
Edwards Lifesciences Corp. (United States of America, Health Care Equipment & Supplies) | 2.2 | 1.1 |
Exxon Mobil Corp. (United States of America, Oil, Gas & Consumable Fuels) | 2.1 | 1.8 |
MasterCard, Inc. Class A (United States of America, IT Services) | 2.1 | 0.5 |
Prologis, Inc. (United States of America, Real Estate Investment Trusts) | 1.8 | 0.0 |
Union Pacific Corp. (United States of America, Road & Rail) | 1.8 | 0.0 |
Apple, Inc. (United States of America, Computers & Peripherals) | 1.8 | 1.3 |
Perrigo Co. (United States of America, Pharmaceuticals) | 1.6 | 1.2 |
British American Tobacco PLC | 1.6 | 0.3 |
| 20.3 | |
Market Sectors as of October 31, 2011 |
| % of fund's
net assets | % of fund's net assets
6 months ago |
Financials | 18.2 | 14.2 |
Consumer Discretionary | 14.7 | 14.7 |
Information Technology | 14.3 | 15.6 |
Energy | 11.4 | 12.6 |
Health Care | 10.7 | 12.1 |
Consumer Staples | 9.4 | 7.2 |
Industrials | 9.2 | 9.5 |
Materials | 4.3 | 5.0 |
Telecommunication Services | 3.0 | 3.0 |
Utilities | 1.4 | 1.0 |
Annual Report
Fidelity Worldwide Fund
Investments October 31, 2011
Showing Percentage of Net Assets
Common Stocks - 96.0% |
| Shares | | Value |
Australia - 1.5% |
Australia & New Zealand Banking Group Ltd. | 244,941 | | $ 5,535,316 |
carsales.com Ltd. (d) | 238,660 | | 1,233,872 |
Commonwealth Bank of Australia | 73,520 | | 3,777,086 |
Fortescue Metals Group Ltd. | 218,016 | | 1,095,164 |
Macquarie Group Ltd. | 17,973 | | 462,782 |
Newcrest Mining Ltd. | 92,133 | | 3,256,459 |
WorleyParsons Ltd. | 61,305 | | 1,779,531 |
TOTAL AUSTRALIA | | 17,140,210 |
Austria - 0.0% |
Osterreichische Elektrizitatswirtschafts AG | 6,500 | | 189,217 |
Bailiwick of Guernsey - 0.1% |
Ashmore Global Opportunities Ltd. (United Kingdom) | 49,599 | | 550,379 |
Bailiwick of Jersey - 0.9% |
Experian PLC | 176,600 | | 2,301,886 |
Shire PLC | 132,800 | | 4,168,784 |
Velti PLC (a) | 32,500 | | 273,650 |
Wolseley PLC | 106,760 | | 3,087,012 |
TOTAL BAILIWICK OF JERSEY | | 9,831,332 |
Belgium - 0.1% |
Anheuser-Busch InBev SA NV | 26,911 | | 1,492,596 |
Bermuda - 0.4% |
African Minerals Ltd. (a) | 177,200 | | 1,258,868 |
Cheung Kong Infrastructure Holdings Ltd. | 401,000 | | 2,148,044 |
Li & Fung Ltd. | 516,000 | | 994,432 |
Noble Group Ltd. | 529,363 | | 646,120 |
TOTAL BERMUDA | | 5,047,464 |
Brazil - 1.0% |
Anhanguera Educacional Participacoes SA | 113,300 | | 1,665,982 |
Arezzo Industria e Comercio SA | 51,200 | | 676,823 |
Itau Unibanco Banco Multiplo SA sponsored ADR | 78,300 | | 1,497,096 |
Qualicorp SA | 341,000 | | 3,117,692 |
Souza Cruz Industria Comerico | 199,500 | | 2,446,698 |
TIM Participacoes SA sponsored ADR | 82,378 | | 2,145,123 |
TOTAL BRAZIL | | 11,549,414 |
British Virgin Islands - 0.2% |
Arcos Dorados Holdings, Inc. | 45,500 | | 1,064,700 |
Mail.ru Group Ltd. GDR (Reg. S) | 43,800 | | 1,508,910 |
TOTAL BRITISH VIRGIN ISLANDS | | 2,573,610 |
Canada - 2.1% |
Canadian Natural Resources Ltd. | 34,200 | | 1,206,272 |
InterOil Corp. (a) | 10,500 | | 498,855 |
Keyera Corp. | 401,000 | | 18,291,087 |
|
| Shares | | Value |
Open Text Corp. (a) | 41,800 | | $ 2,558,277 |
Trinidad Drilling Ltd. | 206,900 | | 1,618,920 |
TOTAL CANADA | | 24,173,411 |
Cayman Islands - 1.3% |
Airtac International Group | 156,000 | | 873,143 |
Belle International Holdings Ltd. | 668,000 | | 1,310,100 |
Biostime International Holdings Ltd. | 496,500 | | 885,400 |
Bosideng International Holdings Ltd. | 2,392,000 | | 659,415 |
China Kanghui Holdings sponsored ADR (a)(d) | 105,800 | | 1,657,886 |
China Mengniu Dairy Co. Ltd. | 386,000 | | 1,229,987 |
China ZhengTong Auto Services Holdings Ltd. | 934,000 | | 1,011,347 |
Ctrip.com International Ltd. sponsored ADR (a)(d) | 52,800 | | 1,840,608 |
Hengdeli Holdings Ltd. | 1,388,000 | | 622,264 |
Microport Scientific Corp. | 738,000 | | 417,124 |
Sands China Ltd. (a) | 1,038,800 | | 3,121,789 |
Shenguan Holdings Group Ltd. | 1,912,000 | | 1,027,233 |
TOTAL CAYMAN ISLANDS | | 14,656,296 |
China - 0.7% |
Baidu.com, Inc. sponsored ADR (a) | 25,000 | | 3,504,500 |
China Telecom Corp. Ltd. (H Shares) | 2,586,000 | | 1,596,615 |
SINA Corp. (a)(d) | 18,600 | | 1,511,994 |
Zhaojin Mining Industry Co. Ltd. (H Shares) | 511,000 | | 912,331 |
TOTAL CHINA | | 7,525,440 |
Curacao - 0.5% |
Schlumberger Ltd. | 72,000 | | 5,289,840 |
Cyprus - 0.0% |
Aisi Realty Public Ltd. (a) | 12,322 | | 13,673 |
Denmark - 0.9% |
Novo Nordisk A/S Series B | 54,816 | | 5,820,540 |
William Demant Holding A/S (a) | 51,300 | | 4,093,123 |
TOTAL DENMARK | | 9,913,663 |
Finland - 0.4% |
Amer Group PLC (A Shares) | 79,900 | | 1,104,630 |
Nokian Tyres PLC | 78,500 | | 2,884,290 |
TOTAL FINLAND | | 3,988,920 |
France - 4.3% |
Air Liquide SA | 18,600 | | 2,413,176 |
Arkema SA | 26,330 | | 1,801,317 |
Atos Origin SA | 55,730 | | 2,700,909 |
AXA SA | 231,637 | | 3,773,020 |
BNP Paribas SA | 77,588 | | 3,527,237 |
Club Mediterranee SA (a) | 26,800 | | 508,484 |
Danone | 76,600 | | 5,332,139 |
Iliad SA | 38,014 | | 4,449,549 |
Ipsos SA | 3,300 | | 108,372 |
JC Decaux SA (a) | 37,500 | | 1,004,971 |
Common Stocks - continued |
| Shares | | Value |
France - continued |
LVMH Moet Hennessy - Louis Vuitton | 33,579 | | $ 5,588,015 |
Pernod-Ricard SA | 17,814 | | 1,664,064 |
PPR SA | 21,450 | | 3,351,398 |
Safran SA | 51,200 | | 1,677,154 |
Sanofi-aventis | 59,011 | | 4,222,200 |
Sanofi-aventis sponsored ADR | 70,000 | | 2,502,500 |
Schneider Electric SA | 24,592 | | 1,451,502 |
Societe Generale Series A | 55,400 | | 1,617,696 |
Unibail-Rodamco | 6,389 | | 1,277,631 |
TOTAL FRANCE | | 48,971,334 |
Germany - 2.2% |
Aareal Bank AG (a) | 69,248 | | 1,407,777 |
Allianz AG | 22,281 | | 2,504,084 |
Bayer AG | 46,647 | | 2,988,564 |
Bayerische Motoren Werke AG (BMW) | 42,702 | | 3,490,168 |
Commerzbank AG (a) | 260,100 | | 641,795 |
Deutsche Bank AG | 64,100 | | 2,650,826 |
Fresenius Medical Care AG & Co. KGaA | 52,700 | | 3,839,525 |
GEA Group AG | 52,982 | | 1,463,870 |
Gerry Weber International AG (Bearer) | 19,400 | | 604,072 |
Kabel Deutschland Holding AG (a) | 54,900 | | 3,134,774 |
Siemens AG | 20,658 | | 2,165,703 |
TOTAL GERMANY | | 24,891,158 |
Hong Kong - 0.7% |
AIA Group Ltd. | 1,010,800 | | 3,090,763 |
China Unicom (Hong Kong) Ltd. | 776,000 | | 1,560,238 |
I.T Ltd. | 798,000 | | 496,991 |
Techtronic Industries Co. Ltd. | 3,575,500 | | 3,093,641 |
TOTAL HONG KONG | | 8,241,633 |
India - 0.8% |
Apollo Hospitals Enterprise Ltd. | 164,788 | | 1,756,036 |
Bharti Airtel Ltd. | 350,401 | | 2,806,264 |
Housing Development Finance Corp. Ltd. | 166,070 | | 2,337,075 |
Larsen & Toubro Ltd. | 16,958 | | 489,178 |
Shriram Transport Finance Co. Ltd. | 41,265 | | 516,600 |
The Jammu & Kashmir Bank Ltd. | 30,114 | | 519,252 |
Titan Industries Ltd. | 175,420 | | 779,023 |
TOTAL INDIA | | 9,203,428 |
Indonesia - 0.3% |
PT Astra International Tbk | 82,000 | | 632,282 |
PT Sarana Menara Nusantara Tbk (a) | 913,000 | | 923,098 |
PT Tower Bersama Infrastructure Tbk | 3,992,500 | | 929,188 |
PT XL Axiata Tbk | 1,171,500 | | 655,208 |
TOTAL INDONESIA | | 3,139,776 |
Ireland - 0.6% |
Accenture PLC Class A | 43,600 | | 2,627,336 |
|
| Shares | | Value |
James Hardie Industries NV CDI (a) | 297,856 | | $ 1,929,373 |
Kenmare Resources PLC (a) | 321,500 | | 209,762 |
Paddy Power PLC (Ireland) | 45,700 | | 2,529,769 |
TOTAL IRELAND | | 7,296,240 |
Israel - 0.3% |
Check Point Software Technologies Ltd. (a) | 32,400 | | 1,867,212 |
Israel Chemicals Ltd. | 81,400 | | 979,495 |
TOTAL ISRAEL | | 2,846,707 |
Italy - 0.6% |
Intesa Sanpaolo SpA | 509,546 | | 910,362 |
Prada SpA | 144,900 | | 716,306 |
Prysmian SpA | 104,600 | | 1,585,078 |
Saipem SpA | 84,317 | | 3,780,636 |
TOTAL ITALY | | 6,992,382 |
Japan - 7.0% |
ABC-Mart, Inc. | 84,500 | | 3,309,601 |
Aozora Bank Ltd. | 566,000 | | 1,431,046 |
Asics Corp. | 200,000 | | 2,651,771 |
Calbee, Inc. (d) | 42,800 | | 1,951,360 |
Canon, Inc. | 94,450 | | 4,288,371 |
Cosmos Pharmaceutical Corp. | 47,300 | | 2,194,224 |
Credit Saison Co. Ltd. | 76,100 | | 1,485,195 |
DeNA Co. Ltd. | 46,400 | | 2,002,954 |
Denso Corp. | 69,500 | | 2,137,626 |
Digital Garage, Inc. (a) | 170 | | 556,650 |
Don Quijote Co. Ltd. | 84,700 | | 3,103,052 |
Fanuc Corp. | 21,200 | | 3,428,272 |
Honda Motor Co. Ltd. | 108,200 | | 3,235,999 |
Japan Retail Fund Investment Corp. | 157 | | 243,063 |
Japan Tobacco, Inc. | 1,306 | | 6,528,435 |
JS Group Corp. | 91,700 | | 1,923,116 |
JSR Corp. | 126,300 | | 2,411,388 |
Kakaku.com, Inc. | 43,300 | | 1,714,683 |
KDDI Corp. | 618 | | 4,527,650 |
Keyence Corp. | 10,400 | | 2,644,131 |
Misumi Group, Inc. | 70,500 | | 1,467,103 |
Mitsubishi Corp. | 136,300 | | 2,803,636 |
Mitsubishi Estate Co. Ltd. | 87,000 | | 1,473,711 |
Mitsubishi UFJ Financial Group, Inc. | 837,800 | | 3,641,492 |
ORIX Corp. | 73,700 | | 6,433,011 |
Rakuten, Inc. | 3,737 | | 4,097,156 |
So-net M3, Inc. | 320 | | 1,447,362 |
SOFTBANK CORP. | 59,800 | | 1,941,095 |
Start Today Co. Ltd. | 165,300 | | 3,497,242 |
Tokyo Electron Ltd. | 19,400 | | 1,031,892 |
TOTAL JAPAN | | 79,602,287 |
Korea (South) - 1.1% |
Hyundai Motor Co. | 11,637 | | 2,334,815 |
Kia Motors Corp. | 27,270 | | 1,741,809 |
Common Stocks - continued |
| Shares | | Value |
Korea (South) - continued |
LG Household & Health Care Ltd. | 3,087 | | $ 1,389,000 |
NHN Corp. (a) | 3,893 | | 809,131 |
Orion Corp. | 6,624 | | 3,540,417 |
Samsung Electronics Co. Ltd. | 1,927 | | 1,652,691 |
Shinhan Financial Group Co. Ltd. | 22,350 | | 887,039 |
TOTAL KOREA (SOUTH) | | 12,354,902 |
Luxembourg - 0.6% |
Brait SA | 516,600 | | 1,236,773 |
Millicom International Cellular SA | 11,500 | | 1,263,850 |
Millicom International Cellular SA (depositary receipt) | 27,200 | | 2,997,630 |
Samsonite International SA | 934,200 | | 1,520,025 |
TOTAL LUXEMBOURG | | 7,018,278 |
Mexico - 0.2% |
Wal-Mart de Mexico SA de CV Series V | 1,042,400 | | 2,692,836 |
Netherlands - 1.6% |
AEGON NV (a) | 292,700 | | 1,396,073 |
ASML Holding NV | 60,800 | | 2,549,344 |
Gemalto NV | 106,288 | | 4,849,622 |
ING Groep NV (Certificaten Van Aandelen) (a) | 654,400 | | 5,642,383 |
Koninklijke Philips Electronics NV | 77,500 | | 1,613,528 |
Randstad Holdings NV | 45,325 | | 1,616,744 |
TOTAL NETHERLANDS | | 17,667,694 |
Norway - 0.5% |
Aker Solutions ASA | 105,900 | | 1,231,594 |
DnB NOR ASA | 367,800 | | 4,290,648 |
TOTAL NORWAY | | 5,522,242 |
Philippines - 0.1% |
Alliance Global Group, Inc. | 6,500,000 | | 1,616,043 |
Poland - 0.2% |
Eurocash SA | 232,100 | | 1,860,945 |
Qatar - 0.1% |
Commercial Bank of Qatar GDR (Reg. S) | 279,659 | | 1,282,610 |
Singapore - 0.1% |
Avago Technologies Ltd. | 41,000 | | 1,384,570 |
South Africa - 0.4% |
AngloGold Ashanti Ltd. sponsored ADR | 44,700 | | 2,020,887 |
Sanlam Ltd. | 311,800 | | 1,164,884 |
Shoprite Holdings Ltd. | 125,400 | | 1,837,793 |
TOTAL SOUTH AFRICA | | 5,023,564 |
Spain - 0.7% |
Banco Bilbao Vizcaya Argentaria SA | 135,154 | | 1,216,551 |
Banco Santander SA: | | | |
rights 10/31/11 | 356,566 | | 61,681 |
(Spain) | 356,566 | | 3,018,362 |
Inditex SA | 17,582 | | 1,600,055 |
|
| Shares | | Value |
Prosegur Compania de Seguridad SA (Reg.) | 19,900 | | $ 992,803 |
Viscofan Envolturas Celulosicas SA | 31,300 | | 1,204,620 |
TOTAL SPAIN | | 8,094,072 |
Sweden - 0.6% |
Elekta AB (B Shares) | 13,000 | | 520,235 |
Intrum Justitia AB | 14,200 | | 233,597 |
Meda AB (A Shares) | 107,400 | | 1,097,137 |
Swedbank AB (A Shares) | 195,000 | | 2,747,237 |
Swedish Match Co. | 65,600 | | 2,269,997 |
TOTAL SWEDEN | | 6,868,203 |
Switzerland - 3.2% |
ACE Ltd. | 41,000 | | 2,958,150 |
Adecco SA (Reg.) | 34,229 | | 1,654,210 |
Compagnie Financiere Richemont SA Series A | 16,640 | | 952,835 |
Kuehne & Nagel International AG | 10,620 | | 1,322,735 |
Nestle SA | 164,083 | | 9,517,207 |
Partners Group Holding | 12,748 | | 2,389,660 |
Schindler Holding AG (participation certificate) | 31,036 | | 3,649,838 |
The Swatch Group AG (Bearer) | 5,440 | | 2,303,577 |
Transocean Ltd. (United States) | 47,100 | | 2,691,765 |
UBS AG (a) | 323,960 | | 4,095,441 |
Zurich Financial Services AG | 19,138 | | 4,444,561 |
TOTAL SWITZERLAND | | 35,979,979 |
Taiwan - 0.3% |
Catcher Technology Co. Ltd. | 317,000 | | 1,766,168 |
WPG Holding Co. Ltd. | 955,930 | | 1,154,290 |
TOTAL TAIWAN | | 2,920,458 |
Turkey - 0.1% |
Boyner Buyuk Magazacilik A/S (a) | 514,000 | | 863,328 |
United Arab Emirates - 0.1% |
First Gulf Bank PJSC | 130,740 | | 553,500 |
United Kingdom - 9.8% |
Aberdeen Asset Management PLC | 474,742 | | 1,469,699 |
Aggreko PLC | 30,300 | | 834,231 |
Anglo American PLC (United Kingdom) | 68,818 | | 2,538,288 |
Ashmore Group PLC | 187,900 | | 1,042,524 |
Aviva PLC | 363,200 | | 1,981,831 |
Barclays PLC | 1,257,259 | | 3,898,158 |
BG Group PLC | 291,563 | | 6,360,515 |
BHP Billiton PLC | 261,599 | | 8,239,155 |
BP PLC | 567,469 | | 4,176,690 |
British American Tobacco PLC: | | | |
(United Kingdom) | 222,000 | | 10,180,670 |
sponsored ADR | 92,400 | | 8,523,900 |
British Land Co. PLC | 332,855 | | 2,732,693 |
Burberry Group PLC | 106,200 | | 2,290,305 |
Carphone Warehouse Group PLC | 852,279 | | 4,810,929 |
Common Stocks - continued |
| Shares | | Value |
United Kingdom - continued |
Diageo PLC | 100,557 | | $ 2,081,493 |
GlaxoSmithKline PLC | 153,700 | | 3,450,034 |
HSBC Holdings PLC (United Kingdom) | 580,528 | | 5,066,231 |
Imperial Tobacco Group PLC | 85,378 | | 3,122,313 |
International Personal Finance PLC | 517,515 | | 2,282,078 |
Jazztel PLC (a) | 228,700 | | 1,322,961 |
Legal & General Group PLC | 1,800,381 | | 3,199,387 |
Lloyds Banking Group PLC (a) | 2,775,954 | | 1,435,778 |
Micro Focus International PLC | 116,800 | | 637,897 |
National Grid PLC | 273,500 | | 2,719,655 |
Ocado Group PLC (a)(d) | 898,900 | | 1,353,815 |
Reckitt Benckiser Group PLC | 19,141 | | 984,426 |
Royal Dutch Shell PLC Class B | 371,168 | | 13,319,306 |
Royalblue Group PLC | 15,700 | | 410,797 |
SuperGroup PLC (a)(d) | 65,400 | | 656,300 |
The Weir Group PLC | 37,100 | | 1,144,956 |
Ultra Electronics Holdings PLC | 32,400 | | 829,522 |
Vodafone Group PLC | 2,115,200 | | 5,874,342 |
Vodafone Group PLC sponsored ADR | 47,212 | | 1,314,382 |
Xstrata PLC | 81,600 | | 1,372,000 |
TOTAL UNITED KINGDOM | | 111,657,261 |
United States of America - 49.4% |
Alexion Pharmaceuticals, Inc. (a) | 173,000 | | 11,679,230 |
Amazon.com, Inc. (a) | 17,800 | | 3,800,478 |
American Express Co. | 182,100 | | 9,217,902 |
Ameriprise Financial, Inc. | 83,000 | | 3,874,440 |
Apple, Inc. (a) | 49,600 | | 20,077,088 |
BB&T Corp. | 38,000 | | 886,920 |
Beam, Inc. | 25,000 | | 1,235,750 |
Biogen Idec, Inc. (a) | 76,300 | | 8,878,268 |
Cabot Oil & Gas Corp. | 66,000 | | 5,129,520 |
Chevron Corp. | 143,000 | | 15,022,150 |
Citigroup, Inc. | 917,100 | | 28,971,189 |
Citrix Systems, Inc. (a) | 167,209 | | 12,177,831 |
Cognizant Technology Solutions Corp. Class A (a) | 61,600 | | 4,481,400 |
Collective Brands, Inc. (a) | 181,000 | | 2,644,410 |
CSX Corp. | 344,000 | | 7,640,240 |
Cummins, Inc. | 169,400 | | 16,843,442 |
Discover Financial Services | 384,100 | | 9,049,396 |
Duke Energy Corp. | 88,000 | | 1,796,960 |
Edwards Lifesciences Corp. (a) | 329,000 | | 24,813,180 |
El Paso Electric Co. | 60,750 | | 1,945,823 |
Elizabeth Arden, Inc. (a) | 76,000 | | 2,605,280 |
EQT Corp. | 257,000 | | 16,319,500 |
Estee Lauder Companies, Inc. Class A | 115,000 | | 11,321,750 |
Exxon Mobil Corp. | 309,000 | | 24,129,810 |
Fifth Third Bancorp | 381,000 | | 4,575,810 |
Fiserv, Inc. (a) | 7,000 | | 412,090 |
Fossil, Inc. (a) | 2,900 | | 300,614 |
|
| Shares | | Value |
Freeport-McMoRan Copper & Gold, Inc. | 112,000 | | $ 4,509,120 |
G-III Apparel Group Ltd. (a) | 189,600 | | 5,344,824 |
Gilead Sciences, Inc. (a) | 122,000 | | 5,082,520 |
Google, Inc. Class A (a) | 6,500 | | 3,852,160 |
Green Mountain Coffee Roasters, Inc. (a) | 8,900 | | 578,678 |
Informatica Corp. (a) | 144,100 | | 6,556,550 |
IntercontinentalExchange, Inc. (a) | 13,000 | | 1,688,440 |
InterMune, Inc. (a) | 37,000 | | 943,500 |
Intuit, Inc. | 576,000 | | 30,913,915 |
iRobot Corp. (a) | 177,000 | | 5,993,220 |
JCPenney Co., Inc. | 31,000 | | 994,480 |
JPMorgan Chase & Co. | 105,000 | | 3,649,800 |
Lincoln National Corp. | 367,000 | | 6,991,350 |
Lorillard, Inc. | 8,000 | | 885,280 |
MasterCard, Inc. Class A | 69,100 | | 23,994,284 |
McDonald's Corp. | 118,500 | | 11,002,725 |
Motorola Solutions, Inc. | 20,000 | | 938,200 |
National Oilwell Varco, Inc. | 82,000 | | 5,849,060 |
Nu Skin Enterprises, Inc. Class A | 132,000 | | 6,669,960 |
ONEOK, Inc. | 37,000 | | 2,813,850 |
Perrigo Co. | 207,000 | | 18,687,960 |
Polypore International, Inc. (a) | 139,100 | | 7,295,795 |
PPL Corp. | 145,000 | | 4,258,650 |
Prestige Brands Holdings, Inc. (a) | 296,120 | | 3,132,950 |
Priceline.com, Inc. (a) | 4,000 | | 2,030,880 |
Prologis, Inc. | 681,600 | | 20,284,416 |
PulteGroup, Inc. (a) | 807,000 | | 4,180,260 |
Ralph Lauren Corp. | 14,000 | | 2,223,060 |
RF Micro Devices, Inc. (a) | 991,700 | | 7,279,078 |
Riverbed Technology, Inc. (a) | 28,000 | | 772,240 |
salesforce.com, Inc. (a) | 56,000 | | 7,457,520 |
Sirius XM Radio, Inc. (a)(d) | 3,900,000 | | 6,981,000 |
Smithfield Foods, Inc. (a) | 186,000 | | 4,251,960 |
Starbucks Corp. | 281,000 | | 11,897,540 |
Target Corp. | 81,000 | | 4,434,750 |
TJX Companies, Inc. | 176,000 | | 10,371,680 |
Torchmark Corp. | 57,000 | | 2,333,010 |
Union Pacific Corp. | 202,000 | | 20,113,140 |
United Technologies Corp. | 65,000 | | 5,068,700 |
UnitedHealth Group, Inc. | 273,900 | | 13,144,461 |
Virgin Media, Inc. | 98,000 | | 2,389,240 |
W.R. Grace & Co. (a) | 323,000 | | 13,498,170 |
Wells Fargo & Co. | 246,000 | | 6,373,860 |
Williams Companies, Inc. | 85,000 | | 2,559,350 |
TOTAL UNITED STATES OF AMERICA | | 560,102,057 |
TOTAL COMMON STOCKS (Cost $1,032,697,154) |
1,088,582,952
|
Nonconvertible Preferred Stocks - 0.6% |
| Shares | | Value |
Germany - 0.5% |
ProSiebenSat.1 Media AG | 2,200 | | $ 47,191 |
Volkswagen AG | 34,600 | | 6,071,557 |
TOTAL GERMANY | | 6,118,748 |
Italy - 0.1% |
Fiat Industrial SpA (a) | 118,500 | | 727,141 |
TOTAL NONCONVERTIBLE PREFERRED STOCKS (Cost $5,541,680) |
6,845,889
|
Money Market Funds - 4.8% |
| | | |
Fidelity Cash Central Fund, 0.12% (b) | 41,886,340 | | 41,886,340 |
Fidelity Securities Lending Cash Central Fund, 0.11% (b)(c) | 12,725,485 | | 12,725,485 |
TOTAL MONEY MARKET FUNDS (Cost $54,611,825) |
54,611,825
|
TOTAL INVESTMENT PORTFOLIO - 101.4% (Cost $1,092,850,659) | | 1,150,040,666 |
NET OTHER ASSETS (LIABILITIES) - (1.4)% | | (15,367,874) |
NET ASSETS - 100% | $ 1,134,672,792 |
Legend |
(a) Non-income producing |
(b) Affiliated fund that is available only to investment companies and other accounts managed by Fidelity Investments. The rate quoted is the annualized seven-day yield of the fund at period end. A complete unaudited listing of the fund's holdings as of its most recent quarter end is available upon request. In addition, each Fidelity Central Fund's financial statements, which are not covered by the Fund's Report of Independent Registered Public Accounting Firm, are available on the SEC's website or upon request. |
(c) Investment made with cash collateral received from securities on loan. |
(d) Security or a portion of the security is on loan at period end. |
Affiliated Central Funds |
Information regarding fiscal year to date income earned by the Fund from investments in Fidelity Central Funds is as follows: |
Fund | Income earned |
Fidelity Cash Central Fund | $ 77,687 |
Fidelity Securities Lending Cash Central Fund | 199,692 |
Total | $ 277,379 |
Other Information |
The following is a summary of the inputs used, as of October 31, 2011, involving the Fund's assets and liabilities carried at fair value. The inputs or methodology used for valuing securities may not be an indication of the risk associated with investing in those securities. For more information on valuation inputs, and their aggregation into the levels used in the tables below, please refer to the Security Valuation section in the accompanying Notes to Financial Statements. |
Valuation Inputs at Reporting Date: |
Description | Total | Level 1 | Level 2 | Level 3 |
Investments in Securities: | | | | |
Equities: | | | | |
United States of America | $ 560,102,057 | $ 560,102,057 | $ - | $ - |
United Kingdom | 111,657,261 | 49,233,918 | 62,423,343 | - |
Japan | 79,602,287 | - | 79,602,287 | - |
France | 48,971,334 | 44,749,134 | 4,222,200 | - |
Switzerland | 35,979,979 | 31,884,538 | 4,095,441 | - |
Germany | 31,009,906 | 22,353,852 | 8,656,054 | - |
Canada | 24,173,411 | 24,173,411 | - | - |
Netherlands | 17,667,694 | 9,015,710 | 8,651,984 | - |
Australia | 17,140,210 | - | 17,140,210 | - |
Other | 169,124,702 | 95,926,624 | 73,198,078 | - |
Money Market Funds | 54,611,825 | 54,611,825 | - | - |
Total Investments in Securities: | $ 1,150,040,666 | $ 892,051,069 | $ 257,989,597 | $ - |
The following is a reconciliation of Investments in Securities for which Level 3 inputs were used in determining value: |
Investments in Securities: | |
Beginning Balance | $ 34,550 |
Total Realized Gain (Loss) | - |
Total Unrealized Gain (Loss) | - |
Cost of Purchases | - |
Proceeds of Sales | - |
Amortization/Accretion | - |
Transfers in to Level 3 | - |
Transfers out of Level 3 | (34,550) |
Ending Balance | $ - |
The change in unrealized gain (loss) for the period attributable to Level 3 securities held at October 31, 2011 | $ - |
The information used in the above reconciliation represents fiscal year to date activity for any Investments in Securities identified as using Level 3 inputs at either the beginning or the end of the current fiscal period. Transfers in or out of Level 3 represent the beginning value of any Security or Instrument where a change in the pricing level occurred from the beginning to the end of the period. The cost of purchases and the proceeds of sales may include securities received or delivered through corporate actions or exchanges. Realized and unrealized gains (losses) disclosed in the reconciliation are included in Net Gain (Loss) on the Fund's Statement of Operations. |
Income Tax Information |
At October 31, 2011, the Fund had a capital loss carryforward of approximately $43,909,944 all of which will expire in fiscal 2017. Capital loss carryforwards are only available to offset future capital gains of the Fund to the extent provided by regulations and may be limited. |
See accompanying notes which are an integral part of the financial statements.
Annual Report
Fidelity Worldwide Fund
Statement of Assets and Liabilities
| October 31, 2011 |
| | |
Assets | | |
Investment in securities, at value (including securities loaned of $11,527,651) - See accompanying schedule: Unaffiliated issuers (cost $1,038,238,834) | $ 1,095,428,841 | |
Fidelity Central Funds (cost $54,611,825) | 54,611,825 | |
Total Investments (cost $1,092,850,659) | | $ 1,150,040,666 |
Foreign currency held at value (cost $12) | | 12 |
Receivable for investments sold | | 36,476,232 |
Receivable for fund shares sold | | 974,697 |
Dividends receivable | | 1,205,767 |
Distributions receivable from Fidelity Central Funds | | 21,667 |
Prepaid expenses | | 4,726 |
Other receivables | | 381,445 |
Total assets | | 1,189,105,212 |
| | |
Liabilities | | |
Payable for investments purchased | $ 39,330,913 | |
Payable for fund shares redeemed | 1,365,409 | |
Accrued management fee | 671,958 | |
Distribution and service plan fees payable | 4,710 | |
Other affiliated payables | 262,119 | |
Other payables and accrued
expenses | 71,826 | |
Collateral on securities loaned, at value | 12,725,485 | |
Total liabilities | | 54,432,420 |
| | |
Net Assets | | $ 1,134,672,792 |
Net Assets consist of: | | |
Paid in capital | | $ 1,132,528,887 |
Undistributed net investment income | | 2,700,979 |
Accumulated undistributed net realized gain (loss) on investments and foreign currency transactions | | (57,762,431) |
Net unrealized appreciation (depreciation) on investments and assets and liabilities in foreign
currencies | | 57,205,357 |
Net Assets | | $ 1,134,672,792 |
| October 31, 2011 |
| | |
Calculation of Maximum Offering Price Class A:
Net Asset Value and redemption price per share ($13,153,433 ÷ 735,359 shares) | | $ 17.89 |
| | |
Maximum offering price per share (100/94.25 of $17.89) | | $ 18.98 |
Class T:
Net Asset Value and redemption price per share ($2,186,869 ÷ 122,631 shares) | | $ 17.83 |
| | |
Maximum offering price per share (100/96.50 of $17.83) | | $ 18.48 |
Class B:
Net Asset Value and offering price per share ($255,549 ÷ 14,383 shares)A | | $ 17.77 |
| | |
Class C:
Net Asset Value and offering price per share ($1,296,964 ÷ 73,124 shares)A | | $ 17.74 |
| | |
Worldwide:
Net Asset Value, offering price and redemption price per share ($1,114,693,586 ÷ 61,871,620 shares) | | $ 18.02 |
| | |
Institutional Class:
Net Asset Value, offering price and redemption price per share ($3,086,391 ÷ 171,674 shares) | | $ 17.98 |
A Redemption price per share is equal to net asset value less any applicable contingent deferred sales charge.
See accompanying notes which are an integral part of the financial statements.
Annual Report
Fidelity Worldwide Fund
Financial Statements - continued
Statement of Operations
| Year ended October 31, 2011 |
| | |
Investment Income | | |
Dividends | | $ 20,686,068 |
Interest | | 17,708 |
Income from Fidelity Central Funds | | 277,379 |
Income before foreign taxes withheld | | 20,981,155 |
Less foreign taxes withheld | | (1,097,612) |
Total income | | 19,883,543 |
| | |
Expenses | | |
Management fee
Basic fee | $ 8,486,454 | |
Performance adjustment | 729,662 | |
Transfer agent fees | 2,773,239 | |
Distribution and service plan fees | 54,064 | |
Accounting and security lending fees | 553,421 | |
Custodian fees and expenses | 257,965 | |
Independent trustees' compensation | 6,658 | |
Registration fees | 98,806 | |
Audit | 81,560 | |
Legal | 5,113 | |
Miscellaneous | 11,919 | |
Total expenses before reductions | 13,058,861 | |
Expense reductions | (357,517) | 12,701,344 |
Net investment income (loss) | | 7,182,199 |
Realized and Unrealized Gain (Loss) Net realized gain (loss) on: | | |
Investment securities: | | |
Unaffiliated issuers | 120,978,817 | |
Foreign currency transactions | (435,639) | |
Total net realized gain (loss) | | 120,543,178 |
Change in net unrealized appreciation (depreciation) on: Investment securities (net of decrease in deferred foreign taxes of $556,502) | (94,435,905) | |
Assets and liabilities in foreign currencies | (21,713) | |
Total change in net unrealized appreciation (depreciation) | | (94,457,618) |
Net gain (loss) | | 26,085,560 |
Net increase (decrease) in net assets resulting from operations | | $ 33,267,759 |
Statement of Changes in Net Assets
| Year ended
October 31,
2011 | Year ended
October 31,
2010 |
Increase (Decrease) in Net Assets | | |
Operations | | |
Net investment income (loss) | $ 7,182,199 | $ 5,168,785 |
Net realized gain (loss) | 120,543,178 | 100,330,002 |
Change in net unrealized appreciation (depreciation) | (94,457,618) | 66,991,246 |
Net increase (decrease) in net assets resulting from operations | 33,267,759 | 172,490,033 |
Distributions to shareholders from net investment income | (6,244,141) | (6,419,967) |
Distributions to shareholders from net realized gain | (2,870,519) | (993,213) |
Total distributions | (9,114,660) | (7,413,180) |
Share transactions - net increase (decrease) | 12,558,124 | (61,476,980) |
Redemption fees | 33,448 | 31,293 |
Total increase (decrease) in net assets | 36,744,671 | 103,631,166 |
| | |
Net Assets | | |
Beginning of period | 1,097,928,121 | 994,296,955 |
End of period (including undistributed net investment income of $2,700,979 and undistributed net investment income of $4,480,160, respectively) | $ 1,134,672,792 | $ 1,097,928,121 |
See accompanying notes which are an integral part of the financial statements.
Annual Report
Financial Highlights - Class A
Years ended October 31, | 2011 | 2010 | 2009H |
Selected Per-Share Data | | | |
Net asset value, beginning of period | $ 17.50 | $ 14.96 | $ 10.88 |
Income from Investment Operations | | | |
Net investment income (loss) E | .05 | .03 | (.01) |
Net realized and unrealized gain (loss) | .47 | 2.63 | 4.09 |
Total from investment operations | .52 | 2.66 | 4.08 |
Distributions from net investment income | (.08) | (.10) | - |
Distributions from net realized gain | (.05) | (.02) | - |
Total distributions | (.13) | (.12) | - |
Redemption fees added to paid in capital E,J | - | - | - |
Net asset value, end of period | $ 17.89 | $ 17.50 | $ 14.96 |
Total Return B,C,D | 2.94% | 17.85% | 37.50% |
Ratios to Average Net Assets F, I | | | |
Expenses before reductions | 1.41% | 1.43% | 1.52% A |
Expenses net of fee waivers, if any | 1.40% | 1.43% | 1.52% A |
Expenses net of all reductions | 1.38% | 1.41% | 1.49% A |
Net investment income (loss) | .28% | .21% | (.06)% A |
Supplemental Data | | | |
Net assets, end of period (000 omitted) | $ 13,153 | $ 7,530 | $ 993 |
Portfolio turnover rate G | 203% | 166% | 224% |
A Annualized
B Total returns for periods of less than one year are not annualized.
C Total returns would have been lower if certain expenses had not been reduced during the applicable periods shown.
D Total returns do not include the effect of the sales charges.
E Calculated based on average shares outstanding during the period.
F Fees and expenses of any underlying Fidelity Central Funds are not included in the Fund's expense ratio. The Fund indirectly bears its proportionate share of the expenses of any underlying Fidelity Central Funds.
G Amount does not include the portfolio activity of any underlying Fidelity Central Funds.
H For the period February 19, 2009 (commencement of sale of shares) to October 31, 2009.
I Expense ratios reflect operating expenses of the class. Expenses before reductions do not reflect amounts reimbursed by the investment adviser or reductions from brokerage service arrangements or reductions from other expense offset arrangements and do not represent the amount paid by the class during periods when reimbursements or reductions occur. Expense ratios before reductions for start-up periods may not be representative of longer-term operating periods. Expenses net of fee waivers reflect expenses after reimbursement by the investment adviser but prior to reductions from brokerage service arrangements or other expense offset arrangements. Expenses net of all reductions represent the net expenses paid by the class.
J Amount represents less than $.01 per share.
Financial Highlights - Class T
Years ended October 31, | 2011 | 2010 | 2009 H |
Selected Per-Share Data | | | |
Net asset value, beginning of period | $ 17.46 | $ 14.94 | $ 10.88 |
Income from Investment Operations | | | |
Net investment income (loss) E | .01 | (.01) | (.01) |
Net realized and unrealized gain (loss) | .45 | 2.62 | 4.07 |
Total from investment operations | .46 | 2.61 | 4.06 |
Distributions from net investment income | (.04) | (.08) | - |
Distributions from net realized gain | (.05) | (.02) | - |
Total distributions | (.09) | (.09) K | - |
Redemption fees added to paid in capital E,J | - | - | - |
Net asset value, end of period | $ 17.83 | $ 17.46 | $ 14.94 |
Total Return B,C,D | 2.61% | 17.53% | 37.32% |
Ratios to Average Net Assets F, I | | | |
Expenses before reductions | 1.66% | 1.70% | 1.73% A |
Expenses net of fee waivers, if any | 1.65% | 1.70% | 1.73% A |
Expenses net of all reductions | 1.63% | 1.68% | 1.70% A |
Net investment income (loss) | .03% | (.05)% | (.08)% A |
Supplemental Data | | | |
Net assets, end of period (000 omitted) | $ 2,187 | $ 1,120 | $ 458 |
Portfolio turnover rate G | 203% | 166% | 224% |
A Annualized
B Total returns for periods of less than one year are not annualized.
C Total returns would have been lower if certain expenses had not been reduced during the applicable periods shown.
D Total returns do not include the effect of the sales charges.
E Calculated based on average shares outstanding during the period.
F Fees and expenses of any underlying Fidelity Central Funds are not included in the Fund's expense ratio. The Fund indirectly bears its proportionate share of the expenses of any underlying Fidelity Central Funds.
G Amount does not include the portfolio activity of any underlying Fidelity Central Funds.
H For the period February 19, 2009 (commencement of sale of shares) to October 31, 2009.
I Expense ratios reflect operating expenses of the class. Expenses before reductions do not reflect amounts reimbursed by the investment adviser or reductions from brokerage service arrangements or reductions from other expense offset arrangements and do not represent the amount paid by the class during periods when reimbursements or reductions occur. Expense ratios before reductions for start-up periods may not be representative of longer-term operating periods. Expenses net of fee waivers reflect expenses after reimbursement by the investment adviser but prior to reductions from brokerage service arrangements or other expense offset arrangements. Expenses net of all reductions represent the net expenses paid by the class.
J Amount represents less than $.01 per share.
K Total distributions of $.09 per share is comprised of distributions from net investment income of $.075 and distributions from net realized gain of $.015 per share.
See accompanying notes which are an integral part of the financial statements.
Annual Report
Financial Highlights - Class B
Years ended October 31, | 2011 | 2010 | 2009 H |
Selected Per-Share Data | | | |
Net asset value, beginning of period | $ 17.39 | $ 14.89 | $ 10.88 |
Income from Investment Operations | | | |
Net investment income (loss) E | (.09) | (.09) | (.03) |
Net realized and unrealized gain (loss) | .47 | 2.61 | 4.04 |
Total from investment operations | .38 | 2.52 | 4.01 |
Distributions from net investment income | - | (.01) | - |
Distributions from net realized gain | - | (.01) | - |
Total distributions | - | (.02) | - |
Redemption fees added to paid in capital E,J | - | - | - |
Net asset value, end of period | $ 17.77 | $ 17.39 | $ 14.89 |
Total Return B,C,D | 2.19% | 16.92% | 36.86% |
Ratios to Average Net Assets F,I | | | |
Expenses before reductions | 2.16% | 2.19% | 2.20% A |
Expenses net of fee waivers, if any | 2.16% | 2.19% | 2.20% A |
Expenses net of all reductions | 2.13% | 2.17% | 2.17% A |
Net investment income (loss) | (.47)% | (.55)% | (.30)% A |
Supplemental Data | | | |
Net assets, end of period (000 omitted) | $ 256 | $ 305 | $ 224 |
Portfolio turnover rate G | 203% | 166% | 224% |
A Annualized
B Total returns for periods of less than one year are not annualized.
C Total returns would have been lower if certain expenses had not been reduced during the applicable periods shown.
D Total returns do not include the effect of the contingent deferred sales charge.
E Calculated based on average shares outstanding during the period.
F Fees and expenses of any underlying Fidelity Central Funds are not included in the Fund's expense ratio. The Fund indirectly bears its proportionate share of the expenses of any underlying Fidelity Central Funds.
G Amount does not include the portfolio activity of any underlying Fidelity Central Funds.
H For the period February 19, 2009 (commencement of sale of shares) to October 31, 2009.
I Expense ratios reflect operating expenses of the class. Expenses before reductions do not reflect amounts reimbursed by the investment adviser or reductions from brokerage service arrangements or reductions from other expense offset arrangements and do not represent the amount paid by the class during periods when reimbursements or reductions occur. Expense ratios before reductions for start-up periods may not be representative of longer-term operating periods. Expenses net of fee waivers reflect expenses after reimbursement by the investment adviser but prior to reductions from brokerage service arrangements or other expense offset arrangements. Expenses net of all reductions represent the net expenses paid by the class.
J Amount represents less than $.01 per share.
Financial Highlights - Class C
Years ended October 31, | 2011 | 2010 | 2009 H |
Selected Per-Share Data | | | |
Net asset value, beginning of period | $ 17.36 | $ 14.89 | $ 10.88 |
Income from Investment Operations | | | |
Net investment income (loss) E | (.09) | (.09) | (.04) |
Net realized and unrealized gain (loss) | .47 | 2.61 | 4.05 |
Total from investment operations | .38 | 2.52 | 4.01 |
Distributions from net investment income | - | (.03) | - |
Distributions from net realized gain | - | (.02) | - |
Total distributions | - | (.05) | - |
Redemption fees added to paid in capital E,J | - | - | - |
Net asset value, end of period | $ 17.74 | $ 17.36 | $ 14.89 |
Total Return B,C,D | 2.19% | 16.94% | 36.86% |
Ratios to Average Net Assets F,I | | | |
Expenses before reductions | 2.16% | 2.19% | 2.18% A |
Expenses net of fee waivers, if any | 2.15% | 2.19% | 2.18% A |
Expenses net of all reductions | 2.13% | 2.16% | 2.15% A |
Net investment income (loss) | (.47)% | (.54)% | (.39)% A |
Supplemental Data | | | |
Net assets, end of period (000 omitted) | $ 1,297 | $ 710 | $ 335 |
Portfolio turnover rate G | 203% | 166% | 224% |
A Annualized
B Total returns for periods of less than one year are not annualized.
C Total returns would have been lower if certain expenses had not been reduced during the applicable periods shown.
D Total returns do not include the effect of the contingent deferred sales charge.
E Calculated based on average shares outstanding during the period.
F Fees and expenses of any underlying Fidelity Central Funds are not included in the Fund's expense ratio. The Fund indirectly bears its proportionate share of the expenses of any underlying Fidelity Central Funds.
G Amount does not include the portfolio activity of any underlying Fidelity Central Funds.
H For the period February 19, 2009 (commencement of sale of shares) to October 31, 2009.
I Expense ratios reflect operating expenses of the class. Expenses before reductions do not reflect amounts reimbursed by the investment adviser or reductions from brokerage service arrangements or reductions from other expense offset arrangements and do not represent the amount paid by the class during periods when reimbursements or reductions occur. Expense ratios before reductions for start-up periods may not be representative of longer-term operating periods. Expenses net of fee waivers reflect expenses after reimbursement by the investment adviser but prior to reductions from brokerage service arrangements or other expense offset arrangements. Expenses net of all reductions represent the net expenses paid by the class.
J Amount represents less than $.01 per share.
See accompanying notes which are an integral part of the financial statements.
Annual Report
Financial Highlights - Worldwide
Years ended October 31, | 2011 | 2010 | 2009 | 2008 | 2007 |
Selected Per-Share Data | | | | | |
Net asset value, beginning of period | $ 17.58 | $ 14.98 | $ 13.40 | $ 25.18 | $ 21.82 |
Income from Investment Operations | | | | | |
Net investment income (loss) B | .11 | .08 | .12 | .16 | .14 |
Net realized and unrealized gain (loss) | .48 | 2.63 | 1.63 | (9.44) | 6.05 |
Total from investment operations | .59 | 2.71 | 1.75 | (9.28) | 6.19 |
Distributions from net investment income | (.10) | (.10) | (.17) | (.12) | (.17) |
Distributions from net realized gain | (.05) | (.02) | - | (2.38) | (2.66) |
Total distributions | (.15) | (.11) G | (.17) | (2.50) | (2.83) |
Redemption fees added to paid in capital B,F | - | - | - | - | - |
Net asset value, end of period | $ 18.02 | $ 17.58 | $ 14.98 | $ 13.40 | $ 25.18 |
Total Return A | 3.32% | 18.18% | 13.39% | (40.66)% | 31.87% |
Ratios to Average Net Assets C,E | | | | | |
Expenses before reductions | 1.08% | 1.15% | 1.27% | 1.21% | 1.04% |
Expenses net of fee waivers, if any | 1.08% | 1.15% | 1.27% | 1.21% | 1.04% |
Expenses net of all reductions | 1.05% | 1.12% | 1.24% | 1.19% | 1.02% |
Net investment income (loss) | .60% | .50% | .92% | .84% | .66% |
Supplemental Data | | | | | |
Net assets, end of period (000 omitted) | $ 1,114,694 | $ 1,087,928 | $ 991,996 | $ 934,885 | $ 1,773,603 |
Portfolio turnover rate D | 203% | 166% | 224% | 264% | 128% |
A Total returns would have been lower if certain expenses had not been reduced during the applicable periods shown.
B Calculated based on average shares outstanding during the period.
C Fees and expenses of any underlying Fidelity Central Funds are not included in the Fund's expense ratio. The Fund indirectly bears its proportionate share of the expenses of any underlying Fidelity Central Funds.
D Amount does not include the portfolio activity of any underlying Fidelity Central Funds.
E Expense ratios reflect operating expenses of the class. Expenses before reductions do not reflect amounts reimbursed by the investment adviser or reductions from brokerage service arrangements or reductions from other expense offset arrangements and do not represent the amount paid by the class during periods when reimbursements or reductions occur. Expenses net of fee waivers reflect expenses after reimbursement by the investment adviser but prior to reductions from brokerage service arrangements or other expense offset arrangements. Expenses net of all reductions represent the net expenses paid by the class.
F Amount represents less than $.01 per share.
G Total distributions of $.11 per share is comprised of distributions from net investment income of $.097 and distributions from net realized gain of $.015 per share.
Financial Highlights - Institutional Class
Years ended October 31, | 2011 | 2010 | 2009 G |
Selected Per-Share Data | | | |
Net asset value, beginning of period | $ 17.57 | $ 15.00 | $ 10.88 |
Income from Investment Operations | | | |
Net investment income (loss) D | .10 | .07 | .06 |
Net realized and unrealized gain (loss) | .47 | 2.63 | 4.06 |
Total from investment operations | .57 | 2.70 | 4.12 |
Distributions from net investment income | (.11) | (.11) | - |
Distributions from net realized gain | (.05) | (.02) | - |
Total distributions | (.16) | (.13) | - |
Redemption fees added to paid in capital D,I | - | - | - |
Net asset value, end of period | $ 17.98 | $ 17.57 | $ 15.00 |
Total Return B,C | 3.23% | 18.08% | 37.87% |
Ratios to Average Net Assets E,H | | | |
Expenses before reductions | 1.13% | 1.21% | 1.17% A |
Expenses net of fee waivers, if any | 1.13% | 1.21% | 1.17% A |
Expenses net of all reductions | 1.10% | 1.19% | 1.15% A |
Net investment income (loss) | .56% | .44% | .62% A |
Supplemental Data | | | |
Net assets, end of period (000 omitted) | $ 3,086 | $ 335 | $ 290 |
Portfolio turnover rate F | 203% | 166% | 224% |
A Annualized
B Total returns for periods of less than one year are not annualized.
C Total returns would have been lower if certain expenses had not been reduced during the applicable periods shown.
D Calculated based on average shares outstanding during the period.
E Fees and expenses of any underlying Fidelity Central Funds are not included in the Fund's expense ratio. The Fund indirectly bears its proportionate share of the expenses of any underlying Fidelity Central Funds.
F Amount does not include the portfolio activity of any underlying Fidelity Central Funds.
G For the period February 19, 2009 (commencement of sale of shares) to October 31, 2009.
H Expense ratios reflect operating expenses of the class. Expenses before reductions do not reflect amounts reimbursed by the investment adviser or reductions from brokerage service arrangements or reductions from other expense offset arrangements and do not represent the amount paid by the class during periods when reimbursements or reductions occur. Expense ratios before reductions for start-up periods may not be representative of longer-term operating periods. Expenses net of fee waivers reflect expenses after reimbursement by the investment adviser but prior to reductions from brokerage service arrangements or other expense offset arrangements. Expenses net of all reductions represent the net expenses paid by the class.
I Amount represents less than $.01 per share.
See accompanying notes which are an integral part of the financial statements.
Annual Report
Notes to Financial Statements
For the period ended October 31, 2011
1. Organization.
Fidelity Worldwide Fund (the Fund) is a fund of Fidelity Investment Trust (the Trust) and is authorized to issue an unlimited number of shares. The Trust is registered under the Investment Company Act of 1940, as amended (the 1940 Act), as an open-end management investment company organized as a Massachusetts business trust. The Fund offers Class A, Class T, Class C, Worldwide and Institutional class, each of which, along with class B shares has equal rights as to assets and voting privileges. Effective after the close of business on September 1, 2010, Class B shares were closed to new accounts and additional purchases, except for exchanges and reinvestments by existing shareholders. Each class has exclusive voting rights with respect to matters that affect that class. Class B shares will automatically convert to Class A shares after a holding period of seven years from the initial date of purchase. Investment income, realized and unrealized capital gains and losses, the common expenses of the Fund, and certain fund-level expense reductions, if any, are allocated on a pro-rata basis to each class based on the relative net assets of each class to the total net assets of the Fund. Each class differs with respect to transfer agent and distribution and service plan fees incurred. Certain expense reductions may also differ by class. The Fund's investments in emerging markets can be subject to social, economic, regulatory, and political uncertainties and can be extremely volatile.
2. Investments in Fidelity Central Funds.
The Fund invests in Fidelity Central Funds, which are open-end investment companies available only to other investment companies and accounts managed by Fidelity Management & Research Company (FMR) and its affiliates. The Fund's Schedule of Investments lists each of the Fidelity Central Funds held as of period end, if any, as an investment of the Fund, but does not include the underlying holdings of each Fidelity Central Fund. As an Investing Fund, the Fund indirectly bears its proportionate share of the expenses of the underlying Fidelity Central Funds.
The Money Market Central Funds seek preservation of capital and current income and are managed by Fidelity Investments Money Management, Inc. (FIMM), an affiliate of FMR.
A complete unaudited list of holdings for each Fidelity Central Fund is available upon request or at the Securities and Exchange Commission (the SEC) web site at www.sec.gov. In addition, the financial statements of the Fidelity Central Funds, which are not covered by the Fund's Report of Independent Registered Public Accounting Firm are available on the SEC web site or upon request.
3. Significant Accounting Policies.
The financial statements have been prepared in conformity with accounting principles generally accepted in the United States of America (GAAP), which require management to make certain estimates and assumptions at the date of the financial statements. Actual results could differ from those estimates. Subsequent events, if any, through the date that the financial statements were issued have been evaluated in the preparation of the financial statements. The following summarizes the significant accounting policies of the Fund:
Security Valuation. Investments are valued as of 4:00 p.m. Eastern time on the last calendar day of the period. The Fund uses independent pricing services approved by the Board of Trustees to value its investments. When current market prices or quotations are not readily available or reliable, valuations may be determined in good faith in accordance with procedures adopted by the Board of Trustees. Factors used in determining value may include market or security specific events. The frequency with which these procedures are used cannot be predicted and they may be utilized to a significant extent. The value used for net asset value (NAV) calculation under these procedures may differ from published prices for the same securities.
The Fund categorizes the inputs to valuation techniques used to value its investments into a disclosure hierarchy consisting of three levels as shown below:
Level 1 - quoted prices in active markets for identical investments
Level 2 - other significant observable inputs (including quoted prices for similar investments, interest rates, prepayment speeds, etc.)
Level 3 - unobservable inputs (including the Fund's own assumptions based on the best information available)
Changes in valuation techniques may result in transfers in or out of an assigned level within the disclosure hierarchy. The aggregate value of investments by input level, as of October 31, 2011 as well as a roll forward of Level 3 securities, is included at the end of the Fund's Schedule of Investments. Valuation techniques used to value the Fund's investments by major category are as follows:
Equity securities, including restricted securities, for which market quotations are readily available, are valued at the last reported sale price or official closing price as reported by an independent pricing service on the primary market or exchange on which they are traded and are categorized as Level 1 in the hierarchy. In the event there were no sales during the day or closing prices are not available, securities are valued at the last quoted bid price or may be valued using the last available price and are generally categorized as Level 2 in the hierarchy. For foreign equity securities, when significant market or security specific events arise, comparisons to the valuation of American Depositary Receipts (ADRs), futures contracts, Exchange-traded funds (ETFs) and certain indexes as well as quoted prices for similar securities are used and are categorized as Level 2 in the hierarchy in these
Annual Report
3. Significant Accounting Policies - continued
Security Valuation - continued
circumstances. Utilizing these techniques may result in transfers between Level 1 and Level 2. For restricted equity securities and private placements where observable inputs are limited, assumptions about market activity and risk are used and are categorized as Level 3 in the hierarchy.
Investments in open-end mutual funds, including the Fidelity Central Funds, are valued at their closing net asset value each business day and are categorized as Level 1 in the hierarchy.
Foreign Currency. The Fund may use foreign currency contracts to facilitate transactions in foreign-denominated securities. Gains and losses from these transactions may arise from changes in the value of the foreign currency or if the counterparties do not perform under the contracts' terms.
Foreign-denominated assets, including investment securities, and liabilities are translated into U.S. dollars at the exchange rate at period end. Purchases and sales of investment securities, income and dividends received and expenses denominated in foreign currencies are translated into U.S. dollars at the exchange rate in effect on the transaction date.
The effects of exchange rate fluctuations on investments are included with the net realized and unrealized gain (loss) on investment securities. Other foreign currency transactions resulting in realized and unrealized gain (loss) are disclosed separately.
Investment Transactions and Income. For financial reporting purposes, the Fund's investment holdings and NAV include trades executed through the end of the last business day of the period. The NAV per share for processing shareholder transactions is calculated as of the close of business of the New York Stock Exchange (NYSE) normally 4:00 p.m. Eastern time and includes trades executed through the end of the prior business day. Gains and losses on securities sold are determined on the basis of identified cost and may include proceeds received from litigation. Dividend income is recorded on the ex-dividend date, except for certain dividends from foreign securities where the ex-dividend date may have passed, which are recorded as soon as the Fund is informed of the ex-dividend date. Non-cash dividends included in dividend income, if any, are recorded at the fair market value of the securities received. Distributions received on securities that represent a return of capital or capital gain are recorded as a reduction of cost of investments and/or as a realized gain. The Fund estimates the components of distributions received that may be considered return of capital distributions or capital gain distributions. Interest income and distributions from the Fidelity Central Funds are accrued as earned. Interest income includes coupon interest and amortization of premium and accretion of discount on debt securities. Investment income is recorded net of foreign taxes withheld where recovery of such taxes is uncertain.
Expenses. Expenses directly attributable to a fund are charged to that fund. Expenses attributable to more than one fund are allocated among the respective funds on the basis of relative net assets or other appropriate methods. Expense estimates are accrued in the period to which they relate and adjustments are made when actual amounts are known.
Income Tax Information and Distributions to Shareholders. Each year, the Fund intends to qualify as a regulated investment company, including distributing substantially all of its taxable income and realized gains under Subchapter M of the Internal Revenue Code and filing its U.S. federal tax return. As a result, no provision for income taxes is required. As of October 31, 2011, the Fund did not have any unrecognized tax benefits in the financial statements. A fund's federal tax return is subject to examination by the Internal Revenue Service (IRS) for a period of three years. Foreign taxes are provided for based on the Fund's understanding of the tax rules and rates that exist in the foreign markets in which it invests.
Distributions are declared and recorded on the ex-dividend date. Income dividends and capital gain distributions are declared separately for each class. Income and capital gain distributions are determined in accordance with income tax regulations, which may differ from GAAP. In addition, the Fund claimed a portion of the payment made to redeeming shareholders as a distribution for income tax purposes.
Capital accounts within the financial statements are adjusted for permanent book-tax differences. These adjustments have no impact on net assets or the results of operations. Temporary book-tax differences will reverse in a subsequent period.
Book-tax differences are primarily due to foreign currency transactions, certain foreign taxes, passive foreign investment companies (PFIC), partnerships, equity-debt classifications, deferred trustees compensation, capital loss carryforwards and losses deferred due to wash sales.
The federal tax cost of investment securities and unrealized appreciation (depreciation) as of period end were as follows:
Gross unrealized appreciation | $ 107,207,788 |
Gross unrealized depreciation | (63,870,262) |
Net unrealized appreciation (depreciation) on securities and other investments | $ 43,337,526 |
| |
Tax Cost | $ 1,106,703,140 |
Annual Report
Notes to Financial Statements - continued
3. Significant Accounting Policies - continued
Income Tax Information and Distributions to Shareholders - continued
The tax-based components of distributable earnings as of period end were as follows:
Undistributed ordinary income | $ 2,701,313 |
Capital loss carryfoward | $ (43,909,944) |
Net unrealized appreciation (depreciation) | $ 43,352,876 |
Under the recently enacted Regulated Investment Company Modernization Act of 2010 (the Act), the Fund will be permitted to carry forward capital losses incurred in taxable years beginning after December 22, 2010 for an unlimited period. However, any losses incurred during those future taxable years will be required to be utilized prior to any losses incurred in pre-enactment taxable years, which generally expire after eight years from when they are incurred. Additionally, post-enactment capital losses that are carried forward will retain their character as either short-term or long-term capital losses rather than being considered all short-term as under previous law. The Fund's first fiscal year end subject to the Act will be October 31, 2012.
The tax character of distributions paid was as follows:
| October 31, 2011 | October 31, 2010 |
Ordinary Income | $ 9,114,660 | $ 7,413,180 |
Short-Term Trading (Redemption) Fees. Shares held by investors in the Fund less than 30 days are subject to a redemption fee equal to 1.00% of the net asset value of shares redeemed. All redemption fees, which reduce the proceeds of the shareholder redemption, are retained by the Fund and accounted for as an addition to paid in capital.
New Accounting Pronouncement. In May 2011, the Financial Accounting Standards Board issued Accounting Standard Update No. 2011-04, Fair Value Measurement (Topic 820) - Amendments to Achieve Common Fair Value Measurement and Disclosure Requirements in U.S. GAAP and IFRSs. The update changes the wording used to describe the requirements in GAAP for measuring fair value and for disclosing information about fair value measurements. The update is effective during interim and annual periods beginning after December 15, 2011. Management is currently evaluating the impact of the update's adoption on the Fund's financial statement disclosures.
4. Purchases and Sales of Investments.
Purchases and sales of securities, other than short-term securities, aggregated $2,331,452,718 and $2,340,625,824, respectively.
5. Fees and Other Transactions with Affiliates.
Management Fee. FMR and its affiliates provide the Fund with investment management related services for which the Fund pays a monthly management fee. The management fee is the sum of an individual fund fee rate that is based on an annual rate of .45% of the Fund's average net assets and a group fee rate that averaged .26% during the period. The group fee rate is based upon the average net assets of all the mutual funds advised by FMR. The group fee rate decreases as assets under management increase and increases as assets under management decrease. In addition, the management fee is subject to a performance adjustment (up to a maximum of ±.20% of the Fund's average net assets over a 36 month performance period). The upward or downward adjustment to the management fee is based on the relative investment performance of Worldwide as compared to an appropriate benchmark index. For the period, the total annual management fee rate, including the performance adjustment, was .77% of the Fund's average net assets.
Distribution and Service Plan Fees. In accordance with Rule 12b-1 of the 1940 Act, the Fund has adopted separate Distribution and Service Plans for each class of shares. Certain classes pay Fidelity Distributors Corporation (FDC), an affiliate of FMR, separate Distribution and Service Fees, each of which is based on an annual percentage of each class' average net assets. In addition, FDC may pay financial intermediaries for selling shares of the Fund and providing shareholder support services. For the period, the Distribution and Service Fee rates, total fees and amounts retained by FDC were as follows:
| Distribution
Fee | Service
Fee | Total
Fees | Retained
by FDC |
Class A | -% | .25% | $ 27,830 | $ 7,097 |
Class T | .25% | .25% | 12,334 | 6 |
Class B | .75% | .25% | 3,072 | 2,345 |
Class C | .75% | .25% | 10,828 | 4,607 |
| | | $ 54,064 | $ 14,055 |
Annual Report
5. Fees and Other Transactions with Affiliates - continued
Sales Load. FDC may receive a front-end sales charge of up to 5.75% for selling Class A shares, and 3.50% for selling Class T shares, some of which is paid to financial intermediaries for selling shares of the Fund. Depending on the holding period, FDC may receive contingent deferred sales charges levied on Class A, Class T, Class B, and Class C redemptions. The deferred sales charges range from 5% to 1% for Class B, 1% for Class C, 1.00% for certain purchases of Class A shares and .25% for certain purchases of Class T shares.
For the period, sales charge amounts retained by FDC were as follows:
| Retained
by FDC |
Class A | $ 12,873 |
Class T | 1,872 |
Class B* | 291 |
Class C* | 512 |
| $ 15,548 |
* When Class B and Class C shares are initially sold, FDC pays commissions from its own resources to financial intermediaries through which the sales are made.
Transfer Agent Fees. Fidelity Investments Institutional Operations Company, Inc. (FIIOC), an affiliate of FMR, is the transfer, dividend disbursing and shareholder servicing agent for each class of the Fund. FIIOC receives account fees and asset-based fees that vary according to the account size and type of account of the shareholders of the respective classes of the Fund. FIIOC pays for typesetting, printing and mailing of shareholder reports, except proxy statements. For the period, transfer agent fees for each class were as follows:
| Amount | % of
Average
Net Assets |
Class A | $ 33,823 | .30 |
Class T | 7,470 | .30 |
Class B | 941 | .31 |
Class C | 3,295 | .30 |
Worldwide | 2,724,210 | .23 |
Institutional Class | 3,500 | .28 |
| $ 2,773,239 | |
Accounting and Security Lending Fees. Fidelity Service Company, Inc. (FSC), an affiliate of FMR, maintains the Fund's accounting records. The accounting fee is based on the level of average net assets for the month. Under a separate contract, FSC administers the security lending program. The security lending fee is based on the number and duration of lending transactions.
Brokerage Commissions. The Fund placed a portion of its portfolio transactions with brokerage firms which are affiliates of the investment adviser. The commissions paid to these affiliated firms were $92,473 for the period.
6. Committed Line of Credit.
The Fund participates with other funds managed by FMR or an affiliate in a $4.0 billion credit facility (the "line of credit") to be utilized for temporary or emergency purposes to fund shareholder redemptions or for other short-term liquidity purposes. The Fund has agreed to pay commitment fees on its pro-rata portion of the line of credit, which amounted to $3,661 and is reflected in Miscellaneous expenses on the Statement of Operations. During the period, there were no borrowings on this line of credit.
7. Security Lending.
The Fund lends portfolio securities through a lending agent from time to time in order to earn additional income. For equity securities, a lending agent is used and may loan securities to certain qualified borrowers, including Fidelity Capital Markets (FCM), a broker-dealer affiliated with the Fund. On the settlement date of the loan, the Fund receives collateral (in the form of U.S. Treasury obligations, letters of credit and/or cash) against the loaned securities and maintains collateral in an amount not less than 100% of the market value of the loaned securities during the period of the loan. The market value of the loaned securities is determined at the close of business of the Fund and any additional required collateral is delivered to the Fund on the next business day. If the borrower defaults on its obligation to return the securities loaned because of insolvency or other reasons, a fund could experience delays and costs in recovering the securities loaned or in gaining access to the collateral. Any cash collateral received is invested in the Fidelity Securities Lending Cash Central Fund. The value of loaned securities and cash collateral at period end are disclosed on the Fund's Statement
Annual Report
Notes to Financial Statements - continued
7. Security Lending - continued
of Assets and Liabilities. Security lending income represents the income earned on investing cash collateral, less rebates paid to borrowers, and any lending agent fees associated with the loan, plus any premium payments received for lending certain types of securities. Security lending income is presented in the Statement of Operations as a component of income from Fidelity Central Funds. Total security lending income during the period amounted to $199,692. During the period, there were no securities loaned to FCM.
8. Expense Reductions.
FMR voluntarily agreed to reimburse a portion of its management fee. For the period, the amount of this reimbursement was $51,129.
Many of the brokers with whom FMR places trades on behalf of the Fund provided services to the Fund in addition to trade execution. These services included payments of certain expenses on behalf of the Fund totaling $306,388 for the period.
9. Distributions to Shareholders.
Distributions to shareholders of each class were as follows:
Years ended October 31, | 2011 | 2010 |
From net investment income | | |
Class A | $ 36,687 | $ 9,814 |
Class T | 3,024 | 2,409 |
Class B | - | 75 |
Class C | - | 827 |
Worldwide | 6,199,611 | 6,404,601 |
Institutional Class | 4,819 | 2,241 |
Total | $ 6,244,141 | $ 6,419,967 |
From net realized gain | | |
Class A | $ 20,664 | $ 1,404 |
Class T | 3,280 | 480 |
Class B | - | 191 |
Class C | - | 373 |
Worldwide | 2,844,643 | 990,471 |
Institutional Class | 1,932 | 294 |
Total | $ 2,870,519 | $ 993,213 |
10. Share Transactions.
Transactions for each class of shares were as follows:
| Shares | Dollars |
Years ended October 31, | 2011 | 2010 | 2011 | 2010 |
Class A | | | | |
Shares sold | 446,295 | 404,777 | $ 8,440,354 | $ 6,463,954 |
Reinvestment of distributions | 2,409 | 589 | 44,007 | 9,399 |
Shares redeemed | (143,732) | (41,328) | (2,654,718) | (668,935) |
Net increase (decrease) | 304,972 | 364,038 | $ 5,829,643 | $ 5,804,418 |
Class T | | | | |
Shares sold | 307,740 | 57,729 | $ 5,853,479 | $ 930,150 |
Reinvestment of distributions | 344 | 156 | 6,293 | 2,498 |
Shares redeemed | (249,620) | (24,377) | (4,835,753) | (385,540) |
Net increase (decrease) | 58,464 | 33,508 | $ 1,024,019 | $ 547,108 |
Class B | | | | |
Shares sold | 3,768 | 11,168 | $ 71,519 | $ 177,092 |
Reinvestment of distributions | - | 16 | - | 260 |
Shares redeemed | (6,939) | (8,709) | (128,598) | (138,098) |
Net increase (decrease) | (3,171) | 2,475 | $ (57,079) | $ 39,254 |
Annual Report
10. Share Transactions - continued
| Shares | Dollars |
Years ended October 31, | 2011 | 2010 | 2011 | 2010 |
Class C | | | | |
Shares sold | 41,472 | 34,028 | $ 784,669 | $ 543,674 |
Reinvestment of distributions | - | 68 | - | 1,087 |
Shares redeemed | (9,227) | (15,747) | (167,760) | (246,126) |
Net increase (decrease) | 32,245 | 18,349 | $ 616,909 | $ 298,635 |
Worldwide | | | | |
Shares sold | 12,255,493 | 8,421,228 | $ 231,984,939 | $ 135,177,567 |
Reinvestment of distributions | 480,262 | 449,494 | 8,805,760 | 7,194,622 |
Shares redeemed | (12,736,797) | (13,209,138) | (238,335,100) | (210,537,866) |
Net increase (decrease) | (1,042) | (4,338,416) | $ 2,455,599 | $ (68,165,677) |
Institutional Class | | | | |
Shares sold | 162,911 | 9,920 | $ 2,875,496 | $ 162,697 |
Reinvestment of distributions | 360 | 158 | 6,581 | 2,535 |
Shares redeemed | (10,647) | (10,397) | (193,044) | (165,950) |
Net increase (decrease) | 152,624 | (319) | $ 2,689,033 | $ (718) |
11. Other.
The Fund's organizational documents provide former and current trustees and officers with a limited indemnification against liabilities arising in connection with the performance of their duties to the Fund. In the normal course of business, the Fund may also enter into contracts that provide general indemnifications. The Fund's maximum exposure under these arrangements is unknown as this would be dependent on future claims that may be made against the Fund. The risk of material loss from such claims is considered remote.
Annual Report
Report of Independent Registered Public Accounting Firm
To the Trustees of Fidelity Investment Trust and Shareholders of Fidelity Worldwide Fund:
We have audited the accompanying statement of assets and liabilities of Fidelity Worldwide Fund (the Fund), a fund of Fidelity Investment Trust, including the schedule of investments, as of October 31, 2011, and the related statement of operations for the year then ended, the statement of changes in net assets for each of the two years in the period then ended, and the financial highlights for each of the five years in the period then ended. These financial statements and financial highlights are the responsibility of the Fund's management. Our responsibility is to express an opinion on these financial statements and financial highlights based on our audits.
We conducted our audits in accordance with the standards of the Public Company Accounting Oversight Board (United States). Those standards require that we plan and perform the audit to obtain reasonable assurance about whether the financial statements and financial highlights are free of material misstatement. The Fund is not required to have, nor were we engaged to perform, an audit of its internal control over financial reporting. Our audits included consideration of internal control over financial reporting as a basis for designing audit procedures that are appropriate in the circumstances, but not for the purpose of expressing an opinion on the effectiveness of the Fund's internal control over financial reporting. Accordingly, we express no such opinion. An audit also includes examining, on a test basis, evidence supporting the amounts and disclosures in the financial statements, assessing the accounting principles used and significant estimates made by management, as well as evaluating the overall financial statement presentation. Our procedures included confirmation of securities owned as of October 31, 2011, by correspondence with the custodians and brokers; where replies were not received from brokers, we performed other auditing procedures. We believe that our audits provide a reasonable basis for our opinion.
In our opinion, the financial statements and financial highlights referred to above present fairly, in all material respects, the financial position of Fidelity Worldwide Fund as of October 31, 2011, the results of its operations for the year then ended, the changes in its net assets for each of the two years in the period then ended, and the financial highlights for each of the five years in the period then ended, in conformity with accounting principles generally accepted in the United States of America.
DELOITTE & TOUCHE LLP
Boston, Massachusetts
December 16, 2011
Annual Report
The Trustees, Members of the Advisory Board, and executive officers of the trust and fund, as applicable, are listed below. The Board of Trustees governs the fund and is responsible for protecting the interests of shareholders. The Trustees are experienced executives who meet periodically throughout the year to oversee the fund's activities, review contractual arrangements with companies that provide services to the fund, oversee management of the risks associated with such activities and contractual arrangements, and review the fund's performance. Except for James C. Curvey, each of the Trustees oversees 226 funds advised by FMR or an affiliate. Mr. Curvey oversees 429 funds advised by FMR or an affiliate.
The Trustees hold office without limit in time except that (a) any Trustee may resign; (b) any Trustee may be removed by written instrument, signed by at least two-thirds of the number of Trustees prior to such removal; (c) any Trustee who requests to be retired or who has become incapacitated by illness or injury may be retired by written instrument signed by a majority of the other Trustees; and (d) any Trustee may be removed at any special meeting of shareholders by a two-thirds vote of the outstanding voting securities of the trust. Each Trustee who is not an interested person (as defined in the 1940 Act) (Independent Trustee), shall retire not later than the last day of the calendar year in which his or her 75th birthday occurs. The Independent Trustees may waive this mandatory retirement age policy with respect to individual Trustees. The executive officers and Advisory Board Members hold office without limit in time, except that any officer and Advisory Board Member may resign or may be removed by a vote of a majority of the Trustees at any regular meeting or any special meeting of the Trustees. Except as indicated, each individual has held the office shown or other offices in the same company for the past five years.
Experience, Skills, Attributes, and Qualifications of the Fund's Trustees. The Governance and Nominating Committee has adopted a statement of policy that describes the experience, qualifications, attributes, and skills that are necessary and desirable for potential Independent Trustee candidates (Statement of Policy). The Board believes that each Trustee satisfied at the time he or she was initially elected or appointed a Trustee, and continues to satisfy, the standards contemplated by the Statement of Policy. The Governance and Nominating Committee also engages professional search firms to help identify potential Independent Trustee candidates who have the experience, qualifications, attributes, and skills consistent with the Statement of Policy. From time to time, additional criteria based on the composition and skills of the current Independent Trustees, as well as experience or skills that may be appropriate in light of future changes to board composition, business conditions, and regulatory or other developments, have also been considered by the professional search firms and the Governance and Nominating Committee. In addition, the Board takes into account the Trustees' commitment and participation in Board and committee meetings, as well as their leadership of standing and ad hoc committees throughout their tenure.
In determining that a particular Trustee was and continues to be qualified to serve as a Trustee, the Board has considered a variety of criteria, none of which, in isolation, was controlling. The Board believes that, collectively, the Trustees have balanced and diverse experience, qualifications, attributes, and skills, which allow the Board to operate effectively in governing the fund and protecting the interests of shareholders. Information about the specific experience, skills, attributes, and qualifications of each Trustee, which in each case led to the Board's conclusion that the Trustee should serve (or continue to serve) as a trustee of the fund, is provided below.
Board Structure and Oversight Function. James C. Curvey is an interested person (as defined in the 1940 Act) and currently serves as Acting Chairman. The Trustees have determined that an interested Chairman is appropriate and benefits shareholders because an interested Chairman has a personal and professional stake in the quality and continuity of services provided to the fund. Independent Trustees exercise their informed business judgment to appoint an individual of their choosing to serve as Chairman, regardless of whether the Trustee happens to be independent or a member of management. The Independent Trustees have determined that they can act independently and effectively without having an Independent Trustee serve as Chairman and that a key structural component for assuring that they are in a position to do so is for the Independent Trustees to constitute a substantial majority for the Board. The Independent Trustees also regularly meet in executive session. Ned C. Lautenbach serves as Chairman of the Independent Trustees and as such (i) acts as a liaison between the Independent Trustees and management with respect to matters important to the Independent Trustees and (ii) with management prepares agendas for Board meetings.
Fidelity funds are overseen by different Boards of Trustees. The fund's Board oversees Fidelity's equity and high income funds and another Board oversees Fidelity's investment-grade bond, money market, and asset allocation funds. The asset allocation funds may invest in Fidelity funds overseen by the fund's Board. The use of separate Boards, each with its own committee structure, allows the Trustees of each group of Fidelity funds to focus on the unique issues of the funds they oversee, including common research, investment, and operational issues. On occasion, the separate Boards establish joint committees to address issues of overlapping consequences for the Fidelity funds overseen by each Board.
The Trustees operate using a system of committees to facilitate the timely and efficient consideration of all matters of importance to the Trustees, the fund, and fund shareholders and to facilitate compliance with legal and regulatory requirements and oversight of the fund's activities and associated risks. The Board, acting through its committees, has charged FMR and its affiliates with (i) identifying events or circumstances the occurrence of which could have demonstrably adverse effects on the fund's business and/or reputation; (ii) implementing processes and controls to lessen the possibility that such events or circumstances occur or to mitigate the effects of such events or circumstances if they do occur; and (iii) creating and maintaining a system designed to evaluate continuously business and market conditions in order to facilitate the identification and implementation processes described in (i) and (ii) above. Because the day-to-day operations and activities of the fund are carried out by or through FMR, its affiliates and other service providers, the fund's exposure to risks is mitigated but not eliminated by the processes overseen by the Trustees. While each of the Board's committees has responsibility for overseeing different aspects of the fund's activities, oversight is exercised primarily through the Operations, Audit, and Compliance Committees. In addition, the Independent Trustees have worked with FMR to enhance the Board's oversight of investment and financial risks, legal and regulatory risks, technology risks, and operational risks, including the development of additional risk reporting to the Board. For example, a working group comprised of Independent Trustees and FMR has worked and continues to work to review the Fidelity funds' valuation-related activities, reporting and risk management. Appropriate personnel, including but not limited to the fund's Chief Compliance Officer (CCO), FMR's internal auditor, the independent accountants, the fund's Treasurer and portfolio management personnel, make periodic reports to the Board's committees, as appropriate, including an annual review of FMR's risk management program for the Fidelity funds. The responsibilities of each standing committee, including their oversight responsibilities, are described further under "Standing Committees of the Fund's Trustees."
Annual Report
Trustees and Officers - continued
The fund's Statement of Additional Information (SAI) includes more information about the Trustees. To request a free copy, call Fidelity at 1-877-208-0098.
Interested Trustees*:
Correspondence intended for each Trustee who is an interested person may be sent to Fidelity Investments, 82 Devonshire Street, Boston, Massachusetts 02109.
Name, Age; Principal Occupations and Other Relevant Experience+ |
James C. Curvey (76) |
| Year of Election or Appointment: 2007 Mr. Curvey is Trustee and Acting Chairman of the Board of Trustees of certain Trusts. Mr. Curvey also serves as Trustee (2007-present) of other investment companies advised by FMR. Mr. Curvey is a Director of Fidelity Investments Money Management, Inc. (2009-present), Director of Fidelity Research & Analysis Co. (2009-present) and Director of FMR and FMR Co., Inc. (2007-present). Mr. Curvey is also Vice Chairman (2007-present) and Director of FMR LLC. In addition, Mr. Curvey serves as an Overseer for the Boston Symphony Orchestra and a member of the Trustees of Villanova University. Previously, Mr. Curvey was the Vice Chairman (2006-2007) and Director (2000-2007) of FMR Corp. |
Ronald P. O'Hanley (54) |
| Year of Election or Appointment: 2011 Mr. O'Hanley is Director of FMR Co., Inc. (2010-present), Director of Fidelity Investments Money Management, Inc. (2010-present), Director of Fidelity Research & Analysis Company (2010-present), President of Fidelity Asset Management and Corporate Services and a member of Fidelity's Executive Committee (2010-present). Previously, Mr. O'Hanley served as President and Chief Executive Officer of BNY Mellon Asset Management (2007-2010). Mr. O'Hanley also served as Vice Chairman of Bank New York Mellon Corp. and a member of that firm's Executive Committee. Prior to the 2007 merger of The Bank of New York and Mellon Financial Corporation, he was Vice Chairman of Mellon Financial Corporation and President and Chief Executive Officer of Mellon Asset Management. He joined Mellon in February 1997. Mr. O'Hanley currently serves as Chairman of the Boston Public Library Foundation Board of Directors and sits on the Board of Directors of Beth Israel Deaconess Medical Center, the Board of Trustees of the Marine Biological Laboratory and the Advisory Board of the Maxwell School of Citizenship and Public Administration at Syracuse University. Mr. O'Hanley also chairs the Council on Asset Management for the Financial Services Roundtable and is a member of the Board of Directors of Institutional Investor's U.S. Institute. |
* Trustees have been determined to be "Interested Trustees" by virtue of, among other things, their affiliation with the trust or various entities under common control with FMR.
+ The information above includes each Trustee's principal occupation during the last five years and other information relating to the experience, attributes, and skills relevant to each Trustee's qualifications to serve as a Trustee, which led to the conclusion that each Trustee should serve as a Trustee for the fund.
Independent Trustees:
Correspondence intended for each Independent Trustee (that is, the Trustees other than the Interested Trustees) may be sent to Fidelity Investments, P.O. Box 55235, Boston, Massachusetts 02205-5235.
Name, Age; Principal Occupations and Other Relevant Experience+ |
Dennis J. Dirks (63) |
| Year of Election or Appointment: 2005 Prior to his retirement in May 2003, Mr. Dirks was Chief Operating Officer and a member of the Board of The Depository Trust & Clearing Corporation (DTCC). He also served as President, Chief Operating Officer, and Board member of The Depository Trust Company (DTC) and President and Board member of the National Securities Clearing Corporation (NSCC). In addition, Mr. Dirks served as Chief Executive Officer and Board member of the Government Securities Clearing Corporation, Chief Executive Officer and Board member of the Mortgage-Backed Securities Clearing Corporation, as a Trustee and a member of the Finance Committee of Manhattan College (2005-2008), and as a Trustee and a member of the Finance Committee of AHRC of Nassau County (2006-2008). Mr. Dirks is a member of the Independent Directors Council (IDC) Governing Council (2010-Present) and Board of Directors for The Brookville Center for Children's Services, Inc. (2009-present). |
Alan J. Lacy (58) |
| Year of Election or Appointment: 2008 Mr. Lacy serves as Senior Adviser (2007-present) of Oak Hill Capital Partners, L.P. (private equity). Mr. Lacy also served as Chief Executive Officer (2000-2005) and Vice Chairman (2005-2006) of Sears Holdings Corporation and Sears, Roebuck and Co. (retail). In addition, Mr. Lacy serves as a member of the Board of Directors of Dave & Buster's, Inc. (restaurant and entertainment complexes, 2010-present), The Hillman Companies, Inc. (hardware wholesalers, 2010-present), and Bristol-Myers Squibb Company (global pharmaceuticals, 2007-present). Mr. Lacy is a member of the Board of Trustees of The National Parks Conservation Association (2006-Present). Previously, Mr. Lacy served as Chairman of the Board of Trustees of the National Parks Conservation Association (2008-2011) and as a member of the Board of Directors for the Western Union Company (global money transfer, 2006-2011). |
Ned C. Lautenbach (67) |
| Year of Election or Appointment: 2000 Mr. Lautenbach is Chairman of the Independent Trustees of the Equity and High Income Funds (2006-present). Mr. Lautenbach currently serves as the Lead Director of the Eaton Corporation Board of Directors (diversified industrial, 1997-present). Mr. Lautenbach is also a member of the Board of Directors of the Philharmonic Center for the Arts in Naples, Florida (1999-present); a member of the Board of Trustees of Fairfield University (2005-present); and a member of the Council on Foreign Relations (1994-present). Previously, Mr. Lautenbach was a Partner/Advisory Partner at Clayton, Dubilier & Rice, LLC (private equity investment, 1998-2010), as well as a Director of Sony Corporation (2006-2007). |
Joseph Mauriello (67) |
| Year of Election or Appointment: 2008 Prior to his retirement in January 2006, Mr. Mauriello served in numerous senior management positions including Deputy Chairman and Chief Operating Officer (2004-2005), and Vice Chairman of Financial Services (2002-2004) of KPMG LLP US (professional services, 1965-2005). Mr. Mauriello currently serves as a member of the Board of Directors of XL Group plc. (global insurance and re-insurance, 2006-present) and of Arcadia Resources Inc. (health care services and products, 2007-present). Previously, Mr. Mauriello served as a Director of the Hamilton Funds of the Bank of New York (2006-2007). |
Robert W. Selander (61) |
| Year of Election or Appointment: 2011 Previously, Mr. Selander served as a Member of the Advisory Board of Fidelity's Equity and High Income Funds (2011), Executive Vice Chairman (2010), Chief Executive Officer (2009-2010), and President and Chief Executive Officer (1997-2009) of Mastercard, Inc. |
Cornelia M. Small (67) |
| Year of Election or Appointment: 2005 Ms. Small is a member of the Board of Directors of the Teagle Foundation (2009-present). Ms. Small is also a member of the Investment Committee, and Chair (2008-present) and a member of the Board of Trustees of Smith College. In addition, Ms. Small serves on the Investment Committee of the Berkshire Taconic Community Foundation (2008-present). Previously, Ms. Small served as Chairperson of the Investment Committee (2002-2008) of Smith College. In addition, Ms. Small served as Chief Investment Officer, Director of Global Equity Investments, and a member of the Board of Directors of Scudder, Stevens & Clark and Scudder Kemper Investments. |
William S. Stavropoulos (72) |
| Year of Election or Appointment: 2001 Mr. Stavropoulos is Vice Chairman of the Independent Trustees of the Equity and High Income Funds (2006-present). Mr. Stavropoulos serves as President and Founder of the Michigan Baseball Foundation, the Great Lakes Loons (2007-present). Mr. Stavropoulos is Chairman Emeritus of the Board of Directors of The Dow Chemical Company, where he previously served in numerous senior management positions, including President, CEO (1995-2000; 2002-2004), Chairman of the Executive Committee (2000-2006), and as a member of the Board of Directors (1990-2006). Currently, Mr. Stavropoulos is Chairman of Univar (global distributor of commodity and specialty chemicals, 2010-present), a Director of Teradata Corporation (data warehousing and technology solutions, 2008-present), Chemical Financial Corporation, Maersk Inc. (industrial conglomerate), Tyco International, Inc. (multinational manufacturing and services, 2007-present), and a member of the Advisory Board for Metalmark Capital (private equity investment, 2005-present). Mr. Stavropoulos is a special advisor to Clayton, Dubilier & Rice, LLC (private equity investment). In addition, Mr. Stavropoulos is a member of the University of Notre Dame Advisory Council for the College of Science. |
David M. Thomas (62) |
| Year of Election or Appointment: 2008 Previously, Mr. Thomas served as Executive Chairman (2005-2006) and Chairman and Chief Executive Officer (2000-2005) of IMS Health, Inc. (pharmaceutical and healthcare information solutions). In addition, Mr. Thomas serves as a member of the Board of Directors of Fortune Brands, Inc. (consumer products), and Interpublic Group of Companies, Inc. (marketing communication, 2004-present). |
Michael E. Wiley (61) |
| Year of Election or Appointment: 2008 Mr. Wiley also serves as a Director of Asia Pacific Exploration Consolidated (international oil and gas exploration and production, 2008-present). Mr. Wiley serves as a Director of Tesoro Corporation (independent oil refiner and marketer, 2005-present), and a Director of Bill Barrett Corporation (exploration and production, 2005-present). In addition, Mr. Wiley also serves as a Director of Post Oak Bank (privately-held bank, 2004-present). Previously, Mr. Wiley served as a member of the Board of Trustees of the University of Tulsa (2000-2006; 2007-2010), as a Senior Energy Advisor of Katzenbach Partners, LLC (consulting, 2006-2007), as an Advisory Director of Riverstone Holdings (private investment), Chairman, President, and CEO of Baker Hughes, Inc. (oilfield services, 2000-2004), and as Director of Spinnaker Exploration Company (exploration and production, 2001-2005). |
+ The information above includes each Trustee's principal occupation during the last five years and other information relating to the experience, attributes, and skills relevant to each Trustee's qualifications to serve as a Trustee, which led to the conclusion that each Trustee should serve as a Trustee for the fund.
Advisory Board Members and Executive Officers:
Correspondence intended for each executive officer, Edward C. Johnson 3d, and Peter S. Lynch may be sent to Fidelity Investments, 82 Devonshire Street, Boston, Massachusetts 02109.
Name, Age; Principal Occupation |
Edward C. Johnson 3d (81) |
| Year of Election or Appointment: 2011 Member of the Advisory Board of Fidelity's Equity and High Income Funds. Mr. Johnson serves as Chief Executive Officer, Chairman, and a Director of FMR LLC, and also serves as Chairman and Director of FIL Limited. Previously, Mr. Johnson served as a Trustee and Chairman of the Board of certain Fidelity Trusts, Chairman and a Director of FMR, Chairman and a Director of FMR Co., Inc., and President of FMR LLC (2006-2007). |
Peter S. Lynch (67) |
| Year of Election or Appointment: 2003 Member of the Advisory Board of Fidelity's Equity and High Income Funds. Mr. Lynch is Vice Chairman and a Director of FMR and FMR Co., Inc. In addition, Mr. Lynch serves as a Trustee of Boston College and as the Chairman of the Inner-City Scholarship Fund. Previously, Mr. Lynch served on the Special Olympics International Board of Directors (1997-2006). |
Kenneth B. Robins (42) |
| Year of Election or Appointment: 2008 President and Treasurer of Fidelity's Equity and High Income Funds. Mr. Robins also serves as President and Treasurer (2010-present) and Assistant Treasurer (2009-present) of other Fidelity funds and is an employee of Fidelity Investments (2004-present). Previously, Mr. Robins served as Deputy Treasurer of the Fidelity funds (2005-2008) and Treasurer and Chief Financial Officer of The North Carolina Capital Management Trust: Cash and Term Portfolios (2006-2008). |
Bruce T. Herring (46) |
| Year of Election or Appointment: 2006 Vice President of certain Equity Funds. Mr. Herring also serves as Chief Investment Officer and Director of Fidelity Management & Research (U.K.) Inc. (2010-present) and Group Chief Investments Officer of FMR. Previously, Mr. Herring served as Vice President (2005-2006) and Senior Vice President (2006-2007) of Fidelity Management & Research Company, Vice President of FMR Co., Inc. (2001-2007) and as a portfolio manager for Fidelity U.S. Equity Funds. |
Brian B. Hogan (47) |
| Year of Election or Appointment: 2009 Vice President of Equity and High Income Funds. Mr. Hogan also serves as President of FMR's Equity Division (2009-present). Previously, Mr. Hogan served as Senior Vice President, Equity Research of FMR (2006-2009) and as a portfolio manager. |
Scott C. Goebel (43) |
| Year of Election or Appointment: 2008 Secretary and Chief Legal Officer (CLO) of the Fidelity funds. Mr. Goebel also serves as Secretary of Fidelity Investments Money Management, Inc. (FIMM) (2010-present) and Fidelity Research and Analysis Company (FRAC) (2010-present); Secretary and CLO of The North Carolina Capital Management Trust: Cash and Term Portfolios (2008-present); General Counsel, Secretary, and Senior Vice President of FMR (2008-present) and FMR Co., Inc. (2008-present); employed by FMR LLC or an affiliate (2001-present); Chief Legal Officer of Fidelity Management & Research (Hong Kong) Limited (2008-present) and Assistant Secretary of Fidelity Management & Research (Japan) Inc. (2008-present), and Fidelity Management & Research (U.K.) Inc. (2008-present). Previously, Mr. Goebel served as Assistant Secretary of FIMM (2008-2010), FRAC (2008-2010), and the Funds (2007-2008) and as Vice President and Secretary of Fidelity Distributors Corporation (FDC) (2005-2007). |
William C. Coffey (42) |
| Year of Election or Appointment: 2009 Assistant Secretary of Fidelity's Equity and High Income Funds. Mr. Coffey also serves as Senior Vice President and Deputy General Counsel of FMR LLC (2010-present), and is an employee of Fidelity Investments. Previously, Mr. Coffey served as Vice President and Associate General Counsel of FMR LLC (2005-2009). |
Holly C. Laurent (57) |
| Year of Election or Appointment: 2008 Anti-Money Laundering (AML) Officer of the Fidelity funds. Ms. Laurent also serves as AML Officer of The North Carolina Capital Management Trust: Cash and Term Portfolios (2008-present) and is an employee of Fidelity Investments. Previously, Ms. Laurent was Senior Vice President and Head of Legal for Fidelity Business Services India Pvt. Ltd. (2006-2008), and Senior Vice President, Deputy General Counsel and Group Head for FMR LLC (2005-2006). |
Christine Reynolds (53) |
| Year of Election or Appointment: 2008 Chief Financial Officer of the Fidelity funds. Ms. Reynolds became President of Fidelity Pricing and Cash Management Services (FPCMS) in August 2008. Ms. Reynolds served as Chief Operating Officer of FPCMS (2007-2008). Previously, Ms. Reynolds served as President, Treasurer, and Anti-Money Laundering officer of the Fidelity funds (2004-2007). |
Kenneth A. Rathgeber (64) |
| Year of Election or Appointment: 2004 Chief Compliance Officer of Fidelity's Equity and High Income Funds. Mr. Rathgeber is Chief Compliance Officer of Fidelity Management & Research (Hong Kong) Limited (2008-present), Fidelity Management & Research (Japan) Inc. (2008-present), FMR (2005-present), FMR Co., Inc. (2005-present), Fidelity Management & Research (U.K.) Inc. (2005-present), Fidelity Research & Analysis Company (2005-present), Fidelity Investments Money Management, Inc. (2005-present), Pyramis Global Advisors, LLC (2005-present), and Strategic Advisers, Inc. (2005-present). |
Jeffrey S. Christian (50) |
| Year of Election or Appointment: 2009 Deputy Treasurer of the Fidelity funds. Mr. Christian is an employee of Fidelity Investments. Previously, Mr. Christian served as Chief Financial Officer (2008-2009) of certain Fidelity funds and Senior Vice President of Fidelity Pricing and Cash Management Services (FPCMS) (2004-2009). |
Joseph F. Zambello (54) |
| Year of Election or Appointment: 2011 Deputy Treasurer of the Fidelity funds. Mr. Zambello is an employee of Fidelity Investments. Previously, Mr. Zambello served as Vice President of FMR's Program Management Group (2009-2011) and Vice President of the Transfer Agent Oversight Group (2005-2009). |
Adrien E. Deberghes (44) |
| Year of Election or Appointment: 2008 Deputy Treasurer of Fidelity's Equity and High Income Funds. Mr. Deberghes also serves as Vice President and Assistant Treasurer of Fidelity Rutland Square Trust II and Fidelity Commonwealth Trust II (2011-present), Assistant Treasurer of other Fidelity funds (2010-present), and is an employee of Fidelity Investments (2008-present). Previously, Mr. Deberghes served as Senior Vice President of Mutual Fund Administration at State Street Corporation (2007-2008), Senior Director of Mutual Fund Administration at Investors Bank & Trust (2005-2007), and Director of Finance for Dunkin' Brands (2000-2005). |
Stephanie J. Dorsey (42) |
| Year of Election or Appointment: 2010 Assistant Treasurer of Fidelity's Equity and High Income Funds. Ms. Dorsey also serves as Deputy Treasurer of other Fidelity funds (2008-present) and is an employee of Fidelity Investments (2008-present). Previously, Ms. Dorsey served as Treasurer (2004-2008) of the JPMorgan Mutual Funds and Vice President (2004-2008) of JPMorgan Chase Bank. |
John R. Hebble (53) |
| Year of Election or Appointment: 2009 Assistant Treasurer of Fidelity's Equity and High Income Funds. Mr. Hebble also serves as President (2011-present), Treasurer, and Chief Financial Officer of The North Carolina Capital Management Trust: Cash and Term Portfolios (2008-present), President and Treasurer of other Fidelity funds (2008-present) and is an employee of Fidelity Investments. |
Gary W. Ryan (53) |
| Year of Election or Appointment: 2005 Assistant Treasurer of the Fidelity funds. Mr. Ryan is an employee of Fidelity Investments. Previously, Mr. Ryan served as Vice President of Fund Reporting in Fidelity Pricing and Cash Management Services (FPCMS) (1999-2005). |
Jonathan Davis (43) |
| Year of Election or Appointment: 2010 Assistant Treasurer of the Fidelity funds. Mr. Davis is also Assistant Treasurer of Fidelity Rutland Square Trust II and Fidelity Commonwealth Trust II. Mr. Davis is an employee of Fidelity Investments. Previously, Mr. Davis served as Vice President and Associate General Counsel of FMR LLC (2003-2010). |
Annual Report
Class A designates 49% and 64%; Class T designates 74% and 64% of the dividends distributed on December 3, 2010 and December 30, 2010, respectively, during the fiscal year as qualifying for the dividends-received deduction for corporate shareholders.
Class A and Class T designate 100% of the dividends distributed during the fiscal year as amounts which may be taken into account as a dividend for purposes of the maximum rate under section 1(h)(11) of the Internal Revenue Code.
The amounts per share which represent income derived from sources within, and taxes paid to, foreign countries or possessions of the United States are as follows:
| Pay Date | Income | Taxes |
Class A | 12/06/10 | $0.099 | $0.0105 |
Class A | 12/31/10 | $0.019 | $0.0000 |
Class T | 12/06/10 | $0.066 | $0.0105 |
Class T | 12/31/10 | $0.019 | $0.0000 |
Class B | 12/06/10 | $0.000 | $0.0000 |
Class B | 12/31/10 | $0.000 | $0.0000 |
Class C | 12/06/10 | $0.000 | $0.0000 |
Class C | 12/31/10 | $0.000 | $0.0000 |
The fund will notify shareholders in January 2012 of amounts for use in preparing 2011 income tax returns.
Annual Report
Board Approval of Investment Advisory Contracts and Management Fees
Fidelity Worldwide Fund
Each year, the Board of Trustees, including the Independent Trustees (together, the Board), votes on the renewal of the management contract and sub-advisory agreements (together, the Advisory Contracts) for the fund. The Board, assisted by the advice of fund counsel and Independent Trustees' counsel, requests and considers a broad range of information relevant to the renewal of the Advisory Contracts throughout the year.
The Board meets regularly and considers at each of its meetings factors that are relevant to its annual consideration of the renewal of the fund's Advisory Contracts, including the services and support provided to the fund and its shareholders. The Board has established various standing committees, each composed of Independent Trustees with varying backgrounds, to which the Board has assigned specific subject matter responsibilities in order to enhance effective decision-making by the Board. The Board, acting directly and through its Committees, requests and receives information concerning the annual consideration of the renewal of the fund's Advisory Contracts. The Board also meets as needed to consider matters specifically related to the Board's annual consideration of the renewal of Advisory Contracts. Members of the Board may also meet with trustees of other Fidelity funds through ad hoc joint committees to discuss certain matters relevant to the Fidelity funds.
At its July 2011 meeting, the Board of Trustees, including the Independent Trustees, unanimously determined to renew the fund's Advisory Contracts. In reaching its determination, the Board considered all factors it believed relevant, including (i) the nature, extent, and quality of the services to be provided to the fund and its shareholders (including the investment performance of the fund); (ii) the competitiveness of the fund's management fee and total expense ratio; (iii) the total costs of the services to be provided by and the profits to be realized by Fidelity from its relationship with the fund; (iv) the extent to which economies of scale would be realized as the fund grows; and (v) whether fee levels reflect these economies of scale, if any, for the benefit of fund shareholders.
In considering whether to renew the Advisory Contracts for the fund, the Board reached a determination, with the assistance of fund counsel and Independent Trustees' counsel and through the exercise of its business judgment, that the renewal of the Advisory Contracts is in the best interests of the fund and its shareholders and that the compensation payable under the Advisory Contracts is fair and reasonable. The Board's decision to renew the Advisory Contracts was not based on any single factor, but rather was based on a comprehensive consideration of all the information provided to the Board at its meetings throughout the year. The Board, in reaching its determination to renew the Advisory Contracts, is aware that shareholders in the fund have a broad range of investment choices available to them, including a wide choice among mutual funds offered by Fidelity's competitors, and that the fund's shareholders, who have the opportunity to review and weigh the disclosure provided by the fund in its prospectus and other public disclosures, have chosen to invest in this fund, managed by Fidelity.
Nature, Extent, and Quality of Services Provided. The Board considered the staffing within the investment adviser, FMR, and the sub-advisers (together, the Investment Advisers), including the backgrounds of the fund's investment personnel and the fund's investment objective and discipline. The Independent Trustees also had discussions with senior management of Fidelity's investment operations and investment groups. The Board considered the structure of the portfolio manager compensation program and whether this structure provides appropriate incentives to act in the best interests of the fund.
Resources Dedicated to Investment Management and Support Services. The Board and the Fund Oversight and Research Committees reviewed the general qualifications and capabilities of the Investment Advisers' investment staff, including its size, education, experience, and resources, as well as the Investment Advisers' approach to recruiting, training, managing, and compensating investment personnel. The Board also noted that FMR has devoted increased resources to non-U.S. offices. The Board noted that Fidelity's analysts have extensive resources, tools and capabilities which allow them to conduct sophisticated quantitative and fundamental analysis, as well as credit analysis of issuers, counterparties and enhancers. The Board also believes that Fidelity's investment professionals have sufficient access to global information and data so as to provide competitive investment results over time, and that those professionals also have access to sophisticated tools which permit them to assess portfolio construction and risk and performance attribution characteristics continuously, as well as to transmit new information and research conclusions rapidly around the world. Additionally, in their deliberations, the Board considered the Investment Advisers' trading capabilities and resources which are an integral part of the investment management process.
Shareholder and Administrative Services. The Board considered (i) the nature, extent, quality, and cost of advisory, administrative, and shareholder services performed by the Investment Advisers and their affiliates under the Advisory Contracts and under separate agreements covering transfer agency, pricing and bookkeeping, and securities lending services for the fund; (ii) the nature and extent of the investment adviser's supervision of third party service providers, principally custodians and subcustodians; and (iii) the resources devoted to, and the record of compliance with, the fund's compliance policies and procedures. The Board also reviewed the allocation of fund brokerage, including allocations to brokers affiliated with the Investment Advisers, the use of brokerage commissions to pay fund expenses, and the use of "soft" commission dollars to pay for research services.
The Board noted that the growth of fund assets over time across the complex allows Fidelity to reinvest in the development of services designed to enhance the value or convenience of the Fidelity funds as investment vehicles. These services include 24-hour access to account information and market information through telephone representatives and over the Internet, investor education materials and asset allocation tools, and the expanded availability of Fidelity Investor Centers, with 35 new branches opening since 2010.
Annual Report
Investment in a Large Fund Family. The Board considered the benefits to shareholders of investing in a Fidelity fund, including the benefits of investing in a fund that is part of a large family of funds offering a variety of investment disciplines and providing a large variety of mutual fund investor services. The Board noted that Fidelity had taken, or had made recommendations that resulted in the Fidelity funds taking, a number of actions over the previous year that benefited particular funds, including (i) continuing to dedicate additional resources to investment research and support of the senior management team that oversees asset management; (ii) rationalizing product lines through the mergers of six funds into other funds; (iii) continuing to migrate the Freedom Funds to dedicated lower cost underlying funds; (iv) obtaining shareholder approval to broaden the investment strategies for Fidelity Consumer Finance Portfolio, Fidelity Emerging Asia Fund, and Fidelity Environment and Alternative Energy Portfolio; (v) contractually agreeing to reduce the management fees and impose other expense limitations on Spartan 500 Index Fund and U.S. Bond Index Fund in connection with launching new institutional classes of these funds; (vi) changing the name, primary and supplemental benchmarks, and investment policies of Fidelity Global Strategies Fund to support the fund's flexible investment mandate and global orientation; and (vii) reducing the transfer agency account fee rates on certain accounts.
Investment Performance. The Board considered whether the fund has operated in accordance with its investment objective, as well as its record of compliance with its investment restrictions. It also reviewed the fund's absolute investment performance for each class, as well as the fund's relative investment performance for each class measured over multiple periods against (i) a broad-based securities market index, and (ii) a peer group of mutual funds deemed appropriate by Fidelity and reviewed by the Board. The following charts considered by the Board show, over the one-, three-, and five-year periods ended December 31, 2010, as available, the cumulative total returns of the retail class and Class B of the fund, the cumulative total returns of a broad-based securities market index ("benchmark"), and a range of cumulative total returns of a peer group of mutual funds identified by Morningstar, Inc. as having an investment style similar to that of the fund based on underlying portfolio holdings. The returns of the retail class and Class B show the performance of the highest performing class (based on five-year performance) and the lowest performing class (based on one-year performance), respectively. The box within each chart shows the 25th percentile return (bottom of box) and the 75th percentile return (top of box) of the peer group. Returns shown above the box are in the first quartile and returns shown below the box are in the fourth quartile. The percentage beaten numbers noted below each chart correspond to the percentile box and represent the percentage of funds in the peer group whose performance was equal to or lower than that of the class indicated.
Fidelity Worldwide Fund

The Board reviewed the fund's relative investment performance against its peer group and noted that the performance of the retail class of the fund was in the first quartile for the one-year period and the second quartile for the three- and five-year periods. The Board also noted that the investment performance of the retail class of the fund compared favorably to its benchmark for all the periods shown. The Board considered that the variations in performance among the fund's classes reflect the variations in class expenses, which result in lower performance for higher expense classes. The Board also reviewed the fund's performance since inception as well as performance in the current year.
The Board also considered that the fund's management fee is subject to upward or downward adjustment depending upon whether, and to what extent, the fund's investment performance for the performance period exceeds, or is exceeded by, the record (over the same period) of a Board-approved performance adjustment index. The Board noted that the performance adjustment provides FMR with a strong economic incentive to seek to achieve superior performance for the fund's shareholders and helps to more closely align the interests of FMR and the fund's shareholders.
Annual Report
Board Approval of Investment Advisory Contracts and Management Fees - continued
Based on its review, the Board concluded that the nature, extent, and quality of services provided to the fund under the Advisory Contracts should benefit the fund's shareholders.
Competitiveness of Management Fee and Total Expense Ratio. The Board considered the fund's management fee and total expense ratio compared to "mapped groups" of competitive funds and classes. Fidelity creates "mapped groups" by combining similar Lipper investment objective categories that have comparable management fee characteristics. Combining Lipper investment objective categories aids the Board's management fee and total expense ratio comparisons by broadening the competitive group used for comparison and by reducing the number of universes to which various Fidelity funds are compared.
Management Fee. The Board considered two proprietary management fee comparisons for the 12-month periods shown in the chart below. The group of Lipper funds used by the Board for management fee comparisons is referred to below as the "Total Mapped Group." The Total Mapped Group comparison focuses on a fund's standing relative to the total universe of comparable funds available to investors in terms of gross management fees before expense reimbursements or caps, and without giving effect to the fund's performance adjustment. "TMG %" represents the percentage of funds in the Total Mapped Group that had management fees that were lower than the fund's. For example, a TMG % of 16% means that 84% of the funds in the Total Mapped Group had higher management fees than the fund. The "Asset-Size Peer Group" (ASPG) comparison focuses on a fund's standing relative to non-Fidelity funds similar in size to the fund within the Total Mapped Group. The ASPG represents at least 15% of the funds in the Total Mapped Group with comparable asset size and management fee characteristics, subject to a minimum of 50 funds (or all funds in the Total Mapped Group if fewer than 50). Additional information, such as the ASPG quartile in which the fund's management fee ranked and the impact of the fund's performance adjustment, is also included in the chart and considered by the Board.
Fidelity Worldwide Fund
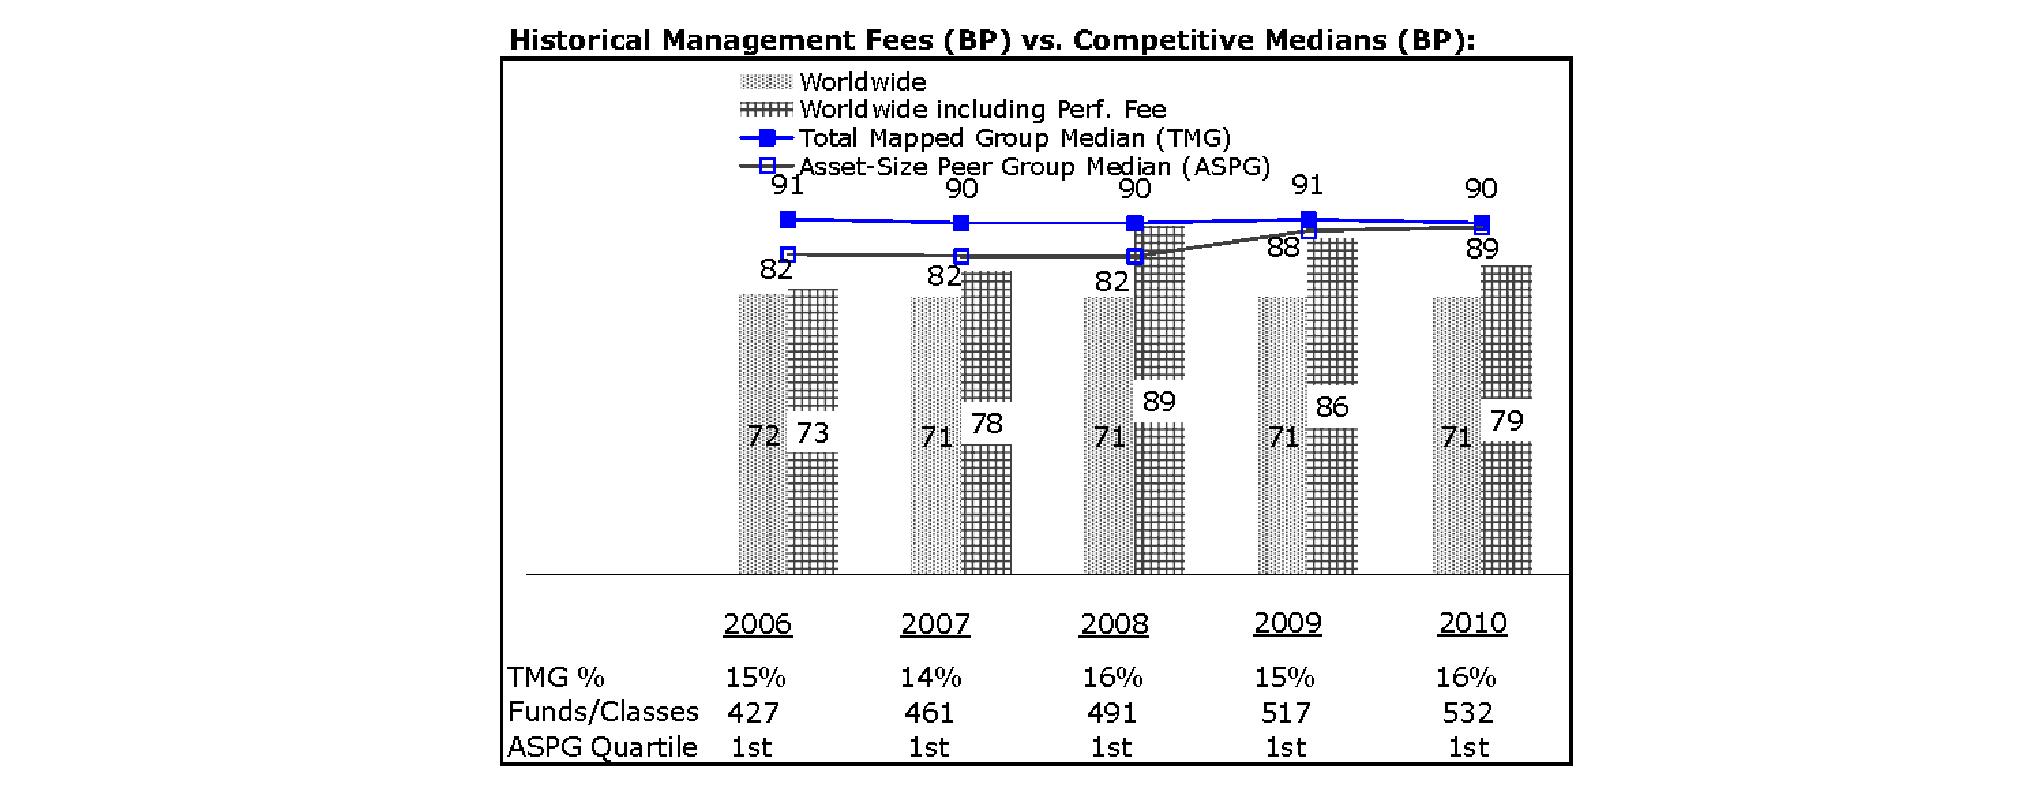
The Board noted that the fund's management fee ranked below the median of its Total Mapped Group and below the median of its ASPG for 2010. The Board also noted the effect of the fund's positive performance adjustment on the fund's management fee ranking. The Board noted that the performance adjustment for each year represents calculations for performance periods that differ from the periods shown in the performance charts above.
Based on its review, the Board concluded that the fund's management fee is fair and reasonable in light of the services that the fund receives and the other factors considered.
Total Expense Ratio. In its review of each class's total expense ratio, the Board considered the fund's management fee as well as other fund or class expenses, as applicable, such as transfer agent fees, pricing and bookkeeping fees, fund-paid 12b-1 fees, and custodial, legal, and audit fees. The Board also noted the effects of any waivers and reimbursements on fees and expenses, as well as the impact of the fund's performance adjustment. As part of its review, the Board also considered the current and historical total expense ratios of each class of the fund compared to competitive fund median expenses. Each class of the fund is compared to those funds and classes in the Total Mapped Group (used by the Board for management fee comparisons) that have a similar sales load structure.
The Board noted that the total expense ratio of each of Class A, Class B, Class C, and the retail class of the fund ranked below its competitive median for 2010 and the total expense ratio of each of Class T and Institutional Class ranked above its competitive median for 2010. The Board considered that various factors, including 12b-1 fees, positive or negative performance adjustments, and relatively higher other expenses in the case of small fund size, can affect total expense ratios. The Board noted that the total expense ratio of Class T was above the competitive median primarily because of higher 12b-1 fees on Class T. Class T has a higher 12b 1 fee, but a lower front-end sales charge, than traditionally priced front-end sales charge classes. The Board noted that the fund offers multiple classes, each of which has a different sales load and 12b-1 fee structure, and that the multiple structures are intended to offer a range of pricing options for the intermediary market. The Board also noted that the total expense ratios of the classes vary primarily by the level of their 12b-1 fees, although differences in transfer agent fees may also cause expenses to vary from class to class.
Annual Report
Fees Charged to Other Fidelity Clients. The Board also considered Fidelity fee structures and other information with respect to clients of FMR and its affiliates, such as other mutual funds advised or subadvised by FMR or its affiliates, pension plan clients, and other institutional clients. In March 2010, the Board created an ad hoc joint committee with the board of other Fidelity funds (the Committee) to review and compare Fidelity's institutional investment advisory business with its business of providing services to the Fidelity funds, including the differences in services provided, fees charged, and costs incurred, as well as competition in their respective marketplaces.
Based on its review of total expense ratios and fees charged to other Fidelity clients, the Board concluded that the total expense ratio of each class of the fund was reasonable, although in some cases above the median of the universe presented for comparison, in light of the services that the fund and its shareholders receive and the other factors considered, including the findings of the Committee.
Costs of the Services and Profitability. The Board considered the revenues earned and the expenses incurred by Fidelity in conducting the business of developing, marketing, distributing, managing, administering and servicing the fund and its shareholders. The Board also considered the level of Fidelity's profits in respect of all the Fidelity funds.
On an annual basis, FMR presents to the Board Fidelity's profitability for the fund. Fidelity calculates the profitability for each fund, as well as aggregate profitability for groups of Fidelity funds and all Fidelity funds, using a series of detailed revenue and cost allocation methodologies which originate with the books and records of Fidelity on which Fidelity's audited financial statements are based. The Audit Committee of the Board reviews any significant changes from the prior year's methodologies.
PricewaterhouseCoopers LLP (PwC), independent registered public accounting firm and auditor to Fidelity and certain Fidelity funds, has been engaged annually by the Board as part of the Board's assessment of Fidelity's profitability analysis. PwC's engagement includes the review and assessment of Fidelity's methodologies used in determining the revenues and expenses attributable to Fidelity's mutual fund business, and completion of agreed-upon procedures surrounding the mathematical accuracy of fund profitability and its conformity to allocation methodologies. After considering PwC's reports issued under the engagement and information provided by Fidelity, the Board concluded that while other allocation methods may also be reasonable, Fidelity's profitability methodologies are reasonable in all material respects.
The Board also reviewed Fidelity's non-fund businesses and fall-out benefits related to the mutual fund business as well as cases where Fidelity's affiliates may benefit from or be related to the fund's business.
The Board considered the costs of the services provided by and the profits realized by Fidelity in connection with the operation of the fund and was satisfied that the profitability was not excessive in the circumstances.
Economies of Scale. The Board considered whether there have been economies of scale in respect of the management of the Fidelity funds, whether the Fidelity funds (including the fund) have appropriately benefited from any such economies of scale, and whether there is potential for realization of any further economies of scale. The Board considered the extent to which the fund will benefit from economies of scale through increased services to the fund, through waivers or reimbursements, or through fee or expense reductions. The Board also noted that in 2009, it and the board of other Fidelity funds created an ad hoc committee (the Economies of Scale Committee) to analyze whether FMR attains economies of scale in respect of the management and servicing of the Fidelity funds, whether the Fidelity funds have appropriately benefited from such economies of scale, and whether there is potential for realization of any further economies of scale.
The Board recognized that the fund's management contract incorporates a "group fee" structure, which provides for lower group fee rates as total fund assets under FMR's management increase, and for higher group fee rates as total fund assets under FMR's management decrease. FMR calculates the group fee rates based on a tiered asset "breakpoint" schedule that varies based on asset class. The Board considered that the group fee is designed to deliver the benefits of economies of scale to fund shareholders when total Fidelity fund assets increase, even if assets of any particular fund are unchanged or have declined, because some portion of Fidelity's costs are attributable to services provided to all Fidelity funds, and all funds benefit if those costs can be allocated among more assets. The Board concluded that, given the group fee structure, fund shareholders will benefit from lower management fees as assets under FMR's management increase at the fund complex level, regardless of whether Fidelity achieves any such economies of scale.
The Board concluded, taking into account the analysis of the Economies of Scale Committee, that any potential economies of scale are being appropriately shared between fund shareholders and Fidelity.
Additional Information Requested by the Board. In order to develop fully the factual basis for consideration of the Fidelity funds' Advisory Contracts, the Board requested and received additional information on certain topics, including (i) fund performance trends, actions to be taken by FMR to improve certain funds' overall performance, and Fidelity's long-term strategies for certain funds; (ii) portfolio manager changes that have occurred during the past year and length of portfolio manager tenure for different categories of funds over time; (iii) Fidelity's compensation structure for portfolio managers and other key personnel and strategies for attracting and retaining non-investment personnel; (iv) the amount of the investment that each portfolio manager has made in the Fidelity fund(s) that he or she manages; (v) historical trends in Fidelity's realization of fall-out benefits; (vi) Fidelity's group fee structures and the rationale for the individual fee rates of certain funds; (vii) fund profitability methodology and the impact of certain factors on fund profitability results; (viii) trends regarding industry use of performance fee structures and Fidelity's compliance practices with respect to performance adjustment calculations; (ix) the fee structures in place for certain other Fidelity clients; and (x) explanations regarding the relative total expense ratios of certain funds and classes, total expense competitive trends, and actions that might be taken by FMR to reduce total expense ratios for certain funds and classes.
Annual Report
Board Approval of Investment Advisory Contracts and Management Fees - continued
Based on its evaluation of all of the conclusions noted above, and after considering all factors it believed relevant, the Board ultimately concluded that the advisory fee structures are fair and reasonable, and that the fund's Advisory Contracts should be renewed.
Annual Report
Annual Report
Investment Adviser
Fidelity Management & Research Company
Boston, MA
Investment Sub-Advisers
FMR Co., Inc.
Fidelity Management & Research
(U.K.) Inc.
FIL Investments (Japan) Limited
FIL Investment Advisors
FIL Investment Advisors
(UK) Limited
Fidelity Management & Research
(Hong Kong) Limited
Fidelity Management & Research
(Japan) Inc.
General Distributor
Fidelity Distributors Corporation
Boston, MA
Transfer and Service Agents
Fidelity Investments Institutional
Operations Company, Inc.
Boston, MA
Fidelity Service Company, Inc.
Boston, MA
Custodian
JPMorgan Chase Bank
New York, NY
(Fidelity Logo)
Corporate Headquarters
82 Devonshire St., Boston, MA 02109
www.fidelity.com
AWLD-UANN-1211
1.883445.102
(Fidelity Logo)
Fidelity Advisor®
Worldwide Fund
Institutional Class
Annual Report
October 31, 2011
(Fidelity Cover Art)
Institutional Class is a class of
Fidelity® Worldwide Fund
Contents
Chairman's Message | 4 | The Chairman's message to shareholders. |
Performance | 5 | How the fund has done over time. |
Management's Discussion of Fund Performance | 6 | The Portfolio Managers' review of fundperformance and strategy. |
Shareholder Expense Example | 7 | An example of shareholder expenses. |
Investment Changes | 9 | A summary of major shifts in the fund's investments over the past six months. |
Investments | 11 | A complete list of the fund's investments with their market values. |
Financial Statements | 27 | Statements of assets and liabilities, operations, and changes in net assets, as well as financial highlights. |
Notes | 37 | Notes to the financial statements. |
Report of Independent Registered Public Accounting Firm | 49 | |
Trustees and Officers | 50 | |
Distributions | 61 | |
Board Approval of Investment Advisory Contracts and Management Fees | 62 | |
To view a fund's proxy voting guidelines and proxy voting record for the 12-month period ended June 30, visit http://www.fidelity.com/proxyvotingresults or visit the Securities and Exchange Commission's (SEC) web site at http://www.sec.gov. You may also call 1-877-208-0098 to request a free copy of the proxy voting guidelines.
Standard & Poor's, S&P and S&P 500 are registered service marks of The McGraw-Hill Companies, Inc. and have been licensed for use by Fidelity Distributors Corporation.
Other third party marks appearing herein are the property of their respective owners.
All other marks appearing herein are registered or unregistered trademarks or service marks of FMR LLC or an affiliated company.
This report and the financial statements contained herein are submitted for the general information of the shareholders of the fund. This report is not authorized for distribution to prospective investors in the fund unless preceded or accompanied by an effective prospectus.
A fund files its complete schedule of portfolio holdings with the SEC for the first and third quarters of each fiscal year on Form N-Q. Forms N-Q are available on the SEC's web site at http://www.sec.gov. A fund's Forms N-Q may be reviewed and copied at the SEC's Public Reference Room in Washington, DC. Information regarding the operation of the SEC's Public Reference Room may be obtained by calling 1-800-SEC-0330. For a complete list of a fund's portfolio holdings, view the most recent holdings listing, semiannual report, or annual report on Fidelity's web site at http://www.fidelity.com, http://www.advisor.fidelity.com, or http://www.401k.com, as applicable.
NOT FDIC INSURED • MAY LOSE VALUE • NO BANK GUARANTEE
Neither the fund nor Fidelity Distributors Corporation is a bank.
Annual Report
(Acting Chairman's Photograph)
Dear Shareholder:
Global equity markets began the fourth quarter on a strong note, sharply reversing course in October amid strong corporate earnings, better-than-expected economic news and the promise of a resolution to the sovereign debt crisis in Europe. The mini rally followed a third quarter marked by a significant downturn in July and August, which heightened investor anxiety and set off a wave of volatility that hampered most major asset classes through the end of September. Financial markets are difficult to predict, of course, but you can help put the odds in your favor by following these time-tested investment principles.
One of the basic tenets is to invest according to your time horizon. For long-term investors, riding out the markets' inevitable ups and downs has proven much more effective than making decisions based on short-term developments. If your goal is approaching, you can also benefit from patience and restraint, rather than attempting to time the market. No matter your time horizon, missing only a few of the markets' best days can significantly diminish returns. Patience also affords the benefits of compounding - earning interest on additional income or reinvested dividends and capital gains. While staying the course doesn't eliminate risk, it can considerably lessen the negative impact of short-term downturns.
Asset allocation is another principle to manage risk. As you spread your portfolio among the asset classes, be sure to consider your time horizon, risk tolerance and investment objectives. Younger investors may be better served by emphasizing equities, which historically have been the best-performing asset class over time. Investors who are nearing a specific goal, such as retirement or sending a child to college, may choose to favor bonds and other investments that have tended to be more stable. Studies indicate that asset allocation is the single most important determinant of a portfolio's long-term success. After deciding on a suitable allocation strategy, make sure your portfolio is adequately diversified, with exposure to stocks of small-, mid- and large-cap companies in a range of sectors, for example. And today, more than ever, geographic diversification should be taken into account.
Lastly, investing a certain amount of money on a regular basis - a principle known as dollar-cost averaging - can help lower the average cost of your purchases, while also giving you the discipline to avoid selling weak performers just prior to an upswing, or chasing a hot performer just before a correction.
We invite you to learn more by visiting us on the Internet, dropping by one of our Investor Centers or calling us by phone. It is our privilege to provide the resources you need to choose investments that are right for you.
Sincerely,
(Acting Chairman's Signature)
James C. Curvey
Acting Chairman
Annual Report
Performance: The Bottom Line
Average annual total return reflects the change in the value of an investment, assuming reinvestment of the class' distributions from dividend income and capital gains (the profits earned upon the sale of securities that have grown in value, if any) and assuming a constant rate of performance each year. The $10,000 table and the fund's returns do not reflect the deduction of taxes that a shareholder would pay on fund distributions or the redemption of fund shares. During periods of reimbursement by Fidelity, a fund's total return will be greater than it would be had the reimbursement not occurred. How a fund did yesterday is no guarantee of how it will do tomorrow.
Average Annual Total Returns
Periods ended October 31, 2011 | Past 1
year | Past 5
years | Past 10
years |
Institutional Class A | 3.23% | 1.61% | 6.52% |
A The initial offering of Institutional Class took place on February 19, 2009. Returns prior to February 19, 2009 are those of Fidelity® Worldwide Fund, the original class of the fund.
$10,000 Over 10 Years
Let's say hypothetically that $10,000 was invested in Fidelity Advisor® Worldwide Fund - Institutional Class, on October 31, 2001. The chart shows how the value of your investment would have changed, and also shows how the MSCI® World Index performed over the same period. The initial offering of Institutional Class took place on February 19, 2009. See above for additional information regarding the performance of Institutional Class.
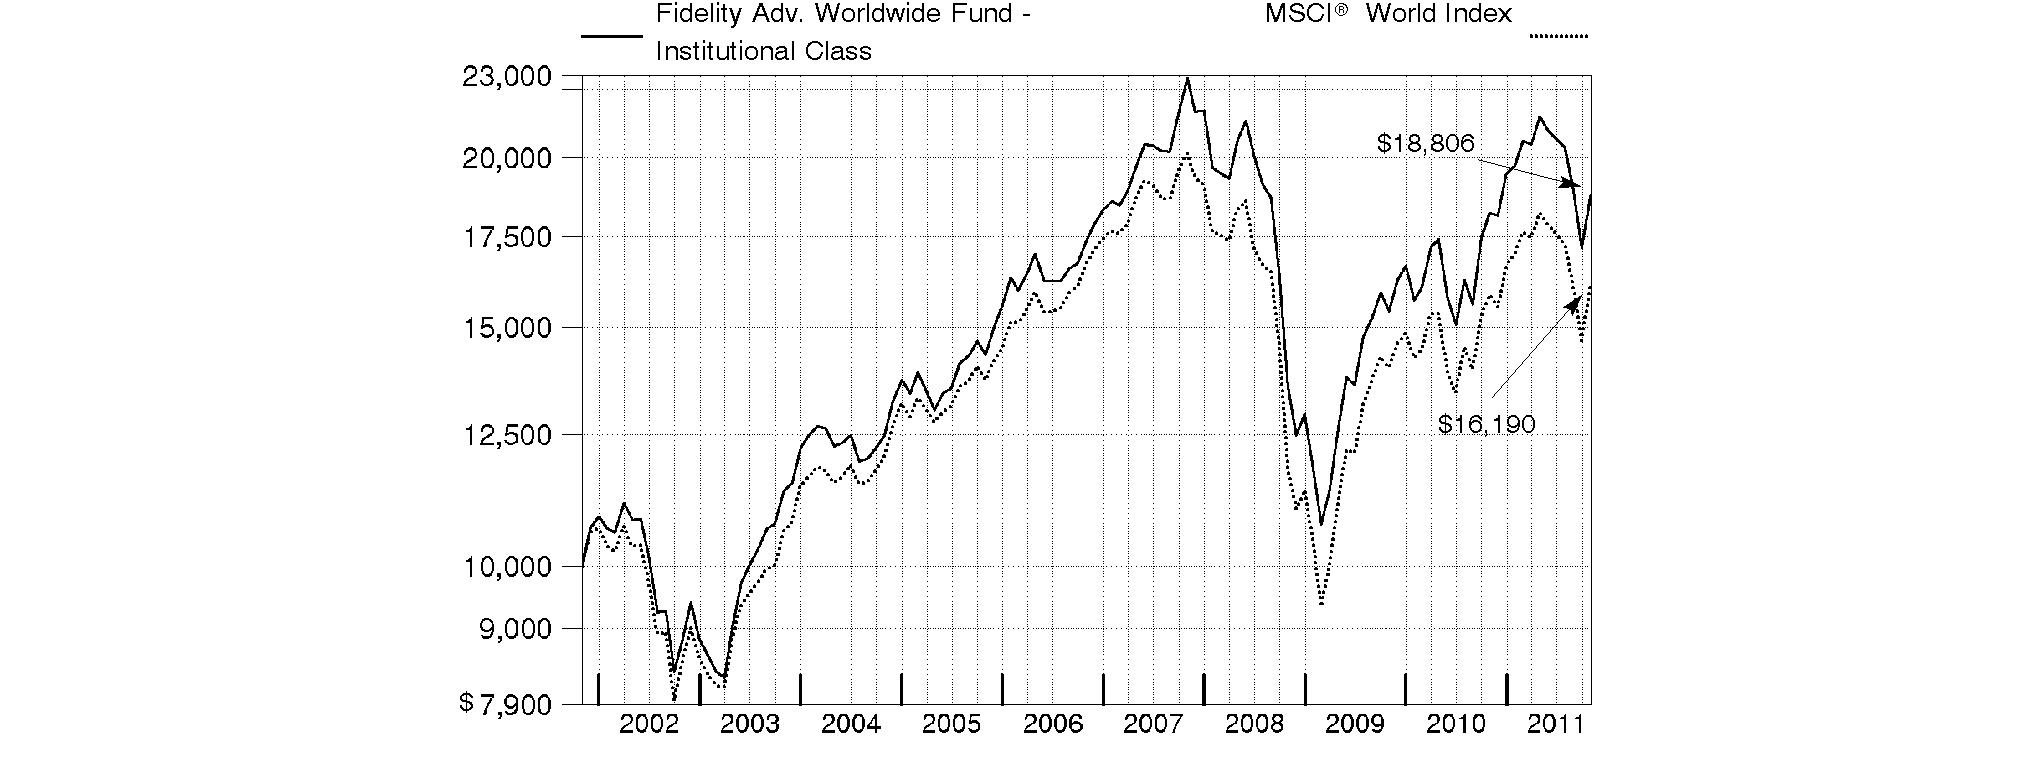
Annual Report
Management's Discussion of Fund Performance
Market Recap: Global equities were rocked by a number of headline events during the year ending October 31, 2011. Stocks posted a solid advance for the first half of the period, despite concern about sovereign debt in Europe, a devastating earthquake/tsunami in Japan, and political upheaval in the Middle East and North Africa. Sentiment turned decidedly negative in the second half, however, as fresh worries about Europe, inflation in China, gridlock over raising the debt ceiling in the U.S. - along with Standard & Poor's downgrade of the nation's long-term sovereign credit rating - and a dimmed outlook for global growth caused markets to suffer declines that intensified in August and September. October brought with it yet another dramatic swing, as better-than-expected U.S. economic data and prospects for a resolution to the European debt debacle prompted buyers to storm back onto the scene in search of bargains. Those gains - along with favorable currency fluctuations overall - helped lift the MSCI® ACWI® (All Country World Index) Index 0.75% for the year. Within the index, Europe and emerging markets declined the most, with many countries in these areas sustaining steep losses. By contrast, the U.S. (+8%), which dominates the index, delivered a positive result, as did Australia (+4%) and Switzerland (+3%). Japan showed resilience in the wake of its natural disasters, falling only 2%.
Comments from William Kennedy, Lead Portfolio Manager of Fidelity Advisor® Worldwide Fund and manager of its non-U.S. equity subportfolio, and Co-Portfolio Manager Stephen DuFour, who manages the fund's U.S. equity subportfolio: For the 12 months ending October 31, 2011, the fund's Institutional Class shares returned 3.23%, compared to 2.12% for the MSCI® World Index. Stock selection aided relative results, particularly in the U.S., but also in Japan and Canada. Standouts included Green Mountain Coffee Roasters, maker of the Keurig® coffee system, whose stock rallied during our ownership, following the launch of a new machine and new brands. Shares of beauty products company Estee Lauder benefited from growing overseas demand, product introductions and improved operations. Card processor MasterCard saw a sizable share price gain, fueled by strong volume growth as more payments worldwide were made with plastic. Conversely, security selection and currency exposure in emerging markets detracted, as did positioning in Europe and Asia Pacific ex Japan. The fund's small cash position also hurt. Individual disappointments included France-based network equipment company Alcatel-Lucent, whose stock declined when the company failed to execute on its turnaround plan. Untimely ownership of commercial roofing supplier Carlisle Companies detracted, as did our lack of exposure to tech giant and index component International Business Machines, which rallied nicely. Some of the stocks mentioned were not in the index, and some were not in the portfolio at period end.
The views expressed above reflect those of the portfolio manager(s) only through the end of the period as stated on the cover of this report and do not necessarily represent the views of Fidelity or any other person in the Fidelity organization. Any such views are subject to change at any time based upon market or other conditions and Fidelity disclaims any responsibility to update such views. These views may not be relied on as investment advice and, because investment decisions for a Fidelity fund are based on numerous factors, may not be relied on as an indication of trading intent on behalf of any Fidelity fund.
Annual Report
Fidelity Worldwide Fund
Shareholder Expense Example
As a shareholder of the Fund, you incur two types of costs: (1) transaction costs, including sales charges (loads) on purchase payments or redemption proceeds, redemption fees, and (2) ongoing costs, including management fees, distribution and/or service (12b-1) fees and other Fund expenses. This Example is intended to help you understand your ongoing costs (in dollars) of investing in the Fund and to compare these costs with the ongoing costs of investing in other mutual funds.
The Example is based on an investment of $1,000 invested at the beginning of the period and held for the entire period (May 1, 2011 to October 31, 2011).
Actual Expenses
The first line of the accompanying table for each class of the Fund provides information about actual account values and actual expenses. You may use the information in this line, together with the amount you invested, to estimate the expenses that you paid over the period. Simply divide your account value by $1,000.00 (for example, an $8,600 account value divided by $1,000.00 = 8.6), then multiply the result by the number in the first line for a class of the Fund under the heading entitled "Expenses Paid During Period" to estimate the expenses you paid on your account during this period. A small balance maintenance fee of $12.00 that is charged once a year may apply for certain accounts with a value of less than $2,000. This fee is not included in the table below. If it was, the estimate of expenses you paid during the period would be higher, and your ending account value lower, by this amount. In addition, the Fund, as a shareholder in the underlying Fidelity Central Funds, will indirectly bear its pro-rata share of the fees and expenses incurred by the underlying Fidelity Central Funds. These fees and expenses are not included in the Fund's annualized expense ratio used to calculate the expense estimate in the table below.
Hypothetical Example for Comparison Purposes
The second line of the accompanying table for each class of the Fund provides information about hypothetical account values and hypothetical expenses based on a Class' actual expense ratio and an assumed rate of return of 5% per year before expenses, which is not the Class' actual return. The hypothetical account values and expenses may not be used to estimate the actual ending account balance or expenses you paid for the period. You may use this information to compare the ongoing costs of investing in the Fund and other funds. To do so, compare this 5% hypothetical example with the 5% hypothetical examples that appear in the shareholder reports of the other funds. A small balance maintenance fee of $12.00 that is charged once a year may apply for certain accounts with a value of less than $2,000. This fee is not included in the table below. If it was, the estimate of expenses you paid during the period would be higher, and your ending account value lower, by this amount. In addition, the Fund, as a shareholder in the underlying Fidelity Central Funds, will indirectly bear its pro-rata share of the fees and expenses incurred by the underlying Fidelity Central Funds. These fees and expenses are not included in the Fund's annualized expense ratio used to calculate the expense estimate in the table below.
Please note that the expenses shown in the table are meant to highlight your ongoing costs only and do not reflect any transaction costs. Therefore, the second line of the table is useful in comparing ongoing costs only, and will not help you determine the relative total costs of owning different funds. In addition, if these transactional costs were included, your costs would have been higher.
| Annualized
Expense Ratio | Beginning
Account Value
May 1, 2011 | Ending
Account Value
October 31, 2011 | Expenses Paid
During Period*
May 1, 2011
to October 31, 2011 |
Class A | 1.39% | | | |
Actual | | $ 1,000.00 | $ 874.80 | $ 6.57 |
HypotheticalA | | $ 1,000.00 | $ 1,018.20 | $ 7.07 |
Class T | 1.69% | | | |
Actual | | $ 1,000.00 | $ 873.20 | $ 7.98 |
HypotheticalA | | $ 1,000.00 | $ 1,016.69 | $ 8.59 |
Class B | 2.12% | | | |
Actual | | $ 1,000.00 | $ 871.50 | $ 10.00 |
HypotheticalA | | $ 1,000.00 | $ 1,014.52 | $ 10.76 |
Class C | 2.14% | | | |
Actual | | $ 1,000.00 | $ 871.70 | $ 10.10 |
HypotheticalA | | $ 1,000.00 | $ 1,014.42 | $ 10.87 |
Worldwide | 1.05% | | | |
Actual | | $ 1,000.00 | $ 876.50 | $ 4.97 |
HypotheticalA | | $ 1,000.00 | $ 1,019.91 | $ 5.35 |
Institutional Class | 1.11% | | | |
Actual | | $ 1,000.00 | $ 876.20 | $ 5.25 |
HypotheticalA | | $ 1,000.00 | $ 1,019.61 | $ 5.65 |
A 5% return per year before expenses
* Expenses are equal to each Class' annualized expense ratio, multiplied by the average account value over the period, multiplied by 184/365 (to reflect the one-half year period).
Annual Report
Fidelity Worldwide Fund
Investment Changes (Unaudited)
Geographic Diversification (% of fund's net assets) |
As of October 31, 2011 |
| United States of America | 52.8% | |
| United Kingdom | 9.8% | |
| Japan | 7.0% | |
| France | 4.3% | |
| Switzerland | 3.2% | |
| Germany | 2.7% | |
| Canada | 2.1% | |
| Netherlands | 1.6% | |
| Australia | 1.5% | |
| Other | 15.0% | |

Percentages are adjusted for the effect of futures contracts, if applicable. |
As of April 30, 2011 |
| United States of America | 48.4% | |
| United Kingdom | 9.9% | |
| Japan | 7.4% | |
| France | 5.9% | |
| Germany | 4.1% | |
| Canada | 3.2% | |
| Switzerland | 2.4% | |
| Netherlands | 2.1% | |
| Australia | 1.9% | |
| Other | 14.7% | |

Percentages are adjusted for the effect of futures contracts, if applicable. |
Asset Allocation |
| % of fund's
net assets | % of fund's net assets
6 months ago |
Stocks | 96.6 | 94.8 |
Bonds | 0.0 | 0.1 |
Short-Term Investments and Net Other Assets | 3.4 | 5.1 |
Top Ten Stocks as of October 31, 2011 |
| % of fund's
net assets | % of fund's net assets
6 months ago |
Intuit, Inc. (United States of America, Software) | 2.7 | 1.1 |
Citigroup, Inc. (United States of America, Diversified Financial Services) | 2.6 | 0.0 |
Edwards Lifesciences Corp. (United States of America, Health Care Equipment & Supplies) | 2.2 | 1.1 |
Exxon Mobil Corp. (United States of America, Oil, Gas & Consumable Fuels) | 2.1 | 1.8 |
MasterCard, Inc. Class A (United States of America, IT Services) | 2.1 | 0.5 |
Prologis, Inc. (United States of America, Real Estate Investment Trusts) | 1.8 | 0.0 |
Union Pacific Corp. (United States of America, Road & Rail) | 1.8 | 0.0 |
Apple, Inc. (United States of America, Computers & Peripherals) | 1.8 | 1.3 |
Perrigo Co. (United States of America, Pharmaceuticals) | 1.6 | 1.2 |
British American Tobacco PLC | 1.6 | 0.3 |
| 20.3 | |
Market Sectors as of October 31, 2011 |
| % of fund's
net assets | % of fund's net assets
6 months ago |
Financials | 18.2 | 14.2 |
Consumer Discretionary | 14.7 | 14.7 |
Information Technology | 14.3 | 15.6 |
Energy | 11.4 | 12.6 |
Health Care | 10.7 | 12.1 |
Consumer Staples | 9.4 | 7.2 |
Industrials | 9.2 | 9.5 |
Materials | 4.3 | 5.0 |
Telecommunication Services | 3.0 | 3.0 |
Utilities | 1.4 | 1.0 |
Annual Report
Fidelity Worldwide Fund
Investments October 31, 2011
Showing Percentage of Net Assets
Common Stocks - 96.0% |
| Shares | | Value |
Australia - 1.5% |
Australia & New Zealand Banking Group Ltd. | 244,941 | | $ 5,535,316 |
carsales.com Ltd. (d) | 238,660 | | 1,233,872 |
Commonwealth Bank of Australia | 73,520 | | 3,777,086 |
Fortescue Metals Group Ltd. | 218,016 | | 1,095,164 |
Macquarie Group Ltd. | 17,973 | | 462,782 |
Newcrest Mining Ltd. | 92,133 | | 3,256,459 |
WorleyParsons Ltd. | 61,305 | | 1,779,531 |
TOTAL AUSTRALIA | | 17,140,210 |
Austria - 0.0% |
Osterreichische Elektrizitatswirtschafts AG | 6,500 | | 189,217 |
Bailiwick of Guernsey - 0.1% |
Ashmore Global Opportunities Ltd. (United Kingdom) | 49,599 | | 550,379 |
Bailiwick of Jersey - 0.9% |
Experian PLC | 176,600 | | 2,301,886 |
Shire PLC | 132,800 | | 4,168,784 |
Velti PLC (a) | 32,500 | | 273,650 |
Wolseley PLC | 106,760 | | 3,087,012 |
TOTAL BAILIWICK OF JERSEY | | 9,831,332 |
Belgium - 0.1% |
Anheuser-Busch InBev SA NV | 26,911 | | 1,492,596 |
Bermuda - 0.4% |
African Minerals Ltd. (a) | 177,200 | | 1,258,868 |
Cheung Kong Infrastructure Holdings Ltd. | 401,000 | | 2,148,044 |
Li & Fung Ltd. | 516,000 | | 994,432 |
Noble Group Ltd. | 529,363 | | 646,120 |
TOTAL BERMUDA | | 5,047,464 |
Brazil - 1.0% |
Anhanguera Educacional Participacoes SA | 113,300 | | 1,665,982 |
Arezzo Industria e Comercio SA | 51,200 | | 676,823 |
Itau Unibanco Banco Multiplo SA sponsored ADR | 78,300 | | 1,497,096 |
Qualicorp SA | 341,000 | | 3,117,692 |
Souza Cruz Industria Comerico | 199,500 | | 2,446,698 |
TIM Participacoes SA sponsored ADR | 82,378 | | 2,145,123 |
TOTAL BRAZIL | | 11,549,414 |
British Virgin Islands - 0.2% |
Arcos Dorados Holdings, Inc. | 45,500 | | 1,064,700 |
Mail.ru Group Ltd. GDR (Reg. S) | 43,800 | | 1,508,910 |
TOTAL BRITISH VIRGIN ISLANDS | | 2,573,610 |
Canada - 2.1% |
Canadian Natural Resources Ltd. | 34,200 | | 1,206,272 |
InterOil Corp. (a) | 10,500 | | 498,855 |
Keyera Corp. | 401,000 | | 18,291,087 |
|
| Shares | | Value |
Open Text Corp. (a) | 41,800 | | $ 2,558,277 |
Trinidad Drilling Ltd. | 206,900 | | 1,618,920 |
TOTAL CANADA | | 24,173,411 |
Cayman Islands - 1.3% |
Airtac International Group | 156,000 | | 873,143 |
Belle International Holdings Ltd. | 668,000 | | 1,310,100 |
Biostime International Holdings Ltd. | 496,500 | | 885,400 |
Bosideng International Holdings Ltd. | 2,392,000 | | 659,415 |
China Kanghui Holdings sponsored ADR (a)(d) | 105,800 | | 1,657,886 |
China Mengniu Dairy Co. Ltd. | 386,000 | | 1,229,987 |
China ZhengTong Auto Services Holdings Ltd. | 934,000 | | 1,011,347 |
Ctrip.com International Ltd. sponsored ADR (a)(d) | 52,800 | | 1,840,608 |
Hengdeli Holdings Ltd. | 1,388,000 | | 622,264 |
Microport Scientific Corp. | 738,000 | | 417,124 |
Sands China Ltd. (a) | 1,038,800 | | 3,121,789 |
Shenguan Holdings Group Ltd. | 1,912,000 | | 1,027,233 |
TOTAL CAYMAN ISLANDS | | 14,656,296 |
China - 0.7% |
Baidu.com, Inc. sponsored ADR (a) | 25,000 | | 3,504,500 |
China Telecom Corp. Ltd. (H Shares) | 2,586,000 | | 1,596,615 |
SINA Corp. (a)(d) | 18,600 | | 1,511,994 |
Zhaojin Mining Industry Co. Ltd. (H Shares) | 511,000 | | 912,331 |
TOTAL CHINA | | 7,525,440 |
Curacao - 0.5% |
Schlumberger Ltd. | 72,000 | | 5,289,840 |
Cyprus - 0.0% |
Aisi Realty Public Ltd. (a) | 12,322 | | 13,673 |
Denmark - 0.9% |
Novo Nordisk A/S Series B | 54,816 | | 5,820,540 |
William Demant Holding A/S (a) | 51,300 | | 4,093,123 |
TOTAL DENMARK | | 9,913,663 |
Finland - 0.4% |
Amer Group PLC (A Shares) | 79,900 | | 1,104,630 |
Nokian Tyres PLC | 78,500 | | 2,884,290 |
TOTAL FINLAND | | 3,988,920 |
France - 4.3% |
Air Liquide SA | 18,600 | | 2,413,176 |
Arkema SA | 26,330 | | 1,801,317 |
Atos Origin SA | 55,730 | | 2,700,909 |
AXA SA | 231,637 | | 3,773,020 |
BNP Paribas SA | 77,588 | | 3,527,237 |
Club Mediterranee SA (a) | 26,800 | | 508,484 |
Danone | 76,600 | | 5,332,139 |
Iliad SA | 38,014 | | 4,449,549 |
Ipsos SA | 3,300 | | 108,372 |
JC Decaux SA (a) | 37,500 | | 1,004,971 |
Common Stocks - continued |
| Shares | | Value |
France - continued |
LVMH Moet Hennessy - Louis Vuitton | 33,579 | | $ 5,588,015 |
Pernod-Ricard SA | 17,814 | | 1,664,064 |
PPR SA | 21,450 | | 3,351,398 |
Safran SA | 51,200 | | 1,677,154 |
Sanofi-aventis | 59,011 | | 4,222,200 |
Sanofi-aventis sponsored ADR | 70,000 | | 2,502,500 |
Schneider Electric SA | 24,592 | | 1,451,502 |
Societe Generale Series A | 55,400 | | 1,617,696 |
Unibail-Rodamco | 6,389 | | 1,277,631 |
TOTAL FRANCE | | 48,971,334 |
Germany - 2.2% |
Aareal Bank AG (a) | 69,248 | | 1,407,777 |
Allianz AG | 22,281 | | 2,504,084 |
Bayer AG | 46,647 | | 2,988,564 |
Bayerische Motoren Werke AG (BMW) | 42,702 | | 3,490,168 |
Commerzbank AG (a) | 260,100 | | 641,795 |
Deutsche Bank AG | 64,100 | | 2,650,826 |
Fresenius Medical Care AG & Co. KGaA | 52,700 | | 3,839,525 |
GEA Group AG | 52,982 | | 1,463,870 |
Gerry Weber International AG (Bearer) | 19,400 | | 604,072 |
Kabel Deutschland Holding AG (a) | 54,900 | | 3,134,774 |
Siemens AG | 20,658 | | 2,165,703 |
TOTAL GERMANY | | 24,891,158 |
Hong Kong - 0.7% |
AIA Group Ltd. | 1,010,800 | | 3,090,763 |
China Unicom (Hong Kong) Ltd. | 776,000 | | 1,560,238 |
I.T Ltd. | 798,000 | | 496,991 |
Techtronic Industries Co. Ltd. | 3,575,500 | | 3,093,641 |
TOTAL HONG KONG | | 8,241,633 |
India - 0.8% |
Apollo Hospitals Enterprise Ltd. | 164,788 | | 1,756,036 |
Bharti Airtel Ltd. | 350,401 | | 2,806,264 |
Housing Development Finance Corp. Ltd. | 166,070 | | 2,337,075 |
Larsen & Toubro Ltd. | 16,958 | | 489,178 |
Shriram Transport Finance Co. Ltd. | 41,265 | | 516,600 |
The Jammu & Kashmir Bank Ltd. | 30,114 | | 519,252 |
Titan Industries Ltd. | 175,420 | | 779,023 |
TOTAL INDIA | | 9,203,428 |
Indonesia - 0.3% |
PT Astra International Tbk | 82,000 | | 632,282 |
PT Sarana Menara Nusantara Tbk (a) | 913,000 | | 923,098 |
PT Tower Bersama Infrastructure Tbk | 3,992,500 | | 929,188 |
PT XL Axiata Tbk | 1,171,500 | | 655,208 |
TOTAL INDONESIA | | 3,139,776 |
Ireland - 0.6% |
Accenture PLC Class A | 43,600 | | 2,627,336 |
|
| Shares | | Value |
James Hardie Industries NV CDI (a) | 297,856 | | $ 1,929,373 |
Kenmare Resources PLC (a) | 321,500 | | 209,762 |
Paddy Power PLC (Ireland) | 45,700 | | 2,529,769 |
TOTAL IRELAND | | 7,296,240 |
Israel - 0.3% |
Check Point Software Technologies Ltd. (a) | 32,400 | | 1,867,212 |
Israel Chemicals Ltd. | 81,400 | | 979,495 |
TOTAL ISRAEL | | 2,846,707 |
Italy - 0.6% |
Intesa Sanpaolo SpA | 509,546 | | 910,362 |
Prada SpA | 144,900 | | 716,306 |
Prysmian SpA | 104,600 | | 1,585,078 |
Saipem SpA | 84,317 | | 3,780,636 |
TOTAL ITALY | | 6,992,382 |
Japan - 7.0% |
ABC-Mart, Inc. | 84,500 | | 3,309,601 |
Aozora Bank Ltd. | 566,000 | | 1,431,046 |
Asics Corp. | 200,000 | | 2,651,771 |
Calbee, Inc. (d) | 42,800 | | 1,951,360 |
Canon, Inc. | 94,450 | | 4,288,371 |
Cosmos Pharmaceutical Corp. | 47,300 | | 2,194,224 |
Credit Saison Co. Ltd. | 76,100 | | 1,485,195 |
DeNA Co. Ltd. | 46,400 | | 2,002,954 |
Denso Corp. | 69,500 | | 2,137,626 |
Digital Garage, Inc. (a) | 170 | | 556,650 |
Don Quijote Co. Ltd. | 84,700 | | 3,103,052 |
Fanuc Corp. | 21,200 | | 3,428,272 |
Honda Motor Co. Ltd. | 108,200 | | 3,235,999 |
Japan Retail Fund Investment Corp. | 157 | | 243,063 |
Japan Tobacco, Inc. | 1,306 | | 6,528,435 |
JS Group Corp. | 91,700 | | 1,923,116 |
JSR Corp. | 126,300 | | 2,411,388 |
Kakaku.com, Inc. | 43,300 | | 1,714,683 |
KDDI Corp. | 618 | | 4,527,650 |
Keyence Corp. | 10,400 | | 2,644,131 |
Misumi Group, Inc. | 70,500 | | 1,467,103 |
Mitsubishi Corp. | 136,300 | | 2,803,636 |
Mitsubishi Estate Co. Ltd. | 87,000 | | 1,473,711 |
Mitsubishi UFJ Financial Group, Inc. | 837,800 | | 3,641,492 |
ORIX Corp. | 73,700 | | 6,433,011 |
Rakuten, Inc. | 3,737 | | 4,097,156 |
So-net M3, Inc. | 320 | | 1,447,362 |
SOFTBANK CORP. | 59,800 | | 1,941,095 |
Start Today Co. Ltd. | 165,300 | | 3,497,242 |
Tokyo Electron Ltd. | 19,400 | | 1,031,892 |
TOTAL JAPAN | | 79,602,287 |
Korea (South) - 1.1% |
Hyundai Motor Co. | 11,637 | | 2,334,815 |
Kia Motors Corp. | 27,270 | | 1,741,809 |
Common Stocks - continued |
| Shares | | Value |
Korea (South) - continued |
LG Household & Health Care Ltd. | 3,087 | | $ 1,389,000 |
NHN Corp. (a) | 3,893 | | 809,131 |
Orion Corp. | 6,624 | | 3,540,417 |
Samsung Electronics Co. Ltd. | 1,927 | | 1,652,691 |
Shinhan Financial Group Co. Ltd. | 22,350 | | 887,039 |
TOTAL KOREA (SOUTH) | | 12,354,902 |
Luxembourg - 0.6% |
Brait SA | 516,600 | | 1,236,773 |
Millicom International Cellular SA | 11,500 | | 1,263,850 |
Millicom International Cellular SA (depositary receipt) | 27,200 | | 2,997,630 |
Samsonite International SA | 934,200 | | 1,520,025 |
TOTAL LUXEMBOURG | | 7,018,278 |
Mexico - 0.2% |
Wal-Mart de Mexico SA de CV Series V | 1,042,400 | | 2,692,836 |
Netherlands - 1.6% |
AEGON NV (a) | 292,700 | | 1,396,073 |
ASML Holding NV | 60,800 | | 2,549,344 |
Gemalto NV | 106,288 | | 4,849,622 |
ING Groep NV (Certificaten Van Aandelen) (a) | 654,400 | | 5,642,383 |
Koninklijke Philips Electronics NV | 77,500 | | 1,613,528 |
Randstad Holdings NV | 45,325 | | 1,616,744 |
TOTAL NETHERLANDS | | 17,667,694 |
Norway - 0.5% |
Aker Solutions ASA | 105,900 | | 1,231,594 |
DnB NOR ASA | 367,800 | | 4,290,648 |
TOTAL NORWAY | | 5,522,242 |
Philippines - 0.1% |
Alliance Global Group, Inc. | 6,500,000 | | 1,616,043 |
Poland - 0.2% |
Eurocash SA | 232,100 | | 1,860,945 |
Qatar - 0.1% |
Commercial Bank of Qatar GDR (Reg. S) | 279,659 | | 1,282,610 |
Singapore - 0.1% |
Avago Technologies Ltd. | 41,000 | | 1,384,570 |
South Africa - 0.4% |
AngloGold Ashanti Ltd. sponsored ADR | 44,700 | | 2,020,887 |
Sanlam Ltd. | 311,800 | | 1,164,884 |
Shoprite Holdings Ltd. | 125,400 | | 1,837,793 |
TOTAL SOUTH AFRICA | | 5,023,564 |
Spain - 0.7% |
Banco Bilbao Vizcaya Argentaria SA | 135,154 | | 1,216,551 |
Banco Santander SA: | | | |
rights 10/31/11 | 356,566 | | 61,681 |
(Spain) | 356,566 | | 3,018,362 |
Inditex SA | 17,582 | | 1,600,055 |
|
| Shares | | Value |
Prosegur Compania de Seguridad SA (Reg.) | 19,900 | | $ 992,803 |
Viscofan Envolturas Celulosicas SA | 31,300 | | 1,204,620 |
TOTAL SPAIN | | 8,094,072 |
Sweden - 0.6% |
Elekta AB (B Shares) | 13,000 | | 520,235 |
Intrum Justitia AB | 14,200 | | 233,597 |
Meda AB (A Shares) | 107,400 | | 1,097,137 |
Swedbank AB (A Shares) | 195,000 | | 2,747,237 |
Swedish Match Co. | 65,600 | | 2,269,997 |
TOTAL SWEDEN | | 6,868,203 |
Switzerland - 3.2% |
ACE Ltd. | 41,000 | | 2,958,150 |
Adecco SA (Reg.) | 34,229 | | 1,654,210 |
Compagnie Financiere Richemont SA Series A | 16,640 | | 952,835 |
Kuehne & Nagel International AG | 10,620 | | 1,322,735 |
Nestle SA | 164,083 | | 9,517,207 |
Partners Group Holding | 12,748 | | 2,389,660 |
Schindler Holding AG (participation certificate) | 31,036 | | 3,649,838 |
The Swatch Group AG (Bearer) | 5,440 | | 2,303,577 |
Transocean Ltd. (United States) | 47,100 | | 2,691,765 |
UBS AG (a) | 323,960 | | 4,095,441 |
Zurich Financial Services AG | 19,138 | | 4,444,561 |
TOTAL SWITZERLAND | | 35,979,979 |
Taiwan - 0.3% |
Catcher Technology Co. Ltd. | 317,000 | | 1,766,168 |
WPG Holding Co. Ltd. | 955,930 | | 1,154,290 |
TOTAL TAIWAN | | 2,920,458 |
Turkey - 0.1% |
Boyner Buyuk Magazacilik A/S (a) | 514,000 | | 863,328 |
United Arab Emirates - 0.1% |
First Gulf Bank PJSC | 130,740 | | 553,500 |
United Kingdom - 9.8% |
Aberdeen Asset Management PLC | 474,742 | | 1,469,699 |
Aggreko PLC | 30,300 | | 834,231 |
Anglo American PLC (United Kingdom) | 68,818 | | 2,538,288 |
Ashmore Group PLC | 187,900 | | 1,042,524 |
Aviva PLC | 363,200 | | 1,981,831 |
Barclays PLC | 1,257,259 | | 3,898,158 |
BG Group PLC | 291,563 | | 6,360,515 |
BHP Billiton PLC | 261,599 | | 8,239,155 |
BP PLC | 567,469 | | 4,176,690 |
British American Tobacco PLC: | | | |
(United Kingdom) | 222,000 | | 10,180,670 |
sponsored ADR | 92,400 | | 8,523,900 |
British Land Co. PLC | 332,855 | | 2,732,693 |
Burberry Group PLC | 106,200 | | 2,290,305 |
Carphone Warehouse Group PLC | 852,279 | | 4,810,929 |
Common Stocks - continued |
| Shares | | Value |
United Kingdom - continued |
Diageo PLC | 100,557 | | $ 2,081,493 |
GlaxoSmithKline PLC | 153,700 | | 3,450,034 |
HSBC Holdings PLC (United Kingdom) | 580,528 | | 5,066,231 |
Imperial Tobacco Group PLC | 85,378 | | 3,122,313 |
International Personal Finance PLC | 517,515 | | 2,282,078 |
Jazztel PLC (a) | 228,700 | | 1,322,961 |
Legal & General Group PLC | 1,800,381 | | 3,199,387 |
Lloyds Banking Group PLC (a) | 2,775,954 | | 1,435,778 |
Micro Focus International PLC | 116,800 | | 637,897 |
National Grid PLC | 273,500 | | 2,719,655 |
Ocado Group PLC (a)(d) | 898,900 | | 1,353,815 |
Reckitt Benckiser Group PLC | 19,141 | | 984,426 |
Royal Dutch Shell PLC Class B | 371,168 | | 13,319,306 |
Royalblue Group PLC | 15,700 | | 410,797 |
SuperGroup PLC (a)(d) | 65,400 | | 656,300 |
The Weir Group PLC | 37,100 | | 1,144,956 |
Ultra Electronics Holdings PLC | 32,400 | | 829,522 |
Vodafone Group PLC | 2,115,200 | | 5,874,342 |
Vodafone Group PLC sponsored ADR | 47,212 | | 1,314,382 |
Xstrata PLC | 81,600 | | 1,372,000 |
TOTAL UNITED KINGDOM | | 111,657,261 |
United States of America - 49.4% |
Alexion Pharmaceuticals, Inc. (a) | 173,000 | | 11,679,230 |
Amazon.com, Inc. (a) | 17,800 | | 3,800,478 |
American Express Co. | 182,100 | | 9,217,902 |
Ameriprise Financial, Inc. | 83,000 | | 3,874,440 |
Apple, Inc. (a) | 49,600 | | 20,077,088 |
BB&T Corp. | 38,000 | | 886,920 |
Beam, Inc. | 25,000 | | 1,235,750 |
Biogen Idec, Inc. (a) | 76,300 | | 8,878,268 |
Cabot Oil & Gas Corp. | 66,000 | | 5,129,520 |
Chevron Corp. | 143,000 | | 15,022,150 |
Citigroup, Inc. | 917,100 | | 28,971,189 |
Citrix Systems, Inc. (a) | 167,209 | | 12,177,831 |
Cognizant Technology Solutions Corp. Class A (a) | 61,600 | | 4,481,400 |
Collective Brands, Inc. (a) | 181,000 | | 2,644,410 |
CSX Corp. | 344,000 | | 7,640,240 |
Cummins, Inc. | 169,400 | | 16,843,442 |
Discover Financial Services | 384,100 | | 9,049,396 |
Duke Energy Corp. | 88,000 | | 1,796,960 |
Edwards Lifesciences Corp. (a) | 329,000 | | 24,813,180 |
El Paso Electric Co. | 60,750 | | 1,945,823 |
Elizabeth Arden, Inc. (a) | 76,000 | | 2,605,280 |
EQT Corp. | 257,000 | | 16,319,500 |
Estee Lauder Companies, Inc. Class A | 115,000 | | 11,321,750 |
Exxon Mobil Corp. | 309,000 | | 24,129,810 |
Fifth Third Bancorp | 381,000 | | 4,575,810 |
Fiserv, Inc. (a) | 7,000 | | 412,090 |
Fossil, Inc. (a) | 2,900 | | 300,614 |
|
| Shares | | Value |
Freeport-McMoRan Copper & Gold, Inc. | 112,000 | | $ 4,509,120 |
G-III Apparel Group Ltd. (a) | 189,600 | | 5,344,824 |
Gilead Sciences, Inc. (a) | 122,000 | | 5,082,520 |
Google, Inc. Class A (a) | 6,500 | | 3,852,160 |
Green Mountain Coffee Roasters, Inc. (a) | 8,900 | | 578,678 |
Informatica Corp. (a) | 144,100 | | 6,556,550 |
IntercontinentalExchange, Inc. (a) | 13,000 | | 1,688,440 |
InterMune, Inc. (a) | 37,000 | | 943,500 |
Intuit, Inc. | 576,000 | | 30,913,915 |
iRobot Corp. (a) | 177,000 | | 5,993,220 |
JCPenney Co., Inc. | 31,000 | | 994,480 |
JPMorgan Chase & Co. | 105,000 | | 3,649,800 |
Lincoln National Corp. | 367,000 | | 6,991,350 |
Lorillard, Inc. | 8,000 | | 885,280 |
MasterCard, Inc. Class A | 69,100 | | 23,994,284 |
McDonald's Corp. | 118,500 | | 11,002,725 |
Motorola Solutions, Inc. | 20,000 | | 938,200 |
National Oilwell Varco, Inc. | 82,000 | | 5,849,060 |
Nu Skin Enterprises, Inc. Class A | 132,000 | | 6,669,960 |
ONEOK, Inc. | 37,000 | | 2,813,850 |
Perrigo Co. | 207,000 | | 18,687,960 |
Polypore International, Inc. (a) | 139,100 | | 7,295,795 |
PPL Corp. | 145,000 | | 4,258,650 |
Prestige Brands Holdings, Inc. (a) | 296,120 | | 3,132,950 |
Priceline.com, Inc. (a) | 4,000 | | 2,030,880 |
Prologis, Inc. | 681,600 | | 20,284,416 |
PulteGroup, Inc. (a) | 807,000 | | 4,180,260 |
Ralph Lauren Corp. | 14,000 | | 2,223,060 |
RF Micro Devices, Inc. (a) | 991,700 | | 7,279,078 |
Riverbed Technology, Inc. (a) | 28,000 | | 772,240 |
salesforce.com, Inc. (a) | 56,000 | | 7,457,520 |
Sirius XM Radio, Inc. (a)(d) | 3,900,000 | | 6,981,000 |
Smithfield Foods, Inc. (a) | 186,000 | | 4,251,960 |
Starbucks Corp. | 281,000 | | 11,897,540 |
Target Corp. | 81,000 | | 4,434,750 |
TJX Companies, Inc. | 176,000 | | 10,371,680 |
Torchmark Corp. | 57,000 | | 2,333,010 |
Union Pacific Corp. | 202,000 | | 20,113,140 |
United Technologies Corp. | 65,000 | | 5,068,700 |
UnitedHealth Group, Inc. | 273,900 | | 13,144,461 |
Virgin Media, Inc. | 98,000 | | 2,389,240 |
W.R. Grace & Co. (a) | 323,000 | | 13,498,170 |
Wells Fargo & Co. | 246,000 | | 6,373,860 |
Williams Companies, Inc. | 85,000 | | 2,559,350 |
TOTAL UNITED STATES OF AMERICA | | 560,102,057 |
TOTAL COMMON STOCKS (Cost $1,032,697,154) |
1,088,582,952
|
Nonconvertible Preferred Stocks - 0.6% |
| Shares | | Value |
Germany - 0.5% |
ProSiebenSat.1 Media AG | 2,200 | | $ 47,191 |
Volkswagen AG | 34,600 | | 6,071,557 |
TOTAL GERMANY | | 6,118,748 |
Italy - 0.1% |
Fiat Industrial SpA (a) | 118,500 | | 727,141 |
TOTAL NONCONVERTIBLE PREFERRED STOCKS (Cost $5,541,680) |
6,845,889
|
Money Market Funds - 4.8% |
| | | |
Fidelity Cash Central Fund, 0.12% (b) | 41,886,340 | | 41,886,340 |
Fidelity Securities Lending Cash Central Fund, 0.11% (b)(c) | 12,725,485 | | 12,725,485 |
TOTAL MONEY MARKET FUNDS (Cost $54,611,825) |
54,611,825
|
TOTAL INVESTMENT PORTFOLIO - 101.4% (Cost $1,092,850,659) | | 1,150,040,666 |
NET OTHER ASSETS (LIABILITIES) - (1.4)% | | (15,367,874) |
NET ASSETS - 100% | $ 1,134,672,792 |
Legend |
(a) Non-income producing |
(b) Affiliated fund that is available only to investment companies and other accounts managed by Fidelity Investments. The rate quoted is the annualized seven-day yield of the fund at period end. A complete unaudited listing of the fund's holdings as of its most recent quarter end is available upon request. In addition, each Fidelity Central Fund's financial statements, which are not covered by the Fund's Report of Independent Registered Public Accounting Firm, are available on the SEC's website or upon request. |
(c) Investment made with cash collateral received from securities on loan. |
(d) Security or a portion of the security is on loan at period end. |
Affiliated Central Funds |
Information regarding fiscal year to date income earned by the Fund from investments in Fidelity Central Funds is as follows: |
Fund | Income earned |
Fidelity Cash Central Fund | $ 77,687 |
Fidelity Securities Lending Cash Central Fund | 199,692 |
Total | $ 277,379 |
Other Information |
The following is a summary of the inputs used, as of October 31, 2011, involving the Fund's assets and liabilities carried at fair value. The inputs or methodology used for valuing securities may not be an indication of the risk associated with investing in those securities. For more information on valuation inputs, and their aggregation into the levels used in the tables below, please refer to the Security Valuation section in the accompanying Notes to Financial Statements. |
Valuation Inputs at Reporting Date: |
Description | Total | Level 1 | Level 2 | Level 3 |
Investments in Securities: | | | | |
Equities: | | | | |
United States of America | $ 560,102,057 | $ 560,102,057 | $ - | $ - |
United Kingdom | 111,657,261 | 49,233,918 | 62,423,343 | - |
Japan | 79,602,287 | - | 79,602,287 | - |
France | 48,971,334 | 44,749,134 | 4,222,200 | - |
Switzerland | 35,979,979 | 31,884,538 | 4,095,441 | - |
Germany | 31,009,906 | 22,353,852 | 8,656,054 | - |
Canada | 24,173,411 | 24,173,411 | - | - |
Netherlands | 17,667,694 | 9,015,710 | 8,651,984 | - |
Australia | 17,140,210 | - | 17,140,210 | - |
Other | 169,124,702 | 95,926,624 | 73,198,078 | - |
Money Market Funds | 54,611,825 | 54,611,825 | - | - |
Total Investments in Securities: | $ 1,150,040,666 | $ 892,051,069 | $ 257,989,597 | $ - |
The following is a reconciliation of Investments in Securities for which Level 3 inputs were used in determining value: |
Investments in Securities: | |
Beginning Balance | $ 34,550 |
Total Realized Gain (Loss) | - |
Total Unrealized Gain (Loss) | - |
Cost of Purchases | - |
Proceeds of Sales | - |
Amortization/Accretion | - |
Transfers in to Level 3 | - |
Transfers out of Level 3 | (34,550) |
Ending Balance | $ - |
The change in unrealized gain (loss) for the period attributable to Level 3 securities held at October 31, 2011 | $ - |
The information used in the above reconciliation represents fiscal year to date activity for any Investments in Securities identified as using Level 3 inputs at either the beginning or the end of the current fiscal period. Transfers in or out of Level 3 represent the beginning value of any Security or Instrument where a change in the pricing level occurred from the beginning to the end of the period. The cost of purchases and the proceeds of sales may include securities received or delivered through corporate actions or exchanges. Realized and unrealized gains (losses) disclosed in the reconciliation are included in Net Gain (Loss) on the Fund's Statement of Operations. |
Income Tax Information |
At October 31, 2011, the Fund had a capital loss carryforward of approximately $43,909,944 all of which will expire in fiscal 2017. Capital loss carryforwards are only available to offset future capital gains of the Fund to the extent provided by regulations and may be limited. |
See accompanying notes which are an integral part of the financial statements.
Annual Report
Fidelity Worldwide Fund
Financial Statements
Statement of Assets and Liabilities
| October 31, 2011 |
| | |
Assets | | |
Investment in securities, at value (including securities loaned of $11,527,651) - See accompanying schedule: Unaffiliated issuers (cost $1,038,238,834) | $ 1,095,428,841 | |
Fidelity Central Funds (cost $54,611,825) | 54,611,825 | |
Total Investments (cost $1,092,850,659) | | $ 1,150,040,666 |
Foreign currency held at value (cost $12) | | 12 |
Receivable for investments sold | | 36,476,232 |
Receivable for fund shares sold | | 974,697 |
Dividends receivable | | 1,205,767 |
Distributions receivable from Fidelity Central Funds | | 21,667 |
Prepaid expenses | | 4,726 |
Other receivables | | 381,445 |
Total assets | | 1,189,105,212 |
| | |
Liabilities | | |
Payable for investments purchased | $ 39,330,913 | |
Payable for fund shares redeemed | 1,365,409 | |
Accrued management fee | 671,958 | |
Distribution and service plan fees payable | 4,710 | |
Other affiliated payables | 262,119 | |
Other payables and accrued
expenses | 71,826 | |
Collateral on securities loaned, at value | 12,725,485 | |
Total liabilities | | 54,432,420 |
| | |
Net Assets | | $ 1,134,672,792 |
Net Assets consist of: | | |
Paid in capital | | $ 1,132,528,887 |
Undistributed net investment income | | 2,700,979 |
Accumulated undistributed net realized gain (loss) on investments and foreign currency transactions | | (57,762,431) |
Net unrealized appreciation (depreciation) on investments and assets and liabilities in foreign
currencies | | 57,205,357 |
Net Assets | | $ 1,134,672,792 |
| October 31, 2011 |
| | |
Calculation of Maximum Offering Price Class A:
Net Asset Value and redemption price per share ($13,153,433 ÷ 735,359 shares) | | $ 17.89 |
| | |
Maximum offering price per share (100/94.25 of $17.89) | | $ 18.98 |
Class T:
Net Asset Value and redemption price per share ($2,186,869 ÷ 122,631 shares) | | $ 17.83 |
| | |
Maximum offering price per share (100/96.50 of $17.83) | | $ 18.48 |
Class B:
Net Asset Value and offering price per share ($255,549 ÷ 14,383 shares)A | | $ 17.77 |
| | |
Class C:
Net Asset Value and offering price per share ($1,296,964 ÷ 73,124 shares)A | | $ 17.74 |
| | |
Worldwide:
Net Asset Value, offering price and redemption price per share ($1,114,693,586 ÷ 61,871,620 shares) | | $ 18.02 |
| | |
Institutional Class:
Net Asset Value, offering price and redemption price per share ($3,086,391 ÷ 171,674 shares) | | $ 17.98 |
A Redemption price per share is equal to net asset value less any applicable contingent deferred sales charge.
See accompanying notes which are an integral part of the financial statements.
Annual Report
Fidelity Worldwide Fund
Financial Statements - continued
Statement of Operations
| Year ended October 31, 2011 |
| | |
Investment Income | | |
Dividends | | $ 20,686,068 |
Interest | | 17,708 |
Income from Fidelity Central Funds | | 277,379 |
Income before foreign taxes withheld | | 20,981,155 |
Less foreign taxes withheld | | (1,097,612) |
Total income | | 19,883,543 |
| | |
Expenses | | |
Management fee
Basic fee | $ 8,486,454 | |
Performance adjustment | 729,662 | |
Transfer agent fees | 2,773,239 | |
Distribution and service plan fees | 54,064 | |
Accounting and security lending fees | 553,421 | |
Custodian fees and expenses | 257,965 | |
Independent trustees' compensation | 6,658 | |
Registration fees | 98,806 | |
Audit | 81,560 | |
Legal | 5,113 | |
Miscellaneous | 11,919 | |
Total expenses before reductions | 13,058,861 | |
Expense reductions | (357,517) | 12,701,344 |
Net investment income (loss) | | 7,182,199 |
Realized and Unrealized Gain (Loss) Net realized gain (loss) on: | | |
Investment securities: | | |
Unaffiliated issuers | 120,978,817 | |
Foreign currency transactions | (435,639) | |
Total net realized gain (loss) | | 120,543,178 |
Change in net unrealized appreciation (depreciation) on: Investment securities (net of decrease in deferred foreign taxes of $556,502) | (94,435,905) | |
Assets and liabilities in foreign currencies | (21,713) | |
Total change in net unrealized appreciation (depreciation) | | (94,457,618) |
Net gain (loss) | | 26,085,560 |
Net increase (decrease) in net assets resulting from operations | | $ 33,267,759 |
Statement of Changes in Net Assets
| Year ended
October 31,
2011 | Year ended
October 31,
2010 |
Increase (Decrease) in Net Assets | | |
Operations | | |
Net investment income (loss) | $ 7,182,199 | $ 5,168,785 |
Net realized gain (loss) | 120,543,178 | 100,330,002 |
Change in net unrealized appreciation (depreciation) | (94,457,618) | 66,991,246 |
Net increase (decrease) in net assets resulting from operations | 33,267,759 | 172,490,033 |
Distributions to shareholders from net investment income | (6,244,141) | (6,419,967) |
Distributions to shareholders from net realized gain | (2,870,519) | (993,213) |
Total distributions | (9,114,660) | (7,413,180) |
Share transactions - net increase (decrease) | 12,558,124 | (61,476,980) |
Redemption fees | 33,448 | 31,293 |
Total increase (decrease) in net assets | 36,744,671 | 103,631,166 |
| | |
Net Assets | | |
Beginning of period | 1,097,928,121 | 994,296,955 |
End of period (including undistributed net investment income of $2,700,979 and undistributed net investment income of $4,480,160, respectively) | $ 1,134,672,792 | $ 1,097,928,121 |
See accompanying notes which are an integral part of the financial statements.
Annual Report
Financial Highlights - Class A
Years ended October 31, | 2011 | 2010 | 2009H |
Selected Per-Share Data | | | |
Net asset value, beginning of period | $ 17.50 | $ 14.96 | $ 10.88 |
Income from Investment Operations | | | |
Net investment income (loss) E | .05 | .03 | (.01) |
Net realized and unrealized gain (loss) | .47 | 2.63 | 4.09 |
Total from investment operations | .52 | 2.66 | 4.08 |
Distributions from net investment income | (.08) | (.10) | - |
Distributions from net realized gain | (.05) | (.02) | - |
Total distributions | (.13) | (.12) | - |
Redemption fees added to paid in capital E,J | - | - | - |
Net asset value, end of period | $ 17.89 | $ 17.50 | $ 14.96 |
Total Return B,C,D | 2.94% | 17.85% | 37.50% |
Ratios to Average Net Assets F, I | | | |
Expenses before reductions | 1.41% | 1.43% | 1.52% A |
Expenses net of fee waivers, if any | 1.40% | 1.43% | 1.52% A |
Expenses net of all reductions | 1.38% | 1.41% | 1.49% A |
Net investment income (loss) | .28% | .21% | (.06)% A |
Supplemental Data | | | |
Net assets, end of period (000 omitted) | $ 13,153 | $ 7,530 | $ 993 |
Portfolio turnover rate G | 203% | 166% | 224% |
A Annualized
B Total returns for periods of less than one year are not annualized.
C Total returns would have been lower if certain expenses had not been reduced during the applicable periods shown.
D Total returns do not include the effect of the sales charges.
E Calculated based on average shares outstanding during the period.
F Fees and expenses of any underlying Fidelity Central Funds are not included in the Fund's expense ratio. The Fund indirectly bears its proportionate share of the expenses of any underlying Fidelity Central Funds.
G Amount does not include the portfolio activity of any underlying Fidelity Central Funds.
H For the period February 19, 2009 (commencement of sale of shares) to October 31, 2009.
I Expense ratios reflect operating expenses of the class. Expenses before reductions do not reflect amounts reimbursed by the investment adviser or reductions from brokerage service arrangements or reductions from other expense offset arrangements and do not represent the amount paid by the class during periods when reimbursements or reductions occur. Expense ratios before reductions for start-up periods may not be representative of longer-term operating periods. Expenses net of fee waivers reflect expenses after reimbursement by the investment adviser but prior to reductions from brokerage service arrangements or other expense offset arrangements. Expenses net of all reductions represent the net expenses paid by the class.
J Amount represents less than $.01 per share.
Financial Highlights - Class T
Years ended October 31, | 2011 | 2010 | 2009 H |
Selected Per-Share Data | | | |
Net asset value, beginning of period | $ 17.46 | $ 14.94 | $ 10.88 |
Income from Investment Operations | | | |
Net investment income (loss) E | .01 | (.01) | (.01) |
Net realized and unrealized gain (loss) | .45 | 2.62 | 4.07 |
Total from investment operations | .46 | 2.61 | 4.06 |
Distributions from net investment income | (.04) | (.08) | - |
Distributions from net realized gain | (.05) | (.02) | - |
Total distributions | (.09) | (.09) K | - |
Redemption fees added to paid in capital E,J | - | - | - |
Net asset value, end of period | $ 17.83 | $ 17.46 | $ 14.94 |
Total Return B,C,D | 2.61% | 17.53% | 37.32% |
Ratios to Average Net Assets F, I | | | |
Expenses before reductions | 1.66% | 1.70% | 1.73% A |
Expenses net of fee waivers, if any | 1.65% | 1.70% | 1.73% A |
Expenses net of all reductions | 1.63% | 1.68% | 1.70% A |
Net investment income (loss) | .03% | (.05)% | (.08)% A |
Supplemental Data | | | |
Net assets, end of period (000 omitted) | $ 2,187 | $ 1,120 | $ 458 |
Portfolio turnover rate G | 203% | 166% | 224% |
A Annualized
B Total returns for periods of less than one year are not annualized.
C Total returns would have been lower if certain expenses had not been reduced during the applicable periods shown.
D Total returns do not include the effect of the sales charges.
E Calculated based on average shares outstanding during the period.
F Fees and expenses of any underlying Fidelity Central Funds are not included in the Fund's expense ratio. The Fund indirectly bears its proportionate share of the expenses of any underlying Fidelity Central Funds.
G Amount does not include the portfolio activity of any underlying Fidelity Central Funds.
H For the period February 19, 2009 (commencement of sale of shares) to October 31, 2009.
I Expense ratios reflect operating expenses of the class. Expenses before reductions do not reflect amounts reimbursed by the investment adviser or reductions from brokerage service arrangements or reductions from other expense offset arrangements and do not represent the amount paid by the class during periods when reimbursements or reductions occur. Expense ratios before reductions for start-up periods may not be representative of longer-term operating periods. Expenses net of fee waivers reflect expenses after reimbursement by the investment adviser but prior to reductions from brokerage service arrangements or other expense offset arrangements. Expenses net of all reductions represent the net expenses paid by the class.
J Amount represents less than $.01 per share.
K Total distributions of $.09 per share is comprised of distributions from net investment income of $.075 and distributions from net realized gain of $.015 per share.
See accompanying notes which are an integral part of the financial statements.
Annual Report
Financial Highlights - Class B
Years ended October 31, | 2011 | 2010 | 2009 H |
Selected Per-Share Data | | | |
Net asset value, beginning of period | $ 17.39 | $ 14.89 | $ 10.88 |
Income from Investment Operations | | | |
Net investment income (loss) E | (.09) | (.09) | (.03) |
Net realized and unrealized gain (loss) | .47 | 2.61 | 4.04 |
Total from investment operations | .38 | 2.52 | 4.01 |
Distributions from net investment income | - | (.01) | - |
Distributions from net realized gain | - | (.01) | - |
Total distributions | - | (.02) | - |
Redemption fees added to paid in capital E,J | - | - | - |
Net asset value, end of period | $ 17.77 | $ 17.39 | $ 14.89 |
Total Return B,C,D | 2.19% | 16.92% | 36.86% |
Ratios to Average Net Assets F,I | | | |
Expenses before reductions | 2.16% | 2.19% | 2.20% A |
Expenses net of fee waivers, if any | 2.16% | 2.19% | 2.20% A |
Expenses net of all reductions | 2.13% | 2.17% | 2.17% A |
Net investment income (loss) | (.47)% | (.55)% | (.30)% A |
Supplemental Data | | | |
Net assets, end of period (000 omitted) | $ 256 | $ 305 | $ 224 |
Portfolio turnover rate G | 203% | 166% | 224% |
A Annualized
B Total returns for periods of less than one year are not annualized.
C Total returns would have been lower if certain expenses had not been reduced during the applicable periods shown.
D Total returns do not include the effect of the contingent deferred sales charge.
E Calculated based on average shares outstanding during the period.
F Fees and expenses of any underlying Fidelity Central Funds are not included in the Fund's expense ratio. The Fund indirectly bears its proportionate share of the expenses of any underlying Fidelity Central Funds.
G Amount does not include the portfolio activity of any underlying Fidelity Central Funds.
H For the period February 19, 2009 (commencement of sale of shares) to October 31, 2009.
I Expense ratios reflect operating expenses of the class. Expenses before reductions do not reflect amounts reimbursed by the investment adviser or reductions from brokerage service arrangements or reductions from other expense offset arrangements and do not represent the amount paid by the class during periods when reimbursements or reductions occur. Expense ratios before reductions for start-up periods may not be representative of longer-term operating periods. Expenses net of fee waivers reflect expenses after reimbursement by the investment adviser but prior to reductions from brokerage service arrangements or other expense offset arrangements. Expenses net of all reductions represent the net expenses paid by the class.
J Amount represents less than $.01 per share.
Financial Highlights - Class C
Years ended October 31, | 2011 | 2010 | 2009 H |
Selected Per-Share Data | | | |
Net asset value, beginning of period | $ 17.36 | $ 14.89 | $ 10.88 |
Income from Investment Operations | | | |
Net investment income (loss) E | (.09) | (.09) | (.04) |
Net realized and unrealized gain (loss) | .47 | 2.61 | 4.05 |
Total from investment operations | .38 | 2.52 | 4.01 |
Distributions from net investment income | - | (.03) | - |
Distributions from net realized gain | - | (.02) | - |
Total distributions | - | (.05) | - |
Redemption fees added to paid in capital E,J | - | - | - |
Net asset value, end of period | $ 17.74 | $ 17.36 | $ 14.89 |
Total Return B,C,D | 2.19% | 16.94% | 36.86% |
Ratios to Average Net Assets F,I | | | |
Expenses before reductions | 2.16% | 2.19% | 2.18% A |
Expenses net of fee waivers, if any | 2.15% | 2.19% | 2.18% A |
Expenses net of all reductions | 2.13% | 2.16% | 2.15% A |
Net investment income (loss) | (.47)% | (.54)% | (.39)% A |
Supplemental Data | | | |
Net assets, end of period (000 omitted) | $ 1,297 | $ 710 | $ 335 |
Portfolio turnover rate G | 203% | 166% | 224% |
A Annualized
B Total returns for periods of less than one year are not annualized.
C Total returns would have been lower if certain expenses had not been reduced during the applicable periods shown.
D Total returns do not include the effect of the contingent deferred sales charge.
E Calculated based on average shares outstanding during the period.
F Fees and expenses of any underlying Fidelity Central Funds are not included in the Fund's expense ratio. The Fund indirectly bears its proportionate share of the expenses of any underlying Fidelity Central Funds.
G Amount does not include the portfolio activity of any underlying Fidelity Central Funds.
H For the period February 19, 2009 (commencement of sale of shares) to October 31, 2009.
I Expense ratios reflect operating expenses of the class. Expenses before reductions do not reflect amounts reimbursed by the investment adviser or reductions from brokerage service arrangements or reductions from other expense offset arrangements and do not represent the amount paid by the class during periods when reimbursements or reductions occur. Expense ratios before reductions for start-up periods may not be representative of longer-term operating periods. Expenses net of fee waivers reflect expenses after reimbursement by the investment adviser but prior to reductions from brokerage service arrangements or other expense offset arrangements. Expenses net of all reductions represent the net expenses paid by the class.
J Amount represents less than $.01 per share.
See accompanying notes which are an integral part of the financial statements.
Annual Report
Financial Highlights - Worldwide
Years ended October 31, | 2011 | 2010 | 2009 | 2008 | 2007 |
Selected Per-Share Data | | | | | |
Net asset value, beginning of period | $ 17.58 | $ 14.98 | $ 13.40 | $ 25.18 | $ 21.82 |
Income from Investment Operations | | | | | |
Net investment income (loss) B | .11 | .08 | .12 | .16 | .14 |
Net realized and unrealized gain (loss) | .48 | 2.63 | 1.63 | (9.44) | 6.05 |
Total from investment operations | .59 | 2.71 | 1.75 | (9.28) | 6.19 |
Distributions from net investment income | (.10) | (.10) | (.17) | (.12) | (.17) |
Distributions from net realized gain | (.05) | (.02) | - | (2.38) | (2.66) |
Total distributions | (.15) | (.11) G | (.17) | (2.50) | (2.83) |
Redemption fees added to paid in capital B,F | - | - | - | - | - |
Net asset value, end of period | $ 18.02 | $ 17.58 | $ 14.98 | $ 13.40 | $ 25.18 |
Total Return A | 3.32% | 18.18% | 13.39% | (40.66)% | 31.87% |
Ratios to Average Net Assets C,E | | | | | |
Expenses before reductions | 1.08% | 1.15% | 1.27% | 1.21% | 1.04% |
Expenses net of fee waivers, if any | 1.08% | 1.15% | 1.27% | 1.21% | 1.04% |
Expenses net of all reductions | 1.05% | 1.12% | 1.24% | 1.19% | 1.02% |
Net investment income (loss) | .60% | .50% | .92% | .84% | .66% |
Supplemental Data | | | | | |
Net assets, end of period (000 omitted) | $ 1,114,694 | $ 1,087,928 | $ 991,996 | $ 934,885 | $ 1,773,603 |
Portfolio turnover rate D | 203% | 166% | 224% | 264% | 128% |
A Total returns would have been lower if certain expenses had not been reduced during the applicable periods shown.
B Calculated based on average shares outstanding during the period.
C Fees and expenses of any underlying Fidelity Central Funds are not included in the Fund's expense ratio. The Fund indirectly bears its proportionate share of the expenses of any underlying Fidelity Central Funds.
D Amount does not include the portfolio activity of any underlying Fidelity Central Funds.
E Expense ratios reflect operating expenses of the class. Expenses before reductions do not reflect amounts reimbursed by the investment adviser or reductions from brokerage service arrangements or reductions from other expense offset arrangements and do not represent the amount paid by the class during periods when reimbursements or reductions occur. Expenses net of fee waivers reflect expenses after reimbursement by the investment adviser but prior to reductions from brokerage service arrangements or other expense offset arrangements. Expenses net of all reductions represent the net expenses paid by the class.
F Amount represents less than $.01 per share.
G Total distributions of $.11 per share is comprised of distributions from net investment income of $.097 and distributions from net realized gain of $.015 per share.
Financial Highlights - Institutional Class
Years ended October 31, | 2011 | 2010 | 2009 G |
Selected Per-Share Data | | | |
Net asset value, beginning of period | $ 17.57 | $ 15.00 | $ 10.88 |
Income from Investment Operations | | | |
Net investment income (loss) D | .10 | .07 | .06 |
Net realized and unrealized gain (loss) | .47 | 2.63 | 4.06 |
Total from investment operations | .57 | 2.70 | 4.12 |
Distributions from net investment income | (.11) | (.11) | - |
Distributions from net realized gain | (.05) | (.02) | - |
Total distributions | (.16) | (.13) | - |
Redemption fees added to paid in capital D,I | - | - | - |
Net asset value, end of period | $ 17.98 | $ 17.57 | $ 15.00 |
Total Return B,C | 3.23% | 18.08% | 37.87% |
Ratios to Average Net Assets E,H | | | |
Expenses before reductions | 1.13% | 1.21% | 1.17% A |
Expenses net of fee waivers, if any | 1.13% | 1.21% | 1.17% A |
Expenses net of all reductions | 1.10% | 1.19% | 1.15% A |
Net investment income (loss) | .56% | .44% | .62% A |
Supplemental Data | | | |
Net assets, end of period (000 omitted) | $ 3,086 | $ 335 | $ 290 |
Portfolio turnover rate F | 203% | 166% | 224% |
A Annualized
B Total returns for periods of less than one year are not annualized.
C Total returns would have been lower if certain expenses had not been reduced during the applicable periods shown.
D Calculated based on average shares outstanding during the period.
E Fees and expenses of any underlying Fidelity Central Funds are not included in the Fund's expense ratio. The Fund indirectly bears its proportionate share of the expenses of any underlying Fidelity Central Funds.
F Amount does not include the portfolio activity of any underlying Fidelity Central Funds.
G For the period February 19, 2009 (commencement of sale of shares) to October 31, 2009.
H Expense ratios reflect operating expenses of the class. Expenses before reductions do not reflect amounts reimbursed by the investment adviser or reductions from brokerage service arrangements or reductions from other expense offset arrangements and do not represent the amount paid by the class during periods when reimbursements or reductions occur. Expense ratios before reductions for start-up periods may not be representative of longer-term operating periods. Expenses net of fee waivers reflect expenses after reimbursement by the investment adviser but prior to reductions from brokerage service arrangements or other expense offset arrangements. Expenses net of all reductions represent the net expenses paid by the class.
I Amount represents less than $.01 per share.
See accompanying notes which are an integral part of the financial statements.
Annual Report
Notes to Financial Statements
For the period ended October 31, 2011
1. Organization.
Fidelity Worldwide Fund (the Fund) is a fund of Fidelity Investment Trust (the Trust) and is authorized to issue an unlimited number of shares. The Trust is registered under the Investment Company Act of 1940, as amended (the 1940 Act), as an open-end management investment company organized as a Massachusetts business trust. The Fund offers Class A, Class T, Class C, Worldwide and Institutional class, each of which, along with class B shares has equal rights as to assets and voting privileges. Effective after the close of business on September 1, 2010, Class B shares were closed to new accounts and additional purchases, except for exchanges and reinvestments by existing shareholders. Each class has exclusive voting rights with respect to matters that affect that class. Class B shares will automatically convert to Class A shares after a holding period of seven years from the initial date of purchase. Investment income, realized and unrealized capital gains and losses, the common expenses of the Fund, and certain fund-level expense reductions, if any, are allocated on a pro-rata basis to each class based on the relative net assets of each class to the total net assets of the Fund. Each class differs with respect to transfer agent and distribution and service plan fees incurred. Certain expense reductions may also differ by class. The Fund's investments in emerging markets can be subject to social, economic, regulatory, and political uncertainties and can be extremely volatile.
2. Investments in Fidelity Central Funds.
The Fund invests in Fidelity Central Funds, which are open-end investment companies available only to other investment companies and accounts managed by Fidelity Management & Research Company (FMR) and its affiliates. The Fund's Schedule of Investments lists each of the Fidelity Central Funds held as of period end, if any, as an investment of the Fund, but does not include the underlying holdings of each Fidelity Central Fund. As an Investing Fund, the Fund indirectly bears its proportionate share of the expenses of the underlying Fidelity Central Funds.
The Money Market Central Funds seek preservation of capital and current income and are managed by Fidelity Investments Money Management, Inc. (FIMM), an affiliate of FMR.
A complete unaudited list of holdings for each Fidelity Central Fund is available upon request or at the Securities and Exchange Commission (the SEC) web site at www.sec.gov. In addition, the financial statements of the Fidelity Central Funds, which are not covered by the Fund's Report of Independent Registered Public Accounting Firm are available on the SEC web site or upon request.
3. Significant Accounting Policies.
The financial statements have been prepared in conformity with accounting principles generally accepted in the United States of America (GAAP), which require management to make certain estimates and assumptions at the date of the financial statements. Actual results could differ from those estimates. Subsequent events, if any, through the date that the financial statements were issued have been evaluated in the preparation of the financial statements. The following summarizes the significant accounting policies of the Fund:
Security Valuation. Investments are valued as of 4:00 p.m. Eastern time on the last calendar day of the period. The Fund uses independent pricing services approved by the Board of Trustees to value its investments. When current market prices or quotations are not readily available or reliable, valuations may be determined in good faith in accordance with procedures adopted by the Board of Trustees. Factors used in determining value may include market or security specific events. The frequency with which these procedures are used cannot be predicted and they may be utilized to a significant extent. The value used for net asset value (NAV) calculation under these procedures may differ from published prices for the same securities.
The Fund categorizes the inputs to valuation techniques used to value its investments into a disclosure hierarchy consisting of three levels as shown below:
Level 1 - quoted prices in active markets for identical investments
Level 2 - other significant observable inputs (including quoted prices for similar investments, interest rates, prepayment speeds, etc.)
Level 3 - unobservable inputs (including the Fund's own assumptions based on the best information available)
Changes in valuation techniques may result in transfers in or out of an assigned level within the disclosure hierarchy. The aggregate value of investments by input level, as of October 31, 2011 as well as a roll forward of Level 3 securities, is included at the end of the Fund's Schedule of Investments. Valuation techniques used to value the Fund's investments by major category are as follows:
Equity securities, including restricted securities, for which market quotations are readily available, are valued at the last reported sale price or official closing price as reported by an independent pricing service on the primary market or exchange on which they are traded and are categorized as Level 1 in the hierarchy. In the event there were no sales during the day or closing prices are not available, securities are valued at the last quoted bid price or may be valued using the last available price and are generally categorized as Level 2 in the hierarchy. For foreign equity securities, when significant market or security specific events arise, comparisons to the valuation of American Depositary Receipts (ADRs), futures contracts, Exchange-traded funds (ETFs) and certain indexes as well as quoted prices for similar securities are used and are categorized as Level 2 in the hierarchy in these
Annual Report
3. Significant Accounting Policies - continued
Security Valuation - continued
circumstances. Utilizing these techniques may result in transfers between Level 1 and Level 2. For restricted equity securities and private placements where observable inputs are limited, assumptions about market activity and risk are used and are categorized as Level 3 in the hierarchy.
Investments in open-end mutual funds, including the Fidelity Central Funds, are valued at their closing net asset value each business day and are categorized as Level 1 in the hierarchy.
Foreign Currency. The Fund may use foreign currency contracts to facilitate transactions in foreign-denominated securities. Gains and losses from these transactions may arise from changes in the value of the foreign currency or if the counterparties do not perform under the contracts' terms.
Foreign-denominated assets, including investment securities, and liabilities are translated into U.S. dollars at the exchange rate at period end. Purchases and sales of investment securities, income and dividends received and expenses denominated in foreign currencies are translated into U.S. dollars at the exchange rate in effect on the transaction date.
The effects of exchange rate fluctuations on investments are included with the net realized and unrealized gain (loss) on investment securities. Other foreign currency transactions resulting in realized and unrealized gain (loss) are disclosed separately.
Investment Transactions and Income. For financial reporting purposes, the Fund's investment holdings and NAV include trades executed through the end of the last business day of the period. The NAV per share for processing shareholder transactions is calculated as of the close of business of the New York Stock Exchange (NYSE) normally 4:00 p.m. Eastern time and includes trades executed through the end of the prior business day. Gains and losses on securities sold are determined on the basis of identified cost and may include proceeds received from litigation. Dividend income is recorded on the ex-dividend date, except for certain dividends from foreign securities where the ex-dividend date may have passed, which are recorded as soon as the Fund is informed of the ex-dividend date. Non-cash dividends included in dividend income, if any, are recorded at the fair market value of the securities received. Distributions received on securities that represent a return of capital or capital gain are recorded as a reduction of cost of investments and/or as a realized gain. The Fund estimates the components of distributions received that may be considered return of capital distributions or capital gain distributions. Interest income and distributions from the Fidelity Central Funds are accrued as earned. Interest income includes coupon interest and amortization of premium and accretion of discount on debt securities. Investment income is recorded net of foreign taxes withheld where recovery of such taxes is uncertain.
Expenses. Expenses directly attributable to a fund are charged to that fund. Expenses attributable to more than one fund are allocated among the respective funds on the basis of relative net assets or other appropriate methods. Expense estimates are accrued in the period to which they relate and adjustments are made when actual amounts are known.
Income Tax Information and Distributions to Shareholders. Each year, the Fund intends to qualify as a regulated investment company, including distributing substantially all of its taxable income and realized gains under Subchapter M of the Internal Revenue Code and filing its U.S. federal tax return. As a result, no provision for income taxes is required. As of October 31, 2011, the Fund did not have any unrecognized tax benefits in the financial statements. A fund's federal tax return is subject to examination by the Internal Revenue Service (IRS) for a period of three years. Foreign taxes are provided for based on the Fund's understanding of the tax rules and rates that exist in the foreign markets in which it invests.
Distributions are declared and recorded on the ex-dividend date. Income dividends and capital gain distributions are declared separately for each class. Income and capital gain distributions are determined in accordance with income tax regulations, which may differ from GAAP. In addition, the Fund claimed a portion of the payment made to redeeming shareholders as a distribution for income tax purposes.
Capital accounts within the financial statements are adjusted for permanent book-tax differences. These adjustments have no impact on net assets or the results of operations. Temporary book-tax differences will reverse in a subsequent period.
Book-tax differences are primarily due to foreign currency transactions, certain foreign taxes, passive foreign investment companies (PFIC), partnerships, equity-debt classifications, deferred trustees compensation, capital loss carryforwards and losses deferred due to wash sales.
The federal tax cost of investment securities and unrealized appreciation (depreciation) as of period end were as follows:
Gross unrealized appreciation | $ 107,207,788 |
Gross unrealized depreciation | (63,870,262) |
Net unrealized appreciation (depreciation) on securities and other investments | $ 43,337,526 |
| |
Tax Cost | $ 1,106,703,140 |
Annual Report
Notes to Financial Statements - continued
3. Significant Accounting Policies - continued
Income Tax Information and Distributions to Shareholders - continued
The tax-based components of distributable earnings as of period end were as follows:
Undistributed ordinary income | $ 2,701,313 |
Capital loss carryfoward | $ (43,909,944) |
Net unrealized appreciation (depreciation) | $ 43,352,876 |
Under the recently enacted Regulated Investment Company Modernization Act of 2010 (the Act), the Fund will be permitted to carry forward capital losses incurred in taxable years beginning after December 22, 2010 for an unlimited period. However, any losses incurred during those future taxable years will be required to be utilized prior to any losses incurred in pre-enactment taxable years, which generally expire after eight years from when they are incurred. Additionally, post-enactment capital losses that are carried forward will retain their character as either short-term or long-term capital losses rather than being considered all short-term as under previous law. The Fund's first fiscal year end subject to the Act will be October 31, 2012.
The tax character of distributions paid was as follows:
| October 31, 2011 | October 31, 2010 |
Ordinary Income | $ 9,114,660 | $ 7,413,180 |
Short-Term Trading (Redemption) Fees. Shares held by investors in the Fund less than 30 days are subject to a redemption fee equal to 1.00% of the net asset value of shares redeemed. All redemption fees, which reduce the proceeds of the shareholder redemption, are retained by the Fund and accounted for as an addition to paid in capital.
New Accounting Pronouncement. In May 2011, the Financial Accounting Standards Board issued Accounting Standard Update No. 2011-04, Fair Value Measurement (Topic 820) - Amendments to Achieve Common Fair Value Measurement and Disclosure Requirements in U.S. GAAP and IFRSs. The update changes the wording used to describe the requirements in GAAP for measuring fair value and for disclosing information about fair value measurements. The update is effective during interim and annual periods beginning after December 15, 2011. Management is currently evaluating the impact of the update's adoption on the Fund's financial statement disclosures.
4. Purchases and Sales of Investments.
Purchases and sales of securities, other than short-term securities, aggregated $2,331,452,718 and $2,340,625,824, respectively.
5. Fees and Other Transactions with Affiliates.
Management Fee. FMR and its affiliates provide the Fund with investment management related services for which the Fund pays a monthly management fee. The management fee is the sum of an individual fund fee rate that is based on an annual rate of .45% of the Fund's average net assets and a group fee rate that averaged .26% during the period. The group fee rate is based upon the average net assets of all the mutual funds advised by FMR. The group fee rate decreases as assets under management increase and increases as assets under management decrease. In addition, the management fee is subject to a performance adjustment (up to a maximum of ±.20% of the Fund's average net assets over a 36 month performance period). The upward or downward adjustment to the management fee is based on the relative investment performance of Worldwide as compared to an appropriate benchmark index. For the period, the total annual management fee rate, including the performance adjustment, was .77% of the Fund's average net assets.
Distribution and Service Plan Fees. In accordance with Rule 12b-1 of the 1940 Act, the Fund has adopted separate Distribution and Service Plans for each class of shares. Certain classes pay Fidelity Distributors Corporation (FDC), an affiliate of FMR, separate Distribution and Service Fees, each of which is based on an annual percentage of each class' average net assets. In addition, FDC may pay financial intermediaries for selling shares of the Fund and providing shareholder support services. For the period, the Distribution and Service Fee rates, total fees and amounts retained by FDC were as follows:
| Distribution
Fee | Service
Fee | Total
Fees | Retained
by FDC |
Class A | -% | .25% | $ 27,830 | $ 7,097 |
Class T | .25% | .25% | 12,334 | 6 |
Class B | .75% | .25% | 3,072 | 2,345 |
Class C | .75% | .25% | 10,828 | 4,607 |
| | | $ 54,064 | $ 14,055 |
Annual Report
5. Fees and Other Transactions with Affiliates - continued
Sales Load. FDC may receive a front-end sales charge of up to 5.75% for selling Class A shares, and 3.50% for selling Class T shares, some of which is paid to financial intermediaries for selling shares of the Fund. Depending on the holding period, FDC may receive contingent deferred sales charges levied on Class A, Class T, Class B, and Class C redemptions. The deferred sales charges range from 5% to 1% for Class B, 1% for Class C, 1.00% for certain purchases of Class A shares and .25% for certain purchases of Class T shares.
For the period, sales charge amounts retained by FDC were as follows:
| Retained
by FDC |
Class A | $ 12,873 |
Class T | 1,872 |
Class B* | 291 |
Class C* | 512 |
| $ 15,548 |
* When Class B and Class C shares are initially sold, FDC pays commissions from its own resources to financial intermediaries through which the sales are made.
Transfer Agent Fees. Fidelity Investments Institutional Operations Company, Inc. (FIIOC), an affiliate of FMR, is the transfer, dividend disbursing and shareholder servicing agent for each class of the Fund. FIIOC receives account fees and asset-based fees that vary according to the account size and type of account of the shareholders of the respective classes of the Fund. FIIOC pays for typesetting, printing and mailing of shareholder reports, except proxy statements. For the period, transfer agent fees for each class were as follows:
| Amount | % of
Average
Net Assets |
Class A | $ 33,823 | .30 |
Class T | 7,470 | .30 |
Class B | 941 | .31 |
Class C | 3,295 | .30 |
Worldwide | 2,724,210 | .23 |
Institutional Class | 3,500 | .28 |
| $ 2,773,239 | |
Accounting and Security Lending Fees. Fidelity Service Company, Inc. (FSC), an affiliate of FMR, maintains the Fund's accounting records. The accounting fee is based on the level of average net assets for the month. Under a separate contract, FSC administers the security lending program. The security lending fee is based on the number and duration of lending transactions.
Brokerage Commissions. The Fund placed a portion of its portfolio transactions with brokerage firms which are affiliates of the investment adviser. The commissions paid to these affiliated firms were $92,473 for the period.
6. Committed Line of Credit.
The Fund participates with other funds managed by FMR or an affiliate in a $4.0 billion credit facility (the "line of credit") to be utilized for temporary or emergency purposes to fund shareholder redemptions or for other short-term liquidity purposes. The Fund has agreed to pay commitment fees on its pro-rata portion of the line of credit, which amounted to $3,661 and is reflected in Miscellaneous expenses on the Statement of Operations. During the period, there were no borrowings on this line of credit.
7. Security Lending.
The Fund lends portfolio securities through a lending agent from time to time in order to earn additional income. For equity securities, a lending agent is used and may loan securities to certain qualified borrowers, including Fidelity Capital Markets (FCM), a broker-dealer affiliated with the Fund. On the settlement date of the loan, the Fund receives collateral (in the form of U.S. Treasury obligations, letters of credit and/or cash) against the loaned securities and maintains collateral in an amount not less than 100% of the market value of the loaned securities during the period of the loan. The market value of the loaned securities is determined at the close of business of the Fund and any additional required collateral is delivered to the Fund on the next business day. If the borrower defaults on its obligation to return the securities loaned because of insolvency or other reasons, a fund could experience delays and costs in recovering the securities loaned or in gaining access to the collateral. Any cash collateral received is invested in the Fidelity Securities Lending Cash Central Fund. The value of loaned securities and cash collateral at period end are disclosed on the Fund's Statement
Annual Report
Notes to Financial Statements - continued
7. Security Lending - continued
of Assets and Liabilities. Security lending income represents the income earned on investing cash collateral, less rebates paid to borrowers, and any lending agent fees associated with the loan, plus any premium payments received for lending certain types of securities. Security lending income is presented in the Statement of Operations as a component of income from Fidelity Central Funds. Total security lending income during the period amounted to $199,692. During the period, there were no securities loaned to FCM.
8. Expense Reductions.
FMR voluntarily agreed to reimburse a portion of its management fee. For the period, the amount of this reimbursement was $51,129.
Many of the brokers with whom FMR places trades on behalf of the Fund provided services to the Fund in addition to trade execution. These services included payments of certain expenses on behalf of the Fund totaling $306,388 for the period.
9. Distributions to Shareholders.
Distributions to shareholders of each class were as follows:
Years ended October 31, | 2011 | 2010 |
From net investment income | | |
Class A | $ 36,687 | $ 9,814 |
Class T | 3,024 | 2,409 |
Class B | - | 75 |
Class C | - | 827 |
Worldwide | 6,199,611 | 6,404,601 |
Institutional Class | 4,819 | 2,241 |
Total | $ 6,244,141 | $ 6,419,967 |
From net realized gain | | |
Class A | $ 20,664 | $ 1,404 |
Class T | 3,280 | 480 |
Class B | - | 191 |
Class C | - | 373 |
Worldwide | 2,844,643 | 990,471 |
Institutional Class | 1,932 | 294 |
Total | $ 2,870,519 | $ 993,213 |
10. Share Transactions.
Transactions for each class of shares were as follows:
| Shares | Dollars |
Years ended October 31, | 2011 | 2010 | 2011 | 2010 |
Class A | | | | |
Shares sold | 446,295 | 404,777 | $ 8,440,354 | $ 6,463,954 |
Reinvestment of distributions | 2,409 | 589 | 44,007 | 9,399 |
Shares redeemed | (143,732) | (41,328) | (2,654,718) | (668,935) |
Net increase (decrease) | 304,972 | 364,038 | $ 5,829,643 | $ 5,804,418 |
Class T | | | | |
Shares sold | 307,740 | 57,729 | $ 5,853,479 | $ 930,150 |
Reinvestment of distributions | 344 | 156 | 6,293 | 2,498 |
Shares redeemed | (249,620) | (24,377) | (4,835,753) | (385,540) |
Net increase (decrease) | 58,464 | 33,508 | $ 1,024,019 | $ 547,108 |
Class B | | | | |
Shares sold | 3,768 | 11,168 | $ 71,519 | $ 177,092 |
Reinvestment of distributions | - | 16 | - | 260 |
Shares redeemed | (6,939) | (8,709) | (128,598) | (138,098) |
Net increase (decrease) | (3,171) | 2,475 | $ (57,079) | $ 39,254 |
Annual Report
10. Share Transactions - continued
| Shares | Dollars |
Years ended October 31, | 2011 | 2010 | 2011 | 2010 |
Class C | | | | |
Shares sold | 41,472 | 34,028 | $ 784,669 | $ 543,674 |
Reinvestment of distributions | - | 68 | - | 1,087 |
Shares redeemed | (9,227) | (15,747) | (167,760) | (246,126) |
Net increase (decrease) | 32,245 | 18,349 | $ 616,909 | $ 298,635 |
Worldwide | | | | |
Shares sold | 12,255,493 | 8,421,228 | $ 231,984,939 | $ 135,177,567 |
Reinvestment of distributions | 480,262 | 449,494 | 8,805,760 | 7,194,622 |
Shares redeemed | (12,736,797) | (13,209,138) | (238,335,100) | (210,537,866) |
Net increase (decrease) | (1,042) | (4,338,416) | $ 2,455,599 | $ (68,165,677) |
Institutional Class | | | | |
Shares sold | 162,911 | 9,920 | $ 2,875,496 | $ 162,697 |
Reinvestment of distributions | 360 | 158 | 6,581 | 2,535 |
Shares redeemed | (10,647) | (10,397) | (193,044) | (165,950) |
Net increase (decrease) | 152,624 | (319) | $ 2,689,033 | $ (718) |
11. Other.
The Fund's organizational documents provide former and current trustees and officers with a limited indemnification against liabilities arising in connection with the performance of their duties to the Fund. In the normal course of business, the Fund may also enter into contracts that provide general indemnifications. The Fund's maximum exposure under these arrangements is unknown as this would be dependent on future claims that may be made against the Fund. The risk of material loss from such claims is considered remote.
Annual Report
Report of Independent Registered Public Accounting Firm
To the Trustees of Fidelity Investment Trust and Shareholders of Fidelity Worldwide Fund:
We have audited the accompanying statement of assets and liabilities of Fidelity Worldwide Fund (the Fund), a fund of Fidelity Investment Trust, including the schedule of investments, as of October 31, 2011, and the related statement of operations for the year then ended, the statement of changes in net assets for each of the two years in the period then ended, and the financial highlights for each of the five years in the period then ended. These financial statements and financial highlights are the responsibility of the Fund's management. Our responsibility is to express an opinion on these financial statements and financial highlights based on our audits.
We conducted our audits in accordance with the standards of the Public Company Accounting Oversight Board (United States). Those standards require that we plan and perform the audit to obtain reasonable assurance about whether the financial statements and financial highlights are free of material misstatement. The Fund is not required to have, nor were we engaged to perform, an audit of its internal control over financial reporting. Our audits included consideration of internal control over financial reporting as a basis for designing audit procedures that are appropriate in the circumstances, but not for the purpose of expressing an opinion on the effectiveness of the Fund's internal control over financial reporting. Accordingly, we express no such opinion. An audit also includes examining, on a test basis, evidence supporting the amounts and disclosures in the financial statements, assessing the accounting principles used and significant estimates made by management, as well as evaluating the overall financial statement presentation. Our procedures included confirmation of securities owned as of October 31, 2011, by correspondence with the custodians and brokers; where replies were not received from brokers, we performed other auditing procedures. We believe that our audits provide a reasonable basis for our opinion.
In our opinion, the financial statements and financial highlights referred to above present fairly, in all material respects, the financial position of Fidelity Worldwide Fund as of October 31, 2011, the results of its operations for the year then ended, the changes in its net assets for each of the two years in the period then ended, and the financial highlights for each of the five years in the period then ended, in conformity with accounting principles generally accepted in the United States of America.
DELOITTE & TOUCHE LLP
Boston, Massachusetts
December 16, 2011
Annual Report
Trustees and Officers
The Trustees, Members of the Advisory Board, and executive officers of the trust and fund, as applicable, are listed below. The Board of Trustees governs the fund and is responsible for protecting the interests of shareholders. The Trustees are experienced executives who meet periodically throughout the year to oversee the fund's activities, review contractual arrangements with companies that provide services to the fund, oversee management of the risks associated with such activities and contractual arrangements, and review the fund's performance. Except for James C. Curvey, each of the Trustees oversees 226 funds advised by FMR or an affiliate. Mr. Curvey oversees 429 funds advised by FMR or an affiliate.
The Trustees hold office without limit in time except that (a) any Trustee may resign; (b) any Trustee may be removed by written instrument, signed by at least two-thirds of the number of Trustees prior to such removal; (c) any Trustee who requests to be retired or who has become incapacitated by illness or injury may be retired by written instrument signed by a majority of the other Trustees; and (d) any Trustee may be removed at any special meeting of shareholders by a two-thirds vote of the outstanding voting securities of the trust. Each Trustee who is not an interested person (as defined in the 1940 Act) (Independent Trustee), shall retire not later than the last day of the calendar year in which his or her 75th birthday occurs. The Independent Trustees may waive this mandatory retirement age policy with respect to individual Trustees. The executive officers and Advisory Board Members hold office without limit in time, except that any officer and Advisory Board Member may resign or may be removed by a vote of a majority of the Trustees at any regular meeting or any special meeting of the Trustees. Except as indicated, each individual has held the office shown or other offices in the same company for the past five years.
Experience, Skills, Attributes, and Qualifications of the Fund's Trustees. The Governance and Nominating Committee has adopted a statement of policy that describes the experience, qualifications, attributes, and skills that are necessary and desirable for potential Independent Trustee candidates (Statement of Policy). The Board believes that each Trustee satisfied at the time he or she was initially elected or appointed a Trustee, and continues to satisfy, the standards contemplated by the Statement of Policy. The Governance and Nominating Committee also engages professional search firms to help identify potential Independent Trustee candidates who have the experience, qualifications, attributes, and skills consistent with the Statement of Policy. From time to time, additional criteria based on the composition and skills of the current Independent Trustees, as well as experience or skills that may be appropriate in light of future changes to board composition, business conditions, and regulatory or other developments, have also been considered by the professional search firms and the Governance and Nominating Committee. In addition, the Board takes into account the Trustees' commitment and participation in Board and committee meetings, as well as their leadership of standing and ad hoc committees throughout their tenure.
In determining that a particular Trustee was and continues to be qualified to serve as a Trustee, the Board has considered a variety of criteria, none of which, in isolation, was controlling. The Board believes that, collectively, the Trustees have balanced and diverse experience, qualifications, attributes, and skills, which allow the Board to operate effectively in governing the fund and protecting the interests of shareholders. Information about the specific experience, skills, attributes, and qualifications of each Trustee, which in each case led to the Board's conclusion that the Trustee should serve (or continue to serve) as a trustee of the fund, is provided below.
Board Structure and Oversight Function. James C. Curvey is an interested person (as defined in the 1940 Act) and currently serves as Acting Chairman. The Trustees have determined that an interested Chairman is appropriate and benefits shareholders because an interested Chairman has a personal and professional stake in the quality and continuity of services provided to the fund. Independent Trustees exercise their informed business judgment to appoint an individual of their choosing to serve as Chairman, regardless of whether the Trustee happens to be independent or a member of management. The Independent Trustees have determined that they can act independently and effectively without having an Independent Trustee serve as Chairman and that a key structural component for assuring that they are in a position to do so is for the Independent Trustees to constitute a substantial majority for the Board. The Independent Trustees also regularly meet in executive session. Ned C. Lautenbach serves as Chairman of the Independent Trustees and as such (i) acts as a liaison between the Independent Trustees and management with respect to matters important to the Independent Trustees and (ii) with management prepares agendas for Board meetings.
Fidelity funds are overseen by different Boards of Trustees. The fund's Board oversees Fidelity's equity and high income funds and another Board oversees Fidelity's investment-grade bond, money market, and asset allocation funds. The asset allocation funds may invest in Fidelity funds overseen by the fund's Board. The use of separate Boards, each with its own committee structure, allows the Trustees of each group of Fidelity funds to focus on the unique issues of the funds they oversee, including common research, investment, and operational issues. On occasion, the separate Boards establish joint committees to address issues of overlapping consequences for the Fidelity funds overseen by each Board.
The Trustees operate using a system of committees to facilitate the timely and efficient consideration of all matters of importance to the Trustees, the fund, and fund shareholders and to facilitate compliance with legal and regulatory requirements and oversight of the fund's activities and associated risks. The Board, acting through its committees, has charged FMR and its affiliates with (i) identifying events or circumstances the occurrence of which could have demonstrably adverse effects on the fund's business and/or reputation; (ii) implementing processes and controls to lessen the possibility that such events or circumstances occur or to mitigate the effects of such events or circumstances if they do occur; and (iii) creating and maintaining a system designed to evaluate continuously business and market conditions in order to facilitate the identification and implementation processes described in (i) and (ii) above. Because the day-to-day operations and activities of the fund are carried out by or through FMR, its affiliates and other service providers, the fund's exposure to risks is mitigated but not eliminated by the processes overseen by the Trustees. While each of the Board's committees has responsibility for overseeing different aspects of the fund's activities, oversight is exercised primarily through the Operations, Audit, and Compliance Committees. In addition, the Independent Trustees have worked with FMR to enhance the Board's oversight of investment and financial risks, legal and regulatory risks, technology risks, and operational risks, including the development of additional risk reporting to the Board. For example, a working group comprised of Independent Trustees and FMR has worked and continues to work to review the Fidelity funds' valuation-related activities, reporting and risk management. Appropriate personnel, including but not limited to the fund's Chief Compliance Officer (CCO), FMR's internal auditor, the independent accountants, the fund's Treasurer and portfolio management personnel, make periodic reports to the Board's committees, as appropriate, including an annual review of FMR's risk management program for the Fidelity funds. The responsibilities of each standing committee, including their oversight responsibilities, are described further under "Standing Committees of the Fund's Trustees."
Annual Report
Trustees and Officers - continued
The fund's Statement of Additional Information (SAI) includes more information about the Trustees. To request a free copy, call Fidelity at 1-877-208-0098.
Interested Trustees*:
Correspondence intended for each Trustee who is an interested person may be sent to Fidelity Investments, 82 Devonshire Street, Boston, Massachusetts 02109.
Name, Age; Principal Occupations and Other Relevant Experience+ |
James C. Curvey (76) |
| Year of Election or Appointment: 2007 Mr. Curvey is Trustee and Acting Chairman of the Board of Trustees of certain Trusts. Mr. Curvey also serves as Trustee (2007-present) of other investment companies advised by FMR. Mr. Curvey is a Director of Fidelity Investments Money Management, Inc. (2009-present), Director of Fidelity Research & Analysis Co. (2009-present) and Director of FMR and FMR Co., Inc. (2007-present). Mr. Curvey is also Vice Chairman (2007-present) and Director of FMR LLC. In addition, Mr. Curvey serves as an Overseer for the Boston Symphony Orchestra and a member of the Trustees of Villanova University. Previously, Mr. Curvey was the Vice Chairman (2006-2007) and Director (2000-2007) of FMR Corp. |
Ronald P. O'Hanley (54) |
| Year of Election or Appointment: 2011 Mr. O'Hanley is Director of FMR Co., Inc. (2010-present), Director of Fidelity Investments Money Management, Inc. (2010-present), Director of Fidelity Research & Analysis Company (2010-present), President of Fidelity Asset Management and Corporate Services and a member of Fidelity's Executive Committee (2010-present). Previously, Mr. O'Hanley served as President and Chief Executive Officer of BNY Mellon Asset Management (2007-2010). Mr. O'Hanley also served as Vice Chairman of Bank New York Mellon Corp. and a member of that firm's Executive Committee. Prior to the 2007 merger of The Bank of New York and Mellon Financial Corporation, he was Vice Chairman of Mellon Financial Corporation and President and Chief Executive Officer of Mellon Asset Management. He joined Mellon in February 1997. Mr. O'Hanley currently serves as Chairman of the Boston Public Library Foundation Board of Directors and sits on the Board of Directors of Beth Israel Deaconess Medical Center, the Board of Trustees of the Marine Biological Laboratory and the Advisory Board of the Maxwell School of Citizenship and Public Administration at Syracuse University. Mr. O'Hanley also chairs the Council on Asset Management for the Financial Services Roundtable and is a member of the Board of Directors of Institutional Investor's U.S. Institute. |
* Trustees have been determined to be "Interested Trustees" by virtue of, among other things, their affiliation with the trust or various entities under common control with FMR.
+ The information above includes each Trustee's principal occupation during the last five years and other information relating to the experience, attributes, and skills relevant to each Trustee's qualifications to serve as a Trustee, which led to the conclusion that each Trustee should serve as a Trustee for the fund.
Independent Trustees:
Correspondence intended for each Independent Trustee (that is, the Trustees other than the Interested Trustees) may be sent to Fidelity Investments, P.O. Box 55235, Boston, Massachusetts 02205-5235.
Name, Age; Principal Occupations and Other Relevant Experience+ |
Dennis J. Dirks (63) |
| Year of Election or Appointment: 2005 Prior to his retirement in May 2003, Mr. Dirks was Chief Operating Officer and a member of the Board of The Depository Trust & Clearing Corporation (DTCC). He also served as President, Chief Operating Officer, and Board member of The Depository Trust Company (DTC) and President and Board member of the National Securities Clearing Corporation (NSCC). In addition, Mr. Dirks served as Chief Executive Officer and Board member of the Government Securities Clearing Corporation, Chief Executive Officer and Board member of the Mortgage-Backed Securities Clearing Corporation, as a Trustee and a member of the Finance Committee of Manhattan College (2005-2008), and as a Trustee and a member of the Finance Committee of AHRC of Nassau County (2006-2008). Mr. Dirks is a member of the Independent Directors Council (IDC) Governing Council (2010-Present) and Board of Directors for The Brookville Center for Children's Services, Inc. (2009-present). |
Alan J. Lacy (58) |
| Year of Election or Appointment: 2008 Mr. Lacy serves as Senior Adviser (2007-present) of Oak Hill Capital Partners, L.P. (private equity). Mr. Lacy also served as Chief Executive Officer (2000-2005) and Vice Chairman (2005-2006) of Sears Holdings Corporation and Sears, Roebuck and Co. (retail). In addition, Mr. Lacy serves as a member of the Board of Directors of Dave & Buster's, Inc. (restaurant and entertainment complexes, 2010-present), The Hillman Companies, Inc. (hardware wholesalers, 2010-present), and Bristol-Myers Squibb Company (global pharmaceuticals, 2007-present). Mr. Lacy is a member of the Board of Trustees of The National Parks Conservation Association (2006-Present). Previously, Mr. Lacy served as Chairman of the Board of Trustees of the National Parks Conservation Association (2008-2011) and as a member of the Board of Directors for the Western Union Company (global money transfer, 2006-2011). |
Ned C. Lautenbach (67) |
| Year of Election or Appointment: 2000 Mr. Lautenbach is Chairman of the Independent Trustees of the Equity and High Income Funds (2006-present). Mr. Lautenbach currently serves as the Lead Director of the Eaton Corporation Board of Directors (diversified industrial, 1997-present). Mr. Lautenbach is also a member of the Board of Directors of the Philharmonic Center for the Arts in Naples, Florida (1999-present); a member of the Board of Trustees of Fairfield University (2005-present); and a member of the Council on Foreign Relations (1994-present). Previously, Mr. Lautenbach was a Partner/Advisory Partner at Clayton, Dubilier & Rice, LLC (private equity investment, 1998-2010), as well as a Director of Sony Corporation (2006-2007). |
Joseph Mauriello (67) |
| Year of Election or Appointment: 2008 Prior to his retirement in January 2006, Mr. Mauriello served in numerous senior management positions including Deputy Chairman and Chief Operating Officer (2004-2005), and Vice Chairman of Financial Services (2002-2004) of KPMG LLP US (professional services, 1965-2005). Mr. Mauriello currently serves as a member of the Board of Directors of XL Group plc. (global insurance and re-insurance, 2006-present) and of Arcadia Resources Inc. (health care services and products, 2007-present). Previously, Mr. Mauriello served as a Director of the Hamilton Funds of the Bank of New York (2006-2007). |
Robert W. Selander (61) |
| Year of Election or Appointment: 2011 Previously, Mr. Selander served as a Member of the Advisory Board of Fidelity's Equity and High Income Funds (2011), Executive Vice Chairman (2010), Chief Executive Officer (2009-2010), and President and Chief Executive Officer (1997-2009) of Mastercard, Inc. |
Cornelia M. Small (67) |
| Year of Election or Appointment: 2005 Ms. Small is a member of the Board of Directors of the Teagle Foundation (2009-present). Ms. Small is also a member of the Investment Committee, and Chair (2008-present) and a member of the Board of Trustees of Smith College. In addition, Ms. Small serves on the Investment Committee of the Berkshire Taconic Community Foundation (2008-present). Previously, Ms. Small served as Chairperson of the Investment Committee (2002-2008) of Smith College. In addition, Ms. Small served as Chief Investment Officer, Director of Global Equity Investments, and a member of the Board of Directors of Scudder, Stevens & Clark and Scudder Kemper Investments. |
William S. Stavropoulos (72) |
| Year of Election or Appointment: 2001 Mr. Stavropoulos is Vice Chairman of the Independent Trustees of the Equity and High Income Funds (2006-present). Mr. Stavropoulos serves as President and Founder of the Michigan Baseball Foundation, the Great Lakes Loons (2007-present). Mr. Stavropoulos is Chairman Emeritus of the Board of Directors of The Dow Chemical Company, where he previously served in numerous senior management positions, including President, CEO (1995-2000; 2002-2004), Chairman of the Executive Committee (2000-2006), and as a member of the Board of Directors (1990-2006). Currently, Mr. Stavropoulos is Chairman of Univar (global distributor of commodity and specialty chemicals, 2010-present), a Director of Teradata Corporation (data warehousing and technology solutions, 2008-present), Chemical Financial Corporation, Maersk Inc. (industrial conglomerate), Tyco International, Inc. (multinational manufacturing and services, 2007-present), and a member of the Advisory Board for Metalmark Capital (private equity investment, 2005-present). Mr. Stavropoulos is a special advisor to Clayton, Dubilier & Rice, LLC (private equity investment). In addition, Mr. Stavropoulos is a member of the University of Notre Dame Advisory Council for the College of Science. |
David M. Thomas (62) |
| Year of Election or Appointment: 2008 Previously, Mr. Thomas served as Executive Chairman (2005-2006) and Chairman and Chief Executive Officer (2000-2005) of IMS Health, Inc. (pharmaceutical and healthcare information solutions). In addition, Mr. Thomas serves as a member of the Board of Directors of Fortune Brands, Inc. (consumer products), and Interpublic Group of Companies, Inc. (marketing communication, 2004-present). |
Michael E. Wiley (61) |
| Year of Election or Appointment: 2008 Mr. Wiley also serves as a Director of Asia Pacific Exploration Consolidated (international oil and gas exploration and production, 2008-present). Mr. Wiley serves as a Director of Tesoro Corporation (independent oil refiner and marketer, 2005-present), and a Director of Bill Barrett Corporation (exploration and production, 2005-present). In addition, Mr. Wiley also serves as a Director of Post Oak Bank (privately-held bank, 2004-present). Previously, Mr. Wiley served as a member of the Board of Trustees of the University of Tulsa (2000-2006; 2007-2010), as a Senior Energy Advisor of Katzenbach Partners, LLC (consulting, 2006-2007), as an Advisory Director of Riverstone Holdings (private investment), Chairman, President, and CEO of Baker Hughes, Inc. (oilfield services, 2000-2004), and as Director of Spinnaker Exploration Company (exploration and production, 2001-2005). |
+ The information above includes each Trustee's principal occupation during the last five years and other information relating to the experience, attributes, and skills relevant to each Trustee's qualifications to serve as a Trustee, which led to the conclusion that each Trustee should serve as a Trustee for the fund.
Advisory Board Members and Executive Officers:
Correspondence intended for each executive officer, Edward C. Johnson 3d, and Peter S. Lynch may be sent to Fidelity Investments, 82 Devonshire Street, Boston, Massachusetts 02109.
Name, Age; Principal Occupation |
Edward C. Johnson 3d (81) |
| Year of Election or Appointment: 2011 Member of the Advisory Board of Fidelity's Equity and High Income Funds. Mr. Johnson serves as Chief Executive Officer, Chairman, and a Director of FMR LLC, and also serves as Chairman and Director of FIL Limited. Previously, Mr. Johnson served as a Trustee and Chairman of the Board of certain Fidelity Trusts, Chairman and a Director of FMR, Chairman and a Director of FMR Co., Inc., and President of FMR LLC (2006-2007). |
Peter S. Lynch (67) |
| Year of Election or Appointment: 2003 Member of the Advisory Board of Fidelity's Equity and High Income Funds. Mr. Lynch is Vice Chairman and a Director of FMR and FMR Co., Inc. In addition, Mr. Lynch serves as a Trustee of Boston College and as the Chairman of the Inner-City Scholarship Fund. Previously, Mr. Lynch served on the Special Olympics International Board of Directors (1997-2006). |
Kenneth B. Robins (42) |
| Year of Election or Appointment: 2008 President and Treasurer of Fidelity's Equity and High Income Funds. Mr. Robins also serves as President and Treasurer (2010-present) and Assistant Treasurer (2009-present) of other Fidelity funds and is an employee of Fidelity Investments (2004-present). Previously, Mr. Robins served as Deputy Treasurer of the Fidelity funds (2005-2008) and Treasurer and Chief Financial Officer of The North Carolina Capital Management Trust: Cash and Term Portfolios (2006-2008). |
Bruce T. Herring (46) |
| Year of Election or Appointment: 2006 Vice President of certain Equity Funds. Mr. Herring also serves as Chief Investment Officer and Director of Fidelity Management & Research (U.K.) Inc. (2010-present) and Group Chief Investments Officer of FMR. Previously, Mr. Herring served as Vice President (2005-2006) and Senior Vice President (2006-2007) of Fidelity Management & Research Company, Vice President of FMR Co., Inc. (2001-2007) and as a portfolio manager for Fidelity U.S. Equity Funds. |
Brian B. Hogan (47) |
| Year of Election or Appointment: 2009 Vice President of Equity and High Income Funds. Mr. Hogan also serves as President of FMR's Equity Division (2009-present). Previously, Mr. Hogan served as Senior Vice President, Equity Research of FMR (2006-2009) and as a portfolio manager. |
Scott C. Goebel (43) |
| Year of Election or Appointment: 2008 Secretary and Chief Legal Officer (CLO) of the Fidelity funds. Mr. Goebel also serves as Secretary of Fidelity Investments Money Management, Inc. (FIMM) (2010-present) and Fidelity Research and Analysis Company (FRAC) (2010-present); Secretary and CLO of The North Carolina Capital Management Trust: Cash and Term Portfolios (2008-present); General Counsel, Secretary, and Senior Vice President of FMR (2008-present) and FMR Co., Inc. (2008-present); employed by FMR LLC or an affiliate (2001-present); Chief Legal Officer of Fidelity Management & Research (Hong Kong) Limited (2008-present) and Assistant Secretary of Fidelity Management & Research (Japan) Inc. (2008-present), and Fidelity Management & Research (U.K.) Inc. (2008-present). Previously, Mr. Goebel served as Assistant Secretary of FIMM (2008-2010), FRAC (2008-2010), and the Funds (2007-2008) and as Vice President and Secretary of Fidelity Distributors Corporation (FDC) (2005-2007). |
William C. Coffey (42) |
| Year of Election or Appointment: 2009 Assistant Secretary of Fidelity's Equity and High Income Funds. Mr. Coffey also serves as Senior Vice President and Deputy General Counsel of FMR LLC (2010-present), and is an employee of Fidelity Investments. Previously, Mr. Coffey served as Vice President and Associate General Counsel of FMR LLC (2005-2009). |
Holly C. Laurent (57) |
| Year of Election or Appointment: 2008 Anti-Money Laundering (AML) Officer of the Fidelity funds. Ms. Laurent also serves as AML Officer of The North Carolina Capital Management Trust: Cash and Term Portfolios (2008-present) and is an employee of Fidelity Investments. Previously, Ms. Laurent was Senior Vice President and Head of Legal for Fidelity Business Services India Pvt. Ltd. (2006-2008), and Senior Vice President, Deputy General Counsel and Group Head for FMR LLC (2005-2006). |
Christine Reynolds (53) |
| Year of Election or Appointment: 2008 Chief Financial Officer of the Fidelity funds. Ms. Reynolds became President of Fidelity Pricing and Cash Management Services (FPCMS) in August 2008. Ms. Reynolds served as Chief Operating Officer of FPCMS (2007-2008). Previously, Ms. Reynolds served as President, Treasurer, and Anti-Money Laundering officer of the Fidelity funds (2004-2007). |
Kenneth A. Rathgeber (64) |
| Year of Election or Appointment: 2004 Chief Compliance Officer of Fidelity's Equity and High Income Funds. Mr. Rathgeber is Chief Compliance Officer of Fidelity Management & Research (Hong Kong) Limited (2008-present), Fidelity Management & Research (Japan) Inc. (2008-present), FMR (2005-present), FMR Co., Inc. (2005-present), Fidelity Management & Research (U.K.) Inc. (2005-present), Fidelity Research & Analysis Company (2005-present), Fidelity Investments Money Management, Inc. (2005-present), Pyramis Global Advisors, LLC (2005-present), and Strategic Advisers, Inc. (2005-present). |
Jeffrey S. Christian (50) |
| Year of Election or Appointment: 2009 Deputy Treasurer of the Fidelity funds. Mr. Christian is an employee of Fidelity Investments. Previously, Mr. Christian served as Chief Financial Officer (2008-2009) of certain Fidelity funds and Senior Vice President of Fidelity Pricing and Cash Management Services (FPCMS) (2004-2009). |
Joseph F. Zambello (54) |
| Year of Election or Appointment: 2011 Deputy Treasurer of the Fidelity funds. Mr. Zambello is an employee of Fidelity Investments. Previously, Mr. Zambello served as Vice President of FMR's Program Management Group (2009-2011) and Vice President of the Transfer Agent Oversight Group (2005-2009). |
Adrien E. Deberghes (44) |
| Year of Election or Appointment: 2008 Deputy Treasurer of Fidelity's Equity and High Income Funds. Mr. Deberghes also serves as Vice President and Assistant Treasurer of Fidelity Rutland Square Trust II and Fidelity Commonwealth Trust II (2011-present), Assistant Treasurer of other Fidelity funds (2010-present), and is an employee of Fidelity Investments (2008-present). Previously, Mr. Deberghes served as Senior Vice President of Mutual Fund Administration at State Street Corporation (2007-2008), Senior Director of Mutual Fund Administration at Investors Bank & Trust (2005-2007), and Director of Finance for Dunkin' Brands (2000-2005). |
Stephanie J. Dorsey (42) |
| Year of Election or Appointment: 2010 Assistant Treasurer of Fidelity's Equity and High Income Funds. Ms. Dorsey also serves as Deputy Treasurer of other Fidelity funds (2008-present) and is an employee of Fidelity Investments (2008-present). Previously, Ms. Dorsey served as Treasurer (2004-2008) of the JPMorgan Mutual Funds and Vice President (2004-2008) of JPMorgan Chase Bank. |
John R. Hebble (53) |
| Year of Election or Appointment: 2009 Assistant Treasurer of Fidelity's Equity and High Income Funds. Mr. Hebble also serves as President (2011-present), Treasurer, and Chief Financial Officer of The North Carolina Capital Management Trust: Cash and Term Portfolios (2008-present), President and Treasurer of other Fidelity funds (2008-present) and is an employee of Fidelity Investments. |
Gary W. Ryan (53) |
| Year of Election or Appointment: 2005 Assistant Treasurer of the Fidelity funds. Mr. Ryan is an employee of Fidelity Investments. Previously, Mr. Ryan served as Vice President of Fund Reporting in Fidelity Pricing and Cash Management Services (FPCMS) (1999-2005). |
Jonathan Davis (43) |
| Year of Election or Appointment: 2010 Assistant Treasurer of the Fidelity funds. Mr. Davis is also Assistant Treasurer of Fidelity Rutland Square Trust II and Fidelity Commonwealth Trust II. Mr. Davis is an employee of Fidelity Investments. Previously, Mr. Davis served as Vice President and Associate General Counsel of FMR LLC (2003-2010). |
Annual Report
Distributions (Unaudited)
Institutional Class designates 38% and 64% of the dividends distributed on December 3, 2010 and December 30, 2010, respectively during the fiscal year as qualifying for the dividends-received deduction for corporate shareholders.
Institutional Class designates 100% of the dividends distributed during the fiscal year as amounts which may be taken into account as a dividend for purposes of the maximum rate under section 1(h)(11) of the Internal Revenue Code.
The amounts per share which represent income derived from sources within, and taxes paid to, foreign countries or possessions of the United States are as follows:
| Pay Date | Income | Taxes |
Institutional Class | 12/06/10 | $0.127 | $0.0105 |
| 12/31/10 | $0.019 | $0.0000 |
The fund will notify shareholders in January 2012 of amounts for use in preparing 2011 income tax returns.
Annual Report
Board Approval of Investment Advisory Contracts and Management Fees
Fidelity Worldwide Fund
Each year, the Board of Trustees, including the Independent Trustees (together, the Board), votes on the renewal of the management contract and sub-advisory agreements (together, the Advisory Contracts) for the fund. The Board, assisted by the advice of fund counsel and Independent Trustees' counsel, requests and considers a broad range of information relevant to the renewal of the Advisory Contracts throughout the year.
The Board meets regularly and considers at each of its meetings factors that are relevant to its annual consideration of the renewal of the fund's Advisory Contracts, including the services and support provided to the fund and its shareholders. The Board has established various standing committees, each composed of Independent Trustees with varying backgrounds, to which the Board has assigned specific subject matter responsibilities in order to enhance effective decision-making by the Board. The Board, acting directly and through its Committees, requests and receives information concerning the annual consideration of the renewal of the fund's Advisory Contracts. The Board also meets as needed to consider matters specifically related to the Board's annual consideration of the renewal of Advisory Contracts. Members of the Board may also meet with trustees of other Fidelity funds through ad hoc joint committees to discuss certain matters relevant to the Fidelity funds.
At its July 2011 meeting, the Board of Trustees, including the Independent Trustees, unanimously determined to renew the fund's Advisory Contracts. In reaching its determination, the Board considered all factors it believed relevant, including (i) the nature, extent, and quality of the services to be provided to the fund and its shareholders (including the investment performance of the fund); (ii) the competitiveness of the fund's management fee and total expense ratio; (iii) the total costs of the services to be provided by and the profits to be realized by Fidelity from its relationship with the fund; (iv) the extent to which economies of scale would be realized as the fund grows; and (v) whether fee levels reflect these economies of scale, if any, for the benefit of fund shareholders.
In considering whether to renew the Advisory Contracts for the fund, the Board reached a determination, with the assistance of fund counsel and Independent Trustees' counsel and through the exercise of its business judgment, that the renewal of the Advisory Contracts is in the best interests of the fund and its shareholders and that the compensation payable under the Advisory Contracts is fair and reasonable. The Board's decision to renew the Advisory Contracts was not based on any single factor, but rather was based on a comprehensive consideration of all the information provided to the Board at its meetings throughout the year. The Board, in reaching its determination to renew the Advisory Contracts, is aware that shareholders in the fund have a broad range of investment choices available to them, including a wide choice among mutual funds offered by Fidelity's competitors, and that the fund's shareholders, who have the opportunity to review and weigh the disclosure provided by the fund in its prospectus and other public disclosures, have chosen to invest in this fund, managed by Fidelity.
Nature, Extent, and Quality of Services Provided. The Board considered the staffing within the investment adviser, FMR, and the sub-advisers (together, the Investment Advisers), including the backgrounds of the fund's investment personnel and the fund's investment objective and discipline. The Independent Trustees also had discussions with senior management of Fidelity's investment operations and investment groups. The Board considered the structure of the portfolio manager compensation program and whether this structure provides appropriate incentives to act in the best interests of the fund.
Resources Dedicated to Investment Management and Support Services. The Board and the Fund Oversight and Research Committees reviewed the general qualifications and capabilities of the Investment Advisers' investment staff, including its size, education, experience, and resources, as well as the Investment Advisers' approach to recruiting, training, managing, and compensating investment personnel. The Board also noted that FMR has devoted increased resources to non-U.S. offices. The Board noted that Fidelity's analysts have extensive resources, tools and capabilities which allow them to conduct sophisticated quantitative and fundamental analysis, as well as credit analysis of issuers, counterparties and enhancers. The Board also believes that Fidelity's investment professionals have sufficient access to global information and data so as to provide competitive investment results over time, and that those professionals also have access to sophisticated tools which permit them to assess portfolio construction and risk and performance attribution characteristics continuously, as well as to transmit new information and research conclusions rapidly around the world. Additionally, in their deliberations, the Board considered the Investment Advisers' trading capabilities and resources which are an integral part of the investment management process.
Shareholder and Administrative Services. The Board considered (i) the nature, extent, quality, and cost of advisory, administrative, and shareholder services performed by the Investment Advisers and their affiliates under the Advisory Contracts and under separate agreements covering transfer agency, pricing and bookkeeping, and securities lending services for the fund; (ii) the nature and extent of the investment adviser's supervision of third party service providers, principally custodians and subcustodians; and (iii) the resources devoted to, and the record of compliance with, the fund's compliance policies and procedures. The Board also reviewed the allocation of fund brokerage, including allocations to brokers affiliated with the Investment Advisers, the use of brokerage commissions to pay fund expenses, and the use of "soft" commission dollars to pay for research services.
The Board noted that the growth of fund assets over time across the complex allows Fidelity to reinvest in the development of services designed to enhance the value or convenience of the Fidelity funds as investment vehicles. These services include 24-hour access to account information and market information through telephone representatives and over the Internet, investor education materials and asset allocation tools, and the expanded availability of Fidelity Investor Centers, with 35 new branches opening since 2010.
Annual Report
Board Approval of Investment Advisory Contracts and Management Fees - continued
Investment in a Large Fund Family. The Board considered the benefits to shareholders of investing in a Fidelity fund, including the benefits of investing in a fund that is part of a large family of funds offering a variety of investment disciplines and providing a large variety of mutual fund investor services. The Board noted that Fidelity had taken, or had made recommendations that resulted in the Fidelity funds taking, a number of actions over the previous year that benefited particular funds, including (i) continuing to dedicate additional resources to investment research and support of the senior management team that oversees asset management; (ii) rationalizing product lines through the mergers of six funds into other funds; (iii) continuing to migrate the Freedom Funds to dedicated lower cost underlying funds; (iv) obtaining shareholder approval to broaden the investment strategies for Fidelity Consumer Finance Portfolio, Fidelity Emerging Asia Fund, and Fidelity Environment and Alternative Energy Portfolio; (v) contractually agreeing to reduce the management fees and impose other expense limitations on Spartan 500 Index Fund and U.S. Bond Index Fund in connection with launching new institutional classes of these funds; (vi) changing the name, primary and supplemental benchmarks, and investment policies of Fidelity Global Strategies Fund to support the fund's flexible investment mandate and global orientation; and (vii) reducing the transfer agency account fee rates on certain accounts.
Investment Performance. The Board considered whether the fund has operated in accordance with its investment objective, as well as its record of compliance with its investment restrictions. It also reviewed the fund's absolute investment performance for each class, as well as the fund's relative investment performance for each class measured over multiple periods against (i) a broad-based securities market index, and (ii) a peer group of mutual funds deemed appropriate by Fidelity and reviewed by the Board. The following charts considered by the Board show, over the one-, three-, and five-year periods ended December 31, 2010, as available, the cumulative total returns of the retail class and Class B of the fund, the cumulative total returns of a broad-based securities market index ("benchmark"), and a range of cumulative total returns of a peer group of mutual funds identified by Morningstar, Inc. as having an investment style similar to that of the fund based on underlying portfolio holdings. The returns of the retail class and Class B show the performance of the highest performing class (based on five-year performance) and the lowest performing class (based on one-year performance), respectively. The box within each chart shows the 25th percentile return (bottom of box) and the 75th percentile return (top of box) of the peer group. Returns shown above the box are in the first quartile and returns shown below the box are in the fourth quartile. The percentage beaten numbers noted below each chart correspond to the percentile box and represent the percentage of funds in the peer group whose performance was equal to or lower than that of the class indicated.
Fidelity Worldwide Fund
The Board reviewed the fund's relative investment performance against its peer group and noted that the performance of the retail class of the fund was in the first quartile for the one-year period and the second quartile for the three- and five-year periods. The Board also noted that the investment performance of the retail class of the fund compared favorably to its benchmark for all the periods shown. The Board considered that the variations in performance among the fund's classes reflect the variations in class expenses, which result in lower performance for higher expense classes. The Board also reviewed the fund's performance since inception as well as performance in the current year.
The Board also considered that the fund's management fee is subject to upward or downward adjustment depending upon whether, and to what extent, the fund's investment performance for the performance period exceeds, or is exceeded by, the record (over the same period) of a Board-approved performance adjustment index. The Board noted that the performance adjustment provides FMR with a strong economic incentive to seek to achieve superior performance for the fund's shareholders and helps to more closely align the interests of FMR and the fund's shareholders.
Annual Report
Based on its review, the Board concluded that the nature, extent, and quality of services provided to the fund under the Advisory Contracts should benefit the fund's shareholders.
Competitiveness of Management Fee and Total Expense Ratio. The Board considered the fund's management fee and total expense ratio compared to "mapped groups" of competitive funds and classes. Fidelity creates "mapped groups" by combining similar Lipper investment objective categories that have comparable management fee characteristics. Combining Lipper investment objective categories aids the Board's management fee and total expense ratio comparisons by broadening the competitive group used for comparison and by reducing the number of universes to which various Fidelity funds are compared.
Management Fee. The Board considered two proprietary management fee comparisons for the 12-month periods shown in the chart below. The group of Lipper funds used by the Board for management fee comparisons is referred to below as the "Total Mapped Group." The Total Mapped Group comparison focuses on a fund's standing relative to the total universe of comparable funds available to investors in terms of gross management fees before expense reimbursements or caps, and without giving effect to the fund's performance adjustment. "TMG %" represents the percentage of funds in the Total Mapped Group that had management fees that were lower than the fund's. For example, a TMG % of 16% means that 84% of the funds in the Total Mapped Group had higher management fees than the fund. The "Asset-Size Peer Group" (ASPG) comparison focuses on a fund's standing relative to non-Fidelity funds similar in size to the fund within the Total Mapped Group. The ASPG represents at least 15% of the funds in the Total Mapped Group with comparable asset size and management fee characteristics, subject to a minimum of 50 funds (or all funds in the Total Mapped Group if fewer than 50). Additional information, such as the ASPG quartile in which the fund's management fee ranked and the impact of the fund's performance adjustment, is also included in the chart and considered by the Board.
Fidelity Worldwide Fund
The Board noted that the fund's management fee ranked below the median of its Total Mapped Group and below the median of its ASPG for 2010. The Board also noted the effect of the fund's positive performance adjustment on the fund's management fee ranking. The Board noted that the performance adjustment for each year represents calculations for performance periods that differ from the periods shown in the performance charts above.
Based on its review, the Board concluded that the fund's management fee is fair and reasonable in light of the services that the fund receives and the other factors considered.
Total Expense Ratio. In its review of each class's total expense ratio, the Board considered the fund's management fee as well as other fund or class expenses, as applicable, such as transfer agent fees, pricing and bookkeeping fees, fund-paid 12b-1 fees, and custodial, legal, and audit fees. The Board also noted the effects of any waivers and reimbursements on fees and expenses, as well as the impact of the fund's performance adjustment. As part of its review, the Board also considered the current and historical total expense ratios of each class of the fund compared to competitive fund median expenses. Each class of the fund is compared to those funds and classes in the Total Mapped Group (used by the Board for management fee comparisons) that have a similar sales load structure.
The Board noted that the total expense ratio of each of Class A, Class B, Class C, and the retail class of the fund ranked below its competitive median for 2010 and the total expense ratio of each of Class T and Institutional Class ranked above its competitive median for 2010. The Board considered that various factors, including 12b-1 fees, positive or negative performance adjustments, and relatively higher other expenses in the case of small fund size, can affect total expense ratios. The Board noted that the total expense ratio of Class T was above the competitive median primarily because of higher 12b-1 fees on Class T. Class T has a higher 12b 1 fee, but a lower front-end sales charge, than traditionally priced front-end sales charge classes. The Board noted that the fund offers multiple classes, each of which has a different sales load and 12b-1 fee structure, and that the multiple structures are intended to offer a range of pricing options for the intermediary market. The Board also noted that the total expense ratios of the classes vary primarily by the level of their 12b-1 fees, although differences in transfer agent fees may also cause expenses to vary from class to class.
Annual Report
Board Approval of Investment Advisory Contracts and Management Fees - continued
Fees Charged to Other Fidelity Clients. The Board also considered Fidelity fee structures and other information with respect to clients of FMR and its affiliates, such as other mutual funds advised or subadvised by FMR or its affiliates, pension plan clients, and other institutional clients. In March 2010, the Board created an ad hoc joint committee with the board of other Fidelity funds (the Committee) to review and compare Fidelity's institutional investment advisory business with its business of providing services to the Fidelity funds, including the differences in services provided, fees charged, and costs incurred, as well as competition in their respective marketplaces.
Based on its review of total expense ratios and fees charged to other Fidelity clients, the Board concluded that the total expense ratio of each class of the fund was reasonable, although in some cases above the median of the universe presented for comparison, in light of the services that the fund and its shareholders receive and the other factors considered, including the findings of the Committee.
Costs of the Services and Profitability. The Board considered the revenues earned and the expenses incurred by Fidelity in conducting the business of developing, marketing, distributing, managing, administering and servicing the fund and its shareholders. The Board also considered the level of Fidelity's profits in respect of all the Fidelity funds.
On an annual basis, FMR presents to the Board Fidelity's profitability for the fund. Fidelity calculates the profitability for each fund, as well as aggregate profitability for groups of Fidelity funds and all Fidelity funds, using a series of detailed revenue and cost allocation methodologies which originate with the books and records of Fidelity on which Fidelity's audited financial statements are based. The Audit Committee of the Board reviews any significant changes from the prior year's methodologies.
PricewaterhouseCoopers LLP (PwC), independent registered public accounting firm and auditor to Fidelity and certain Fidelity funds, has been engaged annually by the Board as part of the Board's assessment of Fidelity's profitability analysis. PwC's engagement includes the review and assessment of Fidelity's methodologies used in determining the revenues and expenses attributable to Fidelity's mutual fund business, and completion of agreed-upon procedures surrounding the mathematical accuracy of fund profitability and its conformity to allocation methodologies. After considering PwC's reports issued under the engagement and information provided by Fidelity, the Board concluded that while other allocation methods may also be reasonable, Fidelity's profitability methodologies are reasonable in all material respects.
The Board also reviewed Fidelity's non-fund businesses and fall-out benefits related to the mutual fund business as well as cases where Fidelity's affiliates may benefit from or be related to the fund's business.
The Board considered the costs of the services provided by and the profits realized by Fidelity in connection with the operation of the fund and was satisfied that the profitability was not excessive in the circumstances.
Economies of Scale. The Board considered whether there have been economies of scale in respect of the management of the Fidelity funds, whether the Fidelity funds (including the fund) have appropriately benefited from any such economies of scale, and whether there is potential for realization of any further economies of scale. The Board considered the extent to which the fund will benefit from economies of scale through increased services to the fund, through waivers or reimbursements, or through fee or expense reductions. The Board also noted that in 2009, it and the board of other Fidelity funds created an ad hoc committee (the Economies of Scale Committee) to analyze whether FMR attains economies of scale in respect of the management and servicing of the Fidelity funds, whether the Fidelity funds have appropriately benefited from such economies of scale, and whether there is potential for realization of any further economies of scale.
The Board recognized that the fund's management contract incorporates a "group fee" structure, which provides for lower group fee rates as total fund assets under FMR's management increase, and for higher group fee rates as total fund assets under FMR's management decrease. FMR calculates the group fee rates based on a tiered asset "breakpoint" schedule that varies based on asset class. The Board considered that the group fee is designed to deliver the benefits of economies of scale to fund shareholders when total Fidelity fund assets increase, even if assets of any particular fund are unchanged or have declined, because some portion of Fidelity's costs are attributable to services provided to all Fidelity funds, and all funds benefit if those costs can be allocated among more assets. The Board concluded that, given the group fee structure, fund shareholders will benefit from lower management fees as assets under FMR's management increase at the fund complex level, regardless of whether Fidelity achieves any such economies of scale.
The Board concluded, taking into account the analysis of the Economies of Scale Committee, that any potential economies of scale are being appropriately shared between fund shareholders and Fidelity.
Additional Information Requested by the Board. In order to develop fully the factual basis for consideration of the Fidelity funds' Advisory Contracts, the Board requested and received additional information on certain topics, including (i) fund performance trends, actions to be taken by FMR to improve certain funds' overall performance, and Fidelity's long-term strategies for certain funds; (ii) portfolio manager changes that have occurred during the past year and length of portfolio manager tenure for different categories of funds over time; (iii) Fidelity's compensation structure for portfolio managers and other key personnel and strategies for attracting and retaining non-investment personnel; (iv) the amount of the investment that each portfolio manager has made in the Fidelity fund(s) that he or she manages; (v) historical trends in Fidelity's realization of fall-out benefits; (vi) Fidelity's group fee structures and the rationale for the individual fee rates of certain funds; (vii) fund profitability methodology and the impact of certain factors on fund profitability results; (viii) trends regarding industry use of performance fee structures and Fidelity's compliance practices with respect to performance adjustment calculations; (ix) the fee structures in place for certain other Fidelity clients; and (x) explanations regarding the relative total expense ratios of certain funds and classes, total expense competitive trends, and actions that might be taken by FMR to reduce total expense ratios for certain funds and classes.
Annual Report
Based on its evaluation of all of the conclusions noted above, and after considering all factors it believed relevant, the Board ultimately concluded that the advisory fee structures are fair and reasonable, and that the fund's Advisory Contracts should be renewed.
Annual Report
Annual Report
Investment Adviser
Fidelity Management & Research Company
Boston, MA
Investment Sub-Advisers
FMR Co., Inc.
Fidelity Management & Research
(U.K.) Inc.
FIL Investments (Japan) Limited
FIL Investment Advisors
FIL Investment Advisors
(UK) Limited
Fidelity Management & Research
(Hong Kong) Limited
Fidelity Management & Research
(Japan) Inc.
General Distributor
Fidelity Distributors Corporation
Boston, MA
Transfer and Service Agents
Fidelity Investments Institutional
Operations Company, Inc.
Boston, MA
Fidelity Service Company, Inc.
Boston, MA
Custodian
JPMorgan Chase Bank
New York, NY
(Fidelity Logo)
Corporate Headquarters
82 Devonshire St., Boston, MA 02109
www.fidelity.com
AWLDI-UANN-1211
1.883436.102
Item 2. Code of Ethics
As of the end of the period, October 31, 2011, Fidelity Investment Trust (the trust) has adopted a code of ethics, as defined in Item 2 of Form N-CSR, that applies to its President and Treasurer and its Chief Financial Officer. A copy of the code of ethics is filed as an exhibit to this Form N-CSR.
Item 3. Audit Committee Financial Expert
The Board of Trustees of the trust has determined that Joseph Mauriello is an audit committee financial expert, as defined in Item 3 of Form N-CSR. Mr. Mauriello is independent for purposes of Item 3 of Form N-CSR.
Item 4. Principal Accountant Fees and Services
Fees and Services
The following table presents fees billed by Deloitte & Touche LLP, the member firms of Deloitte Touche Tohmatsu, and their respective affiliates (collectively, "Deloitte Entities") in each of the last two fiscal years for services rendered to Fidelity Diversified International Fund, Fidelity Emerging Europe, Middle East, Africa (EMEA) Fund, Fidelity International Capital Appreciation Fund, Fidelity International Small Cap Fund, Fidelity International Small Cap Opportunities Fund, Fidelity International Value Fund, Fidelity Series Emerging Markets Fund, Fidelity Series International Small Cap Fund, Fidelity Series International Value Fund, Fidelity Total International Equity Fund, and Fidelity Worldwide Fund (the "Funds"):
Services Billed by Deloitte Entities
October 31, 2011 FeesA
| Audit Fees | Audit-Related Fees | Tax Fees | All Other Fees |
Fidelity Diversified International Fund | $90,000 | $- | $6,800 | $3,100 |
Fidelity Emerging Europe, Middle East, Africa (EMEA) Fund | $50,000 | $- | $5,900 | $300 |
Fidelity International Capital Appreciation Fund | $49,000 | $- | $6,800 | $300 |
Fidelity International Small Cap Fund | $120,000 | $- | $6,800 | $300 |
Fidelity International Small Cap Opportunities Fund | $49,000 | $- | $5,700 | $300 |
Fidelity International Value Fund | $47,000 | $- | $5,700 | $300 |
Fidelity Series Emerging Markets Fund | $39,000 | $- | $6,800 | $600 |
Fidelity Series International Small Cap Fund | $43,000 | $- | $5,700 | $400 |
Fidelity Series International Value Fund | $43,000 | $- | $5,700 | $800 |
Fidelity Total International Equity Fund | $59,000 | $- | $6,600 | $300 |
Fidelity Worldwide Fund | $50,000 | $- | $5,700 | $400 |
October 31, 2010 FeesA, B
| Audit Fees | Audit-Related Fees | Tax Fees | All Other Fees |
Fidelity Diversified International Fund | $89,000 | $- | $6,600 | $- |
Fidelity Emerging Europe, Middle East, Africa (EMEA) Fund | $49,000 | $- | $5,800 | $- |
Fidelity International Capital Appreciation Fund | $48,000 | $- | $6,600 | $- |
Fidelity International Small Cap Fund | $118,000 | $- | $6,600 | $- |
Fidelity International Small Cap Opportunities Fund | $48,000 | $- | $5,600 | $- |
Fidelity International Value Fund | $46,000 | $- | $5,600 | $- |
Fidelity Series Emerging Markets Fund | $31,000 | $- | $6,600 | $- |
Fidelity Series International Small Cap Fund | $33,000 | $- | $5,600 | $- |
Fidelity Series International Value Fund | $33,000 | $- | $5,600 | $- |
Fidelity Total International Equity Fund | $58,000 | $- | $6,400 | $- |
Fidelity Worldwide Fund | $49,000 | $- | $5,700 | $- |
A Amounts may reflect rounding.
B Fidelity Series International Small Cap Fund and Fidelity Series International Value Fund commenced operations on December 3, 2009.
The following table presents fees billed by PricewaterhouseCoopers LLP ("PwC") in each of the last two fiscal years for services rendered to Fidelity Global Commodity Stock Fund, Fidelity International Discovery Fund, Fidelity International Growth Fund, Fidelity Overseas Fund and Fidelity Series International Growth Fund (the "Funds"):
Services Billed by PwC
October 31, 2011 FeesA
| Audit Fees | Audit-Related Fees | Tax Fees | All Other Fees |
Fidelity Global Commodity Stock Fund | $41,000 | $- | $2,700 | $2,000 |
Fidelity International Discovery Fund | $80,000 | $- | $11,500 | $6,300 |
Fidelity International Growth Fund | $54,000 | $- | $5,100 | $1,700 |
Fidelity Overseas Fund | $68,000 | $- | $18,800 | $4,100 |
Fidelity Series International Growth Fund | $46,000 | $- | $5,100 | $4,300 |
October 31, 2010 FeesA, B
| Audit Fees | Audit-Related Fees | Tax Fees | All Other Fees |
Fidelity Global Commodity Stock Fund | $35,000 | $- | $2,600 | $1,800 |
Fidelity International Discovery Fund | $80,000 | $- | $9,700 | $6,300 |
Fidelity International Growth Fund | $51,000 | $- | $4,900 | $1,700 |
Fidelity Overseas Fund | $71,000 | $- | $27,700 | $4,900 |
Fidelity Series International Growth Fund | $36,000 | $- | $4,900 | $2,300 |
A Amounts may reflect rounding.
B Fidelity Series International Growth Fund commenced operations on December 3, 2009.
The following table presents fees billed by PwC and Deloitte Entities that were required to be approved by the Audit Committee for services that relate directly to the operations and financial reporting of the Funds and that are rendered on behalf of Fidelity Management & Research Company ("FMR") and entities controlling, controlled by, or under common control with FMR (not including any sub-adviser whose role is primarily portfolio management and is subcontracted with or overseen by another investment adviser) that provide ongoing services to the Funds ("Fund Service Providers"):
Services Billed by Deloitte Entities
| October 31, 2011A | October 31, 2010A |
Audit-Related Fees | $440,000 | $720,000 |
Tax Fees | $- | $- |
All Other Fees | $430,000 | $790,000 |
A Amounts may reflect rounding.
Services Billed by PwC
| October 31, 2011A | October 31, 2010A |
Audit-Related Fees | $3,835,000 | $2,150,000 |
Tax Fees | $- | $- |
All Other Fees | $- | $510,000 |
A Amounts may reflect rounding.
"Audit-Related Fees" represent fees billed for assurance and related services that are reasonably related to the performance of the fund audit or the review of the fund's financial statements and that are not reported under Audit Fees.
"Tax Fees" represent fees billed for tax compliance, tax advice or tax planning that relate directly to the operations and financial reporting of the fund.
"All Other Fees" represent fees billed for services provided to the fund or Fund Service Provider, a significant portion of which are assurance related, that relate directly to the operations and financial reporting of the fund, excluding those services that are reported under Audit Fees, Audit-Related Fees or Tax Fees.
Assurance services must be performed by an independent public accountant.
* * *
The aggregate non-audit fees billed by PwC and Deloitte Entities for services rendered to the Funds, FMR (not including any sub-adviser whose role is primarily portfolio management and is subcontracted with or overseen by another investment adviser), and any Fund Service Provider for each of the last two fiscal years of the Funds are as follows:
Billed By | October 31, 2011 A | October 31, 2010 A |
PwC | $5,895,000 | $5,265,000 |
Deloitte Entities | $1,035,000 | $1,665,000 |
A Amounts may reflect rounding.
The trust's Audit Committee has considered non-audit services that were not pre-approved that were provided by PwC and Deloitte Entities to Fund Service Providers to be compatible with maintaining the independence of PwC and Deloitte Entities in their audits of the Funds, taking into account representations from PwC and Deloitte Entities, in accordance with Public Company Accounting Oversight Board rules, regarding their independence from the Funds and their related entities and FMR's review of the appropriateness and permissibility under applicable law of such non-audit services prior to their provision to the Fund Service Providers.
Audit Committee Pre-Approval Policies and Procedures
The trust's Audit Committee must pre-approve all audit and non-audit services provided by a fund's independent registered public accounting firm relating to the operations or financial reporting of the fund. Prior to the commencement of any audit or non-audit services to a fund, the Audit Committee reviews the services to determine whether they are appropriate and permissible under applicable law.
The Audit Committee has adopted policies and procedures to, among other purposes, provide a framework for the Committee's consideration of non-audit services by the audit firms that audit the Fidelity funds. The policies and procedures require that any non-audit service provided by a fund audit firm to a Fidelity fund and any non-audit service provided by a fund auditor to a Fund Service Provider that relates directly to the operations and financial reporting of a Fidelity fund ("Covered Service") are subject to approval by the Audit Committee before such service is provided.
All Covered Services must be approved in advance of provision of the service either: (i) by formal resolution of the Audit Committee, or (ii) by oral or written approval of the service by the Chair of the Audit Committee (or if the Chair is unavailable, such other member of the Audit Committee as may be designated by the Chair to act in the Chair's absence). The approval contemplated by (ii) above is permitted where the Treasurer determines that action on such an engagement is necessary before the next meeting of the Audit Committee.
Non-audit services provided by a fund audit firm to a Fund Service Provider that do not relate directly to the operations and financial reporting of a Fidelity fund are reported to the Audit Committee on a periodic basis.
Non-Audit Services Approved Pursuant to Rule 2-01(c)(7)(i)(C) and (ii) of Regulation S-X ("De Minimis Exception")
There were no non-audit services approved or required to be approved by the Audit Committee pursuant to the De Minimis Exception during the Funds' last two fiscal years relating to services provided to (i) the Funds or (ii) any Fund Service Provider that relate directly to the operations and financial reporting of the Funds.
Item 5. Audit Committee of Listed Registrants
Not applicable.
Item 6. Investments
(a) Not applicable.
(b) Not applicable
Item 7. Disclosure of Proxy Voting Policies and Procedures for Closed-End Management Investment Companies
Not applicable.
Item 8. Portfolio Managers of Closed-End Management Investment Companies
Not applicable.
Item 9. Purchase of Equity Securities by Closed-End Management Investment Company and Affiliated Purchasers
Not applicable.
Item 10. Submission of Matters to a Vote of Security Holders
There were no material changes to the procedures by which shareholders may recommend nominees to the trust's Board of Trustees.
Item 11. Controls and Procedures
(a)(i) The President and Treasurer and the Chief Financial Officer have concluded that the trust's disclosure controls and procedures (as defined in Rule 30a-3(c) under the Investment Company Act) provide reasonable assurances that material information relating to the trust is made known to them by the appropriate persons, based on their evaluation of these controls and procedures as of a date within 90 days of the filing date of this report.
(a)(ii) There was no change in the trust's internal control over financial reporting (as defined in Rule 30a-3(d) under the Investment Company Act) that occurred during the second fiscal quarter of the period covered by this report that has materially affected, or is reasonably likely to materially affect, the trust's internal control over financial reporting.
Item 12. Exhibits
(a) | (1) | Code of Ethics pursuant to Item 2 of Form N-CSR is filed and attached hereto as EX-99.CODE ETH. |
(a) | (2) | Certification pursuant to Rule 30a-2(a) under the Investment Company Act of 1940 (17 CFR 270.30a-2(a)) is filed and attached hereto as Exhibit 99.CERT. |
(a) | (3) | Not applicable. |
(b) | | Certification pursuant to Rule 30a-2(b) under the Investment Company Act of 1940 (17 CFR 270.30a-2(b)) is furnished and attached hereto as Exhibit 99.906CERT. |
SIGNATURES
Pursuant to the requirements of the Securities Exchange Act of 1934 and the Investment Company Act of 1940, the registrant has duly caused this report to be signed on its behalf by the undersigned, thereunto duly authorized.
Fidelity Investment Trust
By: | /s/Kenneth B. Robins |
| Kenneth B. Robins |
| President and Treasurer |
| |
Date: | December 30, 2011 |
Pursuant to the requirements of the Securities Exchange Act of 1934 and the Investment Company Act of 1940, this report has been signed below by the following persons on behalf of the registrant and in the capacities and on the dates indicated.
By: | /s/Kenneth B. Robins |
| Kenneth B. Robins |
| President and Treasurer |
| |
Date: | December 30, 2011 |
By: | /s/Christine Reynolds |
| Christine Reynolds |
| Chief Financial Officer |
| |
Date: | December 30, 2011 |