UNITED STATES
SECURITIES AND EXCHANGE COMMISSION
Washington, D.C. 20549
FORM N-CSR
CERTIFIED SHAREHOLDER REPORT OF REGISTERED
MANAGEMENT INVESTMENT COMPANIES
Investment Company Act file number 811-4008
Fidelity Investment Trust
(Exact name of registrant as specified in charter)
245 Summer St., Boston, Massachusetts 02210
(Address of principal executive offices) (Zip code)
Scott C. Goebel, Secretary
245 Summer St.
Boston, Massachusetts 02210
(Name and address of agent for service)
Registrant's telephone number, including area code: 617-563-7000
Date of fiscal year end: | October 31 |
| |
Date of reporting period: | October 31, 2013 |
This report on Form N-CSR relates solely to the Registrant's Fidelity Canada Fund, Fidelity China Region Fund, Fidelity Emerging Asia Fund, Fidelity Emerging Markets Fund, Fidelity Europe Fund, Fidelity Europe Capital Appreciation Fund, Fidelity Japan Fund, Fidelity Japan Smaller Companies Fund, Fidelity Latin America Fund, Fidelity Nordic Fund and Fidelity Pacific Basin Fund (each, a "Fund" and collectively, the "Funds").
Item 1. Reports to Stockholders
Fidelity's
Targeted International Equity
Funds®
Fidelity® Canada Fund
Fidelity China Region Fund
Fidelity Emerging Asia Fund
Fidelity Emerging Markets Fund
Fidelity Europe Capital Appreciation Fund
Fidelity Europe Fund
Fidelity Japan Fund
Fidelity Japan Smaller Companies Fund
Fidelity Latin America Fund
Fidelity Nordic Fund
Fidelity Pacific Basin Fund
Annual Report
October 31, 2013
(Fidelity Cover Art)
Contents
To view a fund's proxy voting guidelines and proxy voting record for the 12-month period ended June 30, visit http://www.fidelity.com/proxyvotingresults or visit the Securities and Exchange Commission's (SEC) web site at http://www.sec.gov. You may also call 1-800-544-8544 to request a free copy of the proxy voting guidelines.
Standard & Poor's, S&P and S&P 500 are registered service marks of The McGraw-Hill Companies, Inc. and have been licensed for use by Fidelity Distributors Corporation.
Other third-party marks appearing herein are the property of their respective owners.
All other marks appearing herein are registered or unregistered trademarks or service marks of FMR LLC or an affiliated company. © 2013 FMR LLC. All rights reserved.
Annual Report
This report and the financial statements contained herein are submitted for the general information of the shareholders of the funds. This report is not authorized for distribution to prospective investors in the funds unless preceded or accompanied by an effective prospectus.
A fund files its complete schedule of portfolio holdings with the SEC for the first and third quarters of each fiscal year on Form N-Q. Forms N-Q are available on the SEC's web site at http://www.sec.gov. A fund's Forms N-Q may be reviewed and copied at the SEC's Public Reference Room in Washington, DC. Information regarding the operation of the SEC's Public Reference Room may be obtained by calling 1-800-SEC-0330. For a complete list of a fund's portfolio holdings, view the most recent holdings listing, semiannual report, or annual report on Fidelity's web site at http://www.fidelity.com, http://www.advisor.fidelity.com, or http://www.401k.com, as applicable.
NOT FDIC INSURED • MAY LOSE VALUE • NO BANK GUARANTEE
Neither the funds nor Fidelity Distributors Corporation is a bank.
Annual Report
Note to shareholders
On September 18, 2013, the Board of Trustees approved a proposal to merge Fidelity® Europe Capital Appreciation Fund into Fidelity® Europe Fund. Shareholders of Fidelity Europe Capital Appreciation Fund are expected to meet on February 12, 2014, to vote on the proposal. If approved, the merger is expected to be completed on or about March 21, 2014. Fidelity Europe Capital Appreciation Fund closed to new investors after the close of business on July 19, 2013.
The note above is not a solicitation of any proxy. More detailed information about the Reorganization is contained in the proxy statement, which is now available.
Annual Report
Fidelity Canada Fund
Average annual total return reflects the change in the value of an investment, assuming reinvestment of the class' distributions from dividend income and capital gains (the profits earned upon the sale of securities that have grown in value, if any) and assuming a constant rate of performance each year. The $10,000 table and the fund's returns do not reflect the deduction of taxes that a shareholder would pay on fund distributions or the redemption of fund shares. During periods of reimbursement by Fidelity, a fund's total return will be greater than it would be had the reimbursement not occurred. How a fund did yesterday is no guarantee of how it will do tomorrow.
Average Annual Total Returns
Periods ended October 31, 2013 | Past 1
year | Past 5
years | Past 10
years |
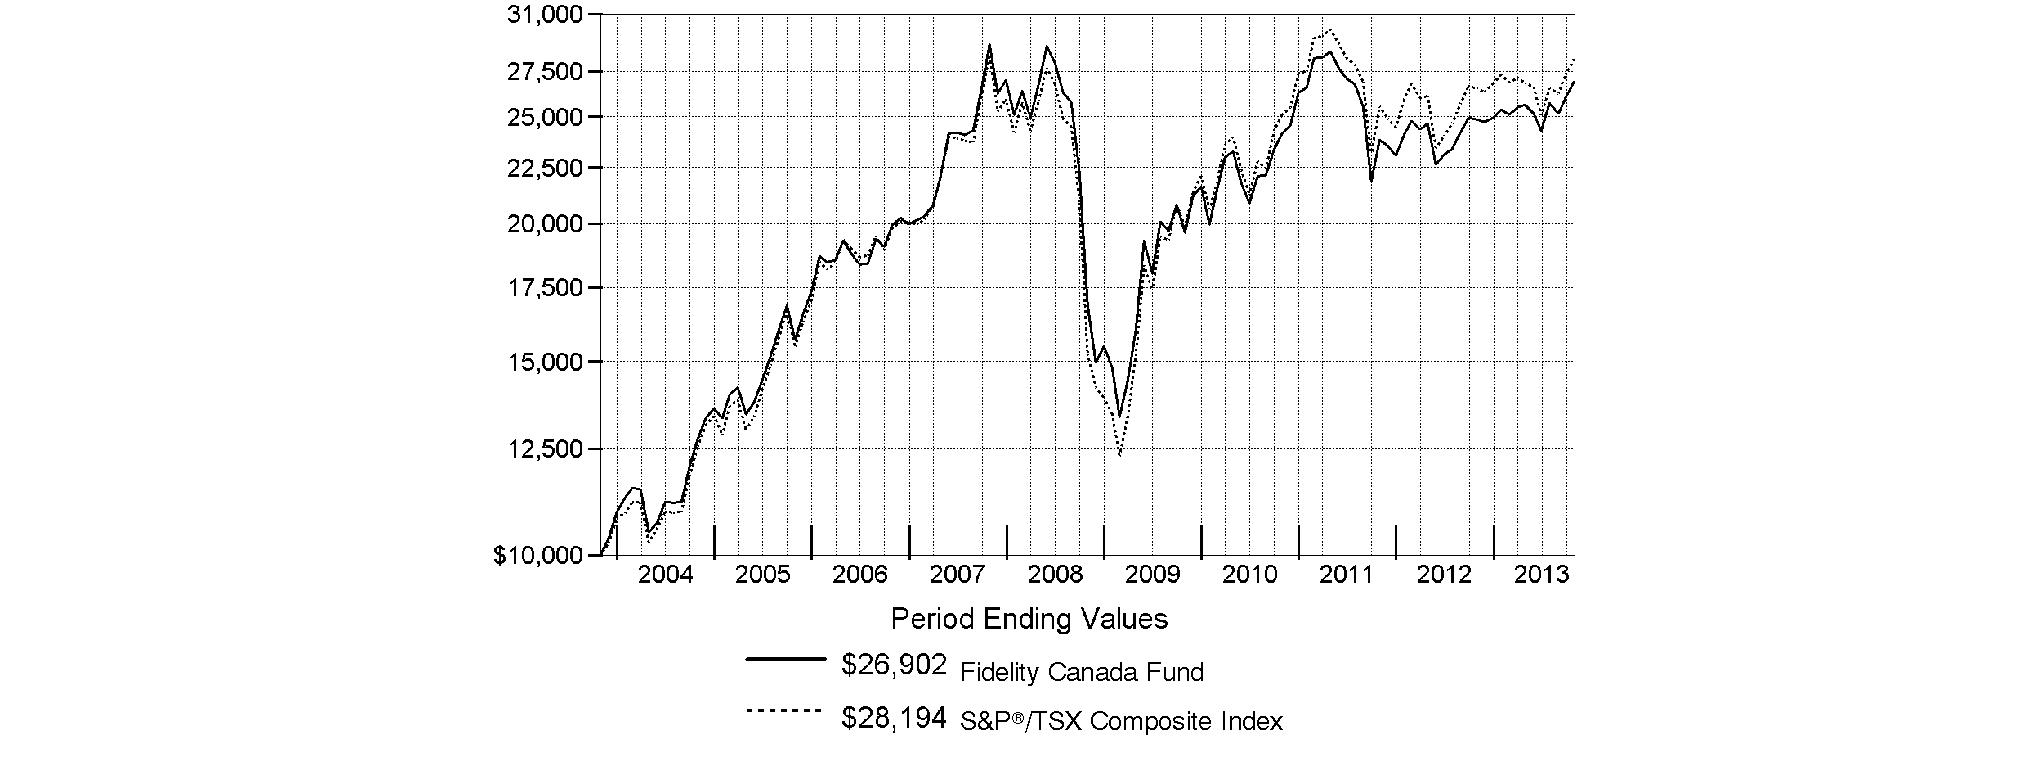
Fidelity® Canada Fund | 8.32% | 9.81% | 10.40% |
$10,000 Over 10 Years
Let's say hypothetically that $10,000 was invested in Fidelity® Canada Fund, a class of the fund, on October 31, 2003. The chart shows how the value of your investment would have changed, and also shows how the S&P®/TSX Composite Index performed over the same period.
Annual Report
Fidelity Canada Fund
Market Recap: On balance, global equity markets remained upbeat for the 12-month period ending October 31, 2013. The MSCI® ACWI® (All Country World Index) Index gained 23.75% for the period, amid investor preference for higher-risk assets. The period was not without turbulence, however. In the spring and summer, central banks worldwide, especially in the U.S. and China, made clear their intentions to maintain accommodative monetary policies. That stance, combined with modest cyclical improvements around the globe and generally low valuations, underpinned the broad rally in equities. Europe (+32%) shone brightly, with most markets in the region - large and small - registering solid, index-beating gains. Another bright spot was Japan, which, despite a struggling yen and taking a second-half breather, posted a 34% result for the full year. The U.S. - by far the index's biggest constituent - also outperformed the global market with a roughly 28% advance. Meanwhile, Asia-Pacific ex Japan (+14%) lagged, hurt in part by a slowdown in Australia's mining industry as well as currency headwinds. Foreign-exchange and commodity weakness also curbed results in resource-heavy Canada and emerging markets (EM), both of which were up 7%. Country-level EM performance diverged meaningfully for the period, as evidenced by performance in Brazil (-1%), Russia (+12%), India (+1%) and China (+8%).
Comments from Douglas Lober, Portfolio Manager of Fidelity® Canada Fund: For the year, the fund's Retail Class shares rose 8.32%, beating the 6.38% gain of the S&P/TSX Composite Index. The Canadian economy showed modest growth for the year, as investor concern about high housing prices and elevated levels of consumer debt weighed on the market, which helped to create significant variation in sector performance. Commodity prices directly impact about 40% of the companies represented within the S&P/TSX index, so they are a major market influencer. During the past 12 months, commodity prices fluctuated and varied widely, mostly based on differing global supply-and-demand factors. During the reporting period, the fund was well-positioned for this type of market, and my focus on quality, growth-oriented companies paid off, particularly in the consumer discretionary and health care sectors, as did an underweighting in cyclically driven resources stocks. At the stock level, Valeant Pharmaceuticals International was by far the fund's biggest contributor, as rising demand globally for the specialty pharma firm's products, combined with a series of earnings-positive acquisitions, helped its stock soar 90%. Despite trimming my stake here, Valeant still ended the period as the fund's largest overweighted holding. Another significant contributor was Magna International, an auto-parts manufacturer serving mainly North America and Europe, whose stock has soared on the heels of the resurging U.S. auto industry. I think Magna is a well-run company perfectly positioned for growth given its heavy exposure to the U.S., so I ramped up my stake considerably. It's a similar story with Gildan Activewear, a T-shirt and apparel maker that has been a direct beneficiary of the improving U.S. economy. On the down side, my decision to underweight life insurance companies weighed on performance, as stocks in this industry tend to do well when interest rates and stock markets rise. Despite the fund's beneficial underweighting in materials, a handful of gold positions hurt, most notably my decision to overweight Goldcorp. By period end, I had slashed exposure to gold and other materials stocks. Another decision that dampened performance was not owning global financial services and publishing company Thomson Reuters. I chose to avoid this index name due to weakness in the business outlook of its key financial services customers, but this strategy did not pan out as the stock gained 39%.
Notes to shareholders: Fidelity Canada Fund may invest up to 35% of its total assets in any industry that represents more than 20% of the Canadian market. As of October 31, 2013, more than 25% of the fund's total assets were invested in securities of companies in the diversified banks industry, which accounted for 22.45% of the Canadian market, as represented by the S&P/TSX Composite Index.
On January 1, 2014, Risteard Hogan will join Douglas Lober as a co-portfolio manager of the fund.
The views expressed above reflect those of the portfolio manager(s) only through the end of the period as stated on the cover of this report and do not necessarily represent the views of Fidelity or any other person in the Fidelity organization. Any such views are subject to change at any time based upon market or other conditions and Fidelity disclaims any responsibility to update such views. These views may not be relied on as investment advice and, because investment decisions for a Fidelity fund are based on numerous factors, may not be relied on as an indication of trading intent on behalf of any Fidelity fund.
Annual Report
Fidelity Canada Fund
As a shareholder of the Fund, you incur two types of costs: (1) transaction costs, including sales charges (loads) on purchase payments or redemption proceeds, redemption fees and (2) ongoing costs, including management fees, distribution and/or service (12b-1) fees and other Fund expenses. This Example is intended to help you understand your ongoing costs (in dollars) of investing in the Fund and to compare these costs with the ongoing costs of investing in other mutual funds.
The Example is based on an investment of $1,000 invested at the beginning of the period and held for the entire period (May 1, 2013 to October 31, 2013).
Actual Expenses
The first line of the accompanying table for each class of the Fund provides information about actual account values and actual expenses. You may use the information in this line, together with the amount you invested, to estimate the expenses that you paid over the period. Simply divide your account value by $1,000.00 (for example, an $8,600 account value divided by $1,000.00 = 8.6), then multiply the result by the number in the first line for a class of the Fund under the heading entitled "Expenses Paid During Period" to estimate the expenses you paid on your account during this period. A small balance maintenance fee of $12.00 that is charged once a year may apply for certain accounts with a value of less than $2,000. This fee is not included in the table below. If it was, the estimate of expenses you paid during the period would be higher, and your ending account value lower, by this amount. In addition, the Fund, as a shareholder in the underlying Fidelity Central Funds, will indirectly bear its pro-rata share of the fees and expenses incurred by the underlying Fidelity Central Funds. These fees and expenses are not included in the Fund's annualized expense ratio used to calculate the expense estimate in the table below.
Hypothetical Example for Comparison Purposes
The second line of the accompanying table for each class of the Fund provides information about hypothetical account values and hypothetical expenses based on a Class' actual expense ratio and an assumed rate of return of 5% per year before expenses, which is not the Class' actual return. The hypothetical account values and expenses may not be used to estimate the actual ending account balance or expenses you paid for the period. You may use this information to compare the ongoing costs of investing in the Fund and other funds. To do so, compare this 5% hypothetical example with the 5% hypothetical examples that appear in the shareholder reports of the other funds. A small balance maintenance fee of $12.00 that is charged once a year may apply for certain accounts with a value of less than $2,000. This fee is not included in the table below. If it was, the estimate of expenses you paid during the period would be higher, and your ending account value lower, by this amount. In addition, the Fund, as a shareholder in the underlying Fidelity Central Funds, will indirectly bear its pro-rata share of the fees and expenses incurred by the underlying Fidelity Central Funds. These fees and expenses are not included in the Fund's annualized expense ratio used to calculate the expense estimate in the table below.
Please note that the expenses shown in the table are meant to highlight your ongoing costs only and do not reflect any transaction costs. Therefore, the second line of the table is useful in comparing ongoing costs only, and will not help you determine the relative total costs of owning different funds. In addition, if these transactional costs were included, your costs would have been higher.
| Annualized
Expense Ratio B | Beginning
Account Value
May 1, 2013 | Ending
Account Value
October 31, 2013 | Expenses Paid
During Period*
May 1, 2013
to October 31, 2013 |
Class A | 1.22% | | | |
Actual | | $ 1,000.00 | $ 1,048.50 | $ 6.30 |
HypotheticalA | | $ 1,000.00 | $ 1,019.06 | $ 6.21 |
Class T | 1.50% | | | |
Actual | | $ 1,000.00 | $ 1,047.10 | $ 7.74 |
HypotheticalA | | $ 1,000.00 | $ 1,017.64 | $ 7.63 |
Class B | 1.99% | | | |
Actual | | $ 1,000.00 | $ 1,044.50 | $ 10.25 |
HypotheticalA | | $ 1,000.00 | $ 1,015.17 | $ 10.11 |
Class C | 1.95% | | | |
Actual | | $ 1,000.00 | $ 1,044.70 | $ 10.05 |
HypotheticalA | | $ 1,000.00 | $ 1,015.38 | $ 9.91 |
Canada | .90% | | | |
Actual | | $ 1,000.00 | $ 1,050.20 | $ 4.65 |
HypotheticalA | | $ 1,000.00 | $ 1,020.67 | $ 4.58 |
Institutional Class | .89% | | | |
Actual | | $ 1,000.00 | $ 1,050.20 | $ 4.60 |
HypotheticalA | | $ 1,000.00 | $ 1,020.72 | $ 4.53 |
A 5% return per year before expenses
B Annualized expense ratio reflects expenses net of applicable fee waivers.
* Expenses are equal to each Class' annualized expense ratio, multiplied by the average account value over the period, multiplied by 184/365 (to reflect the one-half year period).
Annual Report
Fidelity Canada Fund
Investment Changes (Unaudited)
Geographic Diversification (% of fund's net assets) |
As of October 31, 2013 |
 | Canada | 92.8% | |
 | United States of America* | 7.2% | |

|
* Includes Short-Term Investments and Net Other Assets (Liabilities). |
Percentages are based on country or territory of incorporation and are adjusted for the effect of futures contracts, if applicable. |
As of April 30, 2013 |
| Canada | 95.6% | |
| United States of America* | 4.4% | |

* Includes Short-Term Investments and Net Other Assets (Liabilities). |
Percentages are based on country or territory of incorporation and are adjusted for the effect of futures contracts, if applicable. |
Asset Allocation as of October 31, 2013 |
| % of fund's
net assets | % of fund's net assets
6 months ago |
Stocks | 99.0 | 98.3 |
Short-Term Investments and Net Other Assets (Liabilities) | 1.0 | 1.7 |
Top Ten Stocks as of October 31, 2013 |
| % of fund's
net assets | % of fund's net assets
6 months ago |
Royal Bank of Canada (Commercial Banks) | 7.8 | 6.2 |
The Toronto-Dominion Bank (Commercial Banks) | 7.4 | 5.8 |
Bank of Nova Scotia (Commercial Banks) | 4.9 | 5.1 |
Valeant Pharmaceuticals International, Inc. (Canada) (Pharmaceuticals) | 4.4 | 4.7 |
Suncor Energy, Inc. (Oil, Gas & Consumable Fuels) | 4.1 | 2.9 |
Manulife Financial Corp. (Insurance) | 4.0 | 1.9 |
Bank of Montreal (Commercial Banks) | 3.3 | 3.1 |
Canadian National Railway Co. (Road & Rail) | 3.3 | 3.0 |
Magna International, Inc. Class A (sub. vtg.) (Auto Components) | 2.6 | 1.6 |
Sun Life Financial, Inc. (Insurance) | 2.6 | 1.2 |
| 44.4 | |
Market Sectors as of October 31, 2013 |
| % of fund's
net assets | % of fund's net assets
6 months ago |
Financials | 36.2 | 32.8 |
Energy | 18.4 | 20.2 |
Consumer Discretionary | 9.6 | 8.1 |
Health Care | 7.0 | 9.0 |
Industrials | 6.2 | 4.7 |
Materials | 5.9 | 6.8 |
Consumer Staples | 5.9 | 5.6 |
Information Technology | 5.6 | 4.0 |
Telecommunication Services | 4.2 | 6.9 |
Utilities | 0.0 | 0.2 |
Annual Report
Fidelity Canada Fund
Investments October 31, 2013
Showing Percentage of Net Assets
Common Stocks - 99.0% |
| Shares | | Value |
CONSUMER DISCRETIONARY - 9.6% |
Auto Components - 2.6% |
Magna International, Inc. Class A (sub. vtg.) | 760,000 | | $ 64,370,211 |
Hotels, Restaurants & Leisure - 0.9% |
Starbucks Corp. | 200,000 | | 16,210,000 |
Tim Hortons, Inc. (Canada) | 110,300 | | 6,584,254 |
| | 22,794,254 |
Household Durables - 0.2% |
Brookfield Residential Properties, Inc. (a) | 200,000 | | 4,416,000 |
Media - 1.4% |
CBS Corp. Class B | 110,000 | | 6,505,400 |
Cineplex, Inc. | 350,000 | | 14,098,691 |
Corus Entertainment, Inc. Class B (non-vtg.) | 250,000 | | 5,826,500 |
Quebecor, Inc. Class B (sub. vtg.) | 300,000 | | 7,417,638 |
| | 33,848,229 |
Multiline Retail - 2.4% |
Canadian Tire Ltd. Class A (non-vtg.) | 180,000 | | 16,707,812 |
Dollarama, Inc. | 503,467 | | 43,275,032 |
Hudson's Bay Co. | 50,000 | | 949,024 |
| | 60,931,868 |
Textiles, Apparel & Luxury Goods - 2.1% |
Gildan Activewear, Inc. | 970,195 | | 46,767,372 |
lululemon athletica, Inc. (a)(d) | 77,600 | | 5,358,280 |
| | 52,125,652 |
TOTAL CONSUMER DISCRETIONARY | | 238,486,214 |
CONSUMER STAPLES - 5.9% |
Food & Staples Retailing - 5.7% |
Alimentation Couche-Tard, Inc. Class B (sub. vtg.) | 690,200 | | 46,748,117 |
CVS Caremark Corp. | 200,000 | | 12,452,000 |
Jean Coutu Group, Inc. Class A
(sub. vtg.) | 1,350,000 | | 23,862,754 |
Loblaw Companies Ltd. (d) | 550,000 | | 25,156,572 |
Metro, Inc. Class A (sub. vtg.) | 529,165 | | 33,105,484 |
| | 141,324,927 |
Food Products - 0.2% |
Saputo, Inc. | 100,000 | | 4,947,969 |
TOTAL CONSUMER STAPLES | | 146,272,896 |
ENERGY - 18.4% |
Energy Equipment & Services - 0.2% |
Calfrac Well Services Ltd. | 100,000 | | 3,117,058 |
Precision Drilling Corp. | 100,000 | | 1,057,881 |
Secure Energy Services, Inc. | 100,000 | | 1,418,501 |
| | 5,593,440 |
|
| Shares | | Value |
Oil, Gas & Consumable Fuels - 18.2% |
Anadarko Petroleum Corp. | 100,000 | | $ 9,529,000 |
ARC Resources Ltd. | 300,000 | | 7,964,322 |
Baytex Energy Corp. | 50,000 | | 2,086,990 |
Canadian Natural Resources Ltd. | 1,550,000 | | 49,191,483 |
Cenovus Energy, Inc. | 950,000 | | 28,227,114 |
Crescent Point Energy Corp. | 633,400 | | 24,597,292 |
Enbridge, Inc. | 1,387,800 | | 60,162,624 |
EQT Corp. | 80,000 | | 6,848,800 |
Imperial Oil Ltd. | 400,000 | | 17,467,031 |
Keyera Corp. | 152,302 | | 9,012,644 |
Painted Pony Petroleum Ltd. (a)(e) | 113,000 | | 742,387 |
Painted Pony Petroleum Ltd. (a) | 50,000 | | 328,490 |
Pembina Pipeline Corp. | 250,000 | | 8,202,657 |
Peyto Exploration & Development Corp. | 300,000 | | 9,040,426 |
Suncor Energy, Inc. | 2,807,600 | | 102,028,451 |
Talisman Energy, Inc. | 1,600,000 | | 19,949,168 |
Tourmaline Oil Corp. (a) | 400,000 | | 15,510,478 |
Tourmaline Oil Corp. (a)(e) | 80,000 | | 3,102,096 |
TransCanada Corp. | 1,160,000 | | 52,278,713 |
Trilogy Energy Corp. | 100,000 | | 2,933,870 |
Vermilion Energy, Inc. | 400,000 | | 21,986,285 |
Whitecap Resources, Inc. | 50,000 | | 580,732 |
| | 451,771,053 |
TOTAL ENERGY | | 457,364,493 |
FINANCIALS - 36.2% |
Capital Markets - 0.7% |
CI Financial Corp. | 500,000 | | 16,630,701 |
Commercial Banks - 25.3% |
Bank of Montreal (d) | 1,200,000 | | 83,579,341 |
Bank of Nova Scotia | 2,000,000 | | 121,594,015 |
Canadian Imperial Bank of Commerce | 404,600 | | 34,420,007 |
National Bank of Canada | 150,000 | | 13,016,832 |
Royal Bank of Canada | 2,880,000 | | 193,408,714 |
The Toronto-Dominion Bank | 2,003,800 | | 183,804,184 |
| | 629,823,093 |
Diversified Financial Services - 0.1% |
Element Financial Corp. (a) | 250,000 | | 3,191,387 |
Insurance - 7.5% |
Fairfax Financial Holdings Ltd. (sub. vtg.) | 10,000 | | 4,363,881 |
Industrial Alliance Insurance and Financial Services, Inc. | 100,000 | | 4,484,726 |
Intact Financial Corp. | 210,925 | | 13,155,376 |
Manulife Financial Corp. | 5,700,000 | | 100,972,522 |
Sun Life Financial, Inc. | 1,900,000 | | 63,998,465 |
| | 186,974,970 |
Real Estate Investment Trusts - 0.3% |
H&R REIT/H&R Finance Trust | 300,000 | | 6,214,933 |
Common Stocks - continued |
| Shares | | Value |
FINANCIALS - continued |
Real Estate Management & Development - 2.3% |
Brookfield Asset Management, Inc.
Class A | 1,450,000 | | $ 57,407,567 |
TOTAL FINANCIALS | | 900,242,651 |
HEALTH CARE - 7.0% |
Biotechnology - 1.0% |
Amgen, Inc. | 110,000 | | 12,760,000 |
Biogen Idec, Inc. (a) | 55,000 | | 13,430,450 |
| | 26,190,450 |
Health Care Providers & Services - 1.6% |
Catamaran Corp. (a) | 856,468 | | 40,184,544 |
Pharmaceuticals - 4.4% |
Valeant Pharmaceuticals International, Inc. (Canada) (a) | 1,031,471 | | 108,969,003 |
TOTAL HEALTH CARE | | 175,343,997 |
INDUSTRIALS - 6.2% |
Aerospace & Defense - 0.1% |
MacDonald Dettwiler & Associates Ltd. | 50,000 | | 3,814,799 |
Airlines - 0.4% |
Air Canada Class A (a) | 1,600,000 | | 8,823,670 |
Professional Services - 0.6% |
Stantec, Inc. | 245,400 | | 14,583,018 |
Road & Rail - 5.1% |
Canadian National Railway Co. | 750,000 | | 82,398,216 |
Canadian Pacific Railway Ltd. | 320,000 | | 45,741,908 |
| | 128,140,124 |
TOTAL INDUSTRIALS | | 155,361,611 |
INFORMATION TECHNOLOGY - 5.6% |
Computers & Peripherals - 0.2% |
3D Systems Corp. (a)(d) | 50,000 | | 3,112,000 |
NCR Corp. (a) | 80,000 | | 2,924,000 |
| | 6,036,000 |
Internet Software & Services - 0.5% |
Yahoo!, Inc. (a) | 340,000 | | 11,196,200 |
IT Services - 2.9% |
Alliance Data Systems Corp. (a)(d) | 70,000 | | 16,594,200 |
CGI Group, Inc. Class A (sub. vtg.) (a) | 1,290,000 | | 43,278,377 |
Visa, Inc. Class A | 60,000 | | 11,800,200 |
| | 71,672,777 |
Software - 2.0% |
Concur Technologies, Inc. (a) | 55,000 | | 5,753,000 |
Constellation Software, Inc. | 85,000 | | 15,484,487 |
Open Text Corp. | 140,407 | | 10,317,925 |
salesforce.com, Inc. (a) | 100,000 | | 5,336,000 |
|
| Shares | | Value |
ServiceNow, Inc. (a) | 51,800 | | $ 2,828,798 |
Splunk, Inc. (a) | 160,000 | | 10,033,600 |
| | 49,753,810 |
TOTAL INFORMATION TECHNOLOGY | | 138,658,787 |
MATERIALS - 5.9% |
Chemicals - 1.4% |
Methanex Corp. | 600,000 | | 34,797,871 |
Metals & Mining - 4.2% |
Agnico Eagle Mines Ltd. (Canada) | 450,000 | | 13,362,106 |
Alamos Gold, Inc. | 94,200 | | 1,500,659 |
First Quantum Minerals Ltd. | 800,000 | | 15,176,713 |
Franco-Nevada Corp. | 400,000 | | 17,996,451 |
Goldcorp, Inc. | 1,600,000 | | 40,757,685 |
Osisko Mining Corp. (a) | 1,000,000 | | 4,881,792 |
Silver Wheaton Corp. | 450,000 | | 10,211,480 |
| | 103,886,886 |
Paper & Forest Products - 0.3% |
West Fraser Timber Co. Ltd. | 90,000 | | 8,249,461 |
TOTAL MATERIALS | | 146,934,218 |
TELECOMMUNICATION SERVICES - 4.2% |
Diversified Telecommunication Services - 3.1% |
BCE, Inc. | 1,050,000 | | 45,689,829 |
TELUS Corp. | 300,000 | | 10,479,068 |
TELUS Corp. (a) | 600,000 | | 20,958,136 |
| | 77,127,033 |
Wireless Telecommunication Services - 1.1% |
Rogers Communications, Inc. Class B (non-vtg.) | 600,000 | | 27,230,614 |
TOTAL TELECOMMUNICATION SERVICES | | 104,357,647 |
TOTAL COMMON STOCKS (Cost $1,865,701,378) |
2,463,022,514
|
Money Market Funds - 4.7% |
| Shares | | Value |
Fidelity Cash Central Fund, 0.09% (b) | 15,752,624 | | $ 15,752,624 |
Fidelity Securities Lending Cash Central Fund, 0.09% (b)(c) | 101,723,524 | | 101,723,524 |
TOTAL MONEY MARKET FUNDS (Cost $117,476,148) |
117,476,148
|
TOTAL INVESTMENT PORTFOLIO - 103.7% (Cost $1,983,177,526) | | 2,580,498,662 |
NET OTHER ASSETS (LIABILITIES) - (3.7)% | | (93,098,467) |
NET ASSETS - 100% | $ 2,487,400,195 |
Legend |
(a) Non-income producing |
(b) Affiliated fund that is generally available only to investment companies and other accounts managed by Fidelity Investments. The rate quoted is the annualized seven-day yield of the fund at period end. A complete unaudited listing of the fund's holdings as of its most recent quarter end is available upon request. In addition, each Fidelity Central Fund's financial statements, which are not covered by the Fund's Report of Independent Registered Public Accounting Firm, are available on the SEC's website or upon request. |
(c) Investment made with cash collateral received from securities on loan. |
(d) Security or a portion of the security is on loan at period end. |
(e) Security exempt from registration under Rule 144A of the Securities Act of 1933. These securities may be resold in transactions exempt from registration, normally to qualified institutional buyers. At the end of the period, the value of these securities amounted to $3,844,483 or 0.2% of net assets. |
Affiliated Central Funds |
Information regarding fiscal year to date income earned by the Fund from investments in Fidelity Central Funds is as follows: |
Fund | Income earned |
Fidelity Cash Central Fund | $ 46,028 |
Fidelity Securities Lending Cash Central Fund | 3,181,563 |
Total | $ 3,227,591 |
Other Information |
All investments are categorized as Level 1 under the Fair Value Hierarchy. The inputs or methodology used for valuing securities may not be an indication of the risk associated with investing in those securities. For more information on valuation inputs, please refer to the Investment Valuation section in the accompanying Notes to Financial Statements. |
See accompanying notes which are an integral part of the financial statements.
Annual Report
Fidelity Canada Fund
Statement of Assets and Liabilities
| October 31, 2013 |
| | |
Assets | | |
Investment in securities, at value (including securities loaned of $97,192,158) - See accompanying schedule: Unaffiliated issuers (cost $1,865,701,378) | $ 2,463,022,514 | |
Fidelity Central Funds (cost $117,476,148) | 117,476,148 | |
Total Investments (cost $1,983,177,526) | | $ 2,580,498,662 |
Foreign currency held at value (cost $1,939,718) | | 1,939,718 |
Receivable for investments sold | | 38,529,311 |
Receivable for fund shares sold | | 584,145 |
Dividends receivable | | 3,162,138 |
Distributions receivable from Fidelity Central Funds | | 81,917 |
Prepaid expenses | | 6,233 |
Other receivables | | 5,347 |
Total assets | | 2,624,807,471 |
| | |
Liabilities | | |
Payable for investments purchased | $ 29,649,665 | |
Payable for fund shares redeemed | 3,967,056 | |
Accrued management fee | 1,381,333 | |
Distribution and service plan fees payable | 79,324 | |
Other affiliated payables | 538,757 | |
Other payables and accrued expenses | 67,617 | |
Collateral on securities loaned, at value | 101,723,524 | |
Total liabilities | | 137,407,276 |
| | |
Net Assets | | $ 2,487,400,195 |
Net Assets consist of: | | |
Paid in capital | | $ 1,894,267,605 |
Undistributed net investment income | | 5,441,243 |
Accumulated undistributed net realized gain (loss) on investments and foreign currency transactions | | (9,574,612) |
Net unrealized appreciation (depreciation) on investments and assets and liabilities in foreign currencies | | 597,265,959 |
Net Assets | | $ 2,487,400,195 |
Statement of Assets and Liabilities - continued
| October 31, 2013 |
| | |
Calculation of Maximum Offering Price Class A:
Net Asset Value and redemption price per share ($116,661,029 ÷ 2,035,534 shares) | | $ 57.31 |
| | |
Maximum offering price per share (100/94.25 of $57.31) | | $ 60.81 |
Class T:
Net Asset Value and redemption price per share ($23,751,280 ÷ 415,641 shares) | | $ 57.14 |
| | |
Maximum offering price per share (100/96.50 of $57.14) | | $ 59.21 |
Class B:
Net Asset Value and offering price per share ($7,737,243 ÷ 136,881 shares)A | | $ 56.53 |
| | |
Class C:
Net Asset Value and offering price per share ($46,039,529 ÷ 818,175 shares)A | | $ 56.27 |
| | |
Canada:
Net Asset Value, offering price and redemption price per share ($2,262,379,924 ÷ 39,194,450 shares) | | $ 57.72 |
| | |
Institutional Class:
Net Asset Value, offering price and redemption price per share ($30,831,190 ÷ 535,504 shares) | | $ 57.57 |
A Redemption price per share is equal to net asset value less any applicable contingent deferred sales charge.
See accompanying notes which are an integral part of the financial statements.
Annual Report
Fidelity Canada Fund
Financial Statements - continued
Statement of Operations
| Year ended October 31, 2013 |
Investment Income | | |
Dividends | | $ 71,353,255 |
Interest | | 812 |
Income from Fidelity Central Funds | | 3,227,591 |
Income before foreign taxes withheld | | 74,581,658 |
Less foreign taxes withheld | | (10,623,849) |
Total income | | 63,957,809 |
| | |
Expenses | | |
Management fee | | |
Basic fee | $ 19,761,399 | |
Performance adjustment | (2,880,828) | |
Transfer agent fees | 6,184,860 | |
Distribution and service plan fees | 1,097,829 | |
Accounting and security lending fees | 1,239,678 | |
Custodian fees and expenses | 41,774 | |
Independent trustees' compensation | 16,894 | |
Registration fees | 93,431 | |
Audit | 72,278 | |
Legal | 8,642 | |
Interest | 2,828 | |
Miscellaneous | 29,203 | |
Total expenses before reductions | 25,667,988 | |
Expense reductions | (289,539) | 25,378,449 |
Net investment income (loss) | | 38,579,360 |
Realized and Unrealized Gain (Loss) Net realized gain (loss) on: | | |
Investment securities: | | |
Unaffiliated issuers | 315,114,345 | |
Foreign currency transactions | (317,572) | |
Total net realized gain (loss) | | 314,796,773 |
Change in net unrealized appreciation (depreciation) on: Investment securities | (148,439,060) | |
Assets and liabilities in foreign currencies | (35,528) | |
Total change in net unrealized appreciation (depreciation) | | (148,474,588) |
Net gain (loss) | | 166,322,185 |
Net increase (decrease) in net assets resulting from operations | | $ 204,901,545 |
Statement of Changes in Net Assets
| Year ended
October 31,
2013 | Year ended
October 31,
2012 |
Increase (Decrease) in Net Assets | | |
Operations | | |
Net investment income (loss) | $ 38,579,360 | $ 50,353,505 |
Net realized gain (loss) | 314,796,773 | (18,070,675) |
Change in net unrealized appreciation (depreciation) | (148,474,588) | 100,576,015 |
Net increase (decrease) in net assets resulting from operations | 204,901,545 | 132,858,845 |
Distributions to shareholders from net investment income | (43,693,415) | (36,731,380) |
Distributions to shareholders from net realized gain | - | (22,566,448) |
Total distributions | (43,693,415) | (59,297,828) |
Share transactions - net increase (decrease) | (991,330,828) | (952,875,100) |
Redemption fees | 153,637 | 257,398 |
Total increase (decrease) in net assets | (829,969,061) | (879,056,685) |
Net Assets | | |
Beginning of period | 3,317,369,256 | 4,196,425,941 |
End of period (including undistributed net investment income of $5,441,243 and undistributed net investment income of $34,776,724, respectively) | $ 2,487,400,195 | $ 3,317,369,256 |
See accompanying notes which are an integral part of the financial statements.
Annual Report
Financial Highlights - Class A
Years ended October 31, | 2013 | 2012 | 2011 | 2010 | 2009 |
Selected Per-Share Data | | | | | |
Net asset value, beginning of period | $ 53.65 | $ 52.20 | $ 53.81 | $ 44.24 | $ 38.20 |
Income from Investment Operations | | | | | |
Net investment income (loss) C | .60 | .57 | .34 | .31 | .38 |
Net realized and unrealized gain (loss) | 3.63 | 1.50 | (1.17) | 9.64 | 5.72 |
Total from investment operations | 4.23 | 2.07 | (.83) | 9.95 | 6.10 |
Distributions from net investment income | (.57) | (.33) | (.35) | (.39) | (.07) |
Distributions from net realized gain | - | (.29) | (.44) | - | - |
Total distributions | (.57) | (.62) | (.79) | (.39) | (.07) |
Redemption fees added to paid in capital C | - G | - G | .01 | .01 | .01 |
Net asset value, end of period | $ 57.31 | $ 53.65 | $ 52.20 | $ 53.81 | $ 44.24 |
Total Return A,B | 7.98% | 4.04% | (1.64)% | 22.62% | 16.08% |
Ratios to Average Net Assets D,F | | | | | |
Expenses before reductions | 1.19% | 1.08% | 1.12% | 1.24% | 1.42% |
Expenses net of fee waivers, if any | 1.19% | 1.08% | 1.12% | 1.24% | 1.42% |
Expenses net of all reductions | 1.18% | 1.08% | 1.12% | 1.18% | 1.39% |
Net investment income (loss) | 1.11% | 1.11% | .59% | .63% | .98% |
Supplemental Data | | | | | |
Net assets, end of period (000 omitted) | $ 116,661 | $ 159,597 | $ 215,369 | $ 170,446 | $ 83,015 |
Portfolio turnover rate E | 64% | 86% | 104% | 143% | 123% |
A Total returns would have been lower if certain expenses had not been reduced during the applicable periods shown. B Total returns do not include the effect of the sales charges. C Calculated based on average shares outstanding during the period. D Fees and expenses of any underlying Fidelity Central Funds are not included in the Fund's expense ratio. The Fund indirectly bears its proportionate share of the expenses of any underlying Fidelity Central Funds. E Amount does not include the portfolio activity of any underlying Fidelity Central Funds. F Expense ratios reflect operating expenses of the class. Expenses before reductions do not reflect amounts reimbursed by the investment adviser or reductions from brokerage service arrangements or reductions from other expense offset arrangements and do not represent the amount paid by the class during periods when reimbursements or reductions occur. Expenses net of fee waivers reflect expenses after reimbursement by the investment adviser but prior to reductions from brokerage service arrangements or other expense offset arrangements. Expenses net of all reductions represent the net expenses paid by the class. G Amount represents less than $.01 per share. |
Financial Highlights - Class T
Years ended October 31, | 2013 | 2012 | 2011 | 2010 | 2009 |
Selected Per-Share Data | | | | | |
Net asset value, beginning of period | $ 53.48 | $ 52.01 | $ 53.64 | $ 44.11 | $ 38.10 |
Income from Investment Operations | | | | | |
Net investment income (loss) C | .45 | .43 | .17 | .18 | .27 |
Net realized and unrealized gain (loss) | 3.63 | 1.49 | (1.16) | 9.60 | 5.73 |
Total from investment operations | 4.08 | 1.92 | (.99) | 9.78 | 6.00 |
Distributions from net investment income | (.42) | (.16) | (.21) | (.26) | - |
Distributions from net realized gain | - | (.29) | (.44) | - | - |
Total distributions | (.42) | (.45) | (.65) | (.26) | - |
Redemption fees added to paid in capital C | - G | - G | .01 | .01 | .01 |
Net asset value, end of period | $ 57.14 | $ 53.48 | $ 52.01 | $ 53.64 | $ 44.11 |
Total Return A,B | 7.69% | 3.74% | (1.93)% | 22.27% | 15.77% |
Ratios to Average Net Assets D,F | | | | | |
Expenses before reductions | 1.47% | 1.36% | 1.42% | 1.51% | 1.70% |
Expenses net of fee waivers, if any | 1.47% | 1.36% | 1.42% | 1.51% | 1.70% |
Expenses net of all reductions | 1.46% | 1.36% | 1.42% | 1.46% | 1.67% |
Net investment income (loss) | .83% | .83% | .30% | .36% | .71% |
Supplemental Data | | | | | |
Net assets, end of period (000 omitted) | $ 23,751 | $ 29,626 | $ 34,323 | $ 31,522 | $ 17,727 |
Portfolio turnover rate E | 64% | 86% | 104% | 143% | 123% |
A Total returns would have been lower if certain expenses had not been reduced during the applicable periods shown. B Total returns do not include the effect of the sales charges. C Calculated based on average shares outstanding during the period. D Fees and expenses of any underlying Fidelity Central Funds are not included in the Fund's expense ratio. The Fund indirectly bears its proportionate share of the expenses of any underlying Fidelity Central Funds. E Amount does not include the portfolio activity of any underlying Fidelity Central Funds. F Expense ratios reflect operating expenses of the class. Expenses before reductions do not reflect amounts reimbursed by the investment adviser or reductions from brokerage service arrangements or reductions from other expense offset arrangements and do not represent the amount paid by the class during periods when reimbursements or reductions occur. Expenses net of fee waivers reflect expenses after reimbursement by the investment adviser but prior to reductions from brokerage service arrangements or other expense offset arrangements. Expenses net of all reductions represent the net expenses paid by the class. G Amount represents less than $.01 per share. |
See accompanying notes which are an integral part of the financial statements.
Annual Report
Financial Highlights - Class B
Years ended October 31, | 2013 | 2012 | 2011 | 2010 | 2009 |
Selected Per-Share Data | | | | | |
Net asset value, beginning of period | $ 52.89 | $ 51.37 | $ 53.03 | $ 43.68 | $ 37.91 |
Income from Investment Operations | | | | | |
Net investment income (loss) C | .18 | .17 | (.11) | (.07) | .08 |
Net realized and unrealized gain (loss) | 3.60 | 1.49 | (1.14) | 9.50 | 5.68 |
Total from investment operations | 3.78 | 1.66 | (1.25) | 9.43 | 5.76 |
Distributions from net investment income | (.14) | - | (.01) | (.09) | - |
Distributions from net realized gain | - | (.14) | (.41) | - | - |
Total distributions | (.14) | (.14) | (.42) | (.09) | - |
Redemption fees added to paid in capital C | - G | - G | .01 | .01 | .01 |
Net asset value, end of period | $ 56.53 | $ 52.89 | $ 51.37 | $ 53.03 | $ 43.68 |
Total Return A,B | 7.17% | 3.25% | (2.41)% | 21.64% | 15.22% |
Ratios to Average Net Assets D,F | | | | | |
Expenses before reductions | 1.96% | 1.85% | 1.91% | 2.01% | 2.19% |
Expenses net of fee waivers, if any | 1.96% | 1.85% | 1.91% | 2.01% | 2.19% |
Expenses net of all reductions | 1.95% | 1.85% | 1.91% | 1.96% | 2.16% |
Net investment income (loss) | .34% | .34% | (.20)% | (.14)% | .21% |
Supplemental Data | | | | | |
Net assets, end of period (000 omitted) | $ 7,737 | $ 9,804 | $ 11,866 | $ 13,464 | $ 7,283 |
Portfolio turnover rate E | 64% | 86% | 104% | 143% | 123% |
A Total returns would have been lower if certain expenses had not been reduced during the applicable periods shown. B Total returns do not include the effect of the contingent deferred sales charge. C Calculated based on average shares outstanding during the period. D Fees and expenses of any underlying Fidelity Central Funds are not included in the Fund's expense ratio. The Fund indirectly bears its proportionate share of the expenses of any underlying Fidelity Central Funds. E Amount does not include the portfolio activity of any underlying Fidelity Central Funds. F Expense ratios reflect operating expenses of the class. Expenses before reductions do not reflect amounts reimbursed by the investment adviser or reductions from brokerage service arrangements or reductions from other expense offset arrangements and do not represent the amount paid by the class during periods when reimbursements or reductions occur. Expenses net of fee waivers reflect expenses after reimbursement by the investment adviser but prior to reductions from brokerage service arrangements or other expense offset arrangements. Expenses net of all reductions represent the net expenses paid by the class. G Amount represents less than $.01 per share. |
Financial Highlights - Class C
Years ended October 31, | 2013 | 2012 | 2011 | 2010 | 2009 |
Selected Per-Share Data | | | | | |
Net asset value, beginning of period | $ 52.61 | $ 51.19 | $ 52.87 | $ 43.60 | $ 37.84 |
Income from Investment Operations | | | | | |
Net investment income (loss) C | .20 | .19 | (.08) | (.06) | .09 |
Net realized and unrealized gain (loss) | 3.58 | 1.46 | (1.14) | 9.48 | 5.66 |
Total from investment operations | 3.78 | 1.65 | (1.22) | 9.42 | 5.75 |
Distributions from net investment income | (.12) | - | (.03) | (.16) | - |
Distributions from net realized gain | - | (.23) | (.44) | - | - |
Total distributions | (.12) | (.23) | (.47) | (.16) | - |
Redemption fees added to paid in capital C | - G | - G | .01 | .01 | .01 |
Net asset value, end of period | $ 56.27 | $ 52.61 | $ 51.19 | $ 52.87 | $ 43.60 |
Total Return A,B | 7.21% | 3.26% | (2.36)% | 21.68% | 15.22% |
Ratios to Average Net Assets D,F | | | | | |
Expenses before reductions | 1.93% | 1.82% | 1.86% | 1.99% | 2.18% |
Expenses net of fee waivers, if any | 1.92% | 1.82% | 1.86% | 1.99% | 2.18% |
Expenses net of all reductions | 1.92% | 1.82% | 1.86% | 1.94% | 2.15% |
Net investment income (loss) | .37% | .37% | (.15)% | (.12)% | .22% |
Supplemental Data | | | | | |
Net assets, end of period (000 omitted) | $ 46,040 | $ 66,500 | $ 87,990 | $ 54,052 | $ 24,848 |
Portfolio turnover rate E | 64% | 86% | 104% | 143% | 123% |
A Total returns would have been lower if certain expenses had not been reduced during the applicable periods shown. B Total returns do not include the effect of the contingent deferred sales charge. C Calculated based on average shares outstanding during the period. D Fees and expenses of any underlying Fidelity Central Funds are not included in the Fund's expense ratio. The Fund indirectly bears its proportionate share of the expenses of any underlying Fidelity Central Funds. E Amount does not include the portfolio activity of any underlying Fidelity Central Funds. F Expense ratios reflect operating expenses of the class. Expenses before reductions do not reflect amounts reimbursed by the investment adviser or reductions from brokerage service arrangements or reductions from other expense offset arrangements and do not represent the amount paid by the class during periods when reimbursements or reductions occur. Expenses net of fee waivers reflect expenses after reimbursement by the investment adviser but prior to reductions from brokerage service arrangements or other expense offset arrangements. Expenses net of all reductions represent the net expenses paid by the class. G Amount represents less than $.01 per share. |
See accompanying notes which are an integral part of the financial statements.
Annual Report
Financial Highlights - Canada
Years ended October 31, | 2013 | 2012 | 2011 | 2010 | 2009 |
Selected Per-Share Data | | | | | |
Net asset value, beginning of period | $ 54.05 | $ 52.59 | $ 54.14 | $ 44.46 | $ 38.37 |
Income from Investment Operations | | | | | |
Net investment income (loss) B | .77 | .73 | .52 | .46 | .48 |
Net realized and unrealized gain (loss) | 3.66 | 1.51 | (1.18) | 9.68 | 5.74 |
Total from investment operations | 4.43 | 2.24 | (.66) | 10.14 | 6.22 |
Distributions from net investment income | (.76) | (.49) | (.46) | (.47) | (.14) |
Distributions from net realized gain | - | (.29) | (.44) | - | - |
Total distributions | (.76) | (.78) | (.90) | (.47) | (.14) |
Redemption fees added to paid in capital B | - F | - F | .01 | .01 | .01 |
Net asset value, end of period | $ 57.72 | $ 54.05 | $ 52.59 | $ 54.14 | $ 44.46 |
Total Return A | 8.32% | 4.36% | (1.33)% | 22.97% | 16.40% |
Ratios to Average Net Assets C,E | | | | | |
Expenses before reductions | .87% | .77% | .82% | .94% | 1.17% |
Expenses net of fee waivers, if any | .87% | .77% | .82% | .94% | 1.17% |
Expenses net of all reductions | .86% | .77% | .82% | .89% | 1.13% |
Net investment income (loss) | 1.42% | 1.42% | .90% | .93% | 1.24% |
Supplemental Data | | | | | |
Net assets, end of period (000 omitted) | $ 2,262,380 | $ 2,992,597 | $ 3,778,765 | $ 3,953,693 | $ 3,149,791 |
Portfolio turnover rate D | 64% | 86% | 104% | 143% | 123% |
A Total returns would have been lower if certain expenses had not been reduced during the applicable periods shown. B Calculated based on average shares outstanding during the period. C Fees and expenses of any underlying Fidelity Central Funds are not included in the Fund's expense ratio. The Fund indirectly bears its proportionate share of the expenses of any underlying Fidelity Central Funds. D Amount does not include the portfolio activity of any underlying Fidelity Central Funds. EExpense ratios reflect operating expenses of the class. Expenses before reductions do not reflect amounts reimbursed by the investment adviser or reductions from brokerage service arrangements or reductions from other expense offset arrangements and do not represent the amount paid by the class during periods when reimbursements or reductions occur. Expenses net of fee waivers reflect expenses after reimbursement by the investment adviser but prior to reductions from brokerage service arrangements or other expense offset arrangements. Expenses net of all reductions represent the net expenses paid by the class. F Amount represents less than $.01 per share. |
Financial Highlights - Institutional Class
Years ended October 31, | 2013 | 2012 | 2011 | 2010 | 2009 |
Selected Per-Share Data | | | | | |
Net asset value, beginning of period | $ 53.91 | $ 52.44 | $ 54.02 | $ 44.39 | $ 38.31 |
Income from Investment Operations | | | | | |
Net investment income (loss) B | .78 | .74 | .51 | .46 | .49 |
Net realized and unrealized gain (loss) | 3.64 | 1.50 | (1.18) | 9.65 | 5.72 |
Total from investment operations | 4.42 | 2.24 | (.67) | 10.11 | 6.21 |
Distributions from net investment income | (.76) | (.48) | (.48) | (.49) | (.14) |
Distributions from net realized gain | - | (.29) | (.44) | - | - |
Total distributions | (.76) | (.77) | (.92) | (.49) | (.14) |
Redemption fees added to paid in capital B | - F | - F | .01 | .01 | .01 |
Net asset value, end of period | $ 57.57 | $ 53.91 | $ 52.44 | $ 54.02 | $ 44.39 |
Total Return A | 8.34% | 4.38% | (1.35)% | 22.94% | 16.40% |
Ratios to Average Net Assets C,E | | | | | |
Expenses before reductions | .86% | .76% | .82% | .95% | 1.17% |
Expenses net of fee waivers, if any | .86% | .76% | .82% | .95% | 1.17% |
Expenses net of all reductions | .85% | .76% | .82% | .90% | 1.14% |
Net investment income (loss) | 1.43% | 1.42% | .89% | .92% | 1.23% |
Supplemental Data | | | | | |
Net assets, end of period (000 omitted) | $ 30,831 | $ 59,245 | $ 68,112 | $ 46,737 | $ 17,956 |
Portfolio turnover rate D | 64% | 86% | 104% | 143% | 123% |
A Total returns would have been lower if certain expenses had not been reduced during the applicable periods shown. B Calculated based on average shares outstanding during the period. C Fees and expenses of any underlying Fidelity Central Funds are not included in the Fund's expense ratio. The Fund indirectly bears its proportionate share of the expenses of any underlying Fidelity Central Funds. D Amount does not include the portfolio activity of any underlying Fidelity Central Funds. E Expense ratios reflect operating expenses of the class. Expenses before reductions do not reflect amounts reimbursed by the investment adviser or reductions from brokerage service arrangements or reductions from other expense offset arrangements and do not represent the amount paid by the class during periods when reimbursements or reductions occur. Expenses net of fee waivers reflect expenses after reimbursement by the investment adviser but prior to reductions from brokerage service arrangements or other expense offset arrangements. Expenses net of all reductions represent the net expenses paid by the class. F Amount represents less than $.01 per share. |
See accompanying notes which are an integral part of the financial statements.
Annual Report
Notes to Financial Statements
For the period ended October 31, 2013
1. Organization.
Fidelity Canada Fund (the Fund) is a fund of Fidelity Investment Trust (the Trust) and is authorized to issue an unlimited number of shares. The Trust is registered under the Investment Company Act of 1940, as amended (the 1940 Act), as an open-end management investment company organized as a Massachusetts business trust. The Fund offers Class A, Class T, Class C, Canada and Institutional Class shares, each of which, along with Class B shares, has equal rights as to assets and voting privileges. Class B shares are closed to new accounts and additional purchases, except for exchanges and reinvestments. Each class has exclusive voting rights with respect to matters that affect that class. Class B shares will automatically convert to Class A shares after a holding period of seven years from the initial date of purchase.
2. Investments in Fidelity Central Funds.
The Fund invests in Fidelity Central Funds, which are open-end investment companies generally available only to other investment companies and accounts managed by Fidelity Management & Research Company (FMR) and its affiliates. The Fund's Schedule of Investments lists each of the Fidelity Central Funds held as of period end, if any, as an investment of the Fund, but does not include the underlying holdings of each Fidelity Central Fund. As an Investing Fund, the Fund indirectly bears its proportionate share of the expenses of the underlying Fidelity Central Funds.
The Money Market Central Funds seek preservation of capital and current income and are managed by Fidelity Investments Money Management, Inc. (FIMM), an affiliate of FMR.
A complete unaudited list of holdings for each Fidelity Central Fund is available upon request or at the Securities and Exchange Commission (the SEC) website at www.sec.gov. In addition, the financial statements of the Fidelity Central Funds, which are not covered by the Fund's Report of Independent Registered Public Accounting Firm, are available on the SEC website or upon request.
3. Significant Accounting Policies.
The financial statements have been prepared in conformity with accounting principles generally accepted in the United States of America (GAAP), which require management to make certain estimates and assumptions at the date of the financial statements. Actual results could differ from those estimates. Subsequent events, if any, through the date that the financial statements were issued have been evaluated in the preparation of the financial statements. The following summarizes the significant accounting policies of the Fund:
Investment Valuation. Investments are valued as of 4:00 p.m. Eastern time on the last calendar day of the period. In accordance with valuation policies and procedures approved by the Board of Trustees (the Board), the Fund attempts to obtain prices from one or more third party pricing vendors or brokers to value its investments. When current market prices, quotations or currency exchange rates are not readily available or reliable, investments will be fair valued in good faith by the FMR Fair Value Committee (the Committee), in accordance with procedures adopted by the Board. Factors used in determining fair value vary by investment type and may include market or investment specific events. The frequency with which these procedures are used cannot be predicted and they may be utilized to a significant extent. The Committee oversees the Fund's valuation policies and procedures and is responsible for approving and reporting to the Board all fair value determinations.
The Fund categorizes the inputs to valuation techniques used to value its investments into a disclosure hierarchy consisting of three levels as shown below:
Level 1 - quoted prices in active markets for identical investments
Level 2 - other significant observable inputs (including quoted prices for similar investments, interest rates, prepayment speeds, etc.)
Level 3 - unobservable inputs (including the Fund's own assumptions based on the best information available)
Valuation techniques used to value the Fund's investments by major category are as follows:
Equity securities, including restricted securities, for which market quotations are readily available, are valued at the last reported sale price or official closing price as reported by a third party pricing vendor on the primary market or exchange on which they are traded and are categorized as Level 1 in the hierarchy. In the event there were no sales during the day or closing prices are not available, securities are valued at the last quoted bid price or may be valued using the last available price and are generally categorized as Level 2 in the hierarchy. For foreign equity securities, when market or security specific events arise, comparisons to the valuation of American Depositary Receipts (ADRs), futures contracts, Exchange-Traded Funds (ETFs) and certain indexes as well as quoted prices for similar securities may be used and would be categorized as Level 2 in the hierarchy. Utilizing these techniques may result in transfers between Level 1 and Level 2. For equity securities, including restricted securities, where observable inputs are limited, assumptions about market activity and risk are used and these securities may be categorized as Level 3 in the hierarchy.
Investments in open-end mutual funds, including the Fidelity Central Funds, are valued at their closing net asset value (NAV) each business day and are categorized as Level 1 in the hierarchy.
Annual Report
Notes to Financial Statements - continued
3. Significant Accounting Policies - continued
Investment Valuation - continued
Changes in valuation techniques may result in transfers in or out of an assigned level within the disclosure hierarchy.
Foreign Currency. The Fund may use foreign currency contracts to facilitate transactions in foreign-denominated securities. Gains and losses from these transactions may arise from changes in the value of the foreign currency or if the counterparties do not perform under the contracts' terms.
Foreign-denominated assets, including investment securities, and liabilities are translated into U.S. dollars at the exchange rates at period end. Purchases and sales of investment securities, income and dividends received and expenses denominated in foreign currencies are translated into U.S. dollars at the exchange rate in effect on the transaction date.
The effects of exchange rate fluctuations on investments are included with the net realized and unrealized gain (loss) on investment securities. Other foreign currency transactions resulting in realized and unrealized gain (loss) are disclosed separately.
Investment Transactions and Income. For financial reporting purposes, the Fund's investment holdings and NAV include trades executed through the end of the last business day of the period. The NAV per share for processing shareholder transactions is calculated as of the close of business of the New York Stock Exchange (NYSE), normally 4:00 p.m. Eastern time and includes trades executed through the end of the prior business day. Gains and losses on securities sold are determined on the basis of identified cost and may include proceeds received from litigation. Dividend income is recorded on the ex-dividend date, except for certain dividends from foreign securities where the ex-dividend date may have passed, which are recorded as soon as the Fund is informed of the ex-dividend date. Non-cash dividends included in dividend income, if any, are recorded at the fair market value of the securities received. Distributions received on securities that represent a return of capital or capital gain are recorded as a reduction of cost of investments and/or as a realized gain. Subsequent to ex-dividend date the Fund determines the components of these distributions, based upon receipt of tax filings or other correspondence relating to the underlying investment. Interest income and distributions from the Fidelity Central Funds are accrued as earned. Interest income includes coupon interest and amortization of premium and accretion of discount on debt securities. Investment income is recorded net of foreign taxes withheld where recovery of such taxes is uncertain.
Class Allocations and Expenses. Investment income, realized and unrealized capital gains and losses, common expenses of the Fund, and certain fund-level expense reductions, if any, are allocated daily on a pro-rata basis to each class based on the relative net assets of each class to the total net assets of the Fund. Each class differs with respect to transfer agent and distribution and service plan fees incurred. Certain expense reductions may also differ by class. For the reporting period, the allocated portion of income and expenses to each class as a percent of its average net assets may vary due to the timing of recording these transactions in relation to fluctuating net assets of the classes. Expenses directly attributable to a fund are charged to that fund. Expenses attributable to more than one fund are allocated among the respective funds on the basis of relative net assets or other appropriate methods. Expense estimates are accrued in the period to which they relate and adjustments are made when actual amounts are known.
Income Tax Information and Distributions to Shareholders. Each year, the Fund intends to qualify as a regulated investment company under Subchapter M of the Internal Revenue Code, including distributing substantially all of its taxable income and realized gains. As a result, no provision for U.S. Federal income taxes is required. As of October 31, 2013, the Fund did not have any unrecognized tax benefits in the financial statements; nor is the each Fund aware of any tax positions for which it is reasonably possible that the total amounts of unrecognized tax benefits will significantly change in the next twelve months. The Fund files a U.S. federal tax return, in addition to state and local tax returns as required. The Fund's federal income tax returns are subject to examination by the Internal Revenue Service (IRS) for a period of three fiscal years after they are filed. State and local tax returns may be subject to examination for an additional fiscal year depending on the jurisdiction. Foreign taxes are provided for based on the Fund's understanding of the tax rules and rates that exist in the foreign markets in which it invests.
Distributions are declared and recorded on the ex-dividend date. Income dividends and capital gain distributions are declared separately for each class. Income and capital gain distributions are determined in accordance with income tax regulations, which may differ from GAAP. In addition, the fund claimed a portion of the payment made to redeeming shareholders as a distribution for income tax purposes.
Capital accounts within the financial statements are adjusted for permanent book-tax differences. These adjustments have no impact on net assets or the results of operations. Temporary book-tax differences will reverse in a subsequent period.
Book-tax differences are primarily due to foreign currency transactions, passive foreign investment companies (PFIC), deferred trustees compensation, capital loss carryforwards and losses deferred due to wash sales.
The federal tax cost of investment securities and unrealized appreciation (depreciation) as of period end were as follows:
Gross unrealized appreciation | $ 622,734,162 |
Gross unrealized depreciation | (48,641,784) |
Net unrealized appreciation (depreciation) on securities and other investments | $ 574,092,378 |
| |
Tax Cost | $ 2,006,406,284 |
Annual Report
3. Significant Accounting Policies - continued
Income Tax Information and Distributions to Shareholders - continued
The tax-based components of distributable earnings as of period end were as follows:
Undistributed ordinary income | $ 5,441,496 |
Undistributed long-term capital gain | $ 13,654,145 |
Net unrealized appreciation (depreciation) | $ 574,037,201 |
The tax character of distributions paid was as follows:
| October 31, 2013 | October 31, 2012 |
Ordinary Income | $ 43,693,415 | $ 59,297,828 |
Short-Term Trading (Redemption) Fees. Shares held by investors in the Fund less than 90 days may have been subject to a redemption fee equal to 1.50% of the net asset value of shares redeemed. All redemption fees, which reduce the proceeds of the shareholder redemption, are retained by the Fund and accounted for as an addition to paid in capital.
Restricted Securities. The Fund may invest in securities that are subject to legal or contractual restrictions on resale. These securities generally may be resold in transactions exempt from registration or to the public if the securities are registered. Disposal of these securities may involve time-consuming negotiations and expense, and prompt sale at an acceptable price may be difficult. Information regarding restricted securities is included at the end of the Fund's Schedule of Investments.
4. Purchases and Sales of Investments.
Purchases and sales of securities, other than short-term securities, aggregated $1,782,914,089 and $2,781,691,453, respectively.
5. Fees and Other Transactions with Affiliates.
Management Fee. FMR and its affiliates provide the Fund with investment management related services for which the Fund pays a monthly management fee. The management fee is the sum of an individual fund fee rate that is based on an annual rate of .45% of the Fund's average net assets and an annualized group fee rate that averaged .25% during the period. The group fee rate is based upon the average net assets of all the mutual funds advised by FMR, including any mutual funds previously advised by FMR that are currently advised by Fidelity SelectCo, LLC, an affiliate of FMR. The group fee rate decreases as assets under management increase and increases as assets under management decrease. In addition, the management fee is subject to a performance adjustment (up to a maximum of ± .20% of the Fund's average net assets over a 36 month performance period). The upward or downward adjustment to the management fee is based on the relative investment performance of Canada as compared to an appropriate benchmark index over the same 36 month performance period. For the reporting period, the total annual management fee rate, including the performance adjustment, was .60% of the Fund's average net assets. The performance adjustment included in the management fee rate may be higher or lower than the maximum performance adjustment rate due to the difference between the average net assets for the reporting and performance periods.
Distribution and Service Plan Fees. In accordance with Rule 12b-1 of the 1940 Act, the Fund has adopted separate Distribution and Service Plans for each class of shares. Certain classes pay Fidelity Distributors Corporation (FDC), an affiliate of FMR, separate Distribution and Service Fees, each of which is based on an annual percentage of each class' average net assets. In addition, FDC may pay financial intermediaries for selling shares of the Fund and providing shareholder support services. For the period, the Distribution and Service Fee rates, total fees and amounts retained by FDC were as follows:
| Distribution
Fee | Service
Fee | Total Fees | Retained
by FDC |
Class A | -% | .25% | $ 337,330 | $ 15,373 |
Class T | .25% | .25% | 129,706 | 3,129 |
Class B | .75% | .25% | 86,940 | 65,318 |
Class C | .75% | .25% | 543,853 | 40,074 |
| | | $ 1,097,829 | $ 123,894 |
Sales Load. FDC may receive a front-end sales charge of up to 5.75% for selling Class A shares and 3.50% for selling Class T shares, some of which is paid to financial intermediaries for selling shares of the Fund. Depending on the holding period, FDC may receive contingent deferred sales charges levied on Class A, Class T, Class B, and Class C redemptions. The deferred sales charges range from 5.00% to 1.00% for Class B shares, 1.00% for Class C shares, 1.00% for certain purchases of Class A shares and .25% for certain purchases of Class T shares.
Annual Report
Notes to Financial Statements - continued
5. Fees and Other Transactions with Affiliates - continued
Sales Load - continued
For the period, sales charge amounts retained by FDC were as follows:
| Retained
by FDC |
Class A | $ 34,481 |
Class T | 5,392 |
Class B* | 16,573 |
Class C* | 4,351 |
| $ 60,797 |
* When Class B and Class C shares are initially sold, FDC pays commissions from its own resources to financial intermediaries through which the sales are made.
Transfer Agent Fees. Fidelity Investments Institutional Operations Company, Inc., (FIIOC), an affiliate of FMR, is the transfer, dividend disbursing and shareholder servicing agent for each class of the Fund. FIIOC receives account fees and asset-based fees that vary according to the account size and type of account of the shareholders of the respective classes of the Fund. FIIOC pays for typesetting, printing and mailing of shareholder reports, except proxy statements.
For the period, transfer agent fees for each class were as follows:
| Amount | % of
Average
Net Assets |
Class A | $ 380,027 | .28 |
Class T | 80,050 | .31 |
Class B | 26,068 | .30 |
Class C | 144,052 | .27 |
Canada | 5,469,174 | .22 |
Institutional Class | 85,489 | .21 |
| $ 6,184,860 | |
Accounting and Security Lending Fees. Fidelity Service Company, Inc. (FSC), an affiliate of FMR, maintains the Fund's accounting records. The accounting fee is based on the level of average net assets for each month. Under a separate contract, FSC administers the security lending program. The security lending fee is based on the number and duration of lending transactions.
Brokerage Commissions. The Fund placed a portion of its portfolio transactions with brokerage firms which are affiliates of the investment adviser. Brokerage commissions are included in net realized gain (loss) and change in net unrealized appreciation (depreciation) in the Statement of Operations. The commissions paid to these affiliated firms were $7,827 for the period.
Interfund Lending Program. Pursuant to an Exemptive Order issued by the SEC, the Fund, along with other registered investment companies having management contracts with FMR, may participate in an interfund lending program. This program provides an alternative credit facility allowing the funds to borrow from, or lend money to, other participating affiliated funds. At period end, there were no interfund loans outstanding. The Fund's activity in this program during the period for which loans were outstanding was as follows:
Borrower or Lender | Average Loan
Balance | Weighted Average Interest Rate | Interest
Expense |
Borrower | $ 8,609,545 | .33% | $ 1,724 |
6. Committed Line of Credit.
The Fund participates with other funds managed by FMR or an affiliate in a $4.25 billion credit facility (the "line of credit") to be utilized for temporary or emergency purposes to fund shareholder redemptions or for other short-term liquidity purposes. The Fund has agreed to pay commitment fees on its pro-rata portion of the line of credit, which amounted to $6,428 and is reflected in Miscellaneous expenses on the Statement of Operations. During the period, there were no borrowings on this line of credit.
Annual Report
7. Security Lending.
The Fund lends portfolio securities through a lending agent from time to time in order to earn additional income. For equity securities, a lending agent is used and may loan securities to certain qualified borrowers, including Fidelity Capital Markets (FCM), a broker-dealer affiliated with the Fund. On the settlement date of the loan, the Fund receives collateral (in the form of U.S. Treasury obligations, letters of credit and/or cash) against the loaned securities and maintains collateral in an amount not less than 100% of the market value of the loaned securities during the period of the loan. The market value of the loaned securities is determined at the close of business of the Fund and any additional required collateral is delivered to the Fund on the next business day. If the borrower defaults on its obligation to return the securities loaned because of insolvency or other reasons, the Fund may apply collateral received from the borrower against the obligation. The Fund may experience delays and costs in recovering the securities loaned. Any cash collateral received is invested in the Fidelity Securities Lending Cash Central Fund. The value of loaned securities and cash collateral at period end are disclosed on the Fund's Statement of Assets and Liabilities. At period end, there were no security loans outstanding with FCM. Security lending income represents the income earned on investing cash collateral, less rebates paid to borrowers and any lending agent fees associated with the loan, plus any premium payments received for lending certain types of securities. Security lending income is presented in the Statement of Operations as a component of income from Fidelity Central Funds. Total security lending income during the period amounted to $3,181,563, including $135,823 from securities loaned to FCM.
8. Bank Borrowings.
The Fund is permitted to have bank borrowings for temporary or emergency purposes to fund shareholder redemptions or for other short-term liquidity requirements. The Fund has established borrowing arrangements with certain banks. The interest rate on the borrowings is the bank's base rate, as revised from time to time. The average loan balance during the period for which loans were outstanding amounted to $12,098,400. The weighted average interest rate was .66%. The interest expense amounted to $1,104 under the bank borrowing program. At period end, there were no bank borrowings outstanding.
9. Expense Reductions.
Commissions paid to certain brokers with whom FMR, or its affiliates, places trades on behalf of the Fund include an amount in addition to trade execution, which may be rebated back to the Fund to offset certain expenses. This amount totaled $248,571 for the period.
In addition, FMR reimbursed a portion of the Fund's operating expenses during the period in the amount of $40,968.
10. Distributions to Shareholders.
Distributions to shareholders of each class were as follows:
Years ended October 31, | 2013 | 2012 |
From net investment income | | |
Class A | $ 1,637,055 | $ 1,331,457 |
Class T | 220,579 | 100,888 |
Class B | 25,159 | - |
Class C | 146,334 | - |
Canada | 40,860,360 | 34,710,753 |
Institutional Class | 803,928 | 588,282 |
Total | $ 43,693,415 | $ 36,731,380 |
From net realized gain | | |
Class A | $ - | $ 1,169,578 |
Class T | - | 185,711 |
Class B | - | 32,050 |
Class C | - | 395,818 |
Canada | - | 20,430,566 |
Institutional Class | - | 352,725 |
Total | $ - | $ 22,566,448 |
Annual Report
Notes to Financial Statements - continued
11. Share Transactions.
Transactions for each class of shares were as follows:
| Shares | Dollars |
Years ended October 31, | 2013 | 2012 | 2013 | 2012 |
Class A | | | | |
Shares sold | 215,503 | 554,403 | $ 11,581,739 | $ 28,690,109 |
Reinvestment of distributions | 24,773 | 41,955 | 1,299,341 | 2,109,494 |
Shares redeemed | (1,179,795) | (1,747,243) | (63,487,281) | (89,985,257) |
Net increase (decrease) | (939,519) | (1,150,885) | $ (50,606,201) | $ (59,185,654) |
Class T | | | | |
Shares sold | 36,303 | 72,156 | $ 1,947,020 | $ 3,681,114 |
Reinvestment of distributions | 4,099 | 5,569 | 214,911 | 279,919 |
Shares redeemed | (178,697) | (183,751) | (9,595,838) | (9,407,140) |
Net increase (decrease) | (138,295) | (106,026) | $ (7,433,907) | $ (5,446,107) |
Class B | | | | |
Shares sold | 567 | 3,584 | $ 30,467 | $ 181,692 |
Reinvestment of distributions | 400 | 519 | 20,851 | 25,894 |
Shares redeemed | (49,457) | (49,710) | (2,648,974) | (2,528,127) |
Net increase (decrease) | (48,490) | (45,607) | $ (2,597,656) | $ (2,320,541) |
Class C | | | | |
Shares sold | 62,908 | 161,752 | $ 3,346,028 | $ 8,188,420 |
Reinvestment of distributions | 2,201 | 6,045 | 114,122 | 300,150 |
Shares redeemed | (510,875) | (622,861) | (27,051,390) | (31,505,606) |
Net increase (decrease) | (445,766) | (455,064) | $ (23,591,240) | $ (23,017,036) |
Canada | | | | |
Shares sold | 2,375,531 | 4,866,802 | $ 128,818,784 | $ 252,453,035 |
Reinvestment of distributions | 737,701 | 1,003,141 | 38,862,091 | 50,678,709 |
Shares redeemed | (19,289,279) | (22,354,268) | (1,044,400,607) | (1,155,960,861) |
Net increase (decrease) | (16,176,047) | (16,484,325) | $ (876,719,732) | $ (852,829,117) |
Institutional Class | | | | |
Shares sold | 144,801 | 561,510 | $ 7,839,112 | $ 29,055,185 |
Reinvestment of distributions | 11,985 | 13,162 | 629,694 | 663,252 |
Shares redeemed | (720,255) | (774,433) | (38,850,898) | (39,795,082) |
Net increase (decrease) | (563,469) | (199,761) | $ (30,382,092) | $ (10,076,645) |
12. Other.
The Fund's organizational documents provide former and current trustees and officers with a limited indemnification against liabilities arising in connection with the performance of their duties to the Fund. In the normal course of business, the Fund may also enter into contracts that provide general indemnifications. The Fund's maximum exposure under these arrangements is unknown as this would be dependent on future claims that may be made against the Fund. The risk of material loss from such claims is considered remote.
Annual Report
Fidelity China Region Fund
Average annual total return reflects the change in the value of an investment, assuming reinvestment of the class' distributions from dividend income and capital gains (the profits earned upon the sale of securities that have grown in value, if any) and assuming a constant rate of performance each year. The $10,000 table and the fund's returns do not reflect the deduction of taxes that a shareholder would pay on fund distributions or the redemption of fund shares. During periods of reimbursement by Fidelity, a fund's total return will be greater than it would be had the reimbursement not occurred. How a fund did yesterday is no guarantee of how it will do tomorrow.
Average Annual Total Returns
Periods ended October 31, 2013 | Past 1
year | Past 5
years | Past 10
years |
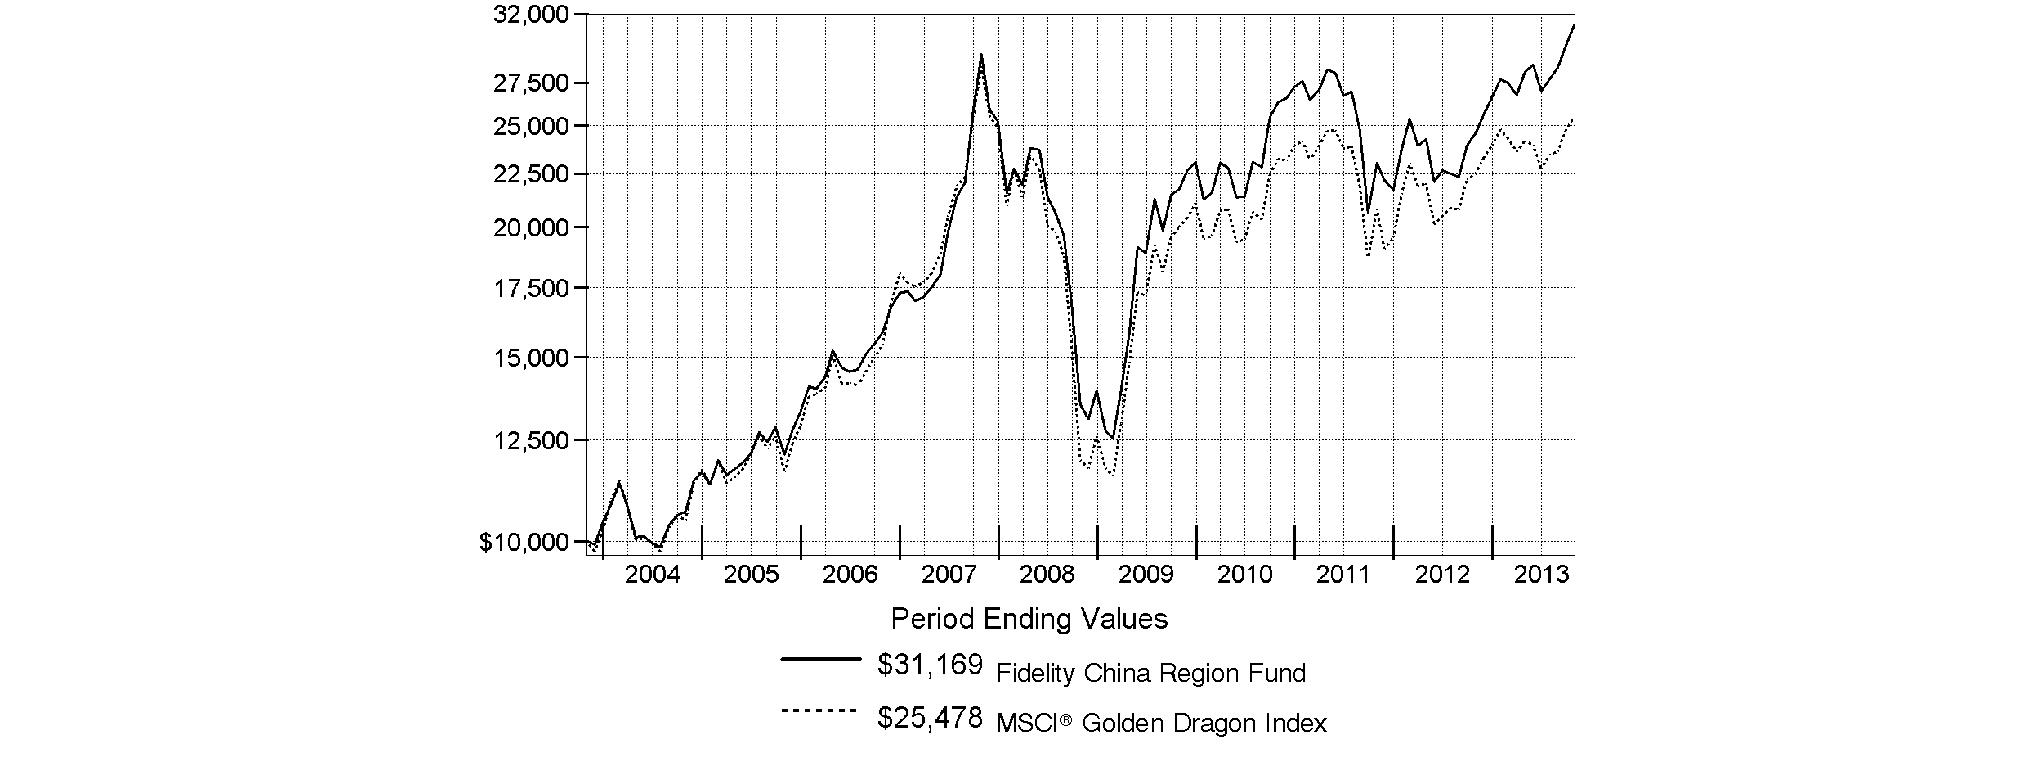
Fidelity China Region Fund | 26.51% | 18.16% | 12.04% |
$10,000 Over 10 Years
Let's say hypothetically that $10,000 was invested in Fidelity China Region Fund, a class of the fund, on October 31, 2003. The chart shows how the value of your investment would have changed, and also shows how the MSCI® Golden Dragon Index performed over the same period.
Annual Report
Fidelity China Region Fund
Market Recap: On balance, global equity markets remained upbeat for the 12-month period ending October 31, 2013. The MSCI® ACWI® (All Country World Index) Index gained 23.75% for the period, amid investor preference for higher-risk assets. The period was not without turbulence, however. In the spring and summer, central banks worldwide, especially in the U.S. and China, made clear their intentions to maintain accommodative monetary policies. That stance, combined with modest cyclical improvements around the globe and generally low valuations, underpinned the broad rally in equities. Europe (+32%) shone brightly, with most markets in the region - large and small - registering solid, index-beating gains. Another bright spot was Japan, which, despite a struggling yen and taking a second-half breather, posted a 34% result for the full year. The U.S. - by far the index's biggest constituent - also outperformed the global market with a roughly 28% advance. Meanwhile, Asia-Pacific ex Japan (+14%) lagged, hurt in part by a slowdown in Australia's mining industry as well as currency headwinds. Foreign-exchange and commodity weakness also curbed results in resource-heavy Canada and emerging markets (EM), both of which were up 7%. Country-level EM performance diverged meaningfully for the period, as evidenced by performance in Brazil (-1%), Russia (+12%), India (+1%) and China (+8%).
Comments from Robert Bao, Portfolio Manager of Fidelity® China Region Fund: For the year, the fund's Retail Class shares returned 26.51%, roughly doubling the 13.27% gain of the MSCI® Golden Dragon Index. Consumer discretionary was a sector in which I significantly increased the fund's weighting during the period. Versus the index, this sector bolstered our results the most by a wide margin and accounted for the fund's three largest relative contributors. The top relative contributor was China-based automaker Chongqing Changan Automobile, a non-index position I added to the fund during the period. The company's joint venture with U.S.-based Ford Motor continued to move in the right direction. Other notable contributors were Taiwan-headquartered ECLAT Textile and Chinese Internet travel portal Ctrip.com International, the latter of which was not in the index and benefited from the surging popularity of online travel reservations in China. On the negative side, financials was the most noteworthy detractor, with stock picking in banks particularly problematic. At the stock level, the largest relative detractor was Spreadtrum Communications, a non-index semiconductor company located in China. The firm was pressured early in the period by greater competition, and with its growth prospects apparently deteriorating, I sold it in January. Also detracting was Chinese property developer Greenland Hong Kong Holdings, which changed its name from SPG Land in August 2013. This non-index stock faltered in part because of a delay in an expected capital injection from its parent company.
Note to shareholders: Fidelity China Region Fund may invest up to 35% of its total assets in any industry that represents more than 20% of the Hong Kong, Taiwanese and Chinese market. As of October 31, 2013, the fund did not have more than 25% of its total assets invested in any one industry.
The views expressed above reflect those of the portfolio manager(s) only through the end of the period as stated on the cover of this report and do not necessarily represent the views of Fidelity or any other person in the Fidelity organization. Any such views are subject to change at any time based upon market or other conditions and Fidelity disclaims any responsibility to update such views. These views may not be relied on as investment advice and, because investment decisions for a Fidelity fund are based on numerous factors, may not be relied on as an indication of trading intent on behalf of any Fidelity fund.
Annual Report
Fidelity China Region Fund
As a shareholder of the Fund, you incur two types of costs: (1) transaction costs, including sales charges (loads) on purchase payments or redemption proceeds, redemption fees and (2) ongoing costs, including management fees, distribution and/or service (12b-1) fees and other Fund expenses. This Example is intended to help you understand your ongoing costs (in dollars) of investing in the Fund and to compare these costs with the ongoing costs of investing in other mutual funds.
The Example is based on an investment of $1,000 invested at the beginning of the period and held for the entire period (May 1, 2013 to October 31, 2013).
Actual Expenses
The first line of the accompanying table for each class of the Fund provides information about actual account values and actual expenses. You may use the information in this line, together with the amount you invested, to estimate the expenses that you paid over the period. Simply divide your account value by $1,000.00 (for example, an $8,600 account value divided by $1,000.00 = 8.6), then multiply the result by the number in the first line for a class of the Fund under the heading entitled "Expenses Paid During Period" to estimate the expenses you paid on your account during this period. A small balance maintenance fee of $12.00 that is charged once a year may apply for certain accounts with a value of less than $2,000. This fee is not included in the table below. If it was, the estimate of expenses you paid during the period would be higher, and your ending account value lower, by this amount. In addition, the Fund, as a shareholder in the underlying Fidelity Central Funds, will indirectly bear its pro-rata share of the fees and expenses incurred by the underlying Fidelity Central Funds. These fees and expenses are not included in the Fund's annualized expense ratio used to calculate the expense estimate in the table below.
Hypothetical Example for Comparison Purposes
The second line of the accompanying table for each class of the Fund provides information about hypothetical account values and hypothetical expenses based on a Class' actual expense ratio and an assumed rate of return of 5% per year before expenses, which is not the Class' actual return. The hypothetical account values and expenses may not be used to estimate the actual ending account balance or expenses you paid for the period. You may use this information to compare the ongoing costs of investing in the Fund and other funds. To do so, compare this 5% hypothetical example with the 5% hypothetical examples that appear in the shareholder reports of the other funds. A small balance maintenance fee of $12.00 that is charged once a year may apply for certain accounts with a value of less than $2,000. This fee is not included in the table below. If it was, the estimate of expenses you paid during the period would be higher, and your ending account value lower, by this amount. In addition, the Fund, as a shareholder in the underlying Fidelity Central Funds, will indirectly bear its pro-rata share of the fees and expenses incurred by the underlying Fidelity Central Funds. These fees and expenses are not included in the Fund's annualized expense ratio used to calculate the expense estimate in the table below.
Please note that the expenses shown in the table are meant to highlight your ongoing costs only and do not reflect any transaction costs. Therefore, the second line of the table is useful in comparing ongoing costs only, and will not help you determine the relative total costs of owning different funds. In addition, if these transactional costs were included, your costs would have been higher.
| Annualized
Expense RatioB | Beginning
Account Value
May 1, 2013 | Ending
Account Value
October 31, 2013 | Expenses Paid
During Period*
May 1, 2013
to October 31, 2013 |
Class A | 1.34% | | | |
Actual | | $ 1,000.00 | $ 1,106.80 | $ 7.12 |
HypotheticalA | | $ 1,000.00 | $ 1,018.45 | $ 6.82 |
Class T | 1.64% | | | |
Actual | | $ 1,000.00 | $ 1,105.20 | $ 8.70 |
HypotheticalA | | $ 1,000.00 | $ 1,016.94 | $ 8.34 |
Class B | 2.09% | | | |
Actual | | $ 1,000.00 | $ 1,102.70 | $ 11.08 |
HypotheticalA | | $ 1,000.00 | $ 1,014.67 | $ 10.61 |
Class C | 2.09% | | | |
Actual | | $ 1,000.00 | $ 1,102.40 | $ 11.08 |
HypotheticalA | | $ 1,000.00 | $ 1,014.67 | $ 10.61 |
China Region | 1.01% | | | |
Actual | | $ 1,000.00 | $ 1,108.60 | $ 5.37 |
HypotheticalA | | $ 1,000.00 | $ 1,020.11 | $ 5.14 |
Institutional Class | .95% | | | |
Actual | | $ 1,000.00 | $ 1,108.90 | $ 5.05 |
HypotheticalA | | $ 1,000.00 | $ 1,020.42 | $ 4.84 |
A 5% return per year before expenses
B Annualized expense ratio reflects expenses net of applicable fee waivers.
* Expenses are equal to each Class' annualized expense ratio, multiplied by the average account value over the period, multiplied by 184/365 (to reflect the one-half year period).
Annual Report
Fidelity China Region Fund
Investment Changes (Unaudited)
Geographic Diversification (% of fund's net assets) |
As of October 31, 2013 |
| Cayman Islands | 24.1% | |
 | China | 20.9% | |
 | Hong Kong | 16.7% | |
 | Taiwan | 14.8% | |
 | Bermuda | 10.6% | |
 | United States of America* | 6.9% | |
 | Japan | 2.1% | |
 | Korea (South) | 1.7% | |
 | Italy | 1.5% | |
| Other | 0.7% | |

* Includes Short-Term Investments and Net Other Assets (Liabilities). |
Percentages are based on country or territory of incorporation and are adjusted for the effect of futures contracts, if applicable. |
As of April 30, 2013 |
| Hong Kong | 24.3% | |
| China | 23.8% | |
| Cayman Islands | 20.9% | |
| Taiwan | 19.2% | |
| Bermuda | 6.8% | |
| Korea (South) | 1.3% | |
| United States of America* | 1.2% | |
| Italy | 1.0% | |
| Thailand | 0.6% | |
| Other | 0.9% | |

* Includes Short-Term Investments and Net Other Assets (Liabilities). |
Percentages are based on country or territory of incorporation and are adjusted for the effect of futures contracts, if applicable. |
Asset Allocation as of October 31, 2013 |
| % of fund's
net assets | % of fund's net assets
6 months ago |
Stocks | 95.3 | 99.3 |
Short-Term Investments and Net Other Assets (Liabilities) | 4.7 | 0.7 |
Top Ten Stocks as of October 31, 2013 |
| % of fund's
net assets | % of fund's net assets
6 months ago |
Tencent Holdings Ltd. (Internet Software & Services) | 6.8 | 4.4 |
Taiwan Semiconductor Manufacturing Co. Ltd. (Semiconductors & Semiconductor Equipment) | 5.7 | 5.7 |
AIA Group Ltd. (Insurance) | 5.1 | 4.8 |
Industrial & Commercial Bank of China Ltd. (H Shares) (Commercial Banks) | 3.7 | 4.0 |
China Construction Bank Corp. (H Shares) (Commercial Banks) | 3.7 | 3.9 |
Chongqing Changan Automobile Co. Ltd. (B Shares) (Automobiles) | 3.0 | 2.3 |
Summit Ascent Holdings Ltd. (Trading Companies & Distributors) | 2.5 | 0.0 |
Sinopec Kantons Holdings Ltd. (Oil, Gas & Consumable Fuels) | 2.3 | 1.4 |
Galaxy Entertainment Group Ltd. (Hotels, Restaurants & Leisure) | 1.7 | 1.3 |
Brilliance China Automotive Holdings Ltd. (Automobiles) | 1.7 | 0.5 |
| 36.2 | |
Market Sectors as of October 31, 2013 |
| % of fund's
net assets | % of fund's net assets
6 months ago |
Consumer Discretionary | 25.7 | 21.7 |
Information Technology | 24.8 | 21.5 |
Financials | 21.8 | 32.1 |
Industrials | 7.6 | 7.3 |
Materials | 3.9 | 5.2 |
Energy | 3.2 | 3.0 |
Health Care | 3.1 | 2.1 |
Utilities | 3.0 | 3.9 |
Telecommunication Services | 1.6 | 2.1 |
Consumer Staples | 0.6 | 0.4 |
Annual Report
Fidelity China Region Fund
Investments October 31, 2013
Showing Percentage of Net Assets
Common Stocks - 95.3% |
| Shares | | Value |
CONSUMER DISCRETIONARY - 25.7% |
Automobiles - 7.2% |
Brilliance China Automotive Holdings Ltd. | 14,164,000 | | $ 24,772,841 |
Chongqing Changan Automobile Co. Ltd. (B Shares) | 24,223,686 | | 44,679,312 |
Geely Automobile Holdings Ltd. | 25,170,000 | | 12,693,757 |
Great Wall Motor Co. Ltd. (H Shares) | 1,600,000 | | 9,400,232 |
Guangzhou Automobile Group Co. Ltd. (H Shares) | 12,000,000 | | 14,239,649 |
| | 105,785,791 |
Hotels, Restaurants & Leisure - 6.9% |
Galaxy Entertainment Group Ltd. (a) | 3,451,000 | | 25,750,077 |
Hotel Shilla Co. | 132,714 | | 8,565,982 |
Melco International Development Ltd. | 7,009,000 | | 22,013,304 |
Melco Crown Entertainment Ltd. sponsored ADR (a) | 403,400 | | 13,376,744 |
Sands China Ltd. | 3,241,800 | | 23,039,234 |
Shangri-La Asia Ltd. | 5,000,000 | | 9,157,745 |
| | 101,903,086 |
Household Durables - 1.3% |
Techtronic Industries Co. Ltd. | 7,728,000 | | 19,437,121 |
Internet & Catalog Retail - 1.0% |
Ctrip.com International Ltd. sponsored ADR (a) | 260,916 | | 14,154,693 |
Leisure Equipment & Products - 1.2% |
Goodbaby International Holdings Ltd. | 16,000,000 | | 7,904,037 |
Merida Industry Co. Ltd. | 1,309,450 | | 9,920,413 |
| | 17,824,450 |
Media - 1.4% |
ChinaVision Media Group Ltd. (a) | 110,780,000 | | 6,787,115 |
Fuji Media Holdings, Inc. | 350,000 | | 6,977,377 |
SinoMedia Holding Ltd. | 8,000,000 | | 7,450,019 |
| | 21,214,511 |
Multiline Retail - 1.6% |
Lifestyle International Holdings Ltd. | 3,953,500 | | 8,617,845 |
Springland International Holdings Ltd. | 25,897,000 | | 14,196,085 |
| | 22,813,930 |
Specialty Retail - 2.0% |
Baoxin Auto Group Ltd. (d) | 21,494,000 | | 22,151,046 |
Oriental Watch Holdings Ltd. | 23,466,000 | | 7,506,214 |
| | 29,657,260 |
Textiles, Apparel & Luxury Goods - 3.1% |
ECLAT Textile Co. Ltd. | 1,486,140 | | 16,333,151 |
Prada SpA | 2,299,200 | | 22,419,647 |
Shenzhou International Group Holdings Ltd. | 2,046,000 | | 7,046,072 |
| | 45,798,870 |
TOTAL CONSUMER DISCRETIONARY | | 378,589,712 |
|
| Shares | | Value |
CONSUMER STAPLES - 0.6% |
Food Products - 0.6% |
China Mengniu Dairy Co. Ltd. | 2,000,000 | | $ 8,796,595 |
ENERGY - 3.2% |
Energy Equipment & Services - 0.9% |
China Oilfield Services Ltd. (H Shares) | 3,520,000 | | 9,852,186 |
Hilong Holding Ltd. | 5,400,000 | | 3,593,964 |
| | 13,446,150 |
Oil, Gas & Consumable Fuels - 2.3% |
Sinopec Kantons Holdings Ltd. (d) | 37,162,000 | | 33,888,216 |
TOTAL ENERGY | | 47,334,366 |
FINANCIALS - 21.8% |
Capital Markets - 0.1% |
SAIC Motor Corp. Ltd. Class A (UBS Warrant Programme) warrants 9/16/14 (a) | 798,200 | | 1,878,118 |
Commercial Banks - 9.4% |
BOC Hong Kong (Holdings) Ltd. | 7,402,000 | | 24,154,598 |
China Construction Bank Corp. (H Shares) | 69,778,000 | | 54,180,776 |
Industrial & Commercial Bank of China Ltd. (H Shares) | 78,024,000 | | 54,645,985 |
SAIC Motor Corp. Ltd. Class A (BNP Paribas Warrant Program) warrants 8/5/15 (a) | 2,201,800 | | 5,180,706 |
| | 138,162,065 |
Insurance - 6.6% |
AIA Group Ltd. | 14,982,600 | | 76,043,507 |
China Pacific Insurance Group Co. Ltd. (H Shares) | 5,999,200 | | 21,666,142 |
| | 97,709,649 |
Real Estate Investment Trusts - 0.5% |
Champion (REIT) | 15,000,000 | | 6,694,183 |
Real Estate Management & Development - 5.2% |
CSI Properties Ltd. | 144,620,000 | | 5,036,425 |
Great Eagle Holdings Ltd. | 2,150,000 | | 7,653,811 |
Greenland Hong Kong Holdings Ltd. | 15,000,000 | | 10,602,347 |
Greentown China Holdings Ltd. | 4,400,000 | | 8,546,885 |
Hopson Development Holdings Ltd. (a) | 14,240,000 | | 17,503,831 |
Lifestyle Property Development Ltd. | 197,675 | | 40,030 |
Shimao Property Holdings Ltd. | 3,908,500 | | 9,840,567 |
Sun Hung Kai Properties Ltd. | 1,282,000 | | 16,800,103 |
| | 76,023,999 |
TOTAL FINANCIALS | | 320,468,014 |
HEALTH CARE - 3.1% |
Health Care Equipment & Supplies - 0.4% |
Pacific Hospital Supply Co. Ltd. | 1,300,000 | | 4,836,079 |
Common Stocks - continued |
| Shares | | Value |
HEALTH CARE - continued |
Pharmaceuticals - 2.7% |
China Pharmaceutical Group Ltd. | 30,500,000 | | $ 19,001,032 |
Lee's Pharmaceutical Holdings Ltd. | 8,290,000 | | 7,688,005 |
Tong Ren Tang Technologies Co. Ltd. (H Shares) (d) | 4,351,000 | | 13,188,250 |
| | 39,877,287 |
TOTAL HEALTH CARE | | 44,713,366 |
INDUSTRIALS - 7.6% |
Commercial Services & Supplies - 0.6% |
Cleanaway Co. Ltd. | 1,409,000 | | 8,807,746 |
Construction & Engineering - 1.2% |
China State Construction International Holdings Ltd. | 10,482,000 | | 17,657,026 |
Machinery - 0.7% |
Cimc Enric Holdings Ltd. | 7,400,000 | | 10,422,804 |
Marine - 1.7% |
China Shipping Development Co. Ltd. (H Shares) (a) | 31,444,000 | | 17,804,612 |
Orient Overseas International Ltd. | 1,506,500 | | 7,782,191 |
| | 25,586,803 |
Road & Rail - 0.1% |
PT Express Transindo Utama Tbk | 10,253,000 | | 1,364,331 |
Trading Companies & Distributors - 2.8% |
Shanghai Waigaoqiao Free Trade Zone Development Co. Ltd. (B Shares) | 1,762,725 | | 3,587,145 |
Summit Ascent Holdings Ltd. (a) | 24,986,000 | | 37,255,019 |
| | 40,842,164 |
Transportation Infrastructure - 0.5% |
Airports of Thailand PCL (For. Reg.) | 1,041,000 | | 7,090,506 |
TOTAL INDUSTRIALS | | 111,771,380 |
INFORMATION TECHNOLOGY - 24.8% |
Communications Equipment - 0.9% |
KMC Kuei Meng International, Inc. | 3,075,000 | | 13,580,771 |
Computers & Peripherals - 3.1% |
Advantech Co. Ltd. | 2,854,000 | | 18,276,847 |
Lenovo Group Ltd. | 18,902,000 | | 20,235,599 |
LITE-ON Technology Corp. | 4,144,537 | | 7,237,275 |
| | 45,749,721 |
Electronic Equipment & Components - 0.2% |
Tong Hsing Electronics Industries Ltd. | 666,000 | | 3,518,362 |
Internet Software & Services - 10.7% |
58.com, Inc. ADR | 7,300 | | 176,076 |
|
| Shares | | Value |
NHN Corp. | 30,000 | | $ 16,875,841 |
Sohu.com, Inc. (a)(d) | 325,000 | | 21,762,000 |
Tencent Holdings Ltd. | 1,827,200 | | 99,738,299 |
Yahoo!, Inc. (a) | 300,000 | | 9,879,000 |
Youku Tudou, Inc. ADR (a)(d) | 300,000 | | 8,172,000 |
| | 156,603,216 |
Semiconductors & Semiconductor Equipment - 9.3% |
Chipbond Technology Corp. | 6,011,000 | | 12,130,233 |
GCL-Poly Energy Holdings Ltd. (a) | 26,000,000 | | 7,981,427 |
Inotera Memories, Inc. (a) | 16,657,000 | | 10,723,633 |
MediaTek, Inc. | 816,000 | | 11,144,284 |
Novatek Microelectronics Corp. | 2,674,000 | | 10,583,353 |
Taiwan Semiconductor Manufacturing Co. Ltd. | 22,911,796 | | 84,283,698 |
| | 136,846,628 |
Software - 0.6% |
Forgame Holdings Ltd. | 1,086,700 | | 8,970,566 |
TOTAL INFORMATION TECHNOLOGY | | 365,269,264 |
MATERIALS - 3.9% |
Chemicals - 0.5% |
Taiwan Fertilizer Co. Ltd. | 3,015,000 | | 7,170,036 |
Construction Materials - 1.9% |
Anhui Conch Cement Co. Ltd. (H Shares) | 6,898,000 | | 24,066,929 |
Asia Cement (China) Holdings Corp. | 6,409,500 | | 3,505,260 |
| | 27,572,189 |
Containers & Packaging - 0.8% |
Greatview Aseptic Pack Co. Ltd. | 19,157,000 | | 12,058,063 |
Paper & Forest Products - 0.7% |
Lee & Man Paper Manufacturing Ltd. | 15,012,000 | | 10,765,732 |
TOTAL MATERIALS | | 57,566,020 |
TELECOMMUNICATION SERVICES - 1.6% |
Wireless Telecommunication Services - 1.6% |
SoftBank Corp. | 316,000 | | 23,598,535 |
UTILITIES - 3.0% |
Electric Utilities - 0.7% |
Power Assets Holdings Ltd. | 1,173,500 | | 9,777,905 |
Independent Power Producers & Energy Traders - 2.3% |
Beijing Jingneng Clean Energy Co. Ltd. (H Shares) | 27,500,000 | | 11,421,385 |
China Longyuan Power Grid Corp. Ltd. (H Shares) | 8,487,000 | | 9,753,537 |
Huadian Fuxin Energy Corp. Ltd. | 43,672,000 | | 13,462,670 |
| | 34,637,592 |
TOTAL UTILITIES | | 44,415,497 |
TOTAL COMMON STOCKS (Cost $1,030,690,335) |
1,402,522,749
|
Money Market Funds - 6.6% |
| Shares | | Value |
Fidelity Cash Central Fund, 0.09% (b) | 62,559,358 | | $ 62,559,358 |
Fidelity Securities Lending Cash Central Fund, 0.09% (b)(c) | 33,705,375 | | 33,705,375 |
TOTAL MONEY MARKET FUNDS (Cost $96,264,733) |
96,264,733
|
TOTAL INVESTMENT PORTFOLIO - 101.9% (Cost $1,126,955,068) | | 1,498,787,482 |
NET OTHER ASSETS (LIABILITIES) - (1.9)% | | (27,714,773) |
NET ASSETS - 100% | $ 1,471,072,709 |
Legend |
(a) Non-income producing |
(b) Affiliated fund that is generally available only to investment companies and other accounts managed by Fidelity Investments. The rate quoted is the annualized seven-day yield of the fund at period end. A complete unaudited listing of the fund's holdings as of its most recent quarter end is available upon request. In addition, each Fidelity Central Fund's financial statements, which are not covered by the Fund's Report of Independent Registered Public Accounting Firm, are available on the SEC's website or upon request. |
(c) Investment made with cash collateral received from securities on loan. |
(d) Security or a portion of the security is on loan at period end. |
Affiliated Central Funds |
Information regarding fiscal year to date income earned by the Fund from investments in Fidelity Central Funds is as follows: |
Fund | Income earned |
Fidelity Cash Central Fund | $ 52,688 |
Fidelity Securities Lending Cash Central Fund | 104,014 |
Total | $ 156,702 |
Other Information |
The following is a summary of the inputs used, as of October 31, 2013, involving the Fund's assets and liabilities carried at fair value. The inputs or methodology used for valuing securities may not be an indication of the risk associated with investing in those securities. For more information on valuation inputs, and their aggregation into the levels used in the table below, please refer to the Investment Valuation section in the accompanying Notes to Financial Statements. |
Valuation Inputs at Reporting Date: |
Description | Total | Level 1 | Level 2 | Level 3 |
Investments in Securities: | | | | |
Equities: | | | | |
Consumer Discretionary | $ 378,589,712 | $ 371,612,335 | $ 6,977,377 | $ - |
Consumer Staples | 8,796,595 | 8,796,595 | - | - |
Energy | 47,334,366 | 47,334,366 | - | - |
Financials | 320,468,014 | 313,409,190 | 7,058,824 | - |
Health Care | 44,713,366 | 44,713,366 | - | - |
Industrials | 111,771,380 | 111,771,380 | - | - |
Information Technology | 365,269,264 | 280,985,566 | 84,283,698 | - |
Materials | 57,566,020 | 57,566,020 | - | - |
Telecommunication Services | 23,598,535 | - | 23,598,535 | - |
Utilities | 44,415,497 | 44,415,497 | - | - |
Money Market Funds | 96,264,733 | 96,264,733 | - | - |
Total Investments in Securities: | $ 1,498,787,482 | $ 1,376,869,048 | $ 121,918,434 | $ - |
See accompanying notes which are an integral part of the financial statements.
Annual Report
Fidelity China Region Fund
Statement of Assets and Liabilities
| October 31, 2013 |
| | |
Assets | | |
Investment in securities, at value (including securities loaned of $32,990,653) - See accompanying schedule: Unaffiliated issuers (cost $1,030,690,335) | $ 1,402,522,749 | |
Fidelity Central Funds (cost $96,264,733) | 96,264,733 | |
Total Investments (cost $1,126,955,068) | | $ 1,498,787,482 |
Foreign currency held at value (cost $642,377) | | 642,196 |
Receivable for investments sold | | 7,139,250 |
Receivable for fund shares sold | | 1,079,646 |
Dividends receivable | | 145,217 |
Distributions receivable from Fidelity Central Funds | | 18,788 |
Prepaid expenses | | 4,105 |
Other receivables | | 202,494 |
Total assets | | 1,508,019,178 |
| | |
Liabilities | | |
Payable for investments purchased | $ 124,100 | |
Payable for fund shares redeemed | 1,709,290 | |
Accrued management fee | 854,776 | |
Distribution and service plan fees payable | 13,438 | |
Other affiliated payables | 298,538 | |
Other payables and accrued expenses | 240,952 | |
Collateral on securities loaned, at value | 33,705,375 | |
Total liabilities | | 36,946,469 |
| | |
Net Assets | | $ 1,471,072,709 |
Net Assets consist of: | | |
Paid in capital | | $ 953,599,430 |
Undistributed net investment income | | 15,463,609 |
Accumulated undistributed net realized gain (loss) on investments and foreign currency transactions | | 130,182,313 |
Net unrealized appreciation (depreciation) on investments and assets and liabilities in foreign currencies | | 371,827,357 |
Net Assets | | $ 1,471,072,709 |
Statement of Assets and Liabilities - continued
| October 31, 2013 |
| | |
Calculation of Maximum Offering Price Class A:
Net Asset Value and redemption price per share ($20,622,669 ÷ 579,951 shares) | | $ 35.56 |
| | |
Maximum offering price per share (100/94.25 of $35.56) | | $ 37.73 |
Class T:
Net Asset Value and redemption price per share ($5,964,876 ÷ 168,514 shares) | | $ 35.40 |
| | |
Maximum offering price per share (100/96.50 of $35.40) | | $ 36.68 |
Class B:
Net Asset Value and offering price per share ($1,494,199 ÷ 42,544 shares)A | | $ 35.12 |
| | |
Class C:
Net Asset Value and offering price per share ($6,956,980 ÷ 198,810 shares)A | | $ 34.99 |
| | |
China Region:
Net Asset Value, offering price and redemption price per share ($1,425,828,353 ÷ 39,795,030 shares) | | $ 35.83 |
| | |
Institutional Class:
Net Asset Value, offering price and redemption price per share ($10,205,632 ÷ 285,481 shares) | | $ 35.75 |
A Redemption price per share is equal to net asset value less any applicable contingent deferred sales charge.
See accompanying notes which are an integral part of the financial statements.
Annual Report
Fidelity China Region Fund
Financial Statements - continued
Statement of Operations
| Year ended October 31, 2013 |
| | |
Investment Income | | |
Dividends | | $ 34,175,261 |
Interest | | 33 |
Income from Fidelity Central Funds | | 156,702 |
Income before foreign taxes withheld | | 34,331,996 |
Less foreign taxes withheld | | (2,083,075) |
Total income | | 32,248,921 |
| | |
Expenses | | |
Management fee | $ 10,087,253 | |
Transfer agent fees | 3,112,421 | |
Distribution and service plan fees | 144,087 | |
Accounting and security lending fees | 647,972 | |
Custodian fees and expenses | 548,229 | |
Independent trustees' compensation | 8,224 | |
Registration fees | 103,330 | |
Audit | 73,742 | |
Legal | 3,695 | |
Interest | 515 | |
Miscellaneous | 11,843 | |
Total expenses before reductions | 14,741,311 | |
Expense reductions | (531,119) | 14,210,192 |
Net investment income (loss) | | 18,038,729 |
Realized and Unrealized Gain (Loss) Net realized gain (loss) on: | | |
Investment securities: | | |
Unaffiliated issuers | 182,788,330 | |
Foreign currency transactions | (157,631) | |
Total net realized gain (loss) | | 182,630,699 |
Change in net unrealized appreciation (depreciation) on: Investment securities | 120,644,687 | |
Assets and liabilities in foreign currencies | (5,059) | |
Total change in net unrealized appreciation (depreciation) | | 120,639,628 |
Net gain (loss) | | 303,270,327 |
Net increase (decrease) in net assets resulting from operations | | $ 321,309,056 |
Statement of Changes in Net Assets
| Year ended
October 31,
2013 | Year ended
October 31,
2012 |
Increase (Decrease) in Net Assets | | |
Operations | | |
Net investment income (loss) | $ 18,038,729 | $ 22,782,166 |
Net realized gain (loss) | 182,630,699 | (16,515,956) |
Change in net unrealized appreciation (depreciation) | 120,639,628 | 76,673,702 |
Net increase (decrease) in net assets resulting from operations | 321,309,056 | 82,939,912 |
Distributions to shareholders from net investment income | (19,616,401) | (15,687,379) |
Distributions to shareholders from net realized gain | - | (18,721,345) |
Total distributions | (19,616,401) | (34,408,724) |
Share transactions - net increase (decrease) | (122,395,498) | (301,570,428) |
Redemption fees | 393,175 | 184,146 |
Total increase (decrease) in net assets | 179,690,332 | (252,855,094) |
| | |
Net Assets | | |
Beginning of period | 1,291,382,377 | 1,544,237,471 |
End of period (including undistributed net investment income of $15,463,609 and undistributed net investment income of $19,540,796, respectively) | $ 1,471,072,709 | $ 1,291,382,377 |
See accompanying notes which are an integral part of the financial statements.
Annual Report
Financial Highlights - Class A
Years ended October 31, | 2013 | 2012 | 2011 | 2010 | 2009 |
Selected Per-Share Data | | | | | |
Net asset value, beginning of period | $ 28.53 | $ 27.28 | $ 31.61 | $ 26.47 | $ 16.67 |
Income from Investment Operations | | | | | |
Net investment income (loss) C | .30 | .36 | .33 | .25 | .30 |
Net realized and unrealized gain (loss) | 7.06 | 1.42 | (4.33) | 5.15 | 9.63 |
Total from investment operations | 7.36 | 1.78 | (4.00) | 5.40 | 9.93 |
Distributions from net investment income | (.34) | (.19) | (.31) | (.20) | (.16) |
Distributions from net realized gain | - | (.34) | (.03) | (.07) | - |
Total distributions | (.34) | (.53) | (.34) | (.27) | (.16) |
Redemption fees added to paid in capital C | .01 | - G | .01 | .01 | .03 |
Net asset value, end of period | $ 35.56 | $ 28.53 | $ 27.28 | $ 31.61 | $ 26.47 |
Total Return A, B | 26.07% | 6.70% | (12.79)% | 20.54% | 60.41% |
Ratios to Average Net Assets D, F | | | | | |
Expenses before reductions | 1.35% | 1.36% | 1.37% | 1.38% | 1.39% |
Expenses net of fee waivers, if any | 1.35% | 1.36% | 1.37% | 1.38% | 1.39% |
Expenses net of all reductions | 1.31% | 1.29% | 1.31% | 1.31% | 1.31% |
Net investment income (loss) | .94% | 1.35% | 1.07% | .91% | 1.27% |
Supplemental Data | | | | | |
Net assets, end of period (000 omitted) | $ 20,623 | $ 13,539 | $ 14,808 | $ 16,047 | $ 11,842 |
Portfolio turnover rate E | 92% | 107% | 87% | 57% | 88% |
ATotal returns would have been lower if certain expenses had not been reduced during the applicable periods shown. BTotal returns do not include the effect of the sales charges. CCalculated based on average shares outstanding during the period. DFees and expenses of any underlying Fidelity Central Funds are not included in the Fund's expense ratio. The Fund indirectly bears its proportionate share of the expenses of any underlying Fidelity Central Funds. EAmount does not include the portfolio activity of any underlying Fidelity Central Funds. FExpense ratios reflect operating expenses of the class. Expenses before reductions do not reflect amounts reimbursed by the investment adviser or reductions from brokerage service arrangements or reductions from other expense offset arrangements and do not represent the amount paid by the class during periods when reimbursements or reductions occur. Expenses net of fee waivers reflect expenses after reimbursement by the investment adviser but prior to reductions from brokerage service arrangements or other expense offset arrangements. Expenses net of all reductions represent the net expenses paid by the class. GAmount represents less than $.01 per share. |
Financial Highlights - Class T
Years ended October 31, | 2013 | 2012 | 2011 | 2010 | 2009 |
Selected Per-Share Data | | | | | |
Net asset value, beginning of period | $ 28.40 | $ 27.13 | $ 31.48 | $ 26.40 | $ 16.65 |
Income from Investment Operations | | | | | |
Net investment income (loss) C | .21 | .29 | .25 | .18 | .23 |
Net realized and unrealized gain (loss) | 7.04 | 1.40 | (4.32) | 5.13 | 9.64 |
Total from investment operations | 7.25 | 1.69 | (4.07) | 5.31 | 9.87 |
Distributions from net investment income | (.26) | (.08) | (.27) | (.18) | (.14) |
Distributions from net realized gain | - | (.34) | (.03) | (.07) | - |
Total distributions | (.26) | (.42) | (.29) H | (.24) I | (.14) |
Redemption fees added to paid in capital C | .01 | - G | .01 | .01 | .02 |
Net asset value, end of period | $ 35.40 | $ 28.40 | $ 27.13 | $ 31.48 | $ 26.40 |
Total Return A, B | 25.74% | 6.38% | (13.04)% | 20.27% | 59.92% |
Ratios to Average Net Assets D, F | | | | | |
Expenses before reductions | 1.64% | 1.64% | 1.63% | 1.64% | 1.66% |
Expenses net of fee waivers, if any | 1.64% | 1.64% | 1.63% | 1.64% | 1.66% |
Expenses net of all reductions | 1.60% | 1.57% | 1.57% | 1.58% | 1.58% |
Net investment income (loss) | .65% | 1.06% | .81% | .64% | 1.00% |
Supplemental Data | | | | | |
Net assets, end of period (000 omitted) | $ 5,965 | $ 4,349 | $ 5,281 | $ 6,070 | $ 3,139 |
Portfolio turnover rate E | 92% | 107% | 87% | 57% | 88% |
ATotal returns would have been lower if certain expenses had not been reduced during the applicable periods shown. BTotal returns do not include the effect of the sales charges. CCalculated based on average shares outstanding during the period. DFees and expenses of any underlying Fidelity Central Funds are not included in the Fund's expense ratio. The Fund indirectly bears its proportionate share of the expenses of any underlying Fidelity Central Funds. EAmount does not include the portfolio activity of any underlying Fidelity Central Funds. FExpense ratios reflect operating expenses of the class. Expenses before reductions do not reflect amounts reimbursed by the investment adviser or reductions from brokerage service arrangements or reductions from other expense offset arrangements and do not represent the amount paid by the class during periods when reimbursements or reductions occur. Expenses net of fee waivers reflect expenses after reimbursement by the investment adviser but prior to reductions from brokerage service arrangements or other expense offset arrangements. Expenses net of all reductions represent the net expenses paid by the class. GAmount represents less than $.01 per share. HTotal distributions of $.29 per share is comprised of distributions from net investment income of $.268 and distributions from net realized gain of $.025 per share. ITotal distributions of $.24 per share is comprised of distributions from net investment income of $.177 and distributions from net realized gain of $.065 per share. |
See accompanying notes which are an integral part of the financial statements.
Annual Report
Financial Highlights - Class B
Years ended October 31, | 2013 | 2012 | 2011 | 2010 | 2009 |
Selected Per-Share Data | | | | | |
Net asset value, beginning of period | $ 28.16 | $ 26.94 | $ 31.23 | $ 26.28 | $ 16.61 |
Income from Investment Operations | | | | | |
Net investment income (loss) C | .06 | .16 | .10 | .04 | .12 |
Net realized and unrealized gain (loss) | 6.99 | 1.40 | (4.29) | 5.09 | 9.63 |
Total from investment operations | 7.05 | 1.56 | (4.19) | 5.13 | 9.75 |
Distributions from net investment income | (.10) | - | (.08) | (.12) | (.10) |
Distributions from net realized gain | - | (.34) | (.03) | (.07) | - |
Total distributions | (.10) | (.34) | (.11) | (.19) | (.10) |
Redemption fees added to paid in capital C | .01 | - G | .01 | .01 | .02 |
Net asset value, end of period | $ 35.12 | $ 28.16 | $ 26.94 | $ 31.23 | $ 26.28 |
Total Return A, B | 25.12% | 5.90% | (13.45)% | 19.63% | 59.16% |
Ratios to Average Net Assets D, F | | | | | |
Expenses before reductions | 2.10% | 2.11% | 2.12% | 2.14% | 2.15% |
Expenses net of fee waivers, if any | 2.10% | 2.11% | 2.12% | 2.14% | 2.15% |
Expenses net of all reductions | 2.07% | 2.04% | 2.06% | 2.08% | 2.06% |
Net investment income (loss) | .19% | .59% | .32% | .14% | .51% |
Supplemental Data | | | | | |
Net assets, end of period (000 omitted) | $ 1,494 | $ 1,533 | $ 1,801 | $ 2,496 | $ 1,915 |
Portfolio turnover rate E | 92% | 107% | 87% | 57% | 88% |
ATotal returns would have been lower if certain expenses had not been reduced during the applicable periods shown. BTotal returns do not include the effect of the contingent deferred sales charge. CCalculated based on average shares outstanding during the period. DFees and expenses of any underlying Fidelity Central Funds are not included in the Fund's expense ratio. The Fund indirectly bears its proportionate share of the expenses of any underlying Fidelity Central Funds. EAmount does not include the portfolio activity of any underlying Fidelity Central Funds. FExpense ratios reflect operating expenses of the class. Expenses before reductions do not reflect amounts reimbursed by the investment adviser or reductions from brokerage service arrangements or reductions from other expense offset arrangements and do not represent the amount paid by the class during periods when reimbursements or reductions occur. Expenses net of fee waivers reflect expenses after reimbursement by the investment adviser but prior to reductions from brokerage service arrangements or other expense offset arrangements. Expenses net of all reductions represent the net expenses paid by the class. GAmount represents less than $.01 per share. |
Financial Highlights - Class C
Years ended October 31, | 2013 | 2012 | 2011 | 2010 | 2009 |
Selected Per-Share Data | | | | | |
Net asset value, beginning of period | $ 28.07 | $ 26.86 | $ 31.19 | $ 26.25 | $ 16.61 |
Income from Investment Operations | | | | | |
Net investment income (loss) C | .06 | .16 | .10 | .04 | .12 |
Net realized and unrealized gain (loss) | 6.97 | 1.39 | (4.28) | 5.09 | 9.62 |
Total from investment operations | 7.03 | 1.55 | (4.18) | 5.13 | 9.74 |
Distributions from net investment income | (.12) | - | (.13) | (.13) | (.12) |
Distributions from net realized gain | - | (.34) | (.03) | (.07) | - |
Total distributions | (.12) | (.34) | (.16) | (.20) | (.12) |
Redemption fees added to paid in capital C | .01 | - G | .01 | .01 | .02 |
Net asset value, end of period | $ 34.99 | $ 28.07 | $ 26.86 | $ 31.19 | $ 26.25 |
Total Return A, B | 25.14% | 5.88% | (13.46)% | 19.66% | 59.18% |
Ratios to Average Net Assets D, F | | | | | |
Expenses before reductions | 2.10% | 2.11% | 2.12% | 2.14% | 2.15% |
Expenses net of fee waivers, if any | 2.10% | 2.11% | 2.12% | 2.14% | 2.15% |
Expenses net of all reductions | 2.07% | 2.04% | 2.06% | 2.07% | 2.07% |
Net investment income (loss) | .19% | .59% | .32% | .15% | .51% |
Supplemental Data | | | | | |
Net assets, end of period (000 omitted) | $ 6,957 | $ 4,515 | $ 5,230 | $ 5,938 | $ 3,806 |
Portfolio turnover rate E | 92% | 107% | 87% | 57% | 88% |
ATotal returns would have been lower if certain expenses had not been reduced during the applicable periods shown. BTotal returns do not include the effect of the contingent deferred sales charge. CCalculated based on average shares outstanding during the period. DFees and expenses of any underlying Fidelity Central Funds are not included in the Fund's expense ratio. The Fund indirectly bears its proportionate share of the expenses of any underlying Fidelity Central Funds. EAmount does not include the portfolio activity of any underlying Fidelity Central Funds. FExpense ratios reflect operating expenses of the class. Expenses before reductions do not reflect amounts reimbursed by the investment adviser or reductions from brokerage service arrangements or reductions from other expense offset arrangements and do not represent the amount paid by the class during periods when reimbursements or reductions occur. Expenses net of fee waivers reflect expenses after reimbursement by the investment adviser but prior to reductions from brokerage service arrangements or other expense offset arrangements. Expenses net of all reductions represent the net expenses paid by the class. GAmount represents less than $.01 per share. |
See accompanying notes which are an integral part of the financial statements.
Annual Report
Financial Highlights - China Region
Years ended October 31, | 2013 | 2012 | 2011 | 2010 | 2009 |
Selected Per-Share Data | | | | | |
Net asset value, beginning of period | $ 28.73 | $ 27.49 | $ 31.81 | $ 26.55 | $ 16.69 |
Income from Investment Operations | | | | | |
Net investment income (loss) B | .41 | .45 | .44 | .34 | .33 |
Net realized and unrealized gain (loss) | 7.11 | 1.42 | (4.37) | 5.18 | 9.68 |
Total from investment operations | 7.52 | 1.87 | (3.93) | 5.52 | 10.01 |
Distributions from net investment income | (.43) | (.29) | (.38) | (.21) | (.17) |
Distributions from net realized gain | - | (.34) | (.03) | (.07) | - |
Total distributions | (.43) | (.63) | (.40) G | (.27) H | (.17) |
Redemption fees added to paid in capital B | .01 | - F | .01 | .01 | .02 |
Net asset value, end of period | $ 35.83 | $ 28.73 | $ 27.49 | $ 31.81 | $ 26.55 |
Total Return A | 26.51% | 7.01% | (12.52)% | 20.97% | 60.77% |
Ratios to Average Net Assets C, E | | | | | |
Expenses before reductions | 1.02% | 1.04% | 1.04% | 1.06% | 1.12% |
Expenses net of fee waivers, if any | 1.02% | 1.04% | 1.04% | 1.06% | 1.12% |
Expenses net of all reductions | .98% | .98% | .98% | 1.00% | 1.03% |
Net investment income (loss) | 1.27% | 1.66% | 1.40% | 1.22% | 1.54% |
Supplemental Data | | | | | |
Net assets, end of period (000 omitted) | $ 1,425,828 | $ 1,265,488 | $ 1,515,084 | $ 2,130,070 | $ 2,138,141 |
Portfolio turnover rate D | 92% | 107% | 87% | 57% | 88% |
ATotal returns would have been lower if certain expenses had not been reduced during the applicable periods shown. BCalculated based on average shares outstanding during the period. CFees and expenses of any underlying Fidelity Central Funds are not included in the Fund's expense ratio. The Fund indirectly bears its proportionate share of the expenses of any underlying Fidelity Central Funds. DAmount does not include the portfolio activity of any underlying Fidelity Central Funds. EExpense ratios reflect operating expenses of the class. Expenses before reductions do not reflect amounts reimbursed by the investment adviser or reductions from brokerage service arrangements or reductions from other expense offset arrangements and do not represent the amount paid by the class during periods when reimbursements or reductions occur. Expenses net of fee waivers reflect expenses after reimbursement by the investment adviser but prior to reductions from brokerage service arrangements or other expense offset arrangements. Expenses net of all reductions represent the net expenses paid by the class. FAmount represents less than $.01 per share. GTotal distributions of $.40 per share is comprised of distributions from net investment income of $.376 and distributions from net realized gain of $.025 per share. HTotal distributions of $.27 per share is comprised of distributions from net investment income of $.209 and distributions from net realized gain of $.065 per share. |
Financial Highlights - Institutional Class
Years ended October 31, | 2013 | 2012 | 2011 | 2010 | 2009 |
Selected Per-Share Data | | | | | |
Net asset value, beginning of period | $ 28.68 | $ 27.46 | $ 31.79 | $ 26.55 | $ 16.70 |
Income from Investment Operations | | | | | |
Net investment income (loss) B | .42 | .45 | .43 | .33 | .37 |
Net realized and unrealized gain (loss) | 7.10 | 1.42 | (4.37) | 5.18 | 9.64 |
Total from investment operations | 7.52 | 1.87 | (3.94) | 5.51 | 10.01 |
Distributions from net investment income | (.46) | (.31) | (.37) | (.22) | (.18) |
Distributions from net realized gain | - | (.34) | (.03) | (.07) | - |
Total distributions | (.46) | (.65) | (.40) | (.28) G | (.18) |
Redemption fees added to paid in capital B | .01 | - F | .01 | .01 | .02 |
Net asset value, end of period | $ 35.75 | $ 28.68 | $ 27.46 | $ 31.79 | $ 26.55 |
Total Return A | 26.58% | 7.02% | (12.56)% | 20.92% | 60.78% |
Ratios to Average Net Assets C, E | | | | | |
Expenses before reductions | .97% | 1.04% | 1.06% | 1.11% | 1.08% |
Expenses net of fee waivers, if any | .97% | 1.04% | 1.06% | 1.11% | 1.08% |
Expenses net of all reductions | .93% | .98% | 1.01% | 1.04% | 1.00% |
Net investment income (loss) | 1.32% | 1.66% | 1.38% | 1.18% | 1.58% |
Supplemental Data | | | | | |
Net assets, end of period (000 omitted) | $ 10,206 | $ 1,958 | $ 2,034 | $ 1,904 | $ 1,684 |
Portfolio turnover rate D | 92% | 107% | 87% | 57% | 88% |
ATotal returns would have been lower if certain expenses had not been reduced during the applicable periods shown. BCalculated based on average shares outstanding during the period. CFees and expenses of any underlying Fidelity Central Funds are not included in the Fund's expense ratio. The Fund indirectly bears its proportionate share of the expenses of any underlying Fidelity Central Funds. DAmount does not include the portfolio activity of any underlying Fidelity Central Funds. EExpense ratios reflect operating expenses of the class. Expenses before reductions do not reflect amounts reimbursed by the investment adviser or reductions from brokerage service arrangements or reductions from other expense offset arrangements and do not represent the amount paid by the class during periods when reimbursements or reductions occur. Expenses net of fee waivers reflect expenses after reimbursement by the investment adviser but prior to reductions from brokerage service arrangements or other expense offset arrangements. Expenses net of all reductions represent the net expenses paid by the class. FAmount represents less than $.01 per share. GTotal distributions of $.28 per share is comprised of distributions from net investment income of $.216 and distributions from net realized gain of $.065 per share. |
See accompanying notes which are an integral part of the financial statements.
Annual Report
Notes to Financial Statements
For the period ended October 31, 2013
1. Organization.
Fidelity China Region Fund (the Fund) is a fund of Fidelity Investment Trust (the Trust) and is authorized to issue an unlimited number of shares. The Trust is registered under the Investment Company Act of 1940, as amended (the 1940 Act), as an open-end management investment company organized as a Massachusetts business trust. The Fund offers Class A, Class T, Class C, China Region and Institutional Class shares, each of which, along with Class B shares, has equal rights as to assets and voting privileges. Class B shares are closed to new accounts and additional purchases, except for exchanges and reinvestments. Each class has exclusive voting rights with respect to matters that affect that class. Class B shares will automatically convert to Class A shares after a holding period of seven years from the initial date of purchase. The Fund's investments in emerging markets can be subject to social, economic, regulatory, and political uncertainties and can be extremely volatile.
2. Investments in Fidelity Central Funds.
The Fund invests in Fidelity Central Funds, which are open-end investment companies generally available only to other investment companies and accounts managed by Fidelity Management & Research Company (FMR) and its affiliates. The Fund's Schedule of Investments lists each of the Fidelity Central Funds held as of period end, if any, as an investment of the Fund, but does not include the underlying holdings of each Fidelity Central Fund. As an Investing Fund, the Fund indirectly bears its proportionate share of the expenses of the underlying Fidelity Central Funds.
The Money Market Central Funds seek preservation of capital and current income and are managed by Fidelity Investments Money Management, Inc. (FIMM), an affiliate of FMR.
A complete unaudited list of holdings for each Fidelity Central Fund is available upon request or at the Securities and Exchange Commission (the SEC) website at www.sec.gov. In addition, the financial statements of the Fidelity Central Funds, which are not covered by the Fund's Report of Independent Registered Public Accounting Firm, are available on the SEC website or upon request.
3. Significant Accounting Policies.
The financial statements have been prepared in conformity with accounting principles generally accepted in the United States of America (GAAP), which require management to make certain estimates and assumptions at the date of the financial statements. Actual results could differ from those estimates. Subsequent events, if any, through the date that the financial statements were issued have been evaluated in the preparation of the financial statements. The following summarizes the significant accounting policies of the Fund:
Investment Valuation. Investments are valued as of 4:00 p.m. Eastern time on the last calendar day of the period. In accordance with valuation policies and procedures approved by the Board of Trustees (the Board), the Fund attempts to obtain prices from one or more third party pricing vendors or brokers to value its investments. When current market prices, quotations or currency exchange rates are not readily available or reliable, investments will be fair valued in good faith by the FMR Fair Value Committee (the Committee), in accordance with procedures adopted by the Board. Factors used in determining fair value vary by investment type and may include market or investment specific events. The frequency with which these procedures are used cannot be predicted and they may be utilized to a significant extent. The Committee oversees the Fund's valuation policies and procedures and is responsible for approving and reporting to the Board all fair value determinations.
The Fund categorizes the inputs to valuation techniques used to value its investments into a disclosure hierarchy consisting of three levels as shown below:
Level 1 - quoted prices in active markets for identical investments
Level 2 - other significant observable inputs (including quoted prices for similar investments, interest rates, prepayment speeds, etc.)
Level 3 - unobservable inputs (including the Fund's own assumptions based on the best information available)
Valuation techniques used to value the Fund's investments by major category are as follows:
Equity securities, including restricted securities, for which market quotations are readily available, are valued at the last reported sale price or official closing price as reported by a third party pricing vendor on the primary market or exchange on which they are traded and are categorized as Level 1 in the hierarchy. In the event there were no sales during the day or closing prices are not available, securities are valued at the last quoted bid price or may be valued using the last available price and are generally categorized as Level 2 in the hierarchy. For foreign equity securities, when market or security specific events arise, comparisons to the valuation of American Depositary Receipts (ADRs), futures contracts, Exchange-Traded Funds (ETFs) and certain indexes as well as quoted prices for similar securities may be used and would be categorized as Level 2 in the hierarchy. Utilizing these techniques may result in transfers between Level 1 and Level 2. For equity securities, including restricted securities, where observable inputs are limited, assumptions about market activity and risk are used and these securities may be categorized as Level 3 in the hierarchy.
Investments in open-end mutual funds, including the Fidelity Central Funds, are valued at their closing net asset value (NAV) each business day and are categorized as Level 1 in the hierarchy.
Annual Report
3. Significant Accounting Policies - continued
Investment Valuation - continued
Changes in valuation techniques may result in transfers in or out of an assigned level within the disclosure hierarchy. The aggregate value of investments by input level, as of October 31, 2013, is included at the end of the Fund's Schedule of Investments.
Foreign Currency. The Fund may use foreign currency contracts to facilitate transactions in foreign-denominated securities. Gains and losses from these transactions may arise from changes in the value of the foreign currency or if the counterparties do not perform under the contracts' terms.
Foreign-denominated assets, including investment securities, and liabilities are translated into U.S. dollars at the exchange rates at period end. Purchases and sales of investment securities, income and dividends received and expenses denominated in foreign currencies are translated into U.S. dollars at the exchange rate in effect on the transaction date.
The effects of exchange rate fluctuations on investments are included with the net realized and unrealized gain (loss) on investment securities. Other foreign currency transactions resulting in realized and unrealized gain (loss) are disclosed separately.
Investment Transactions and Income. For financial reporting purposes, the Fund's investment holdings and NAV include trades executed through the end of the last business day of the period. The NAV per share for processing shareholder transactions is calculated as of the close of business of the New York Stock Exchange (NYSE), normally 4:00 p.m. Eastern time and includes trades executed through the end of the prior business day. Gains and losses on securities sold are determined on the basis of identified cost and may include proceeds received from litigation. Dividend income is recorded on the ex-dividend date, except for certain dividends from foreign securities where the ex-dividend date may have passed, which are recorded as soon as the Fund is informed of the ex-dividend date. Non-cash dividends included in dividend income, if any, are recorded at the fair market value of the securities received. Interest income and distributions from the Fidelity Central Funds are accrued as earned. Interest income includes coupon interest and amortization of premium and accretion of discount on debt securities. Investment income is recorded net of foreign taxes withheld where recovery of such taxes is uncertain.
Class Allocations and Expenses. Investment income, realized and unrealized capital gains and losses, common expenses of the Fund, and certain fund-level expense reductions, if any, are allocated daily on a pro-rata basis to each class based on the relative net assets of each class to the total net assets of the Fund. Each class differs with respect to transfer agent and distribution and service plan fees incurred. Certain expense reductions may also differ by class. For the reporting period, the allocated portion of income and expenses to each class as a percent of its average net assets may vary due to the timing of recording these transactions in relation to fluctuating net assets of the classes. Expenses directly attributable to a fund are charged to that fund. Expenses attributable to more than one fund are allocated among the respective funds on the basis of relative net assets or other appropriate methods. Expense estimates are accrued in the period to which they relate and adjustments are made when actual amounts are known.
Income Tax Information and Distributions to Shareholders. Each year, the Fund intends to qualify as a regulated investment company under Subchapter M of the Internal Revenue Code, including distributing substantially all of its taxable income and realized gains. As a result, no provision for U.S. Federal income taxes is required. As of October 31, 2013, the Fund did not have any unrecognized tax benefits in the financial statements; nor is the Fund aware of any tax positions for which it is reasonably possible that the total amounts of unrecognized tax benefits will significantly change in the next twelve months. The Fund files a U.S. federal tax return, in addition to state and local tax returns as required. The Fund's federal income tax returns are subject to examination by the Internal Revenue Service (IRS) for a period of three fiscal years after they are filed. State and local tax returns may be subject to examination for an additional fiscal year depending on the jurisdiction. Foreign taxes are provided for based on the Fund's understanding of the tax rules and rates that exist in the foreign markets in which it invests.
Distributions are declared and recorded on the ex-dividend date. Income dividends and capital gain distributions are declared separately for each class. Income and capital gain distributions are determined in accordance with income tax regulations, which may differ from GAAP. In addition, the Fund claimed a portion of the payment made to redeeming shareholders as a distribution for income tax purposes.
Capital accounts within the financial statements are adjusted for permanent book-tax differences. These adjustments have no impact on net assets or the results of operations. Temporary book-tax differences will reverse in a subsequent period.
Book-tax differences are primarily due to foreign currency transactions, passive foreign investment companies (PFIC), deferred trustees compensation, capital loss carryforwards and losses deferred due to wash sales.
The federal tax cost of investment securities and unrealized appreciation (depreciation) as of period end were as follows:
Gross unrealized appreciation | $ 393,506,024 |
Gross unrealized depreciation | (27,550,991) |
Net unrealized appreciation (depreciation) on securities and other investments | $ 365,955,033 |
| |
Tax Cost | $ 1,132,832,449 |
Annual Report
Notes to Financial Statements - continued
3. Significant Accounting Policies - continued
Income Tax Information and Distributions to Shareholders - continued
The tax-based components of distributable earnings as of period end were as follows:
Undistributed ordinary income | $ 31,209,233 |
Undistributed long-term capital gain | $ 120,314,075 |
Net unrealized appreciation (depreciation) | $ 365,949,974 |
The tax character of distributions paid was as follows:
| October 31, 2013 | October 31, 2012 |
| | |
Ordinary Income | $ 19,616,401 | $ 15,687,379 |
Long-term Capital Gains | - | 18,721,345 |
Total | $ 19,616,401 | $ 34,408,724 |
Short-Term Trading (Redemption) Fees. Shares held by investors in the Fund less than 90 days may have been subject to a redemption fee equal to 1.50% of the net asset value of shares redeemed. All redemption fees, which reduce the proceeds of the shareholder redemption, are retained by the Fund and accounted for as an addition to paid in capital.
4. Purchases and Sales of Investments.
Purchases and sales of securities, other than short-term securities, aggregated $1,273,312,174 and $1,463,403,074, respectively.
5. Fees and Other Transactions with Affiliates.
Management Fee. FMR and its affiliates provide the Fund with investment management related services for which the Fund pays a monthly management fee. The management fee is the sum of an individual fund fee rate that is based on an annual rate of .45% of the Fund's average net assets and an annualized group fee rate that averaged .25% during the period. The group fee rate is based upon the average net assets of all the mutual funds advised by FMR, including any mutual funds previously advised by FMR that are currently advised by Fidelity SelectCo, LLC, an affiliate of FMR. The group fee rate decreases as assets under management increase and increases as assets under management decrease. For the reporting period, the total annual management fee rate was .70% of the Fund's average net assets.
Distribution and Service Plan Fees. In accordance with Rule 12b-1 of the 1940 Act, the Fund has adopted separate Distribution and Service Plans for each class of shares. Certain classes pay Fidelity Distributors Corporation (FDC), an affiliate of FMR, separate Distribution and Service Fees, each of which is based on an annual percentage of each class' average net assets. In addition, FDC may pay financial intermediaries for selling shares of the Fund and providing shareholder support services. For the period, the Distribution and Service Fee rates, total fees and amounts retained by FDC were as follows:
| Distribution
Fee | Service
Fee | Total Fees | Retained
by FDC |
Class A | -% | .25% | $ 41,731 | $ 701 |
Class T | .25% | .25% | 26,168 | 64 |
Class B | .75% | .25% | 15,256 | 11,538 |
Class C | .75% | .25% | 60,932 | 17,612 |
| | | $ 144,087 | $ 29,915 |
Sales Load. FDC may receive a front-end sales charge of up to 5.75% for selling Class A shares and 3.50% for selling Class T shares, some of which is paid to financial intermediaries for selling shares of the Fund. Depending on the holding period, FDC may receive contingent deferred sales charges levied on Class A, Class T, Class B, and Class C redemptions. The deferred sales charges range from 5.00% to 1.00% for Class B shares, 1.00% for Class C shares, 1.00% for certain purchases of Class A shares and .25% for certain purchases of Class T shares.
For the period, sales charge amounts retained by FDC were as follows:
| Retained
by FDC |
Class A | $ 23,503 |
Class T | 4,468 |
Class B* | 4,857 |
Class C* | 2,325 |
| $ 35,153 |
* When Class B and Class C shares are initially sold, FDC pays commissions from its own resources to financial intermediaries through which the sales are made.
Annual Report
5. Fees and Other Transactions with Affiliates - continued
Transfer Agent Fees. Fidelity Investments Institutional Operations Company, Inc., (FIIOC), an affiliate of FMR, is the transfer, dividend disbursing and shareholder servicing agent for each class of the Fund. FIIOC receives account fees and asset-based fees that vary according to the account size and type of account of the shareholders of the respective classes of the Fund. FIIOC pays for typesetting, printing and mailing of shareholder reports, except proxy statements.
For the period, transfer agent fees for each class were as follows:
| Amount | % of
Average
Net Assets |
Class A | $ 49,843 | .30 |
Class T | 17,685 | .34 |
Class B | 4,586 | .30 |
Class C | 18,274 | .30 |
China Region | 3,014,566 | .22 |
Institutional Class | 7,467 | .17 |
| $ 3,112,421 | |
Accounting and Security Lending Fees. Fidelity Service Company, Inc. (FSC), an affiliate of FMR, maintains the Fund's accounting records. The accounting fee is based on the level of average net assets for each month. Under a separate contract, FSC administers the security lending program. The security lending fee is based on the number and duration of lending transactions.
Brokerage Commissions. The Fund placed a portion of its portfolio transactions with brokerage firms which are affiliates of the investment adviser. Brokerage commissions are included in net realized gain (loss) and change in net unrealized appreciation (depreciation) in the Statement of Operations. The commissions paid to these affiliated firms were $2,982 for the period.
Interfund Lending Program. Pursuant to an Exemptive Order issued by the SEC, the Fund, along with other registered investment companies having management contracts with FMR, may participate in an interfund lending program. This program provides an alternative credit facility allowing the funds to borrow from, or lend money to, other participating affiliated funds. At period end, there were no interfund loans outstanding. The Fund's activity in this program during the period for which loans were outstanding was as follows:
Borrower or Lender | Average Loan
Balance | Weighted Average Interest Rate | Interest Expense |
Borrower | $ 8,690,333 | .36% | $ 515 |
6. Committed Line of Credit.
The Fund participates with other funds managed by FMR or an affiliate in a $4.25 billion credit facility (the "line of credit") to be utilized for temporary or emergency purposes to fund shareholder redemptions or for other short-term liquidity purposes. The Fund has agreed to pay commitment fees on its pro-rata portion of the line of credit, which amounted to $3,108 and is reflected in Miscellaneous expenses on the Statement of Operations. During the period, there were no borrowings on this line of credit.
7. Security Lending.
The Fund lends portfolio securities through a lending agent from time to time in order to earn additional income. For equity securities, a lending agent is used and may loan securities to certain qualified borrowers, including Fidelity Capital Markets (FCM), a broker-dealer affiliated with the Fund. On the settlement date of the loan, the Fund receives collateral (in the form of U.S. Treasury obligations, letters of credit and/or cash) against the loaned securities and maintains collateral in an amount not less than 100% of the market value of the loaned securities during the period of the loan. The market value of the loaned securities is determined at the close of business of the Fund and any additional required collateral is delivered to the Fund on the next business day. If the borrower defaults on its obligation to return the securities loaned because of insolvency or other reasons, the Fund may apply collateral received from the borrower against the obligation. The Fund may experience delays and costs in recovering the securities loaned. Any cash collateral received is invested in the Fidelity Securities Lending Cash Central Fund. The value of loaned securities and cash collateral at period end are disclosed on the Fund's Statement of Assets and Liabilities. Security lending income represents the income earned on investing cash collateral, less rebates paid to borrowers and any lending agent fees associated with the loan, plus any premium payments received for lending certain types of securities. Security lending income is presented in the Statement of Operations as a component of income from Fidelity Central Funds. Total security lending income during the period amounted to $104,014. During the period, there were no securities loaned to FCM.
Annual Report
Notes to Financial Statements - continued
8. Expense Reductions.
Commissions paid to certain brokers with whom FMR, or its affiliates, places trades on behalf of the Fund include an amount in addition to trade execution, which may be rebated back to the Fund to offset certain expenses. This amount totaled $505,020 for the period.
In addition, FMR reimbursed a portion of the Fund's operating expenses during the period in the amount of $26,099.
9. Distributions to Shareholders.
Distributions to shareholders of each class were as follows:
Years ended October 31, | 2013 | 2012 |
From net investment income | | |
Class A | $ 161,788 | $ 100,983 |
Class T | 40,503 | 14,853 |
Class B | 4,993 | - |
Class C | 18,782 | - |
China Region | 19,344,002 | 15,549,167 |
Institutional Class | 46,333 | 22,376 |
Total | $ 19,616,401 | $ 15,687,379 |
From net realized gain | | |
Class A | $ - | $ 182,091 |
Class T | - | 60,664 |
Class B | - | 21,876 |
Class C | - | 65,490 |
China Region | - | 18,366,435 |
Institutional Class | - | 24,789 |
Total | $ - | $ 18,721,345 |
10. Share Transactions.
Transactions for each class of shares were as follows:
| Shares | Dollars |
Years ended October 31, | 2013 | 2012 | 2013 | 2012 |
Class A | | | | |
Shares sold | 284,743 | 128,967 | $ 9,232,019 | $ 3,497,936 |
Reinvestment of distributions | 5,112 | 10,227 | 151,768 | 266,217 |
Shares redeemed | (184,522) | (207,420) | (5,803,916) | (5,547,035) |
Net increase (decrease) | 105,333 | (68,226) | $ 3,579,871 | $ (1,782,882) |
Class T | | | | |
Shares sold | 70,191 | 40,215 | $ 2,215,632 | $ 1,078,486 |
Reinvestment of distributions | 1,321 | 2,834 | 39,167 | 73,623 |
Shares redeemed | (56,116) | (84,588) | (1,759,294) | (2,252,505) |
Net increase (decrease) | 15,396 | (41,539) | $ 495,505 | $ (1,100,396) |
Class B | | | | |
Shares sold | 6,343 | 4,773 | $ 197,892 | $ 131,481 |
Reinvestment of distributions | 151 | 760 | 4,455 | 19,651 |
Shares redeemed | (18,382) | (17,966) | (569,584) | (477,343) |
Net increase (decrease) | (11,888) | (12,433) | $ (367,237) | $ (326,211) |
Class C | | | | |
Shares sold | 120,235 | 39,150 | $ 3,792,024 | $ 1,051,097 |
Reinvestment of distributions | 573 | 2,380 | 16,859 | 61,380 |
Shares redeemed | (82,838) | (75,401) | (2,577,162) | (1,981,464) |
Net increase (decrease) | 37,970 | (33,871) | $ 1,231,721 | $ (868,987) |
China Region | | | | |
Shares sold | 11,534,725 | 5,981,804 | $ 362,586,439 | $ 163,640,090 |
Reinvestment of distributions | 622,145 | 1,245,751 | 18,558,580 | 32,563,934 |
Shares redeemed | (16,406,195) | (18,300,659) | (515,921,780) | (493,563,874) |
Net increase (decrease) | (4,249,325) | (11,073,104) | $ (134,776,761) | $ (297,359,850) |
Annual Report
10. Share Transactions - continued
| Shares | Dollars |
Years ended October 31, | 2013 | 2012 | 2013 | 2012 |
Institutional Class | | | | |
Shares sold | 333,624 | 33,539 | $ 11,106,364 | $ 913,352 |
Reinvestment of distributions | 1,452 | 1,708 | 43,199 | 44,574 |
Shares redeemed | (117,838) | (41,079) | (3,708,160) | (1,090,028) |
Net increase (decrease) | 217,238 | (5,832) | $ 7,441,403 | $ (132,102) |
11. Other.
The Fund's organizational documents provide former and current trustees and officers with a limited indemnification against liabilities arising in connection with the performance of their duties to the Fund. In the normal course of business, the Fund may also enter into contracts that provide general indemnifications. The Fund's maximum exposure under these arrangements is unknown as this would be dependent on future claims that may be made against the Fund. The risk of material loss from such claims is considered remote.
Annual Report
Fidelity Emerging Asia Fund
Average annual total return reflects the change in the value of an investment, assuming reinvestment of the fund's distributions from dividend income and capital gains (the profits earned upon the sale of securities that have grown in value, if any) and assuming a constant rate of performance each year. The $10,000 table and the fund's returns do not reflect the deduction of taxes that a shareholder would pay on fund distributions or the redemption of fund shares. During periods of reimbursement by Fidelity, a fund's total return will be greater than it would be had the reimbursement not occurred. How a fund did yesterday is no guarantee of how it will do tomorrow.
Average Annual Total Returns
Periods ended October 31, 2013 | Past 1
year | Past 5
years | Past 10
years |
Fidelity Emerging Asia Fund A | 10.19% | 13.06% | 11.57% |
A Prior to December 1, 2010, Fidelity Emerging Asia Fund operated under certain different investment policies and compared its performance to a different index. The fund's historical performance may not represent its current investment policies.
$10,000 Over 10 Years
Let's say hypothetically that $10,000 was invested in Fidelity Emerging Asia Fund on October 31, 2003. The chart shows how the value of your investment would have changed, and also shows how the MSCI AC (All Country) Asia ex Japan Index performed over the same period.

Annual Report
Fidelity Emerging Asia Fund
Market Recap: On balance, global equity markets remained upbeat for the 12-month period ending October 31, 2013. The MSCI® ACWI® (All Country World Index) Index gained 23.75% for the period, amid investor preference for higher-risk assets. The period was not without turbulence, however. In the spring and summer, central banks worldwide, especially in the U.S. and China, made clear their intentions to maintain accommodative monetary policies. That stance, combined with modest cyclical improvements around the globe and generally low valuations, underpinned the broad rally in equities. Europe (+32%) shone brightly, with most markets in the region - large and small - registering solid, index-beating gains. Another bright spot was Japan, which, despite a struggling yen and taking a second-half breather, posted a 34% result for the full year. The U.S. - by far the index's biggest constituent - also outperformed the global market with a roughly 28% advance. Meanwhile, Asia-Pacific ex Japan (+14%) lagged, hurt in part by a slowdown in Australia's mining industry as well as currency headwinds. Foreign-exchange and commodity weakness also curbed results in resource-heavy Canada and emerging markets (EM), both of which were up 7%. Country-level EM performance diverged meaningfully for the period, as evidenced by performance in Brazil (-1%), Russia (+12%), India (+1%) and China (+8%).
Comments from Colin Chickles, Portfolio Manager of Fidelity® Emerging Asia Fund: For the year, the fund returned 10.19%, slightly lagging the 10.27% gain of the MSCI® AC (All Country) Asia ex Japan Index. Versus the index, performance was especially helped by stock selection in China and Hong Kong. Two Chinese holdings stood out as positives. Internet services provider Tencent Holdings was the top contributor, aided by robust growth in its online gaming and messaging revenue. Fund performance was further lifted by a small non-index position in real estate Internet portal SouFun Holdings. Other noteworthy contributors included several Hong Kong-listed casino stocks: Galaxy Entertainment Group, where the fund had a sizable overweighting, and two non-index stocks, Melco Crown Entertainment and Melco International Development, the latter of which I sold. Conversely, stock selection in India detracted from relative performance. The shares of Grasim Industries, an India-based cement maker, struggled amid delays in government infrastructure spending, and I eliminated this non-index position. Another detractor that I sold was Hindustan Unilever, partially owned by Anglo-Dutch consumer goods firm Unilever. The biggest relative detractor was South Korean automaker Kia Motors. The main problem here was poor timing on my part.
The views expressed above reflect those of the portfolio manager(s) only through the end of the period as stated on the cover of this report and do not necessarily represent the views of Fidelity or any other person in the Fidelity organization. Any such views are subject to change at any time based upon market or other conditions and Fidelity disclaims any responsibility to update such views. These views may not be relied on as investment advice and, because investment decisions for a Fidelity fund are based on numerous factors, may not be relied on as an indication of trading intent on behalf of any Fidelity fund.
Annual Report
Fidelity Emerging Asia Fund
As a shareholder of the Fund, you incur two types of costs: (1) transaction costs, including redemption fees and (2) ongoing costs, including management fees and other Fund expenses. This Example is intended to help you understand your ongoing costs (in dollars) of investing in the Fund and to compare these costs with the ongoing costs of investing in other mutual funds.
The Example is based on an investment of $1,000 invested at the beginning of the period and held for the entire period (May 1, 2013 to October 31, 2013).
Actual Expenses
The first line of the accompanying table provides information about actual account values and actual expenses. You may use the information in this line, together with the amount you invested, to estimate the expenses that you paid over the period. Simply divide your account value by $1,000.00 (for example, an $8,600 account value divided by $1,000.00 = 8.6), then multiply the result by the number in the first line under the heading entitled "Expenses Paid During Period" to estimate the expenses you paid on your account during this period. A small balance maintenance fee of $12.00 that is charged once a year may apply for certain accounts with a value of less than $2,000. This fee is not included in the table below. If it was, the estimate of expenses you paid during the period would be higher, and your ending account value lower, by this amount. In addition, the Fund, as a shareholder in the underlying Fidelity Central Funds, will indirectly bear its pro-rata share of the fees and expenses incurred by the underlying Fidelity Central Funds. These fees and expenses are not included in the Fund's annualized expense ratio used to calculate the expense estimate in the table below.
Hypothetical Example for Comparison Purposes
The second line of the accompanying table provides information about hypothetical account values and hypothetical expenses based on the Fund's actual expense ratio and an assumed rate of return of 5% per year before expenses, which is not the Fund's actual return. The hypothetical account values and expenses may not be used to estimate the actual ending account balance or expenses you paid for the period. You may use this information to compare the ongoing costs of investing in the Fund and other funds. To do so, compare this 5% hypothetical example with the 5% hypothetical examples that appear in the shareholder reports of the other funds. A small balance maintenance fee of $12.00 that is charged once a year may apply for certain accounts with a value of less than $2,000. This fee is not included in the table below. If it was, the estimate of expenses you paid during the period would be higher, and your ending account value lower, by this amount. In addition, the Fund, as a shareholder in the underlying Fidelity Central Funds, will indirectly bear its pro-rata share of the fees and expenses incurred by the underlying Fidelity Central Funds. These fees and expenses are not included in the Fund's annualized expense ratio used to calculate the expense estimate in the table below.
Please note that the expenses shown in the table are meant to highlight your ongoing costs only and do not reflect any transaction costs. Therefore, the second line of the table is useful in comparing ongoing costs only, and will not help you determine the relative total costs of owning different funds. In addition, if these transactional costs were included, your costs would have been higher.
| Annualized
Expense RatioB | Beginning
Account Value
May 1, 2013 | Ending
Account Value
October 31, 2013 | Expenses Paid
During Period*
May 1, 2013
to October 31, 2013 |
Actual | 1.06% | $ 1,000.00 | $ 1,009.80 | $ 5.37 |
HypotheticalA | | $ 1,000.00 | $ 1,019.86 | $ 5.40 |
A 5% return per year before expenses
B Annualized expense ratio reflects expenses net of applicable fee waivers.
* Expenses are equal to the Fund's annualized expense ratio, multiplied by the average account value over the period, multiplied by 184/365 (to reflect the one-half year period).
Annual Report
Fidelity Emerging Asia Fund
Investment Changes (Unaudited)
Geographic Diversification (% of fund's net assets) |
As of October 31, 2013 |
| Korea (South) | 21.6% | |
| China | 15.9% | |
| Hong Kong | 11.7% | |
| Cayman Islands | 11.5% | |
| India | 8.8% | |
| Taiwan | 8.4% | |
| Singapore | 5.7% | |
| Thailand | 3.8% | |
| Malaysia | 3.4% | |
| Other* | 9.2% | |

* Includes Short-Term Investments and Net Other Assets (Liabilities). |
Percentages are based on country or territory of incorporation and are adjusted for the effect of futures contracts, if applicable. |
As of April 30, 2013 |
| Korea (South) | 18.9% | |
| Hong Kong | 14.3% | |
| China | 12.6% | |
| Taiwan | 11.6% | |
| India | 9.9% | |
| Cayman Islands | 7.5% | |
| Thailand | 7.3% | |
| Indonesia | 4.9% | |
| Singapore | 4.8% | |
| Other* | 8.2% | |

* Includes Short-Term Investments and Net Other Assets (Liabilities). |
Percentages are based on country or territory of incorporation and are adjusted for the effect of futures contracts, if applicable. |
Asset Allocation as of October 31, 2013 |
| % of fund's
net assets | % of fund's net assets
6 months ago |
Stocks | 98.0 | 99.5 |
Short-Term Investments and Net Other Assets (Liabilities) | 2.0 | 0.5 |
Top Ten Stocks as of October 31, 2013 |
| % of fund's
net assets | % of fund's net assets
6 months ago |
Samsung Electronics Co. Ltd. (Korea (South), Semiconductors & Semiconductor Equipment) | 6.3 | 6.5 |
AIA Group Ltd. (Hong Kong, Insurance) | 2.7 | 2.5 |
China Construction Bank Corp. (H Shares) (China, Commercial Banks) | 2.4 | 2.6 |
Tencent Holdings Ltd. (Cayman Islands, Internet Software & Services) | 2.4 | 1.8 |
Hyundai Motor Co. (Korea (South), Automobiles) | 2.3 | 1.5 |
Industrial & Commercial Bank of China Ltd. (H Shares) (China, Commercial Banks) | 2.2 | 2.0 |
CNOOC Ltd. (Hong Kong, Oil, Gas & Consumable Fuels) | 2.0 | 0.0 |
Taiwan Semiconductor Manufacturing Co. Ltd. (Taiwan, Semiconductors & Semiconductor Equipment) | 1.9 | 4.0 |
POSCO (Korea (South), Metals & Mining) | 1.4 | 1.0 |
United Overseas Bank Ltd. (Singapore, Commercial Banks) | 1.4 | 0.0 |
| 25.0 | |
Market Sectors as of October 31, 2013 |
| % of fund's
net assets | % of fund's net assets
6 months ago |
Financials | 34.6 | 34.9 |
Information Technology | 19.8 | 18.6 |
Consumer Discretionary | 11.6 | 9.6 |
Materials | 7.2 | 5.6 |
Industrials | 6.9 | 7.8 |
Energy | 5.8 | 5.4 |
Utilities | 4.3 | 4.2 |
Telecommunication Services | 3.8 | 7.8 |
Consumer Staples | 3.3 | 4.6 |
Health Care | 0.7 | 1.0 |
Annual Report
Fidelity Emerging Asia Fund
Investments October 31, 2013
Showing Percentage of Net Assets
Common Stocks - 98.0% |
| Shares | | Value |
Australia - 0.3% |
Fortescue Metals Group Ltd. | 512,718 | | $ 2,524,742 |
Karoon Gas Australia Ltd. (a) | 342,658 | | 1,434,714 |
TOTAL AUSTRALIA | | 3,959,456 |
Bermuda - 1.4% |
Cafe de Coral Holdings Ltd. | 604,000 | | 2,072,282 |
CSI Properties Ltd. | 36,790,000 | | 1,281,220 |
Great Eagle Holdings Ltd. | 1,877,000 | | 6,681,955 |
Hongkong Land Holdings Ltd. | 826,000 | | 5,088,160 |
Oriental Watch Holdings Ltd. | 5,018,000 | | 1,605,139 |
TOTAL BERMUDA | | 16,728,756 |
Cayman Islands - 11.5% |
58.com, Inc. ADR | 5,800 | | 139,896 |
Baidu.com, Inc. sponsored ADR (a) | 27,000 | | 4,344,300 |
Baoxin Auto Group Ltd. | 3,213,500 | | 3,311,733 |
Bitauto Holdings Ltd. ADR (a) | 9,203 | | 225,566 |
Bonjour Holdings Ltd. | 2,928,000 | | 634,469 |
China Lodging Group Ltd. ADR (a) | 24,000 | | 527,520 |
China Mengniu Dairy Co. Ltd. | 1,172,000 | | 5,154,805 |
China Resources Cement Holdings Ltd. | 6,707,706 | | 4,490,261 |
China Sanjiang Fine Chemicals Ltd. | 4,992,000 | | 2,208,508 |
Chu Kong Petroleum & Natural Gas Steel Pipe Holdings Ltd. | 4,699,000 | | 1,757,655 |
Cimc Enric Holdings Ltd. | 1,464,000 | | 2,062,025 |
Country Garden Holdings Co. Ltd. | 7,049,000 | | 4,818,741 |
Ctrip.com International Ltd. sponsored ADR (a)(d) | 54,100 | | 2,934,925 |
E-Commerce China Dangdang, Inc. ADR (a)(d) | 118,000 | | 1,044,300 |
Geely Automobile Holdings Ltd. | 6,365,000 | | 3,210,003 |
Greatview Aseptic Pack Co. Ltd. | 2,343,000 | | 1,474,763 |
Greentown China Holdings Ltd. | 1,361,000 | | 2,643,707 |
Haitian International Holdings Ltd. | 1,317,000 | | 3,173,167 |
Hengan International Group Co. Ltd. | 562,500 | | 6,888,866 |
Hengdeli Holdings Ltd. | 4,896,000 | | 1,161,955 |
Hosa International Ltd. | 4,080,000 | | 1,515,594 |
Ju Teng International Holdings Ltd. | 3,538,000 | | 2,573,755 |
KWG Property Holding Ltd. | 7,754,000 | | 5,020,647 |
Lee & Man Paper Manufacturing Ltd. | 9,661,000 | | 6,928,306 |
Lifestyle International Holdings Ltd. | 2,481,500 | | 5,409,177 |
Melco Crown Entertainment Ltd. sponsored ADR (a) | 237,900 | | 7,888,764 |
MGM China Holdings Ltd. | 829,600 | | 2,857,000 |
Semiconductor Manufacturing International Corp. (a) | 14,957,000 | | 1,106,483 |
SOHO China Ltd. | 1,890,500 | | 1,655,681 |
SouFun Holdings Ltd. ADR | 47,800 | | 2,544,394 |
Springland International Holdings Ltd. | 13,822,000 | | 7,576,873 |
SPT Energy Group, Inc. | 4,598,000 | | 2,532,369 |
Tencent Holdings Ltd. | 508,900 | | 27,778,470 |
Value Partners Group Ltd. | 3,312,000 | | 2,012,062 |
WuXi PharmaTech Cayman, Inc. sponsored ADR (a) | 91,200 | | 2,667,600 |
|
| Shares | | Value |
Youku Tudou, Inc. ADR (a)(d) | 60,900 | | $ 1,658,916 |
Zhen Ding Technology Holding Ltd. | 549,550 | | 1,288,227 |
TOTAL CAYMAN ISLANDS | | 135,221,483 |
China - 15.9% |
Aluminum Corp. of China Ltd. (H Shares) (a) | 11,688,000 | | 4,322,017 |
Angang Steel Co. Ltd. (H Shares) (a) | 9,352,000 | | 5,669,341 |
Beijing Jingneng Clean Energy Co. Ltd. (H Shares) | 6,206,000 | | 2,577,495 |
China Communications Construction Co. Ltd. (H Shares) | 4,613,000 | | 3,766,321 |
China Construction Bank Corp. (H Shares) | 36,419,000 | | 28,278,393 |
China Longyuan Power Grid Corp. Ltd. (H Shares) | 2,204,000 | | 2,532,909 |
China Merchants Bank Co. Ltd. (H Shares) | 4,780,000 | | 9,494,647 |
China Minsheng Banking Corp. Ltd. (H Shares) | 6,609,000 | | 7,578,229 |
China Pacific Insurance Group Co. Ltd. (H Shares) | 2,307,400 | | 8,333,187 |
China Petroleum & Chemical Corp. (H Shares) | 16,762,000 | | 13,568,968 |
China Railway Construction Corp. Ltd. (H Shares) | 8,134,000 | | 8,917,709 |
China Railway Group Ltd. (H Shares) | 14,149,000 | | 7,993,373 |
China Suntien Green Energy Corp. Ltd. (H Shares) | 20,963,000 | | 7,327,451 |
Chongqing Rural Commercial Bank Co. Ltd. (H Shares) | 4,424,000 | | 2,231,116 |
CSR Corp. Ltd. (H Shares) | 5,357,000 | | 4,463,591 |
Guangzhou R&F Properties Co. Ltd. (H Shares) | 2,216,000 | | 3,887,218 |
Harbin Power Equipment Co. Ltd. (H Shares) | 2,984,000 | | 1,874,382 |
Huadian Power International Corp. Ltd. (H Shares) | 6,956,000 | | 3,229,924 |
Huaneng Power International, Inc. (H Shares) | 7,050,000 | | 7,358,869 |
Industrial & Commercial Bank of China Ltd. (H Shares) | 37,468,000 | | 26,241,615 |
Maanshan Iron & Steel Ltd. (H Shares) (a) | 21,474,000 | | 5,484,138 |
PetroChina Co. Ltd. (H Shares) | 4,144,000 | | 4,719,110 |
Ping An Insurance (Group) Co. of China Ltd. (H Shares) | 1,234,500 | | 9,720,911 |
Shanghai Electric Group Co. Ltd. (H Shares) | 7,050,000 | | 2,491,552 |
Sinotrans Ltd. (H Shares) | 16,965,000 | | 4,179,434 |
TOTAL CHINA | | 186,241,900 |
Hong Kong - 11.7% |
AIA Group Ltd. | 6,315,400 | | 32,053,526 |
Champion (REIT) | 10,130,000 | | 4,520,805 |
China Mobile Ltd. | 369,500 | | 3,839,715 |
China Pharmaceutical Group Ltd. | 2,028,000 | | 1,263,413 |
Common Stocks - continued |
| Shares | | Value |
Hong Kong - continued |
China Power International Development Ltd. | 4,464,000 | | $ 1,750,362 |
China Resources Power Holdings Co. Ltd. | 2,038,000 | | 5,336,180 |
CNOOC Ltd. | 11,235,000 | | 22,851,670 |
Dah Chong Hong Holdings Ltd. | 4,309,000 | | 3,657,064 |
Dah Sing Banking Group Ltd. | 1,101,200 | | 2,076,557 |
Dah Sing Financial Holdings Ltd. | 300,400 | | 1,869,509 |
Fosun International Ltd. | 2,999,000 | | 2,881,794 |
Galaxy Entertainment Group Ltd. (a) | 1,632,000 | | 12,177,376 |
Hysan Development Co. Ltd. | 1,743,000 | | 8,149,587 |
Magnificent Estates Ltd. | 7,684,000 | | 371,663 |
Singamas Container Holdings Ltd. | 7,926,000 | | 1,850,388 |
SinoMedia Holding Ltd. | 1,243,000 | | 1,157,547 |
Sun Art Retail Group Ltd. | 4,551,000 | | 7,454,882 |
Vitasoy International Holdings Ltd. | 3,142,000 | | 4,052,625 |
Wharf Holdings Ltd. | 987,000 | | 8,313,053 |
Wheelock and Co. Ltd. | 1,438,000 | | 7,344,873 |
Wing Hang Bank Ltd. | 306,500 | | 4,360,499 |
TOTAL HONG KONG | | 137,333,088 |
India - 8.8% |
Apollo Tyres Ltd. | 2,906,358 | | 3,211,784 |
Axis Bank Ltd. | 218,266 | | 4,330,680 |
Balkrishna Industries Ltd. (a) | 12,730 | | 57,149 |
Bharat Heavy Electricals Ltd. | 3,511,156 | | 8,039,467 |
Britannia Industries Ltd. | 138,551 | | 2,112,417 |
CESC Ltd. GDR (a) | 171,269 | | 1,034,996 |
Coal India Ltd. | 1,115,388 | | 5,211,865 |
Cox & Kings India Ltd. | 520,737 | | 775,731 |
HCL Infosystems Ltd. (a) | 1,015,133 | | 387,939 |
HCL Technologies Ltd. | 168,301 | | 2,991,505 |
HDFC Bank Ltd. | 891,548 | | 9,900,895 |
Hexaware Technologies Ltd. | 719,034 | | 1,551,272 |
Hindustan Petroleum Corp. Ltd. | 1,720,370 | | 5,621,130 |
Housing Development Finance Corp. Ltd. | 950,991 | | 13,195,263 |
IL&FS Transportation Networks Ltd. | 216,616 | | 376,118 |
Lupin Ltd. | 103,912 | | 1,542,865 |
McLeod Russel India Ltd. | 461,623 | | 2,054,022 |
MindTree Consulting Ltd. | 194,699 | | 4,373,492 |
Mphasis BFL Ltd. | 113,907 | | 782,621 |
MRF Ltd. | 5,492 | | 1,403,756 |
NIIT Technologies Ltd. | 251,348 | | 1,143,881 |
NTPC Ltd. | 2,916,310 | | 7,056,047 |
Reliance Infrastructure Ltd. (a) | 92,483 | | 648,029 |
Shriram City Union Finance Ltd. | 116,415 | | 1,910,559 |
Sintex Industries Ltd. | 911,712 | | 487,487 |
Tata Consultancy Services Ltd. | 359,335 | | 12,315,551 |
The Jammu & Kashmir Bank Ltd. | 134,035 | | 2,836,151 |
Upl Ltd. | 1,757,484 | | 4,691,453 |
|
| Shares | | Value |
Wockhardt Ltd. (a) | 351,389 | | $ 2,534,889 |
Zydus Wellness Ltd. | 51,143 | | 468,780 |
TOTAL INDIA | | 103,047,794 |
Indonesia - 2.3% |
PT Bank Rakyat Indonesia Tbk | 19,430,500 | | 13,617,223 |
PT BISI International Tbk | 6,822,000 | | 369,164 |
PT Express Transindo Utama Tbk | 6,816,000 | | 906,981 |
PT Telkomunikasi Indonesia Tbk Series B | 51,499,000 | | 10,736,040 |
PT Tempo Scan Pacific Tbk | 3,462,000 | | 1,197,758 |
TOTAL INDONESIA | | 26,827,166 |
Japan - 0.5% |
Fuji Media Holdings, Inc. | 128,300 | | 2,557,707 |
Suzuki Motor Corp. | 146,300 | | 3,678,768 |
TOTAL JAPAN | | 6,236,475 |
Korea (South) - 21.6% |
CJ O Shopping Co. Ltd. | 7,783 | | 2,596,092 |
Daesang Corp. | 99,890 | | 3,266,039 |
Daewoo International Corp. | 163,540 | | 6,032,893 |
DGB Financial Group Co. Ltd. | 546,470 | | 8,753,567 |
E1 Corp. | 6,561 | | 470,462 |
Hanwha Corp. | 44,210 | | 1,672,538 |
Hotel Shilla Co. | 143,377 | | 9,254,222 |
Hy-Lok Corp. | 49,168 | | 1,236,983 |
Hyosung Corp. | 14,319 | | 966,041 |
Hyundai Hysco Co. Ltd. | 105,750 | | 4,195,003 |
Hyundai Industrial Development & Construction Co. | 72,160 | | 1,604,643 |
Hyundai Motor Co. | 113,250 | | 26,997,812 |
Hyundai Steel Co. | 91,319 | | 7,529,030 |
KB Financial Group, Inc. | 329,520 | | 12,971,158 |
Kia Motors Corp. | 205,747 | | 11,961,579 |
Kolon Industries, Inc. | 25,763 | | 1,439,531 |
Korea Plant Service & Engineering Co. Ltd. | 16,613 | | 842,171 |
Korean Reinsurance Co. | 201,630 | | 2,260,851 |
LG Hausys Ltd. | 4,981 | | 603,100 |
LG Home Shopping, Inc. | 11,928 | | 2,749,121 |
NHN Corp. | 23,734 | | 13,351,040 |
POSCO | 56,269 | | 16,790,212 |
Samsung Electronics Co. Ltd. | 53,020 | | 73,189,227 |
SBS Contents Hub Co. Ltd. | 94,947 | | 1,328,549 |
Shinhan Financial Group Co. Ltd. | 309,670 | | 13,495,991 |
SK Hynix, Inc. (a) | 443,870 | | 13,362,770 |
SK Telecom Co. Ltd. | 28,181 | | 6,138,141 |
Soulbrain Co. Ltd. | 99,220 | | 4,955,014 |
Sung Kwang Bend Co. Ltd. | 39,944 | | 1,093,371 |
Tong Yang Life Insurance Co. Ltd. | 180,890 | | 1,917,507 |
TOTAL KOREA (SOUTH) | | 253,024,658 |
Malaysia - 3.4% |
British American Tobacco (Malaysia) Bhd | 149,000 | | 2,997,466 |
Bumiputra-Commerce Holdings Bhd | 32,930 | | 77,930 |
Common Stocks - continued |
| Shares | | Value |
Malaysia - continued |
Bursa Malaysia Bhd | 875,500 | | $ 2,230,008 |
Glomac Bhd | 4,871,300 | | 1,743,884 |
Malayan Banking Bhd | 3,323,150 | | 10,275,287 |
Malaysian Plantations Bhd | 3,416,400 | | 5,617,334 |
Media Prima Bhd | 523,900 | | 438,174 |
Tenaga Nasional Bhd | 3,817,700 | | 11,405,326 |
YTL Corp. Bhd | 8,641,500 | | 4,517,179 |
TOTAL MALAYSIA | | 39,302,588 |
Papua New Guinea - 0.2% |
Oil Search Ltd. ADR | 301,334 | | 2,423,698 |
Philippines - 0.9% |
Alliance Global Group, Inc. | 3,072,500 | | 1,873,432 |
Holcim Philippines, Inc. | 399,400 | | 129,205 |
Manila Water Co., Inc. | 1,619,500 | | 936,885 |
Security Bank Corp. | 1,920,040 | | 6,175,762 |
Vista Land & Lifescapes, Inc. | 8,080,500 | | 1,032,150 |
TOTAL PHILIPPINES | | 10,147,434 |
Singapore - 5.7% |
Ascendas Real Estate Investment Trust | 2,718,000 | | 5,185,687 |
Keppel Corp. Ltd. | 1,446,000 | | 12,630,092 |
Mapletree Industrial (REIT) | 2,785,496 | | 3,105,709 |
Singapore Telecommunications Ltd. | 4,683,000 | | 14,250,314 |
United Overseas Bank Ltd. | 971,000 | | 16,290,163 |
UOL Group Ltd. | 1,546,000 | | 8,201,691 |
Wing Tai Holdings Ltd. | 2,376,000 | | 4,227,145 |
Yanlord Land Group Ltd. | 3,322,000 | | 3,302,745 |
TOTAL SINGAPORE | | 67,193,546 |
Taiwan - 8.4% |
Advantech Co. Ltd. | 304,000 | | 1,946,798 |
Catcher Technology Co. Ltd. | 1,342,000 | | 7,796,229 |
Chinatrust Financial Holding Co. Ltd. | 182 | | 123 |
Chipbond Technology Corp. | 2,327,000 | | 4,695,899 |
ECLAT Textile Co. Ltd. | 204,340 | | 2,245,762 |
Fubon Financial Holding Co. Ltd. | 8,786,000 | | 12,834,992 |
LITE-ON Technology Corp. | 3,900,149 | | 6,810,520 |
MediaTek, Inc. | 699,000 | | 9,546,390 |
PChome Online, Inc. | 451,000 | | 2,620,044 |
Shin Kong Financial Holding Co. Ltd. | 12,357,000 | | 4,282,025 |
Sinopac Holdings Co. | 15,297,858 | | 7,535,891 |
Taishin Financial Holdings Co. Ltd. | 20,584,055 | | 10,384,685 |
Taiwan Semiconductor Manufacturing Co. Ltd. | 5,964,192 | | 21,939,972 |
Tongtai Machine & Tool Co. Ltd. | 246,000 | | 236,096 |
Unified-President Enterprises Corp. | 841 | | 1,600 |
WPG Holding Co. Ltd. | 4,230,000 | | 5,144,692 |
TOTAL TAIWAN | | 98,021,718 |
|
| Shares | | Value |
Thailand - 3.8% |
Delta Electronics PCL (For. Reg.) | 3,243,200 | | $ 4,975,512 |
Kasikornbank PCL (For. Reg.) | 1,309,500 | | 8,162,024 |
Preuksa Real Estate PCL (For. Reg.) | 6,008,700 | | 4,305,028 |
PTT Global Chemical PCL (For. Reg.) | 2,157,938 | | 5,442,510 |
Quality Houses PCL NVDR | 21,873,800 | | 2,136,429 |
Shin Corp. PLC: | | | |
(For. Reg.) | 86,000 | | 232,787 |
NVDR | 2,773,900 | | 7,508,468 |
Supalai PCL NVDR | 4,617,600 | | 2,625,912 |
Thai Beverage PCL | 11,423,000 | | 5,011,701 |
Total Access Communication PCL NVDR | 991,500 | | 3,583,735 |
Toyo-Thai Corp. PCL | 915,200 | | 1,132,055 |
TOTAL THAILAND | | 45,116,161 |
United Kingdom - 0.7% |
HSBC Holdings PLC (Hong Kong) | 727,308 | | 7,952,967 |
United States of America - 0.9% |
Las Vegas Sands Corp. | 146,600 | | 10,294,252 |
TOTAL COMMON STOCKS (Cost $1,061,319,100) |
1,149,073,140
|
Money Market Funds - 2.6% |
| | | |
Fidelity Cash Central Fund, 0.09% (b) | 24,154,847 | | 24,154,847 |
Fidelity Securities Lending Cash Central Fund, 0.09% (b)(c) | 5,588,575 | | 5,588,575 |
TOTAL MONEY MARKET FUNDS (Cost $29,743,422) |
29,743,422
|
TOTAL INVESTMENT PORTFOLIO - 100.6% (Cost $1,091,062,522) | | 1,178,816,562 |
NET OTHER ASSETS (LIABILITIES) - (0.6)% | | (6,468,187) |
NET ASSETS - 100% | $ 1,172,348,375 |
Legend |
(a) Non-income producing |
(b) Affiliated fund that is generally available only to investment companies and other accounts managed by Fidelity Investments. The rate quoted is the annualized seven-day yield of the fund at period end. A complete unaudited listing of the fund's holdings as of its most recent quarter end is available upon request. In addition, each Fidelity Central Fund's financial statements, which are not covered by the Fund's Report of Independent Registered Public Accounting Firm, are available on the SEC's website or upon request. |
(c) Investment made with cash collateral received from securities on loan. |
(d) Security or a portion of the security is on loan at period end. |
Affiliated Central Funds |
Information regarding fiscal year to date income earned by the Fund from investments in Fidelity Central Funds is as follows: |
Fund | Income earned |
Fidelity Cash Central Fund | $ 25,395 |
Fidelity Securities Lending Cash Central Fund | 24,827 |
Total | $ 50,222 |
Other Information |
Categorizations in the Schedule of Investments are based on country or territory of incorporation. |
The following is a summary of the inputs used, as of October 31, 2013, involving the Fund's assets and liabilities carried at fair value. The inputs or methodology used for valuing securities may not be an indication of the risk associated with investing in those securities. For more information on valuation inputs, and their aggregation into the levels used in the tables below, please refer to the Investment Valuation section in the accompanying Notes to Financial Statements. |
Valuation Inputs at Reporting Date: |
Description | Total | Level 1 | Level 2 | Level 3 |
Investments in Securities: | | | | |
Equities: | | | | |
Consumer Discretionary | $ 137,335,293 | $ 131,098,818 | $ 6,236,475 | $ - |
Consumer Staples | 39,832,367 | 39,832,367 | - | - |
Energy | 67,448,630 | 26,308,882 | 41,139,748 | - |
Financials | 406,531,314 | 362,210,303 | 44,321,011 | - |
Health Care | 9,206,525 | 7,663,660 | 1,542,865 | - |
Industrials | 77,866,831 | 77,866,831 | - | - |
Information Technology | 231,913,910 | 208,867,455 | 23,046,455 | - |
Materials | 83,794,407 | 62,682,178 | 21,112,229 | - |
Telecommunication Services | 46,289,200 | 36,311,344 | 9,977,856 | - |
Utilities | 48,854,663 | 41,495,794 | 7,358,869 | - |
Money Market Funds | 29,743,422 | 29,743,422 | - | - |
Total Investments in Securities: | $ 1,178,816,562 | $ 1,024,081,054 | $ 154,735,508 | $ - |
The following is a summary of transfers between Level 1 and Level 2 for the period ended October 31, 2013. Transfers are assumed to have occurred at the beginning of the period, and are primarily attributable to the valuation techniques used for foreign equity securities, as discussed in the accompanying Notes to Financial Statements: |
Transfers | Total |
Level 1 to Level 2 | $ 1,343,034 |
Level 2 to Level 1 | $ 15,354,673 |
See accompanying notes which are an integral part of the financial statements.
Annual Report
Fidelity Emerging Asia Fund
Statement of Assets and Liabilities
| October 31, 2013 |
| | |
Assets | | |
Investment in securities, at value (including securities loaned of $5,435,637) - See accompanying schedule: Unaffiliated issuers (cost $1,061,319,100) | $ 1,149,073,140 | |
Fidelity Central Funds (cost $29,743,422) | 29,743,422 | |
Total Investments (cost $1,091,062,522) | | $ 1,178,816,562 |
Foreign currency held at value (cost $28,806) | | 28,648 |
Receivable for investments sold | | 4,099,120 |
Receivable for fund shares sold | | 376,921 |
Dividends receivable | | 537,123 |
Distributions receivable from Fidelity Central Funds | | 11,676 |
Prepaid expenses | | 3,303 |
Other receivables | | 535,703 |
Total assets | | 1,184,409,056 |
| | |
Liabilities | | |
Payable to custodian bank | $ 2,226,004 | |
Payable for investments purchased | 1,212,181 | |
Payable for fund shares redeemed | 1,791,034 | |
Accrued management fee | 677,703 | |
Other affiliated payables | 250,311 | |
Other payables and accrued expenses | 314,873 | |
Collateral on securities loaned, at value | 5,588,575 | |
Total liabilities | | 12,060,681 |
| | |
Net Assets | | $ 1,172,348,375 |
Net Assets consist of: | | |
Paid in capital | | $ 1,278,272,329 |
Undistributed net investment income | | 13,140,582 |
Accumulated undistributed net realized gain (loss) on investments and foreign currency transactions | | (206,645,495) |
Net unrealized appreciation (depreciation) on investments and assets and liabilities in foreign currencies | | 87,580,959 |
Net Assets, for 37,927,682 shares outstanding | | $ 1,172,348,375 |
Net Asset Value, offering price and redemption price per share ($1,172,348,375 ÷ 37,927,682 shares) | | $ 30.91 |
Statement of Operations
| Year ended October 31, 2013 |
| | |
Investment Income | | |
Dividends | | $ 33,417,391 |
Interest | | 70 |
Income from Fidelity Central Funds | | 50,222 |
Income before foreign taxes withheld | | 33,467,683 |
Less foreign taxes withheld | | (2,867,817) |
Total income | | 30,599,866 |
| | |
Expenses | | |
Management fee Basic fee | $ 9,144,559 | |
Performance adjustment | 572,714 | |
Transfer agent fees | 2,812,212 | |
Accounting and security lending fees | 590,535 | |
Custodian fees and expenses | 757,488 | |
Independent trustees' compensation | 7,718 | |
Registration fees | 30,050 | |
Audit | 98,083 | |
Legal | 3,645 | |
Interest | 7,464 | |
Miscellaneous | 11,876 | |
Total expenses before reductions | 14,036,344 | |
Expense reductions | (460,336) | 13,576,008 |
Net investment income (loss) | | 17,023,858 |
Realized and Unrealized Gain (Loss) Net realized gain (loss) on: | | |
Investment securities: | | |
Unaffiliated issuers | 79,160,557 | |
Foreign currency transactions | (2,377,886) | |
Total net realized gain (loss) | | 76,782,671 |
Change in net unrealized appreciation (depreciation) on: Investment securities (net of decrease in deferred foreign taxes of $299,951) | 23,726,381 | |
Assets and liabilities in foreign currencies | (77,602) | |
Total change in net unrealized appreciation (depreciation) | | 23,648,779 |
Net gain (loss) | | 100,431,450 |
Net increase (decrease) in net assets resulting from operations | | $ 117,455,308 |
See accompanying notes which are an integral part of the financial statements.
Annual Report
Statement of Changes in Net Assets
| Year ended
October 31,
2013 | Year ended
October 31,
2012 |
Increase (Decrease) in Net Assets | | |
Operations | | |
Net investment income (loss) | $ 17,023,858 | $ 23,469,581 |
Net realized gain (loss) | 76,782,671 | (12,439,040) |
Change in net unrealized appreciation (depreciation) | 23,648,779 | 71,651,975 |
Net increase (decrease) in net assets resulting from operations | 117,455,308 | 82,682,516 |
Distributions to shareholders from net investment income | (21,400,733) | (28,292,736) |
Distributions to shareholders from net realized gain | (3,801,390) | - |
Total distributions | (25,202,123) | (28,292,736) |
Share transactions
Proceeds from sales of shares | 180,491,279 | 151,864,540 |
Reinvestment of distributions | 24,104,759 | 26,918,231 |
Cost of shares redeemed | (449,851,066) | (433,734,675) |
Net increase (decrease) in net assets resulting from share transactions | (245,255,028) | (254,951,904) |
Redemption fees | 141,939 | 135,187 |
Total increase (decrease) in net assets | (152,859,904) | (200,426,937) |
| | |
Net Assets | | |
Beginning of period | 1,325,208,279 | 1,525,635,216 |
End of period (including undistributed net investment income of $13,140,582 and undistributed net investment income of $19,737,880, respectively) | $ 1,172,348,375 | $ 1,325,208,279 |
Other Information Shares | | |
Sold | 6,104,803 | 5,537,329 |
Issued in reinvestment of distributions | 828,340 | 1,017,318 |
Redeemed | (15,386,262) | (16,016,403) |
Net increase (decrease) | (8,453,119) | (9,461,756) |
Financial Highlights
Years ended October 31, | 2013 | 2012 | 2011 | 2010 | 2009 |
Selected Per-Share Data | | | | | |
Net asset value, beginning of period | $ 28.57 | $ 27.32 | $ 29.70 | $ 23.98 | $ 18.50 |
Income from Investment Operations | | | | | |
Net investment income (loss) B | .39 | .46 | .50 | .39 | .58 E |
Net realized and unrealized gain (loss) | 2.49 | 1.30 | (2.30) | 6.16 | 5.09 |
Total from investment operations | 2.88 | 1.76 | (1.80) | 6.55 | 5.67 |
Distributions from net investment income | (.46) | (.51) | (.49) | (.43) | (.20) |
Distributions from net realized gain | (.08) | - | (.11) | (.40) | - |
Total distributions | (.54) | (.51) | (.59) H | (.83) | (.20) |
Redemption fees added to paid in capital B | - G | - G | .01 | - G | .01 |
Net asset value, end of period | $ 30.91 | $ 28.57 | $ 27.32 | $ 29.70 | $ 23.98 |
Total Return A | 10.19% | 6.60% | (6.20)% | 27.93% | 31.08% |
Ratios to Average Net Assets C, F | | | | | |
Expenses before reductions | 1.08% | .94% | .82% | .78% | 1.14% |
Expenses net of fee waivers, if any | 1.08% | .94% | .82% | .78% | 1.14% |
Expenses net of all reductions | 1.05% | .91% | .78% | .74% | .99% |
Net investment income (loss) | 1.31% | 1.68% | 1.68% | 1.50% | 2.86% E |
Supplemental Data | | | | | |
Net assets, end of period (000 omitted) | $ 1,172,348 | $ 1,325,208 | $ 1,525,635 | $ 1,717,562 | $ 1,736,852 |
Portfolio turnover rate D | 97% | 94% | 115% | 105% | 220% |
ATotal returns would have been lower if certain expenses had not been reduced during the applicable periods shown. BCalculated based on average shares outstanding during the period. CFees and expenses of any underlying Fidelity Central Funds are not included in the Fund's expense ratio. The Fund indirectly bears its proportionate share of the expenses of any underlying Fidelity Central Funds. DAmount does not include the portfolio activity of any underlying Fidelity Central Funds. EInvestment income per share reflects a large, non-recurring dividend which amounted to $.16 per share. Excluding this non-recurring dividend, the ratio of net investment income (loss) to average net assets would have been 2.09%. FExpense ratios reflect operating expenses of the Fund. Expenses before reductions do not reflect amounts reimbursed by the investment adviser or reductions from brokerage service arrangements or reductions from other expense offset arrangements and do not represent the amount paid by the Fund during periods when reimbursements or reductions occur. Expenses net of fee waivers reflect expenses after reimbursement by the investment adviser but prior to reductions from brokerage service arrangements or other expense offset arrangements. Expenses net of all reductions represent the net expenses paid by the Fund. GAmount represents less than $.01 per share. HTotal distributions of $.59 per share is comprised of distributions from net investment income of $.485 and distributions from net realized gain of $.105 per share. |
See accompanying notes which are an integral part of the financial statements.
Annual Report
Notes to Financial Statements
For the period ended October 31, 2013
1. Organization.
Fidelity Emerging Asia Fund (the Fund) is a fund of Fidelity Investment Trust (the Trust) and is authorized to issue an unlimited number of shares. The Trust is registered under the Investment Company Act of 1940, as amended (the 1940 Act), as an open-end management investment company organized as a Massachusetts business trust. The Fund's investments in emerging markets can be subject to social, economic, regulatory and political uncertainties and can be extremely volatile.
2. Investments in Fidelity Central Funds.
The Fund invests in Fidelity Central Funds, which are open-end investment companies generally available only to other investment companies and accounts managed by Fidelity Management & Research Company (FMR) and its affiliates. The Fund's Schedule of Investments lists each of the Fidelity Central Funds held as of period end, if any, as an investment of the Fund, but does not include the underlying holdings of each Fidelity Central Fund. As an Investing Fund, the Fund indirectly bears its proportionate share of the expenses of the underlying Fidelity Central Funds.
The Money Market Central Funds seek preservation of capital and current income and are managed by Fidelity Investments Money Management, Inc. (FIMM), an affiliate of FMR.
A complete unaudited list of holdings for each Fidelity Central Fund is available upon request or at the Securities and Exchange Commission (the SEC) website at www.sec.gov. In addition, the financial statements of the Fidelity Central Funds, which are not covered by the Fund's Report of Independent Registered Public Accounting Firm, are available on the SEC website or upon request.
3. Significant Accounting Policies.
The financial statements have been prepared in conformity with accounting principles generally accepted in the United States of America (GAAP), which require management to make certain estimates and assumptions at the date of the financial statements. Actual results could differ from those estimates. Subsequent events, if any, through the date that the financial statements were issued have been evaluated in the preparation of the financial statements. The following summarizes the significant accounting policies of the Fund:
Investment Valuation. Investments are valued as of 4:00 p.m. Eastern time on the last calendar day of the period. In accordance with valuation policies and procedures approved by the Board of Trustees (the Board), the Fund attempts to obtain prices from one or more third party pricing vendors or brokers to value its investments. When current market prices, quotations or currency exchange rates are not readily available or reliable, investments will be fair valued in good faith by the FMR Fair Value Committee (the Committee), in accordance with procedures adopted by the Board. Factors used in determining fair value vary by investment type and may include market or investment specific events. The frequency with which these procedures are used cannot be predicted and they may be utilized to a significant extent. The Committee oversees the Fund's valuation policies and procedures and is responsible for approving and reporting to the Board all fair value determinations.
The Fund categorizes the inputs to valuation techniques used to value its investments into a disclosure hierarchy consisting of three levels as shown below:
Level 1 - quoted prices in active markets for identical investments
Level 2 - other significant observable inputs (including quoted prices for similar investments, interest rates, prepayment speeds, etc.)
Level 3 - unobservable inputs (including the Fund's own assumptions based on the best information available)
Valuation techniques used to value the Fund's investments by major category are as follows:
Equity securities, including restricted securities, for which market quotations are readily available, are valued at the last reported sale price or official closing price as reported by a third party pricing vendor on the primary market or exchange on which they are traded and are categorized as Level 1 in the hierarchy. In the event there were no sales during the day or closing prices are not available, securities are valued at the last quoted bid price or may be valued using the last available price and are generally categorized as Level 2 in the hierarchy. For foreign equity securities, when market or security specific events arise, comparisons to the valuation of American Depositary Receipts (ADRs), futures contracts, Exchange-Traded Funds (ETFs) and certain indexes as well as quoted prices for similar securities may be used and would be categorized as Level 2 in the hierarchy. Utilizing these techniques may result in transfers between Level 1 and Level 2. For equity securities, including restricted securities, where observable inputs are limited, assumptions about market activity and risk are used and these securities may be categorized as Level 3 in the hierarchy.
Investments in open-end mutual funds, including the Fidelity Central Funds, are valued at their closing net asset value (NAV) each business day and are categorized as Level 1 in the hierarchy.
Annual Report
3. Significant Accounting Policies - continued
Investment Valuation - continued
Changes in valuation techniques may result in transfers in or out of an assigned level within the disclosure hierarchy. The aggregate value of investments by input level, as of October 31, 2013, including information on transfers between Levels 1 and 2, is included at the end of the Fund's Schedule of Investments.
Foreign Currency. The Fund may use foreign currency contracts to facilitate transactions in foreign-denominated securities. Gains and losses from these transactions may arise from changes in the value of the foreign currency or if the counterparties do not perform under the contracts' terms.
Foreign-denominated assets, including investment securities, and liabilities are translated into U.S. dollars at the exchange rates at period end. Purchases and sales of investment securities, income and dividends received and expenses denominated in foreign currencies are translated into U.S. dollars at the exchange rate in effect on the transaction date.
The effects of exchange rate fluctuations on investments are included with the net realized and unrealized gain (loss) on investment securities. Other foreign currency transactions resulting in realized and unrealized gain (loss) are disclosed separately.
Investment Transactions and Income. For financial reporting purposes, the Fund's investment holdings and NAV include trades executed through the end of the last business day of the period. The NAV per share for processing shareholder transactions is calculated as of the close of business of the New York Stock Exchange (NYSE), normally 4:00 p.m. Eastern time and includes trades executed through the end of the prior business day. Gains and losses on securities sold are determined on the basis of identified cost and may include proceeds received from litigation. Dividend income is recorded on the ex-dividend date, except for certain dividends from foreign securities where the ex-dividend date may have passed, which are recorded as soon as the Fund is informed of the ex-dividend date. Non-cash dividends included in dividend income, if any, are recorded at the fair market value of the securities received. Distributions received on securities that represent a return of capital or capital gain are recorded as a reduction of cost of investments and/or as a realized gain. Subsequent to ex-dividend date the Fund determines the components of these distributions, based upon receipt of tax filings or other correspondence relating to the underlying investment. Interest income and distributions from the Fidelity Central Funds are accrued as earned. Interest income includes coupon interest and amortization of premium and accretion of discount on debt securities. Investment income is recorded net of foreign taxes withheld where recovery of such taxes is uncertain.
Expenses. Expenses directly attributable to a fund are charged to that fund. Expenses attributable to more than one fund are allocated among the respective funds on the basis of relative net assets or other appropriate methods. Expense estimates are accrued in the period to which they relate and adjustments are made when actual amounts are known.
Income Tax Information and Distributions to Shareholders. Each year, the Fund intends to qualify as a regulated investment company under Subchapter M of the Internal Revenue Code, including distributing substantially all of its taxable income and realized gains. As a result, no provision for U.S. Federal income taxes is required. As of October 31, 2013, the Fund did not have any unrecognized tax benefits in the financial statements; nor is the Fund aware of any tax positions for which it is reasonably possible that the total amounts of unrecognized tax benefits will significantly change in the next twelve months. The Fund files a U.S. federal tax return, in addition to state and local tax returns as required. The Fund's federal income tax returns are subject to examination by the Internal Revenue Service (IRS) for a period of three fiscal years after they are filed. State and local tax returns may be subject to examination for an additional fiscal year depending on the jurisdiction. Foreign taxes are provided for based on the Fund's understanding of the tax rules and rates that exist in the foreign markets in which it invests.
Distributions are declared and recorded on the ex-dividend date. Income and capital gain distributions are determined in accordance with income tax regulations, which may differ from GAAP.
Capital accounts within the financial statements are adjusted for permanent book-tax differences. These adjustments have no impact on net assets or the results of operations. Temporary book-tax differences will reverse in a subsequent period.
Book-tax differences are primarily due to foreign currency transactions, passive foreign investment companies (PFIC), deferred trustees compensation, capital loss carryforwards and losses deferred due to wash sales.
The federal tax cost of investment securities and unrealized appreciation (depreciation) as of period end were as follows:
Gross unrealized appreciation | $ 132,385,791 |
Gross unrealized depreciation | (45,991,885) |
Net unrealized appreciation (depreciation) on securities and other investments | $ 86,393,906 |
| |
Tax Cost | $ 1,092,422,656 |
Annual Report
Notes to Financial Statements - continued
3. Significant Accounting Policies - continued
Income Tax Information and Distributions to Shareholders - continued
The tax-based components of distributable earnings as of period end were as follows:
Undistributed ordinary income | $ 13,140,996 |
Capital loss carryforward | $ (205,285,362) |
Net unrealized appreciation (depreciation) | $ 86,220,825 |
Capital loss carryforwards are only available to offset future capital gains of the Fund to the extent provided by regulations and may be limited. Under the Regulated Investment Company Modernization Act of 2010 (the Act), the Fund is permitted to carry forward capital losses incurred in taxable years beginning after December 22, 2010 for an unlimited period and such capital losses are required to be used prior to any losses that expire. The capital loss carryforward information presented below, including any applicable limitation, is estimated as of fiscal period end and is subject to adjustment.
Fiscal year of expiration | |
2017 | $ (205,285,362) |
The tax character of distributions paid was as follows:
| October 31, 2013 | October 31, 2012 |
Ordinary Income | $ 25,202,123 | $ 28,292,736 |
Short-Term Trading (Redemption) Fees. Shares held by investors in the Fund less than 90 days may have been subject to a redemption fee equal to 1.50% of the net asset value of shares redeemed. All redemption fees, which reduce the proceeds of the shareholder redemption, are retained by the Fund and accounted for as an addition to paid in capital.
4. Purchases and Sales of Investments.
Purchases and sales of securities, other than short-term securities, aggregated $1,235,836,075 and $1,496,040,618, respectively.
5. Fees and Other Transactions with Affiliates.
Management Fee. FMR and its affiliates provide the Fund with investment management related services for which the Fund pays a monthly management fee. The management fee is the sum of an individual fund fee rate that is based on an annual rate of .45% of the Fund's average net assets and an annualized group fee rate that averaged .25% during the period. The group fee rate is based upon the average net assets of all the mutual funds advised by FMR, including any mutual funds previously advised by FMR that are currently advised by Fidelity SelectCo, LLC, an affiliate of FMR. The group fee rate decreases as assets under management increase and increases as assets under management decrease. In addition, the management fee is subject to a performance adjustment (up to a maximum of ± .20% of the Fund's average net assets over a 36 month performance period). The upward or downward adjustment to the management fee is based on the Fund's relative investment performance as compared to an appropriate benchmark index over the same 36 month performance period. For the reporting period, the total annual management fee rate, including the performance adjustment, was .75% of the Fund's average net assets. The performance adjustment included in the management fee rate may be higher or lower than the maximum performance adjustment rate due to the difference between the average net assets for the reporting and performance periods.
Transfer Agent Fees. Fidelity Investments Institutional Operations Company, Inc., (FIIOC), an affiliate of FMR, is the Fund's transfer, dividend disbursing and shareholder servicing agent. FIIOC receives account fees and asset-based fees that vary according to the account size and type of account. FIIOC pays for typesetting, printing and mailing of shareholder reports, except proxy statements. For the period, the transfer agent fees were equivalent to an annualized rate of .22% of average net assets.
Accounting and Security Lending Fees. Fidelity Service Company, Inc. (FSC), an affiliate of FMR, maintains the Fund's accounting records. The accounting fee is based on the level of average net assets for each month. Under a separate contract, FSC administers the security lending program. The security lending fee is based on the number and duration of lending transactions.
Brokerage Commissions. The Fund placed a portion of its portfolio transactions with brokerage firms which are affiliates of the investment adviser. Brokerage commissions are included in net realized gain (loss) and change in net unrealized appreciation (depreciation) in the Statement of Operations. The commissions paid to these affiliated firms were $1,284 for the period.
Interfund Lending Program. Pursuant to an Exemptive Order issued by the SEC, the Fund, along with other registered investment companies having management contracts with FMR, may participate in an interfund lending program. This program provides an alternative credit facility allowing the
Annual Report
5. Fees and Other Transactions with Affiliates - continued
Interfund Lending Program - continued
funds to borrow from, or lend money to, other participating affiliated funds. At period end, there were no interfund loans outstanding. The Fund's activity in this program during the period for which loans were outstanding was as follows:
Borrower or Lender | Average Loan
Balance | Weighted Average Interest Rate | Interest Expense |
Borrower | $ 16,900,487 | .33% | $ 6,027 |
6. Committed Line of Credit.
The Fund participates with other funds managed by FMR or an affiliate in a $4.25 billion credit facility (the "line of credit") to be utilized for temporary or emergency purposes to fund shareholder redemptions or for other short-term liquidity purposes. The Fund has agreed to pay commitment fees on its pro-rata portion of the line of credit, which amounted to $2,907 and is reflected in Miscellaneous expenses on the Statement of Operations. During the period, there were no borrowings on this line of credit.
7. Security Lending.
The Fund lends portfolio securities through a lending agent from time to time in order to earn additional income. For equity securities, a lending agent is used and may loan securities to certain qualified borrowers, including Fidelity Capital Markets (FCM), a broker-dealer affiliated with the Fund. On the settlement date of the loan, the Fund receives collateral (in the form of U.S. Treasury obligations, letters of credit and/or cash) against the loaned securities and maintains collateral in an amount not less than 100% of the market value of the loaned securities during the period of the loan. The market value of the loaned securities is determined at the close of business of the Fund and any additional required collateral is delivered to the Fund on the next business day. If the borrower defaults on its obligation to return the securities loaned because of insolvency or other reasons, the Fund may apply collateral received from the borrower against the obligation. The Fund may experience delays and costs in recovering the securities loaned. Any cash collateral received is invested in the Fidelity Securities Lending Cash Central Fund. The value of loaned securities and cash collateral at period end are disclosed on the Fund's Statement of Assets and Liabilities. Security lending income represents the income earned on investing cash collateral, less rebates paid to borrowers and any lending agent fees associated with the loan, plus any premium payments received for lending certain types of securities. Security lending income is presented in the Statement of Operations as a component of income from Fidelity Central Funds. Total security lending income during the period amounted to $24,827. During the period, there were no securities loaned to FCM.
8. Bank Borrowings.
The Fund is permitted to have bank borrowings for temporary or emergency purposes to fund shareholder redemptions or for other short-term liquidity requirements. The Fund has established borrowing arrangements with certain banks. The interest rate on the borrowings is the bank's base rate, as revised from time to time. The average loan balance during the period for which loans were outstanding amounted to $17,412,200. The weighted average interest rate was .59%. The interest expense amounted to $1,437 under the bank borrowing program. At period end, there were no bank borrowings outstanding.
9. Expense Reductions.
Commissions paid to certain brokers with whom FMR, or its affiliates, places trades on behalf of the Fund include an amount in addition to trade execution, which may be rebated back to the Fund to offset certain expenses. This amount totaled $446,360 for the period.
In addition, FMR reimbursed a portion of the Fund's operating expenses during the period in the amount of $13,976.
10. Other.
The Fund's organizational documents provide former and current trustees and officers with a limited indemnification against liabilities arising in connection with the performance of their duties to the Fund. In the normal course of business, the Fund may also enter into contracts that provide general indemnifications. The Fund's maximum exposure under these arrangements is unknown as this would be dependent on future claims that may be made against the Fund. The risk of material loss from such claims is considered remote.
Annual Report
Fidelity Emerging Markets Fund
Average annual total return reflects the change in the value of an investment, assuming reinvestment of the class' distributions from dividend income and capital gains (the profits earned upon the sale of securities that have grown in value, if any) and assuming a constant rate of performance each year. The $10,000 table and the fund's returns do not reflect the deduction of taxes that a shareholder would pay on fund distributions or the redemption of fund shares. During periods of reimbursement by Fidelity, a fund's total return will be greater than it would be had the reimbursement not occurred. How a fund did yesterday is no guarantee of how it will do tomorrow.
Average Annual Total Returns
Periods ended October 31, 2013 | Past 1
year | Past 5
years | Past 10
years |
Fidelity Emerging Markets Fund | 11.78% | 13.90% | 11.29% |
$10,000 Over 10 Years
Let's say hypothetically that $10,000 was invested in Fidelity Emerging Markets Fund, a class of the fund, on October 31, 2003. The chart shows how the value of your investment would have changed, and also shows how the MSCI Emerging Markets Index performed over the same period.
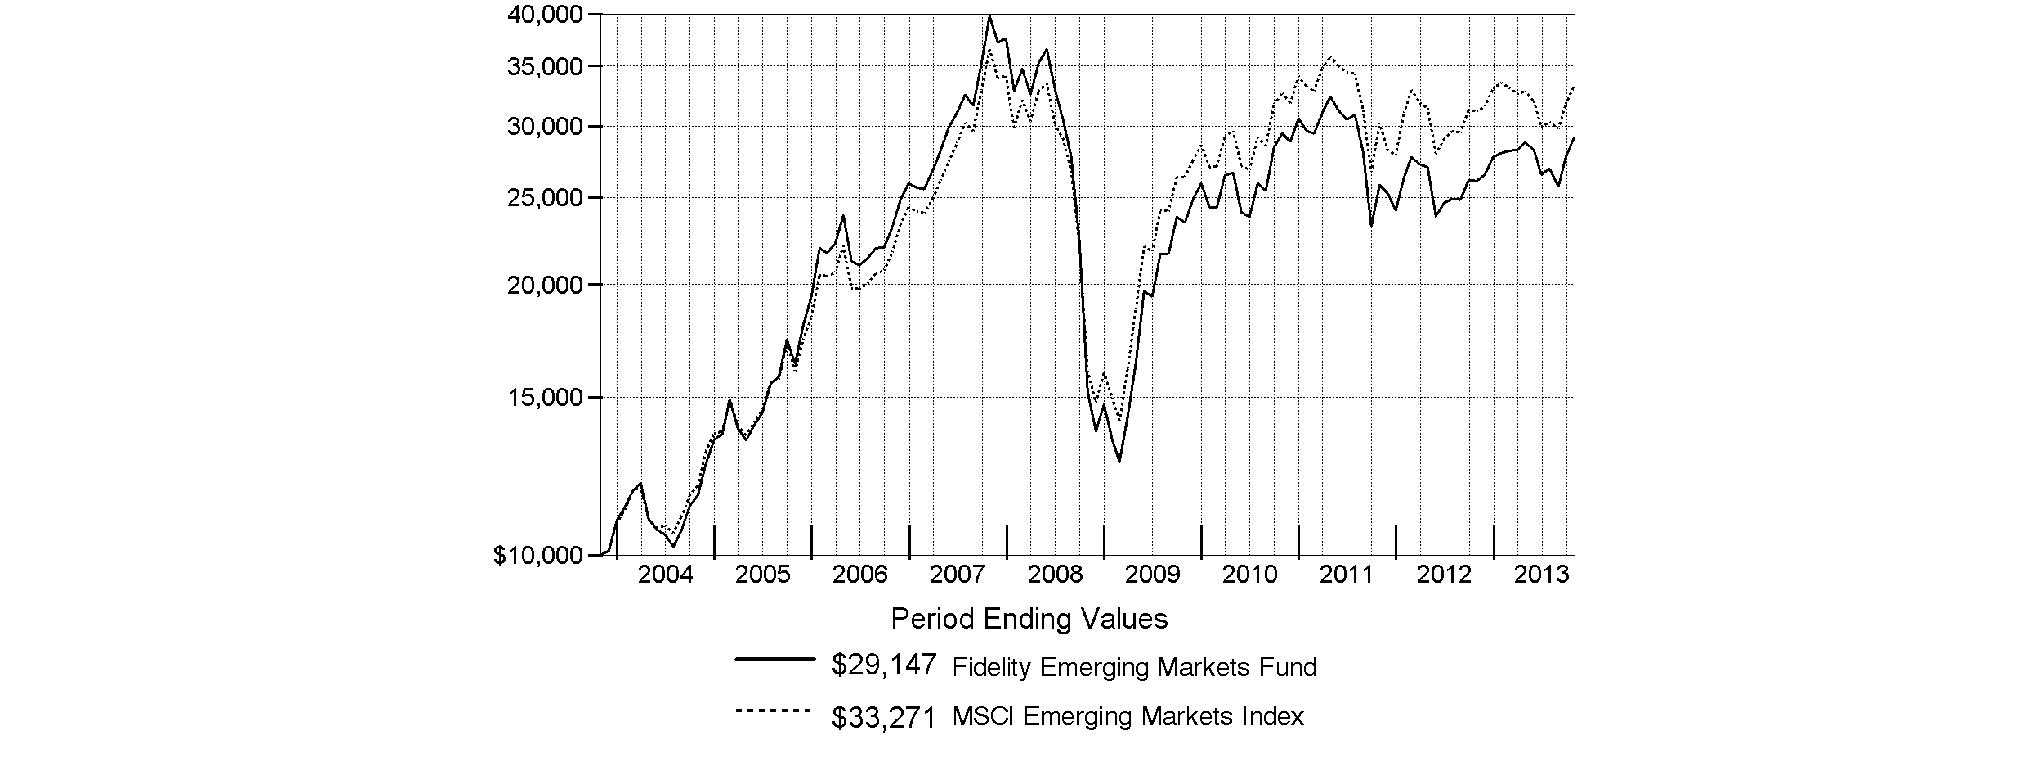
Annual Report
Fidelity Emerging Markets Fund
Market Recap: On balance, global equity markets remained upbeat for the 12-month period ending October 31, 2013. The MSCI® ACWI® (All Country World Index) Index gained 23.75% for the period, amid investor preference for higher-risk assets. The period was not without turbulence, however. In the spring and summer, central banks worldwide, especially in the U.S. and China, made clear their intentions to maintain accommodative monetary policies. That stance, combined with modest cyclical improvements around the globe and generally low valuations, underpinned the broad rally in equities. Europe (+32%) shone brightly, with most markets in the region - large and small - registering solid, index-beating gains. Another bright spot was Japan, which, despite a struggling yen and taking a second-half breather, posted a 34% result for the full year. The U.S. - by far the index's biggest constituent - also outperformed the global market with a roughly 28% advance. Meanwhile, Asia-Pacific ex Japan (+14%) lagged, hurt in part by a slowdown in Australia's mining industry as well as currency headwinds. Foreign-exchange and commodity weakness also curbed results in resource-heavy Canada and emerging markets (EM), both of which were up 7%. Country-level EM performance diverged meaningfully for the period, as evidenced by performance in Brazil (-1%), Russia (+12%), India (+1%) and China (+8%).
Comments from Sammy Simnegar, Portfolio Manager of Fidelity® Emerging Markets Fund: For the year, the fund's Retail Class shares returned 11.78%, handily besting the 6.90% gain of the MSCI® Emerging Markets Index. Versus the index, performance was lifted by a large overweighting in software & services, especially a non-index position in China-based Internet real estate portal SouFun Holdings. However, the largest relative contributor was Mexico-based telecommunication services provider America Movil. I'll also mention casino stocks Galaxy Entertainment Group, a Hong Kong company, and Sands China. Additionally, the fund benefited from underweighting the materials and energy sectors. Specifically, our results benefited from not owning energy provider Petroleo Brasileiro, and from selling our underweighted stake in metals miner Vale, two weak-performing, Brazil-based index components. Conversely, positioning in financials dampened performance, as did my picks in the media and automobiles/components segments. Automakers Kia Motors and Astra International - based in South Korea and Indonesia, respectively - were two of our largest detractors. Golden Eagle Retail Group, a China-based chain of department stores, also hurt. I sold a number of stocks mentioned here.
The views expressed above reflect those of the portfolio manager(s) only through the end of the period as stated on the cover of this report and do not necessarily represent the views of Fidelity or any other person in the Fidelity organization. Any such views are subject to change at any time based upon market or other conditions and Fidelity disclaims any responsibility to update such views. These views may not be relied on as investment advice and, because investment decisions for a Fidelity fund are based on numerous factors, may not be relied on as an indication of trading intent on behalf of any Fidelity fund.
Annual Report
Fidelity Emerging Markets Fund
As a shareholder of the Fund, you incur two types of costs: (1) transaction costs, including redemption fees and (2) ongoing costs, including management fees and other Fund expenses. This Example is intended to help you understand your ongoing costs (in dollars) of investing in the Fund and to compare these costs with the ongoing costs of investing in other mutual funds.
The Example is based on an investment of $1,000 invested at the beginning of the period and held for the entire period (May 1, 2013 to October 31, 2013).
Actual Expenses
The first line of the accompanying table for each class of the Fund provides information about actual account values and actual expenses. You may use the information in this line, together with the amount you invested, to estimate the expenses that you paid over the period. Simply divide your account value by $1,000.00 (for example, an $8,600 account value divided by $1,000.00 = 8.6), then multiply the result by the number in the first line for a class of the Fund under the heading entitled "Expenses Paid During Period" to estimate the expenses you paid on your account during this period. A small balance maintenance fee of $12.00 that is charged once a year may apply for certain accounts with a value of less than $2,000. This fee is not included in the table below. If it was, the estimate of expenses you paid during the period would be higher, and your ending account value lower, by this amount. In addition, the Fund, as a shareholder in the underlying Fidelity Central Funds, will indirectly bear its pro-rata share of the fees and expenses incurred by the underlying Fidelity Central Funds. These fees and expenses are not included in the Fund's annualized expense ratio used to calculate the expense estimate in the table below.
Hypothetical Example for Comparison Purposes
The second line of the accompanying table for each class of the Fund provides information about hypothetical account values and hypothetical expenses based on a Class' actual expense ratio and an assumed rate of return of 5% per year before expenses, which is not the Class' actual return. The hypothetical account values and expenses may not be used to estimate the actual ending account balance or expenses you paid for the period. You may use this information to compare the ongoing costs of investing in the Fund and other funds. To do so, compare this 5% hypothetical example with the 5% hypothetical examples that appear in the shareholder reports of the other funds. A small balance maintenance fee of $12.00 that is charged once a year may apply for certain accounts with a value of less than $2,000. This fee is not included in the table below. If it was, the estimate of expenses you paid during the period would be higher, and your ending account value lower, by this amount. In addition, the Fund, as a shareholder in the underlying Fidelity Central Funds, will indirectly bear its pro-rata share of the fees and expenses incurred by the underlying Fidelity Central Funds. These fees and expenses are not included in the Fund's annualized expense ratio used to calculate the expense estimate in the table below.
Please note that the expenses shown in the table are meant to highlight your ongoing costs only and do not reflect any transaction costs. Therefore, the second line of the table is useful in comparing ongoing costs only, and will not help you determine the relative total costs of owning different funds. In addition, if these transactional costs were included, your costs would have been higher.
| Annualized
Expense RatioB | Beginning
Account Value
May 1, 2013 | Ending
Account Value
October 31, 2013 | Expenses Paid
During Period*
May 1, 2013
to October 31, 2013 |
Emerging Markets | 1.07% | | | |
Actual | | $ 1,000.00 | $ 1,013.30 | $ 5.43 |
HypotheticalA | | $ 1,000.00 | $ 1,019.81 | $ 5.45 |
Class K | .85% | | | |
Actual | | $ 1,000.00 | $ 1,014.10 | $ 4.32 |
HypotheticalA | | $ 1,000.00 | $ 1,020.92 | $ 4.33 |
A 5% return per year before expenses
B Annualized expense ratio reflects expenses net of applicable fee waivers.
* Expenses are equal to each Class' annualized expense ratio, multiplied by the average account value over the period, multiplied by 184/365 (to reflect the one-half year period).
Annual Report
Fidelity Emerging Markets Fund
Investment Changes (Unaudited)
Geographic Diversification (% of fund's net assets) |
As of October 31, 2013 |
| Brazil | 11.7% | |
| India | 11.4% | |
| Korea (South) | 8.1% | |
| Cayman Islands | 7.6% | |
| South Africa | 6.8% | |
| Mexico | 6.1% | |
| Indonesia | 5.5% | |
| United States of America* | 4.2% | |
| Russia | 3.9% | |
| Other | 34.7% | |

* Includes Short-Term Investments and Net Other Assets (Liabilities). |
Percentages are based on country or territory of incorporation and are adjusted for the effect of futures contracts, if applicable. |
As of April 30, 2013 |
| Brazil | 11.8% | |
| India | 10.4% | |
| Korea (South) | 8.7% | |
| Indonesia | 7.6% | |
| Mexico | 7.2% | |
| South Africa | 7.0% | |
| United States of America* | 6.6% | |
| Philippines | 3.8% | |
| Cayman Islands | 3.7% | |
| Other | 33.2% | |

* Includes Short-Term Investments and Net Other Assets (Liabilities). |
Percentages are based on country or territory of incorporation and are adjusted for the effect of futures contracts, if applicable. |
Asset Allocation as of October 31, 2013 |
| % of fund's
net assets | % of fund's net assets
6 months ago |
Stocks | 99.6 | 99.2 |
Short-Term Investments and Net Other Assets (Liabilities) | 0.4 | 0.8 |
Top Ten Stocks as of October 31, 2013 |
| % of fund's
net assets | % of fund's net assets
6 months ago |
Samsung Electronics Co. Ltd. (Korea (South), Semiconductors & Semiconductor Equipment) | 4.6 | 4.9 |
Taiwan Semiconductor Manufacturing Co. Ltd. (Taiwan, Semiconductors & Semiconductor Equipment) | 2.6 | 2.8 |
Tencent Holdings Ltd. (Cayman Islands, Internet Software & Services) | 1.7 | 1.4 |
Hyundai Motor Co. (Korea (South), Automobiles) | 1.4 | 1.2 |
Itau Unibanco Holding SA sponsored ADR (Brazil, Commercial Banks) | 1.4 | 1.4 |
Sberbank (Savings Bank of the Russian Federation) (Russia, Commercial Banks) | 1.3 | 1.4 |
Naspers Ltd. Class N (South Africa, Media) | 1.2 | 1.1 |
Companhia de Bebidas das Americas (AmBev) (PN) sponsored ADR (Brazil, Beverages) | 1.1 | 1.4 |
Housing Development Finance Corp. Ltd. (India, Thrifts & Mortgage Finance) | 1.0 | 1.1 |
HDFC Bank Ltd. (India, Commercial Banks) | 0.9 | 0.9 |
| 17.2 | |
Market Sectors as of October 31, 2013 |
| % of fund's
net assets | % of fund's net assets
6 months ago |
Financials | 26.7 | 23.2 |
Consumer Discretionary | 20.6 | 18.9 |
Information Technology | 14.5 | 16.0 |
Industrials | 13.1 | 13.0 |
Consumer Staples | 11.2 | 14.2 |
Materials | 5.8 | 5.0 |
Health Care | 3.9 | 3.9 |
Energy | 2.9 | 3.0 |
Utilities | 0.5 | 0.0 |
Telecommunication Services | 0.4 | 2.0 |
Annual Report
Fidelity Emerging Markets Fund
Investments October 31, 2013
Showing Percentage of Net Assets
Common Stocks - 98.4% |
| Shares | | Value |
Australia - 0.4% |
Fortescue Metals Group Ltd. | 2,433,475 | | $ 11,982,994 |
Bailiwick of Jersey - 0.4% |
WPP PLC | 554,000 | | 11,769,758 |
Bermuda - 1.8% |
Brilliance China Automotive Holdings Ltd. | 8,460,000 | | 14,796,543 |
Cosan Ltd. Class A | 694,700 | | 10,948,472 |
Credicorp Ltd. | 125,832 | | 17,188,651 |
Jardine Matheson Holdings Ltd. | 150,400 | | 8,195,296 |
TOTAL BERMUDA | | 51,128,962 |
Brazil - 11.5% |
Anhanguera Educacional Participacoes SA | 1,932,400 | | 11,558,861 |
BB Seguridade Participacoes SA | 1,471,400 | | 16,072,296 |
BM&F Bovespa SA | 3,199,900 | | 18,040,683 |
BR Malls Participacoes SA | 1,631,700 | | 15,805,683 |
Brasil Insurance Participacoes e Administracao SA | 1,013,900 | | 9,232,908 |
BTG Pactual Participations Ltd. unit | 854,800 | | 11,435,745 |
CCR SA | 2,045,200 | | 17,008,337 |
Cetip SA - Mercados Organizado | 921,300 | | 10,215,647 |
Cielo SA | 676,280 | | 20,528,096 |
Companhia Brasileira de Distribuicao Grupo Pao de Acucar sponsored ADR (d) | 338,919 | | 17,088,296 |
Companhia de Bebidas das Americas (AmBev) (PN) sponsored ADR | 810,834 | | 30,163,025 |
Iguatemi Empresa de Shopping Centers SA | 1,134,900 | | 13,045,119 |
Itau Unibanco Holding SA sponsored ADR | 2,508,426 | | 38,654,845 |
Localiza Rent A Car SA | 809,261 | | 13,185,442 |
Multiplan Empreendimentos Imobiliarios SA | 552,567 | | 12,971,832 |
Odontoprev SA | 2,700,300 | | 11,161,851 |
Qualicorp SA (a) | 1,246,700 | | 11,675,639 |
Souza Cruz SA | 1,305,667 | | 14,122,092 |
Ultrapar Participacoes SA | 675,200 | | 17,993,679 |
Weg SA | 838,150 | | 10,887,494 |
TOTAL BRAZIL | | 320,847,570 |
British Virgin Islands - 0.4% |
Mail.Ru Group Ltd. GDR (e) | 303,200 | | 11,182,016 |
Cayman Islands - 7.6% |
51job, Inc. sponsored ADR (a) | 147,500 | | 11,298,500 |
Baidu.com, Inc. sponsored ADR (a) | 83,160 | | 13,380,444 |
Baoxin Auto Group Ltd. | 11,446,000 | | 11,795,891 |
Cimc Enric Holdings Ltd. | 9,406,000 | | 13,248,229 |
ENN Energy Holdings Ltd. | 2,382,000 | | 14,117,490 |
Eurasia Drilling Co. Ltd. GDR (Reg. S) | 284,391 | | 12,043,959 |
Greatview Aseptic Pack Co. Ltd. | 17,580,000 | | 11,065,446 |
Haitian International Holdings Ltd. | 4,654,000 | | 11,213,301 |
Hengdeli Holdings Ltd. | 38,020,000 | | 9,023,191 |
|
| Shares | | Value |
Lifestyle International Holdings Ltd. | 1,783,300 | | $ 3,887,240 |
New Oriental Education & Technology Group, Inc. sponsored ADR | 432,100 | | 11,325,341 |
Noah Holdings Ltd. sponsored ADR | 387,795 | | 7,480,566 |
Sands China Ltd. | 1,592,800 | | 11,319,912 |
Shenzhou International Group Holdings Ltd. | 3,157,000 | | 10,872,166 |
SouFun Holdings Ltd. ADR (d) | 254,313 | | 13,537,081 |
Tencent Holdings Ltd. | 855,400 | | 46,692,284 |
TOTAL CAYMAN ISLANDS | | 212,301,041 |
Chile - 0.3% |
Inversiones La Construccion SA | 577,897 | | 8,675,507 |
China - 3.2% |
China Merchants Bank Co. Ltd. (H Shares) | 9,169,959 | | 18,214,545 |
China Minsheng Banking Corp. Ltd. (H Shares) | 10,888,500 | | 12,485,330 |
China Pacific Insurance Group Co. Ltd. (H Shares) | 5,013,200 | | 18,105,198 |
China Vanke Co. Ltd. (B Shares) | 5,757,559 | | 9,750,645 |
Ping An Insurance (Group) Co. of China Ltd. (H Shares) | 2,809,000 | | 22,119,109 |
Travelsky Technology Ltd. (H Shares) | 10,892,000 | | 9,314,325 |
TOTAL CHINA | | 89,989,152 |
Colombia - 0.9% |
Cemex Latam Holdings SA | 1,216,187 | | 9,306,086 |
Grupo de Inversiones Suramerica SA | 739,510 | | 14,654,583 |
TOTAL COLOMBIA | | 23,960,669 |
Denmark - 0.3% |
Novo Nordisk A/S Series B sponsored ADR | 52,400 | | 8,733,508 |
Finland - 0.8% |
Kone Oyj (B Shares) | 111,120 | | 9,799,213 |
Nokian Tyres PLC | 219,300 | | 11,097,313 |
TOTAL FINLAND | | 20,896,526 |
France - 1.9% |
Bureau Veritas SA | 337,500 | | 10,191,272 |
Kering SA | 41,900 | | 9,520,496 |
LVMH Moet Hennessy - Louis Vuitton SA | 57,753 | | 11,119,124 |
Pernod Ricard SA | 84,016 | | 10,095,436 |
Sanofi SA sponsored ADR | 214,766 | | 11,485,686 |
TOTAL FRANCE | | 52,412,014 |
Hong Kong - 1.8% |
AIA Group Ltd. | 2,267,000 | | 11,506,056 |
China Overseas Land and Investment Ltd. | 5,803,000 | | 17,963,627 |
Far East Horizon Ltd. | 11,905,000 | | 8,706,481 |
Galaxy Entertainment Group Ltd. (a) | 1,460,000 | | 10,893,976 |
TOTAL HONG KONG | | 49,070,140 |
Common Stocks - continued |
| Shares | | Value |
India - 11.4% |
Axis Bank Ltd. | 758,960 | | $ 15,058,750 |
Bajaj Auto Ltd. | 393,876 | | 13,613,470 |
Bank of Baroda | 1,321,328 | | 13,784,918 |
Bharat Heavy Electricals Ltd. | 3,257,946 | | 7,459,694 |
CRISIL Ltd. | 364,734 | | 6,625,393 |
Exide Industries Ltd. (a) | 4,230,134 | | 8,566,804 |
Grasim Industries Ltd. sponsored GDR | 187,060 | | 8,553,318 |
HCL Technologies Ltd. | 605,779 | | 10,767,559 |
HDFC Bank Ltd. | 2,240,834 | | 24,885,100 |
Housing Development Finance Corp. Ltd. | 1,940,756 | | 26,928,525 |
ITC Ltd. | 3,755,543 | | 20,415,859 |
Larsen & Toubro Ltd. | 1,114,461 | | 17,609,222 |
Mahindra & Mahindra Ltd. | 1,097,481 | | 15,811,997 |
Maruti Suzuki India Ltd. | 337,950 | | 8,973,027 |
Mundra Port and SEZ Ltd. | 4,004,602 | | 9,455,238 |
Punjab National Bank | 273,831 | | 2,540,038 |
State Bank of India | 527,555 | | 15,381,742 |
Sun Pharmaceutical Industries Ltd. | 1,574,506 | | 15,554,967 |
Sun TV Ltd. | 1,817,236 | | 12,389,843 |
Tata Consultancy Services Ltd. | 655,801 | | 22,476,381 |
Tata Motors Ltd. | 2,731,686 | | 16,941,426 |
Titan Industries Ltd. | 3,045,964 | | 13,207,218 |
Zee Entertainment Enterprises Ltd. (a) | 2,396,184 | | 10,345,073 |
TOTAL INDIA | | 317,345,562 |
Indonesia - 5.5% |
PT ACE Hardware Indonesia Tbk | 196,126,500 | | 10,613,133 |
PT Astra International Tbk | 33,150,000 | | 19,556,118 |
PT Bank Central Asia Tbk | 18,758,000 | | 17,389,228 |
PT Bank Rakyat Indonesia Tbk | 24,433,500 | | 17,123,410 |
PT Global Mediacom Tbk | 70,247,000 | | 11,902,512 |
PT Gudang Garam Tbk | 3,611,000 | | 11,820,377 |
PT Indocement Tunggal Prakarsa Tbk | 7,022,500 | | 13,020,136 |
PT Jasa Marga Tbk | 22,097,000 | | 10,291,297 |
PT Kalbe Farma Tbk | 86,764,500 | | 10,006,055 |
PT Media Nusantara Citra Tbk | 41,852,000 | | 9,281,832 |
PT Semen Gresik (Persero) Tbk | 10,897,500 | | 13,872,549 |
PT Surya Citra Media Tbk | 42,748,000 | | 8,911,712 |
PT Tower Bersama Infrastructure Tbk | 1,777,865 | | 898,982 |
TOTAL INDONESIA | | 154,687,341 |
Ireland - 0.3% |
Dragon Oil PLC | 836,267 | | 7,897,727 |
Italy - 0.7% |
Pirelli & C SpA | 604,100 | | 8,513,850 |
Prada SpA | 1,056,300 | | 10,300,049 |
TOTAL ITALY | | 18,813,899 |
Japan - 0.4% |
Japan Tobacco, Inc. | 275,600 | | 9,972,223 |
|
| Shares | | Value |
Kenya - 0.4% |
Safaricom Ltd. | 89,086,800 | | $ 9,863,741 |
Korea (South) - 8.1% |
Hyundai Mobis | 83,335 | | 23,517,660 |
Hyundai Motor Co. | 166,768 | | 39,756,036 |
Kia Motors Corp. | 335,905 | | 19,528,616 |
LG Household & Health Care Ltd. | 25,926 | | 13,460,368 |
Samsung Electronics Co. Ltd. | 93,476 | | 129,035,006 |
TOTAL KOREA (SOUTH) | | 225,297,686 |
Luxembourg - 0.3% |
Brait SA | 1,922,900 | | 9,366,685 |
Malaysia - 0.5% |
Bumiputra-Commerce Holdings Bhd | 131,726 | | 311,736 |
Public Bank Bhd | 2,352,800 | | 13,640,501 |
TOTAL MALAYSIA | | 13,952,237 |
Mexico - 6.1% |
Alsea S.A.B. de CV | 2,574,906 | | 8,008,560 |
Banregio Grupo Financiero S.A.B. de CV | 1,717,293 | | 9,514,887 |
Coca-Cola FEMSA S.A.B. de CV Series L | 1,166,920 | | 14,222,432 |
Fomento Economico Mexicano S.A.B. de CV unit | 2,472,593 | | 23,129,777 |
Gruma S.A.B. de CV Series B (a) | 1,501,727 | | 10,292,163 |
Grupo Aeroportuario del Pacifico SA de CV Series B | 2,032,857 | | 10,576,201 |
Grupo Aeroportuario del Sureste SA de CV Series B | 990,200 | | 11,835,574 |
Grupo Financiero Banorte S.A.B. de CV Series O | 3,020,900 | | 19,282,267 |
Grupo Financiero Interacciones, SA de CV | 2,089,300 | | 9,768,135 |
Grupo Mexico SA de CV Series B | 5,968,913 | | 18,852,931 |
Grupo Televisa SA de CV | 3,637,757 | | 22,221,482 |
Mexichem S.A.B. de CV | 3,245,959 | | 13,556,290 |
TOTAL MEXICO | | 171,260,699 |
Netherlands - 0.4% |
Yandex NV (a) | 314,903 | | 11,607,325 |
Nigeria - 0.4% |
Guaranty Trust Bank PLC GDR (Reg. S) | 1,559,777 | | 12,166,261 |
Panama - 0.4% |
Copa Holdings SA Class A | 74,176 | | 11,092,279 |
Philippines - 3.1% |
Alliance Global Group, Inc. | 19,883,600 | | 12,123,866 |
DMCI Holdings, Inc. | 8,344,600 | | 10,002,320 |
LT Group, Inc. | 23,577,800 | | 9,067,755 |
Metropolitan Bank & Trust Co. | 5,704,738 | | 11,748,737 |
Security Bank Corp. | 3,987,250 | | 12,824,893 |
SM Investments Corp. | 808,502 | | 16,014,756 |
SM Prime Holdings, Inc. | 34,230,300 | | 15,192,344 |
TOTAL PHILIPPINES | | 86,974,671 |
Common Stocks - continued |
| Shares | | Value |
Russia - 3.9% |
Alrosa Co. Ltd. (a) | 8,128,200 | | $ 9,146,863 |
Magnit OJSC GDR (Reg. S) | 345,534 | | 22,200,560 |
Moscow Exchange MICEX-RTS OAO | 4,224,300 | | 8,067,737 |
Norilsk Nickel OJSC sponsored ADR | 919,287 | | 13,945,584 |
NOVATEK OAO GDR (Reg. S) | 146,700 | | 20,611,350 |
Sberbank (Savings Bank of the Russian Federation) | 11,147,000 | | 35,730,739 |
TOTAL RUSSIA | | 109,702,833 |
South Africa - 6.8% |
Aspen Pharmacare Holdings Ltd. | 541,590 | | 15,077,391 |
Barloworld Ltd. | 1,263,370 | | 11,326,440 |
Bidvest Group Ltd. | 614,500 | | 16,387,279 |
Capitec Bank Holdings Ltd. | 296,306 | | 6,316,472 |
Clicks Group Ltd. | 1,815,527 | | 11,312,286 |
Discovery Holdings Ltd. | 1,385,674 | | 11,732,765 |
Imperial Holdings Ltd. | 677,070 | | 14,386,157 |
Life Healthcare Group Holdings Ltd. | 3,611,464 | | 14,749,847 |
Mr Price Group Ltd. | 959,288 | | 15,114,490 |
Nampak Ltd. | 3,741,600 | | 12,374,162 |
Naspers Ltd. Class N | 360,312 | | 33,702,699 |
Shoprite Holdings Ltd. | 899,500 | | 16,468,993 |
Wilson Bayly Holmes-Ovcon Ltd. | 539,393 | | 9,456,135 |
TOTAL SOUTH AFRICA | | 188,405,116 |
Sweden - 0.6% |
Atlas Copco AB (A Shares) | 351,000 | | 9,739,092 |
Elekta AB (B Shares) | 512,800 | | 7,565,324 |
TOTAL SWEDEN | | 17,304,416 |
Switzerland - 1.9% |
Compagnie Financiere Richemont SA Series A | 101,698 | | 10,429,271 |
Schindler Holding AG (Reg.) | 71,090 | | 10,107,026 |
SGS SA (Reg.) | 4,100 | | 9,606,657 |
Swatch Group AG (Bearer) | 17,640 | | 11,285,634 |
Syngenta AG (Switzerland) | 25,829 | | 10,425,016 |
TOTAL SWITZERLAND | | 51,853,604 |
Taiwan - 2.6% |
Taiwan Semiconductor Manufacturing Co. Ltd. | 19,662,000 | | 72,328,946 |
Thailand - 3.1% |
Airports of Thailand PCL (For. Reg.) | 1,919,700 | | 13,075,547 |
BEC World PCL (For. Reg.) | 6,091,000 | | 11,399,221 |
Kasikornbank PCL (For. Reg.) | 3,088,500 | | 19,250,410 |
Minor International PCL (For. Reg.) | 15,052,300 | | 13,420,123 |
Siam Commercial Bank PCL (For. Reg.) | 3,278,600 | | 17,327,862 |
Thai Beverage PCL | 28,207,000 | | 12,375,475 |
TOTAL THAILAND | | 86,848,638 |
|
| Shares | | Value |
Togo - 0.3% |
Ecobank Transnational, Inc. | 109,026,650 | | $ 9,529,533 |
Turkey - 2.6% |
Anadolu Hayat Sigorta AS | 855,000 | | 2,102,968 |
Coca-Cola Icecek A/S | 425,327 | | 12,197,856 |
Enka Insaat ve Sanayi A/S | 3,537,349 | | 10,348,462 |
Koc Holding A/S | 3,164,000 | | 15,532,724 |
Tupras Turkiye Petrol Rafinelleri A/S | 593,472 | | 13,467,392 |
Turkiye Garanti Bankasi A/S | 4,592,395 | | 18,496,108 |
TOTAL TURKEY | | 72,145,510 |
United Kingdom - 3.5% |
Aberdeen Asset Management PLC | 1,421,522 | | 10,094,880 |
British American Tobacco PLC (United Kingdom) | 210,300 | | 11,602,731 |
Burberry Group PLC | 424,600 | | 10,450,336 |
Diageo PLC | 324,641 | | 10,348,737 |
InterContinental Hotel Group PLC | 338,000 | | 9,848,226 |
Intertek Group PLC | 209,818 | | 11,209,587 |
Prudential PLC | 590,180 | | 12,069,632 |
Rolls-Royce Group PLC | 549,500 | | 10,132,285 |
Standard Chartered PLC (United Kingdom) | 437,701 | | 10,523,638 |
TOTAL UNITED KINGDOM | | 96,280,052 |
United States of America - 3.8% |
BorgWarner, Inc. | 83,900 | | 8,652,607 |
Colgate-Palmolive Co. | 171,428 | | 11,096,534 |
Cummins, Inc. | 65,200 | | 8,281,704 |
FMC Corp. | 158,324 | | 11,519,654 |
Google, Inc. Class A (a) | 11,150 | | 11,490,967 |
MasterCard, Inc. Class A | 16,500 | | 11,832,150 |
Mead Johnson Nutrition Co. Class A | 130,188 | | 10,631,152 |
Philip Morris International, Inc. | 124,787 | | 11,121,017 |
Visa, Inc. Class A | 54,200 | | 10,659,514 |
Yahoo!, Inc. (a) | 320,300 | | 10,547,479 |
TOTAL UNITED STATES OF AMERICA | | 105,832,778 |
TOTAL COMMON STOCKS (Cost $2,434,587,446) |
2,743,479,619
|
Nonconvertible Preferred Stocks - 1.2% |
| | | |
Brazil - 0.2% |
Marcopolo SA (PN) | 1,875,000 | | 4,837,738 |
Colombia - 0.7% |
Banco Davivienda SA | 860,985 | | 11,292,641 |
Grupo Aval Acciones y Valores SA | 13,225,905 | | 9,190,715 |
TOTAL COLOMBIA | | 20,483,356 |
Germany - 0.3% |
Porsche Automobil Holding SE (Germany) | 92,000 | | 8,617,748 |
Nonconvertible Preferred Stocks - continued |
| Shares | | Value |
United Kingdom - 0.0% |
Rolls-Royce Group PLC Series C | 47,257,000 | | $ 75,772 |
TOTAL NONCONVERTIBLE PREFERRED STOCKS (Cost $36,206,353) |
34,014,614
|
Money Market Funds - 0.7% |
| | | |
Fidelity Cash Central Fund, 0.09% (b) | 8,417,046 | | 8,417,046 |
Fidelity Securities Lending Cash Central Fund, 0.09% (b)(c) | 10,705,636 | | 10,705,636 |
TOTAL MONEY MARKET FUNDS (Cost $19,122,682) |
19,122,682
|
TOTAL INVESTMENT PORTFOLIO - 100.3% (Cost $2,489,916,481) | | 2,796,616,915 |
NET OTHER ASSETS (LIABILITIES) - (0.3)% | | (7,910,431) |
NET ASSETS - 100% | $ 2,788,706,484 |
Legend |
(a) Non-income producing |
(b) Affiliated fund that is generally available only to investment companies and other accounts managed by Fidelity Investments. The rate quoted is the annualized seven-day yield of the fund at period end. A complete unaudited listing of the fund's holdings as of its most recent quarter end is available upon request. In addition, each Fidelity Central Fund's financial statements, which are not covered by the Fund's Report of Independent Registered Public Accounting Firm, are available on the SEC's website or upon request. |
(c) Investment made with cash collateral received from securities on loan. |
(d) Security or a portion of the security is on loan at period end. |
(e) Security exempt from registration under Rule 144A of the Securities Act of 1933. These securities may be resold in transactions exempt from registration, normally to qualified institutional buyers. At the end of the period, the value of these securities amounted to $11,182,016 or 0.4% of net assets. |
Affiliated Central Funds |
Information regarding fiscal year to date income earned by the Fund from investments in Fidelity Central Funds is as follows: |
Fund | Income earned |
Fidelity Cash Central Fund | $ 36,614 |
Fidelity Securities Lending Cash Central Fund | 270,382 |
Total | $ 306,996 |
Other Information |
Categorizations in the Schedule of Investments are based on country or territory of incorporation. |
The following is a summary of the inputs used, as of October 31, 2013, involving the Fund's assets and liabilities carried at fair value. The inputs or methodology used for valuing securities may not be an indication of the risk associated with investing in those securities. For more information on valuation inputs, and their aggregation into the levels used in the table below, please refer to the Investment Valuation section in the accompanying Notes to Financial Statements. |
Valuation Inputs at Reporting Date: |
Description | Total | Level 1 | Level 2 | Level 3 |
Investments in Securities: | | | | |
Equities: | | | | |
Consumer Discretionary | $ 578,246,742 | $ 551,457,090 | $ 26,789,652 | $ - |
Consumer Staples | 313,205,144 | 281,281,453 | 31,923,691 | - |
Energy | 82,962,579 | 82,962,579 | - | - |
Financials | 747,584,706 | 708,089,936 | 39,494,770 | - |
Health Care | 106,010,268 | 106,010,268 | - | - |
Industrials | 361,603,979 | 361,603,979 | - | - |
Information Technology | 405,379,573 | 333,050,627 | 72,328,946 | - |
Materials | 157,621,029 | 147,196,013 | 10,425,016 | - |
Telecommunication Services | 10,762,723 | 10,762,723 | - | - |
Utilities | 14,117,490 | 14,117,490 | - | - |
Money Market Funds | 19,122,682 | 19,122,682 | - | - |
Total Investments in Securities: | $ 2,796,616,915 | $ 2,615,654,840 | $ 180,962,075 | $ - |
See accompanying notes which are an integral part of the financial statements.
Annual Report
Fidelity Emerging Markets Fund
Statement of Assets and Liabilities
| October 31, 2013 |
| | |
Assets | | |
Investment in securities, at value (including securities loaned of $10,522,555) - See accompanying schedule: Unaffiliated issuers (cost $2,470,793,799) | $ 2,777,494,233 | |
Fidelity Central Funds (cost $19,122,682) | 19,122,682 | |
Total Investments (cost $2,489,916,481) | | $ 2,796,616,915 |
Cash | | 1,261,805 |
Foreign currency held at value (cost $43,538) | | 36,762 |
Receivable for investments sold | | 74,435,952 |
Receivable for fund shares sold | | 1,989,699 |
Dividends receivable | | 3,281,460 |
Distributions receivable from Fidelity Central Funds | | 5,056 |
Prepaid expenses | | 7,786 |
Other receivables | | 1,860,624 |
Total assets | | 2,879,496,059 |
| | |
Liabilities | | |
Payable for investments purchased | $ 73,356,472 | |
Payable for fund shares redeemed | 2,633,827 | |
Accrued management fee | 1,613,619 | |
Other affiliated payables | 607,666 | |
Other payables and accrued expenses | 1,872,355 | |
Collateral on securities loaned, at value | 10,705,636 | |
Total liabilities | | 90,789,575 |
| | |
Net Assets | | $ 2,788,706,484 |
Net Assets consist of: | | |
Paid in capital | | $ 2,536,971,685 |
Distributions in excess of net investment income | | (481) |
Accumulated undistributed net realized gain (loss) on investments and foreign currency transactions | | (52,900,375) |
Net unrealized appreciation (depreciation) on investments and assets and liabilities in foreign currencies | | 304,635,655 |
Net Assets | | $ 2,788,706,484 |
Statement of Assets and Liabilities - continued
| October 31, 2013 |
| | |
Emerging Markets:
Net Asset Value, offering price and redemption price per share ($2,241,337,971 ÷ 91,759,080 shares) | | $ 24.43 |
| | |
Class K:
Net Asset Value, offering price and redemption price per share ($547,368,513 ÷ 22,411,213 shares) | | $ 24.42 |
See accompanying notes which are an integral part of the financial statements.
Annual Report
Fidelity Emerging Markets Fund
Financial Statements - continued
Statement of Operations
| Year ended October 31, 2013 |
| | |
Investment Income | | |
Dividends | | $ 55,957,180 |
Interest | | 1,953 |
Income from Fidelity Central Funds | | 306,996 |
Income before foreign taxes withheld | | 56,266,129 |
Less foreign taxes withheld | | (4,553,424) |
Total income | | 51,712,705 |
| | |
Expenses | | |
Management fee | $ 19,368,515 | |
Transfer agent fees | 6,081,451 | |
Accounting and security lending fees | 1,197,410 | |
Custodian fees and expenses | 1,643,748 | |
Independent trustees' compensation | 16,067 | |
Registration fees | 87,343 | |
Audit | 118,841 | |
Legal | 7,433 | |
Interest | 4,456 | |
Miscellaneous | 24,853 | |
Total expenses before reductions | 28,550,117 | |
Expense reductions | (1,393,042) | 27,157,075 |
Net investment income (loss) | | 24,555,630 |
Realized and Unrealized Gain (Loss) Net realized gain (loss) on: | | |
Investment securities: | | |
Unaffiliated issuers | 276,385,126 | |
Foreign currency transactions | (1,362,506) | |
Total net realized gain (loss) | | 275,022,620 |
Change in net unrealized appreciation (depreciation) on: Investment securities (net of increase in deferred foreign taxes of $1,332,927) | 15,751,729 | |
Assets and liabilities in foreign currencies | (384,967) | |
Total change in net unrealized appreciation (depreciation) | | 15,366,762 |
Net gain (loss) | | 290,389,382 |
Net increase (decrease) in net assets resulting from operations | | $ 314,945,012 |
Statement of Changes in Net Assets
| Year ended
October 31,
2013 | Year ended
October 31,
2012 |
Increase (Decrease) in Net Assets | | |
Operations | | |
Net investment income (loss) | $ 24,555,630 | $ 47,729,874 |
Net realized gain (loss) | 275,022,620 | 21,976,330 |
Change in net unrealized appreciation (depreciation) | 15,366,762 | (38,586,040) |
Net increase (decrease) in net assets resulting from operations | 314,945,012 | 31,120,164 |
Distributions to shareholders from net investment income | (39,208,001) | (46,903,179) |
Share transactions - net increase (decrease) | (299,270,748) | (578,640,528) |
Redemption fees | 565,621 | 392,465 |
Total increase (decrease) in net assets | (22,968,116) | (594,031,078) |
| | |
Net Assets | | |
Beginning of period | 2,811,674,600 | 3,405,705,678 |
End of period (including distributions in excess of net investment income of $481 and undistributed net investment income of $34,119,316, respectively) | $ 2,788,706,484 | $ 2,811,674,600 |
See accompanying notes which are an integral part of the financial statements.
Annual Report
Financial Highlights - Emerging Markets
Years ended October 31, | 2013 | 2012 | 2011 | 2010 | 2009 |
Selected Per-Share Data | | | | | |
Net asset value, beginning of period | $ 22.15 | $ 22.23 | $ 25.72 | $ 20.68 | $ 13.71 |
Income from Investment Operations | | | | | |
Net investment income (loss) B | .20 | .33 | .35 | .23 | .17 |
Net realized and unrealized gain (loss) | 2.38 | (.11) | (3.48) | 5.05 | 7.03 |
Total from investment operations | 2.58 | .22 | (3.13) | 5.28 | 7.20 |
Distributions from net investment income | (.30) | (.30) | (.24) | (.12) | (.24) |
Distributions from net realized gain | - | - | (.13) | (.14) | - |
Total distributions | (.30) | (.30) | (.37) | (.25) G | (.24) |
Redemption fees added to paid in capital B | - F | - F | .01 | .01 | .01 |
Net asset value, end of period | $ 24.43 | $ 22.15 | $ 22.23 | $ 25.72 | $ 20.68 |
Total Return A | 11.78% | 1.03% | (12.33)% | 25.76% | 53.95% |
Ratios to Average Net Assets C, E | | | | | |
Expenses before reductions | 1.08% | 1.09% | 1.07% | 1.14% | 1.16% |
Expenses net of fee waivers, if any | 1.08% | 1.09% | 1.07% | 1.14% | 1.16% |
Expenses net of all reductions | 1.03% | 1.03% | 1.01% | 1.09% | 1.10% |
Net investment income (loss) | .85% | 1.50% | 1.38% | 1.00% | 1.09% |
Supplemental Data | | | | | |
Net assets, end of period (000 omitted) | $ 2,241,338 | $ 2,203,756 | $ 2,907,884 | $ 3,975,342 | $ 3,649,582 |
Portfolio turnover rate D | 119% | 176% | 122% | 85% | 88% |
ATotal returns would have been lower if certain expenses had not been reduced during the applicable periods shown. BCalculated based on average shares outstanding during the period. CFees and expenses of any underlying Fidelity Central Funds are not included in the Fund's expense ratio. The Fund indirectly bears its proportionate share of the expenses of any underlying Fidelity Central Funds. DAmount does not include the portfolio activity of any underlying Fidelity Central Funds. EExpense ratios reflect operating expenses of the class. Expenses before reductions do not reflect amounts reimbursed by the investment adviser or reductions from brokerage service arrangements or reductions from other expense offset arrangements and do not represent the amount paid by the class during periods when reimbursements or reductions occur. Expenses net of fee waivers reflect expenses after reimbursement by the investment adviser but prior to reductions from brokerage service arrangements or other expense offset arrangements. Expenses net of all reductions represent the net expenses paid by the class. FAmount represents less than $.01 per share. GTotal distributions of $.25 per share is comprised of distributions from net investment income of $.116 and distributions from net realized gain of $.135 per share. |
Financial Highlights - Class K
Years ended October 31, | 2013 | 2012 | 2011 | 2010 | 2009 |
Selected Per-Share Data | | | | | |
Net asset value, beginning of period | $ 22.15 | $ 22.23 | $ 25.75 | $ 20.69 | $ 13.72 |
Income from Investment Operations | | | | | |
Net investment income (loss) B | .25 | .37 | .40 | .28 | .22 |
Net realized and unrealized gain (loss) | 2.38 | (.10) | (3.48) | 5.05 | 7.02 |
Total from investment operations | 2.63 | .27 | (3.08) | 5.33 | 7.24 |
Distributions from net investment income | (.36) | (.35) | (.32) | (.15) | (.28) |
Distributions from net realized gain | - | - | (.13) | (.14) | - |
Total distributions | (.36) | (.35) | (.45) | (.28) G | (.28) |
Redemption fees added to paid in capital B | - F | - F | .01 | .01 | .01 |
Net asset value, end of period | $ 24.42 | $ 22.15 | $ 22.23 | $ 25.75 | $ 20.69 |
Total Return A | 12.01% | 1.25% | (12.17)% | 26.03% | 54.44% |
Ratios to Average Net Assets C, E | | | | | |
Expenses before reductions | .87% | .87% | .87% | .90% | .91% |
Expenses net of fee waivers, if any | .87% | .87% | .87% | .90% | .91% |
Expenses net of all reductions | .82% | .81% | .80% | .84% | .84% |
Net investment income (loss) | 1.07% | 1.72% | 1.58% | 1.24% | 1.35% |
Supplemental Data | | | | | |
Net assets, end of period (000 omitted) | $ 547,369 | $ 607,919 | $ 497,821 | $ 888,629 | $ 270,075 |
Portfolio turnover rate D | 119% | 176% | 122% | 85% | 88% |
ATotal returns would have been lower if certain expenses had not been reduced during the applicable periods shown. BCalculated based on average shares outstanding during the period. CFees and expenses of any underlying Fidelity Central Funds are not included in the Fund's expense ratio. The Fund indirectly bears its proportionate share of the expenses of any underlying Fidelity Central Funds. DAmount does not include the portfolio activity of any underlying Fidelity Central Funds. EExpense ratios reflect operating expenses of the class. Expenses before reductions do not reflect amounts reimbursed by the investment adviser or reductions from brokerage service arrangements or reductions from other expense offset arrangements and do not represent the amount paid by the class during periods when reimbursements or reductions occur. Expense ratios before reductions for start-up periods may not be representative of longer-term operating periods. Expenses net of fee waivers reflect expenses after reimbursement by the investment adviser but prior to reductions from brokerage service arrangements or other expense offset arrangements. Expenses net of all reductions represent the net expenses paid by the class. FAmount represents less than $.01 per share. GTotal distributions of $.28 per share is comprised of distributions from net investment income of $.148 and distributions from net realized gain of $.135 per share. |
See accompanying notes which are an integral part of the financial statements.
Annual Report
Notes to Financial Statements
For the period ended October 31, 2013
1. Organization.
Fidelity Emerging Markets Fund (the Fund) is a fund of Fidelity Investment Trust (the Trust) and is authorized to issue an unlimited number of shares. The Trust is registered under the Investment Company Act of 1940, as amended (the 1940 Act), as an open-end management investment company organized as a Massachusetts business trust. The Fund offers Emerging Markets and Class K shares, each of which has equal rights as to assets and voting privileges. The Fund's investments in emerging markets can be subject to social, economic, regulatory and political uncertainties and can be extremely volatile.
2. Investments in Fidelity Central Funds.
The Fund invests in Fidelity Central Funds, which are open-end investment companies generally available only to other investment companies and accounts managed by Fidelity Management & Research Company (FMR) and its affiliates. The Fund's Schedule of Investments lists each of the Fidelity Central Funds held as of period end, if any, as an investment of the Fund, but does not include the underlying holdings of each Fidelity Central Fund. As an Investing Fund, the Fund indirectly bears its proportionate share of the expenses of the underlying Fidelity Central Funds.
The Money Market Central Funds seek preservation of capital and current income and are managed by Fidelity Investments Money Management, Inc. (FIMM), an affiliate of FMR.
A complete unaudited list of holdings for each Fidelity Central Fund is available upon request or at the Securities and Exchange Commission (the SEC) website at www.sec.gov. In addition, the financial statements of the Fidelity Central Funds, which are not covered by the Fund's Report of Independent Registered Public Accounting Firm, are available on the SEC website or upon request.
3. Significant Accounting Policies.
The financial statements have been prepared in conformity with accounting principles generally accepted in the United States of America (GAAP), which require management to make certain estimates and assumptions at the date of the financial statements. Actual results could differ from those estimates. Subsequent events, if any, through the date that the financial statements were issued have been evaluated in the preparation of the financial statements. The following summarizes the significant accounting policies of the Fund:
Investment Valuation. Investments are valued as of 4:00 p.m. Eastern time on the last calendar day of the period. In accordance with valuation policies and procedures approved by the Board of Trustees (the Board), the Fund attempts to obtain prices from one or more third party pricing vendors or brokers to value its investments. When current market prices, quotations or currency exchange rates are not readily available or reliable, investments will be fair valued in good faith by the FMR Fair Value Committee (the Committee), in accordance with procedures adopted by the Board. Factors used in determining fair value vary by investment type and may include market or investment specific events. The frequency with which these procedures are used cannot be predicted and they may be utilized to a significant extent. The Committee oversees the Fund's valuation policies and procedures and is responsible for approving and reporting to the Board all fair value determinations.
The Fund categorizes the inputs to valuation techniques used to value its investments into a disclosure hierarchy consisting of three levels as shown below:
Level 1 - quoted prices in active markets for identical investments
Level 2 - other significant observable inputs (including quoted prices for similar investments, interest rates, prepayment speeds, etc.)
Level 3 - unobservable inputs (including the Fund's own assumptions based on the best information available)
Valuation techniques used to value the Fund's investments by major category are as follows:
Equity securities, including restricted securities, for which market quotations are readily available, are valued at the last reported sale price or official closing price as reported by a third party pricing vendor on the primary market or exchange on which they are traded and are categorized as Level 1 in the hierarchy. In the event there were no sales during the day or closing prices are not available, securities are valued at the last quoted bid price or may be valued using the last available price and are generally categorized as Level 2 in the hierarchy. For foreign equity securities, when market or security specific events arise, comparisons to the valuation of American Depositary Receipts (ADRs), futures contracts, Exchange-Traded Funds (ETFs) and certain indexes as well as quoted prices for similar securities may be used and would be categorized as Level 2 in the hierarchy. Utilizing these techniques may result in transfers between Level 1 and Level 2. For equity securities, including restricted securities, where observable inputs are limited, assumptions about market activity and risk are used and these securities may be categorized as Level 3 in the hierarchy.
Investments in open-end mutual funds, including the Fidelity Central Funds, are valued at their closing net asset value (NAV) each business day and are categorized as Level 1 in the hierarchy.
Annual Report
3. Significant Accounting Policies - continued
Investment Valuation - continued
Changes in valuation techniques may result in transfers in or out of an assigned level within the disclosure hierarchy. The aggregate value of investments by input level, as of October 31, 2013, is included at the end of the Fund's Schedule of Investments.
Foreign Currency. The Fund may use foreign currency contracts to facilitate transactions in foreign-denominated securities. Gains and losses from these transactions may arise from changes in the value of the foreign currency or if the counterparties do not perform under the contracts' terms.
Foreign-denominated assets, including investment securities, and liabilities are translated into U.S. dollars at the exchange rates at period end. Purchases and sales of investment securities, income and dividends received and expenses denominated in foreign currencies are translated into U.S. dollars at the exchange rate in effect on the transaction date.
The effects of exchange rate fluctuations on investments are included with the net realized and unrealized gain (loss) on investment securities. Other foreign currency transactions resulting in realized and unrealized gain (loss) are disclosed separately.
Investment Transactions and Income. For financial reporting purposes, the Fund's investment holdings and NAV include trades executed through the end of the last business day of the period. The NAV per share for processing shareholder transactions is calculated as of the close of business of the New York Stock Exchange (NYSE), normally 4:00 p.m. Eastern time and includes trades executed through the end of the prior business day. Gains and losses on securities sold are determined on the basis of identified cost and may include proceeds received from litigation. Dividend income is recorded on the ex-dividend date, except for certain dividends from foreign securities where the ex-dividend date may have passed, which are recorded as soon as the Fund is informed of the ex-dividend date. Non-cash dividends included in dividend income, if any, are recorded at the fair market value of the securities received. Interest income and distributions from the Fidelity Central Funds are accrued as earned. Interest income includes coupon interest and amortization of premium and accretion of discount on debt securities. Investment income is recorded net of foreign taxes withheld where recovery of such taxes is uncertain.
Class Allocations and Expenses. Investment income, realized and unrealized capital gains and losses, common expenses of the Fund, and certain fund-level expense reductions, if any, are allocated daily on a pro-rata basis to each class based on the relative net assets of each class to the total net assets of the Fund. Each class differs with respect to transfer agent fees incurred. Certain expense reductions may also differ by class. For the reporting period, the allocated portion of income and expenses to each class as a percent of its average net assets may vary due to the timing of recording these transactions in relation to fluctuating net assets of the classes. Expenses directly attributable to a fund are charged to that fund. Expenses attributable to more than one fund are allocated among the respective funds on the basis of relative net assets or other appropriate methods. Expense estimates are accrued in the period to which they relate and adjustments are made when actual amounts are known.
Income Tax Information and Distributions to Shareholders. Each year, the Fund intends to qualify as a regulated investment company under Subchapter M of the Internal Revenue Code, including distributing substantially all of its taxable income and realized gains. As a result, no provision for U.S. Federal income taxes is required. As of October 31, 2013, the Fund did not have any unrecognized tax benefits in the financial statements; nor is the Fund aware of any tax positions for which it is reasonably possible that the total amounts of unrecognized tax benefits will significantly change in the next twelve months. The Fund files a U.S. federal tax return, in addition to state and local tax returns as required. The Fund's federal income tax returns are subject to examination by the Internal Revenue Service (IRS) for a period of three fiscal years after they are filed. State and local tax returns may be subject to examination for an additional fiscal year depending on the jurisdiction. Foreign taxes are provided for based on the Fund's understanding of the tax rules and rates that exist in the foreign markets in which it invests. The Fund is subject to a tax imposed on capital gains by certain countries in which it invests. An estimated deferred tax liability for net unrealized appreciation on the applicable securities is included in Other payables and accrued expenses on the Statement of Assets & Liabilities.
Distributions are declared and recorded on the ex-dividend date. Income dividends and capital gain distributions are declared separately for each class. Income and capital gain distributions are determined in accordance with income tax regulations, which may differ from GAAP. In addition, the fund claimed a portion of the payment made to redeeming shareholders as a distribution for income tax purposes.
Capital accounts within the financial statements are adjusted for permanent book-tax differences. These adjustments have no impact on net assets or the results of operations. Temporary book-tax differences will reverse in a subsequent period.
Book-tax differences are primarily due to foreign currency transactions, passive foreign investment companies (PFIC), deferred trustees compensation, capital loss carryforwards and losses deferred due to wash sales.
The federal tax cost of investment securities and unrealized appreciation (depreciation) as of period end were as follows:
Gross unrealized appreciation | $ 371,097,001 |
Gross unrealized depreciation | (80,713,474) |
Net unrealized appreciation (depreciation) on securities and other investments | $ 290,383,527 |
| |
Tax Cost | $ 2,506,233,388 |
Annual Report
Notes to Financial Statements - continued
3. Significant Accounting Policies - continued
Income Tax Information and Distributions to Shareholders - continued
The tax-based components of distributable earnings as of period end were as follows:
Capital loss carryforward | $ (36,593,468) |
Net unrealized appreciation (depreciation) | $ 288,328,748 |
Capital loss carryforwards are only available to offset future capital gains of the Fund to the extent provided by regulations and may be limited. Under the Regulated Investment Company Modernization Act of 2010 (the Act), the Fund is permitted to carry forward capital losses incurred in taxable years beginning after December 22, 2010 for an unlimited period and such capital losses are required to be used prior to any losses that expire. The capital loss carryforward information presented below, including any applicable limitation, is estimated as of fiscal period end and is subject to adjustment.
Fiscal year of expiration | |
2017 | $ (36,593,468) |
The tax character of distributions paid was as follows:
| October 31, 2013 | October 31, 2012 |
Ordinary Income | $ 39,208,001 | $ 46,903,179 |
Short-Term Trading (Redemption) Fees. Shares held by investors in the Fund less than 90 days may have been subject to a redemption fee equal to 1.50% of the net asset value of shares redeemed. All redemption fees, which reduce the proceeds of the shareholder redemption, are retained by the Fund and accounted for as an addition to paid in capital.
Restricted Securities. The Fund may invest in securities that are subject to legal or contractual restrictions on resale. These securities generally may be resold in transactions exempt from registration or to the public if the securities are registered. Disposal of these securities may involve time-consuming negotiations and expense, and prompt sale at an acceptable price may be difficult. Information regarding restricted securities is included at the end of the Fund's Schedule of Investments.
4. Purchases and Sales of Investments.
Purchases and sales of securities, other than short-term securities, aggregated $3,246,813,173 and $3,529,292,093, respectively.
5. Fees and Other Transactions with Affiliates.
Management Fee. FMR and its affiliates provide the Fund with investment management related services for which the Fund pays a monthly management fee. The management fee is the sum of an individual fund fee rate that is based on an annual rate of .45% of the Fund's average net assets and an annualized group fee rate that averaged .25% during the period. The group fee rate is based upon the average net assets of all the mutual funds advised by FMR, including any mutual funds previously advised by FMR that are currently advised by Fidelity SelectCo, LLC, an affiliate of FMR. The group fee rate decreases as assets under management increase and increases as assets under management decrease. For the reporting period, the total annual management fee rate was .70% of the Fund's average net assets.
Transfer Agent Fees. Fidelity Investments Institutional Operations Company, Inc., (FIIOC), an affiliate of FMR, is the transfer, dividend disbursing and shareholder servicing agent for each class of the Fund. FIIOC receives account fees and asset-based fees that vary according to the account size and type of account of the shareholders of Emerging Markets. FIIOC receives an asset-based fee of Class K's average net assets. FIIOC pays for typesetting, printing and mailing of shareholder reports, except proxy statements.
For the period, transfer agent fees for each class were as follows:
| Amount | % of
Average
Net Assets |
Emerging Markets | $ 5,795,054 | .27 |
Class K | 286,397 | .05 |
| $ 6,081,451 | |
Annual Report
5. Fees and Other Transactions with Affiliates - continued
Accounting and Security Lending Fees. Fidelity Service Company, Inc. (FSC), an affiliate of FMR, maintains the Fund's accounting records. The accounting fee is based on the level of average net assets for each month. Under a separate contract, FSC administers the security lending program. The security lending fee is based on the number and duration of lending transactions.
Brokerage Commissions. The Fund placed a portion of its portfolio transactions with brokerage firms which are affiliates of the investment adviser. Brokerage commissions are included in net realized gain (loss) and change in net unrealized appreciation (depreciation) in the Statement of Operations. The commissions paid to these affiliated firms were $10,494 for the period.
Interfund Lending Program. Pursuant to an Exemptive Order issued by the SEC, the Fund, along with other registered investment companies having management contracts with FMR, may participate in an interfund lending program. This program provides an alternative credit facility allowing the funds to borrow from, or lend money to, other participating affiliated funds. At period end, there were no interfund loans outstanding. The Fund's activity in this program during the period for which loans were outstanding was as follows:
Borrower or Lender | Average Loan
Balance | Weighted Average
Interest Rate | Interest Expense |
Borrower | $ 18,337,423 | .34% | $ 4,456 |
6. Committed Line of Credit.
The Fund participates with other funds managed by FMR or an affiliate in a $4.25 billion credit facility (the "line of credit") to be utilized for temporary or emergency purposes to fund shareholder redemptions or for other short-term liquidity purposes. The Fund has agreed to pay commitment fees on its pro-rata portion of the line of credit, which amounted to $6,070 and is reflected in Miscellaneous expenses on the Statement of Operations. During the period, there were no borrowings on this line of credit.
7. Security Lending.
The Fund lends portfolio securities through a lending agent from time to time in order to earn additional income. For equity securities, a lending agent is used and may loan securities to certain qualified borrowers, including Fidelity Capital Markets (FCM), a broker-dealer affiliated with the Fund. On the settlement date of the loan, the Fund receives collateral (in the form of U.S. Treasury obligations, letters of credit and/or cash) against the loaned securities and maintains collateral in an amount not less than 100% of the market value of the loaned securities during the period of the loan. The market value of the loaned securities is determined at the close of business of the Fund and any additional required collateral is delivered to the Fund on the next business day. If the borrower defaults on its obligation to return the securities loaned because of insolvency or other reasons, the Fund may apply collateral received from the borrower against the obligation. The Fund may experience delays and costs in recovering the securities loaned. Any cash collateral received is invested the Fidelity Securities Lending Cash Central Fund. The value of loaned securities and cash collateral at period end are disclosed on the Fund's Statement of Assets and Liabilities. At period end, there were no security loans outstanding with FCM. Security lending income represents the income earned on investing cash collateral, less rebates paid to borrowers and any lending agent fees associated with the loan, plus any premium payments received for lending certain types of securities. Security lending income is presented in the Statement of Operations as a component of income from Fidelity Central Funds. Total security lending income during the period amounted to $270,382, including $840 from securities loaned to FCM.
8. Expense Reductions.
Commissions paid to certain brokers with whom FMR, or its affiliates, places trades on behalf of the Fund include an amount in addition to trade execution, which may be rebated back to the Fund to offset certain expenses. This amount totaled $1,353,191 for the period. Through arrangements with the Fund's custodian, credits realized as a result of uninvested cash balances were used to reduce the Fund's expenses. During the period, these credits reduced the Fund's custody expenses by $350.
In addition, FMR reimbursed a portion of the Fund's operating expenses during the period in the amount of $39,501.
9. Distributions to Shareholders.
Distributions to shareholders of each class were as follows:
Years ended October 31, | 2013 | 2012 |
From net investment income | | |
Emerging Markets | $ 29,610,169 | $ 38,359,433 |
Class K | 9,597,832 | 8,543,746 |
Total | $ 39,208,001 | $ 46,903,179 |
Annual Report
Notes to Financial Statements - continued
10. Share Transactions.
Transactions for each class of shares were as follows:
| Shares | Dollars |
Years ended October 31, | 2013 | 2012 | 2013 | 2012 |
Emerging Markets | | | | |
Shares sold | 23,439,766 | 17,560,683 | $ 534,752,122 | $ 382,055,836 |
Reinvestment of distributions | 1,145,115 | 1,697,255 | 25,804,455 | 36,745,572 |
Shares redeemed | (32,317,744) | (50,595,892) | (744,356,372) | (1,110,238,720) |
Net increase (decrease) | (7,732,863) | (31,337,954) | $ (183,799,795) | $ (691,437,312) |
Class K | | | | |
Shares sold | 6,249,509 | 14,677,576 | $ 144,545,998 | $ 321,820,048 |
Reinvestment of distributions | 426,903 | 395,361 | 9,597,831 | 8,543,746 |
Shares redeemed | (11,706,525) | (10,025,395) | (269,614,782) | (217,567,010) |
Net increase (decrease) | (5,030,113) | 5,047,542 | $ (115,470,953) | $ 112,796,784 |
11. Other.
The Fund's organizational documents provide former and current trustees and officers with a limited indemnification against liabilities arising in connection with the performance of their duties to the Fund. In the normal course of business, the Fund may also enter into contracts that provide general indemnifications. The Fund's maximum exposure under these arrangements is unknown as this would be dependent on future claims that may be made against the Fund. The risk of material loss from such claims is considered remote.
Annual Report
Fidelity Europe Capital Appreciation Fund
Average annual total return reflects the change in the value of an investment, assuming reinvestment of the fund's distributions from dividend income and capital gains (the profits earned upon the sale of securities that have grown in value, if any) and assuming a constant rate of performance each year. The $10,000 table and the fund's returns do not reflect the deduction of taxes that a shareholder would pay on fund distributions or the redemption of fund shares. During periods of reimbursement by Fidelity, a fund's total return will be greater than it would be had the reimbursement not occurred. How a fund did yesterday is no guarantee of how it will do tomorrow.
Average Annual Total Returns
Periods ended October 31, 2013 | Past 1
year | Past 5
years | Past 10
years |
Fidelity Europe Capital Appreciation Fund | 28.47% | 12.63% | 8.41% |
$10,000 Over 10 Years
Let's say hypothetically that $10,000 was invested in Fidelity Europe Capital Appreciation Fund on October 31, 2003. The chart shows how the value of your investment would have changed, and also shows how the MSCI Europe Index performed over the same period.
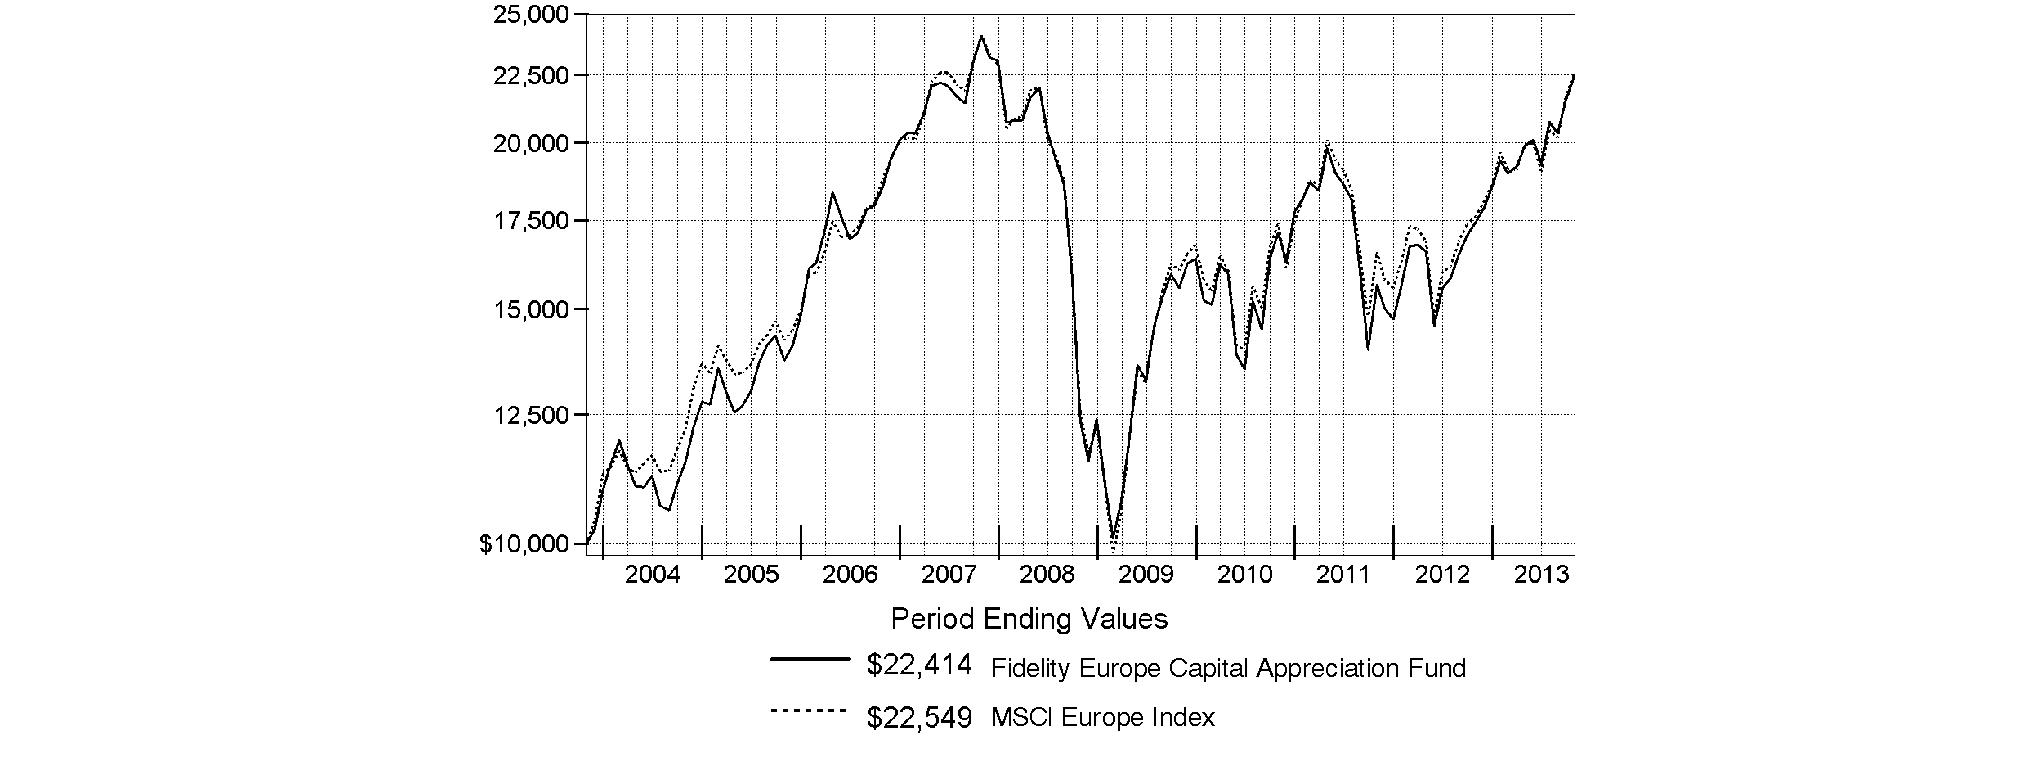
Annual Report
Fidelity Europe Capital Appreciation Fund
Market Recap: On balance, global equity markets remained upbeat for the 12-month period ending October 31, 2013. The MSCI® ACWI® (All Country World Index) Index gained 23.75% for the period, amid investor preference for higher-risk assets. The period was not without turbulence, however. In the spring and summer, central banks worldwide, especially in the U.S. and China, made clear their intentions to maintain accommodative monetary policies. That stance, combined with modest cyclical improvements around the globe and generally low valuations, underpinned the broad rally in equities. Europe (+32%) shone brightly, with most markets in the region - large and small - registering solid, index-beating gains. Another bright spot was Japan, which, despite a struggling yen and taking a second-half breather, posted a 34% result for the full year. The U.S. - by far the index's biggest constituent - also outperformed the global market with a roughly 28% advance. Meanwhile, Asia-Pacific ex Japan (+14%) lagged, hurt in part by a slowdown in Australia's mining industry as well as currency headwinds. Foreign-exchange and commodity weakness also curbed results in resource-heavy Canada and emerging markets (EM), both of which were up 7%. Country-level EM performance diverged meaningfully for the period, as evidenced by performance in Brazil (-1%), Russia (+12%), India (+1%) and China (+8%).
Comments from Risteard Hogan, who became Portfolio Manager of Fidelity® Europe Capital Appreciation Fund on March 18, 2013: For the year, the fund rose 28.47%, while the MSCI® Europe Index gained 28.00%. U.K. homebuilder Taylor Wimpey provided the biggest boost to relative performance. This out-of-index position performed well, as U.K. housing steadily rebounded. In financials, the fund's position in Belgium's KBC Groupe added value, rising as the European financial predicament improved. In consumer staples, Greencore Group, a Dublin-based prepared foods and ingredient supplier was helpful, as the non-index company experienced steady growth in its current markets and into its new U.S. market. On the downside, an average underweighting in Swiss pharmaceuticals company Roche Holding was detrimental. The stock performed well when the fund did not own it earlier in the period. Earlier in the year, I established an overweighted position here, believing the company's valuation was attractive, as was its management team and good dividend payout. Lastly, I'll mention the fund's average 3% cash position, which detracted. The fund's cash stake fluctuated during the period, as I sought buying opportunities, but over time, I expect the fund's average cash position to decrease.
Note to shareholders: On December 16, 2013, Stefan Lindblad will join Risteard Hogan as a co-portfolio manager of the fund.
The views expressed above reflect those of the portfolio manager(s) only through the end of the period as stated on the cover of this report and do not necessarily represent the views of Fidelity or any other person in the Fidelity organization. Any such views are subject to change at any time based upon market or other conditions and Fidelity disclaims any responsibility to update such views. These views may not be relied on as investment advice and, because investment decisions for a Fidelity fund are based on numerous factors, may not be relied on as an indication of trading intent on behalf of any Fidelity fund.
Annual Report
Fidelity Europe Capital Appreciation Fund
As a shareholder of the Fund, you incur two types of costs: (1) transaction costs, including redemption fees and (2) ongoing costs, including management fees and other Fund expenses. This Example is intended to help you understand your ongoing costs (in dollars) of investing in the Fund and to compare these costs with the ongoing costs of investing in other mutual funds.
The Example is based on an investment of $1,000 invested at the beginning of the period and held for the entire period (May 1, 2013 to October 31, 2013).
Actual Expenses
The first line of the accompanying table provides information about actual account values and actual expenses. You may use the information in this line, together with the amount you invested, to estimate the expenses that you paid over the period. Simply divide your account value by $1,000.00 (for example, an $8,600 account value divided by $1,000.00 = 8.6), then multiply the result by the number in the first line under the heading entitled "Expenses Paid During Period" to estimate the expenses you paid on your account during this period. A small balance maintenance fee of $12.00 that is charged once a year may apply for certain accounts with a value of less than $2,000. This fee is not included in the table below. If it was, the estimate of expenses you paid during the period would be higher, and your ending account value lower, by this amount. In addition, the Fund, as a shareholder in the underlying Fidelity Central Funds, will indirectly bear its pro-rata share of the fees and expenses incurred by the underlying Fidelity Central Funds. These fees and expenses are not included in the Fund's annualized expense ratio used to calculate the expense estimate in the table below.
Hypothetical Example for Comparison Purposes
The second line of the accompanying table provides information about hypothetical account values and hypothetical expenses based on the Fund's actual expense ratio and an assumed rate of return of 5% per year before expenses, which is not the Fund's actual return. The hypothetical account values and expenses may not be used to estimate the actual ending account balance or expenses you paid for the period. You may use this information to compare the ongoing costs of investing in the Fund and other funds. To do so, compare this 5% hypothetical example with the 5% hypothetical examples that appear in the shareholder reports of the other funds. A small balance maintenance fee of $12.00 that is charged once a year may apply for certain accounts with a value of less than $2,000. This fee is not included in the table below. If it was, the estimate of expenses you paid during the period would be higher, and your ending account value lower, by this amount. In addition, the Fund, as a shareholder in the underlying Fidelity Central Funds, will indirectly bear its pro-rata share of the fees and expenses incurred by the underlying Fidelity Central Funds. These fees and expenses are not included in the Fund's annualized expense ratio used to calculate the expense estimate in the table below.
Please note that the expenses shown in the table are meant to highlight your ongoing costs only and do not reflect any transaction costs. Therefore, the second line of the table is useful in comparing ongoing costs only, and will not help you determine the relative total costs of owning different funds. In addition, if these transactional costs were included, your costs would have been higher.
| Annualized
Expense Ratio B | Beginning
Account Value
May 1, 2013 | Ending
Account Value
October 31, 2013 | Expenses Paid
During Period*
May 1, 2013
to October 31, 2013 |
Actual | 1.10% | $ 1,000.00 | $ 1,126.90 | $ 5.90 |
HypotheticalA | | $ 1,000.00 | $ 1,019.66 | $ 5.60 |
A 5% return per year before expenses
B Annualized expense ratio reflects expenses net of applicable fee waivers.
* Expenses are equal to the Fund's annualized expense ratio, multiplied by the average account value over the period, multiplied by 184/365 (to reflect the one-half year period).
Annual Report
Fidelity Europe Capital Appreciation Fund
Investment Changes (Unaudited)
Geographic Diversification (% of fund's net assets) |
As of October 31, 2013 |
| United Kingdom | 30.9% | |
| France | 15.0% | |
| Germany | 13.4% | |
| Switzerland | 13.0% | |
| Italy | 3.6% | |
| United States of America* | 3.1% | |
| Finland | 3.0% | |
| Ireland | 3.0% | |
| Belgium | 2.8% | |
| Other | 12.2% | |

* Includes Short-Term Investments and Net Other Assets (Liabilities).
Percentages are based on country or territory of incorporation and are adjusted for the effect of futures contracts, if applicable. |
As of April 30, 2013 |
| United Kingdom | 31.5% | |
| Germany | 14.1% | |
| Switzerland | 13.8% | |
| France | 11.4% | |
| Italy | 4.6% | |
| United States of America* | 3.2% | |
| Ireland | 2.8% | |
| Belgium | 2.8% | |
| Denmark | 2.5% | |
| Other | 13.3% | |

* Includes Short-Term Investments and Net Other Assets (Liabilities).
Percentages are based on country or territory of incorporation and are adjusted for the effect of futures contracts, if applicable. |
Asset Allocation as of October 31, 2013 |
| % of fund's
net assets | % of fund's net assets
6 months ago |
Stocks | 98.9 | 98.6 |
Short-Term Investments and Net Other Assets (Liabilities) | 1.1 | 1.4 |
Top Ten Stocks as of October 31, 2013 |
| % of fund's
net assets | % of fund's net assets
6 months ago |
Nestle SA (Switzerland, Food Products) | 3.7 | 3.9 |
Roche Holding AG (participation certificate) (Switzerland, Pharmaceuticals) | 3.3 | 3.4 |
Total SA (France, Oil, Gas & Consumable Fuels) | 2.5 | 0.0 |
British American Tobacco PLC (United Kingdom) (United Kingdom, Tobacco) | 2.2 | 2.4 |
Sanofi SA (France, Pharmaceuticals) | 2.1 | 2.5 |
GlaxoSmithKline PLC (United Kingdom, Pharmaceuticals) | 2.1 | 1.4 |
Royal Dutch Shell PLC Class B (United Kingdom) (United Kingdom, Oil, Gas & Consumable Fuels) | 1.8 | 2.7 |
BASF AG (Germany, Chemicals) | 1.8 | 1.6 |
Bayer AG (Germany, Pharmaceuticals) | 1.8 | 1.7 |
Anheuser-Busch InBev SA NV (Belgium, Beverages) | 1.6 | 1.8 |
| 22.9 | |
Market Sectors as of October 31, 2013 |
| % of fund's
net assets | % of fund's net assets
6 months ago |
Financials | 20.1 | 20.3 |
Consumer Staples | 16.2 | 18.3 |
Industrials | 15.5 | 13.1 |
Consumer Discretionary | 15.1 | 13.3 |
Health Care | 11.7 | 12.4 |
Energy | 7.0 | 6.3 |
Materials | 6.7 | 7.3 |
Telecommunication Services | 3.5 | 2.6 |
Information Technology | 2.3 | 3.5 |
Utilities | 0.8 | 1.5 |
Annual Report
Fidelity Europe Capital Appreciation Fund
Investments October 31, 2013
Showing Percentage of Net Assets
Common Stocks - 97.7% |
| Shares | | Value |
Austria - 1.3% |
Andritz AG | 38,600 | | $ 2,377,803 |
Erste Group Bank AG | 64,940 | | 2,290,275 |
TOTAL AUSTRIA | | 4,668,078 |
Bailiwick of Jersey - 0.8% |
Informa PLC | 217,222 | | 1,948,704 |
Shire PLC | 19,900 | | 882,375 |
TOTAL BAILIWICK OF JERSEY | | 2,831,079 |
Belgium - 2.8% |
Anheuser-Busch InBev SA NV | 57,100 | | 5,919,199 |
KBC Groupe SA | 42,613 | | 2,322,991 |
UCB SA | 29,000 | | 1,906,525 |
TOTAL BELGIUM | | 10,148,715 |
Bermuda - 0.4% |
Bunge Ltd. | 18,400 | | 1,511,192 |
British Virgin Islands - 0.4% |
Mail.Ru Group Ltd. GDR (Reg. S) | 42,600 | | 1,571,088 |
Canada - 0.5% |
Suncor Energy, Inc. | 49,000 | | 1,780,665 |
Denmark - 0.6% |
Coloplast A/S Series B | 30,700 | | 2,001,864 |
Finland - 3.0% |
Amer Group PLC (A Shares) | 87,700 | | 1,802,791 |
Kesko Oyj | 43,388 | | 1,442,118 |
Lassila & Tikahoja Oyj | 84,679 | | 1,776,332 |
Raisio Group PLC (V Shares) | 203,735 | | 1,186,705 |
Rakentajain Konevuokraamo Oyj (B Shares) | 91,467 | | 1,829,309 |
Sampo Oyj (A Shares) | 61,500 | | 2,913,372 |
TOTAL FINLAND | | 10,950,627 |
France - 15.0% |
Atos Origin SA | 25,079 | | 2,141,128 |
AXA SA | 165,900 | | 4,144,613 |
BNP Paribas SA | 78,760 | | 5,832,311 |
Christian Dior SA | 25,400 | | 4,828,159 |
GDF Suez | 120,271 | | 2,994,884 |
Ipsos SA | 50,800 | | 2,142,668 |
Kering SA | 13,800 | | 3,135,629 |
Legrand SA | 43,600 | | 2,476,248 |
Publicis Groupe SA | 33,900 | | 2,827,483 |
Rexel SA | 61,600 | | 1,543,110 |
Sanofi SA | 71,757 | | 7,650,964 |
Schneider Electric SA | 39,000 | | 3,285,687 |
Technip SA | 18,100 | | 1,895,982 |
Total SA | 146,696 | | 9,000,237 |
TOTAL FRANCE | | 53,899,103 |
Germany - 12.2% |
adidas AG | 25,400 | | 2,899,654 |
BASF AG | 61,300 | | 6,377,921 |
|
| Shares | | Value |
Bayer AG | 51,200 | | $ 6,363,568 |
Beiersdorf AG | 20,900 | | 1,995,185 |
Continental AG | 14,000 | | 2,565,197 |
CTS Eventim AG | 33,593 | | 1,639,712 |
Daimler AG (Germany) | 60,755 | | 4,985,702 |
Deutsche Boerse AG | 26,500 | | 1,995,112 |
Deutsche Post AG | 91,547 | | 3,098,126 |
ElringKlinger AG | 30,900 | | 1,316,112 |
GEA Group AG | 50,953 | | 2,217,265 |
GSW Immobilien AG | 33,700 | | 1,567,149 |
HeidelbergCement Finance AG | 26,400 | | 2,081,137 |
KION Group AG (a) | 40,786 | | 1,661,316 |
Linde AG | 17,800 | | 3,382,305 |
TOTAL GERMANY | | 44,145,461 |
Ireland - 3.0% |
CRH PLC | 96,800 | | 2,355,491 |
DCC PLC (United Kingdom) | 40,200 | | 1,804,142 |
FBD Holdings PLC | 37,000 | | 798,764 |
Greencore Group PLC | 751,719 | | 2,170,757 |
Kingspan Group PLC (United Kingdom) | 107,800 | | 1,822,250 |
Ryanair Holdings PLC sponsored ADR | 35,000 | | 1,757,350 |
TOTAL IRELAND | | 10,708,754 |
Italy - 3.6% |
Astaldi SpA | 177,883 | | 1,734,118 |
Azimut Holding SpA | 73,000 | | 1,854,456 |
Banca Popolare dell'Emilia Romagna Scrl (a) | 107,300 | | 1,032,189 |
Lottomatica SpA | 45,200 | | 1,374,081 |
MARR SpA | 130,069 | | 2,045,042 |
Prada SpA | 167,300 | | 1,631,353 |
Prysmian SpA | 70,000 | | 1,710,765 |
World Duty Free SpA (a) | 142,896 | | 1,583,179 |
TOTAL ITALY | | 12,965,183 |
Luxembourg - 0.3% |
Eurofins Scientific SA | 4,200 | | 1,151,630 |
Netherlands - 1.8% |
ASML Holding NV (Netherlands) | 29,892 | | 2,830,407 |
Koninklijke Philips Electronics NV | 99,493 | | 3,516,156 |
TOTAL NETHERLANDS | | 6,346,563 |
Norway - 1.7% |
DNB ASA | 177,600 | | 3,147,429 |
Telenor ASA | 125,000 | | 3,002,663 |
TOTAL NORWAY | | 6,150,092 |
Russia - 0.5% |
Magnit OJSC GDR (Reg. S) | 27,300 | | 1,754,025 |
South Africa - 0.4% |
Naspers Ltd. Class N | 17,300 | | 1,618,199 |
Common Stocks - continued |
| Shares | | Value |
Spain - 1.5% |
Criteria CaixaCorp SA | 550,035 | | $ 2,859,536 |
Repsol YPF SA | 88,601 | | 2,379,495 |
TOTAL SPAIN | | 5,239,031 |
Sweden - 2.0% |
AF AB (B Shares) | 8,216 | | 259,918 |
Investment AB Kinnevik (B Shares) | 54,600 | | 2,012,096 |
Svenska Handelsbanken AB (A Shares) | 59,000 | | 2,673,189 |
Swedish Match Co. AB | 66,200 | | 2,184,175 |
TOTAL SWEDEN | | 7,129,378 |
Switzerland - 13.0% |
Adecco SA (Reg.) | 28,820 | | 2,126,521 |
Aryzta AG | 32,110 | | 2,399,359 |
Baloise Holdings AG | 17,066 | | 1,986,190 |
Credit Suisse Group | 38,240 | | 1,189,569 |
Nestle SA | 182,591 | | 13,180,133 |
Partners Group Holding AG | 7,640 | | 1,979,571 |
Roche Holding AG (participation certificate) | 43,171 | | 11,951,899 |
Schindler Holding AG (participation certificate) | 15,391 | | 2,183,084 |
Syngenta AG (Switzerland) | 8,415 | | 3,396,434 |
UBS AG | 230,406 | | 4,456,299 |
Vontobel Holdings AG | 46,155 | | 1,849,049 |
TOTAL SWITZERLAND | | 46,698,108 |
United Kingdom - 30.9% |
Associated British Foods PLC | 75,800 | | 2,755,260 |
Babcock International Group PLC | 113,900 | | 2,328,498 |
Barclays PLC | 1,206,947 | | 5,078,188 |
BG Group PLC | 176,800 | | 3,610,132 |
BHP Billiton PLC | 173,440 | | 5,352,098 |
British American Tobacco PLC (United Kingdom) | 144,000 | | 7,944,809 |
BT Group PLC | 646,200 | | 3,909,920 |
Bunzl PLC | 90,400 | | 1,995,925 |
Cineworld Group PLC | 246,232 | | 1,463,752 |
Compass Group PLC | 194,800 | | 2,801,711 |
Dechra Pharmaceuticals PLC | 131,200 | | 1,451,526 |
Diageo PLC | 165,428 | | 5,273,428 |
Galliford Try PLC | 92,500 | | 1,699,684 |
GlaxoSmithKline PLC | 283,700 | | 7,479,007 |
HSBC Holdings PLC (United Kingdom) | 277,056 | | 3,036,906 |
ICAP PLC | 323,400 | | 1,997,414 |
IMI PLC | 84,102 | | 2,048,359 |
ITV PLC | 821,000 | | 2,512,991 |
Kingfisher PLC | 447,000 | | 2,705,617 |
London Stock Exchange Group PLC | 68,600 | | 1,806,089 |
Meggitt PLC | 226,107 | | 2,075,541 |
Mondi PLC | 60,500 | | 1,080,644 |
|
| Shares | | Value |
Next PLC | 27,500 | | $ 2,400,891 |
Partnership Assurance Group PLC | 224,693 | | 1,469,913 |
Prudential PLC | 236,040 | | 4,827,198 |
Rolls-Royce Group PLC | 170,041 | | 3,135,403 |
Royal Dutch Shell PLC Class B (United Kingdom) | 184,352 | | 6,382,273 |
Schroders PLC | 48,400 | | 2,001,422 |
Serco Group PLC | 205,643 | | 1,836,585 |
SIG PLC | 539,700 | | 1,782,631 |
Standard Chartered PLC (United Kingdom) | 182,216 | | 4,381,016 |
Taylor Wimpey PLC | 1,236,500 | | 2,184,830 |
The Go-Ahead Group PLC | 39,708 | | 1,070,893 |
Unite Group PLC | 267,200 | | 1,696,577 |
Vodafone Group PLC | 1,554,600 | | 5,694,131 |
WM Morrison Supermarkets PLC | 468,400 | | 2,114,908 |
TOTAL UNITED KINGDOM | | 111,386,170 |
United States of America - 2.0% |
Amgen, Inc. | 7,614 | | 883,224 |
Beam, Inc. | 22,000 | | 1,480,600 |
Colgate-Palmolive Co. | 24,198 | | 1,566,337 |
Oracle Corp. | 53,500 | | 1,792,250 |
Philip Morris International, Inc. | 17,100 | | 1,523,952 |
TOTAL UNITED STATES OF AMERICA | | 7,246,363 |
TOTAL COMMON STOCKS (Cost $296,806,860) |
351,901,368
|
Nonconvertible Preferred Stocks - 1.2% |
| | | |
Germany - 1.2% |
Volkswagen AG | 16,200 | | 4,117,567 |
United Kingdom - 0.0% |
Rolls-Royce Group PLC: | | | |
(C Shares) (a) | 23,554,979 | | 37,768 |
Series C | 14,967,526 | | 23,999 |
TOTAL UNITED KINGDOM | | 61,767 |
TOTAL NONCONVERTIBLE PREFERRED STOCKS (Cost $3,042,444) |
4,179,334
|
Money Market Funds - 1.7% |
| Shares | | Value |
Fidelity Cash Central Fund, 0.09% (b)
(Cost $6,176,350) | 6,176,350 | | $ 6,176,350 |
TOTAL INVESTMENT PORTFOLIO - 100.6% (Cost $306,025,654) | | 362,257,052 |
NET OTHER ASSETS (LIABILITIES) - (0.6)% | | (1,983,251) |
NET ASSETS - 100% | $ 360,273,801 |
Legend |
(a) Non-income producing |
(b) Affiliated fund that is generally available only to investment companies and other accounts managed by Fidelity Investments. The rate quoted is the annualized seven-day yield of the fund at period end. A complete unaudited listing of the fund's holdings as of its most recent quarter end is available upon request. In addition, each Fidelity Central Fund's financial statements, which are not covered by the Fund's Report of Independent Registered Public Accounting Firm, are available on the SEC's website or upon request. |
Affiliated Central Funds |
Information regarding fiscal year to date income earned by the Fund from investments in Fidelity Central Funds is as follows: |
Fund | Income earned |
Fidelity Cash Central Fund | $ 7,017 |
Fidelity Securities Lending Cash Central Fund | 170,633 |
Total | $ 177,650 |
Other Information |
Categorizations in the Schedule of Investments are based on country or territory of incorporation. |
The following is a summary of the inputs used, as of October 31, 2013, involving the Fund's assets and liabilities carried at fair value. The inputs or methodology used for valuing securities may not be an indication of the risk associated with investing in those securities. For more information on valuation inputs, and their aggregation into the levels used in the tables below, please refer to the Investment Valuation section in the accompanying Notes to Financial Statements. |
Valuation Inputs at Reporting Date: |
Description | Total | Level 1 | Level 2 | Level 3 |
Investments in Securities: | | | | |
Equities: | | | | |
Consumer Discretionary | $ 54,485,982 | $ 54,485,982 | $ - | $ - |
Consumer Staples | 58,447,184 | 26,129,615 | 32,317,569 | - |
Energy | 25,048,784 | 9,666,274 | 15,382,510 | - |
Financials | 73,198,883 | 54,610,723 | 18,588,160 | - |
Health Care | 41,722,582 | 25,710,236 | 16,012,346 | - |
Industrials | 55,214,786 | 51,698,630 | 3,516,156 | - |
Information Technology | 8,334,873 | 5,504,466 | 2,830,407 | - |
Materials | 24,026,030 | 12,922,007 | 11,104,023 | - |
Telecommunication Services | 12,606,714 | 3,002,663 | 9,604,051 | - |
Utilities | 2,994,884 | 2,994,884 | - | - |
Money Market Funds | 6,176,350 | 6,176,350 | - | - |
Total Investments in Securities: | $ 362,257,052 | $ 252,901,830 | $ 109,355,222 | $ - |
The following is a summary of transfers between Level 1 and Level 2 for the period ended October 31, 2013. Transfers are assumed to have occurred at the beginning of the period, and are primarily attributable to the valuation techniques used for foreign equity securities, as discussed in the accompanying Notes to Financial Statements: |
Transfers | Total |
Level 1 to Level 2 | $ 11,229,698 |
Level 2 to Level 1 | $ 0 |
See accompanying notes which are an integral part of the financial statements.
Annual Report
Fidelity Europe Capital Appreciation Fund
Statement of Assets and Liabilities
| October 31, 2013 |
| | |
Assets | | |
Investment in securities, at value - See accompanying schedule: Unaffiliated issuers (cost $299,849,304) | $ 356,080,702 | |
Fidelity Central Funds (cost $6,176,350) | 6,176,350 | |
Total Investments (cost $306,025,654) | | $ 362,257,052 |
Receivable for investments sold | | 3,000,264 |
Receivable for fund shares sold | | 203,059 |
Dividends receivable | | 795,085 |
Distributions receivable from Fidelity Central Funds | | 350 |
Prepaid expenses | | 1,085 |
Other receivables | | 12,046 |
Total assets | | 366,268,941 |
| | |
Liabilities | | |
Payable to custodian bank | $ 70,207 | |
Payable for investments purchased | 5,259,648 | |
Payable for fund shares redeemed | 310,441 | |
Accrued management fee | 211,552 | |
Other affiliated payables | 75,310 | |
Other payables and accrued expenses | 67,982 | |
Total liabilities | | 5,995,140 |
| | |
Net Assets | | $ 360,273,801 |
Net Assets consist of: | | |
Paid in capital | | $ 558,633,697 |
Undistributed net investment income | | 5,181,959 |
Accumulated undistributed net realized gain (loss) on investments and foreign currency transactions | | (259,784,545) |
Net unrealized appreciation (depreciation) on investments and assets and liabilities in foreign currencies | | 56,242,690 |
Net Assets, for 15,662,204 shares outstanding | | $ 360,273,801 |
Net Asset Value, offering price and redemption price per share ($360,273,801 ÷ 15,662,204 shares) | | $ 23.00 |
Statement of Operations
| Year ended October 31, 2013 |
| | |
Investment Income | | |
Dividends | | $ 9,758,494 |
Interest | | 8 |
Income from Fidelity Central Funds | | 177,650 |
Income before foreign taxes withheld | | 9,936,152 |
Less foreign taxes withheld | | (797,025) |
Total income | | 9,139,127 |
| | |
Expenses | | |
Management fee Basic fee | $ 2,356,636 | |
Performance adjustment | 197,690 | |
Transfer agent fees | 738,784 | |
Accounting and security lending fees | 173,918 | |
Custodian fees and expenses | 77,622 | |
Independent trustees' compensation | 1,978 | |
Registration fees | 26,746 | |
Audit | 57,991 | |
Legal | 1,207 | |
Interest | 136 | |
Miscellaneous | 2,364 | |
Total expenses before reductions | 3,635,072 | |
Expense reductions | (120,583) | 3,514,489 |
Net investment income (loss) | | 5,624,638 |
Realized and Unrealized Gain (Loss) Net realized gain (loss) on: | | |
Investment securities: | | |
Unaffiliated issuers | 49,182,991 | |
Foreign currency transactions | (132,338) | |
Total net realized gain (loss) | | 49,050,653 |
Change in net unrealized appreciation (depreciation) on: Investment securities | 28,614,765 | |
Assets and liabilities in foreign currencies | 13,157 | |
Total change in net unrealized appreciation (depreciation) | | 28,627,922 |
Net gain (loss) | | 77,678,575 |
Net increase (decrease) in net assets resulting from operations | | $ 83,303,213 |
See accompanying notes which are an integral part of the financial statements.
Annual Report
Statement of Changes in Net Assets
| Year ended
October 31,
2013 | Year ended
October 31,
2012 |
Increase (Decrease) in Net Assets | | |
Operations | | |
Net investment income (loss) | $ 5,624,638 | $ 6,852,503 |
Net realized gain (loss) | 49,050,653 | (20,276,026) |
Change in net unrealized appreciation (depreciation) | 28,627,922 | 45,195,770 |
Net increase (decrease) in net assets resulting from operations | 83,303,213 | 31,772,247 |
Distributions to shareholders from net investment income | (6,903,907) | (7,037,971) |
Distributions to shareholders from net realized gain | - | (136,470) |
Total distributions | (6,903,907) | (7,174,441) |
Share transactions
Proceeds from sales of shares | 64,670,620 | 23,262,285 |
Reinvestment of distributions | 6,562,117 | 6,834,917 |
Cost of shares redeemed | (96,387,178) | (78,869,598) |
Net increase (decrease) in net assets resulting from share transactions | (25,154,441) | (48,772,396) |
Redemption fees | 6,010 | 4,159 |
Total increase (decrease) in net assets | 51,250,875 | (24,170,431) |
| | |
Net Assets | | |
Beginning of period | 309,022,926 | 333,193,357 |
End of period (including undistributed net investment income of $5,181,959 and undistributed net investment income of $6,223,926, respectively) | $ 360,273,801 | $ 309,022,926 |
Other Information Shares | | |
Sold | 3,237,057 | 1,368,457 |
Issued in reinvestment of distributions | 355,478 | 433,138 |
Redeemed | (4,816,956) | (4,755,853) |
Net increase (decrease) | (1,224,421) | (2,954,258) |
Financial Highlights
Years ended October 31, | 2013 | 2012 | 2011 | 2010 | 2009 |
Selected Per-Share Data | | | | | |
Net asset value, beginning of period | $ 18.30 | $ 16.79 | $ 18.56 | $ 17.16 | $ 14.27 |
Income from Investment Operations | | | | | |
Net investment income (loss) B | .34 | .38 | .31 | .19 | .31 |
Net realized and unrealized gain (loss) | 4.77 | 1.50 | (1.89) | 1.53 | 3.14 |
Total from investment operations | 5.11 | 1.88 | (1.58) | 1.72 | 3.45 |
Distributions from net investment income | (.41) | (.36) | (.19) | (.32) | (.56) |
Distributions from net realized gain | - | (.01) | - | - | - |
Total distributions | (.41) | (.37) | (.19) | (.32) | (.56) |
Redemption fee added to paid in capital B, F | - | - | - | - | - |
Net asset value, end of period | $ 23.00 | $ 18.30 | $ 16.79 | $ 18.56 | $ 17.16 |
Total Return A | 28.47% | 11.54% | (8.65)% | 10.08% | 25.79% |
Ratios to Average Net Assets C, E | | | | | |
Expenses before reductions | 1.09% | .95% | 1.02% | 1.03% | 1.10% |
Expenses net of fee waivers, if any | 1.08% | .95% | 1.02% | 1.03% | 1.10% |
Expenses net of all reductions | 1.05% | .92% | .98% | .96% | 1.07% |
Net investment income (loss) | 1.68% | 2.25% | 1.65% | 1.13% | 2.16% |
Supplemental Data | | | | | |
Net assets, end of period (000 omitted) | $ 360,274 | $ 309,023 | $ 333,193 | $ 457,849 | $ 520,984 |
Portfolio turnover rate D | 127% | 92% | 116% | 133% | 111% |
ATotal returns would have been lower if certain expenses had not been reduced during the applicable periods shown. BCalculated based on average shares outstanding during the period. CFees and expenses of any underlying Fidelity Central Funds are not included in the Fund's expense ratio. The Fund indirectly bears its proportionate share of the expenses of any underlying Fidelity Central Funds. DAmount does not include the portfolio activity of any underlying Fidelity Central Funds. EExpense ratios reflect operating expenses of the Fund. Expenses before reductions do not reflect amounts reimbursed by the investment adviser or reductions from brokerage service arrangements or reductions from other expense offset arrangements and do not represent the amount paid by the Fund during periods when reimbursements or reductions occur. Expenses net of fee waivers reflect expenses after reimbursement by the investment adviser but prior to reductions from brokerage service arrangements or other expense offset arrangements. Expenses net of all reductions represent the net expenses paid by the Fund. FAmount represents less than $.01 per share. |
See accompanying notes which are an integral part of the financial statements.
Annual Report
Notes to Financial Statements
For the period ended October 31, 2013
1. Organization.
Fidelity Europe Capital Appreciation Fund (the Fund) is a fund of Fidelity Investment Trust (the Trust) and is authorized to issue an unlimited number of shares. The Trust is registered under the Investment Company Act of 1940, as amended (the 1940 Act), as an open-end management investment company organized as a Massachusetts business trust. Effective after the close of business on July 19, 2013, the Fund was closed to new accounts with certain exceptions.
2. Investments in Fidelity Central Funds.
The Fund invests in Fidelity Central Funds, which are open-end investment companies generally available only to other investment companies and accounts managed by Fidelity Management & Research Company (FMR) and its affiliates. The Fund's Schedule of Investments lists each of the Fidelity Central Funds held as of period end, if any, as an investment of the Fund, but does not include the underlying holdings of each Fidelity Central Fund. As an Investing Fund, the Fund indirectly bears its proportionate share of the expenses of the underlying Fidelity Central Funds.
The Money Market Central Funds seek preservation of capital and current income and are managed by Fidelity Investments Money Management, Inc. (FIMM), an affiliate of FMR.
A complete unaudited list of holdings for each Fidelity Central Fund is available upon request or at the Securities and Exchange Commission (the SEC) website at www.sec.gov. In addition, the financial statements of the Fidelity Central Funds, which are not covered by the Fund's Report of Independent Registered Public Accounting Firm, are available on the SEC website or upon request.
3. Significant Accounting Policies.
The financial statements have been prepared in conformity with accounting principles generally accepted in the United States of America (GAAP), which require management to make certain estimates and assumptions at the date of the financial statements. Actual results could differ from those estimates. Subsequent events, if any, through the date that the financial statements were issued have been evaluated in the preparation of the financial statements. The following summarizes the significant accounting policies of the Fund:
Investment Valuation. Investments are valued as of 4:00 p.m. Eastern time on the last calendar day of the period. In accordance with valuation policies and procedures approved by the Board of Trustees (the Board), the Fund attempts to obtain prices from one or more third party pricing vendors or brokers to value its investments. When current market prices, quotations or currency exchange rates are not readily available or reliable, investments will be fair valued in good faith by the FMR Fair Value Committee (the Committee), in accordance with procedures adopted by the Board. Factors used in determining fair value vary by investment type and may include market or investment specific events. The frequency with which these procedures are used cannot be predicted and they may be utilized to a significant extent. The Committee oversees the Fund's valuation policies and procedures and is responsible for approving and reporting to the Board all fair value determinations.
The Fund categorizes the inputs to valuation techniques used to value its investments into a disclosure hierarchy consisting of three levels as shown below:
Level 1 - quoted prices in active markets for identical investments
Level 2 - other significant observable inputs (including quoted prices for similar investments, interest rates, prepayment speeds, etc.)
Level 3 - unobservable inputs (including the Fund's own assumptions based on the best information available)
Valuation techniques used to value the Fund's investments by major category are as follows:
Equity securities, including restricted securities, for which market quotations are readily available, are valued at the last reported sale price or official closing price as reported by a third party pricing vendor on the primary market or exchange on which they are traded and are categorized as Level 1 in the hierarchy. In the event there were no sales during the day or closing prices are not available, securities are valued at the last quoted bid price or may be valued using the last available price and are generally categorized as Level 2 in the hierarchy. For foreign equity securities, when market or security specific events arise, comparisons to the valuation of American Depositary Receipts (ADRs), futures contracts, Exchange-Traded Funds (ETFs) and certain indexes as well as quoted prices for similar securities may be used and would be categorized as Level 2 in the hierarchy. Utilizing these techniques may result in transfers between Level 1 and Level 2. For equity securities, including restricted securities, where observable inputs are limited, assumptions about market activity and risk are used and these securities may be categorized as Level 3 in the hierarchy.
Investments in open-end mutual funds, including the Fidelity Central Funds, are valued at their closing net asset value (NAV) each business day and are categorized as Level 1 in the hierarchy.
Annual Report
Notes to Financial Statements - continued
3. Significant Accounting Policies - continued
Investment Valuation - continued
Changes in valuation techniques may result in transfers in or out of an assigned level within the disclosure hierarchy. The aggregate value of investments by input level, as of October 31, 2013, including information on transfers between Levels 1 and 2 is included at the end of the Fund's Schedule of Investments.
Foreign Currency. The Fund may use foreign currency contracts to facilitate transactions in foreign-denominated securities. Gains and losses from these transactions may arise from changes in the value of the foreign currency or if the counterparties do not perform under the contracts' terms.
Foreign-denominated assets, including investment securities, and liabilities are translated into U.S. dollars at the exchange rates at period end. Purchases and sales of investment securities, income and dividends received and expenses denominated in foreign currencies are translated into U.S. dollars at the exchange rate in effect on the transaction date.
The effects of exchange rate fluctuations on investments are included with the net realized and unrealized gain (loss) on investment securities. Other foreign currency transactions resulting in realized and unrealized gain (loss) are disclosed separately.
Investment Transactions and Income. For financial reporting purposes, the Fund's investment holdings and NAV include trades executed through the end of the last business day of the period. The NAV per share for processing shareholder transactions is calculated as of the close of business of the New York Stock Exchange (NYSE), normally 4:00 p.m. Eastern time and includes trades executed through the end of the prior business day. Gains and losses on securities sold are determined on the basis of identified cost and may include proceeds received from litigation. Dividend income is recorded on the ex-dividend date, except for certain dividends from foreign securities where the ex-dividend date may have passed, which are recorded as soon as the Fund is informed of the ex-dividend date. Non-cash dividends included in dividend income, if any, are recorded at the fair market value of the securities received. Distributions received on securities that represent a return of capital or capital gain are recorded as a reduction of cost of investments and/or as a realized gain. Subsequent to ex-dividend date the Fund determines the components of these distributions, based upon receipt of tax filings or other correspondence relating to the underlying investment. Interest income and distributions from the Fidelity Central Funds are accrued as earned. Interest income includes coupon interest and amortization of premium and accretion of discount on debt securities. Investment income is recorded net of foreign taxes withheld where recovery of such taxes is uncertain.
Expenses. Expenses directly attributable to a fund are charged to that fund. Expenses attributable to more than one fund are allocated among the respective funds on the basis of relative net assets or other appropriate methods. Expense estimates are accrued in the period to which they relate and adjustments are made when actual amounts are known.
Income Tax Information and Distributions to Shareholders. Each year, the Fund intends to qualify as a regulated investment company under Subchapter M of the Internal Revenue Code, including distributing substantially all of its taxable income and realized gains. As a result, no provision for U.S. Federal income taxes is required. As of October 31, 2013, the Fund did not have any unrecognized tax benefits in the financial statements; nor is the Fund aware of any tax positions for which it is reasonably possible that the total amounts of unrecognized tax benefits will significantly change in the next twelve months. The Fund files a U.S. federal tax return, in addition to state and local tax returns as required. The Fund's federal income tax returns are subject to examination by the Internal Revenue Service (IRS) for a period of three fiscal years after they are filed. State and local tax returns may be subject to examination for an additional fiscal year depending on the jurisdiction. Foreign taxes are provided for based on the Fund's understanding of the tax rules and rates that exist in the foreign markets in which it invests.
Distributions are declared and recorded on the ex-dividend date. Income and capital gain distributions are determined in accordance with income tax regulations, which may differ from GAAP.
Capital accounts within the financial statements are adjusted for permanent book-tax differences. These adjustments have no impact on net assets or the results of operations. Temporary book-tax differences will reverse in a subsequent period.
Book-tax differences are primarily due to foreign currency transactions, passive foreign investment companies (PFIC), deferred trustees compensation, capital loss carryforwards and losses deferred due to wash sales.
The federal tax cost of investment securities and unrealized appreciation (depreciation) as of period end were as follows:
Gross unrealized appreciation | $ 57,476,953 |
Gross unrealized depreciation | (2,871,741) |
Net unrealized appreciation (depreciation) on securities and other investments | $ 54,605,212 |
| |
Tax Cost | $ 307,651,840 |
Annual Report
3. Significant Accounting Policies - continued
Income Tax Information and Distributions to Shareholders - continued
The tax-based components of distributable earnings as of period end were as follows:
Undistributed ordinary income | $ 5,182,117 |
Capital loss carryforward | $ (258,158,358) |
Net unrealized appreciation (depreciation) | $ 54,616,504 |
Capital loss carryforwards are only available to offset future capital gains of the Fund to the extent provided by regulations and may be limited. Under the Regulated Investment Company Modernization Act of 2010 (the Act), the Fund is permitted to carry forward capital losses incurred in taxable years beginning after December 22, 2010 for an unlimited period and such capital losses are required to be used prior to any losses that expire. The capital loss carryforward information presented below, including any applicable limitation, is estimated as of fiscal period end and is subject to adjustment.
Fiscal year of expiration | |
2016 | $ (121,014,889) |
2017 | (137,143,469) |
Total capital loss carryforward | $ (258,158,358) |
The tax character of distributions paid was as follows:
| October 31, 2013 | October 31, 2012 |
Ordinary Income | $ 6,903,907 | $ 7,174,441 |
Short-Term Trading (Redemption) Fees. Shares held by investors in the Fund less than 30 days may have been subject to a redemption fee equal to 1.00% of the net asset value of shares redeemed. All redemption fees, which reduce the proceeds of the shareholder redemption, are retained by the Fund and accounted for as an addition to paid in capital.
4. Purchases and Sales of Investments.
Purchases and sales of securities, other than short-term securities, aggregated $414,750,209 and $444,805,883, respectively.
5. Fees and Other Transactions with Affiliates.
Management Fee. FMR and its affiliates provide the Fund with investment management related services for which the Fund pays a monthly management fee. The management fee is the sum of an individual fund fee rate that is based on an annual rate of .45% of the Fund's average net assets and an annualized group fee rate that averaged .25% during the period. The group fee rate is based upon the average net assets of all the mutual funds advised by FMR, including any mutual funds previously advised by FMR that are currently advised by Fidelity SelectCo, LLC, an affiliate of FMR. The group fee rate decreases as assets under management increase and increases as assets under management decrease. In addition, the management fee is subject to a performance adjustment (up to a maximum of ± .20% of the Fund's average net assets over a 36 month performance period). The upward or downward adjustment to the management fee is based on the Fund's relative investment performance as compared to an appropriate benchmark index over the same 36 month performance period. For the reporting period, the total annual management fee rate, including the performance adjustment, was .76% of the Fund's average net assets. The performance adjustment included in the management fee rate may be higher or lower than the maximum performance adjustment rate due to the difference between the average net assets for the reporting and performance periods.
Transfer Agent Fees. Fidelity Investments Institutional Operations Company, Inc. (FIIOC), an affiliate of FMR, is the Fund's transfer, dividend disbursing and shareholder servicing agent. FIIOC receives account fees and asset-based fees that vary according to account size and type of account. FIIOC pays for typesetting, printing and mailing of shareholder reports, except proxy statements. For the period, the transfer agent fees were equivalent to an annual rate of .22% of average net assets.
Accounting and Security Lending Fees. Fidelity Service Company, Inc. (FSC), an affiliate of FMR, maintains the Fund's accounting records. The accounting fee is based on the level of average net assets for each month. Under a separate contract, FSC administers the security lending program. The security lending fee is based on the number and duration of lending transactions.
Brokerage Commissions. The Fund placed a portion of its portfolio transactions with brokerage firms which are affiliates of the investment. Brokerage commissions are included in net realized gain (loss) and change in net unrealized appreciation (depreciation) in the Statement of Operations. The commissions paid to these affiliated firms were $605 for the period.
Interfund Lending Program. Pursuant to an Exemptive Order issued by the SEC, the Fund, along with other registered investment companies having management contracts with FMR, may participate in an interfund lending program. This program provides an alternative credit facility allowing the
Annual Report
Notes to Financial Statements - continued
5. Fees and Other Transactions with Affiliates - continued
Interfund Lending Program - continued
funds to borrow from, or lend money to, other participating affiliated funds. At period end, there were no interfund loans outstanding. The Fund's activity in this program during the period for which loans were outstanding was as follows:
Borrower or Lender | Average Loan
Balance | Weighted Average
Interest Rate | Interest Expense |
Borrower | $ 6,462,000 | .38% | $ 136 |
6. Committed Line of Credit.
The Fund participates with other funds managed by FMR or an affiliate in a $4.25 billion credit facility (the "line of credit") to be utilized for temporary or emergency purposes to fund shareholder redemptions or for other short-term liquidity purposes. The Fund has agreed to pay commitment fees on its pro-rata portion of the line of credit, which amounted to $723 and is reflected in Miscellaneous expenses on the Statement of Operations. During the period, there were no borrowings on this line of credit.
7. Security Lending.
The Fund lends portfolio securities through a lending agent from time to time in order to earn additional income. For equity securities, a lending agent is used and may loan securities to certain qualified borrowers, including Fidelity Capital Markets (FCM), a broker-dealer affiliated with the Fund. On the settlement date of the loan, the Fund receives collateral (in the form of U.S. Treasury obligations, letters of credit and/or cash) against the loaned securities and maintains collateral in an amount not less than 100% of the market value of the loaned securities during the period of the loan. The market value of the loaned securities is determined at the close of business of the Fund and any additional required collateral is delivered to the Fund on the next business day. If the borrower defaults on its obligation to return the securities loaned because of insolvency or other reasons, the Fund may apply collateral received from the borrower against the obligation. The Fund may experience delays and costs in recovering the securities loaned. Any cash collateral received is invested in the Fidelity Securities Lending Cash Central Fund. At period end, there were no security loans outstanding. Security lending income represents the income earned on investing cash collateral, less rebates paid to borrowers and any lending agent fees associated with the loan, plus any premium payments received for lending certain types of securities. Security lending income is presented in the Statement of Operations as a component of income from Fidelity Central Funds. Total security lending income during the period amounted to $170,633. During the period, there were no securities loaned to FCM.
8. Expense Reductions.
Commissions paid to certain brokers with whom FMR, or its affiliates, places trades on behalf of the Fund include an amount to the Fund in addition to trade execution, which may be rebated back to the Fund to offset certain expenses. This amount totaled $113,799 for the period.
In addition, FMR reimbursed a portion of the Fund's operating expenses during the period in the amount of $6,784.
9. Proposed Reorganization.
The Board of Trustees of the Fund approved an Agreement and Plan of Reorganization (the Agreement) between the Fund and Fidelity Europe Fund. The Agreement provides for the transfer of all the assets and the assumption of all the liabilities of the Fund in exchange for shares of Fidelity Europe Fund equal in value to the net assets of the Fund on the day the reorganization is effective.
A meeting of shareholders of the Fund is expected to be held during the first quarter of 2014. If approved by shareholders, the reorganization is expected to become effective on or about March 21, 2014. The reorganization is expected to qualify as a tax-free transaction with no gain or loss recognized by the funds or their shareholders.
10. Other.
The Fund's organizational documents provide former and current trustees and officers with a limited indemnification against liabilities arising in connection with the performance of their duties to the Fund. In the normal course of business, the Fund may also enter into contracts that provide general indemnifications. The Fund's maximum exposure under these arrangements is unknown as this would be dependent on future claims that may be made against the Fund. The risk of material loss from such claims is considered remote.
Annual Report
Fidelity Europe Fund
Average annual total return reflects the change in the value of an investment, assuming reinvestment of the fund's distributions from dividend income and capital gains (the profits earned upon the sale of securities that have grown in value, if any) and assuming a constant rate of performance each year. The $10,000 table and the fund's returns do not reflect the deduction of taxes that a shareholder would pay on fund distributions or the redemption of fund shares. During periods of reimbursement by Fidelity, a fund's total return will be greater than it would be had the reimbursement not occurred. How a fund did yesterday is no guarantee of how it will do tomorrow.
Average Annual Total Returns
Periods ended October 31, 2013 | Past 1
year | Past 5
years | Past 10
years |
Fidelity Europe Fund | 28.71% | 12.66% | 9.54% |
$10,000 Over 10 Years
Let's say hypothetically that $10,000 was invested in Fidelity Europe Fund on October 31, 2003. The chart shows how the value of your investment would have changed, and also shows how the MSCI Europe Index performed over the same period.
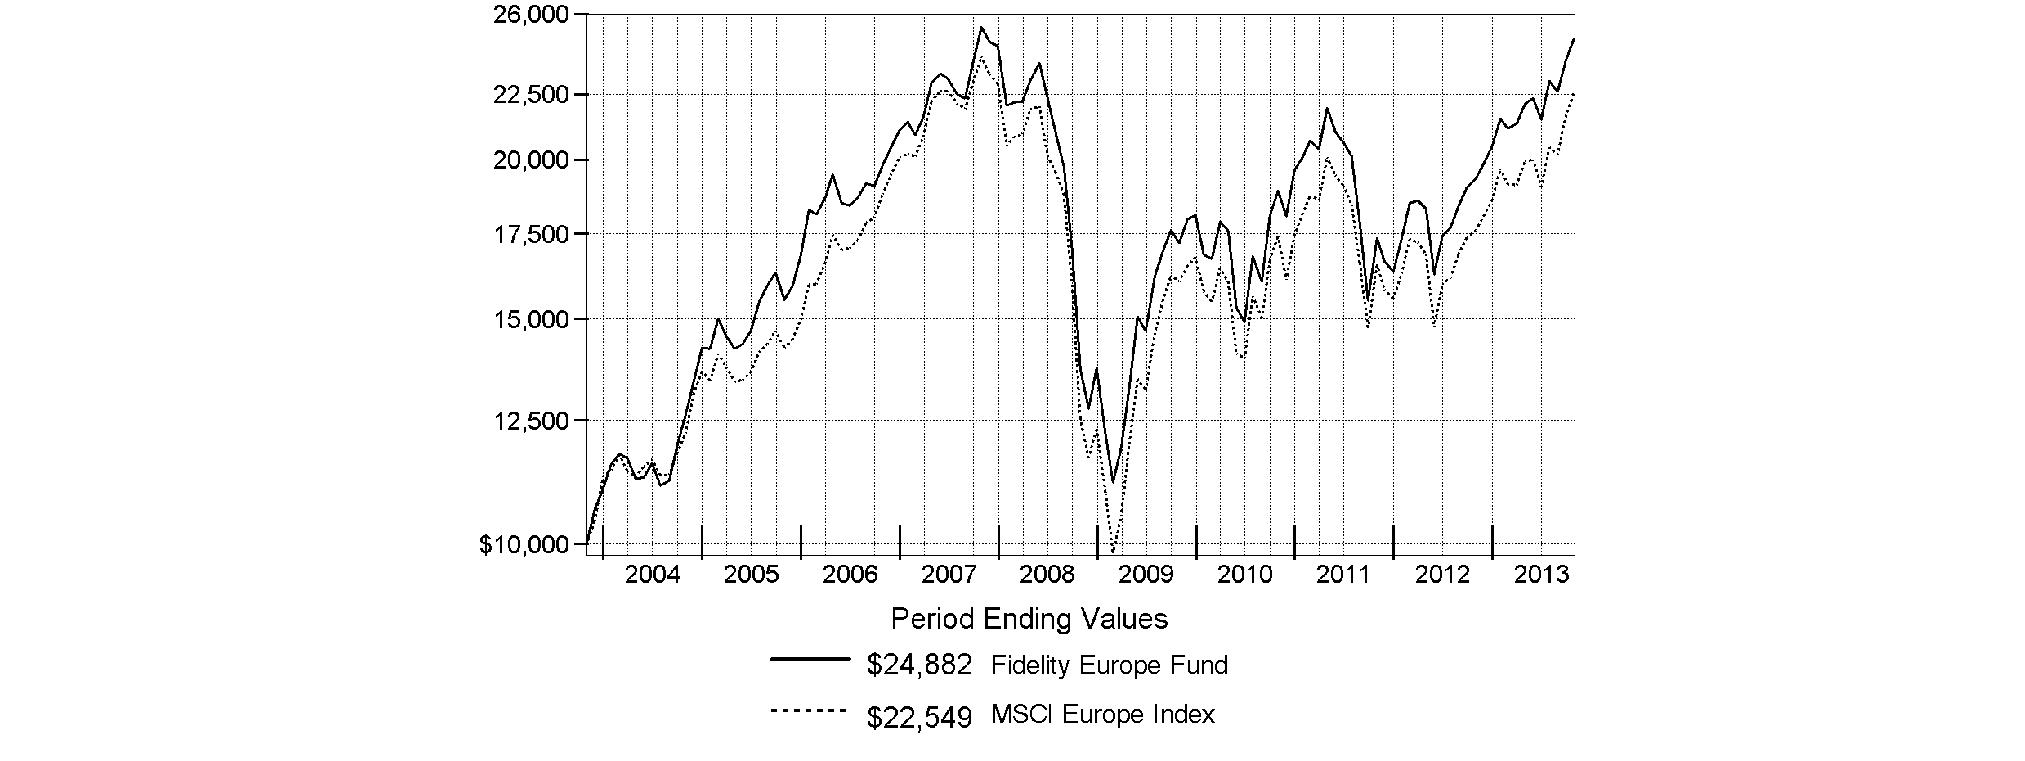
Annual Report
Fidelity Europe Fund
Market Recap: On balance, global equity markets remained upbeat for the 12-month period ending October 31, 2013. The MSCI® ACWI® (All Country World Index) Index gained 23.75% for the period, amid investor preference for higher-risk assets. The period was not without turbulence, however. In the spring and summer, central banks worldwide, especially in the U.S. and China, made clear their intentions to maintain accommodative monetary policies. That stance, combined with modest cyclical improvements around the globe and generally low valuations, underpinned the broad rally in equities. Europe (+32%) shone brightly, with most markets in the region - large and small - registering solid, index-beating gains. Another bright spot was Japan, which, despite a struggling yen and taking a second-half breather, posted a 34% result for the full year. The U.S. - by far the index's biggest constituent - also outperformed the global market with a roughly 28% advance. Meanwhile, Asia-Pacific ex Japan (+14%) lagged, hurt in part by a slowdown in Australia's mining industry as well as currency headwinds. Foreign-exchange and commodity weakness also curbed results in resource-heavy Canada and emerging markets (EM), both of which were up 7%. Country-level EM performance diverged meaningfully for the period, as evidenced by performance in Brazil (-1%), Russia (+12%), India (+1%) and China (+8%).
Comments from Risteard Hogan, Portfolio Manager of Fidelity® Europe Fund: For the year, the fund rose 28.71%, while the MSCI® Europe Index gained 28.00%. U.K. homebuilder Taylor Wimpey provided the biggest boost to relative performance, as its shares rose alongside a steadily rebounding U.K. housing market. U.K. insulation distributor SIG also benefited from this rebound, with shares rising amid increased construction in the U.K. and stabilization in France. In consumer staples, it helped to own Greencore Group, a Dublin-based prepared foods and ingredients supplier that experienced steady growth in both its European markets and its new U.S. markets. On the downside, two materials stocks were among the largest detractors: Canadian gold producer Goldcorp and U.K.-based minerals processor BHP Billiton. As commodity prices declined during the period, due in part to waning demand from emerging markets, these companies suffered. I sold Goldcorp after questioning the company's prospects in the wake of some unexpected issues that increased costs. Lastly, I'll mention the fund's average 3% cash position, which detracted. All of the stocks I've mentioned, except BHP Billiton, were not in the index.
Note to shareholders: On December 16, 2013, Stefan Lindblad will join Risteard Hogan as a co-portfolio manager of the fund.
The views expressed above reflect those of the portfolio manager(s) only through the end of the period as stated on the cover of this report and do not necessarily represent the views of Fidelity or any other person in the Fidelity organization. Any such views are subject to change at any time based upon market or other conditions and Fidelity disclaims any responsibility to update such views. These views may not be relied on as investment advice and, because investment decisions for a Fidelity fund are based on numerous factors, may not be relied on as an indication of trading intent on behalf of any Fidelity fund.
Annual Report
Fidelity Europe Fund
As a shareholder of the Fund, you incur two types of costs: (1) transaction costs, including redemption fees and (2) ongoing costs, including management fees and other Fund expenses. This Example is intended to help you understand your ongoing costs (in dollars) of investing in the Fund and to compare these costs with the ongoing costs of investing in other mutual funds.
The Example is based on an investment of $1,000 invested at the beginning of the period and held for the entire period (May 1, 2013 to October 31, 2013).
Actual Expenses
The first line of the accompanying table provides information about actual account values and actual expenses. You may use the information in this line, together with the amount you invested, to estimate the expenses that you paid over the period. Simply divide your account value by $1,000.00 (for example, an $8,600 account value divided by $1,000.00 = 8.6), then multiply the result by the number in the first line under the heading entitled "Expenses Paid During Period" to estimate the expenses you paid on your account during this period. A small balance maintenance fee of $12.00 that is charged once a year may apply for certain accounts with a value of less than $2,000. This fee is not included in the table below. If it was, the estimate of expenses you paid during the period would be higher, and your ending account value lower, by this amount. In addition, the Fund, as a shareholder in the underlying Fidelity Central Funds, will indirectly bear its pro-rata share of the fees and expenses incurred by the underlying Fidelity Central Funds. These fees and expenses are not included in the Fund's annualized expense ratio used to calculate the expense estimate in the table below.
Hypothetical Example for Comparison Purposes
The second line of the accompanying table provides information about hypothetical account values and hypothetical expenses based on the Fund's actual expense ratio and an assumed rate of return of 5% per year before expenses, which is not the Fund's actual return. The hypothetical account values and expenses may not be used to estimate the actual ending account balance or expenses you paid for the period. You may use this information to compare the ongoing costs of investing in the Fund and other funds. To do so, compare this 5% hypothetical example with the 5% hypothetical examples that appear in the shareholder reports of the other funds. A small balance maintenance fee of $12.00 that is charged once a year may apply for certain accounts with a value of less than $2,000. This fee is not included in the table below. If it was, the estimate of expenses you paid during the period would be higher, and your ending account value lower, by this amount. In addition, the Fund, as a shareholder in the underlying Fidelity Central Funds, will indirectly bear its pro-rata share of the fees and expenses incurred by the underlying Fidelity Central Funds. These fees and expenses are not included in the Fund's annualized expense ratio used to calculate the expense estimate in the table below.
Please note that the expenses shown in the table are meant to highlight your ongoing costs only and do not reflect any transaction costs. Therefore, the second line of the table is useful in comparing ongoing costs only, and will not help you determine the relative total costs of owning different funds. In addition, if these transactional costs were included, your costs would have been higher.
| Annualized
Expense Ratio B | Beginning
Account Value
May 1, 2013 | Ending
Account Value
October 31, 2013 | Expenses Paid
During Period*
May 1, 2013
to October 31, 2013 |
Actual | 1.06% | $ 1,000.00 | $ 1,126.20 | $ 5.68 |
Hypothetical A | | $ 1,000.00 | $ 1,019.86 | $ 5.40 |
A 5% return per year before expenses
B Annualized expense ratio reflects expenses net of applicable fee waivers.
* Expenses are equal to the Fund's annualized expense ratio, multiplied by the average account value over the period, multiplied by 184/365 (to reflect the one-half year period).
Annual Report
Fidelity Europe Fund
Investment Changes (Unaudited)
Geographic Diversification (% of fund's net assets) |
As of October 31, 2013 |
| United Kingdom | 30.5% | |
| France | 14.7% | |
| Germany | 13.2% | |
| Switzerland | 12.8% | |
| United States of America* | 4.7% | |
| Italy | 3.5% | |
| Finland | 3.0% | |
| Ireland | 2.9% | |
| Belgium | 2.8% | |
| Other | 11.9% | |

* Includes Short-Term Investments and Net Other Assets (Liabilities).
Percentages are based on country or territory of incorporation and are adjusted for the effect of futures contracts, if applicable. |
As of April 30, 2013 |
| United Kingdom | 31.5% | |
| Germany | 14.1% | |
| Switzerland | 13.8% | |
| France | 11.4% | |
| Italy | 4.6% | |
| United States of America* | 3.6% | |
| Ireland | 2.8% | |
| Belgium | 2.7% | |
| Denmark | 2.5% | |
| Other | 13.0% | |

* Includes Short-Term Investments and Net Other Assets (Liabilities).
Percentages are based on country or territory of incorporation and are adjusted for the effect of futures contracts, if applicable. |
Asset Allocation as of October 31, 2013 |
| % of fund's
net assets | % of fund's net assets
6 months ago |
Stocks | 97.3 | 98.2 |
Short-Term Investments and Net Other Assets (Liabilities) | 2.7 | 1.8 |
Top Ten Stocks as of October 31, 2013 |
| % of fund's
net assets | % of fund's net assets
6 months ago |
Nestle SA (Switzerland, Food Products) | 3.6 | 3.9 |
Roche Holding AG (participation certificate) (Switzerland, Pharmaceuticals) | 3.3 | 3.5 |
Total SA (France, Oil, Gas & Consumable Fuels) | 2.5 | 0.0 |
British American Tobacco PLC (United Kingdom) (United Kingdom, Tobacco) | 2.2 | 2.4 |
Sanofi SA (France, Pharmaceuticals) | 2.1 | 2.5 |
GlaxoSmithKline PLC (United Kingdom, Pharmaceuticals) | 2.1 | 1.3 |
Royal Dutch Shell PLC Class B (United Kingdom) (United Kingdom, Oil, Gas & Consumable Fuels) | 1.8 | 2.7 |
Bayer AG (Germany, Pharmaceuticals) | 1.7 | 1.7 |
BASF AG (Germany, Chemicals) | 1.7 | 1.6 |
Anheuser-Busch InBev SA NV (Belgium, Beverages) | 1.6 | 1.8 |
| 22.6 | |
Market Sectors as of October 31, 2013 |
| % of fund's
net assets | % of fund's net assets
6 months ago |
Financials | 19.9 | 20.0 |
Consumer Staples | 15.9 | 18.3 |
Industrials | 15.1 | 12.9 |
Consumer Discretionary | 14.9 | 13.4 |
Health Care | 11.5 | 12.4 |
Energy | 6.9 | 6.3 |
Materials | 6.5 | 7.2 |
Telecommunication Services | 3.5 | 2.6 |
Information Technology | 2.3 | 3.5 |
Utilities | 0.8 | 1.6 |
Annual Report
Fidelity Europe Fund
Investments October 31, 2013
Showing Percentage of Net Assets
Common Stocks - 96.1% |
| Shares | | Value |
Austria - 1.3% |
Andritz AG | 98,700 | | $ 6,080,030 |
Erste Group Bank AG | 169,772 | | 5,987,444 |
TOTAL AUSTRIA | | 12,067,474 |
Bailiwick of Jersey - 0.8% |
Informa PLC | 560,113 | | 5,024,787 |
Shire PLC | 52,700 | | 2,336,741 |
TOTAL BAILIWICK OF JERSEY | | 7,361,528 |
Belgium - 2.8% |
Anheuser-Busch InBev SA NV | 150,900 | | 15,642,858 |
KBC Groupe SA | 112,376 | | 6,126,027 |
UCB SA | 76,600 | | 5,035,857 |
TOTAL BELGIUM | | 26,804,742 |
Bermuda - 0.4% |
Bunge Ltd. | 47,900 | | 3,934,027 |
British Virgin Islands - 0.4% |
Mail.Ru Group Ltd. GDR (Reg. S) | 109,869 | | 4,051,969 |
Canada - 0.5% |
Suncor Energy, Inc. | 125,800 | | 4,571,584 |
Denmark - 0.5% |
Coloplast A/S Series B | 79,200 | | 5,164,418 |
Finland - 3.0% |
Amer Group PLC (A Shares) | 231,300 | | 4,754,680 |
Kesko Oyj | 111,300 | | 3,699,358 |
Lassila & Tikahoja Oyj | 218,969 | | 4,593,365 |
Raisio Group PLC (V Shares) | 525,331 | | 3,059,920 |
Rakentajain Konevuokraamo Oyj (B Shares) | 241,672 | | 4,833,357 |
Sampo Oyj (A Shares) | 162,100 | | 7,678,985 |
TOTAL FINLAND | | 28,619,665 |
France - 14.7% |
Atos Origin SA | 66,067 | | 5,640,491 |
AXA SA | 433,900 | | 10,839,950 |
BNP Paribas SA | 207,661 | | 15,377,647 |
Christian Dior SA | 65,645 | | 12,478,130 |
GDF Suez | 317,729 | | 7,911,813 |
Ipsos SA | 130,000 | | 5,483,206 |
Kering SA | 35,600 | | 8,089,013 |
Legrand SA | 112,300 | | 6,378,043 |
Publicis Groupe SA | 87,355 | | 7,285,982 |
Rexel SA | 160,130 | | 4,011,335 |
Sanofi SA | 189,454 | | 20,200,199 |
Schneider Electric SA | 102,800 | | 8,660,734 |
Technip SA | 46,700 | | 4,891,844 |
Total SA | 387,600 | | 23,780,415 |
TOTAL FRANCE | | 141,028,802 |
Germany - 12.0% |
adidas AG | 67,100 | | 7,660,111 |
BASF AG | 158,647 | | 16,506,329 |
|
| Shares | | Value |
Bayer AG | 133,900 | | $ 16,642,222 |
Beiersdorf AG | 53,800 | | 5,135,931 |
Continental AG | 36,000 | | 6,596,221 |
CTS Eventim AG | 86,620 | | 4,228,019 |
Daimler AG (Germany) | 160,220 | | 13,148,039 |
Deutsche Boerse AG | 68,100 | | 5,127,061 |
Deutsche Post AG | 236,057 | | 7,988,622 |
ElringKlinger AG | 81,393 | | 3,466,741 |
GEA Group AG | 131,384 | | 5,717,291 |
GSW Immobilien AG | 88,800 | | 4,129,461 |
HeidelbergCement Finance AG | 67,700 | | 5,336,856 |
KION Group AG (a) | 106,815 | | 4,350,842 |
Linde AG | 46,900 | | 8,911,803 |
TOTAL GERMANY | | 114,945,549 |
Ireland - 2.9% |
CRH PLC | 249,700 | | 6,076,095 |
DCC PLC (United Kingdom) | 106,000 | | 4,757,192 |
FBD Holdings PLC | 98,000 | | 2,115,646 |
Greencore Group PLC | 1,988,700 | | 5,742,816 |
Kingspan Group PLC (United Kingdom) | 278,000 | | 4,699,309 |
Ryanair Holdings PLC sponsored ADR | 90,200 | | 4,528,942 |
TOTAL IRELAND | | 27,920,000 |
Italy - 3.5% |
Astaldi SpA | 469,217 | | 4,574,230 |
Azimut Holding SpA | 187,300 | | 4,758,076 |
Banca Popolare dell'Emilia Romagna Scrl (a) | 282,600 | | 2,718,516 |
Lottomatica SpA | 119,200 | | 3,623,683 |
MARR SpA | 334,907 | | 5,265,657 |
Prada SpA | 441,200 | | 4,302,169 |
Prysmian SpA | 180,600 | | 4,413,774 |
World Duty Free SpA (a) | 377,278 | | 4,179,954 |
TOTAL ITALY | | 33,836,059 |
Luxembourg - 0.3% |
Eurofins Scientific SA | 11,100 | | 3,043,594 |
Netherlands - 1.7% |
ASML Holding NV (Netherlands) | 77,755 | | 7,362,448 |
Koninklijke Philips Electronics NV | 262,307 | | 9,270,122 |
TOTAL NETHERLANDS | | 16,632,570 |
Norway - 1.7% |
DNB ASA | 457,400 | | 8,106,046 |
Telenor ASA | 329,800 | | 7,922,225 |
TOTAL NORWAY | | 16,028,271 |
Russia - 0.5% |
Magnit OJSC GDR (Reg. S) | 70,400 | | 4,523,200 |
South Africa - 0.4% |
Naspers Ltd. Class N | 45,700 | | 4,274,666 |
Common Stocks - continued |
| Shares | | Value |
Spain - 1.4% |
Criteria CaixaCorp SA (d) | 1,448,308 | | $ 7,529,500 |
Repsol YPF SA | 228,459 | | 6,135,562 |
TOTAL SPAIN | | 13,665,062 |
Sweden - 2.0% |
AF AB (B Shares) | 21,656 | | 685,100 |
Investment AB Kinnevik (B Shares) | 143,900 | | 5,302,941 |
Svenska Handelsbanken AB (A Shares) | 155,500 | | 7,045,439 |
Swedish Match Co. AB | 174,800 | | 5,767,276 |
TOTAL SWEDEN | | 18,800,756 |
Switzerland - 12.8% |
Adecco SA (Reg.) | 74,314 | | 5,483,355 |
Aryzta AG | 84,940 | | 6,346,980 |
Baloise Holdings AG | 44,174 | | 5,141,097 |
Credit Suisse Group | 100,005 | | 3,110,952 |
Nestle SA | 481,518 | | 34,757,870 |
Partners Group Holding AG | 20,140 | | 5,218,399 |
Roche Holding AG (participation certificate) | 113,848 | | 31,518,838 |
Schindler Holding AG (participation certificate) | 40,588 | | 5,757,068 |
Syngenta AG (Switzerland) | 20,759 | | 8,378,679 |
UBS AG (NY Shares) | 605,700 | | 11,726,352 |
Vontobel Holdings AG | 119,059 | | 4,769,708 |
TOTAL SWITZERLAND | | 122,209,298 |
United Kingdom - 30.5% |
Associated British Foods PLC | 199,986 | | 7,269,307 |
Babcock International Group PLC | 292,500 | | 5,979,680 |
Barclays PLC | 3,182,895 | | 13,391,922 |
BG Group PLC | 462,500 | | 9,443,926 |
BHP Billiton PLC | 457,386 | | 14,114,245 |
British American Tobacco PLC (United Kingdom) | 379,800 | | 20,954,434 |
BT Group PLC | 1,689,900 | | 10,224,966 |
Bunzl PLC | 236,400 | | 5,219,433 |
Cineworld Group PLC | 646,195 | | 3,841,374 |
Compass Group PLC | 504,100 | | 7,250,217 |
Dechra Pharmaceuticals PLC | 338,200 | | 3,741,662 |
Diageo PLC | 436,258 | | 13,906,805 |
Galliford Try PLC | 237,600 | | 4,365,891 |
GlaxoSmithKline PLC | 748,241 | | 19,725,412 |
HSBC Holdings PLC (United Kingdom) | 713,658 | | 7,822,651 |
ICAP PLC | 830,744 | | 5,130,922 |
IMI PLC | 216,500 | | 5,272,997 |
ITV PLC | 2,116,900 | | 6,479,599 |
Kingfisher PLC | 1,153,900 | | 6,984,366 |
London Stock Exchange Group PLC | 177,800 | | 4,681,088 |
Meggitt PLC | 596,170 | | 5,472,522 |
Mondi PLC | 159,700 | | 2,852,542 |
Next PLC | 72,600 | | 6,338,352 |
Partnership Assurance Group PLC | 583,711 | | 3,818,563 |
|
| Shares | | Value |
Prudential PLC | 622,472 | | $ 12,730,028 |
Rolls-Royce Group PLC | 448,664 | | 8,272,960 |
Royal Dutch Shell PLC Class B (United Kingdom) | 487,148 | | 16,865,081 |
Schroders PLC | 127,700 | | 5,280,610 |
Serco Group PLC | 494,283 | | 4,414,411 |
SIG PLC | 1,391,700 | | 4,596,791 |
Standard Chartered PLC (United Kingdom) | 480,530 | | 11,553,375 |
Taylor Wimpey PLC | 3,257,374 | | 5,755,607 |
The Go-Ahead Group PLC | 104,707 | | 2,823,863 |
Unite Group PLC | 704,650 | | 4,474,150 |
Vodafone Group PLC | 4,099,800 | | 15,016,595 |
William Hill PLC | 88 | | 566 |
WM Morrison Supermarkets PLC | 1,225,000 | | 5,531,089 |
TOTAL UNITED KINGDOM | | 291,598,002 |
United States of America - 2.0% |
Amgen, Inc. | 20,200 | | 2,343,200 |
Beam, Inc. | 58,000 | | 3,903,400 |
Colgate-Palmolive Co. | 61,925 | | 4,008,405 |
Oracle Corp. | 137,400 | | 4,602,900 |
Philip Morris International, Inc. | 44,300 | | 3,948,016 |
TOTAL UNITED STATES OF AMERICA | | 18,805,921 |
TOTAL COMMON STOCKS (Cost $751,125,527) |
919,887,157
|
Nonconvertible Preferred Stocks - 1.2% |
| | | |
Germany - 1.2% |
Volkswagen AG | 42,700 | | 10,853,093 |
United Kingdom - 0.0% |
Rolls-Royce Group PLC: | | | |
(C Shares) (a) | 80,732,080 | | 129,446 |
Series C | 38,585,104 | | 61,867 |
TOTAL UNITED KINGDOM | | 191,313 |
TOTAL NONCONVERTIBLE PREFERRED STOCKS (Cost $7,883,819) |
11,044,406
|
Money Market Funds - 4.1% |
| Shares | | Value |
Fidelity Cash Central Fund, 0.09% (b) | 32,758,296 | | $ 32,758,296 |
Fidelity Securities Lending Cash Central Fund, 0.09% (b)(c) | 6,390,807 | | 6,390,807 |
TOTAL MONEY MARKET FUNDS (Cost $39,149,103) |
39,149,103
|
TOTAL INVESTMENT PORTFOLIO - 101.4% (Cost $798,158,449) | | 970,080,666 |
NET OTHER ASSETS (LIABILITIES) - (1.4)% | | (13,032,277) |
NET ASSETS - 100% | $ 957,048,389 |
Legend |
(a) Non-income producing |
(b) Affiliated fund that is generally available only to investment companies and other accounts managed by Fidelity Investments. The rate quoted is the annualized seven-day yield of the fund at period end. A complete unaudited listing of the fund's holdings as of its most recent quarter end is available upon request. In addition, each Fidelity Central Fund's financial statements, which are not covered by the Fund's Report of Independent Registered Public Accounting Firm, are available on the SEC's website or upon request. |
(c) Investment made with cash collateral received from securities on loan. |
(d) Security or a portion of the security is on loan at period end. |
Affiliated Central Funds |
Information regarding fiscal year to date income earned by the Fund from investments in Fidelity Central Funds is as follows: |
Fund | Income earned |
Fidelity Cash Central Fund | $ 26,881 |
Fidelity Securities Lending Cash Central Fund | 411,237 |
Total | $ 438,118 |
Other Information |
Categorizations in the Schedule of Investments are based on country or territory of incorporation. |
The following is a summary of the inputs used, as of October 31, 2013, involving the Fund's assets and liabilities carried at fair value. The inputs or methodology used for valuing securities may not be an indication of the risk associated with investing in those securities. For more information on valuation inputs, and their aggregation into the levels used in the tables below, please refer to the Investment Valuation section in the accompanying Notes to Financial Statements. |
Valuation Inputs at Reporting Date: |
Description | Total | Level 1 | Level 2 | Level 3 |
Investments in Securities: | | | | |
Equities: | | | | |
Consumer Discretionary | $ 142,098,575 | $ 142,098,575 | $ - | $ - |
Consumer Staples | 153,397,349 | 68,135,382 | 85,261,967 | - |
Energy | 65,688,412 | 25,042,916 | 40,645,496 | - |
Financials | 191,692,556 | 154,637,003 | 37,055,553 | - |
Health Care | 109,752,143 | 67,489,791 | 42,262,352 | - |
Industrials | 143,392,572 | 134,122,450 | 9,270,122 | - |
Information Technology | 21,657,808 | 14,295,360 | 7,362,448 | - |
Materials | 62,176,549 | 33,607,530 | 28,569,019 | - |
Telecommunication Services | 33,163,786 | 7,922,225 | 25,241,561 | - |
Utilities | 7,911,813 | 7,911,813 | - | - |
Money Market Funds | 39,149,103 | 39,149,103 | - | - |
Total Investments in Securities: | $ 970,080,666 | $ 694,412,148 | $ 275,668,518 | $ - |
The following is a summary of transfers between Level 1 and Level 2 for the period ended October 31, 2013. Transfers are assumed to have occurred at the beginning of the period, and are primarily attributable to the valuation techniques used for foreign equity securities, as discussed in the accompanying Notes to Financial Statements: |
Transfers | Total |
Level 1 to Level 2 | $ 25,860,835 |
Level 2 to Level 1 | $ 0 |
See accompanying notes which are an integral part of the financial statements.
Annual Report
Fidelity Europe Fund
Statement of Assets and Liabilities
| October 31, 2013 |
| | |
Assets | | |
Investment in securities, at value (including securities loaned of $6,195,027) - See accompanying schedule: Unaffiliated issuers (cost $759,009,346) | $ 930,931,563 | |
Fidelity Central Funds (cost $39,149,103) | 39,149,103 | |
Total Investments (cost $798,158,449) | | $ 970,080,666 |
Receivable for investments sold | | 6,025,746 |
Receivable for fund shares sold | | 1,110,635 |
Dividends receivable | | 1,491,562 |
Distributions receivable from Fidelity Central Funds | | 5,239 |
Prepaid expenses | | 2,607 |
Other receivables | | 33,923 |
Total assets | | 978,750,378 |
| | |
Liabilities | | |
Payable to custodian bank | $ 37 | |
Payable for investments purchased | 14,080,480 | |
Payable for fund shares redeemed | 421,167 | |
Accrued management fee | 555,450 | |
Other affiliated payables | 174,597 | |
Other payables and accrued expenses | 79,451 | |
Collateral on securities loaned, at value | 6,390,807 | |
Total liabilities | | 21,701,989 |
| | |
Net Assets | | $ 957,048,389 |
Net Assets consist of: | | |
Paid in capital | | $ 1,032,108,370 |
Undistributed net investment income | | 11,865,416 |
Accumulated undistributed net realized gain (loss) on investments and foreign currency transactions | | (258,862,965) |
Net unrealized appreciation (depreciation) on investments and assets and liabilities in foreign currencies | | 171,937,568 |
Net Assets, for 25,237,170 shares outstanding | | $ 957,048,389 |
Net Asset Value, offering price and redemption price per share ($957,048,389 ÷ 25,237,170 shares) | | $ 37.92 |
Statement of Operations
| Year ended October 31, 2013 |
| | |
Investment Income | | |
Dividends | | $ 22,175,090 |
Interest | | 39 |
Income from Fidelity Central Funds | | 438,118 |
Income before foreign taxes withheld | | 22,613,247 |
Less foreign taxes withheld | | (1,687,382) |
Total income | | 20,925,865 |
| | |
Expenses | | |
Management fee Basic fee | $ 5,167,281 | |
Performance adjustment | 554,108 | |
Transfer agent fees | 1,465,123 | |
Accounting and security lending fees | 357,935 | |
Custodian fees and expenses | 96,176 | |
Independent trustees' compensation | 4,352 | |
Registration fees | 41,511 | |
Audit | 75,371 | |
Legal | 5,919 | |
Miscellaneous | 5,419 | |
Total expenses before reductions | 7,773,195 | |
Expense reductions | (253,552) | 7,519,643 |
Net investment income (loss) | | 13,406,222 |
Realized and Unrealized Gain (Loss) Net realized gain (loss) on: | | |
Investment securities: | | |
Unaffiliated issuers | 36,471,524 | |
Foreign currency transactions | 52,955 | |
Total net realized gain (loss) | | 36,524,479 |
Change in net unrealized appreciation (depreciation) on: Investment securities | 135,823,155 | |
Assets and liabilities in foreign currencies | 22,388 | |
Total change in net unrealized appreciation (depreciation) | | 135,845,543 |
Net gain (loss) | | 172,370,022 |
Net increase (decrease) in net assets resulting from operations | | $ 185,776,244 |
See accompanying notes which are an integral part of the financial statements.
Annual Report
Fidelity Europe Fund
Financial Statements - continued
Statement of Changes in Net Assets
| Year ended
October 31,
2013 | Year ended
October 31,
2012 |
Increase (Decrease) in Net Assets | | |
Operations | | |
Net investment income (loss) | $ 13,406,222 | $ 13,558,627 |
Net realized gain (loss) | 36,524,479 | (9,096,398) |
Change in net unrealized appreciation (depreciation) | 135,845,543 | 57,826,009 |
Net increase (decrease) in net assets resulting from operations | 185,776,244 | 62,288,238 |
Distributions to shareholders from net investment income | (14,113,486) | (13,165,713) |
Distributions to shareholders from net realized gain | (241,945) | (376,163) |
Total distributions | (14,355,431) | (13,541,876) |
Share transactions
Proceeds from sales of shares | 335,694,105 | 48,215,969 |
Reinvestment of distributions | 13,676,925 | 12,914,887 |
Cost of shares redeemed | (166,283,398) | (129,152,722) |
Net increase (decrease) in net assets resulting from share transactions | 183,087,632 | (68,021,866) |
Redemption fees | 19,946 | 17,058 |
Total increase (decrease) in net assets | 354,528,391 | (19,258,446) |
| | |
Net Assets | | |
Beginning of period | 602,519,998 | 621,778,444 |
End of period (including undistributed net investment income of $11,865,416 and undistributed net investment income of $11,969,152, respectively) | $ 957,048,389 | $ 602,519,998 |
Other Information Shares | | |
Sold | 9,813,431 | 1,722,766 |
Issued in reinvestment of distributions | 448,718 | 496,918 |
Redeemed | (5,011,867) | (4,702,289) |
Net increase (decrease) | 5,250,282 | (2,482,605) |
Financial Highlights
Years ended October 31, | 2013 | 2012 | 2011 | 2010 | 2009 |
Selected Per-Share Data | | | | | |
Net asset value, beginning of period | $ 30.15 | $ 27.67 | $ 30.83 | $ 28.52 | $ 23.57 |
Income from Investment Operations | | | | | |
Net investment income (loss) B | .61 | .64 | .48 | .33 | .52 |
Net realized and unrealized gain (loss) | 7.87 | 2.45 | (2.97) | 2.50 | 5.16 |
Total from investment operations | 8.48 | 3.09 | (2.49) | 2.83 | 5.68 |
Distributions from net investment income | (.70) | (.60) | (.67) | (.52) | (.73) |
Distributions from net realized gain | (.01) | (.02) | - | - | - |
Total distributions | (.71) | (.61) G | (.67) | (.52) | (.73) |
Redemption fees added to paid in capital B, F | - | - | - | - | - |
Net asset value, end of period | $ 37.92 | $ 30.15 | $ 27.67 | $ 30.83 | $ 28.52 |
Total Return A | 28.71% | 11.53% | (8.32)% | 10.01% | 25.36% |
Ratios to Average Net Assets C, E | | | | | |
Expenses before reductions | 1.06% | .83% | 1.10% | 1.12% | 1.09% |
Expenses net of fee waivers, if any | 1.05% | .83% | 1.10% | 1.12% | 1.09% |
Expenses net of all reductions | 1.02% | .80% | 1.06% | 1.04% | 1.04% |
Net investment income (loss) | 1.82% | 2.33% | 1.56% | 1.15% | 2.22% |
Supplemental Data | | | | | |
Net assets, end of period (000 omitted) | $ 957,048 | $ 602,520 | $ 621,778 | $ 802,527 | $ 2,845,423 |
Portfolio turnover rate D | 59% | 127% | 117% | 136% | 135% |
ATotal returns would have been lower if certain expenses had not been reduced during the applicable periods shown. BCalculated based on average shares outstanding during the period. CFees and expenses of any underlying Fidelity Central Funds are not included in the Fund's expense ratio. The Fund indirectly bears its proportionate share of the expenses of any underlying Fidelity Central Funds. DAmount does not include the portfolio activity of any underlying Fidelity Central Funds. EExpense ratios reflect operating expenses of the Fund. Expenses before reductions do not reflect amounts reimbursed by the investment adviser or reductions from brokerage service arrangements or reductions from other expense offset arrangements and do not represent the amount paid by the Fund during periods when reimbursements or reductions occur. Expenses net of fee waivers reflect expenses after reimbursement by the investment adviser but prior to reductions from brokerage service arrangements or other expense offset arrangements. Expenses net of all reductions represent the net expenses paid by the Fund. FAmount represents less than $.01 per share. GTotal distributions of $.061 per share is comprised of distributions from net investment income of $.595 and distributions from net realized gain of $.017 per share. |
See accompanying notes which are an integral part of the financial statements.
Annual Report
Notes to Financial Statements
For the period ended October 31, 2013
1. Organization.
Fidelity Europe Fund (the Fund) is a fund of Fidelity Investment Trust (the Trust) and is authorized to issue an unlimited number of shares. The Trust is registered under the Investment Company Act of 1940, as amended (the 1940 Act), as an open-end management investment company organized as a Massachusetts business trust.
2. Investments in Fidelity Central Funds.
The Fund invests in Fidelity Central Funds, which are open-end investment companies generally available only to other investment companies and accounts managed by Fidelity Management & Research Company (FMR) and its affiliates. The Fund's Schedule of Investments lists each of the Fidelity Central Funds held as of period end, if any, as an investment of the Fund, but does not include the underlying holdings of each Fidelity Central Fund. As an Investing Fund, the Fund indirectly bears its proportionate share of the expenses of the underlying Fidelity Central Funds.
The Money Market Central Funds seek preservation of capital and current income and are managed by Fidelity Investments Money Management, Inc. (FIMM), an affiliate of FMR.
A complete unaudited list of holdings for each Fidelity Central Fund is available upon request or at the Securities and Exchange Commission (the SEC) website at www.sec.gov. In addition, the financial statements of the Fidelity Central Funds, which are not covered by the Fund's Report of Independent Registered Public Accounting Firm, are available on the SEC website or upon request.
3. Significant Accounting Policies.
The financial statements have been prepared in conformity with accounting principles generally accepted in the United States of America (GAAP), which require management to make certain estimates and assumptions at the date of the financial statements. Actual results could differ from those estimates. Subsequent events, if any, through the date that the financial statements were issued have been evaluated in the preparation of the financial statements. The following summarizes the significant accounting policies of the Fund:
Investment Valuation. Investments are valued as of 4:00 p.m. Eastern time on the last calendar day of the period. In accordance with valuation policies and procedures approved by the Board of Trustees (the Board), the Fund attempts to obtain prices from one or more third party pricing vendors or brokers to value its investments. When current market prices, quotations or currency exchange rates are not readily available or reliable, investments will be fair valued in good faith by the FMR Fair Value Committee (the Committee), in accordance with procedures adopted by the Board. Factors used in determining fair value vary by investment type and may include market or investment specific events, changes in interest rates and credit quality. The frequency with which these procedures are used cannot be predicted and they may be utilized to a significant extent. The Committee oversees the Fund's valuation policies and procedures and is responsible for approving and reporting to the Board all fair value determinations.
The Fund categorizes the inputs to valuation techniques used to value its investments into a disclosure hierarchy consisting of three levels as shown below:
Level 1 - quoted prices in active markets for identical investments
Level 2 - other significant observable inputs (including quoted prices for similar investments, interest rates, prepayment speeds, etc.)
Level 3 - unobservable inputs (including the Fund's own assumptions based on the best information available)
Valuation techniques used to value the Fund's investments by major category are as follows:
Equity securities, including restricted securities, for which market quotations are readily available, are valued at the last reported sale price or official closing price as reported by a third party pricing vendor on the primary market or exchange on which they are traded and are categorized as Level 1 in the hierarchy. In the event there were no sales during the day or closing prices are not available, securities are valued at the last quoted bid price or may be valued using the last available price and are generally categorized as Level 2 in the hierarchy. For foreign equity securities, when market or security specific events arise, comparisons to the valuation of American Depositary Receipts (ADRs), futures contracts, Exchange-Traded Funds (ETFs) and certain indexes as well as quoted prices for similar securities may be used and would be categorized as Level 2 in the hierarchy. Utilizing these techniques may result in transfers between Level 1 and Level 2. For equity securities, including restricted securities, where observable inputs are limited, assumptions about market activity and risk are used and these securities may be categorized as Level 3 in the hierarchy.
Investments in open-end mutual funds, including the Fidelity Central Funds, are valued at their closing net asset value (NAV) each business day and are categorized as Level 1 in the hierarchy.
Changes in valuation techniques may result in transfers in or out of an assigned level within the disclosure hierarchy. The aggregate value of investments by input level, as of October 31, 2013, including information on transfers between Levels 1 and 2, is included at the end of the Fund's Schedule of Investments.
Annual Report
Notes to Financial Statements - continued
3. Significant Accounting Policies - continued
Foreign Currency. The Fund may use foreign currency contracts to facilitate transactions in foreign-denominated securities. Gains and losses from these transactions may arise from changes in the value of the foreign currency or if the counterparties do not perform under the contracts' terms.
Foreign-denominated assets, including investment securities, and liabilities are translated into U.S. dollars at the exchange rates at period end. Purchases and sales of investment securities, income and dividends received and expenses denominated in foreign currencies are translated into U.S. dollars at the exchange rate in effect on the transaction date.
The effects of exchange rate fluctuations on investments are included with the net realized and unrealized gain (loss) on investment securities. Other foreign currency transactions resulting in realized and unrealized gain (loss) are disclosed separately.
Investment Transactions and Income. For financial reporting purposes, the Fund's investment holdings and NAV include trades executed through the end of the last business day of the period. The NAV per share for processing shareholder transactions is calculated as of the close of business of the New York Stock Exchange (NYSE), normally 4:00 p.m. Eastern time and includes trades executed through the end of the prior business day. Gains and losses on securities sold are determined on the basis of identified cost and may include proceeds received from litigation. Dividend income is recorded on the ex-dividend date, except for certain dividends from foreign securities where the ex-dividend date may have passed, which are recorded as soon as the Fund is informed of the ex-dividend date. Non-cash dividends included in dividend income, if any, are recorded at the fair market value of the securities received. Distributions received on securities that represent a return of capital or capital gain are recorded as a reduction of cost of investments and/or as a realized gain. Subsequent to ex-dividend date the Fund determines the components of these distributions, based upon receipt of tax filings or other correspondence relating to the underlying investment. Interest income and distributions from the Fidelity Central Funds are accrued as earned. Interest income includes coupon interest and amortization of premium and accretion of discount on debt securities. Investment income is recorded net of foreign taxes withheld where recovery of such taxes is uncertain.
Expenses. Expenses directly attributable to a fund are charged to that fund. Expenses attributable to more than one fund are allocated among the respective funds on the basis of relative net assets or other appropriate methods. Expense estimates are accrued in the period to which they relate and adjustments are made when actual amounts are known.
Income Tax Information and Distributions to Shareholders. Each year, the Fund intends to qualify as a regulated investment company under Subchapter M of the Internal Revenue Code, including distributing substantially all of its taxable income and realized gains. As a result, no provision for U.S. Federal income taxes is required. As of October 31, 2013, the Fund did not have any unrecognized tax benefits in the financial statements; nor is the Fund aware of any tax positions for which it is reasonably possible that the total amounts of unrecognized tax benefits will significantly change in the next twelve months. The Fund files a U.S. federal tax return, in addition to state and local tax returns as required. The Fund's federal income tax returns are subject to examination by the Internal Revenue Service (IRS) for a period of three fiscal years after they are filed. State and local tax returns may be subject to examination for an additional fiscal year depending on the jurisdiction. Foreign taxes are provided for based on the Fund's understanding of the tax rules and rates that exist in the foreign markets in which it invests.
Distributions are declared and recorded on the ex-dividend date. Income and capital gain distributions are determined in accordance with income tax regulations, which may differ from GAAP.
Capital accounts within the financial statements are adjusted for permanent book-tax differences. These adjustments have no impact on net assets or the results of operations. Temporary book-tax differences will reverse in a subsequent period.
Book-tax differences are primarily due to foreign currency transactions, passive foreign investment companies (PFIC), deferred trustees compensation, capital loss carryforward and losses deferred due to wash sales.
The federal tax cost of investment securities and unrealized appreciation (depreciation) as of period end were as follows:
Gross unrealized appreciation | $ 175,810,573 |
Gross unrealized depreciation | (5,116,279) |
Net unrealized appreciation (depreciation) on securities and other investments | $ 170,694,294 |
| |
Tax Cost | $ 799,386,372 |
The tax-based components of distributable earnings as of period end were as follows:
Undistributed ordinary income | $ 12,467,437 |
Capital loss carryforward | $ (258,236,120) |
Net unrealized appreciation (depreciation) | $ 170,709,645 |
Annual Report
3. Significant Accounting Policies - continued
Income Tax Information and Distributions to Shareholders - continued
Capital loss carryforwards are only available to offset future capital gains of the Fund to the extent provided by regulations and may be limited. Under the Regulated Investment Company Modernization Act of 2010 (the Act), the Fund is permitted to carry forward capital losses incurred in taxable years beginning after December 22, 2010 for an unlimited period and such capital losses are required to be used prior to any losses that expire. The capital loss carryforward information presented below, including any applicable limitation, is estimated as of fiscal period end and is subject to adjustment.
Fiscal year of expiration | |
2017 | $ (258,236,120) |
Due to large redemptions in a prior period, $258,236,120 of capital losses that will be available to offset future capital gains of the Fund will be limited to approximately $32,029,274 per year.
The tax character of distributions paid was as follows:
| October 31, 2013 | October 31, 2012 |
Ordinary Income | $ 14,355,431 | $ 13,541,876 |
Short-Term Trading (Redemption) Fees. Shares held by investors in the Fund less than 30 days may have been subject to a redemption fee equal to 1.00% of the net asset value of shares redeemed. All redemption fees, which reduce the proceeds of the shareholder redemption, are retained by the Fund and accounted for as an addition to paid in capital.
4. Purchases and Sales of Investments.
Purchases and sales of securities, other than short-term securities, aggregated $591,024,335 and $417,745,159, respectively.
5. Fees and Other Transactions with Affiliates.
Management Fee. FMR and its affiliates provide the Fund with investment management related services for which the Fund pays a monthly management fee. The management fee is the sum of an individual fund fee rate that is based on an annual rate of .45% of the Fund's average net assets and an annualized group fee rate that averaged .25% during the period. The group fee rate is based upon the average net assets of all the mutual funds advised by FMR, including any mutual funds previously advised by FMR that are currently advised by Fidelity SelectCo, LLC, an affiliate of FMR. The group fee rate decreases as assets under management increase and increases as assets under management decrease. In addition, the management fee is subject to a performance adjustment (up to a maximum of ± .20% of the Fund's average net assets over a 36 month performance period). The upward or downward adjustment to the management fee is based on the Fund's relative investment performance as compared to an appropriate benchmark index over the same 36 month performance period. For the reporting period, the total annual management fee rate, including the performance adjustment, was .78% of the Fund's average net assets. The performance adjustment included in the management fee rate may be higher or lower than the maximum performance adjustment rate due to the difference between the average net assets for the reporting and performance periods.
Transfer Agent Fees. Fidelity Investments Institutional Operations Company, Inc., (FIIOC), an affiliate of FMR, is the Fund's transfer, dividend disbursing and shareholder servicing agent. FIIOC receives account fees and asset-based fees that vary according to the account size and type of FIIOC pays for typesetting, printing and mailing of shareholder reports, except proxy statements. For the period, the transfer agent fees were equivalent to an annualized rate of .20% of average net assets.
Accounting and Security Lending Fees. Fidelity Service Company, Inc. (FSC), an affiliate of FMR, maintains the Fund's accounting records. The accounting fee is based on the level of average net assets for each month. Under a separate contract, FSC administers the security lending program. The security lending fee is based on the number and duration of lending transactions.
Brokerage Commissions. The Fund placed a portion of its portfolio transactions with brokerage firms which are affiliates of the investment adviser. Brokerage commissions are included in net realized gain (loss) and change in net unrealized appreciation (depreciation) in the Statement of Operations. The commissions paid to these affiliated firms were $384 for the period.
6. Committed Line of Credit.
The Fund participates with other funds managed by FMR or an affiliate in a $4.25 billion credit facility (the "line of credit") to be utilized for temporary or emergency purposes to fund shareholder redemptions or for other short-term liquidity purposes. The Fund has agreed to pay commitment fees on its
Annual Report
Notes to Financial Statements - continued
6. Committed Line of Credit - continued
pro-rata portion of the line of credit, which amounted to $1,523 and is reflected in Miscellaneous expenses on the Statement of Operations. During the period, there were no borrowings on this line of credit.
7. Security Lending.
The Fund lends portfolio securities through a lending agent from time to time in order to earn additional income. For equity securities, a lending agent is used and may loan securities to certain qualified borrowers, including Fidelity Capital Markets (FCM), a broker-dealer affiliated with the Fund. On the settlement date of the loan, the Fund receives collateral (in the form of U.S. Treasury obligations, letters of credit and/or cash) against the loaned securities and maintains collateral in an amount not less than 100% of the market value of the loaned securities during the period of the loan. The market value of the loaned securities is determined at the close of business of the Fund and any additional required collateral is delivered to the Fund on the next business day. If the borrower defaults on its obligation to return the securities loaned because of insolvency or other reasons, the Fund may apply collateral received from the borrower against the obligation. The Fund may experience delays and costs in recovering the securities loaned. Any cash collateral received is invested in the Fidelity Securities Lending Cash Central Fund. The value of loaned securities and cash collateral at period end are disclosed on the Fund's Statement of Assets and Liabilities. Security lending income represents the income earned on investing cash collateral, less rebates paid to borrowers and any lending agent fees associated with the loan, plus any premium payments received for lending certain types of securities. Security lending income is presented in the Statement of Operations as a component of income from Fidelity Central Funds. Total security lending income during the period amounted to $411,237. During the period, there were no securities loaned to FCM.
8. Expense Reductions.
Commissions paid to certain brokers with whom FMR, or its affiliates, places trades on behalf of the Fund include an amount in addition to trade execution, which may be rebated back to the Fund to offset certain expenses. This amount totaled $235,222 for the period.
In addition, FMR reimbursed a portion of the Fund's operating expenses during the period in the amount of $18,330.
9. Proposed Reorganization.
The Board of Trustees of the Fund approved Agreements and Plans of Reorganization (the Agreements) between the Fund and Fidelity Europe Capital Appreciation Fund and Fidelity Advisor Europe Capital Appreciation Fund (Target Funds). In addition, the Board approved the creation of additional classes of shares that are expected to commence operations in March 2014. The Agreements provide for the transfer of all the assets and the assumption of all the liabilities of the Target Funds in exchange for corresponding shares of the Fund equal in value to the net assets of each Target Fund on the day the reorganization is effective. The reorganizations provide shareholders of the Target Funds access to a larger portfolio with similar investment objectives.
A meeting of each Target Fund's shareholders is expected to be held during the first quarter of 2014 to vote on the reorganization. If approved by these shareholders, the reorganizations are expected to become effective on or about March 21, 2014. Each reorganization is expected to qualify as a tax-free transaction with no gain or loss recognized by the funds or their shareholders.
10. Other.
The Fund's organizational documents provide former and current trustees and officers with a limited indemnification against liabilities arising in connection with the performance of their duties to the Fund. In the normal course of business, the Fund may also enter into contracts that provide general indemnifications. The Fund's maximum exposure under these arrangements is unknown as this would be dependent on future claims that may be made against the Fund. The risk of material loss from such claims is considered remote.
Annual Report
Fidelity Japan Fund
Average annual total return reflects the change in the value of an investment, assuming reinvestment of the class' distributions from dividend income and capital gains (the profits earned upon the sale of securities that have grown in value, if any) and assuming a constant rate of performance each year. The $10,000 table and the fund's returns do not reflect the deduction of taxes that a shareholder would pay on fund distributions or the redemption of fund shares. During periods of reimbursement by Fidelity, a fund's total return will be greater than it would be had the reimbursement not occurred. How a fund did yesterday is no guarantee of how it will do tomorrow.
Average Annual Total Returns
Periods ended October 31, 2013 | Past 1
year | Past 5
years | Past 10
years |
Fidelity Japan Fund | 31.92% | 8.39% | 3.59% |
$10,000 Over 10 Years
Let's say hypothetically that $10,000 was invested in Fidelity Japan Fund, a class of the fund, on October 31, 2003. The chart shows how the value of your investment would have changed, and also shows how the Tokyo Stock Price Index (TOPIX) performed over the same period.
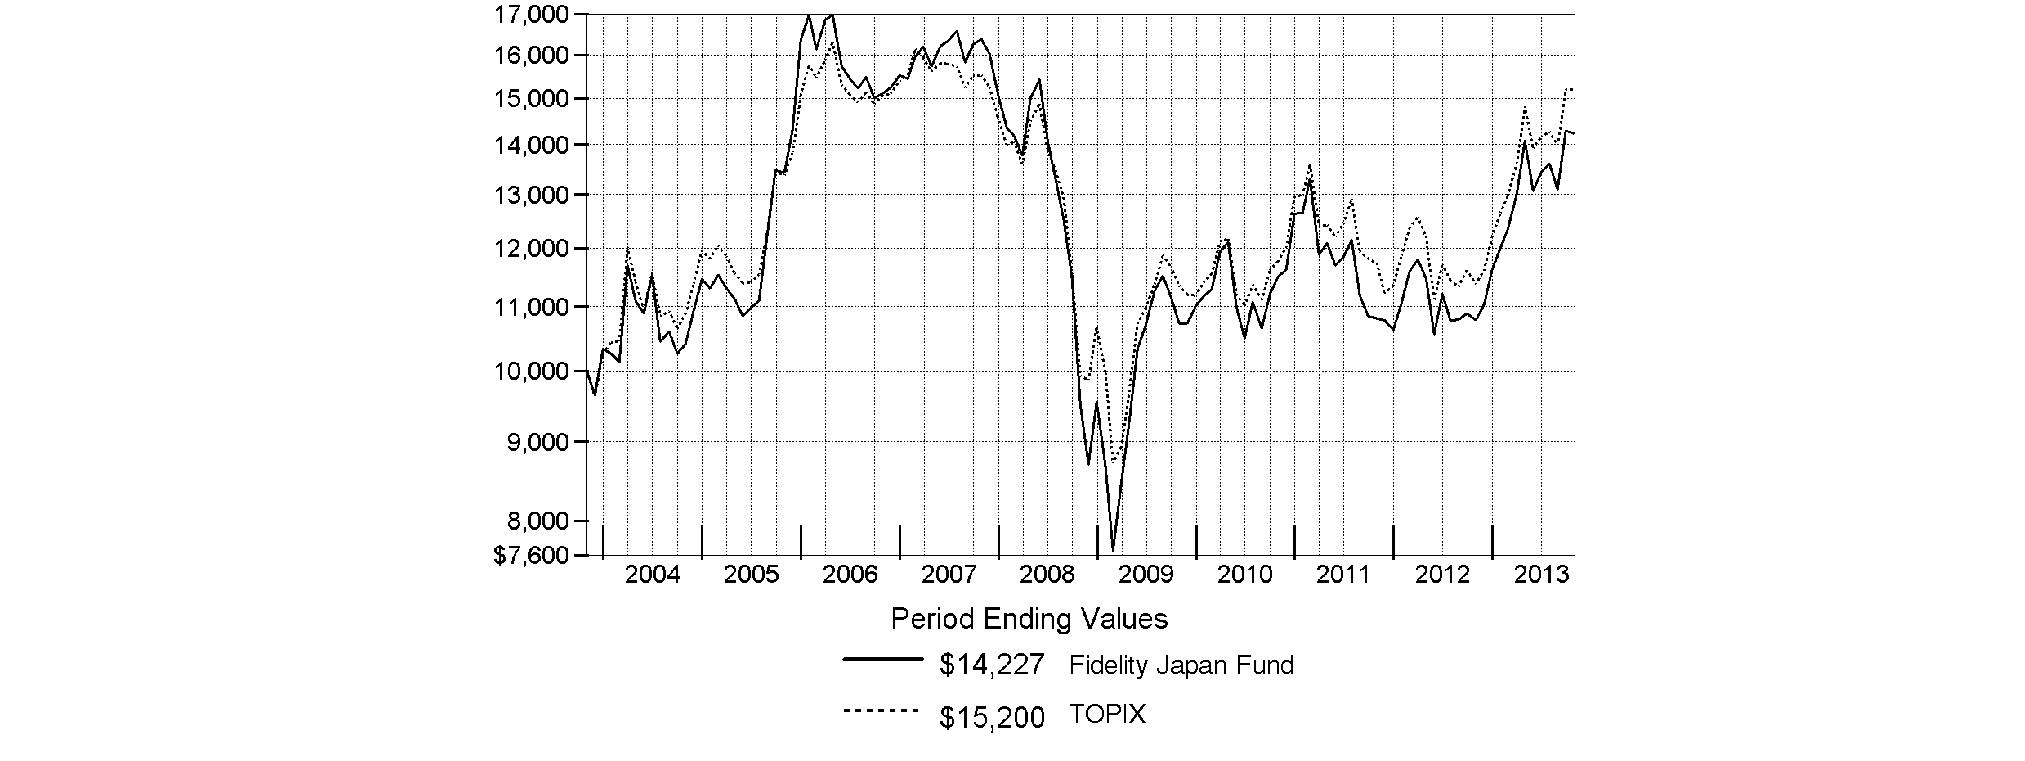
Annual Report
Fidelity Japan Fund
Market Recap: On balance, global equity markets remained upbeat for the 12-month period ending October 31, 2013. The MSCI® ACWI® (All Country World Index) Index gained 23.75% for the period, amid investor preference for higher-risk assets. The period was not without turbulence, however. In the spring and summer, central banks worldwide, especially in the U.S. and China, made clear their intentions to maintain accommodative monetary policies. That stance, combined with modest cyclical improvements around the globe and generally low valuations, underpinned the broad rally in equities. Europe (+32%) shone brightly, with most markets in the region - large and small - registering solid, index-beating gains. Another bright spot was Japan, which, despite a struggling yen and taking a second-half breather, posted a 34% result for the full year. The U.S. - by far the index's biggest constituent - also outperformed the global market with a roughly 28% advance. Meanwhile, Asia-Pacific ex Japan (+14%) lagged, hurt in part by a slowdown in Australia's mining industry as well as currency headwinds. Foreign-exchange and commodity weakness also curbed results in resource-heavy Canada and emerging markets (EM), both of which were up 7%. Country-level EM performance diverged meaningfully for the period, as evidenced by performance in Brazil (-1%), Russia (+12%), India (+1%) and China (+8%).
Comments from Rie Shigekawa, Portfolio Manager of Fidelity® Japan Fund: For the year, the fund's Retail Class shares returned 31.92%, lagging the 33.59% gain of the Tokyo Stock Price Index. Versus the index, unrewarding stock selection and a modest cash position in a soaring market dampened the fund's relative performance, outweighing the positive impact of sector and industry weightings. Specifically, not owning strong-performing index component SoftBank significantly detracted. Other detractors included a large overweighting in materials stock Toray Industries, as well as negligible exposure to Nomura Holdings, which I sold, and not owning Daiwa Securities Group, two market-beating brokerage stocks in the index. Lastly, the much weaker yen was a significant headwind for U.S. investors in Japanese stocks. Conversely, a large overweighting in the automobiles & components group bolstered relative performance. The fund's largest contributor and also its largest holding was automaker Toyota Motor. Although Toyota remained the fund's largest position at period end, I reduced it as the stock advanced in an effort to lessen risk and nail down profits. Other contributors were bank stock Sumitomo Mitsui Financial Group and Nidec, a manufacturer of electric motors and related components.
The views expressed above reflect those of the portfolio manager(s) only through the end of the period as stated on the cover of this report and do not necessarily represent the views of Fidelity or any other person in the Fidelity organization. Any such views are subject to change at any time based upon market or other conditions and Fidelity disclaims any responsibility to update such views. These views may not be relied on as investment advice and, because investment decisions for a Fidelity fund are based on numerous factors, may not be relied on as an indication of trading intent on behalf of any Fidelity fund.
Annual Report
Fidelity Japan Fund
As a shareholder of the Fund, you incur two types of costs: (1) transaction costs, including sales charges (loads) on purchase payments or redemption proceeds, redemption fees and (2) ongoing costs, including management fees, distribution and/or service (12b-1) fees and other Fund expenses. This Example is intended to help you understand your ongoing costs (in dollars) of investing in the Fund and to compare these costs with the ongoing costs of investing in other mutual funds.
The Example is based on an investment of $1,000 invested at the beginning of the period and held for the entire period (May 1, 2013 to October 31, 2013).
Actual Expenses
The first line of the accompanying table for each class of the Fund provides information about actual account values and actual expenses. You may use the information in this line, together with the amount you invested, to estimate the expenses that you paid over the period. Simply divide your account value by $1,000.00 (for example, an $8,600 account value divided by $1,000.00 = 8.6), then multiply the result by the number in the first line for a class of the Fund under the heading entitled "Expenses Paid During Period" to estimate the expenses you paid on your account during this period. A small balance maintenance fee of $12.00 that is charged once a year may apply for certain accounts with a value of less than $2,000. This fee is not included in the table below. If it was, the estimate of expenses you paid during the period would be higher, and your ending account value lower, by this amount. In addition, the Fund, as a shareholder in the underlying Fidelity Central Funds, will indirectly bear its pro-rata share of the fees and expenses incurred by the underlying Fidelity Central Funds. These fees and expenses are not included in the Fund's annualized expense ratio used to calculate the expense estimate in the table below.
Hypothetical Example for Comparison Purposes
The second line of the accompanying table for each class of the Fund provides information about hypothetical account values and hypothetical expenses based on a Class' actual expense ratio and an assumed rate of return of 5% per year before expenses, which is not the Class' actual return. The hypothetical account values and expenses may not be used to estimate the actual ending account balance or expenses you paid for the period. You may use this information to compare the ongoing costs of investing in the Fund and other funds. To do so, compare this 5% hypothetical example with the 5% hypothetical examples that appear in the shareholder reports of the other funds. A small balance maintenance fee of $12.00 that is charged once a year may apply for certain accounts with a value of less than $2,000. This fee is not included in the table below. If it was, the estimate of expenses you paid during the period would be higher, and your ending account value lower, by this amount. In addition, the Fund, as a shareholder in the underlying Fidelity Central Funds, will indirectly bear its pro-rata share of the fees and expenses incurred by the underlying Fidelity Central Funds. These fees and expenses are not included in the Fund's annualized expense ratio used to calculate the expense estimate in the table below.
Please note that the expenses shown in the table are meant to highlight your ongoing costs only and do not reflect any transaction costs. Therefore, the second line of the table is useful in comparing ongoing costs only, and will not help you determine the relative total costs of owning different funds. In addition, if these transactional costs were included, your costs would have been higher.
| Annualized
Expense Ratio B | Beginning
Account Value
May 1, 2013 | Ending
Account Value
October 31, 2013 | Expenses Paid
During Period*
May 1, 2013
to October 31, 2013 |
Class A | 1.27% | | | |
Actual | | $ 1,000.00 | $ 1,009.30 | $ 6.43 |
HypotheticalA | | $ 1,000.00 | $ 1,018.80 | $ 6.46 |
Class T | 1.55% | | | |
Actual | | $ 1,000.00 | $ 1,007.60 | $ 7.84 |
HypotheticalA | | $ 1,000.00 | $ 1,017.39 | $ 7.88 |
Class B | 2.02% | | | |
Actual | | $ 1,000.00 | $ 1,005.00 | $ 10.21 |
HypotheticalA | | $ 1,000.00 | $ 1,015.02 | $ 10.26 |
Class C | 1.97% | | | |
Actual | | $ 1,000.00 | $ 1,005.90 | $ 9.96 |
HypotheticalA | | $ 1,000.00 | $ 1,015.27 | $ 10.01 |
Japan | .92% | | | |
Actual | | $ 1,000.00 | $ 1,010.90 | $ 4.66 |
HypotheticalA | | $ 1,000.00 | $ 1,020.57 | $ 4.69 |
Institutional Class | .91% | | | |
Actual | | $ 1,000.00 | $ 1,010.90 | $ 4.61 |
HypotheticalA | | $ 1,000.00 | $ 1,020.62 | $ 4.63 |
A 5% return per year before expenses
B Annualized expense ratio reflects expenses net of applicable fee waivers.
* Expenses are equal to each Class' annualized expense ratio, multiplied by the average account value over the period, multiplied by 184/365 (to reflect the one-half year period).
Annual Report
Fidelity Japan Fund
Investment Changes (Unaudited)
Geographic Diversification (% of fund's net assets) |
As of October 31, 2013 |
| Japan | 97.1% | |
| United States of America* | 2.9% | |

* Includes Short-Term Investments and Net Other Assets (Liabilities). |
Percentages are based on country or territory of incorporation and are adjusted for the effect of futures contracts, if applicable. |
As of April 30, 2013 |
| Japan | 96.3% | |
| United States of America* | 3.7% | |

* Includes Short-Term Investments and Net Other Assets (Liabilities). |
Percentages are based on country or territory of incorporation and are adjusted for the effect of futures contracts, if applicable. |
Asset Allocation as of October 31, 2013 |
| % of fund's
net assets | % of fund's net assets
6 months ago |
Stocks | 97.1 | 96.3 |
Short-Term Investments and Net Other Assets (Liabilities) | 2.9 | 3.7 |
Top Ten Stocks as of October 31, 2013 |
| % of fund's
net assets | % of fund's net assets
6 months ago |
Toyota Motor Corp. (Automobiles) | 6.4 | 6.5 |
Mitsubishi UFJ Financial Group, Inc. (Commercial Banks) | 4.9 | 5.2 |
Sumitomo Mitsui Financial Group, Inc. (Commercial Banks) | 4.9 | 4.6 |
Honda Motor Co. Ltd. (Automobiles) | 3.8 | 3.8 |
Nissan Motor Co. Ltd. (Automobiles) | 3.6 | 3.2 |
Toray Industries, Inc. (Chemicals) | 3.4 | 3.8 |
Bridgestone Corp. (Auto Components) | 3.2 | 2.5 |
KDDI Corp. (Wireless Telecommunication Services) | 3.2 | 0.0 |
Shimadzu Corp. (Electronic Equipment & Components) | 3.0 | 2.3 |
Mizuho Financial Group, Inc. (Commercial Banks) | 2.9 | 3.0 |
| 39.3 | |
Market Sectors as of October 31, 2013 |
| % of fund's
net assets | % of fund's net assets
6 months ago |
Consumer Discretionary | 25.4 | 24.7 |
Financials | 20.3 | 22.3 |
Industrials | 13.0 | 10.3 |
Information Technology | 12.8 | 13.3 |
Materials | 11.5 | 12.2 |
Health Care | 7.4 | 9.2 |
Telecommunication Services | 3.2 | 1.7 |
Consumer Staples | 2.1 | 2.1 |
Utilities | 1.4 | 0.5 |
Annual Report
Fidelity Japan Fund
Investments October 31, 2013
Showing Percentage of Net Assets
Common Stocks - 97.1% |
| Shares | | Value |
CONSUMER DISCRETIONARY - 25.4% |
Auto Components - 5.2% |
Bridgestone Corp. | 502,600 | | $ 17,230,494 |
Calsonic Kansei Corp. | 898,000 | | 4,317,370 |
DENSO Corp. | 135,400 | | 6,508,464 |
| | 28,056,328 |
Automobiles - 15.1% |
Honda Motor Co. Ltd. | 516,900 | | 20,641,324 |
Nissan Motor Co. Ltd. | 1,904,700 | | 19,125,593 |
Suzuki Motor Corp. | 287,600 | | 7,231,810 |
Toyota Motor Corp. | 532,300 | | 34,513,369 |
| | 81,512,096 |
Hotels, Restaurants & Leisure - 0.5% |
St. Marc Holdings Co. Ltd. | 29,400 | | 1,513,267 |
Toridoll.Corporation | 140,100 | | 1,319,102 |
| | 2,832,369 |
Household Durables - 0.6% |
Fujitsu General Ltd. | 266,000 | | 3,222,933 |
Media - 0.5% |
Daiichikosho Co. Ltd. | 19,400 | | 554,367 |
Tohokushinsha Film Corp. | 209,700 | | 2,065,936 |
| | 2,620,303 |
Multiline Retail - 1.2% |
Marui Group Co. Ltd. | 696,200 | | 6,664,501 |
Specialty Retail - 0.6% |
Arc Land Sakamoto Co. Ltd. | 7,200 | | 107,558 |
K's Denki Corp. | 99,300 | | 2,915,731 |
| | 3,023,289 |
Textiles, Apparel & Luxury Goods - 1.7% |
Onward Holdings Co. Ltd. | 1,118,000 | | 9,253,438 |
TOTAL CONSUMER DISCRETIONARY | | 137,185,257 |
CONSUMER STAPLES - 2.1% |
Food & Staples Retailing - 2.1% |
Seven & i Holdings Co., Ltd. | 261,600 | | 9,681,459 |
Valor Co. Ltd. | 106,800 | | 1,541,477 |
| | 11,222,936 |
FINANCIALS - 20.3% |
Commercial Banks - 12.7% |
Mitsubishi UFJ Financial Group, Inc. | 4,169,400 | | 26,551,852 |
Mizuho Financial Group, Inc. | 7,531,700 | | 15,809,514 |
Sumitomo Mitsui Financial Group, Inc. | 546,800 | | 26,430,067 |
| | 68,791,433 |
Consumer Finance - 1.7% |
ACOM Co. Ltd. (a) | 925,400 | | 3,623,562 |
AEON Financial Service Co. Ltd. | 181,100 | | 5,561,627 |
| | 9,185,189 |
Insurance - 2.9% |
MS&AD Insurance Group Holdings, Inc. | 604,900 | | 15,641,114 |
|
| Shares | | Value |
Real Estate Investment Trusts - 0.4% |
Frontier Real Estate Investment Corp. | 111 | | $ 1,109,096 |
Japan Logistics Fund, Inc. | 112 | | 1,164,928 |
| | 2,274,024 |
Real Estate Management & Development - 2.6% |
Daibiru Corp. | 98,800 | | 1,259,067 |
Nomura Real Estate Holdings, Inc. | 501,100 | | 12,678,547 |
| | 13,937,614 |
TOTAL FINANCIALS | | 109,829,374 |
HEALTH CARE - 7.4% |
Health Care Equipment & Supplies - 3.2% |
ASAHI INTECC Co. Ltd. (d) | 42,000 | | 2,825,632 |
Nihon Kohden Corp. | 101,700 | | 4,188,679 |
Terumo Corp. | 215,900 | | 10,456,188 |
| | 17,470,499 |
Health Care Providers & Services - 1.0% |
Message Co. Ltd. (d) | 192,100 | | 5,422,373 |
Pharmaceuticals - 3.2% |
Nippon Shinyaku Co. Ltd. | 231,000 | | 3,981,888 |
Takeda Pharmaceutical Co. Ltd. | 277,800 | | 13,238,442 |
| | 17,220,330 |
TOTAL HEALTH CARE | | 40,113,202 |
INDUSTRIALS - 13.0% |
Commercial Services & Supplies - 0.3% |
Moshi Moshi Hotline, Inc. | 123,100 | | 1,547,319 |
Construction & Engineering - 0.3% |
Toyo Engineering Corp. | 455,000 | | 1,938,740 |
Electrical Equipment - 5.8% |
Fujikura Ltd. | 469,000 | | 2,140,123 |
Mitsubishi Electric Corp. | 1,401,000 | | 15,399,744 |
Nidec Corp. (d) | 140,900 | | 13,731,011 |
| | 31,270,878 |
Industrial Conglomerates - 2.4% |
Toshiba Corp. | 3,051,000 | | 12,967,565 |
Machinery - 2.9% |
Makita Corp. | 91,300 | | 4,616,983 |
Sumitomo Heavy Industries Ltd. | 2,496,000 | | 11,047,145 |
| | 15,664,128 |
Road & Rail - 0.4% |
Hitachi Transport System Ltd. | 130,800 | | 2,074,096 |
Trading Companies & Distributors - 0.9% |
Sumitomo Corp. | 356,700 | | 4,641,846 |
TOTAL INDUSTRIALS | | 70,104,572 |
Common Stocks - continued |
| Shares | | Value |
INFORMATION TECHNOLOGY - 12.8% |
Computers & Peripherals - 0.8% |
Japan Digital Laboratory Co. | 77,600 | | $ 926,185 |
Wacom Co. Ltd. | 441,800 | | 3,282,413 |
| | 4,208,598 |
Electronic Equipment & Components - 9.0% |
Azbil Corp. | 283,600 | | 6,833,237 |
ESPEC Corp. | 120,700 | | 939,903 |
Hamamatsu Photonics K.K. | 155,600 | | 5,822,462 |
Horiba Ltd. | 240,000 | | 8,769,708 |
Nichicon Corp. | 225,200 | | 2,358,487 |
Shimadzu Corp. | 1,656,000 | | 16,216,186 |
TDK Corp. | 146,000 | | 6,205,021 |
Topcon Corp. | 94,300 | | 1,421,926 |
| | 48,566,930 |
IT Services - 1.8% |
Fujitsu Ltd. | 1,381,000 | | 5,933,057 |
Otsuka Corp. | 30,600 | | 3,968,920 |
| | 9,901,977 |
Semiconductors & Semiconductor Equipment - 1.2% |
Disco Corp. | 58,000 | | 3,665,230 |
NuFlare Technology, Inc. | 18,700 | | 2,503,567 |
| | 6,168,797 |
TOTAL INFORMATION TECHNOLOGY | | 68,846,302 |
MATERIALS - 11.5% |
Chemicals - 9.0% |
Asahi Kasei Corp. | 1,785,000 | | 13,584,930 |
Hitachi Chemical Co. Ltd. | 363,700 | | 5,579,808 |
Nihon Nohyaku Co. Ltd. | 212,000 | | 2,541,070 |
Nitto Denko Corp. | 97,300 | | 5,102,505 |
Toray Industries, Inc. | 2,930,000 | | 18,308,803 |
Zeon Corp. | 271,000 | | 3,229,543 |
| | 48,346,659 |
Metals & Mining - 2.5% |
Nippon Steel & Sumitomo Metal Corp. | 3,937,000 | | 12,994,281 |
Pacific Metals Co. Ltd. | 210,000 | | 769,544 |
| | 13,763,825 |
TOTAL MATERIALS | | 62,110,484 |
|
| Shares | | Value |
TELECOMMUNICATION SERVICES - 3.2% |
Wireless Telecommunication Services - 3.2% |
KDDI Corp. | 317,000 | | $ 17,167,607 |
UTILITIES - 1.4% |
Electric Utilities - 1.4% |
Kansai Electric Power Co., Inc. (a) | 204,200 | | 2,584,564 |
Tohoku Electric Power Co., Inc. (a) | 399,100 | | 4,830,784 |
| | 7,415,348 |
TOTAL COMMON STOCKS (Cost $504,921,967) |
523,995,082
|
Money Market Funds - 3.3% |
| | | |
Fidelity Cash Central Fund, 0.09% (b) | 9,955,567 | | 9,955,567 |
Fidelity Securities Lending Cash Central Fund, 0.09% (b)(c) | 7,668,401 | | 7,668,401 |
TOTAL MONEY MARKET FUNDS (Cost $17,623,968) |
17,623,968
|
TOTAL INVESTMENT PORTFOLIO - 100.4% (Cost $522,545,935) | | 541,619,050 |
NET OTHER ASSETS (LIABILITIES) - (0.4)% | | (2,238,378) |
NET ASSETS - 100% | $ 539,380,672 |
Legend |
(a) Non-income producing |
(b) Affiliated fund that is generally available only to investment companies and other accounts managed by Fidelity Investments. The rate quoted is the annualized seven-day yield of the fund at period end. A complete unaudited listing of the fund's holdings as of its most recent quarter end is available upon request. In addition, each Fidelity Central Fund's financial statements, which are not covered by the Fund's Report of Independent Registered Public Accounting Firm, are available on the SEC's website or upon request. |
(c) Investment made with cash collateral received from securities on loan. |
(d) Security or a portion of the security is on loan at period end. |
Affiliated Central Funds |
Information regarding fiscal year to date income earned by the Fund from investments in Fidelity Central Funds is as follows: |
Fund | Income earned |
Fidelity Cash Central Fund | $ 15,638 |
Fidelity Securities Lending Cash Central Fund | 93,183 |
Total | $ 108,821 |
Other Information |
The following is a summary of the inputs used, as of October 31, 2013, involving the Fund's assets and liabilities carried at fair value. The inputs or methodology used for valuing securities may not be an indication of the risk associated with investing in those securities. For more information on valuation inputs, and their aggregation into the levels used in the tables below, please refer to the Investment Valuation section in the accompanying Notes to Financial Statements. |
Valuation Inputs at Reporting Date: |
Description | Total | Level 1 | Level 2 | Level 3 |
Investments in Securities: | | | | |
Equities: | | | | |
Consumer Discretionary | $ 137,185,257 | $ - | $ 137,185,257 | $ - |
Consumer Staples | 11,222,936 | - | 11,222,936 | - |
Financials | 109,829,374 | - | 109,829,374 | - |
Health Care | 40,113,202 | - | 40,113,202 | - |
Industrials | 70,104,572 | - | 70,104,572 | - |
Information Technology | 68,846,302 | - | 68,846,302 | - |
Materials | 62,110,484 | - | 62,110,484 | - |
Telecommunication Services | 17,167,607 | - | 17,167,607 | - |
Utilities | 7,415,348 | - | 7,415,348 | - |
Money Market Funds | 17,623,968 | 17,623,968 | - | - |
Total Investments in Securities: | $ 541,619,050 | $ 17,623,968 | $ 523,995,082 | $ - |
The following is a summary of transfers between Level 1 and Level 2 for the period ended October 31, 2013. Transfers are assumed to have occurred at the beginning of the period, and are primarily attributable to the valuation techniques used for foreign equity securities, as discussed in the accompanying Notes to Financial Statements: |
Transfers | Total |
Level 1 to Level 2 | $ 185,243,204 |
Level 2 to Level 1 | $ 0 |
See accompanying notes which are an integral part of the financial statements.
Annual Report
Fidelity Japan Fund
Statement of Assets and Liabilities
| October 31, 2013 |
| | |
Assets | | |
Investment in securities, at value (including securities loaned of $7,293,099) - See accompanying schedule: Unaffiliated issuers (cost $504,921,967) | $ 523,995,082 | |
Fidelity Central Funds (cost $17,623,968) | 17,623,968 | |
Total Investments (cost $522,545,935) | | $ 541,619,050 |
Receivable for investments sold | | 2,851,415 |
Receivable for fund shares sold | | 679,527 |
Dividends receivable | | 3,870,202 |
Distributions receivable from Fidelity Central Funds | | 6,131 |
Prepaid expenses | | 1,910 |
Other receivables | | 26,529 |
Total assets | | 549,054,764 |
| | |
Liabilities | | |
Payable for investments purchased | $ 646,082 | |
Payable for fund shares redeemed | 886,923 | |
Accrued management fee | 265,409 | |
Distribution and service plan fees payable | 16,866 | |
Other affiliated payables | 110,934 | |
Other payables and accrued expenses | 79,477 | |
Collateral on securities loaned, at value | 7,668,401 | |
Total liabilities | | 9,674,092 |
| | |
Net Assets | | $ 539,380,672 |
Net Assets consist of: | | |
Paid in capital | | $ 713,501,665 |
Undistributed net investment income | | 4,547,036 |
Accumulated undistributed net realized gain (loss) on investments and foreign currency transactions | | (197,749,320) |
Net unrealized appreciation (depreciation) on investments and assets and liabilities in foreign currencies | | 19,081,291 |
Net Assets | | $ 539,380,672 |
Statement of Assets and Liabilities - continued
| October 31, 2013 |
| | |
Calculation of Maximum Offering Price Class A:
Net Asset Value and redemption price per share ($20,519,915 ÷ 1,709,790 shares) | | $ 12.00 |
| | |
Maximum offering price per share (100/94.25 of $12.00) | | $ 12.73 |
Class T:
Net Asset Value and redemption price per share ($5,356,999 ÷ 447,738 shares) | | $ 11.96 |
| | |
Maximum offering price per share (100/96.50 of $11.96) | | $ 12.39 |
Class B:
Net Asset Value and offering price per share ($874,018 ÷ 72,837 shares)A | | $ 12.00 |
| | |
Class C:
Net Asset Value and offering price per share ($11,823,577 ÷ 988,738 shares)A | | $ 11.96 |
| | |
Japan:
Net Asset Value, offering price and redemption price per share ($480,773,281 ÷ 39,971,447 shares) | | $ 12.03 |
| | |
Institutional Class:
Net Asset Value, offering price and redemption price per share ($20,032,882 ÷ 1,666,824 shares) | | $ 12.02 |
A Redemption price per share is equal to net asset value less any applicable contingent deferred sales charge.
See accompanying notes which are an integral part of the financial statements.
Annual Report
Statement of Operations
| Year ended October 31, 2013 |
| | |
Investment Income | | |
Dividends | | $ 10,225,631 |
Income from Fidelity Central Funds | | 108,821 |
Income before foreign taxes withheld | | 10,334,452 |
Less foreign taxes withheld | | (730,071) |
Total income | | 9,604,381 |
| | |
Expenses | | |
Management fee | | |
Basic fee | $ 3,381,267 | |
Performance adjustment | (364,882) | |
Transfer agent fees | 1,005,993 | |
Distribution and service plan fees | 164,646 | |
Accounting and security lending fees | 250,524 | |
Custodian fees and expenses | 64,515 | |
Independent trustees' compensation | 2,744 | |
Registration fees | 86,829 | |
Audit | 69,145 | |
Legal | 1,108 | |
Interest | 85 | |
Miscellaneous | 3,524 | |
Total expenses before reductions | 4,665,498 | |
Expense reductions | (78,932) | 4,586,566 |
Net investment income (loss) | | 5,017,815 |
Realized and Unrealized Gain (Loss) Net realized gain (loss) on: | | |
Investment securities: | | |
Unaffiliated issuers | 22,728,384 | |
Foreign currency transactions | (386,358) | |
Total net realized gain (loss) | | 22,342,026 |
Change in net unrealized appreciation (depreciation) on: Investment securities | 92,533,961 | |
Assets and liabilities in foreign currencies | 99,827 | |
Total change in net unrealized appreciation (depreciation) | | 92,633,788 |
Net gain (loss) | | 114,975,814 |
Net increase (decrease) in net assets resulting from operations | | $ 119,993,629 |
Statement of Changes in Net Assets
| Year ended
October 31,
2013 | Year ended
October 31,
2012 |
Increase (Decrease) in Net Assets | | |
Operations | | |
Net investment income (loss) | $ 5,017,815 | $ 5,368,143 |
Net realized gain (loss) | 22,342,026 | (8,912,266) |
Change in net unrealized appreciation (depreciation) | 92,633,788 | 3,021,959 |
Net increase (decrease) in net assets resulting from operations | 119,993,629 | (522,164) |
Distributions to shareholders from net investment income | (5,641,978) | (7,688,787) |
Distributions to shareholders from net realized gain | (3,106,863) | (2,570,905) |
Total distributions | (8,748,841) | (10,259,692) |
Share transactions - net increase (decrease) | 51,180,009 | (93,975,629) |
Redemption fees | 461,366 | 61,543 |
Total increase (decrease) in net assets | 162,886,163 | (104,695,942) |
| | |
Net Assets | | |
Beginning of period | 376,494,509 | 481,190,451 |
End of period (including undistributed net investment income of $4,547,036 and undistributed net investment income of $5,171,198, respectively) | $ 539,380,672 | $ 376,494,509 |
See accompanying notes which are an integral part of the financial statements.
Annual Report
Financial Highlights - Class A
Years ended October 31, | 2013 | 2012 | 2011 H |
Selected Per-Share Data | | | |
Net asset value, beginning of period | $ 9.30 | $ 9.54 | $ 10.83 |
Income from Investment Operations | | | |
Net investment income (loss) E | .08 | .09 | .09 |
Net realized and unrealized gain (loss) | 2.80 | (.15) | (1.39) |
Total from investment operations | 2.88 | (.06) | (1.30) |
Distributions from net investment income | (.11) | (.13) | - |
Distributions from net realized gain | (.08) | (.05) | - |
Total distributions | (.19) | (.18) | - |
Redemption fees added to paid in capital E | .01 | - K | .01 |
Net asset value, end of period | $ 12.00 | $ 9.30 | $ 9.54 |
Total Return B, C, D | 31.58% | (.64)% | (11.91)% |
Ratios to Average Net Assets F, I | | | |
Expenses before reductions | 1.26% | 1.42% | 1.20% A |
Expenses net of fee waivers, if any | 1.26% | 1.38% | 1.20% A |
Expenses net of all reductions | 1.25% | 1.36% | 1.16% A |
Net investment income (loss) | .75% | .94% | 1.02% A |
Supplemental Data | | | |
Net assets, end of period (000 omitted) | $ 20,520 | $ 9,495 | $ 13,208 |
Portfolio turnover rate G | 68% | 52% | 134% J |
A Annualized B Total returns for periods of less than one year are not annualized. C Total returns would have been lower if certain expenses had not been reduced during the applicable periods shown. D Total returns do not include the effect of the sales charges. E Calculated based on average shares outstanding during the period. F Fees and expenses of any underlying Fidelity Central Funds are not included in the Fund's expense ratio. The Fund indirectly bears its proportionate share of the expenses of any underlying Fidelity Central Funds. G Amount does not include the portfolio activity of any underlying Fidelity Central Funds. H For the period December 14, 2010 (commencement of sale of shares) to October 31, 2011. I Expense ratios reflect operating expenses of the class. Expenses before reductions do not reflect amounts reimbursed by the investment adviser or reductions from brokerage service arrangements or reductions from other expense offset arrangements and do not represent the amount paid by the class during periods when reimbursements or reductions occur. Expense ratios before reductions for start-up periods may not be representative of longer-term operating periods. Expenses net of fee waivers reflect expenses after reimbursement by the investment adviser but prior to reductions from brokerage service arrangements or other expense offset arrangements. Expenses net of all reductions represent the net expenses paid by the class. J The portfolio turnover rate does not include the assets acquired in the merger. K Amount represents less than $.01 per share. |
Financial Highlights - Class T
Years ended October 31, | 2013 | 2012 | 2011 H |
Selected Per-Share Data | | | |
Net asset value, beginning of period | $ 9.28 | $ 9.51 | $ 10.83 |
Income from Investment Operations | | | |
Net investment income (loss) E | .05 | .06 | .07 |
Net realized and unrealized gain (loss) | 2.78 | (.13) | (1.40) |
Total from investment operations | 2.83 | (.07) | (1.33) |
Distributions from net investment income | (.08) | (.11) | - |
Distributions from net realized gain | (.08) | (.05) | - |
Total distributions | (.16) | (.16) | - |
Redemption fees added to paid in capital E | .01 | - K | .01 |
Net asset value, end of period | $ 11.96 | $ 9.28 | $ 9.51 |
Total Return B, C, D | 31.04% | (.75)% | (12.19)% |
Ratios to Average Net Assets F, I | | | |
Expenses before reductions | 1.55% | 1.70% | 1.48% A |
Expenses net of fee waivers, if any | 1.55% | 1.66% | 1.48% A |
Expenses net of all reductions | 1.53% | 1.64% | 1.44% A |
Net investment income (loss) | .46% | .66% | .74% A |
Supplemental Data | | | |
Net assets, end of period (000 omitted) | $ 5,357 | $ 3,934 | $ 4,643 |
Portfolio turnover rate G | 68% | 52% | 134% J |
A Annualized B Total returns for periods of less than one year are not annualized. C Total returns would have been lower if certain expenses had not been reduced during the applicable periods shown. D Total returns do not include the effect of the sales charges. E Calculated based on average shares outstanding during the period. F Fees and expenses of any underlying Fidelity Central Funds are not included in the Fund's expense ratio. The Fund indirectly bears its proportionate share of the expenses of any underlying Fidelity Central Funds. G Amount does not include the portfolio activity of any underlying Fidelity Central Funds. H For the period December 14, 2010 (commencement of sale of shares) to October 31, 2011. I Expense ratios reflect operating expenses of the class. Expenses before reductions do not reflect amounts reimbursed by the investment adviser or reductions from brokerage service arrangements or reductions from other expense offset arrangements and do not represent the amount paid by the class during periods when reimbursements or reductions occur. Expense ratios before reductions for start-up periods may not be representative of longer-term operating periods. Expenses net of fee waivers reflect expenses after reimbursement by the investment adviser but prior to reductions from brokerage service arrangements or other expense offset arrangements. Expenses net of all reductions represent the net expenses paid by the class. J The portfolio turnover rate does not include the assets acquired in the merger. K Amount represents less than $.01 per share. |
See accompanying notes which are an integral part of the financial statements.
Annual Report
Financial Highlights - Class B
Years ended October 31, | 2013 | 2012 | 2011 H |
Selected Per-Share Data | | | |
Net asset value, beginning of period | $ 9.26 | $ 9.47 | $ 10.83 |
Income from Investment Operations | | | |
Net investment income (loss) E | - K | .02 | .02 |
Net realized and unrealized gain (loss) | 2.80 | (.14) | (1.39) |
Total from investment operations | 2.80 | (.12) | (1.37) |
Distributions from net investment income | - | (.04) | - |
Distributions from net realized gain | (.07) | (.05) | - |
Total distributions | (.07) | (.09) | - |
Redemption fees added to paid in capital E | .01 | - K | .01 |
Net asset value, end of period | $ 12.00 | $ 9.26 | $ 9.47 |
Total Return B, C, D | 30.52% | (1.24)% | (12.56)% |
Ratios to Average Net Assets F, I | | | |
Expenses before reductions | 2.02% | 2.17% | 1.95% A |
Expenses net of fee waivers, if any | 2.02% | 2.13% | 1.95% A |
Expenses net of all reductions | 2.01% | 2.11% | 1.91% A |
Net investment income (loss) | (.02)% | .19% | .27% A |
Supplemental Data | | | |
Net assets, end of period (000 omitted) | $ 874 | $ 1,012 | $ 1,458 |
Portfolio turnover rate G | 68% | 52% | 134% J |
A Annualized B Total returns for periods of less than one year are not annualized. C Total returns would have been lower if certain expenses had not been reduced during the applicable periods shown. D Total returns do not include the effect of the contingent deferred sales charge. E Calculated based on average shares outstanding during the period. F Fees and expenses of any underlying Fidelity Central Funds are not included in the Fund's expense ratio. The Fund indirectly bears its proportionate share of the expenses of any underlying Fidelity Central Funds. G Amount does not include the portfolio activity of any underlying Fidelity Central Funds. H For the period December 14, 2010 (commencement of sale of shares) to October 31, 2011. I Expense ratios reflect operating expenses of the class. Expenses before reductions do not reflect amounts reimbursed by the investment adviser or reductions from brokerage service arrangements or reductions from other expense offset arrangements and do not represent the amount paid by the class during periods when reimbursements or reductions occur. Expense ratios before reductions for start-up periods may not be representative of longer-term operating periods. Expenses net of fee waivers reflect expenses after reimbursement by the investment adviser but prior to reductions from brokerage service arrangements or other expense offset arrangements. Expenses net of all reductions represent the net expenses paid by the class. J The portfolio turnover rate does not include the assets acquired in the merger. K Amount represents less than $.01 per share. |
Financial Highlights - Class C
Years ended October 31, | 2013 | 2012 | 2011 H |
Selected Per-Share Data | | | |
Net asset value, beginning of period | $ 9.25 | $ 9.48 | $ 10.83 |
Income from Investment Operations | | | |
Net investment income (loss) E | - K | .02 | .03 |
Net realized and unrealized gain (loss) | 2.79 | (.14) | (1.39) |
Total from investment operations | 2.79 | (.12) | (1.36) |
Distributions from net investment income | (.01) | (.06) | - |
Distributions from net realized gain | (.08) | (.05) | - |
Total distributions | (.09) | (.11) | - |
Redemption fees added to paid in capital E | .01 | - K | .01 |
Net asset value, end of period | $ 11.96 | $ 9.25 | $ 9.48 |
Total Return B, C, D | 30.55% | (1.27)% | (12.47)% |
Ratios to Average Net Assets F, I | | | |
Expenses before reductions | 1.97% | 2.15% | 1.92% A |
Expenses net of fee waivers, if any | 1.97% | 2.11% | 1.92% A |
Expenses net of all reductions | 1.95% | 2.09% | 1.88% A |
Net investment income (loss) | .04% | .21% | .30% A |
Supplemental Data | | | |
Net assets, end of period (000 omitted) | $ 11,824 | $ 7,015 | $ 8,750 |
Portfolio turnover rate G | 68% | 52% | 134% J |
A Annualized B Total returns for periods of less than one year are not annualized. C Total returns would have been lower if certain expenses had not been reduced during the applicable periods shown. D Total returns do not include the effect of the contingent deferred sales charge. E Calculated based on average shares outstanding during the period. F Fees and expenses of any underlying Fidelity Central Funds are not included in the Fund's expense ratio. The Fund indirectly bears its proportionate share of the expenses of any underlying Fidelity Central Funds. G Amount does not include the portfolio activity of any underlying Fidelity Central Funds. H For the period December 14, 2010 (commencement of sale of shares) to October 31, 2011. I Expense ratios reflect operating expenses of the class. Expenses before reductions do not reflect amounts reimbursed by the investment adviser or reductions from brokerage service arrangements or reductions from other expense offset arrangements and do not represent the amount paid by the class during periods when reimbursements or reductions occur. Expense ratios before reductions for start-up periods may not be representative of longer-term operating periods. Expenses net of fee waivers reflect expenses after reimbursement by the investment adviser but prior to reductions from brokerage service arrangements or other expense offset arrangements. Expenses net of all reductions represent the net expenses paid by the class. J The portfolio turnover rate does not include the assets acquired in the merger. K Amount represents less than $.01 per share. |
See accompanying notes which are an integral part of the financial statements.
Annual Report
Financial Highlights - Japan
Years ended October 31, | 2013 | 2012 | 2011 | 2010 | 2009 |
Selected Per-Share Data | | | | | |
Net asset value, beginning of period | $ 9.34 | $ 9.57 | $ 10.57 | $ 10.03 | $ 9.03 |
Income from Investment Operations | | | | | |
Net investment income (loss) B | .12 | .12 | .15 | .10 | .08 |
Net realized and unrealized gain (loss) | 2.79 | (.14) | (.75) | .61 | 1.04 |
Total from investment operations | 2.91 | (.02) | (.60) | .71 | 1.12 |
Distributions from net investment income | (.15) | (.16) | (.20) | (.07) | (.11) |
Distributions from net realized gain | (.08) | (.05) | (.21) | (.10) | (.01) |
Total distributions | (.23) | (.21) | (.41) | (.17) | (.12) |
Redemption fees added to paid in capital B | .01 | - G | .01 | - G | - G |
Net asset value, end of period | $ 12.03 | $ 9.34 | $ 9.57 | $ 10.57 | $ 10.03 |
Total Return A | 31.92% | (.19)% | (6.00)% | 7.12% | 12.84% |
Ratios to Average Net Assets C, E | | | | | |
Expenses before reductions | .93% | 1.09% | .86% | .93% | .90% |
Expenses net of fee waivers, if any | .93% | 1.06% | .84% | .93% | .90% |
Expenses net of all reductions | .91% | 1.04% | .80% | .93% | .89% |
Net investment income (loss) | 1.08% | 1.26% | 1.38% | .97% | .90% |
Supplemental Data | | | | | |
Net assets, end of period (000 omitted) | $ 480,773 | $ 353,550 | $ 450,417 | $ 649,316 | $ 944,902 |
Portfolio turnover rate D | 68% | 52% | 134% F | 43% | 73% |
A Total returns would have been lower if certain expenses had not been reduced during the applicable periods shown. B Calculated based on average shares outstanding during the period. C Fees and expenses of any underlying Fidelity Central Funds are not included in the Fund's expense ratio. The Fund indirectly bears its proportionate share of the expenses of any underlying Fidelity Central Funds. D Amount does not include the portfolio activity of any underlying Fidelity Central Funds. E Expense ratios reflect operating expenses of the class. Expenses before reductions do not reflect amounts reimbursed by the investment adviser or reductions from brokerage service arrangements or reductions from other expense offset arrangements and do not represent the amount paid by the class during periods when reimbursements or reductions occur. Expenses net of fee waivers reflect expenses after reimbursement by the investment adviser but prior to reductions from brokerage service arrangements or other expense offset arrangements. Expenses net of all reductions represent the net expenses paid by the class. F The portfolio turnover rate does not include the assets acquired in the merger. G Amount represents less than $.01 per share. |
Financial Highlights - Institutional Class
Years ended October 31, | 2013 | 2012 | 2011 G |
Selected Per-Share Data | | | |
Net asset value, beginning of period | $ 9.33 | $ 9.57 | $ 10.83 |
Income from Investment Operations | | | |
Net investment income (loss) D | .13 | .12 | .13 |
Net realized and unrealized gain (loss) | 2.78 | (.14) | (1.40) |
Total from investment operations | 2.91 | (.02) | (1.27) |
Distributions from net investment income | (.15) | (.17) | - |
Distributions from net realized gain | (.08) | (.05) | - |
Total distributions | (.23) | (.22) | - |
Redemption fees added to paid in capital D | .01 | - J | .01 |
Net asset value, end of period | $ 12.02 | $ 9.33 | $ 9.57 |
Total Return B, C | 32.04% | (.18)% | (11.63)% |
Ratios to Average Net Assets E, H | | | |
Expenses before reductions | .90% | 1.03% | .79% A |
Expenses net of fee waivers, if any | .90% | 1.01% | .79% A |
Expenses net of all reductions | .88% | .99% | .75% A |
Net investment income (loss) | 1.11% | 1.31% | 1.43% A |
Supplemental Data | | | |
Net assets, end of period (000 omitted) | $ 20,033 | $ 1,488 | $ 2,715 |
Portfolio turnover rate F | 68% | 52% | 134% I |
A Annualized B Total returns for periods of less than one year are not annualized. C Total returns would have been lower if certain expenses had not been reduced during the applicable periods shown. D Calculated based on average shares outstanding during the period. E Fees and expenses of any underlying Fidelity Central Funds are not included in the Fund's expense ratio. The Fund indirectly bears its proportionate share of the expenses of any underlying Fidelity Central Funds. F Amount does not include the portfolio activity of any underlying Fidelity Central Funds. G For the period December 14, 2010 (commencement of sale of shares) to October 31, 2011. H Expense ratios reflect operating expenses of the class. Expenses before reductions do not reflect amounts reimbursed by the investment adviser or reductions from brokerage service arrangements or reductions from other expense offset arrangements and do not represent the amount paid by the class during periods when reimbursements or reductions occur. Expense ratios before reductions for start-up periods may not be representative of longer-term operating periods. Expenses net of fee waivers reflect expenses after reimbursement by the investment adviser but prior to reductions from brokerage service arrangements or other expense offset arrangements. Expenses net of all reductions represent the net expenses paid by the class. I The portfolio turnover rate does not include the assets acquired in the merger. J Amount represents less than $.01 per share. |
See accompanying notes which are an integral part of the financial statements.
Annual Report
Notes to Financial Statements
For the period ended October 31, 2013
1. Organization.
Fidelity Japan Fund (the Fund) is a fund of Fidelity Investment Trust (the Trust) and is authorized to issue an unlimited number of shares. The Trust is registered under the Investment Company Act of 1940, as amended (the 1940 Act), as an open-end management investment company organized as a Massachusetts business trust. The Fund offers Class A, Class T, Class C, Japan and Institutional Class shares, each of which, along with Class B shares, has equal rights as to assets and voting privileges. Class B shares are closed to new accounts and additional purchases, except for exchanges and reinvestments. Each class has exclusive voting rights with respect to matters that affect that class. Class B shares will automatically convert to Class A shares after a holding period of seven years from the initial date of purchase.
2. Investments in Fidelity Central Funds.
The Fund invests in Fidelity Central Funds, which are open-end investment companies generally available only to other investment companies and accounts managed by Fidelity Management & Research Company (FMR) and its affiliates. The Fund's Schedule of Investments lists each of the Fidelity Central Funds held as of period end, if any, as an investment of the Fund, but does not include the underlying holdings of each Fidelity Central Fund. As an Investing Fund, the Fund indirectly bears its proportionate share of the expenses of the underlying Fidelity Central Funds.
The Money Market Central Funds seek preservation of capital and current income and are managed by Fidelity Investments Money Management, Inc. (FIMM), an affiliate of FMR.
A complete unaudited list of holdings for each Fidelity Central Fund is available upon request or at the Securities and Exchange Commission (the SEC) website at www.sec.gov. In addition, the financial statements of the Fidelity Central Funds, which are not covered by the Fund's Report of Independent Registered Public Accounting Firm, are available on the SEC website or upon request.
3. Significant Accounting Policies.
The financial statements have been prepared in conformity with accounting principles generally accepted in the United States of America (GAAP), which require management to make certain estimates and assumptions at the date of the financial statements. Actual results could differ from those estimates. Subsequent events, if any, through the date that the financial statements were issued have been evaluated in the preparation of the financial statements. The following summarizes the significant accounting policies of the Fund:
Investment Valuation. Investments are valued as of 4:00 p.m. Eastern time on the last calendar day of the period. In accordance with valuation policies and procedures approved by the Board of Trustees (the Board), the Fund attempts to obtain prices from one or more third party pricing vendors or brokers to value its investments. When current market prices, quotations or currency exchange rates are not readily available or reliable, investments will be fair valued in good faith by the FMR Fair Value Committee (the Committee), in accordance with procedures adopted by the Board. Factors used in determining fair value vary by investment type and may include market or investment specific events. The frequency with which these procedures are used cannot be predicted and they may be utilized to a significant extent. The Committee oversees the Fund's valuation policies and procedures and is responsible for approving and reporting to the Board all fair value determinations.
The Fund categorizes the inputs to valuation techniques used to value its investments into a disclosure hierarchy consisting of three levels as shown below:
Level 1 - quoted prices in active markets for identical investments
Level 2 - other significant observable inputs (including quoted prices for similar investments, interest rates, prepayment speeds, etc.)
Level 3 - unobservable inputs (including the Fund's own assumptions based on the best information available)
Valuation techniques used to value the Fund's investments by major category are as follows:
Equity securities, including restricted securities, for which market quotations are readily available, are valued at the last reported sale price or official closing price as reported by a third party pricing vendor on the primary market or exchange on which they are traded and are categorized as Level 1 in the hierarchy. In the event there were no sales during the day or closing prices are not available, securities are valued at the last quoted bid price or may be valued using the last available price and are generally categorized as Level 2 in the hierarchy. For foreign equity securities, when market or security specific events arise, comparisons to the valuation of American Depositary Receipts (ADRs), futures contracts, Exchange-Traded Funds (ETFs) and certain indexes as well as quoted prices for similar securities may be used and would be categorized as Level 2 in the hierarchy. Utilizing these techniques may result in transfers between Level 1 and Level 2. For equity securities, including restricted securities, where observable inputs are limited, assumptions about market activity and risk are used and these securities may be categorized as Level 3 in the hierarchy.
Investments in open-end mutual funds, including the Fidelity Central Funds, are valued at their closing net asset value (NAV) each business day and are categorized as Level 1 in the hierarchy.
Annual Report
3. Significant Accounting Policies - continued
Investment Valuation - continued
Changes in valuation techniques may result in transfers in or out of an assigned level within the disclosure hierarchy. The aggregate value of investments by input level, as of October 31, 2013, including information on transfers between Levels 1 and 2 is included at the end of the Fund's Schedule of Investments.
Foreign Currency. The Fund may use foreign currency contracts to facilitate transactions in foreign-denominated securities. Gains and losses from these transactions may arise from changes in the value of the foreign currency or if the counterparties do not perform under the contracts' terms.
Foreign-denominated assets, including investment securities, and liabilities are translated into U.S. dollars at the exchange rates at period end. Purchases and sales of investment securities, income and dividends received and expenses denominated in foreign currencies are translated into U.S. dollars at the exchange rate in effect on the transaction date.
The effects of exchange rate fluctuations on investments are included with the net realized and unrealized gain (loss) on investment securities. Other foreign currency transactions resulting in realized and unrealized gain (loss) are disclosed separately.
Investment Transactions and Income. For financial reporting purposes, the Fund's investment holdings and NAV include trades executed through the end of the last business day of the period. The NAV per share for processing shareholder transactions is calculated as of the close of business of the New York Stock Exchange (NYSE), normally 4:00 p.m. Eastern time and includes trades executed through the end of the prior business day. Gains and losses on securities sold are determined on the basis of identified cost. Dividend income is recorded on the ex-dividend date, except for certain dividends from foreign securities where the ex-dividend date may have passed, which are recorded as soon as the Fund is informed of the ex-dividend date. Non-cash dividends included in dividend income, if any, are recorded at the fair market value of the securities received. Interest income and distributions from the Fidelity Central Funds are accrued as earned. Investment income is recorded net of foreign taxes withheld where recovery of such taxes is uncertain.
Class Allocations and Expenses. Investment income, realized and unrealized capital gains and losses, common expenses of the Fund, and certain fund-level expense reductions, if any, are allocated daily on a pro-rata basis to each class based on the relative net assets of each class to the total net assets of the Fund. Each class differs with respect to transfer agent and distribution and service plan fees incurred. Certain expense reductions may also differ by class. For the reporting period, the allocated portion of income and expenses to each class as a percent of its average net assets may vary due to the timing of recording these transactions in relation to fluctuating net assets of the classes. Expenses directly attributable to a fund are charged to that fund. Expenses attributable to more than one fund are allocated among the respective funds on the basis of relative net assets or other appropriate methods. Expense estimates are accrued in the period to which they relate and adjustments are made when actual amounts are known.
Income Tax Information and Distributions to Shareholders. Each year, the Fund intends to qualify as a regulated investment company under Subchapter M of the Internal Revenue Code, including distributing substantially all of its taxable income and realized gains. As a result, no provision for U.S. Federal income taxes is required. As of October 31, 2013, the Fund did not have any unrecognized tax benefits in the financial statements; nor is the Fund aware of any tax positions for which it is reasonably possible that the total amounts of unrecognized tax benefits will significantly change in the next twelve months. The Fund files a U.S. federal tax return, in addition to state and local tax returns as required. The Fund's federal income tax returns are subject to examination by the Internal Revenue Service (IRS) for a period of three fiscal years after they are filed. State and local tax returns may be subject to examination for an additional fiscal year depending on the jurisdiction. Foreign taxes are provided for based on the Fund's understanding of the tax rules and rates that exist in the foreign markets in which it invests.
Distributions are declared and recorded on the ex-dividend date. Income dividends and capital gain distributions are declared separately for each class. Income and capital gain distributions are determined in accordance with income tax regulations, which may differ from GAAP.
Capital accounts within the financial statements are adjusted for permanent book-tax differences. These adjustments have no impact on net assets or the results of operations. Temporary book-tax differences will reverse in a subsequent period.
Book-tax differences are primarily due to foreign currency transactions, passive foreign investment companies (PFIC), deferred trustees compensation, capital loss carryforwards and losses deferred due to wash sales.
The federal tax cost of investment securities and unrealized appreciation (depreciation) as of period end were as follows:
Gross unrealized appreciation | $ 55,398,617 |
Gross unrealized depreciation | (43,857,029) |
Net unrealized appreciation (depreciation) on securities and other investments | $ 11,541,588 |
| |
Tax Cost | $ 530,077,462 |
Annual Report
Notes to Financial Statements - continued
3. Significant Accounting Policies - continued
Income Tax Information and Distributions to Shareholders - continued
The tax-based components of distributable earnings as of period end were as follows:
Undistributed ordinary income | $ 4,845,246 |
Capital loss carryforward | $ (190,515,854) |
Net unrealized appreciation (depreciation) | $ 11,549,764 |
Capital loss carryforwards are only available to offset future capital gains of the Fund to the extent provided by regulations and may be limited. Under the Regulated Investment Company Modernization Act of 2010 (the Act), the Fund is permitted to carry forward capital losses incurred in taxable years beginning after December 22, 2010 for an unlimited period and such capital losses are required to be used prior to any losses that expire. The capital loss carryforward information presented below, including any applicable limitation, is estimated as of fiscal period end and is subject to adjustment.
Fiscal year of expiration | |
2016 | (3,870,588) |
2017 | (60,951,366) |
2018 | (26,887,863) |
2019 | (98,806,037) |
Total with expiration | (190,515,854) |
The tax character of distributions paid was as follows:
| October 31, 2013 | October 31, 2012 |
| | |
Ordinary Income | $ 8,748,841 | $ 10,259,692 |
Due to large redemptions in a prior period, $161,303,179 of capital losses that will be available to offset future capital gains of the Fund will be limited to approximately $18,885,324 per year.
The Fund acquired $5,487,891 of its capital loss carryforward as part of a merger in a prior period. The losses acquired that will be available to offset future capital gains of the Fund will be limited to approximately $1,371,973 per year.
Short-Term Trading (Redemption) Fees. Shares held by investors in the Fund less than 90 days may have been subject to a redemption fee equal to 1.50% of the net asset value of shares redeemed. All redemption fees, which reduce the proceeds of the shareholder redemption, are retained by the Fund and accounted for as an addition to paid in capital.
4. Purchases and Sales of Investments.
Purchases and sales of securities, other than short-term securities, aggregated $351,084,154 and $314,554,352, respectively.
5. Fees and Other Transactions with Affiliates.
Management Fee. FMR and its affiliates provide the Fund with investment management related services for which the Fund pays a monthly management fee. The management fee is the sum of an individual fund fee rate that is based on an annual rate of .45% of the Fund's average net assets and an annualized group fee rate that averaged .25% during the period. The group fee rate is based upon the average net assets of all the mutual funds advised by FMR, including any mutual funds previously advised by FMR that are currently advised by Fidelity SelectCo, LLC, an affiliate of FMR. The group fee rate decreases as assets under management increase and increases as assets under management decrease. In addition, the management fee is subject to a performance adjustment (up to a maximum of ± .20% of the Fund's average net assets over a 36 month performance period). The upward or downward adjustment to the management fee is based on the relative investment performance of Japan as compared to an appropriate benchmark index over the same 36 month performance period. For the reporting period, the total annual management fee rate, including the performance adjustment, was .63% of the Fund's average net assets. The performance adjustment included in the management fee rate may be higher or lower than the maximum performance adjustment rate due to the difference between the average net assets for the reporting and performance periods.
Distribution and Service Plan Fees. In accordance with Rule 12b-1 of the 1940 Act, the Fund has adopted separate Distribution and Service Plans for each class of shares. Certain classes pay Fidelity Distributors Corporation (FDC), an affiliate of FMR, separate Distribution and Service Fees, each of which is based on an annual percentage of each class' average net assets. In addition, FDC may pay financial intermediaries for selling shares of the
Annual Report
5. Fees and Other Transactions with Affiliates - continued
Distribution and Service Plan Fees - continued
Fund and providing shareholder support services. For the period, the Distribution and Service Fee rates, total fees and amounts retained by FDC were as follows:
| Distribution
Fee | Service
Fee | Total Fees | Retained
by FDC |
Class A | -% | .25% | $ 38,678 | $ 1,182 |
Class T | .25% | .25% | 24,976 | - |
Class B | .75% | .25% | 9,235 | 6,947 |
Class C | .75% | .25% | 91,757 | 26,746 |
| | | $ 164,646 | $ 34,875 |
Sales Load. FDC may receive a front-end sales charge of up to 5.75% for selling Class A shares and 3.50% for selling Class T shares, some of which is paid to financial intermediaries for selling shares of the Fund. Depending on the holding period, FDC may receive contingent deferred sales charges levied on Class A, Class T, Class B and Class C redemptions. The deferred sales charges range from 5.00% to 1.00% for Class B shares, 1.00% for Class C shares, 1.00% for certain purchases of Class A shares and .25% for certain purchases of Class T shares.
For the period, sales charge amounts retained by FDC were as follows:
| Retained
by FDC |
Class A | $ 23,911 |
Class T | 2,514 |
Class B* | 629 |
Class C* | 3,853 |
| $ 30,907 |
* When Class B and Class C shares are initially sold, FDC pays commissions from its own resources to financial intermediaries through which the sales are made.
Transfer Agent Fees. Fidelity Investments Institutional Operations Company, Inc., (FIIOC), an affiliate of FMR, is the transfer, dividend disbursing and shareholder servicing agent for each class of the Fund. FIIOC receives account fees and asset-based fees that vary according to the account size and type of account of the shareholders of the respective classes of the Fund. FIIOC pays for typesetting, printing and mailing of shareholder reports, except proxy statements.
For the period, transfer agent fees for each applicable class were as follows:
| Amount | % of
Average
Net Assets |
Class A | $ 45,115 | .29 |
Class T | 16,311 | .33 |
Class B | 2,767 | .30 |
Class C | 22,846 | .25 |
Japan | 901,696 | .20 |
Institutional Class | 17,258 | .17 |
| $ 1,005,993 | |
Accounting and Security Lending Fees. Fidelity Service Company, Inc. (FSC), an affiliate of FMR, maintains the Fund's accounting records. The accounting fee is based on the level of average net assets for each month. Under a separate contract, FSC administers the security lending program. The security lending fee is based on the number and duration of lending transactions.
Interfund Lending Program. Pursuant to an Exemptive Order issued by the SEC, the Fund, along with other registered investment companies having management contracts with FMR, may participate in an interfund lending program. This program provides an alternative credit facility allowing the funds to borrow from, or lend money to, other participating affiliated funds. At period end, there were no interfund loans outstanding. The Fund's activity in this program during the period for which loans were outstanding was as follows:
Borrower or Lender | Average Loan
Balance | Weighted Average Interest Rate | Interest
Expense |
Borrower | $ 2,436,750 | .31% | $ 85 |
Annual Report
Notes to Financial Statements - continued
6. Committed Line of Credit.
The Fund participates with other funds managed by FMR or an affiliate in a $4.25 billion credit facility (the "line of credit") to be utilized for temporary or emergency purposes to fund shareholder redemptions or for other short-term liquidity purposes. The Fund has agreed to pay commitment fees on its pro-rata portion of the line of credit, which amounted to $993 and is reflected in Miscellaneous expenses on the Statement of Operations. During the period, there were no borrowings on this line of credit.
7. Security Lending.
The Fund lends portfolio securities through a lending agent from time to time in order to earn additional income. For equity securities, a lending agent is used and may loan securities to certain qualified borrowers, including Fidelity Capital Markets (FCM), a broker-dealer affiliated with the Fund. On the settlement date of the loan, the Fund receives collateral (in the form of U.S. Treasury obligations, letters of credit and/or cash) against the loaned securities and maintains collateral in an amount not less than 100% of the market value of the loaned securities during the period of the loan. The market value of the loaned securities is determined at the close of business of the Fund and any additional required collateral is delivered to the Fund on the next business day. If the borrower defaults on its obligation to return the securities loaned because of insolvency or other reasons, the Fund may apply collateral received from the borrower against the obligation. The Fund may experience delays and costs in recovering the securities loaned. Any cash collateral received is invested in the Fidelity Securities Lending Cash Central Fund. The value of loaned securities and cash collateral at period end are disclosed on the Fund's Statement of Assets and Liabilities. Security lending income represents the income earned on investing cash collateral, less rebates paid to borrowers and any lending agent fees associated with the loan, plus any premium payments received for lending certain types of securities. Security lending income is presented in the Statement of Operations as a component of income from Fidelity Central Funds. Total security lending income during the period amounted to $93,183. During the period, there were no securities loaned to FCM.
8. Expense Reductions.
Commissions paid to certain brokers with whom FMR, or its affiliates, places trades on behalf of the Fund include an amount in addition to trade execution, which may be rebated back to the Fund to offset certain expenses. This amount totaled $76,363 for the period.
In addition, FMR reimbursed a portion of the Fund's operating expenses during the period in the amount of $2,569.
9. Distributions to Shareholders.
Distributions to shareholders of each class were as follows:
Years ended October 31, | 2013 | 2012 |
From net investment income | | |
Class A | $ 106,946 | $ 168,535 |
Class T | 32,766 | 50,833 |
Class B | - | 6,144 |
Class C | 8,397 | 52,214 |
Japan | 5,470,176 | 7,354,386 |
Institutional Class | 23,693 | 56,675 |
Total | $ 5,641,978 | $ 7,688,787 |
From net realized gain | | |
Class A | $ 79,705 | $ 69,007 |
Class T | 33,186 | 24,703 |
Class B | 6,644 | 7,792 |
Class C | 55,283 | 46,858 |
Japan | 2,919,891 | 2,405,209 |
Institutional Class | 12,154 | 17,336 |
Total | $ 3,106,863 | $ 2,570,905 |
Annual Report
10. Share Transactions.
Transactions for each class of shares were as follows:
| Shares | Dollars |
Years ended October 31, | 2013 | 2012 | 2013 | 2012 |
Class A | | | | |
Shares sold | 1,327,321 | 272,417 | $ 15,043,376 | $ 2,571,605 |
Reinvestment of distributions | 17,701 | 22,132 | 165,861 | 206,271 |
Shares redeemed | (655,691) | (659,149) | (7,373,829) | (6,253,228) |
Net increase (decrease) | 689,331 | (364,600) | $ 7,835,408 | $ (3,475,352) |
Class T | | | | |
Shares sold | 195,003 | 61,409 | $ 2,164,942 | $ 587,072 |
Reinvestment of distributions | 6,834 | 7,853 | 64,034 | 73,111 |
Shares redeemed | (178,171) | (133,261) | (1,988,129) | (1,264,265) |
Net increase (decrease) | 23,666 | (63,999) | $ 240,847 | $ (604,082) |
Class B | | | | |
Shares sold | 14,757 | 6,716 | $ 173,151 | $ 66,720 |
Reinvestment of distributions | 463 | 1,058 | 4,366 | 9,881 |
Shares redeemed | (51,705) | (52,372) | (551,755) | (495,118) |
Net increase (decrease) | (36,485) | (44,598) | $ (374,238) | $ (418,517) |
Class C | | | | |
Shares sold | 526,927 | 108,642 | $ 5,994,932 | $ 1,051,805 |
Reinvestment of distributions | 5,172 | 7,654 | 48,618 | 71,333 |
Shares redeemed | (302,151) | (280,979) | (3,208,131) | (2,637,126) |
Net increase (decrease) | 229,948 | (164,683) | $ 2,835,419 | $ (1,513,988) |
Japan | | | | |
Shares sold | 14,062,957 | 2,737,496 | $ 157,503,214 | $ 26,290,775 |
Reinvestment of distributions | 872,770 | 1,014,920 | 8,177,855 | 9,459,053 |
Shares redeemed | (12,837,219) | (12,951,522) | (141,848,609) | (122,521,103) |
Net increase (decrease) | 2,098,508 | (9,199,106) | $ 23,832,460 | $ (86,771,275) |
Institutional Class | | | | |
Shares sold | 1,891,907 | 238,239 | $ 21,220,551 | $ 2,250,127 |
Reinvestment of distributions | 2,940 | 6,735 | 27,514 | 62,700 |
Shares redeemed | (387,518) | (369,198) | (4,437,952) | (3,505,242) |
Net increase (decrease) | 1,507,329 | (124,224) | $ 16,810,113 | $ (1,192,415) |
11. Other.
The Fund's organizational documents provide former and current trustees and officers with a limited indemnification against liabilities arising in connection with the performance of their duties to the Fund. In the normal course of business, the Fund may also enter into contracts that provide general indemnifications. The Fund's maximum exposure under these arrangements is unknown as this would be dependent on future claims that may be made against the Fund. The risk of material loss from such claims is considered remote.
At the end of the period, Strategic Advisers International Fund was the owner of record of approximately 37% of the total outstanding shares of the Fund. Mutual Funds managed by FMR or its affiliates were the owners of record, in the aggregate, of approximately 42% of the total outstanding shares of the Fund.
Annual Report
Fidelity Japan Smaller Companies Fund
Average annual total return reflects the change in the value of an investment, assuming reinvestment of the fund's distributions from dividend income and capital gains (the profits earned upon the sale of securities that have grown in value, if any) and assuming a constant rate of performance each year. The $10,000 table and the fund's returns do not reflect the deduction of taxes that a shareholder would pay on fund distributions or the redemption of fund shares. During periods of reimbursement by Fidelity, a fund's total return will be greater than it would be had the reimbursement not occurred. How a fund did yesterday is no guarantee of how it will do tomorrow.
Average Annual Total Returns
Periods ended October 31, 2013 | Past 1
year | Past 5
years | Past 10
years |
Fidelity Japan Smaller Companies Fund | 55.79% | 16.49% | 4.93% |
$10,000 Over 10 years
Let's say hypothetically that $10,000 was invested in Fidelity Japan Smaller Companies Fund on October 31, 2003. The chart shows how the value of your investment would have changed, and also shows how the Russell/Nomura Mid-Small CapTM Index performed over the same period.
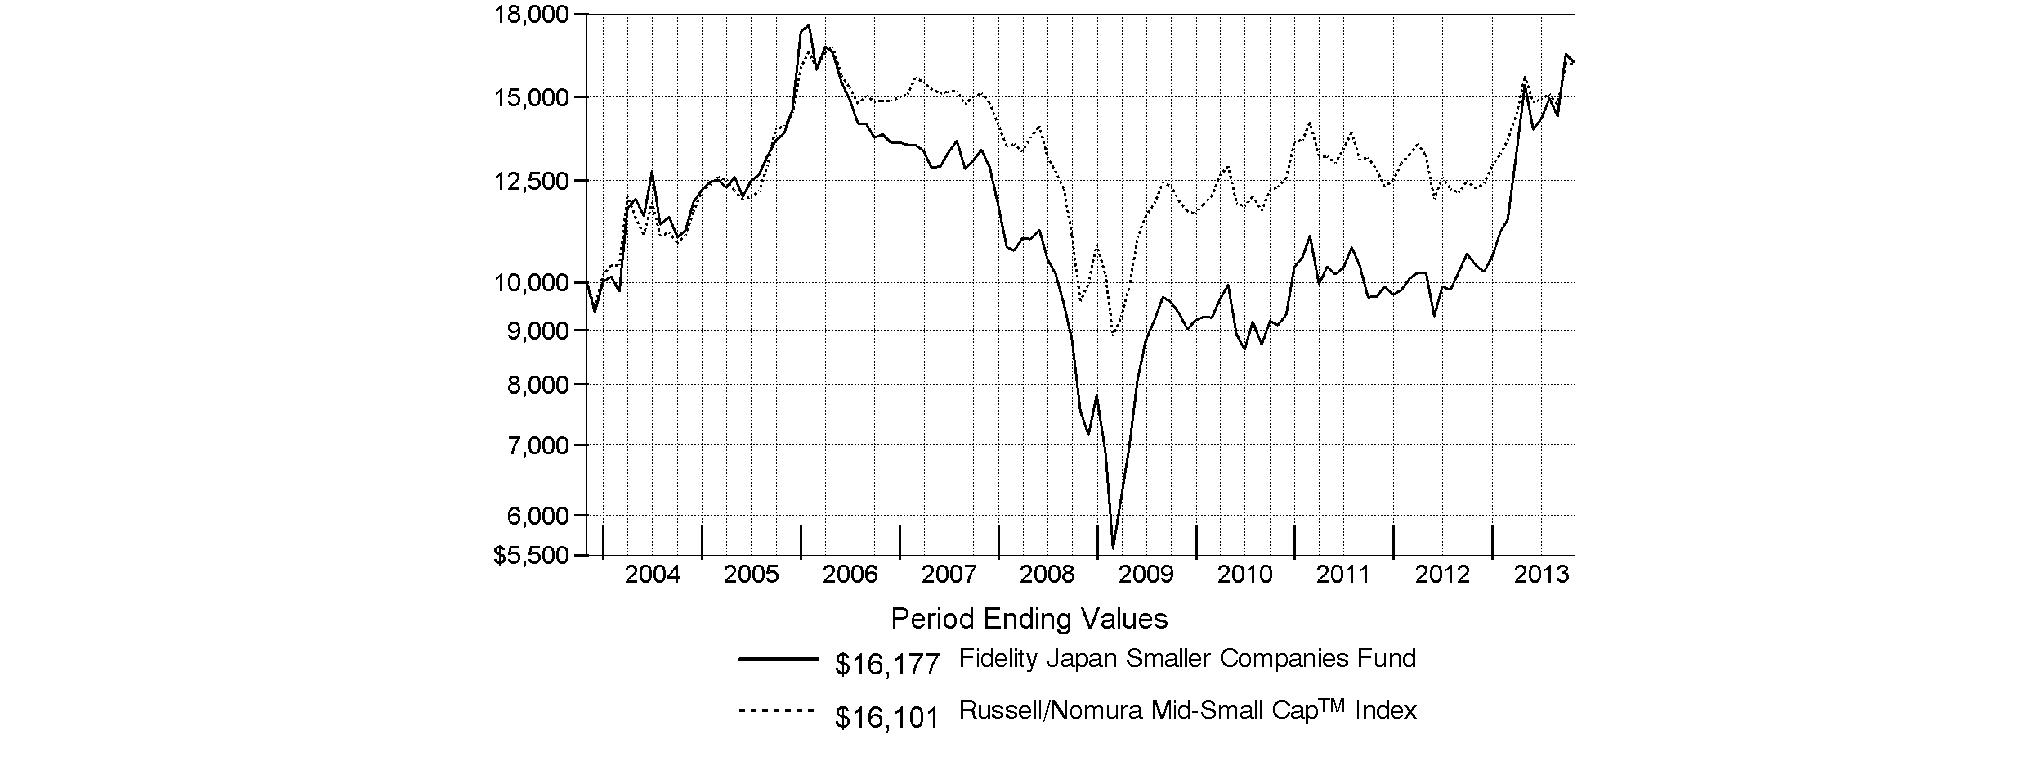
Annual Report
Fidelity Japan Smaller Companies Fund
Market Recap: On balance, global equity markets remained upbeat for the 12-month period ending October 31, 2013. The MSCI® ACWI® (All Country World Index) Index gained 23.75% for the period, amid investor preference for higher-risk assets. The period was not without turbulence, however. In the spring and summer, central banks worldwide, especially in the U.S. and China, made clear their intentions to maintain accommodative monetary policies. That stance, combined with modest cyclical improvements around the globe and generally low valuations, underpinned the broad rally in equities. Europe (+32%) shone brightly, with most markets in the region - large and small - registering solid, index-beating gains. Another bright spot was Japan, which, despite a struggling yen and taking a second-half breather, posted a 34% result for the full year. The U.S. - by far the index's biggest constituent - also outperformed the global market with a roughly 28% advance. Meanwhile, Asia-Pacific ex Japan (+14%) lagged, hurt in part by a slowdown in Australia's mining industry as well as currency headwinds. Foreign-exchange and commodity weakness also curbed results in resource-heavy Canada and emerging markets (EM), both of which were up 7%. Country-level EM performance diverged meaningfully for the period, as evidenced by performance in Brazil (-1%), Russia (+12%), India (+1%) and China (+8%).
Comments from Nicholas Price, Portfolio Manager of Fidelity® Japan Smaller Companies Fund: For the year, the fund returned 55.79%, far outdistancing the 31.19% return of the Russell/Nomura Mid-Small CapTM Index. Japan's economy and stock market marked a positive turning point in late 2012 with the election of new Prime Minister Shinzo Abe, who moved quickly to implement his reflationary policies, setting a pro-cyclical rally in motion. The Bank of Japan's aggressive easing measures helped spur sharp declines in the yen and accelerated share price gains. Against this backdrop, the fund's four-largest holdings during the period - baby products manufacturer Pigeon, online price comparator Kakaku.com, real estate developer Tokyo Tatemono and an out-of-index stake in consumer credit giant ORIX - also were its top relative contributors, a testament to our stock-picking approach. Overweighting diversified financial services and real estate proved particularly rewarding, even though our stock picking in the former category detracted somewhat. Security selection in household & personal products and software & services also helped. Conversely, a large, out-of-index stake in video game developer Nintendo was by far the fund's largest individual detractor. I began selling the position in late 2012 after the company cut its earnings guidance, and I closed out the position in February. An underweighting in power utilities also hurt, as the potential for new safety standards raised expectations for nuclear restarts, boosting the group's return.
The views expressed above reflect those of the portfolio manager(s) only through the end of the period as stated on the cover of this report and do not necessarily represent the views of Fidelity or any other person in the Fidelity organization. Any such views are subject to change at any time based upon market or other conditions and Fidelity disclaims any responsibility to update such views. These views may not be relied on as investment advice and, because investment decisions for a Fidelity fund are based on numerous factors, may not be relied on as an indication of trading intent on behalf of any Fidelity fund.
Annual Report
Fidelity Japan Smaller Companies Fund
As a shareholder of the Fund, you incur two types of costs: (1) transaction costs, including redemption fees and (2) ongoing costs, including management fees and other Fund expenses. This Example is intended to help you understand your ongoing costs (in dollars) of investing in the Fund and to compare these costs with the ongoing costs of investing in other mutual funds.
The Example is based on an investment of $1,000 invested at the beginning of the period and held for the entire period (May 1, 2013 to October 31, 2013).
Actual Expenses
The first line of the accompanying table provides information about actual account values and actual expenses. You may use the information in this line, together with the amount you invested, to estimate the expenses that you paid over the period. Simply divide your account value by $1,000.00 (for example, an $8,600 account value divided by $1,000.00 = 8.6), then multiply the result by the number in the first line under the heading entitled "Expenses Paid During Period" to estimate the expenses you paid on your account during this period. A small balance maintenance fee of $12.00 that is charged once a year may apply for certain accounts with a value of less than $2,000. This fee is not included in the table below. If it was, the estimate of expenses you paid during the period would be higher, and your ending account value lower, by this amount. In addition, the Fund, as a shareholder in the underlying Fidelity Central Funds, will indirectly bear its pro-rata share of the fees and expenses incurred by the underlying Fidelity Central Funds. These fees and expenses are not included in the Fund's annualized expense ratio used to calculate the expense estimate in the table below.
Hypothetical Example for Comparison Purposes
The second line of the accompanying table provides information about hypothetical account values and hypothetical expenses based on the Fund's actual expense ratio and an assumed rate of return of 5% per year before expenses, which is not the Fund's actual return. The hypothetical account values and expenses may not be used to estimate the actual ending account balance or expenses you paid for the period. You may use this information to compare the ongoing costs of investing in the Fund and other funds. To do so, compare this 5% hypothetical example with the 5% hypothetical examples that appear in the shareholder reports of the other funds. A small balance maintenance fee of $12.00 that is charged once a year may apply for certain accounts with a value of less than $2,000. This fee is not included in the table below. If it was, the estimate of expenses you paid during the period would be higher, and your ending account value lower, by this amount. In addition, the Fund, as a shareholder in the underlying Fidelity Central Funds, will indirectly bear its pro-rata share of the fees and expenses incurred by the underlying Fidelity Central Funds. These fees and expenses are not included in the Fund's annualized expense ratio used to calculate the expense estimate in the table below.
Please note that the expenses shown in the table are meant to highlight your ongoing costs only and do not reflect any transaction costs. Therefore, the second line of the table is useful in comparing ongoing costs only, and will not help you determine the relative total costs of owning different funds. In addition, if these transactional costs were included, your costs would have been higher.
| Annualized
Expense Ratio B | Beginning
Account Value
May 1, 2013 | Ending
Account Value
October 31, 2013 | Expenses Paid
During Period*
May 1, 2013
to October 31, 2013 |
Actual | 1.01% | $ 1,000.00 | $ 1,050.00 | $ 5.22 |
Hypothetical A | | $ 1,000.00 | $ 1,020.11 | $ 5.14 |
A 5% return per year before expenses
B Annualized expense ratio reflects expenses net of applicable fee waivers.
* Expenses are equal to the Fund's annualized expense ratio, multiplied by the average account value over the period, multiplied by 184/365 (to reflect the one-half year period).
Annual Report
Fidelity Japan Smaller Companies Fund
Investment Changes (Unaudited)
Geographic Diversification (% of fund's net assets) |
As of October 31, 2013 |
| Japan | 99.3% | |
| United States of America* | 0.7% | |

* Includes Short-Term Investments and Net Other Assets (Liabilities). |
Percentages are based on country or territory of incorporation and are adjusted for the effect of futures contracts, if applicable. |
As of April 30, 2013 |
| Japan | 98.2% | |
| United States of America* | 1.8% | |

* Includes Short-Term Investments and Net Other Assets (Liabilities). |
Percentages are based on country or territory of incorporation and are adjusted for the effect of futures contracts, if applicable. |
Asset Allocation as of October 31, 2013 |
| % of fund's
net assets | % of fund's net assets
6 months ago |
Stocks | 99.3 | 98.2 |
Short-Term Investments and Net Other Assets (Liabilities) | 0.7 | 1.8 |
Top Ten Stocks as of October 31, 2013 |
| % of fund's
net assets | % of fund's net assets
6 months ago |
ORIX Corp. (Diversified Financial Services) | 7.0 | 6.8 |
Tokyo Tatemono Co. Ltd. (Real Estate Management & Development) | 5.5 | 5.4 |
Pigeon Corp. (Household Products) | 5.2 | 5.0 |
Rakuten, Inc. (Internet & Catalog Retail) | 4.5 | 3.5 |
Kakaku.com, Inc. (Internet Software & Services) | 4.5 | 4.5 |
Sega Sammy Holdings, Inc. (Leisure Equipment & Products) | 3.5 | 3.8 |
Stanley Electric Co. Ltd. (Auto Components) | 3.3 | 2.2 |
AEON Financial Service Co. Ltd. (Consumer Finance) | 3.2 | 2.4 |
Leopalace21 Corp. (Real Estate Management & Development) | 3.1 | 0.0 |
Mazda Motor Corp. (Automobiles) | 2.7 | 1.5 |
| 42.5 | |
Market Sectors as of October 31, 2013 |
| % of fund's
net assets | % of fund's net assets
6 months ago |
Consumer Discretionary | 27.4 | 29.7 |
Financials | 27.0 | 29.9 |
Industrials | 10.1 | 9.6 |
Information Technology | 9.9 | 9.3 |
Utilities | 8.4 | 0.0 |
Health Care | 7.1 | 8.1 |
Consumer Staples | 6.2 | 5.4 |
Materials | 2.7 | 1.7 |
Telecommunication Services | 0.3 | 4.1 |
Energy | 0.2 | 0.4 |
Annual Report
Fidelity Japan Smaller Companies Fund
Investments October 31, 2013
Showing Percentage of Net Assets
Common Stocks - 99.3% |
| Shares | | Value |
CONSUMER DISCRETIONARY - 27.4% |
Auto Components - 3.5% |
G-Tekt Corp. | 22,700 | | $ 670,994 |
Nippon Seiki Co. Ltd. | 35,000 | | 570,637 |
Stanley Electric Co. Ltd. | 946,200 | | 22,009,571 |
| | 23,251,202 |
Automobiles - 5.0% |
Mazda Motor Corp. (a) | 3,998,000 | | 17,997,032 |
Nissan Motor Co. Ltd. | 447,700 | | 4,495,473 |
Yamaha Motor Co. Ltd. | 693,800 | | 10,627,977 |
| | 33,120,482 |
Hotels, Restaurants & Leisure - 3.0% |
Accordia Golf Co. Ltd. | 691,000 | | 7,583,873 |
H.I.S. Co. Ltd. | 197,100 | | 10,630,524 |
Koshidaka Holdings Co. Ltd. | 47,500 | | 1,673,057 |
| | 19,887,454 |
Household Durables - 3.7% |
Foster Electric Co. Ltd. | 328,700 | | 6,431,195 |
Hajime Construction Co. Ltd. (d) | 156,400 | | 10,784,013 |
Higashi Nihon House Co. Ltd. | 1,002,000 | | 5,356,445 |
Pressance Corp. (d) | 51,000 | | 1,633,060 |
| | 24,204,713 |
Internet & Catalog Retail - 4.5% |
Rakuten, Inc. | 2,284,500 | | 29,766,214 |
Leisure Equipment & Products - 4.1% |
Heiwa Corp. | 108,200 | | 1,814,107 |
KAWAI Musical Instruments Manufacturing Co. Ltd. | 1,059,000 | | 1,997,680 |
Sega Sammy Holdings, Inc. | 899,000 | | 23,046,353 |
| | 26,858,140 |
Media - 0.3% |
Fuji Media Holdings, Inc. | 109,400 | | 2,180,929 |
Multiline Retail - 0.1% |
Parco Co. Ltd. | 79,000 | | 812,199 |
Specialty Retail - 2.9% |
Fuji Corp. | 77,600 | | 1,279,528 |
K's Denki Corp. | 294,800 | | 8,656,168 |
Pal Co. Ltd. | 284,200 | | 7,941,850 |
VT Holdings Co. Ltd. | 119,200 | | 1,604,323 |
| | 19,481,869 |
Textiles, Apparel & Luxury Goods - 0.3% |
Fujibo Holdings, Inc. | 946,000 | | 1,927,664 |
TOTAL CONSUMER DISCRETIONARY | | 181,490,866 |
CONSUMER STAPLES - 6.2% |
Food & Staples Retailing - 0.4% |
Welcia Holdings Co. Ltd. | 28,300 | | 1,711,853 |
Yamaya Corp. | 74,700 | | 1,076,053 |
| | 2,787,906 |
|
| Shares | | Value |
Food Products - 0.6% |
Ajinomoto Co., Inc. | 276,000 | | $ 3,862,077 |
Kotobuki Spirits Co. Ltd. | 29,200 | | 381,855 |
| | 4,243,932 |
Household Products - 5.2% |
Pigeon Corp. | 661,600 | | 34,134,060 |
TOTAL CONSUMER STAPLES | | 41,165,898 |
ENERGY - 0.2% |
Oil, Gas & Consumable Fuels - 0.2% |
Kanto Natural Gas Development | 152,000 | | 1,071,665 |
San-Ai Oil Co. Ltd. | 113,000 | | 488,027 |
| | 1,559,692 |
FINANCIALS - 27.0% |
Capital Markets - 1.0% |
JAFCO Co. Ltd. | 107,500 | | 5,391,157 |
Sawada Holdings Co. Ltd. (d) | 104,300 | | 979,465 |
| | 6,370,622 |
Commercial Banks - 1.0% |
Mizuho Financial Group, Inc. | 2,656,300 | | 5,575,742 |
Shinsei Bank Ltd. | 311,000 | | 728,146 |
Sumitomo Mitsui Financial Group, Inc. | 13,100 | | 633,200 |
| | 6,937,088 |
Consumer Finance - 4.1% |
ACOM Co. Ltd. (a) | 1,499,700 | | 5,872,333 |
AEON Financial Service Co. Ltd. | 691,200 | | 21,226,929 |
| | 27,099,262 |
Diversified Financial Services - 7.0% |
ORIX Corp. | 2,671,700 | | 46,276,747 |
Real Estate Management & Development - 13.9% |
AEON Mall Co. Ltd. | 146,300 | | 4,155,062 |
Airport Facilities Co. Ltd. | 190,300 | | 1,664,609 |
Iida Home Max Co., Ltd. (d) | 214,700 | | 4,925,894 |
Leopalace21 Corp. (a) | 2,971,900 | | 20,632,441 |
Nomura Real Estate Holdings, Inc. | 361,300 | | 9,141,407 |
NTT Urban Development Co. | 400,100 | | 5,107,416 |
Tokyo Tatemono Co. Ltd. | 3,875,000 | | 36,378,526 |
Tokyu Fudosan Holdings Corp. (a) | 985,000 | | 9,727,987 |
| | 91,733,342 |
TOTAL FINANCIALS | | 178,417,061 |
HEALTH CARE - 7.1% |
Biotechnology - 1.6% |
Sosei Group Corp. (a) | 250,900 | | 10,803,796 |
Health Care Equipment & Supplies - 1.7% |
Nikkiso Co. Ltd. | 894,000 | | 11,060,082 |
Common Stocks - continued |
| Shares | | Value |
HEALTH CARE - continued |
Health Care Providers & Services - 0.9% |
N Field Co. Ltd. | 33,900 | | $ 3,766,803 |
Uchiyama Holdings Co. Ltd. | 73,500 | | 2,208,287 |
| | 5,975,090 |
Pharmaceuticals - 2.9% |
Nippon Shinyaku Co. Ltd. | 558,000 | | 9,618,587 |
Ono Pharmaceutical Co. Ltd. | 76,500 | | 5,784,177 |
Rohto Pharmaceutical Co. Ltd. | 270,000 | | 3,918,323 |
| | 19,321,087 |
TOTAL HEALTH CARE | | 47,160,055 |
INDUSTRIALS - 10.1% |
Building Products - 1.6% |
Nichias Corp. | 1,015,000 | | 6,866,973 |
Shinko Kogyo Co. Ltd. | 475,700 | | 3,918,838 |
| | 10,785,811 |
Construction & Engineering - 0.6% |
Nippon Koei Co. Ltd. | 150,000 | | 705,651 |
Toshiba Plant Systems & Services Corp. | 35,000 | | 617,553 |
Toyo Engineering Corp. | 536,000 | | 2,283,878 |
| | 3,607,082 |
Machinery - 5.1% |
Amada Co. Ltd. | 795,000 | | 6,839,046 |
Daiwa Industries Ltd. | 93,000 | | 585,215 |
Hoshizaki Electric Co. Ltd. | 298,800 | | 10,949,511 |
Juki Corp. (a)(d) | 2,285,000 | | 4,314,911 |
Nitta Corp. | 307,900 | | 6,485,170 |
Sumitomo Heavy Industries Ltd. | 751,000 | | 3,323,880 |
Takeuchi Manufacturing Co. Ltd. | 62,100 | | 1,309,888 |
| | 33,807,621 |
Marine - 1.7% |
Iino Kaiun Kaisha Ltd. | 967,200 | | 6,369,692 |
Nippon Yusen KK | 1,538,000 | | 4,699,354 |
| | 11,069,046 |
Professional Services - 1.1% |
Career Design Center Co. Ltd. | 1,485 | | 1,758,926 |
Creek & River Co. Ltd. | 201,700 | | 868,192 |
en-japan, Inc. | 206,400 | | 4,610,052 |
| | 7,237,170 |
TOTAL INDUSTRIALS | | 66,506,730 |
|
| Shares | | Value |
INFORMATION TECHNOLOGY - 9.9% |
Electronic Equipment & Components - 3.7% |
Hitachi Ltd. | 1,534,000 | | $ 10,730,496 |
ITC Networks Corp. | 59,800 | | 514,415 |
Shinko Shoji Co. Ltd. | 59,500 | | 509,220 |
Topcon Corp. | 830,100 | | 12,516,870 |
| | 24,271,001 |
Internet Software & Services - 5.6% |
Enigmo, Inc. (a) | 105,900 | | 7,537,691 |
Kakaku.com, Inc. | 1,521,400 | | 29,425,908 |
| | 36,963,599 |
IT Services - 0.1% |
CAC Corp. | 89,900 | | 799,068 |
Semiconductors & Semiconductor Equipment - 0.1% |
Shinkawa Ltd. | 111,600 | | 722,947 |
Software - 0.4% |
Justsystems Corp. (a) | 152,400 | | 1,468,545 |
Sourcenext Corp. (a)(d) | 177,200 | | 1,467,874 |
| | 2,936,419 |
TOTAL INFORMATION TECHNOLOGY | | 65,693,034 |
MATERIALS - 2.7% |
Chemicals - 1.5% |
ISE Chemical Corp. | 114,000 | | 985,309 |
Nihon Nohyaku Co. Ltd. | 298,000 | | 3,571,882 |
Sakata INX Corp. | 561,000 | | 5,324,554 |
| | 9,881,745 |
Metals & Mining - 1.2% |
JFE Holdings, Inc. | 97,000 | | 2,205,265 |
Mitsubishi Materials Corp. | 1,445,000 | | 5,653,441 |
| | 7,858,706 |
TOTAL MATERIALS | | 17,740,451 |
TELECOMMUNICATION SERVICES - 0.3% |
Wireless Telecommunication Services - 0.3% |
WirelessGate, Inc. (a) | 53,500 | | 1,638,335 |
UTILITIES - 8.4% |
Electric Utilities - 8.4% |
Chugoku Electric Power Co., Inc. | 332,000 | | 5,089,117 |
Hokkaido Electric Power Co., Inc. (a) | 1,298,000 | | 16,720,996 |
Kansai Electric Power Co., Inc. (a) | 617,900 | | 7,820,773 |
Kyushu Electric Power Co., Inc. (a) | 606,400 | | 8,538,008 |
Tohoku Electric Power Co., Inc. (a) | 1,424,600 | | 17,243,637 |
| | 55,412,531 |
TOTAL COMMON STOCKS (Cost $526,124,019) |
656,784,653
|
Money Market Funds - 3.0% |
| Shares | | Value |
Fidelity Cash Central Fund, 0.09% (b) | 6,949,393 | | $ 6,949,393 |
Fidelity Securities Lending Cash Central Fund, 0.09% (b)(c) | 13,167,475 | | 13,167,475 |
TOTAL MONEY MARKET FUNDS (Cost $20,116,868) |
20,116,868
|
TOTAL INVESTMENT PORTFOLIO - 102.3% (Cost $546,240,887) | | 676,901,521 |
NET OTHER ASSETS (LIABILITIES) - (2.3)% | | (15,456,334) |
NET ASSETS - 100% | $ 661,445,187 |
Legend |
(a) Non-income producing |
(b) Affiliated fund that is generally available only to investment companies and other accounts managed by Fidelity Investments. The rate quoted is the annualized seven-day yield of the fund at period end. A complete unaudited listing of the fund's holdings as of its most recent quarter end is available upon request. In addition, each Fidelity Central Fund's financial statements, which are not covered by the Fund's Report of Independent Registered Public Accounting Firm, are available on the SEC's website or upon request. |
(c) Investment made with cash collateral received from securities on loan. |
(d) Security or a portion of the security is on loan at period end. |
Affiliated Central Funds |
Information regarding fiscal year to date income earned by the Fund from investments in Fidelity Central Funds is as follows: |
Fund | Income earned |
Fidelity Cash Central Fund | $ 6,282 |
Fidelity Securities Lending Cash Central Fund | 117,447 |
Total | $ 123,729 |
Other Information |
The following is a summary of the inputs used, as of October 31, 2013, involving the Fund's assets and liabilities carried at fair value. The inputs or methodology used for valuing securities may not be an indication of the risk associated with investing in those securities. For more information on valuation inputs, and their aggregation into the levels used in the tables below, please refer to the Investment Valuation section in the accompanying Notes to Financial Statements. |
Valuation Inputs at Reporting Date: |
Description | Total | Level 1 | Level 2 | Level 3 |
Investments in Securities: | | | | |
Equities: | | | | |
Consumer Discretionary | $ 181,490,866 | $ - | $ 170,706,853 | $ 10,784,013 |
Consumer Staples | 41,165,898 | - | 41,165,898 | - |
Energy | 1,559,692 | - | 1,559,692 | - |
Financials | 178,417,061 | - | 173,491,167 | 4,925,894 |
Health Care | 47,160,055 | - | 47,160,055 | - |
Industrials | 66,506,730 | - | 66,506,730 | - |
Information Technology | 65,693,034 | - | 65,693,034 | - |
Materials | 17,740,451 | - | 17,740,451 | - |
Telecommunication Services | 1,638,335 | - | 1,638,335 | - |
Utilities | 55,412,531 | - | 55,412,531 | - |
Money Market Funds | 20,116,868 | 20,116,868 | - | - |
Total Investments in Securities: | $ 676,901,521 | $ 20,116,868 | $ 641,074,746 | $ 15,709,907 |
The following is a summary of transfers between Level 1 and Level 2 for the period ended October 31, 2013. Transfers are assumed to have occurred at the beginning of the period, and are primarily attributable to the valuation techniques used for foreign equity securities, as discussed in the accompanying Notes to Financial Statements: |
Transfers | Total |
Level 1 to Level 2 | $ 124,971,568 |
Level 2 to Level 1 | $ 0 |
Valuation Inputs at Reporting Date: |
The following is a reconciliation of Investments in Securities for which Level 3 inputs were used in determining value: |
Investments in Securities: | |
Equities - Consumer Discretionary | |
Beginning Balance | $ - |
Net Realized Gain (Loss) on Investment Securities | 207,361 |
Net Unrealized Gain (Loss) on Investment Securities | 3,655,800 |
Cost of Purchases | 5,453,606 |
Proceeds of Sales | (387,628) |
Amortization/Accretion | - |
Transfers into Level 3 | 1,854,874 |
Transfers out of Level 3 | - |
Ending Balance | $ 10,784,013 |
The change in unrealized gain (loss) for the period attributable to Level 3 securities held at October 31, 2013 | $ 3,655,800 |
Other Investments in Securities | |
Beginning Balance | $ - |
Net Realized Gain (Loss) on Investment Securities | 112,678 |
Net Unrealized Gain (Loss) on Investment Securities | 2,450,801 |
Cost of Purchases | 1,370,926 |
Proceeds of Sales | (246,662) |
Amortization/Accretion | - |
Transfers into Level 3 | 1,238,151 |
Transfers out of Level 3 | - |
Ending Balance | $ 4,925,894 |
The change in unrealized gain (loss) for the period attributable to Level 3 securities held at October 31, 2013 | $ 2,450,801 |
The information used in the above reconciliations represents fiscal year to date activity for any Investments in Securities identified as using Level 3 inputs at either the beginning or the end of the current fiscal period. Transfers in or out of Level 3 represent the beginning value of any Security or Instrument where a change in the pricing level occurred from the beginning to the end of the period. The cost of purchases and the proceeds of sales may include securities received or delivered through corporate actions or exchanges. Realized and unrealized gains (losses) disclosed in the reconciliations are included in Net Gain (Loss) on the Fund's Statement of Operations. |
See accompanying notes which are an integral part of the financial statements.
Annual Report
Fidelity Japan Smaller Companies Fund
Statement of Assets and Liabilities
| October 31, 2013 |
| | |
Assets | | |
Investment in securities, at value (including securities loaned of $12,300,148) - See accompanying schedule: Unaffiliated issuers (cost $526,124,019) | $ 656,784,653 | |
Fidelity Central Funds (cost $20,116,868) | 20,116,868 | |
Total Investments (cost $546,240,887) | | $ 676,901,521 |
Receivable for investments sold | | 3,713,502 |
Receivable for fund shares sold | | 1,397,994 |
Dividends receivable | | 2,106,883 |
Distributions receivable from Fidelity Central Funds | | 30,111 |
Prepaid expenses | | 2,359 |
Other receivables | | 49,275 |
Total assets | | 684,201,645 |
| | |
Liabilities | | |
Payable for investments purchased | $ 7,800,615 | |
Payable for fund shares redeemed | 1,193,936 | |
Accrued management fee | 380,412 | |
Other affiliated payables | 124,033 | |
Other payables and accrued expenses | 89,987 | |
Collateral on securities loaned, at value | 13,167,475 | |
Total liabilities | | 22,756,458 |
| | |
Net Assets | | $ 661,445,187 |
Net Assets consist of: | | |
Paid in capital | | $ 582,110,050 |
Undistributed net investment income | | 744,564 |
Accumulated undistributed net realized gain (loss) on investments and foreign currency transactions | | (52,059,713) |
Net unrealized appreciation (depreciation) on investments and assets and liabilities in foreign currencies | | 130,650,286 |
Net Assets, for 47,721,766 shares outstanding | | $ 661,445,187 |
Net Asset Value, offering price and redemption price per share ($661,445,187 ÷ 47,721,766 shares) | | $ 13.86 |
Statement of Operations
| Year ended October 31, 2013 |
| | |
Investment Income | | |
Dividends | | $ 5,204,752 |
Income from Fidelity Central Funds | | 123,729 |
Income before foreign taxes withheld | | 5,328,481 |
Less foreign taxes withheld | | (371,284) |
Total income | | 4,957,197 |
| | |
Expenses | | |
Management fee | $ 2,993,296 | |
Transfer agent fees | 868,459 | |
Accounting and security lending fees | 218,368 | |
Custodian fees and expenses | 133,912 | |
Independent trustees' compensation | 2,240 | |
Registration fees | 60,830 | |
Audit | 58,902 | |
Legal | 760 | |
Interest | 164 | |
Miscellaneous | 2,358 | |
Total expenses before reductions | 4,339,289 | |
Expense reductions | (143,992) | 4,195,297 |
Net investment income (loss) | | 761,900 |
Realized and Unrealized Gain (Loss) Net realized gain (loss) on: | | |
Investment securities: | | |
Unaffiliated issuers | 34,280,607 | |
Foreign currency transactions | (616,971) | |
Total net realized gain (loss) | | 33,663,636 |
Change in net unrealized appreciation (depreciation) on: Investment securities | 115,467,813 | |
Assets and liabilities in foreign currencies | 21,110 | |
Total change in net unrealized appreciation (depreciation) | | 115,488,923 |
Net gain (loss) | | 149,152,559 |
Net increase (decrease) in net assets resulting from operations | | $ 149,914,459 |
See accompanying notes which are an integral part of the financial statements.
Annual Report
Fidelity Japan Smaller Companies Fund
Financial Statements - continued
Statement of Changes in Net Assets
| Year ended
October 31,
2013 | Year ended
October 31,
2012 |
Increase (Decrease) in Net Assets | | |
Operations | | |
Net investment income (loss) | $ 761,900 | $ 1,859,512 |
Net realized gain (loss) | 33,663,636 | 5,891,891 |
Change in net unrealized appreciation (depreciation) | 115,488,923 | 11,404,226 |
Net increase (decrease) in net assets resulting from operations | 149,914,459 | 19,155,629 |
Distributions to shareholders from net investment income | (1,868,698) | (2,759,893) |
Distributions to shareholders from net realized gain | (3,762,650) | (1,096,879) |
Total distributions | (5,631,348) | (3,856,772) |
Share transactions
Proceeds from sales of shares | 483,923,628 | 24,562,052 |
Reinvestment of distributions | 5,425,956 | 3,393,514 |
Cost of shares redeemed | (211,148,028) | (109,014,492) |
Net increase (decrease) in net assets resulting from share transactions | 278,201,556 | (81,058,926) |
Redemption fees | 1,067,201 | 34,784 |
Total increase (decrease) in net assets | 423,551,868 | (65,725,285) |
| | |
Net Assets | | |
Beginning of period | 237,893,319 | 303,618,604 |
End of period (including undistributed net investment income of $744,564 and undistributed net investment income of $1,851,362, respectively) | $ 661,445,187 | $ 237,893,319 |
Other Information Shares | | |
Sold | 38,404,402 | 2,831,264 |
Issued in reinvestment of distributions | 611,720 | 392,314 |
Redeemed | (17,382,624) | (12,377,356) |
Net increase (decrease) | 21,633,498 | (9,153,778) |
Financial Highlights
Years ended October 31, | 2013 | 2012 | 2011 | 2010 | 2009 |
Selected Per-Share Data | | | | | |
Net asset value, beginning of period | $ 9.12 | $ 8.62 | $ 8.23 | $ 8.59 | $ 6.99 |
Income from Investment Operations | | | | | |
Net investment income (loss) B | .02 | .06 | .08 | .04 | .02 |
Net realized and unrealized gain (loss) | 4.91 | .55 | .45 | (.25) | 1.63 |
Total from investment operations | 4.93 | .61 | .53 | (.21) | 1.65 |
Distributions from net investment income | (.07) | (.08) | (.05) | (.03) | (.04) |
Distributions from net realized gain | (.15) | (.03) | (.10) | (.12) | (.01) |
Total distributions | (.22) | (.11) | (.14) G | (.15) | (.05) |
Redemption fees added to paid in capital B | .03 | - F | - F | - F | - F |
Net asset value, end of period | $ 13.86 | $ 9.12 | $ 8.62 | $ 8.23 | $ 8.59 |
Total Return A | 55.79% | 7.13% | 6.44% | (2.50)% | 23.84% |
Ratios to Average Net Assets C,E | | | | | |
Expenses before reductions | 1.01% | 1.05% | 1.05% | 1.09% | 1.16% |
Expenses net of fee waivers, if any | 1.01% | 1.05% | 1.05% | 1.09% | 1.16% |
Expenses net of all reductions | .98% | 1.02% | 1.01% | 1.09% | 1.14% |
Net investment income (loss) | .18% | .67% | .88% | .43% | .33% |
Supplemental Data | | | | | |
Net assets, end of period (000 omitted) | $ 661,445 | $ 237,893 | $ 303,619 | $ 285,603 | $ 395,714 |
Portfolio turnover rate D | 91% | 86% | 133% | 78% | 183% |
ATotal returns would have been lower if certain expenses had not been reduced during the applicable periods shown. BCalculated based on average shares outstanding during the period. CFees and expenses of any underlying Fidelity Central Funds are not included in the Fund's expense ratio. The Fund indirectly bears its proportionate share of the expenses of any underlying Fidelity Central Funds. DAmount does not include the portfolio activity of any underlying Fidelity Central Funds. EExpense ratios reflect operating expenses of the Fund. Expenses before reductions do not reflect amounts reimbursed by the investment adviser or reductions from brokerage service arrangements or reductions from other expense offset arrangements and do not represent the amount paid by the Fund during periods when reimbursements or reductions occur. Expenses net of fee waivers reflect expenses after reimbursement by the investment adviser but prior to reductions from brokerage service arrangements or other expense offset arrangements. Expenses net of all reductions represent the net expenses paid by the Fund. FAmount represents less than $.01 per share. GTotal distributions of $.14 per share is comprised of distributions from net investment income of $.045 and distributions from net realized gain of $.095 per share. |
See accompanying notes which are an integral part of the financial statements.
Annual Report
Notes to Financial Statements
For the period ended October 31, 2013
1. Organization.
Fidelity Japan Smaller Companies Fund (the Fund) is a fund of Fidelity Investment Trust (the Trust) and is authorized to issue an unlimited number of shares. The Trust is registered under the Investment Company Act of 1940, as amended (the 1940 Act), as an open-end management investment company organized as a Massachusetts business trust.
2. Investments in Fidelity Central Funds.
The Fund invests in Fidelity Central Funds, which are open-end investment companies generally available only to other investment companies and accounts managed by Fidelity Management & Research Company (FMR) and its affiliates. The Fund's Schedule of Investments lists each of the Fidelity Central Funds held as of period end, if any, as an investment of the Fund, but does not include the underlying holdings of each Fidelity Central Fund. As an Investing Fund, the Fund indirectly bears its proportionate share of the expenses of the underlying Fidelity Central Funds.
The Money Market Central Funds seek preservation of capital and current income and are managed by Fidelity Investments Money Management, Inc. (FIMM), an affiliate of FMR.
A complete unaudited list of holdings for each Fidelity Central Fund is available upon request or at the Securities and Exchange Commission (the SEC) website at www.sec.gov. In addition, the financial statements of the Fidelity Central Funds, which are not covered by the Fund's Report of Independent Registered Public Accounting Firm, are available on the SEC website or upon request.
3. Significant Accounting Policies.
The financial statements have been prepared in conformity with accounting principles generally accepted in the United States of America (GAAP), which require management to make certain estimates and assumptions at the date of the financial statements. Actual results could differ from those estimates. Subsequent events, if any, through the date that the financial statements were issued have been evaluated in the preparation of the financial statements. The following summarizes the significant accounting policies of the Fund:
Investment Valuation. Investments are valued as of 4:00 p.m. Eastern time on the last calendar day of the period. In accordance with valuation policies and procedures approved by the Board of Trustees (the Board), the Fund attempts to obtain prices from one or more third party pricing vendors or brokers to value its investments. When current market prices, quotations or currency exchange rates are not readily available or reliable, investments will be fair valued in good faith by the FMR Fair Value Committee (the Committee), in accordance with procedures adopted by the Board. Factors used in determining fair value vary by investment type and may include market or investment specific events. The frequency with which these procedures are used cannot be predicted and they may be utilized to a significant extent. The Committee oversees the Fund's valuation policies and procedures and is responsible for approving and reporting to the Board all fair value determinations.
The Fund categorizes the inputs to valuation techniques used to value its investments into a disclosure hierarchy consisting of three levels as shown below:
Level 1 - quoted prices in active markets for identical investments
Level 2 - other significant observable inputs (including quoted prices for similar investments, interest rates, prepayment speeds, etc.)
Level 3 - unobservable inputs (including the Fund's own assumptions based on the best information available)
Valuation techniques used to value the Fund's investments by major category are as follows:
Equity securities, including restricted securities, for which market quotations are readily available, are valued at the last reported sale price or official closing price as reported by a third party pricing vendor on the primary market or exchange on which they are traded and are categorized as Level 1 in the hierarchy. In the event there were no sales during the day or closing prices are not available, securities are valued at the last quoted bid price or may be valued using the last available price and are generally categorized as Level 2 in the hierarchy. For foreign equity securities, when market or security specific events arise, comparisons to the valuation of American Depositary Receipts (ADRs), futures contracts, Exchange-Traded Funds (ETFs) and certain indexes as well as quoted prices for similar securities may be used and would be categorized as Level 2 in the hierarchy. Utilizing these techniques may result in transfers between Level 1 and Level 2. For equity securities, including restricted securities, where observable inputs are limited, assumptions about market activity and risk are used and these securities may be categorized as Level 3 in the hierarchy.
Investments in open-end mutual funds, including the Fidelity Central Funds, are valued at their closing net asset value (NAV) each business day and are categorized as Level 1 in the hierarchy.
Changes in valuation techniques may result in transfers in or out of an assigned level within the disclosure hierarchy. The aggregate value of investments by input level, as of October 31, 2013, including information on transfers between Levels 1 and 2, as well as a roll forward of Level 3 investments, is included at the end of the Fund's Schedule of Investments.
Annual Report
Notes to Financial Statements - continued
3. Significant Accounting Policies - continued
Foreign Currency. The Fund may use foreign currency contracts to facilitate transactions in foreign-denominated securities. Gains and losses from these transactions may arise from changes in the value of the foreign currency or if the counterparties do not perform under the contracts' terms.
Foreign-denominated assets, including investment securities, and liabilities are translated into U.S. dollars at the exchange rates at period end. Purchases and sales of investment securities, income and dividends received and expenses denominated in foreign currencies are translated into U.S. dollars at the exchange rate in effect on the transaction date.
The effects of exchange rate fluctuations on investments are included with the net realized and unrealized gain (loss) on investment securities. Other foreign currency transactions resulting in realized and unrealized gain (loss) are disclosed separately.
Investment Transactions and Income. For financial reporting purposes, the Fund's investment holdings and NAV include trades executed through the end of the last business day of the period. The NAV per share for processing shareholder transactions is calculated as of the close of business of the New York Stock Exchange (NYSE), normally 4:00 p.m. Eastern time and includes trades executed through the end of the prior business day. Gains and losses on securities sold are determined on the basis of identified cost. Dividend income is recorded on the ex-dividend date, except for certain dividends from foreign securities where the ex-dividend date may have passed, which are recorded as soon as the Fund is informed of the ex-dividend date. Non-cash dividends included in dividend income, if any, are recorded at the fair market value of the securities received. Interest income and distributions from the Fidelity Central Funds are accrued as earned. Investment income is recorded net of foreign taxes withheld where recovery of such taxes is uncertain.
Expenses. Expenses directly attributable to a fund are charged to that fund. Expenses attributable to more than one fund are allocated among the respective funds on the basis of relative net assets or other appropriate methods. Expense estimates are accrued in the period to which they relate and adjustments are made when actual amounts are known.
Income Tax Information and Distributions to Shareholders. Each year, the Fund intends to qualify as a regulated investment company under Subchapter M of the Internal Revenue Code, including distributing substantially all of its taxable income and realized gains. As a result, no provision for U.S. Federal income taxes is required. As of October 31, 2013, the Fund did not have any unrecognized tax benefits in the financial statements; nor is the Fund aware of any tax positions for which it is reasonably possible that the total amounts of unrecognized tax benefits will significantly change in the next twelve months. The Fund files a U.S. federal tax return, in addition to state and local tax returns as required. The Fund's federal income tax returns are subject to examination by the Internal Revenue Service (IRS) for a period of three fiscal years after they are filed. State and local tax returns may be subject to examination for an additional fiscal year depending on the jurisdiction. Foreign taxes are provided for based on the Fund's understanding of the tax rules and rates that exist in the foreign markets in which it invests.
Distributions are declared and recorded on the ex-dividend date. Income and capital gain distributions are determined in accordance with income tax regulations, which may differ from GAAP.
Capital accounts within the financial statements are adjusted for permanent book-tax differences. These adjustments have no impact on net assets or the results of operations. Temporary book-tax differences will reverse in a subsequent period.
Book-tax differences are primarily due to foreign currency transactions, passive foreign investment companies (PFIC), deferred trustees compensation, capital loss carryforwards and losses deferred due to wash sales.
The federal tax cost of investment securities and unrealized appreciation (depreciation) as of period end were as follows:
Gross unrealized appreciation | $ 119,893,395 |
Gross unrealized depreciation | (12,279,525) |
Net unrealized appreciation (depreciation) on securities and other investments | $ 107,613,870 |
| |
Tax Cost | $ 569,287,651 |
The tax-based components of distributable earnings as of period end were as follows:
Undistributed ordinary income | $ 15,317,543 |
Capital loss carryforward | $ (43,585,911) |
Net unrealized appreciation (depreciation) | $ 107,603,522 |
Annual Report
3. Significant Accounting Policies - continued
Income Tax Information and Distributions to Shareholders - continued
Capital loss carryforwards are only available to offset future capital gains of the Fund to the extent provided by regulations and may be limited. Under the Regulated Investment Company Modernization Act of 2010 (the Act), the Fund is permitted to carry forward capital losses incurred in taxable years beginning after December 22, 2010 for an unlimited period and such capital losses are required to be used prior to any losses that expire. The capital loss carryforward information presented below, including any applicable limitation, is estimated as of fiscal period end and is subject to adjustment.
Fiscal year of expiration | |
2017 | $ (43,585,911) |
The tax character of distributions paid was as follows:
| October 31, 2013 | October 31, 2012 |
Ordinary Income | $ 5,631,348 | $ 3,856,772 |
Short-Term Trading (Redemption) Fees. Shares held by investors in the Fund less than 90 days may have been subject to a redemption fee equal to 1.50% of the net asset value of shares redeemed. All redemption fees, which reduce the proceeds of the shareholder redemption, are retained by the Fund and accounted for as an addition to paid in capital.
4. Purchases and Sales of Investments.
Purchases and sales of securities, other than short-term securities, aggregated $646,869,392 and $383,439,173, respectively.
5. Fees and Other Transactions with Affiliates.
Management Fee. FMR and its affiliates provide the Fund with investment management related services for which the Fund pays a monthly management fee. The management fee is the sum of an individual fund fee rate that is based on an annual rate of .45% of the Fund's average net assets and an annualized group fee rate that averaged .25% during the period. The group fee rate is based upon the average net assets of all the mutual funds advised by FMR, including any mutual funds previously advised by FMR that are currently advised by Fidelity SelectCo, LLC, an affiliate of FMR. The group fee rate decreases as assets under management increase and increases as assets under management decrease. For the reporting period, the total annual management fee rate was .70% of the Fund's average net assets.
Transfer Agent Fees. Fidelity Investments Institutional Operations Company, Inc. (FIIOC), an affiliate of FMR, is the Fund's transfer, dividend disbursing and shareholder servicing agent. FIIOC receives account fees and asset-based fees that vary according to account size and type of account. FIIOC pays for typesetting, printing and mailing of shareholder reports, except proxy statements. For the period, the transfer agent fees were equivalent to an annual rate of .20% of average net assets.
Accounting and Security Lending Fees. Fidelity Service Company, Inc. (FSC), an affiliate of FMR, maintains the Fund's accounting records. The accounting fee is based on the level of average net assets for each month. Under a separate contract, FSC administers the security lending program. The security lending fee is based on the number and duration of lending transactions.
Interfund Lending Program. Pursuant to an Exemptive Order issued by the SEC, the Fund, along with other registered investment companies having management contracts with FMR, may participate in an interfund lending program. This program provides an alternative credit facility allowing the funds to borrow from, or lend money to, other participating affiliated funds. At period end, there were no interfund loans outstanding. The Fund's activity in this program during the period for which loans were outstanding was as follows:
Borrower or Lender | Average Loan
Balance | Weighted Average Interest Rate | Interest
Expense |
Borrower | $ 2,420,833 | .41% | $ 164 |
6. Committed Line of Credit.
The Fund participates with other funds managed by FMR or an affiliate in a $4.25 billion credit facility (the "line of credit") to be utilized for temporary or emergency purposes to fund shareholder redemptions or for other short-term liquidity purposes. The Fund has agreed to pay commitment fees on its pro-rata portion of the line of credit, which amounted to $794 and is reflected in Miscellaneous expenses on the Statement of Operations. During the period, there were no borrowings on this line of credit.
Annual Report
Notes to Financial Statements - continued
7. Security Lending.
The Fund lends portfolio securities through a lending agent from time to time in order to earn additional income. For equity securities, a lending agent is used and may loan securities to certain qualified borrowers, including Fidelity Capital Markets (FCM), a broker-dealer affiliated with the Fund. On the settlement date of the loan, the Fund receives collateral (in the form of U.S. Treasury obligations, letters of credit and/or cash) against the loaned securities and maintains collateral in an amount not less than 100% of the market value of the loaned securities during the period of the loan. The market value of the loaned securities is determined at the close of business of the Fund and any additional required collateral is delivered to the Fund on the next business day. If the borrower defaults on its obligation to return the securities loaned because of insolvency or other reasons, the Fund may apply collateral received from the borrower against the obligation. The Fund may experience delays and costs in recovering the securities loaned. Any cash collateral received is invested in the Fidelity Securities Lending Cash Central Fund. The value of loaned securities and cash collateral at period end are disclosed on the Fund's Statement of Assets and Liabilities. Security lending income represents the income earned on investing cash collateral, less rebates paid to borrowers and any lending agent fees associated with the loan, plus any premium payments received for lending certain types of securities. Security lending income is presented in the Statement of Operations as a component of income from Fidelity Central Funds. Total security lending income during the period amounted to $117,447. During the period, there were no securities loaned to FCM.
8. Expense Reductions.
Commissions paid to certain brokers with whom FMR, or its affiliates, places trades on behalf of the Fund include an amount to the Fund in addition to trade execution, which may be rebated back to the Fund to offset certain expenses. This amount totaled $136,988 for the period.
In addition, FMR reimbursed the Fund's operating expenses during the period in the amount of $7,004.
9. Other.
The Fund's organizational documents provide former and current trustees and officers with a limited indemnification against liabilities arising in connection with the performance of their duties to the Fund. In the normal course of business, the Fund may also enter into contracts that provide general indemnifications. The Fund's maximum exposure under these arrangements is unknown as this would be dependent on future claims that may be made against the Fund. The risk of material loss from such claims is considered remote.
At the end of the period, Strategic Advisers International Fund was the owner of record of approximately 14% of the total outstanding shares of the Fund. Mutual funds managed by FMR or its affiliates were the owner of record, in the aggregate, of approximately 31% of the total outstanding shares of the Fund.
Annual Report
Fidelity Latin America Fund
Average annual total return reflects the change in the value of an investment, assuming reinvestment of the class' distributions from dividend income and capital gains (the profits earned upon the sale of securities that have grown in value, if any) and assuming a constant rate of performance each year. The $10,000 table and the fund's returns do not reflect the deduction of taxes that a shareholder would pay on fund distributions or the redemption of fund shares. During periods of reimbursement by Fidelity, a fund's total return will be greater than it would be had the reimbursement not occurred. How a fund did yesterday is no guarantee of how it will do tomorrow.
Average Annual Total Returns
Periods ended October 31, 2013 | Past 1
year | Past 5
years | Past 10
years |
Fidelity Latin America Fund | -8.63% | 11.07% | 15.17% |
$10,000 Over 10 Years
Let's say hypothetically that $10,000 was invested in Fidelity Latin America Fund, a class of the fund, on October 31, 2003. The chart shows how the value of your investment would have changed, and also shows how the MSCI EM (Emerging Markets) Latin America Index performed over the same period.
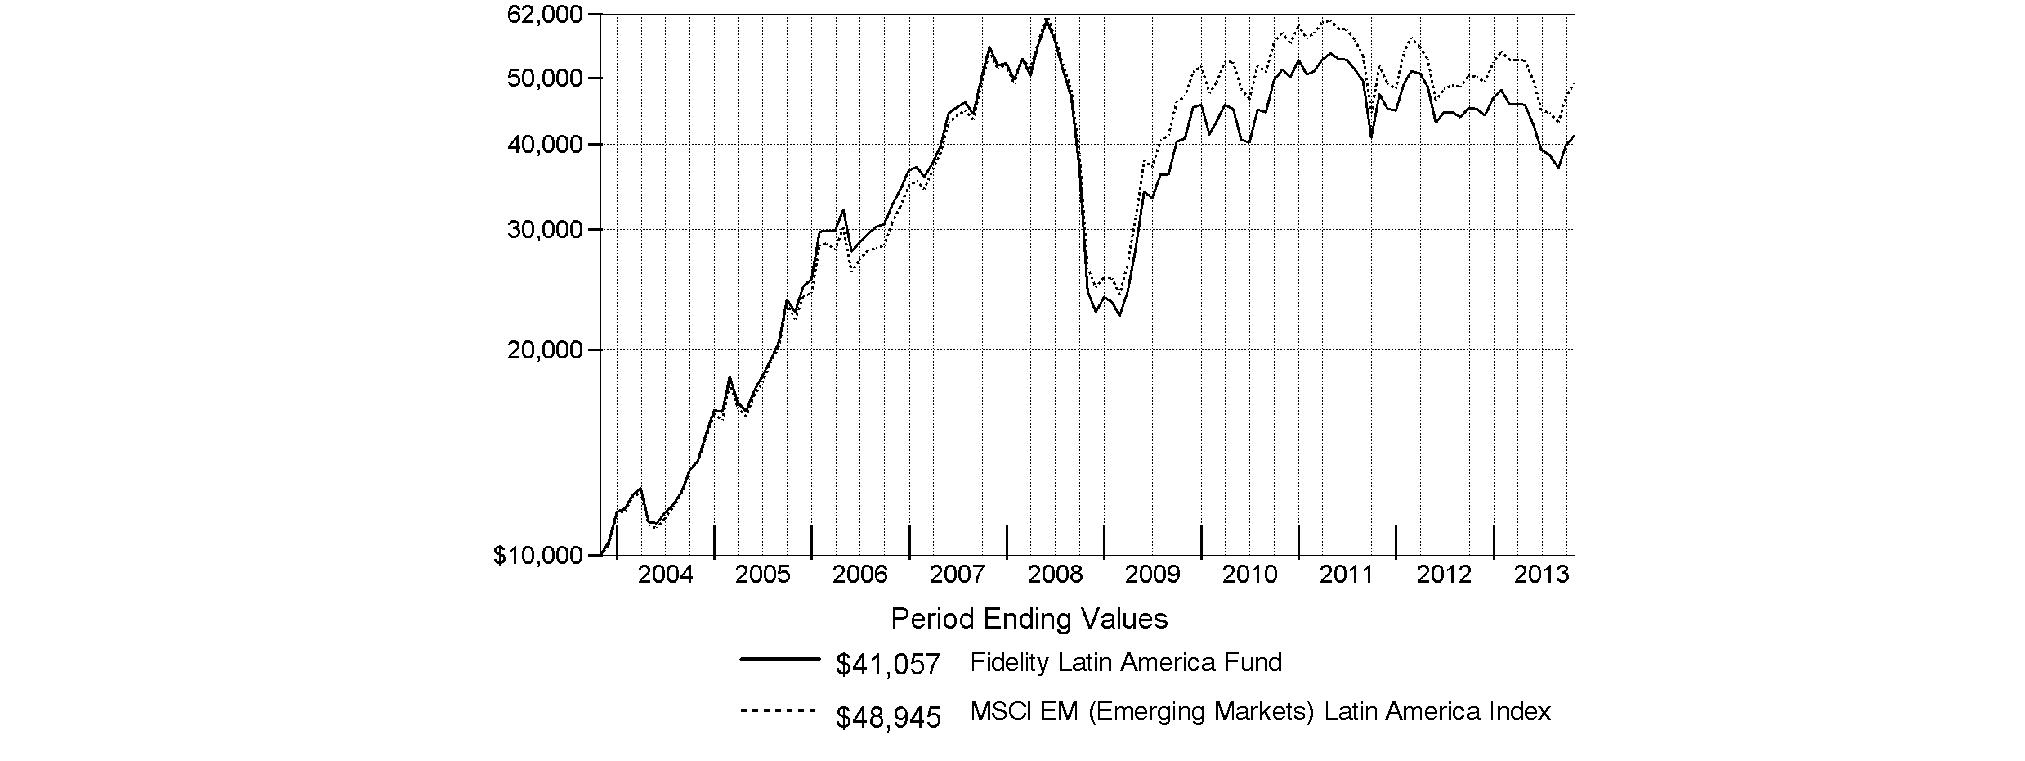
Annual Report
Fidelity Latin America Fund
Market Recap: On balance, global equity markets remained upbeat for the 12-month period ending October 31, 2013. The MSCI® ACWI® (All Country World Index) Index gained 23.75% for the period, amid investor preference for higher-risk assets. The period was not without turbulence, however. In the spring and summer, central banks worldwide, especially in the U.S. and China, made clear their intentions to maintain accommodative monetary policies. That stance, combined with modest cyclical improvements around the globe and generally low valuations, underpinned the broad rally in equities. Europe (+32%) shone brightly, with most markets in the region - large and small - registering solid, index-beating gains. Another bright spot was Japan, which, despite a struggling yen and taking a second-half breather, posted a 34% result for the full year. The U.S. - by far the index's biggest constituent - also outperformed the global market with a roughly 28% advance. Meanwhile, Asia-Pacific ex Japan (+14%) lagged, hurt in part by a slowdown in Australia's mining industry as well as currency headwinds. Foreign-exchange and commodity weakness also curbed results in resource-heavy Canada and emerging markets (EM), both of which were up 7%. Country-level EM performance diverged meaningfully for the period, as evidenced by performance in Brazil (-1%), Russia (+12%), India (+1%) and China (+8%).
Comments from Adam Kutas, Portfolio Manager of Fidelity® Latin America Fund: For the year, the fund's Retail Class shares returned -8.63%, underperforming the -2.43% return of the MSCI® EM (Emerging Markets) Latin America Index. Versus the index, poor security selection and an underweighting in relatively strong Brazil, the largest index component by far, hurt, as did unfavorable security selection in Mexico and Peru. At the sector level, we were held back by security selection in consumer discretionary - particularly the media industry - and materials, including an overweighting in Peruvian gold mining company Compania de Minas Buenaventura, significantly underweighting Mexican cable TV company Grupo Televisa and an overweighting in Brazilian consumer-loyalty awards program manager Multiplus. On the plus side, positioning in consumer staples helped, including the top two individual contributors during the period: an out-of-benchmark position in Mexican flour supplier Gruma and an overweighting in consumer products company Kimberly-Clark de Mexico, the latter of which was sold from the fund before period end.
Note to shareholders: Fidelity® Latin America Fund may invest up to 35% of its total assets in any industry that represents more than 20% of the Latin America market. As of October 31, 2013, the fund did not have more than 25% of its total assets in any one industry.
The views expressed above reflect those of the portfolio manager(s) only through the end of the period as stated on the cover of this report and do not necessarily represent the views of Fidelity or any other person in the Fidelity organization. Any such views are subject to change at any time based upon market or other conditions and Fidelity disclaims any responsibility to update such views. These views may not be relied on as investment advice and, because investment decisions for a Fidelity fund are based on numerous factors, may not be relied on as an indication of trading intent on behalf of any Fidelity fund.
Annual Report
Fidelity Latin America Fund
As a shareholder of the Fund, you incur two types of costs: (1) transaction costs, including sales charges (loads) on purchase payments or redemption proceeds, redemption fees and (2) ongoing costs, including management fees, distribution and/or service (12b-1) fees and other Fund expenses. This Example is intended to help you understand your ongoing costs (in dollars) of investing in the Fund and to compare these costs with the ongoing costs of investing in other mutual funds.
The Example is based on an investment of $1,000 invested at the beginning of the period and held for the entire period (May 1, 2013 to October 31, 2013).
Actual Expenses
The first line of the accompanying table for each class of the Fund provides information about actual account values and actual expenses. You may use the information in this line, together with the amount you invested, to estimate the expenses that you paid over the period. Simply divide your account value by $1,000.00 (for example, an $8,600 account value divided by $1,000.00 = 8.6), then multiply the result by the number in the first line for a class of the Fund under the heading entitled "Expenses Paid During Period" to estimate the expenses you paid on your account during this period. A small balance maintenance fee of $12.00 that is charged once a year may apply for certain accounts with a value of less than $2,000. This fee is not included in the table below. If it was, the estimate of expenses you paid during the period would be higher, and your ending account value lower, by this amount. In addition, the Fund, as a shareholder in the underlying Fidelity Central Funds, will indirectly bear its pro-rata share of the fees and expenses incurred by the underlying Fidelity Central Funds. These fees and expenses are not included in the Fund's annualized expense ratio used to calculate the expense estimate in the table below.
Hypothetical Example for Comparison Purposes
The second line of the accompanying table for each class of the Fund provides information about hypothetical account values and hypothetical expenses based on a Class' actual expense ratio and an assumed rate of return of 5% per year before expenses, which is not the Class' actual return. The hypothetical account values and expenses may not be used to estimate the actual ending account balance or expenses you paid for the period. You may use this information to compare the ongoing costs of investing in the Fund and other funds. To do so, compare this 5% hypothetical example with the 5% hypothetical examples that appear in the shareholder reports of the other funds. A small balance maintenance fee of $12.00 that is charged once a year may apply for certain accounts with a value of less than $2,000. This fee is not included in the table below. If it was, the estimate of expenses you paid during the period would be higher, and your ending account value lower, by this amount. In addition, the Fund, as a shareholder in the underlying Fidelity Central Funds, will indirectly bear its pro-rata share of the fees and expenses incurred by the underlying Fidelity Central Funds. These fees and expenses are not included in the Fund's annualized expense ratio used to calculate the expense estimate in the table below.
Please note that the expenses shown in the table are meant to highlight your ongoing costs only and do not reflect any transaction costs. Therefore, the second line of the table is useful in comparing ongoing costs only, and will not help you determine the relative total costs of owning different funds. In addition, if these transactional costs were included, your costs would have been higher.
| Annualized
Expense Ratio B | Beginning
Account Value
May 1, 2013 | Ending
Account Value
October 31, 2013 | Expenses Paid
During Period*
May 1, 2013
to October 31, 2013 |
Class A | 1.36% | | | |
Actual | | $ 1,000.00 | $ 898.10 | $ 6.51 |
HypotheticalA | | $ 1,000.00 | $ 1,018.35 | $ 6.92 |
Class T | 1.63% | | | |
Actual | | $ 1,000.00 | $ 897.00 | $ 7.79 |
HypotheticalA | | $ 1,000.00 | $ 1,016.99 | $ 8.29 |
Class B | 2.10% | | | |
Actual | | $ 1,000.00 | $ 894.70 | $ 10.03 |
HypotheticalA | | $ 1,000.00 | $ 1,014.62 | $ 10.66 |
Class C | 2.11% | | | |
Actual | | $ 1,000.00 | $ 894.60 | $ 10.08 |
HypotheticalA | | $ 1,000.00 | $ 1,014.57 | $ 10.71 |
Latin America | 1.05% | | | |
Actual | | $ 1,000.00 | $ 899.50 | $ 5.03 |
HypotheticalA | | $ 1,000.00 | $ 1,019.91 | $ 5.35 |
Institutional Class | 1.03% | | | |
Actual | | $ 1,000.00 | $ 899.40 | $ 4.93 |
HypotheticalA | | $ 1,000.00 | $ 1,020.01 | $ 5.24 |
A 5% return per year before expenses
B Annualized expense ratio reflects expenses net of applicable fee waivers.
* Expenses are equal to each Class' annualized expense ratio, multiplied by the average account value over the period, multiplied by 184/365 (to reflect the one-half year period).
Annual Report
Fidelity Latin America Fund
Investment Changes (Unaudited)
Geographic Diversification (% of fund's net assets) |
As of October 31, 2013 |
| Brazil | 50.1% | |
| Mexico | 19.3% | |
| Chile | 14.0% | |
| Colombia | 8.8% | |
| Peru | 3.3% | |
| United States of America* | 2.7% | |
| Spain | 0.9% | |
| France | 0.5% | |
| Panama | 0.2% | |
| Other | 0.2% | |

* Includes Short-Term Investments and Net Other Assets (Liabilities). |
Percentages are based on country or territory of incorporation and are adjusted for the effect of futures contracts, if applicable. |
As of April 30, 2013 |
| Brazil | 46.3% | |
| Mexico | 23.8% | |
| Chile | 15.0% | |
| Colombia | 8.1% | |
| United States of America* | 4.4% | |
| Peru | 2.4% | |

* Includes Short-Term Investments and Net Other Assets (Liabilities). |
Percentages are based on country or territory of incorporation and are adjusted for the effect of futures contracts, if applicable. |
Asset Allocation as of October 31, 2013 |
| % of fund's
net assets | % of fund's net assets
6 months ago |
Stocks | 99.3 | 96.9 |
Short-Term Investments and Net Other Assets (Liabilities) | 0.7 | 3.1 |
Top Ten Stocks as of October 31, 2013 |
| % of fund's
net assets | % of fund's net assets
6 months ago |
America Movil S.A.B. de CV Series L (Mexico, Wireless Telecommunication Services) | 7.7 | 8.4 |
Petroleo Brasileiro SA - Petrobras (PN) (non-vtg.) (Brazil, Oil, Gas & Consumable Fuels) | 6.4 | 6.4 |
Itau Unibanco Holding SA (Brazil, Commercial Banks) | 5.9 | 6.4 |
Companhia de Bebidas das Americas (AmBev) (PN) sponsored ADR (Brazil, Beverages) | 4.4 | 5.1 |
Petroleo Brasileiro SA - Petrobras (Brazil, Oil, Gas & Consumable Fuels) | 3.8 | 4.0 |
Wal-Mart de Mexico SA de CV Series V (Mexico, Food & Staples Retailing) | 3.3 | 4.4 |
Fomento Economico Mexicano S.A.B. de CV sponsored ADR (Mexico, Beverages) | 3.1 | 5.1 |
CCR SA (Brazil, Transportation Infrastructure) | 2.9 | 2.9 |
Vale SA (Brazil, Steel) | 2.8 | 2.6 |
Grupo de Inversiones Suramerica SA (Colombia, Diversified Financial Services) | 2.7 | 2.2 |
| 43.0 | |
Market Sectors as of October 31, 2013 |
| % of fund's
net assets | % of fund's net assets
6 months ago |
Consumer Staples | 24.5 | 26.7 |
Financials | 22.8 | 19.5 |
Telecommunication Services | 13.5 | 15.1 |
Energy | 12.6 | 13.2 |
Materials | 10.8 | 9.5 |
Industrials | 5.4 | 6.2 |
Consumer Discretionary | 5.1 | 2.5 |
Utilities | 3.6 | 4.1 |
Information Technology | 1.0 | 0.1 |
Annual Report
Fidelity Latin America Fund
Investments October 31, 2013
Showing Percentage of Net Assets
Common Stocks - 78.0% |
| Shares | | Value |
Brazil - 30.5% |
Banco Bradesco SA | 287,900 | | $ 4,614,985 |
Banco Bradesco SA (PN) sponsored ADR | 159,621 | | 2,301,735 |
BB Seguridade Participacoes SA | 893,200 | | 9,756,541 |
Brasil Foods SA | 286,500 | | 6,727,033 |
BTG Pactual Participations Ltd. unit | 1,403,600 | | 18,777,739 |
CCR SA | 4,830,700 | | 40,173,172 |
Cielo SA | 451,800 | | 13,714,133 |
Companhia Brasileira de Distribuicao Grupo Pao de Acucar sponsored ADR (d) | 337,370 | | 17,010,195 |
Companhia de Bebidas das Americas (AmBev): | | | |
(PN) sponsored ADR | 1,674,213 | | 62,280,724 |
sponsored ADR (d) | 341,625 | | 12,691,369 |
Companhia de Saneamento Basico do Estado de Sao Paulo (SABESP) | 960,500 | | 10,178,676 |
Cyrela Brazil Realty SA | 1,736,900 | | 12,986,820 |
Embraer SA sponsored ADR | 268,634 | | 7,895,153 |
Estacio Participacoes SA | 960,700 | | 7,419,030 |
Industrias Romi SA (a) | 490,000 | | 1,367,065 |
Itau Unibanco Holding SA sponsored ADR | 1,505,938 | | 23,206,505 |
M. Dias Branco SA | 240,900 | | 11,298,707 |
Multiplus SA | 1,954,300 | | 24,208,475 |
Obrascon Huarte Lain Brasil SA | 166,500 | | 1,479,042 |
Petroleo Brasileiro SA - Petrobras: | | | |
(ON) | 1,194,028 | | 10,414,832 |
(PN) sponsored ADR (non-vtg.) | 381,913 | | 6,935,540 |
sponsored ADR | 2,512,645 | | 43,795,402 |
Souza Cruz SA | 2,756,400 | | 29,813,218 |
Telefonica Brasil SA sponsored ADR (d) | 304,542 | | 6,754,742 |
TIM Participacoes SA | 2,087,495 | | 10,641,547 |
Tractebel Energia SA | 734,175 | | 12,486,415 |
Vale SA: | | | |
(PN-A) sponsored ADR | 851,775 | | 12,469,986 |
sponsored ADR (d) | 544,093 | | 8,710,929 |
TOTAL BRAZIL | | 430,109,710 |
Canada - 0.1% |
First Majestic Silver Corp. (a) | 124,800 | | 1,412,401 |
Chile - 12.7% |
Aguas Andinas SA | 14,673,069 | | 9,939,591 |
Banco de Chile | 65,951,092 | | 10,052,634 |
Banco de Chile sponsored ADR (d) | 114,754 | | 10,537,860 |
Banco Santander Chile sponsored ADR (d) | 1,000,709 | | 24,577,413 |
CAP SA | 795,964 | | 16,531,502 |
Compania Cervecerias Unidas SA | 2,143,530 | | 28,747,785 |
Empresa Nacional de Telecomunicaciones SA (ENTEL) | 1,759,033 | | 27,069,709 |
Inversiones La Construccion SA | 731,460 | | 10,980,826 |
LATAM Airlines Group SA | 239,915 | | 3,973,995 |
|
| Shares | | Value |
LATAM Airlines Group SA sponsored ADR (d) | 804,554 | | $ 13,315,369 |
S.A.C.I. Falabella | 1,837,918 | | 18,291,278 |
Sociedad Matriz SAAM SA | 48,419,693 | | 4,867,019 |
TOTAL CHILE | | 178,884,981 |
Colombia - 8.4% |
Bolsa de Valores de Colombia | 586,230,591 | | 7,465,926 |
Cemex Latam Holdings SA | 673,456 | | 5,153,187 |
Ecopetrol SA | 9,879,672 | | 23,493,796 |
Ecopetrol SA ADR (d) | 15,216 | | 720,630 |
Empresa de Telecomunicaciones de Bogota | 40,032,169 | | 8,208,031 |
Grupo Aval Acciones y Valores SA | 4,519,256 | | 3,176,265 |
Grupo de Inversiones Suramerica SA | 1,765,744 | | 34,991,065 |
Inversiones Argos SA | 2,984,600 | | 34,603,570 |
TOTAL COLOMBIA | | 117,812,470 |
France - 0.5% |
Carrefour SA | 192,221 | | 7,041,458 |
Luxembourg - 0.1% |
Tenaris SA sponsored ADR | 28,821 | | 1,349,111 |
Mexico - 19.3% |
America Movil S.A.B. de CV: | | | |
Series L | 5,073,400 | | 5,443,875 |
Series L sponsored ADR | 4,789,573 | | 102,544,757 |
Consorcio ARA S.A.B. de CV (a) | 23,993,705 | | 9,378,827 |
Controladora Commercial Mexicana S.A.B. de CV unit (d) | 1,738,815 | | 7,128,645 |
Fomento Economico Mexicano S.A.B. de CV sponsored ADR | 465,111 | | 43,394,856 |
Gruma S.A.B. de CV Series B (a) | 3,297,556 | | 22,599,970 |
Grupo Financiero Inbursa S.A.B. de CV Series O | 4,007,300 | | 10,322,892 |
Grupo Financiero Santander Mexico S.A.B. de CV | 4,260,900 | | 11,926,503 |
Grupo Televisa SA de CV (CPO) sponsored ADR | 25,200 | | 767,088 |
Industrias Penoles SA de CV | 288,178 | | 8,431,811 |
Infraestructura Energetica Nova S.A.B. de CV | 1,223,900 | | 4,829,092 |
Wal-Mart de Mexico SA de CV Series V | 17,693,248 | | 45,998,580 |
TOTAL MEXICO | | 272,766,896 |
Panama - 0.2% |
Banco Latinoamericano de Exporaciones SA (BLADEX) Series E | 81,600 | | 2,140,368 |
Peru - 3.3% |
Alicorp SA Class C | 3,176,608 | | 9,909,001 |
Compania de Minas Buenaventura SA sponsored ADR | 2,518,892 | | 36,523,934 |
TOTAL PERU | | 46,432,935 |
Common Stocks - continued |
| Shares | | Value |
Spain - 0.9% |
Banco Bilbao Vizcaya Argentaria SA | 602,964 | | $ 7,046,799 |
Distribuidora Internacional de Alimentacion SA | 681,435 | | 6,229,495 |
TOTAL SPAIN | | 13,276,294 |
United States of America - 2.0% |
BPZ Energy, Inc. (a)(d) | 3,060,350 | | 6,151,304 |
First Cash Financial Services, Inc. (a) | 315,945 | | 19,111,513 |
Gran Tierra Energy, Inc. (Canada) (a) | 463,100 | | 3,491,072 |
TOTAL UNITED STATES OF AMERICA | | 28,753,889 |
TOTAL COMMON STOCKS (Cost $766,614,382) |
1,099,980,513
|
Nonconvertible Preferred Stocks - 21.3% |
| | | |
Brazil - 19.6% |
AES Tiete SA (PN) (non-vtg.) | 703,145 | | 6,873,884 |
Banco Bradesco SA (PN) | 1,313,817 | | 18,931,351 |
Companhia Brasileira de Distribuicao Grupo Pao de Acucar (PN) | 329,225 | | 16,327,514 |
Companhia Energetica de Sao Paulo Series B | 724,800 | | 7,580,602 |
Forjas Taurus SA | 1,566,600 | | 1,510,515 |
Itau Unibanco Holding SA | 3,919,750 | | 60,540,733 |
Itausa-Investimentos Itau SA (PN) | 6,267,322 | | 26,997,437 |
Petroleo Brasileiro SA - Petrobras (PN) (non-vtg.) | 9,159,971 | | 83,536,384 |
Telefonica Brasil SA | 1,294,413 | | 28,526,547 |
Vale SA (PN-A) | 1,777,600 | | 26,058,559 |
TOTAL BRAZIL | | 276,883,526 |
Chile - 1.3% |
Embotelladora Andina SA: | | | |
Class A | 1,321,447 | | 5,597,931 |
Class B | 2,207,046 | | 12,447,353 |
TOTAL CHILE | | 18,045,284 |
|
| Shares | | Value |
Colombia - 0.4% |
Grupo Aval Acciones y Valores SA | 2,897,449 | | $ 2,013,445 |
Grupo de Inversiones Suramerica SA | 161,141 | | 3,201,784 |
TOTAL COLOMBIA | | 5,215,229 |
TOTAL NONCONVERTIBLE PREFERRED STOCKS (Cost $219,156,548) |
300,144,039
|
Money Market Funds - 4.1% |
| | | |
Fidelity Cash Central Fund, 0.09% (b) | 8,000,693 | | 8,000,693 |
Fidelity Securities Lending Cash Central Fund, 0.09% (b)(c) | 50,236,716 | | 50,236,716 |
TOTAL MONEY MARKET FUNDS (Cost $58,237,409) |
58,237,409
|
TOTAL INVESTMENT PORTFOLIO - 103.4% (Cost $1,044,008,339) | | 1,458,361,961 |
NET OTHER ASSETS (LIABILITIES) - (3.4)% | | (47,365,173) |
NET ASSETS - 100% | $ 1,410,996,788 |
Legend |
(a) Non-income producing |
(b) Affiliated fund that is generally available only to investment companies and other accounts managed by Fidelity Investments. The rate quoted is the annualized seven-day yield of the fund at period end. A complete unaudited listing of the fund's holdings as of its most recent quarter end is available upon request. In addition, each Fidelity Central Fund's financial statements, which are not covered by the Fund's Report of Independent Registered Public Accounting Firm, are available on the SEC's website or upon request. |
(c) Investment made with cash collateral received from securities on loan. |
(d) Security or a portion of the security is on loan at period end. |
Affiliated Central Funds |
Information regarding fiscal year to date income earned by the Fund from investments in Fidelity Central Funds is as follows: |
Fund | Income earned |
Fidelity Cash Central Fund | $ 22,896 |
Fidelity Securities Lending Cash Central Fund | 501,984 |
Total | $ 524,880 |
Other Information |
Categorizations in the Schedule of Investments are based on country or territory of incorporation. |
The following is a summary of the inputs used, as of October 31, 2013, involving the Fund's assets and liabilities carried at fair value. The inputs or methodology used for valuing securities may not be an indication of the risk associated with investing in those securities. For more information on valuation inputs, and their aggregation into the levels used in the table below, please refer to the Investment Valuation section in the accompanying Notes to Financial Statements. |
Valuation Inputs at Reporting Date: |
Description | Total | Level 1 | Level 2 | Level 3 |
Investments in Securities: | | | | |
Equities: | | | | |
Consumer Discretionary | $ 73,051,518 | $ 73,051,518 | $ - | $ - |
Consumer Staples | 345,243,834 | 345,243,834 | - | - |
Energy | 179,888,071 | 179,888,071 | - | - |
Financials | 322,672,319 | 315,625,520 | 7,046,799 | - |
Industrials | 74,581,330 | 74,581,330 | - | - |
Information Technology | 13,714,133 | 13,714,133 | - | - |
Materials | 149,895,879 | 149,895,879 | - | - |
Telecommunication Services | 189,189,208 | 189,189,208 | - | - |
Utilities | 51,888,260 | 51,888,260 | - | - |
Money Market Funds | 58,237,409 | 58,237,409 | - | - |
Total Investments in Securities: | $ 1,458,361,961 | $ 1,451,315,162 | $ 7,046,799 | $ - |
See accompanying notes which are an integral part of the financial statements.
Annual Report
Fidelity Latin America Fund
Statement of Assets and Liabilities
| October 31, 2013 |
| | |
Assets | | |
Investment in securities, at value (including securities loaned of $48,248,176) - See accompanying schedule: Unaffiliated issuers (cost $985,770,930) | $ 1,400,124,552 | |
Fidelity Central Funds (cost $58,237,409) | 58,237,409 | |
Total Investments (cost $1,044,008,339) | | $ 1,458,361,961 |
Foreign currency held at value (cost $2,216,036) | | 2,216,036 |
Receivable for investments sold | | 1,609 |
Receivable for fund shares sold | | 544,628 |
Dividends receivable | | 4,543,889 |
Distributions receivable from Fidelity Central Funds | | 32,242 |
Prepaid expenses | | 2,318 |
Other receivables | | 8,707 |
Total assets | | 1,465,711,390 |
| | |
Liabilities | | |
Payable for investments purchased | $ 633,430 | |
Payable for fund shares redeemed | 2,161,625 | |
Accrued management fee | 830,522 | |
Distribution and service plan fees payable | 32,172 | |
Other affiliated payables | 344,982 | |
Other payables and accrued expenses | 475,155 | |
Collateral on securities loaned, at value | 50,236,716 | |
Total liabilities | | 54,714,602 |
| | |
Net Assets | | $ 1,410,996,788 |
Net Assets consist of: | | |
Paid in capital | | $ 769,670,329 |
Undistributed net investment income | | 18,836,319 |
Accumulated undistributed net realized gain (loss) on investments and foreign currency transactions | | 208,543,792 |
Net unrealized appreciation (depreciation) on investments and assets and liabilities in foreign currencies | | 413,946,348 |
Net Assets | | $ 1,410,996,788 |
Statement of Assets and Liabilities - continued
| October 31, 2013 |
| | |
Calculation of Maximum Offering Price Class A:
Net Asset Value and redemption price per share ($48,463,916 ÷ 1,190,399 shares) | | $ 40.71 |
| | |
Maximum offering price per share (100/94.25 of $40.71) | | $ 43.19 |
Class T:
Net Asset Value and redemption price per share ($12,704,735 ÷ 312,328 shares) | | $ 40.68 |
| | |
Maximum offering price per share (100/96.50 of $40.68) | | $ 42.16 |
Class B:
Net Asset Value and offering price per share ($4,764,250 ÷ 117,263 shares)A | | $ 40.63 |
| | |
Class C:
Net Asset Value and offering price per share ($15,184,519 ÷ 374,059 shares)A | | $ 40.59 |
| | |
Latin America:
Net Asset Value, offering price and redemption price per share ($1,324,748,455 ÷ 32,472,812 shares) | | $ 40.80 |
| | |
Institutional Class:
Net Asset Value, offering price and redemption price per share ($5,130,913 ÷ 125,777 shares) | | $ 40.79 |
A Redemption price per share is equal to net asset value less any applicable contingent deferred sales charge.
See accompanying notes which are an integral part of the financial statements.
Annual Report
Fidelity Latin America Fund
Financial Statements - continued
Statement of Operations
| Year ended October 31, 2013 |
| | |
Investment Income | | |
Dividends | | $ 59,989,795 |
Interest | | 70 |
Income from Fidelity Central Funds | | 524,880 |
Income before foreign taxes withheld | | 60,514,745 |
Less foreign taxes withheld | | (4,239,642) |
Total income | | 56,275,103 |
| | |
Expenses | | |
Management fee | $ 13,229,127 | |
Transfer agent fees | 4,381,374 | |
Distribution and service plan fees | 503,129 | |
Accounting and security lending fees | 843,722 | |
Custodian fees and expenses | 928,497 | |
Independent trustees' compensation | 11,598 | |
Registration fees | 96,818 | |
Audit | 72,029 | |
Legal | 6,009 | |
Interest | 388 | |
Miscellaneous | 22,444 | |
Total expenses before reductions | 20,095,135 | |
Expense reductions | (342,239) | 19,752,896 |
Net investment income (loss) | | 36,522,207 |
Realized and Unrealized Gain (Loss) Net realized gain (loss) on: | | |
Investment securities: | | |
Unaffiliated issuers (net of foreign taxes of $101,531) | 271,486,024 | |
Foreign currency transactions | (1,062,388) | |
Total net realized gain (loss) | | 270,423,636 |
Change in net unrealized appreciation (depreciation) on: Investment securities (net of increase in deferred foreign taxes of $152,377) | (467,997,709) | |
Assets and liabilities in foreign currencies | (206,947) | |
Total change in net unrealized appreciation (depreciation) | | (468,204,656) |
Net gain (loss) | | (197,781,020) |
Net increase (decrease) in net assets resulting from operations | | $ (161,258,813) |
Statement of Changes in Net Assets
| Year ended
October 31,
2013 | Year ended
October 31,
2012 |
Increase (Decrease) in Net Assets | | |
Operations | | |
Net investment income (loss) | $ 36,522,207 | $ 58,892,289 |
Net realized gain (loss) | 270,423,636 | 295,024,672 |
Change in net unrealized appreciation (depreciation) | (468,204,656) | (507,764,945) |
Net increase (decrease) in net assets resulting from operations | (161,258,813) | (153,847,984) |
Distributions to shareholders from net investment income | (45,716,095) | (46,233,461) |
Distributions to shareholders from net realized gain | (164,648,488) | - |
Total distributions | (210,364,583) | (46,233,461) |
Share transactions - net increase (decrease) | (626,013,705) | (452,506,012) |
Redemption fees | 218,753 | 354,338 |
Total increase (decrease) in net assets | (997,418,348) | (652,233,119) |
| | |
Net Assets | | |
Beginning of period | 2,408,415,136 | 3,060,648,255 |
End of period (including undistributed net investment income of $18,836,319 and undistributed net investment income of $34,109,670, respectively) | $ 1,410,996,788 | $ 2,408,415,136 |
See accompanying notes which are an integral part of the financial statements.
Annual Report
Financial Highlights - Class A
Years ended October 31, | 2013 | 2012 | 2011 | 2010 H |
Selected Per-Share Data | | | | |
Net asset value, beginning of period | $ 48.95 | $ 52.38 | $ 57.48 | $ 55.47 |
Income from Investment Operations | | | | |
Net investment income (loss) E | .72 | .92 | 1.15 | .02 |
Net realized and unrealized gain (loss) | (4.73) | (3.66) | (5.87) | 2.79 |
Total from investment operations | (4.01) | (2.74) | (4.72) | 2.81 |
Distributions from net investment income | (.79) | (.70) | (.19) | (.80) |
Distributions from net realized gain | (3.45) | - | (.20) | - |
Total distributions | (4.24) | (.70) | (.39) | (.80) |
Redemption fees added to paid in capital E | .01 | .01 | .01 | - K |
Net asset value, end of period | $ 40.71 | $ 48.95 | $ 52.38 | $ 57.48 |
Total Return B,C,D | (8.93)% | (5.23)% | (8.26)% | 5.14% |
Ratios to Average Net Assets F,I | | | | |
Expenses before reductions | 1.37% | 1.35% | 1.34% | 1.37% A |
Expenses net of fee waivers, if any | 1.37% | 1.35% | 1.34% | 1.37% A |
Expenses net of all reductions | 1.35% | 1.35% | 1.34% | 1.34% A |
Net investment income (loss) | 1.66% | 1.80% | 2.05% | .39% A |
Supplemental Data | | | | |
Net assets, end of period (000 omitted) | $ 48,464 | $ 69,654 | $ 91,407 | $ 115,626 |
Portfolio turnover rate G | 23% | 23% | 11% | 56% J |
A Annualized B Total returns for periods of less than one year are not annualized. C Total returns would have been lower if certain expenses had not been reduced during the applicable periods shown. D Total returns do not include the effect of the sales charges. E Calculated based on average shares outstanding during the period. F Fees and expenses of any underlying Fidelity Central Funds are not included in the Fund's expense ratio. The Fund indirectly bears its proportionate share of the expenses of any underlying Fidelity Central Funds. G Amount does not include the portfolio activity of any underlying Fidelity Central Funds. H For the period September 28, 2010 (commencement of sale of shares) to October 31, 2010. I Expense ratios reflect operating expenses of the class. Expenses before reductions do not reflect amounts reimbursed by the investment adviser or reductions from brokerage service arrangements or reductions from other expense offset arrangements and do not represent the amount paid by the class during periods when reimbursements or reductions occur. Expense ratios before reductions for start-up periods may not be representative of longer-term operating periods. Expenses net of fee waivers reflect expenses after reimbursement by the investment adviser but prior to reductions from brokerage service arrangements or other expense offset arrangements. Expenses net of all reductions represent the net expenses paid by the class. J The portfolio turnover rate does not include the assets acquired in the merger. K Amount represents less than $.01 per share. |
Financial Highlights - Class T
Years ended October 31, | 2013 | 2012 | 2011 | 2010 H |
Selected Per-Share Data | | | | |
Net asset value, beginning of period | $ 48.88 | $ 52.27 | $ 57.47 | $ 55.47 |
Income from Investment Operations | | | | |
Net investment income (loss) E | .61 | .78 | .99 | .01 |
Net realized and unrealized gain (loss) | (4.74) | (3.65) | (5.85) | 2.79 |
Total from investment operations | (4.13) | (2.87) | (4.86) | 2.80 |
Distributions from net investment income | (.63) | (.53) | (.15) | (.80) |
Distributions from net realized gain | (3.45) | - | (.20) | - |
Total distributions | (4.08) | (.53) | (.35) | (.80) |
Redemption fees added to paid in capital E | .01 | .01 | .01 | - K |
Net asset value, end of period | $ 40.68 | $ 48.88 | $ 52.27 | $ 57.47 |
Total Return B,C,D | (9.17)% | (5.49)% | (8.50)% | 5.12% |
Ratios to Average Net Assets F,I | | | | |
Expenses before reductions | 1.63% | 1.61% | 1.61% | 1.63% A |
Expenses net of fee waivers, if any | 1.63% | 1.61% | 1.61% | 1.63% A |
Expenses net of all reductions | 1.61% | 1.61% | 1.61% | 1.60% A |
Net investment income (loss) | 1.40% | 1.54% | 1.78% | .13% A |
Supplemental Data | | | | |
Net assets, end of period (000 omitted) | $ 12,705 | $ 19,334 | $ 26,020 | $ 36,820 |
Portfolio turnover rate G | 23% | 23% | 11% | 56% J |
A Annualized B Total returns for periods of less than one year are not annualized. C Total returns would have been lower if certain expenses had not been reduced during the applicable periods shown. D Total returns do not include the effect of the sales charges. E Calculated based on average shares outstanding during the period. F Fees and expenses of any underlying Fidelity Central Funds are not included in the Fund's expense ratio. The Fund indirectly bears its proportionate share of the expenses of any underlying Fidelity Central Funds. G Amount does not include the portfolio activity of any underlying Fidelity Central Funds. H For the period September 28, 2010 (commencement of sale of shares) to October 31, 2010. I Expense ratios reflect operating expenses of the class. Expenses before reductions do not reflect amounts reimbursed by the investment adviser or reductions from brokerage service arrangements or reductions from other expense offset arrangements and do not represent the amount paid by the class during periods when reimbursements or reductions occur. Expense ratios before reductions for start-up periods may not be representative of longer-term operating periods. Expenses net of fee waivers reflect expenses after reimbursement by the investment adviser but prior to reductions from brokerage service arrangements or other expense offset arrangements. Expenses net of all reductions represent the net expenses paid by the class. J The portfolio turnover rate does not include the assets acquired in the merger. K Amount represents less than $.01 per share. |
See accompanying notes which are an integral part of the financial statements.
Annual Report
Financial Highlights - Class B
Years ended October 31, | 2013 | 2012 | 2011 | 2010 H |
Selected Per-Share Data | | | | |
Net asset value, beginning of period | $ 48.72 | $ 52.06 | $ 57.44 | $ 55.47 |
Income from Investment Operations | | | | |
Net investment income (loss) E | .40 | .53 | .72 | (.02) |
Net realized and unrealized gain (loss) | (4.74) | (3.63) | (5.84) | 2.79 |
Total from investment operations | (4.34) | (3.10) | (5.12) | 2.77 |
Distributions from net investment income | (.31) | (.25) | (.07) | (.80) |
Distributions from net realized gain | (3.45) | - | (.20) | - |
Total distributions | (3.76) | (.25) | (.27) | (.80) |
Redemption fees added to paid in capital E | .01 | .01 | .01 | - K |
Net asset value, end of period | $ 40.63 | $ 48.72 | $ 52.06 | $ 57.44 |
Total Return B,C,D | (9.60)% | (5.95)% | (8.94)% | 5.06% |
Ratios to Average Net Assets F,I | | | | |
Expenses before reductions | 2.12% | 2.10% | 2.10% | 2.12% A |
Expenses net of fee waivers, if any | 2.12% | 2.10% | 2.10% | 2.12% A |
Expenses net of all reductions | 2.10% | 2.10% | 2.10% | 2.10% A |
Net investment income (loss) | .91% | 1.05% | 1.29% | (.36)% A |
Supplemental Data | | | | |
Net assets, end of period (000 omitted) | $ 4,764 | $ 9,492 | $ 14,114 | $ 20,392 |
Portfolio turnover rate G | 23% | 23% | 11% | 56% J |
A Annualized B Total returns for periods of less than one year are not annualized. C Total returns would have been lower if certain expenses had not been reduced during the applicable periods shown. D Total returns do not include the effect of the contingent deferred sales charge. E Calculated based on average shares outstanding during the period. F Fees and expenses of any underlying Fidelity Central Funds are not included in the Fund's expense ratio. The Fund indirectly bears its proportionate share of the expenses of any underlying Fidelity Central Funds. G Amount does not include the portfolio activity of any underlying Fidelity Central Funds. H For the period September 28, 2010 (commencement of sale of shares) to October 31, 2010. I Expense ratios reflect operating expenses of the class. Expenses before reductions do not reflect amounts reimbursed by the investment adviser or reductions from brokerage service arrangements or reductions from other expense offset arrangements and do not represent the amount paid by the class during periods when reimbursements or reductions occur. Expense ratios before reductions for start-up periods may not be representative of longer-term operating periods. Expenses net of fee waivers reflect expenses after reimbursement by the investment adviser but prior to reductions from brokerage service arrangements or other expense offset arrangements. Expenses net of all reductions represent the net expenses paid by the class. J The portfolio turnover rate does not include the assets acquired in the merger. K Amount represents less than $.01 per share. |
Financial Highlights - Class C
Years ended October 31, | 2013 | 2012 | 2011 | 2010 H |
Selected Per-Share Data | | | | |
Net asset value, beginning of period | $ 48.73 | $ 52.05 | $ 57.44 | $ 55.47 |
Income from Investment Operations | | | | |
Net investment income (loss) E | .40 | .54 | .73 | (.02) |
Net realized and unrealized gain (loss) | (4.74) | (3.64) | (5.84) | 2.79 |
Total from investment operations | (4.34) | (3.10) | (5.11) | 2.77 |
Distributions from net investment income | (.36) | (.23) | (.09) | (.80) |
Distributions from net realized gain | (3.45) | - | (.20) | - |
Total distributions | (3.81) | (.23) | (.29) | (.80) |
Redemption fees added to paid in capital E | .01 | .01 | .01 | - K |
Net asset value, end of period | $ 40.59 | $ 48.73 | $ 52.05 | $ 57.44 |
Total Return B,C,D | (9.62)% | (5.94)% | (8.93)% | 5.06% |
Ratios to Average Net Assets F,I | | | | |
Expenses before reductions | 2.12% | 2.10% | 2.08% | 2.09% A |
Expenses net of fee waivers, if any | 2.12% | 2.10% | 2.08% | 2.09% A |
Expenses net of all reductions | 2.10% | 2.10% | 2.08% | 2.07% A |
Net investment income (loss) | .91% | 1.06% | 1.31% | (.34)% A |
Supplemental Data | | | | |
Net assets, end of period (000 omitted) | $ 15,185 | $ 27,405 | $ 35,203 | $ 48,329 |
Portfolio turnover rate G | 23% | 23% | 11% | 56% J |
A Annualized B Total returns for periods of less than one year are not annualized. C Total returns would have been lower if certain expenses had not been reduced during the applicable periods shown. D Total returns do not include the effect of the contingent deferred sales charge. E Calculated based on average shares outstanding during the period. F Fees and expenses of any underlying Fidelity Central Funds are not included in the Fund's expense ratio. The Fund indirectly bears its proportionate share of the expenses of any underlying Fidelity Central Funds. G Amount does not include the portfolio activity of any underlying Fidelity Central Funds. H For the period September 28, 2010 (commencement of sale of shares) to October 31, 2010. I Expense ratios reflect operating expenses of the class. Expenses before reductions do not reflect amounts reimbursed by the investment adviser or reductions from brokerage service arrangements or reductions from other expense offset arrangements and do not represent the amount paid by the class during periods when reimbursements or reductions occur. Expense ratios before reductions for start-up periods may not be representative of longer-term operating periods. Expenses net of fee waivers reflect expenses after reimbursement by the investment adviser but prior to reductions from brokerage service arrangements or other expense offset arrangements. Expenses net of all reductions represent the net expenses paid by the class. J The portfolio turnover rate does not include the assets acquired in the merger. K Amount represents less than $.01 per share. |
See accompanying notes which are an integral part of the financial statements.
Annual Report
Financial Highlights - Latin America
Years ended October 31, | 2013 | 2012 | 2011 | 2010 | 2009 |
Selected Per-Share Data | | | | | |
Net asset value, beginning of period | $ 49.09 | $ 52.48 | $ 57.50 | $ 47.29 | $ 28.69 |
Income from Investment Operations | | | | | |
Net investment income (loss) B | .87 | 1.09 | 1.34 | 1.07 | .72 |
Net realized and unrealized gain (loss) | (4.74) | (3.67) | (5.88) | 11.00 | 18.32 |
Total from investment operations | (3.87) | (2.58) | (4.54) | 12.07 | 19.04 |
Distributions from net investment income | (.98) | (.82) | (.29) | (1.49) | (.46) |
Distributions from net realized gain | (3.45) | - | (.20) | (.39) | - |
Total distributions | (4.43) | (.82) | (.49) | (1.88) | (.46) |
Redemption fees added to paid in capital B | .01 | .01 | .01 | .02 | .02 |
Net asset value, end of period | $ 40.80 | $ 49.09 | $ 52.48 | $ 57.50 | $ 47.29 |
Total Return A | (8.63)% | (4.91)% | (7.96)% | 25.91% | 67.88% |
Ratios to Average Net Assets C,E | | | | | |
Expenses before reductions | 1.04% | 1.02% | 1.00% | 1.03% | 1.07% |
Expenses net of fee waivers, if any | 1.04% | 1.02% | 1.00% | 1.03% | 1.07% |
Expenses net of all reductions | 1.03% | 1.02% | 1.00% | 1.01% | 1.05% |
Net investment income (loss) | 1.99% | 2.14% | 2.39% | 2.10% | 2.04% |
Supplemental Data | | | | | |
Net assets, end of period (000 omitted) | $ 1,324,748 | $ 2,274,601 | $ 2,884,301 | $ 4,283,462 | $ 4,043,748 |
Portfolio turnover rate D | 23% | 23% | 11% | 56% F | 52% |
A Total returns would have been lower if certain expenses had not been reduced during the applicable periods shown. B Calculated based on average shares outstanding during the period. C Fees and expenses of any underlying Fidelity Central Funds are not included in the Fund's expense ratio. The Fund indirectly bears its proportionate share of the expenses of any underlying Fidelity Central Funds. D Amount does not include the portfolio activity of any underlying Fidelity Central Funds. E Expense ratios reflect operating expenses of the class. Expenses before reductions do not reflect amounts reimbursed by the investment adviser or reductions from brokerage service arrangements or reductions from other expense offset arrangements and do not represent the amount paid by the class during periods when reimbursements or reductions occur. Expenses net of fee waivers reflect expenses after reimbursement by the investment adviser but prior to reductions from brokerage service arrangements or other expense offset arrangements. Expenses net of all reductions represent the net expenses paid by the class. F The portfolio turnover rate does not include the assets acquired in the merger. |
Financial Highlights - Institutional Class
Years ended October 31, | 2013 | 2012 | 2011 | 2010 G |
Selected Per-Share Data | | | | |
Net asset value, beginning of period | $ 49.07 | $ 52.51 | $ 57.49 | $ 55.47 |
Income from Investment Operations | | | | |
Net investment income (loss) D | .87 | 1.08 | 1.32 | .03 |
Net realized and unrealized gain (loss) | (4.74) | (3.67) | (5.88) | 2.79 |
Total from investment operations | (3.87) | (2.59) | (4.56) | 2.82 |
Distributions from net investment income | (.97) | (.86) | (.23) | (.80) |
Distributions from net realized gain | (3.45) | - | (.20) | - |
Total distributions | (4.42) | (.86) | (.43) | (.80) |
Redemption fees added to paid in capital D | .01 | .01 | .01 | - J |
Net asset value, end of period | $ 40.79 | $ 49.07 | $ 52.51 | $ 57.49 |
Total Return B,C | (8.63)% | (4.93)% | (7.98)% | 5.15% |
Ratios to Average Net Assets E,H | | | | |
Expenses before reductions | 1.03% | 1.04% | 1.04% | 1.08% A |
Expenses net of fee waivers, if any | 1.03% | 1.04% | 1.04% | 1.08% A |
Expenses net of all reductions | 1.01% | 1.04% | 1.04% | 1.06% A |
Net investment income (loss) | 2.00% | 2.12% | 2.35% | .68% A |
Supplemental Data | | | | |
Net assets, end of period (000 omitted) | $ 5,131 | $ 7,928 | $ 9,603 | $ 12,868 |
Portfolio turnover rate F | 23% | 23% | 11% | 56% I |
A Annualized B Total returns for periods of less than one year are not annualized. C Total returns would have been lower if certain expenses had not been reduced during the applicable periods shown. D Calculated based on average shares outstanding during the period. E Fees and expenses of any underlying Fidelity Central Funds are not included in the Fund's expense ratio. The Fund indirectly bears its proportionate share of the expenses of any underlying Fidelity Central Funds. F Amount does not include the portfolio activity of any underlying Fidelity Central Funds. G For the period September 28, 2010 (commencement of sale of shares) to October 31, 2010. H Expense ratios reflect operating expenses of the class. Expenses before reductions do not reflect amounts reimbursed by the investment adviser or reductions from brokerage service arrangements or reductions from other expense offset arrangements and do not represent the amount paid by the class during periods when reimbursements or reductions occur. Expense ratios before reductions for start-up periods may not be representative of longer-term operating periods. Expenses net of fee waivers reflect expenses after reimbursement by the investment adviser but prior to reductions from brokerage service arrangements or other expense offset arrangements. Expenses net of all reductions represent the net expenses paid by the class. I The portfolio turnover rate does not include the assets acquired in the merger. J Amount represents less than $.01 per share. |
See accompanying notes which are an integral part of the financial statements.
Annual Report
Notes to Financial Statements
For the period ended October 31, 2013
1. Organization.
Fidelity Latin America Fund (the Fund) is a non-diversified fund of Fidelity Investment Trust (the Trust) and is authorized to issue an unlimited number of shares. The Trust is registered under the Investment Company Act of 1940, as amended (the 1940 Act), as an open-end management investment company organized as a Massachusetts business trust. The Fund offers Class A, Class T, Class C, Latin America and Institutional Class shares, each of which, along with Class B shares, has equal rights as to assets and voting privileges. Class B shares are closed to new accounts and additional purchases, except for exchanges and reinvestments. Each class has exclusive voting rights with respect to matters that affect that class. Class B shares will automatically convert to Class A shares after a holding period of seven years from the initial date of purchase. The Fund's investments in emerging markets can be subject to social, economic, regulatory, and political uncertainties and can be extremely volatile.
2. Investments in Fidelity Central Funds.
The Fund invests in Fidelity Central Funds, which are open-end investment companies generally available only to other investment companies and accounts managed by Fidelity Management & Research Company (FMR) and its affiliates. The Fund's Schedule of Investments lists each of the Fidelity Central Funds held as of period end, if any, as an investment of the Fund, but does not include the underlying holdings of each Fidelity Central Fund. As an Investing Fund, the Fund indirectly bears its proportionate share of the expenses of the underlying Fidelity Central Funds.
The Money Market Central Funds seek preservation of capital and current income and are managed by Fidelity Investments Money Management, Inc. (FIMM), an affiliate of FMR.
A complete unaudited list of holdings for each Fidelity Central Fund is available upon request or at the Securities and Exchange Commission (the SEC) website at www.sec.gov. In addition, the financial statements of the Fidelity Central Funds, which are not covered by the Fund's Report of Independent Registered Public Accounting Firm, are available on the SEC website or upon request.
3. Significant Accounting Policies.
The financial statements have been prepared in conformity with accounting principles generally accepted in the United States of America (GAAP), which require management to make certain estimates and assumptions at the date of the financial statements. Actual results could differ from those estimates. Subsequent events, if any, through the date that the financial statements were issued have been evaluated in the preparation of the financial statements. The following summarizes the significant accounting policies of the Fund:
Investment Valuation. Investments are valued as of 4:00 p.m. Eastern time on the last calendar day of the period. In accordance with valuation policies and procedures approved by the Board of Trustees (the Board), the Fund attempts to obtain prices from one or more third party pricing vendors or brokers to value its investments. When current market prices, quotations or currency exchange rates are not readily available or reliable, investments will be fair valued in good faith by the FMR Fair Value Committee (the Committee), in accordance with procedures adopted by the Board. Factors used in determining fair value vary by investment type and may include market or investment specific events. The frequency with which these procedures are used cannot be predicted and they may be utilized to a significant extent. The Committee oversees the Fund's valuation policies and procedures and is responsible for approving and reporting to the Board all fair value determinations.
The Fund categorizes the inputs to valuation techniques used to value its investments into a disclosure hierarchy consisting of three levels as shown below:
Level 1 - quoted prices in active markets for identical investments
Level 2 - other significant observable inputs (including quoted prices for similar investments, interest rates, prepayment speeds, etc.)
Level 3 - unobservable inputs (including the Fund's own assumptions based on the best information available)
Valuation techniques used to value the Fund's investments by major category are as follows:
Equity securities, including restricted securities, for which market quotations are readily available, are valued at the last reported sale price or official closing price as reported by a third party pricing vendor on the primary market or exchange on which they are traded and are categorized as Level 1 in the hierarchy. In the event there were no sales during the day or closing prices are not available, securities are valued at the last quoted bid price or may be valued using the last available price and are generally categorized as Level 2 in the hierarchy. For foreign equity securities, when market or security specific events arise, comparisons to the valuation of American Depositary Receipts (ADRs), futures contracts, Exchange-Traded Funds (ETFs) and certain indexes as well as quoted prices for similar securities may be used and would be categorized as Level 2 in the hierarchy. Utilizing these techniques may result in transfers between Level 1 and Level 2. For equity securities, including restricted securities, where observable inputs are limited, assumptions about market activity and risk are used and these securities may be categorized as Level 3 in the hierarchy.
Investments in open-end mutual funds, including the Fidelity Central Funds, are valued at their closing net asset value (NAV) each business day and are categorized as Level 1 in the hierarchy.
Annual Report
3. Significant Accounting Policies - continued
Investment Valuation - continued
Changes in valuation techniques may result in transfers in or out of an assigned level within the disclosure hierarchy. The aggregate value of investments by input level, as of October 31, 2013, is included at the end of the Fund's Schedule of Investments.
Foreign Currency. The Fund may use foreign currency contracts to facilitate transactions in foreign-denominated securities. Gains and losses from these transactions may arise from changes in the value of the foreign currency or if the counterparties do not perform under the contracts' terms.
Foreign-denominated assets, including investment securities, and liabilities are translated into U.S. dollars at the exchange rates at period end. Purchases and sales of investment securities, income and dividends received and expenses denominated in foreign currencies are translated into U.S. dollars at the exchange rate in effect on the transaction date.
The effects of exchange rate fluctuations on investments are included with the net realized and unrealized gain (loss) on investment securities. Other foreign currency transactions resulting in realized and unrealized gain (loss) are disclosed separately.
Investment Transactions and Income. For financial reporting purposes, the Fund's investment holdings and NAV include trades executed through the end of the last business day of the period. The NAV per share for processing shareholder transactions is calculated as of the close of business of the New York Stock Exchange (NYSE), normally 4:00 p.m. Eastern time and includes trades executed through the end of the prior business day. Gains and losses on securities sold are determined on the basis of identified cost and may include proceeds received from litigation. Dividend income is recorded on the ex-dividend date, except for certain dividends from foreign securities where the ex-dividend date may have passed, which are recorded as soon as the Fund is informed of the ex-dividend date. Non-cash dividends included in dividend income, if any, are recorded at the fair market value of the securities received. Distributions received on securities that represent a return of capital or capital gain are recorded as a reduction of cost of investments and/or as a realized gain. Subsequent to ex-dividend date the Fund determines the components of these distributions, based upon receipt of tax filings or other correspondence relating to the underlying investment. Interest income and distributions from the Fidelity Central Funds are accrued as earned. Interest income includes coupon interest and amortization of premium and accretion of discount on debt securities. Investment income is recorded net of foreign taxes withheld where recovery of such taxes is uncertain.
Class Allocations and Expenses. Investment income, realized and unrealized capital gains and losses, common expenses of the Fund, and certain fund-level expense reductions, if any, are allocated daily on a pro-rata basis to each class based on the relative net assets of each class to the total net assets of the Fund. Each class differs with respect to transfer agent and distribution and service plan fees incurred. Certain expense reductions may also differ by class. For the reporting period, the allocated portion of income and expenses to each class as a percent of its average net assets may vary due to the timing of recording these transactions in relation to fluctuating net assets of the classes. Expenses directly attributable to a fund are charged to that fund. Expenses attributable to more than one fund are allocated among the respective funds on the basis of relative net assets or other appropriate methods. Expense estimates are accrued in the period to which they relate and adjustments are made when actual amounts are known.
Income Tax Information and Distributions to Shareholders. Each year, the Fund intends to qualify as a regulated investment company under Subchapter M of the Internal Revenue Code, including distributing substantially all of its taxable income and realized gains. As a result, no provision for U.S. Federal income taxes is required. As of October 31, 2013, the Fund did not have any unrecognized tax benefits in the financial statements; nor is the Fund aware of any tax positions for which it is reasonably possible that the total amounts of unrecognized tax benefits will significantly change in the next twelve months. The Fund files a U.S. federal tax return, in addition to state and local tax returns as required. The Fund's federal income tax returns are subject to examination by the Internal Revenue Service (IRS) for a period of three fiscal years after they are filed. State and local tax returns may be subject to examination for an additional fiscal year depending on the jurisdiction. Foreign taxes are provided for based on the Fund's understanding of the tax rules and rates that exist in the foreign markets in which it invests. The Fund is subject to a tax imposed on capital gains by certain countries in which it invests. An estimated deferred tax liability for net unrealized appreciation on the applicable securities is included in Other payables and accrued expenses on the Statement of Assets & Liabilities.
Distributions are declared and recorded on the ex-dividend date. Income dividends and capital gain distributions are declared separately for each class. Income and capital gain distributions are determined in accordance with income tax regulations, which may differ from GAAP. In addition, the Fund claimed a portion of the payment made to redeeming shareholders as a distribution for income tax purposes.
Capital accounts within the financial statements are adjusted for permanent book-tax differences. These adjustments have no impact on net assets or the results of operations. Temporary book-tax differences will reverse in a subsequent period.
Book-tax differences are primarily due to foreign currency transactions, certain foreign taxes, passive foreign investment companies (PFIC), deferred trustees compensation, and losses deferred due to wash sales.
Annual Report
Notes to Financial Statements - continued
3. Significant Accounting Policies - continued
Income Tax Information and Distributions to Shareholders - continued
The federal tax cost of investment securities and unrealized appreciation (depreciation) as of period end were as follows:
Gross unrealized appreciation | $ 514,889,062 |
Gross unrealized depreciation | (101,624,195) |
Net unrealized appreciation (depreciation) on securities and other investments | $ 413,264,867 |
| |
Tax Cost | $ 1,045,097,094 |
The tax-based components of distributable earnings as of period end were as follows:
Undistributed ordinary income | $ 18,836,911 |
Undistributed long-term capital gain | $ 209,632,547 |
Net unrealized appreciation (depreciation) | $ 413,009,970 |
The tax character of distributions paid was as follows:
| October 31, 2013 | October 31, 2012 |
Ordinary Income | $ 45,716,095 | $ 46,233,461 |
Long-term Capital Gains | 164,648,488 | - |
Total | $ 210,364,583 | $ 46,233,461 |
Short-Term Trading (Redemption) Fees. Shares held by investors in the Fund less than 90 days may have been subject to a redemption fee equal to 1.50% of the net asset value of shares redeemed. All redemption fees, which reduce the proceeds of the shareholder redemption, are retained by the Fund and accounted for as an addition to paid in capital.
4. Purchases and Sales of Investments.
Purchases and sales of securities, other than short-term securities, aggregated $415,539,658 and $1,205,128,341, respectively.
5. Fees and Other Transactions with Affiliates.
Management Fee. FMR and its affiliates provide the Fund with investment management related services for which the Fund pays a monthly management fee. The management fee is the sum of an individual fund fee rate that is based on an annual rate of .45% of the Fund's average net assets and an annualized group fee rate that averaged .25% during the period. The group fee rate is based upon the average net assets of all the mutual funds advised by FMR, including any mutual funds previously advised by FMR that are currently advised by Fidelity SelectCo, LLC, an affiliate of FMR. The group fee rate decreases as assets under management increase and increases as assets under management decrease. For the reporting period, the total annual management fee rate was .71% of the Fund's average net assets.
Distribution and Service Plan Fees. In accordance with Rule 12b-1 of the 1940 Act, the Fund has adopted separate Distribution and Service Plans for each class of shares. Certain classes pay Fidelity Distributors Corporation (FDC), an affiliate of FMR, separate Distribution and Service Fees, each of which is based on an annual percentage of each class' average net assets. In addition, FDC may pay financial intermediaries for selling shares of the Fund and providing shareholder support services. For the period, the Distribution and Service Fee rates, total fees and amounts retained by FDC were as follows:
| Distribution
Fee | Service
Fee | Total Fees | Retained
by FDC |
Class A | -% | .25% | $ 147,042 | $ 3,467 |
Class T | .25% | .25% | 79,698 | 1,065 |
Class B | .75% | .25% | 68,553 | 51,415 |
Class C | .75% | .25% | 207,836 | 19,782 |
| | | $ 503,129 | $ 75,729 |
Sales Load. FDC may receive a front-end sales charge of up to 5.75% for selling Class A shares and 3.50% for selling Class T shares, some of which is paid to financial intermediaries for selling shares of the Fund. Depending on the holding period, FDC may receive contingent deferred sales charges levied on Class A, Class T, Class B and Class C redemptions. The deferred sales charges range from 5.00% to 1.00% for Class B shares, 1.00% for Class C shares, 1.00% for certain purchases of Class A shares and .25% for certain purchases of Class T shares.
Annual Report
5. Fees and Other Transactions with Affiliates - continued
Sales Load - continued
For the period, sales charge amounts retained by FDC were as follows:
| Retained
by FDC |
Class A | $ 27,051 |
Class T | 4,208 |
Class B* | 11,774 |
Class C* | 3,514 |
| $ 46,547 |
* When Class B and Class C shares are initially sold, FDC pays commissions from its own resources to financial intermediaries through which the sales are made.
Transfer Agent Fees. Fidelity Investments Institutional Operations Company, Inc., (FIIOC), an affiliate of FMR, is the transfer, dividend disbursing and shareholder servicing agent for each class of the Fund. FIIOC receives account fees and asset-based fees that vary according to the account size and type of account of the shareholders of the respective classes of the Fund. FIIOC pays for typesetting, printing and mailing of shareholder reports, except proxy statements.
For the period, transfer agent fees for each class were as follows:
| Amount | % of
Average
Net Assets |
Class A | $ 176,560 | .30 |
Class T | 49,934 | .31 |
Class B | 20,537 | .30 |
Class C | 62,116 | .30 |
Latin America | 4,058,638 | .23 |
Institutional Class | 13,589 | .21 |
| $ 4,381,374 | |
Accounting and Security Lending Fees. Fidelity Service Company, Inc. (FSC), an affiliate of FMR, maintains the Fund's accounting records. The accounting fee is based on the level of average net assets for each month. Under a separate contract, FSC administers the security lending program. The security lending fee is based on the number and duration of lending transactions.
Brokerage Commissions. The Fund placed a portion of its portfolio transactions with brokerage firms which are affiliates of the investment adviser. Brokerage commissions are included in net realized gain (loss) and change in net unrealized appreciation (depreciation) in the Statement of Operations. The commissions paid to these affiliated firms were $18,366 for the period.
Interfund Lending Program. Pursuant to an Exemptive Order issued by the SEC, the Fund, along with other registered investment companies having management contracts with FMR, may participate in an interfund lending program. This program provides an alternative credit facility allowing the funds to borrow from, or lend money to, other participating affiliated funds. At period end, there were no interfund loans outstanding. The Fund's activity in this program during the period for which loans were outstanding was as follows:
Borrower or Lender | Average Loan
Balance | Weighted Average Interest Rate | Interest
Expense |
Borrower | $ 4,442,000 | .39% | $ 388 |
Other. During the period, FMR reimbursed the Fund for certain losses in the amount of $9,785.
6. Committed Line of Credit.
The Fund participates with other funds managed by FMR or an affiliate in a $4.25 billion credit facility (the "line of credit") to be utilized for temporary or emergency purposes to fund shareholder redemptions or for other short-term liquidity purposes. The Fund has agreed to pay commitment fees on its pro-rata portion of the line of credit, which amounted to $4,461 and is reflected in Miscellaneous expenses on the Statement of Operations. During the period, there were no borrowings on this line of credit.
7. Security Lending.
The Fund lends portfolio securities through a lending agent from time to time in order to earn additional income. For equity securities, a lending agent is used and may loan securities to certain qualified borrowers, including Fidelity Capital Markets (FCM), a broker-dealer affiliated with the Fund. On the settlement date of the loan, the Fund receives collateral (in the form of U.S. Treasury obligations, letters of credit and/or cash) against the loaned
Annual Report
Notes to Financial Statements - continued
7. Security Lending - continued
securities and maintains collateral in an amount not less than 100% of the market value of the loaned securities during the period of the loan. The market value of the loaned securities is determined at the close of business of the Fund and any additional required collateral is delivered to the Fund on the next business day. If the borrower defaults on its obligation to return the securities loaned because of insolvency or other reasons, the Fund may apply collateral received from the borrower against the obligation. The Fund may experience delays and costs in recovering the securities loaned. Any cash collateral received is invested in the Fidelity Securities Lending Cash Central Fund. The value of loaned securities and cash collateral at period end are disclosed on the Fund's Statement of Assets and Liabilities. At period end, there were no security loans outstanding with FCM. Security lending income represents the income earned on investing cash collateral, less rebates paid to borrowers and any lending agent fees associated with the loan, plus any premium payments received for lending certain types of securities. Security lending income is presented in the Statement of Operations as a component of income from Fidelity Central Funds. Total security lending income during the period amounted to $501,984, including $11,698 from securities loaned to FCM.
8. Expense Reductions.
Commissions paid to certain brokers with whom FMR, or its affiliates, places trades on behalf of the Fund include an amount in addition to trade execution, which may be rebated back to the Fund to offset certain expenses. This amount totaled $316,869 for the period.
In addition, FMR reimbursed a portion of the Fund's operating expenses during the period in the amount of $25,370.
9. Distributions to Shareholders.
Distributions to shareholders of each class were as follows:
Years ended October 31, | 2013 | 2012 |
From net investment income | | |
Class A | $ 1,098,761 | $ 1,209,540 |
Class T | 245,683 | 259,191 |
Class B | 57,649 | 65,750 |
Class C | 192,218 | 156,473 |
Latin America | 43,971,155 | 44,398,764 |
Institutional Class | 150,629 | 143,743 |
Total | $ 45,716,095 | $ 46,233,461 |
From net realized gain | | |
Class A | $ 4,828,947 | $ - |
Class T | 1,341,152 | - |
Class B | 641,573 | - |
Class C | 1,868,040 | - |
Latin America | 155,430,816 | - |
Institutional Class | 537,960 | - |
Total | $ 164,648,488 | $ - |
10. Share Transactions.
Transactions for each class of shares were as follows:
| Shares | Dollars |
Years ended October 31, | 2013 | 2012 | 2013 | 2012 |
Class A | | | | |
Shares sold | 232,318 | 250,504 | $ 10,075,611 | $ 12,951,683 |
Reinvestment of distributions | 119,230 | 21,636 | 5,315,278 | 1,072,283 |
Shares redeemed | (584,100) | (594,208) | (25,288,174) | (30,101,636) |
Net increase (decrease) | (232,552) | (322,068) | $ (9,897,285) | $ (16,077,670) |
Class T | | | | |
Shares sold | 46,221 | 45,016 | $ 2,015,673 | $ 2,321,071 |
Reinvestment of distributions | 34,933 | 5,062 | 1,559,775 | 251,031 |
Shares redeemed | (164,385) | (152,369) | (7,142,972) | (7,641,343) |
Net increase (decrease) | (83,231) | (102,291) | $ (3,567,524) | $ (5,069,241) |
Annual Report
10. Share Transactions - continued
| Shares | Dollars |
Years ended October 31, | 2013 | 2012 | 2013 | 2012 |
Class B | | | | |
Shares sold | 1,849 | 3,378 | $ 84,642 | $ 173,307 |
Reinvestment of distributions | 13,236 | 1,105 | 592,836 | 54,795 |
Shares redeemed | (92,657) | (80,783) | (4,084,874) | (4,111,766) |
Net increase (decrease) | (77,572) | (76,300) | $ (3,407,396) | $ (3,883,664) |
Class C | | | | |
Shares sold | 46,994 | 55,877 | $ 2,021,869 | $ 2,923,684 |
Reinvestment of distributions | 42,623 | 2,881 | 1,907,392 | 142,933 |
Shares redeemed | (277,980) | (172,705) | (12,111,471) | (8,681,626) |
Net increase (decrease) | (188,363) | (113,947) | $ (8,182,210) | $ (5,615,009) |
Latin America | | | | |
Shares sold | 3,510,227 | 6,405,350 | $ 154,033,223 | $ 336,749,510 |
Reinvestment of distributions | 4,304,957 | 860,999 | 191,785,822 | 42,666,908 |
Shares redeemed | (21,678,292) | (15,886,221) | (945,202,869) | (800,304,511) |
Net increase (decrease) | (13,863,108) | (8,619,872) | $ (599,383,824) | $ (420,888,093) |
Institutional Class | | | | |
Shares sold | 62,065 | 84,374 | $ 2,723,553 | $ 4,329,443 |
Reinvestment of distributions | 11,511 | 2,228 | 512,716 | 110,408 |
Shares redeemed | (109,367) | (107,894) | (4,811,735) | (5,412,186) |
Net increase (decrease) | (35,791) | (21,292) | $ (1,575,466) | $ (972,335) |
11. Other.
The Fund's organizational documents provide former and current trustees and officers with a limited indemnification against liabilities arising in connection with the performance of their duties to the Fund. In the normal course of business, the Fund may also enter into contracts that provide general indemnifications. The Fund's maximum exposure under these arrangements is unknown as this would be dependent on future claims that may be made against the Fund. The risk of material loss from such claims is considered remote.
Annual Report
Fidelity Nordic Fund
Average annual total return reflects the change in the value of an investment, assuming reinvestment of the fund's distributions from dividend income and capital gains (the profits earned upon the sale of securities that have grown in value, if any) and assuming a constant rate of performance each year. The $10,000 table and the fund's returns do not reflect the deduction of taxes that a shareholder would pay on fund distributions or the redemption of fund shares. During periods of reimbursement by Fidelity, a fund's total return will be greater than it would be had the reimbursement not occurred. How a fund did yesterday is no guarantee of how it will do tomorrow.
Average Annual Total Returns
Periods ended October 31, 2013 | Past 1
year | Past 5
years | Past 10
years |
Fidelity Nordic Fund | 46.42% | 19.09% | 12.15% |
$10,000 Over 10 Years
Let's say hypothetically that $10,000 was invested in Fidelity Nordic Fund on October 31, 2003. The chart shows how the value of your investment would have changed, and also shows how the FTSE® Capped Nordic Index performed over the same period. Returns shown for the FTSE® Capped Nordic Index for periods prior to October 1, 2009 (its inception date) are returns of the uncapped FTSE Nordic Index.
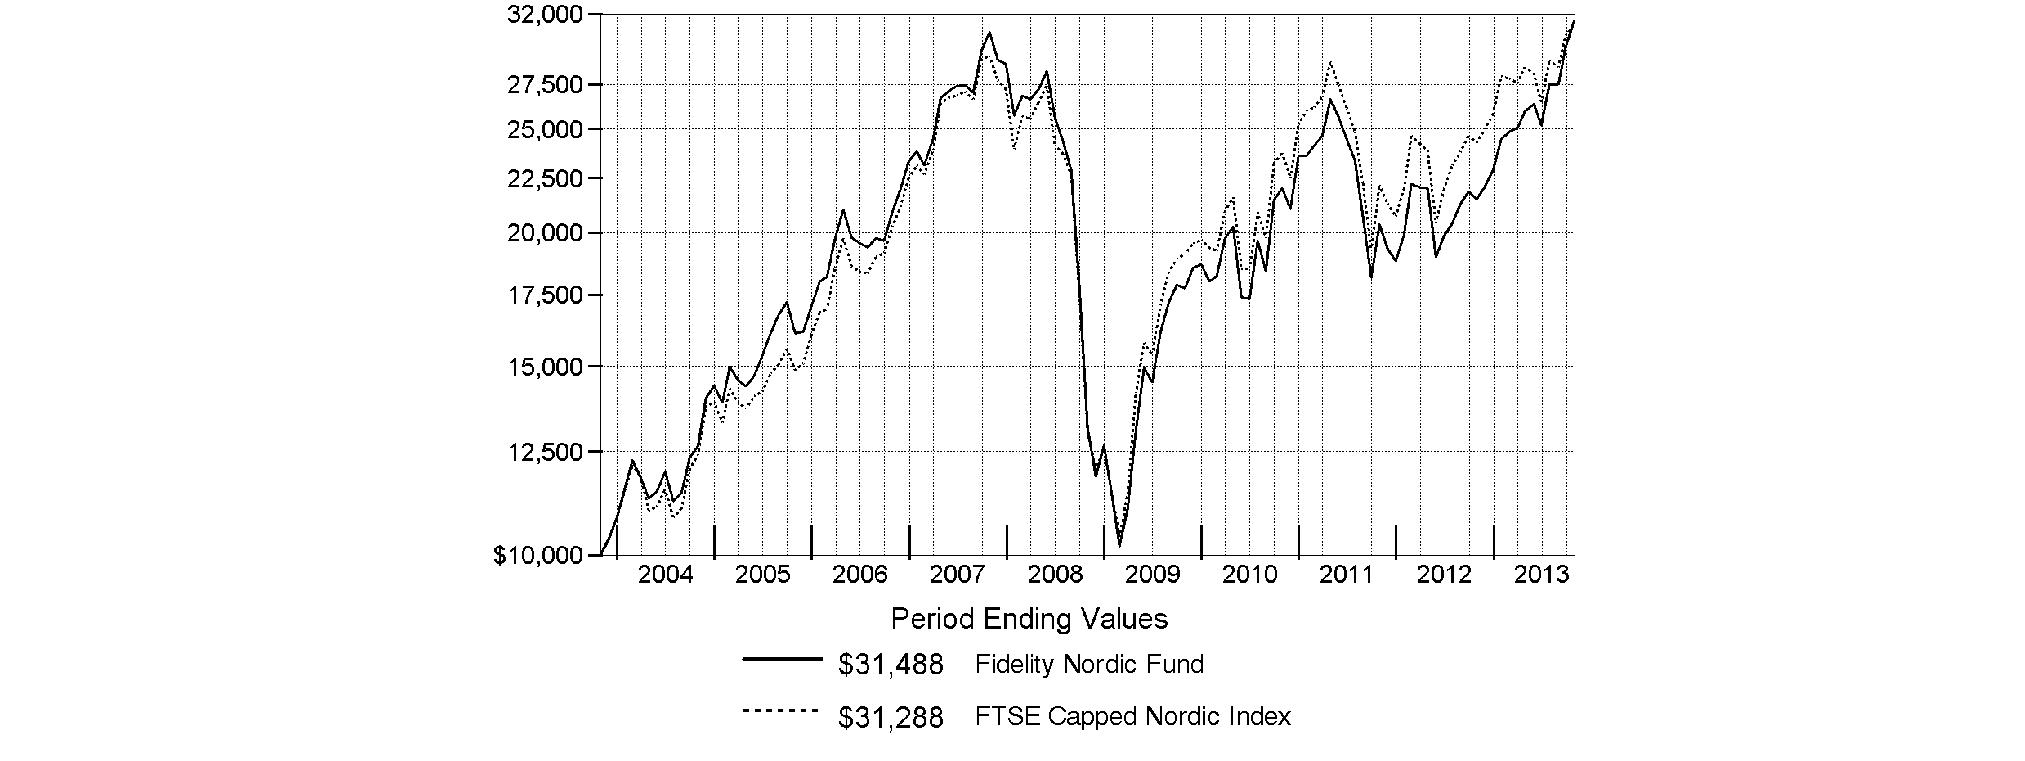
Annual Report
Fidelity Nordic Fund
Market Recap: On balance, global equity markets remained upbeat for the 12-month period ending October 31, 2013. The MSCI® ACWI® (All Country World Index) Index gained 23.75% for the period, amid investor preference for higher-risk assets. The period was not without turbulence, however. In the spring and summer, central banks worldwide, especially in the U.S. and China, made clear their intentions to maintain accommodative monetary policies. That stance, combined with modest cyclical improvements around the globe and generally low valuations, underpinned the broad rally in equities. Europe (+32%) shone brightly, with most markets in the region - large and small - registering solid, index-beating gains. Another bright spot was Japan, which, despite a struggling yen and taking a second-half breather, posted a 34% result for the full year. The U.S. - by far the index's biggest constituent - also outperformed the global market with a roughly 28% advance. Meanwhile, Asia-Pacific ex Japan (+14%) lagged, hurt in part by a slowdown in Australia's mining industry as well as currency headwinds. Foreign-exchange and commodity weakness also curbed results in resource-heavy Canada and emerging markets (EM), both of which were up 7%. Country-level EM performance diverged meaningfully for the period, as evidenced by performance in Brazil (-1%), Russia (+12%), India (+1%) and China (+8%).
Comments from Per Johansson, Portfolio Manager of Fidelity® Nordic Fund: For the year, the fund gained 46.42%, handily outpacing the FTSE® Capped Nordic Index, which gained 28.97%. Versus the index, stock picking in financials helped the most by far, with a stake in Vostok Nafta Investment providing the biggest boost. This Swedish investment manager with a primary focus on Russia experienced steady growth during the period, as the company started to streamline its holdings, prepared to sell some of its assets and narrowed its business model to focus on just a few opportunities. The position had grown substantially during the period due to strong performance. Also within financials, Jyske Bank performed very well. The Danish bank, which I had bought prior to the reporting period when I considered it to be undervalued, shored up its balance sheet and started its journey to consolidate smaller Dutch banks. As the stock improved, its valuation expanded toward what I considered more normal, and I reduced the position to take profits. Elsewhere, Intrum Justitia contributed after previously lingering among the fund's list of relative detractors. As Europe continued develeraging its debt, this Sweden-based credit-management company's operating environment improved. I viewed this company as a steady grower trading below its intrinsic value, so it remained a sizable holding for the fund. On the downside, the fund's position in Swedish e-commerce company CDON Group was disappointing. The company hasn't been able to execute its business plan effectively and has experienced inventory and supply-chain issues for its online retailing sites. I'll also mention Finland-based technology company Nokia. While shares of this major benchmark component experienced a positive run during the period, I maintained a below-index stake because it did not fit my investment criteria. Some of the stocks I've mentioned were not in the index.
The views expressed above reflect those of the portfolio manager(s) only through the end of the period as stated on the cover of this report and do not necessarily represent the views of Fidelity or any other person in the Fidelity organization. Any such views are subject to change at any time based upon market or other conditions and Fidelity disclaims any responsibility to update such views. These views may not be relied on as investment advice and, because investment decisions for a Fidelity fund are based on numerous factors, may not be relied on as an indication of trading intent on behalf of any Fidelity fund.
Annual Report
Fidelity Nordic Fund
As a shareholder of the Fund, you incur two types of costs: (1) transaction costs, including redemption fees and (2) ongoing costs, including management fees and other Fund expenses. This Example is intended to help you understand your ongoing costs (in dollars) of investing in the Fund and to compare these costs with the ongoing costs of investing in other mutual funds.
The Example is based on an investment of $1,000 invested at the beginning of the period and held for the entire period (May 1, 2013 to October 31, 2013).
Actual Expenses
The first line of the accompanying table provides information about actual account values and actual expenses. You may use the information in this line, together with the amount you invested, to estimate the expenses that you paid over the period. Simply divide your account value by $1,000.00 (for example, an $8,600 account value divided by $1,000.00 = 8.6), then multiply the result by the number in the first line under the heading entitled "Expenses Paid During Period" to estimate the expenses you paid on your account during this period. A small balance maintenance fee of $12.00 that is charged once a year may apply for certain accounts with a value of less than $2,000. This fee is not included in the table below. If it was, the estimate of expenses you paid during the period would be higher, and your ending account value lower, by this amount. In addition, the Fund, as a shareholder in the underlying Fidelity Central Funds, will indirectly bear its pro-rata share of the fees and expenses incurred by the underlying Fidelity Central Funds. These fees and expenses are not included in the Fund's annualized expense ratio used to calculate the expense estimate in the table below.
Hypothetical Example for Comparison Purposes
The second line of the accompanying table provides information about hypothetical account values and hypothetical expenses based on the Fund's actual expense ratio and an assumed rate of return of 5% per year before expenses, which is not the Fund's actual return. The hypothetical account values and expenses may not be used to estimate the actual ending account balance or expenses you paid for the period. You may use this information to compare the ongoing costs of investing in the Fund and other funds. To do so, compare this 5% hypothetical example with the 5% hypothetical examples that appear in the shareholder reports of the other funds. A small balance maintenance fee of $12.00 that is charged once a year may apply for certain accounts with a value of less than $2,000. This fee is not included in the table below. If it was, the estimate of expenses you paid during the period would be higher, and your ending account value lower, by this amount. In addition, the Fund, as a shareholder in the underlying Fidelity Central Funds, will indirectly bear its pro-rata share of the fees and expenses incurred by the underlying Fidelity Central Funds. These fees and expenses are not included in the Fund's annualized expense ratio used to calculate the expense estimate in the table below.
Please note that the expenses shown in the table are meant to highlight your ongoing costs only and do not reflect any transaction costs. Therefore, the second line of the table is useful in comparing ongoing costs only, and will not help you determine the relative total costs of owning different funds. In addition, if these transactional costs were included, your costs would have been higher.
| Annualized
Expense Ratio B | Beginning
Account Value
May 1, 2013 | Ending
Account Value
October 31, 2013 | Expenses Paid
During Period*
May 1, 2013
to October 31, 2013 |
Actual | 1.02% | $ 1,000.00 | $ 1,214.70 | $ 5.69 |
Hypothetical A | | $ 1,000.00 | $ 1,020.06 | $ 5.19 |
A 5% return per year before expenses
B Annualized expense ratio reflects expenses net of applicable fee waivers.
* Expenses are equal to the Fund's annualized expense ratio, multiplied by the average account value over the period, multiplied by 184/365 (to reflect the one-half year period).
Annual Report
Fidelity Nordic Fund
Investment Changes (Unaudited)
Geographic Diversification (% of fund's net assets) |
As of October 31, 2013 |
| Sweden | 43.6% | |
| Finland | 20.7% | |
| Denmark | 15.4% | |
| Bermuda | 7.7% | |
| Norway | 3.5% | |
| United States of America* | 3.3% | |
| United Kingdom | 2.7% | |
| Malta | 2.4% | |
| Bailiwick of Jersey | 0.7% | |

* Includes Short-Term Investments and Net Other Assets (Liabilities). |
Percentages are based on country or territory of incorporation and are adjusted for the effect of futures contracts, if applicable. |
As of April 30, 2013 |
| Sweden | 43.8% | |
| Denmark | 17.4% | |
| Finland | 16.8% | |
| Norway | 12.3% | |
| Bermuda | 6.7% | |
| Malta | 3.4% | |
 | United States of America* | (0.4)%† | |

* Includes Short-Term Investments and Net Other Assets (Liabilities). |
† United States of America is not included in the pie chart. |
Percentages are based on country or territory of incorporation and are adjusted for the effect of futures contracts, if applicable. |
Asset Allocation as of October 31, 2013 |
| % of fund's
net assets | % of fund's net assets
6 months ago |
Stocks | 96.7 | 100.4 |
Short-Term Investments and Net Other Assets (Liabilities) | 3.3 | (0.4) |
Top Ten Stocks as of October 31, 2013 |
| % of fund's
net assets | % of fund's net assets
6 months ago |
Vostok Nafta Investment Ltd. SDR (Bermuda, Capital Markets) | 6.1 | 5.0 |
Investment AB Kinnevik (B Shares) (Sweden, Diversified Financial Services) | 4.2 | 3.0 |
Intrum Justitia AB (Sweden, Commercial Services & Supplies) | 4.2 | 4.2 |
Sampo Oyj (A Shares) (Finland, Insurance) | 4.2 | 4.5 |
Raisio Group PLC (V Shares) (Finland, Food Products) | 4.2 | 3.9 |
Svenska Handelsbanken AB (A Shares) (Sweden, Commercial Banks) | 4.1 | 5.4 |
Lassila & Tikahoja Oyj (Finland, Commercial Services & Supplies) | 3.9 | 3.9 |
CDON Group AB (Sweden, Internet & Catalog Retail) | 3.8 | 1.6 |
ASSA ABLOY AB (B Shares) (Sweden, Building Products) | 3.8 | 4.8 |
Schibsted ASA (B Shares) (Norway, Media) | 3.5 | 5.6 |
| 42.0 | |
Market Sectors as of October 31, 2013 |
| % of fund's
net assets | % of fund's net assets
6 months ago |
Financials | 26.2 | 30.6 |
Industrials | 25.2 | 22.8 |
Consumer Discretionary | 12.6 | 13.7 |
Consumer Staples | 11.1 | 9.8 |
Health Care | 8.1 | 8.1 |
Information Technology | 6.2 | 8.3 |
Materials | 5.7 | 2.7 |
Energy | 1.6 | 4.4 |
Annual Report
Fidelity Nordic Fund
Investments October 31, 2013
Showing Percentage of Net Assets
Common Stocks - 96.7% |
| Shares | | Value |
Bailiwick of Jersey - 0.7% |
Black Earth Farming Ltd. unit (a)(d) | 3,057,580 | | $ 3,066,993 |
Bermuda - 7.7% |
BW Offshore Ltd. | 4,988,145 | | 6,845,759 |
Vostok Nafta Investment Ltd. SDR | 3,309,800 | | 26,942,994 |
TOTAL BERMUDA | | 33,788,753 |
Denmark - 15.4% |
Ambu A/S Series B | 208,300 | | 9,385,018 |
Auriga Industries A/S Series B (a) | 352,000 | | 13,808,947 |
Christian Hansen Holding A/S | 302,200 | | 11,195,140 |
Jyske Bank A/S (Reg.) (a) | 179,380 | | 10,126,198 |
Novo Nordisk A/S Series B | 80,001 | | 13,324,378 |
Solar Holding A/S | 174,102 | | 9,920,161 |
TOTAL DENMARK | | 67,759,842 |
Finland - 20.7% |
Amer Group PLC (A Shares) | 614,800 | | 12,638,035 |
Caverion Corp. (a) | 706,000 | | 5,521,372 |
Kesko Oyj | 205,800 | | 6,840,323 |
Lassila & Tikahoja Oyj | 818,700 | | 17,174,064 |
Nokia Corp. (a)(d) | 1,627,000 | | 12,366,483 |
Raisio Group PLC (V Shares) | 3,135,992 | | 18,266,362 |
Sampo Oyj (A Shares) | 385,800 | | 18,276,078 |
TOTAL FINLAND | | 91,082,717 |
Malta - 2.4% |
Unibet Group PLC unit | 258,961 | | 10,390,330 |
Norway - 3.5% |
Schibsted ASA (B Shares) | 249,300 | | 15,243,480 |
Sweden - 43.6% |
AarhusKarlshamn AB | 108,300 | | 6,409,372 |
AF AB (B Shares) | 479,950 | | 15,183,486 |
ASSA ABLOY AB (B Shares) | 333,000 | | 16,531,678 |
Atlas Copco AB (A Shares) | 100,900 | | 2,799,642 |
Avanza Bank Holding AB | 244,700 | | 7,873,388 |
BioGaia AB | 169,923 | | 5,795,169 |
CDON Group AB (a)(d) | 4,289,802 | | 16,814,835 |
DIBS Payment Services AB (e) | 958,000 | | 6,652,726 |
East Capital Explorer AB (a) | 987,400 | | 8,342,551 |
Industrial & Financial Systems AB (IFS) (d) | 362,353 | | 8,331,818 |
|
| Shares | | Value |
Intrum Justitia AB | 694,000 | | $ 18,474,395 |
Investment AB Kinnevik (B Shares) | 505,700 | | 18,635,838 |
Lindab International AB (a) | 757,500 | | 7,382,061 |
Nordea Bank AB | 551,000 | | 7,057,507 |
Saab AB (B Shares) | 283,800 | | 5,693,475 |
Svenska Handelsbanken AB
(A Shares) | 394,400 | | 17,869,591 |
Swedish Match Co. AB | 425,700 | | 14,045,364 |
Vitrolife AB | 615,700 | | 7,529,915 |
TOTAL SWEDEN | | 191,422,811 |
United Kingdom - 2.7% |
G4S PLC (United Kingdom) | 2,800,700 | | 11,743,030 |
TOTAL COMMON STOCKS (Cost $331,161,765) |
424,497,956
|
Money Market Funds - 8.8% |
| | | |
Fidelity Cash Central Fund, 0.09% (b) | 18,483,622 | | 18,483,622 |
Fidelity Securities Lending Cash Central Fund, 0.09% (b)(c) | 20,401,399 | | 20,401,399 |
TOTAL MONEY MARKET FUNDS (Cost $38,885,021) |
38,885,021
|
TOTAL INVESTMENT PORTFOLIO - 105.5% (Cost $370,046,786) | | 463,382,977 |
NET OTHER ASSETS (LIABILITIES) - (5.5)% | | (24,236,307) |
NET ASSETS - 100% | $ 439,146,670 |
Legend |
(a) Non-income producing |
(b) Affiliated fund that is generally available only to investment companies and other accounts managed by Fidelity Investments. The rate quoted is the annualized seven-day yield of the fund at period end. A complete unaudited listing of the fund's holdings as of its most recent quarter end is available upon request. In addition, each Fidelity Central Fund's financial statements, which are not covered by the Fund's Report of Independent Registered Public Accounting Firm, are available on the SEC's website or upon request. |
(c) Investment made with cash collateral received from securities on loan. |
(d) Security or a portion of the security is on loan at period end. |
(e) Affiliated company |
Affiliated Central Funds |
Information regarding fiscal year to date income earned by the Fund from investments in Fidelity Central Funds is as follows: |
Fund | Income earned |
Fidelity Cash Central Fund | $ 4,313 |
Fidelity Securities Lending Cash Central Fund | 649,482 |
Total | $ 653,795 |
Other Affiliated Issuers |
An affiliated company is a company in which the Fund has ownership of at least 5% of the voting securities. Fiscal year to date transactions with companies which are or were affiliates are as follows: |
Affiliate | Value, beginning of period | Purchases | Sales Proceeds | Dividend Income | Value,
end of
period |
DIBS Payment Services AB | $ 6,451,061 | $ 996,282 | $ 61,217 | $ 373,244 | $ 6,652,726 |
Other Information |
Categorizations in the Schedule of Investments are based on country or territory of incorporation. |
The following is a summary of the inputs used, as of October 31, 2013, involving the Fund's assets and liabilities carried at fair value. The inputs or methodology used for valuing securities may not be an indication of the risk associated with investing in those securities. For more information on valuation inputs, and their aggregation into the levels used in the table below, please refer to the Investment Valuation section in the accompanying Notes to Financial Statements. |
Valuation Inputs at Reporting Date: |
Description | Total | Level 1 | Level 2 | Level 3 |
Investments in Securities: | | | | |
Equities: | | | | |
Consumer Discretionary | $ 55,086,680 | $ 55,086,680 | $ - | $ - |
Consumer Staples | 48,628,414 | 48,628,414 | - | - |
Energy | 6,845,759 | 6,845,759 | - | - |
Financials | 115,124,145 | 115,124,145 | - | - |
Health Care | 36,034,480 | 22,710,102 | 13,324,378 | - |
Industrials | 110,423,364 | 110,423,364 | - | - |
Information Technology | 27,351,027 | 14,984,544 | 12,366,483 | - |
Materials | 25,004,087 | 25,004,087 | - | - |
Money Market Funds | 38,885,021 | 38,885,021 | - | - |
Total Investments in Securities: | $ 463,382,977 | $ 437,692,116 | $ 25,690,861 | $ - |
See accompanying notes which are an integral part of the financial statements.
Annual Report
Fidelity Nordic Fund
Statement of Assets and Liabilities
| October 31, 2013 |
| | |
Assets | | |
Investment in securities, at value (including securities loaned of $19,024,934) - See accompanying schedule: Unaffiliated issuers (cost $324,062,126) | $ 417,845,230 | |
Fidelity Central Funds (cost $38,885,021) | 38,885,021 | |
Other affiliated issuers (cost $7,099,639) | 6,652,726 | |
Total Investments (cost $370,046,786) | | $ 463,382,977 |
Receivable for fund shares sold | | 1,259,713 |
Distributions receivable from Fidelity Central Funds | | 25,018 |
Prepaid expenses | | 1,118 |
Other receivables | | 3,795 |
Total assets | | 464,672,621 |
| | |
Liabilities | | |
Payable for investments purchased | $ 4,541,940 | |
Payable for fund shares redeemed | 177,711 | |
Accrued management fee | 240,561 | |
Other affiliated payables | 84,603 | |
Other payables and accrued expenses | 79,737 | |
Collateral on securities loaned, at value | 20,401,399 | |
Total liabilities | | 25,525,951 |
| | |
Net Assets | | $ 439,146,670 |
Net Assets consist of: | | |
Paid in capital | | $ 446,637,894 |
Undistributed net investment income | | 8,385,928 |
Accumulated undistributed net realized gain (loss) on investments and foreign currency transactions | | (109,210,267) |
Net unrealized appreciation (depreciation) on investments and assets and liabilities in foreign currencies | | 93,333,115 |
Net Assets, for 10,002,125 shares outstanding | | $ 439,146,670 |
Net Asset Value, offering price and redemption price per share ($439,146,670 ÷ 10,002,125 shares) | | $ 43.91 |
Statement of Operations
| Year ended October 31, 2013 |
| | |
Investment Income | | |
Dividends (including $373,244 earned from other affiliated issuers) | | $ 12,397,523 |
Interest | | 126,755 |
Income from Fidelity Central Funds (including $649,482 from security lending) | | 653,795 |
Income before foreign taxes withheld | | 13,178,073 |
Less foreign taxes withheld | | (1,365,996) |
Total income | | 11,812,077 |
| | |
Expenses | | |
Management fee | $ 2,358,007 | |
Transfer agent fees | 769,502 | |
Accounting and security lending fees | 176,578 | |
Custodian fees and expenses | 82,126 | |
Independent trustees' compensation | 1,876 | |
Registration fees | 27,683 | |
Audit | 65,007 | |
Legal | 807 | |
Miscellaneous | 2,268 | |
Total expenses before reductions | 3,483,854 | |
Expense reductions | (73,889) | 3,409,965 |
Net investment income (loss) | | 8,402,112 |
Realized and Unrealized Gain (Loss) Net realized gain (loss) on: | | |
Investment securities: | | |
Unaffiliated issuers | 30,530,773 | |
Other affiliated issuers | 2,223 | |
Foreign currency transactions | (77,059) | |
Total net realized gain (loss) | | 30,455,937 |
Change in net unrealized appreciation (depreciation) on: Investment securities | 89,429,087 | |
Assets and liabilities in foreign currencies | (3,342) | |
Total change in net unrealized appreciation (depreciation) | | 89,425,745 |
Net gain (loss) | | 119,881,682 |
Net increase (decrease) in net assets resulting from operations | | $ 128,283,794 |
See accompanying notes which are an integral part of the financial statements.
Annual Report
Fund Name
Financial Statements - continued
Statement of Changes in Net Assets
| Year ended
October 31,
2013 | Year ended
October 31,
2012 |
Increase (Decrease) in Net Assets | | |
Operations | | |
Net investment income (loss) | $ 8,402,112 | $ 7,525,589 |
Net realized gain (loss) | 30,455,937 | (13,188,687) |
Change in net unrealized appreciation (depreciation) | 89,425,745 | 20,467,125 |
Net increase (decrease) in net assets resulting from operations | 128,283,794 | 14,804,027 |
Distributions to shareholders from net investment income | (5,930,609) | (7,290,470) |
Share transactions
Proceeds from sales of shares | 102,329,656 | 33,108,526 |
Reinvestment of distributions | 5,720,237 | 7,043,836 |
Cost of shares redeemed | (88,249,829) | (111,655,692) |
Net increase (decrease) in net assets resulting from share transactions | 19,800,064 | (71,503,330) |
Redemption fees | 42,742 | 40,364 |
Total increase (decrease) in net assets | 142,195,991 | (63,949,409) |
| | |
Net Assets | | |
Beginning of period | 296,950,679 | 360,900,088 |
End of period (including undistributed net investment income of $8,385,928 and undistributed net investment income of $5,914,425, respectively) | $ 439,146,670 | $ 296,950,679 |
Other Information Shares | | |
Sold | 2,653,497 | 1,108,092 |
Issued in reinvestment of distributions | 185,181 | 258,205 |
Redeemed | (2,539,813) | (3,857,413) |
Net increase (decrease) | 298,865 | (2,491,116) |
Financial Highlights
Years ended October 31, | 2013 | 2012 | 2011 | 2010 | 2009 |
Selected Per-Share Data | | | | | |
Net asset value, beginning of period | $ 30.60 | $ 29.60 | $ 32.27 | $ 26.33 | $ 20.75 |
Income from Investment Operations | | | | | |
Net investment income (loss) B | .90 | .70 E | .47 | .33 | .35 |
Net realized and unrealized gain (loss) | 13.04 | .91 | (2.86) | 5.94 | 6.29 |
Total from investment operations | 13.94 | 1.61 | (2.39) | 6.27 | 6.64 |
Distributions from net investment income | (.63) | (.61) | (.29) | (.34) | (1.06) |
Redemption fees added to paid in capital B | - G | - G | .01 | .01 | - G |
Net asset value, end of period | $ 43.91 | $ 30.60 | $ 29.60 | $ 32.27 | $ 26.33 |
Total Return A | 46.42% | 5.69% | (7.49)% | 24.05% | 34.90% |
Ratios to Average Net Assets C,F | | | | | |
Expenses before reductions | 1.04% | 1.08% | 1.05% | 1.12% | 1.15% |
Expenses net of fee waivers, if any | 1.04% | 1.08% | 1.05% | 1.12% | 1.15% |
Expenses net of all reductions | 1.02% | 1.04% | .99% | 1.10% | 1.12% |
Net investment income (loss) | 2.50% | 2.40% E | 1.40% | 1.16% | 1.71% |
Supplemental Data | | | | | |
Net assets, end of period (000 omitted) | $ 439,147 | $ 296,951 | $ 360,900 | $ 457,775 | $ 334,414 |
Portfolio turnover rate D | 61% | 193% | 265% | 80% | 107% |
A Total returns would have been lower if certain expenses had not been reduced during the applicable periods shown. B Calculated based on average shares outstanding during the period. C Fees and expenses of any underlying Fidelity Central Funds are not included in the Fund's expense ratio. The Fund indirectly bears its proportionate share of the expenses of any underlying Fidelity Central Funds. D Amount does not include the portfolio activity of any underlying Fidelity Central Funds. E Investment income per share reflects a large, non-recurring dividend which amounted to $.17 per share. Excluding this non-recurring dividend, the ratio of net investment income (loss) to average net assets would have been 1.83%. F Expense ratios reflect operating expenses of the Fund. Expenses before reductions do not reflect amounts reimbursed by the investment adviser or reductions from brokerage service arrangements or reductions from other expense offset arrangements and do not represent the amount paid by the Fund during periods when reimbursements or reductions occur. Expenses net of fee waivers reflect expenses after reimbursement by the investment adviser but prior to reductions from brokerage service arrangements or other expense offset arrangements. Expenses net of all reductions represent the net expenses paid by the Fund. G Amount represents less than $.01 per share. |
See accompanying notes which are an integral part of the financial statements.
Annual Report
Notes to Financial Statements
For the period ended October 31, 2013
1. Organization.
Fidelity Nordic Fund (the Fund) is a fund of Fidelity Investment Trust (the Trust) and is authorized to issue an unlimited number of shares. The Trust is registered under the Investment Company Act of 1940, as amended (the 1940 Act), as an open-end management investment company organized as a Massachusetts business trust. The Fund's investments in emerging markets can be subject to social, economic, regulatory and political uncertainties and can be extremely volatile.
2. Investments in Fidelity Central Funds.
The Fund invests in Fidelity Central Funds, which are open-end investment companies generally available only to other investment companies and accounts managed by Fidelity Management & Research Company (FMR) and its affiliates. The Fund's Schedule of Investments lists each of the Fidelity Central Funds held as of period end, if any, as an investment of the Fund, but does not include the underlying holdings of each Fidelity Central Fund. As an Investing Fund, the Fund indirectly bears its proportionate share of the expenses of the underlying Fidelity Central Funds.
The Money Market Central Funds seek preservation of capital and current income and are managed by Fidelity Investments Money Management, Inc. (FIMM), an affiliate of FMR.
A complete unaudited list of holdings for each Fidelity Central Fund is available upon request or at the Securities and Exchange Commission (the SEC) website at www.sec.gov. In addition, the financial statements of the Fidelity Central Funds, which are not covered by the Fund's Report of Independent Registered Public Accounting Firm, are available on the SEC website or upon request.
3. Significant Accounting Policies.
The financial statements have been prepared in conformity with accounting principles generally accepted in the United States of America (GAAP), which require management to make certain estimates and assumptions at the date of the financial statements. Actual results could differ from those estimates. Subsequent events, if any, through the date that the financial statements were issued have been evaluated in the preparation of the financial statements. The following summarizes the significant accounting policies of the Fund:
Investment Valuation. Investments are valued as of 4:00 p.m. Eastern time on the last calendar day of the period. In accordance with valuation policies and procedures approved by the Board of Trustees (the Board), the Fund attempts to obtain prices from one or more third party pricing vendors or brokers to value its investments. When current market prices, quotations or currency exchange rates are not readily available or reliable, investments will be fair valued in good faith by the FMR Fair Value Committee (the Committee), in accordance with procedures adopted by the Board. Factors used in determining fair value vary by investment type and may include market or investment specific events. The frequency with which these procedures are used cannot be predicted and they may be utilized to a significant extent. The Committee oversees the Fund's valuation policies and procedures and is responsible for approving and reporting to the Board all fair value determinations.
The Fund categorizes the inputs to valuation techniques used to value its investments into a disclosure hierarchy consisting of three levels as shown below:
Level 1 - quoted prices in active markets for identical investments
Level 2 - other significant observable inputs (including quoted prices for similar investments, interest rates, prepayment speeds, etc.)
Level 3 - unobservable inputs (including the Fund's own assumptions based on the best information available)
Valuation techniques used to value the Fund's investments by major category are as follows:
Equity securities, including restricted securities, for which market quotations are readily available, are valued at the last reported sale price or official closing price as reported by a third party pricing vendor on the primary market or exchange on which they are traded and are categorized as Level 1 in the hierarchy. In the event there were no sales during the day or closing prices are not available, securities are valued at the last quoted bid price or may be valued using the last available price and are generally categorized as Level 2 in the hierarchy. For foreign equity securities, when market or security specific events arise, comparisons to the valuation of American Depositary Receipts (ADRs), futures contracts, Exchange-Traded Funds (ETFs) and certain indexes as well as quoted prices for similar securities may be used and would be categorized as Level 2 in the hierarchy. Utilizing these techniques may result in transfers between Level 1 and Level 2. For equity securities, including restricted securities, where observable inputs are limited, assumptions about market activity and risk are used and these securities may be categorized as Level 3 in the hierarchy.
Investments in open-end mutual funds, including the Fidelity Central Funds, are valued at their closing net asset value (NAV) each business day and are categorized as Level 1 in the hierarchy.
Changes in valuation techniques may result in transfers in or out of an assigned level within the disclosure hierarchy. The aggregate value of investments by input level, as of October 31, 2013, is included at the end of the Fund's Schedule of Investments.
Annual Report
3. Significant Accounting Policies - continued
Foreign Currency. The Fund may use foreign currency contracts to facilitate transactions in foreign-denominated securities. Gains and losses from these transactions may arise from changes in the value of the foreign currency or if the counterparties do not perform under the contracts' terms.
Foreign-denominated assets, including investment securities, and liabilities are translated into U.S. dollars at the exchange rates at period end. Purchases and sales of investment securities, income and dividends received and expenses denominated in foreign currencies are translated into U.S. dollars at the exchange rate in effect on the transaction date.
The effects of exchange rate fluctuations on investments are included with the net realized and unrealized gain (loss) on investment securities. Other foreign currency transactions resulting in realized and unrealized gain (loss) are disclosed separately.
Investment Transactions and Income. For financial reporting purposes, the Fund's investment holdings and NAV include trades executed through the end of the last business day of the period. The NAV per share for processing shareholder transactions is calculated as of the close of business of the New York Stock Exchange (NYSE), normally 4:00 p.m. Eastern time and includes trades executed through the end of the prior business day. Gains and losses on securities sold are determined on the basis of identified cost. Dividend income is recorded on the ex-dividend date, except for certain dividends from foreign securities where the ex-dividend date may have passed, which are recorded as soon as the Fund is informed of the ex-dividend date. Non-cash dividends included in dividend income, if any, are recorded at the fair market value of the securities received. Interest income and distributions from the Fidelity Central Funds are accrued as earned. Interest income includes coupon interest and amortization of premium and accretion of discount on debt securities. Investment income is recorded net of foreign taxes withheld where recovery of such taxes is uncertain.
Expenses. Expenses directly attributable to a fund are charged to that fund. Expenses attributable to more than one fund are allocated among the respective funds on the basis of relative net assets or other appropriate methods. Expense estimates are accrued in the period to which they relate and adjustments are made when actual amounts are known.
Income Tax Information and Distributions to Shareholders. Each year, the Fund intends to qualify as a regulated investment company under Subchapter M of the Internal Revenue Code, including distributing substantially all of its taxable income and realized gains. As a result, no provision for U.S. Federal income taxes is required. As of October 31, 2013, the Fund did not have any unrecognized tax benefits in the financial statements; nor is the Fund aware of any tax positions for which it is reasonably possible that the total amounts of unrecognized tax benefits will significantly change in the next twelve months. The Fund files a U.S. federal tax return, in addition to state and local tax returns as required. The Fund's federal income tax returns are subject to examination by the Internal Revenue Service (IRS) for a period of three fiscal years after they are filed. State and local tax returns may be subject to examination for an additional fiscal year depending on the jurisdiction. Foreign taxes are provided for based on the Fund's understanding of the tax rules and rates that exist in the foreign markets in which it invests.
Distributions are declared and recorded on the ex-dividend date. Income and capital gain distributions are determined in accordance with income tax regulations, which may differ from GAAP.
Capital accounts within the financial statements are adjusted for permanent book-tax differences. These adjustments have no impact on net assets or the results of operations. Temporary book-tax differences will reverse in a subsequent period.
Book-tax differences are primarily due to foreign currency transactions, passive foreign investment companies (PFIC), deferred trustees compensation, capital loss carryforwards and losses deferred due to wash sales.
The federal tax cost of investment securities and unrealized appreciation (depreciation) as of period end were as follows:
Gross unrealized appreciation | $ 83,015,232 |
Gross unrealized depreciation | (10,660,246) |
Net unrealized appreciation (depreciation) on securities and other investments | $ 72,354,986 |
| |
Tax Cost | $ 391,027,991 |
The tax-based components of distributable earnings as of period end were as follows:
Undistributed ordinary income | $ 27,033,155 |
Capital loss carryforward | $ (106,876,288) |
Net unrealized appreciation (depreciation) | $ 72,351,910 |
Annual Report
Notes to Financial Statements - continued
3. Significant Accounting Policies - continued
Income Tax Information and Distributions to Shareholders - continued
Capital loss carryforwards are only available to offset future capital gains of the Fund to the extent provided by regulations and may be limited. Under the Regulated Investment Company Modernization Act of 2010 (the Act), the Fund is permitted to carry forward capital losses incurred in taxable years beginning after December 22, 2010 for an unlimited period and such capital losses are required to be used prior to any losses that expire. The capital loss carryforward information presented below, including any applicable limitation, is estimated as of fiscal period end and is subject to adjustment.
Fiscal year of expiration | |
2017 | $ (106,876,288) |
The tax character of distributions paid was as follows:
| October 31, 2013 | October 31, 2012 |
Ordinary Income | $ 5,930,609 | $ 7,290,470 |
Short-Term Trading (Redemption) Fees. Shares held by investors in the Fund less than 90 days may have been subject to a redemption fee equal to 1.50% of the net asset value of shares redeemed. All redemption fees, which reduce the proceeds of the shareholder redemption, are retained by the Fund and accounted for as an addition to paid in capital.
4. Purchases and Sales of Investments.
Purchases and sales of securities, other than short-term securities, aggregated $218,499,281 and $204,366,433, respectively.
5. Fees and Other Transactions with Affiliates.
Management Fee. FMR and its affiliates provide the Fund with investment management related services for which the Fund pays a monthly management fee. The management fee is the sum of an individual fund fee rate that is based on an annual rate of .45% of the Fund's average net assets and an annualized group fee rate that averaged .25% during the period. The group fee rate is based upon the average net assets of all the mutual funds advised by FMR, including any mutual funds previously advised by FMR that are currently advised by Fidelity SelectCo, LLC, an affiliate of FMR. The group fee rate decreases as assets under management increase and increases as assets under management decrease. For the reporting period, the total annual management fee rate was .70% of the Fund's average net assets.
Transfer Agent Fees. Fidelity Investments Institutional Operations Company, Inc. (FIIOC), an affiliate of FMR, is the Fund's transfer, dividend disbursing and shareholder servicing agent. FIIOC receives account fees and asset-based fees that vary according to account size and type of account. FIIOC pays for typesetting, printing and mailing of shareholder reports, except proxy statements. For the period, the transfer agent fees were equivalent to an annual rate of .23% of average net assets.
Accounting and Security Lending Fees. Fidelity Service Company, Inc. (FSC), an affiliate of FMR, maintains the Fund's accounting records. The accounting fee is based on the level of average net assets for each month. Under a separate contract, FSC administers the security lending program. The security lending fee is based on the number and duration of lending transactions.
6. Committed Line of Credit.
The Fund participates with other funds managed by FMR or an affiliate in a $4.25 billion credit facility (the "line of credit") to be utilized for temporary or emergency purposes to fund shareholder redemptions or for other short-term liquidity purposes. The Fund has agreed to pay commitment fees on its pro-rata portion of the line of credit, which amounted to $704 and is reflected in Miscellaneous expenses on the Statement of Operations. During the period, there were no borrowings on this line of credit.
7. Security Lending.
The Fund lends portfolio securities through a lending agent from time to time in order to earn additional income. For equity securities, a lending agent is used and may loan securities to certain qualified borrowers, including Fidelity Capital Markets (FCM), a broker-dealer affiliated with the Fund. On the settlement date of the loan, the Fund receives collateral (in the form of U.S. Treasury obligations, letters of credit and/or cash) against the loaned securities and maintains collateral in an amount not less than 100% of the market value of the loaned securities during the period of the loan. The market value of the loaned securities is determined at the close of business of the Fund and any additional required collateral is delivered to the Fund on the next business day. If the borrower defaults on its obligation to return the securities loaned because of insolvency or other reasons, the Fund may apply collateral received from the borrower against the obligation. The Fund may experience delays and costs in recovering the securities loaned. Any
Annual Report
7. Security Lending - continued
cash collateral received is invested in the Fidelity Securities Lending Cash Central Fund. The value of loaned securities and cash collateral at period end are disclosed on the Fund's Statement of Assets and Liabilities. Security lending income represents the income earned on investing cash collateral, less rebates paid to borrowers and any lending agent fees associated with the loan, plus any premium payments received for lending certain types of securities. Security lending income is presented in the Statement of Operations as a component of income from Fidelity Central Funds. During the period, there were no securities loaned to FCM.
8. Expense Reductions.
Commissions paid to certain brokers with whom FMR, or its affiliates, places trades on behalf of the Fund include an amount to the Fund in addition to trade execution, which may be rebated back to the Fund to offset certain expenses. This amount totaled $65,922 for the period.
In addition, FMR reimbursed a portion of the Fund's operating expenses during the period in the amount of $7,967.
9. Other.
The Fund's organizational documents provide former and current trustees and officers with a limited indemnification against liabilities arising in connection with the performance of their duties to the Fund. In the normal course of business, the Fund may also enter into contracts that provide general indemnifications. The Fund's maximum exposure under these arrangements is unknown as this would be dependent on future claims that may be made against the Fund. The risk of material loss from such claims is considered remote.
Annual Report
Fidelity Pacific Basin Fund
Average annual total return reflects the change in the value of an investment, assuming reinvestment of the fund's distributions from dividend income and capital gains (the profits earned upon the sale of securities that have grown in value, if any) and assuming a constant rate of performance each year. The $10,000 table and the fund's returns do not reflect the deduction of taxes that a shareholder would pay on fund distributions or the redemption of fund shares. During periods of reimbursement by Fidelity, a fund's total return will be greater than it would be had the reimbursement not occurred. How a fund did yesterday is no guarantee of how it will do tomorrow.
Average Annual Total Returns
Periods ended October 31, 2013 | Past 1
year | Past 5
years | Past 10
years |
Fidelity Pacific Basin Fund | 30.58% | 22.56% | 10.37% |
$10,000 Over 10 Years
Let's say hypothetically that $10,000 was invested in Fidelity Pacific Basin Fund on October 31, 2003. The chart shows how the value of your investment would have changed, and also shows how the MSCI AC (All Country) Pacific Index performed over the same period.
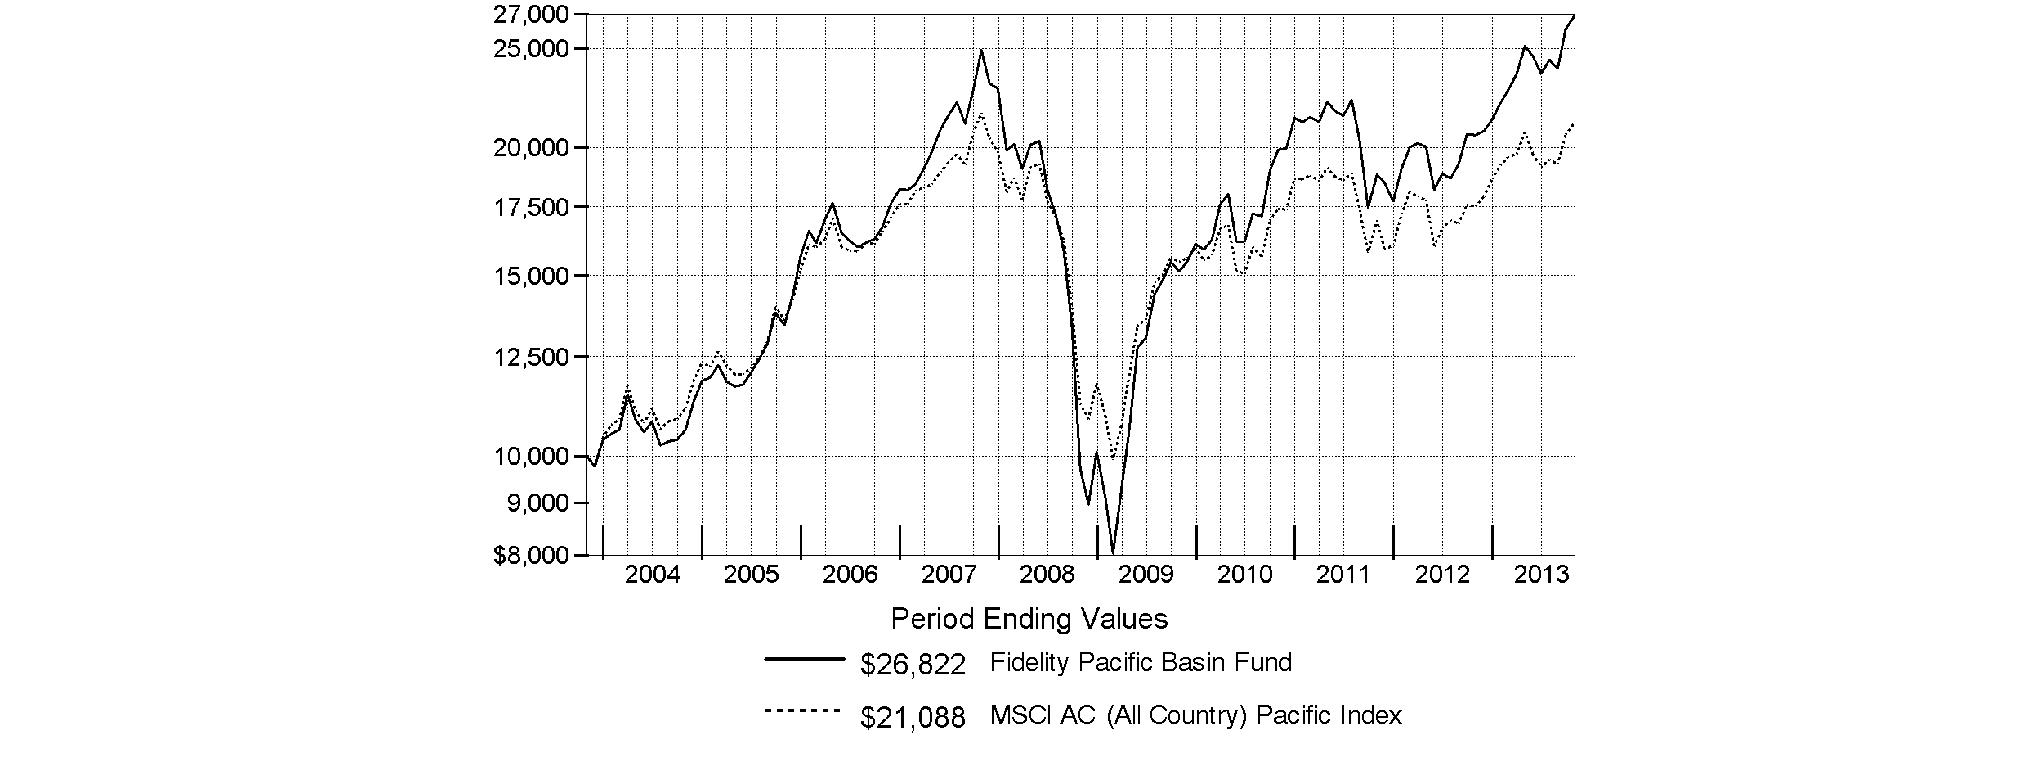
Annual Report
Fidelity Pacific Basin Fund
Market Recap: On balance, global equity markets remained upbeat for the 12-month period ending October 31, 2013. The MSCI® ACWI® (All Country World Index) Index gained 23.75% for the period, amid investor preference for higher-risk assets. The period was not without turbulence, however. In the spring and summer, central banks worldwide, especially in the U.S. and China, made clear their intentions to maintain accommodative monetary policies. That stance, combined with modest cyclical improvements around the globe and generally low valuations, underpinned the broad rally in equities. Europe (+32%) shone brightly, with most markets in the region - large and small - registering solid, index-beating gains. Another bright spot was Japan, which, despite a struggling yen and taking a second-half breather, posted a 34% result for the full year. The U.S. - by far the index's biggest constituent - also outperformed the global market with a roughly 28% advance. Meanwhile, Asia-Pacific ex Japan (+14%) lagged, hurt in part by a slowdown in Australia's mining industry as well as currency headwinds. Foreign-exchange and commodity weakness also curbed results in resource-heavy Canada and emerging markets (EM), both of which were up 7%. Country-level EM performance diverged meaningfully for the period, as evidenced by performance in Brazil (-1%), Russia (+12%), India (+1%) and China (+8%).
Comments from Dale Nicholls, Portfolio Manager of Fidelity® Pacific Basin Fund for most of the reporting period: For the year, the fund returned 30.58%, handily beating the 20.34% gain of the MSCI® AC (All Country) Pacific Index. Versus the index, stock selection in emerging markets - especially China, Malaysia and Thailand - provided a significant boost. Picks in Japan also meaningfully bolstered our results, as I was able to identify some winners that benefited from recently elected Prime Minister Shinzo Abe's boldly stimulative fiscal and monetary policies. In fact, five of the 10 largest relative contributors were Japanese stocks, among them telecommunication services provider SoftBank. This stock more than doubled amid investor optimism over the company's recent acquisition of U.S. wireless carrier Sprint Nextel and increasing estimates of the value of SoftBank's 37% stake in Chinese e-commerce giant Alibaba, which is expected to have its initial public offering in 2014. Another standout was ORIX, Japan's leading diversified financial services company. This stock posted a solid gain amid the surge in liquidity resulting from the government's efforts to reinvigorate the Japanese economy. However, the top relative contributor was a non-index position in SouFun Holdings, the largest property Internet portal in China. Amid a continued boom in real estate development and increasing use of online platforms to advertise listings, this firm reported a series of strong earnings results that lifted its stock to a gain of more than 200%. SouFun Holdings was not held at period end, and our stake in ORIX was roughly halved during the period. Conversely, one noteworthy detractor was Japan's Fujibo Holdings, a manufacturer of industrial textiles, including screen-polishing materials for Apple products. Fujibo's stock declined following disappointing sales and earnings guidance resulting from price declines and a build-up of inventories of the company's products at Apple, and the position was eliminated. Also weighing on performance was Singapore-based Goodpack, which leases intermediate bulk containers. Lackluster shipping volumes and lower profit margins due to interest costs on a loan curbed profits and hampered the stock. Fujibo and Goodpack both were non-index holdings. One strong performer in the index that the fund didn't own - and that detracted from relative performance as a result - was Japanese automaker Toyota Motor. I thought this stock was richly valued compared with its Korean competitors and their superior growth prospects, but the December election of Prime Minister Abe triggered a massive depreciation of the yen and sizable share-price gains for large-cap exporters like Toyota, whose global competitive position was materially improved by a cheaper currency.
Note to shareholders: John Dance became Portfolio Manager of Fidelity® Pacific Basin Fund on October 1, 2013.
The views expressed above reflect those of the portfolio manager(s) only through the end of the period as stated on the cover of this report and do not necessarily represent the views of Fidelity or any other person in the Fidelity organization. Any such views are subject to change at any time based upon market or other conditions and Fidelity disclaims any responsibility to update such views. These views may not be relied on as investment advice and, because investment decisions for a Fidelity fund are based on numerous factors, may not be relied on as an indication of trading intent on behalf of any Fidelity fund.
Annual Report
Fidelity Pacific Basin Fund
As a shareholder of the Fund, you incur two types of costs: (1) transaction costs, including redemption fees and (2) ongoing costs, including management fees and other Fund expenses. This Example is intended to help you understand your ongoing costs (in dollars) of investing in the Fund and to compare these costs with the ongoing costs of investing in other mutual funds.
The Example is based on an investment of $1,000 invested at the beginning of the period and held for the entire period (May 1, 2013 to October 31, 2013).
Actual Expenses
The first line of the accompanying table provides information about actual account values and actual expenses. You may use the information in this line, together with the amount you invested, to estimate the expenses that you paid over the period. Simply divide your account value by $1,000.00 (for example, an $8,600 account value divided by $1,000.00 = 8.6), then multiply the result by the number in the first line under the heading entitled "Expenses Paid During Period" to estimate the expenses you paid on your account during this period. A small balance maintenance fee of $12.00 that is charged once a year may apply for certain accounts with a value of less than $2,000. This fee is not included in the table below. If it was, the estimate of expenses you paid during the period would be higher, and your ending account value lower, by this amount. In addition, the Fund, as a shareholder in the underlying Fidelity Central Funds, will indirectly bear its pro-rata share of the fees and expenses incurred by the underlying Fidelity Central Funds. These fees and expenses are not included in the Fund's annualized expense ratio used to calculate the expense estimate in the table below.
Hypothetical Example for Comparison Purposes
The second line of the accompanying table provides information about hypothetical account values and hypothetical expenses based on the Fund's actual expense ratio and an assumed rate of return of 5% per year before expenses, which is not the Fund's actual return. The hypothetical account values and expenses may not be used to estimate the actual ending account balance or expenses you paid for the period. You may use this information to compare the ongoing costs of investing in the Fund and other funds. To do so, compare this 5% hypothetical example with the 5% hypothetical examples that appear in the shareholder reports of the other funds. A small balance maintenance fee of $12.00 that is charged once a year may apply for certain accounts with a value of less than $2,000. This fee is not included in the table below. If it was, the estimate of expenses you paid during the period would be higher, and your ending account value lower, by this amount. In addition, the Fund, as a shareholder in the underlying Fidelity Central Funds, will indirectly bear its pro-rata share of the fees and expenses incurred by the underlying Fidelity Central Funds. These fees and expenses are not included in the Fund's annualized expense ratio used to calculate the expense estimate in the table below.
Please note that the expenses shown in the table are meant to highlight your ongoing costs only and do not reflect any transaction costs. Therefore, the second line of the table is useful in comparing ongoing costs only, and will not help you determine the relative total costs of owning different funds. In addition, if these transactional costs were included, your costs would have been higher.
| Annualized
Expense Ratio B | Beginning
Account Value
May 1, 2013 | Ending
Account Value
October 31, 2013 | Expenses Paid
During Period*
May 1, 2013
to October 31, 2013 |
Actual | 1.21% | $ 1,000.00 | $ 1,068.20 | $ 6.31 |
HypotheticalA | | $ 1,000.00 | $ 1,019.11 | $ 6.16 |
A 5% return per year before expenses
B Annualized expense ratio reflects expenses net of applicable fee waivers.
* Expenses are equal to the Fund's annualized expense ratio, multiplied by the average account value over the period, multiplied by 184/365 (to reflect the one-half year period).
Annual Report
Fidelity Pacific Basin Fund
Investment Changes (Unaudited)
Geographic Diversification (% of fund's net assets) |
As of October 31, 2013 |
| Japan | 35.6% | |
| Australia | 13.1% | |
| Cayman Islands | 10.5% | |
| Korea (South) | 7.4% | |
| Taiwan | 4.4% | |
| Singapore | 4.3% | |
| United States ofAmerica* | 4.2% | |
| Hong Kong | 3.8% | |
| Bermuda | 3.8% | |
| Other | 12.9% | |

* Includes Short-Term Investments and Net Other Assets (Liabilities). |
Percentages are based on country or territory of incorporation and are adjusted for the effect of futures contracts, if applicable. |
As of April 30, 2013 |
| Japan | 36.4% | |
| Cayman Islands | 15.8% | |
| Korea (South) | 9.7% | |
| Australia | 6.8% | |
| Indonesia | 5.6% | |
| Bermuda | 4.3% | |
| Singapore | 3.3% | |
| Hong Kong | 3.0% | |
| Taiwan | 2.9% | |
| Other* | 12.2% | |

* Includes Short-Term Investments and Net Other Assets (Liabilities). |
Percentages are based on country or territory of incorporation and are adjusted for the effect of futures contracts, if applicable. |
Asset Allocation as of October 31, 2013 |
| % of fund's
net assets | % of fund's net assets
6 months ago |
Stocks | 96.7 | 98.8 |
Short-Term Investments and Net Other Assets (Liabilities) | 3.3 | 1.2 |
Top Ten Stocks as of October 31, 2013 |
| % of fund's
net assets | % of fund's net assets
6 months ago |
Samsung Electronics Co. Ltd. (Korea (South), Semiconductors & Semiconductor Equipment) | 3.0 | 2.6 |
SoftBank Corp. (Japan, Wireless Telecommunication Services) | 2.9 | 2.5 |
ORIX Corp. (Japan, Diversified Financial Services) | 2.6 | 3.8 |
Commonwealth Bank of Australia (Australia, Commercial Banks) | 2.4 | 0.0 |
Taiwan Semiconductor Manufacturing Co. Ltd. (Taiwan, Semiconductors & Semiconductor Equipment) | 2.1 | 0.0 |
Australia & New Zealand Banking Group Ltd. (Australia, Commercial Banks) | 1.8 | 0.0 |
Cheung Kong Infrastructure Holdings Ltd. (Bermuda, Electric Utilities) | 1.6 | 0.4 |
Tencent Holdings Ltd. (Cayman Islands, Internet Software & Services) | 1.5 | 1.0 |
Sumitomo Mitsui Financial Group, Inc. (Japan, Commercial Banks) | 1.5 | 0.0 |
AIA Group Ltd. (Hong Kong, Insurance) | 1.5 | 1.2 |
| 20.9 | |
Market Sectors as of October 31, 2013 |
| % of fund's
net assets | % of fund's net assets
6 months ago |
Financials | 23.6 | 20.4 |
Consumer Discretionary | 15.5 | 19.1 |
Industrials | 13.8 | 14.7 |
Information Technology | 12.2 | 21.5 |
Consumer Staples | 9.7 | 5.5 |
Health Care | 9.1 | 6.6 |
Telecommunication Services | 4.6 | 2.5 |
Materials | 4.1 | 5.8 |
Utilities | 2.4 | 1.2 |
Energy | 1.7 | 1.5 |
Annual Report
Fidelity Pacific Basin Fund
Investments October 31, 2013
Showing Percentage of Net Assets
Common Stocks - 96.7% |
| Shares | | Value |
Australia - 13.1% |
Ansell Ltd. | 321,461 | | $ 5,921,625 |
ARB Corp. Ltd. | 289,695 | | 3,189,831 |
Austal Ltd. (a) | 1,145,555 | | 817,455 |
Australia & New Zealand Banking Group Ltd. | 409,926 | | 13,111,022 |
Brambles Ltd. | 604,183 | | 5,310,705 |
Commonwealth Bank of Australia | 238,278 | | 17,133,859 |
CSL Ltd. | 119,174 | | 7,828,293 |
Goodman Group unit | 1,144,347 | | 5,472,793 |
Invocare Ltd. | 319,066 | | 3,305,155 |
Karoon Gas Australia Ltd. (a) | 326,406 | | 1,366,667 |
Magellan Financial Group Ltd. | 251,802 | | 2,653,596 |
QRxPharma Ltd. (a)(d) | 656,257 | | 431,082 |
SEEK Ltd. | 246,449 | | 3,025,777 |
Slater & Gordon Ltd. | 957,128 | | 3,500,916 |
Transurban Group unit | 872,677 | | 5,856,156 |
Woodside Petroleum Ltd. | 170,943 | | 6,272,022 |
Woolworths Ltd. | 288,568 | | 9,518,628 |
TOTAL AUSTRALIA | | 94,715,582 |
Bermuda - 3.8% |
Brilliance China Automotive Holdings Ltd. | 2,610,000 | | 4,564,891 |
Cheung Kong Infrastructure Holdings Ltd. | 1,687,000 | | 11,739,153 |
China Animal Healthcare Ltd. (a) | 10,068,000 | | 3,220,513 |
Hongkong Land Holdings Ltd. | 1,236,000 | | 7,613,760 |
REXLot Holdings Ltd. | 11,967 | | 1,050 |
TOTAL BERMUDA | | 27,139,367 |
Cayman Islands - 10.5% |
21Vianet Group, Inc. ADR (a)(d) | 200,200 | | 3,603,600 |
Airtac International Group | 398,590 | | 2,884,310 |
AMVIG Holdings Ltd. | 9,408,000 | | 4,417,015 |
Bitauto Holdings Ltd. ADR (a)(d) | 161,370 | | 3,955,179 |
China Automation Group Ltd. | 3,709,000 | | 779,785 |
China High Precision Automation Group Ltd. | 1,875,000 | | 72,553 |
China Metal Recycling (Holdings) Ltd. (a) | 2,572,200 | | 3 |
China State Construction International Holdings Ltd. | 1,302 | | 2,193 |
Cimc Enric Holdings Ltd. | 2,326,000 | | 3,276,141 |
ENN Energy Holdings Ltd. | 848,000 | | 5,025,874 |
Greatview Aseptic Pack Co. Ltd. | 3,683,000 | | 2,318,205 |
Haitian International Holdings Ltd. | 1,666,000 | | 4,014,044 |
Hengan International Group Co. Ltd. | 500,500 | | 6,129,560 |
Hutchison China Meditech Ltd. (a) | 69 | | 698 |
Integrated Waste Solutions Group Health Ltd. (a) | 11,590,000 | | 819,208 |
Kingdee International Software Group Co. Ltd. (a) | 1,513 | | 488 |
New Oriental Education & Technology Group, Inc. sponsored ADR | 221,600 | | 5,808,136 |
|
| Shares | | Value |
Pactera Technology International Ltd. ADR | 12 | | $ 85 |
Perfect World Co. Ltd. sponsored ADR Class B | 75 | | 1,315 |
Royale Furniture Holdings Ltd. | 21,567,865 | | 1,126,659 |
Sands China Ltd. | 898,400 | | 6,384,863 |
Tencent Holdings Ltd. | 204,800 | | 11,179,074 |
Vipshop Holdings Ltd. ADR (a)(d) | 28,200 | | 1,943,826 |
Want Want China Holdings Ltd. | 3,162,000 | | 4,861,478 |
WuXi PharmaTech Cayman, Inc. sponsored ADR (a) | 243,800 | | 7,131,150 |
TOTAL CAYMAN ISLANDS | | 75,735,442 |
China - 2.6% |
China Longyuan Power Grid Corp. Ltd. (H Shares) | 284,000 | | 326,382 |
Industrial & Commercial Bank of China Ltd. (H Shares) | 14,414,000 | | 10,095,192 |
Tsingtao Brewery Co. Ltd. (H Shares) | 996,000 | | 8,157,616 |
Yantai Changyu Pioneer Wine Co. Ltd. (B Shares) | 10 | | 32 |
TOTAL CHINA | | 18,579,222 |
Hong Kong - 3.8% |
AIA Group Ltd. | 2,148,000 | | 10,902,077 |
Galaxy Entertainment Group Ltd. (a) | 842,000 | | 6,282,691 |
Lenovo Group Ltd. | 2,958,000 | | 3,166,697 |
Magnificent Estates Ltd. | 67,338,000 | | 3,257,030 |
Techtronic Industries Co. Ltd. | 1,642,500 | | 4,131,143 |
TOTAL HONG KONG | | 27,739,638 |
India - 3.0% |
Asian Paints India Ltd. | 360,763 | | 3,158,081 |
Britannia Industries Ltd. | 334,421 | | 5,098,748 |
Housing Development Finance Corp. Ltd. | 187,495 | | 2,601,545 |
Petronet LNG Ltd. | 2,121,402 | | 4,277,298 |
Sun Pharmaceutical Industries Ltd. | 345,549 | | 3,413,771 |
United Spirits Ltd. | 72,195 | | 3,015,721 |
TOTAL INDIA | | 21,565,164 |
Indonesia - 1.0% |
PT Bank Central Asia Tbk | 4,792,000 | | 4,442,328 |
PT Gudang Garam Tbk | 253,000 | | 828,179 |
PT MNC Sky Vision Tbk (a) | 8,196,000 | | 1,690,450 |
TOTAL INDONESIA | | 6,960,957 |
Italy - 0.9% |
Prada SpA | 649,300 | | 6,331,366 |
Japan - 35.6% |
ACOM Co. Ltd. (a) | 422,200 | | 1,653,196 |
AEON Mall Co. Ltd. | 160,210 | | 4,550,119 |
Asahi Group Holdings | 217,200 | | 5,874,069 |
Astellas Pharma, Inc. | 152,100 | | 8,479,025 |
Calbee, Inc. | 164,700 | | 4,321,622 |
Create SD Holdings Co. Ltd. | 70,600 | | 2,573,659 |
Common Stocks - continued |
| Shares | | Value |
Japan - continued |
Daikin Industries Ltd. | 110,700 | | $ 6,368,947 |
Daito Trust Construction Co. Ltd. | 43,700 | | 4,461,934 |
East Japan Railway Co. | 93,800 | | 8,148,471 |
Fuji Heavy Industries Ltd. | 167,000 | | 4,566,036 |
GMO Internet, Inc. | 1,200 | | 13,642 |
Hajime Construction Co. Ltd. (d) | 64,200 | | 4,426,686 |
Hamakyorex Co. Ltd. | 81,100 | | 2,243,871 |
Harmonic Drive Systems, Inc. | 206,500 | | 4,445,551 |
Hitachi Capital Corp. | 78,000 | | 2,097,831 |
ISE Chemical Corp. | 432,000 | | 3,733,803 |
Japan Exchange Group, Inc. | 107,800 | | 2,506,150 |
Japan Tobacco, Inc. | 236,400 | | 8,553,823 |
Kansai Paint Co. Ltd. | 286,000 | | 3,842,949 |
KDDI Corp. | 157,100 | | 8,507,985 |
Keyence Corp. | 18,600 | | 7,971,774 |
Message Co. Ltd. | 116,800 | | 3,296,893 |
Miraca Holdings, Inc. | 117,600 | | 5,298,824 |
Miraial Co. Ltd. (d) | 113,600 | | 1,842,693 |
Mitsui Fudosan Co. Ltd. | 252,000 | | 8,347,728 |
MS&AD Insurance Group Holdings, Inc. | 155,700 | | 4,025,990 |
Nihon M&A Center, Inc. | 96,400 | | 7,434,906 |
Nihon Nohyaku Co. Ltd. | 243,000 | | 2,912,642 |
Nihon Parkerizing Co. Ltd. | 203,000 | | 3,965,617 |
Nippon Seiki Co. Ltd. | 412,000 | | 6,717,213 |
Nitori Holdings Co. Ltd. | 58,750 | | 5,511,086 |
Nitta Corp. | 155,100 | | 3,266,807 |
ORIX Corp. | 1,065,300 | | 18,452,154 |
Rakuten, Inc. | 487,300 | | 6,349,344 |
Rinnai Corp. | 49,000 | | 3,792,605 |
Rohto Pharmaceutical Co. Ltd. | 472,000 | | 6,849,809 |
Sanix, Inc. (a) | 202,100 | | 2,187,260 |
Sankyo Seiko Co. Ltd. | 382,200 | | 1,300,377 |
Sega Sammy Holdings, Inc. | 92,100 | | 2,361,034 |
Seven Bank Ltd. | 1,298,000 | | 4,593,954 |
Ship Healthcare Holdings, Inc. | 92,200 | | 3,783,369 |
SoftBank Corp. | 281,900 | | 21,051,984 |
Sony Financial Holdings, Inc. | 171,600 | | 3,204,215 |
Sumitomo Mitsui Financial Group, Inc. | 226,800 | | 10,962,581 |
Toshiba Plant Systems & Services Corp. | 244,000 | | 4,305,224 |
Toyo Engineering Corp. | 660,000 | | 2,812,238 |
Unicharm Corp. (d) | 134,000 | | 8,606,674 |
Yamato Kogyo Co. Ltd. | 91,100 | | 3,376,549 |
TOTAL JAPAN | | 255,950,913 |
Korea (South) - 7.4% |
Hyundai Home Shopping Network Corp. | 17,873 | | 2,829,284 |
Hyundai Motor Co. | 42,049 | | 10,024,115 |
Hyundai Wia Corp. | 12,404 | | 2,138,862 |
Korea Plant Service & Engineering Co. Ltd. | 102,936 | | 5,218,184 |
Korean Reinsurance Co. | 255,290 | | 2,862,534 |
|
| Shares | | Value |
NHN Corp. | 11,974 | | $ 6,735,711 |
Samsung Electronics Co. Ltd. | 15,355 | | 21,196,155 |
Soulbrain Co. Ltd. | 47,213 | | 2,357,802 |
TOTAL KOREA (SOUTH) | | 53,362,647 |
Malaysia - 1.5% |
Bursa Malaysia Bhd | 757,500 | | 1,929,447 |
JobStreet Corp. Bhd | 12,693,400 | | 8,645,908 |
WCT Holdings Bhd | 83,200 | | 64,578 |
TOTAL MALAYSIA | | 10,639,933 |
New Zealand - 0.9% |
Diligent Board Member Services, Inc. (a) | 416,547 | | 1,507,017 |
Ryman Healthcare Group Ltd. | 843,377 | | 5,259,552 |
TOTAL NEW ZEALAND | | 6,766,569 |
Philippines - 0.0% |
Alliance Global Group, Inc. | 42 | | 26 |
Singapore - 4.3% |
CSE Global Ltd. | 5,798,500 | | 4,411,192 |
Global Logistic Properties Ltd. | 2,154,000 | | 5,358,123 |
Goodpack Ltd. | 3,837,800 | | 5,916,428 |
OSIM International Ltd. | 2,739,000 | | 4,652,463 |
Parkway Life REIT | 2,233,000 | | 4,368,210 |
United Overseas Bank Ltd. | 385,000 | | 6,459,024 |
TOTAL SINGAPORE | | 31,165,440 |
Taiwan - 4.4% |
CTCI Corp. | 1,205,000 | | 2,104,196 |
King Slide Works Co. Ltd. | 487,000 | | 4,301,682 |
LITE-ON Technology Corp. | 687 | | 1,200 |
Lung Yen Life Service Co. Ltd. | 542,000 | | 1,638,797 |
Merida Industry Co. Ltd. | 417,000 | | 3,159,198 |
Taiwan Semiconductor Manufacturing Co. Ltd. | 4,007,000 | | 14,740,214 |
Tong Hsing Electronics Industries Ltd. | 1,048,096 | | 5,536,909 |
TOTAL TAIWAN | | 31,482,196 |
Thailand - 1.7% |
Advanced Info Service PCL (For. Reg.) | 403,000 | | 3,301,687 |
Thai Beverage PCL | 7,157,000 | | 3,140,046 |
Toyo-Thai Corp. PCL | 4,548,726 | | 5,626,537 |
TOTAL THAILAND | | 12,068,270 |
United Kingdom - 1.3% |
Daqin Railway Co. Ltd. (A Shares)(UBS Warrant Programme) warrants 3/26/14 (a) | 1,627,847 | | 1,965,863 |
SAIC Motor Corp. Ltd. Class A (UBS Warrant Programme) warrants 9/16/14 (a) | 744,982 | | 1,752,899 |
Standard Chartered PLC (Hong Kong) | 231,500 | | 5,568,780 |
TOTAL UNITED KINGDOM | | 9,287,542 |
United States of America - 0.9% |
AsiaInfo-Linkage, Inc. (a) | 195,800 | | 2,271,280 |
Common Stocks - continued |
| Shares | | Value |
United States of America - continued |
GI Dynamics, Inc. CDI (a) | 4,198,289 | | $ 3,174,410 |
YOU On Demand Holdings, Inc. (a) | 440,068 | | 783,321 |
TOTAL UNITED STATES OF AMERICA | | 6,229,011 |
TOTAL COMMON STOCKS (Cost $567,588,282) |
695,719,285
|
Money Market Funds - 3.4% |
| | | |
Fidelity Cash Central Fund, 0.09% (b) | 15,557,422 | | 15,557,422 |
Fidelity Securities Lending Cash Central Fund, 0.09% (b)(c) | 8,898,828 | | 8,898,828 |
TOTAL MONEY MARKET FUNDS (Cost $24,456,250) |
24,456,250
|
TOTAL INVESTMENT PORTFOLIO - 100.1% (Cost $592,044,532) | | 720,175,535 |
NET OTHER ASSETS (LIABILITIES) - (0.1)% | | (500,466) |
NET ASSETS - 100% | $ 719,675,069 |
Legend |
(a) Non-income producing |
(b) Affiliated fund that is generally available only to investment companies and other accounts managed by Fidelity Investments. The rate quoted is the annualized seven-day yield of the fund at period end. A complete unaudited listing of the fund's holdings as of its most recent quarter end is available upon request. In addition, each Fidelity Central Fund's financial statements, which are not covered by the Fund's Report of Independent Registered Public Accounting Firm, are available on the SEC's website or upon request. |
(c) Investment made with cash collateral received from securities on loan. |
(d) Security or a portion of the security is on loan at period end. |
Affiliated Central Funds |
Information regarding fiscal year to date income earned by the Fund from investments in Fidelity Central Funds is as follows: |
Fund | Income earned |
Fidelity Cash Central Fund | $ 15,215 |
Fidelity Securities Lending Cash Central Fund | 474,733 |
Total | $ 489,948 |
Other Information |
Categorizations in the Schedule of Investments are based on country or territory of incorporation. |
The following is a summary of the inputs used, as of October 31, 2013, involving the Fund's assets and liabilities carried at fair value. The inputs or methodology used for valuing securities may not be an indication of the risk associated with investing in those securities. For more information on valuation inputs, and their aggregation into the levels used in the tables below, please refer to the Investment Valuation section in the accompanying Notes to Financial Statements. |
Valuation Inputs at Reporting Date: |
Description | Total | Level 1 | Level 2 | Level 3 |
Investments in Securities: | | | | |
Equities: | | | | |
Consumer Discretionary | $ 111,768,428 | $ 76,744,047 | $ 30,597,695 | $ 4,426,686 |
Consumer Staples | 70,679,855 | 40,750,008 | 29,929,847 | - |
Energy | 11,915,987 | 11,915,987 | - | - |
Financials | 169,146,904 | 100,572,290 | 68,574,614 | - |
Health Care | 64,089,014 | 36,381,094 | 27,707,920 | - |
Industrials | 99,876,588 | 57,844,105 | 41,213,275 | 819,208 |
Information Technology | 88,206,778 | 63,565,902 | 24,568,323 | 72,553 |
Materials | 30,082,666 | 12,251,103 | 17,831,560 | 3 |
Telecommunication Services | 32,861,656 | 3,301,687 | 29,559,969 | - |
Utilities | 17,091,409 | 17,091,409 | - | - |
Money Market Funds | 24,456,250 | 24,456,250 | - | - |
Total Investments in Securities: | $ 720,175,535 | $ 444,873,882 | $ 269,983,203 | $ 5,318,450 |
The following is a summary of transfers between Level 1 and Level 2 for the period ended October 31, 2013. Transfers are assumed to have occurred at the beginning of the period, and are primarily attributable to the valuation techniques used for foreign equity securities, as discussed in the accompanying Notes to Financial Statements: |
Transfers | Total |
Level 1 to Level 2 | $ 119,727,954 |
Level 2 to Level 1 | $ 0 |
See accompanying notes which are an integral part of the financial statements.
Annual Report
Fidelity Pacific Basin Fund
Statement of Assets and Liabilities
| October 31, 2013 |
| | |
Assets | | |
Investment in securities, at value (including securities loaned of $8,493,940) - See accompanying schedule: Unaffiliated issuers (cost $567,588,282) | $ 695,719,285 | |
Fidelity Central Funds (cost $24,456,250) | 24,456,250 | |
Total Investments (cost $592,044,532) | | $ 720,175,535 |
Foreign currency held at value (cost $11) | | 11 |
Receivable for investments sold | | 7,883,550 |
Receivable for fund shares sold | | 862,228 |
Dividends receivable | | 1,229,033 |
Distributions receivable from Fidelity Central Funds | | 16,101 |
Prepaid expenses | | 2,232 |
Other receivables | | 51,500 |
Total assets | | 730,220,190 |
| | |
Liabilities | | |
Payable for investments purchased | $ 239,094 | |
Payable for fund shares redeemed | 501,302 | |
Accrued management fee | 533,701 | |
Other affiliated payables | 139,763 | |
Other payables and accrued expenses | 232,433 | |
Collateral on securities loaned, at value | 8,898,828 | |
Total liabilities | | 10,545,121 |
| | |
Net Assets | | $ 719,675,069 |
Net Assets consist of: | | |
Paid in capital | | $ 519,489,340 |
Undistributed net investment income | | 2,466,476 |
Accumulated undistributed net realized gain (loss) on investments and foreign currency transactions | | 69,698,394 |
Net unrealized appreciation (depreciation) on investments and assets and liabilities in foreign currencies | | 128,020,859 |
Net Assets, for 22,867,413 shares outstanding | | $ 719,675,069 |
Net Asset Value, offering price and redemption price per share ($719,675,069 ÷ 22,867,413 shares) | | $ 31.47 |
Statement of Operations
| Year ended October 31, 2013 |
| | |
Investment Income | | |
Dividends | | $ 10,950,573 |
Interest | | 55 |
Income from Fidelity Central Funds | | 489,948 |
Income before foreign taxes withheld | | 11,440,576 |
Less foreign taxes withheld | | (670,300) |
Total income | | 10,770,276 |
| | |
Expenses | | |
Management fee Basic fee | $ 4,618,317 | |
Performance adjustment | 1,452,298 | |
Transfer agent fees | 1,326,399 | |
Accounting and security lending fees | 330,745 | |
Custodian fees and expenses | 210,915 | |
Independent trustees' compensation | 3,856 | |
Registration fees | 28,756 | |
Audit | 82,352 | |
Legal | 3,298 | |
Miscellaneous | 5,216 | |
Total expenses before reductions | 8,062,152 | |
Expense reductions | (82,740) | 7,979,412 |
Net investment income (loss) | | 2,790,864 |
Realized and Unrealized Gain (Loss) Net realized gain (loss) on: | | |
Investment securities: | | |
Unaffiliated issuers (net of foreign taxes of $136,077) | 116,529,612 | |
Foreign currency transactions | (259,114) | |
Total net realized gain (loss) | | 116,270,498 |
Change in net unrealized appreciation (depreciation) on: Investment securities (net of increase in deferred foreign taxes of $27,530) | 53,115,359 | |
Assets and liabilities in foreign currencies | 29,562 | |
Total change in net unrealized appreciation (depreciation) | | 53,144,921 |
Net gain (loss) | | 169,415,419 |
Net increase (decrease) in net assets resulting from operations | | $ 172,206,283 |
See accompanying notes which are an integral part of the financial statements.
Annual Report
Fidelity Pacific Basin Fund
Financial Statements - continued
Statement of Changes in Net Assets
| Year ended
October 31,
2013 | Year ended
October 31,
2012 |
Increase (Decrease) in Net Assets | | |
Operations | | |
Net investment income (loss) | $ 2,790,864 | $ 7,891,504 |
Net realized gain (loss) | 116,270,498 | 3,649,505 |
Change in net unrealized appreciation (depreciation) | 53,144,921 | 37,684,059 |
Net increase (decrease) in net assets resulting from operations | 172,206,283 | 49,225,068 |
Distributions to shareholders from net investment income | (6,773,254) | (3,487,165) |
Distributions to shareholders from net realized gain | (10,772,479) | (2,493,225) |
Total distributions | (17,545,733) | (5,980,390) |
Share transactions
Proceeds from sales of shares | 137,800,185 | 39,444,014 |
Reinvestment of distributions | 16,854,631 | 5,724,533 |
Cost of shares redeemed | (170,997,087) | (229,658,785) |
Net increase (decrease) in net assets resulting from share transactions | (16,342,271) | (184,490,238) |
Redemption fees | 103,129 | 45,917 |
Total increase (decrease) in net assets | 138,421,408 | (141,199,643) |
| | |
Net Assets | | |
Beginning of period | 581,253,661 | 722,453,304 |
End of period (including undistributed net investment income of $2,466,476 and undistributed net investment income of $6,554,336, respectively) | $ 719,675,069 | $ 581,253,661 |
Other Information Shares | | |
Sold | 4,984,798 | 1,702,098 |
Issued in reinvestment of distributions | 691,047 | 257,613 |
Redeemed | (6,195,426) | (10,038,333) |
Net increase (decrease) | (519,581) | (8,078,622) |
Financial Highlights
Years ended October 31, | 2013 | 2012 | 2011 | 2010 | 2009 |
Selected Per-Share Data | | | | | |
Net asset value, beginning of period | $ 24.85 | $ 22.96 | $ 25.11 | $ 19.88 | $ 12.84 |
Income from Investment Operations | | | | | |
Net investment income (loss) B | .12 | .30 | .21 | .21 | .20 |
Net realized and unrealized gain (loss) | 7.26 | 1.79 | (1.51) | 5.86 | 6.90 |
Total from investment operations | 7.38 | 2.09 | (1.30) | 6.07 | 7.10 |
Distributions from net investment income | (.29) | (.12) | (.20) | (.15) | (.07) |
Distributions from net realized gain | (.47) | (.08) | (.66) | (.70) | - |
Total distributions | (.76) | (.20) | (.86) | (.85) | (.07) |
Redemption fees added to paid in capital B | - F | - F | .01 | .01 | .01 |
Net asset value, end of period | $ 31.47 | $ 24.85 | $ 22.96 | $ 25.11 | $ 19.88 |
Total Return A | 30.58% | 9.22% | (5.44)% | 31.65% | 55.77% |
Ratios to Average Net Assets C, E | | | | | |
Expenses before reductions | 1.23% | 1.28% | 1.14% | 1.07% | .90% |
Expenses net of fee waivers, if any | 1.22% | 1.28% | 1.13% | 1.07% | .90% |
Expenses net of all reductions | 1.21% | 1.26% | 1.10% | 1.03% | .85% |
Net investment income (loss) | .42% | 1.29% | .81% | .95% | 1.30% |
Supplemental Data | | | | | |
Net assets, end of period (000 omitted) | $ 719,675 | $ 581,254 | $ 722,453 | $ 836,913 | $ 609,209 |
Portfolio turnover rate D | 82% | 26% | 59% | 66% | 91% |
ATotal returns would have been lower if certain expenses had not been reduced during the applicable periods shown. BCalculated based on average shares outstanding during the period. CFees and expenses of any underlying Fidelity Central Funds are not included in the Fund's expense ratio. The Fund indirectly bears its proportionate share of the expenses of any underlying Fidelity Central Funds. DAmount does not include the portfolio activity of any underlying Fidelity Central Funds. EExpense ratios reflect operating expenses of the Fund. Expenses before reductions do not reflect amounts reimbursed by the investment adviser or reductions from brokerage service arrangements or reductions from other expense offset arrangements and do not represent the amount paid by the Fund during periods when reimbursements or reductions occur. Expenses net of fee waivers reflect expenses after reimbursement by the investment adviser but prior to reductions from brokerage service arrangements or other expense offset arrangements. Expenses net of all reductions represent the net expenses paid by the Fund. FAmount represents less than $.01 per share. |
See accompanying notes which are an integral part of the financial statements.
Annual Report
Notes to Financial Statements
For the period ended October 31, 2013
1. Organization.
Fidelity Pacific Basin Fund (the Fund) is a fund of Fidelity Investment Trust (the Trust) and is authorized to issue an unlimited number of shares. The Trust is registered under the Investment Company Act of 1940, as amended (the 1940 Act), as an open-end management investment company organized as a Massachusetts business trust. The Fund's investments in emerging markets can be subject to social, economic, regulatory, and political uncertainties and can be extremely volatile.
2. Investments in Fidelity Central Funds.
The Fund invests in Fidelity Central Funds, which are open-end investment companies generally available only to other investment companies and accounts managed by Fidelity Management & Research Company (FMR) and its affiliates. The Fund's Schedule of Investments lists each of the Fidelity Central Funds held as of period end, if any, as an investment of the Fund, but does not include the underlying holdings of each Fidelity Central Fund. As an Investing Fund, the Fund indirectly bears its proportionate share of the expenses of the underlying Fidelity Central Funds.
The Money Market Central Funds seek preservation of capital and current income and are managed by Fidelity Investments Money Management, Inc. (FIMM), an affiliate of FMR.
A complete unaudited list of holdings for each Fidelity Central Fund is available upon request or at the Securities and Exchange Commission (the SEC) website at www.sec.gov. In addition, the financial statements of the Fidelity Central Funds, which are not covered by the Fund's Report of Independent Registered Public Accounting Firm, are available on the SEC website or upon request.
3. Significant Accounting Policies.
The financial statements have been prepared in conformity with accounting principles generally accepted in the United States of America (GAAP), which require management to make certain estimates and assumptions at the date of the financial statements. Actual results could differ from those estimates. Subsequent events, if any, through the date that the financial statements were issued have been evaluated in the preparation of the financial statements. The following summarizes the significant accounting policies of the Fund:
Investment Valuation. Investments are valued as of 4:00 p.m. Eastern time on the last calendar day of the period. In accordance with valuation policies and procedures approved by the Board of Trustees (the Board), the Fund attempts to obtain prices from one or more third party pricing vendors or brokers to value its investments. When current market prices, quotations or currency exchange rates are not readily available or reliable, investments will be fair valued in good faith by the FMR Fair Value Committee (the Committee), in accordance with procedures adopted by the Board. Factors used in determining fair value vary by investment type and may include market or investment specific events. The frequency with which these procedures are used cannot be predicted and they may be utilized to a significant extent. The Committee oversees the Fund's valuation policies and procedures and is responsible for approving and reporting to the Board all fair value determinations.
The Fund categorizes the inputs to valuation techniques used to value its investments into a disclosure hierarchy consisting of three levels as shown below:
Level 1 - quoted prices in active markets for identical investments
Level 2 - other significant observable inputs (including quoted prices for similar investments, interest rates, prepayment speeds, etc.)
Level 3 - unobservable inputs (including the Fund's own assumptions based on the best information available)
Valuation techniques used to value the Fund's investments by major category are as follows:
Equity securities, including restricted securities, for which market quotations are readily available, are valued at the last reported sale price or official closing price as reported by a third party pricing vendor on the primary market or exchange on which they are traded and are categorized as Level 1 in the hierarchy. In the event there were no sales during the day or closing prices are not available, securities are valued at the last quoted bid price or may be valued using the last available price and are generally categorized as Level 2 in the hierarchy. For foreign equity securities, when market or security specific events arise, comparisons to the valuation of American Depositary Receipts (ADRs), futures contracts, Exchange-Traded Funds (ETFs) and certain indexes as well as quoted prices for similar securities may be used and would be categorized as Level 2 in the hierarchy. Utilizing these techniques may result in transfers between Level 1 and Level 2. For equity securities, including restricted securities, where observable inputs are limited, assumptions about market activity and risk are used and these securities may be categorized as Level 3 in the hierarchy.
Investments in open-end mutual funds, including the Fidelity Central Funds, are valued at their closing net asset value (NAV) each business day and are categorized as Level 1 in the hierarchy.
Annual Report
3. Significant Accounting Policies - continued
Investment Valuation - continued
Changes in valuation techniques may result in transfers in or out of an assigned level within the disclosure hierarchy. The aggregate value of investments by input level, as of October 31, 2013, including information on transfers between Levels 1 and 2 is included at the end of the Fund's Schedule of Investments.
Foreign Currency. The Fund may use foreign currency contracts to facilitate transactions in foreign-denominated securities. Gains and losses from these transactions may arise from changes in the value of the foreign currency or if the counterparties do not perform under the contracts' terms.
Foreign-denominated assets, including investment securities, and liabilities are translated into U.S. dollars at the exchange rates at period end. Purchases and sales of investment securities, income and dividends received and expenses denominated in foreign currencies are translated into U.S. dollars at the exchange rate in effect on the transaction date.
The effects of exchange rate fluctuations on investments are included with the net realized and unrealized gain (loss) on investment securities. Other foreign currency transactions resulting in realized and unrealized gain (loss) are disclosed separately.
Investment Transactions and Income. For financial reporting purposes, the Fund's investment holdings and NAV include trades executed through the end of the last business day of the period. The NAV per share for processing shareholder transactions is calculated as of the close of business of the New York Stock Exchange (NYSE), normally 4:00 p.m. Eastern time and includes trades executed through the end of the prior business day. Gains and losses on securities sold are determined on the basis of identified cost. Dividend income is recorded on the ex-dividend date, except for certain dividends from foreign securities where the ex-dividend date may have passed, which are recorded as soon as the Fund is informed of the ex-dividend date. Non-cash dividends included in dividend income, if any, are recorded at the fair market value of the securities received. Distributions received on securities that represent a return of capital or capital gain are recorded as a reduction of cost of investments and/or as a realized gain. Subsequent to ex-dividend date the Fund determines the components of these distributions, based upon receipt of tax filings or other correspondence relating to the underlying investment. Interest income and distributions from the Fidelity Central Funds are accrued as earned. Interest income includes coupon interest and amortization of premium and accretion of discount on debt securities. Investment income is recorded net of foreign taxes withheld where recovery of such taxes is uncertain.
Expenses. Expenses directly attributable to a fund are charged to that fund. Expenses attributable to more than one fund are allocated among the respective funds on the basis of relative net assets or other appropriate methods. Expense estimates are accrued in the period to which they relate and adjustments are made when actual amounts are known.
Income Tax Information and Distributions to Shareholders. Each year, the Fund intends to qualify as a regulated investment company under Subchapter M of the Internal Revenue Code, including distributing substantially all of its taxable income and realized gains. As a result, no provision for U.S. Federal income taxes is required. As of October 31, 2013, the Fund did not have any unrecognized tax benefits in the financial statements; nor is the Fund aware of any tax positions for which it is reasonably possible that the total amounts of unrecognized tax benefits will significantly change in the next twelve months. The Fund files a U.S. federal tax return, in addition to state and local tax returns as required. The Fund's federal income tax returns are subject to examination by the Internal Revenue Service (IRS) for a period of three fiscal years after they are filed. State and local tax returns may be subject to examination for an additional fiscal year depending on the jurisdiction. Foreign taxes are provided for based on the Fund's understanding of the tax rules and rates that exist in the foreign markets in which it invests. The Fund is subject to a tax imposed on capital gains by certain countries in which it invests. An estimated deferred tax liability for net unrealized appreciation on the applicable securities is included in Other payables and accrued expenses on the Statement of Assets & Liabilities.
Distributions are declared and recorded on the ex-dividend date. Income and capital gain distributions are determined in accordance with income tax regulations, which may differ from GAAP. In addition, the Fund claimed a portion of the payment made to redeeming shareholders as a distribution for income tax purposes.
Capital accounts within the financial statements are adjusted for permanent book-tax differences. These adjustments have no impact on net assets or the results of operations. Temporary book-tax differences will reverse in a subsequent period.
Book-tax differences are primarily due to foreign currency transactions, certain foreign taxes, passive foreign investment companies (PFIC), deferred trustees compensation, capital loss carryforwards and losses deferred due to wash sales.
Annual Report
Notes to Financial Statements - continued
3. Significant Accounting Policies - continued
Income Tax Information and Distributions to Shareholders - continued
The federal tax cost of investment securities and unrealized appreciation (depreciation) as of period end were as follows:
Gross unrealized appreciation | $ 127,733,391 |
Gross unrealized depreciation | (20,192,976) |
Net unrealized appreciation (depreciation) on securities and other investments | $ 107,540,415 |
| |
Tax Cost | $ 612,635,120 |
The tax-based components of distributable earnings as of period end were as follows:
Undistributed ordinary income | $ 23,518,253 |
Undistributed long-term capital gain | $ 69,237,727 |
Net unrealized appreciation (depreciation) | $ 107,534,410 |
The tax character of distributions paid was as follows:
| October 31, 2013 | October 31, 2012 |
Ordinary Income | $ 17,545,733 | $ 5,980,390 |
Short-Term Trading (Redemption) Fees. Shares held by investors in the Fund less than 90 days may have been subject to a redemption fee equal to 1.50% of the net asset value of shares redeemed. All redemption fees, which reduce the proceeds of the shareholder redemption, are retained by the Fund and accounted for as an addition to paid in capital.
4. Purchases and Sales of Investments.
Purchases and sales of securities, other than short-term securities, aggregated $526,082,267 and $578,341,554, respectively.
5. Fees and Other Transactions with Affiliates.
Management Fee. FMR and its affiliates provide the Fund with investment management related services for which the Fund pays a monthly management fee. The management fee is the sum of an individual fund fee rate that is based on an annual rate of .45% of the Fund's average net assets and an annualized group fee rate that averaged .25% during the period. The group fee rate is based upon the average net assets of all the mutual funds advised by FMR, including any mutual funds previously advised by FMR that are currently advised by Fidelity SelectCo, LLC, an affiliate of FMR. The group fee rate decreases as assets under management increase and increases as assets under management decrease. In addition, the management fee is subject to a performance adjustment (up to a maximum of ± .20% of the Fund's average net assets over a 36 month performance period). The upward or downward adjustment to the management fee is based on the Fund's relative investment performance as compared to an appropriate benchmark index over the same 36 month performance period. For the reporting period, the total annual management fee rate, including the performance adjustment, was .92% of the Fund's average net assets. The performance adjustment included in the management fee rate may be higher or lower than the maximum performance adjustment rate due to the difference between the average net assets for the reporting and performance periods.
Transfer Agent Fees. Fidelity Investments Institutional Operations Company, Inc. (FIIOC), an affiliate of FMR, is the Fund's transfer, dividend disbursing and shareholder servicing agent. FIIOC receives account fees and asset-based fees that vary according to account size and type of account. FIIOC pays for typesetting, printing and mailing of shareholder reports, except proxy statements. For the period, the transfer agent fees were equivalent to an annual rate of .20% of average net assets.
Accounting and Security Lending Fees. Fidelity Service Company, Inc. (FSC), an affiliate of FMR, maintains the Fund's accounting records. The accounting fee is based on the level of average net assets for each month. Under a separate contract, FSC administers the security lending program. The security lending fee is based on the number and duration of lending transactions.
Brokerage Commissions. The Fund placed a portion of its portfolio transactions with brokerage firms which are affiliates of the investment adviser. Brokerage commissions are included in net realized gain (loss) and change in net unrealized appreciation (depreciation) in the Statement of Operations. The commissions paid to these affiliated firms were $2,877 for the period.
Annual Report
6. Committed Line of Credit.
The Fund participates with other funds managed by FMR or an affiliate in a $4.25 billion credit facility (the "line of credit") to be utilized for temporary or emergency purposes to fund shareholder redemptions or for other short-term liquidity purposes. The Fund has agreed to pay commitment fees on its pro-rata portion of the line of credit, which amounted to $1,395 and is reflected in Miscellaneous expenses on the Statement of Operations. During the period, there were no borrowings on this line of credit.
7. Security Lending.
The Fund lends portfolio securities through a lending agent from time to time in order to earn additional income. For equity securities, a lending agent is used and may loan securities to certain qualified borrowers, including Fidelity Capital Markets (FCM), a broker-dealer affiliated with the Fund. On the settlement date of the loan, the Fund receives collateral (in the form of U.S. Treasury obligations, letters of credit and/or cash) against the loaned securities and maintains collateral in an amount not less than 100% of the market value of the loaned securities during the period of the loan. The market value of the loaned securities is determined at the close of business of the Fund and any additional required collateral is delivered to the Fund on the next business day. If the borrower defaults on its obligation to return the securities loaned because of insolvency or other reasons, the Fund may apply collateral received from the borrower against the obligation. The Fund may experience delays and costs in recovering the securities loaned. Any cash collateral received is invested in the Fidelity Securities Lending Cash Central Fund. The value of loaned securities and cash collateral at period end are disclosed on the Fund's Statement of Assets and Liabilities. At period end, there were no security loans outstanding with FCM. Security lending income represents the income earned on investing cash collateral, less rebates paid to borrowers and any lending agent fees associated with the loan, plus any premium payments received for lending certain types of securities. Security lending income is presented in the Statement of Operations as a component of income from Fidelity Central Funds. Total security lending income during the period amounted to $474,733, including $16,936 from securities loaned to FCM.
8. Expense Reductions.
Commissions paid to certain brokers with whom FMR, or its affiliates, places trades on behalf of the Fund include an amount to the Fund in addition to trade execution, which may be rebated back to the Fund to offset certain expenses. This amount totaled $59,893 for the period.
In addition, FMR reimbursed a portion of the Fund's operating expenses during the period in the amount of $22,847.
9. Other.
The Fund's organizational documents provide former and current trustees and officers with a limited indemnification against liabilities arising in connection with the performance of their duties to the Fund. In the normal course of business, the Fund may also enter into contracts that provide general indemnifications. The Fund's maximum exposure under these arrangements is unknown as this would be dependent on future claims that may be made against the Fund. The risk of material loss from such claims is considered remote.
Annual Report
Report of Independent Registered Public Accounting Firm
To the Trustees of Fidelity Investment Trust and the Shareholders of Fidelity Canada Fund, Fidelity China Region Fund, Fidelity Emerging Asia Fund, Fidelity Emerging Markets Fund, Fidelity Europe Fund, Fidelity Japan Fund, Fidelity Japan Smaller Companies Fund, Fidelity Latin America Fund, Fidelity Nordic Fund, Fidelity Pacific Basin Fund:
In our opinion, the accompanying statements of assets and liabilities, including the schedules of investments, and the related statements of operations and of changes in net assets and the financial highlights present fairly, in all material respects, the financial position of Fidelity Canada Fund, Fidelity China Region Fund, Fidelity Emerging Asia Fund, Fidelity Emerging Markets Fund, Fidelity Europe Fund, Fidelity Japan Fund, Fidelity Japan Smaller Companies Fund, Fidelity Latin America Fund, Fidelity Nordic Fund, Fidelity Pacific Basin Fund (each a fund of Fidelity Investment Trust) at October 31, 2013, the results of their operations for the year then ended, the changes in their net assets for each of the two years in the period then ended and the financial highlights for each of the periods indicated, in conformity with accounting principles generally accepted in the United States of America. These financial statements and financial highlights (hereafter referred to as "financial statements") are the responsibility of the Fidelity Investment Trust's management. Our responsibility is to express an opinion on these financial statements based on our audits. We conducted our audits of these financial statements in accordance with the standards of the Public Company Accounting Oversight Board (United States). Those standards require that we plan and perform the audit to obtain reasonable assurance about whether the financial statements are free of material misstatement. An audit includes examining, on a test basis, evidence supporting the amounts and disclosures in the financial statements, assessing the accounting principles used and significant estimates made by management, and evaluating the overall financial statement presentation. We believe that our audits, which included confirmation of securities at October 31, 2013 by correspondence with the custodian and brokers, provide a reasonable basis for our opinion.
PricewaterhouseCoopers LLP
Boston, Massachusetts
December 16, 2013
Annual Report
Report of Independent Registered Public Accounting Firm
To the Trustees of Fidelity Investment Trust and Shareholders of Fidelity Europe Capital Appreciation Fund:
We have audited the accompanying statement of assets and liabilities of Fidelity Europe Capital Appreciation Fund (the Fund), a fund of Fidelity Investment Trust, including the schedule of investments, as of October 31, 2013, and the related statement of operations for the year then ended, the statement of changes in net assets for each of the two years in the period then ended, and the financial highlights for each of the five years in the period then ended. These financial statements and financial highlights are the responsibility of the Fund's management. Our responsibility is to express an opinion on these financial statements and financial highlights based on our audits.
We conducted our audits in accordance with the standards of the Public Company Accounting Oversight Board (United States). Those standards require that we plan and perform the audit to obtain reasonable assurance about whether the financial statements and financial highlights are free of material misstatement. The Fund is not required to have, nor were we engaged to perform, an audit of its internal control over financial reporting. Our audits included consideration of internal control over financial reporting as a basis for designing audit procedures that are appropriate in the circumstances, but not for the purpose of expressing an opinion on the effectiveness of the Fund's internal control over financial reporting. Accordingly, we express no such opinion. An audit also includes examining, on a test basis, evidence supporting the amounts and disclosures in the financial statements, assessing the accounting principles used and significant estimates made by management, as well as evaluating the overall financial statement presentation. Our procedures included confirmation of securities owned as of October 31, 2013, by correspondence with the custodians and brokers; where replies were not received from brokers, we performed other auditing procedures. We believe that our audits provide a reasonable basis for our opinion.
In our opinion, the financial statements and financial highlights referred to above present fairly, in all material respects, the financial position of Fidelity Europe Capital Appreciation Fund as of October 31, 2013, the results of its operations for the year then ended, the changes in its net assets for each of the two years in the period then ended, and the financial highlights for each of the five years in the period then ended, in conformity with accounting principles generally accepted in the United States of America.
DELOITTE & TOUCHE LLP
Boston, Massachusetts
December 16, 2013
Annual Report
The Trustees, Member of the Advisory Board, and executive officers of the trust and funds, as applicable, are listed below. The Board of Trustees governs each fund and is responsible for protecting the interests of shareholders. The Trustees are experienced executives who meet periodically throughout the year to oversee each fund's activities, review contractual arrangements with companies that provide services to each fund, oversee management of the risks associated with such activities and contractual arrangements, and review each fund's performance. Except for James C. Curvey, Ned C. Lautenbach, Ronald P. O'Hanley, and William S. Stavropoulos, each of the Trustees oversees 171 funds. Mr. Curvey oversees 394 funds. Mr. Lautenbach, Mr. O'Hanley, and Mr. Stavropoulos each oversees 245 funds.
The Trustees hold office without limit in time except that (a) any Trustee may resign; (b) any Trustee may be removed by written instrument, signed by at least two-thirds of the number of Trustees prior to such removal; (c) any Trustee who requests to be retired or who has become incapacitated by illness or injury may be retired by written instrument signed by a majority of the other Trustees; and (d) any Trustee may be removed at any special meeting of shareholders by a two-thirds vote of the outstanding voting securities of the trust. Each Trustee who is not an interested person of the trust and the funds (as defined in the 1940 Act) (Independent Trustee), shall retire not later than the last day of the calendar year in which his or her 75th birthday occurs. The Independent Trustees may waive this mandatory retirement age policy with respect to individual Trustees. The executive officers and Advisory Board Member hold office without limit in time, except that any officer and Advisory Board Member may resign or may be removed by a vote of a majority of the Trustees at any regular meeting or any special meeting of the Trustees. Except as indicated, each individual has held the office shown or other offices in the same company for the past five years.
Experience, Skills, Attributes, and Qualifications of the Funds' Trustees. The Governance and Nominating Committee has adopted a statement of policy that describes the experience, qualifications, attributes, and skills that are necessary and desirable for potential Independent Trustee candidates (Statement of Policy). The Board believes that each Trustee satisfied at the time he or she was initially elected or appointed a Trustee, and continues to satisfy, the standards contemplated by the Statement of Policy. The Governance and Nominating Committee also engages professional search firms to help identify potential Independent Trustee candidates who have the experience, qualifications, attributes, and skills consistent with the Statement of Policy. From time to time, additional criteria based on the composition and skills of the current Independent Trustees, as well as experience or skills that may be appropriate in light of future changes to board composition, business conditions, and regulatory or other developments, have also been considered by the professional search firms and the Governance and Nominating Committee. In addition, the Board takes into account the Trustees' commitment and participation in Board and committee meetings, as well as their leadership of standing and ad hoc committees throughout their tenure.
In determining that a particular Trustee was and continues to be qualified to serve as a Trustee, the Board has considered a variety of criteria, none of which, in isolation, was controlling. The Board believes that, collectively, the Trustees have balanced and diverse experience, qualifications, attributes, and skills, which allow the Board to operate effectively in governing each fund and protecting the interests of shareholders. Information about the specific experience, skills, attributes, and qualifications of each Trustee, which in each case led to the Board's conclusion that the Trustee should serve (or continue to serve) as a trustee of the funds, is provided below.
Board Structure and Oversight Function. James C. Curvey is an interested person (as defined in the 1940 Act) and currently serves as Chairman. The Trustees have determined that an interested Chairman is appropriate and benefits shareholders because an interested Chairman has a personal and professional stake in the quality and continuity of services provided to the funds. Independent Trustees exercise their informed business judgment to appoint an individual of their choosing to serve as Chairman, regardless of whether the Trustee happens to be independent or a member of management. The Independent Trustees have determined that they can act independently and effectively without having an Independent Trustee serve as Chairman and that a key structural component for assuring that they are in a position to do so is for the Independent Trustees to constitute a substantial majority for the Board. The Independent Trustees also regularly meet in executive session. Ned C. Lautenbach serves as Chairman of the Independent Trustees and as such (i) acts as a liaison between the Independent Trustees and management with respect to matters important to the Independent Trustees and (ii) with management prepares agendas for Board meetings.
Fidelity funds are overseen by different Boards of Trustees. The funds' Board oversees Fidelity's equity and high income funds and another Board oversees Fidelity's investment-grade bond, money market, and asset allocation funds. The asset allocation funds may invest in Fidelity funds overseen by the funds' Board. The use of separate Boards, each with its own committee structure, allows the Trustees of each group of Fidelity funds to focus on the unique issues of the funds they oversee, including common research, investment, and operational issues. On occasion, the separate Boards establish joint committees to address issues of overlapping consequences for the Fidelity funds overseen by each Board.
The Trustees operate using a system of committees to facilitate the timely and efficient consideration of all matters of importance to the Trustees, each fund, and fund shareholders and to facilitate compliance with legal and regulatory requirements and oversight of the funds' activities and associated risks. The Board, acting through its committees, has charged FMR and its affiliates with (i) identifying events or circumstances the occurrence of which could have demonstrably adverse effects on the funds' business and/or reputation; (ii) implementing processes and controls to lessen the possibility that such events or circumstances occur or to mitigate the effects of such events or circumstances if they do occur; and (iii) creating and maintaining a system designed to evaluate continuously business and market conditions in order to facilitate the identification and implementation processes described in (i) and (ii) above. Because the day-to-day operations and activities of the funds are carried out by or through FMR, its affiliates and other service providers, the funds' exposure to risks is mitigated but not eliminated by the processes overseen by the Trustees. While each of the Board's committees has responsibility for overseeing different aspects of the funds' activities, oversight is exercised primarily through the Operations, Audit, and Compliance Committees. In addition, the Independent Trustees have worked with FMR to enhance the Board's oversight of investment and financial risks, legal and regulatory risks, technology risks, and operational risks, including the development of additional risk reporting to the Board. For example, a working group comprised of Independent Trustees and FMR has worked and continues to work to review the Fidelity funds' valuation-related activities, reporting and risk management. Appropriate personnel, including but not limited to the funds' Chief Compliance Officer (CCO), FMR's internal auditor, the independent accountants, the funds' Treasurer and portfolio management personnel, make periodic reports to the Board's committees, as appropriate, including an annual review of FMR's risk management program for the Fidelity funds. The responsibilities of each standing committee, including their oversight responsibilities, are described further under "Standing Committees of the Funds' Trustees."
Annual Report
Trustees and Officers - continued
The funds' Statement of Additional Information (SAI) includes more information about the Trustees. To request a free copy, call Fidelity at 1-800-544-8544.
Interested Trustees*:
Correspondence intended for each Trustee who is an interested person may be sent to Fidelity Investments, 245 Summer Street, Boston, Massachusetts 02210.
Name, Year of Birth; Principal Occupations and Other Relevant Experience+ |
James C. Curvey (1935) |
Year of Election or Appointment: 2007 Trustee Chairman of the Board of Trustees |
| Mr. Curvey also serves as Trustee of other Fidelity funds. Mr. Curvey is a Director of Fidelity Investments Money Management, Inc. (2009-present), Director of Fidelity Research & Analysis Co. (2009-present) and Director of FMR and FMR Co., Inc. (2007-present). Mr. Curvey is also Vice Chairman (2007-present) and Director of FMR LLC. In addition, Mr. Curvey serves as an Overseer for the Boston Symphony Orchestra and a member of the Trustees of Villanova University. Previously, Mr. Curvey was the Vice Chairman (2006-2007) and Director (2000-2007) of FMR Corp. |
Ronald P. O'Hanley (1957) |
Year of Election or Appointment: 2011 Trustee |
| Mr. O'Hanley also serves as Trustee of other Fidelity funds. He is Director of Fidelity SelectCo, LLC (2013-present), FMR Co., Inc. (2010-present), Director of Fidelity Investments Money Management, Inc. (2010-present), Director of Fidelity Research & Analysis Company (2010-present), President of Fidelity Asset Management and Corporate Services and a Member of Fidelity's Executive Committee (2010-present). Previously, Mr. O'Hanley served as President and Chief Executive Officer of BNY Mellon Asset Management (2007-2010). Mr. O'Hanley also served as Vice Chairman of Bank New York Mellon Corp. and a member of that firm's Executive Committee. Prior to the 2007 merger of The Bank of New York and Mellon Financial Corporation, he was Vice Chairman of Mellon Financial Corporation and President and Chief Executive Officer of Mellon Asset Management. He joined Mellon in February 1997. Mr. O'Hanley currently serves as Chairman of the Boston Public Library Foundation Board of Directors and sits on the Board of Directors of Beth Israel Deaconess Medical Center, the Board of Trustees of the Marine Biological Laboratory and the Advisory Board of the Maxwell School of Citizenship and Public Administration at Syracuse University. Mr. O'Hanley also chairs the Council on Asset Management for the Financial Services Roundtable and is a member of the Board of Directors of Institutional Investor's U.S. Institute. |
* Trustees have been determined to be "Interested Trustees" by virtue of, among other things, their affiliation with the trust or various entities under common control with FMR.
+ The information above includes each Trustee's principal occupation during the last five years and other information relating to the experience, attributes, and skills relevant to each Trustee's qualifications to serve as a Trustee, which led to the conclusion that each Trustee should serve as a Trustee for each fund.
Annual Report
Independent Trustees:
Correspondence intended for each Independent Trustee (that is, the Trustees other than the Interested Trustees) may be sent to Fidelity Investments, P.O. Box 55235, Boston, Massachusetts 02205-5235.
Name, Year of Birth; Principal Occupations and Other Relevant Experience+ |
Dennis J. Dirks (1948) |
Year of Election or Appointment: 2005 Trustee |
| Mr. Dirks also serves as Trustee of other Fidelity funds. Prior to his retirement in May 2003, Mr. Dirks was Chief Operating Officer and a member of the Board of The Depository Trust & Clearing Corporation (DTCC). He also served as President, Chief Operating Officer, and Board member of The Depository Trust Company (DTC) and President and Board member of the National Securities Clearing Corporation (NSCC). In addition, Mr. Dirks served as Chief Executive Officer and Board member of the Government Securities Clearing Corporation, Chief Executive Officer and Board member of the Mortgage-Backed Securities Clearing Corporation, as a Trustee and a member of the Finance Committee of Manhattan College (2005-2008), and as a Trustee and a member of the Finance Committee of AHRC of Nassau County (2006-2008). Mr. Dirks is a member of the Independent Directors Council (IDC) Governing Council (2010-present) and Board of Directors for The Brookville Center for Children's Services, Inc. (2009-present). |
Alan J. Lacy (1953) |
Year of Election or Appointment: 2008 Trustee |
| Mr. Lacy also serves as Trustee of other Fidelity funds. Mr. Lacy serves as Senior Adviser (2007-present) of Oak Hill Capital Partners, L.P. (private equity). Mr. Lacy also served as Chief Executive Officer (2000-2005) and Vice Chairman (2005-2006) of Sears Holdings Corporation and Sears, Roebuck and Co. (retail). In addition, Mr. Lacy serves as a member of the Board of Directors of Dave & Buster's Entertainment, Inc. (restaurant and entertainment complexes, 2010-present), Earth Fare, Inc. (retail grocery, 2012-present), The Hillman Companies, Inc. (hardware wholesalers, 2010-present), and Bristol-Myers Squibb Company (global pharmaceuticals, 2008-present). Mr. Lacy is a member of the Board of Trustees of The National Parks Conservation Association (2006-present). Previously, Mr. Lacy served as Chairman of the Board of Trustees of the National Parks Conservation Association (2008-2011) and as a member of the Board of Directors for the Western Union Company (global money transfer, 2006-2011). |
Ned C. Lautenbach (1944) |
Year of Election or Appointment: 2000 Trustee Chairman of the Independent Trustees |
| Mr. Lautenbach also serves as Trustee of other Fidelity funds. Mr. Lautenbach currently serves as the Lead Director of the Eaton Corporation Board of Directors (diversified industrial, 1997-present). Mr. Lautenbach is Chairman of the Board of Directors of the Philharmonic Center for the Arts in Naples, Florida (2012-present) and a member of the Council on Foreign Relations (1994-present). Previously, Mr. Lautenbach was a Partner/Advisory Partner at Clayton, Dubilier & Rice, LLC (private equity investment, 1998-2010), as well as a Director of Sony Corporation (2006-2007). |
Joseph Mauriello (1944) |
Year of Election or Appointment: 2008 Trustee |
| Mr. Mauriello also serves as Trustee of other Fidelity funds. Prior to his retirement in January 2006, Mr. Mauriello served in numerous senior management positions including Deputy Chairman and Chief Operating Officer (2004-2005), and Vice Chairman of Financial Services (2002-2004) of KPMG LLP US (professional services, 1965-2005). Mr. Mauriello currently serves as a member of the Board of Directors of XL Group plc. (global insurance and re-insurance, 2006-present). Previously, Mr. Mauriello served as a Director of the Hamilton Funds of the Bank of New York (2006-2007) and of Arcadia Resources Inc. (health care services and products, 2007-2012). |
Robert W. Selander (1950) |
Year of Election or Appointment: 2011 Trustee |
| Mr. Selander also serves as Trustee of other Fidelity funds. Previously, Mr. Selander served as a Member of the Advisory Board of other Fidelity funds (2011), and Executive Vice Chairman (2010), Chief Executive Officer (2009-2010), and President and Chief Executive Officer (1997-2009) of Mastercard, Inc. |
Cornelia M. Small (1944) |
Year of Election or Appointment: 2005 Trustee |
| Ms. Small also serves as Trustee of other Fidelity funds. Ms. Small is a member of the Board of Directors (2009-present) and Chair of the Investment Committee (2010-present) of the Teagle Foundation. Ms. Small also serves on the Investment Committee of the Berkshire Taconic Community Foundation (2008-present). Previously, Ms. Small served as Chairperson (2002-2008) and a member of the Investment Committee and Chairperson (2008-2012) and a member of the Board of Trustees of Smith College. In addition, Ms. Small served as Chief Investment Officer, Director of Global Equity Investments, and a member of the Board of Directors of Scudder, Stevens & Clark and Scudder Kemper Investments. |
William S. Stavropoulos (1939) |
Year of Election or Appointment: 2001 Trustee Vice Chairman of the Independent Trustees |
| Mr. Stavropoulos also serves as Trustee of other Fidelity funds. Mr. Stavropoulos serves as President and Founder of the Michigan Baseball Foundation, the Great Lakes Loons (2007-present). Mr. Stavropoulos is Chairman Emeritus of the Board of Directors of The Dow Chemical Company, where he previously served in numerous senior management positions, including President, CEO (1995-2000; 2002-2004), Chairman of the Executive Committee (2000-2006), and as a member of the Board of Directors (1990-2006). Currently, Mr. Stavropoulos is Chairman of the Board of Directors of Univar Inc. (global distributor of commodity and specialty chemicals), a Director of Teradata Corporation (data warehousing and technology solutions), and Maersk Inc. (industrial conglomerate), and a member of the Advisory Board for Metalmark Capital LLC (private equity investment, 2005-present). Mr. Stavropoulos is an operating advisor to Clayton, Dubilier & Rice, LLC (private equity investment). In addition, Mr. Stavropoulos is a member of the University of Notre Dame Advisory Council for the College of Science, a Trustee of the Rollin L. Gerstacker Foundation, and a Director of the Naples Philharmonic Center for the Arts. Previously, Mr. Stavropoulos served as a Director of Chemical Financial Corporation (bank holding company, 1993-2012) and Tyco International, Ltd. (multinational manufacturing and services, 2007-2012). |
David M. Thomas (1949) |
Year of Election or Appointment: 2008 Trustee |
| Mr. Thomas also serves as Trustee of other Fidelity funds. Mr. Thomas serves as Non-Executive Chairman of the Board of Directors of Fortune Brands Home and Security (home and security products, 2011-present), and as a member of the Board of Directors of Interpublic Group of Companies, Inc. (marketing communication, 2004-present). Previously, Mr. Thomas served as Executive Chairman (2005-2006) and Chairman and Chief Executive Officer (2000-2005) of IMS Health, Inc. (pharmaceutical and healthcare information solutions), and a Director of Fortune Brands, Inc. (consumer products, 2000-2011). |
+ The information above includes each Trustee's principal occupation during the last five years and other information relating to the experience, attributes, and skills relevant to each Trustee's qualifications to serve as a Trustee, which led to the conclusion that each Trustee should serve as a Trustee for each fund.
Advisory Board Member and Executive Officers:
Correspondence intended for each executive officer and Peter S. Lynch may be sent to Fidelity Investments, 245 Summer Street, Boston, Massachusetts 02210. Executive officers appear below in alphabetical order.
Name, Year of Birth; Principal Occupation |
Peter S. Lynch (1944) |
Year of Election or Appointment: 2003 Member of the Advisory Board |
| Mr. Lynch also serves as Member of the Advisory Board of other Fidelity funds. Mr. Lynch is Vice Chairman and a Director of FMR and FMR Co., Inc. In addition, Mr. Lynch serves as a Trustee of Boston College and as the Chairman of the Inner-City Scholarship Fund. Previously, Mr. Lynch served on the Special Olympics International Board of Directors (1997-2006). |
Elizabeth Paige Baumann (1968) |
Year of Election or Appointment: 2012 Anti-Money Laundering (AML) Officer |
| Ms. Baumann also serves as AML Officer of other funds. She is Chief AML Officer of FMR LLC (2012-present) and is an employee of Fidelity Investments. Previously, Ms. Baumann served as Vice President and Deputy Anti-Money Laundering Officer (2007-2012). |
William C. Coffey (1969) |
Year of Election or Appointment: 2009 Assistant Secretary |
| Mr. Coffey also serves as Assistant Secretary of other funds. He is Senior Vice President and Deputy General Counsel of FMR LLC (2010-present), and is an employee of Fidelity Investments. Previously, Mr. Coffey served as Vice President and Associate General Counsel of FMR LLC (2005-2009). |
Jonathan Davis (1968) |
Year of Election or Appointment: 2010 Assistant Treasurer |
| Mr. Davis also serves as Assistant Treasurer of other funds. Mr. Davis is an employee of Fidelity Investments. Previously, Mr. Davis served as Vice President and Associate General Counsel of FMR LLC (2003-2010). |
Adrien E. Deberghes (1967) |
Year of Election or Appointment: 2008 Deputy Treasurer |
| Mr. Deberghes also serves as an officer of other funds. He is an employee of Fidelity Investments (2008-present). Prior to joining Fidelity Investments, Mr. Deberghes was Senior Vice President of Mutual Fund Administration at State Street Corporation (2007-2008), Senior Director of Mutual Fund Administration at Investors Bank & Trust (2005-2007), and Director of Finance for Dunkin' Brands (2000-2005). |
Stephanie J. Dorsey (1969) |
Year of Election or Appointment: 2010 Assistant Treasurer |
| Ms. Dorsey also serves as an officer of other funds. She is an employee of Fidelity Investments (2008-present) and has served in other fund officer roles. Prior to joining Fidelity Investments, Ms. Dorsey served as Treasurer (2004-2008) of the JPMorgan Mutual Funds and Vice President (2004-2008) of JPMorgan Chase Bank. |
Scott C. Goebel (1968) |
Year of Election or Appointment: 2008 Secretary and Chief Legal Officer (CLO) |
| Mr. Goebel serves as Secretary and CLO of other funds. Mr. Goebel also serves as Secretary of Fidelity Investments Money Management, Inc. (FIMM) (2010-present) and Fidelity Research and Analysis Company (FRAC) (2010-present); General Counsel, Secretary, and Senior Vice President of FMR (2008-present) and FMR Co., Inc. (2008-present); Chief Legal Officer of Fidelity Management & Research (Hong Kong) Limited (2008-present) and Assistant Secretary of Fidelity Management & Research (Japan) Inc. (2008-present), and Fidelity Management & Research (U.K.) Inc. (2008-present). Previously, Mr. Goebel served as Secretary and CLO of other Fidelity funds (2008-2013), Assistant Secretary of FIMM (2008-2010), FRAC (2008-2010), and certain funds (2007-2008); and as Vice President and Secretary of Fidelity Distributors Corporation (FDC) (2005-2007). Mr. Goebel has been employed by FMR LLC or an affiliate since 2001. |
Joseph A. Hanlon (1968) |
Year of Election or Appointment: 2012 Chief Compliance Officer |
| Mr. Hanlon also serves as Chief Compliance Officer of other funds. Mr. Hanlon serves as Compliance Officer of FMR, FMR Co., Inc., Fidelity Investments Money Management, Inc. (FIMM), Fidelity Research and Analysis Company (FRAC), and Fidelity Management & Research (Hong Kong) (2009-present), as Senior Vice President of the Fidelity Asset Management Division (2009-present), and is an employee of Fidelity Investments. Previously, Mr. Hanlon served as Compliance Officer of Fidelity Management & Research (Japan) Inc. (2009-2013), Strategic Advisers, Inc. (2009-2013), and Fidelity Management & Research (U.K.) Inc. (2009-2013). |
Bruce T. Herring (1965) |
Year of Election or Appointment: 2006 Vice President of certain Equity Funds |
| Mr. Herring also serves as Vice President of other funds. He serves as Chief Investment Officer of Fidelity Global Asset Allocation (GAA) (2013-present), Chief Investment Officer and Director of Fidelity Management & Research (U.K.) Inc. (2010-present), Group Chief Investment Officer of FMR, and President of Fidelity Research & Analysis Company (2010-present). Previously, Mr. Herring served as Vice President (2005-2006) and Senior Vice President (2006-2007) of Fidelity Management & Research Company, Vice President of FMR Co., Inc. (2001-2007), and as a portfolio manager for Fidelity U.S. Equity Funds. |
Brian B. Hogan (1964) |
Year of Election or Appointment: 2009 Vice President |
| Mr. Hogan also serves as Vice President of other funds. Mr. Hogan serves as President of FMR's Equity Division (2009-present). Previously, Mr. Hogan served as Senior Vice President, Equity Research of FMR (2006-2009) and as a portfolio manager. |
Chris Maher (1972) |
Year of Election or Appointment: 2013 Assistant Treasurer |
| Mr. Maher serves as Assistant Treasurer of other funds. Mr. Maher is Vice President of Valuation Oversight and is an employee of Fidelity Investments. Previously, Mr. Maher served as Vice President of Asset Management Compliance (2013), Vice President of FMR's Program Management Group (2010-2013), and Vice President of Valuation Oversight (2008-2010). |
Christine Reynolds (1958) |
Year of Election or Appointment: 2008 Chief Financial Officer |
| Ms. Reynolds also serves as Chief Financial Officer of other funds. Ms. Reynolds became President of Fidelity Pricing and Cash Management Services (FPCMS) in August 2008. Ms. Reynolds served as Chief Operating Officer of FPCMS (2007-2008). Previously, Ms. Reynolds served as President, Treasurer, and Anti-Money Laundering officer of the Fidelity funds (2004-2007). |
Kenneth B. Robins (1969) |
Year of Election or Appointment: 2008 President and Treasurer |
| Mr. Robins also serves as an officer of other funds. Mr. Robins serves as Executive Vice President of Fidelity Investments Money Management, Inc. (FIMM) (2013-present) and is an employee of Fidelity Investments (2004-present). Previously, Mr. Robins served in other fund officer roles. |
Gary W. Ryan (1958) |
Year of Election or Appointment: 2005 Assistant Treasurer |
| Mr. Ryan also serves as Assistant Treasurer of other funds. Mr. Ryan is an employee of Fidelity Investments and has served in other fund officer roles. Previously, Mr. Ryan served as Vice President of Fund Reporting in Fidelity Pricing and Cash Management Services (FPCMS) (1999-2005). |
Stephen Sadoski (1971) |
Year of Election or Appointment: 2012 Deputy Treasurer |
| Mr. Sadoski also serves as Deputy Treasurer of other funds. He is an employee of Fidelity Investments (2012-present) and has served in another fund officer role. Prior to joining Fidelity Investments, Mr. Sadoski served as an assistant chief accountant in the Division of Investment Management of the Securities and Exchange Commission (SEC) (2009-2012) and as a senior manager at Deloitte & Touche LLP (1997-2009). |
Stacie M. Smith (1974) |
Year of Election or Appointment: 2013 Deputy Treasurer |
| Ms. Smith also serves as an officer of other funds. She is an employee of Fidelity Investments (2009-present) and has served in other fund officer roles. Prior to joining Fidelity Investments, Ms. Smith served as Senior Audit Manager of Ernst & Young LLP (1996-2009). |
Renee Stagnone (1975) |
Year of Election or Appointment: 2013 Deputy Treasurer |
| Ms. Stagnone also serves as Deputy Treasurer of other funds. Ms. Stagnone is an employee of Fidelity Investments. |
Joseph F. Zambello (1957) |
Year of Election or Appointment: 2011 Deputy Treasurer |
| Mr. Zambello also serves as Deputy Treasurer of other funds. Mr. Zambello is an employee of Fidelity Investments. Previously, Mr. Zambello served as Vice President of FMR's Program Management Group (2009-2011) and Vice President of the Transfer Agent Oversight Group (2005-2009). |
Annual Report
The Board of Trustees of each fund voted to pay to shareholders of record at the opening of business on record date, the following distributions per share derived from capital gains realized from sales of portfolio securities, and dividends derived from net investment income:
| Pay Date | Record Date | Dividends | Capital Gains |
Fidelity Canada Fund | 12/09/13 | 12/06/13 | $0.239 | $0.320 |
Fidelity China Region Fund | 12/09/13 | 12/06/13 | $0.379 | $3.306 |
Fidelity Emerging Markets Fund | 12/09/13 | 12/06/13 | $0.004 | $0.000 |
Fidelity Europe Fund | 12/09/13 | 12/06/13 | $0.520 | $0.024 |
Fidelity Europe Capital Appreciation Fund | 12/09/13 | 12/06/13 | $0.366 | $0.000 |
Fidelity Japan Fund | 12/09/13 | 12/06/13 | $0.105 | $0.009 |
Fidelity Japan Smaller Companies Fund | 12/09/13 | 12/06/13 | $0.017 | $0.311 |
Fidelity Latin America Fund | 12/09/13 | 12/06/13 | $0.661 | $6.250 |
Fidelity Nordic Fund | 12/09/13 | 12/06/13 | $0.829 | $1.797 |
Fidelity Pacific Basin Fund | 12/09/13 | 12/06/13 | $0.157 | $3.933 |
Fidelity Emerging Asia Fund | 12/09/13 | 12/06/13 | $0.387 | $0.000 |
The funds hereby designate as capital gain dividend the amounts noted below for the taxable year ended October 31, 2013, or, if subsequently determined to be different, the net capital gain of such year.
Fidelity Canada Fund | $54,802,785 |
Fidelity China Region Fund | $120,314,075 |
Fidelity Latin America Fund | $266,757,493 |
Fidelity Pacific Basin Fund | $69,237,727 |
A percentage of the dividends distributed during the fiscal year for the following funds may be taken into account as a dividend for purposes of the maximum rate under section 1(h)(11) of the Internal Revenue Code.
| December 07, 2012 | December 28, 2012 |
Fidelity Canada Fund | 100% | - |
Fidelity China Region Fund | 51% | - |
Fidelity Emerging Markets Fund | 99% | 100% |
Fidelity Europe Fund | 100% | - |
Fidelity Europe Capital Appreciation Fund | 100% | - |
Fidelity Japan Fund | 100% | - |
Fidelity Japan Smaller Companies Fund | 71% | - |
Fidelity Latin America Fund | 83% | - |
Fidelity Nordic Fund | 98% | - |
Fidelity Pacific Basin Fund | 37% | |
Fidelity Emerging Asia Fund | 73% | - |
A percentage of the dividends distributed during the fiscal year for the following funds qualifies for the dividends-received deduction for corporate shareholders:
Fidelity Canada Fund | |
December 7, 2012 | 4% |
| |
Fidelity Emerging Markets Fund | |
December 7, 2012 | 1% |
December 27, 2012 | 6% |
| |
Fidelity Europe Fund | |
December 7, 2012 | 1% |
| |
Fidelity Europe Capital Appreciation Fund | |
December 7, 2012 | 3% |
| |
Fidelity Latin America Fund | |
December 7, 2012 | 5% |
| |
Fidelity Emerging Asia Fund | |
December 7, 2012 | 1% |
The amounts per share which represent income derived from sources within, and taxes paid to, foreign countries or possessions of the United States are as follows:
Fund | Pay Date | Income | Taxes |
Fidelity Canada Fund | 12/10/12 | $0.888 | $0.1441 |
Fidelity China Region Fund | 12/10/12 | $0.495 | $0.0650 |
Fidelity Emerging Markets Fund | 12/10/12 | $0.354 | $0.0615 |
| 12/28/12 | $0.011 | $0.0000 |
Fidelity Europe | 12/10/12 | $0.478 | $0.0567 |
Fidelity Europe Capital Appreciation Fund | 12/10/12 | $0.311 | $0.0238 |
Fidelity Japan | 12/10/12 | $0.107 | $0.0178 |
Fidelity Japan Smaller Companies Fund | 12/10/12 | $0.086 | $0.0131 |
Fidelity Latin America Fund | 12/10/12 | $1.117 | $0.1408 |
Fidelity Nordic Fund | 12/10/12 | $0.756 | $0.1258 |
Fidelity Pacific Basin Fund | 12/10/12 | $0.437 | $0.0299 |
Fidelity Emerging Asia Fund | 12/10/12 | $0.502 | $0.0722 |
The fund will notify shareholders in January 2014 of amounts for use in preparing 2013 income tax returns.
Annual Report
Board Approval of Investment Advisory Contracts and Management Fees
Targeted International Equity Funds
Each year, the Board of Trustees, including the Independent Trustees (together, the Board), votes on the renewal of the management contract and sub-advisory agreements (together, the Advisory Contracts) for each fund. The Board, assisted by the advice of fund counsel and Independent Trustees' counsel, requests and considers a broad range of information relevant to the renewal of the Advisory Contracts throughout the year.
The Board meets regularly and, at each of its meetings, covers an extensive agenda of topics and materials and considers factors that are relevant to its annual consideration of the renewal of each fund's Advisory Contracts, including the services and support provided to each fund and its shareholders. The Board has established various standing committees, each composed of and chaired by Independent Trustees with varying backgrounds, to which the Board has assigned specific subject matter responsibilities in order to enhance effective decision-making by the Board. The Board, acting directly and through its Committees, requests and receives information concerning the annual consideration of the renewal of each fund's Advisory Contracts. The Board also meets as needed to consider matters specifically related to the Board's annual consideration of the renewal of Advisory Contracts. Members of the Board may also meet with trustees of other Fidelity funds through ad hoc joint committees to discuss certain matters relevant to the Fidelity funds.
At its July 2013 meeting, the Board, including the Independent Trustees, unanimously determined to renew each fund's Advisory Contracts. In reaching its determination, the Board considered all factors it believed relevant, including (i) the nature, extent, and quality of the services to be provided to each fund and its shareholders (including the investment performance of each fund); (ii) the competitiveness of each fund's management fee and total expense ratio relative to peer funds; (iii) the total costs of the services to be provided by and the profits to be realized by Fidelity from its relationship with each fund; (iv) the extent to which economies of scale exist and would be realized as each fund grows; and (v) whether fee levels reflect these economies of scale, if any, for the benefit of fund shareholders.
In considering whether to renew the Advisory Contracts for each fund, the Board reached a determination, with the assistance of fund counsel and Independent Trustees' counsel and through the exercise of its business judgment, that the renewal of the Advisory Contracts was in the best interests of each fund and its shareholders and that the compensation payable under the Advisory Contracts was fair and reasonable. The Board's decision to renew the Advisory Contracts was not based on any single factor, but rather was based on a comprehensive consideration of all the information provided to the Board at its meetings throughout the year. The Board, in reaching its determination to renew the Advisory Contracts, was aware that shareholders in each fund have a broad range of investment choices available to them, including a wide choice among mutual funds offered by Fidelity's competitors, and that each fund's shareholders, who have the opportunity to review and weigh the disclosure provided by the fund in its prospectus and other public disclosures, have chosen to invest in that fund, which is a part of the Fidelity family of funds.
Nature, Extent, and Quality of Services Provided. The Board considered the staffing within the investment adviser, Fidelity Management & Research Company (FMR), and the sub-advisers (together, the Investment Advisers) as it relates to the funds, including the backgrounds of the funds' investment personnel, and also considered the funds' investment objectives, strategies, and related investment philosophies. The Independent Trustees also had discussions with senior management of Fidelity's investment operations and investment groups. The Board considered the structure of the portfolio manager compensation program and whether this structure provides appropriate incentives to act in the best interests of each fund.
Resources Dedicated to Investment Management and Support Services. The Board and the Fund Oversight and Research Committees reviewed the general qualifications and capabilities of the Investment Advisers' investment staff, including its size, education, experience, and resources, as well as the Investment Advisers' approach to recruiting, training, managing, and compensating investment personnel. The Board noted that FMR has continued to increase the resources devoted to non-U.S. offices, including expansion of Fidelity's global investment organization. The Board also noted that Fidelity's analysts have extensive resources, tools and capabilities that allow them to conduct sophisticated quantitative and fundamental analysis, as well as credit analysis of issuers, counterparties and guarantors. Further, the Board believes that Fidelity's investment professionals have sufficient access to global information and data so as to provide competitive investment results over time, and that those professionals also have access to sophisticated tools that permit them to assess portfolio construction and risk and performance attribution characteristics continuously, as well as to transmit new information and research conclusions rapidly around the world. Additionally, in its deliberations, the Board considered the Investment Advisers' trading and risk management capabilities and resources, which are an integral part of the investment management process.
Shareholder and Administrative Services. The Board considered (i) the nature, extent, quality, and cost of advisory, administrative, and shareholder services performed by the Investment Advisers and their affiliates under the Advisory Contracts and under separate agreements covering transfer agency, pricing and bookkeeping, and securities lending services for each fund; (ii) the nature and extent of the supervision of third party service providers, principally custodians and subcustodians; and (iii) the resources devoted to, and the record of compliance with, each fund's compliance policies and procedures. The Board also reviewed the allocation of fund brokerage, including allocations to brokers affiliated with the Investment Advisers, the use of brokerage commissions to pay fund expenses, and the use of "soft" commission dollars to pay for research services.
The Board noted that the growth of fund assets over time across the complex allows Fidelity to reinvest in the development of services designed to enhance the value or convenience of the Fidelity funds as investment vehicles. These services include 24-hour access to account information and market information through telephone representatives and over the Internet, investor education materials and asset allocation tools, and the expanded availability of Fidelity Investor Centers.
Annual Report
Investment in a Large Fund Family. The Board considered the benefits to shareholders of investing in a Fidelity fund, including the benefits of investing in a fund that is part of a large family of funds offering a variety of investment disciplines and providing a large variety of mutual fund investor services. The Board noted that Fidelity had taken, or had made recommendations that resulted in the Fidelity funds taking, a number of actions over the previous year that benefited particular funds, including (i) continuing to dedicate additional resources to investment research and to the support of the senior management team that oversees asset management; (ii) persisting in efforts to enhance Fidelity's global research capabilities; (iii) launching new funds and making other enhancements to meet client needs for global and income-oriented solutions; (iv) continuing to launch dedicated lower cost underlying funds to meet portfolio construction needs related to expanding underlying fund options for Fidelity funds of funds, specifically for the Freedom Fund product lines; (v) rationalizing product lines and gaining increased efficiencies through the mergers of several funds into other funds; (vi) strengthening Fidelity's index fund offerings by reducing investment minimums and adopting or lowering existing expense caps for certain funds and classes; (vii) enhancing Global Asset Allocation product offerings by launching new funds and strategies, including "open architecture" target date funds that utilize affiliated and unaffiliated sub-advisers; (viii) modifying the eligibility criteria for Institutional Class shares of Advisor funds to increase their marketability to a portion of the defined contribution plan market; (ix) creating a new low-cost retirement share class for certain Advisor funds to appeal to large retirement plans; (x) transitioning the management of certain Fidelity commodity funds to Geode Capital Management LLC, a registered commodity pool operator, while retaining administrative responsibilities for the funds; (xi) reorganizing a number of funds; and (xii) taking steps toward establishing a new Fidelity adviser to manage sector-based funds and products.
Investment Performance. The Board considered whether each fund has operated in accordance with its investment objective, as well as its record of compliance with its investment restrictions and its performance history. The Board noted that there was a portfolio management change for Fidelity China Region Fund in October 2011, for Fidelity Emerging Markets Fund in October 2012, and for Fidelity Europe Capital Appreciation Fund in April 2012 and March 2013.
The Board took into account discussions with the Investment Advisers about fund investment performance that occur at Board meetings throughout the year. In this regard the Board noted that as part of regularly scheduled fund reviews and other reports to the Board on fund performance, the Board periodically considers annualized return information for each fund, for different time periods, measured against a securities market index ("benchmark index") and a peer group of mutual funds with similar objectives ("peer group"). In its evaluation of fund investment performance, the Board gave particular attention to information indicating changes in performance of certain Fidelity funds for specific time periods and the Investment Advisers' explanations for any overperformance or, in the case of Fidelity Nordic Fund, underperformance.
In addition to reviewing absolute and relative fund performance, the Independent Trustees periodically consider the appropriateness of fund performance metrics in evaluating the results achieved. In general, the Independent Trustees believe that fund performance should be evaluated based on net performance (after fees and expenses) of both the highest performing and lowest performing classes, where applicable, compared to appropriate benchmark indices, over appropriate time periods which may include full market cycles, and compared to peer groups, as applicable, over the same periods, taking into account relevant factors including the following: general market conditions; issuer-specific information; tactical opportunities for investment; and fund cash flows and other factors.
The Independent Trustees recognize that shareholders evaluate performance on a net basis over their own holding periods, for which one-, three-, and five-year periods are used as a proxy. For this reason, the performance information reviewed by the Board also included net cumulative calendar year total return information for each fund and an appropriate benchmark index and peer group for the most recent one-, three-, and five-year periods, as shown below. For Fidelity Emerging Markets Fund, Fidelity Europe Fund, Fidelity Europe Capital Appreciation Fund, and Fidelity Japan Fund, returns are shown compared to the 25th percentile (top of box) and 75th percentile (bottom of box) of the peer universe. For Fidelity Canada Fund, Fidelity China Region Fund, Fidelity Emerging Asia Fund, Fidelity Japan Smaller Companies Fund, Fidelity Latin American Fund, Fidelity Nordic Fund, and Fidelity Pacific Basin Fund, a peer group comparison is not shown. For Fidelity Emerging Asia Fund, Fidelity Europe Fund, Fidelity Europe Capital Appreciation Fund, and Fidelity Pacific Basin Fund, returns of the benchmark index are "net MA," i.e., adjusted for tax withholding rates applicable to U.S.-based mutual funds organized as Massachusetts business trusts.
Annual Report
Board Approval of Investment Advisory Contracts and Management Fees - continued
Fidelity Canada Fund

Fidelity China Region Fund
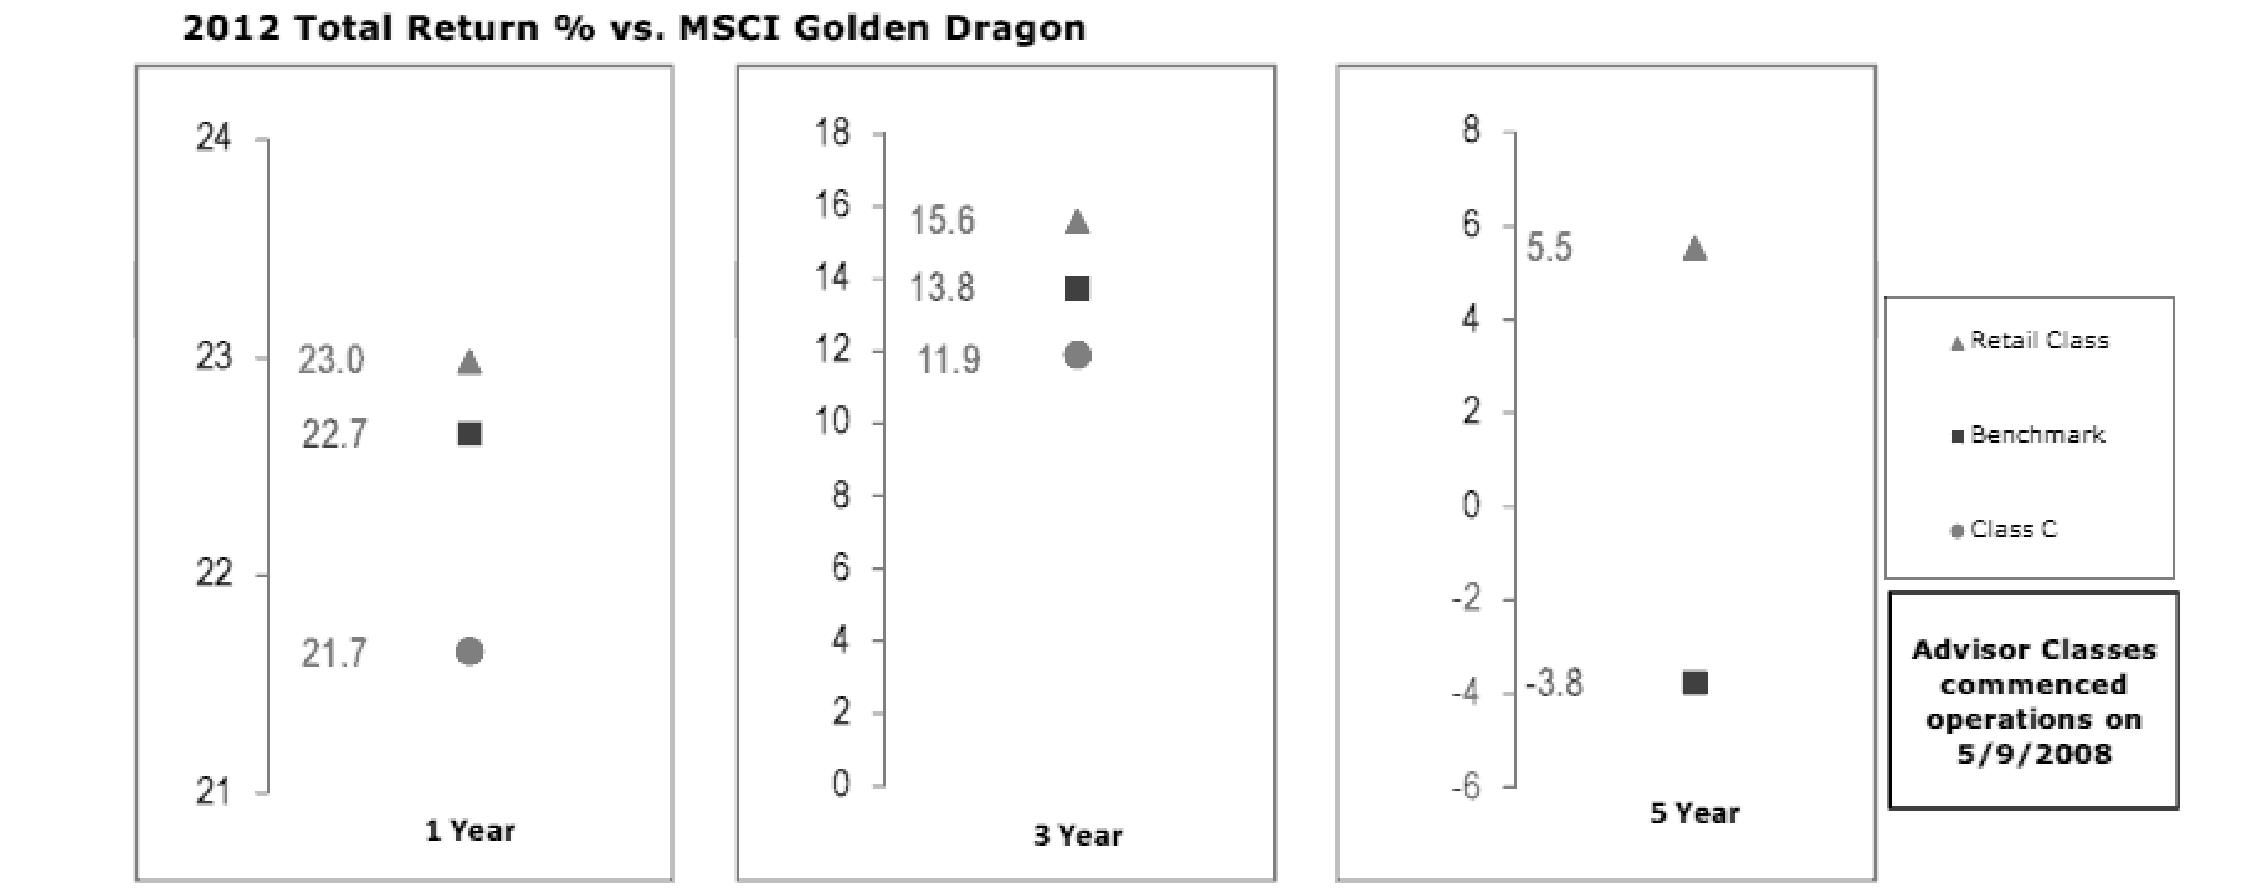
Annual Report
Fidelity Emerging Asia Fund
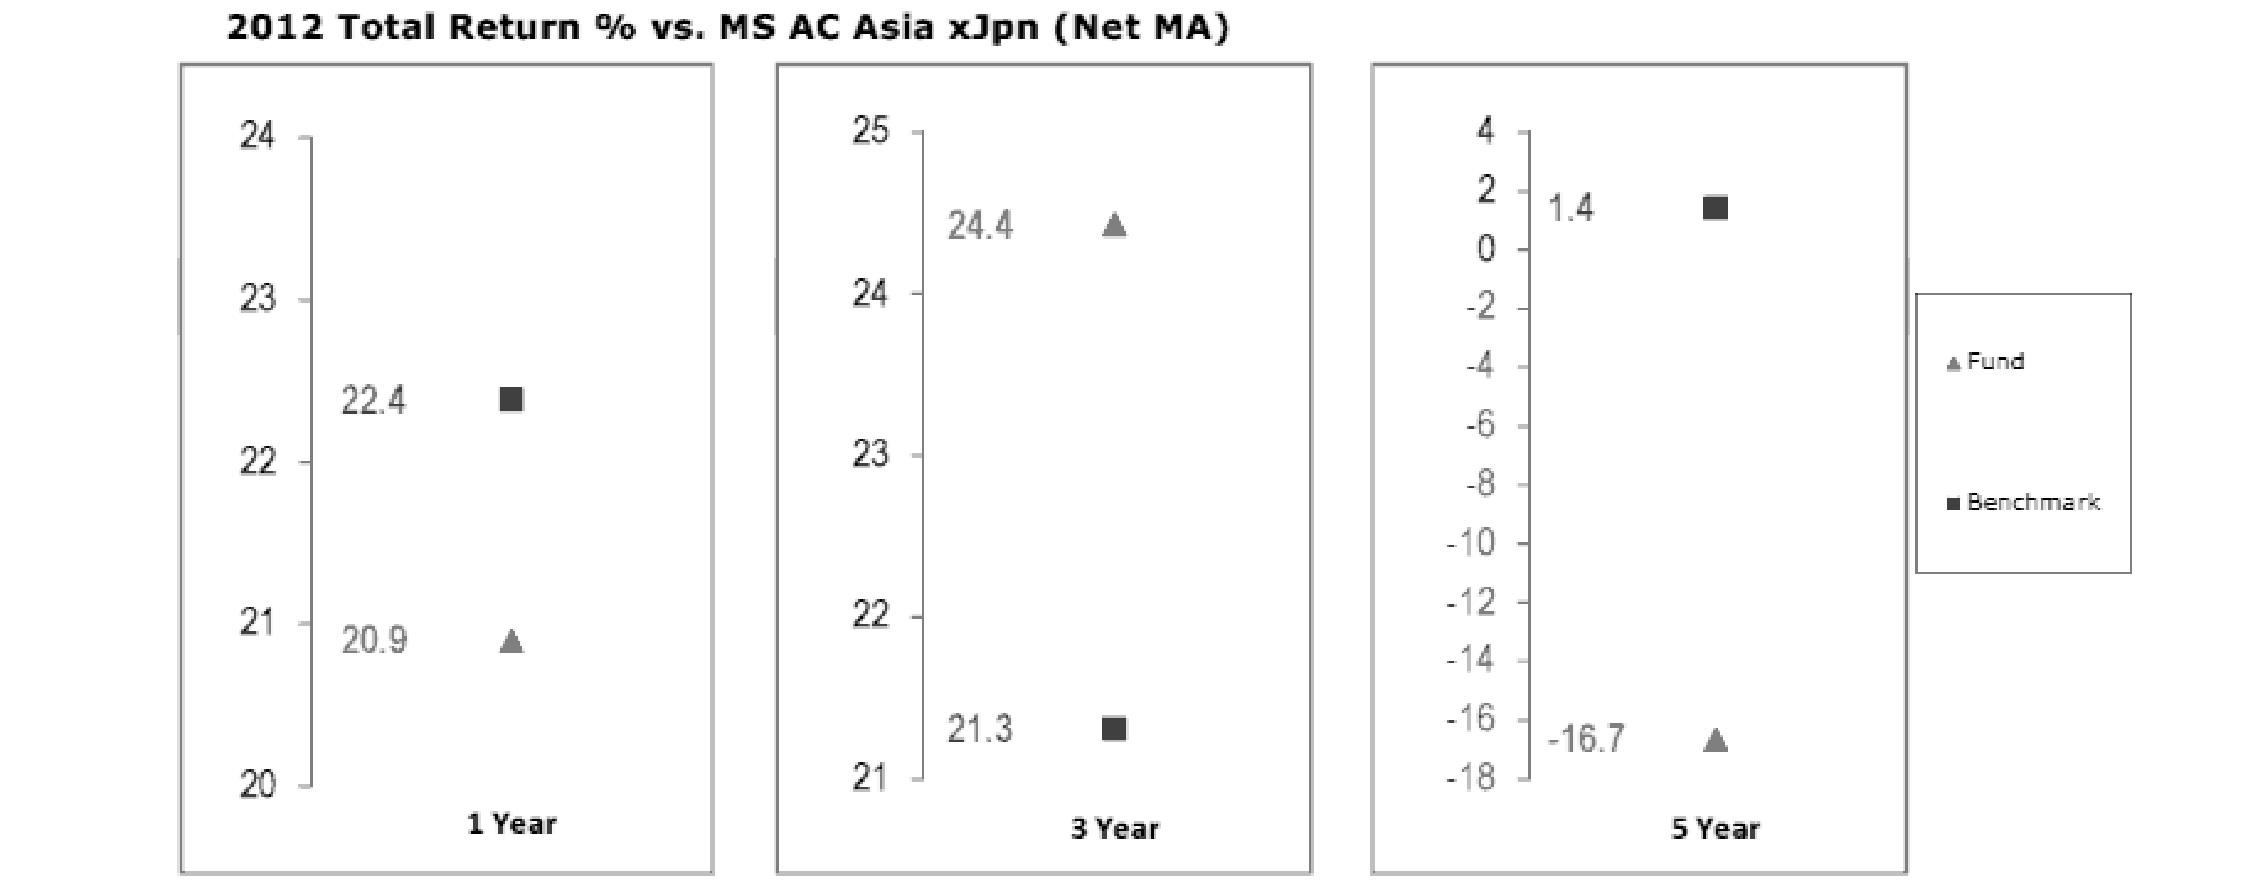
Fidelity Emerging Markets Fund

Annual Report
Board Approval of Investment Advisory Contracts and Management Fees - continued
Fidelity Europe Fund
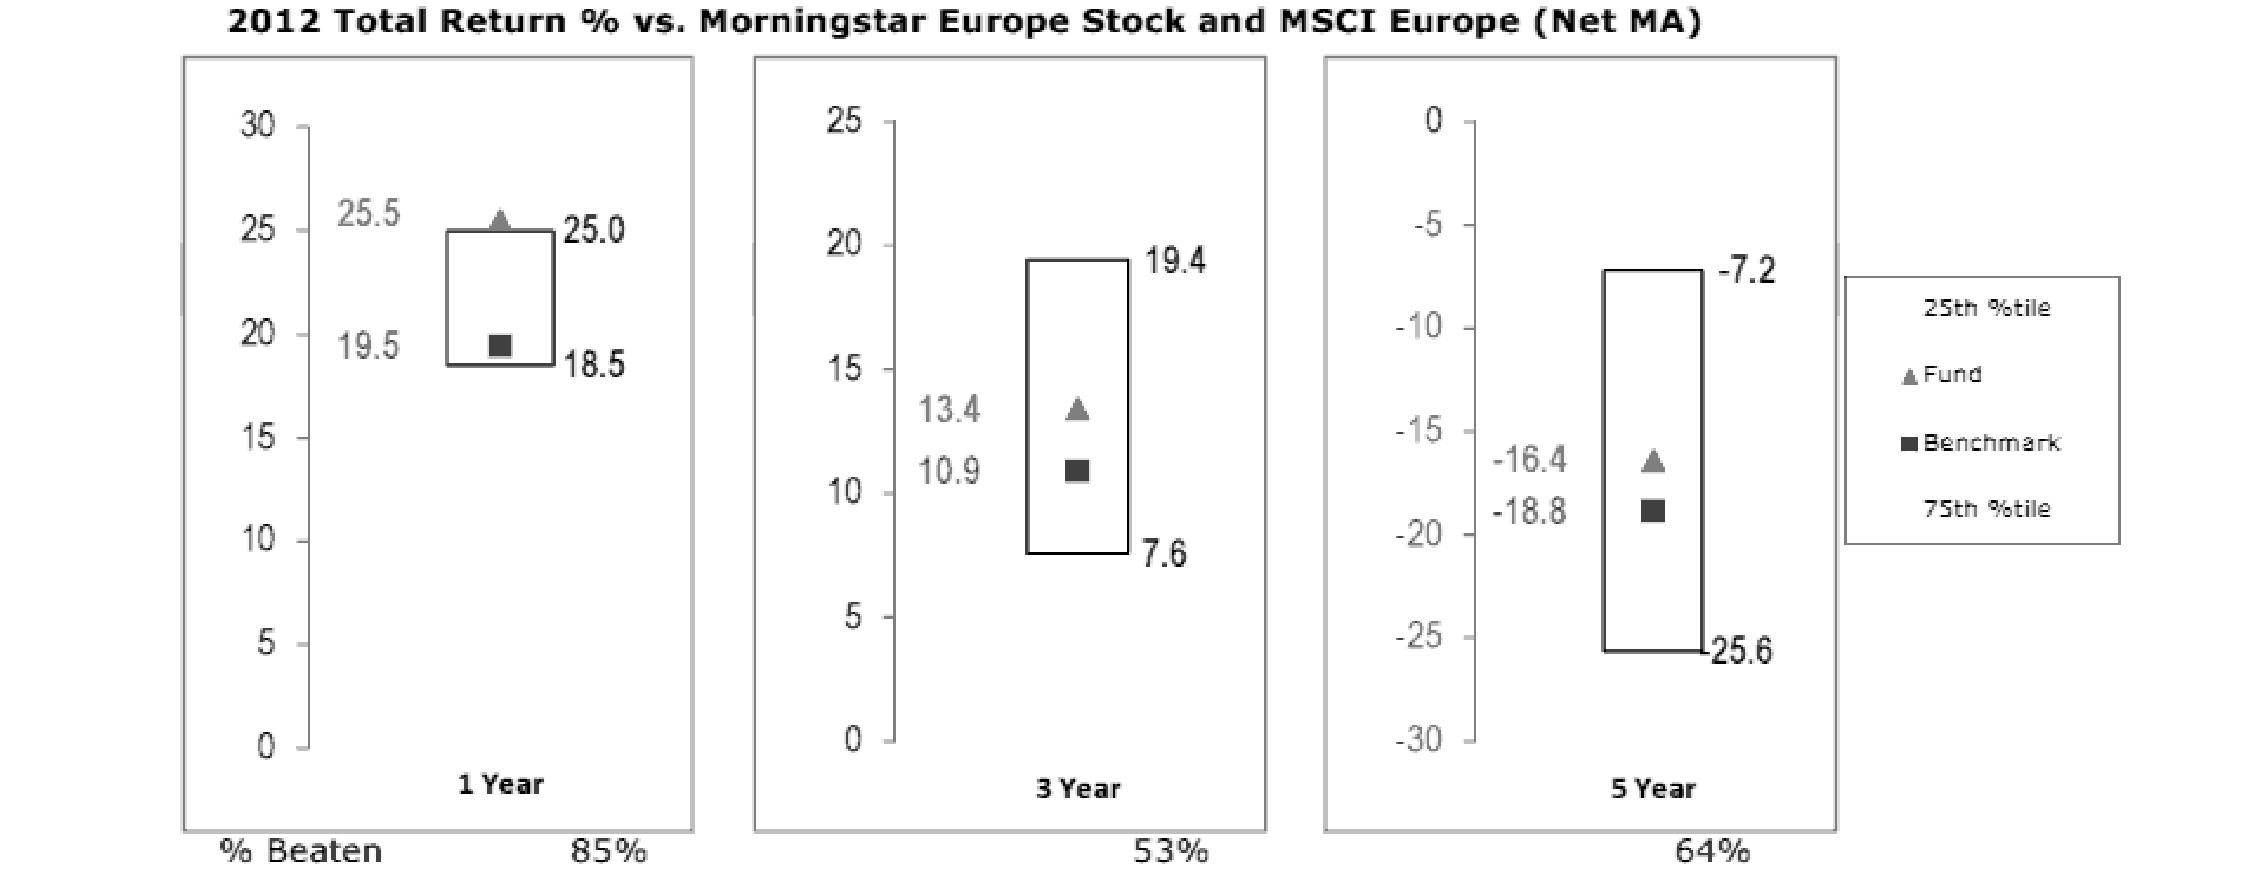
Fidelity Europe Capital Appreciation Fund

Annual Report
Fidelity Japan Fund

Fidelity Japan Smaller Companies Fund
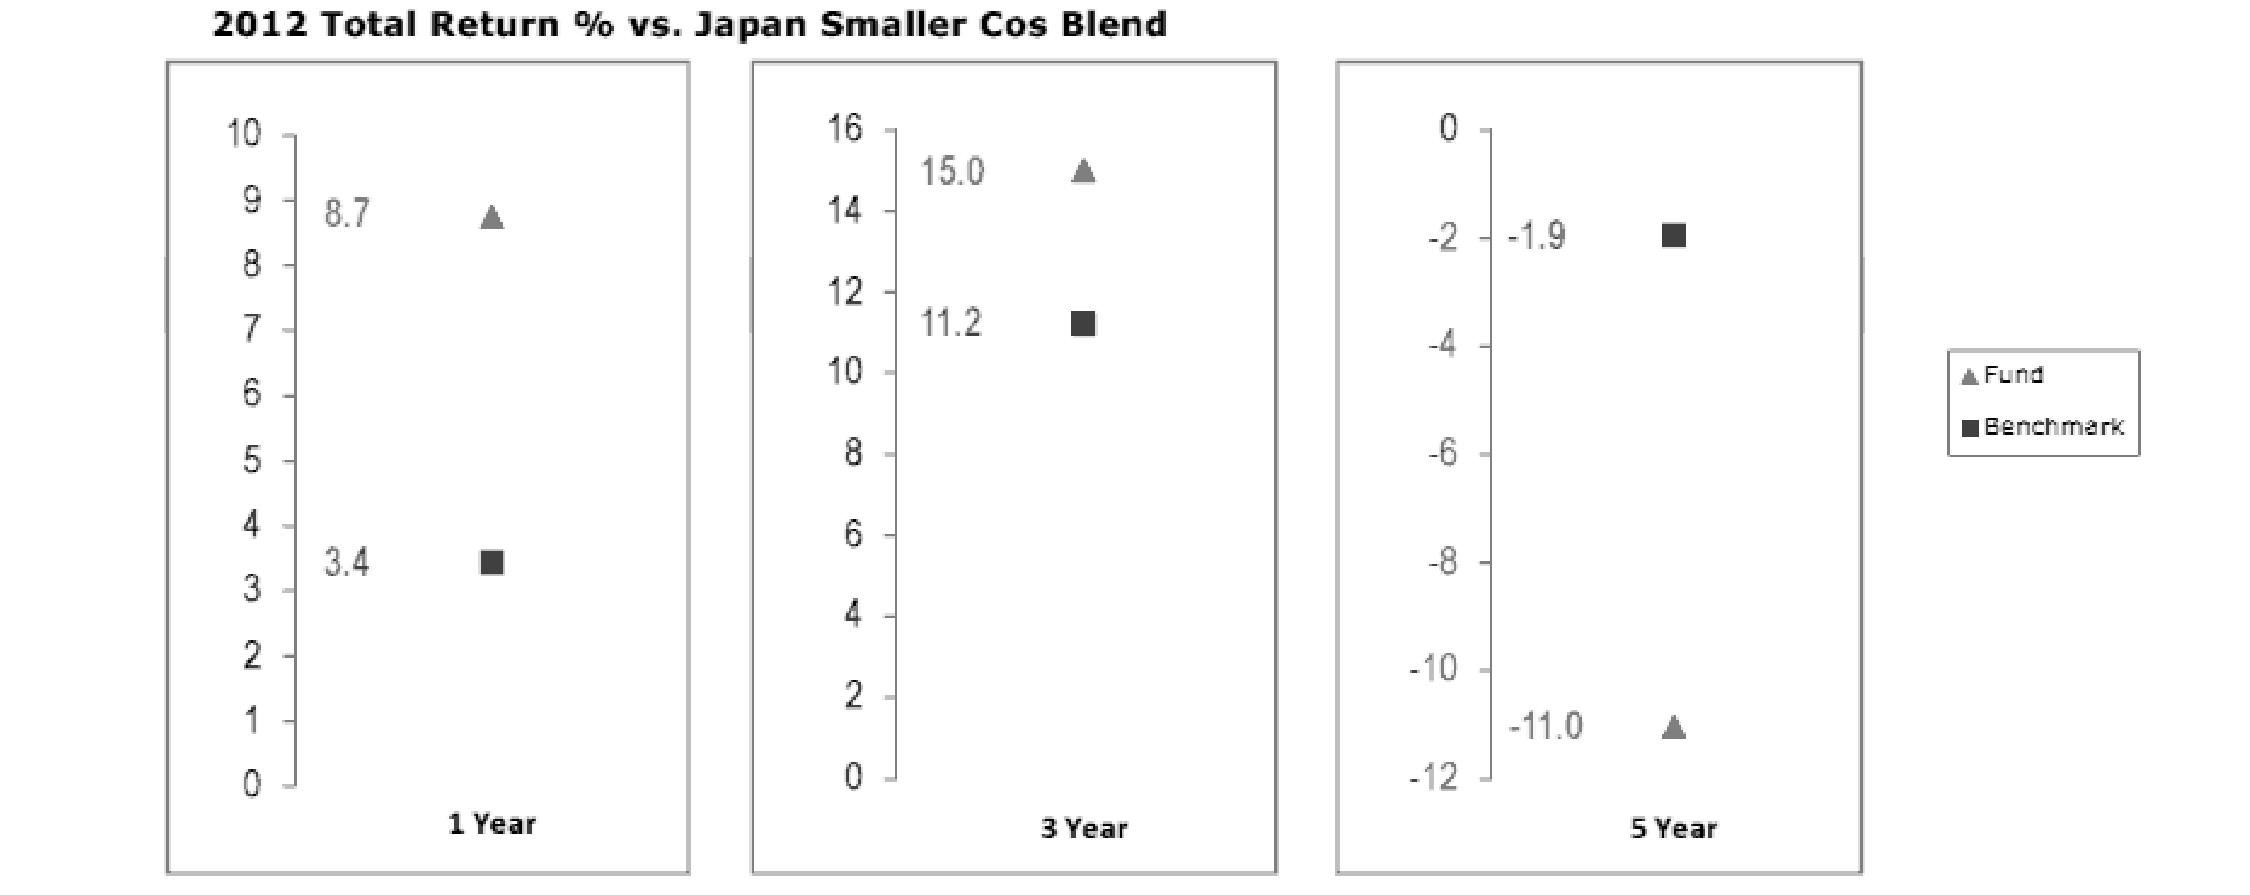
Annual Report
Board Approval of Investment Advisory Contracts and Management Fees - continued
Fidelity Latin America Fund

Fidelity Nordic Fund
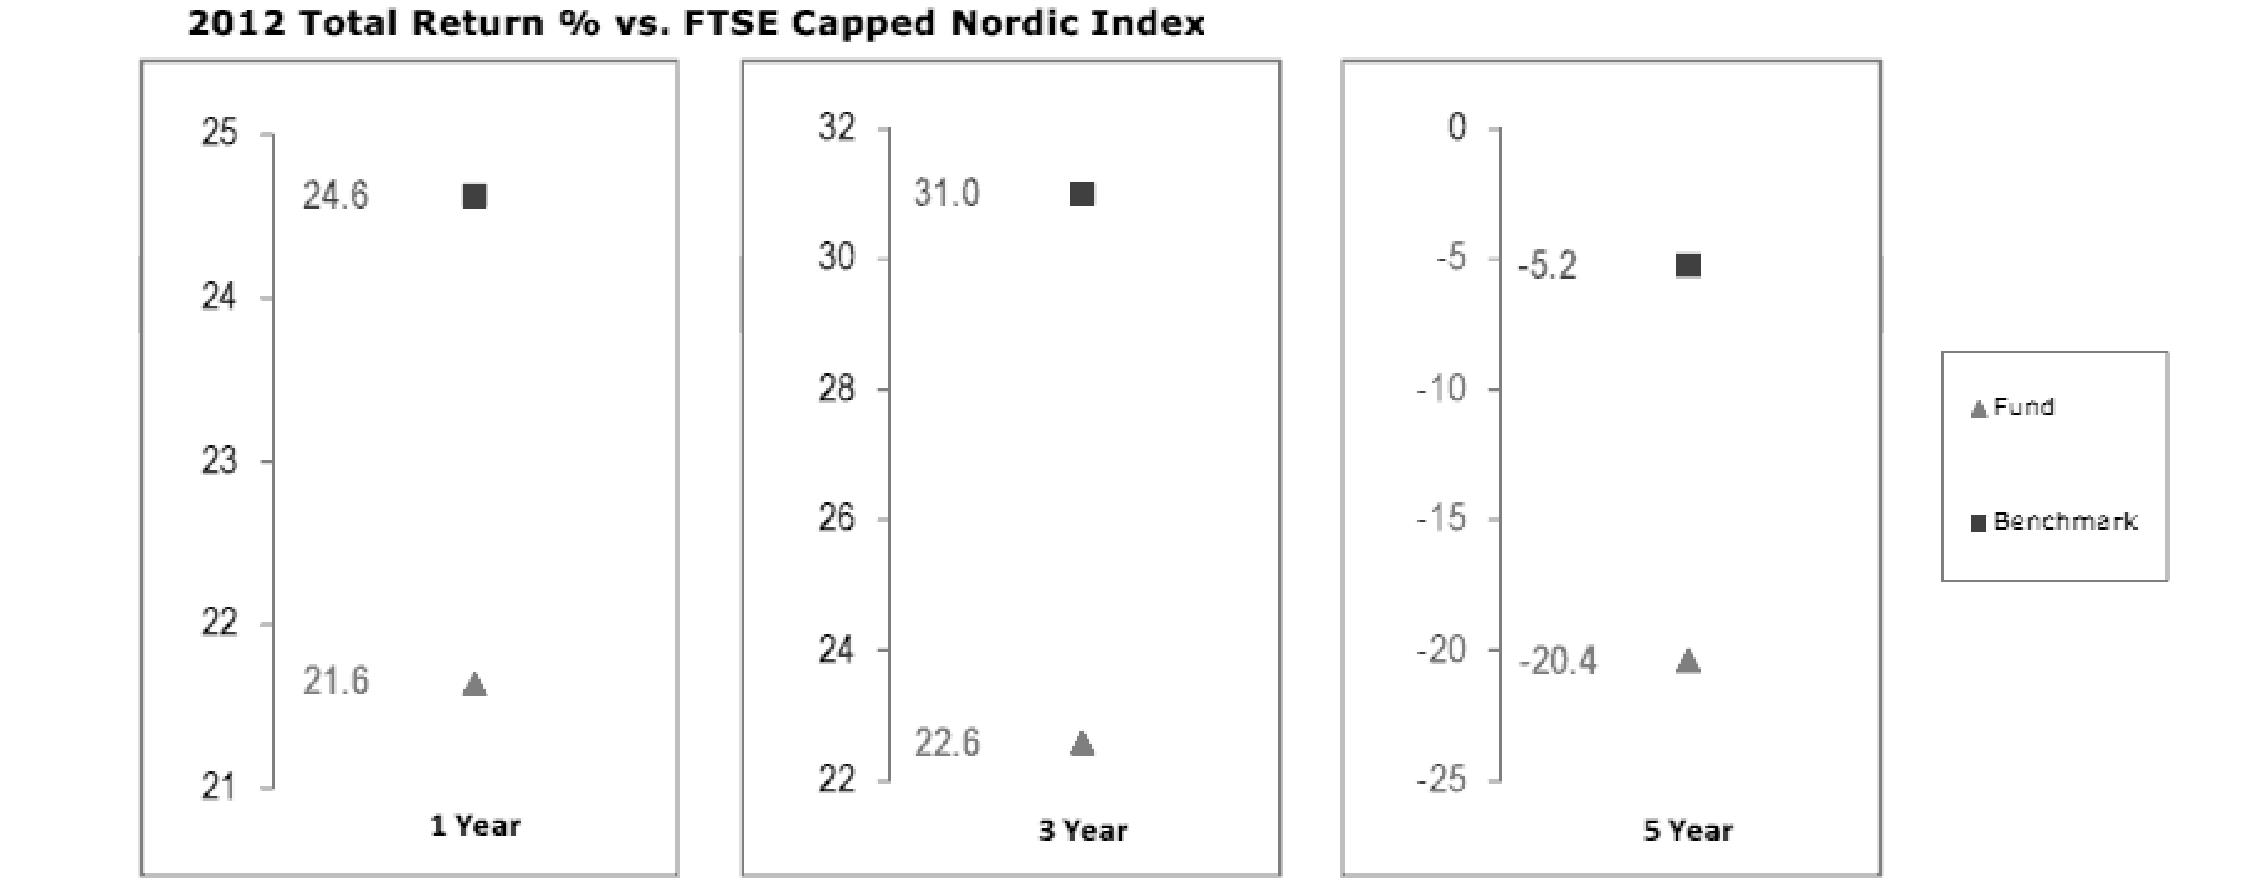
Annual Report
Fidelity Pacific Basin Fund
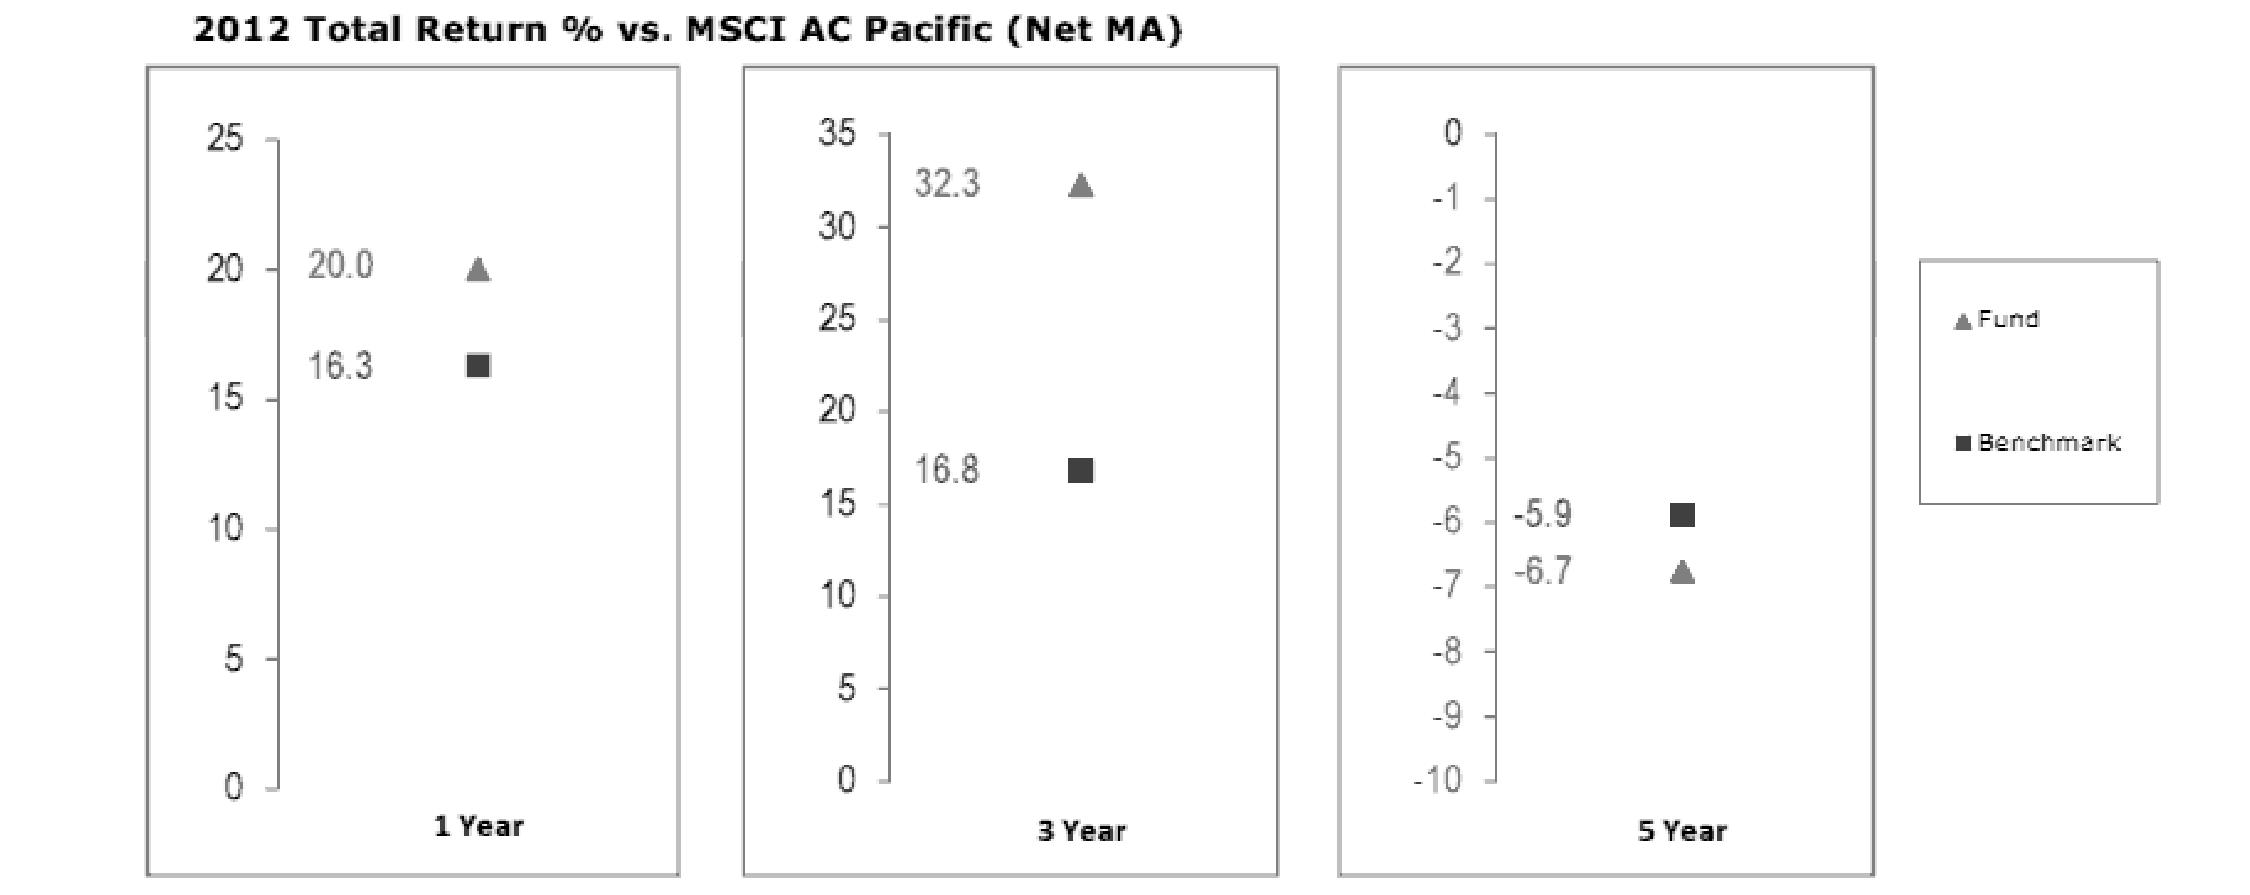
The Board has discussed with FMR each of Fidelity Canada Fund's and Fidelity Emerging Markets Fund's underperformance (based on the December 31, 2012 data presented herein) and has engaged with FMR to consider what steps might be taken to remediate these funds' underperformance. The Board noted that each fund's performance has improved for more recent periods.
The Board also has discussed Fidelity Nordic Fund's underperformance with FMR and has engaged with FMR to consider what steps might be taken to remediate this fund's underperformance.
The Board also considered that each of Fidelity Canada Fund's, Fidelity Emerging Asia Fund's, Fidelity Europe Fund's, Fidelity Europe Capital Appreciation Fund's, Fidelity Japan Fund's and Fidelity Pacific Basin Fund's management fee is subject to upward or downward adjustment depending upon whether, and to what extent, the fund's investment performance for the performance period exceeds, or is exceeded by, a securities index, thus leading to a performance adjustment for the same period. The Board noted that the performance adjustment provides FMR with a strong economic incentive to seek to achieve superior performance for each fund's shareholders and helps to more closely align the interests of FMR and each fund's shareholders.
Based on its review, the Board concluded that the nature, extent, and quality of services provided to each fund under the Advisory Contracts should benefit each fund's shareholders.
Competitiveness of Management Fee and Total Expense Ratio. The Board considered each fund's management fee and total expense ratio compared to "mapped groups" of competitive funds and classes. Fidelity creates "mapped groups" by combining similar Lipper investment objective categories that have comparable management fee characteristics. Combining Lipper investment objective categories aids the Board's management fee and total expense ratio comparisons by broadening the competitive group used for comparison and by reducing the number of universes to which various Fidelity funds are compared.
Management Fee. The Board considered two proprietary management fee comparisons for the 12-month periods shown in the charts below. The group of Lipper funds used by the Board for management fee comparisons is referred to below as the "Total Mapped Group." For Fidelity Japan Fund, the Total Mapped Group is broader than the Lipper peer group used by the Board for performance comparisons because the Total Mapped Group combines several Lipper investment objective categories while the Lipper peer group does not. The Total Mapped Group comparison focuses on a fund's standing in terms of gross management fees before expense reimbursements or caps, and without giving effect to the fund's performance adjustment (if applicable), relative to the total universe of funds with comparable investment mandates, regardless of whether their management fee structures also are comparable. Funds with comparable investment mandates offer exposure to similar types of securities. Funds with comparable management fee structures have similar management fee contractual arrangements (e.g., flat rate charged for advisory services, all-inclusive fee rate, etc.). "TMG %" represents the percentage of funds in the Total Mapped Group that had management fees that were lower than a fund's. For example, a TMG % of 16% would mean that 84% of the funds in the Total Mapped Group had higher management fees than a fund. The "Asset-Size Peer Group" (ASPG) comparison focuses on a fund's standing relative to a subset of non-Fidelity funds within the Total Mapped Group that are similar in size and management fee structure. The ASPG represents at least 15% of the funds in the Total Mapped Group with comparable asset size and management fee structures, subject to a minimum of 50 funds (or all funds in the Total Mapped Group if fewer than 50). Additional information, such as the ASPG quartile in which a fund's management fee ranked and the impact of a fund's performance adjustment (if applicable), is also included in the charts and considered by the Board.
Annual Report
Board Approval of Investment Advisory Contracts and Management Fees - continued
Fidelity Canada Fund
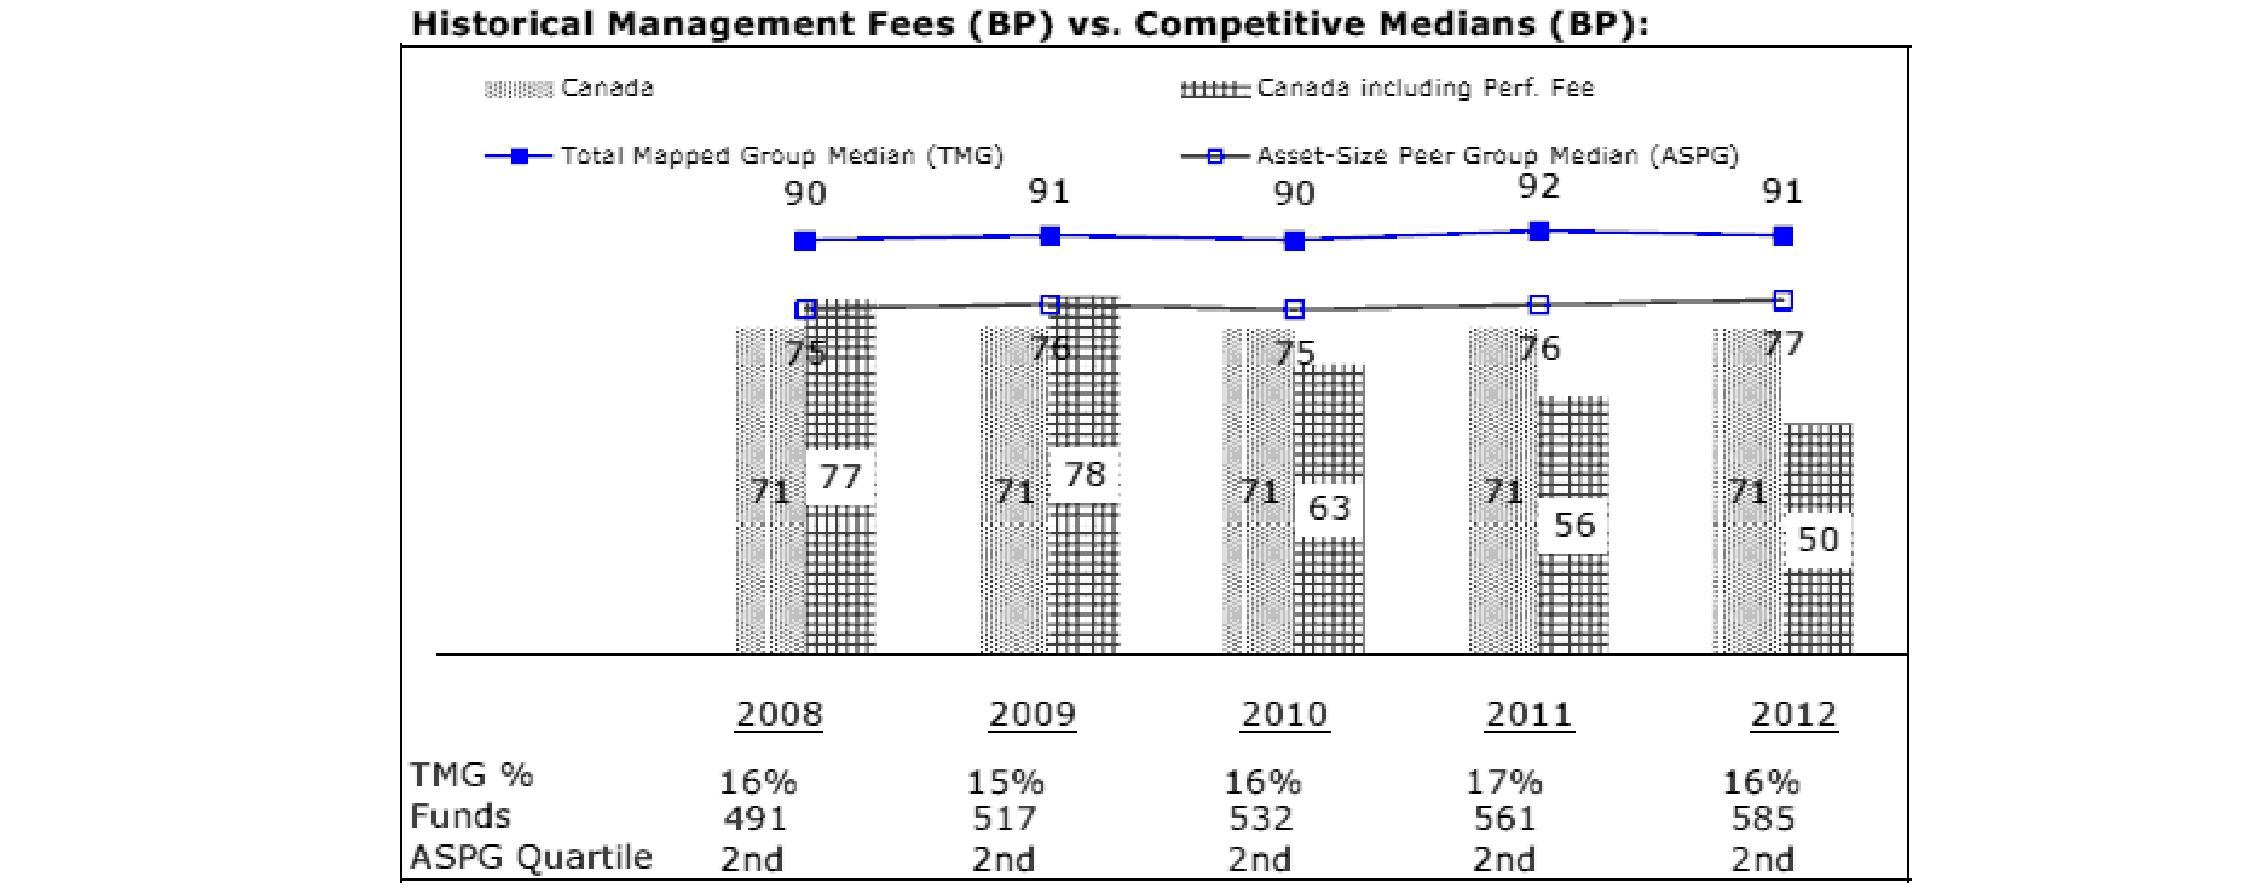
The Board noted that the fund's management fee ranked below the median of its Total Mapped Group and below the median of its ASPG for 2012. The Board also noted the effect of the fund's negative performance adjustment on the fund's management fee ranking.
Fidelity China Region Fund
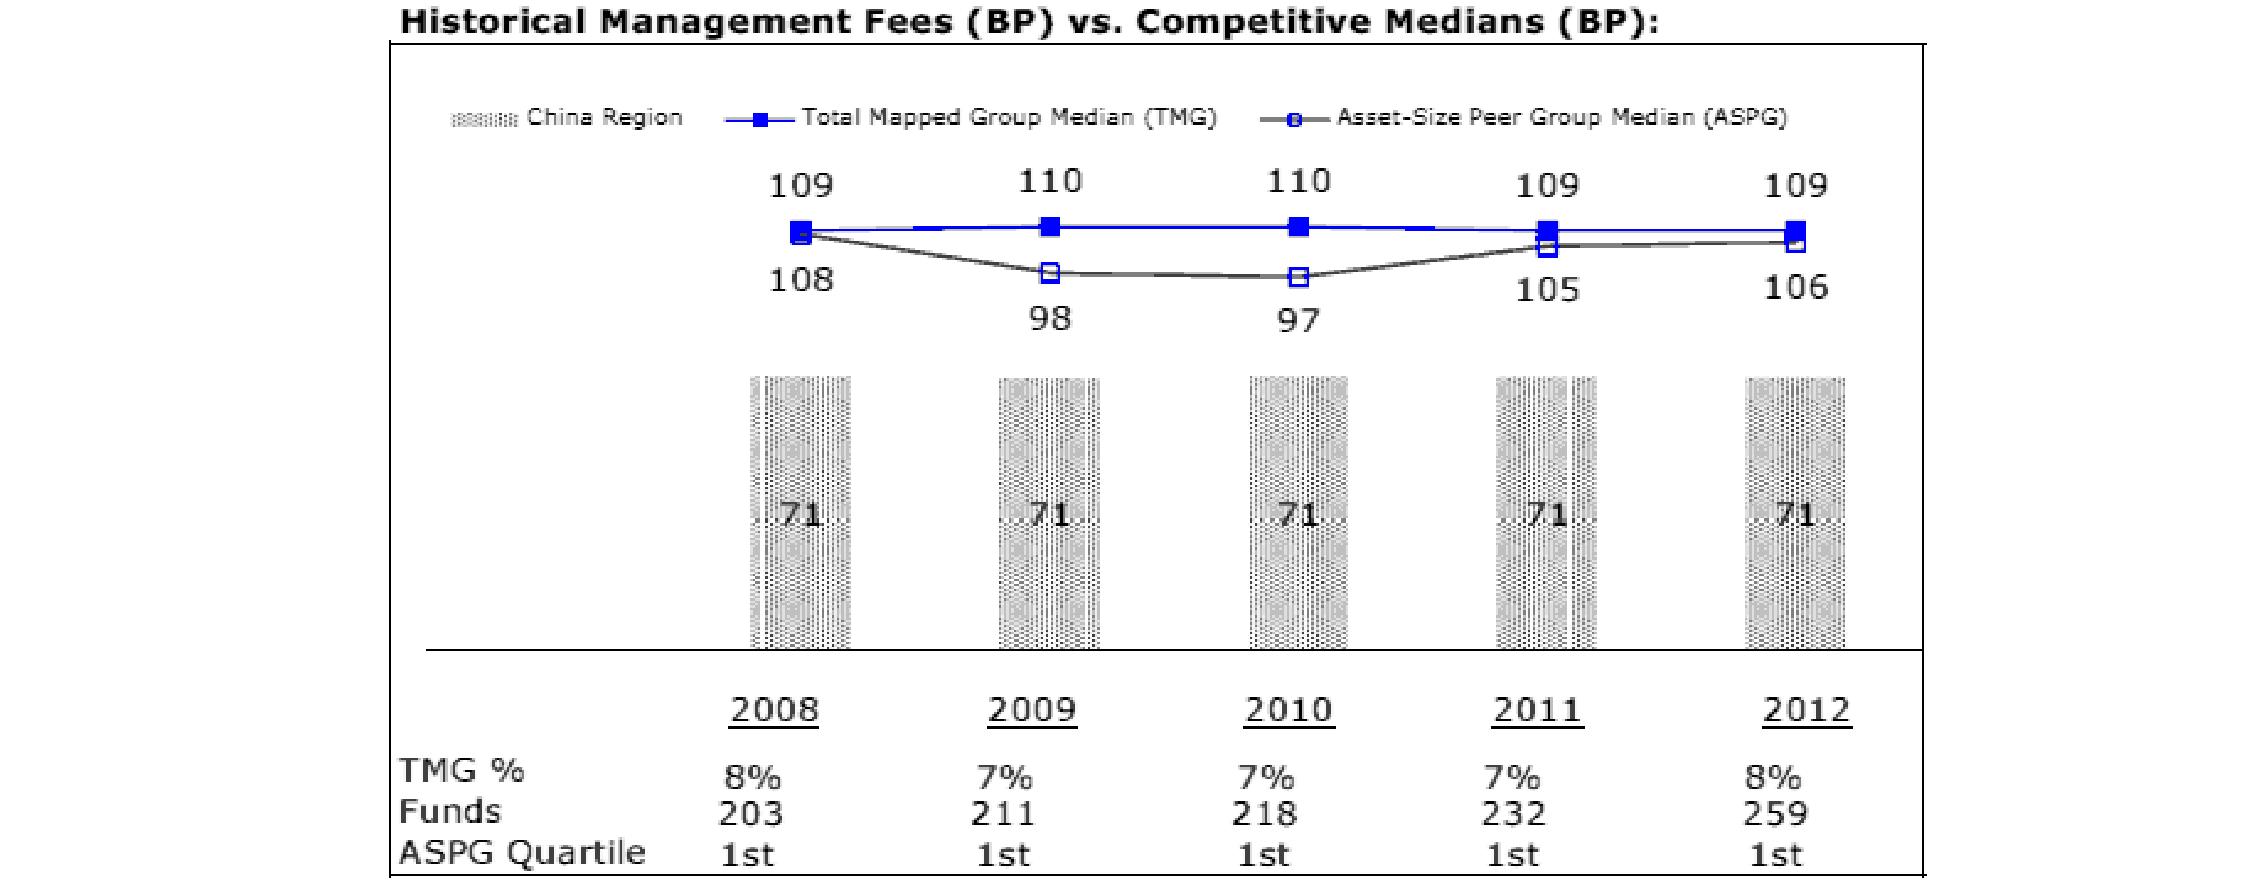
The Board noted that the fund's management fee ranked below the median of its Total Mapped Group and below the median of its ASPG for 2012.
Annual Report
Fidelity Emerging Asia Fund
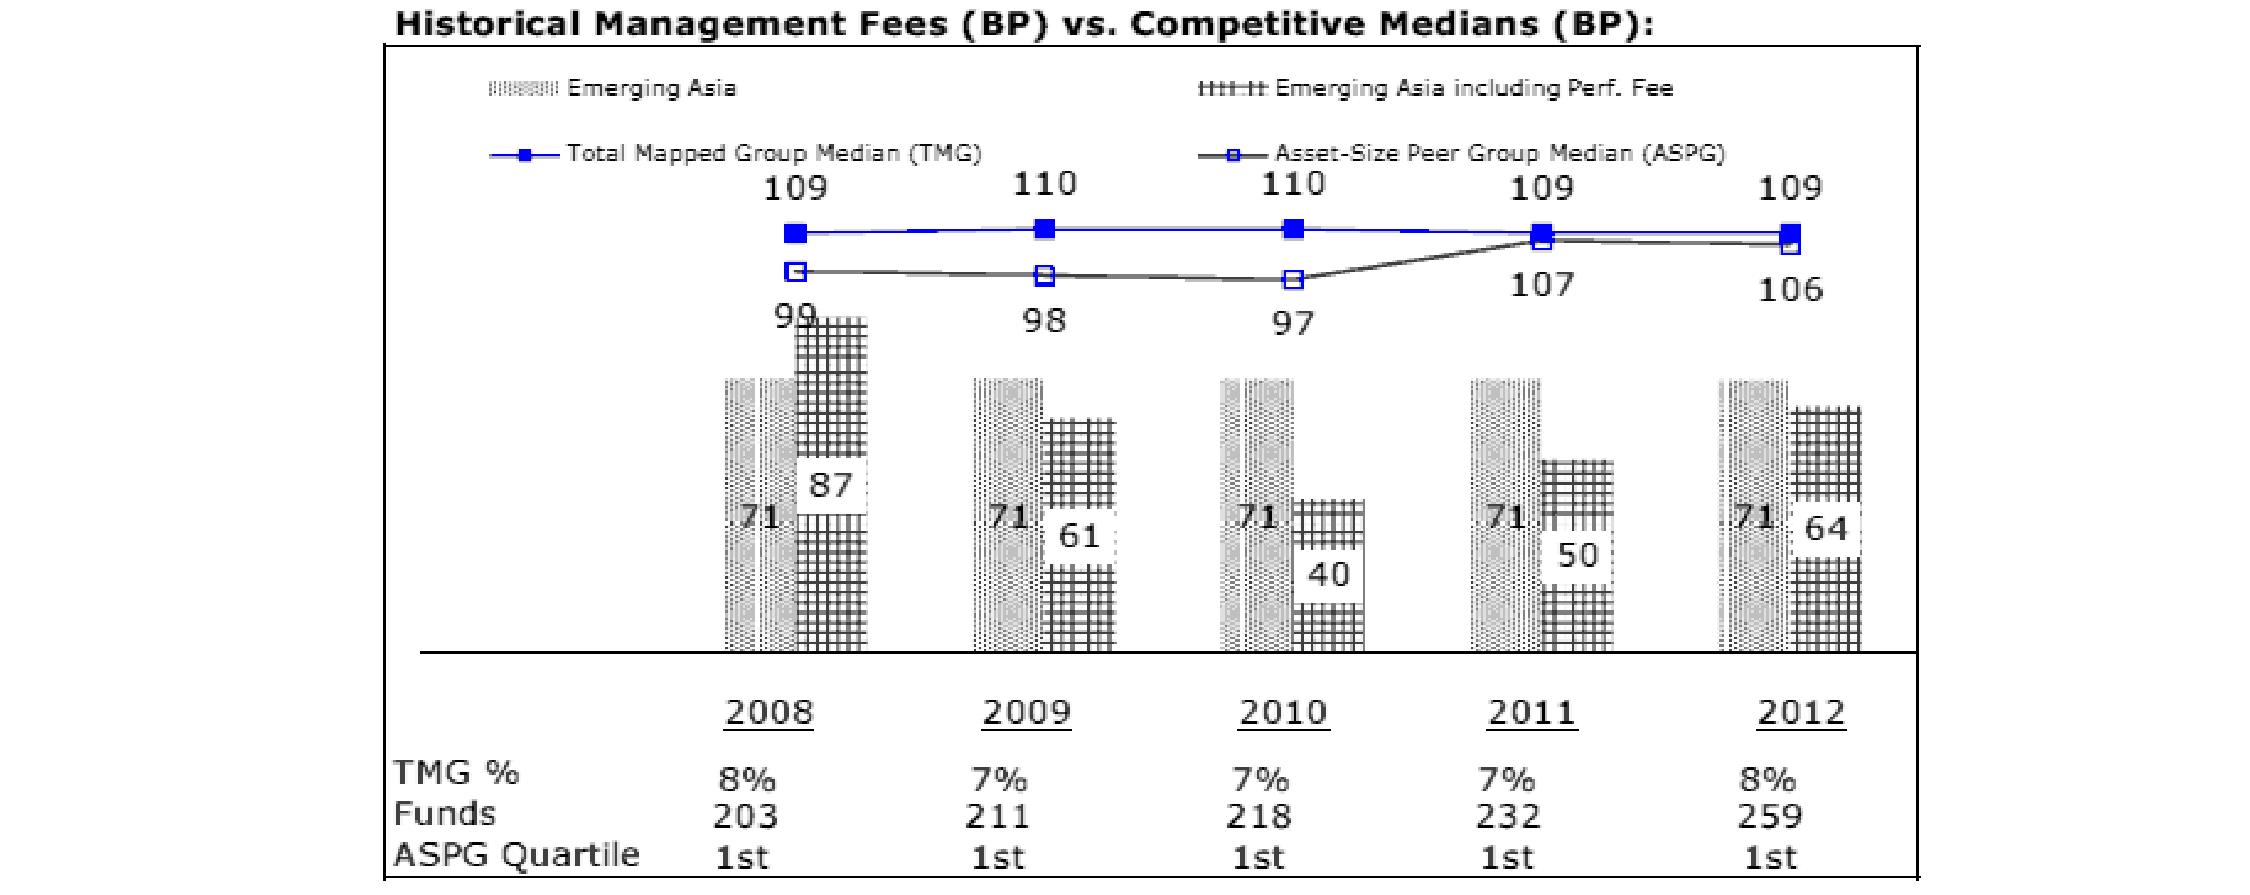
The Board noted that the fund's management fee ranked below the median of its Total Mapped Group and below the median of its ASPG for 2012. The Board also noted the effect of the fund's negative performance adjustment on the fund's management fee ranking.
Furthermore, the Board considered that shareholders of Emerging Asia Fund approved a change in the index used to calculate the fund's performance adjustment, beginning December 1, 2010. The Board also considered that, because the performance adjustment is based on a rolling 36-month measurement period, during a transition period the fund's performance is compared to a blended index return that reflects the performance of the former index for the portion of the measurement period prior to December 1, 2010 and the performance of the current index for the remainder of the measurement period. The Board noted that the fund's performance adjustments for 2010 through 2012 shown in the chart above reflect the effect of using the blended index return to calculate the fund's performance adjustment.
Fidelity Emerging Markets Fund
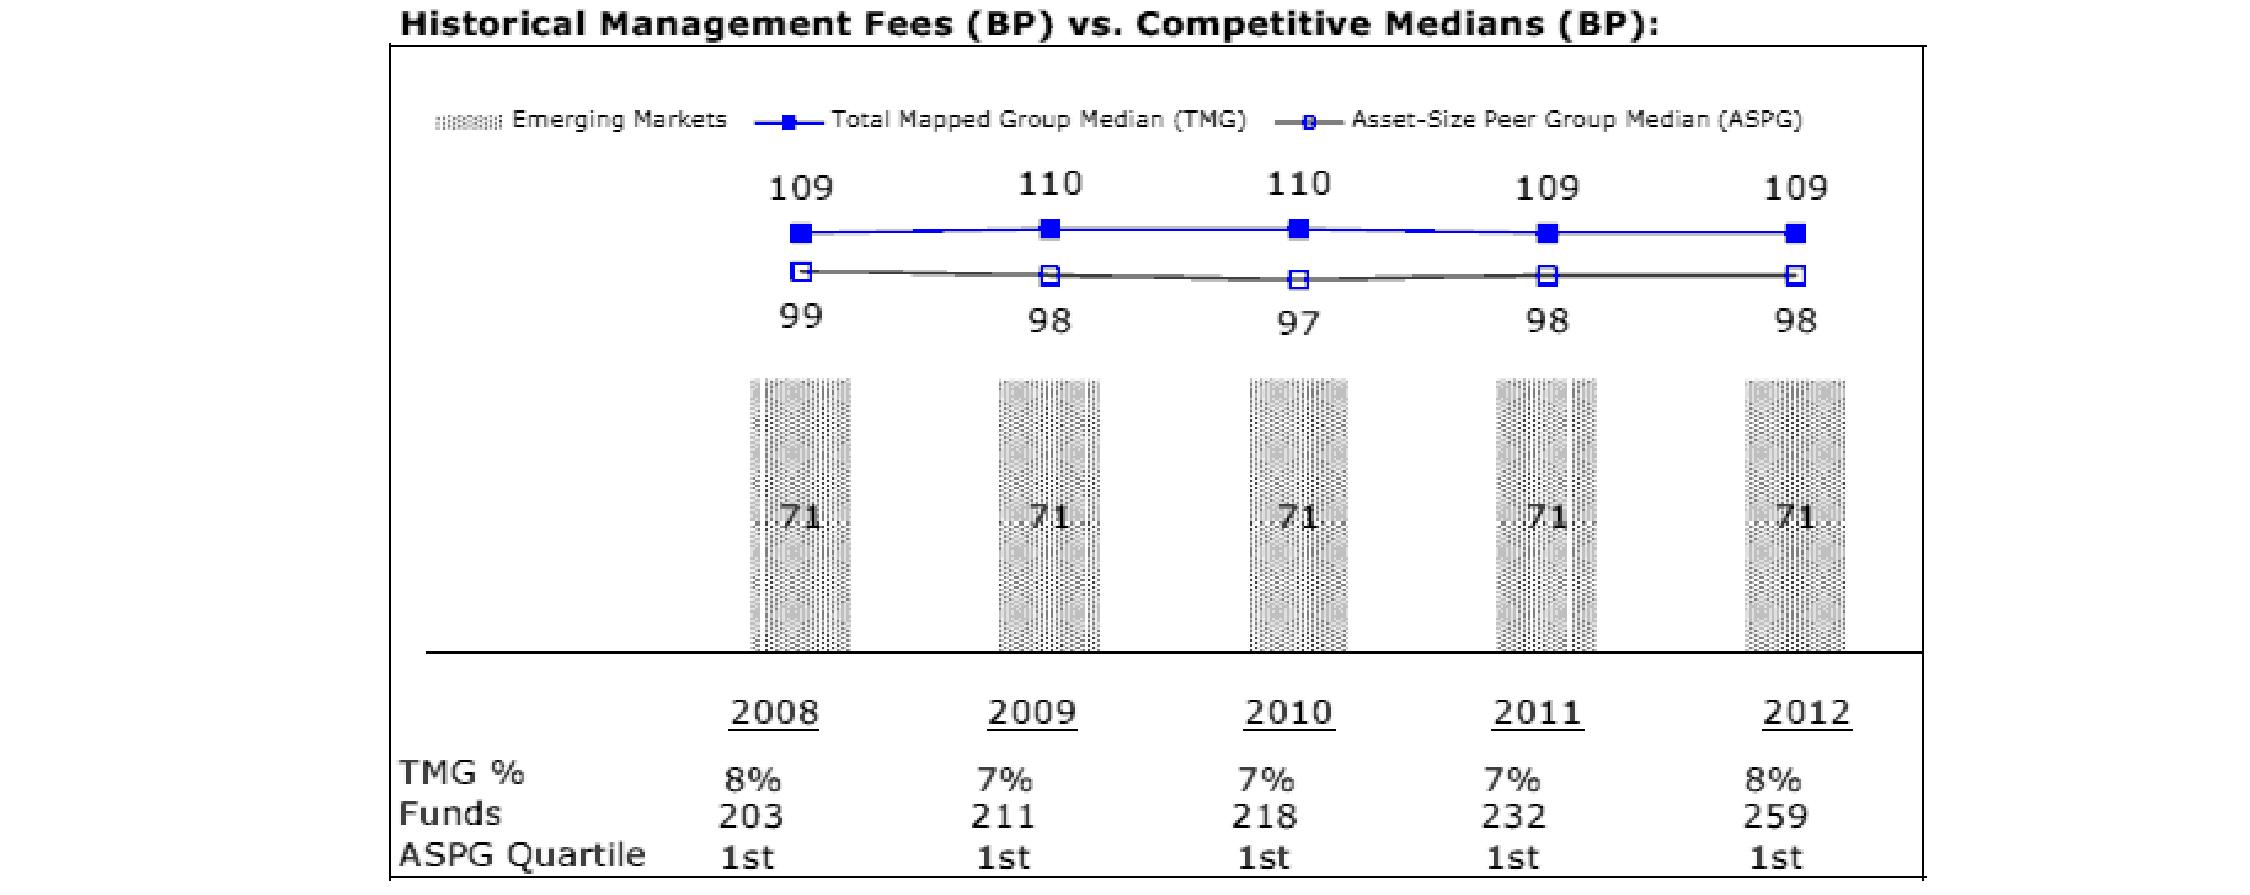
The Board noted that the fund's management fee ranked below the median of its Total Mapped Group and below the median of its ASPG for 2012.
Annual Report
Board Approval of Investment Advisory Contracts and Management Fees - continued
Fidelity Europe Fund
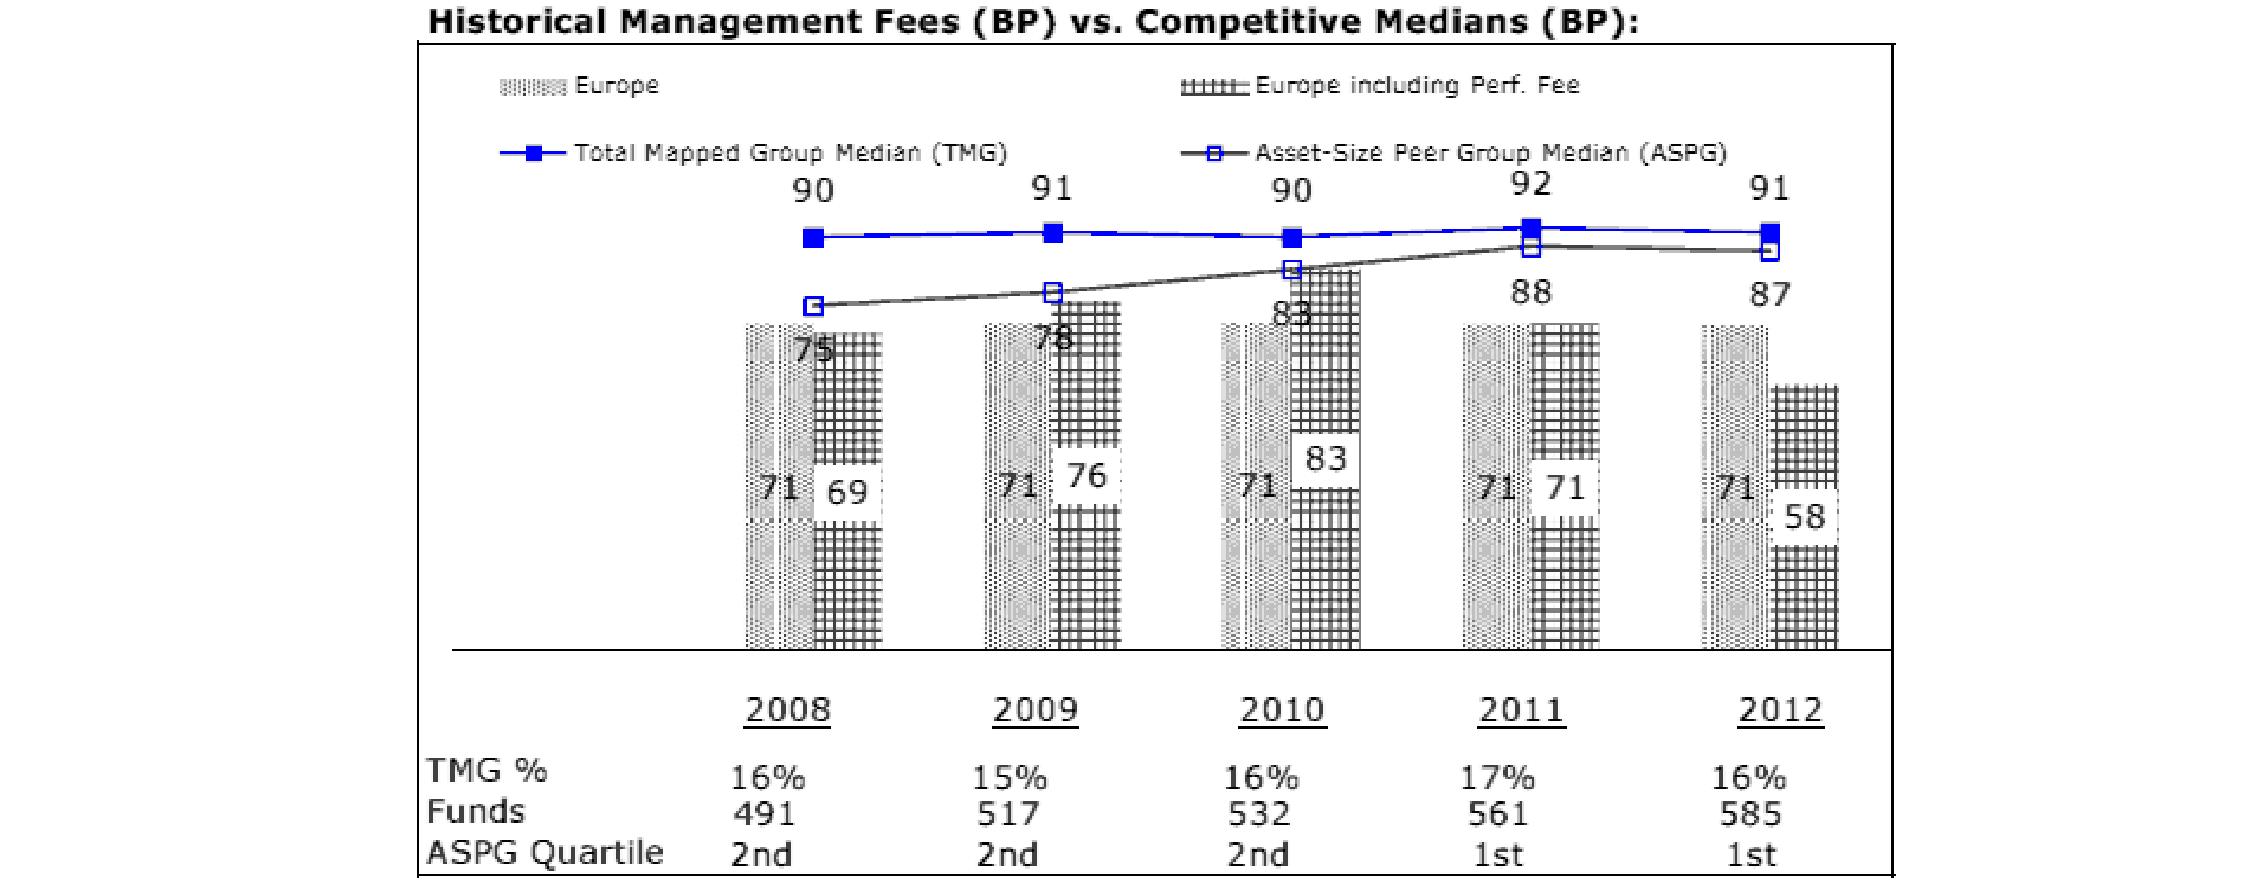
The Board noted that the fund's management fee ranked below the median of its Total Mapped Group and below the median of its ASPG for 2012. The Board also noted the effect of the fund's negative performance adjustment on the fund's management fee ranking.
Fidelity Europe Capital Appreciation Fund
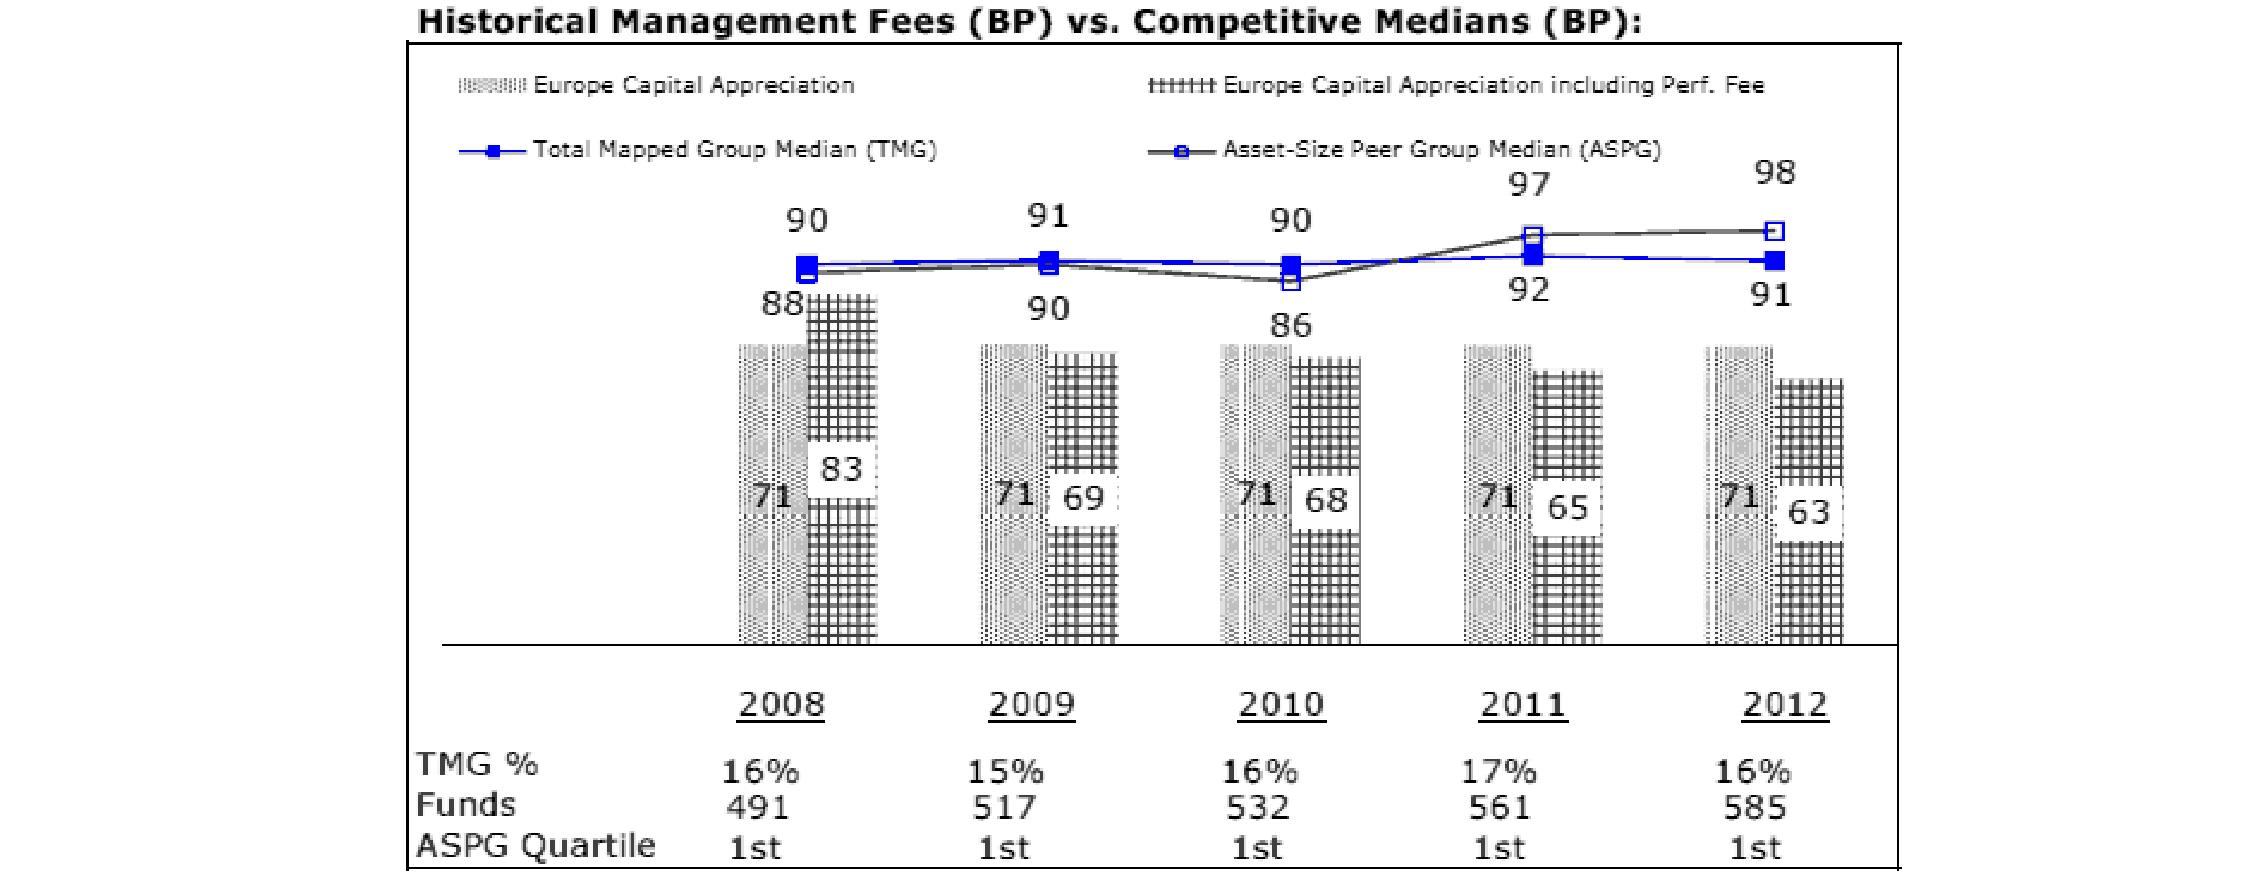
The Board noted that the fund's management fee ranked below the median of its Total Mapped Group and below the median of its ASPG for 2012. The Board also noted the effect of the fund's negative performance adjustment on the fund's management fee ranking.
Annual Report
Fidelity Japan Fund
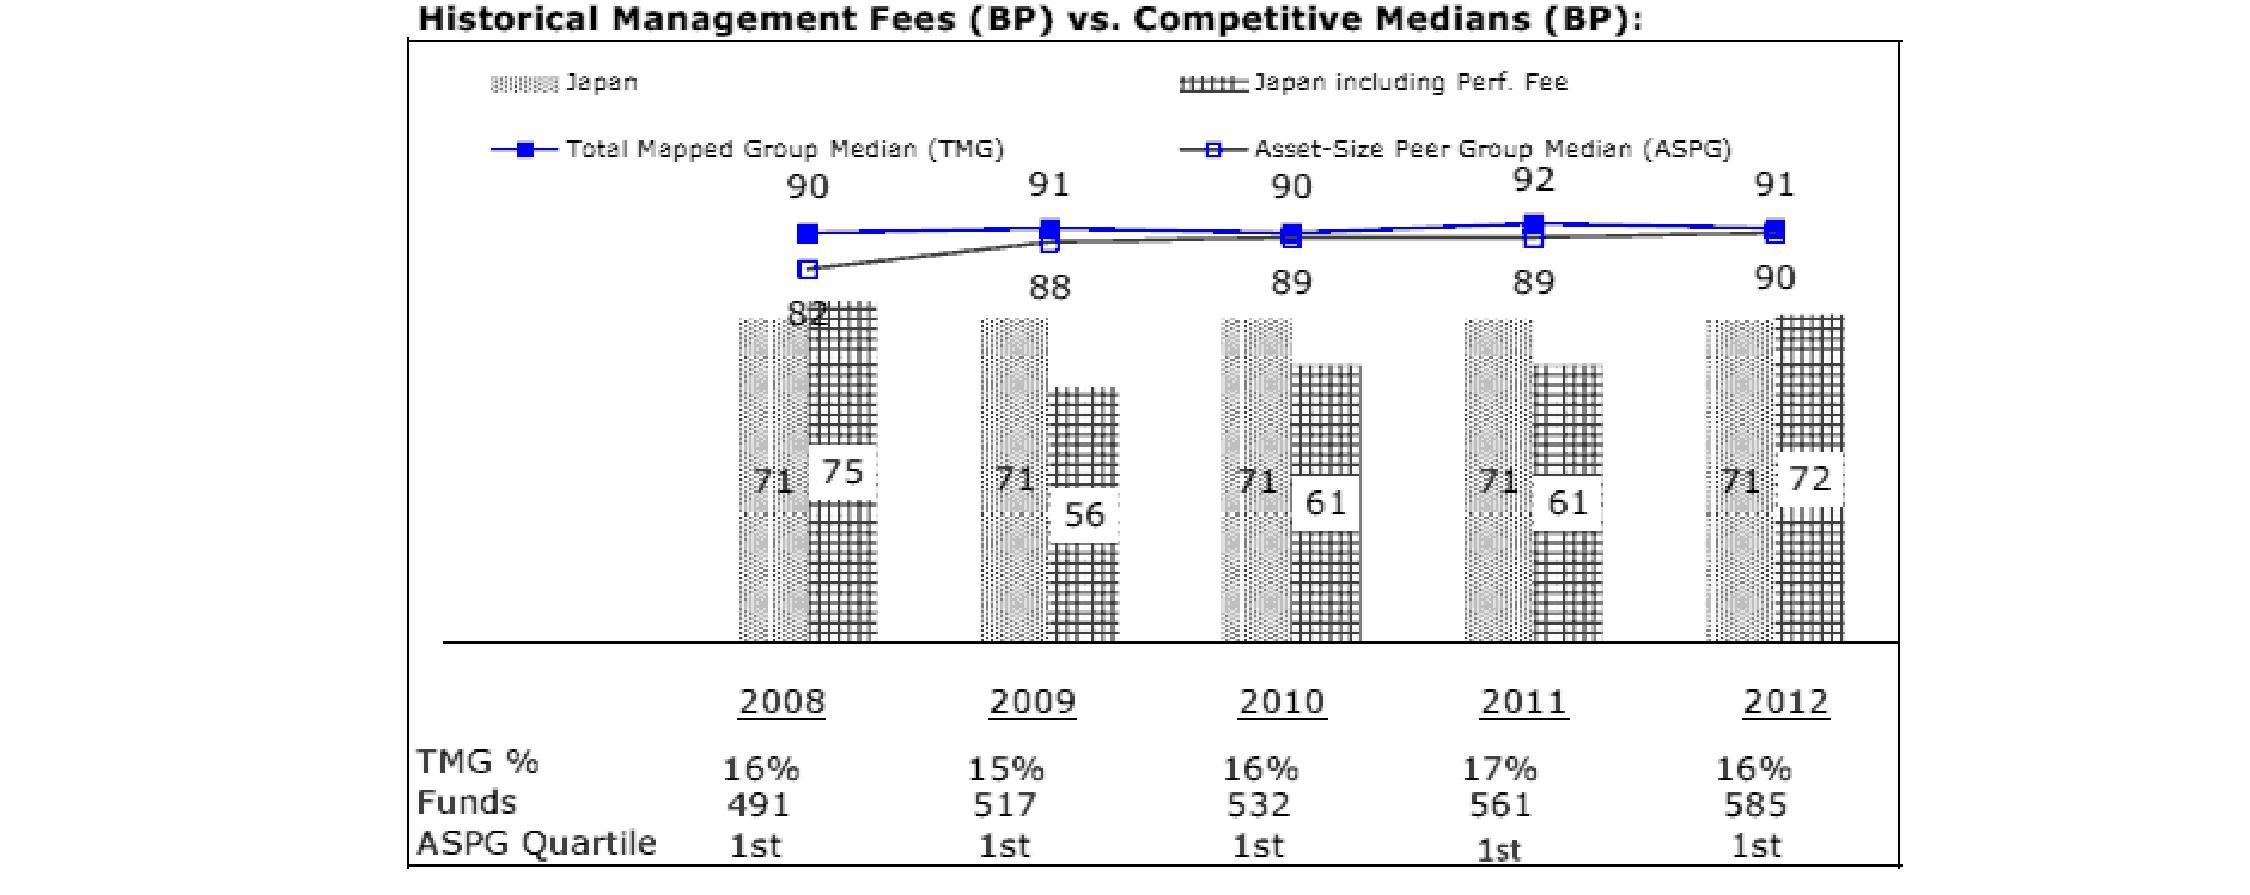
The Board noted that the fund's management fee ranked below the median of its Total Mapped Group and below the median of its ASPG for 2012. The Board also noted the effect of the fund's positive performance adjustment on the fund's management fee ranking.
Fidelity Japan Smaller Companies Fund
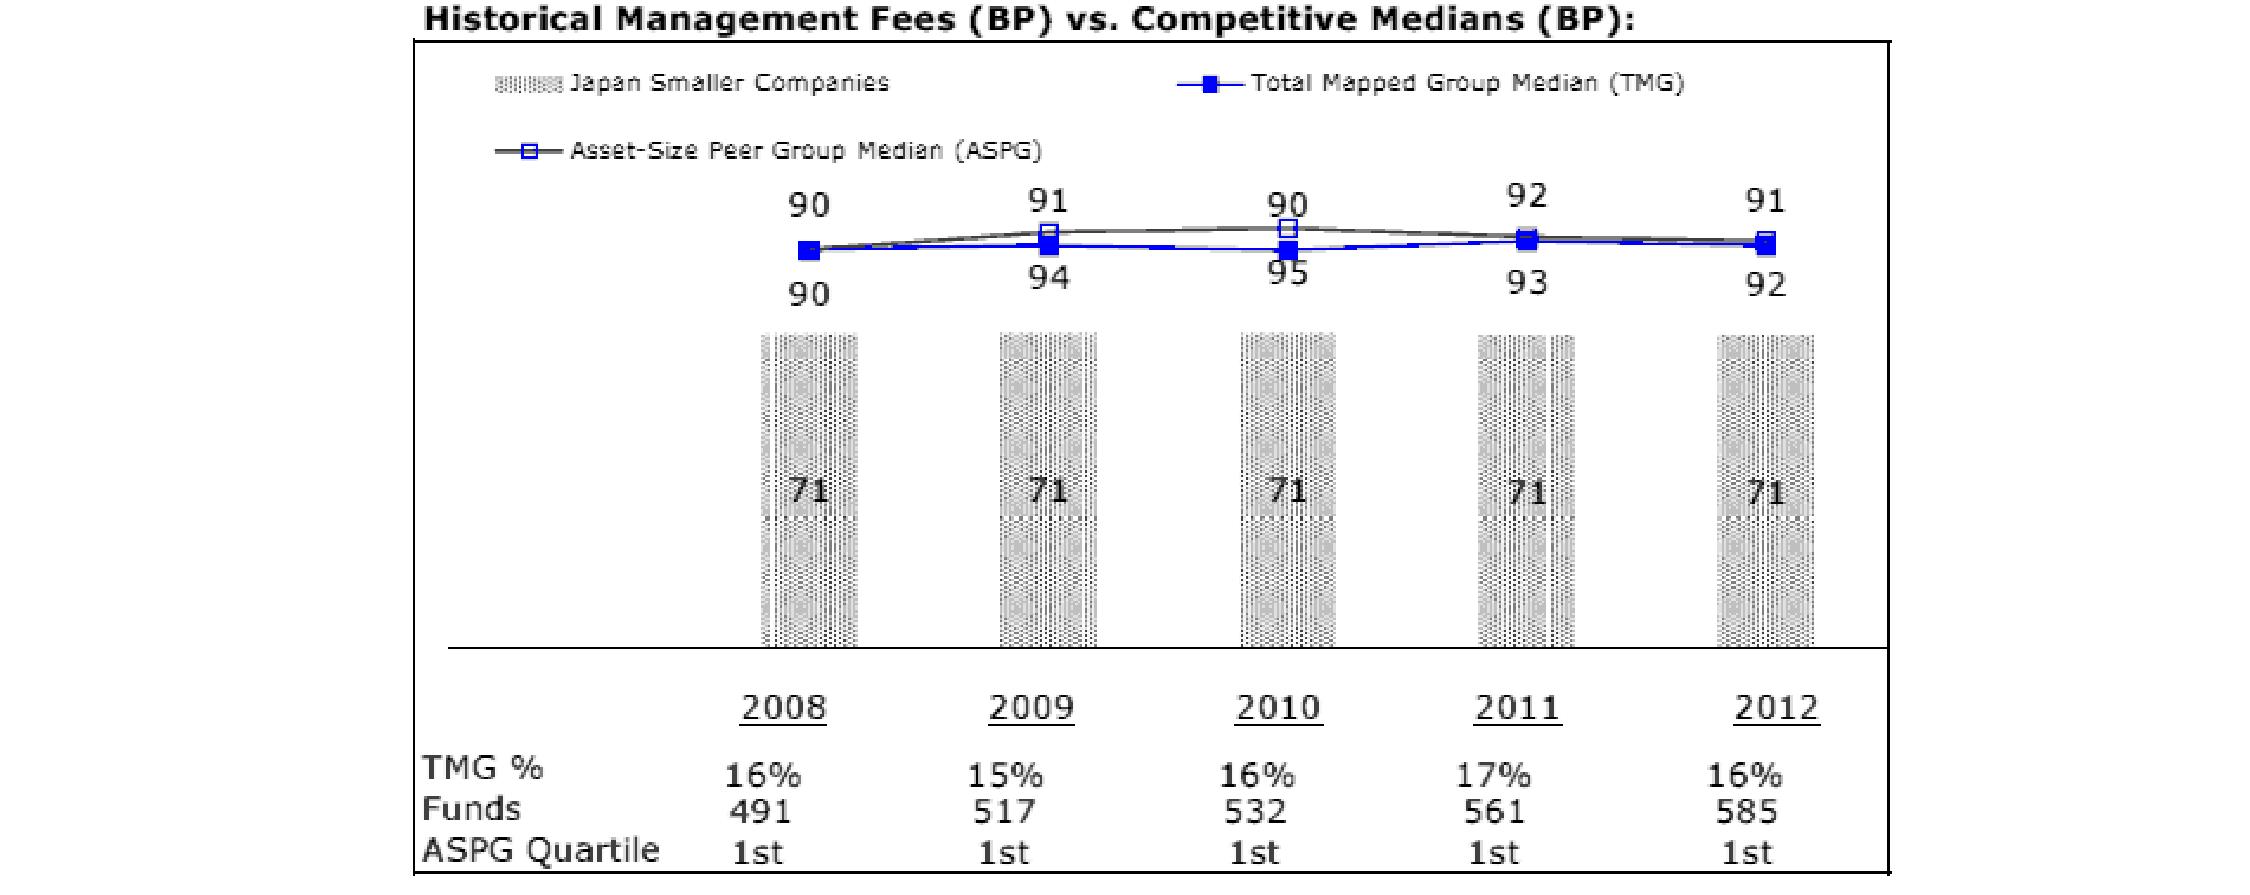
The Board noted that the fund's management fee ranked below the median of its Total Mapped Group and below the median of its ASPG for 2012.
Annual Report
Board Approval of Investment Advisory Contracts and Management Fees - continued
Fidelity Latin America Fund
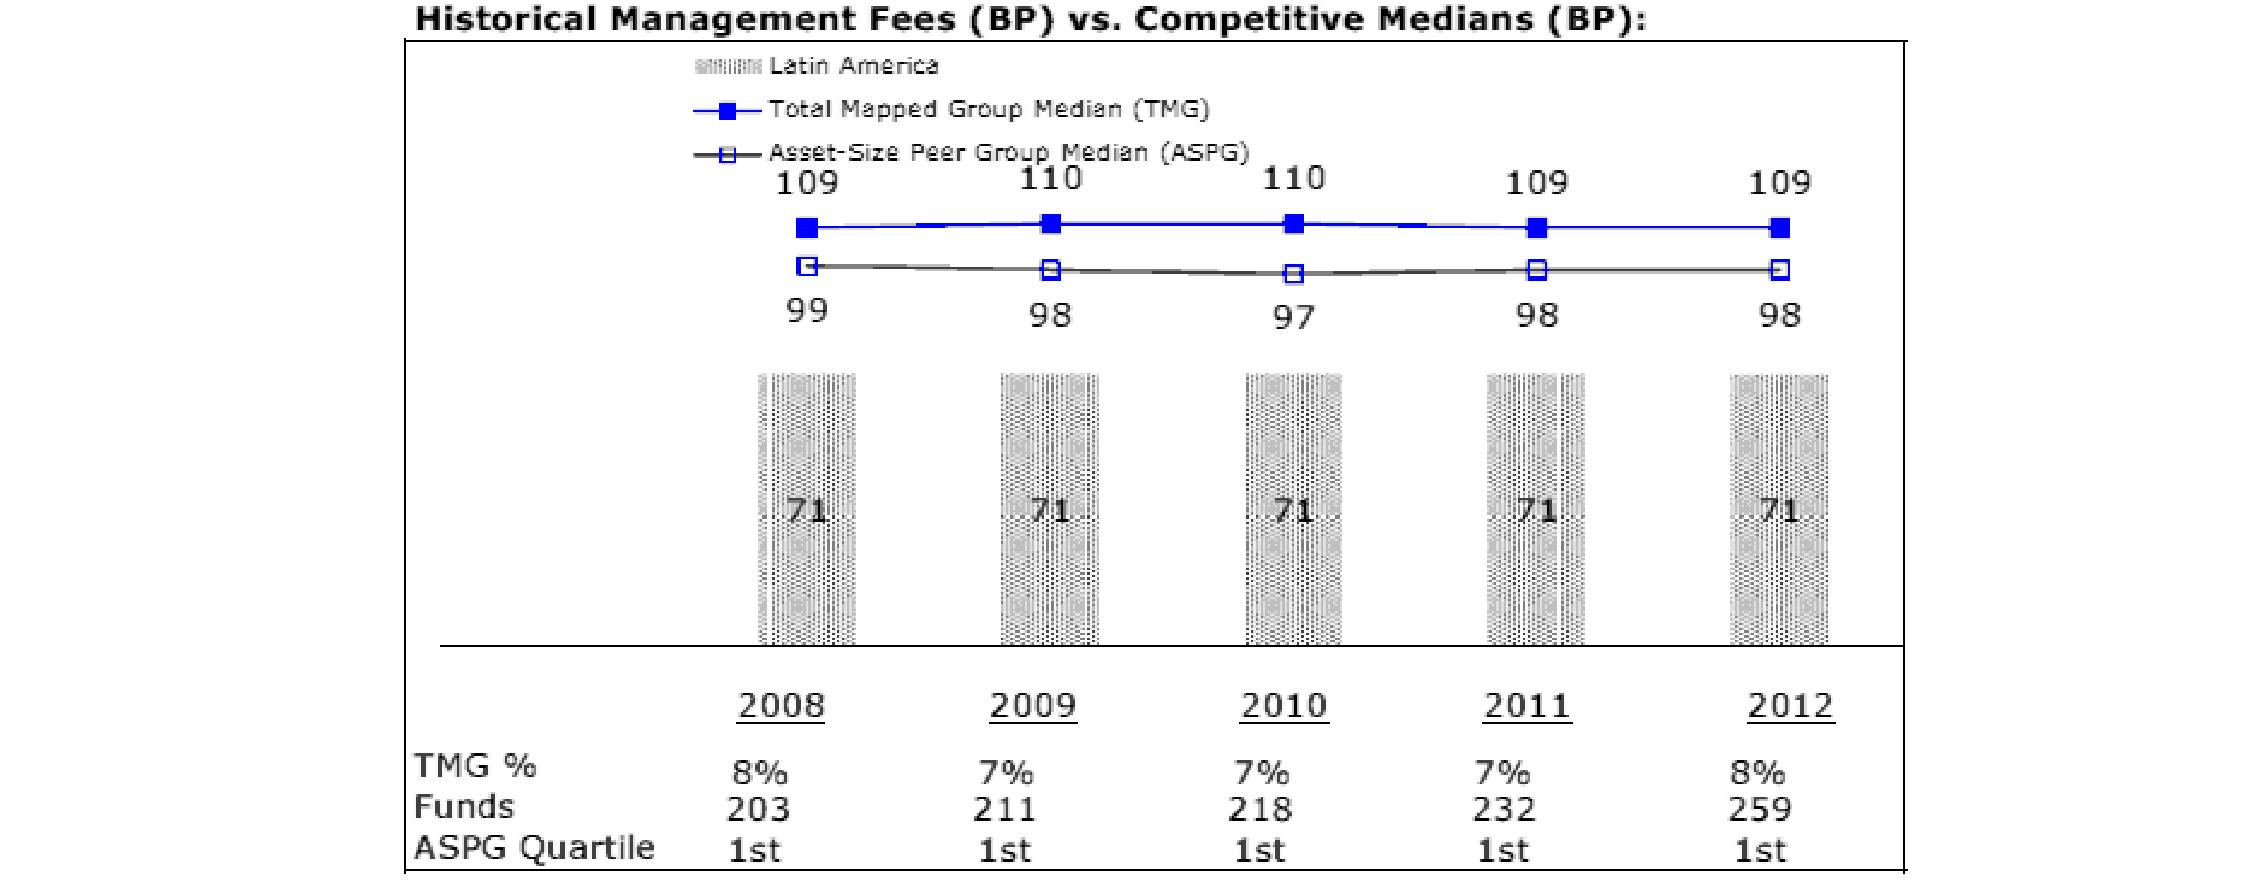
The Board noted that the fund's management fee ranked below the median of its Total Mapped Group and below the median of its ASPG for 2012.
Fidelity Nordic Fund
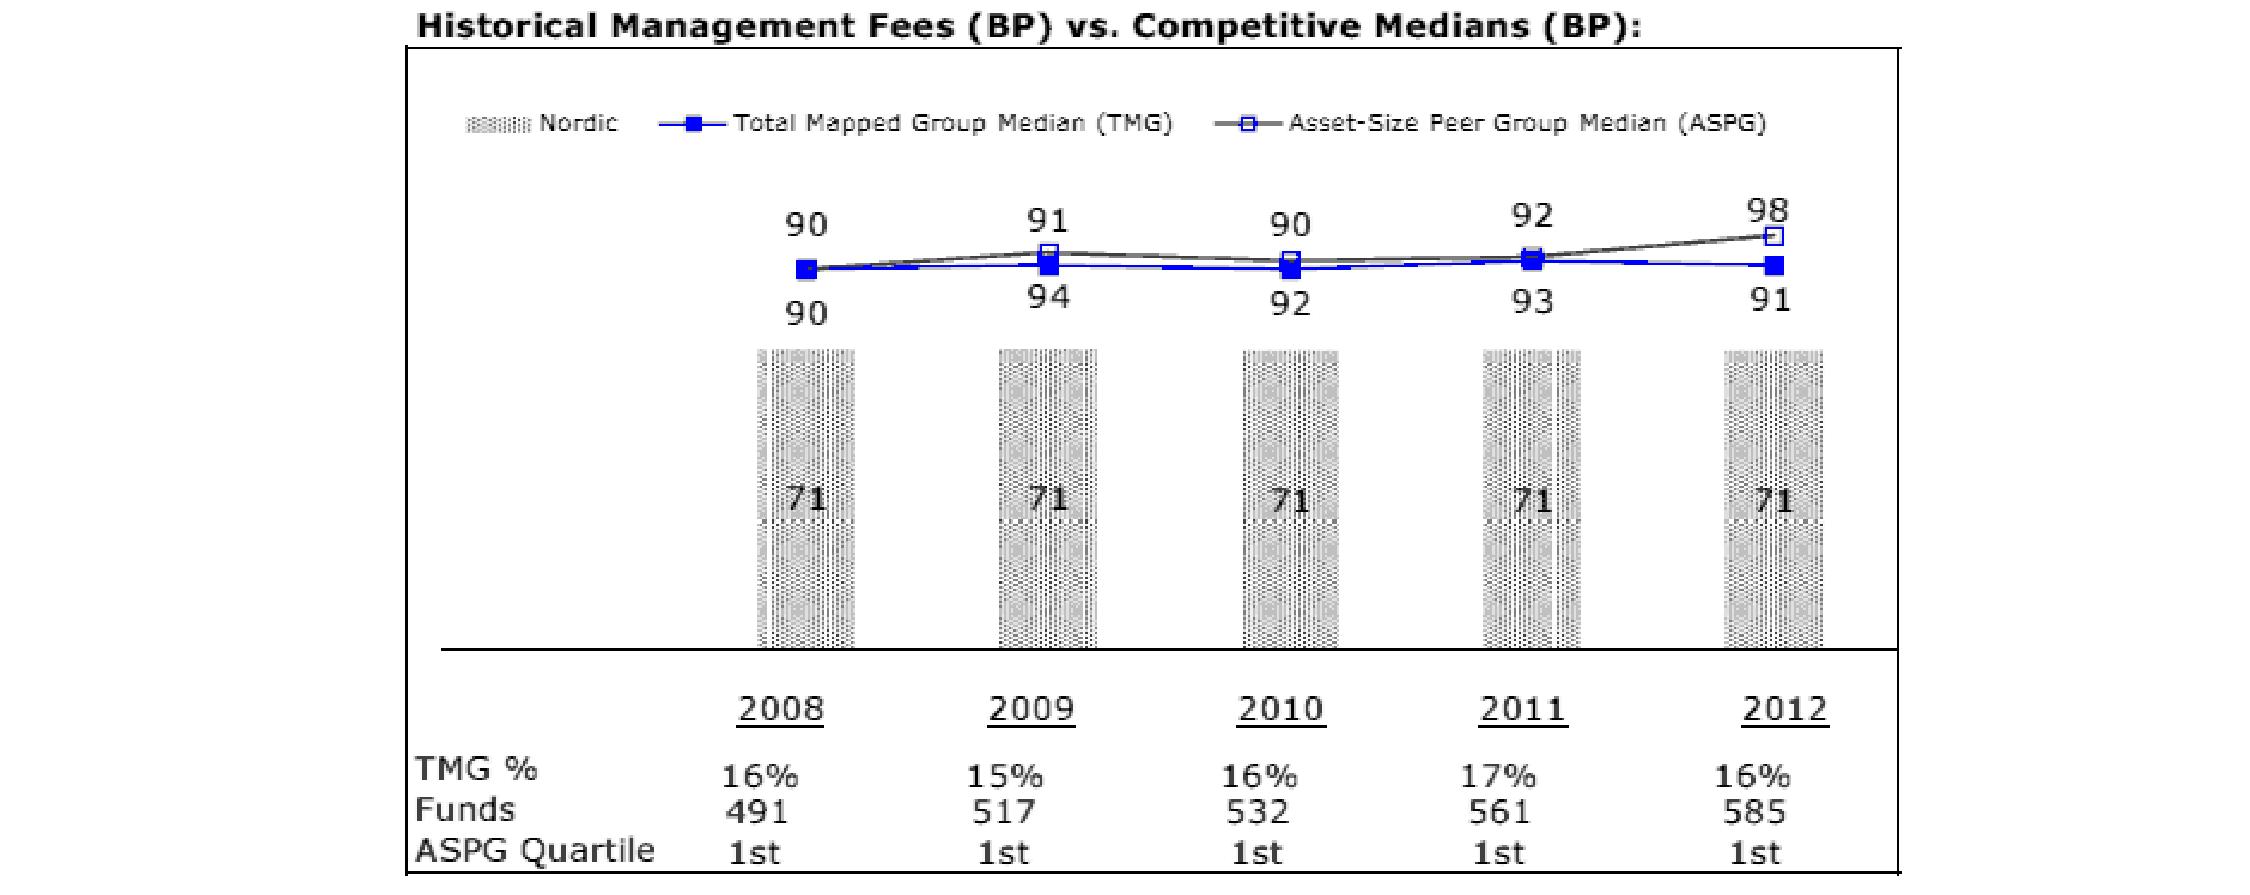
The Board noted that the fund's management fee ranked below the median of its Total Mapped Group and below the median of its ASPG for 2012.
Annual Report
Fidelity Pacific Basin Fund
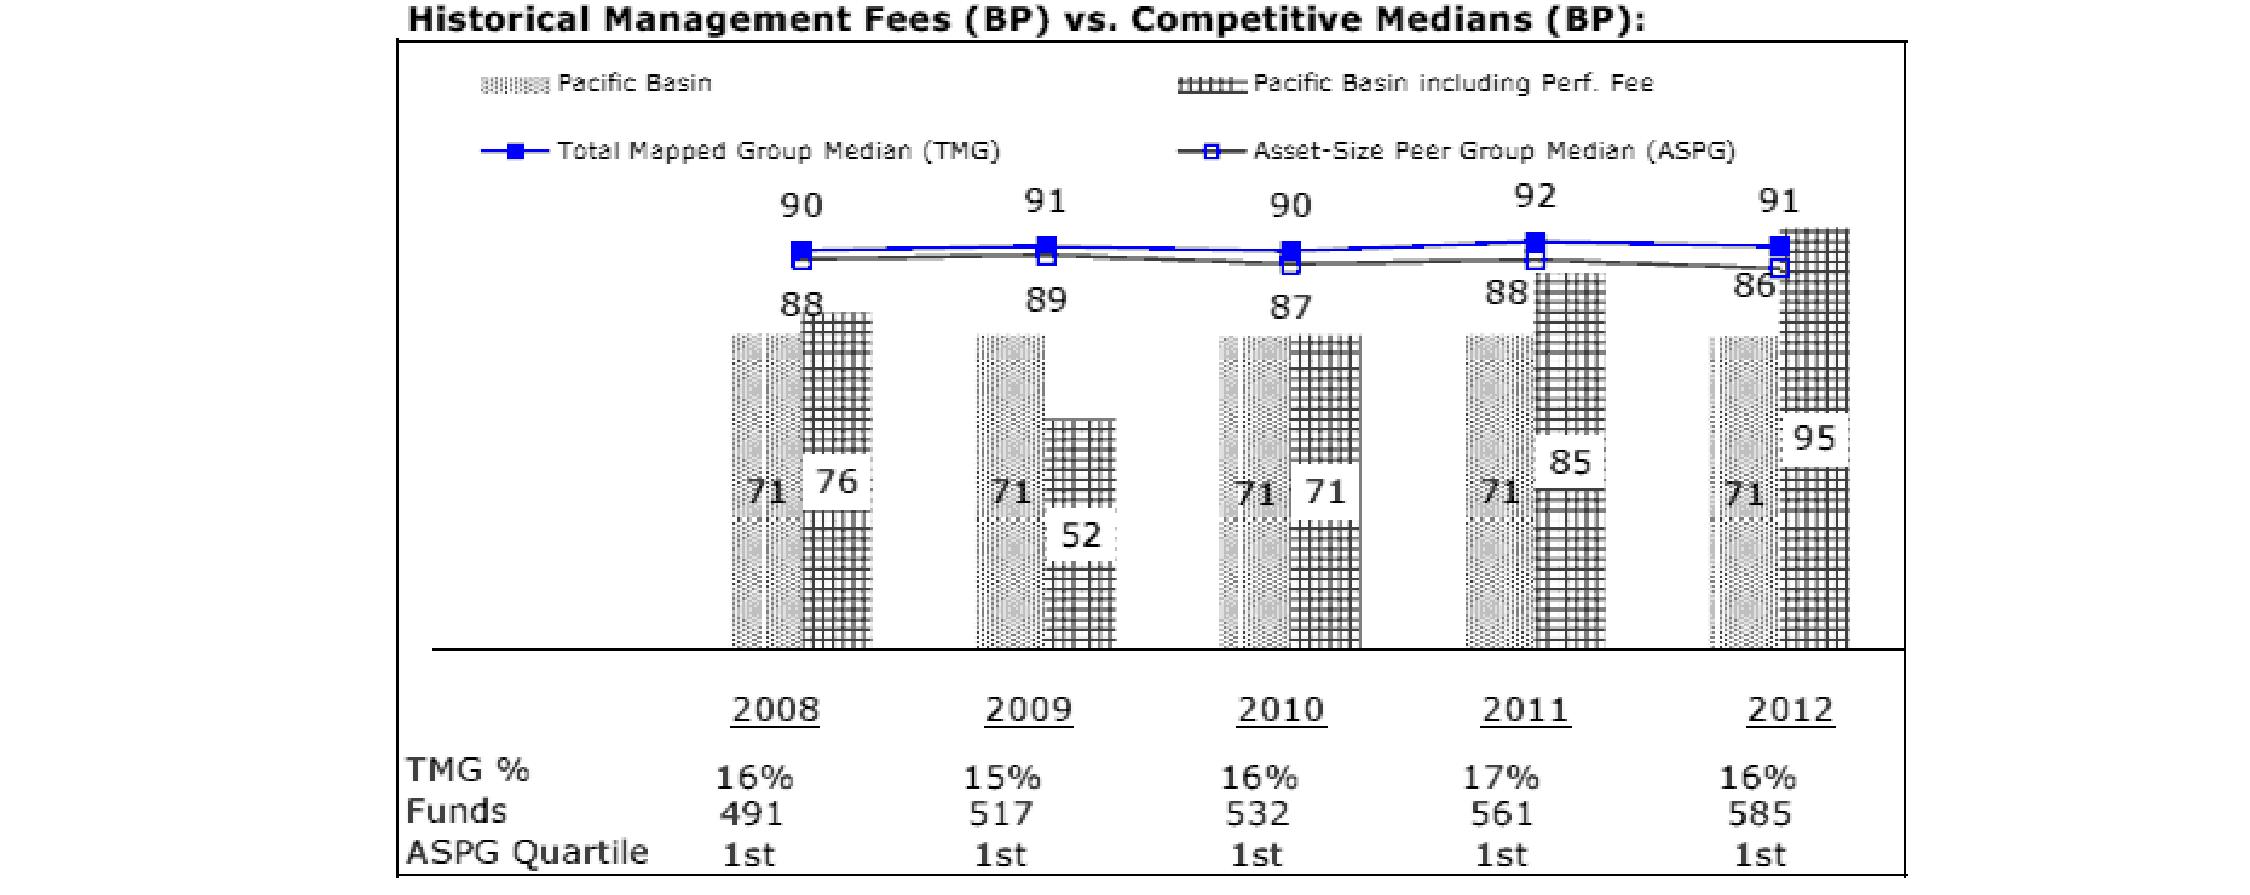
The Board noted that the fund's management fee ranked below the median of its Total Mapped Group and below the median of its ASPG for 2012. The Board also noted the effect of the fund's positive performance adjustment on the fund's management fee ranking.
Based on its review, the Board concluded that each fund's management fee is fair and reasonable in light of the services that the fund receives and the other factors considered.
Total Expense Ratio (for Fidelity Canada Fund, Fidelity China Region Fund, Fidelity Emerging Markets Fund, Fidelity Japan Fund, and Fidelity Latin America Fund). In its review of the total expense ratio of each class of each fund, the Board considered the fund's management fee as well as other fund or class expenses, as applicable, such as transfer agent fees, pricing and bookkeeping fees, fund-paid 12b-1 fees, and custodial, legal, and audit fees. The Board also noted the effects of any waivers and reimbursements on fees and expenses, as well as the impact of Fidelity Canada Fund's and Fidelity Japan Fund's performance adjustment. As part of its review, the Board also considered the current and historical total expense ratios of each class of each fund compared to competitive fund median expenses. Each class of each fund is compared to those funds and classes in the Total Mapped Group (used by the Board for management fee comparisons) that have a similar sales load structure.
The Board noted that the total expense ratio of each of Class A, Class B, Class C, Institutional Class, and the retail class of Fidelity Japan Fund ranked below its competitive median for 2012 and the total expense ratio of Class T ranked above its competitive median for 2012. The Board considered that, in general, various factors can affect total expense ratios. The Board noted that the total expense ratio of Class T was above the competitive median primarily because of higher 12b-1 fees on Class T. Class T has a higher 12b-1 fee, but a lower front-end sales charge, than traditionally priced front-end sales charge classes. The Board considered that Class T is primarily sold load-waived in the retirement plan market where its 0.50% 12b-1 fee is comparable to competing no-load, higher 12b-1 fee classes designed specifically for retirement plans. The Board noted that the fund offers multiple classes, each of which has a different sales load and 12b-1 fee structure, and that the multiple structures are intended to offer a range of pricing options for the intermediary market. The Board also noted that the total expense ratios of the classes vary primarily by the level of their 12b-1 fees, although differences in transfer agent fees may also cause expenses to vary from class to class.
The Board noted that the total expense ratio of each class of Fidelity Canada Fund, Fidelity China Region Fund, Fidelity Emerging Markets Fund, and Fidelity Latin America Fund ranked below its competitive median for 2012.
Total Expense Ratio (for Fidelity Emerging Asia Fund, Fidelity Europe Fund, Fidelity Europe Capital Appreciation Fund, Fidelity Japan Smaller Companies Fund, Fidelity Nordic Fund, and Fidelity Pacific Basin Fund). In its review of each fund's total expense ratio, the Board considered the fund's management fee as well as other fund expenses, such as transfer agent fees, pricing and bookkeeping fees, and custodial, legal, and audit fees. The Board also noted the effects of any waivers and reimbursements on fees and expenses, as well as the impact of Fidelity Emerging Asia Fund's, Fidelity Europe Fund's, Fidelity Europe Capital Appreciation Fund's, and Fidelity Pacific Basin Fund's performance adjustment. As part of its review, the Board also considered the current and historical total expense ratios of each fund compared to competitive fund median expenses. Each fund is compared to those funds and classes in the Total Mapped Group (used by the Board for management fee comparisons) that have a similar sales load structure.
The Board noted that the total expense ratio of each of Fidelity Emerging Asia Fund, Fidelity Europe Fund, Fidelity Europe Capital Appreciation Fund, Fidelity Japan Smaller Companies Fund, and Fidelity Nordic Fund ranked below its competitive median for 2012. The Board noted that Fidelity Pacific Basin Fund's total expense ratio ranked above its competitive median for 2012. The Board considered that, in general, various factors can affect total expense ratios. The Board also considered that Fidelity Pacific Basin Fund's total expense ratio ranked above its competitive median due to a positive performance adjustment in 2012.
Annual Report
Board Approval of Investment Advisory Contracts and Management Fees - continued
Fees Charged to Other Fidelity Clients. The Board also considered Fidelity fee structures and other information with respect to clients of FMR and its affiliates, such as other mutual funds advised or subadvised by FMR or its affiliates, pension plan clients, and other institutional clients. The Board noted the findings of the 2013 ad hoc joint committee (created with the board of other Fidelity funds), which reviewed and compared Fidelity's institutional investment advisory business with its business of providing services to the Fidelity funds, including the differences in services provided, fees charged, and costs incurred, as well as competition in their respective marketplaces.
Based on its review of total expense ratios and fees charged to other Fidelity clients, the Board concluded that the total expense ratio of each fund or each class of each fund, as applicable, was reasonable, although Fidelity Pacific Basin Fund and Class T of Fidelity Japan Fund were above the median of the universe presented for comparison, in light of the services that the fund and its shareholders receive and the other factors considered.
Costs of the Services and Profitability. The Board considered the revenues earned and the expenses incurred by Fidelity in conducting the business of developing, marketing, distributing, managing, administering and servicing each fund and servicing each fund's shareholders. The Board also considered the level of Fidelity's profits in respect of all the Fidelity funds.
On an annual basis, FMR presents to the Board Fidelity's profitability for each fund. Fidelity calculates the profitability for each fund, as well as aggregate profitability for groups of Fidelity funds and all Fidelity funds, using a series of detailed revenue and cost allocation methodologies which originate with the books and records of Fidelity on which Fidelity's audited financial statements are based. The Audit Committee of the Board reviews any significant changes from the prior year's methodologies.
PricewaterhouseCoopers LLP (PwC), independent registered public accounting firm and auditor to Fidelity and certain Fidelity funds, has been engaged annually by the Board as part of the Board's assessment of Fidelity's profitability analysis. PwC's engagement includes the review and assessment of the methodologies used by Fidelity in determining the revenues and expenses attributable to Fidelity's mutual fund business, and completion of agreed-upon procedures surrounding the mathematical accuracy of fund profitability and its conformity to allocation methodologies. After considering PwC's reports issued under the engagement and information provided by Fidelity, the Board concluded that while other allocation methods may also be reasonable, Fidelity's profitability methodologies are reasonable in all material respects.
The Board also reviewed Fidelity's non-fund businesses and fall-out benefits related to the mutual fund business as well as cases where Fidelity's affiliates may benefit from or be related to the funds' business.
The Board considered the costs of the services provided by and the profits realized by Fidelity in connection with the operation of each fund and was satisfied that the profitability was not excessive in the circumstances.
Economies of Scale. The Board considered whether there have been economies of scale in respect of the management of the Fidelity funds, whether the Fidelity funds (including each fund) have appropriately benefited from any such economies of scale, and whether there is potential for realization of any further economies of scale. The Board considered the extent to which each fund will benefit from economies of scale through increased services to the fund, through waivers or reimbursements, or through fee or expense reductions. The Board also noted that in 2009, it and the board of other Fidelity funds created an ad hoc committee (the Economies of Scale Committee) to analyze whether FMR attains economies of scale in respect of the management and servicing of the Fidelity funds, whether the Fidelity funds have appropriately benefited from such economies of scale, and whether there is potential for realization of any further economies of scale.
The Board recognized that each fund's management contract incorporates a "group fee" structure, which provides for lower group fee rates as total fund assets under FMR's management increase, and for higher group fee rates as total fund assets under FMR's management decrease. FMR calculates the group fee rates based on a tiered asset "breakpoint" schedule that varies based on asset class. The Board considered that the group fee is designed to deliver the benefits of economies of scale to fund shareholders when total Fidelity fund assets increase, even if assets of any particular fund are unchanged or have declined, because some portion of Fidelity's costs are attributable to services provided to all Fidelity funds, and all funds benefit if those costs can be allocated among more assets. The Board also considered that although Fidelity Europe Capital Appreciation Fund is expected to partially close to new investors, it will continue to incur investment management expenses, and marketing and distribution expenses related to the retention of existing shareholders and assets. The Board further noted that Fidelity Europe Capital Appreciation Fund may continue to realize benefits from the group fee structure, even though, after it is partially closed, assets may not be expected to grow significantly at the fund level. The Board concluded that, given the group fee structure, fund shareholders will benefit from lower management fees as assets under FMR's management increase at the fund complex level, regardless of whether Fidelity achieves any such economies of scale.
The Board concluded, taking into account the analysis of the Economies of Scale Committee, that economies of scale, if any, are being appropriately shared between fund shareholders and Fidelity.
Annual Report
Amendment to Description of Group Fee Rate. At its July 2013 meeting, the Board voted to approve an amendment to each fund's management contract to modify the description of the "group fee rate" effective August 1, 2013. The Board noted that under the prior description in the contract, the group fee rate was based on the average net assets of all registered investment companies with which FMR has management contracts. Under the contract's tiered asset breakpoint schedule, the group fee rate is lower as total fund assets under FMR's management increase, and higher as total fund assets under FMR's management decrease. The Board considered that the prior description would have excluded the assets of 64 Fidelity sector funds from the group fee rate calculation once Fidelity SelectCo, LLC, an affiliate of FMR, assumed management responsibilities for those funds. The Board noted that modifying the description of the group fee rate to continue to include the assets of those 64 funds for purposes of determining group fee rate breakpoints would avoid an immediate adverse impact on the group fee rate for any fund.
Additional Information Requested by the Board. In order to develop fully the factual basis for consideration of the Fidelity funds' Advisory Contracts, the Board requested and received additional information on certain topics, including: (i) fund performance trends and Fidelity's long-term strategies for certain funds; (ii) the potential to further rationalize the Fidelity fund lineup with the possibility of achieving savings for the funds and Fidelity; (iii) the methodology with respect to competitive fund data and peer group classifications; (iv) the arrangements with, and performance of, certain sub-advisers on behalf of the Fidelity funds, as well as certain proposed participating affiliate arrangements; (v) the realization of fall-out benefits in certain Fidelity business units; (vi) Fidelity's group fee structures, including the rationale for the individual fee rates of certain categories of funds and the definition of group assets; (vii) trends regarding industry use of performance fee structures and the performance adjustment methodologies applicable to the Fidelity funds; (viii) additional competitive analysis regarding the total expenses for certain classes; and (ix) fund profitability methodology, including Fidelity's cost allocation methodology, and the impact of certain factors on fund profitability results.
Based on its evaluation of all of the conclusions noted above, and after considering all factors it believed relevant, the Board ultimately concluded that the advisory fee structures are fair and reasonable, and that each fund's Advisory Contracts should be renewed.
Annual Report
Fidelity Advisor®
Canada Fund -
Class A, Class T, Class B, and Class C
Annual Report
October 31, 2013
Class A, Class T, Class B, and Class C are
classes of Fidelity® Canada Fund
(Fidelity Cover Art)
Contents
Performance | (Click Here) | How the fund has done over time. |
Management's Discussion of Fund Performance | (Click Here) | The Portfolio Manager's review of fund performance and strategy. |
Shareholder Expense Example | (Click Here) | An example of shareholder expenses. |
Investment Changes | (Click Here) | A summary of major shifts in the fund's investments over the past six months. |
Investments | (Click Here) | A complete list of the fund's investments with their market values. |
Financial Statements | (Click Here) | Statements of assets and liabilities, operations, and changes in net assets, as well as financial highlights. |
Notes | (Click Here) | Notes to the financial statements. |
Report of Independent Registered Public Accounting Firm | (Click Here) | |
Trustees and Officers | (Click Here) | |
Distributions | (Click Here) | |
Board Approval of Investment Advisory Contracts and Management Fees | (Click Here) | |
To view a fund's proxy voting guidelines and proxy voting record for the 12-month period ended June 30, visit http://www.fidelity.com/proxyvotingresults or visit the Securities and Exchange Commission's (SEC) web site at http://www.sec.gov. You may also call 1-877-208-0098 to request a free copy of the proxy voting guidelines.
Standard & Poor's, S&P and S&P 500 are registered service marks of The McGraw-Hill Companies, Inc. and have been licensed for use by Fidelity Distributors Corporation.
Other third-party marks appearing herein are the property of their respective owners.
All other marks appearing herein are registered or unregistered trademarks or service marks of FMR LLC or an affiliated company. © 2013 FMR LLC. All rights reserved.
This report and the financial statements contained herein are submitted for the general information of the shareholders of the fund. This report is not authorized for distribution to prospective investors in the fund unless preceded or accompanied by an effective prospectus.
A fund files its complete schedule of portfolio holdings with the SEC for the first and third quarters of each fiscal year on Form N-Q. Forms N-Q are available on the SEC's web site at http://www.sec.gov. A fund's Forms N-Q may be reviewed and copied at the SEC's Public Reference Room in Washington, DC. Information regarding the operation of the SEC's Public Reference Room may be obtained by calling 1-800-SEC-0330. For a complete list of a fund's portfolio holdings, view the most recent holdings listing, semiannual report, or annual report on Fidelity's web site at http://www.fidelity.com, http://www.advisor.fidelity.com, or http://www.401k.com, as applicable.
NOT FDIC INSURED • MAY LOSE VALUE • NO BANK GUARANTEE
Neither the fund nor Fidelity Distributors Corporation is a bank.
Annual Report
Average annual total return reflects the change in the value of an investment, assuming reinvestment of the class' distributions from dividend income and capital gains (the profits earned upon the sale of securities that have grown in value, if any) and assuming a constant rate of performance each year. The $10,000 table and the fund's returns do not reflect the deduction of taxes that a shareholder would pay on fund distributions or the redemption of fund shares. During periods of reimbursement by Fidelity, a fund's total return will be greater than it would be had the reimbursement not occurred. How a fund did yesterday is no guarantee of how it will do tomorrow.
Average Annual Total Returns
Periods ended October 31, 2013 | Past 1
year | Past 5
years | Past 10
years |
Class A (incl. 5.75% sales charge)A | 1.77% | 8.19% | 9.54% |
Class T (incl. 3.50% sales charge) B | 3.92% | 8.40% | 9.60% |
Class B (incl. contingent deferred sales charge) C | 2.17% | 8.35% | 9.64% |
Class C (incl. contingent deferred sales charge) D | 6.21% | 8.67% | 9.66% |
A Class A shares bear a 0.25% 12b-1 fee. The initial offering of Class A shares took place on May 2, 2007. Returns prior to May 2, 2007 are those of Fidelity® Canada Fund, the original class of the fund, which has no 12b-1 fee. Had Class A shares' 12b-1 fee been reflected, returns prior to May 2, 2007 would have been lower.
B Class T shares bear a 0.50% 12b-1 fee. The initial offering of Class T shares took place on May 2, 2007. Returns prior to May 2, 2007 are those of Fidelity® Canada Fund, the original class of the fund, which has no 12b-1 fee. Had Class T shares' 12b-1 fee been reflected, returns prior to May 2, 2007 would have been lower.
C Class B shares bear a 1.00% 12b-1 fee. The initial offering of Class B shares took place on May 2, 2007. Returns prior to May 2, 2007 are those of Fidelity Canada Fund, the original class of the fund, which has no 12b-1 fee. Had Class B shares' 12b-1 fee been reflected, returns prior to May 2, 2007 would have been lower. Class B shares' contingent deferred sales charge included in the past one year, past five years, and past ten years total return figures are 5%, 2%, and 0%, respectively.
D Class C shares bear a 1.00% 12b-1 fee. The initial offering of Class C shares took place on May 2, 2007. Returns prior to May 2, 2007 are those of Fidelity Canada Fund, the original class of the fund, which has no 12b-1 fee. Had Class C shares' 12b-1 fee been reflected, returns prior to May 2, 2007 would have been lower. Class C shares' contingent deferred sales charge included in the past one year, past five years, and past ten years total return figures are 1%, 0%, and 0%, respectively.
$10,000 Over 10 Years
Let's say hypothetically that $10,000 was invested in Fidelity Advisor® Canada Fund - Class A on October 31, 2003, and the current 5.75% sales charge was paid. The chart shows how the value of your investment would have changed, and also shows how the S&P®/TSX Composite Index performed over the same period. See footnote A above for additional information regarding the performance of Class A.
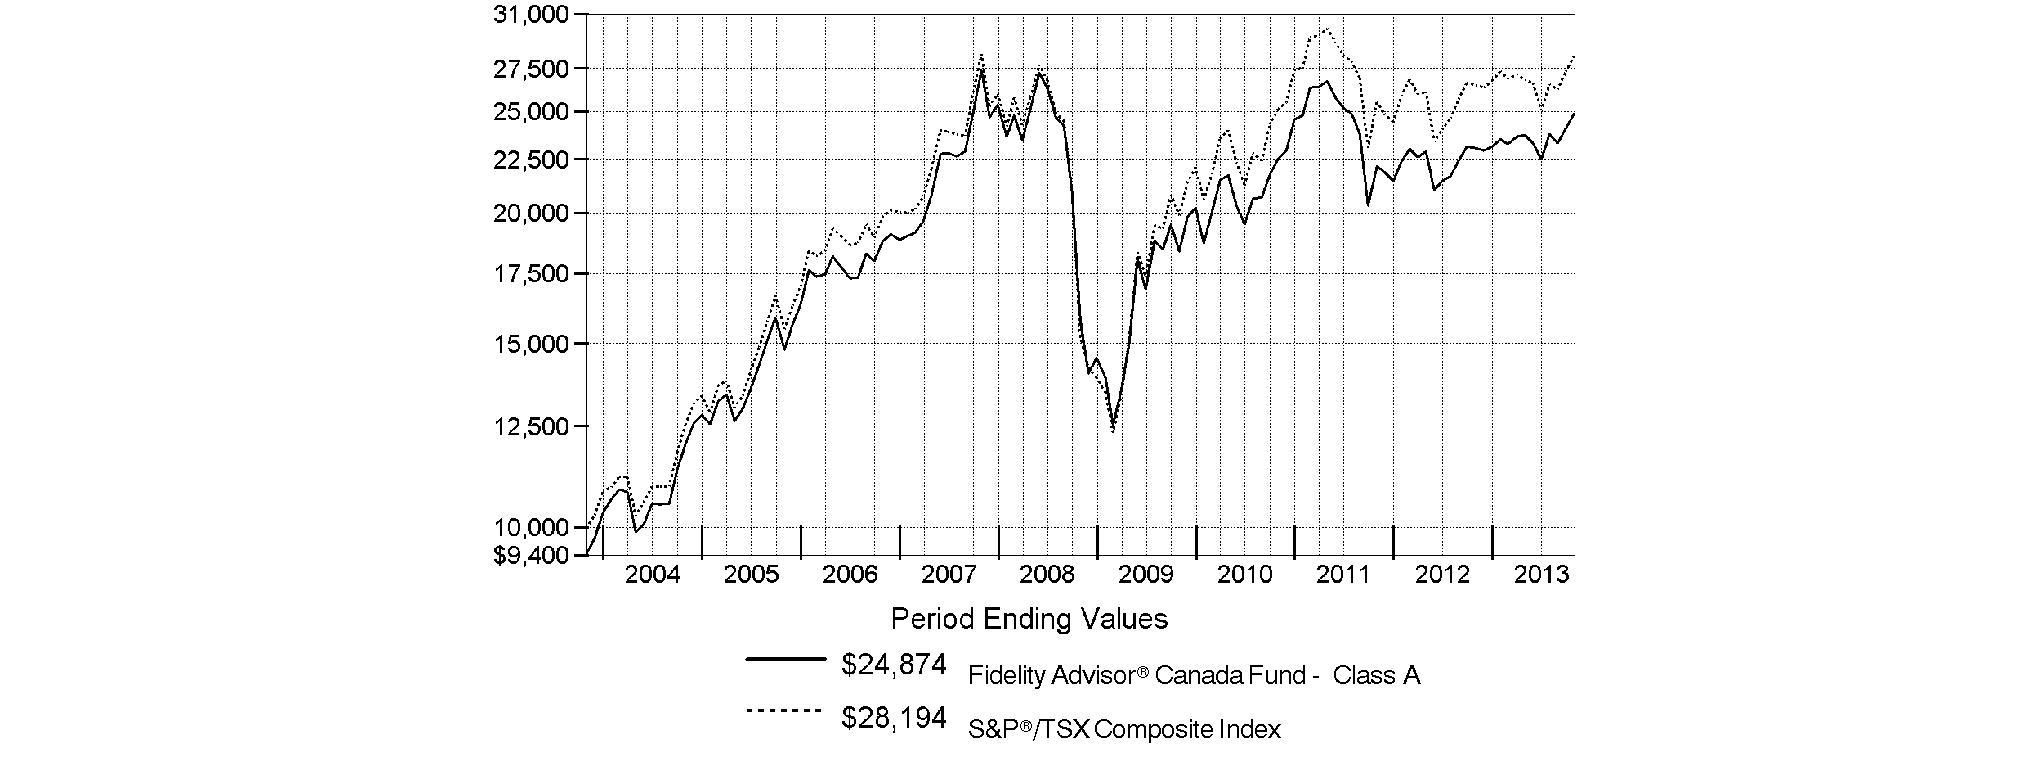
Annual Report
Market Recap: On balance, global equity markets remained upbeat for the 12-month period ending October 31, 2013. The MSCI® ACWI® (All Country World Index) Index gained 23.75% for the period, amid investor preference for higher-risk assets. The period was not without turbulence, however. In the spring and summer, central banks worldwide, especially in the U.S. and China, made clear their intentions to maintain accommodative monetary policies. That stance, combined with modest cyclical improvements around the globe and generally low valuations, underpinned the broad rally in equities. Europe (+32%) shone brightly, with most markets in the region - large and small - registering solid, index-beating gains. Another bright spot was Japan, which, despite a struggling yen and taking a second-half breather, posted a 34% result for the full year. The U.S. - by far the index's biggest constituent - also outperformed the global market with a roughly 28% advance. Meanwhile, Asia-Pacific ex Japan (+14%) lagged, hurt in part by a slowdown in Australia's mining industry as well as currency headwinds. Foreign-exchange and commodity weakness also curbed results in resource-heavy Canada and emerging markets (EM), both of which were up 7%. Country-level EM performance diverged meaningfully for the period, as evidenced by performance in Brazil (-1%), Russia (+12%), India (+1%) and China (+8%).
Comments from Douglas Lober, Portfolio Manager of Fidelity Advisor® Canada Fund: For the year, the fund's Class A, Class T, Class B and Class C shares rose 7.98%, 7.69%, 7.17% and 7.21%, respectively (excluding sales charges), beating the 6.38% gain of the S&P/TSX Composite Index. The Canadian economy showed modest growth for the year, as investor concern about high housing prices and elevated levels of consumer debt weighed on the market, which helped to create significant variation in sector performance. Commodity prices directly impact about 40% of the companies represented within the S&P/TSX index, so they are a major market influencer. During the past 12 months, commodity prices fluctuated and varied widely, mostly based on differing global supply-and-demand factors. During the reporting period, the fund was well-positioned for this type of market, and my focus on quality, growth-oriented companies paid off, particularly in the consumer discretionary and health care sectors, as did an underweighting in cyclically driven resources stocks. At the stock level, Valeant Pharmaceuticals International was by far the fund's biggest contributor, as rising demand globally for the specialty pharma firm's products, combined with a series of earnings-positive acquisitions, helped its stock soar 90%. Despite trimming my stake here, Valeant still ended the period as the fund's largest overweighted holding. Another significant contributor was Magna International, an auto-parts manufacturer serving mainly North America and Europe, whose stock has soared on the heels of the resurging U.S. auto industry. I think Magna is a well-run company perfectly positioned for growth given its heavy exposure to the U.S., so I ramped up my stake considerably. It's a similar story with Gildan Activewear, a T-shirt and apparel maker that has been a direct beneficiary of the improving U.S. economy. On the down side, my decision to underweight life insurance companies weighed on performance, as stocks in this industry tend to do well when interest rates and stock markets rise. Despite the fund's beneficial underweighting in materials, a handful of gold positions hurt, most notably my decision to overweight Goldcorp. By period end, I had slashed exposure to gold and other materials stocks. Another decision that dampened performance was not owning global financial services and publishing company Thomson Reuters. I chose to avoid this index name due to weakness in the business outlook of its key financial services customers, but this strategy did not pan out as the stock gained 39%.
Notes to shareholders: Fidelity Advisor Canada Fund may invest up to 35% of its total assets in any industry that represents more than 20% of the Canadian market. As of October 31, 2013, more than 25% of the fund's total assets were invested in securities of companies in the diversified banks industry, which accounted for 22.45% of the Canadian market, as represented by the S&P/TSX Composite Index.
On January 1, 2014, Risteard Hogan will join Douglas Lober as a co-portfolio manager of the fund.
Annual Report
P ALIGN="LEFT">
The views expressed above reflect those of the portfolio manager(s) only through the end of the period as stated on the cover of this report and do not necessarily represent the views of Fidelity or any other person in the Fidelity organization. Any such views are subject to change at any time based upon market or other conditions and Fidelity disclaims any responsibility to update such views. These views may not be relied on as investment advice and, because investment decisions for a Fidelity fund are based on numerous factors, may not be relied on as an indication of trading intent on behalf of any Fidelity fund.Annual Report
Fidelity Canada Fund
As a shareholder of the Fund, you incur two types of costs: (1) transaction costs, including sales charges (loads) on purchase payments or redemption proceeds, redemption fees and (2) ongoing costs, including management fees, distribution and/or service (12b-1) fees and other Fund expenses. This Example is intended to help you understand your ongoing costs (in dollars) of investing in the Fund and to compare these costs with the ongoing costs of investing in other mutual funds.
The Example is based on an investment of $1,000 invested at the beginning of the period and held for the entire period (May 1, 2013 to October 31, 2013).
Actual Expenses
The first line of the accompanying table for each class of the Fund provides information about actual account values and actual expenses. You may use the information in this line, together with the amount you invested, to estimate the expenses that you paid over the period. Simply divide your account value by $1,000.00 (for example, an $8,600 account value divided by $1,000.00 = 8.6), then multiply the result by the number in the first line for a class of the Fund under the heading entitled "Expenses Paid During Period" to estimate the expenses you paid on your account during this period. A small balance maintenance fee of $12.00 that is charged once a year may apply for certain accounts with a value of less than $2,000. This fee is not included in the table below. If it was, the estimate of expenses you paid during the period would be higher, and your ending account value lower, by this amount. In addition, the Fund, as a shareholder in the underlying Fidelity Central Funds, will indirectly bear its pro-rata share of the fees and expenses incurred by the underlying Fidelity Central Funds. These fees and expenses are not included in the Fund's annualized expense ratio used to calculate the expense estimate in the table below.
Hypothetical Example for Comparison Purposes
The second line of the accompanying table for each class of the Fund provides information about hypothetical account values and hypothetical expenses based on a Class' actual expense ratio and an assumed rate of return of 5% per year before expenses, which is not the Class' actual return. The hypothetical account values and expenses may not be used to estimate the actual ending account balance or expenses you paid for the period. You may use this information to compare the ongoing costs of investing in the Fund and other funds. To do so, compare this 5% hypothetical example with the 5% hypothetical examples that appear in the shareholder reports of the other funds. A small balance maintenance fee of $12.00 that is charged once a year may apply for certain accounts with a value of less than $2,000. This fee is not included in the table below. If it was, the estimate of expenses you paid during the period would be higher, and your ending account value lower, by this amount. In addition, the Fund, as a shareholder in the underlying Fidelity Central Funds, will indirectly bear its pro-rata share of the fees and expenses incurred by the underlying Fidelity Central Funds. These fees and expenses are not included in the Fund's annualized expense ratio used to calculate the expense estimate in the table below.
Please note that the expenses shown in the table are meant to highlight your ongoing costs only and do not reflect any transaction costs. Therefore, the second line of the table is useful in comparing ongoing costs only, and will not help you determine the relative total costs of owning different funds. In addition, if these transactional costs were included, your costs would have been higher.
| Annualized
Expense Ratio B | Beginning
Account Value
May 1, 2013 | Ending
Account Value
October 31, 2013 | Expenses Paid
During Period*
May 1, 2013
to October 31, 2013 |
Class A | 1.22% | | | |
Actual | | $ 1,000.00 | $ 1,048.50 | $ 6.30 |
HypotheticalA | | $ 1,000.00 | $ 1,019.06 | $ 6.21 |
Class T | 1.50% | | | |
Actual | | $ 1,000.00 | $ 1,047.10 | $ 7.74 |
HypotheticalA | | $ 1,000.00 | $ 1,017.64 | $ 7.63 |
Class B | 1.99% | | | |
Actual | | $ 1,000.00 | $ 1,044.50 | $ 10.25 |
HypotheticalA | | $ 1,000.00 | $ 1,015.17 | $ 10.11 |
Class C | 1.95% | | | |
Actual | | $ 1,000.00 | $ 1,044.70 | $ 10.05 |
HypotheticalA | | $ 1,000.00 | $ 1,015.38 | $ 9.91 |
Canada | .90% | | | |
Actual | | $ 1,000.00 | $ 1,050.20 | $ 4.65 |
HypotheticalA | | $ 1,000.00 | $ 1,020.67 | $ 4.58 |
Institutional Class | .89% | | | |
Actual | | $ 1,000.00 | $ 1,050.20 | $ 4.60 |
HypotheticalA | | $ 1,000.00 | $ 1,020.72 | $ 4.53 |
A 5% return per year before expenses
B Annualized expense ratio reflects expenses net of applicable fee waivers.
* Expenses are equal to each Class' annualized expense ratio, multiplied by the average account value over the period, multiplied by 184/365 (to reflect the one-half year period).
Annual Report
Fidelity Canada Fund
Investment Changes (Unaudited)
Geographic Diversification (% of fund's net assets) |
As of October 31, 2013 |
 | Canada | 92.8% | |
 | United States of America* | 7.2% | |

|
* Includes Short-Term Investments and Net Other Assets (Liabilities). |
Percentages are based on country or territory of incorporation and are adjusted for the effect of futures contracts, if applicable. |
As of April 30, 2013 |
| Canada | 95.6% | |
| United States of America* | 4.4% | |

* Includes Short-Term Investments and Net Other Assets (Liabilities). |
Percentages are based on country or territory of incorporation and are adjusted for the effect of futures contracts, if applicable. |
Asset Allocation as of October 31, 2013 |
| % of fund's
net assets | % of fund's net assets
6 months ago |
Stocks | 99.0 | 98.3 |
Short-Term Investments and Net Other Assets (Liabilities) | 1.0 | 1.7 |
Top Ten Stocks as of October 31, 2013 |
| % of fund's
net assets | % of fund's net assets
6 months ago |
Royal Bank of Canada (Commercial Banks) | 7.8 | 6.2 |
The Toronto-Dominion Bank (Commercial Banks) | 7.4 | 5.8 |
Bank of Nova Scotia (Commercial Banks) | 4.9 | 5.1 |
Valeant Pharmaceuticals International, Inc. (Canada) (Pharmaceuticals) | 4.4 | 4.7 |
Suncor Energy, Inc. (Oil, Gas & Consumable Fuels) | 4.1 | 2.9 |
Manulife Financial Corp. (Insurance) | 4.0 | 1.9 |
Bank of Montreal (Commercial Banks) | 3.3 | 3.1 |
Canadian National Railway Co. (Road & Rail) | 3.3 | 3.0 |
Magna International, Inc. Class A (sub. vtg.) (Auto Components) | 2.6 | 1.6 |
Sun Life Financial, Inc. (Insurance) | 2.6 | 1.2 |
| 44.4 | |
Market Sectors as of October 31, 2013 |
| % of fund's
net assets | % of fund's net assets
6 months ago |
Financials | 36.2 | 32.8 |
Energy | 18.4 | 20.2 |
Consumer Discretionary | 9.6 | 8.1 |
Health Care | 7.0 | 9.0 |
Industrials | 6.2 | 4.7 |
Materials | 5.9 | 6.8 |
Consumer Staples | 5.9 | 5.6 |
Information Technology | 5.6 | 4.0 |
Telecommunication Services | 4.2 | 6.9 |
Utilities | 0.0 | 0.2 |
Annual Report
Fidelity Canada Fund
Investments October 31, 2013
Showing Percentage of Net Assets
Common Stocks - 99.0% |
| Shares | | Value |
CONSUMER DISCRETIONARY - 9.6% |
Auto Components - 2.6% |
Magna International, Inc. Class A (sub. vtg.) | 760,000 | | $ 64,370,211 |
Hotels, Restaurants & Leisure - 0.9% |
Starbucks Corp. | 200,000 | | 16,210,000 |
Tim Hortons, Inc. (Canada) | 110,300 | | 6,584,254 |
| | 22,794,254 |
Household Durables - 0.2% |
Brookfield Residential Properties, Inc. (a) | 200,000 | | 4,416,000 |
Media - 1.4% |
CBS Corp. Class B | 110,000 | | 6,505,400 |
Cineplex, Inc. | 350,000 | | 14,098,691 |
Corus Entertainment, Inc. Class B (non-vtg.) | 250,000 | | 5,826,500 |
Quebecor, Inc. Class B (sub. vtg.) | 300,000 | | 7,417,638 |
| | 33,848,229 |
Multiline Retail - 2.4% |
Canadian Tire Ltd. Class A (non-vtg.) | 180,000 | | 16,707,812 |
Dollarama, Inc. | 503,467 | | 43,275,032 |
Hudson's Bay Co. | 50,000 | | 949,024 |
| | 60,931,868 |
Textiles, Apparel & Luxury Goods - 2.1% |
Gildan Activewear, Inc. | 970,195 | | 46,767,372 |
lululemon athletica, Inc. (a)(d) | 77,600 | | 5,358,280 |
| | 52,125,652 |
TOTAL CONSUMER DISCRETIONARY | | 238,486,214 |
CONSUMER STAPLES - 5.9% |
Food & Staples Retailing - 5.7% |
Alimentation Couche-Tard, Inc. Class B (sub. vtg.) | 690,200 | | 46,748,117 |
CVS Caremark Corp. | 200,000 | | 12,452,000 |
Jean Coutu Group, Inc. Class A
(sub. vtg.) | 1,350,000 | | 23,862,754 |
Loblaw Companies Ltd. (d) | 550,000 | | 25,156,572 |
Metro, Inc. Class A (sub. vtg.) | 529,165 | | 33,105,484 |
| | 141,324,927 |
Food Products - 0.2% |
Saputo, Inc. | 100,000 | | 4,947,969 |
TOTAL CONSUMER STAPLES | | 146,272,896 |
ENERGY - 18.4% |
Energy Equipment & Services - 0.2% |
Calfrac Well Services Ltd. | 100,000 | | 3,117,058 |
Precision Drilling Corp. | 100,000 | | 1,057,881 |
Secure Energy Services, Inc. | 100,000 | | 1,418,501 |
| | 5,593,440 |
|
| Shares | | Value |
Oil, Gas & Consumable Fuels - 18.2% |
Anadarko Petroleum Corp. | 100,000 | | $ 9,529,000 |
ARC Resources Ltd. | 300,000 | | 7,964,322 |
Baytex Energy Corp. | 50,000 | | 2,086,990 |
Canadian Natural Resources Ltd. | 1,550,000 | | 49,191,483 |
Cenovus Energy, Inc. | 950,000 | | 28,227,114 |
Crescent Point Energy Corp. | 633,400 | | 24,597,292 |
Enbridge, Inc. | 1,387,800 | | 60,162,624 |
EQT Corp. | 80,000 | | 6,848,800 |
Imperial Oil Ltd. | 400,000 | | 17,467,031 |
Keyera Corp. | 152,302 | | 9,012,644 |
Painted Pony Petroleum Ltd. (a)(e) | 113,000 | | 742,387 |
Painted Pony Petroleum Ltd. (a) | 50,000 | | 328,490 |
Pembina Pipeline Corp. | 250,000 | | 8,202,657 |
Peyto Exploration & Development Corp. | 300,000 | | 9,040,426 |
Suncor Energy, Inc. | 2,807,600 | | 102,028,451 |
Talisman Energy, Inc. | 1,600,000 | | 19,949,168 |
Tourmaline Oil Corp. (a) | 400,000 | | 15,510,478 |
Tourmaline Oil Corp. (a)(e) | 80,000 | | 3,102,096 |
TransCanada Corp. | 1,160,000 | | 52,278,713 |
Trilogy Energy Corp. | 100,000 | | 2,933,870 |
Vermilion Energy, Inc. | 400,000 | | 21,986,285 |
Whitecap Resources, Inc. | 50,000 | | 580,732 |
| | 451,771,053 |
TOTAL ENERGY | | 457,364,493 |
FINANCIALS - 36.2% |
Capital Markets - 0.7% |
CI Financial Corp. | 500,000 | | 16,630,701 |
Commercial Banks - 25.3% |
Bank of Montreal (d) | 1,200,000 | | 83,579,341 |
Bank of Nova Scotia | 2,000,000 | | 121,594,015 |
Canadian Imperial Bank of Commerce | 404,600 | | 34,420,007 |
National Bank of Canada | 150,000 | | 13,016,832 |
Royal Bank of Canada | 2,880,000 | | 193,408,714 |
The Toronto-Dominion Bank | 2,003,800 | | 183,804,184 |
| | 629,823,093 |
Diversified Financial Services - 0.1% |
Element Financial Corp. (a) | 250,000 | | 3,191,387 |
Insurance - 7.5% |
Fairfax Financial Holdings Ltd. (sub. vtg.) | 10,000 | | 4,363,881 |
Industrial Alliance Insurance and Financial Services, Inc. | 100,000 | | 4,484,726 |
Intact Financial Corp. | 210,925 | | 13,155,376 |
Manulife Financial Corp. | 5,700,000 | | 100,972,522 |
Sun Life Financial, Inc. | 1,900,000 | | 63,998,465 |
| | 186,974,970 |
Real Estate Investment Trusts - 0.3% |
H&R REIT/H&R Finance Trust | 300,000 | | 6,214,933 |
Common Stocks - continued |
| Shares | | Value |
FINANCIALS - continued |
Real Estate Management & Development - 2.3% |
Brookfield Asset Management, Inc.
Class A | 1,450,000 | | $ 57,407,567 |
TOTAL FINANCIALS | | 900,242,651 |
HEALTH CARE - 7.0% |
Biotechnology - 1.0% |
Amgen, Inc. | 110,000 | | 12,760,000 |
Biogen Idec, Inc. (a) | 55,000 | | 13,430,450 |
| | 26,190,450 |
Health Care Providers & Services - 1.6% |
Catamaran Corp. (a) | 856,468 | | 40,184,544 |
Pharmaceuticals - 4.4% |
Valeant Pharmaceuticals International, Inc. (Canada) (a) | 1,031,471 | | 108,969,003 |
TOTAL HEALTH CARE | | 175,343,997 |
INDUSTRIALS - 6.2% |
Aerospace & Defense - 0.1% |
MacDonald Dettwiler & Associates Ltd. | 50,000 | | 3,814,799 |
Airlines - 0.4% |
Air Canada Class A (a) | 1,600,000 | | 8,823,670 |
Professional Services - 0.6% |
Stantec, Inc. | 245,400 | | 14,583,018 |
Road & Rail - 5.1% |
Canadian National Railway Co. | 750,000 | | 82,398,216 |
Canadian Pacific Railway Ltd. | 320,000 | | 45,741,908 |
| | 128,140,124 |
TOTAL INDUSTRIALS | | 155,361,611 |
INFORMATION TECHNOLOGY - 5.6% |
Computers & Peripherals - 0.2% |
3D Systems Corp. (a)(d) | 50,000 | | 3,112,000 |
NCR Corp. (a) | 80,000 | | 2,924,000 |
| | 6,036,000 |
Internet Software & Services - 0.5% |
Yahoo!, Inc. (a) | 340,000 | | 11,196,200 |
IT Services - 2.9% |
Alliance Data Systems Corp. (a)(d) | 70,000 | | 16,594,200 |
CGI Group, Inc. Class A (sub. vtg.) (a) | 1,290,000 | | 43,278,377 |
Visa, Inc. Class A | 60,000 | | 11,800,200 |
| | 71,672,777 |
Software - 2.0% |
Concur Technologies, Inc. (a) | 55,000 | | 5,753,000 |
Constellation Software, Inc. | 85,000 | | 15,484,487 |
Open Text Corp. | 140,407 | | 10,317,925 |
salesforce.com, Inc. (a) | 100,000 | | 5,336,000 |
|
| Shares | | Value |
ServiceNow, Inc. (a) | 51,800 | | $ 2,828,798 |
Splunk, Inc. (a) | 160,000 | | 10,033,600 |
| | 49,753,810 |
TOTAL INFORMATION TECHNOLOGY | | 138,658,787 |
MATERIALS - 5.9% |
Chemicals - 1.4% |
Methanex Corp. | 600,000 | | 34,797,871 |
Metals & Mining - 4.2% |
Agnico Eagle Mines Ltd. (Canada) | 450,000 | | 13,362,106 |
Alamos Gold, Inc. | 94,200 | | 1,500,659 |
First Quantum Minerals Ltd. | 800,000 | | 15,176,713 |
Franco-Nevada Corp. | 400,000 | | 17,996,451 |
Goldcorp, Inc. | 1,600,000 | | 40,757,685 |
Osisko Mining Corp. (a) | 1,000,000 | | 4,881,792 |
Silver Wheaton Corp. | 450,000 | | 10,211,480 |
| | 103,886,886 |
Paper & Forest Products - 0.3% |
West Fraser Timber Co. Ltd. | 90,000 | | 8,249,461 |
TOTAL MATERIALS | | 146,934,218 |
TELECOMMUNICATION SERVICES - 4.2% |
Diversified Telecommunication Services - 3.1% |
BCE, Inc. | 1,050,000 | | 45,689,829 |
TELUS Corp. | 300,000 | | 10,479,068 |
TELUS Corp. (a) | 600,000 | | 20,958,136 |
| | 77,127,033 |
Wireless Telecommunication Services - 1.1% |
Rogers Communications, Inc. Class B (non-vtg.) | 600,000 | | 27,230,614 |
TOTAL TELECOMMUNICATION SERVICES | | 104,357,647 |
TOTAL COMMON STOCKS (Cost $1,865,701,378) |
2,463,022,514
|
Money Market Funds - 4.7% |
| Shares | | Value |
Fidelity Cash Central Fund, 0.09% (b) | 15,752,624 | | $ 15,752,624 |
Fidelity Securities Lending Cash Central Fund, 0.09% (b)(c) | 101,723,524 | | 101,723,524 |
TOTAL MONEY MARKET FUNDS (Cost $117,476,148) |
117,476,148
|
TOTAL INVESTMENT PORTFOLIO - 103.7% (Cost $1,983,177,526) | | 2,580,498,662 |
NET OTHER ASSETS (LIABILITIES) - (3.7)% | | (93,098,467) |
NET ASSETS - 100% | $ 2,487,400,195 |
Legend |
(a) Non-income producing |
(b) Affiliated fund that is generally available only to investment companies and other accounts managed by Fidelity Investments. The rate quoted is the annualized seven-day yield of the fund at period end. A complete unaudited listing of the fund's holdings as of its most recent quarter end is available upon request. In addition, each Fidelity Central Fund's financial statements, which are not covered by the Fund's Report of Independent Registered Public Accounting Firm, are available on the SEC's website or upon request. |
(c) Investment made with cash collateral received from securities on loan. |
(d) Security or a portion of the security is on loan at period end. |
(e) Security exempt from registration under Rule 144A of the Securities Act of 1933. These securities may be resold in transactions exempt from registration, normally to qualified institutional buyers. At the end of the period, the value of these securities amounted to $3,844,483 or 0.2% of net assets. |
Affiliated Central Funds |
Information regarding fiscal year to date income earned by the Fund from investments in Fidelity Central Funds is as follows: |
Fund | Income earned |
Fidelity Cash Central Fund | $ 46,028 |
Fidelity Securities Lending Cash Central Fund | 3,181,563 |
Total | $ 3,227,591 |
Other Information |
All investments are categorized as Level 1 under the Fair Value Hierarchy. The inputs or methodology used for valuing securities may not be an indication of the risk associated with investing in those securities. For more information on valuation inputs, please refer to the Investment Valuation section in the accompanying Notes to Financial Statements. |
See accompanying notes which are an integral part of the financial statements.
Annual Report
Fidelity Canada Fund
Statement of Assets and Liabilities
| October 31, 2013 |
| | |
Assets | | |
Investment in securities, at value (including securities loaned of $97,192,158) - See accompanying schedule: Unaffiliated issuers (cost $1,865,701,378) | $ 2,463,022,514 | |
Fidelity Central Funds (cost $117,476,148) | 117,476,148 | |
Total Investments (cost $1,983,177,526) | | $ 2,580,498,662 |
Foreign currency held at value (cost $1,939,718) | | 1,939,718 |
Receivable for investments sold | | 38,529,311 |
Receivable for fund shares sold | | 584,145 |
Dividends receivable | | 3,162,138 |
Distributions receivable from Fidelity Central Funds | | 81,917 |
Prepaid expenses | | 6,233 |
Other receivables | | 5,347 |
Total assets | | 2,624,807,471 |
| | |
Liabilities | | |
Payable for investments purchased | $ 29,649,665 | |
Payable for fund shares redeemed | 3,967,056 | |
Accrued management fee | 1,381,333 | |
Distribution and service plan fees payable | 79,324 | |
Other affiliated payables | 538,757 | |
Other payables and accrued expenses | 67,617 | |
Collateral on securities loaned, at value | 101,723,524 | |
Total liabilities | | 137,407,276 |
| | |
Net Assets | | $ 2,487,400,195 |
Net Assets consist of: | | |
Paid in capital | | $ 1,894,267,605 |
Undistributed net investment income | | 5,441,243 |
Accumulated undistributed net realized gain (loss) on investments and foreign currency transactions | | (9,574,612) |
Net unrealized appreciation (depreciation) on investments and assets and liabilities in foreign currencies | | 597,265,959 |
Net Assets | | $ 2,487,400,195 |
Statement of Assets and Liabilities - continued
| October 31, 2013 |
| | |
Calculation of Maximum Offering Price Class A:
Net Asset Value and redemption price per share ($116,661,029 ÷ 2,035,534 shares) | | $ 57.31 |
| | |
Maximum offering price per share (100/94.25 of $57.31) | | $ 60.81 |
Class T:
Net Asset Value and redemption price per share ($23,751,280 ÷ 415,641 shares) | | $ 57.14 |
| | |
Maximum offering price per share (100/96.50 of $57.14) | | $ 59.21 |
Class B:
Net Asset Value and offering price per share ($7,737,243 ÷ 136,881 shares)A | | $ 56.53 |
| | |
Class C:
Net Asset Value and offering price per share ($46,039,529 ÷ 818,175 shares)A | | $ 56.27 |
| | |
Canada:
Net Asset Value, offering price and redemption price per share ($2,262,379,924 ÷ 39,194,450 shares) | | $ 57.72 |
| | |
Institutional Class:
Net Asset Value, offering price and redemption price per share ($30,831,190 ÷ 535,504 shares) | | $ 57.57 |
A Redemption price per share is equal to net asset value less any applicable contingent deferred sales charge.
See accompanying notes which are an integral part of the financial statements.
Annual Report
Fidelity Canada Fund
Financial Statements - continued
Statement of Operations
| Year ended October 31, 2013 |
Investment Income | | |
Dividends | | $ 71,353,255 |
Interest | | 812 |
Income from Fidelity Central Funds | | 3,227,591 |
Income before foreign taxes withheld | | 74,581,658 |
Less foreign taxes withheld | | (10,623,849) |
Total income | | 63,957,809 |
| | |
Expenses | | |
Management fee | | |
Basic fee | $ 19,761,399 | |
Performance adjustment | (2,880,828) | |
Transfer agent fees | 6,184,860 | |
Distribution and service plan fees | 1,097,829 | |
Accounting and security lending fees | 1,239,678 | |
Custodian fees and expenses | 41,774 | |
Independent trustees' compensation | 16,894 | |
Registration fees | 93,431 | |
Audit | 72,278 | |
Legal | 8,642 | |
Interest | 2,828 | |
Miscellaneous | 29,203 | |
Total expenses before reductions | 25,667,988 | |
Expense reductions | (289,539) | 25,378,449 |
Net investment income (loss) | | 38,579,360 |
Realized and Unrealized Gain (Loss) Net realized gain (loss) on: | | |
Investment securities: | | |
Unaffiliated issuers | 315,114,345 | |
Foreign currency transactions | (317,572) | |
Total net realized gain (loss) | | 314,796,773 |
Change in net unrealized appreciation (depreciation) on: Investment securities | (148,439,060) | |
Assets and liabilities in foreign currencies | (35,528) | |
Total change in net unrealized appreciation (depreciation) | | (148,474,588) |
Net gain (loss) | | 166,322,185 |
Net increase (decrease) in net assets resulting from operations | | $ 204,901,545 |
Statement of Changes in Net Assets
| Year ended
October 31,
2013 | Year ended
October 31,
2012 |
Increase (Decrease) in Net Assets | | |
Operations | | |
Net investment income (loss) | $ 38,579,360 | $ 50,353,505 |
Net realized gain (loss) | 314,796,773 | (18,070,675) |
Change in net unrealized appreciation (depreciation) | (148,474,588) | 100,576,015 |
Net increase (decrease) in net assets resulting from operations | 204,901,545 | 132,858,845 |
Distributions to shareholders from net investment income | (43,693,415) | (36,731,380) |
Distributions to shareholders from net realized gain | - | (22,566,448) |
Total distributions | (43,693,415) | (59,297,828) |
Share transactions - net increase (decrease) | (991,330,828) | (952,875,100) |
Redemption fees | 153,637 | 257,398 |
Total increase (decrease) in net assets | (829,969,061) | (879,056,685) |
Net Assets | | |
Beginning of period | 3,317,369,256 | 4,196,425,941 |
End of period (including undistributed net investment income of $5,441,243 and undistributed net investment income of $34,776,724, respectively) | $ 2,487,400,195 | $ 3,317,369,256 |
See accompanying notes which are an integral part of the financial statements.
Annual Report
Financial Highlights - Class A
Years ended October 31, | 2013 | 2012 | 2011 | 2010 | 2009 |
Selected Per-Share Data | | | | | |
Net asset value, beginning of period | $ 53.65 | $ 52.20 | $ 53.81 | $ 44.24 | $ 38.20 |
Income from Investment Operations | | | | | |
Net investment income (loss) C | .60 | .57 | .34 | .31 | .38 |
Net realized and unrealized gain (loss) | 3.63 | 1.50 | (1.17) | 9.64 | 5.72 |
Total from investment operations | 4.23 | 2.07 | (.83) | 9.95 | 6.10 |
Distributions from net investment income | (.57) | (.33) | (.35) | (.39) | (.07) |
Distributions from net realized gain | - | (.29) | (.44) | - | - |
Total distributions | (.57) | (.62) | (.79) | (.39) | (.07) |
Redemption fees added to paid in capital C | - G | - G | .01 | .01 | .01 |
Net asset value, end of period | $ 57.31 | $ 53.65 | $ 52.20 | $ 53.81 | $ 44.24 |
Total Return A,B | 7.98% | 4.04% | (1.64)% | 22.62% | 16.08% |
Ratios to Average Net Assets D,F | | | | | |
Expenses before reductions | 1.19% | 1.08% | 1.12% | 1.24% | 1.42% |
Expenses net of fee waivers, if any | 1.19% | 1.08% | 1.12% | 1.24% | 1.42% |
Expenses net of all reductions | 1.18% | 1.08% | 1.12% | 1.18% | 1.39% |
Net investment income (loss) | 1.11% | 1.11% | .59% | .63% | .98% |
Supplemental Data | | | | | |
Net assets, end of period (000 omitted) | $ 116,661 | $ 159,597 | $ 215,369 | $ 170,446 | $ 83,015 |
Portfolio turnover rate E | 64% | 86% | 104% | 143% | 123% |
A Total returns would have been lower if certain expenses had not been reduced during the applicable periods shown. B Total returns do not include the effect of the sales charges. C Calculated based on average shares outstanding during the period. D Fees and expenses of any underlying Fidelity Central Funds are not included in the Fund's expense ratio. The Fund indirectly bears its proportionate share of the expenses of any underlying Fidelity Central Funds. E Amount does not include the portfolio activity of any underlying Fidelity Central Funds. F Expense ratios reflect operating expenses of the class. Expenses before reductions do not reflect amounts reimbursed by the investment adviser or reductions from brokerage service arrangements or reductions from other expense offset arrangements and do not represent the amount paid by the class during periods when reimbursements or reductions occur. Expenses net of fee waivers reflect expenses after reimbursement by the investment adviser but prior to reductions from brokerage service arrangements or other expense offset arrangements. Expenses net of all reductions represent the net expenses paid by the class. G Amount represents less than $.01 per share. |
Financial Highlights - Class T
Years ended October 31, | 2013 | 2012 | 2011 | 2010 | 2009 |
Selected Per-Share Data | | | | | |
Net asset value, beginning of period | $ 53.48 | $ 52.01 | $ 53.64 | $ 44.11 | $ 38.10 |
Income from Investment Operations | | | | | |
Net investment income (loss) C | .45 | .43 | .17 | .18 | .27 |
Net realized and unrealized gain (loss) | 3.63 | 1.49 | (1.16) | 9.60 | 5.73 |
Total from investment operations | 4.08 | 1.92 | (.99) | 9.78 | 6.00 |
Distributions from net investment income | (.42) | (.16) | (.21) | (.26) | - |
Distributions from net realized gain | - | (.29) | (.44) | - | - |
Total distributions | (.42) | (.45) | (.65) | (.26) | - |
Redemption fees added to paid in capital C | - G | - G | .01 | .01 | .01 |
Net asset value, end of period | $ 57.14 | $ 53.48 | $ 52.01 | $ 53.64 | $ 44.11 |
Total Return A,B | 7.69% | 3.74% | (1.93)% | 22.27% | 15.77% |
Ratios to Average Net Assets D,F | | | | | |
Expenses before reductions | 1.47% | 1.36% | 1.42% | 1.51% | 1.70% |
Expenses net of fee waivers, if any | 1.47% | 1.36% | 1.42% | 1.51% | 1.70% |
Expenses net of all reductions | 1.46% | 1.36% | 1.42% | 1.46% | 1.67% |
Net investment income (loss) | .83% | .83% | .30% | .36% | .71% |
Supplemental Data | | | | | |
Net assets, end of period (000 omitted) | $ 23,751 | $ 29,626 | $ 34,323 | $ 31,522 | $ 17,727 |
Portfolio turnover rate E | 64% | 86% | 104% | 143% | 123% |
A Total returns would have been lower if certain expenses had not been reduced during the applicable periods shown. B Total returns do not include the effect of the sales charges. C Calculated based on average shares outstanding during the period. D Fees and expenses of any underlying Fidelity Central Funds are not included in the Fund's expense ratio. The Fund indirectly bears its proportionate share of the expenses of any underlying Fidelity Central Funds. E Amount does not include the portfolio activity of any underlying Fidelity Central Funds. F Expense ratios reflect operating expenses of the class. Expenses before reductions do not reflect amounts reimbursed by the investment adviser or reductions from brokerage service arrangements or reductions from other expense offset arrangements and do not represent the amount paid by the class during periods when reimbursements or reductions occur. Expenses net of fee waivers reflect expenses after reimbursement by the investment adviser but prior to reductions from brokerage service arrangements or other expense offset arrangements. Expenses net of all reductions represent the net expenses paid by the class. G Amount represents less than $.01 per share. |
See accompanying notes which are an integral part of the financial statements.
Annual Report
Financial Highlights - Class B
Years ended October 31, | 2013 | 2012 | 2011 | 2010 | 2009 |
Selected Per-Share Data | | | | | |
Net asset value, beginning of period | $ 52.89 | $ 51.37 | $ 53.03 | $ 43.68 | $ 37.91 |
Income from Investment Operations | | | | | |
Net investment income (loss) C | .18 | .17 | (.11) | (.07) | .08 |
Net realized and unrealized gain (loss) | 3.60 | 1.49 | (1.14) | 9.50 | 5.68 |
Total from investment operations | 3.78 | 1.66 | (1.25) | 9.43 | 5.76 |
Distributions from net investment income | (.14) | - | (.01) | (.09) | - |
Distributions from net realized gain | - | (.14) | (.41) | - | - |
Total distributions | (.14) | (.14) | (.42) | (.09) | - |
Redemption fees added to paid in capital C | - G | - G | .01 | .01 | .01 |
Net asset value, end of period | $ 56.53 | $ 52.89 | $ 51.37 | $ 53.03 | $ 43.68 |
Total Return A,B | 7.17% | 3.25% | (2.41)% | 21.64% | 15.22% |
Ratios to Average Net Assets D,F | | | | | |
Expenses before reductions | 1.96% | 1.85% | 1.91% | 2.01% | 2.19% |
Expenses net of fee waivers, if any | 1.96% | 1.85% | 1.91% | 2.01% | 2.19% |
Expenses net of all reductions | 1.95% | 1.85% | 1.91% | 1.96% | 2.16% |
Net investment income (loss) | .34% | .34% | (.20)% | (.14)% | .21% |
Supplemental Data | | | | | |
Net assets, end of period (000 omitted) | $ 7,737 | $ 9,804 | $ 11,866 | $ 13,464 | $ 7,283 |
Portfolio turnover rate E | 64% | 86% | 104% | 143% | 123% |
A Total returns would have been lower if certain expenses had not been reduced during the applicable periods shown. B Total returns do not include the effect of the contingent deferred sales charge. C Calculated based on average shares outstanding during the period. D Fees and expenses of any underlying Fidelity Central Funds are not included in the Fund's expense ratio. The Fund indirectly bears its proportionate share of the expenses of any underlying Fidelity Central Funds. E Amount does not include the portfolio activity of any underlying Fidelity Central Funds. F Expense ratios reflect operating expenses of the class. Expenses before reductions do not reflect amounts reimbursed by the investment adviser or reductions from brokerage service arrangements or reductions from other expense offset arrangements and do not represent the amount paid by the class during periods when reimbursements or reductions occur. Expenses net of fee waivers reflect expenses after reimbursement by the investment adviser but prior to reductions from brokerage service arrangements or other expense offset arrangements. Expenses net of all reductions represent the net expenses paid by the class. G Amount represents less than $.01 per share. |
Financial Highlights - Class C
Years ended October 31, | 2013 | 2012 | 2011 | 2010 | 2009 |
Selected Per-Share Data | | | | | |
Net asset value, beginning of period | $ 52.61 | $ 51.19 | $ 52.87 | $ 43.60 | $ 37.84 |
Income from Investment Operations | | | | | |
Net investment income (loss) C | .20 | .19 | (.08) | (.06) | .09 |
Net realized and unrealized gain (loss) | 3.58 | 1.46 | (1.14) | 9.48 | 5.66 |
Total from investment operations | 3.78 | 1.65 | (1.22) | 9.42 | 5.75 |
Distributions from net investment income | (.12) | - | (.03) | (.16) | - |
Distributions from net realized gain | - | (.23) | (.44) | - | - |
Total distributions | (.12) | (.23) | (.47) | (.16) | - |
Redemption fees added to paid in capital C | - G | - G | .01 | .01 | .01 |
Net asset value, end of period | $ 56.27 | $ 52.61 | $ 51.19 | $ 52.87 | $ 43.60 |
Total Return A,B | 7.21% | 3.26% | (2.36)% | 21.68% | 15.22% |
Ratios to Average Net Assets D,F | | | | | |
Expenses before reductions | 1.93% | 1.82% | 1.86% | 1.99% | 2.18% |
Expenses net of fee waivers, if any | 1.92% | 1.82% | 1.86% | 1.99% | 2.18% |
Expenses net of all reductions | 1.92% | 1.82% | 1.86% | 1.94% | 2.15% |
Net investment income (loss) | .37% | .37% | (.15)% | (.12)% | .22% |
Supplemental Data | | | | | |
Net assets, end of period (000 omitted) | $ 46,040 | $ 66,500 | $ 87,990 | $ 54,052 | $ 24,848 |
Portfolio turnover rate E | 64% | 86% | 104% | 143% | 123% |
A Total returns would have been lower if certain expenses had not been reduced during the applicable periods shown. B Total returns do not include the effect of the contingent deferred sales charge. C Calculated based on average shares outstanding during the period. D Fees and expenses of any underlying Fidelity Central Funds are not included in the Fund's expense ratio. The Fund indirectly bears its proportionate share of the expenses of any underlying Fidelity Central Funds. E Amount does not include the portfolio activity of any underlying Fidelity Central Funds. F Expense ratios reflect operating expenses of the class. Expenses before reductions do not reflect amounts reimbursed by the investment adviser or reductions from brokerage service arrangements or reductions from other expense offset arrangements and do not represent the amount paid by the class during periods when reimbursements or reductions occur. Expenses net of fee waivers reflect expenses after reimbursement by the investment adviser but prior to reductions from brokerage service arrangements or other expense offset arrangements. Expenses net of all reductions represent the net expenses paid by the class. G Amount represents less than $.01 per share. |
See accompanying notes which are an integral part of the financial statements.
Annual Report
Financial Highlights - Canada
Years ended October 31, | 2013 | 2012 | 2011 | 2010 | 2009 |
Selected Per-Share Data | | | | | |
Net asset value, beginning of period | $ 54.05 | $ 52.59 | $ 54.14 | $ 44.46 | $ 38.37 |
Income from Investment Operations | | | | | |
Net investment income (loss) B | .77 | .73 | .52 | .46 | .48 |
Net realized and unrealized gain (loss) | 3.66 | 1.51 | (1.18) | 9.68 | 5.74 |
Total from investment operations | 4.43 | 2.24 | (.66) | 10.14 | 6.22 |
Distributions from net investment income | (.76) | (.49) | (.46) | (.47) | (.14) |
Distributions from net realized gain | - | (.29) | (.44) | - | - |
Total distributions | (.76) | (.78) | (.90) | (.47) | (.14) |
Redemption fees added to paid in capital B | - F | - F | .01 | .01 | .01 |
Net asset value, end of period | $ 57.72 | $ 54.05 | $ 52.59 | $ 54.14 | $ 44.46 |
Total Return A | 8.32% | 4.36% | (1.33)% | 22.97% | 16.40% |
Ratios to Average Net Assets C,E | | | | | |
Expenses before reductions | .87% | .77% | .82% | .94% | 1.17% |
Expenses net of fee waivers, if any | .87% | .77% | .82% | .94% | 1.17% |
Expenses net of all reductions | .86% | .77% | .82% | .89% | 1.13% |
Net investment income (loss) | 1.42% | 1.42% | .90% | .93% | 1.24% |
Supplemental Data | | | | | |
Net assets, end of period (000 omitted) | $ 2,262,380 | $ 2,992,597 | $ 3,778,765 | $ 3,953,693 | $ 3,149,791 |
Portfolio turnover rate D | 64% | 86% | 104% | 143% | 123% |
A Total returns would have been lower if certain expenses had not been reduced during the applicable periods shown. B Calculated based on average shares outstanding during the period. C Fees and expenses of any underlying Fidelity Central Funds are not included in the Fund's expense ratio. The Fund indirectly bears its proportionate share of the expenses of any underlying Fidelity Central Funds. D Amount does not include the portfolio activity of any underlying Fidelity Central Funds. EExpense ratios reflect operating expenses of the class. Expenses before reductions do not reflect amounts reimbursed by the investment adviser or reductions from brokerage service arrangements or reductions from other expense offset arrangements and do not represent the amount paid by the class during periods when reimbursements or reductions occur. Expenses net of fee waivers reflect expenses after reimbursement by the investment adviser but prior to reductions from brokerage service arrangements or other expense offset arrangements. Expenses net of all reductions represent the net expenses paid by the class. F Amount represents less than $.01 per share. |
Financial Highlights - Institutional Class
Years ended October 31, | 2013 | 2012 | 2011 | 2010 | 2009 |
Selected Per-Share Data | | | | | |
Net asset value, beginning of period | $ 53.91 | $ 52.44 | $ 54.02 | $ 44.39 | $ 38.31 |
Income from Investment Operations | | | | | |
Net investment income (loss) B | .78 | .74 | .51 | .46 | .49 |
Net realized and unrealized gain (loss) | 3.64 | 1.50 | (1.18) | 9.65 | 5.72 |
Total from investment operations | 4.42 | 2.24 | (.67) | 10.11 | 6.21 |
Distributions from net investment income | (.76) | (.48) | (.48) | (.49) | (.14) |
Distributions from net realized gain | - | (.29) | (.44) | - | - |
Total distributions | (.76) | (.77) | (.92) | (.49) | (.14) |
Redemption fees added to paid in capital B | - F | - F | .01 | .01 | .01 |
Net asset value, end of period | $ 57.57 | $ 53.91 | $ 52.44 | $ 54.02 | $ 44.39 |
Total Return A | 8.34% | 4.38% | (1.35)% | 22.94% | 16.40% |
Ratios to Average Net Assets C,E | | | | | |
Expenses before reductions | .86% | .76% | .82% | .95% | 1.17% |
Expenses net of fee waivers, if any | .86% | .76% | .82% | .95% | 1.17% |
Expenses net of all reductions | .85% | .76% | .82% | .90% | 1.14% |
Net investment income (loss) | 1.43% | 1.42% | .89% | .92% | 1.23% |
Supplemental Data | | | | | |
Net assets, end of period (000 omitted) | $ 30,831 | $ 59,245 | $ 68,112 | $ 46,737 | $ 17,956 |
Portfolio turnover rate D | 64% | 86% | 104% | 143% | 123% |
A Total returns would have been lower if certain expenses had not been reduced during the applicable periods shown. B Calculated based on average shares outstanding during the period. C Fees and expenses of any underlying Fidelity Central Funds are not included in the Fund's expense ratio. The Fund indirectly bears its proportionate share of the expenses of any underlying Fidelity Central Funds. D Amount does not include the portfolio activity of any underlying Fidelity Central Funds. E Expense ratios reflect operating expenses of the class. Expenses before reductions do not reflect amounts reimbursed by the investment adviser or reductions from brokerage service arrangements or reductions from other expense offset arrangements and do not represent the amount paid by the class during periods when reimbursements or reductions occur. Expenses net of fee waivers reflect expenses after reimbursement by the investment adviser but prior to reductions from brokerage service arrangements or other expense offset arrangements. Expenses net of all reductions represent the net expenses paid by the class. F Amount represents less than $.01 per share. |
See accompanying notes which are an integral part of the financial statements.
Annual Report
Notes to Financial Statements
For the period ended October 31, 2013
1. Organization.
Fidelity Canada Fund (the Fund) is a fund of Fidelity Investment Trust (the Trust) and is authorized to issue an unlimited number of shares. The Trust is registered under the Investment Company Act of 1940, as amended (the 1940 Act), as an open-end management investment company organized as a Massachusetts business trust. The Fund offers Class A, Class T, Class C, Canada and Institutional Class shares, each of which, along with Class B shares, has equal rights as to assets and voting privileges. Class B shares are closed to new accounts and additional purchases, except for exchanges and reinvestments. Each class has exclusive voting rights with respect to matters that affect that class. Class B shares will automatically convert to Class A shares after a holding period of seven years from the initial date of purchase.
2. Investments in Fidelity Central Funds.
The Fund invests in Fidelity Central Funds, which are open-end investment companies generally available only to other investment companies and accounts managed by Fidelity Management & Research Company (FMR) and its affiliates. The Fund's Schedule of Investments lists each of the Fidelity Central Funds held as of period end, if any, as an investment of the Fund, but does not include the underlying holdings of each Fidelity Central Fund. As an Investing Fund, the Fund indirectly bears its proportionate share of the expenses of the underlying Fidelity Central Funds.
The Money Market Central Funds seek preservation of capital and current income and are managed by Fidelity Investments Money Management, Inc. (FIMM), an affiliate of FMR.
A complete unaudited list of holdings for each Fidelity Central Fund is available upon request or at the Securities and Exchange Commission (the SEC) website at www.sec.gov. In addition, the financial statements of the Fidelity Central Funds, which are not covered by the Fund's Report of Independent Registered Public Accounting Firm, are available on the SEC website or upon request.
3. Significant Accounting Policies.
The financial statements have been prepared in conformity with accounting principles generally accepted in the United States of America (GAAP), which require management to make certain estimates and assumptions at the date of the financial statements. Actual results could differ from those estimates. Subsequent events, if any, through the date that the financial statements were issued have been evaluated in the preparation of the financial statements. The following summarizes the significant accounting policies of the Fund:
Investment Valuation. Investments are valued as of 4:00 p.m. Eastern time on the last calendar day of the period. In accordance with valuation policies and procedures approved by the Board of Trustees (the Board), the Fund attempts to obtain prices from one or more third party pricing vendors or brokers to value its investments. When current market prices, quotations or currency exchange rates are not readily available or reliable, investments will be fair valued in good faith by the FMR Fair Value Committee (the Committee), in accordance with procedures adopted by the Board. Factors used in determining fair value vary by investment type and may include market or investment specific events. The frequency with which these procedures are used cannot be predicted and they may be utilized to a significant extent. The Committee oversees the Fund's valuation policies and procedures and is responsible for approving and reporting to the Board all fair value determinations.
The Fund categorizes the inputs to valuation techniques used to value its investments into a disclosure hierarchy consisting of three levels as shown below:
Level 1 - quoted prices in active markets for identical investments
Level 2 - other significant observable inputs (including quoted prices for similar investments, interest rates, prepayment speeds, etc.)
Level 3 - unobservable inputs (including the Fund's own assumptions based on the best information available)
Valuation techniques used to value the Fund's investments by major category are as follows:
Equity securities, including restricted securities, for which market quotations are readily available, are valued at the last reported sale price or official closing price as reported by a third party pricing vendor on the primary market or exchange on which they are traded and are categorized as Level 1 in the hierarchy. In the event there were no sales during the day or closing prices are not available, securities are valued at the last quoted bid price or may be valued using the last available price and are generally categorized as Level 2 in the hierarchy. For foreign equity securities, when market or security specific events arise, comparisons to the valuation of American Depositary Receipts (ADRs), futures contracts, Exchange-Traded Funds (ETFs) and certain indexes as well as quoted prices for similar securities may be used and would be categorized as Level 2 in the hierarchy. Utilizing these techniques may result in transfers between Level 1 and Level 2. For equity securities, including restricted securities, where observable inputs are limited, assumptions about market activity and risk are used and these securities may be categorized as Level 3 in the hierarchy.
Investments in open-end mutual funds, including the Fidelity Central Funds, are valued at their closing net asset value (NAV) each business day and are categorized as Level 1 in the hierarchy.
Annual Report
Notes to Financial Statements - continued
3. Significant Accounting Policies - continued
Investment Valuation - continued
Changes in valuation techniques may result in transfers in or out of an assigned level within the disclosure hierarchy.
Foreign Currency. The Fund may use foreign currency contracts to facilitate transactions in foreign-denominated securities. Gains and losses from these transactions may arise from changes in the value of the foreign currency or if the counterparties do not perform under the contracts' terms.
Foreign-denominated assets, including investment securities, and liabilities are translated into U.S. dollars at the exchange rates at period end. Purchases and sales of investment securities, income and dividends received and expenses denominated in foreign currencies are translated into U.S. dollars at the exchange rate in effect on the transaction date.
The effects of exchange rate fluctuations on investments are included with the net realized and unrealized gain (loss) on investment securities. Other foreign currency transactions resulting in realized and unrealized gain (loss) are disclosed separately.
Investment Transactions and Income. For financial reporting purposes, the Fund's investment holdings and NAV include trades executed through the end of the last business day of the period. The NAV per share for processing shareholder transactions is calculated as of the close of business of the New York Stock Exchange (NYSE), normally 4:00 p.m. Eastern time and includes trades executed through the end of the prior business day. Gains and losses on securities sold are determined on the basis of identified cost and may include proceeds received from litigation. Dividend income is recorded on the ex-dividend date, except for certain dividends from foreign securities where the ex-dividend date may have passed, which are recorded as soon as the Fund is informed of the ex-dividend date. Non-cash dividends included in dividend income, if any, are recorded at the fair market value of the securities received. Distributions received on securities that represent a return of capital or capital gain are recorded as a reduction of cost of investments and/or as a realized gain. Subsequent to ex-dividend date the Fund determines the components of these distributions, based upon receipt of tax filings or other correspondence relating to the underlying investment. Interest income and distributions from the Fidelity Central Funds are accrued as earned. Interest income includes coupon interest and amortization of premium and accretion of discount on debt securities. Investment income is recorded net of foreign taxes withheld where recovery of such taxes is uncertain.
Class Allocations and Expenses. Investment income, realized and unrealized capital gains and losses, common expenses of the Fund, and certain fund-level expense reductions, if any, are allocated daily on a pro-rata basis to each class based on the relative net assets of each class to the total net assets of the Fund. Each class differs with respect to transfer agent and distribution and service plan fees incurred. Certain expense reductions may also differ by class. For the reporting period, the allocated portion of income and expenses to each class as a percent of its average net assets may vary due to the timing of recording these transactions in relation to fluctuating net assets of the classes. Expenses directly attributable to a fund are charged to that fund. Expenses attributable to more than one fund are allocated among the respective funds on the basis of relative net assets or other appropriate methods. Expense estimates are accrued in the period to which they relate and adjustments are made when actual amounts are known.
Income Tax Information and Distributions to Shareholders. Each year, the Fund intends to qualify as a regulated investment company under Subchapter M of the Internal Revenue Code, including distributing substantially all of its taxable income and realized gains. As a result, no provision for U.S. Federal income taxes is required. As of October 31, 2013, the Fund did not have any unrecognized tax benefits in the financial statements; nor is the each Fund aware of any tax positions for which it is reasonably possible that the total amounts of unrecognized tax benefits will significantly change in the next twelve months. The Fund files a U.S. federal tax return, in addition to state and local tax returns as required. The Fund's federal income tax returns are subject to examination by the Internal Revenue Service (IRS) for a period of three fiscal years after they are filed. State and local tax returns may be subject to examination for an additional fiscal year depending on the jurisdiction. Foreign taxes are provided for based on the Fund's understanding of the tax rules and rates that exist in the foreign markets in which it invests.
Distributions are declared and recorded on the ex-dividend date. Income dividends and capital gain distributions are declared separately for each class. Income and capital gain distributions are determined in accordance with income tax regulations, which may differ from GAAP. In addition, the fund claimed a portion of the payment made to redeeming shareholders as a distribution for income tax purposes.
Capital accounts within the financial statements are adjusted for permanent book-tax differences. These adjustments have no impact on net assets or the results of operations. Temporary book-tax differences will reverse in a subsequent period.
Book-tax differences are primarily due to foreign currency transactions, passive foreign investment companies (PFIC), deferred trustees compensation, capital loss carryforwards and losses deferred due to wash sales.
The federal tax cost of investment securities and unrealized appreciation (depreciation) as of period end were as follows:
Gross unrealized appreciation | $ 622,734,162 |
Gross unrealized depreciation | (48,641,784) |
Net unrealized appreciation (depreciation) on securities and other investments | $ 574,092,378 |
| |
Tax Cost | $ 2,006,406,284 |
Annual Report
3. Significant Accounting Policies - continued
Income Tax Information and Distributions to Shareholders - continued
The tax-based components of distributable earnings as of period end were as follows:
Undistributed ordinary income | $ 5,441,496 |
Undistributed long-term capital gain | $ 13,654,145 |
Net unrealized appreciation (depreciation) | $ 574,037,201 |
The tax character of distributions paid was as follows:
| October 31, 2013 | October 31, 2012 |
Ordinary Income | $ 43,693,415 | $ 59,297,828 |
Short-Term Trading (Redemption) Fees. Shares held by investors in the Fund less than 90 days may have been subject to a redemption fee equal to 1.50% of the net asset value of shares redeemed. All redemption fees, which reduce the proceeds of the shareholder redemption, are retained by the Fund and accounted for as an addition to paid in capital.
Restricted Securities. The Fund may invest in securities that are subject to legal or contractual restrictions on resale. These securities generally may be resold in transactions exempt from registration or to the public if the securities are registered. Disposal of these securities may involve time-consuming negotiations and expense, and prompt sale at an acceptable price may be difficult. Information regarding restricted securities is included at the end of the Fund's Schedule of Investments.
4. Purchases and Sales of Investments.
Purchases and sales of securities, other than short-term securities, aggregated $1,782,914,089 and $2,781,691,453, respectively.
5. Fees and Other Transactions with Affiliates.
Management Fee. FMR and its affiliates provide the Fund with investment management related services for which the Fund pays a monthly management fee. The management fee is the sum of an individual fund fee rate that is based on an annual rate of .45% of the Fund's average net assets and an annualized group fee rate that averaged .25% during the period. The group fee rate is based upon the average net assets of all the mutual funds advised by FMR, including any mutual funds previously advised by FMR that are currently advised by Fidelity SelectCo, LLC, an affiliate of FMR. The group fee rate decreases as assets under management increase and increases as assets under management decrease. In addition, the management fee is subject to a performance adjustment (up to a maximum of ± .20% of the Fund's average net assets over a 36 month performance period). The upward or downward adjustment to the management fee is based on the relative investment performance of Canada as compared to an appropriate benchmark index over the same 36 month performance period. For the reporting period, the total annual management fee rate, including the performance adjustment, was .60% of the Fund's average net assets. The performance adjustment included in the management fee rate may be higher or lower than the maximum performance adjustment rate due to the difference between the average net assets for the reporting and performance periods.
Distribution and Service Plan Fees. In accordance with Rule 12b-1 of the 1940 Act, the Fund has adopted separate Distribution and Service Plans for each class of shares. Certain classes pay Fidelity Distributors Corporation (FDC), an affiliate of FMR, separate Distribution and Service Fees, each of which is based on an annual percentage of each class' average net assets. In addition, FDC may pay financial intermediaries for selling shares of the Fund and providing shareholder support services. For the period, the Distribution and Service Fee rates, total fees and amounts retained by FDC were as follows:
| Distribution
Fee | Service
Fee | Total Fees | Retained
by FDC |
Class A | -% | .25% | $ 337,330 | $ 15,373 |
Class T | .25% | .25% | 129,706 | 3,129 |
Class B | .75% | .25% | 86,940 | 65,318 |
Class C | .75% | .25% | 543,853 | 40,074 |
| | | $ 1,097,829 | $ 123,894 |
Sales Load. FDC may receive a front-end sales charge of up to 5.75% for selling Class A shares and 3.50% for selling Class T shares, some of which is paid to financial intermediaries for selling shares of the Fund. Depending on the holding period, FDC may receive contingent deferred sales charges levied on Class A, Class T, Class B, and Class C redemptions. The deferred sales charges range from 5.00% to 1.00% for Class B shares, 1.00% for Class C shares, 1.00% for certain purchases of Class A shares and .25% for certain purchases of Class T shares.
Annual Report
Notes to Financial Statements - continued
5. Fees and Other Transactions with Affiliates - continued
Sales Load - continued
For the period, sales charge amounts retained by FDC were as follows:
| Retained
by FDC |
Class A | $ 34,481 |
Class T | 5,392 |
Class B* | 16,573 |
Class C* | 4,351 |
| $ 60,797 |
* When Class B and Class C shares are initially sold, FDC pays commissions from its own resources to financial intermediaries through which the sales are made.
Transfer Agent Fees. Fidelity Investments Institutional Operations Company, Inc., (FIIOC), an affiliate of FMR, is the transfer, dividend disbursing and shareholder servicing agent for each class of the Fund. FIIOC receives account fees and asset-based fees that vary according to the account size and type of account of the shareholders of the respective classes of the Fund. FIIOC pays for typesetting, printing and mailing of shareholder reports, except proxy statements.
For the period, transfer agent fees for each class were as follows:
| Amount | % of
Average
Net Assets |
Class A | $ 380,027 | .28 |
Class T | 80,050 | .31 |
Class B | 26,068 | .30 |
Class C | 144,052 | .27 |
Canada | 5,469,174 | .22 |
Institutional Class | 85,489 | .21 |
| $ 6,184,860 | |
Accounting and Security Lending Fees. Fidelity Service Company, Inc. (FSC), an affiliate of FMR, maintains the Fund's accounting records. The accounting fee is based on the level of average net assets for each month. Under a separate contract, FSC administers the security lending program. The security lending fee is based on the number and duration of lending transactions.
Brokerage Commissions. The Fund placed a portion of its portfolio transactions with brokerage firms which are affiliates of the investment adviser. Brokerage commissions are included in net realized gain (loss) and change in net unrealized appreciation (depreciation) in the Statement of Operations. The commissions paid to these affiliated firms were $7,827 for the period.
Interfund Lending Program. Pursuant to an Exemptive Order issued by the SEC, the Fund, along with other registered investment companies having management contracts with FMR, may participate in an interfund lending program. This program provides an alternative credit facility allowing the funds to borrow from, or lend money to, other participating affiliated funds. At period end, there were no interfund loans outstanding. The Fund's activity in this program during the period for which loans were outstanding was as follows:
Borrower or Lender | Average Loan
Balance | Weighted Average Interest Rate | Interest
Expense |
Borrower | $ 8,609,545 | .33% | $ 1,724 |
6. Committed Line of Credit.
The Fund participates with other funds managed by FMR or an affiliate in a $4.25 billion credit facility (the "line of credit") to be utilized for temporary or emergency purposes to fund shareholder redemptions or for other short-term liquidity purposes. The Fund has agreed to pay commitment fees on its pro-rata portion of the line of credit, which amounted to $6,428 and is reflected in Miscellaneous expenses on the Statement of Operations. During the period, there were no borrowings on this line of credit.
Annual Report
7. Security Lending.
The Fund lends portfolio securities through a lending agent from time to time in order to earn additional income. For equity securities, a lending agent is used and may loan securities to certain qualified borrowers, including Fidelity Capital Markets (FCM), a broker-dealer affiliated with the Fund. On the settlement date of the loan, the Fund receives collateral (in the form of U.S. Treasury obligations, letters of credit and/or cash) against the loaned securities and maintains collateral in an amount not less than 100% of the market value of the loaned securities during the period of the loan. The market value of the loaned securities is determined at the close of business of the Fund and any additional required collateral is delivered to the Fund on the next business day. If the borrower defaults on its obligation to return the securities loaned because of insolvency or other reasons, the Fund may apply collateral received from the borrower against the obligation. The Fund may experience delays and costs in recovering the securities loaned. Any cash collateral received is invested in the Fidelity Securities Lending Cash Central Fund. The value of loaned securities and cash collateral at period end are disclosed on the Fund's Statement of Assets and Liabilities. At period end, there were no security loans outstanding with FCM. Security lending income represents the income earned on investing cash collateral, less rebates paid to borrowers and any lending agent fees associated with the loan, plus any premium payments received for lending certain types of securities. Security lending income is presented in the Statement of Operations as a component of income from Fidelity Central Funds. Total security lending income during the period amounted to $3,181,563, including $135,823 from securities loaned to FCM.
8. Bank Borrowings.
The Fund is permitted to have bank borrowings for temporary or emergency purposes to fund shareholder redemptions or for other short-term liquidity requirements. The Fund has established borrowing arrangements with certain banks. The interest rate on the borrowings is the bank's base rate, as revised from time to time. The average loan balance during the period for which loans were outstanding amounted to $12,098,400. The weighted average interest rate was .66%. The interest expense amounted to $1,104 under the bank borrowing program. At period end, there were no bank borrowings outstanding.
9. Expense Reductions.
Commissions paid to certain brokers with whom FMR, or its affiliates, places trades on behalf of the Fund include an amount in addition to trade execution, which may be rebated back to the Fund to offset certain expenses. This amount totaled $248,571 for the period.
In addition, FMR reimbursed a portion of the Fund's operating expenses during the period in the amount of $40,968.
10. Distributions to Shareholders.
Distributions to shareholders of each class were as follows:
Years ended October 31, | 2013 | 2012 |
From net investment income | | |
Class A | $ 1,637,055 | $ 1,331,457 |
Class T | 220,579 | 100,888 |
Class B | 25,159 | - |
Class C | 146,334 | - |
Canada | 40,860,360 | 34,710,753 |
Institutional Class | 803,928 | 588,282 |
Total | $ 43,693,415 | $ 36,731,380 |
From net realized gain | | |
Class A | $ - | $ 1,169,578 |
Class T | - | 185,711 |
Class B | - | 32,050 |
Class C | - | 395,818 |
Canada | - | 20,430,566 |
Institutional Class | - | 352,725 |
Total | $ - | $ 22,566,448 |
Annual Report
Notes to Financial Statements - continued
11. Share Transactions.
Transactions for each class of shares were as follows:
| Shares | Dollars |
Years ended October 31, | 2013 | 2012 | 2013 | 2012 |
Class A | | | | |
Shares sold | 215,503 | 554,403 | $ 11,581,739 | $ 28,690,109 |
Reinvestment of distributions | 24,773 | 41,955 | 1,299,341 | 2,109,494 |
Shares redeemed | (1,179,795) | (1,747,243) | (63,487,281) | (89,985,257) |
Net increase (decrease) | (939,519) | (1,150,885) | $ (50,606,201) | $ (59,185,654) |
Class T | | | | |
Shares sold | 36,303 | 72,156 | $ 1,947,020 | $ 3,681,114 |
Reinvestment of distributions | 4,099 | 5,569 | 214,911 | 279,919 |
Shares redeemed | (178,697) | (183,751) | (9,595,838) | (9,407,140) |
Net increase (decrease) | (138,295) | (106,026) | $ (7,433,907) | $ (5,446,107) |
Class B | | | | |
Shares sold | 567 | 3,584 | $ 30,467 | $ 181,692 |
Reinvestment of distributions | 400 | 519 | 20,851 | 25,894 |
Shares redeemed | (49,457) | (49,710) | (2,648,974) | (2,528,127) |
Net increase (decrease) | (48,490) | (45,607) | $ (2,597,656) | $ (2,320,541) |
Class C | | | | |
Shares sold | 62,908 | 161,752 | $ 3,346,028 | $ 8,188,420 |
Reinvestment of distributions | 2,201 | 6,045 | 114,122 | 300,150 |
Shares redeemed | (510,875) | (622,861) | (27,051,390) | (31,505,606) |
Net increase (decrease) | (445,766) | (455,064) | $ (23,591,240) | $ (23,017,036) |
Canada | | | | |
Shares sold | 2,375,531 | 4,866,802 | $ 128,818,784 | $ 252,453,035 |
Reinvestment of distributions | 737,701 | 1,003,141 | 38,862,091 | 50,678,709 |
Shares redeemed | (19,289,279) | (22,354,268) | (1,044,400,607) | (1,155,960,861) |
Net increase (decrease) | (16,176,047) | (16,484,325) | $ (876,719,732) | $ (852,829,117) |
Institutional Class | | | | |
Shares sold | 144,801 | 561,510 | $ 7,839,112 | $ 29,055,185 |
Reinvestment of distributions | 11,985 | 13,162 | 629,694 | 663,252 |
Shares redeemed | (720,255) | (774,433) | (38,850,898) | (39,795,082) |
Net increase (decrease) | (563,469) | (199,761) | $ (30,382,092) | $ (10,076,645) |
12. Other.
The Fund's organizational documents provide former and current trustees and officers with a limited indemnification against liabilities arising in connection with the performance of their duties to the Fund. In the normal course of business, the Fund may also enter into contracts that provide general indemnifications. The Fund's maximum exposure under these arrangements is unknown as this would be dependent on future claims that may be made against the Fund. The risk of material loss from such claims is considered remote.
Annual Report
Report of Independent Registered Public Accounting Firm
To the Trustees of Fidelity Investment Trust and the Shareholders of Fidelity Canada Fund:
In our opinion, the accompanying statement of assets and liabilities, including the schedule of investments, and the related statements of operations and of changes in net assets and the financial highlights present fairly, in all material respects, the financial position of Fidelity Canada Fund (a fund of Fidelity Investment Trust) at October 31, 2013, the results of its operations for the year then ended, the changes in its net assets for each of the two years in the period then ended and the financial highlights for each of the five years in the period then ended, in conformity with accounting principles generally accepted in the United States of America. These financial statements and financial highlights (hereafter referred to as "financial statements") are the responsibility of the Fidelity Canada Fund's management. Our responsibility is to express an opinion on these financial statements based on our audits. We conducted our audits of these financial statements in accordance with the standards of the Public Company Accounting Oversight Board (United States). Those standards require that we plan and perform the audit to obtain reasonable assurance about whether the financial statements are free of material misstatement. An audit includes examining, on a test basis, evidence supporting the amounts and disclosures in the financial statements, assessing the accounting principles used and significant estimates made by management, and evaluating the overall financial statement presentation. We believe that our audits, which included confirmation of securities at October 31, 2013 by correspondence with the custodian and brokers, provide a reasonable basis for our opinion.
PricewaterhouseCoopers LLP
Boston, Massachusetts
December 16, 2013
Annual Report
The Trustees, Member of the Advisory Board, and executive officers of the trust and fund, as applicable, are listed below. The Board of Trustees governs the fund and is responsible for protecting the interests of shareholders. The Trustees are experienced executives who meet periodically throughout the year to oversee the fund's activities, review contractual arrangements with companies that provide services to the fund, oversee management of the risks associated with such activities and contractual arrangements, and review the fund's performance. Except for James C. Curvey, Ned C. Lautenbach, Ronald P. O'Hanley, and William S. Stavropoulos, each of the Trustees oversees 171 funds. Mr. Curvey oversees 394 funds. Mr. Lautenbach, Mr. O'Hanley, and Mr. Stavropoulos each oversees 245 funds.
The Trustees hold office without limit in time except that (a) any Trustee may resign; (b) any Trustee may be removed by written instrument, signed by at least two-thirds of the number of Trustees prior to such removal; (c) any Trustee who requests to be retired or who has become incapacitated by illness or injury may be retired by written instrument signed by a majority of the other Trustees; and (d) any Trustee may be removed at any special meeting of shareholders by a two-thirds vote of the outstanding voting securities of the trust. Each Trustee who is not an interested person of the trust and the fund (as defined in the 1940 Act) (Independent Trustee), shall retire not later than the last day of the calendar year in which his or her 75th birthday occurs. The Independent Trustees may waive this mandatory retirement age policy with respect to individual Trustees. The executive officers and Advisory Board Member hold office without limit in time, except that any officer and Advisory Board Member may resign or may be removed by a vote of a majority of the Trustees at any regular meeting or any special meeting of the Trustees. Except as indicated, each individual has held the office shown or other offices in the same company for the past five years.
Experience, Skills, Attributes, and Qualifications of the Fund's Trustees. The Governance and Nominating Committee has adopted a statement of policy that describes the experience, qualifications, attributes, and skills that are necessary and desirable for potential Independent Trustee candidates (Statement of Policy). The Board believes that each Trustee satisfied at the time he or she was initially elected or appointed a Trustee, and continues to satisfy, the standards contemplated by the Statement of Policy. The Governance and Nominating Committee also engages professional search firms to help identify potential Independent Trustee candidates who have the experience, qualifications, attributes, and skills consistent with the Statement of Policy. From time to time, additional criteria based on the composition and skills of the current Independent Trustees, as well as experience or skills that may be appropriate in light of future changes to board composition, business conditions, and regulatory or other developments, have also been considered by the professional search firms and the Governance and Nominating Committee. In addition, the Board takes into account the Trustees' commitment and participation in Board and committee meetings, as well as their leadership of standing and ad hoc committees throughout their tenure.
In determining that a particular Trustee was and continues to be qualified to serve as a Trustee, the Board has considered a variety of criteria, none of which, in isolation, was controlling. The Board believes that, collectively, the Trustees have balanced and diverse experience, qualifications, attributes, and skills, which allow the Board to operate effectively in governing the fund and protecting the interests of shareholders. Information about the specific experience, skills, attributes, and qualifications of each Trustee, which in each case led to the Board's conclusion that the Trustee should serve (or continue to serve) as a trustee of the fund, is provided below.
Board Structure and Oversight Function. James C. Curvey is an interested person (as defined in the 1940 Act) and currently serves as Chairman. The Trustees have determined that an interested Chairman is appropriate and benefits shareholders because an interested Chairman has a personal and professional stake in the quality and continuity of services provided to the fund. Independent Trustees exercise their informed business judgment to appoint an individual of their choosing to serve as Chairman, regardless of whether the Trustee happens to be independent or a member of management. The Independent Trustees have determined that they can act independently and effectively without having an Independent Trustee serve as Chairman and that a key structural component for assuring that they are in a position to do so is for the Independent Trustees to constitute a substantial majority for the Board. The Independent Trustees also regularly meet in executive session. Ned C. Lautenbach serves as Chairman of the Independent Trustees and as such (i) acts as a liaison between the Independent Trustees and management with respect to matters important to the Independent Trustees and (ii) with management prepares agendas for Board meetings.
Fidelity funds are overseen by different Boards of Trustees. The fund's Board oversees Fidelity's equity and high income funds and another Board oversees Fidelity's investment-grade bond, money market, and asset allocation funds. The asset allocation funds may invest in Fidelity funds overseen by the fund's Board. The use of separate Boards, each with its own committee structure, allows the Trustees of each group of Fidelity funds to focus on the unique issues of the funds they oversee, including common research, investment, and operational issues. On occasion, the separate Boards establish joint committees to address issues of overlapping consequences for the Fidelity funds overseen by each Board.
The Trustees operate using a system of committees to facilitate the timely and efficient consideration of all matters of importance to the Trustees, the fund, and fund shareholders and to facilitate compliance with legal and regulatory requirements and oversight of the fund's activities and associated risks. The Board, acting through its committees, has charged FMR and its affiliates with (i) identifying events or circumstances the occurrence of which could have demonstrably adverse effects on the fund's business and/or reputation; (ii) implementing processes and controls to lessen the possibility that such events or circumstances occur or to mitigate the effects of such events or circumstances if they do occur; and (iii) creating and maintaining a system designed to evaluate continuously business and market conditions in order to facilitate the identification and implementation processes described in (i) and (ii) above. Because the day-to-day operations and activities of the fund are carried out by or through FMR, its affiliates and other service providers, the fund's exposure to risks is mitigated but not eliminated by the processes overseen by the Trustees. While each of the Board's committees has responsibility for overseeing different aspects of the fund's activities, oversight is exercised primarily through the Operations, Audit, and Compliance Committees. In addition, the Independent Trustees have worked with FMR to enhance the Board's oversight of investment and financial risks, legal and regulatory risks, technology risks, and operational risks, including the development of additional risk reporting to the Board. For example, a working group comprised of Independent Trustees and FMR has worked and continues to work to review the Fidelity funds' valuation-related activities, reporting and risk management. Appropriate personnel, including but not limited to the fund's Chief Compliance Officer (CCO), FMR's internal auditor, the independent accountants, the fund's Treasurer and portfolio management personnel, make periodic reports to the Board's committees, as appropriate, including an annual review of FMR's risk management program for the Fidelity funds. The responsibilities of each standing committee, including their oversight responsibilities, are described further under "Standing Committees of the Fund's Trustees."
Annual Report
Trustees and Officers - continued
The fund's Statement of Additional Information (SAI) includes more information about the Trustees. To request a free copy, call Fidelity at 1-877-208-0098.
Interested Trustees*:
Correspondence intended for each Trustee who is an interested person may be sent to Fidelity Investments, 245 Summer Street, Boston, Massachusetts 02210.
Name, Year of Birth; Principal Occupations and Other Relevant Experience+ |
James C. Curvey (1935) |
Year of Election or Appointment: 2007 Trustee Chairman of the Board of Trustees |
| Mr. Curvey also serves as Trustee of other Fidelity funds. Mr. Curvey is a Director of Fidelity Investments Money Management, Inc. (2009-present), Director of Fidelity Research & Analysis Co. (2009-present) and Director of FMR and FMR Co., Inc. (2007-present). Mr. Curvey is also Vice Chairman (2007-present) and Director of FMR LLC. In addition, Mr. Curvey serves as an Overseer for the Boston Symphony Orchestra and a member of the Trustees of Villanova University. Previously, Mr. Curvey was the Vice Chairman (2006-2007) and Director (2000-2007) of FMR Corp. |
Ronald P. O'Hanley (1957) |
Year of Election or Appointment: 2011 Trustee |
| Mr. O'Hanley also serves as Trustee of other Fidelity funds. He is Director of Fidelity SelectCo, LLC (2013-present), FMR Co., Inc. (2010-present), Director of Fidelity Investments Money Management, Inc. (2010-present), Director of Fidelity Research & Analysis Company (2010-present), President of Fidelity Asset Management and Corporate Services and a Member of Fidelity's Executive Committee (2010-present). Previously, Mr. O'Hanley served as President and Chief Executive Officer of BNY Mellon Asset Management (2007-2010). Mr. O'Hanley also served as Vice Chairman of Bank New York Mellon Corp. and a member of that firm's Executive Committee. Prior to the 2007 merger of The Bank of New York and Mellon Financial Corporation, he was Vice Chairman of Mellon Financial Corporation and President and Chief Executive Officer of Mellon Asset Management. He joined Mellon in February 1997. Mr. O'Hanley currently serves as Chairman of the Boston Public Library Foundation Board of Directors and sits on the Board of Directors of Beth Israel Deaconess Medical Center, the Board of Trustees of the Marine Biological Laboratory and the Advisory Board of the Maxwell School of Citizenship and Public Administration at Syracuse University. Mr. O'Hanley also chairs the Council on Asset Management for the Financial Services Roundtable and is a member of the Board of Directors of Institutional Investor's U.S. Institute. |
* Trustees have been determined to be "Interested Trustees" by virtue of, among other things, their affiliation with the trust or various entities under common control with FMR.
+ The information above includes each Trustee's principal occupation during the last five years and other information relating to the experience, attributes, and skills relevant to each Trustee's qualifications to serve as a Trustee, which led to the conclusion that each Trustee should serve as a Trustee for the fund.
Annual Report
Independent Trustees:
Correspondence intended for each Independent Trustee (that is, the Trustees other than the Interested Trustees) may be sent to Fidelity Investments, P.O. Box 55235, Boston, Massachusetts 02205-5235.
Name, Year of Birth; Principal Occupations and Other Relevant Experience+ |
Dennis J. Dirks (1948) |
Year of Election or Appointment: 2005 Trustee |
| Mr. Dirks also serves as Trustee of other Fidelity funds. Prior to his retirement in May 2003, Mr. Dirks was Chief Operating Officer and a member of the Board of The Depository Trust & Clearing Corporation (DTCC). He also served as President, Chief Operating Officer, and Board member of The Depository Trust Company (DTC) and President and Board member of the National Securities Clearing Corporation (NSCC). In addition, Mr. Dirks served as Chief Executive Officer and Board member of the Government Securities Clearing Corporation, Chief Executive Officer and Board member of the Mortgage-Backed Securities Clearing Corporation, as a Trustee and a member of the Finance Committee of Manhattan College (2005-2008), and as a Trustee and a member of the Finance Committee of AHRC of Nassau County (2006-2008). Mr. Dirks is a member of the Independent Directors Council (IDC) Governing Council (2010-present) and Board of Directors for The Brookville Center for Children's Services, Inc. (2009-present). |
Alan J. Lacy (1953) |
Year of Election or Appointment: 2008 Trustee |
| Mr. Lacy also serves as Trustee of other Fidelity funds. Mr. Lacy serves as Senior Adviser (2007-present) of Oak Hill Capital Partners, L.P. (private equity). Mr. Lacy also served as Chief Executive Officer (2000-2005) and Vice Chairman (2005-2006) of Sears Holdings Corporation and Sears, Roebuck and Co. (retail). In addition, Mr. Lacy serves as a member of the Board of Directors of Dave & Buster's Entertainment, Inc. (restaurant and entertainment complexes, 2010-present), Earth Fare, Inc. (retail grocery, 2012-present), The Hillman Companies, Inc. (hardware wholesalers, 2010-present), and Bristol-Myers Squibb Company (global pharmaceuticals, 2008-present). Mr. Lacy is a member of the Board of Trustees of The National Parks Conservation Association (2006-present). Previously, Mr. Lacy served as Chairman of the Board of Trustees of the National Parks Conservation Association (2008-2011) and as a member of the Board of Directors for the Western Union Company (global money transfer, 2006-2011). |
Ned C. Lautenbach (1944) |
Year of Election or Appointment: 2000 Trustee Chairman of the Independent Trustees |
| Mr. Lautenbach also serves as Trustee of other Fidelity funds. Mr. Lautenbach currently serves as the Lead Director of the Eaton Corporation Board of Directors (diversified industrial, 1997-present). Mr. Lautenbach is Chairman of the Board of Directors of the Philharmonic Center for the Arts in Naples, Florida (2012-present) and a member of the Council on Foreign Relations (1994-present). Previously, Mr. Lautenbach was a Partner/Advisory Partner at Clayton, Dubilier & Rice, LLC (private equity investment, 1998-2010), as well as a Director of Sony Corporation (2006-2007). |
Joseph Mauriello (1944) |
Year of Election or Appointment: 2008 Trustee |
| Mr. Mauriello also serves as Trustee of other Fidelity funds. Prior to his retirement in January 2006, Mr. Mauriello served in numerous senior management positions including Deputy Chairman and Chief Operating Officer (2004-2005), and Vice Chairman of Financial Services (2002-2004) of KPMG LLP US (professional services, 1965-2005). Mr. Mauriello currently serves as a member of the Board of Directors of XL Group plc. (global insurance and re-insurance, 2006-present). Previously, Mr. Mauriello served as a Director of the Hamilton Funds of the Bank of New York (2006-2007) and of Arcadia Resources Inc. (health care services and products, 2007-2012). |
Robert W. Selander (1950) |
Year of Election or Appointment: 2011 Trustee |
| Mr. Selander also serves as Trustee of other Fidelity funds. Previously, Mr. Selander served as a Member of the Advisory Board of other Fidelity funds (2011), and Executive Vice Chairman (2010), Chief Executive Officer (2009-2010), and President and Chief Executive Officer (1997-2009) of Mastercard, Inc. |
Cornelia M. Small (1944) |
Year of Election or Appointment: 2005 Trustee |
| Ms. Small also serves as Trustee of other Fidelity funds. Ms. Small is a member of the Board of Directors (2009-present) and Chair of the Investment Committee (2010-present) of the Teagle Foundation. Ms. Small also serves on the Investment Committee of the Berkshire Taconic Community Foundation (2008-present). Previously, Ms. Small served as Chairperson (2002-2008) and a member of the Investment Committee and Chairperson (2008-2012) and a member of the Board of Trustees of Smith College. In addition, Ms. Small served as Chief Investment Officer, Director of Global Equity Investments, and a member of the Board of Directors of Scudder, Stevens & Clark and Scudder Kemper Investments. |
William S. Stavropoulos (1939) |
Year of Election or Appointment: 2001 Trustee Vice Chairman of the Independent Trustees |
| Mr. Stavropoulos also serves as Trustee of other Fidelity funds. Mr. Stavropoulos serves as President and Founder of the Michigan Baseball Foundation, the Great Lakes Loons (2007-present). Mr. Stavropoulos is Chairman Emeritus of the Board of Directors of The Dow Chemical Company, where he previously served in numerous senior management positions, including President, CEO (1995-2000; 2002-2004), Chairman of the Executive Committee (2000-2006), and as a member of the Board of Directors (1990-2006). Currently, Mr. Stavropoulos is Chairman of the Board of Directors of Univar Inc. (global distributor of commodity and specialty chemicals), a Director of Teradata Corporation (data warehousing and technology solutions), and Maersk Inc. (industrial conglomerate), and a member of the Advisory Board for Metalmark Capital LLC (private equity investment, 2005-present). Mr. Stavropoulos is an operating advisor to Clayton, Dubilier & Rice, LLC (private equity investment). In addition, Mr. Stavropoulos is a member of the University of Notre Dame Advisory Council for the College of Science, a Trustee of the Rollin L. Gerstacker Foundation, and a Director of the Naples Philharmonic Center for the Arts. Previously, Mr. Stavropoulos served as a Director of Chemical Financial Corporation (bank holding company, 1993-2012) and Tyco International, Ltd. (multinational manufacturing and services, 2007-2012). |
David M. Thomas (1949) |
Year of Election or Appointment: 2008 Trustee |
| Mr. Thomas also serves as Trustee of other Fidelity funds. Mr. Thomas serves as Non-Executive Chairman of the Board of Directors of Fortune Brands Home and Security (home and security products, 2011-present), and as a member of the Board of Directors of Interpublic Group of Companies, Inc. (marketing communication, 2004-present). Previously, Mr. Thomas served as Executive Chairman (2005-2006) and Chairman and Chief Executive Officer (2000-2005) of IMS Health, Inc. (pharmaceutical and healthcare information solutions), and a Director of Fortune Brands, Inc. (consumer products, 2000-2011). |
+ The information above includes each Trustee's principal occupation during the last five years and other information relating to the experience, attributes, and skills relevant to each Trustee's qualifications to serve as a Trustee, which led to the conclusion that each Trustee should serve as a Trustee for the fund.
Advisory Board Member and Executive Officers:
Correspondence intended for each executive officer and Peter S. Lynch may be sent to Fidelity Investments, 245 Summer Street, Boston, Massachusetts 02210. Executive officers appear below in alphabetical order.
Name, Year of Birth; Principal Occupation |
Peter S. Lynch (1944) |
Year of Election or Appointment: 2003 Member of the Advisory Board |
| Mr. Lynch also serves as Member of the Advisory Board of other Fidelity funds. Mr. Lynch is Vice Chairman and a Director of FMR and FMR Co., Inc. In addition, Mr. Lynch serves as a Trustee of Boston College and as the Chairman of the Inner-City Scholarship Fund. Previously, Mr. Lynch served on the Special Olympics International Board of Directors (1997-2006). |
Elizabeth Paige Baumann (1968) |
Year of Election or Appointment: 2012 Anti-Money Laundering (AML) Officer |
| Ms. Baumann also serves as AML Officer of other funds. She is Chief AML Officer of FMR LLC (2012-present) and is an employee of Fidelity Investments. Previously, Ms. Baumann served as Vice President and Deputy Anti-Money Laundering Officer (2007-2012). |
William C. Coffey (1969) |
Year of Election or Appointment: 2009 Assistant Secretary |
| Mr. Coffey also serves as Assistant Secretary of other funds. He is Senior Vice President and Deputy General Counsel of FMR LLC (2010-present), and is an employee of Fidelity Investments. Previously, Mr. Coffey served as Vice President and Associate General Counsel of FMR LLC (2005-2009). |
Jonathan Davis (1968) |
Year of Election or Appointment: 2010 Assistant Treasurer |
| Mr. Davis also serves as Assistant Treasurer of other funds. Mr. Davis is an employee of Fidelity Investments. Previously, Mr. Davis served as Vice President and Associate General Counsel of FMR LLC (2003-2010). |
Adrien E. Deberghes (1967) |
Year of Election or Appointment: 2008 Deputy Treasurer |
| Mr. Deberghes also serves as an officer of other funds. He is an employee of Fidelity Investments (2008-present). Prior to joining Fidelity Investments, Mr. Deberghes was Senior Vice President of Mutual Fund Administration at State Street Corporation (2007-2008), Senior Director of Mutual Fund Administration at Investors Bank & Trust (2005-2007), and Director of Finance for Dunkin' Brands (2000-2005). |
Stephanie J. Dorsey (1969) |
Year of Election or Appointment: 2010 Assistant Treasurer |
| Ms. Dorsey also serves as an officer of other funds. She is an employee of Fidelity Investments (2008-present) and has served in other fund officer roles. Prior to joining Fidelity Investments, Ms. Dorsey served as Treasurer (2004-2008) of the JPMorgan Mutual Funds and Vice President (2004-2008) of JPMorgan Chase Bank. |
Scott C. Goebel (1968) |
Year of Election or Appointment: 2008 Secretary and Chief Legal Officer (CLO) |
| Mr. Goebel serves as Secretary and CLO of other funds. Mr. Goebel also serves as Secretary of Fidelity Investments Money Management, Inc. (FIMM) (2010-present) and Fidelity Research and Analysis Company (FRAC) (2010-present); General Counsel, Secretary, and Senior Vice President of FMR (2008-present) and FMR Co., Inc. (2008-present); Chief Legal Officer of Fidelity Management & Research (Hong Kong) Limited (2008-present) and Assistant Secretary of Fidelity Management & Research (Japan) Inc. (2008-present), and Fidelity Management & Research (U.K.) Inc. (2008-present). Previously, Mr. Goebel served as Secretary and CLO of other Fidelity funds (2008-2013), Assistant Secretary of FIMM (2008-2010), FRAC (2008-2010), and certain funds (2007-2008); and as Vice President and Secretary of Fidelity Distributors Corporation (FDC) (2005-2007). Mr. Goebel has been employed by FMR LLC or an affiliate since 2001. |
Joseph A. Hanlon (1968) |
Year of Election or Appointment: 2012 Chief Compliance Officer |
| Mr. Hanlon also serves as Chief Compliance Officer of other funds. Mr. Hanlon serves as Compliance Officer of FMR, FMR Co., Inc., Fidelity Investments Money Management, Inc. (FIMM), Fidelity Research and Analysis Company (FRAC), and Fidelity Management & Research (Hong Kong) (2009-present), as Senior Vice President of the Fidelity Asset Management Division (2009-present), and is an employee of Fidelity Investments. Previously, Mr. Hanlon served as Compliance Officer of Fidelity Management & Research (Japan) Inc. (2009-2013), Strategic Advisers, Inc. (2009-2013), and Fidelity Management & Research (U.K.) Inc. (2009-2013). |
Bruce T. Herring (1965) |
Year of Election or Appointment: 2006 Vice President of certain Equity Funds |
| Mr. Herring also serves as Vice President of other funds. He serves as Chief Investment Officer of Fidelity Global Asset Allocation (GAA) (2013-present), Chief Investment Officer and Director of Fidelity Management & Research (U.K.) Inc. (2010-present), Group Chief Investment Officer of FMR, and President of Fidelity Research & Analysis Company (2010-present). Previously, Mr. Herring served as Vice President (2005-2006) and Senior Vice President (2006-2007) of Fidelity Management & Research Company, Vice President of FMR Co., Inc. (2001-2007), and as a portfolio manager for Fidelity U.S. Equity Funds. |
Brian B. Hogan (1964) |
Year of Election or Appointment: 2009 Vice President |
| Mr. Hogan also serves as Vice President of other funds. Mr. Hogan serves as President of FMR's Equity Division (2009-present). Previously, Mr. Hogan served as Senior Vice President, Equity Research of FMR (2006-2009) and as a portfolio manager. |
Chris Maher (1972) |
Year of Election or Appointment: 2013 Assistant Treasurer |
| Mr. Maher serves as Assistant Treasurer of other funds. Mr. Maher is Vice President of Valuation Oversight and is an employee of Fidelity Investments. Previously, Mr. Maher served as Vice President of Asset Management Compliance (2013), Vice President of FMR's Program Management Group (2010-2013), and Vice President of Valuation Oversight (2008-2010). |
Christine Reynolds (1958) |
Year of Election or Appointment: 2008 Chief Financial Officer |
| Ms. Reynolds also serves as Chief Financial Officer of other funds. Ms. Reynolds became President of Fidelity Pricing and Cash Management Services (FPCMS) in August 2008. Ms. Reynolds served as Chief Operating Officer of FPCMS (2007-2008). Previously, Ms. Reynolds served as President, Treasurer, and Anti-Money Laundering officer of the Fidelity funds (2004-2007). |
Kenneth B. Robins (1969) |
Year of Election or Appointment: 2008 President and Treasurer |
| Mr. Robins also serves as an officer of other funds. Mr. Robins serves as Executive Vice President of Fidelity Investments Money Management, Inc. (FIMM) (2013-present) and is an employee of Fidelity Investments (2004-present). Previously, Mr. Robins served in other fund officer roles. |
Gary W. Ryan (1958) |
Year of Election or Appointment: 2005 Assistant Treasurer |
| Mr. Ryan also serves as Assistant Treasurer of other funds. Mr. Ryan is an employee of Fidelity Investments and has served in other fund officer roles. Previously, Mr. Ryan served as Vice President of Fund Reporting in Fidelity Pricing and Cash Management Services (FPCMS) (1999-2005). |
Stephen Sadoski (1971) |
Year of Election or Appointment: 2012 Deputy Treasurer |
| Mr. Sadoski also serves as Deputy Treasurer of other funds. He is an employee of Fidelity Investments (2012-present) and has served in another fund officer role. Prior to joining Fidelity Investments, Mr. Sadoski served as an assistant chief accountant in the Division of Investment Management of the Securities and Exchange Commission (SEC) (2009-2012) and as a senior manager at Deloitte & Touche LLP (1997-2009). |
Stacie M. Smith (1974) |
Year of Election or Appointment: 2013 Deputy Treasurer |
| Ms. Smith also serves as an officer of other funds. She is an employee of Fidelity Investments (2009-present) and has served in other fund officer roles. Prior to joining Fidelity Investments, Ms. Smith served as Senior Audit Manager of Ernst & Young LLP (1996-2009). |
Renee Stagnone (1975) |
Year of Election or Appointment: 2013 Deputy Treasurer |
| Ms. Stagnone also serves as Deputy Treasurer of other funds. Ms. Stagnone is an employee of Fidelity Investments. |
Joseph F. Zambello (1957) |
Year of Election or Appointment: 2011 Deputy Treasurer |
| Mr. Zambello also serves as Deputy Treasurer of other funds. Mr. Zambello is an employee of Fidelity Investments. Previously, Mr. Zambello served as Vice President of FMR's Program Management Group (2009-2011) and Vice President of the Transfer Agent Oversight Group (2005-2009). |
Annual Report
The Board of Trustees of Fidelity Advisor Canada Fund voted to pay to shareholders of record at the opening of business on record date, the following distributions per share derived from capital gains realized from sales of portfolio securities, and dividends derived from net investment income:
| Pay Date | Record Date | Dividends | Capital Gains |
Class A | 12/09/13 | 12/06/13 | $0.027 | $0.32 |
Class T | 12/09/13 | 12/06/13 | $__ | $0.32 |
Class B | 12/09/13 | 12/06/13 | $__ | $0.32 |
Class C | 12/09/13 | 12/06/13 | $__ | $0.32 |
The fund hereby designates as a capital gain dividend with respect to the taxable year ended October 31, 2013 $54,802,785 or, if subsequently determined to be different, the net capital gain of such year.
A percentage of the dividends distributed during the fiscal year for the following funds qualifies for the dividends-received deduction for corporate shareholders:
| December 07, 2012 |
Class A | 5% |
Class T | 6% |
Class B | 12% |
Class C | 13% |
A percentage of the dividends distributed during the fiscal year for the following funds may be taken into account as a dividend for purposes of the maximum rate under section 1(h)(11) of the Internal Revenue Code.
| December 07, 2012 |
Class A | 100% |
Class T | 100% |
Class B | 100% |
Class C | 100% |
The amounts per share which represent income derived from sources within, and taxes paid to, foreign countries or possessions of the United States are as follows:
| Pay Date | Income | Taxes |
Class A | 12/10/12 | $0.702 | $0.1441 |
Class T | 12/10/12 | $0.552 | $0.1441 |
Class B | 12/10/12 | $0.279 | $0.1441 |
Class C | 12/10/12 | $0.262 | $0.1441 |
The fund will notify shareholders in January 2014 of amounts for use in preparing 2013 income tax returns.
Annual Report
Board Approval of Investment Advisory Contracts and Management Fees
Fidelity Canada Fund
Each year, the Board of Trustees, including the Independent Trustees (together, the Board), votes on the renewal of the management contract and sub-advisory agreements (together, the Advisory Contracts) for the fund. The Board, assisted by the advice of fund counsel and Independent Trustees' counsel, requests and considers a broad range of information relevant to the renewal of the Advisory Contracts throughout the year.
The Board meets regularly and, at each of its meetings, covers an extensive agenda of topics and materials and considers factors that are relevant to its annual consideration of the renewal of the fund's Advisory Contracts, including the services and support provided to the fund and its shareholders. The Board has established various standing committees, each composed of and chaired by Independent Trustees with varying backgrounds, to which the Board has assigned specific subject matter responsibilities in order to enhance effective decision-making by the Board. The Board, acting directly and through its Committees, requests and receives information concerning the annual consideration of the renewal of the fund's Advisory Contracts. The Board also meets as needed to consider matters specifically related to the Board's annual consideration of the renewal of Advisory Contracts. Members of the Board may also meet with trustees of other Fidelity funds through ad hoc joint committees to discuss certain matters relevant to the Fidelity funds.
At its July 2013 meeting, the Board, including the Independent Trustees, unanimously determined to renew the fund's Advisory Contracts. In reaching its determination, the Board considered all factors it believed relevant, including (i) the nature, extent, and quality of the services to be provided to the fund and its shareholders (including the investment performance of the fund); (ii) the competitiveness of the fund's management fee and total expense ratio relative to peer funds; (iii) the total costs of the services to be provided by and the profits to be realized by Fidelity from its relationship with the fund; (iv) the extent to which economies of scale exist and would be realized as the fund grows; and (v) whether fee levels reflect these economies of scale, if any, for the benefit of fund shareholders.
In considering whether to renew the Advisory Contracts for the fund, the Board reached a determination, with the assistance of fund counsel and Independent Trustees' counsel and through the exercise of its business judgment, that the renewal of the Advisory Contracts was in the best interests of the fund and its shareholders and that the compensation payable under the Advisory Contracts was fair and reasonable. The Board's decision to renew the Advisory Contracts was not based on any single factor, but rather was based on a comprehensive consideration of all the information provided to the Board at its meetings throughout the year. The Board, in reaching its determination to renew the Advisory Contracts, was aware that shareholders in the fund have a broad range of investment choices available to them, including a wide choice among mutual funds offered by Fidelity's competitors, and that the fund's shareholders, who have the opportunity to review and weigh the disclosure provided by the fund in its prospectus and other public disclosures, have chosen to invest in this fund, which is a part of the Fidelity family of funds.
Nature, Extent, and Quality of Services Provided. The Board considered the staffing within the investment adviser, Fidelity Management & Research Company (FMR), and the sub-advisers (together, the Investment Advisers) as it relates to the fund, including the backgrounds of the fund's investment personnel, and also considered the fund's investment objective, strategies, and related investment philosophy. The Independent Trustees also had discussions with senior management of Fidelity's investment operations and investment groups. The Board considered the structure of the portfolio manager compensation program and whether this structure provides appropriate incentives to act in the best interests of the fund.
Resources Dedicated to Investment Management and Support Services. The Board and the Fund Oversight and Research Committees reviewed the general qualifications and capabilities of the Investment Advisers' investment staff, including its size, education, experience, and resources, as well as the Investment Advisers' approach to recruiting, training, managing, and compensating investment personnel. The Board noted that FMR has continued to increase the resources devoted to non-U.S. offices, including expansion of Fidelity's global investment organization. The Board also noted that Fidelity's analysts have extensive resources, tools and capabilities that allow them to conduct sophisticated quantitative and fundamental analysis, as well as credit analysis of issuers, counterparties and guarantors. Further, the Board believes that Fidelity's investment professionals have sufficient access to global information and data so as to provide competitive investment results over time, and that those professionals also have access to sophisticated tools that permit them to assess portfolio construction and risk and performance attribution characteristics continuously, as well as to transmit new information and research conclusions rapidly around the world. Additionally, in its deliberations, the Board considered the Investment Advisers' trading and risk management capabilities and resources, which are an integral part of the investment management process.
Shareholder and Administrative Services. The Board considered (i) the nature, extent, quality, and cost of advisory, administrative, and shareholder services performed by the Investment Advisers and their affiliates under the Advisory Contracts and under separate agreements covering transfer agency, pricing and bookkeeping, and securities lending services for the fund; (ii) the nature and extent of the supervision of third party service providers, principally custodians and subcustodians; and (iii) the resources devoted to, and the record of compliance with, the fund's compliance policies and procedures. The Board also reviewed the allocation of fund brokerage, including allocations to brokers affiliated with the Investment Advisers, the use of brokerage commissions to pay fund expenses, and the use of "soft" commission dollars to pay for research services.
The Board noted that the growth of fund assets over time across the complex allows Fidelity to reinvest in the development of services designed to enhance the value or convenience of the Fidelity funds as investment vehicles. These services include 24-hour access to account information and market information through telephone representatives and over the Internet, investor education materials and asset allocation tools, and the expanded availability of Fidelity Investor Centers.
Annual Report
Board Approval of Investment Advisory Contracts and Management Fees - continued
Investment in a Large Fund Family. The Board considered the benefits to shareholders of investing in a Fidelity fund, including the benefits of investing in a fund that is part of a large family of funds offering a variety of investment disciplines and providing a large variety of mutual fund investor services. The Board noted that Fidelity had taken, or had made recommendations that resulted in the Fidelity funds taking, a number of actions over the previous year that benefited particular funds, including (i) continuing to dedicate additional resources to investment research and to the support of the senior management team that oversees asset management; (ii) persisting in efforts to enhance Fidelity's global research capabilities; (iii) launching new funds and making other enhancements to meet client needs for global and income-oriented solutions; (iv) continuing to launch dedicated lower cost underlying funds to meet portfolio construction needs related to expanding underlying fund options for Fidelity funds of funds, specifically for the Freedom Fund product lines; (v) rationalizing product lines and gaining increased efficiencies through the mergers of several funds into other funds; (vi) strengthening Fidelity's index fund offerings by reducing investment minimums and adopting or lowering existing expense caps for certain funds and classes; (vii) enhancing Global Asset Allocation product offerings by launching new funds and strategies, including "open architecture" target date funds that utilize affiliated and unaffiliated sub-advisers; (viii) modifying the eligibility criteria for Institutional Class shares of Advisor funds to increase their marketability to a portion of the defined contribution plan market; (ix) creating a new low-cost retirement share class for certain Advisor funds to appeal to large retirement plans; (x) transitioning the management of certain Fidelity commodity funds to Geode Capital Management LLC, a registered commodity pool operator, while retaining administrative responsibilities for the funds; (xi) reorganizing a number of funds; and (xii) taking steps toward establishing a new Fidelity adviser to manage sector-based funds and products.
Investment Performance. The Board considered whether the fund has operated in accordance with its investment objective, as well as its record of compliance with its investment restrictions and its performance history.
The Board took into account discussions with the Investment Advisers about fund investment performance that occur at Board meetings throughout the year. In this regard the Board noted that as part of regularly scheduled fund reviews and other reports to the Board on fund performance, the Board periodically considers annualized return information for the fund, for different time periods, measured against a securities market index ("benchmark index") and a peer group of mutual funds with similar objectives ("peer group"). In its evaluation of fund investment performance, the Board gave particular attention to information indicating changes in performance of certain Fidelity funds for specific time periods and the Investment Advisers' explanations for any overperformance or underperformance.
In addition to reviewing absolute and relative fund performance, the Independent Trustees periodically consider the appropriateness of fund performance metrics in evaluating the results achieved. In general, the Independent Trustees believe that fund performance should be evaluated based on net performance (after fees and expenses) of both the highest performing and lowest performing classes, where applicable, compared to appropriate benchmark indices, over appropriate time periods which may include full market cycles, and compared to peer groups, as applicable, over the same periods, taking into account relevant factors including the following: general market conditions; issuer-specific information; tactical opportunities for investment; and fund cash flows and other factors.
The Independent Trustees recognize that shareholders evaluate performance on a net basis over their own holding periods, for which one-, three-, and five-year periods are used as a proxy. For this reason, the performance information reviewed by the Board also included net cumulative calendar year total return information for the fund and an appropriate benchmark index for the most recent one-, three-, and five-year periods, as shown below. A peer group comparison is not shown below.
Annual Report
Fidelity Canada Fund
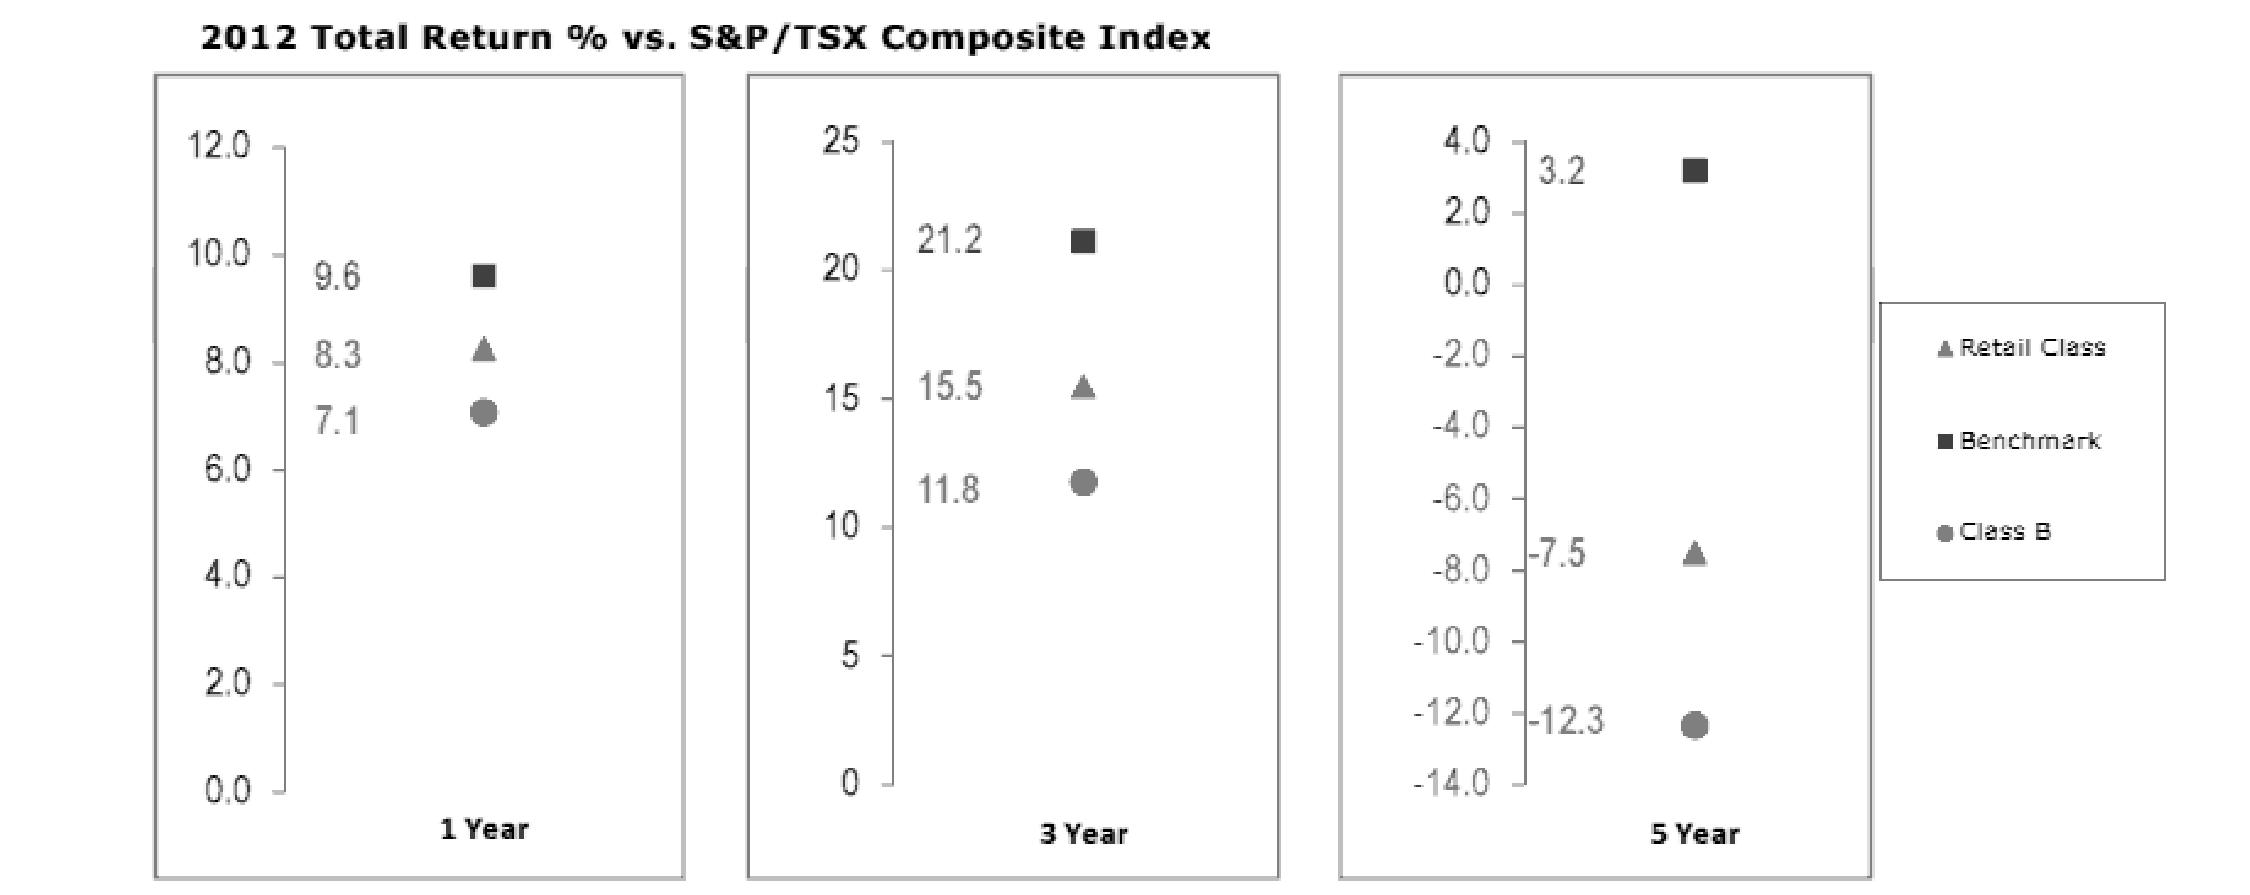
The Board has discussed with FMR the fund's underperformance (based on the December 31, 2012 data presented herein) and has engaged with FMR to consider what steps might be taken to remediate the fund's underperformance. The Board noted that the fund's performance has improved for more recent periods.
The Board also considered that the fund's management fee is subject to upward or downward adjustment depending upon whether, and to what extent, the fund's investment performance for the performance period exceeds, or is exceeded by, a securities index, thus leading to a performance adjustment for the same period. The Board noted that the performance adjustment provides FMR with a strong economic incentive to seek to achieve superior performance for the fund's shareholders and helps to more closely align the interests of FMR and the fund's shareholders.
Based on its review, the Board concluded that the nature, extent, and quality of services provided to the fund under the Advisory Contracts should benefit the fund's shareholders.
Competitiveness of Management Fee and Total Expense Ratio. The Board considered the fund's management fee and total expense ratio compared to "mapped groups" of competitive funds and classes. Fidelity creates "mapped groups" by combining similar Lipper investment objective categories that have comparable management fee characteristics. Combining Lipper investment objective categories aids the Board's management fee and total expense ratio comparisons by broadening the competitive group used for comparison and by reducing the number of universes to which various Fidelity funds are compared.
Management Fee. The Board considered two proprietary management fee comparisons for the 12-month periods shown in the chart below. The group of Lipper funds used by the Board for management fee comparisons is referred to below as the "Total Mapped Group." The Total Mapped Group comparison focuses on a fund's standing in terms of gross management fees before expense reimbursements or caps, and without giving effect to the fund's performance adjustment, relative to the total universe of funds with comparable investment mandates, regardless of whether their management fee structures also are comparable. Funds with comparable investment mandates offer exposure to similar types of securities. Funds with comparable management fee structures have similar management fee contractual arrangements (e.g., flat rate charged for advisory services, all-inclusive fee rate, etc.). "TMG %" represents the percentage of funds in the Total Mapped Group that had management fees that were lower than the fund's. For example, a TMG % of 16% means that 84% of the funds in the Total Mapped Group had higher management fees than the fund. The "Asset-Size Peer Group" (ASPG) comparison focuses on a fund's standing relative to a subset of non-Fidelity funds within the Total Mapped Group that are similar in size and management fee structure. The ASPG represents at least 15% of the funds in the Total Mapped Group with comparable asset size and management fee structures, subject to a minimum of 50 funds (or all funds in the Total Mapped Group if fewer than 50). Additional information, such as the ASPG quartile in which the fund's management fee ranked and the impact of the fund's performance adjustment, is also included in the chart and considered by the Board.
Annual Report
Board Approval of Investment Advisory Contracts and Management Fees - continued
Fidelity Canada Fund
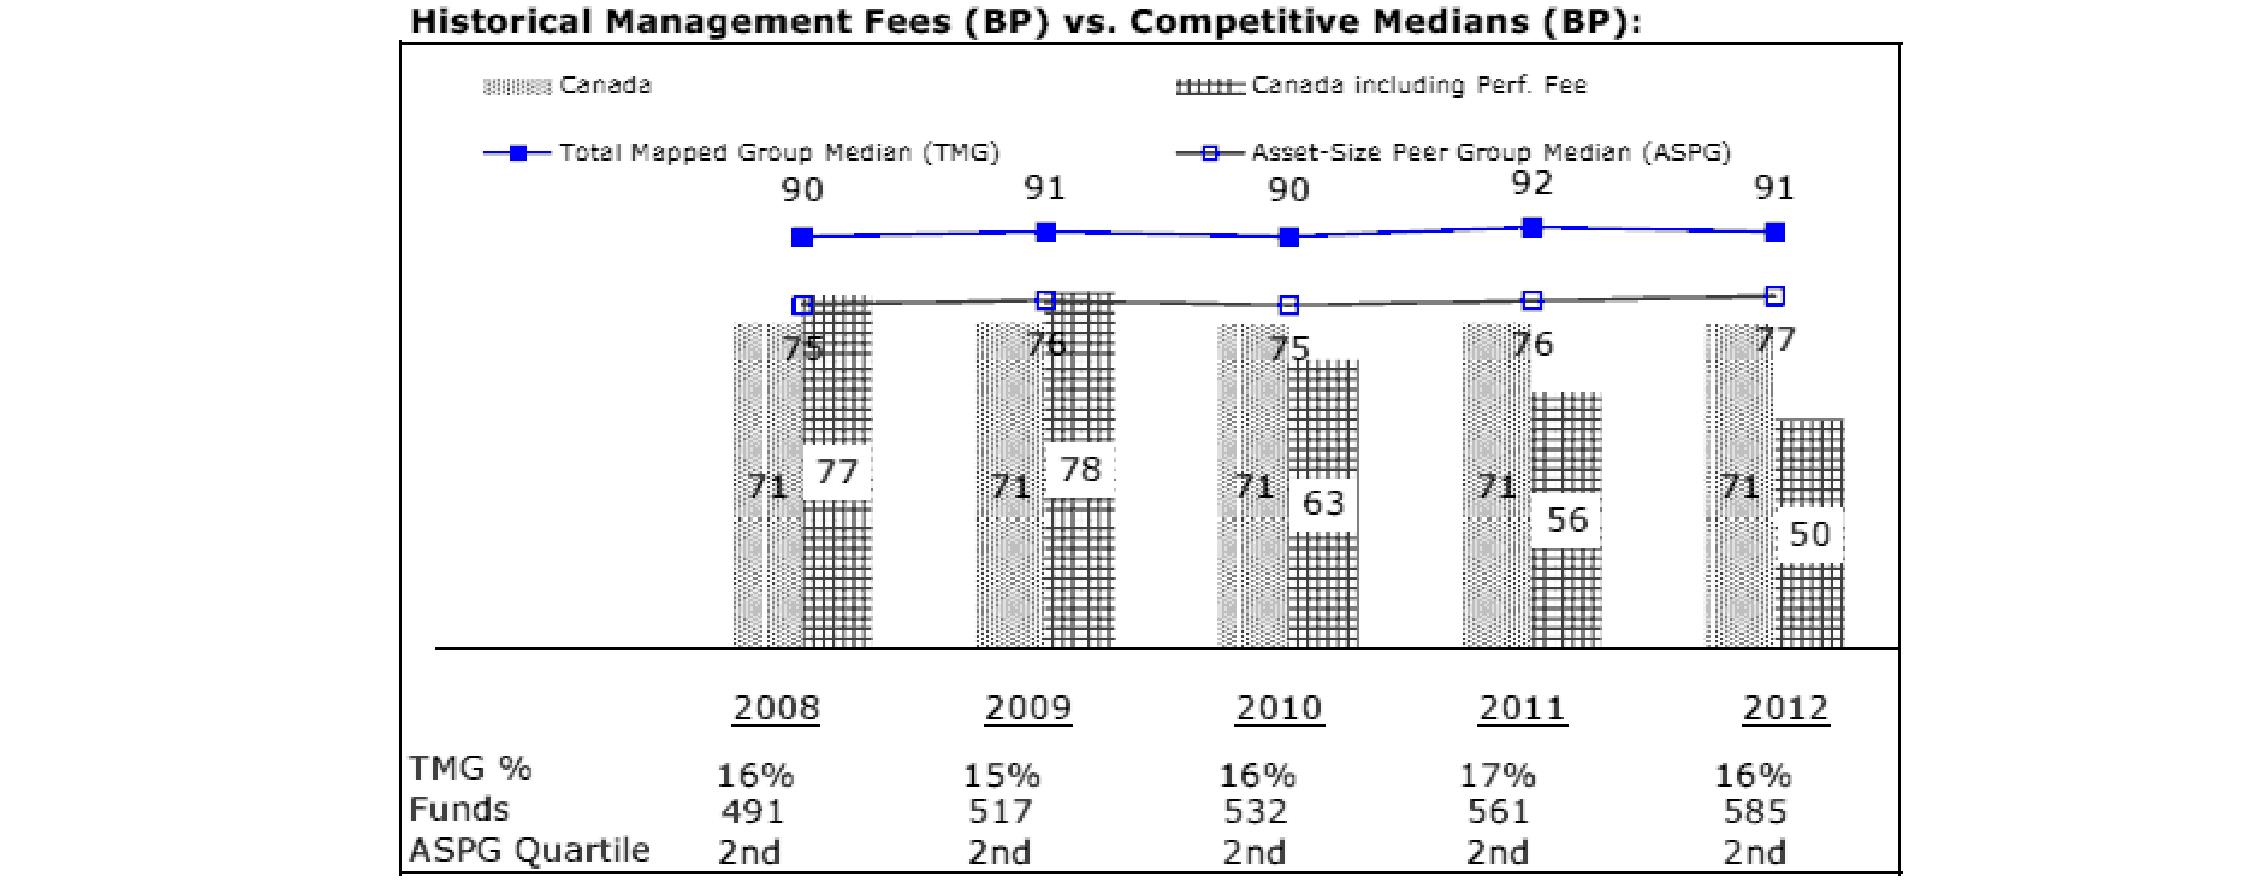
The Board noted that the fund's management fee ranked below the median of its Total Mapped Group and below the median of its ASPG for 2012. The Board also noted the effect of the fund's negative performance adjustment on the fund's management fee ranking.
Based on its review, the Board concluded that the fund's management fee is fair and reasonable in light of the services that the fund receives and the other factors considered.
Total Expense Ratio. In its review of each class's total expense ratio, the Board considered the fund's management fee as well as other fund or class expenses, as applicable, such as transfer agent fees, pricing and bookkeeping fees, fund-paid 12b-1 fees, and custodial, legal, and audit fees. The Board also noted the effects of any waivers and reimbursements on fees and expenses, as well as the impact of the fund's performance adjustment. As part of its review, the Board also considered the current and historical total expense ratios of each class of the fund compared to competitive fund median expenses. Each class of the fund is compared to those funds and classes in the Total Mapped Group (used by the Board for management fee comparisons) that have a similar sales load structure.
The Board noted that the total expense ratio of each class ranked below its competitive median for 2012.
Fees Charged to Other Fidelity Clients. The Board also considered Fidelity fee structures and other information with respect to clients of FMR and its affiliates, such as other mutual funds advised or subadvised by FMR or its affiliates, pension plan clients, and other institutional clients. The Board noted the findings of the 2013 ad hoc joint committee (created with the board of other Fidelity funds), which reviewed and compared Fidelity's institutional investment advisory business with its business of providing services to the Fidelity funds, including the differences in services provided, fees charged, and costs incurred, as well as competition in their respective marketplaces.
Based on its review of total expense ratios and fees charged to other Fidelity clients, the Board concluded that the total expense ratio of each class of the fund was reasonable in light of the services that the fund and its shareholders receive and the other factors considered.
Costs of the Services and Profitability. The Board considered the revenues earned and the expenses incurred by Fidelity in conducting the business of developing, marketing, distributing, managing, administering and servicing the fund and servicing the fund's shareholders. The Board also considered the level of Fidelity's profits in respect of all the Fidelity funds.
On an annual basis, FMR presents to the Board Fidelity's profitability for the fund. Fidelity calculates the profitability for each fund, as well as aggregate profitability for groups of Fidelity funds and all Fidelity funds, using a series of detailed revenue and cost allocation methodologies which originate with the books and records of Fidelity on which Fidelity's audited financial statements are based. The Audit Committee of the Board reviews any significant changes from the prior year's methodologies.
PricewaterhouseCoopers LLP (PwC), independent registered public accounting firm and auditor to Fidelity and certain Fidelity funds, has been engaged annually by the Board as part of the Board's assessment of Fidelity's profitability analysis. PwC's engagement includes the review and assessment of the methodologies used by Fidelity in determining the revenues and expenses attributable to Fidelity's mutual fund business, and completion of agreed-upon procedures surrounding the mathematical accuracy of fund profitability and its conformity to allocation methodologies. After considering PwC's reports issued under the engagement and information provided by Fidelity, the Board concluded that while other allocation methods may also be reasonable, Fidelity's profitability methodologies are reasonable in all material respects.
Annual Report
The Board also reviewed Fidelity's non-fund businesses and fall-out benefits related to the mutual fund business as well as cases where Fidelity's affiliates may benefit from or be related to the fund's business.
The Board considered the costs of the services provided by and the profits realized by Fidelity in connection with the operation of the fund and was satisfied that the profitability was not excessive in the circumstances.
Economies of Scale. The Board considered whether there have been economies of scale in respect of the management of the Fidelity funds, whether the Fidelity funds (including the fund) have appropriately benefited from any such economies of scale, and whether there is potential for realization of any further economies of scale. The Board considered the extent to which the fund will benefit from economies of scale through increased services to the fund, through waivers or reimbursements, or through fee or expense reductions. The Board also noted that in 2009, it and the board of other Fidelity funds created an ad hoc committee (the Economies of Scale Committee) to analyze whether FMR attains economies of scale in respect of the management and servicing of the Fidelity funds, whether the Fidelity funds have appropriately benefited from such economies of scale, and whether there is potential for realization of any further economies of scale.
The Board recognized that the fund's management contract incorporates a "group fee" structure, which provides for lower group fee rates as total fund assets under FMR's management increase, and for higher group fee rates as total fund assets under FMR's management decrease. FMR calculates the group fee rates based on a tiered asset "breakpoint" schedule that varies based on asset class. The Board considered that the group fee is designed to deliver the benefits of economies of scale to fund shareholders when total Fidelity fund assets increase, even if assets of any particular fund are unchanged or have declined, because some portion of Fidelity's costs are attributable to services provided to all Fidelity funds, and all funds benefit if those costs can be allocated among more assets. The Board concluded that, given the group fee structure, fund shareholders will benefit from lower management fees as assets under FMR's management increase at the fund complex level, regardless of whether Fidelity achieves any such economies of scale.
The Board concluded, taking into account the analysis of the Economies of Scale Committee, that economies of scale, if any, are being appropriately shared between fund shareholders and Fidelity.
Amendment to Description of Group Fee Rate. At its July 2013 meeting, the Board voted to approve an amendment to the fund's management contract to modify the description of the "group fee rate" effective August 1, 2013. The Board noted that under the prior description in the contract, the group fee rate was based on the average net assets of all registered investment companies with which FMR has management contracts. Under the contract's tiered asset breakpoint schedule, the group fee rate is lower as total fund assets under FMR's management increase, and higher as total fund assets under FMR's management decrease. The Board considered that the prior description would have excluded the assets of 64 Fidelity sector funds from the group fee rate calculation once Fidelity SelectCo, LLC, an affiliate of FMR, assumed management responsibilities for those funds. The Board noted that modifying the description of the group fee rate to continue to include the assets of those 64 funds for purposes of determining group fee rate breakpoints would avoid an immediate adverse impact on the group fee rate for any fund.
Additional Information Requested by the Board. In order to develop fully the factual basis for consideration of the Fidelity funds' Advisory Contracts, the Board requested and received additional information on certain topics, including: (i) fund performance trends and Fidelity's long-term strategies for certain funds; (ii) the potential to further rationalize the Fidelity fund lineup with the possibility of achieving savings for the funds and Fidelity; (iii) the methodology with respect to competitive fund data and peer group classifications; (iv) the arrangements with, and performance of, certain sub-advisers on behalf of the Fidelity funds, as well as certain proposed participating affiliate arrangements; (v) the realization of fall-out benefits in certain Fidelity business units; (vi) Fidelity's group fee structures, including the rationale for the individual fee rates of certain categories of funds and the definition of group assets; (vii) trends regarding industry use of performance fee structures and the performance adjustment methodologies applicable to the Fidelity funds; (viii) additional competitive analysis regarding the total expenses for certain classes; and (ix) fund profitability methodology, including Fidelity's cost allocation methodology, and the impact of certain factors on fund profitability results.
Based on its evaluation of all of the conclusions noted above, and after considering all factors it believed relevant, the Board ultimately concluded that the advisory fee structures are fair and reasonable, and that the fund's Advisory Contracts should be renewed.
Annual Report
Investment Adviser
Fidelity Management & Research Company
Boston, MA
Investment Sub-Advisers
FMR Co., Inc.
Fidelity Management & Research
(U.K.) Inc.
Fidelity Management & Research
(Hong Kong) Limited
Fidelity Management & Research
(Japan) Inc.
FIL Investment Advisors
FIL Investment Advisors
(UK) Limited
General Distributor
Fidelity Distributors Corporation
Smithfield, RI
Transfer and Service Agents
Fidelity Investments Institutional
Operations Company, Inc.
Boston, MA
Fidelity Service Company, Inc.
Boston, MA
Custodian
State Street Bank and Trust Company
Quincy, MA
(Fidelity Investment logo)(registered trademark)
Corporate Headquarters
245 Summer St., Boston, MA 02210
www.fidelity.com
ACAN-UANN-1213
1.843164.106
Fidelity Advisor®
Canada Fund -
Institutional Class
Annual Report
October 31, 2013
Institutional Class is a class of
Fidelity® Canada Fund
(Fidelity Cover Art)
Contents
Performance | (Click Here) | How the fund has done over time. |
Management's Discussion of Fund Performance | (Click Here) | The Portfolio Manager's review of fund performance and strategy. |
Shareholder Expense Example | (Click Here) | An example of shareholder expenses. |
Investment Changes | (Click Here) | A summary of major shifts in the fund's investments over the past six months. |
Investments | (Click Here) | A complete list of the fund's investments with their market values. |
Financial Statements | (Click Here) | Statements of assets and liabilities, operations, and changes in net assets, as well as financial highlights. |
Notes | (Click Here) | Notes to the financial statements. |
Report of Independent Registered Public Accounting Firm | (Click Here) | |
Trustees and Officers | (Click Here) | |
Distributions | (Click Here) | |
Board Approval of Investment Advisory Contracts and Management Fees | (Click Here) | |
To view a fund's proxy voting guidelines and proxy voting record for the 12-month period ended June 30, visit http://www.fidelity.com/proxyvotingresults or visit the Securities and Exchange Commission's (SEC) web site at http://www.sec.gov. You may also call 1-877-208-0098 to request a free copy of the proxy voting guidelines.
Standard & Poor's, S&P and S&P 500 are registered service marks of The McGraw-Hill Companies, Inc. and have been licensed for use by Fidelity Distributors Corporation.
Other third-party marks appearing herein are the property of their respective owners.
All other marks appearing herein are registered or unregistered trademarks or service marks of FMR LLC or an affiliated company. © 2013 FMR LLC. All rights reserved.
This report and the financial statements contained herein are submitted for the general information of the shareholders of the fund. This report is not authorized for distribution to prospective investors in the fund unless preceded or accompanied by an effective prospectus.
A fund files its complete schedule of portfolio holdings with the SEC for the first and third quarters of each fiscal year on Form N-Q. Forms N-Q are available on the SEC's web site at http://www.sec.gov. A fund's Forms N-Q may be reviewed and copied at the SEC's Public Reference Room in Washington, DC. Information regarding the operation of the SEC's Public Reference Room may be obtained by calling 1-800-SEC-0330. For a complete list of a fund's portfolio holdings, view the most recent holdings listing, semiannual report, or annual report on Fidelity's web site at http://www.fidelity.com, http://www.advisor.fidelity.com, or http://www.401k.com, as applicable.
NOT FDIC INSURED • MAY LOSE VALUE • NO BANK GUARANTEE
Neither the fund nor Fidelity Distributors Corporation is a bank.
Annual Report
Average annual total return reflects the change in the value of an investment, assuming reinvestment of the class' distributions from dividend income and capital gains (the profits earned upon the sale of securities that have grown in value, if any) and assuming a constant rate of performance each year. The $10,000 table and the fund's returns do not reflect the deduction of taxes that a shareholder would pay on fund distributions or the redemption of fund shares. During periods of reimbursement by Fidelity, a fund's total return will be greater than it would be had the reimbursement not occurred. How a fund did yesterday is no guarantee of how it will do tomorrow.
Average Annual Total Returns
Periods ended October 31, 2013 | Past 1
year | Past 5
years | Past 10
years |
Institutional ClassA | 8.34% | 9.81% | 10.39% |
A The initial offering of Institutional Class shares took place on May 2, 2007. Returns prior to May 2, 2007 are those of Fidelity® Canada Fund, the original class of the fund.
$10,000 Over 10 Years
Let's say hypothetically that $10,000 was invested in Fidelity Advisor® Canada Fund - Institutional Class on October 31, 2003. The chart shows how the value of your investment would have changed, and also shows how the S&P®/TSX Composite Index performed over the same period. See footnote A above for additional information regarding the performance of Institutional Class.
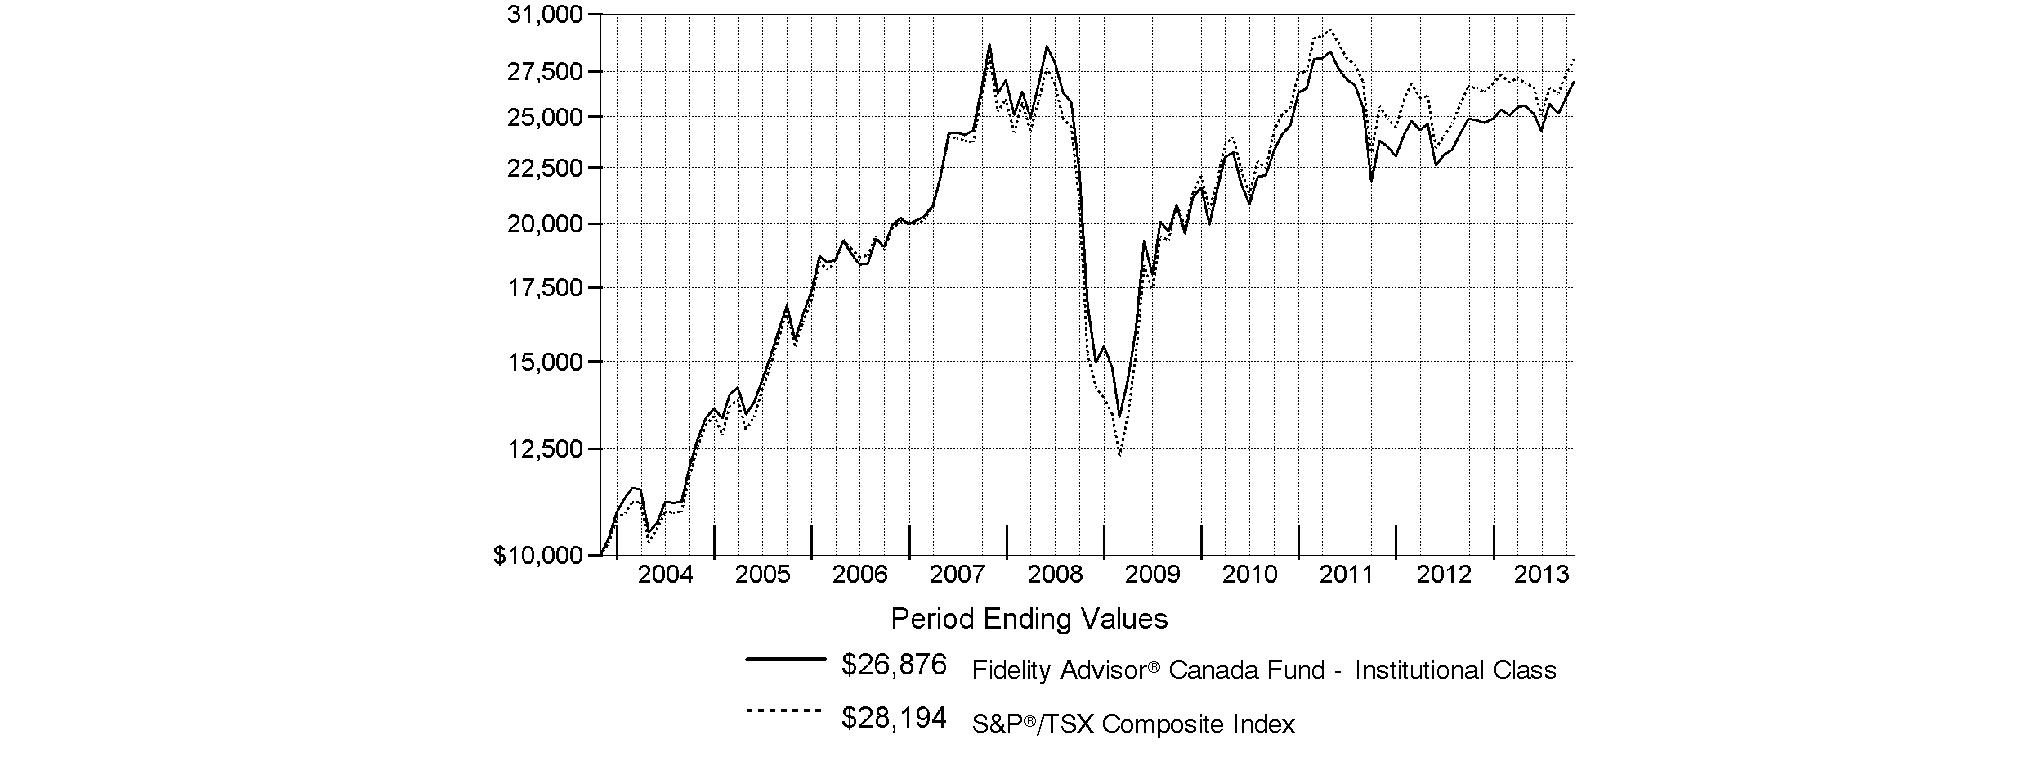
Annual Report
Market Recap: On balance, global equity markets remained upbeat for the 12-month period ending October 31, 2013. The MSCI® ACWI® (All Country World Index) Index gained 23.75% for the period, amid investor preference for higher-risk assets. The period was not without turbulence, however. In the spring and summer, central banks worldwide, especially in the U.S. and China, made clear their intentions to maintain accommodative monetary policies. That stance, combined with modest cyclical improvements around the globe and generally low valuations, underpinned the broad rally in equities. Europe (+32%) shone brightly, with most markets in the region - large and small - registering solid, index-beating gains. Another bright spot was Japan, which, despite a struggling yen and taking a second-half breather, posted a 34% result for the full year. The U.S. - by far the index's biggest constituent - also outperformed the global market with a roughly 28% advance. Meanwhile, Asia-Pacific ex Japan (+14%) lagged, hurt in part by a slowdown in Australia's mining industry as well as currency headwinds. Foreign-exchange and commodity weakness also curbed results in resource-heavy Canada and emerging markets (EM), both of which were up 7%. Country-level EM performance diverged meaningfully for the period, as evidenced by performance in Brazil (-1%), Russia (+12%), India (+1%) and China (+8%).
Comments from Douglas Lober, Portfolio Manager of Fidelity Advisor® Canada Fund: For the year, the fund's Institutional Class shares rose 8.34%, beating the 6.38% gain of the S&P/TSX Composite Index. The Canadian economy showed modest growth for the year, as investor concern about high housing prices and elevated levels of consumer debt weighed on the market, which helped to create significant variation in sector performance. Commodity prices directly impact about 40% of the companies represented within the S&P/TSX index, so they are a major market influencer. During the past 12 months, commodity prices fluctuated and varied widely, mostly based on differing global supply-and-demand factors. During the reporting period, the fund was well-positioned for this type of market, and my focus on quality, growth-oriented companies paid off, particularly in the consumer discretionary and health care sectors, as did an underweighting in cyclically driven resources stocks. At the stock level, Valeant Pharmaceuticals International was by far the fund's biggest contributor, as rising demand globally for the specialty pharma firm's products, combined with a series of earnings-positive acquisitions, helped its stock soar 90%. Despite trimming my stake here, Valeant still ended the period as the fund's largest overweighted holding. Another significant contributor was Magna International, an auto-parts manufacturer serving mainly North America and Europe, whose stock has soared on the heels of the resurging U.S. auto industry. I think Magna is a well-run company perfectly positioned for growth given its heavy exposure to the U.S., so I ramped up my stake considerably. It's a similar story with Gildan Activewear, a T-shirt and apparel maker that has been a direct beneficiary of the improving U.S. economy. On the down side, my decision to underweight life insurance companies weighed on performance, as stocks in this industry tend to do well when interest rates and stock markets rise. Despite the fund's beneficial underweighting in materials, a handful of gold positions hurt, most notably my decision to overweight Goldcorp. By period end, I had slashed exposure to gold and other materials stocks. Another decision that dampened performance was not owning global financial services and publishing company Thomson Reuters. I chose to avoid this index name due to weakness in the business outlook of its key financial services customers, but this strategy did not pan out as the stock gained 39%.
Notes to shareholders: Fidelity Advisor Canada Fund may invest up to 35% of its total assets in any industry that represents more than 20% of the Canadian market. As of October 31, 2013, more than 25% of the fund's total assets were invested in securities of companies in the diversified banks industry, which accounted for 22.45% of the Canadian market, as represented by the S&P/TSX Composite Index.
On January 1, 2014, Risteard Hogan will join Douglas Lober as a co-portfolio manager of the fund.
Annual Report
The views expressed above reflect those of the portfolio manager(s) only through the end of the period as stated on the cover of this report and do not necessarily represent the views of Fidelity or any other person in the Fidelity organization. Any such views are subject to change at any time based upon market or other conditions and Fidelity disclaims any responsibility to update such views. These views may not be relied on as investment advice and, because investment decisions for a Fidelity fund are based on numerous factors, may not be relied on as an indication of trading intent on behalf of any Fidelity fund.
Annual Report
Fidelity Canada Fund
As a shareholder of the Fund, you incur two types of costs: (1) transaction costs, including sales charges (loads) on purchase payments or redemption proceeds, redemption fees and (2) ongoing costs, including management fees, distribution and/or service (12b-1) fees and other Fund expenses. This Example is intended to help you understand your ongoing costs (in dollars) of investing in the Fund and to compare these costs with the ongoing costs of investing in other mutual funds.
The Example is based on an investment of $1,000 invested at the beginning of the period and held for the entire period (May 1, 2013 to October 31, 2013).
Actual Expenses
The first line of the accompanying table for each class of the Fund provides information about actual account values and actual expenses. You may use the information in this line, together with the amount you invested, to estimate the expenses that you paid over the period. Simply divide your account value by $1,000.00 (for example, an $8,600 account value divided by $1,000.00 = 8.6), then multiply the result by the number in the first line for a class of the Fund under the heading entitled "Expenses Paid During Period" to estimate the expenses you paid on your account during this period. A small balance maintenance fee of $12.00 that is charged once a year may apply for certain accounts with a value of less than $2,000. This fee is not included in the table below. If it was, the estimate of expenses you paid during the period would be higher, and your ending account value lower, by this amount. In addition, the Fund, as a shareholder in the underlying Fidelity Central Funds, will indirectly bear its pro-rata share of the fees and expenses incurred by the underlying Fidelity Central Funds. These fees and expenses are not included in the Fund's annualized expense ratio used to calculate the expense estimate in the table below.
Hypothetical Example for Comparison Purposes
The second line of the accompanying table for each class of the Fund provides information about hypothetical account values and hypothetical expenses based on a Class' actual expense ratio and an assumed rate of return of 5% per year before expenses, which is not the Class' actual return. The hypothetical account values and expenses may not be used to estimate the actual ending account balance or expenses you paid for the period. You may use this information to compare the ongoing costs of investing in the Fund and other funds. To do so, compare this 5% hypothetical example with the 5% hypothetical examples that appear in the shareholder reports of the other funds. A small balance maintenance fee of $12.00 that is charged once a year may apply for certain accounts with a value of less than $2,000. This fee is not included in the table below. If it was, the estimate of expenses you paid during the period would be higher, and your ending account value lower, by this amount. In addition, the Fund, as a shareholder in the underlying Fidelity Central Funds, will indirectly bear its pro-rata share of the fees and expenses incurred by the underlying Fidelity Central Funds. These fees and expenses are not included in the Fund's annualized expense ratio used to calculate the expense estimate in the table below.
Please note that the expenses shown in the table are meant to highlight your ongoing costs only and do not reflect any transaction costs. Therefore, the second line of the table is useful in comparing ongoing costs only, and will not help you determine the relative total costs of owning different funds. In addition, if these transactional costs were included, your costs would have been higher.
| Annualized
Expense Ratio B | Beginning
Account Value
May 1, 2013 | Ending
Account Value
October 31, 2013 | Expenses Paid
During Period*
May 1, 2013
to October 31, 2013 |
Class A | 1.22% | | | |
Actual | | $ 1,000.00 | $ 1,048.50 | $ 6.30 |
HypotheticalA | | $ 1,000.00 | $ 1,019.06 | $ 6.21 |
Class T | 1.50% | | | |
Actual | | $ 1,000.00 | $ 1,047.10 | $ 7.74 |
HypotheticalA | | $ 1,000.00 | $ 1,017.64 | $ 7.63 |
Class B | 1.99% | | | |
Actual | | $ 1,000.00 | $ 1,044.50 | $ 10.25 |
HypotheticalA | | $ 1,000.00 | $ 1,015.17 | $ 10.11 |
Class C | 1.95% | | | |
Actual | | $ 1,000.00 | $ 1,044.70 | $ 10.05 |
HypotheticalA | | $ 1,000.00 | $ 1,015.38 | $ 9.91 |
Canada | .90% | | | |
Actual | | $ 1,000.00 | $ 1,050.20 | $ 4.65 |
HypotheticalA | | $ 1,000.00 | $ 1,020.67 | $ 4.58 |
Institutional Class | .89% | | | |
Actual | | $ 1,000.00 | $ 1,050.20 | $ 4.60 |
HypotheticalA | | $ 1,000.00 | $ 1,020.72 | $ 4.53 |
A 5% return per year before expenses
B Annualized expense ratio reflects expenses net of applicable fee waivers.
* Expenses are equal to each Class' annualized expense ratio, multiplied by the average account value over the period, multiplied by 184/365 (to reflect the one-half year period).
Annual Report
Fidelity Canada Fund
Investment Changes (Unaudited)
Geographic Diversification (% of fund's net assets) |
As of October 31, 2013 |
| Canada | 92.8% | |
| United States of America* | 7.2% | |

|
* Includes Short-Term Investments and Net Other Assets (Liabilities). |
Percentages are based on country or territory of incorporation and are adjusted for the effect of futures contracts, if applicable. |
As of April 30, 2013 |
| Canada | 95.6% | |
| United States of America* | 4.4% | |

* Includes Short-Term Investments and Net Other Assets (Liabilities). |
Percentages are based on country or territory of incorporation and are adjusted for the effect of futures contracts, if applicable. |
Asset Allocation as of October 31, 2013 |
| % of fund's
net assets | % of fund's net assets
6 months ago |
Stocks | 99.0 | 98.3 |
Short-Term Investments and Net Other Assets (Liabilities) | 1.0 | 1.7 |
Top Ten Stocks as of October 31, 2013 |
| % of fund's
net assets | % of fund's net assets
6 months ago |
Royal Bank of Canada (Commercial Banks) | 7.8 | 6.2 |
The Toronto-Dominion Bank (Commercial Banks) | 7.4 | 5.8 |
Bank of Nova Scotia (Commercial Banks) | 4.9 | 5.1 |
Valeant Pharmaceuticals International, Inc. (Canada) (Pharmaceuticals) | 4.4 | 4.7 |
Suncor Energy, Inc. (Oil, Gas & Consumable Fuels) | 4.1 | 2.9 |
Manulife Financial Corp. (Insurance) | 4.0 | 1.9 |
Bank of Montreal (Commercial Banks) | 3.3 | 3.1 |
Canadian National Railway Co. (Road & Rail) | 3.3 | 3.0 |
Magna International, Inc. Class A (sub. vtg.) (Auto Components) | 2.6 | 1.6 |
Sun Life Financial, Inc. (Insurance) | 2.6 | 1.2 |
| 44.4 | |
Market Sectors as of October 31, 2013 |
| % of fund's
net assets | % of fund's net assets
6 months ago |
Financials | 36.2 | 32.8 |
Energy | 18.4 | 20.2 |
Consumer Discretionary | 9.6 | 8.1 |
Health Care | 7.0 | 9.0 |
Industrials | 6.2 | 4.7 |
Materials | 5.9 | 6.8 |
Consumer Staples | 5.9 | 5.6 |
Information Technology | 5.6 | 4.0 |
Telecommunication Services | 4.2 | 6.9 |
Utilities | 0.0 | 0.2 |
Annual Report
Fidelity Canada Fund
Investments October 31, 2013
Showing Percentage of Net Assets
Common Stocks - 99.0% |
| Shares | | Value |
CONSUMER DISCRETIONARY - 9.6% |
Auto Components - 2.6% |
Magna International, Inc. Class A (sub. vtg.) | 760,000 | | $ 64,370,211 |
Hotels, Restaurants & Leisure - 0.9% |
Starbucks Corp. | 200,000 | | 16,210,000 |
Tim Hortons, Inc. (Canada) | 110,300 | | 6,584,254 |
| | 22,794,254 |
Household Durables - 0.2% |
Brookfield Residential Properties, Inc. (a) | 200,000 | | 4,416,000 |
Media - 1.4% |
CBS Corp. Class B | 110,000 | | 6,505,400 |
Cineplex, Inc. | 350,000 | | 14,098,691 |
Corus Entertainment, Inc. Class B (non-vtg.) | 250,000 | | 5,826,500 |
Quebecor, Inc. Class B (sub. vtg.) | 300,000 | | 7,417,638 |
| | 33,848,229 |
Multiline Retail - 2.4% |
Canadian Tire Ltd. Class A (non-vtg.) | 180,000 | | 16,707,812 |
Dollarama, Inc. | 503,467 | | 43,275,032 |
Hudson's Bay Co. | 50,000 | | 949,024 |
| | 60,931,868 |
Textiles, Apparel & Luxury Goods - 2.1% |
Gildan Activewear, Inc. | 970,195 | | 46,767,372 |
lululemon athletica, Inc. (a)(d) | 77,600 | | 5,358,280 |
| | 52,125,652 |
TOTAL CONSUMER DISCRETIONARY | | 238,486,214 |
CONSUMER STAPLES - 5.9% |
Food & Staples Retailing - 5.7% |
Alimentation Couche-Tard, Inc. Class B (sub. vtg.) | 690,200 | | 46,748,117 |
CVS Caremark Corp. | 200,000 | | 12,452,000 |
Jean Coutu Group, Inc. Class A
(sub. vtg.) | 1,350,000 | | 23,862,754 |
Loblaw Companies Ltd. (d) | 550,000 | | 25,156,572 |
Metro, Inc. Class A (sub. vtg.) | 529,165 | | 33,105,484 |
| | 141,324,927 |
Food Products - 0.2% |
Saputo, Inc. | 100,000 | | 4,947,969 |
TOTAL CONSUMER STAPLES | | 146,272,896 |
ENERGY - 18.4% |
Energy Equipment & Services - 0.2% |
Calfrac Well Services Ltd. | 100,000 | | 3,117,058 |
Precision Drilling Corp. | 100,000 | | 1,057,881 |
Secure Energy Services, Inc. | 100,000 | | 1,418,501 |
| | 5,593,440 |
|
| Shares | | Value |
Oil, Gas & Consumable Fuels - 18.2% |
Anadarko Petroleum Corp. | 100,000 | | $ 9,529,000 |
ARC Resources Ltd. | 300,000 | | 7,964,322 |
Baytex Energy Corp. | 50,000 | | 2,086,990 |
Canadian Natural Resources Ltd. | 1,550,000 | | 49,191,483 |
Cenovus Energy, Inc. | 950,000 | | 28,227,114 |
Crescent Point Energy Corp. | 633,400 | | 24,597,292 |
Enbridge, Inc. | 1,387,800 | | 60,162,624 |
EQT Corp. | 80,000 | | 6,848,800 |
Imperial Oil Ltd. | 400,000 | | 17,467,031 |
Keyera Corp. | 152,302 | | 9,012,644 |
Painted Pony Petroleum Ltd. (a)(e) | 113,000 | | 742,387 |
Painted Pony Petroleum Ltd. (a) | 50,000 | | 328,490 |
Pembina Pipeline Corp. | 250,000 | | 8,202,657 |
Peyto Exploration & Development Corp. | 300,000 | | 9,040,426 |
Suncor Energy, Inc. | 2,807,600 | | 102,028,451 |
Talisman Energy, Inc. | 1,600,000 | | 19,949,168 |
Tourmaline Oil Corp. (a) | 400,000 | | 15,510,478 |
Tourmaline Oil Corp. (a)(e) | 80,000 | | 3,102,096 |
TransCanada Corp. | 1,160,000 | | 52,278,713 |
Trilogy Energy Corp. | 100,000 | | 2,933,870 |
Vermilion Energy, Inc. | 400,000 | | 21,986,285 |
Whitecap Resources, Inc. | 50,000 | | 580,732 |
| | 451,771,053 |
TOTAL ENERGY | | 457,364,493 |
FINANCIALS - 36.2% |
Capital Markets - 0.7% |
CI Financial Corp. | 500,000 | | 16,630,701 |
Commercial Banks - 25.3% |
Bank of Montreal (d) | 1,200,000 | | 83,579,341 |
Bank of Nova Scotia | 2,000,000 | | 121,594,015 |
Canadian Imperial Bank of Commerce | 404,600 | | 34,420,007 |
National Bank of Canada | 150,000 | | 13,016,832 |
Royal Bank of Canada | 2,880,000 | | 193,408,714 |
The Toronto-Dominion Bank | 2,003,800 | | 183,804,184 |
| | 629,823,093 |
Diversified Financial Services - 0.1% |
Element Financial Corp. (a) | 250,000 | | 3,191,387 |
Insurance - 7.5% |
Fairfax Financial Holdings Ltd. (sub. vtg.) | 10,000 | | 4,363,881 |
Industrial Alliance Insurance and Financial Services, Inc. | 100,000 | | 4,484,726 |
Intact Financial Corp. | 210,925 | | 13,155,376 |
Manulife Financial Corp. | 5,700,000 | | 100,972,522 |
Sun Life Financial, Inc. | 1,900,000 | | 63,998,465 |
| | 186,974,970 |
Real Estate Investment Trusts - 0.3% |
H&R REIT/H&R Finance Trust | 300,000 | | 6,214,933 |
Common Stocks - continued |
| Shares | | Value |
FINANCIALS - continued |
Real Estate Management & Development - 2.3% |
Brookfield Asset Management, Inc.
Class A | 1,450,000 | | $ 57,407,567 |
TOTAL FINANCIALS | | 900,242,651 |
HEALTH CARE - 7.0% |
Biotechnology - 1.0% |
Amgen, Inc. | 110,000 | | 12,760,000 |
Biogen Idec, Inc. (a) | 55,000 | | 13,430,450 |
| | 26,190,450 |
Health Care Providers & Services - 1.6% |
Catamaran Corp. (a) | 856,468 | | 40,184,544 |
Pharmaceuticals - 4.4% |
Valeant Pharmaceuticals International, Inc. (Canada) (a) | 1,031,471 | | 108,969,003 |
TOTAL HEALTH CARE | | 175,343,997 |
INDUSTRIALS - 6.2% |
Aerospace & Defense - 0.1% |
MacDonald Dettwiler & Associates Ltd. | 50,000 | | 3,814,799 |
Airlines - 0.4% |
Air Canada Class A (a) | 1,600,000 | | 8,823,670 |
Professional Services - 0.6% |
Stantec, Inc. | 245,400 | | 14,583,018 |
Road & Rail - 5.1% |
Canadian National Railway Co. | 750,000 | | 82,398,216 |
Canadian Pacific Railway Ltd. | 320,000 | | 45,741,908 |
| | 128,140,124 |
TOTAL INDUSTRIALS | | 155,361,611 |
INFORMATION TECHNOLOGY - 5.6% |
Computers & Peripherals - 0.2% |
3D Systems Corp. (a)(d) | 50,000 | | 3,112,000 |
NCR Corp. (a) | 80,000 | | 2,924,000 |
| | 6,036,000 |
Internet Software & Services - 0.5% |
Yahoo!, Inc. (a) | 340,000 | | 11,196,200 |
IT Services - 2.9% |
Alliance Data Systems Corp. (a)(d) | 70,000 | | 16,594,200 |
CGI Group, Inc. Class A (sub. vtg.) (a) | 1,290,000 | | 43,278,377 |
Visa, Inc. Class A | 60,000 | | 11,800,200 |
| | 71,672,777 |
Software - 2.0% |
Concur Technologies, Inc. (a) | 55,000 | | 5,753,000 |
Constellation Software, Inc. | 85,000 | | 15,484,487 |
Open Text Corp. | 140,407 | | 10,317,925 |
salesforce.com, Inc. (a) | 100,000 | | 5,336,000 |
|
| Shares | | Value |
ServiceNow, Inc. (a) | 51,800 | | $ 2,828,798 |
Splunk, Inc. (a) | 160,000 | | 10,033,600 |
| | 49,753,810 |
TOTAL INFORMATION TECHNOLOGY | | 138,658,787 |
MATERIALS - 5.9% |
Chemicals - 1.4% |
Methanex Corp. | 600,000 | | 34,797,871 |
Metals & Mining - 4.2% |
Agnico Eagle Mines Ltd. (Canada) | 450,000 | | 13,362,106 |
Alamos Gold, Inc. | 94,200 | | 1,500,659 |
First Quantum Minerals Ltd. | 800,000 | | 15,176,713 |
Franco-Nevada Corp. | 400,000 | | 17,996,451 |
Goldcorp, Inc. | 1,600,000 | | 40,757,685 |
Osisko Mining Corp. (a) | 1,000,000 | | 4,881,792 |
Silver Wheaton Corp. | 450,000 | | 10,211,480 |
| | 103,886,886 |
Paper & Forest Products - 0.3% |
West Fraser Timber Co. Ltd. | 90,000 | | 8,249,461 |
TOTAL MATERIALS | | 146,934,218 |
TELECOMMUNICATION SERVICES - 4.2% |
Diversified Telecommunication Services - 3.1% |
BCE, Inc. | 1,050,000 | | 45,689,829 |
TELUS Corp. | 300,000 | | 10,479,068 |
TELUS Corp. (a) | 600,000 | | 20,958,136 |
| | 77,127,033 |
Wireless Telecommunication Services - 1.1% |
Rogers Communications, Inc. Class B (non-vtg.) | 600,000 | | 27,230,614 |
TOTAL TELECOMMUNICATION SERVICES | | 104,357,647 |
TOTAL COMMON STOCKS (Cost $1,865,701,378) |
2,463,022,514
|
Money Market Funds - 4.7% |
| Shares | | Value |
Fidelity Cash Central Fund, 0.09% (b) | 15,752,624 | | $ 15,752,624 |
Fidelity Securities Lending Cash Central Fund, 0.09% (b)(c) | 101,723,524 | | 101,723,524 |
TOTAL MONEY MARKET FUNDS (Cost $117,476,148) |
117,476,148
|
TOTAL INVESTMENT PORTFOLIO - 103.7% (Cost $1,983,177,526) | | 2,580,498,662 |
NET OTHER ASSETS (LIABILITIES) - (3.7)% | | (93,098,467) |
NET ASSETS - 100% | $ 2,487,400,195 |
Legend |
(a) Non-income producing |
(b) Affiliated fund that is generally available only to investment companies and other accounts managed by Fidelity Investments. The rate quoted is the annualized seven-day yield of the fund at period end. A complete unaudited listing of the fund's holdings as of its most recent quarter end is available upon request. In addition, each Fidelity Central Fund's financial statements, which are not covered by the Fund's Report of Independent Registered Public Accounting Firm, are available on the SEC's website or upon request. |
(c) Investment made with cash collateral received from securities on loan. |
(d) Security or a portion of the security is on loan at period end. |
(e) Security exempt from registration under Rule 144A of the Securities Act of 1933. These securities may be resold in transactions exempt from registration, normally to qualified institutional buyers. At the end of the period, the value of these securities amounted to $3,844,483 or 0.2% of net assets. |
Affiliated Central Funds |
Information regarding fiscal year to date income earned by the Fund from investments in Fidelity Central Funds is as follows: |
Fund | Income earned |
Fidelity Cash Central Fund | $ 46,028 |
Fidelity Securities Lending Cash Central Fund | 3,181,563 |
Total | $ 3,227,591 |
Other Information |
All investments are categorized as Level 1 under the Fair Value Hierarchy. The inputs or methodology used for valuing securities may not be an indication of the risk associated with investing in those securities. For more information on valuation inputs, please refer to the Investment Valuation section in the accompanying Notes to Financial Statements. |
See accompanying notes which are an integral part of the financial statements.
Annual Report
Fidelity Canada Fund
Statement of Assets and Liabilities
| October 31, 2013 |
| | |
Assets | | |
Investment in securities, at value (including securities loaned of $97,192,158) - See accompanying schedule: Unaffiliated issuers (cost $1,865,701,378) | $ 2,463,022,514 | |
Fidelity Central Funds (cost $117,476,148) | 117,476,148 | |
Total Investments (cost $1,983,177,526) | | $ 2,580,498,662 |
Foreign currency held at value (cost $1,939,718) | | 1,939,718 |
Receivable for investments sold | | 38,529,311 |
Receivable for fund shares sold | | 584,145 |
Dividends receivable | | 3,162,138 |
Distributions receivable from Fidelity Central Funds | | 81,917 |
Prepaid expenses | | 6,233 |
Other receivables | | 5,347 |
Total assets | | 2,624,807,471 |
| | |
Liabilities | | |
Payable for investments purchased | $ 29,649,665 | |
Payable for fund shares redeemed | 3,967,056 | |
Accrued management fee | 1,381,333 | |
Distribution and service plan fees payable | 79,324 | |
Other affiliated payables | 538,757 | |
Other payables and accrued expenses | 67,617 | |
Collateral on securities loaned, at value | 101,723,524 | |
Total liabilities | | 137,407,276 |
| | |
Net Assets | | $ 2,487,400,195 |
Net Assets consist of: | | |
Paid in capital | | $ 1,894,267,605 |
Undistributed net investment income | | 5,441,243 |
Accumulated undistributed net realized gain (loss) on investments and foreign currency transactions | | (9,574,612) |
Net unrealized appreciation (depreciation) on investments and assets and liabilities in foreign currencies | | 597,265,959 |
Net Assets | | $ 2,487,400,195 |
Statement of Assets and Liabilities - continued
| October 31, 2013 |
| | |
Calculation of Maximum Offering Price Class A:
Net Asset Value and redemption price per share ($116,661,029 ÷ 2,035,534 shares) | | $ 57.31 |
| | |
Maximum offering price per share (100/94.25 of $57.31) | | $ 60.81 |
Class T:
Net Asset Value and redemption price per share ($23,751,280 ÷ 415,641 shares) | | $ 57.14 |
| | |
Maximum offering price per share (100/96.50 of $57.14) | | $ 59.21 |
Class B:
Net Asset Value and offering price per share ($7,737,243 ÷ 136,881 shares)A | | $ 56.53 |
| | |
Class C:
Net Asset Value and offering price per share ($46,039,529 ÷ 818,175 shares)A | | $ 56.27 |
| | |
Canada:
Net Asset Value, offering price and redemption price per share ($2,262,379,924 ÷ 39,194,450 shares) | | $ 57.72 |
| | |
Institutional Class:
Net Asset Value, offering price and redemption price per share ($30,831,190 ÷ 535,504 shares) | | $ 57.57 |
A Redemption price per share is equal to net asset value less any applicable contingent deferred sales charge.
See accompanying notes which are an integral part of the financial statements.
Annual Report
Fidelity Canada Fund
Financial Statements - continued
Statement of Operations
| Year ended October 31, 2013 |
Investment Income | | |
Dividends | | $ 71,353,255 |
Interest | | 812 |
Income from Fidelity Central Funds | | 3,227,591 |
Income before foreign taxes withheld | | 74,581,658 |
Less foreign taxes withheld | | (10,623,849) |
Total income | | 63,957,809 |
| | |
Expenses | | |
Management fee | | |
Basic fee | $ 19,761,399 | |
Performance adjustment | (2,880,828) | |
Transfer agent fees | 6,184,860 | |
Distribution and service plan fees | 1,097,829 | |
Accounting and security lending fees | 1,239,678 | |
Custodian fees and expenses | 41,774 | |
Independent trustees' compensation | 16,894 | |
Registration fees | 93,431 | |
Audit | 72,278 | |
Legal | 8,642 | |
Interest | 2,828 | |
Miscellaneous | 29,203 | |
Total expenses before reductions | 25,667,988 | |
Expense reductions | (289,539) | 25,378,449 |
Net investment income (loss) | | 38,579,360 |
Realized and Unrealized Gain (Loss) Net realized gain (loss) on: | | |
Investment securities: | | |
Unaffiliated issuers | 315,114,345 | |
Foreign currency transactions | (317,572) | |
Total net realized gain (loss) | | 314,796,773 |
Change in net unrealized appreciation (depreciation) on: Investment securities | (148,439,060) | |
Assets and liabilities in foreign currencies | (35,528) | |
Total change in net unrealized appreciation (depreciation) | | (148,474,588) |
Net gain (loss) | | 166,322,185 |
Net increase (decrease) in net assets resulting from operations | | $ 204,901,545 |
Statement of Changes in Net Assets
| Year ended
October 31,
2013 | Year ended
October 31,
2012 |
Increase (Decrease) in Net Assets | | |
Operations | | |
Net investment income (loss) | $ 38,579,360 | $ 50,353,505 |
Net realized gain (loss) | 314,796,773 | (18,070,675) |
Change in net unrealized appreciation (depreciation) | (148,474,588) | 100,576,015 |
Net increase (decrease) in net assets resulting from operations | 204,901,545 | 132,858,845 |
Distributions to shareholders from net investment income | (43,693,415) | (36,731,380) |
Distributions to shareholders from net realized gain | - | (22,566,448) |
Total distributions | (43,693,415) | (59,297,828) |
Share transactions - net increase (decrease) | (991,330,828) | (952,875,100) |
Redemption fees | 153,637 | 257,398 |
Total increase (decrease) in net assets | (829,969,061) | (879,056,685) |
Net Assets | | |
Beginning of period | 3,317,369,256 | 4,196,425,941 |
End of period (including undistributed net investment income of $5,441,243 and undistributed net investment income of $34,776,724, respectively) | $ 2,487,400,195 | $ 3,317,369,256 |
See accompanying notes which are an integral part of the financial statements.
Annual Report
Financial Highlights - Class A
Years ended October 31, | 2013 | 2012 | 2011 | 2010 | 2009 |
Selected Per-Share Data | | | | | |
Net asset value, beginning of period | $ 53.65 | $ 52.20 | $ 53.81 | $ 44.24 | $ 38.20 |
Income from Investment Operations | | | | | |
Net investment income (loss) C | .60 | .57 | .34 | .31 | .38 |
Net realized and unrealized gain (loss) | 3.63 | 1.50 | (1.17) | 9.64 | 5.72 |
Total from investment operations | 4.23 | 2.07 | (.83) | 9.95 | 6.10 |
Distributions from net investment income | (.57) | (.33) | (.35) | (.39) | (.07) |
Distributions from net realized gain | - | (.29) | (.44) | - | - |
Total distributions | (.57) | (.62) | (.79) | (.39) | (.07) |
Redemption fees added to paid in capital C | - G | - G | .01 | .01 | .01 |
Net asset value, end of period | $ 57.31 | $ 53.65 | $ 52.20 | $ 53.81 | $ 44.24 |
Total Return A,B | 7.98% | 4.04% | (1.64)% | 22.62% | 16.08% |
Ratios to Average Net Assets D,F | | | | | |
Expenses before reductions | 1.19% | 1.08% | 1.12% | 1.24% | 1.42% |
Expenses net of fee waivers, if any | 1.19% | 1.08% | 1.12% | 1.24% | 1.42% |
Expenses net of all reductions | 1.18% | 1.08% | 1.12% | 1.18% | 1.39% |
Net investment income (loss) | 1.11% | 1.11% | .59% | .63% | .98% |
Supplemental Data | | | | | |
Net assets, end of period (000 omitted) | $ 116,661 | $ 159,597 | $ 215,369 | $ 170,446 | $ 83,015 |
Portfolio turnover rate E | 64% | 86% | 104% | 143% | 123% |
A Total returns would have been lower if certain expenses had not been reduced during the applicable periods shown. B Total returns do not include the effect of the sales charges. C Calculated based on average shares outstanding during the period. D Fees and expenses of any underlying Fidelity Central Funds are not included in the Fund's expense ratio. The Fund indirectly bears its proportionate share of the expenses of any underlying Fidelity Central Funds. E Amount does not include the portfolio activity of any underlying Fidelity Central Funds. F Expense ratios reflect operating expenses of the class. Expenses before reductions do not reflect amounts reimbursed by the investment adviser or reductions from brokerage service arrangements or reductions from other expense offset arrangements and do not represent the amount paid by the class during periods when reimbursements or reductions occur. Expenses net of fee waivers reflect expenses after reimbursement by the investment adviser but prior to reductions from brokerage service arrangements or other expense offset arrangements. Expenses net of all reductions represent the net expenses paid by the class. G Amount represents less than $.01 per share. |
Financial Highlights - Class T
Years ended October 31, | 2013 | 2012 | 2011 | 2010 | 2009 |
Selected Per-Share Data | | | | | |
Net asset value, beginning of period | $ 53.48 | $ 52.01 | $ 53.64 | $ 44.11 | $ 38.10 |
Income from Investment Operations | | | | | |
Net investment income (loss) C | .45 | .43 | .17 | .18 | .27 |
Net realized and unrealized gain (loss) | 3.63 | 1.49 | (1.16) | 9.60 | 5.73 |
Total from investment operations | 4.08 | 1.92 | (.99) | 9.78 | 6.00 |
Distributions from net investment income | (.42) | (.16) | (.21) | (.26) | - |
Distributions from net realized gain | - | (.29) | (.44) | - | - |
Total distributions | (.42) | (.45) | (.65) | (.26) | - |
Redemption fees added to paid in capital C | - G | - G | .01 | .01 | .01 |
Net asset value, end of period | $ 57.14 | $ 53.48 | $ 52.01 | $ 53.64 | $ 44.11 |
Total Return A,B | 7.69% | 3.74% | (1.93)% | 22.27% | 15.77% |
Ratios to Average Net Assets D,F | | | | | |
Expenses before reductions | 1.47% | 1.36% | 1.42% | 1.51% | 1.70% |
Expenses net of fee waivers, if any | 1.47% | 1.36% | 1.42% | 1.51% | 1.70% |
Expenses net of all reductions | 1.46% | 1.36% | 1.42% | 1.46% | 1.67% |
Net investment income (loss) | .83% | .83% | .30% | .36% | .71% |
Supplemental Data | | | | | |
Net assets, end of period (000 omitted) | $ 23,751 | $ 29,626 | $ 34,323 | $ 31,522 | $ 17,727 |
Portfolio turnover rate E | 64% | 86% | 104% | 143% | 123% |
A Total returns would have been lower if certain expenses had not been reduced during the applicable periods shown. B Total returns do not include the effect of the sales charges. C Calculated based on average shares outstanding during the period. D Fees and expenses of any underlying Fidelity Central Funds are not included in the Fund's expense ratio. The Fund indirectly bears its proportionate share of the expenses of any underlying Fidelity Central Funds. E Amount does not include the portfolio activity of any underlying Fidelity Central Funds. F Expense ratios reflect operating expenses of the class. Expenses before reductions do not reflect amounts reimbursed by the investment adviser or reductions from brokerage service arrangements or reductions from other expense offset arrangements and do not represent the amount paid by the class during periods when reimbursements or reductions occur. Expenses net of fee waivers reflect expenses after reimbursement by the investment adviser but prior to reductions from brokerage service arrangements or other expense offset arrangements. Expenses net of all reductions represent the net expenses paid by the class. G Amount represents less than $.01 per share. |
See accompanying notes which are an integral part of the financial statements.
Annual Report
Financial Highlights - Class B
Years ended October 31, | 2013 | 2012 | 2011 | 2010 | 2009 |
Selected Per-Share Data | | | | | |
Net asset value, beginning of period | $ 52.89 | $ 51.37 | $ 53.03 | $ 43.68 | $ 37.91 |
Income from Investment Operations | | | | | |
Net investment income (loss) C | .18 | .17 | (.11) | (.07) | .08 |
Net realized and unrealized gain (loss) | 3.60 | 1.49 | (1.14) | 9.50 | 5.68 |
Total from investment operations | 3.78 | 1.66 | (1.25) | 9.43 | 5.76 |
Distributions from net investment income | (.14) | - | (.01) | (.09) | - |
Distributions from net realized gain | - | (.14) | (.41) | - | - |
Total distributions | (.14) | (.14) | (.42) | (.09) | - |
Redemption fees added to paid in capital C | - G | - G | .01 | .01 | .01 |
Net asset value, end of period | $ 56.53 | $ 52.89 | $ 51.37 | $ 53.03 | $ 43.68 |
Total Return A,B | 7.17% | 3.25% | (2.41)% | 21.64% | 15.22% |
Ratios to Average Net Assets D,F | | | | | |
Expenses before reductions | 1.96% | 1.85% | 1.91% | 2.01% | 2.19% |
Expenses net of fee waivers, if any | 1.96% | 1.85% | 1.91% | 2.01% | 2.19% |
Expenses net of all reductions | 1.95% | 1.85% | 1.91% | 1.96% | 2.16% |
Net investment income (loss) | .34% | .34% | (.20)% | (.14)% | .21% |
Supplemental Data | | | | | |
Net assets, end of period (000 omitted) | $ 7,737 | $ 9,804 | $ 11,866 | $ 13,464 | $ 7,283 |
Portfolio turnover rate E | 64% | 86% | 104% | 143% | 123% |
A Total returns would have been lower if certain expenses had not been reduced during the applicable periods shown. B Total returns do not include the effect of the contingent deferred sales charge. C Calculated based on average shares outstanding during the period. D Fees and expenses of any underlying Fidelity Central Funds are not included in the Fund's expense ratio. The Fund indirectly bears its proportionate share of the expenses of any underlying Fidelity Central Funds. E Amount does not include the portfolio activity of any underlying Fidelity Central Funds. F Expense ratios reflect operating expenses of the class. Expenses before reductions do not reflect amounts reimbursed by the investment adviser or reductions from brokerage service arrangements or reductions from other expense offset arrangements and do not represent the amount paid by the class during periods when reimbursements or reductions occur. Expenses net of fee waivers reflect expenses after reimbursement by the investment adviser but prior to reductions from brokerage service arrangements or other expense offset arrangements. Expenses net of all reductions represent the net expenses paid by the class. G Amount represents less than $.01 per share. |
Financial Highlights - Class C
Years ended October 31, | 2013 | 2012 | 2011 | 2010 | 2009 |
Selected Per-Share Data | | | | | |
Net asset value, beginning of period | $ 52.61 | $ 51.19 | $ 52.87 | $ 43.60 | $ 37.84 |
Income from Investment Operations | | | | | |
Net investment income (loss) C | .20 | .19 | (.08) | (.06) | .09 |
Net realized and unrealized gain (loss) | 3.58 | 1.46 | (1.14) | 9.48 | 5.66 |
Total from investment operations | 3.78 | 1.65 | (1.22) | 9.42 | 5.75 |
Distributions from net investment income | (.12) | - | (.03) | (.16) | - |
Distributions from net realized gain | - | (.23) | (.44) | - | - |
Total distributions | (.12) | (.23) | (.47) | (.16) | - |
Redemption fees added to paid in capital C | - G | - G | .01 | .01 | .01 |
Net asset value, end of period | $ 56.27 | $ 52.61 | $ 51.19 | $ 52.87 | $ 43.60 |
Total Return A,B | 7.21% | 3.26% | (2.36)% | 21.68% | 15.22% |
Ratios to Average Net Assets D,F | | | | | |
Expenses before reductions | 1.93% | 1.82% | 1.86% | 1.99% | 2.18% |
Expenses net of fee waivers, if any | 1.92% | 1.82% | 1.86% | 1.99% | 2.18% |
Expenses net of all reductions | 1.92% | 1.82% | 1.86% | 1.94% | 2.15% |
Net investment income (loss) | .37% | .37% | (.15)% | (.12)% | .22% |
Supplemental Data | | | | | |
Net assets, end of period (000 omitted) | $ 46,040 | $ 66,500 | $ 87,990 | $ 54,052 | $ 24,848 |
Portfolio turnover rate E | 64% | 86% | 104% | 143% | 123% |
A Total returns would have been lower if certain expenses had not been reduced during the applicable periods shown. B Total returns do not include the effect of the contingent deferred sales charge. C Calculated based on average shares outstanding during the period. D Fees and expenses of any underlying Fidelity Central Funds are not included in the Fund's expense ratio. The Fund indirectly bears its proportionate share of the expenses of any underlying Fidelity Central Funds. E Amount does not include the portfolio activity of any underlying Fidelity Central Funds. F Expense ratios reflect operating expenses of the class. Expenses before reductions do not reflect amounts reimbursed by the investment adviser or reductions from brokerage service arrangements or reductions from other expense offset arrangements and do not represent the amount paid by the class during periods when reimbursements or reductions occur. Expenses net of fee waivers reflect expenses after reimbursement by the investment adviser but prior to reductions from brokerage service arrangements or other expense offset arrangements. Expenses net of all reductions represent the net expenses paid by the class. G Amount represents less than $.01 per share. |
See accompanying notes which are an integral part of the financial statements.
Annual Report
Financial Highlights - Canada
Years ended October 31, | 2013 | 2012 | 2011 | 2010 | 2009 |
Selected Per-Share Data | | | | | |
Net asset value, beginning of period | $ 54.05 | $ 52.59 | $ 54.14 | $ 44.46 | $ 38.37 |
Income from Investment Operations | | | | | |
Net investment income (loss) B | .77 | .73 | .52 | .46 | .48 |
Net realized and unrealized gain (loss) | 3.66 | 1.51 | (1.18) | 9.68 | 5.74 |
Total from investment operations | 4.43 | 2.24 | (.66) | 10.14 | 6.22 |
Distributions from net investment income | (.76) | (.49) | (.46) | (.47) | (.14) |
Distributions from net realized gain | - | (.29) | (.44) | - | - |
Total distributions | (.76) | (.78) | (.90) | (.47) | (.14) |
Redemption fees added to paid in capital B | - F | - F | .01 | .01 | .01 |
Net asset value, end of period | $ 57.72 | $ 54.05 | $ 52.59 | $ 54.14 | $ 44.46 |
Total Return A | 8.32% | 4.36% | (1.33)% | 22.97% | 16.40% |
Ratios to Average Net Assets C,E | | | | | |
Expenses before reductions | .87% | .77% | .82% | .94% | 1.17% |
Expenses net of fee waivers, if any | .87% | .77% | .82% | .94% | 1.17% |
Expenses net of all reductions | .86% | .77% | .82% | .89% | 1.13% |
Net investment income (loss) | 1.42% | 1.42% | .90% | .93% | 1.24% |
Supplemental Data | | | | | |
Net assets, end of period (000 omitted) | $ 2,262,380 | $ 2,992,597 | $ 3,778,765 | $ 3,953,693 | $ 3,149,791 |
Portfolio turnover rate D | 64% | 86% | 104% | 143% | 123% |
A Total returns would have been lower if certain expenses had not been reduced during the applicable periods shown. B Calculated based on average shares outstanding during the period. C Fees and expenses of any underlying Fidelity Central Funds are not included in the Fund's expense ratio. The Fund indirectly bears its proportionate share of the expenses of any underlying Fidelity Central Funds. D Amount does not include the portfolio activity of any underlying Fidelity Central Funds. EExpense ratios reflect operating expenses of the class. Expenses before reductions do not reflect amounts reimbursed by the investment adviser or reductions from brokerage service arrangements or reductions from other expense offset arrangements and do not represent the amount paid by the class during periods when reimbursements or reductions occur. Expenses net of fee waivers reflect expenses after reimbursement by the investment adviser but prior to reductions from brokerage service arrangements or other expense offset arrangements. Expenses net of all reductions represent the net expenses paid by the class. F Amount represents less than $.01 per share. |
Financial Highlights - Institutional Class
Years ended October 31, | 2013 | 2012 | 2011 | 2010 | 2009 |
Selected Per-Share Data | | | | | |
Net asset value, beginning of period | $ 53.91 | $ 52.44 | $ 54.02 | $ 44.39 | $ 38.31 |
Income from Investment Operations | | | | | |
Net investment income (loss) B | .78 | .74 | .51 | .46 | .49 |
Net realized and unrealized gain (loss) | 3.64 | 1.50 | (1.18) | 9.65 | 5.72 |
Total from investment operations | 4.42 | 2.24 | (.67) | 10.11 | 6.21 |
Distributions from net investment income | (.76) | (.48) | (.48) | (.49) | (.14) |
Distributions from net realized gain | - | (.29) | (.44) | - | - |
Total distributions | (.76) | (.77) | (.92) | (.49) | (.14) |
Redemption fees added to paid in capital B | - F | - F | .01 | .01 | .01 |
Net asset value, end of period | $ 57.57 | $ 53.91 | $ 52.44 | $ 54.02 | $ 44.39 |
Total Return A | 8.34% | 4.38% | (1.35)% | 22.94% | 16.40% |
Ratios to Average Net Assets C,E | | | | | |
Expenses before reductions | .86% | .76% | .82% | .95% | 1.17% |
Expenses net of fee waivers, if any | .86% | .76% | .82% | .95% | 1.17% |
Expenses net of all reductions | .85% | .76% | .82% | .90% | 1.14% |
Net investment income (loss) | 1.43% | 1.42% | .89% | .92% | 1.23% |
Supplemental Data | | | | | |
Net assets, end of period (000 omitted) | $ 30,831 | $ 59,245 | $ 68,112 | $ 46,737 | $ 17,956 |
Portfolio turnover rate D | 64% | 86% | 104% | 143% | 123% |
A Total returns would have been lower if certain expenses had not been reduced during the applicable periods shown. B Calculated based on average shares outstanding during the period. C Fees and expenses of any underlying Fidelity Central Funds are not included in the Fund's expense ratio. The Fund indirectly bears its proportionate share of the expenses of any underlying Fidelity Central Funds. D Amount does not include the portfolio activity of any underlying Fidelity Central Funds. E Expense ratios reflect operating expenses of the class. Expenses before reductions do not reflect amounts reimbursed by the investment adviser or reductions from brokerage service arrangements or reductions from other expense offset arrangements and do not represent the amount paid by the class during periods when reimbursements or reductions occur. Expenses net of fee waivers reflect expenses after reimbursement by the investment adviser but prior to reductions from brokerage service arrangements or other expense offset arrangements. Expenses net of all reductions represent the net expenses paid by the class. F Amount represents less than $.01 per share. |
See accompanying notes which are an integral part of the financial statements.
Annual Report
Notes to Financial Statements
For the period ended October 31, 2013
1. Organization.
Fidelity Canada Fund (the Fund) is a fund of Fidelity Investment Trust (the Trust) and is authorized to issue an unlimited number of shares. The Trust is registered under the Investment Company Act of 1940, as amended (the 1940 Act), as an open-end management investment company organized as a Massachusetts business trust. The Fund offers Class A, Class T, Class C, Canada and Institutional Class shares, each of which, along with Class B shares, has equal rights as to assets and voting privileges. Class B shares are closed to new accounts and additional purchases, except for exchanges and reinvestments. Each class has exclusive voting rights with respect to matters that affect that class. Class B shares will automatically convert to Class A shares after a holding period of seven years from the initial date of purchase.
2. Investments in Fidelity Central Funds.
The Fund invests in Fidelity Central Funds, which are open-end investment companies generally available only to other investment companies and accounts managed by Fidelity Management & Research Company (FMR) and its affiliates. The Fund's Schedule of Investments lists each of the Fidelity Central Funds held as of period end, if any, as an investment of the Fund, but does not include the underlying holdings of each Fidelity Central Fund. As an Investing Fund, the Fund indirectly bears its proportionate share of the expenses of the underlying Fidelity Central Funds.
The Money Market Central Funds seek preservation of capital and current income and are managed by Fidelity Investments Money Management, Inc. (FIMM), an affiliate of FMR.
A complete unaudited list of holdings for each Fidelity Central Fund is available upon request or at the Securities and Exchange Commission (the SEC) website at www.sec.gov. In addition, the financial statements of the Fidelity Central Funds, which are not covered by the Fund's Report of Independent Registered Public Accounting Firm, are available on the SEC website or upon request.
3. Significant Accounting Policies.
The financial statements have been prepared in conformity with accounting principles generally accepted in the United States of America (GAAP), which require management to make certain estimates and assumptions at the date of the financial statements. Actual results could differ from those estimates. Subsequent events, if any, through the date that the financial statements were issued have been evaluated in the preparation of the financial statements. The following summarizes the significant accounting policies of the Fund:
Investment Valuation. Investments are valued as of 4:00 p.m. Eastern time on the last calendar day of the period. In accordance with valuation policies and procedures approved by the Board of Trustees (the Board), the Fund attempts to obtain prices from one or more third party pricing vendors or brokers to value its investments. When current market prices, quotations or currency exchange rates are not readily available or reliable, investments will be fair valued in good faith by the FMR Fair Value Committee (the Committee), in accordance with procedures adopted by the Board. Factors used in determining fair value vary by investment type and may include market or investment specific events. The frequency with which these procedures are used cannot be predicted and they may be utilized to a significant extent. The Committee oversees the Fund's valuation policies and procedures and is responsible for approving and reporting to the Board all fair value determinations.
The Fund categorizes the inputs to valuation techniques used to value its investments into a disclosure hierarchy consisting of three levels as shown below:
Level 1 - quoted prices in active markets for identical investments
Level 2 - other significant observable inputs (including quoted prices for similar investments, interest rates, prepayment speeds, etc.)
Level 3 - unobservable inputs (including the Fund's own assumptions based on the best information available)
Valuation techniques used to value the Fund's investments by major category are as follows:
Equity securities, including restricted securities, for which market quotations are readily available, are valued at the last reported sale price or official closing price as reported by a third party pricing vendor on the primary market or exchange on which they are traded and are categorized as Level 1 in the hierarchy. In the event there were no sales during the day or closing prices are not available, securities are valued at the last quoted bid price or may be valued using the last available price and are generally categorized as Level 2 in the hierarchy. For foreign equity securities, when market or security specific events arise, comparisons to the valuation of American Depositary Receipts (ADRs), futures contracts, Exchange-Traded Funds (ETFs) and certain indexes as well as quoted prices for similar securities may be used and would be categorized as Level 2 in the hierarchy. Utilizing these techniques may result in transfers between Level 1 and Level 2. For equity securities, including restricted securities, where observable inputs are limited, assumptions about market activity and risk are used and these securities may be categorized as Level 3 in the hierarchy.
Investments in open-end mutual funds, including the Fidelity Central Funds, are valued at their closing net asset value (NAV) each business day and are categorized as Level 1 in the hierarchy.
Annual Report
Notes to Financial Statements - continued
3. Significant Accounting Policies - continued
Investment Valuation - continued
Changes in valuation techniques may result in transfers in or out of an assigned level within the disclosure hierarchy.
Foreign Currency. The Fund may use foreign currency contracts to facilitate transactions in foreign-denominated securities. Gains and losses from these transactions may arise from changes in the value of the foreign currency or if the counterparties do not perform under the contracts' terms.
Foreign-denominated assets, including investment securities, and liabilities are translated into U.S. dollars at the exchange rates at period end. Purchases and sales of investment securities, income and dividends received and expenses denominated in foreign currencies are translated into U.S. dollars at the exchange rate in effect on the transaction date.
The effects of exchange rate fluctuations on investments are included with the net realized and unrealized gain (loss) on investment securities. Other foreign currency transactions resulting in realized and unrealized gain (loss) are disclosed separately.
Investment Transactions and Income. For financial reporting purposes, the Fund's investment holdings and NAV include trades executed through the end of the last business day of the period. The NAV per share for processing shareholder transactions is calculated as of the close of business of the New York Stock Exchange (NYSE), normally 4:00 p.m. Eastern time and includes trades executed through the end of the prior business day. Gains and losses on securities sold are determined on the basis of identified cost and may include proceeds received from litigation. Dividend income is recorded on the ex-dividend date, except for certain dividends from foreign securities where the ex-dividend date may have passed, which are recorded as soon as the Fund is informed of the ex-dividend date. Non-cash dividends included in dividend income, if any, are recorded at the fair market value of the securities received. Distributions received on securities that represent a return of capital or capital gain are recorded as a reduction of cost of investments and/or as a realized gain. Subsequent to ex-dividend date the Fund determines the components of these distributions, based upon receipt of tax filings or other correspondence relating to the underlying investment. Interest income and distributions from the Fidelity Central Funds are accrued as earned. Interest income includes coupon interest and amortization of premium and accretion of discount on debt securities. Investment income is recorded net of foreign taxes withheld where recovery of such taxes is uncertain.
Class Allocations and Expenses. Investment income, realized and unrealized capital gains and losses, common expenses of the Fund, and certain fund-level expense reductions, if any, are allocated daily on a pro-rata basis to each class based on the relative net assets of each class to the total net assets of the Fund. Each class differs with respect to transfer agent and distribution and service plan fees incurred. Certain expense reductions may also differ by class. For the reporting period, the allocated portion of income and expenses to each class as a percent of its average net assets may vary due to the timing of recording these transactions in relation to fluctuating net assets of the classes. Expenses directly attributable to a fund are charged to that fund. Expenses attributable to more than one fund are allocated among the respective funds on the basis of relative net assets or other appropriate methods. Expense estimates are accrued in the period to which they relate and adjustments are made when actual amounts are known.
Income Tax Information and Distributions to Shareholders. Each year, the Fund intends to qualify as a regulated investment company under Subchapter M of the Internal Revenue Code, including distributing substantially all of its taxable income and realized gains. As a result, no provision for U.S. Federal income taxes is required. As of October 31, 2013, the Fund did not have any unrecognized tax benefits in the financial statements; nor is the each Fund aware of any tax positions for which it is reasonably possible that the total amounts of unrecognized tax benefits will significantly change in the next twelve months. The Fund files a U.S. federal tax return, in addition to state and local tax returns as required. The Fund's federal income tax returns are subject to examination by the Internal Revenue Service (IRS) for a period of three fiscal years after they are filed. State and local tax returns may be subject to examination for an additional fiscal year depending on the jurisdiction. Foreign taxes are provided for based on the Fund's understanding of the tax rules and rates that exist in the foreign markets in which it invests.
Distributions are declared and recorded on the ex-dividend date. Income dividends and capital gain distributions are declared separately for each class. Income and capital gain distributions are determined in accordance with income tax regulations, which may differ from GAAP. In addition, the fund claimed a portion of the payment made to redeeming shareholders as a distribution for income tax purposes.
Capital accounts within the financial statements are adjusted for permanent book-tax differences. These adjustments have no impact on net assets or the results of operations. Temporary book-tax differences will reverse in a subsequent period.
Book-tax differences are primarily due to foreign currency transactions, passive foreign investment companies (PFIC), deferred trustees compensation, capital loss carryforwards and losses deferred due to wash sales.
The federal tax cost of investment securities and unrealized appreciation (depreciation) as of period end were as follows:
Gross unrealized appreciation | $ 622,734,162 |
Gross unrealized depreciation | (48,641,784) |
Net unrealized appreciation (depreciation) on securities and other investments | $ 574,092,378 |
| |
Tax Cost | $ 2,006,406,284 |
Annual Report
3. Significant Accounting Policies - continued
Income Tax Information and Distributions to Shareholders - continued
The tax-based components of distributable earnings as of period end were as follows:
Undistributed ordinary income | $ 5,441,496 |
Undistributed long-term capital gain | $ 13,654,145 |
Net unrealized appreciation (depreciation) | $ 574,037,201 |
The tax character of distributions paid was as follows:
| October 31, 2013 | October 31, 2012 |
Ordinary Income | $ 43,693,415 | $ 59,297,828 |
Short-Term Trading (Redemption) Fees. Shares held by investors in the Fund less than 90 days may have been subject to a redemption fee equal to 1.50% of the net asset value of shares redeemed. All redemption fees, which reduce the proceeds of the shareholder redemption, are retained by the Fund and accounted for as an addition to paid in capital.
Restricted Securities. The Fund may invest in securities that are subject to legal or contractual restrictions on resale. These securities generally may be resold in transactions exempt from registration or to the public if the securities are registered. Disposal of these securities may involve time-consuming negotiations and expense, and prompt sale at an acceptable price may be difficult. Information regarding restricted securities is included at the end of the Fund's Schedule of Investments.
4. Purchases and Sales of Investments.
Purchases and sales of securities, other than short-term securities, aggregated $1,782,914,089 and $2,781,691,453, respectively.
5. Fees and Other Transactions with Affiliates.
Management Fee. FMR and its affiliates provide the Fund with investment management related services for which the Fund pays a monthly management fee. The management fee is the sum of an individual fund fee rate that is based on an annual rate of .45% of the Fund's average net assets and an annualized group fee rate that averaged .25% during the period. The group fee rate is based upon the average net assets of all the mutual funds advised by FMR, including any mutual funds previously advised by FMR that are currently advised by Fidelity SelectCo, LLC, an affiliate of FMR. The group fee rate decreases as assets under management increase and increases as assets under management decrease. In addition, the management fee is subject to a performance adjustment (up to a maximum of ± .20% of the Fund's average net assets over a 36 month performance period). The upward or downward adjustment to the management fee is based on the relative investment performance of Canada as compared to an appropriate benchmark index over the same 36 month performance period. For the reporting period, the total annual management fee rate, including the performance adjustment, was .60% of the Fund's average net assets. The performance adjustment included in the management fee rate may be higher or lower than the maximum performance adjustment rate due to the difference between the average net assets for the reporting and performance periods.
Distribution and Service Plan Fees. In accordance with Rule 12b-1 of the 1940 Act, the Fund has adopted separate Distribution and Service Plans for each class of shares. Certain classes pay Fidelity Distributors Corporation (FDC), an affiliate of FMR, separate Distribution and Service Fees, each of which is based on an annual percentage of each class' average net assets. In addition, FDC may pay financial intermediaries for selling shares of the Fund and providing shareholder support services. For the period, the Distribution and Service Fee rates, total fees and amounts retained by FDC were as follows:
| Distribution
Fee | Service
Fee | Total Fees | Retained
by FDC |
Class A | -% | .25% | $ 337,330 | $ 15,373 |
Class T | .25% | .25% | 129,706 | 3,129 |
Class B | .75% | .25% | 86,940 | 65,318 |
Class C | .75% | .25% | 543,853 | 40,074 |
| | | $ 1,097,829 | $ 123,894 |
Sales Load. FDC may receive a front-end sales charge of up to 5.75% for selling Class A shares and 3.50% for selling Class T shares, some of which is paid to financial intermediaries for selling shares of the Fund. Depending on the holding period, FDC may receive contingent deferred sales charges levied on Class A, Class T, Class B, and Class C redemptions. The deferred sales charges range from 5.00% to 1.00% for Class B shares, 1.00% for Class C shares, 1.00% for certain purchases of Class A shares and .25% for certain purchases of Class T shares.
Annual Report
Notes to Financial Statements - continued
5. Fees and Other Transactions with Affiliates - continued
Sales Load - continued
For the period, sales charge amounts retained by FDC were as follows:
| Retained
by FDC |
Class A | $ 34,481 |
Class T | 5,392 |
Class B* | 16,573 |
Class C* | 4,351 |
| $ 60,797 |
* When Class B and Class C shares are initially sold, FDC pays commissions from its own resources to financial intermediaries through which the sales are made.
Transfer Agent Fees. Fidelity Investments Institutional Operations Company, Inc., (FIIOC), an affiliate of FMR, is the transfer, dividend disbursing and shareholder servicing agent for each class of the Fund. FIIOC receives account fees and asset-based fees that vary according to the account size and type of account of the shareholders of the respective classes of the Fund. FIIOC pays for typesetting, printing and mailing of shareholder reports, except proxy statements.
For the period, transfer agent fees for each class were as follows:
| Amount | % of
Average
Net Assets |
Class A | $ 380,027 | .28 |
Class T | 80,050 | .31 |
Class B | 26,068 | .30 |
Class C | 144,052 | .27 |
Canada | 5,469,174 | .22 |
Institutional Class | 85,489 | .21 |
| $ 6,184,860 | |
Accounting and Security Lending Fees. Fidelity Service Company, Inc. (FSC), an affiliate of FMR, maintains the Fund's accounting records. The accounting fee is based on the level of average net assets for each month. Under a separate contract, FSC administers the security lending program. The security lending fee is based on the number and duration of lending transactions.
Brokerage Commissions. The Fund placed a portion of its portfolio transactions with brokerage firms which are affiliates of the investment adviser. Brokerage commissions are included in net realized gain (loss) and change in net unrealized appreciation (depreciation) in the Statement of Operations. The commissions paid to these affiliated firms were $7,827 for the period.
Interfund Lending Program. Pursuant to an Exemptive Order issued by the SEC, the Fund, along with other registered investment companies having management contracts with FMR, may participate in an interfund lending program. This program provides an alternative credit facility allowing the funds to borrow from, or lend money to, other participating affiliated funds. At period end, there were no interfund loans outstanding. The Fund's activity in this program during the period for which loans were outstanding was as follows:
Borrower or Lender | Average Loan
Balance | Weighted Average Interest Rate | Interest
Expense |
Borrower | $ 8,609,545 | .33% | $ 1,724 |
6. Committed Line of Credit.
The Fund participates with other funds managed by FMR or an affiliate in a $4.25 billion credit facility (the "line of credit") to be utilized for temporary or emergency purposes to fund shareholder redemptions or for other short-term liquidity purposes. The Fund has agreed to pay commitment fees on its pro-rata portion of the line of credit, which amounted to $6,428 and is reflected in Miscellaneous expenses on the Statement of Operations. During the period, there were no borrowings on this line of credit.
Annual Report
7. Security Lending.
The Fund lends portfolio securities through a lending agent from time to time in order to earn additional income. For equity securities, a lending agent is used and may loan securities to certain qualified borrowers, including Fidelity Capital Markets (FCM), a broker-dealer affiliated with the Fund. On the settlement date of the loan, the Fund receives collateral (in the form of U.S. Treasury obligations, letters of credit and/or cash) against the loaned securities and maintains collateral in an amount not less than 100% of the market value of the loaned securities during the period of the loan. The market value of the loaned securities is determined at the close of business of the Fund and any additional required collateral is delivered to the Fund on the next business day. If the borrower defaults on its obligation to return the securities loaned because of insolvency or other reasons, the Fund may apply collateral received from the borrower against the obligation. The Fund may experience delays and costs in recovering the securities loaned. Any cash collateral received is invested in the Fidelity Securities Lending Cash Central Fund. The value of loaned securities and cash collateral at period end are disclosed on the Fund's Statement of Assets and Liabilities. At period end, there were no security loans outstanding with FCM. Security lending income represents the income earned on investing cash collateral, less rebates paid to borrowers and any lending agent fees associated with the loan, plus any premium payments received for lending certain types of securities. Security lending income is presented in the Statement of Operations as a component of income from Fidelity Central Funds. Total security lending income during the period amounted to $3,181,563, including $135,823 from securities loaned to FCM.
8. Bank Borrowings.
The Fund is permitted to have bank borrowings for temporary or emergency purposes to fund shareholder redemptions or for other short-term liquidity requirements. The Fund has established borrowing arrangements with certain banks. The interest rate on the borrowings is the bank's base rate, as revised from time to time. The average loan balance during the period for which loans were outstanding amounted to $12,098,400. The weighted average interest rate was .66%. The interest expense amounted to $1,104 under the bank borrowing program. At period end, there were no bank borrowings outstanding.
9. Expense Reductions.
Commissions paid to certain brokers with whom FMR, or its affiliates, places trades on behalf of the Fund include an amount in addition to trade execution, which may be rebated back to the Fund to offset certain expenses. This amount totaled $248,571 for the period.
In addition, FMR reimbursed a portion of the Fund's operating expenses during the period in the amount of $40,968.
10. Distributions to Shareholders.
Distributions to shareholders of each class were as follows:
Years ended October 31, | 2013 | 2012 |
From net investment income | | |
Class A | $ 1,637,055 | $ 1,331,457 |
Class T | 220,579 | 100,888 |
Class B | 25,159 | - |
Class C | 146,334 | - |
Canada | 40,860,360 | 34,710,753 |
Institutional Class | 803,928 | 588,282 |
Total | $ 43,693,415 | $ 36,731,380 |
From net realized gain | | |
Class A | $ - | $ 1,169,578 |
Class T | - | 185,711 |
Class B | - | 32,050 |
Class C | - | 395,818 |
Canada | - | 20,430,566 |
Institutional Class | - | 352,725 |
Total | $ - | $ 22,566,448 |
Annual Report
Notes to Financial Statements - continued
11. Share Transactions.
Transactions for each class of shares were as follows:
| Shares | Dollars |
Years ended October 31, | 2013 | 2012 | 2013 | 2012 |
Class A | | | | |
Shares sold | 215,503 | 554,403 | $ 11,581,739 | $ 28,690,109 |
Reinvestment of distributions | 24,773 | 41,955 | 1,299,341 | 2,109,494 |
Shares redeemed | (1,179,795) | (1,747,243) | (63,487,281) | (89,985,257) |
Net increase (decrease) | (939,519) | (1,150,885) | $ (50,606,201) | $ (59,185,654) |
Class T | | | | |
Shares sold | 36,303 | 72,156 | $ 1,947,020 | $ 3,681,114 |
Reinvestment of distributions | 4,099 | 5,569 | 214,911 | 279,919 |
Shares redeemed | (178,697) | (183,751) | (9,595,838) | (9,407,140) |
Net increase (decrease) | (138,295) | (106,026) | $ (7,433,907) | $ (5,446,107) |
Class B | | | | |
Shares sold | 567 | 3,584 | $ 30,467 | $ 181,692 |
Reinvestment of distributions | 400 | 519 | 20,851 | 25,894 |
Shares redeemed | (49,457) | (49,710) | (2,648,974) | (2,528,127) |
Net increase (decrease) | (48,490) | (45,607) | $ (2,597,656) | $ (2,320,541) |
Class C | | | | |
Shares sold | 62,908 | 161,752 | $ 3,346,028 | $ 8,188,420 |
Reinvestment of distributions | 2,201 | 6,045 | 114,122 | 300,150 |
Shares redeemed | (510,875) | (622,861) | (27,051,390) | (31,505,606) |
Net increase (decrease) | (445,766) | (455,064) | $ (23,591,240) | $ (23,017,036) |
Canada | | | | |
Shares sold | 2,375,531 | 4,866,802 | $ 128,818,784 | $ 252,453,035 |
Reinvestment of distributions | 737,701 | 1,003,141 | 38,862,091 | 50,678,709 |
Shares redeemed | (19,289,279) | (22,354,268) | (1,044,400,607) | (1,155,960,861) |
Net increase (decrease) | (16,176,047) | (16,484,325) | $ (876,719,732) | $ (852,829,117) |
Institutional Class | | | | |
Shares sold | 144,801 | 561,510 | $ 7,839,112 | $ 29,055,185 |
Reinvestment of distributions | 11,985 | 13,162 | 629,694 | 663,252 |
Shares redeemed | (720,255) | (774,433) | (38,850,898) | (39,795,082) |
Net increase (decrease) | (563,469) | (199,761) | $ (30,382,092) | $ (10,076,645) |
12. Other.
The Fund's organizational documents provide former and current trustees and officers with a limited indemnification against liabilities arising in connection with the performance of their duties to the Fund. In the normal course of business, the Fund may also enter into contracts that provide general indemnifications. The Fund's maximum exposure under these arrangements is unknown as this would be dependent on future claims that may be made against the Fund. The risk of material loss from such claims is considered remote.
Annual Report
Report of Independent Registered Public Accounting Firm
To the Trustees of Fidelity Investment Trust and the Shareholders of Fidelity Canada Fund:
In our opinion, the accompanying statement of assets and liabilities, including the schedule of investments, and the related statements of operations and of changes in net assets and the financial highlights present fairly, in all material respects, the financial position of Fidelity Canada Fund (a fund of Fidelity Investment Trust) at October 31, 2013, the results of its operations for the year then ended, the changes in its net assets for each of the two years in the period then ended and the financial highlights for each of the five years in the period then ended, in conformity with accounting principles generally accepted in the United States of America. These financial statements and financial highlights (hereafter referred to as "financial statements") are the responsibility of the Fidelity Canada Fund's management. Our responsibility is to express an opinion on these financial statements based on our audits. We conducted our audits of these financial statements in accordance with the standards of the Public Company Accounting Oversight Board (United States). Those standards require that we plan and perform the audit to obtain reasonable assurance about whether the financial statements are free of material misstatement. An audit includes examining, on a test basis, evidence supporting the amounts and disclosures in the financial statements, assessing the accounting principles used and significant estimates made by management, and evaluating the overall financial statement presentation. We believe that our audits, which included confirmation of securities at October 31, 2013 by correspondence with the custodian and brokers, provide a reasonable basis for our opinion.
PricewaterhouseCoopers LLP
Boston, Massachusetts
December 16, 2013
Annual Report
The Trustees, Member of the Advisory Board, and executive officers of the trust and fund, as applicable, are listed below. The Board of Trustees governs the fund and is responsible for protecting the interests of shareholders. The Trustees are experienced executives who meet periodically throughout the year to oversee the fund's activities, review contractual arrangements with companies that provide services to the fund, oversee management of the risks associated with such activities and contractual arrangements, and review the fund's performance. Except for James C. Curvey, Ned C. Lautenbach, Ronald P. O'Hanley, and William S. Stavropoulos, each of the Trustees oversees 171 funds. Mr. Curvey oversees 394 funds. Mr. Lautenbach, Mr. O'Hanley, and Mr. Stavropoulos each oversees 245 funds.
The Trustees hold office without limit in time except that (a) any Trustee may resign; (b) any Trustee may be removed by written instrument, signed by at least two-thirds of the number of Trustees prior to such removal; (c) any Trustee who requests to be retired or who has become incapacitated by illness or injury may be retired by written instrument signed by a majority of the other Trustees; and (d) any Trustee may be removed at any special meeting of shareholders by a two-thirds vote of the outstanding voting securities of the trust. Each Trustee who is not an interested person of the trust and the fund (as defined in the 1940 Act) (Independent Trustee), shall retire not later than the last day of the calendar year in which his or her 75th birthday occurs. The Independent Trustees may waive this mandatory retirement age policy with respect to individual Trustees. The executive officers and Advisory Board Member hold office without limit in time, except that any officer and Advisory Board Member may resign or may be removed by a vote of a majority of the Trustees at any regular meeting or any special meeting of the Trustees. Except as indicated, each individual has held the office shown or other offices in the same company for the past five years.
Experience, Skills, Attributes, and Qualifications of the Fund's Trustees. The Governance and Nominating Committee has adopted a statement of policy that describes the experience, qualifications, attributes, and skills that are necessary and desirable for potential Independent Trustee candidates (Statement of Policy). The Board believes that each Trustee satisfied at the time he or she was initially elected or appointed a Trustee, and continues to satisfy, the standards contemplated by the Statement of Policy. The Governance and Nominating Committee also engages professional search firms to help identify potential Independent Trustee candidates who have the experience, qualifications, attributes, and skills consistent with the Statement of Policy. From time to time, additional criteria based on the composition and skills of the current Independent Trustees, as well as experience or skills that may be appropriate in light of future changes to board composition, business conditions, and regulatory or other developments, have also been considered by the professional search firms and the Governance and Nominating Committee. In addition, the Board takes into account the Trustees' commitment and participation in Board and committee meetings, as well as their leadership of standing and ad hoc committees throughout their tenure.
In determining that a particular Trustee was and continues to be qualified to serve as a Trustee, the Board has considered a variety of criteria, none of which, in isolation, was controlling. The Board believes that, collectively, the Trustees have balanced and diverse experience, qualifications, attributes, and skills, which allow the Board to operate effectively in governing the fund and protecting the interests of shareholders. Information about the specific experience, skills, attributes, and qualifications of each Trustee, which in each case led to the Board's conclusion that the Trustee should serve (or continue to serve) as a trustee of the fund, is provided below.
Board Structure and Oversight Function. James C. Curvey is an interested person (as defined in the 1940 Act) and currently serves as Chairman. The Trustees have determined that an interested Chairman is appropriate and benefits shareholders because an interested Chairman has a personal and professional stake in the quality and continuity of services provided to the fund. Independent Trustees exercise their informed business judgment to appoint an individual of their choosing to serve as Chairman, regardless of whether the Trustee happens to be independent or a member of management. The Independent Trustees have determined that they can act independently and effectively without having an Independent Trustee serve as Chairman and that a key structural component for assuring that they are in a position to do so is for the Independent Trustees to constitute a substantial majority for the Board. The Independent Trustees also regularly meet in executive session. Ned C. Lautenbach serves as Chairman of the Independent Trustees and as such (i) acts as a liaison between the Independent Trustees and management with respect to matters important to the Independent Trustees and (ii) with management prepares agendas for Board meetings.
Fidelity funds are overseen by different Boards of Trustees. The fund's Board oversees Fidelity's equity and high income funds and another Board oversees Fidelity's investment-grade bond, money market, and asset allocation funds. The asset allocation funds may invest in Fidelity funds overseen by the fund's Board. The use of separate Boards, each with its own committee structure, allows the Trustees of each group of Fidelity funds to focus on the unique issues of the funds they oversee, including common research, investment, and operational issues. On occasion, the separate Boards establish joint committees to address issues of overlapping consequences for the Fidelity funds overseen by each Board.
The Trustees operate using a system of committees to facilitate the timely and efficient consideration of all matters of importance to the Trustees, the fund, and fund shareholders and to facilitate compliance with legal and regulatory requirements and oversight of the fund's activities and associated risks. The Board, acting through its committees, has charged FMR and its affiliates with (i) identifying events or circumstances the occurrence of which could have demonstrably adverse effects on the fund's business and/or reputation; (ii) implementing processes and controls to lessen the possibility that such events or circumstances occur or to mitigate the effects of such events or circumstances if they do occur; and (iii) creating and maintaining a system designed to evaluate continuously business and market conditions in order to facilitate the identification and implementation processes described in (i) and (ii) above. Because the day-to-day operations and activities of the fund are carried out by or through FMR, its affiliates and other service providers, the fund's exposure to risks is mitigated but not eliminated by the processes overseen by the Trustees. While each of the Board's committees has responsibility for overseeing different aspects of the fund's activities, oversight is exercised primarily through the Operations, Audit, and Compliance Committees. In addition, the Independent Trustees have worked with FMR to enhance the Board's oversight of investment and financial risks, legal and regulatory risks, technology risks, and operational risks, including the development of additional risk reporting to the Board. For example, a working group comprised of Independent Trustees and FMR has worked and continues to work to review the Fidelity funds' valuation-related activities, reporting and risk management. Appropriate personnel, including but not limited to the fund's Chief Compliance Officer (CCO), FMR's internal auditor, the independent accountants, the fund's Treasurer and portfolio management personnel, make periodic reports to the Board's committees, as appropriate, including an annual review of FMR's risk management program for the Fidelity funds. The responsibilities of each standing committee, including their oversight responsibilities, are described further under "Standing Committees of the Fund's Trustees."
Annual Report
Trustees and Officers - continued
The fund's Statement of Additional Information (SAI) includes more information about the Trustees. To request a free copy, call Fidelity at 1-877-208-0098.
Interested Trustees*:
Correspondence intended for each Trustee who is an interested person may be sent to Fidelity Investments, 245 Summer Street, Boston, Massachusetts 02210.
Name, Year of Birth; Principal Occupations and Other Relevant Experience+ |
James C. Curvey (1935) |
Year of Election or Appointment: 2007 Trustee Chairman of the Board of Trustees |
| Mr. Curvey also serves as Trustee of other Fidelity funds. Mr. Curvey is a Director of Fidelity Investments Money Management, Inc. (2009-present), Director of Fidelity Research & Analysis Co. (2009-present) and Director of FMR and FMR Co., Inc. (2007-present). Mr. Curvey is also Vice Chairman (2007-present) and Director of FMR LLC. In addition, Mr. Curvey serves as an Overseer for the Boston Symphony Orchestra and a member of the Trustees of Villanova University. Previously, Mr. Curvey was the Vice Chairman (2006-2007) and Director (2000-2007) of FMR Corp. |
Ronald P. O'Hanley (1957) |
Year of Election or Appointment: 2011 Trustee |
| Mr. O'Hanley also serves as Trustee of other Fidelity funds. He is Director of Fidelity SelectCo, LLC (2013-present), FMR Co., Inc. (2010-present), Director of Fidelity Investments Money Management, Inc. (2010-present), Director of Fidelity Research & Analysis Company (2010-present), President of Fidelity Asset Management and Corporate Services and a Member of Fidelity's Executive Committee (2010-present). Previously, Mr. O'Hanley served as President and Chief Executive Officer of BNY Mellon Asset Management (2007-2010). Mr. O'Hanley also served as Vice Chairman of Bank New York Mellon Corp. and a member of that firm's Executive Committee. Prior to the 2007 merger of The Bank of New York and Mellon Financial Corporation, he was Vice Chairman of Mellon Financial Corporation and President and Chief Executive Officer of Mellon Asset Management. He joined Mellon in February 1997. Mr. O'Hanley currently serves as Chairman of the Boston Public Library Foundation Board of Directors and sits on the Board of Directors of Beth Israel Deaconess Medical Center, the Board of Trustees of the Marine Biological Laboratory and the Advisory Board of the Maxwell School of Citizenship and Public Administration at Syracuse University. Mr. O'Hanley also chairs the Council on Asset Management for the Financial Services Roundtable and is a member of the Board of Directors of Institutional Investor's U.S. Institute. |
* Trustees have been determined to be "Interested Trustees" by virtue of, among other things, their affiliation with the trust or various entities under common control with FMR.
+ The information above includes each Trustee's principal occupation during the last five years and other information relating to the experience, attributes, and skills relevant to each Trustee's qualifications to serve as a Trustee, which led to the conclusion that each Trustee should serve as a Trustee for the fund.
Annual Report
Independent Trustees:
Correspondence intended for each Independent Trustee (that is, the Trustees other than the Interested Trustees) may be sent to Fidelity Investments, P.O. Box 55235, Boston, Massachusetts 02205-5235.
Name, Year of Birth; Principal Occupations and Other Relevant Experience+ |
Dennis J. Dirks (1948) |
Year of Election or Appointment: 2005 Trustee |
| Mr. Dirks also serves as Trustee of other Fidelity funds. Prior to his retirement in May 2003, Mr. Dirks was Chief Operating Officer and a member of the Board of The Depository Trust & Clearing Corporation (DTCC). He also served as President, Chief Operating Officer, and Board member of The Depository Trust Company (DTC) and President and Board member of the National Securities Clearing Corporation (NSCC). In addition, Mr. Dirks served as Chief Executive Officer and Board member of the Government Securities Clearing Corporation, Chief Executive Officer and Board member of the Mortgage-Backed Securities Clearing Corporation, as a Trustee and a member of the Finance Committee of Manhattan College (2005-2008), and as a Trustee and a member of the Finance Committee of AHRC of Nassau County (2006-2008). Mr. Dirks is a member of the Independent Directors Council (IDC) Governing Council (2010-present) and Board of Directors for The Brookville Center for Children's Services, Inc. (2009-present). |
Alan J. Lacy (1953) |
Year of Election or Appointment: 2008 Trustee |
| Mr. Lacy also serves as Trustee of other Fidelity funds. Mr. Lacy serves as Senior Adviser (2007-present) of Oak Hill Capital Partners, L.P. (private equity). Mr. Lacy also served as Chief Executive Officer (2000-2005) and Vice Chairman (2005-2006) of Sears Holdings Corporation and Sears, Roebuck and Co. (retail). In addition, Mr. Lacy serves as a member of the Board of Directors of Dave & Buster's Entertainment, Inc. (restaurant and entertainment complexes, 2010-present), Earth Fare, Inc. (retail grocery, 2012-present), The Hillman Companies, Inc. (hardware wholesalers, 2010-present), and Bristol-Myers Squibb Company (global pharmaceuticals, 2008-present). Mr. Lacy is a member of the Board of Trustees of The National Parks Conservation Association (2006-present). Previously, Mr. Lacy served as Chairman of the Board of Trustees of the National Parks Conservation Association (2008-2011) and as a member of the Board of Directors for the Western Union Company (global money transfer, 2006-2011). |
Ned C. Lautenbach (1944) |
Year of Election or Appointment: 2000 Trustee Chairman of the Independent Trustees |
| Mr. Lautenbach also serves as Trustee of other Fidelity funds. Mr. Lautenbach currently serves as the Lead Director of the Eaton Corporation Board of Directors (diversified industrial, 1997-present). Mr. Lautenbach is Chairman of the Board of Directors of the Philharmonic Center for the Arts in Naples, Florida (2012-present) and a member of the Council on Foreign Relations (1994-present). Previously, Mr. Lautenbach was a Partner/Advisory Partner at Clayton, Dubilier & Rice, LLC (private equity investment, 1998-2010), as well as a Director of Sony Corporation (2006-2007). |
Joseph Mauriello (1944) |
Year of Election or Appointment: 2008 Trustee |
| Mr. Mauriello also serves as Trustee of other Fidelity funds. Prior to his retirement in January 2006, Mr. Mauriello served in numerous senior management positions including Deputy Chairman and Chief Operating Officer (2004-2005), and Vice Chairman of Financial Services (2002-2004) of KPMG LLP US (professional services, 1965-2005). Mr. Mauriello currently serves as a member of the Board of Directors of XL Group plc. (global insurance and re-insurance, 2006-present). Previously, Mr. Mauriello served as a Director of the Hamilton Funds of the Bank of New York (2006-2007) and of Arcadia Resources Inc. (health care services and products, 2007-2012). |
Robert W. Selander (1950) |
Year of Election or Appointment: 2011 Trustee |
| Mr. Selander also serves as Trustee of other Fidelity funds. Previously, Mr. Selander served as a Member of the Advisory Board of other Fidelity funds (2011), and Executive Vice Chairman (2010), Chief Executive Officer (2009-2010), and President and Chief Executive Officer (1997-2009) of Mastercard, Inc. |
Cornelia M. Small (1944) |
Year of Election or Appointment: 2005 Trustee |
| Ms. Small also serves as Trustee of other Fidelity funds. Ms. Small is a member of the Board of Directors (2009-present) and Chair of the Investment Committee (2010-present) of the Teagle Foundation. Ms. Small also serves on the Investment Committee of the Berkshire Taconic Community Foundation (2008-present). Previously, Ms. Small served as Chairperson (2002-2008) and a member of the Investment Committee and Chairperson (2008-2012) and a member of the Board of Trustees of Smith College. In addition, Ms. Small served as Chief Investment Officer, Director of Global Equity Investments, and a member of the Board of Directors of Scudder, Stevens & Clark and Scudder Kemper Investments. |
William S. Stavropoulos (1939) |
Year of Election or Appointment: 2001 Trustee Vice Chairman of the Independent Trustees |
| Mr. Stavropoulos also serves as Trustee of other Fidelity funds. Mr. Stavropoulos serves as President and Founder of the Michigan Baseball Foundation, the Great Lakes Loons (2007-present). Mr. Stavropoulos is Chairman Emeritus of the Board of Directors of The Dow Chemical Company, where he previously served in numerous senior management positions, including President, CEO (1995-2000; 2002-2004), Chairman of the Executive Committee (2000-2006), and as a member of the Board of Directors (1990-2006). Currently, Mr. Stavropoulos is Chairman of the Board of Directors of Univar Inc. (global distributor of commodity and specialty chemicals), a Director of Teradata Corporation (data warehousing and technology solutions), and Maersk Inc. (industrial conglomerate), and a member of the Advisory Board for Metalmark Capital LLC (private equity investment, 2005-present). Mr. Stavropoulos is an operating advisor to Clayton, Dubilier & Rice, LLC (private equity investment). In addition, Mr. Stavropoulos is a member of the University of Notre Dame Advisory Council for the College of Science, a Trustee of the Rollin L. Gerstacker Foundation, and a Director of the Naples Philharmonic Center for the Arts. Previously, Mr. Stavropoulos served as a Director of Chemical Financial Corporation (bank holding company, 1993-2012) and Tyco International, Ltd. (multinational manufacturing and services, 2007-2012). |
David M. Thomas (1949) |
Year of Election or Appointment: 2008 Trustee |
| Mr. Thomas also serves as Trustee of other Fidelity funds. Mr. Thomas serves as Non-Executive Chairman of the Board of Directors of Fortune Brands Home and Security (home and security products, 2011-present), and as a member of the Board of Directors of Interpublic Group of Companies, Inc. (marketing communication, 2004-present). Previously, Mr. Thomas served as Executive Chairman (2005-2006) and Chairman and Chief Executive Officer (2000-2005) of IMS Health, Inc. (pharmaceutical and healthcare information solutions), and a Director of Fortune Brands, Inc. (consumer products, 2000-2011). |
+ The information above includes each Trustee's principal occupation during the last five years and other information relating to the experience, attributes, and skills relevant to each Trustee's qualifications to serve as a Trustee, which led to the conclusion that each Trustee should serve as a Trustee for the fund.
Advisory Board Member and Executive Officers:
Correspondence intended for each executive officer and Peter S. Lynch may be sent to Fidelity Investments, 245 Summer Street, Boston, Massachusetts 02210. Executive officers appear below in alphabetical order.
Name, Year of Birth; Principal Occupation |
Peter S. Lynch (1944) |
Year of Election or Appointment: 2003 Member of the Advisory Board |
| Mr. Lynch also serves as Member of the Advisory Board of other Fidelity funds. Mr. Lynch is Vice Chairman and a Director of FMR and FMR Co., Inc. In addition, Mr. Lynch serves as a Trustee of Boston College and as the Chairman of the Inner-City Scholarship Fund. Previously, Mr. Lynch served on the Special Olympics International Board of Directors (1997-2006). |
Elizabeth Paige Baumann (1968) |
Year of Election or Appointment: 2012 Anti-Money Laundering (AML) Officer |
| Ms. Baumann also serves as AML Officer of other funds. She is Chief AML Officer of FMR LLC (2012-present) and is an employee of Fidelity Investments. Previously, Ms. Baumann served as Vice President and Deputy Anti-Money Laundering Officer (2007-2012). |
William C. Coffey (1969) |
Year of Election or Appointment: 2009 Assistant Secretary |
| Mr. Coffey also serves as Assistant Secretary of other funds. He is Senior Vice President and Deputy General Counsel of FMR LLC (2010-present), and is an employee of Fidelity Investments. Previously, Mr. Coffey served as Vice President and Associate General Counsel of FMR LLC (2005-2009). |
Jonathan Davis (1968) |
Year of Election or Appointment: 2010 Assistant Treasurer |
| Mr. Davis also serves as Assistant Treasurer of other funds. Mr. Davis is an employee of Fidelity Investments. Previously, Mr. Davis served as Vice President and Associate General Counsel of FMR LLC (2003-2010). |
Adrien E. Deberghes (1967) |
Year of Election or Appointment: 2008 Deputy Treasurer |
| Mr. Deberghes also serves as an officer of other funds. He is an employee of Fidelity Investments (2008-present). Prior to joining Fidelity Investments, Mr. Deberghes was Senior Vice President of Mutual Fund Administration at State Street Corporation (2007-2008), Senior Director of Mutual Fund Administration at Investors Bank & Trust (2005-2007), and Director of Finance for Dunkin' Brands (2000-2005). |
Stephanie J. Dorsey (1969) |
Year of Election or Appointment: 2010 Assistant Treasurer |
| Ms. Dorsey also serves as an officer of other funds. She is an employee of Fidelity Investments (2008-present) and has served in other fund officer roles. Prior to joining Fidelity Investments, Ms. Dorsey served as Treasurer (2004-2008) of the JPMorgan Mutual Funds and Vice President (2004-2008) of JPMorgan Chase Bank. |
Scott C. Goebel (1968) |
Year of Election or Appointment: 2008 Secretary and Chief Legal Officer (CLO) |
| Mr. Goebel serves as Secretary and CLO of other funds. Mr. Goebel also serves as Secretary of Fidelity Investments Money Management, Inc. (FIMM) (2010-present) and Fidelity Research and Analysis Company (FRAC) (2010-present); General Counsel, Secretary, and Senior Vice President of FMR (2008-present) and FMR Co., Inc. (2008-present); Chief Legal Officer of Fidelity Management & Research (Hong Kong) Limited (2008-present) and Assistant Secretary of Fidelity Management & Research (Japan) Inc. (2008-present), and Fidelity Management & Research (U.K.) Inc. (2008-present). Previously, Mr. Goebel served as Secretary and CLO of other Fidelity funds (2008-2013), Assistant Secretary of FIMM (2008-2010), FRAC (2008-2010), and certain funds (2007-2008); and as Vice President and Secretary of Fidelity Distributors Corporation (FDC) (2005-2007). Mr. Goebel has been employed by FMR LLC or an affiliate since 2001. |
Joseph A. Hanlon (1968) |
Year of Election or Appointment: 2012 Chief Compliance Officer |
| Mr. Hanlon also serves as Chief Compliance Officer of other funds. Mr. Hanlon serves as Compliance Officer of FMR, FMR Co., Inc., Fidelity Investments Money Management, Inc. (FIMM), Fidelity Research and Analysis Company (FRAC), and Fidelity Management & Research (Hong Kong) (2009-present), as Senior Vice President of the Fidelity Asset Management Division (2009-present), and is an employee of Fidelity Investments. Previously, Mr. Hanlon served as Compliance Officer of Fidelity Management & Research (Japan) Inc. (2009-2013), Strategic Advisers, Inc. (2009-2013), and Fidelity Management & Research (U.K.) Inc. (2009-2013). |
Bruce T. Herring (1965) |
Year of Election or Appointment: 2006 Vice President of certain Equity Funds |
| Mr. Herring also serves as Vice President of other funds. He serves as Chief Investment Officer of Fidelity Global Asset Allocation (GAA) (2013-present), Chief Investment Officer and Director of Fidelity Management & Research (U.K.) Inc. (2010-present), Group Chief Investment Officer of FMR, and President of Fidelity Research & Analysis Company (2010-present). Previously, Mr. Herring served as Vice President (2005-2006) and Senior Vice President (2006-2007) of Fidelity Management & Research Company, Vice President of FMR Co., Inc. (2001-2007), and as a portfolio manager for Fidelity U.S. Equity Funds. |
Brian B. Hogan (1964) |
Year of Election or Appointment: 2009 Vice President |
| Mr. Hogan also serves as Vice President of other funds. Mr. Hogan serves as President of FMR's Equity Division (2009-present). Previously, Mr. Hogan served as Senior Vice President, Equity Research of FMR (2006-2009) and as a portfolio manager. |
Chris Maher (1972) |
Year of Election or Appointment: 2013 Assistant Treasurer |
| Mr. Maher serves as Assistant Treasurer of other funds. Mr. Maher is Vice President of Valuation Oversight and is an employee of Fidelity Investments. Previously, Mr. Maher served as Vice President of Asset Management Compliance (2013), Vice President of FMR's Program Management Group (2010-2013), and Vice President of Valuation Oversight (2008-2010). |
Christine Reynolds (1958) |
Year of Election or Appointment: 2008 Chief Financial Officer |
| Ms. Reynolds also serves as Chief Financial Officer of other funds. Ms. Reynolds became President of Fidelity Pricing and Cash Management Services (FPCMS) in August 2008. Ms. Reynolds served as Chief Operating Officer of FPCMS (2007-2008). Previously, Ms. Reynolds served as President, Treasurer, and Anti-Money Laundering officer of the Fidelity funds (2004-2007). |
Kenneth B. Robins (1969) |
Year of Election or Appointment: 2008 President and Treasurer |
| Mr. Robins also serves as an officer of other funds. Mr. Robins serves as Executive Vice President of Fidelity Investments Money Management, Inc. (FIMM) (2013-present) and is an employee of Fidelity Investments (2004-present). Previously, Mr. Robins served in other fund officer roles. |
Gary W. Ryan (1958) |
Year of Election or Appointment: 2005 Assistant Treasurer |
| Mr. Ryan also serves as Assistant Treasurer of other funds. Mr. Ryan is an employee of Fidelity Investments and has served in other fund officer roles. Previously, Mr. Ryan served as Vice President of Fund Reporting in Fidelity Pricing and Cash Management Services (FPCMS) (1999-2005). |
Stephen Sadoski (1971) |
Year of Election or Appointment: 2012 Deputy Treasurer |
| Mr. Sadoski also serves as Deputy Treasurer of other funds. He is an employee of Fidelity Investments (2012-present) and has served in another fund officer role. Prior to joining Fidelity Investments, Mr. Sadoski served as an assistant chief accountant in the Division of Investment Management of the Securities and Exchange Commission (SEC) (2009-2012) and as a senior manager at Deloitte & Touche LLP (1997-2009). |
Stacie M. Smith (1974) |
Year of Election or Appointment: 2013 Deputy Treasurer |
| Ms. Smith also serves as an officer of other funds. She is an employee of Fidelity Investments (2009-present) and has served in other fund officer roles. Prior to joining Fidelity Investments, Ms. Smith served as Senior Audit Manager of Ernst & Young LLP (1996-2009). |
Renee Stagnone (1975) |
Year of Election or Appointment: 2013 Deputy Treasurer |
| Ms. Stagnone also serves as Deputy Treasurer of other funds. Ms. Stagnone is an employee of Fidelity Investments. |
Joseph F. Zambello (1957) |
Year of Election or Appointment: 2011 Deputy Treasurer |
| Mr. Zambello also serves as Deputy Treasurer of other funds. Mr. Zambello is an employee of Fidelity Investments. Previously, Mr. Zambello served as Vice President of FMR's Program Management Group (2009-2011) and Vice President of the Transfer Agent Oversight Group (2005-2009). |
Annual Report
The Board of Trustees of Fidelity Advisor Canada Fund voted to pay to shareholders of record at the opening of business on record date, the following distributions per share derived from capital gains realized from sales of portfolio securities, and dividends derived from net investment income:
| Pay Date | Record Date | Dividends | Capital Gains |
Institutional Class | 12/09/13 | 12/06/13 | $0.222 | $0.32 |
The fund hereby designates as a capital gain dividend with respect to the taxable year ended October 31, 2013 $54,802,785 or, if subsequently determined to be different, the net capital gain of such year.
A percentage of the dividends distributed during the fiscal year for the following funds qualifies for the dividends-received deduction for corporate shareholders:
| December 07, 2012 |
Institutional Class | 4% |
The Institutional Class designates 100% of the dividends distributed during the fiscal year as amounts which may be taken into account as a dividend for the purposes of the maximum rate under section 1(h)(11) of the Internal Revenue Code.
The amounts per share which represent income derived from sources within, and taxes paid to, foreign countries or possessions of the United States are as follows:
| Pay Date | Income | Taxes |
Institutional Class | 12/10/12 | $0.893 | $0.1441 |
The fund will notify shareholders in January 2014 of amounts for use in preparing 2013 income tax returns.
Annual Report
Board Approval of Investment Advisory Contracts and Management Fees
Fidelity Canada Fund
Each year, the Board of Trustees, including the Independent Trustees (together, the Board), votes on the renewal of the management contract and sub-advisory agreements (together, the Advisory Contracts) for the fund. The Board, assisted by the advice of fund counsel and Independent Trustees' counsel, requests and considers a broad range of information relevant to the renewal of the Advisory Contracts throughout the year.
The Board meets regularly and, at each of its meetings, covers an extensive agenda of topics and materials and considers factors that are relevant to its annual consideration of the renewal of the fund's Advisory Contracts, including the services and support provided to the fund and its shareholders. The Board has established various standing committees, each composed of and chaired by Independent Trustees with varying backgrounds, to which the Board has assigned specific subject matter responsibilities in order to enhance effective decision-making by the Board. The Board, acting directly and through its Committees, requests and receives information concerning the annual consideration of the renewal of the fund's Advisory Contracts. The Board also meets as needed to consider matters specifically related to the Board's annual consideration of the renewal of Advisory Contracts. Members of the Board may also meet with trustees of other Fidelity funds through ad hoc joint committees to discuss certain matters relevant to the Fidelity funds.
At its July 2013 meeting, the Board, including the Independent Trustees, unanimously determined to renew the fund's Advisory Contracts. In reaching its determination, the Board considered all factors it believed relevant, including (i) the nature, extent, and quality of the services to be provided to the fund and its shareholders (including the investment performance of the fund); (ii) the competitiveness of the fund's management fee and total expense ratio relative to peer funds; (iii) the total costs of the services to be provided by and the profits to be realized by Fidelity from its relationship with the fund; (iv) the extent to which economies of scale exist and would be realized as the fund grows; and (v) whether fee levels reflect these economies of scale, if any, for the benefit of fund shareholders.
In considering whether to renew the Advisory Contracts for the fund, the Board reached a determination, with the assistance of fund counsel and Independent Trustees' counsel and through the exercise of its business judgment, that the renewal of the Advisory Contracts was in the best interests of the fund and its shareholders and that the compensation payable under the Advisory Contracts was fair and reasonable. The Board's decision to renew the Advisory Contracts was not based on any single factor, but rather was based on a comprehensive consideration of all the information provided to the Board at its meetings throughout the year. The Board, in reaching its determination to renew the Advisory Contracts, was aware that shareholders in the fund have a broad range of investment choices available to them, including a wide choice among mutual funds offered by Fidelity's competitors, and that the fund's shareholders, who have the opportunity to review and weigh the disclosure provided by the fund in its prospectus and other public disclosures, have chosen to invest in this fund, which is a part of the Fidelity family of funds.
Nature, Extent, and Quality of Services Provided. The Board considered the staffing within the investment adviser, Fidelity Management & Research Company (FMR), and the sub-advisers (together, the Investment Advisers) as it relates to the fund, including the backgrounds of the fund's investment personnel, and also considered the fund's investment objective, strategies, and related investment philosophy. The Independent Trustees also had discussions with senior management of Fidelity's investment operations and investment groups. The Board considered the structure of the portfolio manager compensation program and whether this structure provides appropriate incentives to act in the best interests of the fund.
Resources Dedicated to Investment Management and Support Services. The Board and the Fund Oversight and Research Committees reviewed the general qualifications and capabilities of the Investment Advisers' investment staff, including its size, education, experience, and resources, as well as the Investment Advisers' approach to recruiting, training, managing, and compensating investment personnel. The Board noted that FMR has continued to increase the resources devoted to non-U.S. offices, including expansion of Fidelity's global investment organization. The Board also noted that Fidelity's analysts have extensive resources, tools and capabilities that allow them to conduct sophisticated quantitative and fundamental analysis, as well as credit analysis of issuers, counterparties and guarantors. Further, the Board believes that Fidelity's investment professionals have sufficient access to global information and data so as to provide competitive investment results over time, and that those professionals also have access to sophisticated tools that permit them to assess portfolio construction and risk and performance attribution characteristics continuously, as well as to transmit new information and research conclusions rapidly around the world. Additionally, in its deliberations, the Board considered the Investment Advisers' trading and risk management capabilities and resources, which are an integral part of the investment management process.
Shareholder and Administrative Services. The Board considered (i) the nature, extent, quality, and cost of advisory, administrative, and shareholder services performed by the Investment Advisers and their affiliates under the Advisory Contracts and under separate agreements covering transfer agency, pricing and bookkeeping, and securities lending services for the fund; (ii) the nature and extent of the supervision of third party service providers, principally custodians and subcustodians; and (iii) the resources devoted to, and the record of compliance with, the fund's compliance policies and procedures. The Board also reviewed the allocation of fund brokerage, including allocations to brokers affiliated with the Investment Advisers, the use of brokerage commissions to pay fund expenses, and the use of "soft" commission dollars to pay for research services.
The Board noted that the growth of fund assets over time across the complex allows Fidelity to reinvest in the development of services designed to enhance the value or convenience of the Fidelity funds as investment vehicles. These services include 24-hour access to account information and market information through telephone representatives and over the Internet, investor education materials and asset allocation tools, and the expanded availability of Fidelity Investor Centers.
Annual Report
Board Approval of Investment Advisory Contracts and Management Fees - continued
Investment in a Large Fund Family. The Board considered the benefits to shareholders of investing in a Fidelity fund, including the benefits of investing in a fund that is part of a large family of funds offering a variety of investment disciplines and providing a large variety of mutual fund investor services. The Board noted that Fidelity had taken, or had made recommendations that resulted in the Fidelity funds taking, a number of actions over the previous year that benefited particular funds, including (i) continuing to dedicate additional resources to investment research and to the support of the senior management team that oversees asset management; (ii) persisting in efforts to enhance Fidelity's global research capabilities; (iii) launching new funds and making other enhancements to meet client needs for global and income-oriented solutions; (iv) continuing to launch dedicated lower cost underlying funds to meet portfolio construction needs related to expanding underlying fund options for Fidelity funds of funds, specifically for the Freedom Fund product lines; (v) rationalizing product lines and gaining increased efficiencies through the mergers of several funds into other funds; (vi) strengthening Fidelity's index fund offerings by reducing investment minimums and adopting or lowering existing expense caps for certain funds and classes; (vii) enhancing Global Asset Allocation product offerings by launching new funds and strategies, including "open architecture" target date funds that utilize affiliated and unaffiliated sub-advisers; (viii) modifying the eligibility criteria for Institutional Class shares of Advisor funds to increase their marketability to a portion of the defined contribution plan market; (ix) creating a new low-cost retirement share class for certain Advisor funds to appeal to large retirement plans; (x) transitioning the management of certain Fidelity commodity funds to Geode Capital Management LLC, a registered commodity pool operator, while retaining administrative responsibilities for the funds; (xi) reorganizing a number of funds; and (xii) taking steps toward establishing a new Fidelity adviser to manage sector-based funds and products.
Investment Performance. The Board considered whether the fund has operated in accordance with its investment objective, as well as its record of compliance with its investment restrictions and its performance history.
The Board took into account discussions with the Investment Advisers about fund investment performance that occur at Board meetings throughout the year. In this regard the Board noted that as part of regularly scheduled fund reviews and other reports to the Board on fund performance, the Board periodically considers annualized return information for the fund, for different time periods, measured against a securities market index ("benchmark index") and a peer group of mutual funds with similar objectives ("peer group"). In its evaluation of fund investment performance, the Board gave particular attention to information indicating changes in performance of certain Fidelity funds for specific time periods and the Investment Advisers' explanations for any overperformance or underperformance.
In addition to reviewing absolute and relative fund performance, the Independent Trustees periodically consider the appropriateness of fund performance metrics in evaluating the results achieved. In general, the Independent Trustees believe that fund performance should be evaluated based on net performance (after fees and expenses) of both the highest performing and lowest performing classes, where applicable, compared to appropriate benchmark indices, over appropriate time periods which may include full market cycles, and compared to peer groups, as applicable, over the same periods, taking into account relevant factors including the following: general market conditions; issuer-specific information; tactical opportunities for investment; and fund cash flows and other factors.
The Independent Trustees recognize that shareholders evaluate performance on a net basis over their own holding periods, for which one-, three-, and five-year periods are used as a proxy. For this reason, the performance information reviewed by the Board also included net cumulative calendar year total return information for the fund and an appropriate benchmark index for the most recent one-, three-, and five-year periods, as shown below. A peer group comparison is not shown below.
Annual Report
Fidelity Canada Fund

The Board has discussed with FMR the fund's underperformance (based on the December 31, 2012 data presented herein) and has engaged with FMR to consider what steps might be taken to remediate the fund's underperformance. The Board noted that the fund's performance has improved for more recent periods.
The Board also considered that the fund's management fee is subject to upward or downward adjustment depending upon whether, and to what extent, the fund's investment performance for the performance period exceeds, or is exceeded by, a securities index, thus leading to a performance adjustment for the same period. The Board noted that the performance adjustment provides FMR with a strong economic incentive to seek to achieve superior performance for the fund's shareholders and helps to more closely align the interests of FMR and the fund's shareholders.
Based on its review, the Board concluded that the nature, extent, and quality of services provided to the fund under the Advisory Contracts should benefit the fund's shareholders.
Competitiveness of Management Fee and Total Expense Ratio. The Board considered the fund's management fee and total expense ratio compared to "mapped groups" of competitive funds and classes. Fidelity creates "mapped groups" by combining similar Lipper investment objective categories that have comparable management fee characteristics. Combining Lipper investment objective categories aids the Board's management fee and total expense ratio comparisons by broadening the competitive group used for comparison and by reducing the number of universes to which various Fidelity funds are compared.
Management Fee. The Board considered two proprietary management fee comparisons for the 12-month periods shown in the chart below. The group of Lipper funds used by the Board for management fee comparisons is referred to below as the "Total Mapped Group." The Total Mapped Group comparison focuses on a fund's standing in terms of gross management fees before expense reimbursements or caps, and without giving effect to the fund's performance adjustment, relative to the total universe of funds with comparable investment mandates, regardless of whether their management fee structures also are comparable. Funds with comparable investment mandates offer exposure to similar types of securities. Funds with comparable management fee structures have similar management fee contractual arrangements (e.g., flat rate charged for advisory services, all-inclusive fee rate, etc.). "TMG %" represents the percentage of funds in the Total Mapped Group that had management fees that were lower than the fund's. For example, a TMG % of 16% means that 84% of the funds in the Total Mapped Group had higher management fees than the fund. The "Asset-Size Peer Group" (ASPG) comparison focuses on a fund's standing relative to a subset of non-Fidelity funds within the Total Mapped Group that are similar in size and management fee structure. The ASPG represents at least 15% of the funds in the Total Mapped Group with comparable asset size and management fee structures, subject to a minimum of 50 funds (or all funds in the Total Mapped Group if fewer than 50). Additional information, such as the ASPG quartile in which the fund's management fee ranked and the impact of the fund's performance adjustment, is also included in the chart and considered by the Board.
Annual Report
Board Approval of Investment Advisory Contracts and Management Fees - continued
Fidelity Canada Fund

The Board noted that the fund's management fee ranked below the median of its Total Mapped Group and below the median of its ASPG for 2012. The Board also noted the effect of the fund's negative performance adjustment on the fund's management fee ranking.
Based on its review, the Board concluded that the fund's management fee is fair and reasonable in light of the services that the fund receives and the other factors considered.
Total Expense Ratio. In its review of each class's total expense ratio, the Board considered the fund's management fee as well as other fund or class expenses, as applicable, such as transfer agent fees, pricing and bookkeeping fees, fund-paid 12b-1 fees, and custodial, legal, and audit fees. The Board also noted the effects of any waivers and reimbursements on fees and expenses, as well as the impact of the fund's performance adjustment. As part of its review, the Board also considered the current and historical total expense ratios of each class of the fund compared to competitive fund median expenses. Each class of the fund is compared to those funds and classes in the Total Mapped Group (used by the Board for management fee comparisons) that have a similar sales load structure.
The Board noted that the total expense ratio of each class ranked below its competitive median for 2012.
Fees Charged to Other Fidelity Clients. The Board also considered Fidelity fee structures and other information with respect to clients of FMR and its affiliates, such as other mutual funds advised or subadvised by FMR or its affiliates, pension plan clients, and other institutional clients. The Board noted the findings of the 2013 ad hoc joint committee (created with the board of other Fidelity funds), which reviewed and compared Fidelity's institutional investment advisory business with its business of providing services to the Fidelity funds, including the differences in services provided, fees charged, and costs incurred, as well as competition in their respective marketplaces.
Based on its review of total expense ratios and fees charged to other Fidelity clients, the Board concluded that the total expense ratio of each class of the fund was reasonable in light of the services that the fund and its shareholders receive and the other factors considered.
Costs of the Services and Profitability. The Board considered the revenues earned and the expenses incurred by Fidelity in conducting the business of developing, marketing, distributing, managing, administering and servicing the fund and servicing the fund's shareholders. The Board also considered the level of Fidelity's profits in respect of all the Fidelity funds.
On an annual basis, FMR presents to the Board Fidelity's profitability for the fund. Fidelity calculates the profitability for each fund, as well as aggregate profitability for groups of Fidelity funds and all Fidelity funds, using a series of detailed revenue and cost allocation methodologies which originate with the books and records of Fidelity on which Fidelity's audited financial statements are based. The Audit Committee of the Board reviews any significant changes from the prior year's methodologies.
PricewaterhouseCoopers LLP (PwC), independent registered public accounting firm and auditor to Fidelity and certain Fidelity funds, has been engaged annually by the Board as part of the Board's assessment of Fidelity's profitability analysis. PwC's engagement includes the review and assessment of the methodologies used by Fidelity in determining the revenues and expenses attributable to Fidelity's mutual fund business, and completion of agreed-upon procedures surrounding the mathematical accuracy of fund profitability and its conformity to allocation methodologies. After considering PwC's reports issued under the engagement and information provided by Fidelity, the Board concluded that while other allocation methods may also be reasonable, Fidelity's profitability methodologies are reasonable in all material respects.
Annual Report
The Board also reviewed Fidelity's non-fund businesses and fall-out benefits related to the mutual fund business as well as cases where Fidelity's affiliates may benefit from or be related to the fund's business.
The Board considered the costs of the services provided by and the profits realized by Fidelity in connection with the operation of the fund and was satisfied that the profitability was not excessive in the circumstances.
Economies of Scale. The Board considered whether there have been economies of scale in respect of the management of the Fidelity funds, whether the Fidelity funds (including the fund) have appropriately benefited from any such economies of scale, and whether there is potential for realization of any further economies of scale. The Board considered the extent to which the fund will benefit from economies of scale through increased services to the fund, through waivers or reimbursements, or through fee or expense reductions. The Board also noted that in 2009, it and the board of other Fidelity funds created an ad hoc committee (the Economies of Scale Committee) to analyze whether FMR attains economies of scale in respect of the management and servicing of the Fidelity funds, whether the Fidelity funds have appropriately benefited from such economies of scale, and whether there is potential for realization of any further economies of scale.
The Board recognized that the fund's management contract incorporates a "group fee" structure, which provides for lower group fee rates as total fund assets under FMR's management increase, and for higher group fee rates as total fund assets under FMR's management decrease. FMR calculates the group fee rates based on a tiered asset "breakpoint" schedule that varies based on asset class. The Board considered that the group fee is designed to deliver the benefits of economies of scale to fund shareholders when total Fidelity fund assets increase, even if assets of any particular fund are unchanged or have declined, because some portion of Fidelity's costs are attributable to services provided to all Fidelity funds, and all funds benefit if those costs can be allocated among more assets. The Board concluded that, given the group fee structure, fund shareholders will benefit from lower management fees as assets under FMR's management increase at the fund complex level, regardless of whether Fidelity achieves any such economies of scale.
The Board concluded, taking into account the analysis of the Economies of Scale Committee, that economies of scale, if any, are being appropriately shared between fund shareholders and Fidelity.
Amendment to Description of Group Fee Rate. At its July 2013 meeting, the Board voted to approve an amendment to the fund's management contract to modify the description of the "group fee rate" effective August 1, 2013. The Board noted that under the prior description in the contract, the group fee rate was based on the average net assets of all registered investment companies with which FMR has management contracts. Under the contract's tiered asset breakpoint schedule, the group fee rate is lower as total fund assets under FMR's management increase, and higher as total fund assets under FMR's management decrease. The Board considered that the prior description would have excluded the assets of 64 Fidelity sector funds from the group fee rate calculation once Fidelity SelectCo, LLC, an affiliate of FMR, assumed management responsibilities for those funds. The Board noted that modifying the description of the group fee rate to continue to include the assets of those 64 funds for purposes of determining group fee rate breakpoints would avoid an immediate adverse impact on the group fee rate for any fund.
Additional Information Requested by the Board. In order to develop fully the factual basis for consideration of the Fidelity funds' Advisory Contracts, the Board requested and received additional information on certain topics, including: (i) fund performance trends and Fidelity's long-term strategies for certain funds; (ii) the potential to further rationalize the Fidelity fund lineup with the possibility of achieving savings for the funds and Fidelity; (iii) the methodology with respect to competitive fund data and peer group classifications; (iv) the arrangements with, and performance of, certain sub-advisers on behalf of the Fidelity funds, as well as certain proposed participating affiliate arrangements; (v) the realization of fall-out benefits in certain Fidelity business units; (vi) Fidelity's group fee structures, including the rationale for the individual fee rates of certain categories of funds and the definition of group assets; (vii) trends regarding industry use of performance fee structures and the performance adjustment methodologies applicable to the Fidelity funds; (viii) additional competitive analysis regarding the total expenses for certain classes; and (ix) fund profitability methodology, including Fidelity's cost allocation methodology, and the impact of certain factors on fund profitability results.
Based on its evaluation of all of the conclusions noted above, and after considering all factors it believed relevant, the Board ultimately concluded that the advisory fee structures are fair and reasonable, and that the fund's Advisory Contracts should be renewed.
Annual Report
Investment Adviser
Fidelity Management & Research Company
Boston, MA
Investment Sub-Advisers
FMR Co., Inc.
Fidelity Management & Research
(U.K.) Inc.
Fidelity Management & Research
(Hong Kong) Limited
Fidelity Management & Research
(Japan) Inc.
FIL Investment Advisors
FIL Investment Advisors
(UK) Limited
General Distributor
Fidelity Distributors Corporation
Smithfield, RI
Transfer and Service Agents
Fidelity Investments Institutional
Operations Company, Inc.
Boston, MA
Fidelity Service Company, Inc.
Boston, MA
Custodian
State Street Bank and Trust Company
Quincy, MA
(Fidelity Investment logo)(registered trademark)
Corporate Headquarters
245 Summer St., Boston, MA 02210
www.fidelity.com
ACANI-UANN-1213
1.843157.106
Fidelity®
Emerging Markets
Fund -
Class K
Annual Report
October 31, 2013
(Fidelity Cover Art)
Contents
Performance | (Click Here) | How the fund has done over time. |
Management's Discussion of Fund Performance | (Click Here) | The Portfolio Manager's review of fund performance and strategy. |
Shareholder Expense Example | (Click Here) | An example of shareholder expenses. |
Investment Changes | (Click Here) | A summary of major shifts in the fund's investments over the past six months. |
Investments | (Click Here) | A complete list of the fund's investments with their market values. |
Financial Statements | (Click Here) | Statements of assets and liabilities, operations, and changes in net assets, as well as financial highlights. |
Notes | (Click Here) | Notes to the financial statements. |
Report of Independent Registered Public Accounting Firm | (Click Here) | |
Trustees and Officers | (Click Here) | |
Distributions | (Click Here) | |
Board Approval of Investment Advisory Contracts and Management Fees | (Click Here) | |
To view a fund's proxy voting guidelines and proxy voting record for the 12-month period ended June 30, visit http://www.fidelity.com/proxyvotingresults or visit the Securities and Exchange Commission's (SEC) web site at http://www.sec.gov. You may also call 1-800-835-5092 to request a free copy of the proxy voting guidelines.
Standard & Poor's, S&P and S&P 500 are registered service marks of The McGraw-Hill Companies, Inc. and have been licensed for use by Fidelity Distributors Corporation.
Other third-party marks appearing herein are the property of their respective owners.
All other marks appearing herein are registered or unregistered trademarks or service marks of FMR LLC or an affiliated company. © 2013 FMR LLC. All rights reserved.
This report and the financial statements contained herein are submitted for the general information of the shareholders of the fund. This report is not authorized for distribution to prospective investors in the fund unless preceded or accompanied by an effective prospectus.
A fund files its complete schedule of portfolio holdings with the SEC for the first and third quarters of each fiscal year on Form N-Q. Forms N-Q are available on the SEC's web site at http://www.sec.gov. A fund's Forms N-Q may be reviewed and copied at the SEC's Public Reference Room in Washington, DC. Information regarding the operation of the SEC's Public Reference Room may be obtained by calling 1-800-SEC-0330. For a complete list of a fund's portfolio holdings, view the most recent holdings listing, semiannual report, or annual report on Fidelity's web site at http://www.fidelity.com, http://www.advisor.fidelity.com, or http://www.401k.com, as applicable.
NOT FDIC INSURED • MAY LOSE VALUE • NO BANK GUARANTEE
Neither the fund nor Fidelity Distributors Corporation is a bank.
Annual Report
Average annual total return reflects the change in the value of an investment, assuming reinvestment of the class' distributions from dividend income and capital gains (the profits earned upon the sale of securities that have grown in value, if any) and assuming a constant rate of performance each year. The $10,000 table and the fund's returns do not reflect the deduction of taxes that a shareholder would pay on fund distributions or the redemption of fund shares. During periods of reimbursement by Fidelity, a fund's total return will be greater than it would be had the reimbursement not occurred. How a fund did yesterday is no guarantee of how it will do tomorrow.
Average Annual Total Returns
Periods ended October 31, 2013 | Past 1
year | Past 5
years | Past 10
years |
Class K A | 12.01% | 14.16% | 11.43% |
A The initial offering of Class K shares took place on May 9, 2008. Returns prior to May 9, 2008, are those of Fidelity® Emerging Markets Fund, the original class of the fund.
$10,000 Over 10 Years
Let's say hypothetically that $10,000 was invested in Fidelity® Emerging Markets Fund - Class K on October 31, 2003. The chart shows how the value of your investment would have changed, and also shows how the MSCI® Emerging Markets Index performed over the same period. See footnote A above for additional information regarding the performance of Class K.
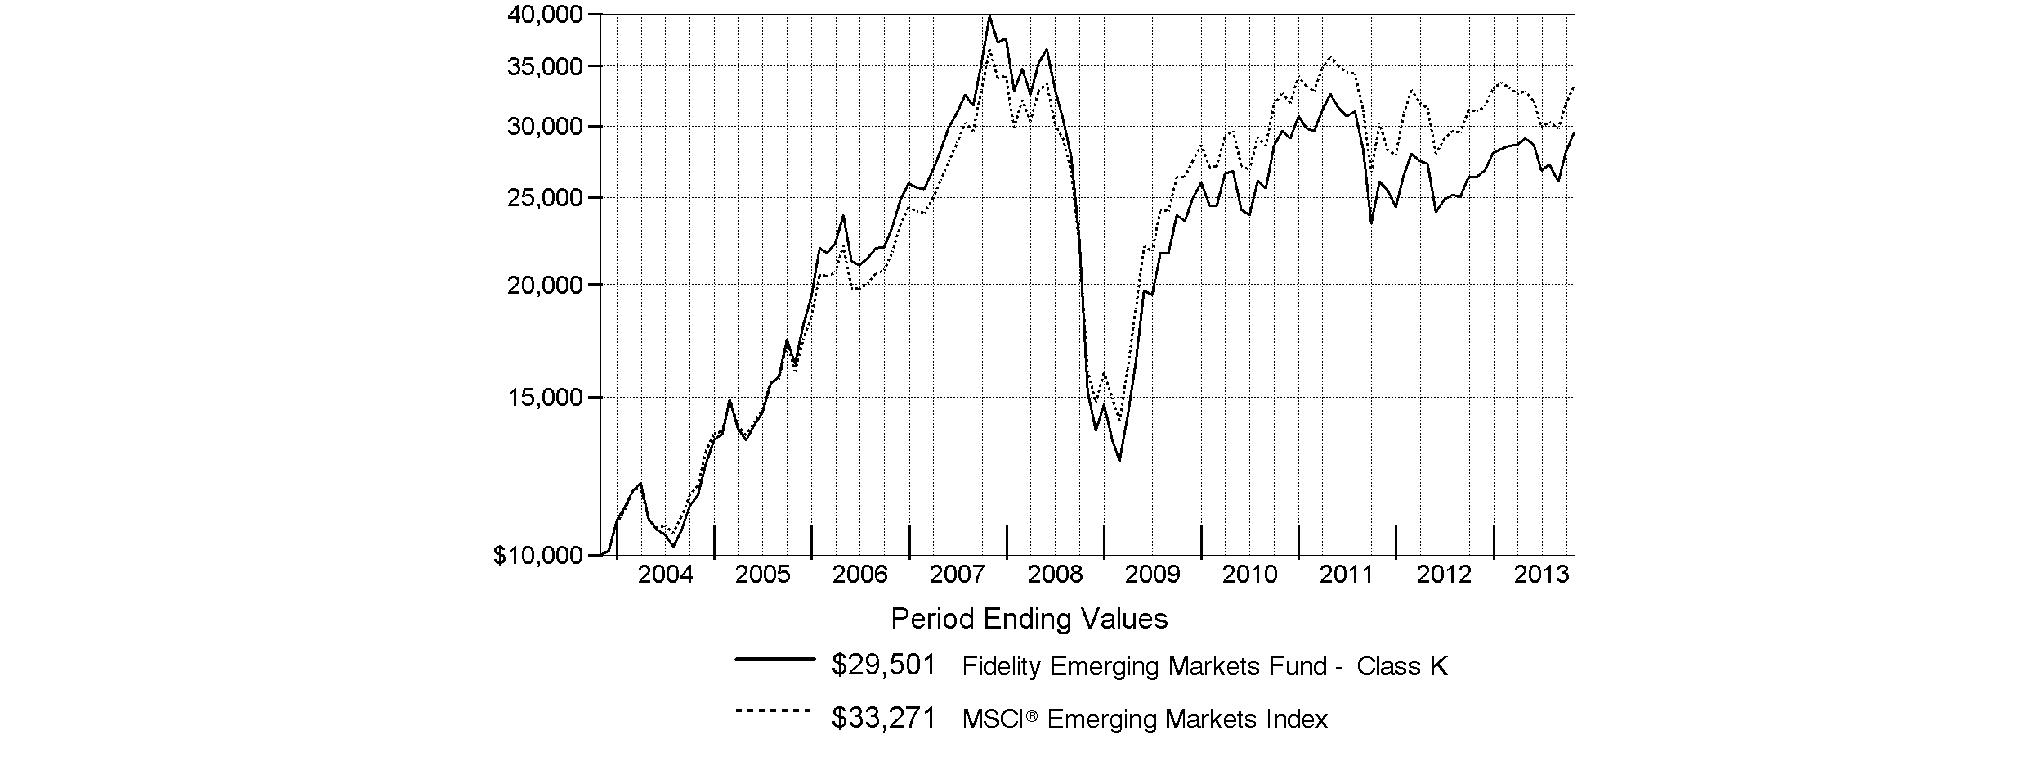
Annual Report
Market Recap: On balance, global equity markets remained upbeat for the 12-month period ending October 31, 2013. The MSCI® ACWI® (All Country World Index) Index gained 23.75% for the period, amid investor preference for higher-risk assets. The period was not without turbulence, however. In the spring and summer, central banks worldwide, especially in the U.S. and China, made clear their intentions to maintain accommodative monetary policies. That stance, combined with modest cyclical improvements around the globe and generally low valuations, underpinned the broad rally in equities. Europe (+32%) shone brightly, with most markets in the region - large and small - registering solid, index-beating gains. Another bright spot was Japan, which, despite a struggling yen and taking a second-half breather, posted a 34% result for the full year. The U.S. - by far the index's biggest constituent - also outperformed the global market with a roughly 28% advance. Meanwhile, Asia-Pacific ex Japan (+14%) lagged, hurt in part by a slowdown in Australia's mining industry as well as currency headwinds. Foreign-exchange and commodity weakness also curbed results in resource-heavy Canada and emerging markets (EM), both of which were up 7%. Country-level EM performance diverged meaningfully for the period, as evidenced by performance in Brazil (-1%), Russia (+12%), India (+1%) and China (+8%).
Comments from Sammy Simnegar, Portfolio Manager of Fidelity® Emerging Markets Fund: For the year, the fund's Class K shares returned 12.01%, handily besting the 6.90% gain of the MSCI® Emerging Markets Index. Versus the index, performance was lifted by a large overweighting in software & services, especially a non-index position in China-based Internet real estate portal SouFun Holdings. However, the largest relative contributor was Mexico-based telecommunication services provider America Movil. I'll also mention casino stocks Galaxy Entertainment Group, a Hong Kong company, and Sands China. Additionally, the fund benefited from underweighting the materials and energy sectors. Specifically, our results benefited from not owning energy provider Petroleo Brasileiro, and from selling our underweighted stake in metals miner Vale, two weak-performing, Brazil-based index components. Conversely, positioning in financials dampened performance, as did my picks in the media and automobiles/components segments. Automakers Kia Motors and Astra International - based in South Korea and Indonesia, respectively - were two of our largest detractors. Golden Eagle Retail Group, a China-based chain of department stores, also hurt. I sold a number of stocks mentioned here.
The views expressed above reflect those of the portfolio manager(s) only through the end of the period as stated on the cover of this report and do not necessarily represent the views of Fidelity or any other person in the Fidelity organization. Any such views are subject to change at any time based upon market or other conditions and Fidelity disclaims any responsibility to update such views. These views may not be relied on as investment advice and, because investment decisions for a Fidelity fund are based on numerous factors, may not be relied on as an indication of trading intent on behalf of any Fidelity fund.
Annual Report
Fidelity Emerging Markets Fund
As a shareholder of the Fund, you incur two types of costs: (1) transaction costs, including redemption fees and (2) ongoing costs, including management fees and other Fund expenses. This Example is intended to help you understand your ongoing costs (in dollars) of investing in the Fund and to compare these costs with the ongoing costs of investing in other mutual funds.
The Example is based on an investment of $1,000 invested at the beginning of the period and held for the entire period (May 1, 2013 to October 31, 2013).
Actual Expenses
The first line of the accompanying table for each class of the Fund provides information about actual account values and actual expenses. You may use the information in this line, together with the amount you invested, to estimate the expenses that you paid over the period. Simply divide your account value by $1,000.00 (for example, an $8,600 account value divided by $1,000.00 = 8.6), then multiply the result by the number in the first line for a class of the Fund under the heading entitled "Expenses Paid During Period" to estimate the expenses you paid on your account during this period. A small balance maintenance fee of $12.00 that is charged once a year may apply for certain accounts with a value of less than $2,000. This fee is not included in the table below. If it was, the estimate of expenses you paid during the period would be higher, and your ending account value lower, by this amount. In addition, the Fund, as a shareholder in the underlying Fidelity Central Funds, will indirectly bear its pro-rata share of the fees and expenses incurred by the underlying Fidelity Central Funds. These fees and expenses are not included in the Fund's annualized expense ratio used to calculate the expense estimate in the table below.
Hypothetical Example for Comparison Purposes
The second line of the accompanying table for each class of the Fund provides information about hypothetical account values and hypothetical expenses based on a Class' actual expense ratio and an assumed rate of return of 5% per year before expenses, which is not the Class' actual return. The hypothetical account values and expenses may not be used to estimate the actual ending account balance or expenses you paid for the period. You may use this information to compare the ongoing costs of investing in the Fund and other funds. To do so, compare this 5% hypothetical example with the 5% hypothetical examples that appear in the shareholder reports of the other funds. A small balance maintenance fee of $12.00 that is charged once a year may apply for certain accounts with a value of less than $2,000. This fee is not included in the table below. If it was, the estimate of expenses you paid during the period would be higher, and your ending account value lower, by this amount. In addition, the Fund, as a shareholder in the underlying Fidelity Central Funds, will indirectly bear its pro-rata share of the fees and expenses incurred by the underlying Fidelity Central Funds. These fees and expenses are not included in the Fund's annualized expense ratio used to calculate the expense estimate in the table below.
Please note that the expenses shown in the table are meant to highlight your ongoing costs only and do not reflect any transaction costs. Therefore, the second line of the table is useful in comparing ongoing costs only, and will not help you determine the relative total costs of owning different funds. In addition, if these transactional costs were included, your costs would have been higher.
| Annualized
Expense RatioB | Beginning
Account Value
May 1, 2013 | Ending
Account Value
October 31, 2013 | Expenses Paid
During Period*
May 1, 2013
to October 31, 2013 |
Emerging Markets | 1.07% | | | |
Actual | | $ 1,000.00 | $ 1,013.30 | $ 5.43 |
HypotheticalA | | $ 1,000.00 | $ 1,019.81 | $ 5.45 |
Class K | .85% | | | |
Actual | | $ 1,000.00 | $ 1,014.10 | $ 4.32 |
HypotheticalA | | $ 1,000.00 | $ 1,020.92 | $ 4.33 |
A 5% return per year before expenses
B Annualized expense ratio reflects expenses net of applicable fee waivers.
* Expenses are equal to each Class' annualized expense ratio, multiplied by the average account value over the period, multiplied by 184/365 (to reflect the one-half year period).
Annual Report
Fidelity Emerging Markets Fund
Investment Changes (Unaudited)
Geographic Diversification (% of fund's net assets) |
As of October 31, 2013 |
| Brazil | 11.7% | |
 | India | 11.4% | |
 | Korea (South) | 8.1% | |
 | Cayman Islands | 7.6% | |
 | South Africa | 6.8% | |
 | Mexico | 6.1% | |
 | Indonesia | 5.5% | |
 | United States of America* | 4.2% | |
 | Russia | 3.9% | |
| Other | 34.7% | |

* Includes Short-Term Investments and Net Other Assets (Liabilities). |
Percentages are based on country or territory of incorporation and are adjusted for the effect of futures contracts, if applicable. |
As of April 30, 2013 |
| Brazil | 11.8% | |
| India | 10.4% | |
| Korea (South) | 8.7% | |
| Indonesia | 7.6% | |
| Mexico | 7.2% | |
| South Africa | 7.0% | |
| United States of America* | 6.6% | |
| Philippines | 3.8% | |
| Cayman Islands | 3.7% | |
| Other | 33.2% | |

* Includes Short-Term Investments and Net Other Assets (Liabilities). |
Percentages are based on country or territory of incorporation and are adjusted for the effect of futures contracts, if applicable. |
Asset Allocation as of October 31, 2013 |
| % of fund's
net assets | % of fund's net assets
6 months ago |
Stocks | 99.6 | 99.2 |
Short-Term Investments and Net Other Assets (Liabilities) | 0.4 | 0.8 |
Top Ten Stocks as of October 31, 2013 |
| % of fund's
net assets | % of fund's net assets
6 months ago |
Samsung Electronics Co. Ltd. (Korea (South), Semiconductors & Semiconductor Equipment) | 4.6 | 4.9 |
Taiwan Semiconductor Manufacturing Co. Ltd. (Taiwan, Semiconductors & Semiconductor Equipment) | 2.6 | 2.8 |
Tencent Holdings Ltd. (Cayman Islands, Internet Software & Services) | 1.7 | 1.4 |
Hyundai Motor Co. (Korea (South), Automobiles) | 1.4 | 1.2 |
Itau Unibanco Holding SA sponsored ADR (Brazil, Commercial Banks) | 1.4 | 1.4 |
Sberbank (Savings Bank of the Russian Federation) (Russia, Commercial Banks) | 1.3 | 1.4 |
Naspers Ltd. Class N (South Africa, Media) | 1.2 | 1.1 |
Companhia de Bebidas das Americas (AmBev) (PN) sponsored ADR (Brazil, Beverages) | 1.1 | 1.4 |
Housing Development Finance Corp. Ltd. (India, Thrifts & Mortgage Finance) | 1.0 | 1.1 |
HDFC Bank Ltd. (India, Commercial Banks) | 0.9 | 0.9 |
| 17.2 | |
Market Sectors as of October 31, 2013 |
| % of fund's
net assets | % of fund's net assets
6 months ago |
Financials | 26.7 | 23.2 |
Consumer Discretionary | 20.6 | 18.9 |
Information Technology | 14.5 | 16.0 |
Industrials | 13.1 | 13.0 |
Consumer Staples | 11.2 | 14.2 |
Materials | 5.8 | 5.0 |
Health Care | 3.9 | 3.9 |
Energy | 2.9 | 3.0 |
Utilities | 0.5 | 0.0 |
Telecommunication Services | 0.4 | 2.0 |
Annual Report
Fidelity Emerging Markets Fund
Investments October 31, 2013
Showing Percentage of Net Assets
Common Stocks - 98.4% |
| Shares | | Value |
Australia - 0.4% |
Fortescue Metals Group Ltd. | 2,433,475 | | $ 11,982,994 |
Bailiwick of Jersey - 0.4% |
WPP PLC | 554,000 | | 11,769,758 |
Bermuda - 1.8% |
Brilliance China Automotive Holdings Ltd. | 8,460,000 | | 14,796,543 |
Cosan Ltd. Class A | 694,700 | | 10,948,472 |
Credicorp Ltd. | 125,832 | | 17,188,651 |
Jardine Matheson Holdings Ltd. | 150,400 | | 8,195,296 |
TOTAL BERMUDA | | 51,128,962 |
Brazil - 11.5% |
Anhanguera Educacional Participacoes SA | 1,932,400 | | 11,558,861 |
BB Seguridade Participacoes SA | 1,471,400 | | 16,072,296 |
BM&F Bovespa SA | 3,199,900 | | 18,040,683 |
BR Malls Participacoes SA | 1,631,700 | | 15,805,683 |
Brasil Insurance Participacoes e Administracao SA | 1,013,900 | | 9,232,908 |
BTG Pactual Participations Ltd. unit | 854,800 | | 11,435,745 |
CCR SA | 2,045,200 | | 17,008,337 |
Cetip SA - Mercados Organizado | 921,300 | | 10,215,647 |
Cielo SA | 676,280 | | 20,528,096 |
Companhia Brasileira de Distribuicao Grupo Pao de Acucar sponsored ADR (d) | 338,919 | | 17,088,296 |
Companhia de Bebidas das Americas (AmBev) (PN) sponsored ADR | 810,834 | | 30,163,025 |
Iguatemi Empresa de Shopping Centers SA | 1,134,900 | | 13,045,119 |
Itau Unibanco Holding SA sponsored ADR | 2,508,426 | | 38,654,845 |
Localiza Rent A Car SA | 809,261 | | 13,185,442 |
Multiplan Empreendimentos Imobiliarios SA | 552,567 | | 12,971,832 |
Odontoprev SA | 2,700,300 | | 11,161,851 |
Qualicorp SA (a) | 1,246,700 | | 11,675,639 |
Souza Cruz SA | 1,305,667 | | 14,122,092 |
Ultrapar Participacoes SA | 675,200 | | 17,993,679 |
Weg SA | 838,150 | | 10,887,494 |
TOTAL BRAZIL | | 320,847,570 |
British Virgin Islands - 0.4% |
Mail.Ru Group Ltd. GDR (e) | 303,200 | | 11,182,016 |
Cayman Islands - 7.6% |
51job, Inc. sponsored ADR (a) | 147,500 | | 11,298,500 |
Baidu.com, Inc. sponsored ADR (a) | 83,160 | | 13,380,444 |
Baoxin Auto Group Ltd. | 11,446,000 | | 11,795,891 |
Cimc Enric Holdings Ltd. | 9,406,000 | | 13,248,229 |
ENN Energy Holdings Ltd. | 2,382,000 | | 14,117,490 |
Eurasia Drilling Co. Ltd. GDR (Reg. S) | 284,391 | | 12,043,959 |
Greatview Aseptic Pack Co. Ltd. | 17,580,000 | | 11,065,446 |
Haitian International Holdings Ltd. | 4,654,000 | | 11,213,301 |
Hengdeli Holdings Ltd. | 38,020,000 | | 9,023,191 |
|
| Shares | | Value |
Lifestyle International Holdings Ltd. | 1,783,300 | | $ 3,887,240 |
New Oriental Education & Technology Group, Inc. sponsored ADR | 432,100 | | 11,325,341 |
Noah Holdings Ltd. sponsored ADR | 387,795 | | 7,480,566 |
Sands China Ltd. | 1,592,800 | | 11,319,912 |
Shenzhou International Group Holdings Ltd. | 3,157,000 | | 10,872,166 |
SouFun Holdings Ltd. ADR (d) | 254,313 | | 13,537,081 |
Tencent Holdings Ltd. | 855,400 | | 46,692,284 |
TOTAL CAYMAN ISLANDS | | 212,301,041 |
Chile - 0.3% |
Inversiones La Construccion SA | 577,897 | | 8,675,507 |
China - 3.2% |
China Merchants Bank Co. Ltd. (H Shares) | 9,169,959 | | 18,214,545 |
China Minsheng Banking Corp. Ltd. (H Shares) | 10,888,500 | | 12,485,330 |
China Pacific Insurance Group Co. Ltd. (H Shares) | 5,013,200 | | 18,105,198 |
China Vanke Co. Ltd. (B Shares) | 5,757,559 | | 9,750,645 |
Ping An Insurance (Group) Co. of China Ltd. (H Shares) | 2,809,000 | | 22,119,109 |
Travelsky Technology Ltd. (H Shares) | 10,892,000 | | 9,314,325 |
TOTAL CHINA | | 89,989,152 |
Colombia - 0.9% |
Cemex Latam Holdings SA | 1,216,187 | | 9,306,086 |
Grupo de Inversiones Suramerica SA | 739,510 | | 14,654,583 |
TOTAL COLOMBIA | | 23,960,669 |
Denmark - 0.3% |
Novo Nordisk A/S Series B sponsored ADR | 52,400 | | 8,733,508 |
Finland - 0.8% |
Kone Oyj (B Shares) | 111,120 | | 9,799,213 |
Nokian Tyres PLC | 219,300 | | 11,097,313 |
TOTAL FINLAND | | 20,896,526 |
France - 1.9% |
Bureau Veritas SA | 337,500 | | 10,191,272 |
Kering SA | 41,900 | | 9,520,496 |
LVMH Moet Hennessy - Louis Vuitton SA | 57,753 | | 11,119,124 |
Pernod Ricard SA | 84,016 | | 10,095,436 |
Sanofi SA sponsored ADR | 214,766 | | 11,485,686 |
TOTAL FRANCE | | 52,412,014 |
Hong Kong - 1.8% |
AIA Group Ltd. | 2,267,000 | | 11,506,056 |
China Overseas Land and Investment Ltd. | 5,803,000 | | 17,963,627 |
Far East Horizon Ltd. | 11,905,000 | | 8,706,481 |
Galaxy Entertainment Group Ltd. (a) | 1,460,000 | | 10,893,976 |
TOTAL HONG KONG | | 49,070,140 |
Common Stocks - continued |
| Shares | | Value |
India - 11.4% |
Axis Bank Ltd. | 758,960 | | $ 15,058,750 |
Bajaj Auto Ltd. | 393,876 | | 13,613,470 |
Bank of Baroda | 1,321,328 | | 13,784,918 |
Bharat Heavy Electricals Ltd. | 3,257,946 | | 7,459,694 |
CRISIL Ltd. | 364,734 | | 6,625,393 |
Exide Industries Ltd. (a) | 4,230,134 | | 8,566,804 |
Grasim Industries Ltd. sponsored GDR | 187,060 | | 8,553,318 |
HCL Technologies Ltd. | 605,779 | | 10,767,559 |
HDFC Bank Ltd. | 2,240,834 | | 24,885,100 |
Housing Development Finance Corp. Ltd. | 1,940,756 | | 26,928,525 |
ITC Ltd. | 3,755,543 | | 20,415,859 |
Larsen & Toubro Ltd. | 1,114,461 | | 17,609,222 |
Mahindra & Mahindra Ltd. | 1,097,481 | | 15,811,997 |
Maruti Suzuki India Ltd. | 337,950 | | 8,973,027 |
Mundra Port and SEZ Ltd. | 4,004,602 | | 9,455,238 |
Punjab National Bank | 273,831 | | 2,540,038 |
State Bank of India | 527,555 | | 15,381,742 |
Sun Pharmaceutical Industries Ltd. | 1,574,506 | | 15,554,967 |
Sun TV Ltd. | 1,817,236 | | 12,389,843 |
Tata Consultancy Services Ltd. | 655,801 | | 22,476,381 |
Tata Motors Ltd. | 2,731,686 | | 16,941,426 |
Titan Industries Ltd. | 3,045,964 | | 13,207,218 |
Zee Entertainment Enterprises Ltd. (a) | 2,396,184 | | 10,345,073 |
TOTAL INDIA | | 317,345,562 |
Indonesia - 5.5% |
PT ACE Hardware Indonesia Tbk | 196,126,500 | | 10,613,133 |
PT Astra International Tbk | 33,150,000 | | 19,556,118 |
PT Bank Central Asia Tbk | 18,758,000 | | 17,389,228 |
PT Bank Rakyat Indonesia Tbk | 24,433,500 | | 17,123,410 |
PT Global Mediacom Tbk | 70,247,000 | | 11,902,512 |
PT Gudang Garam Tbk | 3,611,000 | | 11,820,377 |
PT Indocement Tunggal Prakarsa Tbk | 7,022,500 | | 13,020,136 |
PT Jasa Marga Tbk | 22,097,000 | | 10,291,297 |
PT Kalbe Farma Tbk | 86,764,500 | | 10,006,055 |
PT Media Nusantara Citra Tbk | 41,852,000 | | 9,281,832 |
PT Semen Gresik (Persero) Tbk | 10,897,500 | | 13,872,549 |
PT Surya Citra Media Tbk | 42,748,000 | | 8,911,712 |
PT Tower Bersama Infrastructure Tbk | 1,777,865 | | 898,982 |
TOTAL INDONESIA | | 154,687,341 |
Ireland - 0.3% |
Dragon Oil PLC | 836,267 | | 7,897,727 |
Italy - 0.7% |
Pirelli & C SpA | 604,100 | | 8,513,850 |
Prada SpA | 1,056,300 | | 10,300,049 |
TOTAL ITALY | | 18,813,899 |
Japan - 0.4% |
Japan Tobacco, Inc. | 275,600 | | 9,972,223 |
|
| Shares | | Value |
Kenya - 0.4% |
Safaricom Ltd. | 89,086,800 | | $ 9,863,741 |
Korea (South) - 8.1% |
Hyundai Mobis | 83,335 | | 23,517,660 |
Hyundai Motor Co. | 166,768 | | 39,756,036 |
Kia Motors Corp. | 335,905 | | 19,528,616 |
LG Household & Health Care Ltd. | 25,926 | | 13,460,368 |
Samsung Electronics Co. Ltd. | 93,476 | | 129,035,006 |
TOTAL KOREA (SOUTH) | | 225,297,686 |
Luxembourg - 0.3% |
Brait SA | 1,922,900 | | 9,366,685 |
Malaysia - 0.5% |
Bumiputra-Commerce Holdings Bhd | 131,726 | | 311,736 |
Public Bank Bhd | 2,352,800 | | 13,640,501 |
TOTAL MALAYSIA | | 13,952,237 |
Mexico - 6.1% |
Alsea S.A.B. de CV | 2,574,906 | | 8,008,560 |
Banregio Grupo Financiero S.A.B. de CV | 1,717,293 | | 9,514,887 |
Coca-Cola FEMSA S.A.B. de CV Series L | 1,166,920 | | 14,222,432 |
Fomento Economico Mexicano S.A.B. de CV unit | 2,472,593 | | 23,129,777 |
Gruma S.A.B. de CV Series B (a) | 1,501,727 | | 10,292,163 |
Grupo Aeroportuario del Pacifico SA de CV Series B | 2,032,857 | | 10,576,201 |
Grupo Aeroportuario del Sureste SA de CV Series B | 990,200 | | 11,835,574 |
Grupo Financiero Banorte S.A.B. de CV Series O | 3,020,900 | | 19,282,267 |
Grupo Financiero Interacciones, SA de CV | 2,089,300 | | 9,768,135 |
Grupo Mexico SA de CV Series B | 5,968,913 | | 18,852,931 |
Grupo Televisa SA de CV | 3,637,757 | | 22,221,482 |
Mexichem S.A.B. de CV | 3,245,959 | | 13,556,290 |
TOTAL MEXICO | | 171,260,699 |
Netherlands - 0.4% |
Yandex NV (a) | 314,903 | | 11,607,325 |
Nigeria - 0.4% |
Guaranty Trust Bank PLC GDR (Reg. S) | 1,559,777 | | 12,166,261 |
Panama - 0.4% |
Copa Holdings SA Class A | 74,176 | | 11,092,279 |
Philippines - 3.1% |
Alliance Global Group, Inc. | 19,883,600 | | 12,123,866 |
DMCI Holdings, Inc. | 8,344,600 | | 10,002,320 |
LT Group, Inc. | 23,577,800 | | 9,067,755 |
Metropolitan Bank & Trust Co. | 5,704,738 | | 11,748,737 |
Security Bank Corp. | 3,987,250 | | 12,824,893 |
SM Investments Corp. | 808,502 | | 16,014,756 |
SM Prime Holdings, Inc. | 34,230,300 | | 15,192,344 |
TOTAL PHILIPPINES | | 86,974,671 |
Common Stocks - continued |
| Shares | | Value |
Russia - 3.9% |
Alrosa Co. Ltd. (a) | 8,128,200 | | $ 9,146,863 |
Magnit OJSC GDR (Reg. S) | 345,534 | | 22,200,560 |
Moscow Exchange MICEX-RTS OAO | 4,224,300 | | 8,067,737 |
Norilsk Nickel OJSC sponsored ADR | 919,287 | | 13,945,584 |
NOVATEK OAO GDR (Reg. S) | 146,700 | | 20,611,350 |
Sberbank (Savings Bank of the Russian Federation) | 11,147,000 | | 35,730,739 |
TOTAL RUSSIA | | 109,702,833 |
South Africa - 6.8% |
Aspen Pharmacare Holdings Ltd. | 541,590 | | 15,077,391 |
Barloworld Ltd. | 1,263,370 | | 11,326,440 |
Bidvest Group Ltd. | 614,500 | | 16,387,279 |
Capitec Bank Holdings Ltd. | 296,306 | | 6,316,472 |
Clicks Group Ltd. | 1,815,527 | | 11,312,286 |
Discovery Holdings Ltd. | 1,385,674 | | 11,732,765 |
Imperial Holdings Ltd. | 677,070 | | 14,386,157 |
Life Healthcare Group Holdings Ltd. | 3,611,464 | | 14,749,847 |
Mr Price Group Ltd. | 959,288 | | 15,114,490 |
Nampak Ltd. | 3,741,600 | | 12,374,162 |
Naspers Ltd. Class N | 360,312 | | 33,702,699 |
Shoprite Holdings Ltd. | 899,500 | | 16,468,993 |
Wilson Bayly Holmes-Ovcon Ltd. | 539,393 | | 9,456,135 |
TOTAL SOUTH AFRICA | | 188,405,116 |
Sweden - 0.6% |
Atlas Copco AB (A Shares) | 351,000 | | 9,739,092 |
Elekta AB (B Shares) | 512,800 | | 7,565,324 |
TOTAL SWEDEN | | 17,304,416 |
Switzerland - 1.9% |
Compagnie Financiere Richemont SA Series A | 101,698 | | 10,429,271 |
Schindler Holding AG (Reg.) | 71,090 | | 10,107,026 |
SGS SA (Reg.) | 4,100 | | 9,606,657 |
Swatch Group AG (Bearer) | 17,640 | | 11,285,634 |
Syngenta AG (Switzerland) | 25,829 | | 10,425,016 |
TOTAL SWITZERLAND | | 51,853,604 |
Taiwan - 2.6% |
Taiwan Semiconductor Manufacturing Co. Ltd. | 19,662,000 | | 72,328,946 |
Thailand - 3.1% |
Airports of Thailand PCL (For. Reg.) | 1,919,700 | | 13,075,547 |
BEC World PCL (For. Reg.) | 6,091,000 | | 11,399,221 |
Kasikornbank PCL (For. Reg.) | 3,088,500 | | 19,250,410 |
Minor International PCL (For. Reg.) | 15,052,300 | | 13,420,123 |
Siam Commercial Bank PCL (For. Reg.) | 3,278,600 | | 17,327,862 |
Thai Beverage PCL | 28,207,000 | | 12,375,475 |
TOTAL THAILAND | | 86,848,638 |
|
| Shares | | Value |
Togo - 0.3% |
Ecobank Transnational, Inc. | 109,026,650 | | $ 9,529,533 |
Turkey - 2.6% |
Anadolu Hayat Sigorta AS | 855,000 | | 2,102,968 |
Coca-Cola Icecek A/S | 425,327 | | 12,197,856 |
Enka Insaat ve Sanayi A/S | 3,537,349 | | 10,348,462 |
Koc Holding A/S | 3,164,000 | | 15,532,724 |
Tupras Turkiye Petrol Rafinelleri A/S | 593,472 | | 13,467,392 |
Turkiye Garanti Bankasi A/S | 4,592,395 | | 18,496,108 |
TOTAL TURKEY | | 72,145,510 |
United Kingdom - 3.5% |
Aberdeen Asset Management PLC | 1,421,522 | | 10,094,880 |
British American Tobacco PLC (United Kingdom) | 210,300 | | 11,602,731 |
Burberry Group PLC | 424,600 | | 10,450,336 |
Diageo PLC | 324,641 | | 10,348,737 |
InterContinental Hotel Group PLC | 338,000 | | 9,848,226 |
Intertek Group PLC | 209,818 | | 11,209,587 |
Prudential PLC | 590,180 | | 12,069,632 |
Rolls-Royce Group PLC | 549,500 | | 10,132,285 |
Standard Chartered PLC (United Kingdom) | 437,701 | | 10,523,638 |
TOTAL UNITED KINGDOM | | 96,280,052 |
United States of America - 3.8% |
BorgWarner, Inc. | 83,900 | | 8,652,607 |
Colgate-Palmolive Co. | 171,428 | | 11,096,534 |
Cummins, Inc. | 65,200 | | 8,281,704 |
FMC Corp. | 158,324 | | 11,519,654 |
Google, Inc. Class A (a) | 11,150 | | 11,490,967 |
MasterCard, Inc. Class A | 16,500 | | 11,832,150 |
Mead Johnson Nutrition Co. Class A | 130,188 | | 10,631,152 |
Philip Morris International, Inc. | 124,787 | | 11,121,017 |
Visa, Inc. Class A | 54,200 | | 10,659,514 |
Yahoo!, Inc. (a) | 320,300 | | 10,547,479 |
TOTAL UNITED STATES OF AMERICA | | 105,832,778 |
TOTAL COMMON STOCKS (Cost $2,434,587,446) |
2,743,479,619
|
Nonconvertible Preferred Stocks - 1.2% |
| | | |
Brazil - 0.2% |
Marcopolo SA (PN) | 1,875,000 | | 4,837,738 |
Colombia - 0.7% |
Banco Davivienda SA | 860,985 | | 11,292,641 |
Grupo Aval Acciones y Valores SA | 13,225,905 | | 9,190,715 |
TOTAL COLOMBIA | | 20,483,356 |
Germany - 0.3% |
Porsche Automobil Holding SE (Germany) | 92,000 | | 8,617,748 |
Nonconvertible Preferred Stocks - continued |
| Shares | | Value |
United Kingdom - 0.0% |
Rolls-Royce Group PLC Series C | 47,257,000 | | $ 75,772 |
TOTAL NONCONVERTIBLE PREFERRED STOCKS (Cost $36,206,353) |
34,014,614
|
Money Market Funds - 0.7% |
| | | |
Fidelity Cash Central Fund, 0.09% (b) | 8,417,046 | | 8,417,046 |
Fidelity Securities Lending Cash Central Fund, 0.09% (b)(c) | 10,705,636 | | 10,705,636 |
TOTAL MONEY MARKET FUNDS (Cost $19,122,682) |
19,122,682
|
TOTAL INVESTMENT PORTFOLIO - 100.3% (Cost $2,489,916,481) | | 2,796,616,915 |
NET OTHER ASSETS (LIABILITIES) - (0.3)% | | (7,910,431) |
NET ASSETS - 100% | $ 2,788,706,484 |
Legend |
(a) Non-income producing |
(b) Affiliated fund that is generally available only to investment companies and other accounts managed by Fidelity Investments. The rate quoted is the annualized seven-day yield of the fund at period end. A complete unaudited listing of the fund's holdings as of its most recent quarter end is available upon request. In addition, each Fidelity Central Fund's financial statements, which are not covered by the Fund's Report of Independent Registered Public Accounting Firm, are available on the SEC's website or upon request. |
(c) Investment made with cash collateral received from securities on loan. |
(d) Security or a portion of the security is on loan at period end. |
(e) Security exempt from registration under Rule 144A of the Securities Act of 1933. These securities may be resold in transactions exempt from registration, normally to qualified institutional buyers. At the end of the period, the value of these securities amounted to $11,182,016 or 0.4% of net assets. |
Affiliated Central Funds |
Information regarding fiscal year to date income earned by the Fund from investments in Fidelity Central Funds is as follows: |
Fund | Income earned |
Fidelity Cash Central Fund | $ 36,614 |
Fidelity Securities Lending Cash Central Fund | 270,382 |
Total | $ 306,996 |
Other Information |
Categorizations in the Schedule of Investments are based on country or territory of incorporation. |
The following is a summary of the inputs used, as of October 31, 2013, involving the Fund's assets and liabilities carried at fair value. The inputs or methodology used for valuing securities may not be an indication of the risk associated with investing in those securities. For more information on valuation inputs, and their aggregation into the levels used in the table below, please refer to the Investment Valuation section in the accompanying Notes to Financial Statements. |
Valuation Inputs at Reporting Date: |
Description | Total | Level 1 | Level 2 | Level 3 |
Investments in Securities: | | | | |
Equities: | | | | |
Consumer Discretionary | $ 578,246,742 | $ 551,457,090 | $ 26,789,652 | $ - |
Consumer Staples | 313,205,144 | 281,281,453 | 31,923,691 | - |
Energy | 82,962,579 | 82,962,579 | - | - |
Financials | 747,584,706 | 708,089,936 | 39,494,770 | - |
Health Care | 106,010,268 | 106,010,268 | - | - |
Industrials | 361,603,979 | 361,603,979 | - | - |
Information Technology | 405,379,573 | 333,050,627 | 72,328,946 | - |
Materials | 157,621,029 | 147,196,013 | 10,425,016 | - |
Telecommunication Services | 10,762,723 | 10,762,723 | - | - |
Utilities | 14,117,490 | 14,117,490 | - | - |
Money Market Funds | 19,122,682 | 19,122,682 | - | - |
Total Investments in Securities: | $ 2,796,616,915 | $ 2,615,654,840 | $ 180,962,075 | $ - |
See accompanying notes which are an integral part of the financial statements.
Annual Report
Fidelity Emerging Markets Fund
Statement of Assets and Liabilities
| October 31, 2013 |
| | |
Assets | | |
Investment in securities, at value (including securities loaned of $10,522,555) - See accompanying schedule: Unaffiliated issuers (cost $2,470,793,799) | $ 2,777,494,233 | |
Fidelity Central Funds (cost $19,122,682) | 19,122,682 | |
Total Investments (cost $2,489,916,481) | | $ 2,796,616,915 |
Cash | | 1,261,805 |
Foreign currency held at value (cost $43,538) | | 36,762 |
Receivable for investments sold | | 74,435,952 |
Receivable for fund shares sold | | 1,989,699 |
Dividends receivable | | 3,281,460 |
Distributions receivable from Fidelity Central Funds | | 5,056 |
Prepaid expenses | | 7,786 |
Other receivables | | 1,860,624 |
Total assets | | 2,879,496,059 |
| | |
Liabilities | | |
Payable for investments purchased | $ 73,356,472 | |
Payable for fund shares redeemed | 2,633,827 | |
Accrued management fee | 1,613,619 | |
Other affiliated payables | 607,666 | |
Other payables and accrued expenses | 1,872,355 | |
Collateral on securities loaned, at value | 10,705,636 | |
Total liabilities | | 90,789,575 |
| | |
Net Assets | | $ 2,788,706,484 |
Net Assets consist of: | | |
Paid in capital | | $ 2,536,971,685 |
Distributions in excess of net investment income | | (481) |
Accumulated undistributed net realized gain (loss) on investments and foreign currency transactions | | (52,900,375) |
Net unrealized appreciation (depreciation) on investments and assets and liabilities in foreign currencies | | 304,635,655 |
Net Assets | | $ 2,788,706,484 |
Statement of Assets and Liabilities - continued
| October 31, 2013 |
| | |
Emerging Markets:
Net Asset Value, offering price and redemption price per share ($2,241,337,971 ÷ 91,759,080 shares) | | $ 24.43 |
| | |
Class K:
Net Asset Value, offering price and redemption price per share ($547,368,513 ÷ 22,411,213 shares) | | $ 24.42 |
See accompanying notes which are an integral part of the financial statements.
Annual Report
Statement of Operations
| Year ended October 31, 2013 |
| | |
Investment Income | | |
Dividends | | $ 55,957,180 |
Interest | | 1,953 |
Income from Fidelity Central Funds | | 306,996 |
Income before foreign taxes withheld | | 56,266,129 |
Less foreign taxes withheld | | (4,553,424) |
Total income | | 51,712,705 |
| | |
Expenses | | |
Management fee | $ 19,368,515 | |
Transfer agent fees | 6,081,451 | |
Accounting and security lending fees | 1,197,410 | |
Custodian fees and expenses | 1,643,748 | |
Independent trustees' compensation | 16,067 | |
Registration fees | 87,343 | |
Audit | 118,841 | |
Legal | 7,433 | |
Interest | 4,456 | |
Miscellaneous | 24,853 | |
Total expenses before reductions | 28,550,117 | |
Expense reductions | (1,393,042) | 27,157,075 |
Net investment income (loss) | | 24,555,630 |
Realized and Unrealized Gain (Loss) Net realized gain (loss) on: | | |
Investment securities: | | |
Unaffiliated issuers | 276,385,126 | |
Foreign currency transactions | (1,362,506) | |
Total net realized gain (loss) | | 275,022,620 |
Change in net unrealized appreciation (depreciation) on: Investment securities (net of increase in deferred foreign taxes of $1,332,927) | 15,751,729 | |
Assets and liabilities in foreign currencies | (384,967) | |
Total change in net unrealized appreciation (depreciation) | | 15,366,762 |
Net gain (loss) | | 290,389,382 |
Net increase (decrease) in net assets resulting from operations | | $ 314,945,012 |
Statement of Changes in Net Assets
| Year ended
October 31,
2013 | Year ended
October 31,
2012 |
Increase (Decrease) in Net Assets | | |
Operations | | |
Net investment income (loss) | $ 24,555,630 | $ 47,729,874 |
Net realized gain (loss) | 275,022,620 | 21,976,330 |
Change in net unrealized appreciation (depreciation) | 15,366,762 | (38,586,040) |
Net increase (decrease) in net assets resulting from operations | 314,945,012 | 31,120,164 |
Distributions to shareholders from net investment income | (39,208,001) | (46,903,179) |
Share transactions - net increase (decrease) | (299,270,748) | (578,640,528) |
Redemption fees | 565,621 | 392,465 |
Total increase (decrease) in net assets | (22,968,116) | (594,031,078) |
| | |
Net Assets | | |
Beginning of period | 2,811,674,600 | 3,405,705,678 |
End of period (including distributions in excess of net investment income of $481 and undistributed net investment income of $34,119,316, respectively) | $ 2,788,706,484 | $ 2,811,674,600 |
See accompanying notes which are an integral part of the financial statements.
Annual Report
Financial Highlights - Emerging Markets
Years ended October 31, | 2013 | 2012 | 2011 | 2010 | 2009 |
Selected Per-Share Data | | | | | |
Net asset value, beginning of period | $ 22.15 | $ 22.23 | $ 25.72 | $ 20.68 | $ 13.71 |
Income from Investment Operations | | | | | |
Net investment income (loss) B | .20 | .33 | .35 | .23 | .17 |
Net realized and unrealized gain (loss) | 2.38 | (.11) | (3.48) | 5.05 | 7.03 |
Total from investment operations | 2.58 | .22 | (3.13) | 5.28 | 7.20 |
Distributions from net investment income | (.30) | (.30) | (.24) | (.12) | (.24) |
Distributions from net realized gain | - | - | (.13) | (.14) | - |
Total distributions | (.30) | (.30) | (.37) | (.25) G | (.24) |
Redemption fees added to paid in capital B | - F | - F | .01 | .01 | .01 |
Net asset value, end of period | $ 24.43 | $ 22.15 | $ 22.23 | $ 25.72 | $ 20.68 |
Total Return A | 11.78% | 1.03% | (12.33)% | 25.76% | 53.95% |
Ratios to Average Net Assets C, E | | | | | |
Expenses before reductions | 1.08% | 1.09% | 1.07% | 1.14% | 1.16% |
Expenses net of fee waivers, if any | 1.08% | 1.09% | 1.07% | 1.14% | 1.16% |
Expenses net of all reductions | 1.03% | 1.03% | 1.01% | 1.09% | 1.10% |
Net investment income (loss) | .85% | 1.50% | 1.38% | 1.00% | 1.09% |
Supplemental Data | | | | | |
Net assets, end of period (000 omitted) | $ 2,241,338 | $ 2,203,756 | $ 2,907,884 | $ 3,975,342 | $ 3,649,582 |
Portfolio turnover rate D | 119% | 176% | 122% | 85% | 88% |
ATotal returns would have been lower if certain expenses had not been reduced during the applicable periods shown. BCalculated based on average shares outstanding during the period. CFees and expenses of any underlying Fidelity Central Funds are not included in the Fund's expense ratio. The Fund indirectly bears its proportionate share of the expenses of any underlying Fidelity Central Funds. DAmount does not include the portfolio activity of any underlying Fidelity Central Funds. EExpense ratios reflect operating expenses of the class. Expenses before reductions do not reflect amounts reimbursed by the investment adviser or reductions from brokerage service arrangements or reductions from other expense offset arrangements and do not represent the amount paid by the class during periods when reimbursements or reductions occur. Expenses net of fee waivers reflect expenses after reimbursement by the investment adviser but prior to reductions from brokerage service arrangements or other expense offset arrangements. Expenses net of all reductions represent the net expenses paid by the class. FAmount represents less than $.01 per share. GTotal distributions of $.25 per share is comprised of distributions from net investment income of $.116 and distributions from net realized gain of $.135 per share. |
Financial Highlights - Class K
Years ended October 31, | 2013 | 2012 | 2011 | 2010 | 2009 |
Selected Per-Share Data | | | | | |
Net asset value, beginning of period | $ 22.15 | $ 22.23 | $ 25.75 | $ 20.69 | $ 13.72 |
Income from Investment Operations | | | | | |
Net investment income (loss) B | .25 | .37 | .40 | .28 | .22 |
Net realized and unrealized gain (loss) | 2.38 | (.10) | (3.48) | 5.05 | 7.02 |
Total from investment operations | 2.63 | .27 | (3.08) | 5.33 | 7.24 |
Distributions from net investment income | (.36) | (.35) | (.32) | (.15) | (.28) |
Distributions from net realized gain | - | - | (.13) | (.14) | - |
Total distributions | (.36) | (.35) | (.45) | (.28) G | (.28) |
Redemption fees added to paid in capital B | - F | - F | .01 | .01 | .01 |
Net asset value, end of period | $ 24.42 | $ 22.15 | $ 22.23 | $ 25.75 | $ 20.69 |
Total Return A | 12.01% | 1.25% | (12.17)% | 26.03% | 54.44% |
Ratios to Average Net Assets C, E | | | | | |
Expenses before reductions | .87% | .87% | .87% | .90% | .91% |
Expenses net of fee waivers, if any | .87% | .87% | .87% | .90% | .91% |
Expenses net of all reductions | .82% | .81% | .80% | .84% | .84% |
Net investment income (loss) | 1.07% | 1.72% | 1.58% | 1.24% | 1.35% |
Supplemental Data | | | | | |
Net assets, end of period (000 omitted) | $ 547,369 | $ 607,919 | $ 497,821 | $ 888,629 | $ 270,075 |
Portfolio turnover rate D | 119% | 176% | 122% | 85% | 88% |
ATotal returns would have been lower if certain expenses had not been reduced during the applicable periods shown. BCalculated based on average shares outstanding during the period. CFees and expenses of any underlying Fidelity Central Funds are not included in the Fund's expense ratio. The Fund indirectly bears its proportionate share of the expenses of any underlying Fidelity Central Funds. DAmount does not include the portfolio activity of any underlying Fidelity Central Funds. EExpense ratios reflect operating expenses of the class. Expenses before reductions do not reflect amounts reimbursed by the investment adviser or reductions from brokerage service arrangements or reductions from other expense offset arrangements and do not represent the amount paid by the class during periods when reimbursements or reductions occur. Expense ratios before reductions for start-up periods may not be representative of longer-term operating periods. Expenses net of fee waivers reflect expenses after reimbursement by the investment adviser but prior to reductions from brokerage service arrangements or other expense offset arrangements. Expenses net of all reductions represent the net expenses paid by the class. FAmount represents less than $.01 per share. GTotal distributions of $.28 per share is comprised of distributions from net investment income of $.148 and distributions from net realized gain of $.135 per share. |
See accompanying notes which are an integral part of the financial statements.
Annual Report
Notes to Financial Statements
For the period ended October 31, 2013
1. Organization.
Fidelity Emerging Markets Fund (the Fund) is a fund of Fidelity Investment Trust (the Trust) and is authorized to issue an unlimited number of shares. The Trust is registered under the Investment Company Act of 1940, as amended (the 1940 Act), as an open-end management investment company organized as a Massachusetts business trust. The Fund offers Emerging Markets and Class K shares, each of which has equal rights as to assets and voting privileges. The Fund's investments in emerging markets can be subject to social, economic, regulatory and political uncertainties and can be extremely volatile.
2. Investments in Fidelity Central Funds.
The Fund invests in Fidelity Central Funds, which are open-end investment companies generally available only to other investment companies and accounts managed by Fidelity Management & Research Company (FMR) and its affiliates. The Fund's Schedule of Investments lists each of the Fidelity Central Funds held as of period end, if any, as an investment of the Fund, but does not include the underlying holdings of each Fidelity Central Fund. As an Investing Fund, the Fund indirectly bears its proportionate share of the expenses of the underlying Fidelity Central Funds.
The Money Market Central Funds seek preservation of capital and current income and are managed by Fidelity Investments Money Management, Inc. (FIMM), an affiliate of FMR.
A complete unaudited list of holdings for each Fidelity Central Fund is available upon request or at the Securities and Exchange Commission (the SEC) website at www.sec.gov. In addition, the financial statements of the Fidelity Central Funds, which are not covered by the Fund's Report of Independent Registered Public Accounting Firm, are available on the SEC website or upon request.
3. Significant Accounting Policies.
The financial statements have been prepared in conformity with accounting principles generally accepted in the United States of America (GAAP), which require management to make certain estimates and assumptions at the date of the financial statements. Actual results could differ from those estimates. Subsequent events, if any, through the date that the financial statements were issued have been evaluated in the preparation of the financial statements. The following summarizes the significant accounting policies of the Fund:
Investment Valuation. Investments are valued as of 4:00 p.m. Eastern time on the last calendar day of the period. In accordance with valuation policies and procedures approved by the Board of Trustees (the Board), the Fund attempts to obtain prices from one or more third party pricing vendors or brokers to value its investments. When current market prices, quotations or currency exchange rates are not readily available or reliable, investments will be fair valued in good faith by the FMR Fair Value Committee (the Committee), in accordance with procedures adopted by the Board. Factors used in determining fair value vary by investment type and may include market or investment specific events. The frequency with which these procedures are used cannot be predicted and they may be utilized to a significant extent. The Committee oversees the Fund's valuation policies and procedures and is responsible for approving and reporting to the Board all fair value determinations.
The Fund categorizes the inputs to valuation techniques used to value its investments into a disclosure hierarchy consisting of three levels as shown below:
Level 1 - quoted prices in active markets for identical investments
Level 2 - other significant observable inputs (including quoted prices for similar investments, interest rates, prepayment speeds, etc.)
Level 3 - unobservable inputs (including the Fund's own assumptions based on the best information available)
Valuation techniques used to value the Fund's investments by major category are as follows:
Equity securities, including restricted securities, for which market quotations are readily available, are valued at the last reported sale price or official closing price as reported by a third party pricing vendor on the primary market or exchange on which they are traded and are categorized as Level 1 in the hierarchy. In the event there were no sales during the day or closing prices are not available, securities are valued at the last quoted bid price or may be valued using the last available price and are generally categorized as Level 2 in the hierarchy. For foreign equity securities, when market or security specific events arise, comparisons to the valuation of American Depositary Receipts (ADRs), futures contracts, Exchange-Traded Funds (ETFs) and certain indexes as well as quoted prices for similar securities may be used and would be categorized as Level 2 in the hierarchy. Utilizing these techniques may result in transfers between Level 1 and Level 2. For equity securities, including restricted securities, where observable inputs are limited, assumptions about market activity and risk are used and these securities may be categorized as Level 3 in the hierarchy.
Investments in open-end mutual funds, including the Fidelity Central Funds, are valued at their closing net asset value (NAV) each business day and are categorized as Level 1 in the hierarchy.
Annual Report
Notes to Financial Statements - continued
3. Significant Accounting Policies - continued
Investment Valuation - continued
Changes in valuation techniques may result in transfers in or out of an assigned level within the disclosure hierarchy. The aggregate value of investments by input level, as of October 31, 2013, is included at the end of the Fund's Schedule of Investments.
Foreign Currency. The Fund may use foreign currency contracts to facilitate transactions in foreign-denominated securities. Gains and losses from these transactions may arise from changes in the value of the foreign currency or if the counterparties do not perform under the contracts' terms.
Foreign-denominated assets, including investment securities, and liabilities are translated into U.S. dollars at the exchange rates at period end. Purchases and sales of investment securities, income and dividends received and expenses denominated in foreign currencies are translated into U.S. dollars at the exchange rate in effect on the transaction date.
The effects of exchange rate fluctuations on investments are included with the net realized and unrealized gain (loss) on investment securities. Other foreign currency transactions resulting in realized and unrealized gain (loss) are disclosed separately.
Investment Transactions and Income. For financial reporting purposes, the Fund's investment holdings and NAV include trades executed through the end of the last business day of the period. The NAV per share for processing shareholder transactions is calculated as of the close of business of the New York Stock Exchange (NYSE), normally 4:00 p.m. Eastern time and includes trades executed through the end of the prior business day. Gains and losses on securities sold are determined on the basis of identified cost and may include proceeds received from litigation. Dividend income is recorded on the ex-dividend date, except for certain dividends from foreign securities where the ex-dividend date may have passed, which are recorded as soon as the Fund is informed of the ex-dividend date. Non-cash dividends included in dividend income, if any, are recorded at the fair market value of the securities received. Interest income and distributions from the Fidelity Central Funds are accrued as earned. Interest income includes coupon interest and amortization of premium and accretion of discount on debt securities. Investment income is recorded net of foreign taxes withheld where recovery of such taxes is uncertain.
Class Allocations and Expenses. Investment income, realized and unrealized capital gains and losses, common expenses of the Fund, and certain fund-level expense reductions, if any, are allocated daily on a pro-rata basis to each class based on the relative net assets of each class to the total net assets of the Fund. Each class differs with respect to transfer agent fees incurred. Certain expense reductions may also differ by class. For the reporting period, the allocated portion of income and expenses to each class as a percent of its average net assets may vary due to the timing of recording these transactions in relation to fluctuating net assets of the classes. Expenses directly attributable to a fund are charged to that fund. Expenses attributable to more than one fund are allocated among the respective funds on the basis of relative net assets or other appropriate methods. Expense estimates are accrued in the period to which they relate and adjustments are made when actual amounts are known.
Income Tax Information and Distributions to Shareholders. Each year, the Fund intends to qualify as a regulated investment company under Subchapter M of the Internal Revenue Code, including distributing substantially all of its taxable income and realized gains. As a result, no provision for U.S. Federal income taxes is required. As of October 31, 2013, the Fund did not have any unrecognized tax benefits in the financial statements; nor is the Fund aware of any tax positions for which it is reasonably possible that the total amounts of unrecognized tax benefits will significantly change in the next twelve months. The Fund files a U.S. federal tax return, in addition to state and local tax returns as required. The Fund's federal income tax returns are subject to examination by the Internal Revenue Service (IRS) for a period of three fiscal years after they are filed. State and local tax returns may be subject to examination for an additional fiscal year depending on the jurisdiction. Foreign taxes are provided for based on the Fund's understanding of the tax rules and rates that exist in the foreign markets in which it invests. The Fund is subject to a tax imposed on capital gains by certain countries in which it invests. An estimated deferred tax liability for net unrealized appreciation on the applicable securities is included in Other payables and accrued expenses on the Statement of Assets & Liabilities.
Distributions are declared and recorded on the ex-dividend date. Income dividends and capital gain distributions are declared separately for each class. Income and capital gain distributions are determined in accordance with income tax regulations, which may differ from GAAP. In addition, the fund claimed a portion of the payment made to redeeming shareholders as a distribution for income tax purposes.
Capital accounts within the financial statements are adjusted for permanent book-tax differences. These adjustments have no impact on net assets or the results of operations. Temporary book-tax differences will reverse in a subsequent period.
Book-tax differences are primarily due to foreign currency transactions, passive foreign investment companies (PFIC), deferred trustees compensation, capital loss carryforwards and losses deferred due to wash sales.
The federal tax cost of investment securities and unrealized appreciation (depreciation) as of period end were as follows:
Gross unrealized appreciation | $ 371,097,001 |
Gross unrealized depreciation | (80,713,474) |
Net unrealized appreciation (depreciation) on securities and other investments | $ 290,383,527 |
| |
Tax Cost | $ 2,506,233,388 |
Annual Report
3. Significant Accounting Policies - continued
Income Tax Information and Distributions to Shareholders - continued
The tax-based components of distributable earnings as of period end were as follows:
Capital loss carryforward | $ (36,593,468) |
Net unrealized appreciation (depreciation) | $ 288,328,748 |
Capital loss carryforwards are only available to offset future capital gains of the Fund to the extent provided by regulations and may be limited. Under the Regulated Investment Company Modernization Act of 2010 (the Act), the Fund is permitted to carry forward capital losses incurred in taxable years beginning after December 22, 2010 for an unlimited period and such capital losses are required to be used prior to any losses that expire. The capital loss carryforward information presented below, including any applicable limitation, is estimated as of fiscal period end and is subject to adjustment.
Fiscal year of expiration | |
2017 | $ (36,593,468) |
The tax character of distributions paid was as follows:
| October 31, 2013 | October 31, 2012 |
Ordinary Income | $ 39,208,001 | $ 46,903,179 |
Short-Term Trading (Redemption) Fees. Shares held by investors in the Fund less than 90 days may have been subject to a redemption fee equal to 1.50% of the net asset value of shares redeemed. All redemption fees, which reduce the proceeds of the shareholder redemption, are retained by the Fund and accounted for as an addition to paid in capital.
Restricted Securities. The Fund may invest in securities that are subject to legal or contractual restrictions on resale. These securities generally may be resold in transactions exempt from registration or to the public if the securities are registered. Disposal of these securities may involve time-consuming negotiations and expense, and prompt sale at an acceptable price may be difficult. Information regarding restricted securities is included at the end of the Fund's Schedule of Investments.
4. Purchases and Sales of Investments.
Purchases and sales of securities, other than short-term securities, aggregated $3,246,813,173 and $3,529,292,093, respectively.
5. Fees and Other Transactions with Affiliates.
Management Fee. FMR and its affiliates provide the Fund with investment management related services for which the Fund pays a monthly management fee. The management fee is the sum of an individual fund fee rate that is based on an annual rate of .45% of the Fund's average net assets and an annualized group fee rate that averaged .25% during the period. The group fee rate is based upon the average net assets of all the mutual funds advised by FMR, including any mutual funds previously advised by FMR that are currently advised by Fidelity SelectCo, LLC, an affiliate of FMR. The group fee rate decreases as assets under management increase and increases as assets under management decrease. For the reporting period, the total annual management fee rate was .70% of the Fund's average net assets.
Transfer Agent Fees. Fidelity Investments Institutional Operations Company, Inc., (FIIOC), an affiliate of FMR, is the transfer, dividend disbursing and shareholder servicing agent for each class of the Fund. FIIOC receives account fees and asset-based fees that vary according to the account size and type of account of the shareholders of Emerging Markets. FIIOC receives an asset-based fee of Class K's average net assets. FIIOC pays for typesetting, printing and mailing of shareholder reports, except proxy statements.
For the period, transfer agent fees for each class were as follows:
| Amount | % of
Average
Net Assets |
Emerging Markets | $ 5,795,054 | .27 |
Class K | 286,397 | .05 |
| $ 6,081,451 | |
Annual Report
Notes to Financial Statements - continued
5. Fees and Other Transactions with Affiliates - continued
Accounting and Security Lending Fees. Fidelity Service Company, Inc. (FSC), an affiliate of FMR, maintains the Fund's accounting records. The accounting fee is based on the level of average net assets for each month. Under a separate contract, FSC administers the security lending program. The security lending fee is based on the number and duration of lending transactions.
Brokerage Commissions. The Fund placed a portion of its portfolio transactions with brokerage firms which are affiliates of the investment adviser. Brokerage commissions are included in net realized gain (loss) and change in net unrealized appreciation (depreciation) in the Statement of Operations. The commissions paid to these affiliated firms were $10,494 for the period.
Interfund Lending Program. Pursuant to an Exemptive Order issued by the SEC, the Fund, along with other registered investment companies having management contracts with FMR, may participate in an interfund lending program. This program provides an alternative credit facility allowing the funds to borrow from, or lend money to, other participating affiliated funds. At period end, there were no interfund loans outstanding. The Fund's activity in this program during the period for which loans were outstanding was as follows:
Borrower or Lender | Average Loan
Balance | Weighted Average
Interest Rate | Interest Expense |
Borrower | $ 18,337,423 | .34% | $ 4,456 |
6. Committed Line of Credit.
The Fund participates with other funds managed by FMR or an affiliate in a $4.25 billion credit facility (the "line of credit") to be utilized for temporary or emergency purposes to fund shareholder redemptions or for other short-term liquidity purposes. The Fund has agreed to pay commitment fees on its pro-rata portion of the line of credit, which amounted to $6,070 and is reflected in Miscellaneous expenses on the Statement of Operations. During the period, there were no borrowings on this line of credit.
7. Security Lending.
The Fund lends portfolio securities through a lending agent from time to time in order to earn additional income. For equity securities, a lending agent is used and may loan securities to certain qualified borrowers, including Fidelity Capital Markets (FCM), a broker-dealer affiliated with the Fund. On the settlement date of the loan, the Fund receives collateral (in the form of U.S. Treasury obligations, letters of credit and/or cash) against the loaned securities and maintains collateral in an amount not less than 100% of the market value of the loaned securities during the period of the loan. The market value of the loaned securities is determined at the close of business of the Fund and any additional required collateral is delivered to the Fund on the next business day. If the borrower defaults on its obligation to return the securities loaned because of insolvency or other reasons, the Fund may apply collateral received from the borrower against the obligation. The Fund may experience delays and costs in recovering the securities loaned. Any cash collateral received is invested the Fidelity Securities Lending Cash Central Fund. The value of loaned securities and cash collateral at period end are disclosed on the Fund's Statement of Assets and Liabilities. At period end, there were no security loans outstanding with FCM. Security lending income represents the income earned on investing cash collateral, less rebates paid to borrowers and any lending agent fees associated with the loan, plus any premium payments received for lending certain types of securities. Security lending income is presented in the Statement of Operations as a component of income from Fidelity Central Funds. Total security lending income during the period amounted to $270,382, including $840 from securities loaned to FCM.
8. Expense Reductions.
Commissions paid to certain brokers with whom FMR, or its affiliates, places trades on behalf of the Fund include an amount in addition to trade execution, which may be rebated back to the Fund to offset certain expenses. This amount totaled $1,353,191 for the period. Through arrangements with the Fund's custodian, credits realized as a result of uninvested cash balances were used to reduce the Fund's expenses. During the period, these credits reduced the Fund's custody expenses by $350.
In addition, FMR reimbursed a portion of the Fund's operating expenses during the period in the amount of $39,501.
9. Distributions to Shareholders.
Distributions to shareholders of each class were as follows:
Years ended October 31, | 2013 | 2012 |
From net investment income | | |
Emerging Markets | $ 29,610,169 | $ 38,359,433 |
Class K | 9,597,832 | 8,543,746 |
Total | $ 39,208,001 | $ 46,903,179 |
Annual Report
10. Share Transactions.
Transactions for each class of shares were as follows:
| Shares | Dollars |
Years ended October 31, | 2013 | 2012 | 2013 | 2012 |
Emerging Markets | | | | |
Shares sold | 23,439,766 | 17,560,683 | $ 534,752,122 | $ 382,055,836 |
Reinvestment of distributions | 1,145,115 | 1,697,255 | 25,804,455 | 36,745,572 |
Shares redeemed | (32,317,744) | (50,595,892) | (744,356,372) | (1,110,238,720) |
Net increase (decrease) | (7,732,863) | (31,337,954) | $ (183,799,795) | $ (691,437,312) |
Class K | | | | |
Shares sold | 6,249,509 | 14,677,576 | $ 144,545,998 | $ 321,820,048 |
Reinvestment of distributions | 426,903 | 395,361 | 9,597,831 | 8,543,746 |
Shares redeemed | (11,706,525) | (10,025,395) | (269,614,782) | (217,567,010) |
Net increase (decrease) | (5,030,113) | 5,047,542 | $ (115,470,953) | $ 112,796,784 |
11. Other.
The Fund's organizational documents provide former and current trustees and officers with a limited indemnification against liabilities arising in connection with the performance of their duties to the Fund. In the normal course of business, the Fund may also enter into contracts that provide general indemnifications. The Fund's maximum exposure under these arrangements is unknown as this would be dependent on future claims that may be made against the Fund. The risk of material loss from such claims is considered remote.
Annual Report
Report of Independent Registered Public Accounting Firm
To the Trustees of Fidelity Investment Trust and the Shareholders of Fidelity Emerging Markets Fund:
In our opinion, the accompanying statement of assets and liabilities, including the schedule of investments, and the related statements of operations and of changes in net assets and the financial highlights present fairly, in all material respects, the financial position of Fidelity Emerging Markets Fund (a fund of Fidelity Investment Trust) at October 31, 2013, the results of its operations for the year then ended, the changes in its net assets for each of the two years in the period then ended and the financial highlights for each of the five years in the period then ended, in conformity with accounting principles generally accepted in the United States of America. These financial statements and financial highlights (hereafter referred to as "financial statements") are the responsibility of the Fidelity Emerging Markets Fund's management. Our responsibility is to express an opinion on these financial statements based on our audits. We conducted our audits of these financial statements in accordance with the standards of the Public Company Accounting Oversight Board (United States). Those standards require that we plan and perform the audit to obtain reasonable assurance about whether the financial statements are free of material misstatement. An audit includes examining, on a test basis, evidence supporting the amounts and disclosures in the financial statements, assessing the accounting principles used and significant estimates made by management, and evaluating the overall financial statement presentation. We believe that our audits, which included confirmation of securities at October 31, 2013 by correspondence with the custodian and brokers, provide a reasonable basis for our opinion.
PricewaterhouseCoopers LLP
Boston, Massachusetts
December 16, 2013
Annual Report
The Trustees, Member of the Advisory Board, and executive officers of the trust and fund, as applicable, are listed below. The Board of Trustees governs the fund and is responsible for protecting the interests of shareholders. The Trustees are experienced executives who meet periodically throughout the year to oversee the fund's activities, review contractual arrangements with companies that provide services to the fund, oversee management of the risks associated with such activities and contractual arrangements, and review the fund's performance. Except for James C. Curvey, Ned C. Lautenbach, Ronald P. O'Hanley, and William S. Stavropoulos, each of the Trustees oversees 171 funds. Mr. Curvey oversees 394 funds. Mr. Lautenbach, Mr. O'Hanley, and Mr. Stavropoulos each oversees 245 funds.
The Trustees hold office without limit in time except that (a) any Trustee may resign; (b) any Trustee may be removed by written instrument, signed by at least two-thirds of the number of Trustees prior to such removal; (c) any Trustee who requests to be retired or who has become incapacitated by illness or injury may be retired by written instrument signed by a majority of the other Trustees; and (d) any Trustee may be removed at any special meeting of shareholders by a two-thirds vote of the outstanding voting securities of the trust. Each Trustee who is not an interested person of the trust and the fund (as defined in the 1940 Act) (Independent Trustee), shall retire not later than the last day of the calendar year in which his or her 75th birthday occurs. The Independent Trustees may waive this mandatory retirement age policy with respect to individual Trustees. The executive officers and Advisory Board Member hold office without limit in time, except that any officer and Advisory Board Member may resign or may be removed by a vote of a majority of the Trustees at any regular meeting or any special meeting of the Trustees. Except as indicated, each individual has held the office shown or other offices in the same company for the past five years.
Experience, Skills, Attributes, and Qualifications of the Fund's Trustees. The Governance and Nominating Committee has adopted a statement of policy that describes the experience, qualifications, attributes, and skills that are necessary and desirable for potential Independent Trustee candidates (Statement of Policy). The Board believes that each Trustee satisfied at the time he or she was initially elected or appointed a Trustee, and continues to satisfy, the standards contemplated by the Statement of Policy. The Governance and Nominating Committee also engages professional search firms to help identify potential Independent Trustee candidates who have the experience, qualifications, attributes, and skills consistent with the Statement of Policy. From time to time, additional criteria based on the composition and skills of the current Independent Trustees, as well as experience or skills that may be appropriate in light of future changes to board composition, business conditions, and regulatory or other developments, have also been considered by the professional search firms and the Governance and Nominating Committee. In addition, the Board takes into account the Trustees' commitment and participation in Board and committee meetings, as well as their leadership of standing and ad hoc committees throughout their tenure.
In determining that a particular Trustee was and continues to be qualified to serve as a Trustee, the Board has considered a variety of criteria, none of which, in isolation, was controlling. The Board believes that, collectively, the Trustees have balanced and diverse experience, qualifications, attributes, and skills, which allow the Board to operate effectively in governing the fund and protecting the interests of shareholders. Information about the specific experience, skills, attributes, and qualifications of each Trustee, which in each case led to the Board's conclusion that the Trustee should serve (or continue to serve) as a trustee of the fund, is provided below.
Board Structure and Oversight Function. James C. Curvey is an interested person (as defined in the 1940 Act) and currently serves as Chairman. The Trustees have determined that an interested Chairman is appropriate and benefits shareholders because an interested Chairman has a personal and professional stake in the quality and continuity of services provided to the fund. Independent Trustees exercise their informed business judgment to appoint an individual of their choosing to serve as Chairman, regardless of whether the Trustee happens to be independent or a member of management. The Independent Trustees have determined that they can act independently and effectively without having an Independent Trustee serve as Chairman and that a key structural component for assuring that they are in a position to do so is for the Independent Trustees to constitute a substantial majority for the Board. The Independent Trustees also regularly meet in executive session. Ned C. Lautenbach serves as Chairman of the Independent Trustees and as such (i) acts as a liaison between the Independent Trustees and management with respect to matters important to the Independent Trustees and (ii) with management prepares agendas for Board meetings.
Fidelity funds are overseen by different Boards of Trustees. The fund's Board oversees Fidelity's equity and high income funds and another Board oversees Fidelity's investment-grade bond, money market, and asset allocation funds. The asset allocation funds may invest in Fidelity funds overseen by the fund's Board. The use of separate Boards, each with its own committee structure, allows the Trustees of each group of Fidelity funds to focus on the unique issues of the funds they oversee, including common research, investment, and operational issues. On occasion, the separate Boards establish joint committees to address issues of overlapping consequences for the Fidelity funds overseen by each Board.
The Trustees operate using a system of committees to facilitate the timely and efficient consideration of all matters of importance to the Trustees, the fund, and fund shareholders and to facilitate compliance with legal and regulatory requirements and oversight of the fund's activities and associated risks. The Board, acting through its committees, has charged FMR and its affiliates with (i) identifying events or circumstances the occurrence of which could have demonstrably adverse effects on the fund's business and/or reputation; (ii) implementing processes and controls to lessen the possibility that such events or circumstances occur or to mitigate the effects of such events or circumstances if they do occur; and (iii) creating and maintaining a system designed to evaluate continuously business and market conditions in order to facilitate the identification and implementation processes described in (i) and (ii) above. Because the day-to-day operations and activities of the fund are carried out by or through FMR, its affiliates and other service providers, the fund's exposure to risks is mitigated but not eliminated by the processes overseen by the Trustees. While each of the Board's committees has responsibility for overseeing different aspects of the fund's activities, oversight is exercised primarily through the Operations, Audit, and Compliance Committees. In addition, the Independent Trustees have worked with FMR to enhance the Board's oversight of investment and financial risks, legal and regulatory risks, technology risks, and operational risks, including the development of additional risk reporting to the Board. For example, a working group comprised of Independent Trustees and FMR has worked and continues to work to review the Fidelity funds' valuation-related activities, reporting and risk management. Appropriate personnel, including but not limited to the fund's Chief Compliance Officer (CCO), FMR's internal auditor, the independent accountants, the fund's Treasurer and portfolio management personnel, make periodic reports to the Board's committees, as appropriate, including an annual review of FMR's risk management program for the Fidelity funds. The responsibilities of each standing committee, including their oversight responsibilities, are described further under "Standing Committees of the Fund's Trustees."
Annual Report
Trustees and Officers - continued
The fund's Statement of Additional Information (SAI) includes more information about the Trustees. To request a free copy, call Fidelity at 1-800-835-5092.
Interested Trustees*:
Correspondence intended for each Trustee who is an interested person may be sent to Fidelity Investments, 245 Summer Street, Boston, Massachusetts 02210.
Name, Year of Birth; Principal Occupations and Other Relevant Experience+ |
James C. Curvey (1935) |
Year of Election or Appointment: 2007 Trustee Chairman of the Board of Trustees |
| Mr. Curvey also serves as Trustee of other Fidelity funds. Mr. Curvey is a Director of Fidelity Investments Money Management, Inc. (2009-present), Director of Fidelity Research & Analysis Co. (2009-present) and Director of FMR and FMR Co., Inc. (2007-present). Mr. Curvey is also Vice Chairman (2007-present) and Director of FMR LLC. In addition, Mr. Curvey serves as an Overseer for the Boston Symphony Orchestra and a member of the Trustees of Villanova University. Previously, Mr. Curvey was the Vice Chairman (2006-2007) and Director (2000-2007) of FMR Corp. |
Ronald P. O'Hanley (1957) |
Year of Election or Appointment: 2011 Trustee |
| Mr. O'Hanley also serves as Trustee of other Fidelity funds. He is Director of Fidelity SelectCo, LLC (2013-present), FMR Co., Inc. (2010-present), Director of Fidelity Investments Money Management, Inc. (2010-present), Director of Fidelity Research & Analysis Company (2010-present), President of Fidelity Asset Management and Corporate Services and a Member of Fidelity's Executive Committee (2010-present). Previously, Mr. O'Hanley served as President and Chief Executive Officer of BNY Mellon Asset Management (2007-2010). Mr. O'Hanley also served as Vice Chairman of Bank New York Mellon Corp. and a member of that firm's Executive Committee. Prior to the 2007 merger of The Bank of New York and Mellon Financial Corporation, he was Vice Chairman of Mellon Financial Corporation and President and Chief Executive Officer of Mellon Asset Management. He joined Mellon in February 1997. Mr. O'Hanley currently serves as Chairman of the Boston Public Library Foundation Board of Directors and sits on the Board of Directors of Beth Israel Deaconess Medical Center, the Board of Trustees of the Marine Biological Laboratory and the Advisory Board of the Maxwell School of Citizenship and Public Administration at Syracuse University. Mr. O'Hanley also chairs the Council on Asset Management for the Financial Services Roundtable and is a member of the Board of Directors of Institutional Investor's U.S. Institute. |
* Trustees have been determined to be "Interested Trustees" by virtue of, among other things, their affiliation with the trust or various entities under common control with FMR.
+ The information above includes each Trustee's principal occupation during the last five years and other information relating to the experience, attributes, and skills relevant to each Trustee's qualifications to serve as a Trustee, which led to the conclusion that each Trustee should serve as a Trustee for the fund.
Annual Report
Independent Trustees:
Correspondence intended for each Independent Trustee (that is, the Trustees other than the Interested Trustees) may be sent to Fidelity Investments, P.O. Box 55235, Boston, Massachusetts 02205-5235.
Name, Year of Birth; Principal Occupations and Other Relevant Experience+ |
Dennis J. Dirks (1948) |
Year of Election or Appointment: 2005 Trustee |
| Mr. Dirks also serves as Trustee of other Fidelity funds. Prior to his retirement in May 2003, Mr. Dirks was Chief Operating Officer and a member of the Board of The Depository Trust & Clearing Corporation (DTCC). He also served as President, Chief Operating Officer, and Board member of The Depository Trust Company (DTC) and President and Board member of the National Securities Clearing Corporation (NSCC). In addition, Mr. Dirks served as Chief Executive Officer and Board member of the Government Securities Clearing Corporation, Chief Executive Officer and Board member of the Mortgage-Backed Securities Clearing Corporation, as a Trustee and a member of the Finance Committee of Manhattan College (2005-2008), and as a Trustee and a member of the Finance Committee of AHRC of Nassau County (2006-2008). Mr. Dirks is a member of the Independent Directors Council (IDC) Governing Council (2010-present) and Board of Directors for The Brookville Center for Children's Services, Inc. (2009-present). |
Alan J. Lacy (1953) |
Year of Election or Appointment: 2008 Trustee |
| Mr. Lacy also serves as Trustee of other Fidelity funds. Mr. Lacy serves as Senior Adviser (2007-present) of Oak Hill Capital Partners, L.P. (private equity). Mr. Lacy also served as Chief Executive Officer (2000-2005) and Vice Chairman (2005-2006) of Sears Holdings Corporation and Sears, Roebuck and Co. (retail). In addition, Mr. Lacy serves as a member of the Board of Directors of Dave & Buster's Entertainment, Inc. (restaurant and entertainment complexes, 2010-present), Earth Fare, Inc. (retail grocery, 2012-present), The Hillman Companies, Inc. (hardware wholesalers, 2010-present), and Bristol-Myers Squibb Company (global pharmaceuticals, 2008-present). Mr. Lacy is a member of the Board of Trustees of The National Parks Conservation Association (2006-present). Previously, Mr. Lacy served as Chairman of the Board of Trustees of the National Parks Conservation Association (2008-2011) and as a member of the Board of Directors for the Western Union Company (global money transfer, 2006-2011). |
Ned C. Lautenbach (1944) |
Year of Election or Appointment: 2000 Trustee Chairman of the Independent Trustees |
| Mr. Lautenbach also serves as Trustee of other Fidelity funds. Mr. Lautenbach currently serves as the Lead Director of the Eaton Corporation Board of Directors (diversified industrial, 1997-present). Mr. Lautenbach is Chairman of the Board of Directors of the Philharmonic Center for the Arts in Naples, Florida (2012-present) and a member of the Council on Foreign Relations (1994-present). Previously, Mr. Lautenbach was a Partner/Advisory Partner at Clayton, Dubilier & Rice, LLC (private equity investment, 1998-2010), as well as a Director of Sony Corporation (2006-2007). |
Joseph Mauriello (1944) |
Year of Election or Appointment: 2008 Trustee |
| Mr. Mauriello also serves as Trustee of other Fidelity funds. Prior to his retirement in January 2006, Mr. Mauriello served in numerous senior management positions including Deputy Chairman and Chief Operating Officer (2004-2005), and Vice Chairman of Financial Services (2002-2004) of KPMG LLP US (professional services, 1965-2005). Mr. Mauriello currently serves as a member of the Board of Directors of XL Group plc. (global insurance and re-insurance, 2006-present). Previously, Mr. Mauriello served as a Director of the Hamilton Funds of the Bank of New York (2006-2007) and of Arcadia Resources Inc. (health care services and products, 2007-2012). |
Robert W. Selander (1950) |
Year of Election or Appointment: 2011 Trustee |
| Mr. Selander also serves as Trustee of other Fidelity funds. Previously, Mr. Selander served as a Member of the Advisory Board of other Fidelity funds (2011), and Executive Vice Chairman (2010), Chief Executive Officer (2009-2010), and President and Chief Executive Officer (1997-2009) of Mastercard, Inc. |
Cornelia M. Small (1944) |
Year of Election or Appointment: 2005 Trustee |
| Ms. Small also serves as Trustee of other Fidelity funds. Ms. Small is a member of the Board of Directors (2009-present) and Chair of the Investment Committee (2010-present) of the Teagle Foundation. Ms. Small also serves on the Investment Committee of the Berkshire Taconic Community Foundation (2008-present). Previously, Ms. Small served as Chairperson (2002-2008) and a member of the Investment Committee and Chairperson (2008-2012) and a member of the Board of Trustees of Smith College. In addition, Ms. Small served as Chief Investment Officer, Director of Global Equity Investments, and a member of the Board of Directors of Scudder, Stevens & Clark and Scudder Kemper Investments. |
William S. Stavropoulos (1939) |
Year of Election or Appointment: 2001 Trustee Vice Chairman of the Independent Trustees |
| Mr. Stavropoulos also serves as Trustee of other Fidelity funds. Mr. Stavropoulos serves as President and Founder of the Michigan Baseball Foundation, the Great Lakes Loons (2007-present). Mr. Stavropoulos is Chairman Emeritus of the Board of Directors of The Dow Chemical Company, where he previously served in numerous senior management positions, including President, CEO (1995-2000; 2002-2004), Chairman of the Executive Committee (2000-2006), and as a member of the Board of Directors (1990-2006). Currently, Mr. Stavropoulos is Chairman of the Board of Directors of Univar Inc. (global distributor of commodity and specialty chemicals), a Director of Teradata Corporation (data warehousing and technology solutions), and Maersk Inc. (industrial conglomerate), and a member of the Advisory Board for Metalmark Capital LLC (private equity investment, 2005-present). Mr. Stavropoulos is an operating advisor to Clayton, Dubilier & Rice, LLC (private equity investment). In addition, Mr. Stavropoulos is a member of the University of Notre Dame Advisory Council for the College of Science, a Trustee of the Rollin L. Gerstacker Foundation, and a Director of the Naples Philharmonic Center for the Arts. Previously, Mr. Stavropoulos served as a Director of Chemical Financial Corporation (bank holding company, 1993-2012) and Tyco International, Ltd. (multinational manufacturing and services, 2007-2012). |
David M. Thomas (1949) |
Year of Election or Appointment: 2008 Trustee |
| Mr. Thomas also serves as Trustee of other Fidelity funds. Mr. Thomas serves as Non-Executive Chairman of the Board of Directors of Fortune Brands Home and Security (home and security products, 2011-present), and as a member of the Board of Directors of Interpublic Group of Companies, Inc. (marketing communication, 2004-present). Previously, Mr. Thomas served as Executive Chairman (2005-2006) and Chairman and Chief Executive Officer (2000-2005) of IMS Health, Inc. (pharmaceutical and healthcare information solutions), and a Director of Fortune Brands, Inc. (consumer products, 2000-2011). |
+ The information above includes each Trustee's principal occupation during the last five years and other information relating to the experience, attributes, and skills relevant to each Trustee's qualifications to serve as a Trustee, which led to the conclusion that each Trustee should serve as a Trustee for the fund.
Advisory Board Member and Executive Officers:
Correspondence intended for each executive officer and Peter S. Lynch may be sent to Fidelity Investments, 245 Summer Street, Boston, Massachusetts 02210. Executive officers appear below in alphabetical order.
Name, Year of Birth; Principal Occupation |
Peter S. Lynch (1944) |
Year of Election or Appointment: 2003 Member of the Advisory Board |
| Mr. Lynch also serves as Member of the Advisory Board of other Fidelity funds. Mr. Lynch is Vice Chairman and a Director of FMR and FMR Co., Inc. In addition, Mr. Lynch serves as a Trustee of Boston College and as the Chairman of the Inner-City Scholarship Fund. Previously, Mr. Lynch served on the Special Olympics International Board of Directors (1997-2006). |
Elizabeth Paige Baumann (1968) |
Year of Election or Appointment: 2012 Anti-Money Laundering (AML) Officer |
| Ms. Baumann also serves as AML Officer of other funds. She is Chief AML Officer of FMR LLC (2012-present) and is an employee of Fidelity Investments. Previously, Ms. Baumann served as Vice President and Deputy Anti-Money Laundering Officer (2007-2012). |
William C. Coffey (1969) |
Year of Election or Appointment: 2009 Assistant Secretary |
| Mr. Coffey also serves as Assistant Secretary of other funds. He is Senior Vice President and Deputy General Counsel of FMR LLC (2010-present), and is an employee of Fidelity Investments. Previously, Mr. Coffey served as Vice President and Associate General Counsel of FMR LLC (2005-2009). |
Jonathan Davis (1968) |
Year of Election or Appointment: 2010 Assistant Treasurer |
| Mr. Davis also serves as Assistant Treasurer of other funds. Mr. Davis is an employee of Fidelity Investments. Previously, Mr. Davis served as Vice President and Associate General Counsel of FMR LLC (2003-2010). |
Adrien E. Deberghes (1967) |
Year of Election or Appointment: 2008 Deputy Treasurer |
| Mr. Deberghes also serves as an officer of other funds. He is an employee of Fidelity Investments (2008-present). Prior to joining Fidelity Investments, Mr. Deberghes was Senior Vice President of Mutual Fund Administration at State Street Corporation (2007-2008), Senior Director of Mutual Fund Administration at Investors Bank & Trust (2005-2007), and Director of Finance for Dunkin' Brands (2000-2005). |
Stephanie J. Dorsey (1969) |
Year of Election or Appointment: 2010 Assistant Treasurer |
| Ms. Dorsey also serves as an officer of other funds. She is an employee of Fidelity Investments (2008-present) and has served in other fund officer roles. Prior to joining Fidelity Investments, Ms. Dorsey served as Treasurer (2004-2008) of the JPMorgan Mutual Funds and Vice President (2004-2008) of JPMorgan Chase Bank. |
Scott C. Goebel (1968) |
Year of Election or Appointment: 2008 Secretary and Chief Legal Officer (CLO) |
| Mr. Goebel serves as Secretary and CLO of other funds. Mr. Goebel also serves as Secretary of Fidelity Investments Money Management, Inc. (FIMM) (2010-present) and Fidelity Research and Analysis Company (FRAC) (2010-present); General Counsel, Secretary, and Senior Vice President of FMR (2008-present) and FMR Co., Inc. (2008-present); Chief Legal Officer of Fidelity Management & Research (Hong Kong) Limited (2008-present) and Assistant Secretary of Fidelity Management & Research (Japan) Inc. (2008-present), and Fidelity Management & Research (U.K.) Inc. (2008-present). Previously, Mr. Goebel served as Secretary and CLO of other Fidelity funds (2008-2013), Assistant Secretary of FIMM (2008-2010), FRAC (2008-2010), and certain funds (2007-2008); and as Vice President and Secretary of Fidelity Distributors Corporation (FDC) (2005-2007). Mr. Goebel has been employed by FMR LLC or an affiliate since 2001. |
Joseph A. Hanlon (1968) |
Year of Election or Appointment: 2012 Chief Compliance Officer |
| Mr. Hanlon also serves as Chief Compliance Officer of other funds. Mr. Hanlon serves as Compliance Officer of FMR, FMR Co., Inc., Fidelity Investments Money Management, Inc. (FIMM), Fidelity Research and Analysis Company (FRAC), and Fidelity Management & Research (Hong Kong) (2009-present), as Senior Vice President of the Fidelity Asset Management Division (2009-present), and is an employee of Fidelity Investments. Previously, Mr. Hanlon served as Compliance Officer of Fidelity Management & Research (Japan) Inc. (2009-2013), Strategic Advisers, Inc. (2009-2013), and Fidelity Management & Research (U.K.) Inc. (2009-2013). |
Bruce T. Herring (1965) |
Year of Election or Appointment: 2006 Vice President of certain Equity Funds |
| Mr. Herring also serves as Vice President of other funds. He serves as Chief Investment Officer of Fidelity Global Asset Allocation (GAA) (2013-present), Chief Investment Officer and Director of Fidelity Management & Research (U.K.) Inc. (2010-present), Group Chief Investment Officer of FMR, and President of Fidelity Research & Analysis Company (2010-present). Previously, Mr. Herring served as Vice President (2005-2006) and Senior Vice President (2006-2007) of Fidelity Management & Research Company, Vice President of FMR Co., Inc. (2001-2007), and as a portfolio manager for Fidelity U.S. Equity Funds. |
Brian B. Hogan (1964) |
Year of Election or Appointment: 2009 Vice President |
| Mr. Hogan also serves as Vice President of other funds. Mr. Hogan serves as President of FMR's Equity Division (2009-present). Previously, Mr. Hogan served as Senior Vice President, Equity Research of FMR (2006-2009) and as a portfolio manager. |
Chris Maher (1972) |
Year of Election or Appointment: 2013 Assistant Treasurer |
| Mr. Maher serves as Assistant Treasurer of other funds. Mr. Maher is Vice President of Valuation Oversight and is an employee of Fidelity Investments. Previously, Mr. Maher served as Vice President of Asset Management Compliance (2013), Vice President of FMR's Program Management Group (2010-2013), and Vice President of Valuation Oversight (2008-2010). |
Christine Reynolds (1958) |
Year of Election or Appointment: 2008 Chief Financial Officer |
| Ms. Reynolds also serves as Chief Financial Officer of other funds. Ms. Reynolds became President of Fidelity Pricing and Cash Management Services (FPCMS) in August 2008. Ms. Reynolds served as Chief Operating Officer of FPCMS (2007-2008). Previously, Ms. Reynolds served as President, Treasurer, and Anti-Money Laundering officer of the Fidelity funds (2004-2007). |
Kenneth B. Robins (1969) |
Year of Election or Appointment: 2008 President and Treasurer |
| Mr. Robins also serves as an officer of other funds. Mr. Robins serves as Executive Vice President of Fidelity Investments Money Management, Inc. (FIMM) (2013-present) and is an employee of Fidelity Investments (2004-present). Previously, Mr. Robins served in other fund officer roles. |
Gary W. Ryan (1958) |
Year of Election or Appointment: 2005 Assistant Treasurer |
| Mr. Ryan also serves as Assistant Treasurer of other funds. Mr. Ryan is an employee of Fidelity Investments and has served in other fund officer roles. Previously, Mr. Ryan served as Vice President of Fund Reporting in Fidelity Pricing and Cash Management Services (FPCMS) (1999-2005). |
Stephen Sadoski (1971) |
Year of Election or Appointment: 2012 Deputy Treasurer |
| Mr. Sadoski also serves as Deputy Treasurer of other funds. He is an employee of Fidelity Investments (2012-present) and has served in another fund officer role. Prior to joining Fidelity Investments, Mr. Sadoski served as an assistant chief accountant in the Division of Investment Management of the Securities and Exchange Commission (SEC) (2009-2012) and as a senior manager at Deloitte & Touche LLP (1997-2009). |
Stacie M. Smith (1974) |
Year of Election or Appointment: 2013 Deputy Treasurer |
| Ms. Smith also serves as an officer of other funds. She is an employee of Fidelity Investments (2009-present) and has served in other fund officer roles. Prior to joining Fidelity Investments, Ms. Smith served as Senior Audit Manager of Ernst & Young LLP (1996-2009). |
Renee Stagnone (1975) |
Year of Election or Appointment: 2013 Deputy Treasurer |
| Ms. Stagnone also serves as Deputy Treasurer of other funds. Ms. Stagnone is an employee of Fidelity Investments. |
Joseph F. Zambello (1957) |
Year of Election or Appointment: 2011 Deputy Treasurer |
| Mr. Zambello also serves as Deputy Treasurer of other funds. Mr. Zambello is an employee of Fidelity Investments. Previously, Mr. Zambello served as Vice President of FMR's Program Management Group (2009-2011) and Vice President of the Transfer Agent Oversight Group (2005-2009). |
Annual Report
A percentage of the dividends distributed during the fiscal year qualify for the dividends-received deduction for corporate shareholders:
| December 7, 2012 | December 27, 2012 |
Class K | 1% | 6% |
A percentage the dividends distributed during the fiscal year may be taken into account as a dividend for the purposes of the maximum rate under section 1(h)(11) of the Internal Revenue Code:
| December 7, 2012 | December 27, 2012 |
Class K | 86% | 100% |
The amounts per share which represent income derived from sources within, and taxes paid to, foreign countries or possessions of the United States are as follows:
| Pay Date | Income | Taxes |
Class K | 12/10/12 | $0.409 | $0.0615 |
| 12/28/12 | $0.011 | $0.0000 |
The fund will notify shareholders in January 2014 of amounts for use in preparing 2013 income tax returns.
Annual Report
Board Approval of Investment Advisory Contracts and Management Fees
Fidelity Emerging Markets Fund
Each year, the Board of Trustees, including the Independent Trustees (together, the Board), votes on the renewal of the management contract and sub-advisory agreements (together, the Advisory Contracts) for the fund. The Board, assisted by the advice of fund counsel and Independent Trustees' counsel, requests and considers a broad range of information relevant to the renewal of the Advisory Contracts throughout the year.
The Board meets regularly and, at each of its meetings, covers an extensive agenda of topics and materials and considers factors that are relevant to its annual consideration of the renewal of the fund's Advisory Contracts, including the services and support provided to the fund and its shareholders. The Board has established various standing committees, each composed of and chaired by Independent Trustees with varying backgrounds, to which the Board has assigned specific subject matter responsibilities in order to enhance effective decision-making by the Board. The Board, acting directly and through its Committees, requests and receives information concerning the annual consideration of the renewal of the fund's Advisory Contracts. The Board also meets as needed to consider matters specifically related to the Board's annual consideration of the renewal of Advisory Contracts. Members of the Board may also meet with trustees of other Fidelity funds through ad hoc joint committees to discuss certain matters relevant to the Fidelity funds.
At its July 2013 meeting, the Board, including the Independent Trustees, unanimously determined to renew the fund's Advisory Contracts. In reaching its determination, the Board considered all factors it believed relevant, including (i) the nature, extent, and quality of the services to be provided to the fund and its shareholders (including the investment performance of the fund); (ii) the competitiveness of the fund's management fee and total expense ratio relative to peer funds; (iii) the total costs of the services to be provided by and the profits to be realized by Fidelity from its relationship with the fund; (iv) the extent to which economies of scale exist and would be realized as the fund grows; and (v) whether fee levels reflect these economies of scale, if any, for the benefit of fund shareholders.
In considering whether to renew the Advisory Contracts for the fund, the Board reached a determination, with the assistance of fund counsel and Independent Trustees' counsel and through the exercise of its business judgment, that the renewal of the Advisory Contracts was in the best interests of the fund and its shareholders and that the compensation payable under the Advisory Contracts was fair and reasonable. The Board's decision to renew the Advisory Contracts was not based on any single factor, but rather was based on a comprehensive consideration of all the information provided to the Board at its meetings throughout the year. The Board, in reaching its determination to renew the Advisory Contracts, was aware that shareholders in the fund have a broad range of investment choices available to them, including a wide choice among mutual funds offered by Fidelity's competitors, and that the fund's shareholders, who have the opportunity to review and weigh the disclosure provided by the fund in its prospectus and other public disclosures, have chosen to invest in this fund, which is a part of the Fidelity family of funds.
Nature, Extent, and Quality of Services Provided. The Board considered the staffing within the investment adviser, Fidelity Management & Research Company (FMR), and the sub-advisers (together, the Investment Advisers) as it relates to the fund, including the backgrounds of the fund's investment personnel, and also considered the fund's investment objective, strategies, and related investment philosophy. The Independent Trustees also had discussions with senior management of Fidelity's investment operations and investment groups. The Board considered the structure of the portfolio manager compensation program and whether this structure provides appropriate incentives to act in the best interests of the fund.
Resources Dedicated to Investment Management and Support Services. The Board and the Fund Oversight and Research Committees reviewed the general qualifications and capabilities of the Investment Advisers' investment staff, including its size, education, experience, and resources, as well as the Investment Advisers' approach to recruiting, training, managing, and compensating investment personnel. The Board noted that FMR has continued to increase the resources devoted to non-U.S. offices, including expansion of Fidelity's global investment organization. The Board also noted that Fidelity's analysts have extensive resources, tools and capabilities that allow them to conduct sophisticated quantitative and fundamental analysis, as well as credit analysis of issuers, counterparties and guarantors. Further, the Board believes that Fidelity's investment professionals have sufficient access to global information and data so as to provide competitive investment results over time, and that those professionals also have access to sophisticated tools that permit them to assess portfolio construction and risk and performance attribution characteristics continuously, as well as to transmit new information and research conclusions rapidly around the world. Additionally, in its deliberations, the Board considered the Investment Advisers' trading and risk management capabilities and resources, which are an integral part of the investment management process.
Shareholder and Administrative Services. The Board considered (i) the nature, extent, quality, and cost of advisory, administrative, and shareholder services performed by the Investment Advisers and their affiliates under the Advisory Contracts and under separate agreements covering transfer agency, pricing and bookkeeping, and securities lending services for the fund; (ii) the nature and extent of the supervision of third party service providers, principally custodians and subcustodians; and (iii) the resources devoted to, and the record of compliance with, the fund's compliance policies and procedures. The Board also reviewed the allocation of fund brokerage, including allocations to brokers affiliated with the Investment Advisers, the use of brokerage commissions to pay fund expenses, and the use of "soft" commission dollars to pay for research services.
The Board noted that the growth of fund assets over time across the complex allows Fidelity to reinvest in the development of services designed to enhance the value or convenience of the Fidelity funds as investment vehicles. These services include 24-hour access to account information and market information through telephone representatives and over the Internet, investor education materials and asset allocation tools, and the expanded availability of Fidelity Investor Centers.
Annual Report
Board Approval of Investment Advisory Contracts and Management Fees - continued
Investment in a Large Fund Family. The Board considered the benefits to shareholders of investing in a Fidelity fund, including the benefits of investing in a fund that is part of a large family of funds offering a variety of investment disciplines and providing a large variety of mutual fund investor services. The Board noted that Fidelity had taken, or had made recommendations that resulted in the Fidelity funds taking, a number of actions over the previous year that benefited particular funds, including (i) continuing to dedicate additional resources to investment research and to the support of the senior management team that oversees asset management; (ii) persisting in efforts to enhance Fidelity's global research capabilities; (iii) launching new funds and making other enhancements to meet client needs for global and income-oriented solutions; (iv) continuing to launch dedicated lower cost underlying funds to meet portfolio construction needs related to expanding underlying fund options for Fidelity funds of funds, specifically for the Freedom Fund product lines; (v) rationalizing product lines and gaining increased efficiencies through the mergers of several funds into other funds; (vi) strengthening Fidelity's index fund offerings by reducing investment minimums and adopting or lowering existing expense caps for certain funds and classes; (vii) enhancing Global Asset Allocation product offerings by launching new funds and strategies, including "open architecture" target date funds that utilize affiliated and unaffiliated sub-advisers; (viii) modifying the eligibility criteria for Institutional Class shares of Advisor funds to increase their marketability to a portion of the defined contribution plan market; (ix) creating a new low-cost retirement share class for certain Advisor funds to appeal to large retirement plans; (x) transitioning the management of certain Fidelity commodity funds to Geode Capital Management LLC, a registered commodity pool operator, while retaining administrative responsibilities for the funds; (xi) reorganizing a number of funds; and (xii) taking steps toward establishing a new Fidelity adviser to manage sector-based funds and products.
Investment Performance. The Board considered whether the fund has operated in accordance with its investment objective, as well as its record of compliance with its investment restrictions and its performance history. The Board noted that there was a portfolio management change for the fund in October 2012.
The Board took into account discussions with the Investment Advisers about fund investment performance that occur at Board meetings throughout the year. In this regard the Board noted that as part of regularly scheduled fund reviews and other reports to the Board on fund performance, the Board periodically considers annualized return information for the fund, for different time periods, measured against a securities market index ("benchmark index") and a peer group of mutual funds with similar objectives ("peer group"). In its evaluation of fund investment performance, the Board gave particular attention to information indicating changes in performance of certain Fidelity funds for specific time periods and the Investment Advisers' explanations for any overperformance or underperformance.
In addition to reviewing absolute and relative fund performance, the Independent Trustees periodically consider the appropriateness of fund performance metrics in evaluating the results achieved. In general, the Independent Trustees believe that fund performance should be evaluated based on net performance (after fees and expenses) of both the highest performing and lowest performing classes, where applicable, compared to appropriate benchmark indices, over appropriate time periods which may include full market cycles, and compared to peer groups, as applicable, over the same periods, taking into account relevant factors including the following: general market conditions; issuer-specific information; tactical opportunities for investment; and fund cash flows and other factors.
The Independent Trustees recognize that shareholders evaluate performance on a net basis over their own holding periods, for which one-, three-, and five-year periods are used as a proxy. For this reason, the performance information reviewed by the Board also included net cumulative calendar year total return information for the fund and an appropriate benchmark index and peer group for the most recent one-, three-, and five-year periods, as shown below. Returns are shown compared to the 25th percentile (top of box) and 75th percentile (bottom of box) of the peer universe.
Annual Report
Fidelity Emerging Markets Fund
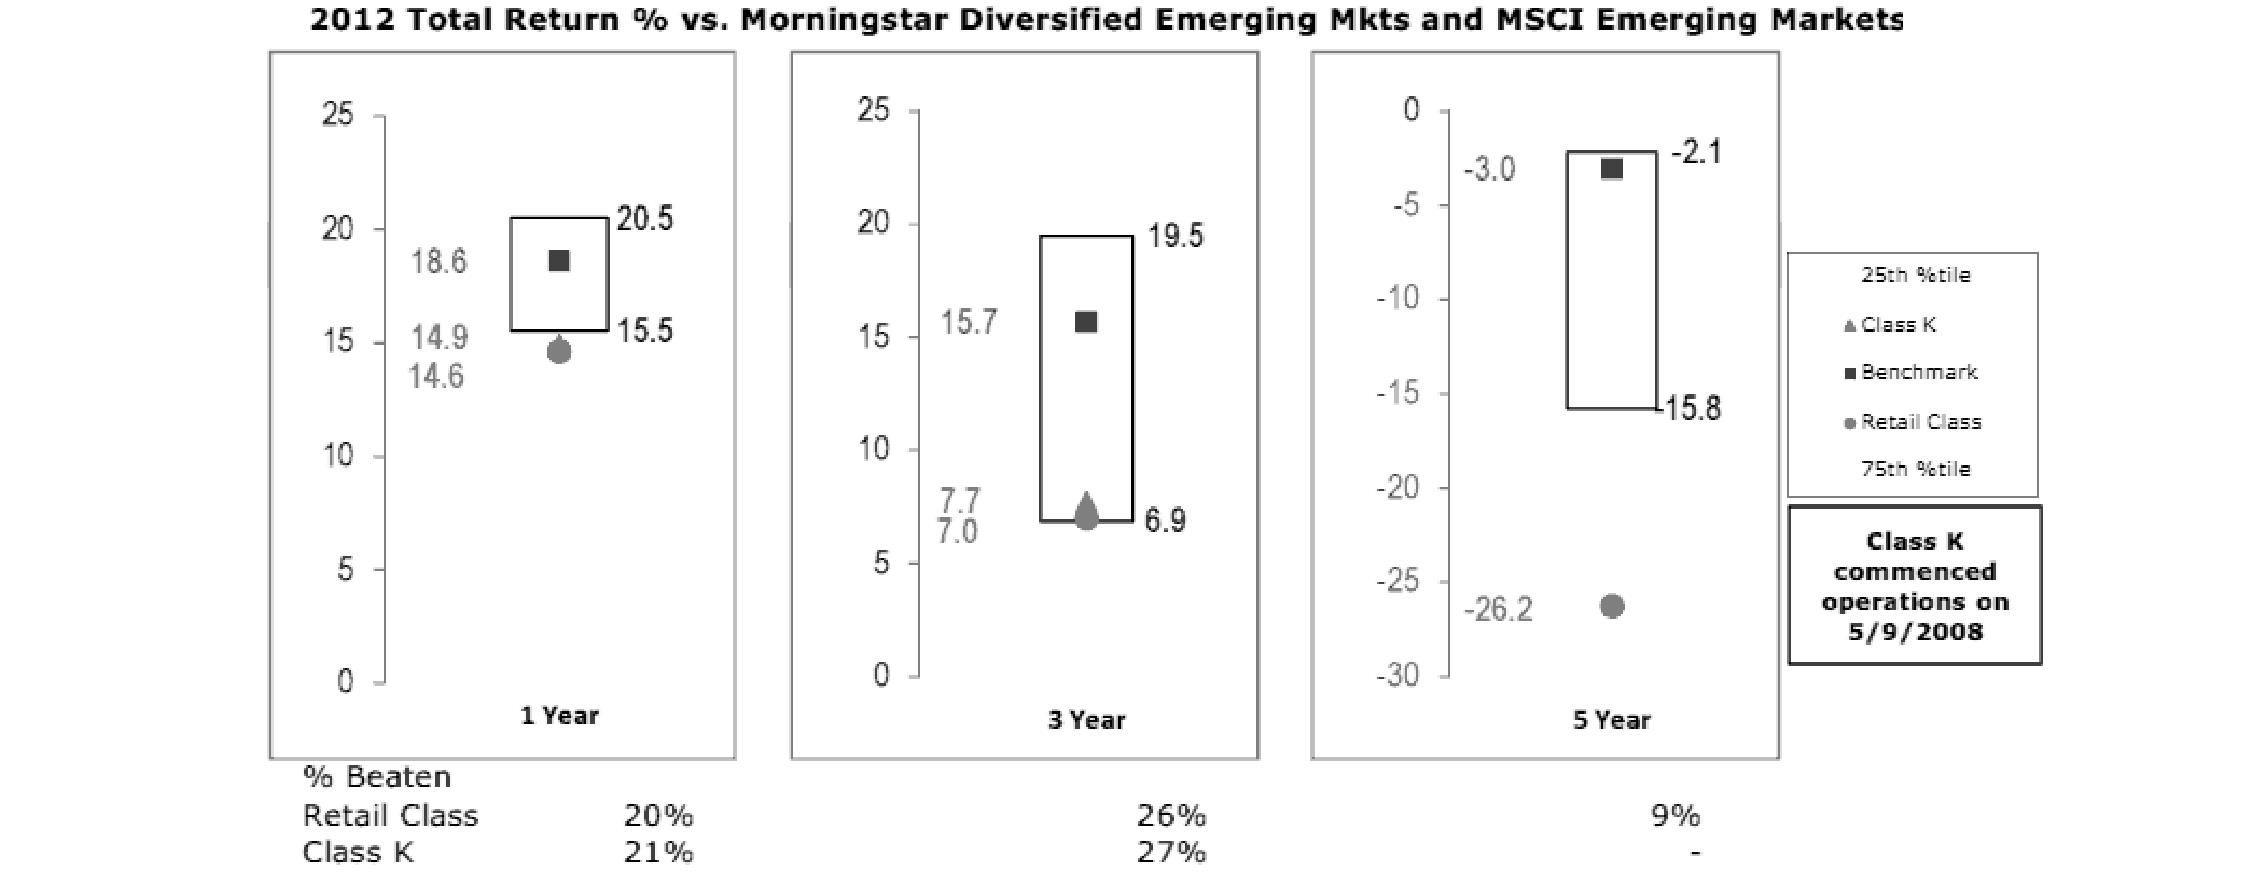
The Board has discussed with FMR the fund's underperformance (based on the December 31, 2012 data presented herein) and has engaged with FMR to consider what steps might be taken to remediate the fund's underperformance. The Board noted that the fund's performance has improved for more recent periods.
Based on its review, the Board concluded that the nature, extent, and quality of services provided to the fund under the Advisory Contracts should benefit the fund's shareholders.
Competitiveness of Management Fee and Total Expense Ratio. The Board considered the fund's management fee and total expense ratio compared to "mapped groups" of competitive funds and classes. Fidelity creates "mapped groups" by combining similar Lipper investment objective categories that have comparable management fee characteristics. Combining Lipper investment objective categories aids the Board's management fee and total expense ratio comparisons by broadening the competitive group used for comparison and by reducing the number of universes to which various Fidelity funds are compared.
Management Fee. The Board considered two proprietary management fee comparisons for the 12-month periods shown in the chart below. The group of Lipper funds used by the Board for management fee comparisons is referred to below as the "Total Mapped Group." The Total Mapped Group comparison focuses on a fund's standing in terms of gross management fees before expense reimbursements or caps relative to the total universe of funds with comparable investment mandates, regardless of whether their management fee structures also are comparable. Funds with comparable investment mandates offer exposure to similar types of securities. Funds with comparable management fee structures have similar management fee contractual arrangements (e.g., flat rate charged for advisory services, all-inclusive fee rate, etc.). "TMG %" represents the percentage of funds in the Total Mapped Group that had management fees that were lower than the fund's. For example, a TMG % of 8% means that 92% of the funds in the Total Mapped Group had higher management fees than the fund. The "Asset-Size Peer Group" (ASPG) comparison focuses on a fund's standing relative to a subset of non-Fidelity funds within the Total Mapped Group that are similar in size and management fee structure. The ASPG represents at least 15% of the funds in the Total Mapped Group with comparable asset size and management fee structures, subject to a minimum of 50 funds (or all funds in the Total Mapped Group if fewer than 50). Additional information, such as the ASPG quartile in which the fund's management fee ranked, is also included in the chart and considered by the Board.
Annual Report
Board Approval of Investment Advisory Contracts and Management Fees - continued
Fidelity Emerging Markets Fund
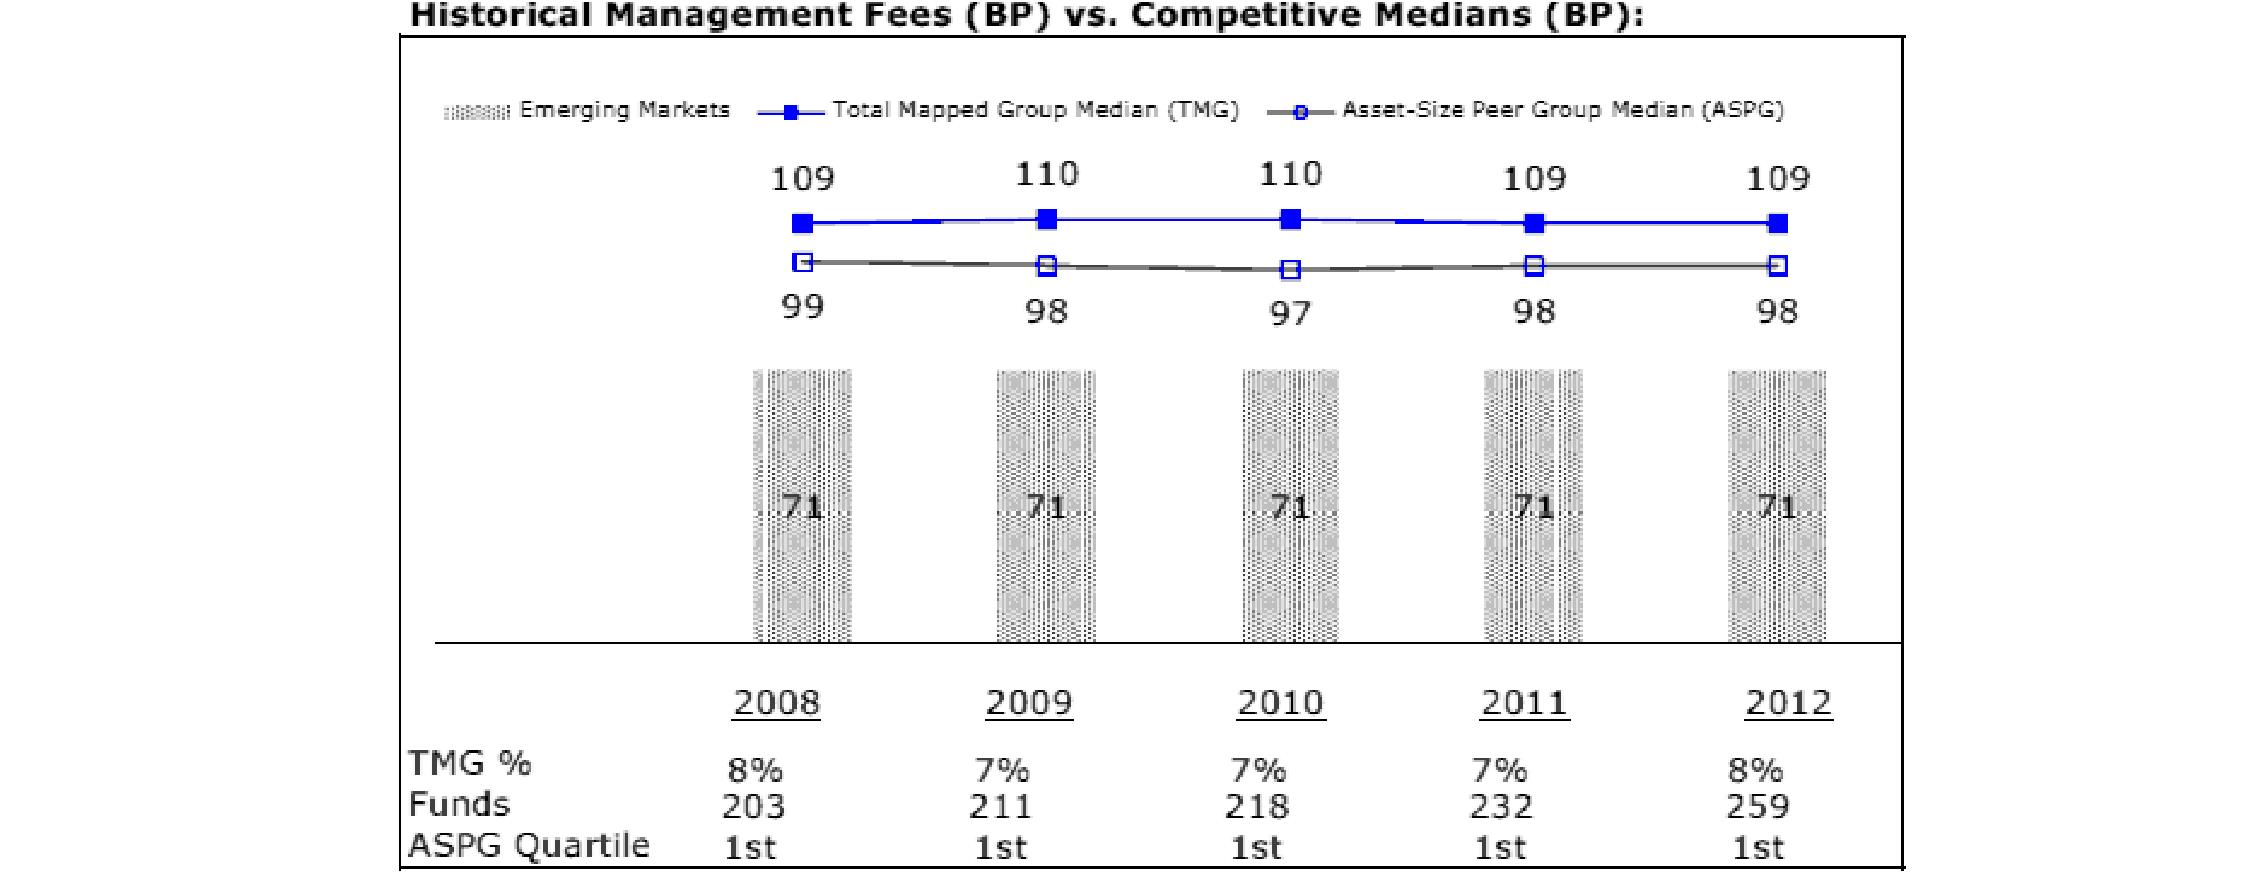
The Board noted that the fund's management fee ranked below the median of its Total Mapped Group and below the median of its ASPG for 2012.
Based on its review, the Board concluded that the fund's management fee is fair and reasonable in light of the services that the fund receives and the other factors considered.
Total Expense Ratio. In its review of each class's total expense ratio, the Board considered the fund's management fee as well as other fund or class expenses, as applicable, such as transfer agent fees, pricing and bookkeeping fees, and custodial, legal, and audit fees. The Board also noted the effects of any waivers and reimbursements on fees and expenses. As part of its review, the Board also considered the current and historical total expense ratios of each class of the fund compared to competitive fund median expenses. Each class of the fund is compared to those funds and classes in the Total Mapped Group (used by the Board for management fee comparisons) that have a similar sales load structure.
The Board noted that the total expense ratio of each class ranked below its competitive median for 2012.
Fees Charged to Other Fidelity Clients. The Board also considered Fidelity fee structures and other information with respect to clients of FMR and its affiliates, such as other mutual funds advised or subadvised by FMR or its affiliates, pension plan clients, and other institutional clients. The Board noted the findings of the 2013 ad hoc joint committee (created with the board of other Fidelity funds), which reviewed and compared Fidelity's institutional investment advisory business with its business of providing services to the Fidelity funds, including the differences in services provided, fees charged, and costs incurred, as well as competition in their respective marketplaces.
Based on its review of total expense ratios and fees charged to other Fidelity clients, the Board concluded that the total expense ratio of each class of the fund was reasonable in light of the services that the fund and its shareholders receive and the other factors considered.
Costs of the Services and Profitability. The Board considered the revenues earned and the expenses incurred by Fidelity in conducting the business of developing, marketing, distributing, managing, administering and servicing the fund and servicing the fund's shareholders. The Board also considered the level of Fidelity's profits in respect of all the Fidelity funds.
On an annual basis, FMR presents to the Board Fidelity's profitability for the fund. Fidelity calculates the profitability for each fund, as well as aggregate profitability for groups of Fidelity funds and all Fidelity funds, using a series of detailed revenue and cost allocation methodologies which originate with the books and records of Fidelity on which Fidelity's audited financial statements are based. The Audit Committee of the Board reviews any significant changes from the prior year's methodologies.
PricewaterhouseCoopers LLP (PwC), independent registered public accounting firm and auditor to Fidelity and certain Fidelity funds, has been engaged annually by the Board as part of the Board's assessment of Fidelity's profitability analysis. PwC's engagement includes the review and assessment of the methodologies used by Fidelity in determining the revenues and expenses attributable to Fidelity's mutual fund business, and completion of agreed-upon procedures surrounding the mathematical accuracy of fund profitability and its conformity to allocation methodologies. After considering PwC's reports issued under the engagement and information provided by Fidelity, the Board concluded that while other allocation methods may also be reasonable, Fidelity's profitability methodologies are reasonable in all material respects.
Annual Report
The Board also reviewed Fidelity's non-fund businesses and fall-out benefits related to the mutual fund business as well as cases where Fidelity's affiliates may benefit from or be related to the fund's business.
The Board considered the costs of the services provided by and the profits realized by Fidelity in connection with the operation of the fund and was satisfied that the profitability was not excessive in the circumstances.
Economies of Scale. The Board considered whether there have been economies of scale in respect of the management of the Fidelity funds, whether the Fidelity funds (including the fund) have appropriately benefited from any such economies of scale, and whether there is potential for realization of any further economies of scale. The Board considered the extent to which the fund will benefit from economies of scale through increased services to the fund, through waivers or reimbursements, or through fee or expense reductions. The Board also noted that in 2009, it and the board of other Fidelity funds created an ad hoc committee (the Economies of Scale Committee) to analyze whether FMR attains economies of scale in respect of the management and servicing of the Fidelity funds, whether the Fidelity funds have appropriately benefited from such economies of scale, and whether there is potential for realization of any further economies of scale.
The Board recognized that the fund's management contract incorporates a "group fee" structure, which provides for lower group fee rates as total fund assets under FMR's management increase, and for higher group fee rates as total fund assets under FMR's management decrease. FMR calculates the group fee rates based on a tiered asset "breakpoint" schedule that varies based on asset class. The Board considered that the group fee is designed to deliver the benefits of economies of scale to fund shareholders when total Fidelity fund assets increase, even if assets of any particular fund are unchanged or have declined, because some portion of Fidelity's costs are attributable to services provided to all Fidelity funds, and all funds benefit if those costs can be allocated among more assets. The Board concluded that, given the group fee structure, fund shareholders will benefit from lower management fees as assets under FMR's management increase at the fund complex level, regardless of whether Fidelity achieves any such economies of scale.
The Board concluded, taking into account the analysis of the Economies of Scale Committee, that economies of scale, if any, are being appropriately shared between fund shareholders and Fidelity.
Amendment to Description of Group Fee Rate. At its July 2013 meeting, the Board voted to approve an amendment to the fund's management contract to modify the description of the "group fee rate" effective August 1, 2013. The Board noted that under the prior description in the contract, the group fee rate was based on the average net assets of all registered investment companies with which FMR has management contracts. Under the contract's tiered asset breakpoint schedule, the group fee rate is lower as total fund assets under FMR's management increase, and higher as total fund assets under FMR's management decrease. The Board considered that the prior description would have excluded the assets of 64 Fidelity sector funds from the group fee rate calculation once Fidelity SelectCo, LLC, an affiliate of FMR, assumed management responsibilities for those funds. The Board noted that modifying the description of the group fee rate to continue to include the assets of those 64 funds for purposes of determining group fee rate breakpoints would avoid an immediate adverse impact on the group fee rate for any fund.
Additional Information Requested by the Board. In order to develop fully the factual basis for consideration of the Fidelity funds' Advisory Contracts, the Board requested and received additional information on certain topics, including: (i) fund performance trends and Fidelity's long-term strategies for certain funds; (ii) the potential to further rationalize the Fidelity fund lineup with the possibility of achieving savings for the funds and Fidelity; (iii) the methodology with respect to competitive fund data and peer group classifications; (iv) the arrangements with, and performance of, certain sub-advisers on behalf of the Fidelity funds, as well as certain proposed participating affiliate arrangements; (v) the realization of fall-out benefits in certain Fidelity business units; (vi) Fidelity's group fee structures, including the rationale for the individual fee rates of certain categories of funds and the definition of group assets; (vii) trends regarding industry use of performance fee structures and the performance adjustment methodologies applicable to the Fidelity funds; (viii) additional competitive analysis regarding the total expenses for certain classes; and (ix) fund profitability methodology, including Fidelity's cost allocation methodology, and the impact of certain factors on fund profitability results.
Based on its evaluation of all of the conclusions noted above, and after considering all factors it believed relevant, the Board ultimately concluded that the advisory fee structures are fair and reasonable, and that the fund's Advisory Contracts should be renewed.
Annual Report
Investment Adviser
Fidelity Management & Research Company
Boston, MA
Investment Sub-Advisers
FMR Co., Inc.
Fidelity Management & Research (U.K.) Inc.
FIL Investments (Japan) Limited
FIL Investment Advisors
FIL Investment Advisors
(UK) Limited
Fidelity Management & Research
(Hong Kong) Limited
Fidelity Management & Research
(Japan) Inc.
General Distributor
Fidelity Distributors Corporation
Smithfield, RI
Transfer and Service Agents
Fidelity Investments Institutional
Operations Company, Inc.
Boston, MA
Fidelity Service Company, Inc.
Boston, MA
Custodians
JPMorgan Chase Bank
New York, NY
Fidelity's International Equity Funds
Fidelity Canada Fund
Fidelity China Region Fund
Fidelity Diversified International Fund
Fidelity Emerging Asia Fund
Fidelity Emerging Europe, Middle East, Africa (EMEA) Fund
Fidelity Emerging Markets Fund
Fidelity Europe Capital Appreciation Fund
Fidelity Europe Fund
Fidelity Global Balanced Fund
Fidelity Global Commodity Stock Fund
Fidelity International Capital Appreciation Fund
Fidelity International Discovery Fund
Fidelity International Growth Fund
Fidelity International Small Cap Fund
Fidelity International Small Cap Opportunities Fund
Fidelity International Value Fund
Fidelity Japan Fund
Fidelity Japan Smaller Companies Fund
Fidelity Latin America Fund
Fidelity Nordic Fund
Fidelity Overseas Fund
Fidelity Pacific Basin Fund
Fidelity Total International Equity Fund
Fidelity Worldwide Fund
Corporate Headquarters
245 Summer St.,
Boston, MA 02210
www.fidelity.com
(Fidelity Investment logo)(registered trademark)
Corporate Headquarters
245 Summer St., Boston, MA 02210
www.fidelity.com
EMF-K-UANN-1213
1.863014.105
Fidelity Advisor®
Latin America Fund -
Class A, Class T, Class B, and Class C
Annual Report
October 31, 2013
(Fidelity Cover Art)
Class A, Class T, Class B, and Class C are
classes of Fidelity® Latin America Fund
Contents
Performance | 3 | How the fund has done over time. |
Management's Discussion of Fund Performance | 360 | The Portfolio Manager's review of fund performance and strategy. |
Shareholder Expense Example | 361 | An example of shareholder expenses. |
Investment Changes | 362 | A summary of major shifts in the fund's investments over the past six months. |
Investments | 363 | A complete list of the fund's investments with their market values. |
Financial Statements | 368 | Statements of assets and liabilities, operations, and changes in net assets, as well as financial highlights. |
Notes | 378 | Notes to the financial statements. |
Report of Independent Registered Public Accounting Firm | 384 | |
Trustees and Officers | 384 | |
Distributions | 390 | |
Board Approval of Investment Advisory Contracts and Management Fees | 391 | |
To view a fund's proxy voting guidelines and proxy voting record for the 12-month period ended June 30, visit http://www.fidelity.com/proxyvotingresults or visit the Securities and Exchange Commission's (SEC) web site at http://www.sec.gov. You may also call 1-877-208-0098 to request a free copy of the proxy voting guidelines.
Standard & Poor's, S&P and S&P 500 are registered service marks of The McGraw-Hill Companies, Inc. and have been licensed for use by Fidelity Distributors Corporation.
Other third-party marks appearing herein are the property of their respective owners.
All other marks appearing herein are registered or unregistered trademarks or service marks of FMR LLC or an affiliated company. © 2013 FMR LLC. All rights reserved.
This report and the financial statements contained herein are submitted for the general information of the shareholders of the fund. This report is not authorized for distribution to prospective investors in the fund unless preceded or accompanied by an effective prospectus.
A fund files its complete schedule of portfolio holdings with the SEC for the first and third quarters of each fiscal year on Form N-Q. Forms N-Q are available on the SEC's web site at http://www.sec.gov. A fund's Forms N-Q may be reviewed and copied at the SEC's Public Reference Room in Washington, DC. Information regarding the operation of the SEC's Public Reference Room may be obtained by calling 1-800-SEC-0330. For a complete list of a fund's portfolio holdings, view the most recent holdings listing, semiannual report, or annual report on Fidelity's web site at http://www.fidelity.com, http://www.advisor.fidelity.com, or http://www.401k.com, as applicable.
NOT FDIC INSURED • MAY LOSE VALUE • NO BANK GUARANTEE
Neither the fund nor Fidelity Distributors Corporation is a bank.
Annual Report
Performance: The Bottom Line
Average annual total return reflects the change in the value of an investment, assuming reinvestment of the class' distributions from dividend income and capital gains (the profits earned upon the sale of securities that have grown in value, if any) and assuming a constant rate of performance each year. The $10,000 table and the fund's returns do not reflect the deduction of taxes that a shareholder would pay on fund distributions or the redemption of fund shares. During periods of reimbursement by Fidelity, a fund's total return will be greater than it would be had the reimbursement not occurred. How a fund did yesterday is no guarantee of how it will do tomorrow.
Average Annual Total Returns
Periods ended October 31, 2013 | Past 1
year | Past 5
years | Past 10
years |
Class A (incl. 5.75% sales charge ) A | -14.17% | 9.54% | 14.37% |
Class T (incl. 3.50% sales charge) B | -12.35% | 9.88% | 14.55% |
Class B (incl. contingent deferred sales charge) C | -13.77% | 10.06% | 14.78% |
Class C (incl. contingent deferred sales charge) D | -10.45% | 10.33% | 14.79% |
A Class A shares bear a 0.25% 12b-1 fee. The initial offering of Class A shares took place on September 28, 2010. Returns prior to September 28, 2010 are those of Fidelity® Latin America Fund, the original class of the fund, which has no 12b-1 fee. Had Class A's 12b-1 fee been reflected, returns prior to September 28, 2010, would have been lower.
B Class T shares bear a 0.50% 12b-1 fee. The initial offering of Class T shares took place on September 28, 2010. Returns prior to September 28, 2010 are those of Fidelity® Latin America Fund, the original class of the fund, which has no 12b-1 fee. Had Class T's 12b-1 fee been reflected, returns prior to September 28, 2010, would have been lower.
C Class B shares bear a 1.00% 12b-1 fee. The initial offering of Class B shares took place on September 28, 2010. Returns prior to September 28, 2010 are those of Fidelity Latin America Fund, the original class of the fund, which has no 12b-1 fee. Had Class B's 12b-1 fee been reflected, returns prior to September 28, 2010, would have been lower. Class B shares' contingent deferred sales charges included in the past one year, past five years, and past ten years total return figures are 5%, 2%, and 0%, respectively.
D Class C shares bear a 1.00% 12b-1 fee. The initial offering of Class C shares took place on September 28, 2010. Returns prior to September 28, 2010 are those of Fidelity Latin America Fund, the original class of the fund, which has no 12b-1 fee. Had Class C's 12b-1 fee been reflected, returns prior to September 28, 2010, would have been lower. Class C shares' contingent deferred sales charges included in the past one year, past five years, and past ten years total return figures are 1%, 0%, and 0%, respectively.
$10,000 Over 10 Years
Let's say hypothetically that $10,000 was invested in Fidelity Advisor® Latin America Fund - Class A on October 31, 2003, and the current 5.75% sales charge was paid. The chart shows how the value of your investment would have changed, and also shows how the MSCI® EM (Emerging Markets) Latin America Index performed over the same period. See footnote A above for additional information regarding the performance ofClass A.
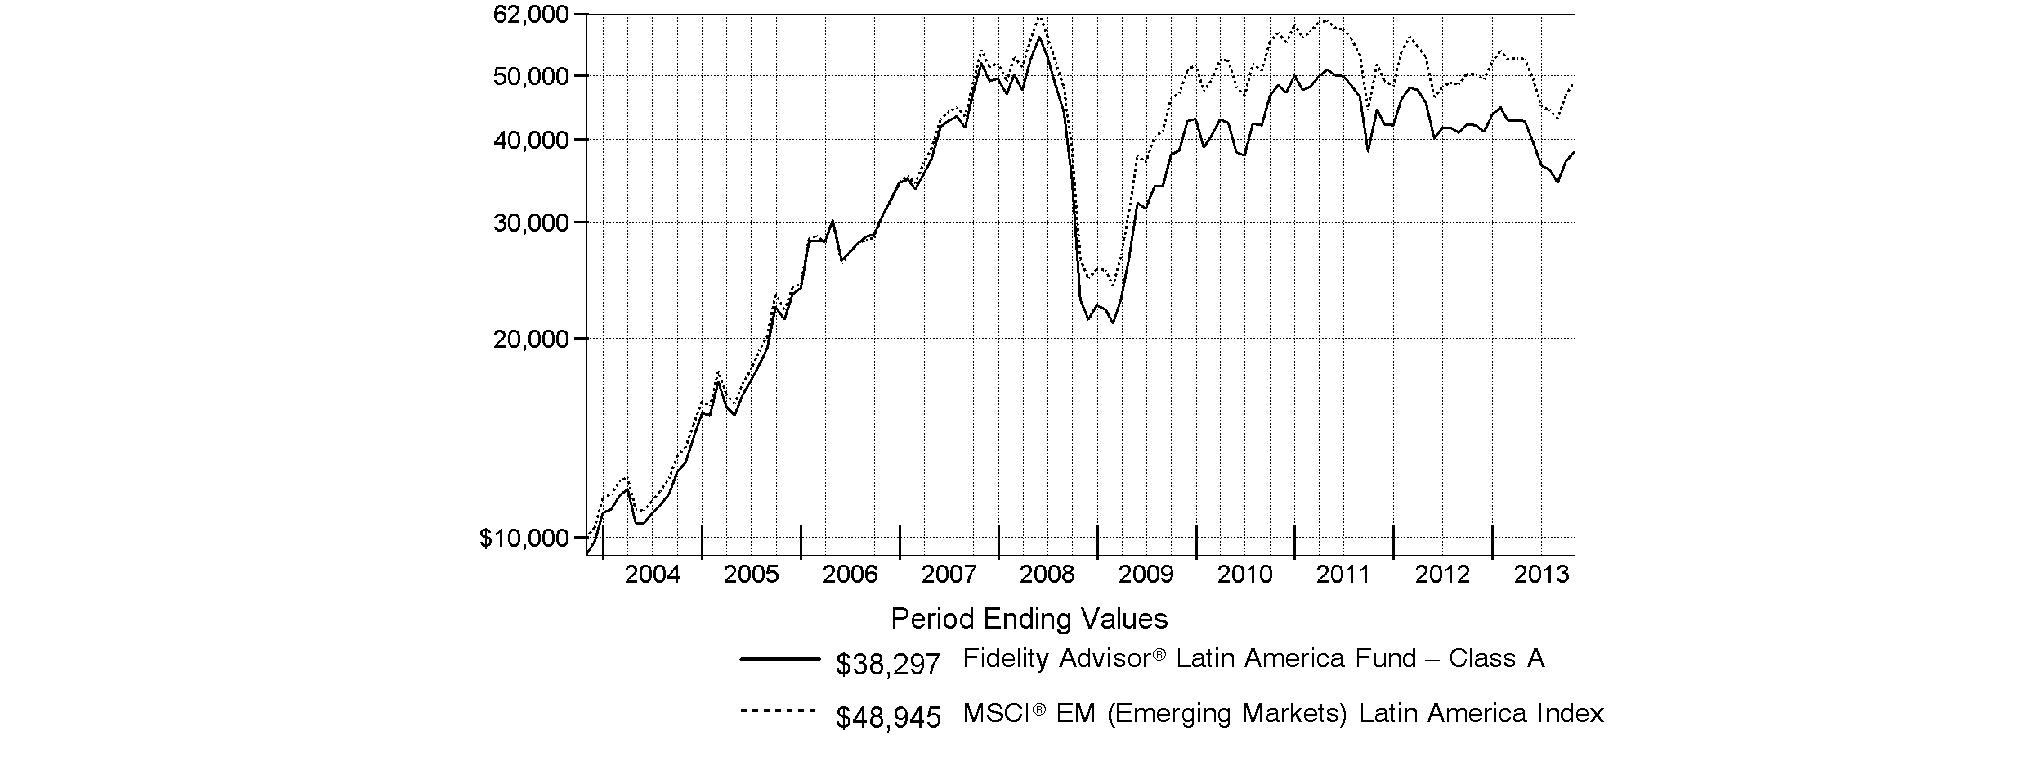
Annual Report
Management's Discussion of Fund Performance
Market Recap: On balance, global equity markets remained upbeat for the 12-month period ending October 31, 2013. The MSCI® ACWI® (All Country World Index) Index gained 23.75% for the period, amid investor preference for higher-risk assets. The period was not without turbulence, however. In the spring and summer, central banks worldwide, especially in the U.S. and China, made clear their intentions to maintain accommodative monetary policies. That stance, combined with modest cyclical improvements around the globe and generally low valuations, underpinned the broad rally in equities. Europe (+32%) shone brightly, with most markets in the region - large and small - registering solid, index-beating gains. Another bright spot was Japan, which, despite a struggling yen and taking a second-half breather, posted a 34% result for the full year. The U.S. - by far the index's biggest constituent - also outperformed the global market with a roughly 28% advance. Meanwhile, Asia-Pacific ex Japan (+14%) lagged, hurt in part by a slowdown in Australia's mining industry as well as currency headwinds. Foreign-exchange and commodity weakness also curbed results in resource-heavy Canada and emerging markets (EM), both of which were up 7%. Country-level EM performance diverged meaningfully for the period, as evidenced by performance in Brazil (-1%), Russia (+12%), India (+1%) and China (+8%).
Comments from Adam Kutas, Portfolio Manager of Fidelity Advisor® Latin America Fund: For the year, the fund's Class A, Class T, Class B and Class C shares returned -8.93%, -9.17%, -9.60% and -9.62%, respectively (excluding sales charges), underperforming the -2.43% return of the MSCI® EM (Emerging Markets) Latin America Index. Versus the index, poor security selection and an underweighting in relatively strong Brazil, the largest index component by far, hurt, as did unfavorable security selection in Mexico and Peru. At the sector level, we were held back by security selection in consumer discretionary - particularly the media industry - and materials, including an overweighting in Peruvian gold mining company Compania de Minas Buenaventura, significantly underweighting Mexican cable TV company Grupo Televisa and an overweighting in Brazilian consumer-loyalty awards program manager Multiplus. On the plus side, positioning in consumer staples helped, including the top two individual contributors during the period: an out-of-benchmark position in Mexican flour supplier Gruma and an overweighting in consumer products company Kimberly-Clark de Mexico, the latter of which was sold from the fund before period end.
Note to shareholders: Fidelity Advisor® Latin America Fund may invest up to 35% of its total assets in any industry that represents more than 20% of the Latin America market. As of October 31, 2013, the fund did not have more than 25% of its total assets in any one industry.
The views expressed above reflect those of the portfolio manager(s) only through the end of the period as stated on the cover of this report and do not necessarily represent the views of Fidelity or any other person in the Fidelity organization. Any such views are subject to change at any time based upon market or other conditions and Fidelity disclaims any responsibility to update such views. These views may not be relied on as investment advice and, because investment decisions for a Fidelity fund are based on numerous factors, may not be relied on as an indication of trading intent on behalf of any Fidelity fund.
Annual Report
Fidelity Latin America Fund
Shareholder Expense Example
As a shareholder of the Fund, you incur two types of costs: (1) transaction costs, including sales charges (loads) on purchase payments or redemption proceeds, redemption fees and (2) ongoing costs, including management fees, distribution and/or service (12b-1) fees and other Fund expenses. This Example is intended to help you understand your ongoing costs (in dollars) of investing in the Fund and to compare these costs with the ongoing costs of investing in other mutual funds.
The Example is based on an investment of $1,000 invested at the beginning of the period and held for the entire period (May 1, 2013 to October 31, 2013).
Actual Expenses
The first line of the accompanying table for each class of the Fund provides information about actual account values and actual expenses. You may use the information in this line, together with the amount you invested, to estimate the expenses that you paid over the period. Simply divide your account value by $1,000.00 (for example, an $8,600 account value divided by $1,000.00 = 8.6), then multiply the result by the number in the first line for a class of the Fund under the heading entitled "Expenses Paid During Period" to estimate the expenses you paid on your account during this period. A small balance maintenance fee of $12.00 that is charged once a year may apply for certain accounts with a value of less than $2,000. This fee is not included in the table below. If it was, the estimate of expenses you paid during the period would be higher, and your ending account value lower, by this amount. In addition, the Fund, as a shareholder in the underlying Fidelity Central Funds, will indirectly bear its pro-rata share of the fees and expenses incurred by the underlying Fidelity Central Funds. These fees and expenses are not included in the Fund's annualized expense ratio used to calculate the expense estimate in the table below.
Hypothetical Example for Comparison Purposes
The second line of the accompanying table for each class of the Fund provides information about hypothetical account values and hypothetical expenses based on a Class' actual expense ratio and an assumed rate of return of 5% per year before expenses, which is not the Class' actual return. The hypothetical account values and expenses may not be used to estimate the actual ending account balance or expenses you paid for the period. You may use this information to compare the ongoing costs of investing in the Fund and other funds. To do so, compare this 5% hypothetical example with the 5% hypothetical examples that appear in the shareholder reports of the other funds. A small balance maintenance fee of $12.00 that is charged once a year may apply for certain accounts with a value of less than $2,000. This fee is not included in the table below. If it was, the estimate of expenses you paid during the period would be higher, and your ending account value lower, by this amount. In addition, the Fund, as a shareholder in the underlying Fidelity Central Funds, will indirectly bear its pro-rata share of the fees and expenses incurred by the underlying Fidelity Central Funds. These fees and expenses are not included in the Fund's annualized expense ratio used to calculate the expense estimate in the table below.
Please note that the expenses shown in the table are meant to highlight your ongoing costs only and do not reflect any transaction costs. Therefore, the second line of the table is useful in comparing ongoing costs only, and will not help you determine the relative total costs of owning different funds. In addition, if these transactional costs were included, your costs would have been higher.
| Annualized
Expense Ratio B | Beginning
Account Value
May 1, 2013 | Ending
Account Value
October 31, 2013 | Expenses Paid
During Period*
May 1, 2013
to October 31, 2013 |
Class A | 1.36% | | | |
Actual | | $ 1,000.00 | $ 898.10 | $ 6.51 |
HypotheticalA | | $ 1,000.00 | $ 1,018.35 | $ 6.92 |
Class T | 1.63% | | | |
Actual | | $ 1,000.00 | $ 897.00 | $ 7.79 |
HypotheticalA | | $ 1,000.00 | $ 1,016.99 | $ 8.29 |
Class B | 2.10% | | | |
Actual | | $ 1,000.00 | $ 894.70 | $ 10.03 |
HypotheticalA | | $ 1,000.00 | $ 1,014.62 | $ 10.66 |
Class C | 2.11% | | | |
Actual | | $ 1,000.00 | $ 894.60 | $ 10.08 |
HypotheticalA | | $ 1,000.00 | $ 1,014.57 | $ 10.71 |
Latin America | 1.05% | | | |
Actual | | $ 1,000.00 | $ 899.50 | $ 5.03 |
HypotheticalA | | $ 1,000.00 | $ 1,019.91 | $ 5.35 |
Institutional Class | 1.03% | | | |
Actual | | $ 1,000.00 | $ 899.40 | $ 4.93 |
HypotheticalA | | $ 1,000.00 | $ 1,020.01 | $ 5.24 |
A 5% return per year before expenses
B Annualized expense ratio reflects expenses net of applicable fee waivers.
* Expenses are equal to each Class' annualized expense ratio, multiplied by the average account value over the period, multiplied by 184/365 (to reflect the one-half year period).
Annual Report
Fidelity Latin America Fund
Investment Changes (Unaudited)
Geographic Diversification (% of fund's net assets) |
As of October 31, 2013 |
| Brazil | 50.1% | |
| Mexico | 19.3% | |
| Chile | 14.0% | |
| Colombia | 8.8% | |
| Peru | 3.3% | |
| United States of America* | 2.7% | |
| Spain | 0.9% | |
| France | 0.5% | |
| Panama | 0.2% | |
| Other | 0.2% | |

* Includes Short-Term Investments and Net Other Assets (Liabilities). |
Percentages are based on country or territory of incorporation and are adjusted for the effect of futures contracts, if applicable. |
As of April 30, 2013 |
| Brazil | 46.3% | |
| Mexico | 23.8% | |
| Chile | 15.0% | |
| Colombia | 8.1% | |
| United States of America* | 4.4% | |
| Peru | 2.4% | |

* Includes Short-Term Investments and Net Other Assets (Liabilities). |
Percentages are based on country or territory of incorporation and are adjusted for the effect of futures contracts, if applicable. |
Asset Allocation as of October 31, 2013 |
| % of fund's
net assets | % of fund's net assets
6 months ago |
Stocks | 99.3 | 96.9 |
Short-Term Investments and Net Other Assets (Liabilities) | 0.7 | 3.1 |
Top Ten Stocks as of October 31, 2013 |
| % of fund's
net assets | % of fund's net assets
6 months ago |
America Movil S.A.B. de CV Series L (Mexico, Wireless Telecommunication Services) | 7.7 | 8.4 |
Petroleo Brasileiro SA - Petrobras (PN) (non-vtg.) (Brazil, Oil, Gas & Consumable Fuels) | 6.4 | 6.4 |
Itau Unibanco Holding SA (Brazil, Commercial Banks) | 5.9 | 6.4 |
Companhia de Bebidas das Americas (AmBev) (PN) sponsored ADR (Brazil, Beverages) | 4.4 | 5.1 |
Petroleo Brasileiro SA - Petrobras (Brazil, Oil, Gas & Consumable Fuels) | 3.8 | 4.0 |
Wal-Mart de Mexico SA de CV Series V (Mexico, Food & Staples Retailing) | 3.3 | 4.4 |
Fomento Economico Mexicano S.A.B. de CV sponsored ADR (Mexico, Beverages) | 3.1 | 5.1 |
CCR SA (Brazil, Transportation Infrastructure) | 2.9 | 2.9 |
Vale SA (Brazil, Steel) | 2.8 | 2.6 |
Grupo de Inversiones Suramerica SA (Colombia, Diversified Financial Services) | 2.7 | 2.2 |
| 43.0 | |
Market Sectors as of October 31, 2013 |
| % of fund's
net assets | % of fund's net assets
6 months ago |
Consumer Staples | 24.5 | 26.7 |
Financials | 22.8 | 19.5 |
Telecommunication Services | 13.5 | 15.1 |
Energy | 12.6 | 13.2 |
Materials | 10.8 | 9.5 |
Industrials | 5.4 | 6.2 |
Consumer Discretionary | 5.1 | 2.5 |
Utilities | 3.6 | 4.1 |
Information Technology | 1.0 | 0.1 |
Annual Report
Fidelity Latin America Fund
Investments October 31, 2013
Showing Percentage of Net Assets
Common Stocks - 78.0% |
| Shares | | Value |
Brazil - 30.5% |
Banco Bradesco SA | 287,900 | | $ 4,614,985 |
Banco Bradesco SA (PN) sponsored ADR | 159,621 | | 2,301,735 |
BB Seguridade Participacoes SA | 893,200 | | 9,756,541 |
Brasil Foods SA | 286,500 | | 6,727,033 |
BTG Pactual Participations Ltd. unit | 1,403,600 | | 18,777,739 |
CCR SA | 4,830,700 | | 40,173,172 |
Cielo SA | 451,800 | | 13,714,133 |
Companhia Brasileira de Distribuicao Grupo Pao de Acucar sponsored ADR (d) | 337,370 | | 17,010,195 |
Companhia de Bebidas das Americas (AmBev): | | | |
(PN) sponsored ADR | 1,674,213 | | 62,280,724 |
sponsored ADR (d) | 341,625 | | 12,691,369 |
Companhia de Saneamento Basico do Estado de Sao Paulo (SABESP) | 960,500 | | 10,178,676 |
Cyrela Brazil Realty SA | 1,736,900 | | 12,986,820 |
Embraer SA sponsored ADR | 268,634 | | 7,895,153 |
Estacio Participacoes SA | 960,700 | | 7,419,030 |
Industrias Romi SA (a) | 490,000 | | 1,367,065 |
Itau Unibanco Holding SA sponsored ADR | 1,505,938 | | 23,206,505 |
M. Dias Branco SA | 240,900 | | 11,298,707 |
Multiplus SA | 1,954,300 | | 24,208,475 |
Obrascon Huarte Lain Brasil SA | 166,500 | | 1,479,042 |
Petroleo Brasileiro SA - Petrobras: | | | |
(ON) | 1,194,028 | | 10,414,832 |
(PN) sponsored ADR (non-vtg.) | 381,913 | | 6,935,540 |
sponsored ADR | 2,512,645 | | 43,795,402 |
Souza Cruz SA | 2,756,400 | | 29,813,218 |
Telefonica Brasil SA sponsored ADR (d) | 304,542 | | 6,754,742 |
TIM Participacoes SA | 2,087,495 | | 10,641,547 |
Tractebel Energia SA | 734,175 | | 12,486,415 |
Vale SA: | | | |
(PN-A) sponsored ADR | 851,775 | | 12,469,986 |
sponsored ADR (d) | 544,093 | | 8,710,929 |
TOTAL BRAZIL | | 430,109,710 |
Canada - 0.1% |
First Majestic Silver Corp. (a) | 124,800 | | 1,412,401 |
Chile - 12.7% |
Aguas Andinas SA | 14,673,069 | | 9,939,591 |
Banco de Chile | 65,951,092 | | 10,052,634 |
Banco de Chile sponsored ADR (d) | 114,754 | | 10,537,860 |
Banco Santander Chile sponsored ADR (d) | 1,000,709 | | 24,577,413 |
CAP SA | 795,964 | | 16,531,502 |
Compania Cervecerias Unidas SA | 2,143,530 | | 28,747,785 |
Empresa Nacional de Telecomunicaciones SA (ENTEL) | 1,759,033 | | 27,069,709 |
Inversiones La Construccion SA | 731,460 | | 10,980,826 |
LATAM Airlines Group SA | 239,915 | | 3,973,995 |
|
| Shares | | Value |
LATAM Airlines Group SA sponsored ADR (d) | 804,554 | | $ 13,315,369 |
S.A.C.I. Falabella | 1,837,918 | | 18,291,278 |
Sociedad Matriz SAAM SA | 48,419,693 | | 4,867,019 |
TOTAL CHILE | | 178,884,981 |
Colombia - 8.4% |
Bolsa de Valores de Colombia | 586,230,591 | | 7,465,926 |
Cemex Latam Holdings SA | 673,456 | | 5,153,187 |
Ecopetrol SA | 9,879,672 | | 23,493,796 |
Ecopetrol SA ADR (d) | 15,216 | | 720,630 |
Empresa de Telecomunicaciones de Bogota | 40,032,169 | | 8,208,031 |
Grupo Aval Acciones y Valores SA | 4,519,256 | | 3,176,265 |
Grupo de Inversiones Suramerica SA | 1,765,744 | | 34,991,065 |
Inversiones Argos SA | 2,984,600 | | 34,603,570 |
TOTAL COLOMBIA | | 117,812,470 |
France - 0.5% |
Carrefour SA | 192,221 | | 7,041,458 |
Luxembourg - 0.1% |
Tenaris SA sponsored ADR | 28,821 | | 1,349,111 |
Mexico - 19.3% |
America Movil S.A.B. de CV: | | | |
Series L | 5,073,400 | | 5,443,875 |
Series L sponsored ADR | 4,789,573 | | 102,544,757 |
Consorcio ARA S.A.B. de CV (a) | 23,993,705 | | 9,378,827 |
Controladora Commercial Mexicana S.A.B. de CV unit (d) | 1,738,815 | | 7,128,645 |
Fomento Economico Mexicano S.A.B. de CV sponsored ADR | 465,111 | | 43,394,856 |
Gruma S.A.B. de CV Series B (a) | 3,297,556 | | 22,599,970 |
Grupo Financiero Inbursa S.A.B. de CV Series O | 4,007,300 | | 10,322,892 |
Grupo Financiero Santander Mexico S.A.B. de CV | 4,260,900 | | 11,926,503 |
Grupo Televisa SA de CV (CPO) sponsored ADR | 25,200 | | 767,088 |
Industrias Penoles SA de CV | 288,178 | | 8,431,811 |
Infraestructura Energetica Nova S.A.B. de CV | 1,223,900 | | 4,829,092 |
Wal-Mart de Mexico SA de CV Series V | 17,693,248 | | 45,998,580 |
TOTAL MEXICO | | 272,766,896 |
Panama - 0.2% |
Banco Latinoamericano de Exporaciones SA (BLADEX) Series E | 81,600 | | 2,140,368 |
Peru - 3.3% |
Alicorp SA Class C | 3,176,608 | | 9,909,001 |
Compania de Minas Buenaventura SA sponsored ADR | 2,518,892 | | 36,523,934 |
TOTAL PERU | | 46,432,935 |
Common Stocks - continued |
| Shares | | Value |
Spain - 0.9% |
Banco Bilbao Vizcaya Argentaria SA | 602,964 | | $ 7,046,799 |
Distribuidora Internacional de Alimentacion SA | 681,435 | | 6,229,495 |
TOTAL SPAIN | | 13,276,294 |
United States of America - 2.0% |
BPZ Energy, Inc. (a)(d) | 3,060,350 | | 6,151,304 |
First Cash Financial Services, Inc. (a) | 315,945 | | 19,111,513 |
Gran Tierra Energy, Inc. (Canada) (a) | 463,100 | | 3,491,072 |
TOTAL UNITED STATES OF AMERICA | | 28,753,889 |
TOTAL COMMON STOCKS (Cost $766,614,382) |
1,099,980,513
|
Nonconvertible Preferred Stocks - 21.3% |
| | | |
Brazil - 19.6% |
AES Tiete SA (PN) (non-vtg.) | 703,145 | | 6,873,884 |
Banco Bradesco SA (PN) | 1,313,817 | | 18,931,351 |
Companhia Brasileira de Distribuicao Grupo Pao de Acucar (PN) | 329,225 | | 16,327,514 |
Companhia Energetica de Sao Paulo Series B | 724,800 | | 7,580,602 |
Forjas Taurus SA | 1,566,600 | | 1,510,515 |
Itau Unibanco Holding SA | 3,919,750 | | 60,540,733 |
Itausa-Investimentos Itau SA (PN) | 6,267,322 | | 26,997,437 |
Petroleo Brasileiro SA - Petrobras (PN) (non-vtg.) | 9,159,971 | | 83,536,384 |
Telefonica Brasil SA | 1,294,413 | | 28,526,547 |
Vale SA (PN-A) | 1,777,600 | | 26,058,559 |
TOTAL BRAZIL | | 276,883,526 |
Chile - 1.3% |
Embotelladora Andina SA: | | | |
Class A | 1,321,447 | | 5,597,931 |
Class B | 2,207,046 | | 12,447,353 |
TOTAL CHILE | | 18,045,284 |
|
| Shares | | Value |
Colombia - 0.4% |
Grupo Aval Acciones y Valores SA | 2,897,449 | | $ 2,013,445 |
Grupo de Inversiones Suramerica SA | 161,141 | | 3,201,784 |
TOTAL COLOMBIA | | 5,215,229 |
TOTAL NONCONVERTIBLE PREFERRED STOCKS (Cost $219,156,548) |
300,144,039
|
Money Market Funds - 4.1% |
| | | |
Fidelity Cash Central Fund, 0.09% (b) | 8,000,693 | | 8,000,693 |
Fidelity Securities Lending Cash Central Fund, 0.09% (b)(c) | 50,236,716 | | 50,236,716 |
TOTAL MONEY MARKET FUNDS (Cost $58,237,409) |
58,237,409
|
TOTAL INVESTMENT PORTFOLIO - 103.4% (Cost $1,044,008,339) | | 1,458,361,961 |
NET OTHER ASSETS (LIABILITIES) - (3.4)% | | (47,365,173) |
NET ASSETS - 100% | $ 1,410,996,788 |
Legend |
(a) Non-income producing |
(b) Affiliated fund that is generally available only to investment companies and other accounts managed by Fidelity Investments. The rate quoted is the annualized seven-day yield of the fund at period end. A complete unaudited listing of the fund's holdings as of its most recent quarter end is available upon request. In addition, each Fidelity Central Fund's financial statements, which are not covered by the Fund's Report of Independent Registered Public Accounting Firm, are available on the SEC's website or upon request. |
(c) Investment made with cash collateral received from securities on loan. |
(d) Security or a portion of the security is on loan at period end. |
Affiliated Central Funds |
Information regarding fiscal year to date income earned by the Fund from investments in Fidelity Central Funds is as follows: |
Fund | Income earned |
Fidelity Cash Central Fund | $ 22,896 |
Fidelity Securities Lending Cash Central Fund | 501,984 |
Total | $ 524,880 |
Other Information |
Categorizations in the Schedule of Investments are based on country or territory of incorporation. |
The following is a summary of the inputs used, as of October 31, 2013, involving the Fund's assets and liabilities carried at fair value. The inputs or methodology used for valuing securities may not be an indication of the risk associated with investing in those securities. For more information on valuation inputs, and their aggregation into the levels used in the table below, please refer to the Investment Valuation section in the accompanying Notes to Financial Statements. |
Valuation Inputs at Reporting Date: |
Description | Total | Level 1 | Level 2 | Level 3 |
Investments in Securities: | | | | |
Equities: | | | | |
Consumer Discretionary | $ 73,051,518 | $ 73,051,518 | $ - | $ - |
Consumer Staples | 345,243,834 | 345,243,834 | - | - |
Energy | 179,888,071 | 179,888,071 | - | - |
Financials | 322,672,319 | 315,625,520 | 7,046,799 | - |
Industrials | 74,581,330 | 74,581,330 | - | - |
Information Technology | 13,714,133 | 13,714,133 | - | - |
Materials | 149,895,879 | 149,895,879 | - | - |
Telecommunication Services | 189,189,208 | 189,189,208 | - | - |
Utilities | 51,888,260 | 51,888,260 | - | - |
Money Market Funds | 58,237,409 | 58,237,409 | - | - |
Total Investments in Securities: | $ 1,458,361,961 | $ 1,451,315,162 | $ 7,046,799 | $ - |
See accompanying notes which are an integral part of the financial statements.
Annual Report
Fidelity Latin America Fund
Financial Statements
Statement of Assets and Liabilities
| October 31, 2013 |
| | |
Assets | | |
Investment in securities, at value (including securities loaned of $48,248,176) - See accompanying schedule: Unaffiliated issuers (cost $985,770,930) | $ 1,400,124,552 | |
Fidelity Central Funds (cost $58,237,409) | 58,237,409 | |
Total Investments (cost $1,044,008,339) | | $ 1,458,361,961 |
Foreign currency held at value (cost $2,216,036) | | 2,216,036 |
Receivable for investments sold | | 1,609 |
Receivable for fund shares sold | | 544,628 |
Dividends receivable | | 4,543,889 |
Distributions receivable from Fidelity Central Funds | | 32,242 |
Prepaid expenses | | 2,318 |
Other receivables | | 8,707 |
Total assets | | 1,465,711,390 |
| | |
Liabilities | | |
Payable for investments purchased | $ 633,430 | |
Payable for fund shares redeemed | 2,161,625 | |
Accrued management fee | 830,522 | |
Distribution and service plan fees payable | 32,172 | |
Other affiliated payables | 344,982 | |
Other payables and accrued expenses | 475,155 | |
Collateral on securities loaned, at value | 50,236,716 | |
Total liabilities | | 54,714,602 |
| | |
Net Assets | | $ 1,410,996,788 |
Net Assets consist of: | | |
Paid in capital | | $ 769,670,329 |
Undistributed net investment income | | 18,836,319 |
Accumulated undistributed net realized gain (loss) on investments and foreign currency transactions | | 208,543,792 |
Net unrealized appreciation (depreciation) on investments and assets and liabilities in foreign currencies | | 413,946,348 |
Net Assets | | $ 1,410,996,788 |
Statement of Assets and Liabilities - continued
| October 31, 2013 |
| | |
Calculation of Maximum Offering Price Class A:
Net Asset Value and redemption price per share ($48,463,916 ÷ 1,190,399 shares) | | $ 40.71 |
| | |
Maximum offering price per share (100/94.25 of $40.71) | | $ 43.19 |
Class T:
Net Asset Value and redemption price per share ($12,704,735 ÷ 312,328 shares) | | $ 40.68 |
| | |
Maximum offering price per share (100/96.50 of $40.68) | | $ 42.16 |
Class B:
Net Asset Value and offering price per share ($4,764,250 ÷ 117,263 shares)A | | $ 40.63 |
| | |
Class C:
Net Asset Value and offering price per share ($15,184,519 ÷ 374,059 shares)A | | $ 40.59 |
| | |
Latin America:
Net Asset Value, offering price and redemption price per share ($1,324,748,455 ÷ 32,472,812 shares) | | $ 40.80 |
| | |
Institutional Class:
Net Asset Value, offering price and redemption price per share ($5,130,913 ÷ 125,777 shares) | | $ 40.79 |
A Redemption price per share is equal to net asset value less any applicable contingent deferred sales charge.
See accompanying notes which are an integral part of the financial statements.
Annual Report
Fidelity Latin America Fund
Financial Statements - continued
Statement of Operations
| Year ended October 31, 2013 |
| | |
Investment Income | | |
Dividends | | $ 59,989,795 |
Interest | | 70 |
Income from Fidelity Central Funds | | 524,880 |
Income before foreign taxes withheld | | 60,514,745 |
Less foreign taxes withheld | | (4,239,642) |
Total income | | 56,275,103 |
| | |
Expenses | | |
Management fee | $ 13,229,127 | |
Transfer agent fees | 4,381,374 | |
Distribution and service plan fees | 503,129 | |
Accounting and security lending fees | 843,722 | |
Custodian fees and expenses | 928,497 | |
Independent trustees' compensation | 11,598 | |
Registration fees | 96,818 | |
Audit | 72,029 | |
Legal | 6,009 | |
Interest | 388 | |
Miscellaneous | 22,444 | |
Total expenses before reductions | 20,095,135 | |
Expense reductions | (342,239) | 19,752,896 |
Net investment income (loss) | | 36,522,207 |
Realized and Unrealized Gain (Loss) Net realized gain (loss) on: | | |
Investment securities: | | |
Unaffiliated issuers (net of foreign taxes of $101,531) | 271,486,024 | |
Foreign currency transactions | (1,062,388) | |
Total net realized gain (loss) | | 270,423,636 |
Change in net unrealized appreciation (depreciation) on: Investment securities (net of increase in deferred foreign taxes of $152,377) | (467,997,709) | |
Assets and liabilities in foreign currencies | (206,947) | |
Total change in net unrealized appreciation (depreciation) | | (468,204,656) |
Net gain (loss) | | (197,781,020) |
Net increase (decrease) in net assets resulting from operations | | $ (161,258,813) |
Statement of Changes in Net Assets
| Year ended
October 31,
2013 | Year ended
October 31,
2012 |
Increase (Decrease) in Net Assets | | |
Operations | | |
Net investment income (loss) | $ 36,522,207 | $ 58,892,289 |
Net realized gain (loss) | 270,423,636 | 295,024,672 |
Change in net unrealized appreciation (depreciation) | (468,204,656) | (507,764,945) |
Net increase (decrease) in net assets resulting from operations | (161,258,813) | (153,847,984) |
Distributions to shareholders from net investment income | (45,716,095) | (46,233,461) |
Distributions to shareholders from net realized gain | (164,648,488) | - |
Total distributions | (210,364,583) | (46,233,461) |
Share transactions - net increase (decrease) | (626,013,705) | (452,506,012) |
Redemption fees | 218,753 | 354,338 |
Total increase (decrease) in net assets | (997,418,348) | (652,233,119) |
| | |
Net Assets | | |
Beginning of period | 2,408,415,136 | 3,060,648,255 |
End of period (including undistributed net investment income of $18,836,319 and undistributed net investment income of $34,109,670, respectively) | $ 1,410,996,788 | $ 2,408,415,136 |
See accompanying notes which are an integral part of the financial statements.
Annual Report
Financial Highlights - Class A
Years ended October 31, | 2013 | 2012 | 2011 | 2010 H |
Selected Per-Share Data | | | | |
Net asset value, beginning of period | $ 48.95 | $ 52.38 | $ 57.48 | $ 55.47 |
Income from Investment Operations | | | | |
Net investment income (loss) E | .72 | .92 | 1.15 | .02 |
Net realized and unrealized gain (loss) | (4.73) | (3.66) | (5.87) | 2.79 |
Total from investment operations | (4.01) | (2.74) | (4.72) | 2.81 |
Distributions from net investment income | (.79) | (.70) | (.19) | (.80) |
Distributions from net realized gain | (3.45) | - | (.20) | - |
Total distributions | (4.24) | (.70) | (.39) | (.80) |
Redemption fees added to paid in capital E | .01 | .01 | .01 | - K |
Net asset value, end of period | $ 40.71 | $ 48.95 | $ 52.38 | $ 57.48 |
Total Return B,C,D | (8.93)% | (5.23)% | (8.26)% | 5.14% |
Ratios to Average Net Assets F,I | | | | |
Expenses before reductions | 1.37% | 1.35% | 1.34% | 1.37% A |
Expenses net of fee waivers, if any | 1.37% | 1.35% | 1.34% | 1.37% A |
Expenses net of all reductions | 1.35% | 1.35% | 1.34% | 1.34% A |
Net investment income (loss) | 1.66% | 1.80% | 2.05% | .39% A |
Supplemental Data | | | | |
Net assets, end of period (000 omitted) | $ 48,464 | $ 69,654 | $ 91,407 | $ 115,626 |
Portfolio turnover rate G | 23% | 23% | 11% | 56% J |
A Annualized B Total returns for periods of less than one year are not annualized. C Total returns would have been lower if certain expenses had not been reduced during the applicable periods shown. D Total returns do not include the effect of the sales charges. E Calculated based on average shares outstanding during the period. F Fees and expenses of any underlying Fidelity Central Funds are not included in the Fund's expense ratio. The Fund indirectly bears its proportionate share of the expenses of any underlying Fidelity Central Funds. G Amount does not include the portfolio activity of any underlying Fidelity Central Funds. H For the period September 28, 2010 (commencement of sale of shares) to October 31, 2010. I Expense ratios reflect operating expenses of the class. Expenses before reductions do not reflect amounts reimbursed by the investment adviser or reductions from brokerage service arrangements or reductions from other expense offset arrangements and do not represent the amount paid by the class during periods when reimbursements or reductions occur. Expense ratios before reductions for start-up periods may not be representative of longer-term operating periods. Expenses net of fee waivers reflect expenses after reimbursement by the investment adviser but prior to reductions from brokerage service arrangements or other expense offset arrangements. Expenses net of all reductions represent the net expenses paid by the class. J The portfolio turnover rate does not include the assets acquired in the merger. K Amount represents less than $.01 per share. |
Financial Highlights - Class T
Years ended October 31, | 2013 | 2012 | 2011 | 2010 H |
Selected Per-Share Data | | | | |
Net asset value, beginning of period | $ 48.88 | $ 52.27 | $ 57.47 | $ 55.47 |
Income from Investment Operations | | | | |
Net investment income (loss) E | .61 | .78 | .99 | .01 |
Net realized and unrealized gain (loss) | (4.74) | (3.65) | (5.85) | 2.79 |
Total from investment operations | (4.13) | (2.87) | (4.86) | 2.80 |
Distributions from net investment income | (.63) | (.53) | (.15) | (.80) |
Distributions from net realized gain | (3.45) | - | (.20) | - |
Total distributions | (4.08) | (.53) | (.35) | (.80) |
Redemption fees added to paid in capital E | .01 | .01 | .01 | - K |
Net asset value, end of period | $ 40.68 | $ 48.88 | $ 52.27 | $ 57.47 |
Total Return B,C,D | (9.17)% | (5.49)% | (8.50)% | 5.12% |
Ratios to Average Net Assets F,I | | | | |
Expenses before reductions | 1.63% | 1.61% | 1.61% | 1.63% A |
Expenses net of fee waivers, if any | 1.63% | 1.61% | 1.61% | 1.63% A |
Expenses net of all reductions | 1.61% | 1.61% | 1.61% | 1.60% A |
Net investment income (loss) | 1.40% | 1.54% | 1.78% | .13% A |
Supplemental Data | | | | |
Net assets, end of period (000 omitted) | $ 12,705 | $ 19,334 | $ 26,020 | $ 36,820 |
Portfolio turnover rate G | 23% | 23% | 11% | 56% J |
A Annualized B Total returns for periods of less than one year are not annualized. C Total returns would have been lower if certain expenses had not been reduced during the applicable periods shown. D Total returns do not include the effect of the sales charges. E Calculated based on average shares outstanding during the period. F Fees and expenses of any underlying Fidelity Central Funds are not included in the Fund's expense ratio. The Fund indirectly bears its proportionate share of the expenses of any underlying Fidelity Central Funds. G Amount does not include the portfolio activity of any underlying Fidelity Central Funds. H For the period September 28, 2010 (commencement of sale of shares) to October 31, 2010. I Expense ratios reflect operating expenses of the class. Expenses before reductions do not reflect amounts reimbursed by the investment adviser or reductions from brokerage service arrangements or reductions from other expense offset arrangements and do not represent the amount paid by the class during periods when reimbursements or reductions occur. Expense ratios before reductions for start-up periods may not be representative of longer-term operating periods. Expenses net of fee waivers reflect expenses after reimbursement by the investment adviser but prior to reductions from brokerage service arrangements or other expense offset arrangements. Expenses net of all reductions represent the net expenses paid by the class. J The portfolio turnover rate does not include the assets acquired in the merger. K Amount represents less than $.01 per share. |
See accompanying notes which are an integral part of the financial statements.
Annual Report
Financial Highlights - Class B
Years ended October 31, | 2013 | 2012 | 2011 | 2010 H |
Selected Per-Share Data | | | | |
Net asset value, beginning of period | $ 48.72 | $ 52.06 | $ 57.44 | $ 55.47 |
Income from Investment Operations | | | | |
Net investment income (loss) E | .40 | .53 | .72 | (.02) |
Net realized and unrealized gain (loss) | (4.74) | (3.63) | (5.84) | 2.79 |
Total from investment operations | (4.34) | (3.10) | (5.12) | 2.77 |
Distributions from net investment income | (.31) | (.25) | (.07) | (.80) |
Distributions from net realized gain | (3.45) | - | (.20) | - |
Total distributions | (3.76) | (.25) | (.27) | (.80) |
Redemption fees added to paid in capital E | .01 | .01 | .01 | - K |
Net asset value, end of period | $ 40.63 | $ 48.72 | $ 52.06 | $ 57.44 |
Total Return B,C,D | (9.60)% | (5.95)% | (8.94)% | 5.06% |
Ratios to Average Net Assets F,I | | | | |
Expenses before reductions | 2.12% | 2.10% | 2.10% | 2.12% A |
Expenses net of fee waivers, if any | 2.12% | 2.10% | 2.10% | 2.12% A |
Expenses net of all reductions | 2.10% | 2.10% | 2.10% | 2.10% A |
Net investment income (loss) | .91% | 1.05% | 1.29% | (.36)% A |
Supplemental Data | | | | |
Net assets, end of period (000 omitted) | $ 4,764 | $ 9,492 | $ 14,114 | $ 20,392 |
Portfolio turnover rate G | 23% | 23% | 11% | 56% J |
A Annualized B Total returns for periods of less than one year are not annualized. C Total returns would have been lower if certain expenses had not been reduced during the applicable periods shown. D Total returns do not include the effect of the contingent deferred sales charge. E Calculated based on average shares outstanding during the period. F Fees and expenses of any underlying Fidelity Central Funds are not included in the Fund's expense ratio. The Fund indirectly bears its proportionate share of the expenses of any underlying Fidelity Central Funds. G Amount does not include the portfolio activity of any underlying Fidelity Central Funds. H For the period September 28, 2010 (commencement of sale of shares) to October 31, 2010. I Expense ratios reflect operating expenses of the class. Expenses before reductions do not reflect amounts reimbursed by the investment adviser or reductions from brokerage service arrangements or reductions from other expense offset arrangements and do not represent the amount paid by the class during periods when reimbursements or reductions occur. Expense ratios before reductions for start-up periods may not be representative of longer-term operating periods. Expenses net of fee waivers reflect expenses after reimbursement by the investment adviser but prior to reductions from brokerage service arrangements or other expense offset arrangements. Expenses net of all reductions represent the net expenses paid by the class. J The portfolio turnover rate does not include the assets acquired in the merger. K Amount represents less than $.01 per share. |
Financial Highlights - Class C
Years ended October 31, | 2013 | 2012 | 2011 | 2010 H |
Selected Per-Share Data | | | | |
Net asset value, beginning of period | $ 48.73 | $ 52.05 | $ 57.44 | $ 55.47 |
Income from Investment Operations | | | | |
Net investment income (loss) E | .40 | .54 | .73 | (.02) |
Net realized and unrealized gain (loss) | (4.74) | (3.64) | (5.84) | 2.79 |
Total from investment operations | (4.34) | (3.10) | (5.11) | 2.77 |
Distributions from net investment income | (.36) | (.23) | (.09) | (.80) |
Distributions from net realized gain | (3.45) | - | (.20) | - |
Total distributions | (3.81) | (.23) | (.29) | (.80) |
Redemption fees added to paid in capital E | .01 | .01 | .01 | - K |
Net asset value, end of period | $ 40.59 | $ 48.73 | $ 52.05 | $ 57.44 |
Total Return B,C,D | (9.62)% | (5.94)% | (8.93)% | 5.06% |
Ratios to Average Net Assets F,I | | | | |
Expenses before reductions | 2.12% | 2.10% | 2.08% | 2.09% A |
Expenses net of fee waivers, if any | 2.12% | 2.10% | 2.08% | 2.09% A |
Expenses net of all reductions | 2.10% | 2.10% | 2.08% | 2.07% A |
Net investment income (loss) | .91% | 1.06% | 1.31% | (.34)% A |
Supplemental Data | | | | |
Net assets, end of period (000 omitted) | $ 15,185 | $ 27,405 | $ 35,203 | $ 48,329 |
Portfolio turnover rate G | 23% | 23% | 11% | 56% J |
A Annualized B Total returns for periods of less than one year are not annualized. C Total returns would have been lower if certain expenses had not been reduced during the applicable periods shown. D Total returns do not include the effect of the contingent deferred sales charge. E Calculated based on average shares outstanding during the period. F Fees and expenses of any underlying Fidelity Central Funds are not included in the Fund's expense ratio. The Fund indirectly bears its proportionate share of the expenses of any underlying Fidelity Central Funds. G Amount does not include the portfolio activity of any underlying Fidelity Central Funds. H For the period September 28, 2010 (commencement of sale of shares) to October 31, 2010. I Expense ratios reflect operating expenses of the class. Expenses before reductions do not reflect amounts reimbursed by the investment adviser or reductions from brokerage service arrangements or reductions from other expense offset arrangements and do not represent the amount paid by the class during periods when reimbursements or reductions occur. Expense ratios before reductions for start-up periods may not be representative of longer-term operating periods. Expenses net of fee waivers reflect expenses after reimbursement by the investment adviser but prior to reductions from brokerage service arrangements or other expense offset arrangements. Expenses net of all reductions represent the net expenses paid by the class. J The portfolio turnover rate does not include the assets acquired in the merger. K Amount represents less than $.01 per share. |
See accompanying notes which are an integral part of the financial statements.
Annual Report
Financial Highlights - Latin America
Years ended October 31, | 2013 | 2012 | 2011 | 2010 | 2009 |
Selected Per-Share Data | | | | | |
Net asset value, beginning of period | $ 49.09 | $ 52.48 | $ 57.50 | $ 47.29 | $ 28.69 |
Income from Investment Operations | | | | | |
Net investment income (loss) B | .87 | 1.09 | 1.34 | 1.07 | .72 |
Net realized and unrealized gain (loss) | (4.74) | (3.67) | (5.88) | 11.00 | 18.32 |
Total from investment operations | (3.87) | (2.58) | (4.54) | 12.07 | 19.04 |
Distributions from net investment income | (.98) | (.82) | (.29) | (1.49) | (.46) |
Distributions from net realized gain | (3.45) | - | (.20) | (.39) | - |
Total distributions | (4.43) | (.82) | (.49) | (1.88) | (.46) |
Redemption fees added to paid in capital B | .01 | .01 | .01 | .02 | .02 |
Net asset value, end of period | $ 40.80 | $ 49.09 | $ 52.48 | $ 57.50 | $ 47.29 |
Total Return A | (8.63)% | (4.91)% | (7.96)% | 25.91% | 67.88% |
Ratios to Average Net Assets C,E | | | | | |
Expenses before reductions | 1.04% | 1.02% | 1.00% | 1.03% | 1.07% |
Expenses net of fee waivers, if any | 1.04% | 1.02% | 1.00% | 1.03% | 1.07% |
Expenses net of all reductions | 1.03% | 1.02% | 1.00% | 1.01% | 1.05% |
Net investment income (loss) | 1.99% | 2.14% | 2.39% | 2.10% | 2.04% |
Supplemental Data | | | | | |
Net assets, end of period (000 omitted) | $ 1,324,748 | $ 2,274,601 | $ 2,884,301 | $ 4,283,462 | $ 4,043,748 |
Portfolio turnover rate D | 23% | 23% | 11% | 56% F | 52% |
A Total returns would have been lower if certain expenses had not been reduced during the applicable periods shown. B Calculated based on average shares outstanding during the period. C Fees and expenses of any underlying Fidelity Central Funds are not included in the Fund's expense ratio. The Fund indirectly bears its proportionate share of the expenses of any underlying Fidelity Central Funds. D Amount does not include the portfolio activity of any underlying Fidelity Central Funds. E Expense ratios reflect operating expenses of the class. Expenses before reductions do not reflect amounts reimbursed by the investment adviser or reductions from brokerage service arrangements or reductions from other expense offset arrangements and do not represent the amount paid by the class during periods when reimbursements or reductions occur. Expenses net of fee waivers reflect expenses after reimbursement by the investment adviser but prior to reductions from brokerage service arrangements or other expense offset arrangements. Expenses net of all reductions represent the net expenses paid by the class. F The portfolio turnover rate does not include the assets acquired in the merger. |
Financial Highlights - Institutional Class
Years ended October 31, | 2013 | 2012 | 2011 | 2010 G |
Selected Per-Share Data | | | | |
Net asset value, beginning of period | $ 49.07 | $ 52.51 | $ 57.49 | $ 55.47 |
Income from Investment Operations | | | | |
Net investment income (loss) D | .87 | 1.08 | 1.32 | .03 |
Net realized and unrealized gain (loss) | (4.74) | (3.67) | (5.88) | 2.79 |
Total from investment operations | (3.87) | (2.59) | (4.56) | 2.82 |
Distributions from net investment income | (.97) | (.86) | (.23) | (.80) |
Distributions from net realized gain | (3.45) | - | (.20) | - |
Total distributions | (4.42) | (.86) | (.43) | (.80) |
Redemption fees added to paid in capital D | .01 | .01 | .01 | - J |
Net asset value, end of period | $ 40.79 | $ 49.07 | $ 52.51 | $ 57.49 |
Total Return B,C | (8.63)% | (4.93)% | (7.98)% | 5.15% |
Ratios to Average Net Assets E,H | | | | |
Expenses before reductions | 1.03% | 1.04% | 1.04% | 1.08% A |
Expenses net of fee waivers, if any | 1.03% | 1.04% | 1.04% | 1.08% A |
Expenses net of all reductions | 1.01% | 1.04% | 1.04% | 1.06% A |
Net investment income (loss) | 2.00% | 2.12% | 2.35% | .68% A |
Supplemental Data | | | | |
Net assets, end of period (000 omitted) | $ 5,131 | $ 7,928 | $ 9,603 | $ 12,868 |
Portfolio turnover rate F | 23% | 23% | 11% | 56% I |
A Annualized B Total returns for periods of less than one year are not annualized. C Total returns would have been lower if certain expenses had not been reduced during the applicable periods shown. D Calculated based on average shares outstanding during the period. E Fees and expenses of any underlying Fidelity Central Funds are not included in the Fund's expense ratio. The Fund indirectly bears its proportionate share of the expenses of any underlying Fidelity Central Funds. F Amount does not include the portfolio activity of any underlying Fidelity Central Funds. G For the period September 28, 2010 (commencement of sale of shares) to October 31, 2010. H Expense ratios reflect operating expenses of the class. Expenses before reductions do not reflect amounts reimbursed by the investment adviser or reductions from brokerage service arrangements or reductions from other expense offset arrangements and do not represent the amount paid by the class during periods when reimbursements or reductions occur. Expense ratios before reductions for start-up periods may not be representative of longer-term operating periods. Expenses net of fee waivers reflect expenses after reimbursement by the investment adviser but prior to reductions from brokerage service arrangements or other expense offset arrangements. Expenses net of all reductions represent the net expenses paid by the class. I The portfolio turnover rate does not include the assets acquired in the merger. J Amount represents less than $.01 per share. |
See accompanying notes which are an integral part of the financial statements.
Annual Report
Notes to Financial Statements
For the period ended October 31, 2013
1. Organization.
Fidelity Latin America Fund (the Fund) is a non-diversified fund of Fidelity Investment Trust (the Trust) and is authorized to issue an unlimited number of shares. The Trust is registered under the Investment Company Act of 1940, as amended (the 1940 Act), as an open-end management investment company organized as a Massachusetts business trust. The Fund offers Class A, Class T, Class C, Latin America and Institutional Class shares, each of which, along with Class B shares, has equal rights as to assets and voting privileges. Class B shares are closed to new accounts and additional purchases, except for exchanges and reinvestments. Each class has exclusive voting rights with respect to matters that affect that class. Class B shares will automatically convert to Class A shares after a holding period of seven years from the initial date of purchase. The Fund's investments in emerging markets can be subject to social, economic, regulatory, and political uncertainties and can be extremely volatile.
2. Investments in Fidelity Central Funds.
The Fund invests in Fidelity Central Funds, which are open-end investment companies generally available only to other investment companies and accounts managed by Fidelity Management & Research Company (FMR) and its affiliates. The Fund's Schedule of Investments lists each of the Fidelity Central Funds held as of period end, if any, as an investment of the Fund, but does not include the underlying holdings of each Fidelity Central Fund. As an Investing Fund, the Fund indirectly bears its proportionate share of the expenses of the underlying Fidelity Central Funds.
The Money Market Central Funds seek preservation of capital and current income and are managed by Fidelity Investments Money Management, Inc. (FIMM), an affiliate of FMR.
A complete unaudited list of holdings for each Fidelity Central Fund is available upon request or at the Securities and Exchange Commission (the SEC) website at www.sec.gov. In addition, the financial statements of the Fidelity Central Funds, which are not covered by the Fund's Report of Independent Registered Public Accounting Firm, are available on the SEC website or upon request.
3. Significant Accounting Policies.
The financial statements have been prepared in conformity with accounting principles generally accepted in the United States of America (GAAP), which require management to make certain estimates and assumptions at the date of the financial statements. Actual results could differ from those estimates. Subsequent events, if any, through the date that the financial statements were issued have been evaluated in the preparation of the financial statements. The following summarizes the significant accounting policies of the Fund:
Investment Valuation. Investments are valued as of 4:00 p.m. Eastern time on the last calendar day of the period. In accordance with valuation policies and procedures approved by the Board of Trustees (the Board), the Fund attempts to obtain prices from one or more third party pricing vendors or brokers to value its investments. When current market prices, quotations or currency exchange rates are not readily available or reliable, investments will be fair valued in good faith by the FMR Fair Value Committee (the Committee), in accordance with procedures adopted by the Board. Factors used in determining fair value vary by investment type and may include market or investment specific events. The frequency with which these procedures are used cannot be predicted and they may be utilized to a significant extent. The Committee oversees the Fund's valuation policies and procedures and is responsible for approving and reporting to the Board all fair value determinations.
The Fund categorizes the inputs to valuation techniques used to value its investments into a disclosure hierarchy consisting of three levels as shown below:
Level 1 - quoted prices in active markets for identical investments
Level 2 - other significant observable inputs (including quoted prices for similar investments, interest rates, prepayment speeds, etc.)
Level 3 - unobservable inputs (including the Fund's own assumptions based on the best information available)
Valuation techniques used to value the Fund's investments by major category are as follows:
Equity securities, including restricted securities, for which market quotations are readily available, are valued at the last reported sale price or official closing price as reported by a third party pricing vendor on the primary market or exchange on which they are traded and are categorized as Level 1 in the hierarchy. In the event there were no sales during the day or closing prices are not available, securities are valued at the last quoted bid price or may be valued using the last available price and are generally categorized as Level 2 in the hierarchy. For foreign equity securities, when market or security specific events arise, comparisons to the valuation of American Depositary Receipts (ADRs), futures contracts, Exchange-Traded Funds (ETFs) and certain indexes as well as quoted prices for similar securities may be used and would be categorized as Level 2 in the hierarchy. Utilizing these techniques may result in transfers between Level 1 and Level 2. For equity securities, including restricted securities, where observable inputs are limited, assumptions about market activity and risk are used and these securities may be categorized as Level 3 in the hierarchy.
Investments in open-end mutual funds, including the Fidelity Central Funds, are valued at their closing net asset value (NAV) each business day and are categorized as Level 1 in the hierarchy.
Annual Report
3. Significant Accounting Policies - continued
Investment Valuation - continued
Changes in valuation techniques may result in transfers in or out of an assigned level within the disclosure hierarchy. The aggregate value of investments by input level, as of October 31, 2013, is included at the end of the Fund's Schedule of Investments.
Foreign Currency. The Fund may use foreign currency contracts to facilitate transactions in foreign-denominated securities. Gains and losses from these transactions may arise from changes in the value of the foreign currency or if the counterparties do not perform under the contracts' terms.
Foreign-denominated assets, including investment securities, and liabilities are translated into U.S. dollars at the exchange rates at period end. Purchases and sales of investment securities, income and dividends received and expenses denominated in foreign currencies are translated into U.S. dollars at the exchange rate in effect on the transaction date.
The effects of exchange rate fluctuations on investments are included with the net realized and unrealized gain (loss) on investment securities. Other foreign currency transactions resulting in realized and unrealized gain (loss) are disclosed separately.
Investment Transactions and Income. For financial reporting purposes, the Fund's investment holdings and NAV include trades executed through the end of the last business day of the period. The NAV per share for processing shareholder transactions is calculated as of the close of business of the New York Stock Exchange (NYSE), normally 4:00 p.m. Eastern time and includes trades executed through the end of the prior business day. Gains and losses on securities sold are determined on the basis of identified cost and may include proceeds received from litigation. Dividend income is recorded on the ex-dividend date, except for certain dividends from foreign securities where the ex-dividend date may have passed, which are recorded as soon as the Fund is informed of the ex-dividend date. Non-cash dividends included in dividend income, if any, are recorded at the fair market value of the securities received. Distributions received on securities that represent a return of capital or capital gain are recorded as a reduction of cost of investments and/or as a realized gain. Subsequent to ex-dividend date the Fund determines the components of these distributions, based upon receipt of tax filings or other correspondence relating to the underlying investment. Interest income and distributions from the Fidelity Central Funds are accrued as earned. Interest income includes coupon interest and amortization of premium and accretion of discount on debt securities. Investment income is recorded net of foreign taxes withheld where recovery of such taxes is uncertain.
Class Allocations and Expenses. Investment income, realized and unrealized capital gains and losses, common expenses of the Fund, and certain fund-level expense reductions, if any, are allocated daily on a pro-rata basis to each class based on the relative net assets of each class to the total net assets of the Fund. Each class differs with respect to transfer agent and distribution and service plan fees incurred. Certain expense reductions may also differ by class. For the reporting period, the allocated portion of income and expenses to each class as a percent of its average net assets may vary due to the timing of recording these transactions in relation to fluctuating net assets of the classes. Expenses directly attributable to a fund are charged to that fund. Expenses attributable to more than one fund are allocated among the respective funds on the basis of relative net assets or other appropriate methods. Expense estimates are accrued in the period to which they relate and adjustments are made when actual amounts are known.
Income Tax Information and Distributions to Shareholders. Each year, the Fund intends to qualify as a regulated investment company under Subchapter M of the Internal Revenue Code, including distributing substantially all of its taxable income and realized gains. As a result, no provision for U.S. Federal income taxes is required. As of October 31, 2013, the Fund did not have any unrecognized tax benefits in the financial statements; nor is the Fund aware of any tax positions for which it is reasonably possible that the total amounts of unrecognized tax benefits will significantly change in the next twelve months. The Fund files a U.S. federal tax return, in addition to state and local tax returns as required. The Fund's federal income tax returns are subject to examination by the Internal Revenue Service (IRS) for a period of three fiscal years after they are filed. State and local tax returns may be subject to examination for an additional fiscal year depending on the jurisdiction. Foreign taxes are provided for based on the Fund's understanding of the tax rules and rates that exist in the foreign markets in which it invests. The Fund is subject to a tax imposed on capital gains by certain countries in which it invests. An estimated deferred tax liability for net unrealized appreciation on the applicable securities is included in Other payables and accrued expenses on the Statement of Assets & Liabilities.
Distributions are declared and recorded on the ex-dividend date. Income dividends and capital gain distributions are declared separately for each class. Income and capital gain distributions are determined in accordance with income tax regulations, which may differ from GAAP. In addition, the Fund claimed a portion of the payment made to redeeming shareholders as a distribution for income tax purposes.
Capital accounts within the financial statements are adjusted for permanent book-tax differences. These adjustments have no impact on net assets or the results of operations. Temporary book-tax differences will reverse in a subsequent period.
Book-tax differences are primarily due to foreign currency transactions, certain foreign taxes, passive foreign investment companies (PFIC), deferred trustees compensation, and losses deferred due to wash sales.
Annual Report
Notes to Financial Statements - continued
3. Significant Accounting Policies - continued
Income Tax Information and Distributions to Shareholders - continued
The federal tax cost of investment securities and unrealized appreciation (depreciation) as of period end were as follows:
Gross unrealized appreciation | $ 514,889,062 |
Gross unrealized depreciation | (101,624,195) |
Net unrealized appreciation (depreciation) on securities and other investments | $ 413,264,867 |
| |
Tax Cost | $ 1,045,097,094 |
The tax-based components of distributable earnings as of period end were as follows:
Undistributed ordinary income | $ 18,836,911 |
Undistributed long-term capital gain | $ 209,632,547 |
Net unrealized appreciation (depreciation) | $ 413,009,970 |
The tax character of distributions paid was as follows:
| October 31, 2013 | October 31, 2012 |
Ordinary Income | $ 45,716,095 | $ 46,233,461 |
Long-term Capital Gains | 164,648,488 | - |
Total | $ 210,364,583 | $ 46,233,461 |
Short-Term Trading (Redemption) Fees. Shares held by investors in the Fund less than 90 days may have been subject to a redemption fee equal to 1.50% of the net asset value of shares redeemed. All redemption fees, which reduce the proceeds of the shareholder redemption, are retained by the Fund and accounted for as an addition to paid in capital.
4. Purchases and Sales of Investments.
Purchases and sales of securities, other than short-term securities, aggregated $415,539,658 and $1,205,128,341, respectively.
5. Fees and Other Transactions with Affiliates.
Management Fee. FMR and its affiliates provide the Fund with investment management related services for which the Fund pays a monthly management fee. The management fee is the sum of an individual fund fee rate that is based on an annual rate of .45% of the Fund's average net assets and an annualized group fee rate that averaged .25% during the period. The group fee rate is based upon the average net assets of all the mutual funds advised by FMR, including any mutual funds previously advised by FMR that are currently advised by Fidelity SelectCo, LLC, an affiliate of FMR. The group fee rate decreases as assets under management increase and increases as assets under management decrease. For the reporting period, the total annual management fee rate was .71% of the Fund's average net assets.
Distribution and Service Plan Fees. In accordance with Rule 12b-1 of the 1940 Act, the Fund has adopted separate Distribution and Service Plans for each class of shares. Certain classes pay Fidelity Distributors Corporation (FDC), an affiliate of FMR, separate Distribution and Service Fees, each of which is based on an annual percentage of each class' average net assets. In addition, FDC may pay financial intermediaries for selling shares of the Fund and providing shareholder support services. For the period, the Distribution and Service Fee rates, total fees and amounts retained by FDC were as follows:
| Distribution
Fee | Service
Fee | Total Fees | Retained
by FDC |
Class A | -% | .25% | $ 147,042 | $ 3,467 |
Class T | .25% | .25% | 79,698 | 1,065 |
Class B | .75% | .25% | 68,553 | 51,415 |
Class C | .75% | .25% | 207,836 | 19,782 |
| | | $ 503,129 | $ 75,729 |
Sales Load. FDC may receive a front-end sales charge of up to 5.75% for selling Class A shares and 3.50% for selling Class T shares, some of which is paid to financial intermediaries for selling shares of the Fund. Depending on the holding period, FDC may receive contingent deferred sales charges levied on Class A, Class T, Class B and Class C redemptions. The deferred sales charges range from 5.00% to 1.00% for Class B shares, 1.00% for Class C shares, 1.00% for certain purchases of Class A shares and .25% for certain purchases of Class T shares.
Annual Report
5. Fees and Other Transactions with Affiliates - continued
Sales Load - continued
For the period, sales charge amounts retained by FDC were as follows:
| Retained
by FDC |
Class A | $ 27,051 |
Class T | 4,208 |
Class B* | 11,774 |
Class C* | 3,514 |
| $ 46,547 |
* When Class B and Class C shares are initially sold, FDC pays commissions from its own resources to financial intermediaries through which the sales are made.
Transfer Agent Fees. Fidelity Investments Institutional Operations Company, Inc., (FIIOC), an affiliate of FMR, is the transfer, dividend disbursing and shareholder servicing agent for each class of the Fund. FIIOC receives account fees and asset-based fees that vary according to the account size and type of account of the shareholders of the respective classes of the Fund. FIIOC pays for typesetting, printing and mailing of shareholder reports, except proxy statements.
For the period, transfer agent fees for each class were as follows:
| Amount | % of
Average
Net Assets |
Class A | $ 176,560 | .30 |
Class T | 49,934 | .31 |
Class B | 20,537 | .30 |
Class C | 62,116 | .30 |
Latin America | 4,058,638 | .23 |
Institutional Class | 13,589 | .21 |
| $ 4,381,374 | |
Accounting and Security Lending Fees. Fidelity Service Company, Inc. (FSC), an affiliate of FMR, maintains the Fund's accounting records. The accounting fee is based on the level of average net assets for each month. Under a separate contract, FSC administers the security lending program. The security lending fee is based on the number and duration of lending transactions.
Brokerage Commissions. The Fund placed a portion of its portfolio transactions with brokerage firms which are affiliates of the investment adviser. Brokerage commissions are included in net realized gain (loss) and change in net unrealized appreciation (depreciation) in the Statement of Operations. The commissions paid to these affiliated firms were $18,366 for the period.
Interfund Lending Program. Pursuant to an Exemptive Order issued by the SEC, the Fund, along with other registered investment companies having management contracts with FMR, may participate in an interfund lending program. This program provides an alternative credit facility allowing the funds to borrow from, or lend money to, other participating affiliated funds. At period end, there were no interfund loans outstanding. The Fund's activity in this program during the period for which loans were outstanding was as follows:
Borrower or Lender | Average Loan
Balance | Weighted Average Interest Rate | Interest
Expense |
Borrower | $ 4,442,000 | .39% | $ 388 |
Other. During the period, FMR reimbursed the Fund for certain losses in the amount of $9,785.
6. Committed Line of Credit.
The Fund participates with other funds managed by FMR or an affiliate in a $4.25 billion credit facility (the "line of credit") to be utilized for temporary or emergency purposes to fund shareholder redemptions or for other short-term liquidity purposes. The Fund has agreed to pay commitment fees on its pro-rata portion of the line of credit, which amounted to $4,461 and is reflected in Miscellaneous expenses on the Statement of Operations. During the period, there were no borrowings on this line of credit.
7. Security Lending.
The Fund lends portfolio securities through a lending agent from time to time in order to earn additional income. For equity securities, a lending agent is used and may loan securities to certain qualified borrowers, including Fidelity Capital Markets (FCM), a broker-dealer affiliated with the Fund. On the settlement date of the loan, the Fund receives collateral (in the form of U.S. Treasury obligations, letters of credit and/or cash) against the loaned
Annual Report
Notes to Financial Statements - continued
7. Security Lending - continued
securities and maintains collateral in an amount not less than 100% of the market value of the loaned securities during the period of the loan. The market value of the loaned securities is determined at the close of business of the Fund and any additional required collateral is delivered to the Fund on the next business day. If the borrower defaults on its obligation to return the securities loaned because of insolvency or other reasons, the Fund may apply collateral received from the borrower against the obligation. The Fund may experience delays and costs in recovering the securities loaned. Any cash collateral received is invested in the Fidelity Securities Lending Cash Central Fund. The value of loaned securities and cash collateral at period end are disclosed on the Fund's Statement of Assets and Liabilities. At period end, there were no security loans outstanding with FCM. Security lending income represents the income earned on investing cash collateral, less rebates paid to borrowers and any lending agent fees associated with the loan, plus any premium payments received for lending certain types of securities. Security lending income is presented in the Statement of Operations as a component of income from Fidelity Central Funds. Total security lending income during the period amounted to $501,984, including $11,698 from securities loaned to FCM.
8. Expense Reductions.
Commissions paid to certain brokers with whom FMR, or its affiliates, places trades on behalf of the Fund include an amount in addition to trade execution, which may be rebated back to the Fund to offset certain expenses. This amount totaled $316,869 for the period.
In addition, FMR reimbursed a portion of the Fund's operating expenses during the period in the amount of $25,370.
9. Distributions to Shareholders.
Distributions to shareholders of each class were as follows:
Years ended October 31, | 2013 | 2012 |
From net investment income | | |
Class A | $ 1,098,761 | $ 1,209,540 |
Class T | 245,683 | 259,191 |
Class B | 57,649 | 65,750 |
Class C | 192,218 | 156,473 |
Latin America | 43,971,155 | 44,398,764 |
Institutional Class | 150,629 | 143,743 |
Total | $ 45,716,095 | $ 46,233,461 |
From net realized gain | | |
Class A | $ 4,828,947 | $ - |
Class T | 1,341,152 | - |
Class B | 641,573 | - |
Class C | 1,868,040 | - |
Latin America | 155,430,816 | - |
Institutional Class | 537,960 | - |
Total | $ 164,648,488 | $ - |
10. Share Transactions.
Transactions for each class of shares were as follows:
| Shares | Dollars |
Years ended October 31, | 2013 | 2012 | 2013 | 2012 |
Class A | | | | |
Shares sold | 232,318 | 250,504 | $ 10,075,611 | $ 12,951,683 |
Reinvestment of distributions | 119,230 | 21,636 | 5,315,278 | 1,072,283 |
Shares redeemed | (584,100) | (594,208) | (25,288,174) | (30,101,636) |
Net increase (decrease) | (232,552) | (322,068) | $ (9,897,285) | $ (16,077,670) |
Class T | | | | |
Shares sold | 46,221 | 45,016 | $ 2,015,673 | $ 2,321,071 |
Reinvestment of distributions | 34,933 | 5,062 | 1,559,775 | 251,031 |
Shares redeemed | (164,385) | (152,369) | (7,142,972) | (7,641,343) |
Net increase (decrease) | (83,231) | (102,291) | $ (3,567,524) | $ (5,069,241) |
Annual Report
10. Share Transactions - continued
| Shares | Dollars |
Years ended October 31, | 2013 | 2012 | 2013 | 2012 |
Class B | | | | |
Shares sold | 1,849 | 3,378 | $ 84,642 | $ 173,307 |
Reinvestment of distributions | 13,236 | 1,105 | 592,836 | 54,795 |
Shares redeemed | (92,657) | (80,783) | (4,084,874) | (4,111,766) |
Net increase (decrease) | (77,572) | (76,300) | $ (3,407,396) | $ (3,883,664) |
Class C | | | | |
Shares sold | 46,994 | 55,877 | $ 2,021,869 | $ 2,923,684 |
Reinvestment of distributions | 42,623 | 2,881 | 1,907,392 | 142,933 |
Shares redeemed | (277,980) | (172,705) | (12,111,471) | (8,681,626) |
Net increase (decrease) | (188,363) | (113,947) | $ (8,182,210) | $ (5,615,009) |
Latin America | | | | |
Shares sold | 3,510,227 | 6,405,350 | $ 154,033,223 | $ 336,749,510 |
Reinvestment of distributions | 4,304,957 | 860,999 | 191,785,822 | 42,666,908 |
Shares redeemed | (21,678,292) | (15,886,221) | (945,202,869) | (800,304,511) |
Net increase (decrease) | (13,863,108) | (8,619,872) | $ (599,383,824) | $ (420,888,093) |
Institutional Class | | | | |
Shares sold | 62,065 | 84,374 | $ 2,723,553 | $ 4,329,443 |
Reinvestment of distributions | 11,511 | 2,228 | 512,716 | 110,408 |
Shares redeemed | (109,367) | (107,894) | (4,811,735) | (5,412,186) |
Net increase (decrease) | (35,791) | (21,292) | $ (1,575,466) | $ (972,335) |
11. Other.
The Fund's organizational documents provide former and current trustees and officers with a limited indemnification against liabilities arising in connection with the performance of their duties to the Fund. In the normal course of business, the Fund may also enter into contracts that provide general indemnifications. The Fund's maximum exposure under these arrangements is unknown as this would be dependent on future claims that may be made against the Fund. The risk of material loss from such claims is considered remote.
Annual Report
Report of Independent Registered Public Accounting Firm
To the Trustees of Fidelity Investment Trust and the Shareholders of Fidelity Latin America Fund:
In our opinion, the accompanying statement of assets and liabilities, including the schedule of investments, and the related statements of operations and of changes in net assets and the financial highlights present fairly, in all material respects, the financial position of Fidelity Latin America Fund (a fund of Fidelity Investment Trust) at October 31, 2013, the results of its operations for the year then ended, the changes in its net assets for each of the two years in the period then ended and the financial highlights for each of the periods indicated, in conformity with accounting principles generally accepted in the United States of America. These financial statements and financial highlights (hereafter referred to as "financial statements") are the responsibility of the Fidelity Latin America Fund's management. Our responsibility is to express an opinion on these financial statements based on our audits. We conducted our audits of these financial statements in accordance with the standards of the Public Company Accounting Oversight Board (United States). Those standards require that we plan and perform the audit to obtain reasonable assurance about whether the financial statements are free of material misstatement. An audit includes examining, on a test basis, evidence supporting the amounts and disclosures in the financial statements, assessing the accounting principles used and significant estimates made by management, and evaluating the overall financial statement presentation. We believe that our audits, which included confirmation of securities at October 31, 2013 by correspondence with the custodian and brokers, provide a reasonable basis for our opinion.
PricewaterhouseCoopers LLP
Boston, Massachusetts
December 16, 2013
Annual Report
Trustees and Officers
The Trustees, Member of the Advisory Board, and executive officers of the trust and fund, as applicable, are listed below. The Board of Trustees governs the fund and is responsible for protecting the interests of shareholders. The Trustees are experienced executives who meet periodically throughout the year to oversee the fund's activities, review contractual arrangements with companies that provide services to the fund, oversee management of the risks associated with such activities and contractual arrangements, and review the fund's performance. Except for James C. Curvey, Ned C. Lautenbach, Ronald P. O'Hanley, and William S. Stavropoulos, each of the Trustees oversees 171 funds. Mr. Curvey oversees 394 funds. Mr. Lautenbach, Mr. O'Hanley, and Mr. Stavropoulos each oversees 245 funds.
The Trustees hold office without limit in time except that (a) any Trustee may resign; (b) any Trustee may be removed by written instrument, signed by at least two-thirds of the number of Trustees prior to such removal; (c) any Trustee who requests to be retired or who has become incapacitated by illness or injury may be retired by written instrument signed by a majority of the other Trustees; and (d) any Trustee may be removed at any special meeting of shareholders by a two-thirds vote of the outstanding voting securities of the trust. Each Trustee who is not an interested person of the trust and the fund (as defined in the 1940 Act) (Independent Trustee), shall retire not later than the last day of the calendar year in which his or her 75th birthday occurs. The Independent Trustees may waive this mandatory retirement age policy with respect to individual Trustees. The executive officers and Advisory Board Member hold office without limit in time, except that any officer and Advisory Board Member may resign or may be removed by a vote of a majority of the Trustees at any regular meeting or any special meeting of the Trustees. Except as indicated, each individual has held the office shown or other offices in the same company for the past five years.
Experience, Skills, Attributes, and Qualifications of the Fund's Trustees. The Governance and Nominating Committee has adopted a statement of policy that describes the experience, qualifications, attributes, and skills that are necessary and desirable for potential Independent Trustee candidates (Statement of Policy). The Board believes that each Trustee satisfied at the time he or she was initially elected or appointed a Trustee, and continues to satisfy, the standards contemplated by the Statement of Policy. The Governance and Nominating Committee also engages professional search firms to help identify potential Independent Trustee candidates who have the experience, qualifications, attributes, and skills consistent with the Statement of Policy. From time to time, additional criteria based on the composition and skills of the current Independent Trustees, as well as experience or skills that may be appropriate in light of future changes to board composition, business conditions, and regulatory or other developments, have also been considered by the professional search firms and the Governance and Nominating Committee. In addition, the Board takes into account the Trustees' commitment and participation in Board and committee meetings, as well as their leadership of standing and ad hoc committees throughout their tenure.
In determining that a particular Trustee was and continues to be qualified to serve as a Trustee, the Board has considered a variety of criteria, none of which, in isolation, was controlling. The Board believes that, collectively, the Trustees have balanced and diverse experience, qualifications, attributes, and skills, which allow the Board to operate effectively in governing the fund and protecting the interests of shareholders. Information about the specific experience, skills, attributes, and qualifications of each Trustee, which in each case led to the Board's conclusion that the Trustee should serve (or continue to serve) as a trustee of the fund, is provided below.
Board Structure and Oversight Function. James C. Curvey is an interested person (as defined in the 1940 Act) and currently serves as Chairman. The Trustees have determined that an interested Chairman is appropriate and benefits shareholders because an interested Chairman has a personal and professional stake in the quality and continuity of services provided to the fund. Independent Trustees exercise their informed business judgment to appoint an individual of their choosing to serve as Chairman, regardless of whether the Trustee happens to be independent or a member of management. The Independent Trustees have determined that they can act independently and effectively without having an Independent Trustee serve as Chairman and that a key structural component for assuring that they are in a position to do so is for the Independent Trustees to constitute a substantial majority for the Board. The Independent Trustees also regularly meet in executive session. Ned C. Lautenbach serves as Chairman of the Independent Trustees and as such (i) acts as a liaison between the Independent Trustees and management with respect to matters important to the Independent Trustees and (ii) with management prepares agendas for Board meetings.
Fidelity funds are overseen by different Boards of Trustees. The fund's Board oversees Fidelity's equity and high income funds and another Board oversees Fidelity's investment-grade bond, money market, and asset allocation funds. The asset allocation funds may invest in Fidelity funds overseen by the fund's Board. The use of separate Boards, each with its own committee structure, allows the Trustees of each group of Fidelity funds to focus on the unique issues of the funds they oversee, including common research, investment, and operational issues. On occasion, the separate Boards establish joint committees to address issues of overlapping consequences for the Fidelity funds overseen by each Board.
The Trustees operate using a system of committees to facilitate the timely and efficient consideration of all matters of importance to the Trustees, the fund, and fund shareholders and to facilitate compliance with legal and regulatory requirements and oversight of the fund's activities and associated risks. The Board, acting through its committees, has charged FMR and its affiliates with (i) identifying events or circumstances the occurrence of which could have demonstrably adverse effects on the fund's business and/or reputation; (ii) implementing processes and controls to lessen the possibility that such events or circumstances occur or to mitigate the effects of such events or circumstances if they do occur; and (iii) creating and maintaining a system designed to evaluate continuously business and market conditions in order to facilitate the identification and implementation processes described in (i) and (ii) above. Because the day-to-day operations and activities of the fund are carried out by or through FMR, its affiliates and other service providers, the fund's exposure to risks is mitigated but not eliminated by the processes overseen by the Trustees. While each of the Board's committees has responsibility for overseeing different aspects of the fund's activities, oversight is exercised primarily through the Operations, Audit, and Compliance Committees. In addition, the Independent Trustees have worked with FMR to enhance the Board's oversight of investment and financial risks, legal and regulatory risks, technology risks, and operational risks, including the development of additional risk reporting to the Board. For example, a working group comprised of Independent Trustees and FMR has worked and continues to work to review the Fidelity funds' valuation-related activities, reporting and risk management. Appropriate personnel, including but not limited to the fund's Chief Compliance Officer (CCO), FMR's internal auditor, the independent accountants, the fund's Treasurer and portfolio management personnel, make periodic reports to the Board's committees, as appropriate, including an annual review of FMR's risk management program for the Fidelity funds. The responsibilities of each standing committee, including their oversight responsibilities, are described further under "Standing Committees of the Fund's Trustees."
Annual Report
The fund's Statement of Additional Information (SAI) includes more information about the Trustees. To request a free copy, call Fidelity at 1-877-208-0098.
Interested Trustees*:
Correspondence intended for each Trustee who is an interested person may be sent to Fidelity Investments, 245 Summer Street, Boston, Massachusetts 02210.
Name, Year of Birth; Principal Occupations and Other Relevant Experience+ |
James C. Curvey (1935) |
Year of Election or Appointment: 2007 Trustee Chairman of the Board of Trustees |
| Mr. Curvey also serves as Trustee of other Fidelity funds. Mr. Curvey is a Director of Fidelity Investments Money Management, Inc. (2009-present), Director of Fidelity Research & Analysis Co. (2009-present) and Director of FMR and FMR Co., Inc. (2007-present). Mr. Curvey is also Vice Chairman (2007-present) and Director of FMR LLC. In addition, Mr. Curvey serves as an Overseer for the Boston Symphony Orchestra and a member of the Trustees of Villanova University. Previously, Mr. Curvey was the Vice Chairman (2006-2007) and Director (2000-2007) of FMR Corp. |
Ronald P. O'Hanley (1957) |
Year of Election or Appointment: 2011 Trustee |
| Mr. O'Hanley also serves as Trustee of other Fidelity funds. He is Director of Fidelity SelectCo, LLC (2013-present), FMR Co., Inc. (2010-present), Director of Fidelity Investments Money Management, Inc. (2010-present), Director of Fidelity Research & Analysis Company (2010-present), President of Fidelity Asset Management and Corporate Services and a Member of Fidelity's Executive Committee (2010-present). Previously, Mr. O'Hanley served as President and Chief Executive Officer of BNY Mellon Asset Management (2007-2010). Mr. O'Hanley also served as Vice Chairman of Bank New York Mellon Corp. and a member of that firm's Executive Committee. Prior to the 2007 merger of The Bank of New York and Mellon Financial Corporation, he was Vice Chairman of Mellon Financial Corporation and President and Chief Executive Officer of Mellon Asset Management. He joined Mellon in February 1997. Mr. O'Hanley currently serves as Chairman of the Boston Public Library Foundation Board of Directors and sits on the Board of Directors of Beth Israel Deaconess Medical Center, the Board of Trustees of the Marine Biological Laboratory and the Advisory Board of the Maxwell School of Citizenship and Public Administration at Syracuse University. Mr. O'Hanley also chairs the Council on Asset Management for the Financial Services Roundtable and is a member of the Board of Directors of Institutional Investor's U.S. Institute. |
* Trustees have been determined to be "Interested Trustees" by virtue of, among other things, their affiliation with the trust or various entities under common control with FMR.
+ The information above includes each Trustee's principal occupation during the last five years and other information relating to the experience, attributes, and skills relevant to each Trustee's qualifications to serve as a Trustee, which led to the conclusion that each Trustee should serve as a Trustee for the fund.
Annual Report
Trustees and Officers - continued
Independent Trustees:
Correspondence intended for each Independent Trustee (that is, the Trustees other than the Interested Trustees) may be sent to Fidelity Investments, P.O. Box 55235, Boston, Massachusetts 02205-5235.
Name, Year of Birth; Principal Occupations and Other Relevant Experience+ |
Dennis J. Dirks (1948) |
Year of Election or Appointment: 2005 Trustee |
| Mr. Dirks also serves as Trustee of other Fidelity funds. Prior to his retirement in May 2003, Mr. Dirks was Chief Operating Officer and a member of the Board of The Depository Trust & Clearing Corporation (DTCC). He also served as President, Chief Operating Officer, and Board member of The Depository Trust Company (DTC) and President and Board member of the National Securities Clearing Corporation (NSCC). In addition, Mr. Dirks served as Chief Executive Officer and Board member of the Government Securities Clearing Corporation, Chief Executive Officer and Board member of the Mortgage-Backed Securities Clearing Corporation, as a Trustee and a member of the Finance Committee of Manhattan College (2005-2008), and as a Trustee and a member of the Finance Committee of AHRC of Nassau County (2006-2008). Mr. Dirks is a member of the Independent Directors Council (IDC) Governing Council (2010-present) and Board of Directors for The Brookville Center for Children's Services, Inc.(2009-present). |
Alan J. Lacy (1953) |
Year of Election or Appointment: 2008 Trustee |
| Mr. Lacy also serves as Trustee of other Fidelity funds. Mr. Lacy serves as Senior Adviser (2007-present) of Oak Hill Capital Partners, L.P. (private equity). Mr. Lacy also served as Chief Executive Officer (2000-2005) and Vice Chairman (2005-2006) of Sears Holdings Corporation and Sears, Roebuck and Co. (retail). In addition, Mr. Lacy serves as a member of the Board of Directors of Dave & Buster's Entertainment, Inc. (restaurant and entertainment complexes, 2010-present), Earth Fare, Inc. (retail grocery, 2012-present), The Hillman Companies, Inc. (hardware wholesalers, 2010-present), and Bristol-Myers Squibb Company (global pharmaceuticals, 2008-present). Mr. Lacy is a member of the Board of Trustees of The National Parks Conservation Association (2006-present). Previously, Mr. Lacy served as Chairman of the Board of Trustees of the National Parks Conservation Association (2008-2011) and as a member of the Board of Directors for the Western Union Company (global money transfer, 2006-2011). |
Ned C. Lautenbach (1944) |
Year of Election or Appointment: 2000 Trustee Chairman of the Independent Trustees |
| Mr. Lautenbach also serves as Trustee of other Fidelity funds. Mr. Lautenbach currently serves as the Lead Director of the Eaton Corporation Board of Directors (diversified industrial, 1997-present). Mr. Lautenbach is Chairman of the Board of Directors of the Philharmonic Center for the Arts in Naples, Florida (2012-present) and a member of the Council on Foreign Relations (1994-present). Previously, Mr. Lautenbach was a Partner/Advisory Partner at Clayton, Dubilier & Rice, LLC (private equity investment, 1998-2010), as well as a Director of Sony Corporation (2006-2007). |
Joseph Mauriello (1944) |
Year of Election or Appointment: 2008 Trustee |
| Mr. Mauriello also serves as Trustee of other Fidelity funds. Prior to his retirement in January 2006, Mr. Mauriello served in numerous senior management positions including Deputy Chairman and Chief Operating Officer (2004-2005), and Vice Chairman of Financial Services (2002-2004) of KPMG LLP US (professional services, 1965-2005). Mr. Mauriello currently serves as a member of the Board of Directors of XL Group plc. (global insurance and re-insurance, 2006-present). Previously, Mr. Mauriello served as a Director of the Hamilton Funds of the Bank of New York (2006-2007) and of Arcadia Resources Inc. (health care services and products, 2007-2012). |
Robert W. Selander (1950) |
Year of Election or Appointment: 2011 Trustee |
| Mr. Selander also serves as Trustee of other Fidelity funds. Previously, Mr. Selander served as a Member of the Advisory Board of other Fidelity funds (2011), and Executive Vice Chairman (2010), Chief Executive Officer (2009-2010), and President and Chief Executive Officer (1997-2009) of Mastercard, Inc. |
Cornelia M. Small (1944) |
Year of Election or Appointment: 2005 Trustee |
| Ms. Small also serves as Trustee of other Fidelity funds. Ms. Small is a member of the Board of Directors (2009-present) and Chair of the Investment Committee (2010-present) of the Teagle Foundation. Ms. Small also serves on the Investment Committee of the Berkshire Taconic Community Foundation (2008-present). Previously, Ms. Small served as Chairperson (2002-2008) and a member of the Investment Committee and Chairperson (2008-2012) and a member of the Board of Trustees of Smith College. In addition, Ms. Small served as Chief Investment Officer, Director of Global Equity Investments, and a member of the Board of Directors of Scudder, Stevens & Clark and Scudder Kemper Investments. |
William S. Stavropoulos (1939) |
Year of Election or Appointment: 2001 Trustee Vice Chairman of the Independent Trustees |
| Mr. Stavropoulos also serves as Trustee of other Fidelity funds. Mr. Stavropoulos serves as President and Founder of the Michigan Baseball Foundation, the Great Lakes Loons (2007-present). Mr. Stavropoulos is Chairman Emeritus of the Board of Directors of The Dow Chemical Company, where he previously served in numerous senior management positions, including President, CEO (1995-2000; 2002-2004), Chairman of the Executive Committee (2000-2006), and as a member of the Board of Directors (1990-2006). Currently, Mr. Stavropoulos is Chairman of the Board of Directors of Univar Inc. (global distributor of commodity and specialty chemicals), a Director of Teradata Corporation (data warehousing and technology solutions), and Maersk Inc. (industrial conglomerate), and a member of the Advisory Board for Metalmark Capital LLC (private equity investment, 2005-present). Mr. Stavropoulos is an operating advisor to Clayton, Dubilier & Rice, LLC (private equity investment). In addition, Mr. Stavropoulos is a member of the University of Notre Dame Advisory Council for the College of Science, a Trustee of the Rollin L. Gerstacker Foundation, and a Director of the Naples Philharmonic Center for the Arts. Previously, Mr. Stavropoulos served as a Director of Chemical Financial Corporation (bank holding company, 1993-2012) and Tyco International, Ltd. (multinational manufacturing and services, 2007-2012). |
David M. Thomas (1949) |
Year of Election or Appointment: 2008 Trustee |
| Mr. Thomas also serves as Trustee of other Fidelity funds. Mr. Thomas serves as Non-Executive Chairman of the Board of Directors of Fortune Brands Home and Security (home and security products, 2011-present), and as a member of the Board of Directors of Interpublic Group of Companies, Inc. (marketing communication, 2004-present). Previously, Mr. Thomas served as Executive Chairman (2005-2006) and Chairman and Chief Executive Officer (2000-2005) of IMS Health, Inc. (pharmaceutical and healthcare information solutions), and a Director of Fortune Brands, Inc. (consumer products, 2000-2011). |
+ The information above includes each Trustee's principal occupation during the last five years and other information relating to the experience, attributes, and skills relevant to each Trustee's qualifications to serve as a Trustee, which led to the conclusion that each Trustee should serve as a Trustee for the fund.
Advisory Board Member and Executive Officers:
Correspondence intended for each executive officer and Peter S. Lynch may be sent to Fidelity Investments, 245 Summer Street, Boston, Massachusetts 02210. Executive officers appear below in alphabetical order.
Name, Year of Birth; Principal Occupation |
Peter S. Lynch (1944) |
Year of Election or Appointment: 2003 Member of the Advisory Board |
| Mr. Lynch also serves as Member of the Advisory Board of other Fidelity funds. Mr. Lynch is Vice Chairman and a Director of FMR and FMR Co., Inc. In addition, Mr. Lynch serves as a Trustee of Boston College and as the Chairman of the Inner-City Scholarship Fund. Previously, Mr. Lynch served on the Special Olympics International Board of Directors (1997-2006). |
Elizabeth Paige Baumann (1968) |
Year of Election or Appointment: 2012 Anti-Money Laundering (AML) Officer |
| Ms. Baumann also serves as AML Officer of other funds. She is Chief AML Officer of FMR LLC (2012-present) and is an employee of Fidelity Investments. Previously, Ms. Baumann served as Vice President and Deputy Anti-Money Laundering Officer (2007-2012). |
William C. Coffey (1969) |
Year of Election or Appointment: 2009 Assistant Secretary |
| Mr. Coffey also serves as Assistant Secretary of other funds. He is Senior Vice President and Deputy General Counsel of FMR LLC (2010-present), and is an employee of Fidelity Investments. Previously, Mr. Coffey served as Vice President and Associate General Counsel of FMR LLC (2005-2009). |
Jonathan Davis (1968) |
Year of Election or Appointment: 2010 Assistant Treasurer |
| Mr. Davis also serves as Assistant Treasurer of other funds. Mr. Davis is an employee of Fidelity Investments. Previously, Mr. Davis served as Vice President and Associate General Counsel of FMR LLC (2003-2010). |
Adrien E. Deberghes (1967) |
Year of Election or Appointment: 2008 Deputy Treasurer |
| Mr. Deberghes also serves as an officer of other funds. He is an employee of Fidelity Investments (2008-present). Prior to joining Fidelity Investments, Mr. Deberghes was Senior Vice President of Mutual Fund Administration at State Street Corporation (2007-2008), Senior Director of Mutual Fund Administration at Investors Bank & Trust (2005-2007), and Director of Finance for Dunkin' Brands (2000-2005). |
Stephanie J. Dorsey (1969) |
Year of Election or Appointment: 2010 Assistant Treasurer |
| Ms. Dorsey also serves as an officer of other funds. She is an employee of Fidelity Investments (2008-present) and has served in other fund officer roles. Prior to joining Fidelity Investments, Ms. Dorsey served as Treasurer (2004-2008) of the JPMorgan Mutual Funds and Vice President (2004-2008) of JPMorgan Chase Bank. |
Scott C. Goebel (1968) |
Year of Election or Appointment: 2008 Secretary and Chief Legal Officer (CLO) |
| Mr. Goebel serves as Secretary and CLO of other funds. Mr. Goebel also serves as Secretary of Fidelity Investments Money Management, Inc. (FIMM) (2010-present) and Fidelity Research and Analysis Company (FRAC) (2010-present); General Counsel, Secretary, and Senior Vice President of FMR (2008-present) and FMR Co., Inc. (2008-present); Chief Legal Officer of Fidelity Management & Research (Hong Kong) Limited (2008-present) and Assistant Secretary of Fidelity Management & Research (Japan) Inc. (2008-present), and Fidelity Management & Research (U.K.) Inc. (2008-present). Previously, Mr. Goebel served as Secretary and CLO of other Fidelity funds (2008-2013), Assistant Secretary of FIMM (2008-2010), FRAC (2008-2010), and certain funds (2007-2008); and as Vice President and Secretary of Fidelity Distributors Corporation (FDC) (2005-2007). Mr. Goebel has been employed by FMR LLC or an affiliate since 2001. |
Joseph A. Hanlon (1968) |
Year of Election or Appointment: 2012 Chief Compliance Officer |
| Mr. Hanlon also serves as Chief Compliance Officer of other funds. Mr. Hanlon serves as Compliance Officer of FMR, FMR Co., Inc., Fidelity Investments Money Management, Inc. (FIMM), Fidelity Research and Analysis Company (FRAC), and Fidelity Management & Research (Hong Kong) (2009-present), as Senior Vice President of the Fidelity Asset Management Division (2009-present), and is an employee of Fidelity Investments. Previously, Mr. Hanlon served as Compliance Officer of Fidelity Management & Research (Japan) Inc. (2009-2013), Strategic Advisers, Inc. (2009-2013), and Fidelity Management & Research (U.K.) Inc. (2009-2013). |
Bruce T. Herring (1965) |
Year of Election or Appointment: 2006 Vice President of certain Equity Funds |
| Mr. Herring also serves as Vice President of other funds. He serves as Chief Investment Officer of Fidelity Global Asset Allocation (GAA) (2013-present), Chief Investment Officer and Director of Fidelity Management & Research (U.K.) Inc. (2010-present), Group Chief Investment Officer of FMR, and President of Fidelity Research & Analysis Company (2010-present). Previously, Mr. Herring served as Vice President (2005-2006) and Senior Vice President (2006-2007) of Fidelity Management & Research Company, Vice President of FMR Co., Inc. (2001-2007), and as a portfolio manager for Fidelity U.S. Equity Funds. |
Brian B. Hogan (1964) |
Year of Election or Appointment: 2009 Vice President |
| Mr. Hogan also serves as Vice President of other funds. Mr. Hogan serves as President of FMR's Equity Division (2009-present). Previously, Mr. Hogan served as Senior Vice President, Equity Research of FMR (2006-2009) and as a portfolio manager. |
Chris Maher (1972) |
Year of Election or Appointment: 2013 Assistant Treasurer |
| Mr. Maher serves as Assistant Treasurer of other funds. Mr. Maher is Vice President of Valuation Oversight and is an employee of Fidelity Investments. Previously, Mr. Maher served as Vice President of Asset Management Compliance (2013), Vice President of FMR's Program Management Group (2010-2013), and Vice President of Valuation Oversight (2008-2010). |
Christine Reynolds (1958) |
Year of Election or Appointment: 2008 Chief Financial Officer |
| Ms. Reynolds also serves as Chief Financial Officer of other funds. Ms. Reynolds became President of Fidelity Pricing and Cash Management Services (FPCMS) in August 2008. Ms. Reynolds served as Chief Operating Officer of FPCMS (2007-2008). Previously, Ms. Reynolds served as President, Treasurer, and Anti-Money Laundering officer of the Fidelity funds (2004-2007). |
Kenneth B. Robins (1969) |
Year of Election or Appointment: 2008 President and Treasurer |
| Mr. Robins also serves as an officer of other funds. Mr. Robins serves as Executive Vice President of Fidelity Investments Money Management, Inc. (FIMM) (2013-present) and is an employee of Fidelity Investments (2004-present). Previously, Mr. Robins served in other fund officer roles. |
Gary W. Ryan (1958) |
Year of Election or Appointment: 2005 Assistant Treasurer |
| Mr. Ryan also serves as Assistant Treasurer of other funds. Mr. Ryan is an employee of Fidelity Investments and has served in other fund officer roles. Previously, Mr. Ryan served as Vice President of Fund Reporting in Fidelity Pricing and Cash Management Services (FPCMS) (1999-2005). |
Stephen Sadoski (1971) |
Year of Election or Appointment: 2012 Deputy Treasurer |
| Mr. Sadoski also serves as Deputy Treasurer of other funds. He is an employee of Fidelity Investments (2012-present) and has served in another fund officer role. Prior to joining Fidelity Investments, Mr. Sadoski served as an assistant chief accountant in the Division of Investment Management of the Securities and Exchange Commission (SEC) (2009-2012) and as a senior manager at Deloitte & Touche LLP (1997-2009). |
Stacie M. Smith (1974) |
Year of Election or Appointment: 2013 Deputy Treasurer |
| Ms. Smith also serves as an officer of other funds. She is an employee of Fidelity Investments (2009-present) and has served in other fund officer roles. Prior to joining Fidelity Investments, Ms. Smith served as Senior Audit Manager of Ernst & Young LLP (1996-2009). |
Renee Stagnone (1975) |
Year of Election or Appointment: 2013 Deputy Treasurer |
| Ms. Stagnone also serves as Deputy Treasurer of other funds. Ms. Stagnone is an employee of Fidelity Investments. |
Joseph F. Zambello (1957) |
Year of Election or Appointment: 2011 Deputy Treasurer |
| Mr. Zambello also serves as Deputy Treasurer of other funds. Mr. Zambello is an employee of Fidelity Investments. Previously, Mr. Zambello served as Vice President of FMR's Program Management Group (2009-2011) and Vice President of the Transfer Agent Oversight Group (2005-2009). |
Annual Report
Distributions (Unaudited)
The Board of Trustees of Fidelity Latin America Fund voted to pay to shareholders of record at the opening of business on record date, the following distributions per share derived from capital gains realized from sales of portfolio securities and dividends derived from net investment income:
| Pay Date | Record Date | Dividends | Capital Gains |
Class A | 12/09/2013 | 12/06/2013 | $0.517 | $6.250 |
| | | | |
Class T | 12/09/2013 | 12/06/2013 | $0.384 | $6.250 |
| | | | |
Class B | 12/09/2013 | 12/06/2013 | $0.054 | $6.250 |
| | | | |
Class C | 12/09/2013 | 12/06/2013 | $0.109 | $6.250 |
The fund hereby designates as a capital gain dividend with respect to the taxable year ended October 31, 2013, $266,757,493, or, if subsequently determined to be different, the net capital gain of such year.
Class A designates 6%, Class T designates 8%, Class B designates 13%, and Class C designates 12% of the dividends distributed during the fiscal year as qualifying for the dividends-received deduction for corporate shareholders.
Class A, Class T, Class B and Class C designates 100% of the dividends distributed during the fiscal year as amounts which may be taken into account as a dividend for purposes of the maximum rate under section 1(h)(11) of the Internal Revenue Code.
The amounts per share which represent income derived from sources within, and taxes paid to, foreign countries or possessions of the United States are as follows:
| Pay Date | Income | Taxes |
Class A | 12/10/2012 | $0.926 | $0.1408 |
| | | |
Class T | 12/10/2012 | $0.773 | $0.1408 |
| | | |
Class B | 12/10/2012 | $0.451 | $0.1408 |
| | | |
Class C | 12/10/2012 | $0.496 | $0.1408 |
The fund will notify shareholders in January 2014 of amounts for use in preparing 2013 income tax returns.
Annual Report
Board Approval of Investment Advisory Contracts and Management Fees
Fidelity Latin America Fund
Each year, the Board of Trustees, including the Independent Trustees (together, the Board), votes on the renewal of the management contract and sub-advisory agreements (together, the Advisory Contracts) for the fund. The Board, assisted by the advice of fund counsel and Independent Trustees' counsel, requests and considers a broad range of information relevant to the renewal of the Advisory Contracts throughout the year.
The Board meets regularly and, at each of its meetings, covers an extensive agenda of topics and materials and considers factors that are relevant to its annual consideration of the renewal of the fund's Advisory Contracts, including the services and support provided to the fund and its shareholders. The Board has established various standing committees, each composed of and chaired by Independent Trustees with varying backgrounds, to which the Board has assigned specific subject matter responsibilities in order to enhance effective decision-making by the Board. The Board, acting directly and through its Committees, requests and receives information concerning the annual consideration of the renewal of the fund's Advisory Contracts. The Board also meets as needed to consider matters specifically related to the Board's annual consideration of the renewal of Advisory Contracts. Members of the Board may also meet with trustees of other Fidelity funds through ad hoc joint committees to discuss certain matters relevant to the Fidelity funds.
At its July 2013 meeting, the Board, including the Independent Trustees, unanimously determined to renew the fund's Advisory Contracts. In reaching its determination, the Board considered all factors it believed relevant, including (i) the nature, extent, and quality of the services to be provided to the fund and its shareholders (including the investment performance of the fund); (ii) the competitiveness of the fund's management fee and total expense ratio relative to peer funds; (iii) the total costs of the services to be provided by and the profits to be realized by Fidelity from its relationship with the fund; (iv) the extent to which economies of scale exist and would be realized as the fund grows; and (v) whether fee levels reflect these economies of scale, if any, for the benefit of fund shareholders.
In considering whether to renew the Advisory Contracts for the fund, the Board reached a determination, with the assistance of fund counsel and Independent Trustees' counsel and through the exercise of its business judgment, that the renewal of the Advisory Contracts was in the best interests of the fund and its shareholders and that the compensation payable under the Advisory Contracts was fair and reasonable. The Board's decision to renew the Advisory Contracts was not based on any single factor, but rather was based on a comprehensive consideration of all the information provided to the Board at its meetings throughout the year. The Board, in reaching its determination to renew the Advisory Contracts, was aware that shareholders in the fund have a broad range of investment choices available to them, including a wide choice among mutual funds offered by Fidelity's competitors, and that the fund's shareholders, who have the opportunity to review and weigh the disclosure provided by the fund in its prospectus and other public disclosures, have chosen to invest in this fund, which is a part of the Fidelity family of funds.
Nature, Extent, and Quality of Services Provided. The Board considered the staffing within the investment adviser, Fidelity Management & Research Company (FMR), and the sub-advisers (together, the Investment Advisers) as it relates to the fund, including the backgrounds of the fund's investment personnel, and also considered the fund's investment objective, strategies, and related investment philosophy. The Independent Trustees also had discussions with senior management of Fidelity's investment operations and investment groups. The Board considered the structure of the portfolio manager compensation program and whether this structure provides appropriate incentives to act in the best interests of the fund.
Resources Dedicated to Investment Management and Support Services. The Board and the Fund Oversight and Research Committees reviewed the general qualifications and capabilities of the Investment Advisers' investment staff, including its size, education, experience, and resources, as well as the Investment Advisers' approach to recruiting, training, managing, and compensating investment personnel. The Board noted that FMR has continued to increase the resources devoted to non-U.S. offices, including expansion of Fidelity's global investment organization. The Board also noted that Fidelity's analysts have extensive resources, tools and capabilities that allow them to conduct sophisticated quantitative and fundamental analysis, as well as credit analysis of issuers, counterparties and guarantors. Further, the Board believes that Fidelity's investment professionals have sufficient access to global information and data so as to provide competitive investment results over time, and that those professionals also have access to sophisticated tools that permit them to assess portfolio construction and risk and performance attribution characteristics continuously, as well as to transmit new information and research conclusions rapidly around the world. Additionally, in its deliberations, the Board considered the Investment Advisers' trading and risk management capabilities and resources, which are an integral part of the investment management process.
Shareholder and Administrative Services. The Board considered (i) the nature, extent, quality, and cost of advisory, administrative, and shareholder services performed by the Investment Advisers and their affiliates under the Advisory Contracts and under separate agreements covering transfer agency, pricing and bookkeeping, and securities lending services for the fund; (ii) the nature and extent of the supervision of third party service providers, principally custodians and subcustodians; and (iii) the resources devoted to, and the record of compliance with, the fund's compliance policies and procedures. The Board also reviewed the allocation of fund brokerage, including allocations to brokers affiliated with the Investment Advisers, the use of brokerage commissions to pay fund expenses, and the use of "soft" commission dollars to pay for research services.
The Board noted that the growth of fund assets over time across the complex allows Fidelity to reinvest in the development of services designed to enhance the value or convenience of the Fidelity funds as investment vehicles. These services include 24-hour access to account information and market information through telephone representatives and over the Internet, investor education materials and asset allocation tools, and the expanded availability of Fidelity Investor Centers.
Annual Report
Investment in a Large Fund Family. The Board considered the benefits to shareholders of investing in a Fidelity fund, including the benefits of investing in a fund that is part of a large family of funds offering a variety of investment disciplines and providing a large variety of mutual fund investor services. The Board noted that Fidelity had taken, or had made recommendations that resulted in the Fidelity funds taking, a number of actions over the previous year that benefited particular funds, including (i) continuing to dedicate additional resources to investment research and to the support of the senior management team that oversees asset management; (ii) persisting in efforts to enhance Fidelity's global research capabilities; (iii) launching new funds and making other enhancements to meet client needs for global and income-oriented solutions; (iv) continuing to launch dedicated lower cost underlying funds to meet portfolio construction needs related to expanding underlying fund options for Fidelity funds of funds, specifically for the Freedom Fund product lines; (v) rationalizing product lines and gaining increased efficiencies through the mergers of several funds into other funds; (vi) strengthening Fidelity's index fund offerings by reducing investment minimums and adopting or lowering existing expense caps for certain funds and classes; (vii) enhancing Global Asset Allocation product offerings by launching new funds and strategies, including "open architecture" target date funds that utilize affiliated and unaffiliated sub-advisers; (viii) modifying the eligibility criteria for Institutional Class shares of Advisor funds to increase their marketability to a portion of the defined contribution plan market; (ix) creating a new low-cost retirement share class for certain Advisor funds to appeal to large retirement plans; (x) transitioning the management of certain Fidelity commodity funds to Geode Capital Management LLC, a registered commodity pool operator, while retaining administrative responsibilities for the funds; (xi) reorganizing a number of funds; and (xii) taking steps toward establishing a new Fidelity adviser to manage sector-based funds and products.
Investment Performance. The Board considered whether the fund has operated in accordance with its investment objective, as well as its record of compliance with its investment restrictions and its performance history.
The Board took into account discussions with the Investment Advisers about fund investment performance that occur at Board meetings throughout the year. In this regard the Board noted that as part of regularly scheduled fund reviews and other reports to the Board on fund performance, the Board periodically considers annualized return information for the fund, for different time periods, measured against a securities market index ("benchmark index") and a peer group of mutual funds with similar objectives ("peer group"). In its evaluation of fund investment performance, the Board gave particular attention to information indicating changes in performance of certain Fidelity funds for specific time periods and the Investment Advisers' explanations for any overperformance or underperformance.
In addition to reviewing absolute and relative fund performance, the Independent Trustees periodically consider the appropriateness of fund performance metrics in evaluating the results achieved. In general, the Independent Trustees believe that fund performance should be evaluated based on net performance (after fees and expenses) of both the highest performing and lowest performing classes, where applicable, compared to appropriate benchmark indices, over appropriate time periods which may include full market cycles, and compared to peer groups, as applicable, over the same periods, taking into account relevant factors including the following: general market conditions; issuer-specific information; tactical opportunities for investment; and fund cash flows and other factors.
The Independent Trustees recognize that shareholders evaluate performance on a net basis over their own holding periods, for which one-, three-, and five-year periods are used as a proxy. For this reason, the performance information reviewed by the Board also included net cumulative calendar year total return information for the fund and an appropriate benchmark index for the most recent one-, three-, and five-year periods, as shown below. A peer group comparison is not shown below.
Annual Report
Board Approval of Investment Advisory Contracts and Management Fees - continued
Fidelity Latin America Fund
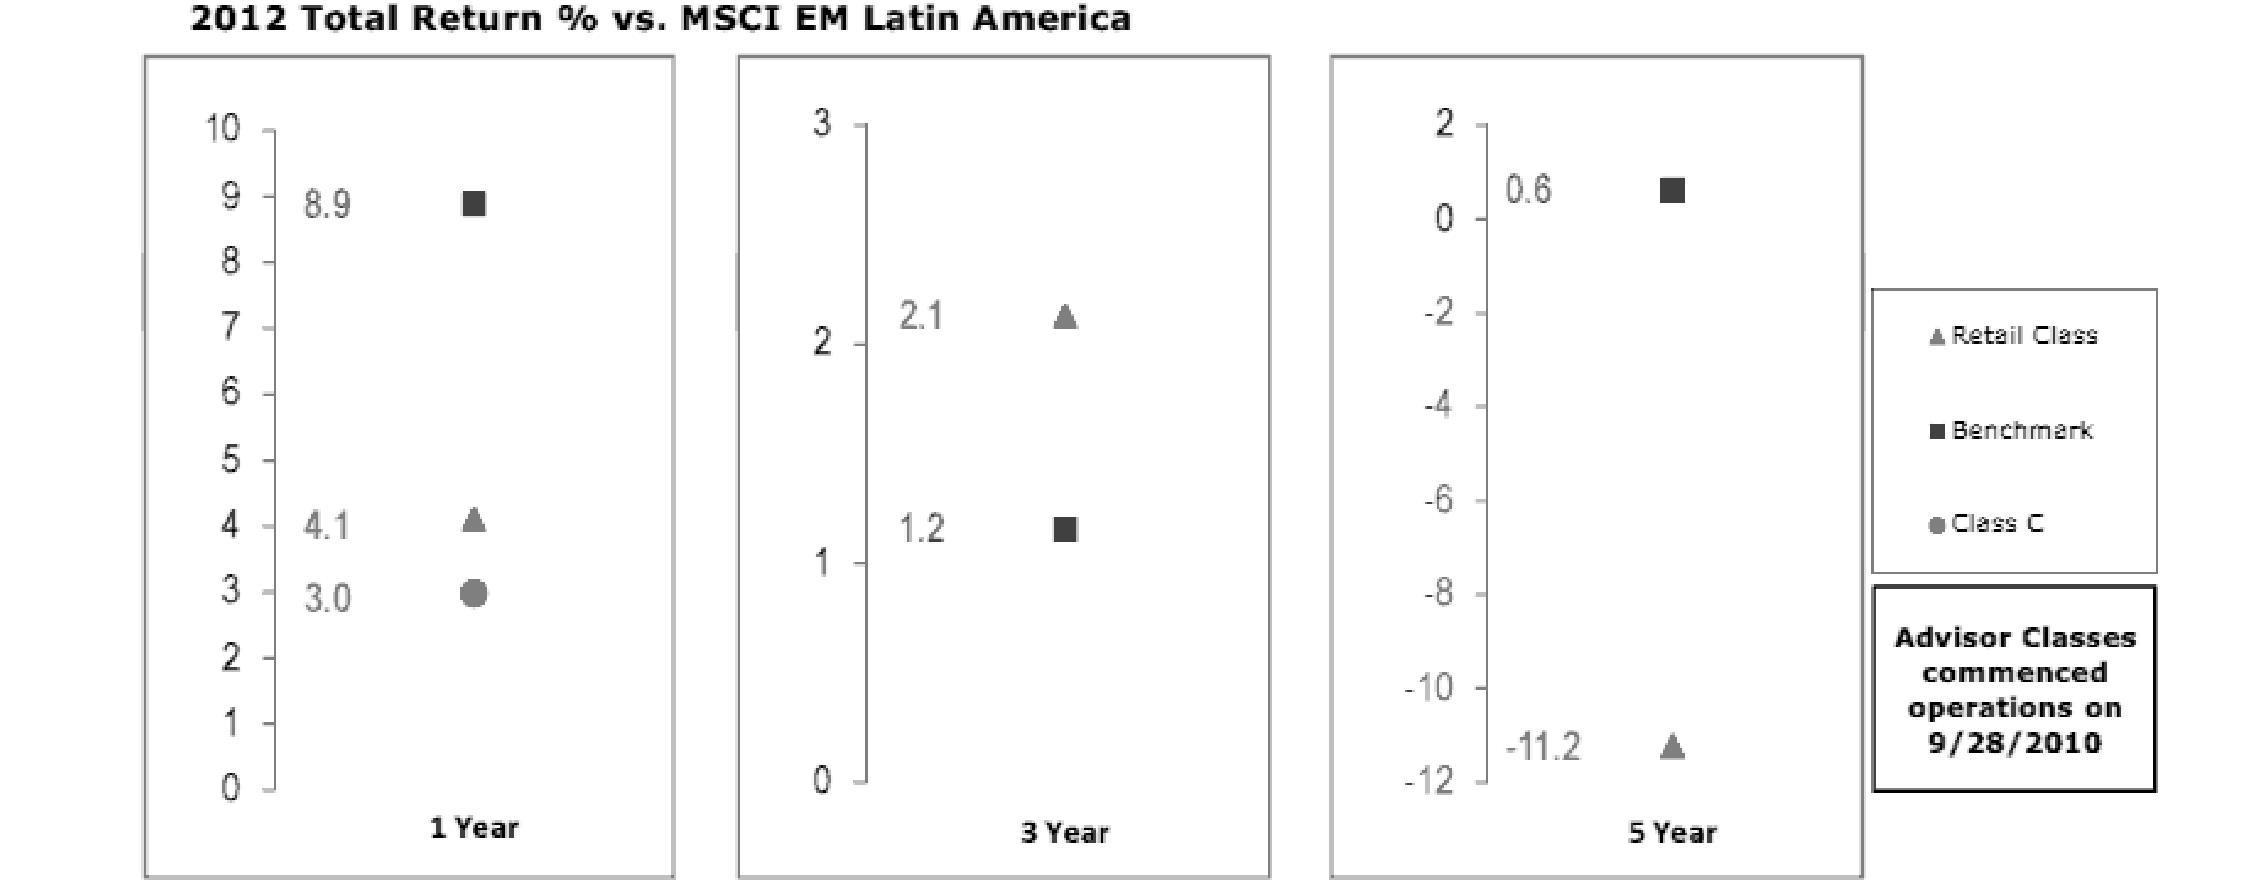
Based on its review, the Board concluded that the nature, extent, and quality of services provided to the fund under the Advisory Contracts should benefit the fund's shareholders.
Competitiveness of Management Fee and Total Expense Ratio. The Board considered the fund's management fee and total expense ratio compared to "mapped groups" of competitive funds and classes. Fidelity creates "mapped groups" by combining similar Lipper investment objective categories that have comparable management fee characteristics. Combining Lipper investment objective categories aids the Board's management fee and total expense ratio comparisons by broadening the competitive group used for comparison and by reducing the number of universes to which various Fidelity funds are compared.
Management Fee. The Board considered two proprietary management fee comparisons for the 12-month periods shown in the chart below. The group of Lipper funds used by the Board for management fee comparisons is referred to below as the "Total Mapped Group." The Total Mapped Group comparison focuses on a fund's standing in terms of gross management fees before expense reimbursements or caps relative to the total universe of funds with comparable investment mandates, regardless of whether their management fee structures also are comparable. Funds with comparable investment mandates offer exposure to similar types of securities. Funds with comparable management fee structures have similar management fee contractual arrangements (e.g., flat rate charged for advisory services, all-inclusive fee rate, etc.). "TMG %" represents the percentage of funds in the Total Mapped Group that had management fees that were lower than the fund's. For example, a TMG % of 8% means that 92% of the funds in the Total Mapped Group had higher management fees than the fund. The "Asset-Size Peer Group" (ASPG) comparison focuses on a fund's standing relative to a subset of non-Fidelity funds within the Total Mapped Group that are similar in size and management fee structure. The ASPG represents at least 15% of the funds in the Total Mapped Group with comparable asset size and management fee structures, subject to a minimum of 50 funds (or all funds in the Total Mapped Group if fewer than 50). Additional information, such as the ASPG quartile in which the fund's management fee ranked, is also included in the chart and considered by the Board.
Annual Report
Fidelity Latin America Fund

The Board noted that the fund's management fee ranked below the median of its Total Mapped Group and below the median of its ASPG for 2012.
Based on its review, the Board concluded that the fund's management fee is fair and reasonable in light of the services that the fund receives and the other factors considered.
Total Expense Ratio. In its review of each class's total expense ratio, the Board considered the fund's management fee as well as other fund or class expenses, as applicable, such as transfer agent fees, pricing and bookkeeping fees, fund-paid 12b-1 fees, and custodial, legal, and audit fees. The Board also noted the effects of any waivers and reimbursements on fees and expenses. As part of its review, the Board also considered the current and historical total expense ratios of each class of the fund compared to competitive fund median expenses. Each class of the fund is compared to those funds and classes in the Total Mapped Group (used by the Board for management fee comparisons) that have a similar sales load structure.
The Board noted that the total expense ratio of each class ranked below its competitive median for 2012.
Fees Charged to Other Fidelity Clients. The Board also considered Fidelity fee structures and other information with respect to clients of FMR and its affiliates, such as other mutual funds advised or subadvised by FMR or its affiliates, pension plan clients, and other institutional clients. The Board noted the findings of the 2013 ad hoc joint committee (created with the board of other Fidelity funds), which reviewed and compared Fidelity's institutional investment advisory business with its business of providing services to the Fidelity funds, including the differences in services provided, fees charged, and costs incurred, as well as competition in their respective marketplaces.
Based on its review of total expense ratios and fees charged to other Fidelity clients, the Board concluded that the total expense ratio of each class of the fund was reasonable in light of the services that the fund and its shareholders receive and the other factors considered.
Costs of the Services and Profitability. The Board considered the revenues earned and the expenses incurred by Fidelity in conducting the business of developing, marketing, distributing, managing, administering and servicing the fund and servicing the fund's shareholders. The Board also considered the level of Fidelity's profits in respect of all the Fidelity funds.
On an annual basis, FMR presents to the Board Fidelity's profitability for the fund. Fidelity calculates the profitability for each fund, as well as aggregate profitability for groups of Fidelity funds and all Fidelity funds, using a series of detailed revenue and cost allocation methodologies which originate with the books and records of Fidelity on which Fidelity's audited financial statements are based. The Audit Committee of the Board reviews any significant changes from the prior year's methodologies.
PricewaterhouseCoopers LLP (PwC), independent registered public accounting firm and auditor to Fidelity and certain Fidelity funds, has been engaged annually by the Board as part of the Board's assessment of Fidelity's profitability analysis. PwC's engagement includes the review and assessment of the methodologies used by Fidelity in determining the revenues and expenses attributable to Fidelity's mutual fund business, and completion of agreed-upon procedures surrounding the mathematical accuracy of fund profitability and its conformity to allocation methodologies. After considering PwC's reports issued under the engagement and information provided by Fidelity, the Board concluded that while other allocation methods may also be reasonable, Fidelity's profitability methodologies are reasonable in all material respects.
Annual Report
Board Approval of Investment Advisory Contracts and Management Fees - continued
The Board also reviewed Fidelity's non-fund businesses and fall-out benefits related to the mutual fund business as well as cases where Fidelity's affiliates may benefit from or be related to the fund's business.
The Board considered the costs of the services provided by and the profits realized by Fidelity in connection with the operation of the fund and was satisfied that the profitability was not excessive in the circumstances.
Economies of Scale. The Board considered whether there have been economies of scale in respect of the management of the Fidelity funds, whether the Fidelity funds (including the fund) have appropriately benefited from any such economies of scale, and whether there is potential for realization of any further economies of scale. The Board considered the extent to which the fund will benefit from economies of scale through increased services to the fund, through waivers or reimbursements, or through fee or expense reductions. The Board also noted that in 2009, it and the board of other Fidelity funds created an ad hoc committee (the Economies of Scale Committee) to analyze whether FMR attains economies of scale in respect of the management and servicing of the Fidelity funds, whether the Fidelity funds have appropriately benefited from such economies of scale, and whether there is potential for realization of any further economies of scale.
The Board recognized that the fund's management contract incorporates a "group fee" structure, which provides for lower group fee rates as total fund assets under FMR's management increase, and for higher group fee rates as total fund assets under FMR's management decrease. FMR calculates the group fee rates based on a tiered asset "breakpoint" schedule that varies based on asset class. The Board considered that the group fee is designed to deliver the benefits of economies of scale to fund shareholders when total Fidelity fund assets increase, even if assets of any particular fund are unchanged or have declined, because some portion of Fidelity's costs are attributable to services provided to all Fidelity funds, and all funds benefit if those costs can be allocated among more assets. The Board concluded that, given the group fee structure, fund shareholders will benefit from lower management fees as assets under FMR's management increase at the fund complex level, regardless of whether Fidelity achieves any such economies of scale.
The Board concluded, taking into account the analysis of the Economies of Scale Committee, that economies of scale, if any, are being appropriately shared between fund shareholders and Fidelity.
Amendment to Description of Group Fee Rate. At its July 2013 meeting, the Board voted to approve an amendment to the fund's management contract to modify the description of the "group fee rate" effective August 1, 2013. The Board noted that under the prior description in the contract, the group fee rate was based on the average net assets of all registered investment companies with which FMR has management contracts. Under the contract's tiered asset breakpoint schedule, the group fee rate is lower as total fund assets under FMR's management increase, and higher as total fund assets under FMR's management decrease. The Board considered that the prior description would have excluded the assets of 64 Fidelity sector funds from the group fee rate calculation once Fidelity SelectCo, LLC, an affiliate of FMR, assumed management responsibilities for those funds. The Board noted that modifying the description of the group fee rate to continue to include the assets of those 64 funds for purposes of determining group fee rate breakpoints would avoid an immediate adverse impact on the group fee rate for any fund.
Additional Information Requested by the Board. In order to develop fully the factual basis for consideration of the Fidelity funds' Advisory Contracts, the Board requested and received additional information on certain topics, including: (i) fund performance trends and Fidelity's long-term strategies for certain funds; (ii) the potential to further rationalize the Fidelity fund lineup with the possibility of achieving savings for the funds and Fidelity; (iii) the methodology with respect to competitive fund data and peer group classifications; (iv) the arrangements with, and performance of, certain sub-advisers on behalf of the Fidelity funds, as well as certain proposed participating affiliate arrangements; (v) the realization of fall-out benefits in certain Fidelity business units; (vi) Fidelity's group fee structures, including the rationale for the individual fee rates of certain categories of funds and the definition of group assets; (vii) trends regarding industry use of performance fee structures and the performance adjustment methodologies applicable to the Fidelity funds; (viii) additional competitive analysis regarding the total expenses for certain classes; and (ix) fund profitability methodology, including Fidelity's cost allocation methodology, and the impact of certain factors on fund profitability results.
Based on its evaluation of all of the conclusions noted above, and after considering all factors it believed relevant, the Board ultimately concluded that the advisory fee structures are fair and reasonable, and that the fund's Advisory Contracts should be renewed.
Annual Report
Investment Adviser
Fidelity Management & Research Company
Boston, MA
Investment Sub-Advisers
FMR Co., Inc.
Fidelity Management & Research
(U.K.) Inc.
Fidelity Management & Research
(Hong Kong) Limited
Fidelity Management & Research
(Japan) Inc.
FIL Investment Advisors
FIL Investment Advisors
(UK) Limited
General Distributor
Fidelity Distributors Corporation
Smithfield, RI
Transfer and Service Agents
Fidelity Investments Institutional Operations Company, Inc.
Boston, MA
Fidelity Service Company, Inc.
Boston, MA
Custodian
Brown Brothers Harriman & Co.
Boston, MA
(Fidelity Investment logo)(registered trademark)
Corporate Headquarters
245 Summer St., Boston, MA 02210
www.fidelity.com
FALAA-UANN-1213
1.917416.103
Fidelity Advisor®
Latin America Fund -
Institutional Class
(Fidelity Cover Art)
Annual Report
October 31, 2013
Institutional Class is a class of
Fidelity® Latin America Fund
Contents
Performance | 3 | How the fund has done over time. |
Management's Discussion of Fund Performance | 3 | The Portfolio Manager's review of fund performance and strategy. |
Shareholder Expense Example | 3 | An example of shareholder expenses. |
Investment Changes | 4 | A summary of major shifts in the fund's investments over the past six months. |
Investments | 6 | A complete list of the fund's investments with their market values. |
Financial Statements | 10 | Statements of assets and liabilities, operations, and changes in net assets, as well as financial highlights. |
Notes | 20 | Notes to the financial statements. |
Report of Independent Registered Public Accounting Firm | 26 | |
Trustees and Officers | 26 | |
Distributions | 32 | |
Board Approval of Investment Advisory Contracts and Management Fees | 33 | |
To view a fund's proxy voting guidelines and proxy voting record for the 12-month period ended June 30, visit http://www.fidelity.com/proxyvotingresults or visit the Securities and Exchange Commission's (SEC) web site at http://www.sec.gov. You may also call 1-877-208-0098 to request a free copy of the proxy voting guidelines.
Standard & Poor's, S&P and S&P 500 are registered service marks of The McGraw-Hill Companies, Inc. and have been licensed for use by Fidelity Distributors Corporation.
Other third-party marks appearing herein are the property of their respective owners.
All other marks appearing herein are registered or unregistered trademarks or service marks of FMR LLC or an affiliated company. © 2013 FMR LLC. All rights reserved.
This report and the financial statements contained herein are submitted for the general information of the shareholders of the fund. This report is not authorized for distribution to prospective investors in the fund unless preceded or accompanied by an effective prospectus.
A fund files its complete schedule of portfolio holdings with the SEC for the first and third quarters of each fiscal year on Form N-Q. Forms N-Q are available on the SEC's web site at http://www.sec.gov. A fund's Forms N-Q may be reviewed and copied at the SEC's Public Reference Room in Washington, DC. Information regarding the operation of the SEC's Public Reference Room may be obtained by calling 1-800-SEC-0330. For a complete list of a fund's portfolio holdings, view the most recent holdings listing, semiannual report, or annual report on Fidelity's web site at http://www.fidelity.com, http://www.advisor.fidelity.com, or http://www.401k.com, as applicable.
NOT FDIC INSURED • MAY LOSE VALUE • NO BANK GUARANTEE
Neither the fund nor Fidelity Distributors Corporation is a bank.
Annual Report
Performance: The Bottom Line
Average annual total return reflects the change in the value of an investment, assuming reinvestment of the class' distributions from dividend income and capital gains (the profits earned upon the sale of securities that have grown in value, if any) and assuming a constant rate of performance each year. The $10,000 table and the fund's returns do not reflect the deduction of taxes that a shareholder would pay on fund distributions or the redemption of fund shares. During periods of reimbursement by Fidelity, a fund's total return will be greater than it would be had the reimbursement not occurred. How a fund did yesterday is no guarantee of how it will do tomorrow.
Average Annual Total Returns
Periods ended October 31, 2013 | Past 1
year | Past 5
years | Past 10
years |
Institutional Class A | -8.63% | 11.06% | 15.16% |
A The initial offering of Institutional Class shares took place on September 28, 2010. Returns prior to September 28, 2010 are those of Fidelity® Latin America Fund, the original class of the fund.
$10,000 Over 10 Years
Let's say hypothetically that $10,000 was invested in Fidelity Advisor® Latin America Fund - Institutional Class on October 31, 2003. The chart shows how the value of your investment would have changed, and also shows how the MSCI® EM (Emerging Markets) Latin America Index performed over the same period. See footnote A above for additional information regarding the performance of Institutional Class.
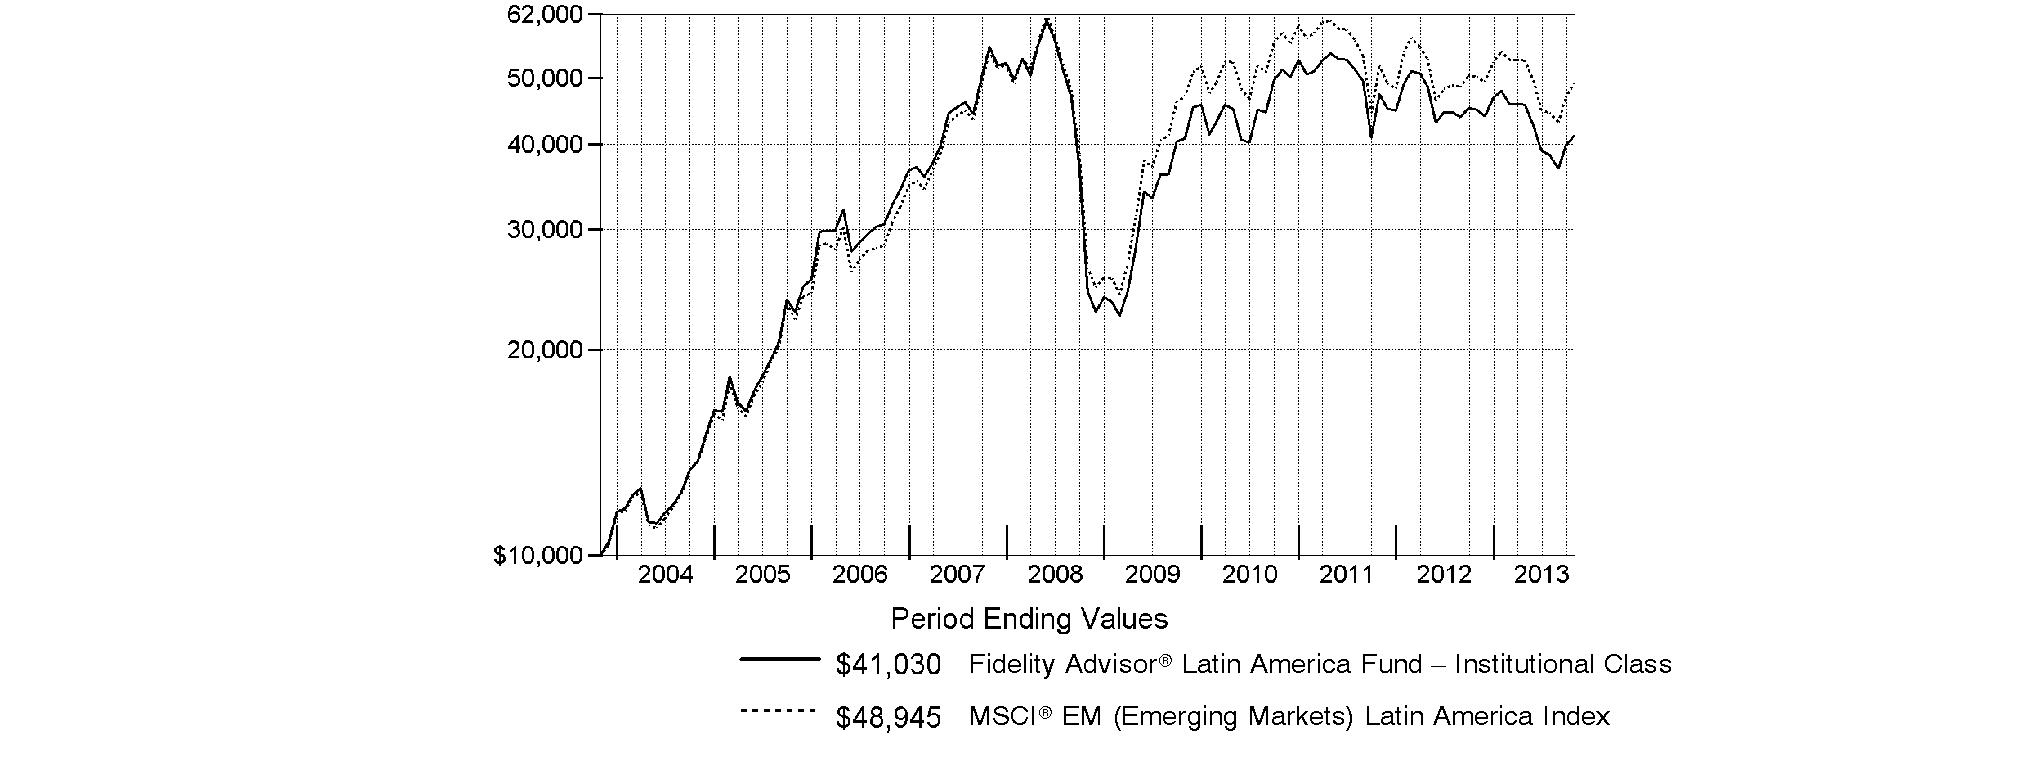
Annual Report
Management's Discussion of Fund Performance
Market Recap: On balance, global equity markets remained upbeat for the 12-month period ending October 31, 2013. The MSCI® ACWI® (All Country World Index) Index gained 23.75% for the period, amid investor preference for higher-risk assets. The period was not without turbulence, however. In the spring and summer, central banks worldwide, especially in the U.S. and China, made clear their intentions to maintain accommodative monetary policies. That stance, combined with modest cyclical improvements around the globe and generally low valuations, underpinned the broad rally in equities. Europe (+32%) shone brightly, with most markets in the region - large and small - registering solid, index-beating gains. Another bright spot was Japan, which, despite a struggling yen and taking a second-half breather, posted a 34% result for the full year. The U.S. - by far the index's biggest constituent - also outperformed the global market with a roughly 28% advance. Meanwhile, Asia-Pacific ex Japan (+14%) lagged, hurt in part by a slowdown in Australia's mining industry as well as currency headwinds. Foreign-exchange and commodity weakness also curbed results in resource-heavy Canada and emerging markets (EM), both of which were up 7%. Country-level EM performance diverged meaningfully for the period, as evidenced by performance in Brazil (-1%), Russia (+12%), India (+1%) and China (+8%).
Comments from Adam Kutas, Portfolio Manager of Fidelity Advisor® Latin America Fund: For the year, the fund's Institutional Class shares returned -8.63%, underperforming the -2.43% return of the MSCI® EM (Emerging Markets) Latin America Index. Versus the index, poor security selection and an underweighting in relatively strong Brazil, the largest index component by far, hurt, as did unfavorable security selection in Mexico and Peru. At the sector level, we were held back by security selection in consumer discretionary - particularly the media industry - and materials, including an overweighting in Peruvian gold mining company Compania de Minas Buenaventura, significantly underweighting Mexican cable TV company Grupo Televisa and an overweighting in Brazilian consumer-loyalty awards program manager Multiplus. On the plus side, positioning in consumer staples helped, including as it did the top two individual contributors during the period: an out-of-benchmark position in Mexican flour supplier Gruma and an overweighting in consumer products company Kimberly-Clark de Mexico, the latter of which was sold from the fund before period end.
Note to shareholders: Fidelity Advisor® Latin America Fund may invest up to 35% of its total assets in any industry that represents more than 20% of the Latin America market. As of October 31, 2013, the fund did not have more than 25% of its total assets in any one industry.
The views expressed above reflect those of the portfolio manager(s) only through the end of the period as stated on the cover of this report and do not necessarily represent the views of Fidelity or any other person in the Fidelity organization. Any such views are subject to change at any time based upon market or other conditions and Fidelity disclaims any responsibility to update such views. These views may not be relied on as investment advice and, because investment decisions for a Fidelity fund are based on numerous factors, may not be relied on as an indication of trading intent on behalf of any Fidelity fund.
Annual Report
Fidelity Latin America Fund
Shareholder Expense Example
As a shareholder of the Fund, you incur two types of costs: (1) transaction costs, including sales charges (loads) on purchase payments or redemption proceeds, redemption fees and (2) ongoing costs, including management fees, distribution and/or service (12b-1) fees and other Fund expenses. This Example is intended to help you understand your ongoing costs (in dollars) of investing in the Fund and to compare these costs with the ongoing costs of investing in other mutual funds.
The Example is based on an investment of $1,000 invested at the beginning of the period and held for the entire period (May 1, 2013 to October 31, 2013).
Actual Expenses
The first line of the accompanying table for each class of the Fund provides information about actual account values and actual expenses. You may use the information in this line, together with the amount you invested, to estimate the expenses that you paid over the period. Simply divide your account value by $1,000.00 (for example, an $8,600 account value divided by $1,000.00 = 8.6), then multiply the result by the number in the first line for a class of the Fund under the heading entitled "Expenses Paid During Period" to estimate the expenses you paid on your account during this period. A small balance maintenance fee of $12.00 that is charged once a year may apply for certain accounts with a value of less than $2,000. This fee is not included in the table below. If it was, the estimate of expenses you paid during the period would be higher, and your ending account value lower, by this amount. In addition, the Fund, as a shareholder in the underlying Fidelity Central Funds, will indirectly bear its pro-rata share of the fees and expenses incurred by the underlying Fidelity Central Funds. These fees and expenses are not included in the Fund's annualized expense ratio used to calculate the expense estimate in the table below.
Hypothetical Example for Comparison Purposes
The second line of the accompanying table for each class of the Fund provides information about hypothetical account values and hypothetical expenses based on a Class' actual expense ratio and an assumed rate of return of 5% per year before expenses, which is not the Class' actual return. The hypothetical account values and expenses may not be used to estimate the actual ending account balance or expenses you paid for the period. You may use this information to compare the ongoing costs of investing in the Fund and other funds. To do so, compare this 5% hypothetical example with the 5% hypothetical examples that appear in the shareholder reports of the other funds. A small balance maintenance fee of $12.00 that is charged once a year may apply for certain accounts with a value of less than $2,000. This fee is not included in the table below. If it was, the estimate of expenses you paid during the period would be higher, and your ending account value lower, by this amount. In addition, the Fund, as a shareholder in the underlying Fidelity Central Funds, will indirectly bear its pro-rata share of the fees and expenses incurred by the underlying Fidelity Central Funds. These fees and expenses are not included in the Fund's annualized expense ratio used to calculate the expense estimate in the table below.
Please note that the expenses shown in the table are meant to highlight your ongoing costs only and do not reflect any transaction costs. Therefore, the second line of the table is useful in comparing ongoing costs only, and will not help you determine the relative total costs of owning different funds. In addition, if these transactional costs were included, your costs would have been higher.
| Annualized
Expense Ratio B | Beginning
Account Value
May 1, 2013 | Ending
Account Value
October 31, 2013 | Expenses Paid
During Period*
May 1, 2013
to October 31, 2013 |
Class A | 1.36% | | | |
Actual | | $ 1,000.00 | $ 898.10 | $ 6.51 |
HypotheticalA | | $ 1,000.00 | $ 1,018.35 | $ 6.92 |
Class T | 1.63% | | | |
Actual | | $ 1,000.00 | $ 897.00 | $ 7.79 |
HypotheticalA | | $ 1,000.00 | $ 1,016.99 | $ 8.29 |
Class B | 2.10% | | | |
Actual | | $ 1,000.00 | $ 894.70 | $ 10.03 |
HypotheticalA | | $ 1,000.00 | $ 1,014.62 | $ 10.66 |
Class C | 2.11% | | | |
Actual | | $ 1,000.00 | $ 894.60 | $ 10.08 |
HypotheticalA | | $ 1,000.00 | $ 1,014.57 | $ 10.71 |
Latin America | 1.05% | | | |
Actual | | $ 1,000.00 | $ 899.50 | $ 5.03 |
HypotheticalA | | $ 1,000.00 | $ 1,019.91 | $ 5.35 |
Institutional Class | 1.03% | | | |
Actual | | $ 1,000.00 | $ 899.40 | $ 4.93 |
HypotheticalA | | $ 1,000.00 | $ 1,020.01 | $ 5.24 |
A 5% return per year before expenses
B Annualized expense ratio reflects expenses net of applicable fee waivers.
* Expenses are equal to each Class' annualized expense ratio, multiplied by the average account value over the period, multiplied by 184/365 (to reflect the one-half year period).
Annual Report
Fidelity Latin America Fund
Investment Changes (Unaudited)
Geographic Diversification (% of fund's net assets) |
As of October 31, 2013 |
 | Brazil | 50.1% | |
 | Mexico | 19.3% | |
 | Chile | 14.0% | |
 | Colombia | 8.8% | |
 | Peru | 3.3% | |
 | United States of America* | 2.7% | |
 | Spain | 0.9% | |
 | France | 0.5% | |
 | Panama | 0.2% | |
 | Other | 0.2% | |

* Includes Short-Term Investments and Net Other Assets (Liabilities). |
Percentages are based on country or territory of incorporation and are adjusted for the effect of futures contracts, if applicable. |
As of April 30, 2013 |
| Brazil | 46.3% | |
| Mexico | 23.8% | |
| Chile | 15.0% | |
| Colombia | 8.1% | |
| United States of America* | 4.4% | |
| Peru | 2.4% | |

* Includes Short-Term Investments and Net Other Assets (Liabilities). |
Percentages are based on country or territory of incorporation and are adjusted for the effect of futures contracts, if applicable. |
Asset Allocation as of October 31, 2013 |
| % of fund's
net assets | % of fund's net assets
6 months ago |
Stocks | 99.3 | 96.9 |
Short-Term Investments and Net Other Assets (Liabilities) | 0.7 | 3.1 |
Top Ten Stocks as of October 31, 2013 |
| % of fund's
net assets | % of fund's net assets
6 months ago |
America Movil S.A.B. de CV Series L (Mexico, Wireless Telecommunication Services) | 7.7 | 8.4 |
Petroleo Brasileiro SA - Petrobras (PN) (non-vtg.) (Brazil, Oil, Gas & Consumable Fuels) | 6.4 | 6.4 |
Itau Unibanco Holding SA (Brazil, Commercial Banks) | 5.9 | 6.4 |
Companhia de Bebidas das Americas (AmBev) (PN) sponsored ADR (Brazil, Beverages) | 4.4 | 5.1 |
Petroleo Brasileiro SA - Petrobras (Brazil, Oil, Gas & Consumable Fuels) | 3.8 | 4.0 |
Wal-Mart de Mexico SA de CV Series V (Mexico, Food & Staples Retailing) | 3.3 | 4.4 |
Fomento Economico Mexicano S.A.B. de CV sponsored ADR (Mexico, Beverages) | 3.1 | 5.1 |
CCR SA (Brazil, Transportation Infrastructure) | 2.9 | 2.9 |
Vale SA (Brazil, Steel) | 2.8 | 2.6 |
Grupo de Inversiones Suramerica SA (Colombia, Diversified Financial Services) | 2.7 | 2.2 |
| 43.0 | |
Market Sectors as of October 31, 2013 |
| % of fund's
net assets | % of fund's net assets
6 months ago |
Consumer Staples | 24.5 | 26.7 |
Financials | 22.8 | 19.5 |
Telecommunication Services | 13.5 | 15.1 |
Energy | 12.6 | 13.2 |
Materials | 10.8 | 9.5 |
Industrials | 5.4 | 6.2 |
Consumer Discretionary | 5.1 | 2.5 |
Utilities | 3.6 | 4.1 |
Information Technology | 1.0 | 0.1 |
Annual Report
Fidelity Latin America Fund
Investments October 31, 2013
Showing Percentage of Net Assets
Common Stocks - 78.0% |
| Shares | | Value |
Brazil - 30.5% |
Banco Bradesco SA | 287,900 | | $ 4,614,985 |
Banco Bradesco SA (PN) sponsored ADR | 159,621 | | 2,301,735 |
BB Seguridade Participacoes SA | 893,200 | | 9,756,541 |
Brasil Foods SA | 286,500 | | 6,727,033 |
BTG Pactual Participations Ltd. unit | 1,403,600 | | 18,777,739 |
CCR SA | 4,830,700 | | 40,173,172 |
Cielo SA | 451,800 | | 13,714,133 |
Companhia Brasileira de Distribuicao Grupo Pao de Acucar sponsored ADR (d) | 337,370 | | 17,010,195 |
Companhia de Bebidas das Americas (AmBev): | | | |
(PN) sponsored ADR | 1,674,213 | | 62,280,724 |
sponsored ADR (d) | 341,625 | | 12,691,369 |
Companhia de Saneamento Basico do Estado de Sao Paulo (SABESP) | 960,500 | | 10,178,676 |
Cyrela Brazil Realty SA | 1,736,900 | | 12,986,820 |
Embraer SA sponsored ADR | 268,634 | | 7,895,153 |
Estacio Participacoes SA | 960,700 | | 7,419,030 |
Industrias Romi SA (a) | 490,000 | | 1,367,065 |
Itau Unibanco Holding SA sponsored ADR | 1,505,938 | | 23,206,505 |
M. Dias Branco SA | 240,900 | | 11,298,707 |
Multiplus SA | 1,954,300 | | 24,208,475 |
Obrascon Huarte Lain Brasil SA | 166,500 | | 1,479,042 |
Petroleo Brasileiro SA - Petrobras: | | | |
(ON) | 1,194,028 | | 10,414,832 |
(PN) sponsored ADR (non-vtg.) | 381,913 | | 6,935,540 |
sponsored ADR | 2,512,645 | | 43,795,402 |
Souza Cruz SA | 2,756,400 | | 29,813,218 |
Telefonica Brasil SA sponsored ADR (d) | 304,542 | | 6,754,742 |
TIM Participacoes SA | 2,087,495 | | 10,641,547 |
Tractebel Energia SA | 734,175 | | 12,486,415 |
Vale SA: | | | |
(PN-A) sponsored ADR | 851,775 | | 12,469,986 |
sponsored ADR (d) | 544,093 | | 8,710,929 |
TOTAL BRAZIL | | 430,109,710 |
Canada - 0.1% |
First Majestic Silver Corp. (a) | 124,800 | | 1,412,401 |
Chile - 12.7% |
Aguas Andinas SA | 14,673,069 | | 9,939,591 |
Banco de Chile | 65,951,092 | | 10,052,634 |
Banco de Chile sponsored ADR (d) | 114,754 | | 10,537,860 |
Banco Santander Chile sponsored ADR (d) | 1,000,709 | | 24,577,413 |
CAP SA | 795,964 | | 16,531,502 |
Compania Cervecerias Unidas SA | 2,143,530 | | 28,747,785 |
Empresa Nacional de Telecomunicaciones SA (ENTEL) | 1,759,033 | | 27,069,709 |
Inversiones La Construccion SA | 731,460 | | 10,980,826 |
LATAM Airlines Group SA | 239,915 | | 3,973,995 |
|
| Shares | | Value |
LATAM Airlines Group SA sponsored ADR (d) | 804,554 | | $ 13,315,369 |
S.A.C.I. Falabella | 1,837,918 | | 18,291,278 |
Sociedad Matriz SAAM SA | 48,419,693 | | 4,867,019 |
TOTAL CHILE | | 178,884,981 |
Colombia - 8.4% |
Bolsa de Valores de Colombia | 586,230,591 | | 7,465,926 |
Cemex Latam Holdings SA | 673,456 | | 5,153,187 |
Ecopetrol SA | 9,879,672 | | 23,493,796 |
Ecopetrol SA ADR (d) | 15,216 | | 720,630 |
Empresa de Telecomunicaciones de Bogota | 40,032,169 | | 8,208,031 |
Grupo Aval Acciones y Valores SA | 4,519,256 | | 3,176,265 |
Grupo de Inversiones Suramerica SA | 1,765,744 | | 34,991,065 |
Inversiones Argos SA | 2,984,600 | | 34,603,570 |
TOTAL COLOMBIA | | 117,812,470 |
France - 0.5% |
Carrefour SA | 192,221 | | 7,041,458 |
Luxembourg - 0.1% |
Tenaris SA sponsored ADR | 28,821 | | 1,349,111 |
Mexico - 19.3% |
America Movil S.A.B. de CV: | | | |
Series L | 5,073,400 | | 5,443,875 |
Series L sponsored ADR | 4,789,573 | | 102,544,757 |
Consorcio ARA S.A.B. de CV (a) | 23,993,705 | | 9,378,827 |
Controladora Commercial Mexicana S.A.B. de CV unit (d) | 1,738,815 | | 7,128,645 |
Fomento Economico Mexicano S.A.B. de CV sponsored ADR | 465,111 | | 43,394,856 |
Gruma S.A.B. de CV Series B (a) | 3,297,556 | | 22,599,970 |
Grupo Financiero Inbursa S.A.B. de CV Series O | 4,007,300 | | 10,322,892 |
Grupo Financiero Santander Mexico S.A.B. de CV | 4,260,900 | | 11,926,503 |
Grupo Televisa SA de CV (CPO) sponsored ADR | 25,200 | | 767,088 |
Industrias Penoles SA de CV | 288,178 | | 8,431,811 |
Infraestructura Energetica Nova S.A.B. de CV | 1,223,900 | | 4,829,092 |
Wal-Mart de Mexico SA de CV Series V | 17,693,248 | | 45,998,580 |
TOTAL MEXICO | | 272,766,896 |
Panama - 0.2% |
Banco Latinoamericano de Exporaciones SA (BLADEX) Series E | 81,600 | | 2,140,368 |
Peru - 3.3% |
Alicorp SA Class C | 3,176,608 | | 9,909,001 |
Compania de Minas Buenaventura SA sponsored ADR | 2,518,892 | | 36,523,934 |
TOTAL PERU | | 46,432,935 |
Common Stocks - continued |
| Shares | | Value |
Spain - 0.9% |
Banco Bilbao Vizcaya Argentaria SA | 602,964 | | $ 7,046,799 |
Distribuidora Internacional de Alimentacion SA | 681,435 | | 6,229,495 |
TOTAL SPAIN | | 13,276,294 |
United States of America - 2.0% |
BPZ Energy, Inc. (a)(d) | 3,060,350 | | 6,151,304 |
First Cash Financial Services, Inc. (a) | 315,945 | | 19,111,513 |
Gran Tierra Energy, Inc. (Canada) (a) | 463,100 | | 3,491,072 |
TOTAL UNITED STATES OF AMERICA | | 28,753,889 |
TOTAL COMMON STOCKS (Cost $766,614,382) |
1,099,980,513
|
Nonconvertible Preferred Stocks - 21.3% |
| | | |
Brazil - 19.6% |
AES Tiete SA (PN) (non-vtg.) | 703,145 | | 6,873,884 |
Banco Bradesco SA (PN) | 1,313,817 | | 18,931,351 |
Companhia Brasileira de Distribuicao Grupo Pao de Acucar (PN) | 329,225 | | 16,327,514 |
Companhia Energetica de Sao Paulo Series B | 724,800 | | 7,580,602 |
Forjas Taurus SA | 1,566,600 | | 1,510,515 |
Itau Unibanco Holding SA | 3,919,750 | | 60,540,733 |
Itausa-Investimentos Itau SA (PN) | 6,267,322 | | 26,997,437 |
Petroleo Brasileiro SA - Petrobras (PN) (non-vtg.) | 9,159,971 | | 83,536,384 |
Telefonica Brasil SA | 1,294,413 | | 28,526,547 |
Vale SA (PN-A) | 1,777,600 | | 26,058,559 |
TOTAL BRAZIL | | 276,883,526 |
Chile - 1.3% |
Embotelladora Andina SA: | | | |
Class A | 1,321,447 | | 5,597,931 |
Class B | 2,207,046 | | 12,447,353 |
TOTAL CHILE | | 18,045,284 |
|
| Shares | | Value |
Colombia - 0.4% |
Grupo Aval Acciones y Valores SA | 2,897,449 | | $ 2,013,445 |
Grupo de Inversiones Suramerica SA | 161,141 | | 3,201,784 |
TOTAL COLOMBIA | | 5,215,229 |
TOTAL NONCONVERTIBLE PREFERRED STOCKS (Cost $219,156,548) |
300,144,039
|
Money Market Funds - 4.1% |
| | | |
Fidelity Cash Central Fund, 0.09% (b) | 8,000,693 | | 8,000,693 |
Fidelity Securities Lending Cash Central Fund, 0.09% (b)(c) | 50,236,716 | | 50,236,716 |
TOTAL MONEY MARKET FUNDS (Cost $58,237,409) |
58,237,409
|
TOTAL INVESTMENT PORTFOLIO - 103.4% (Cost $1,044,008,339) | | 1,458,361,961 |
NET OTHER ASSETS (LIABILITIES) - (3.4)% | | (47,365,173) |
NET ASSETS - 100% | $ 1,410,996,788 |
Legend |
(a) Non-income producing |
(b) Affiliated fund that is generally available only to investment companies and other accounts managed by Fidelity Investments. The rate quoted is the annualized seven-day yield of the fund at period end. A complete unaudited listing of the fund's holdings as of its most recent quarter end is available upon request. In addition, each Fidelity Central Fund's financial statements, which are not covered by the Fund's Report of Independent Registered Public Accounting Firm, are available on the SEC's website or upon request. |
(c) Investment made with cash collateral received from securities on loan. |
(d) Security or a portion of the security is on loan at period end. |
Affiliated Central Funds |
Information regarding fiscal year to date income earned by the Fund from investments in Fidelity Central Funds is as follows: |
Fund | Income earned |
Fidelity Cash Central Fund | $ 22,896 |
Fidelity Securities Lending Cash Central Fund | 501,984 |
Total | $ 524,880 |
Other Information |
Categorizations in the Schedule of Investments are based on country or territory of incorporation. |
The following is a summary of the inputs used, as of October 31, 2013, involving the Fund's assets and liabilities carried at fair value. The inputs or methodology used for valuing securities may not be an indication of the risk associated with investing in those securities. For more information on valuation inputs, and their aggregation into the levels used in the table below, please refer to the Investment Valuation section in the accompanying Notes to Financial Statements. |
Valuation Inputs at Reporting Date: |
Description | Total | Level 1 | Level 2 | Level 3 |
Investments in Securities: | | | | |
Equities: | | | | |
Consumer Discretionary | $ 73,051,518 | $ 73,051,518 | $ - | $ - |
Consumer Staples | 345,243,834 | 345,243,834 | - | - |
Energy | 179,888,071 | 179,888,071 | - | - |
Financials | 322,672,319 | 315,625,520 | 7,046,799 | - |
Industrials | 74,581,330 | 74,581,330 | - | - |
Information Technology | 13,714,133 | 13,714,133 | - | - |
Materials | 149,895,879 | 149,895,879 | - | - |
Telecommunication Services | 189,189,208 | 189,189,208 | - | - |
Utilities | 51,888,260 | 51,888,260 | - | - |
Money Market Funds | 58,237,409 | 58,237,409 | - | - |
Total Investments in Securities: | $ 1,458,361,961 | $ 1,451,315,162 | $ 7,046,799 | $ - |
See accompanying notes which are an integral part of the financial statements.
Annual Report
Fidelity Latin America Fund
Financial Statements
Statement of Assets and Liabilities
| October 31, 2013 |
| | �� |
Assets | | |
Investment in securities, at value (including securities loaned of $48,248,176) - See accompanying schedule: Unaffiliated issuers (cost $985,770,930) | $ 1,400,124,552 | |
Fidelity Central Funds (cost $58,237,409) | 58,237,409 | |
Total Investments (cost $1,044,008,339) | | $ 1,458,361,961 |
Foreign currency held at value (cost $2,216,036) | | 2,216,036 |
Receivable for investments sold | | 1,609 |
Receivable for fund shares sold | | 544,628 |
Dividends receivable | | 4,543,889 |
Distributions receivable from Fidelity Central Funds | | 32,242 |
Prepaid expenses | | 2,318 |
Other receivables | | 8,707 |
Total assets | | 1,465,711,390 |
| | |
Liabilities | | |
Payable for investments purchased | $ 633,430 | |
Payable for fund shares redeemed | 2,161,625 | |
Accrued management fee | 830,522 | |
Distribution and service plan fees payable | 32,172 | |
Other affiliated payables | 344,982 | |
Other payables and accrued expenses | 475,155 | |
Collateral on securities loaned, at value | 50,236,716 | |
Total liabilities | | 54,714,602 |
| | |
Net Assets | | $ 1,410,996,788 |
Net Assets consist of: | | |
Paid in capital | | $ 769,670,329 |
Undistributed net investment income | | 18,836,319 |
Accumulated undistributed net realized gain (loss) on investments and foreign currency transactions | | 208,543,792 |
Net unrealized appreciation (depreciation) on investments and assets and liabilities in foreign currencies | | 413,946,348 |
Net Assets | | $ 1,410,996,788 |
Statement of Assets and Liabilities - continued
| October 31, 2013 |
| | |
Calculation of Maximum Offering Price Class A:
Net Asset Value and redemption price per share ($48,463,916 ÷ 1,190,399 shares) | | $ 40.71 |
| | |
Maximum offering price per share (100/94.25 of $40.71) | | $ 43.19 |
Class T:
Net Asset Value and redemption price per share ($12,704,735 ÷ 312,328 shares) | | $ 40.68 |
| | |
Maximum offering price per share (100/96.50 of $40.68) | | $ 42.16 |
Class B:
Net Asset Value and offering price per share ($4,764,250 ÷ 117,263 shares)A | | $ 40.63 |
| | |
Class C:
Net Asset Value and offering price per share ($15,184,519 ÷ 374,059 shares)A | | $ 40.59 |
| | |
Latin America:
Net Asset Value, offering price and redemption price per share ($1,324,748,455 ÷ 32,472,812 shares) | | $ 40.80 |
| | |
Institutional Class:
Net Asset Value, offering price and redemption price per share ($5,130,913 ÷ 125,777 shares) | | $ 40.79 |
A Redemption price per share is equal to net asset value less any applicable contingent deferred sales charge.
See accompanying notes which are an integral part of the financial statements.
Annual Report
Statement of Operations
| Year ended October 31, 2013 |
| | |
Investment Income | | |
Dividends | | $ 59,989,795 |
Interest | | 70 |
Income from Fidelity Central Funds | | 524,880 |
Income before foreign taxes withheld | | 60,514,745 |
Less foreign taxes withheld | | (4,239,642) |
Total income | | 56,275,103 |
| | |
Expenses | | |
Management fee | $ 13,229,127 | |
Transfer agent fees | 4,381,374 | |
Distribution and service plan fees | 503,129 | |
Accounting and security lending fees | 843,722 | |
Custodian fees and expenses | 928,497 | |
Independent trustees' compensation | 11,598 | |
Registration fees | 96,818 | |
Audit | 72,029 | |
Legal | 6,009 | |
Interest | 388 | |
Miscellaneous | 22,444 | |
Total expenses before reductions | 20,095,135 | |
Expense reductions | (342,239) | 19,752,896 |
Net investment income (loss) | | 36,522,207 |
Realized and Unrealized Gain (Loss) Net realized gain (loss) on: | | |
Investment securities: | | |
Unaffiliated issuers (net of foreign taxes of $101,531) | 271,486,024 | |
Foreign currency transactions | (1,062,388) | |
Total net realized gain (loss) | | 270,423,636 |
Change in net unrealized appreciation (depreciation) on: Investment securities (net of increase in deferred foreign taxes of $152,377) | (467,997,709) | |
Assets and liabilities in foreign currencies | (206,947) | |
Total change in net unrealized appreciation (depreciation) | | (468,204,656) |
Net gain (loss) | | (197,781,020) |
Net increase (decrease) in net assets resulting from operations | | $ (161,258,813) |
Statement of Changes in Net Assets
| Year ended
October 31,
2013 | Year ended
October 31,
2012 |
Increase (Decrease) in Net Assets | | |
Operations | | |
Net investment income (loss) | $ 36,522,207 | $ 58,892,289 |
Net realized gain (loss) | 270,423,636 | 295,024,672 |
Change in net unrealized appreciation (depreciation) | (468,204,656) | (507,764,945) |
Net increase (decrease) in net assets resulting from operations | (161,258,813) | (153,847,984) |
Distributions to shareholders from net investment income | (45,716,095) | (46,233,461) |
Distributions to shareholders from net realized gain | (164,648,488) | - |
Total distributions | (210,364,583) | (46,233,461) |
Share transactions - net increase (decrease) | (626,013,705) | (452,506,012) |
Redemption fees | 218,753 | 354,338 |
Total increase (decrease) in net assets | (997,418,348) | (652,233,119) |
| | |
Net Assets | | |
Beginning of period | 2,408,415,136 | 3,060,648,255 |
End of period (including undistributed net investment income of $18,836,319 and undistributed net investment income of $34,109,670, respectively) | $ 1,410,996,788 | $ 2,408,415,136 |
See accompanying notes which are an integral part of the financial statements.
Annual Report
Financial Highlights - Class A
Years ended October 31, | 2013 | 2012 | 2011 | 2010 H |
Selected Per-Share Data | | | | |
Net asset value, beginning of period | $ 48.95 | $ 52.38 | $ 57.48 | $ 55.47 |
Income from Investment Operations | | | | |
Net investment income (loss) E | .72 | .92 | 1.15 | .02 |
Net realized and unrealized gain (loss) | (4.73) | (3.66) | (5.87) | 2.79 |
Total from investment operations | (4.01) | (2.74) | (4.72) | 2.81 |
Distributions from net investment income | (.79) | (.70) | (.19) | (.80) |
Distributions from net realized gain | (3.45) | - | (.20) | - |
Total distributions | (4.24) | (.70) | (.39) | (.80) |
Redemption fees added to paid in capital E | .01 | .01 | .01 | - K |
Net asset value, end of period | $ 40.71 | $ 48.95 | $ 52.38 | $ 57.48 |
Total Return B,C,D | (8.93)% | (5.23)% | (8.26)% | 5.14% |
Ratios to Average Net Assets F,I | | | | |
Expenses before reductions | 1.37% | 1.35% | 1.34% | 1.37% A |
Expenses net of fee waivers, if any | 1.37% | 1.35% | 1.34% | 1.37% A |
Expenses net of all reductions | 1.35% | 1.35% | 1.34% | 1.34% A |
Net investment income (loss) | 1.66% | 1.80% | 2.05% | .39% A |
Supplemental Data | | | | |
Net assets, end of period (000 omitted) | $ 48,464 | $ 69,654 | $ 91,407 | $ 115,626 |
Portfolio turnover rate G | 23% | 23% | 11% | 56% J |
A Annualized B Total returns for periods of less than one year are not annualized. C Total returns would have been lower if certain expenses had not been reduced during the applicable periods shown. D Total returns do not include the effect of the sales charges. E Calculated based on average shares outstanding during the period. F Fees and expenses of any underlying Fidelity Central Funds are not included in the Fund's expense ratio. The Fund indirectly bears its proportionate share of the expenses of any underlying Fidelity Central Funds. G Amount does not include the portfolio activity of any underlying Fidelity Central Funds. H For the period September 28, 2010 (commencement of sale of shares) to October 31, 2010. I Expense ratios reflect operating expenses of the class. Expenses before reductions do not reflect amounts reimbursed by the investment adviser or reductions from brokerage service arrangements or reductions from other expense offset arrangements and do not represent the amount paid by the class during periods when reimbursements or reductions occur. Expense ratios before reductions for start-up periods may not be representative of longer-term operating periods. Expenses net of fee waivers reflect expenses after reimbursement by the investment adviser but prior to reductions from brokerage service arrangements or other expense offset arrangements. Expenses net of all reductions represent the net expenses paid by the class. J The portfolio turnover rate does not include the assets acquired in the merger. K Amount represents less than $.01 per share. |
Financial Highlights - Class T
Years ended October 31, | 2013 | 2012 | 2011 | 2010 H |
Selected Per-Share Data | | | | |
Net asset value, beginning of period | $ 48.88 | $ 52.27 | $ 57.47 | $ 55.47 |
Income from Investment Operations | | | | |
Net investment income (loss) E | .61 | .78 | .99 | .01 |
Net realized and unrealized gain (loss) | (4.74) | (3.65) | (5.85) | 2.79 |
Total from investment operations | (4.13) | (2.87) | (4.86) | 2.80 |
Distributions from net investment income | (.63) | (.53) | (.15) | (.80) |
Distributions from net realized gain | (3.45) | - | (.20) | - |
Total distributions | (4.08) | (.53) | (.35) | (.80) |
Redemption fees added to paid in capital E | .01 | .01 | .01 | - K |
Net asset value, end of period | $ 40.68 | $ 48.88 | $ 52.27 | $ 57.47 |
Total Return B,C,D | (9.17)% | (5.49)% | (8.50)% | 5.12% |
Ratios to Average Net Assets F,I | | | | |
Expenses before reductions | 1.63% | 1.61% | 1.61% | 1.63% A |
Expenses net of fee waivers, if any | 1.63% | 1.61% | 1.61% | 1.63% A |
Expenses net of all reductions | 1.61% | 1.61% | 1.61% | 1.60% A |
Net investment income (loss) | 1.40% | 1.54% | 1.78% | .13% A |
Supplemental Data | | | | |
Net assets, end of period (000 omitted) | $ 12,705 | $ 19,334 | $ 26,020 | $ 36,820 |
Portfolio turnover rate G | 23% | 23% | 11% | 56% J |
A Annualized B Total returns for periods of less than one year are not annualized. C Total returns would have been lower if certain expenses had not been reduced during the applicable periods shown. D Total returns do not include the effect of the sales charges. E Calculated based on average shares outstanding during the period. F Fees and expenses of any underlying Fidelity Central Funds are not included in the Fund's expense ratio. The Fund indirectly bears its proportionate share of the expenses of any underlying Fidelity Central Funds. G Amount does not include the portfolio activity of any underlying Fidelity Central Funds. H For the period September 28, 2010 (commencement of sale of shares) to October 31, 2010. I Expense ratios reflect operating expenses of the class. Expenses before reductions do not reflect amounts reimbursed by the investment adviser or reductions from brokerage service arrangements or reductions from other expense offset arrangements and do not represent the amount paid by the class during periods when reimbursements or reductions occur. Expense ratios before reductions for start-up periods may not be representative of longer-term operating periods. Expenses net of fee waivers reflect expenses after reimbursement by the investment adviser but prior to reductions from brokerage service arrangements or other expense offset arrangements. Expenses net of all reductions represent the net expenses paid by the class. J The portfolio turnover rate does not include the assets acquired in the merger. K Amount represents less than $.01 per share. |
See accompanying notes which are an integral part of the financial statements.
Annual Report
Financial Highlights - Class B
Years ended October 31, | 2013 | 2012 | 2011 | 2010 H |
Selected Per-Share Data | | | | |
Net asset value, beginning of period | $ 48.72 | $ 52.06 | $ 57.44 | $ 55.47 |
Income from Investment Operations | | | | |
Net investment income (loss) E | .40 | .53 | .72 | (.02) |
Net realized and unrealized gain (loss) | (4.74) | (3.63) | (5.84) | 2.79 |
Total from investment operations | (4.34) | (3.10) | (5.12) | 2.77 |
Distributions from net investment income | (.31) | (.25) | (.07) | (.80) |
Distributions from net realized gain | (3.45) | - | (.20) | - |
Total distributions | (3.76) | (.25) | (.27) | (.80) |
Redemption fees added to paid in capital E | .01 | .01 | .01 | - K |
Net asset value, end of period | $ 40.63 | $ 48.72 | $ 52.06 | $ 57.44 |
Total Return B,C,D | (9.60)% | (5.95)% | (8.94)% | 5.06% |
Ratios to Average Net Assets F,I | | | | |
Expenses before reductions | 2.12% | 2.10% | 2.10% | 2.12% A |
Expenses net of fee waivers, if any | 2.12% | 2.10% | 2.10% | 2.12% A |
Expenses net of all reductions | 2.10% | 2.10% | 2.10% | 2.10% A |
Net investment income (loss) | .91% | 1.05% | 1.29% | (.36)% A |
Supplemental Data | | | | |
Net assets, end of period (000 omitted) | $ 4,764 | $ 9,492 | $ 14,114 | $ 20,392 |
Portfolio turnover rate G | 23% | 23% | 11% | 56% J |
A Annualized B Total returns for periods of less than one year are not annualized. C Total returns would have been lower if certain expenses had not been reduced during the applicable periods shown. D Total returns do not include the effect of the contingent deferred sales charge. E Calculated based on average shares outstanding during the period. F Fees and expenses of any underlying Fidelity Central Funds are not included in the Fund's expense ratio. The Fund indirectly bears its proportionate share of the expenses of any underlying Fidelity Central Funds. G Amount does not include the portfolio activity of any underlying Fidelity Central Funds. H For the period September 28, 2010 (commencement of sale of shares) to October 31, 2010. I Expense ratios reflect operating expenses of the class. Expenses before reductions do not reflect amounts reimbursed by the investment adviser or reductions from brokerage service arrangements or reductions from other expense offset arrangements and do not represent the amount paid by the class during periods when reimbursements or reductions occur. Expense ratios before reductions for start-up periods may not be representative of longer-term operating periods. Expenses net of fee waivers reflect expenses after reimbursement by the investment adviser but prior to reductions from brokerage service arrangements or other expense offset arrangements. Expenses net of all reductions represent the net expenses paid by the class. J The portfolio turnover rate does not include the assets acquired in the merger. K Amount represents less than $.01 per share. |
Financial Highlights - Class C
Years ended October 31, | 2013 | 2012 | 2011 | 2010 H |
Selected Per-Share Data | | | | |
Net asset value, beginning of period | $ 48.73 | $ 52.05 | $ 57.44 | $ 55.47 |
Income from Investment Operations | | | | |
Net investment income (loss) E | .40 | .54 | .73 | (.02) |
Net realized and unrealized gain (loss) | (4.74) | (3.64) | (5.84) | 2.79 |
Total from investment operations | (4.34) | (3.10) | (5.11) | 2.77 |
Distributions from net investment income | (.36) | (.23) | (.09) | (.80) |
Distributions from net realized gain | (3.45) | - | (.20) | - |
Total distributions | (3.81) | (.23) | (.29) | (.80) |
Redemption fees added to paid in capital E | .01 | .01 | .01 | - K |
Net asset value, end of period | $ 40.59 | $ 48.73 | $ 52.05 | $ 57.44 |
Total Return B,C,D | (9.62)% | (5.94)% | (8.93)% | 5.06% |
Ratios to Average Net Assets F,I | | | | |
Expenses before reductions | 2.12% | 2.10% | 2.08% | 2.09% A |
Expenses net of fee waivers, if any | 2.12% | 2.10% | 2.08% | 2.09% A |
Expenses net of all reductions | 2.10% | 2.10% | 2.08% | 2.07% A |
Net investment income (loss) | .91% | 1.06% | 1.31% | (.34)% A |
Supplemental Data | | | | |
Net assets, end of period (000 omitted) | $ 15,185 | $ 27,405 | $ 35,203 | $ 48,329 |
Portfolio turnover rate G | 23% | 23% | 11% | 56% J |
A Annualized B Total returns for periods of less than one year are not annualized. C Total returns would have been lower if certain expenses had not been reduced during the applicable periods shown. D Total returns do not include the effect of the contingent deferred sales charge. E Calculated based on average shares outstanding during the period. F Fees and expenses of any underlying Fidelity Central Funds are not included in the Fund's expense ratio. The Fund indirectly bears its proportionate share of the expenses of any underlying Fidelity Central Funds. G Amount does not include the portfolio activity of any underlying Fidelity Central Funds. H For the period September 28, 2010 (commencement of sale of shares) to October 31, 2010. I Expense ratios reflect operating expenses of the class. Expenses before reductions do not reflect amounts reimbursed by the investment adviser or reductions from brokerage service arrangements or reductions from other expense offset arrangements and do not represent the amount paid by the class during periods when reimbursements or reductions occur. Expense ratios before reductions for start-up periods may not be representative of longer-term operating periods. Expenses net of fee waivers reflect expenses after reimbursement by the investment adviser but prior to reductions from brokerage service arrangements or other expense offset arrangements. Expenses net of all reductions represent the net expenses paid by the class. J The portfolio turnover rate does not include the assets acquired in the merger. K Amount represents less than $.01 per share. |
See accompanying notes which are an integral part of the financial statements.
Annual Report
Financial Highlights - Latin America
Years ended October 31, | 2013 | 2012 | 2011 | 2010 | 2009 |
Selected Per-Share Data | | | | | |
Net asset value, beginning of period | $ 49.09 | $ 52.48 | $ 57.50 | $ 47.29 | $ 28.69 |
Income from Investment Operations | | | | | |
Net investment income (loss) B | .87 | 1.09 | 1.34 | 1.07 | .72 |
Net realized and unrealized gain (loss) | (4.74) | (3.67) | (5.88) | 11.00 | 18.32 |
Total from investment operations | (3.87) | (2.58) | (4.54) | 12.07 | 19.04 |
Distributions from net investment income | (.98) | (.82) | (.29) | (1.49) | (.46) |
Distributions from net realized gain | (3.45) | - | (.20) | (.39) | - |
Total distributions | (4.43) | (.82) | (.49) | (1.88) | (.46) |
Redemption fees added to paid in capital B | .01 | .01 | .01 | .02 | .02 |
Net asset value, end of period | $ 40.80 | $ 49.09 | $ 52.48 | $ 57.50 | $ 47.29 |
Total Return A | (8.63)% | (4.91)% | (7.96)% | 25.91% | 67.88% |
Ratios to Average Net Assets C,E | | | | | |
Expenses before reductions | 1.04% | 1.02% | 1.00% | 1.03% | 1.07% |
Expenses net of fee waivers, if any | 1.04% | 1.02% | 1.00% | 1.03% | 1.07% |
Expenses net of all reductions | 1.03% | 1.02% | 1.00% | 1.01% | 1.05% |
Net investment income (loss) | 1.99% | 2.14% | 2.39% | 2.10% | 2.04% |
Supplemental Data | | | | | |
Net assets, end of period (000 omitted) | $ 1,324,748 | $ 2,274,601 | $ 2,884,301 | $ 4,283,462 | $ 4,043,748 |
Portfolio turnover rate D | 23% | 23% | 11% | 56% F | 52% |
A Total returns would have been lower if certain expenses had not been reduced during the applicable periods shown. B Calculated based on average shares outstanding during the period. C Fees and expenses of any underlying Fidelity Central Funds are not included in the Fund's expense ratio. The Fund indirectly bears its proportionate share of the expenses of any underlying Fidelity Central Funds. D Amount does not include the portfolio activity of any underlying Fidelity Central Funds. E Expense ratios reflect operating expenses of the class. Expenses before reductions do not reflect amounts reimbursed by the investment adviser or reductions from brokerage service arrangements or reductions from other expense offset arrangements and do not represent the amount paid by the class during periods when reimbursements or reductions occur. Expenses net of fee waivers reflect expenses after reimbursement by the investment adviser but prior to reductions from brokerage service arrangements or other expense offset arrangements. Expenses net of all reductions represent the net expenses paid by the class. F The portfolio turnover rate does not include the assets acquired in the merger. |
Financial Highlights - Institutional Class
Years ended October 31, | 2013 | 2012 | 2011 | 2010 G |
Selected Per-Share Data | | | | |
Net asset value, beginning of period | $ 49.07 | $ 52.51 | $ 57.49 | $ 55.47 |
Income from Investment Operations | | | | |
Net investment income (loss) D | .87 | 1.08 | 1.32 | .03 |
Net realized and unrealized gain (loss) | (4.74) | (3.67) | (5.88) | 2.79 |
Total from investment operations | (3.87) | (2.59) | (4.56) | 2.82 |
Distributions from net investment income | (.97) | (.86) | (.23) | (.80) |
Distributions from net realized gain | (3.45) | - | (.20) | - |
Total distributions | (4.42) | (.86) | (.43) | (.80) |
Redemption fees added to paid in capital D | .01 | .01 | .01 | - J |
Net asset value, end of period | $ 40.79 | $ 49.07 | $ 52.51 | $ 57.49 |
Total Return B,C | (8.63)% | (4.93)% | (7.98)% | 5.15% |
Ratios to Average Net Assets E,H | | | | |
Expenses before reductions | 1.03% | 1.04% | 1.04% | 1.08% A |
Expenses net of fee waivers, if any | 1.03% | 1.04% | 1.04% | 1.08% A |
Expenses net of all reductions | 1.01% | 1.04% | 1.04% | 1.06% A |
Net investment income (loss) | 2.00% | 2.12% | 2.35% | .68% A |
Supplemental Data | | | | |
Net assets, end of period (000 omitted) | $ 5,131 | $ 7,928 | $ 9,603 | $ 12,868 |
Portfolio turnover rate F | 23% | 23% | 11% | 56% I |
A Annualized B Total returns for periods of less than one year are not annualized. C Total returns would have been lower if certain expenses had not been reduced during the applicable periods shown. D Calculated based on average shares outstanding during the period. E Fees and expenses of any underlying Fidelity Central Funds are not included in the Fund's expense ratio. The Fund indirectly bears its proportionate share of the expenses of any underlying Fidelity Central Funds. F Amount does not include the portfolio activity of any underlying Fidelity Central Funds. G For the period September 28, 2010 (commencement of sale of shares) to October 31, 2010. H Expense ratios reflect operating expenses of the class. Expenses before reductions do not reflect amounts reimbursed by the investment adviser or reductions from brokerage service arrangements or reductions from other expense offset arrangements and do not represent the amount paid by the class during periods when reimbursements or reductions occur. Expense ratios before reductions for start-up periods may not be representative of longer-term operating periods. Expenses net of fee waivers reflect expenses after reimbursement by the investment adviser but prior to reductions from brokerage service arrangements or other expense offset arrangements. Expenses net of all reductions represent the net expenses paid by the class. I The portfolio turnover rate does not include the assets acquired in the merger. J Amount represents less than $.01 per share. |
See accompanying notes which are an integral part of the financial statements.
Annual Report
Notes to Financial Statements
For the period ended October 31, 2013
1. Organization.
Fidelity Latin America Fund (the Fund) is a non-diversified fund of Fidelity Investment Trust (the Trust) and is authorized to issue an unlimited number of shares. The Trust is registered under the Investment Company Act of 1940, as amended (the 1940 Act), as an open-end management investment company organized as a Massachusetts business trust. The Fund offers Class A, Class T, Class C, Latin America and Institutional Class shares, each of which, along with Class B shares, has equal rights as to assets and voting privileges. Class B shares are closed to new accounts and additional purchases, except for exchanges and reinvestments. Each class has exclusive voting rights with respect to matters that affect that class. Class B shares will automatically convert to Class A shares after a holding period of seven years from the initial date of purchase. The Fund's investments in emerging markets can be subject to social, economic, regulatory, and political uncertainties and can be extremely volatile.
2. Investments in Fidelity Central Funds.
The Fund invests in Fidelity Central Funds, which are open-end investment companies generally available only to other investment companies and accounts managed by Fidelity Management & Research Company (FMR) and its affiliates. The Fund's Schedule of Investments lists each of the Fidelity Central Funds held as of period end, if any, as an investment of the Fund, but does not include the underlying holdings of each Fidelity Central Fund. As an Investing Fund, the Fund indirectly bears its proportionate share of the expenses of the underlying Fidelity Central Funds.
The Money Market Central Funds seek preservation of capital and current income and are managed by Fidelity Investments Money Management, Inc. (FIMM), an affiliate of FMR.
A complete unaudited list of holdings for each Fidelity Central Fund is available upon request or at the Securities and Exchange Commission (the SEC) website at www.sec.gov. In addition, the financial statements of the Fidelity Central Funds, which are not covered by the Fund's Report of Independent Registered Public Accounting Firm, are available on the SEC website or upon request.
3. Significant Accounting Policies.
The financial statements have been prepared in conformity with accounting principles generally accepted in the United States of America (GAAP), which require management to make certain estimates and assumptions at the date of the financial statements. Actual results could differ from those estimates. Subsequent events, if any, through the date that the financial statements were issued have been evaluated in the preparation of the financial statements. The following summarizes the significant accounting policies of the Fund:
Investment Valuation. Investments are valued as of 4:00 p.m. Eastern time on the last calendar day of the period. In accordance with valuation policies and procedures approved by the Board of Trustees (the Board), the Fund attempts to obtain prices from one or more third party pricing vendors or brokers to value its investments. When current market prices, quotations or currency exchange rates are not readily available or reliable, investments will be fair valued in good faith by the FMR Fair Value Committee (the Committee), in accordance with procedures adopted by the Board. Factors used in determining fair value vary by investment type and may include market or investment specific events. The frequency with which these procedures are used cannot be predicted and they may be utilized to a significant extent. The Committee oversees the Fund's valuation policies and procedures and is responsible for approving and reporting to the Board all fair value determinations.
The Fund categorizes the inputs to valuation techniques used to value its investments into a disclosure hierarchy consisting of three levels as shown below:
Level 1 - quoted prices in active markets for identical investments
Level 2 - other significant observable inputs (including quoted prices for similar investments, interest rates, prepayment speeds, etc.)
Level 3 - unobservable inputs (including the Fund's own assumptions based on the best information available)
Valuation techniques used to value the Fund's investments by major category are as follows:
Equity securities, including restricted securities, for which market quotations are readily available, are valued at the last reported sale price or official closing price as reported by a third party pricing vendor on the primary market or exchange on which they are traded and are categorized as Level 1 in the hierarchy. In the event there were no sales during the day or closing prices are not available, securities are valued at the last quoted bid price or may be valued using the last available price and are generally categorized as Level 2 in the hierarchy. For foreign equity securities, when market or security specific events arise, comparisons to the valuation of American Depositary Receipts (ADRs), futures contracts, Exchange-Traded Funds (ETFs) and certain indexes as well as quoted prices for similar securities may be used and would be categorized as Level 2 in the hierarchy. Utilizing these techniques may result in transfers between Level 1 and Level 2. For equity securities, including restricted securities, where observable inputs are limited, assumptions about market activity and risk are used and these securities may be categorized as Level 3 in the hierarchy.
Investments in open-end mutual funds, including the Fidelity Central Funds, are valued at their closing net asset value (NAV) each business day and are categorized as Level 1 in the hierarchy.
Annual Report
3. Significant Accounting Policies - continued
Investment Valuation - continued
Changes in valuation techniques may result in transfers in or out of an assigned level within the disclosure hierarchy. The aggregate value of investments by input level, as of October 31, 2013, is included at the end of the Fund's Schedule of Investments.
Foreign Currency. The Fund may use foreign currency contracts to facilitate transactions in foreign-denominated securities. Gains and losses from these transactions may arise from changes in the value of the foreign currency or if the counterparties do not perform under the contracts' terms.
Foreign-denominated assets, including investment securities, and liabilities are translated into U.S. dollars at the exchange rates at period end. Purchases and sales of investment securities, income and dividends received and expenses denominated in foreign currencies are translated into U.S. dollars at the exchange rate in effect on the transaction date.
The effects of exchange rate fluctuations on investments are included with the net realized and unrealized gain (loss) on investment securities. Other foreign currency transactions resulting in realized and unrealized gain (loss) are disclosed separately.
Investment Transactions and Income. For financial reporting purposes, the Fund's investment holdings and NAV include trades executed through the end of the last business day of the period. The NAV per share for processing shareholder transactions is calculated as of the close of business of the New York Stock Exchange (NYSE), normally 4:00 p.m. Eastern time and includes trades executed through the end of the prior business day. Gains and losses on securities sold are determined on the basis of identified cost and may include proceeds received from litigation. Dividend income is recorded on the ex-dividend date, except for certain dividends from foreign securities where the ex-dividend date may have passed, which are recorded as soon as the Fund is informed of the ex-dividend date. Non-cash dividends included in dividend income, if any, are recorded at the fair market value of the securities received. Distributions received on securities that represent a return of capital or capital gain are recorded as a reduction of cost of investments and/or as a realized gain. Subsequent to ex-dividend date the Fund determines the components of these distributions, based upon receipt of tax filings or other correspondence relating to the underlying investment. Interest income and distributions from the Fidelity Central Funds are accrued as earned. Interest income includes coupon interest and amortization of premium and accretion of discount on debt securities. Investment income is recorded net of foreign taxes withheld where recovery of such taxes is uncertain.
Class Allocations and Expenses. Investment income, realized and unrealized capital gains and losses, common expenses of the Fund, and certain fund-level expense reductions, if any, are allocated daily on a pro-rata basis to each class based on the relative net assets of each class to the total net assets of the Fund. Each class differs with respect to transfer agent and distribution and service plan fees incurred. Certain expense reductions may also differ by class. For the reporting period, the allocated portion of income and expenses to each class as a percent of its average net assets may vary due to the timing of recording these transactions in relation to fluctuating net assets of the classes. Expenses directly attributable to a fund are charged to that fund. Expenses attributable to more than one fund are allocated among the respective funds on the basis of relative net assets or other appropriate methods. Expense estimates are accrued in the period to which they relate and adjustments are made when actual amounts are known.
Income Tax Information and Distributions to Shareholders. Each year, the Fund intends to qualify as a regulated investment company under Subchapter M of the Internal Revenue Code, including distributing substantially all of its taxable income and realized gains. As a result, no provision for U.S. Federal income taxes is required. As of October 31, 2013, the Fund did not have any unrecognized tax benefits in the financial statements; nor is the Fund aware of any tax positions for which it is reasonably possible that the total amounts of unrecognized tax benefits will significantly change in the next twelve months. The Fund files a U.S. federal tax return, in addition to state and local tax returns as required. The Fund's federal income tax returns are subject to examination by the Internal Revenue Service (IRS) for a period of three fiscal years after they are filed. State and local tax returns may be subject to examination for an additional fiscal year depending on the jurisdiction. Foreign taxes are provided for based on the Fund's understanding of the tax rules and rates that exist in the foreign markets in which it invests. The Fund is subject to a tax imposed on capital gains by certain countries in which it invests. An estimated deferred tax liability for net unrealized appreciation on the applicable securities is included in Other payables and accrued expenses on the Statement of Assets & Liabilities.
Distributions are declared and recorded on the ex-dividend date. Income dividends and capital gain distributions are declared separately for each class. Income and capital gain distributions are determined in accordance with income tax regulations, which may differ from GAAP. In addition, the Fund claimed a portion of the payment made to redeeming shareholders as a distribution for income tax purposes.
Capital accounts within the financial statements are adjusted for permanent book-tax differences. These adjustments have no impact on net assets or the results of operations. Temporary book-tax differences will reverse in a subsequent period.
Book-tax differences are primarily due to foreign currency transactions, certain foreign taxes, passive foreign investment companies (PFIC), deferred trustees compensation, and losses deferred due to wash sales.
Annual Report
Notes to Financial Statements - continued
3. Significant Accounting Policies - continued
Income Tax Information and Distributions to Shareholders - continued
The federal tax cost of investment securities and unrealized appreciation (depreciation) as of period end were as follows:
Gross unrealized appreciation | $ 514,889,062 |
Gross unrealized depreciation | (101,624,195) |
Net unrealized appreciation (depreciation) on securities and other investments | $ 413,264,867 |
| |
Tax Cost | $ 1,045,097,094 |
The tax-based components of distributable earnings as of period end were as follows:
Undistributed ordinary income | $ 18,836,911 |
Undistributed long-term capital gain | $ 209,632,547 |
Net unrealized appreciation (depreciation) | $ 413,009,970 |
The tax character of distributions paid was as follows:
| October 31, 2013 | October 31, 2012 |
Ordinary Income | $ 45,716,095 | $ 46,233,461 |
Long-term Capital Gains | 164,648,488 | - |
Total | $ 210,364,583 | $ 46,233,461 |
Short-Term Trading (Redemption) Fees. Shares held by investors in the Fund less than 90 days may have been subject to a redemption fee equal to 1.50% of the net asset value of shares redeemed. All redemption fees, which reduce the proceeds of the shareholder redemption, are retained by the Fund and accounted for as an addition to paid in capital.
4. Purchases and Sales of Investments.
Purchases and sales of securities, other than short-term securities, aggregated $415,539,658 and $1,205,128,341, respectively.
5. Fees and Other Transactions with Affiliates.
Management Fee. FMR and its affiliates provide the Fund with investment management related services for which the Fund pays a monthly management fee. The management fee is the sum of an individual fund fee rate that is based on an annual rate of .45% of the Fund's average net assets and an annualized group fee rate that averaged .25% during the period. The group fee rate is based upon the average net assets of all the mutual funds advised by FMR, including any mutual funds previously advised by FMR that are currently advised by Fidelity SelectCo, LLC, an affiliate of FMR. The group fee rate decreases as assets under management increase and increases as assets under management decrease. For the reporting period, the total annual management fee rate was .71% of the Fund's average net assets.
Distribution and Service Plan Fees. In accordance with Rule 12b-1 of the 1940 Act, the Fund has adopted separate Distribution and Service Plans for each class of shares. Certain classes pay Fidelity Distributors Corporation (FDC), an affiliate of FMR, separate Distribution and Service Fees, each of which is based on an annual percentage of each class' average net assets. In addition, FDC may pay financial intermediaries for selling shares of the Fund and providing shareholder support services. For the period, the Distribution and Service Fee rates, total fees and amounts retained by FDC were as follows:
| Distribution
Fee | Service
Fee | Total Fees | Retained
by FDC |
Class A | -% | .25% | $ 147,042 | $ 3,467 |
Class T | .25% | .25% | 79,698 | 1,065 |
Class B | .75% | .25% | 68,553 | 51,415 |
Class C | .75% | .25% | 207,836 | 19,782 |
| | | $ 503,129 | $ 75,729 |
Sales Load. FDC may receive a front-end sales charge of up to 5.75% for selling Class A shares and 3.50% for selling Class T shares, some of which is paid to financial intermediaries for selling shares of the Fund. Depending on the holding period, FDC may receive contingent deferred sales charges levied on Class A, Class T, Class B and Class C redemptions. The deferred sales charges range from 5.00% to 1.00% for Class B shares, 1.00% for Class C shares, 1.00% for certain purchases of Class A shares and .25% for certain purchases of Class T shares.
Annual Report
5. Fees and Other Transactions with Affiliates - continued
Sales Load - continued
For the period, sales charge amounts retained by FDC were as follows:
| Retained
by FDC |
Class A | $ 27,051 |
Class T | 4,208 |
Class B* | 11,774 |
Class C* | 3,514 |
| $ 46,547 |
* When Class B and Class C shares are initially sold, FDC pays commissions from its own resources to financial intermediaries through which the sales are made.
Transfer Agent Fees. Fidelity Investments Institutional Operations Company, Inc., (FIIOC), an affiliate of FMR, is the transfer, dividend disbursing and shareholder servicing agent for each class of the Fund. FIIOC receives account fees and asset-based fees that vary according to the account size and type of account of the shareholders of the respective classes of the Fund. FIIOC pays for typesetting, printing and mailing of shareholder reports, except proxy statements.
For the period, transfer agent fees for each class were as follows:
| Amount | % of
Average
Net Assets |
Class A | $ 176,560 | .30 |
Class T | 49,934 | .31 |
Class B | 20,537 | .30 |
Class C | 62,116 | .30 |
Latin America | 4,058,638 | .23 |
Institutional Class | 13,589 | .21 |
| $ 4,381,374 | |
Accounting and Security Lending Fees. Fidelity Service Company, Inc. (FSC), an affiliate of FMR, maintains the Fund's accounting records. The accounting fee is based on the level of average net assets for each month. Under a separate contract, FSC administers the security lending program. The security lending fee is based on the number and duration of lending transactions.
Brokerage Commissions. The Fund placed a portion of its portfolio transactions with brokerage firms which are affiliates of the investment adviser. Brokerage commissions are included in net realized gain (loss) and change in net unrealized appreciation (depreciation) in the Statement of Operations. The commissions paid to these affiliated firms were $18,366 for the period.
Interfund Lending Program. Pursuant to an Exemptive Order issued by the SEC, the Fund, along with other registered investment companies having management contracts with FMR, may participate in an interfund lending program. This program provides an alternative credit facility allowing the funds to borrow from, or lend money to, other participating affiliated funds. At period end, there were no interfund loans outstanding. The Fund's activity in this program during the period for which loans were outstanding was as follows:
Borrower or Lender | Average Loan
Balance | Weighted Average Interest Rate | Interest
Expense |
Borrower | $ 4,442,000 | .39% | $ 388 |
Other. During the period, FMR reimbursed the Fund for certain losses in the amount of $9,785.
6. Committed Line of Credit.
The Fund participates with other funds managed by FMR or an affiliate in a $4.25 billion credit facility (the "line of credit") to be utilized for temporary or emergency purposes to fund shareholder redemptions or for other short-term liquidity purposes. The Fund has agreed to pay commitment fees on its pro-rata portion of the line of credit, which amounted to $4,461 and is reflected in Miscellaneous expenses on the Statement of Operations. During the period, there were no borrowings on this line of credit.
7. Security Lending.
The Fund lends portfolio securities through a lending agent from time to time in order to earn additional income. For equity securities, a lending agent is used and may loan securities to certain qualified borrowers, including Fidelity Capital Markets (FCM), a broker-dealer affiliated with the Fund. On the settlement date of the loan, the Fund receives collateral (in the form of U.S. Treasury obligations, letters of credit and/or cash) against the loaned
Annual Report
Notes to Financial Statements - continued
7. Security Lending - continued
securities and maintains collateral in an amount not less than 100% of the market value of the loaned securities during the period of the loan. The market value of the loaned securities is determined at the close of business of the Fund and any additional required collateral is delivered to the Fund on the next business day. If the borrower defaults on its obligation to return the securities loaned because of insolvency or other reasons, the Fund may apply collateral received from the borrower against the obligation. The Fund may experience delays and costs in recovering the securities loaned. Any cash collateral received is invested in the Fidelity Securities Lending Cash Central Fund. The value of loaned securities and cash collateral at period end are disclosed on the Fund's Statement of Assets and Liabilities. At period end, there were no security loans outstanding with FCM. Security lending income represents the income earned on investing cash collateral, less rebates paid to borrowers and any lending agent fees associated with the loan, plus any premium payments received for lending certain types of securities. Security lending income is presented in the Statement of Operations as a component of income from Fidelity Central Funds. Total security lending income during the period amounted to $501,984, including $11,698 from securities loaned to FCM.
8. Expense Reductions.
Commissions paid to certain brokers with whom FMR, or its affiliates, places trades on behalf of the Fund include an amount in addition to trade execution, which may be rebated back to the Fund to offset certain expenses. This amount totaled $316,869 for the period.
In addition, FMR reimbursed a portion of the Fund's operating expenses during the period in the amount of $25,370.
9. Distributions to Shareholders.
Distributions to shareholders of each class were as follows:
Years ended October 31, | 2013 | 2012 |
From net investment income | | |
Class A | $ 1,098,761 | $ 1,209,540 |
Class T | 245,683 | 259,191 |
Class B | 57,649 | 65,750 |
Class C | 192,218 | 156,473 |
Latin America | 43,971,155 | 44,398,764 |
Institutional Class | 150,629 | 143,743 |
Total | $ 45,716,095 | $ 46,233,461 |
From net realized gain | | |
Class A | $ 4,828,947 | $ - |
Class T | 1,341,152 | - |
Class B | 641,573 | - |
Class C | 1,868,040 | - |
Latin America | 155,430,816 | - |
Institutional Class | 537,960 | - |
Total | $ 164,648,488 | $ - |
10. Share Transactions.
Transactions for each class of shares were as follows:
| Shares | Dollars |
Years ended October 31, | 2013 | 2012 | 2013 | 2012 |
Class A | | | | |
Shares sold | 232,318 | 250,504 | $ 10,075,611 | $ 12,951,683 |
Reinvestment of distributions | 119,230 | 21,636 | 5,315,278 | 1,072,283 |
Shares redeemed | (584,100) | (594,208) | (25,288,174) | (30,101,636) |
Net increase (decrease) | (232,552) | (322,068) | $ (9,897,285) | $ (16,077,670) |
Class T | | | | |
Shares sold | 46,221 | 45,016 | $ 2,015,673 | $ 2,321,071 |
Reinvestment of distributions | 34,933 | 5,062 | 1,559,775 | 251,031 |
Shares redeemed | (164,385) | (152,369) | (7,142,972) | (7,641,343) |
Net increase (decrease) | (83,231) | (102,291) | $ (3,567,524) | $ (5,069,241) |
Annual Report
10. Share Transactions - continued
| Shares | Dollars |
Years ended October 31, | 2013 | 2012 | 2013 | 2012 |
Class B | | | | |
Shares sold | 1,849 | 3,378 | $ 84,642 | $ 173,307 |
Reinvestment of distributions | 13,236 | 1,105 | 592,836 | 54,795 |
Shares redeemed | (92,657) | (80,783) | (4,084,874) | (4,111,766) |
Net increase (decrease) | (77,572) | (76,300) | $ (3,407,396) | $ (3,883,664) |
Class C | | | | |
Shares sold | 46,994 | 55,877 | $ 2,021,869 | $ 2,923,684 |
Reinvestment of distributions | 42,623 | 2,881 | 1,907,392 | 142,933 |
Shares redeemed | (277,980) | (172,705) | (12,111,471) | (8,681,626) |
Net increase (decrease) | (188,363) | (113,947) | $ (8,182,210) | $ (5,615,009) |
Latin America | | | | |
Shares sold | 3,510,227 | 6,405,350 | $ 154,033,223 | $ 336,749,510 |
Reinvestment of distributions | 4,304,957 | 860,999 | 191,785,822 | 42,666,908 |
Shares redeemed | (21,678,292) | (15,886,221) | (945,202,869) | (800,304,511) |
Net increase (decrease) | (13,863,108) | (8,619,872) | $ (599,383,824) | $ (420,888,093) |
Institutional Class | | | | |
Shares sold | 62,065 | 84,374 | $ 2,723,553 | $ 4,329,443 |
Reinvestment of distributions | 11,511 | 2,228 | 512,716 | 110,408 |
Shares redeemed | (109,367) | (107,894) | (4,811,735) | (5,412,186) |
Net increase (decrease) | (35,791) | (21,292) | $ (1,575,466) | $ (972,335) |
11. Other.
The Fund's organizational documents provide former and current trustees and officers with a limited indemnification against liabilities arising in connection with the performance of their duties to the Fund. In the normal course of business, the Fund may also enter into contracts that provide general indemnifications. The Fund's maximum exposure under these arrangements is unknown as this would be dependent on future claims that may be made against the Fund. The risk of material loss from such claims is considered remote.
Annual Report
Report of Independent Registered Public Accounting Firm
To the Trustees of Fidelity Investment Trust and the Shareholders of Fidelity Latin America Fund:
In our opinion, the accompanying statement of assets and liabilities, including the schedule of investments, and the related statements of operations and of changes in net assets and the financial highlights present fairly, in all material respects, the financial position of Fidelity Latin America Fund (a fund of Fidelity Investment Trust) at October 31, 2013, the results of its operations for the year then ended, the changes in its net assets for each of the two years in the period then ended and the financial highlights for each of the periods indicated, in conformity with accounting principles generally accepted in the United States of America. These financial statements and financial highlights (hereafter referred to as "financial statements") are the responsibility of the Fidelity Latin America Fund's management. Our responsibility is to express an opinion on these financial statements based on our audits. We conducted our audits of these financial statements in accordance with the standards of the Public Company Accounting Oversight Board (United States). Those standards require that we plan and perform the audit to obtain reasonable assurance about whether the financial statements are free of material misstatement. An audit includes examining, on a test basis, evidence supporting the amounts and disclosures in the financial statements, assessing the accounting principles used and significant estimates made by management, and evaluating the overall financial statement presentation. We believe that our audits, which included confirmation of securities at October 31, 2013 by correspondence with the custodian and brokers, provide a reasonable basis for our opinion.
PricewaterhouseCoopers LLP
Boston, Massachusetts
December 16, 2013
Annual Report
Trustees and Officers
The Trustees, Member of the Advisory Board, and executive officers of the trust and fund, as applicable, are listed below. The Board of Trustees governs the fund and is responsible for protecting the interests of shareholders. The Trustees are experienced executives who meet periodically throughout the year to oversee the fund's activities, review contractual arrangements with companies that provide services to the fund, oversee management of the risks associated with such activities and contractual arrangements, and review the fund's performance. Except for James C. Curvey, Ned C. Lautenbach, Ronald P. O'Hanley, and William S. Stavropoulos, each of the Trustees oversees 171 funds. Mr. Curvey oversees 394 funds. Mr. Lautenbach, Mr. O'Hanley, and Mr. Stavropoulos each oversees 245 funds.
The Trustees hold office without limit in time except that (a) any Trustee may resign; (b) any Trustee may be removed by written instrument, signed by at least two-thirds of the number of Trustees prior to such removal; (c) any Trustee who requests to be retired or who has become incapacitated by illness or injury may be retired by written instrument signed by a majority of the other Trustees; and (d) any Trustee may be removed at any special meeting of shareholders by a two-thirds vote of the outstanding voting securities of the trust. Each Trustee who is not an interested person of the trust and the fund (as defined in the 1940 Act) (Independent Trustee), shall retire not later than the last day of the calendar year in which his or her 75th birthday occurs. The Independent Trustees may waive this mandatory retirement age policy with respect to individual Trustees. The executive officers and Advisory Board Member hold office without limit in time, except that any officer and Advisory Board Member may resign or may be removed by a vote of a majority of the Trustees at any regular meeting or any special meeting of the Trustees. Except as indicated, each individual has held the office shown or other offices in the same company for the past five years.
Experience, Skills, Attributes, and Qualifications of the Fund's Trustees. The Governance and Nominating Committee has adopted a statement of policy that describes the experience, qualifications, attributes, and skills that are necessary and desirable for potential Independent Trustee candidates (Statement of Policy). The Board believes that each Trustee satisfied at the time he or she was initially elected or appointed a Trustee, and continues to satisfy, the standards contemplated by the Statement of Policy. The Governance and Nominating Committee also engages professional search firms to help identify potential Independent Trustee candidates who have the experience, qualifications, attributes, and skills consistent with the Statement of Policy. From time to time, additional criteria based on the composition and skills of the current Independent Trustees, as well as experience or skills that may be appropriate in light of future changes to board composition, business conditions, and regulatory or other developments, have also been considered by the professional search firms and the Governance and Nominating Committee. In addition, the Board takes into account the Trustees' commitment and participation in Board and committee meetings, as well as their leadership of standing and ad hoc committees throughout their tenure.
In determining that a particular Trustee was and continues to be qualified to serve as a Trustee, the Board has considered a variety of criteria, none of which, in isolation, was controlling. The Board believes that, collectively, the Trustees have balanced and diverse experience, qualifications, attributes, and skills, which allow the Board to operate effectively in governing the fund and protecting the interests of shareholders. Information about the specific experience, skills, attributes, and qualifications of each Trustee, which in each case led to the Board's conclusion that the Trustee should serve (or continue to serve) as a trustee of the fund, is provided below.
Board Structure and Oversight Function. James C. Curvey is an interested person (as defined in the 1940 Act) and currently serves as Chairman. The Trustees have determined that an interested Chairman is appropriate and benefits shareholders because an interested Chairman has a personal and professional stake in the quality and continuity of services provided to the fund. Independent Trustees exercise their informed business judgment to appoint an individual of their choosing to serve as Chairman, regardless of whether the Trustee happens to be independent or a member of management. The Independent Trustees have determined that they can act independently and effectively without having an Independent Trustee serve as Chairman and that a key structural component for assuring that they are in a position to do so is for the Independent Trustees to constitute a substantial majority for the Board. The Independent Trustees also regularly meet in executive session. Ned C. Lautenbach serves as Chairman of the Independent Trustees and as such (i) acts as a liaison between the Independent Trustees and management with respect to matters important to the Independent Trustees and (ii) with management prepares agendas for Board meetings.
Fidelity funds are overseen by different Boards of Trustees. The fund's Board oversees Fidelity's equity and high income funds and another Board oversees Fidelity's investment-grade bond, money market, and asset allocation funds. The asset allocation funds may invest in Fidelity funds overseen by the fund's Board. The use of separate Boards, each with its own committee structure, allows the Trustees of each group of Fidelity funds to focus on the unique issues of the funds they oversee, including common research, investment, and operational issues. On occasion, the separate Boards establish joint committees to address issues of overlapping consequences for the Fidelity funds overseen by each Board.
The Trustees operate using a system of committees to facilitate the timely and efficient consideration of all matters of importance to the Trustees, the fund, and fund shareholders and to facilitate compliance with legal and regulatory requirements and oversight of the fund's activities and associated risks. The Board, acting through its committees, has charged FMR and its affiliates with (i) identifying events or circumstances the occurrence of which could have demonstrably adverse effects on the fund's business and/or reputation; (ii) implementing processes and controls to lessen the possibility that such events or circumstances occur or to mitigate the effects of such events or circumstances if they do occur; and (iii) creating and maintaining a system designed to evaluate continuously business and market conditions in order to facilitate the identification and implementation processes described in (i) and (ii) above. Because the day-to-day operations and activities of the fund are carried out by or through FMR, its affiliates and other service providers, the fund's exposure to risks is mitigated but not eliminated by the processes overseen by the Trustees. While each of the Board's committees has responsibility for overseeing different aspects of the fund's activities, oversight is exercised primarily through the Operations, Audit, and Compliance Committees. In addition, the Independent Trustees have worked with FMR to enhance the Board's oversight of investment and financial risks, legal and regulatory risks, technology risks, and operational risks, including the development of additional risk reporting to the Board. For example, a working group comprised of Independent Trustees and FMR has worked and continues to work to review the Fidelity funds' valuation-related activities, reporting and risk management. Appropriate personnel, including but not limited to the fund's Chief Compliance Officer (CCO), FMR's internal auditor, the independent accountants, the fund's Treasurer and portfolio management personnel, make periodic reports to the Board's committees, as appropriate, including an annual review of FMR's risk management program for the Fidelity funds. The responsibilities of each standing committee, including their oversight responsibilities, are described further under "Standing Committees of the Fund's Trustees."
Annual Report
The fund's Statement of Additional Information (SAI) includes more information about the Trustees. To request a free copy, call Fidelity at 1-877-208-0098.
Interested Trustees*:
Correspondence intended for each Trustee who is an interested person may be sent to Fidelity Investments, 245 Summer Street, Boston, Massachusetts 02210.
Name, Year of Birth; Principal Occupations and Other Relevant Experience+ |
James C. Curvey (1935) |
Year of Election or Appointment: 2007 Trustee Chairman of the Board of Trustees |
| Mr. Curvey also serves as Trustee of other Fidelity funds. Mr. Curvey is a Director of Fidelity Investments Money Management, Inc. (2009-present), Director of Fidelity Research & Analysis Co. (2009-present) and Director of FMR and FMR Co., Inc. (2007-present). Mr. Curvey is also Vice Chairman (2007-present) and Director of FMR LLC. In addition, Mr. Curvey serves as an Overseer for the Boston Symphony Orchestra and a member of the Trustees of Villanova University. Previously, Mr. Curvey was the Vice Chairman (2006-2007) and Director (2000-2007) of FMR Corp. |
Ronald P. O'Hanley (1957) |
Year of Election or Appointment: 2011 Trustee |
| Mr. O'Hanley also serves as Trustee of other Fidelity funds. He is Director of Fidelity SelectCo, LLC (2013-present), FMR Co., Inc. (2010-present), Director of Fidelity Investments Money Management, Inc. (2010-present), Director of Fidelity Research & Analysis Company (2010-present), President of Fidelity Asset Management and Corporate Services and a Member of Fidelity's Executive Committee (2010-present). Previously, Mr. O'Hanley served as President and Chief Executive Officer of BNY Mellon Asset Management (2007-2010). Mr. O'Hanley also served as Vice Chairman of Bank New York Mellon Corp. and a member of that firm's Executive Committee. Prior to the 2007 merger of The Bank of New York and Mellon Financial Corporation, he was Vice Chairman of Mellon Financial Corporation and President and Chief Executive Officer of Mellon Asset Management. He joined Mellon in February 1997. Mr. O'Hanley currently serves as Chairman of the Boston Public Library Foundation Board of Directors and sits on the Board of Directors of Beth Israel Deaconess Medical Center, the Board of Trustees of the Marine Biological Laboratory and the Advisory Board of the Maxwell School of Citizenship and Public Administration at Syracuse University. Mr. O'Hanley also chairs the Council on Asset Management for the Financial Services Roundtable and is a member of the Board of Directors of Institutional Investor's U.S. Institute. |
* Trustees have been determined to be "Interested Trustees" by virtue of, among other things, their affiliation with the trust or various entities under common control with FMR.
+ The information above includes each Trustee's principal occupation during the last five years and other information relating to the experience, attributes, and skills relevant to each Trustee's qualifications to serve as a Trustee, which led to the conclusion that each Trustee should serve as a Trustee for the fund.
Annual Report
Trustees and Officers - continued
Independent Trustees:
Correspondence intended for each Independent Trustee (that is, the Trustees other than the Interested Trustees) may be sent to Fidelity Investments, P.O. Box 55235, Boston, Massachusetts 02205-5235.
Name, Year of Birth; Principal Occupations and Other Relevant Experience+ |
Dennis J. Dirks (1948) |
Year of Election or Appointment: 2005 Trustee |
| Mr. Dirks also serves as Trustee of other Fidelity funds. Prior to his retirement in May 2003, Mr. Dirks was Chief Operating Officer and a member of the Board of The Depository Trust & Clearing Corporation (DTCC). He also served as President, Chief Operating Officer, and Board member of The Depository Trust Company (DTC) and President and Board member of the National Securities Clearing Corporation (NSCC). In addition, Mr. Dirks served as Chief Executive Officer and Board member of the Government Securities Clearing Corporation, Chief Executive Officer and Board member of the Mortgage-Backed Securities Clearing Corporation, as a Trustee and a member of the Finance Committee of Manhattan College (2005-2008), and as a Trustee and a member of the Finance Committee of AHRC of Nassau County (2006-2008). Mr. Dirks is a member of the Independent Directors Council (IDC) Governing Council (2010-present) and Board of Directors for The Brookville Center for Children's Services, Inc.(2009-present). |
Alan J. Lacy (1953) |
Year of Election or Appointment: 2008 Trustee |
| Mr. Lacy also serves as Trustee of other Fidelity funds. Mr. Lacy serves as Senior Adviser (2007-present) of Oak Hill Capital Partners, L.P. (private equity). Mr. Lacy also served as Chief Executive Officer (2000-2005) and Vice Chairman (2005-2006) of Sears Holdings Corporation and Sears, Roebuck and Co. (retail). In addition, Mr. Lacy serves as a member of the Board of Directors of Dave & Buster's Entertainment, Inc. (restaurant and entertainment complexes, 2010-present), Earth Fare, Inc. (retail grocery, 2012-present), The Hillman Companies, Inc. (hardware wholesalers, 2010-present), and Bristol-Myers Squibb Company (global pharmaceuticals, 2008-present). Mr. Lacy is a member of the Board of Trustees of The National Parks Conservation Association (2006-present). Previously, Mr. Lacy served as Chairman of the Board of Trustees of the National Parks Conservation Association (2008-2011) and as a member of the Board of Directors for the Western Union Company (global money transfer, 2006-2011). |
Ned C. Lautenbach (1944) |
Year of Election or Appointment: 2000 Trustee Chairman of the Independent Trustees |
| Mr. Lautenbach also serves as Trustee of other Fidelity funds. Mr. Lautenbach currently serves as the Lead Director of the Eaton Corporation Board of Directors (diversified industrial, 1997-present). Mr. Lautenbach is Chairman of the Board of Directors of the Philharmonic Center for the Arts in Naples, Florida (2012-present) and a member of the Council on Foreign Relations (1994-present). Previously, Mr. Lautenbach was a Partner/Advisory Partner at Clayton, Dubilier & Rice, LLC (private equity investment, 1998-2010), as well as a Director of Sony Corporation (2006-2007). |
Joseph Mauriello (1944) |
Year of Election or Appointment: 2008 Trustee |
| Mr. Mauriello also serves as Trustee of other Fidelity funds. Prior to his retirement in January 2006, Mr. Mauriello served in numerous senior management positions including Deputy Chairman and Chief Operating Officer (2004-2005), and Vice Chairman of Financial Services (2002-2004) of KPMG LLP US (professional services, 1965-2005). Mr. Mauriello currently serves as a member of the Board of Directors of XL Group plc. (global insurance and re-insurance, 2006-present). Previously, Mr. Mauriello served as a Director of the Hamilton Funds of the Bank of New York (2006-2007) and of Arcadia Resources Inc. (health care services and products, 2007-2012). |
Robert W. Selander (1950) |
Year of Election or Appointment: 2011 Trustee |
| Mr. Selander also serves as Trustee of other Fidelity funds. Previously, Mr. Selander served as a Member of the Advisory Board of other Fidelity funds (2011), and Executive Vice Chairman (2010), Chief Executive Officer (2009-2010), and President and Chief Executive Officer (1997-2009) of Mastercard, Inc. |
Cornelia M. Small (1944) |
Year of Election or Appointment: 2005 Trustee |
| Ms. Small also serves as Trustee of other Fidelity funds. Ms. Small is a member of the Board of Directors (2009-present) and Chair of the Investment Committee (2010-present) of the Teagle Foundation. Ms. Small also serves on the Investment Committee of the Berkshire Taconic Community Foundation (2008-present). Previously, Ms. Small served as Chairperson (2002-2008) and a member of the Investment Committee and Chairperson (2008-2012) and a member of the Board of Trustees of Smith College. In addition, Ms. Small served as Chief Investment Officer, Director of Global Equity Investments, and a member of the Board of Directors of Scudder, Stevens & Clark and Scudder Kemper Investments. |
William S. Stavropoulos (1939) |
Year of Election or Appointment: 2001 Trustee Vice Chairman of the Independent Trustees |
| Mr. Stavropoulos also serves as Trustee of other Fidelity funds. Mr. Stavropoulos serves as President and Founder of the Michigan Baseball Foundation, the Great Lakes Loons (2007-present). Mr. Stavropoulos is Chairman Emeritus of the Board of Directors of The Dow Chemical Company, where he previously served in numerous senior management positions, including President, CEO (1995-2000; 2002-2004), Chairman of the Executive Committee (2000-2006), and as a member of the Board of Directors (1990-2006). Currently, Mr. Stavropoulos is Chairman of the Board of Directors of Univar Inc. (global distributor of commodity and specialty chemicals), a Director of Teradata Corporation (data warehousing and technology solutions), and Maersk Inc. (industrial conglomerate), and a member of the Advisory Board for Metalmark Capital LLC (private equity investment, 2005-present). Mr. Stavropoulos is an operating advisor to Clayton, Dubilier & Rice, LLC (private equity investment). In addition, Mr. Stavropoulos is a member of the University of Notre Dame Advisory Council for the College of Science, a Trustee of the Rollin L. Gerstacker Foundation, and a Director of the Naples Philharmonic Center for the Arts. Previously, Mr. Stavropoulos served as a Director of Chemical Financial Corporation (bank holding company, 1993-2012) and Tyco International, Ltd. (multinational manufacturing and services, 2007-2012). |
David M. Thomas (1949) |
Year of Election or Appointment: 2008 Trustee |
| Mr. Thomas also serves as Trustee of other Fidelity funds. Mr. Thomas serves as Non-Executive Chairman of the Board of Directors of Fortune Brands Home and Security (home and security products, 2011-present), and as a member of the Board of Directors of Interpublic Group of Companies, Inc. (marketing communication, 2004-present). Previously, Mr. Thomas served as Executive Chairman (2005-2006) and Chairman and Chief Executive Officer (2000-2005) of IMS Health, Inc. (pharmaceutical and healthcare information solutions), and a Director of Fortune Brands, Inc. (consumer products, 2000-2011). |
+ The information above includes each Trustee's principal occupation during the last five years and other information relating to the experience, attributes, and skills relevant to each Trustee's qualifications to serve as a Trustee, which led to the conclusion that each Trustee should serve as a Trustee for the fund.
Advisory Board Member and Executive Officers:
Correspondence intended for each executive officer and Peter S. Lynch may be sent to Fidelity Investments, 245 Summer Street, Boston, Massachusetts 02210. Executive officers appear below in alphabetical order.
Name, Year of Birth; Principal Occupation |
Peter S. Lynch (1944) |
Year of Election or Appointment: 2003 Member of the Advisory Board |
| Mr. Lynch also serves as Member of the Advisory Board of other Fidelity funds. Mr. Lynch is Vice Chairman and a Director of FMR and FMR Co., Inc. In addition, Mr. Lynch serves as a Trustee of Boston College and as the Chairman of the Inner-City Scholarship Fund. Previously, Mr. Lynch served on the Special Olympics International Board of Directors (1997-2006). |
Elizabeth Paige Baumann (1968) |
Year of Election or Appointment: 2012 Anti-Money Laundering (AML) Officer |
| Ms. Baumann also serves as AML Officer of other funds. She is Chief AML Officer of FMR LLC (2012-present) and is an employee of Fidelity Investments. Previously, Ms. Baumann served as Vice President and Deputy Anti-Money Laundering Officer (2007-2012). |
William C. Coffey (1969) |
Year of Election or Appointment: 2009 Assistant Secretary |
| Mr. Coffey also serves as Assistant Secretary of other funds. He is Senior Vice President and Deputy General Counsel of FMR LLC (2010-present), and is an employee of Fidelity Investments. Previously, Mr. Coffey served as Vice President and Associate General Counsel of FMR LLC (2005-2009). |
Jonathan Davis (1968) |
Year of Election or Appointment: 2010 Assistant Treasurer |
| Mr. Davis also serves as Assistant Treasurer of other funds. Mr. Davis is an employee of Fidelity Investments. Previously, Mr. Davis served as Vice President and Associate General Counsel of FMR LLC (2003-2010). |
Adrien E. Deberghes (1967) |
Year of Election or Appointment: 2008 Deputy Treasurer |
| Mr. Deberghes also serves as an officer of other funds. He is an employee of Fidelity Investments (2008-present). Prior to joining Fidelity Investments, Mr. Deberghes was Senior Vice President of Mutual Fund Administration at State Street Corporation (2007-2008), Senior Director of Mutual Fund Administration at Investors Bank & Trust (2005-2007), and Director of Finance for Dunkin' Brands (2000-2005). |
Stephanie J. Dorsey (1969) |
Year of Election or Appointment: 2010 Assistant Treasurer |
| Ms. Dorsey also serves as an officer of other funds. She is an employee of Fidelity Investments (2008-present) and has served in other fund officer roles. Prior to joining Fidelity Investments, Ms. Dorsey served as Treasurer (2004-2008) of the JPMorgan Mutual Funds and Vice President (2004-2008) of JPMorgan Chase Bank. |
Scott C. Goebel (1968) |
Year of Election or Appointment: 2008 Secretary and Chief Legal Officer (CLO) |
| Mr. Goebel serves as Secretary and CLO of other funds. Mr. Goebel also serves as Secretary of Fidelity Investments Money Management, Inc. (FIMM) (2010-present) and Fidelity Research and Analysis Company (FRAC) (2010-present); General Counsel, Secretary, and Senior Vice President of FMR (2008-present) and FMR Co., Inc. (2008-present); Chief Legal Officer of Fidelity Management & Research (Hong Kong) Limited (2008-present) and Assistant Secretary of Fidelity Management & Research (Japan) Inc. (2008-present), and Fidelity Management & Research (U.K.) Inc. (2008-present). Previously, Mr. Goebel served as Secretary and CLO of other Fidelity funds (2008-2013), Assistant Secretary of FIMM (2008-2010), FRAC (2008-2010), and certain funds (2007-2008); and as Vice President and Secretary of Fidelity Distributors Corporation (FDC) (2005-2007). Mr. Goebel has been employed by FMR LLC or an affiliate since 2001. |
Joseph A. Hanlon (1968) |
Year of Election or Appointment: 2012 Chief Compliance Officer |
| Mr. Hanlon also serves as Chief Compliance Officer of other funds. Mr. Hanlon serves as Compliance Officer of FMR, FMR Co., Inc., Fidelity Investments Money Management, Inc. (FIMM), Fidelity Research and Analysis Company (FRAC), and Fidelity Management & Research (Hong Kong) (2009-present), as Senior Vice President of the Fidelity Asset Management Division (2009-present), and is an employee of Fidelity Investments. Previously, Mr. Hanlon served as Compliance Officer of Fidelity Management & Research (Japan) Inc. (2009-2013), Strategic Advisers, Inc. (2009-2013), and Fidelity Management & Research (U.K.) Inc. (2009-2013). |
Bruce T. Herring (1965) |
Year of Election or Appointment: 2006 Vice President of certain Equity Funds |
| Mr. Herring also serves as Vice President of other funds. He serves as Chief Investment Officer of Fidelity Global Asset Allocation (GAA) (2013-present), Chief Investment Officer and Director of Fidelity Management & Research (U.K.) Inc. (2010-present), Group Chief Investment Officer of FMR, and President of Fidelity Research & Analysis Company (2010-present). Previously, Mr. Herring served as Vice President (2005-2006) and Senior Vice President (2006-2007) of Fidelity Management & Research Company, Vice President of FMR Co., Inc. (2001-2007), and as a portfolio manager for Fidelity U.S. Equity Funds. |
Brian B. Hogan (1964) |
Year of Election or Appointment: 2009 Vice President |
| Mr. Hogan also serves as Vice President of other funds. Mr. Hogan serves as President of FMR's Equity Division (2009-present). Previously, Mr. Hogan served as Senior Vice President, Equity Research of FMR (2006-2009) and as a portfolio manager. |
Chris Maher (1972) |
Year of Election or Appointment: 2013 Assistant Treasurer |
| Mr. Maher serves as Assistant Treasurer of other funds. Mr. Maher is Vice President of Valuation Oversight and is an employee of Fidelity Investments. Previously, Mr. Maher served as Vice President of Asset Management Compliance (2013), Vice President of FMR's Program Management Group (2010-2013), and Vice President of Valuation Oversight (2008-2010). |
Christine Reynolds (1958) |
Year of Election or Appointment: 2008 Chief Financial Officer |
| Ms. Reynolds also serves as Chief Financial Officer of other funds. Ms. Reynolds became President of Fidelity Pricing and Cash Management Services (FPCMS) in August 2008. Ms. Reynolds served as Chief Operating Officer of FPCMS (2007-2008). Previously, Ms. Reynolds served as President, Treasurer, and Anti-Money Laundering officer of the Fidelity funds (2004-2007). |
Kenneth B. Robins (1969) |
Year of Election or Appointment: 2008 President and Treasurer |
| Mr. Robins also serves as an officer of other funds. Mr. Robins serves as Executive Vice President of Fidelity Investments Money Management, Inc. (FIMM) (2013-present) and is an employee of Fidelity Investments (2004-present). Previously, Mr. Robins served in other fund officer roles. |
Gary W. Ryan (1958) |
Year of Election or Appointment: 2005 Assistant Treasurer |
| Mr. Ryan also serves as Assistant Treasurer of other funds. Mr. Ryan is an employee of Fidelity Investments and has served in other fund officer roles. Previously, Mr. Ryan served as Vice President of Fund Reporting in Fidelity Pricing and Cash Management Services (FPCMS) (1999-2005). |
Stephen Sadoski (1971) |
Year of Election or Appointment: 2012 Deputy Treasurer |
| Mr. Sadoski also serves as Deputy Treasurer of other funds. He is an employee of Fidelity Investments (2012-present) and has served in another fund officer role. Prior to joining Fidelity Investments, Mr. Sadoski served as an assistant chief accountant in the Division of Investment Management of the Securities and Exchange Commission (SEC) (2009-2012) and as a senior manager at Deloitte & Touche LLP (1997-2009). |
Stacie M. Smith (1974) |
Year of Election or Appointment: 2013 Deputy Treasurer |
| Ms. Smith also serves as an officer of other funds. She is an employee of Fidelity Investments (2009-present) and has served in other fund officer roles. Prior to joining Fidelity Investments, Ms. Smith served as Senior Audit Manager of Ernst & Young LLP (1996-2009). |
Renee Stagnone (1975) |
Year of Election or Appointment: 2013 Deputy Treasurer |
| Ms. Stagnone also serves as Deputy Treasurer of other funds. Ms. Stagnone is an employee of Fidelity Investments. |
Joseph F. Zambello (1957) |
Year of Election or Appointment: 2011 Deputy Treasurer |
| Mr. Zambello also serves as Deputy Treasurer of other funds. Mr. Zambello is an employee of Fidelity Investments. Previously, Mr. Zambello served as Vice President of FMR's Program Management Group (2009-2011) and Vice President of the Transfer Agent Oversight Group (2005-2009). |
Annual Report
Distributions (Unaudited)
The Board of Trustees of Fidelity Latin America Fund voted to pay to shareholders of record at the opening of business on record date, the following distributions per share derived from capital gains realized from sales of portfolio securities and dividends derived from net investment income:
| Pay Date | Record Date | Dividends | Capital Gains |
Institutional Class | 12/09/2013 | 12/06/2013 | $0.676 | $6.250 |
The fund hereby designates as a capital gain dividend with respect to the taxable year ended October 31, 2013, $266,757,493, or, if subsequently determined to be different, the net capital gain of such year.
Institutional Class designates 5% of the dividends distributed during the fiscal year as qualifying for the dividends-received deduction for corporate shareholders.
Institutional Class designates 83% of the dividends distributed during the fiscal year as amounts which may be taken into account as a dividend for purposes of the maximum rate under section 1(h)(11) of the Internal Revenue Code.
The amounts per share which represent income derived from sources within, and taxes paid to, foreign countries or possessions of the United States are as follows:
| Pay Date | Income | Taxes |
Institutional Class | 12/10/2012 | $1.107 | $0.1408 |
The fund will notify shareholders in January 2014 of amounts for use in preparing 2013 income tax returns.
Annual Report
Board Approval of Investment Advisory Contracts and Management Fees
Fidelity Latin America Fund
Each year, the Board of Trustees, including the Independent Trustees (together, the Board), votes on the renewal of the management contract and sub-advisory agreements (together, the Advisory Contracts) for the fund. The Board, assisted by the advice of fund counsel and Independent Trustees' counsel, requests and considers a broad range of information relevant to the renewal of the Advisory Contracts throughout the year.
The Board meets regularly and, at each of its meetings, covers an extensive agenda of topics and materials and considers factors that are relevant to its annual consideration of the renewal of the fund's Advisory Contracts, including the services and support provided to the fund and its shareholders. The Board has established various standing committees, each composed of and chaired by Independent Trustees with varying backgrounds, to which the Board has assigned specific subject matter responsibilities in order to enhance effective decision-making by the Board. The Board, acting directly and through its Committees, requests and receives information concerning the annual consideration of the renewal of the fund's Advisory Contracts. The Board also meets as needed to consider matters specifically related to the Board's annual consideration of the renewal of Advisory Contracts. Members of the Board may also meet with trustees of other Fidelity funds through ad hoc joint committees to discuss certain matters relevant to the Fidelity funds.
At its July 2013 meeting, the Board, including the Independent Trustees, unanimously determined to renew the fund's Advisory Contracts. In reaching its determination, the Board considered all factors it believed relevant, including (i) the nature, extent, and quality of the services to be provided to the fund and its shareholders (including the investment performance of the fund); (ii) the competitiveness of the fund's management fee and total expense ratio relative to peer funds; (iii) the total costs of the services to be provided by and the profits to be realized by Fidelity from its relationship with the fund; (iv) the extent to which economies of scale exist and would be realized as the fund grows; and (v) whether fee levels reflect these economies of scale, if any, for the benefit of fund shareholders.
In considering whether to renew the Advisory Contracts for the fund, the Board reached a determination, with the assistance of fund counsel and Independent Trustees' counsel and through the exercise of its business judgment, that the renewal of the Advisory Contracts was in the best interests of the fund and its shareholders and that the compensation payable under the Advisory Contracts was fair and reasonable. The Board's decision to renew the Advisory Contracts was not based on any single factor, but rather was based on a comprehensive consideration of all the information provided to the Board at its meetings throughout the year. The Board, in reaching its determination to renew the Advisory Contracts, was aware that shareholders in the fund have a broad range of investment choices available to them, including a wide choice among mutual funds offered by Fidelity's competitors, and that the fund's shareholders, who have the opportunity to review and weigh the disclosure provided by the fund in its prospectus and other public disclosures, have chosen to invest in this fund, which is a part of the Fidelity family of funds.
Nature, Extent, and Quality of Services Provided. The Board considered the staffing within the investment adviser, Fidelity Management & Research Company (FMR), and the sub-advisers (together, the Investment Advisers) as it relates to the fund, including the backgrounds of the fund's investment personnel, and also considered the fund's investment objective, strategies, and related investment philosophy. The Independent Trustees also had discussions with senior management of Fidelity's investment operations and investment groups. The Board considered the structure of the portfolio manager compensation program and whether this structure provides appropriate incentives to act in the best interests of the fund.
Resources Dedicated to Investment Management and Support Services. The Board and the Fund Oversight and Research Committees reviewed the general qualifications and capabilities of the Investment Advisers' investment staff, including its size, education, experience, and resources, as well as the Investment Advisers' approach to recruiting, training, managing, and compensating investment personnel. The Board noted that FMR has continued to increase the resources devoted to non-U.S. offices, including expansion of Fidelity's global investment organization. The Board also noted that Fidelity's analysts have extensive resources, tools and capabilities that allow them to conduct sophisticated quantitative and fundamental analysis, as well as credit analysis of issuers, counterparties and guarantors. Further, the Board believes that Fidelity's investment professionals have sufficient access to global information and data so as to provide competitive investment results over time, and that those professionals also have access to sophisticated tools that permit them to assess portfolio construction and risk and performance attribution characteristics continuously, as well as to transmit new information and research conclusions rapidly around the world. Additionally, in its deliberations, the Board considered the Investment Advisers' trading and risk management capabilities and resources, which are an integral part of the investment management process.
Shareholder and Administrative Services. The Board considered (i) the nature, extent, quality, and cost of advisory, administrative, and shareholder services performed by the Investment Advisers and their affiliates under the Advisory Contracts and under separate agreements covering transfer agency, pricing and bookkeeping, and securities lending services for the fund; (ii) the nature and extent of the supervision of third party service providers, principally custodians and subcustodians; and (iii) the resources devoted to, and the record of compliance with, the fund's compliance policies and procedures. The Board also reviewed the allocation of fund brokerage, including allocations to brokers affiliated with the Investment Advisers, the use of brokerage commissions to pay fund expenses, and the use of "soft" commission dollars to pay for research services.
The Board noted that the growth of fund assets over time across the complex allows Fidelity to reinvest in the development of services designed to enhance the value or convenience of the Fidelity funds as investment vehicles. These services include 24-hour access to account information and market information through telephone representatives and over the Internet, investor education materials and asset allocation tools, and the expanded availability of Fidelity Investor Centers.
Annual Report
Investment in a Large Fund Family. The Board considered the benefits to shareholders of investing in a Fidelity fund, including the benefits of investing in a fund that is part of a large family of funds offering a variety of investment disciplines and providing a large variety of mutual fund investor services. The Board noted that Fidelity had taken, or had made recommendations that resulted in the Fidelity funds taking, a number of actions over the previous year that benefited particular funds, including (i) continuing to dedicate additional resources to investment research and to the support of the senior management team that oversees asset management; (ii) persisting in efforts to enhance Fidelity's global research capabilities; (iii) launching new funds and making other enhancements to meet client needs for global and income-oriented solutions; (iv) continuing to launch dedicated lower cost underlying funds to meet portfolio construction needs related to expanding underlying fund options for Fidelity funds of funds, specifically for the Freedom Fund product lines; (v) rationalizing product lines and gaining increased efficiencies through the mergers of several funds into other funds; (vi) strengthening Fidelity's index fund offerings by reducing investment minimums and adopting or lowering existing expense caps for certain funds and classes; (vii) enhancing Global Asset Allocation product offerings by launching new funds and strategies, including "open architecture" target date funds that utilize affiliated and unaffiliated sub-advisers; (viii) modifying the eligibility criteria for Institutional Class shares of Advisor funds to increase their marketability to a portion of the defined contribution plan market; (ix) creating a new low-cost retirement share class for certain Advisor funds to appeal to large retirement plans; (x) transitioning the management of certain Fidelity commodity funds to Geode Capital Management LLC, a registered commodity pool operator, while retaining administrative responsibilities for the funds; (xi) reorganizing a number of funds; and (xii) taking steps toward establishing a new Fidelity adviser to manage sector-based funds and products.
Investment Performance. The Board considered whether the fund has operated in accordance with its investment objective, as well as its record of compliance with its investment restrictions and its performance history.
The Board took into account discussions with the Investment Advisers about fund investment performance that occur at Board meetings throughout the year. In this regard the Board noted that as part of regularly scheduled fund reviews and other reports to the Board on fund performance, the Board periodically considers annualized return information for the fund, for different time periods, measured against a securities market index ("benchmark index") and a peer group of mutual funds with similar objectives ("peer group"). In its evaluation of fund investment performance, the Board gave particular attention to information indicating changes in performance of certain Fidelity funds for specific time periods and the Investment Advisers' explanations for any overperformance or underperformance.
In addition to reviewing absolute and relative fund performance, the Independent Trustees periodically consider the appropriateness of fund performance metrics in evaluating the results achieved. In general, the Independent Trustees believe that fund performance should be evaluated based on net performance (after fees and expenses) of both the highest performing and lowest performing classes, where applicable, compared to appropriate benchmark indices, over appropriate time periods which may include full market cycles, and compared to peer groups, as applicable, over the same periods, taking into account relevant factors including the following: general market conditions; issuer-specific information; tactical opportunities for investment; and fund cash flows and other factors.
The Independent Trustees recognize that shareholders evaluate performance on a net basis over their own holding periods, for which one-, three-, and five-year periods are used as a proxy. For this reason, the performance information reviewed by the Board also included net cumulative calendar year total return information for the fund and an appropriate benchmark index for the most recent one-, three-, and five-year periods, as shown below. A peer group comparison is not shown below.
Annual Report
Board Approval of Investment Advisory Contracts and Management Fees - continued
Fidelity Latin America Fund

Based on its review, the Board concluded that the nature, extent, and quality of services provided to the fund under the Advisory Contracts should benefit the fund's shareholders.
Competitiveness of Management Fee and Total Expense Ratio. The Board considered the fund's management fee and total expense ratio compared to "mapped groups" of competitive funds and classes. Fidelity creates "mapped groups" by combining similar Lipper investment objective categories that have comparable management fee characteristics. Combining Lipper investment objective categories aids the Board's management fee and total expense ratio comparisons by broadening the competitive group used for comparison and by reducing the number of universes to which various Fidelity funds are compared.
Management Fee. The Board considered two proprietary management fee comparisons for the 12-month periods shown in the chart below. The group of Lipper funds used by the Board for management fee comparisons is referred to below as the "Total Mapped Group." The Total Mapped Group comparison focuses on a fund's standing in terms of gross management fees before expense reimbursements or caps relative to the total universe of funds with comparable investment mandates, regardless of whether their management fee structures also are comparable. Funds with comparable investment mandates offer exposure to similar types of securities. Funds with comparable management fee structures have similar management fee contractual arrangements (e.g., flat rate charged for advisory services, all-inclusive fee rate, etc.). "TMG %" represents the percentage of funds in the Total Mapped Group that had management fees that were lower than the fund's. For example, a TMG % of 8% means that 92% of the funds in the Total Mapped Group had higher management fees than the fund. The "Asset-Size Peer Group" (ASPG) comparison focuses on a fund's standing relative to a subset of non-Fidelity funds within the Total Mapped Group that are similar in size and management fee structure. The ASPG represents at least 15% of the funds in the Total Mapped Group with comparable asset size and management fee structures, subject to a minimum of 50 funds (or all funds in the Total Mapped Group if fewer than 50). Additional information, such as the ASPG quartile in which the fund's management fee ranked, is also included in the chart and considered by the Board.
Annual Report
Fidelity Latin America Fund
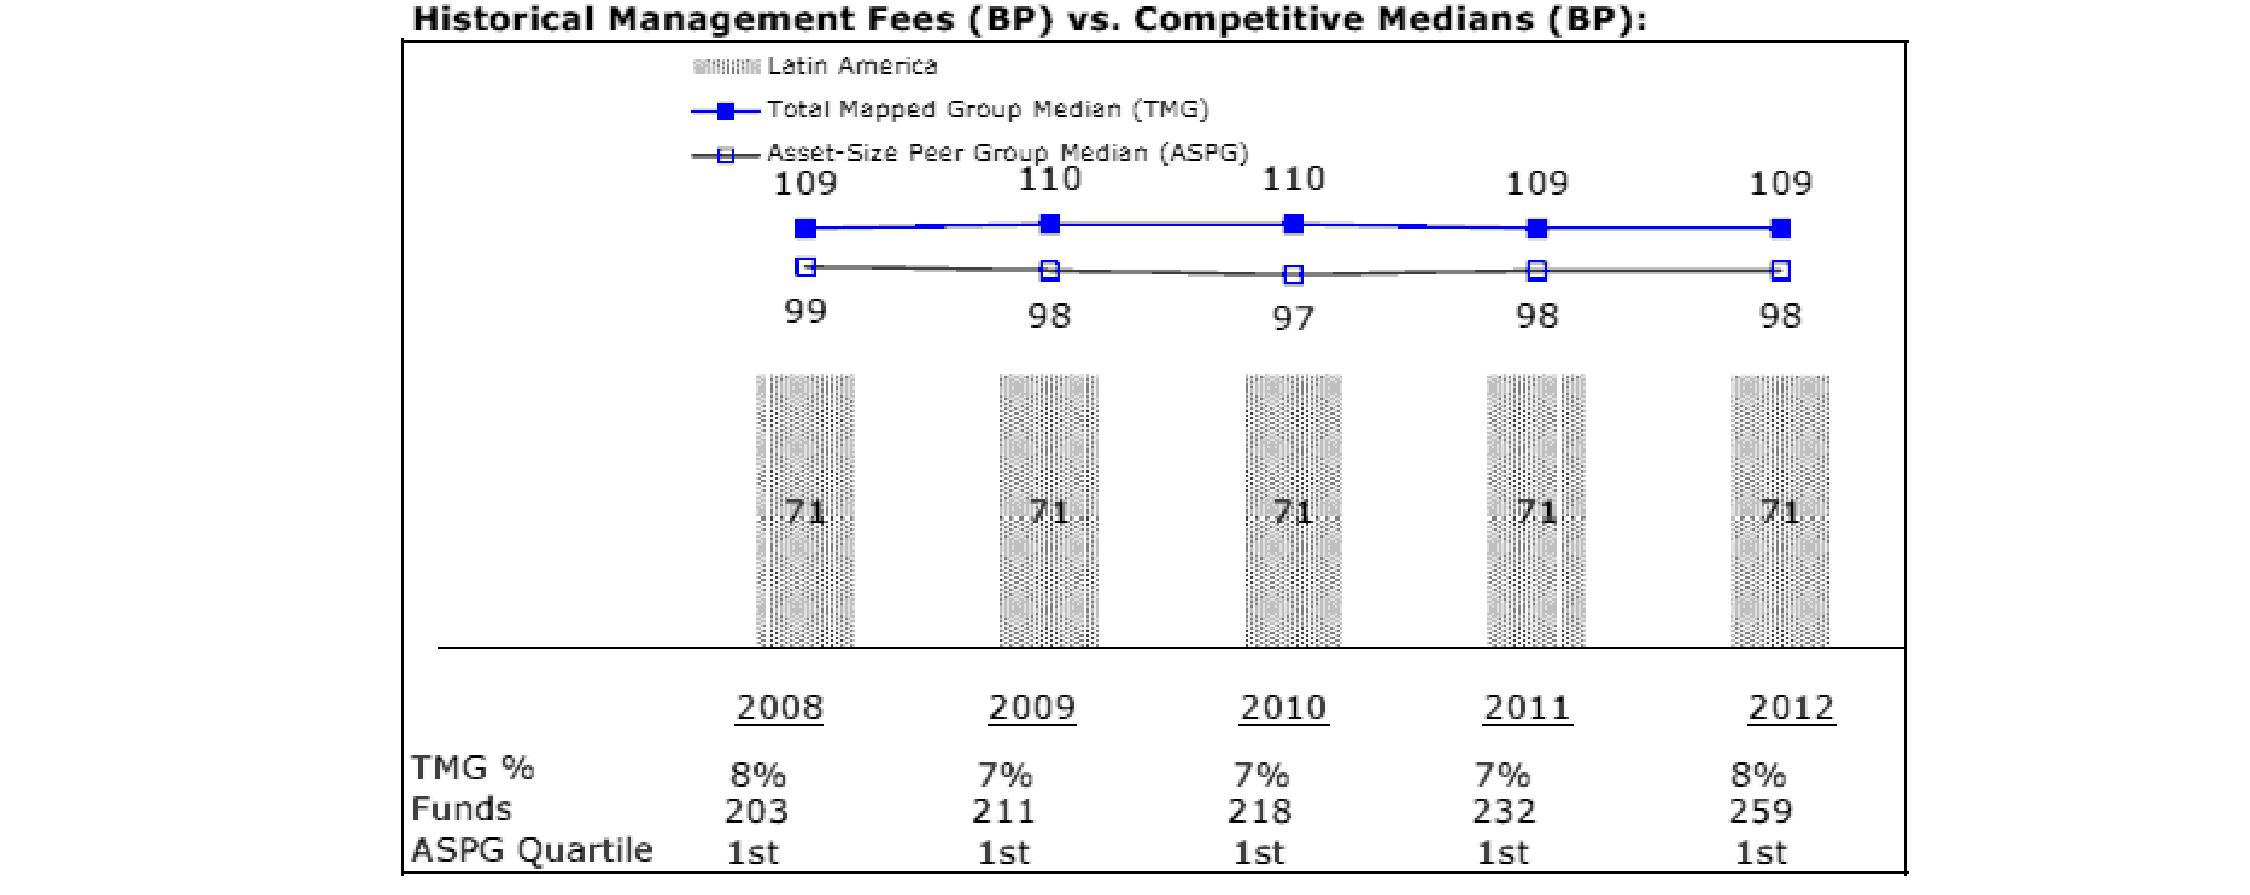
The Board noted that the fund's management fee ranked below the median of its Total Mapped Group and below the median of its ASPG for 2012.
Based on its review, the Board concluded that the fund's management fee is fair and reasonable in light of the services that the fund receives and the other factors considered.
Total Expense Ratio. In its review of each class's total expense ratio, the Board considered the fund's management fee as well as other fund or class expenses, as applicable, such as transfer agent fees, pricing and bookkeeping fees, fund-paid 12b-1 fees, and custodial, legal, and audit fees. The Board also noted the effects of any waivers and reimbursements on fees and expenses. As part of its review, the Board also considered the current and historical total expense ratios of each class of the fund compared to competitive fund median expenses. Each class of the fund is compared to those funds and classes in the Total Mapped Group (used by the Board for management fee comparisons) that have a similar sales load structure.
The Board noted that the total expense ratio of each class ranked below its competitive median for 2012.
Fees Charged to Other Fidelity Clients. The Board also considered Fidelity fee structures and other information with respect to clients of FMR and its affiliates, such as other mutual funds advised or subadvised by FMR or its affiliates, pension plan clients, and other institutional clients. The Board noted the findings of the 2013 ad hoc joint committee (created with the board of other Fidelity funds), which reviewed and compared Fidelity's institutional investment advisory business with its business of providing services to the Fidelity funds, including the differences in services provided, fees charged, and costs incurred, as well as competition in their respective marketplaces.
Based on its review of total expense ratios and fees charged to other Fidelity clients, the Board concluded that the total expense ratio of each class of the fund was reasonable in light of the services that the fund and its shareholders receive and the other factors considered.
Costs of the Services and Profitability. The Board considered the revenues earned and the expenses incurred by Fidelity in conducting the business of developing, marketing, distributing, managing, administering and servicing the fund and servicing the fund's shareholders. The Board also considered the level of Fidelity's profits in respect of all the Fidelity funds.
On an annual basis, FMR presents to the Board Fidelity's profitability for the fund. Fidelity calculates the profitability for each fund, as well as aggregate profitability for groups of Fidelity funds and all Fidelity funds, using a series of detailed revenue and cost allocation methodologies which originate with the books and records of Fidelity on which Fidelity's audited financial statements are based. The Audit Committee of the Board reviews any significant changes from the prior year's methodologies.
PricewaterhouseCoopers LLP (PwC), independent registered public accounting firm and auditor to Fidelity and certain Fidelity funds, has been engaged annually by the Board as part of the Board's assessment of Fidelity's profitability analysis. PwC's engagement includes the review and assessment of the methodologies used by Fidelity in determining the revenues and expenses attributable to Fidelity's mutual fund business, and completion of agreed-upon procedures surrounding the mathematical accuracy of fund profitability and its conformity to allocation methodologies. After considering PwC's reports issued under the engagement and information provided by Fidelity, the Board concluded that while other allocation methods may also be reasonable, Fidelity's profitability methodologies are reasonable in all material respects.
Annual Report
Board Approval of Investment Advisory Contracts and Management Fees - continued
The Board also reviewed Fidelity's non-fund businesses and fall-out benefits related to the mutual fund business as well as cases where Fidelity's affiliates may benefit from or be related to the fund's business.
The Board considered the costs of the services provided by and the profits realized by Fidelity in connection with the operation of the fund and was satisfied that the profitability was not excessive in the circumstances.
Economies of Scale. The Board considered whether there have been economies of scale in respect of the management of the Fidelity funds, whether the Fidelity funds (including the fund) have appropriately benefited from any such economies of scale, and whether there is potential for realization of any further economies of scale. The Board considered the extent to which the fund will benefit from economies of scale through increased services to the fund, through waivers or reimbursements, or through fee or expense reductions. The Board also noted that in 2009, it and the board of other Fidelity funds created an ad hoc committee (the Economies of Scale Committee) to analyze whether FMR attains economies of scale in respect of the management and servicing of the Fidelity funds, whether the Fidelity funds have appropriately benefited from such economies of scale, and whether there is potential for realization of any further economies of scale.
The Board recognized that the fund's management contract incorporates a "group fee" structure, which provides for lower group fee rates as total fund assets under FMR's management increase, and for higher group fee rates as total fund assets under FMR's management decrease. FMR calculates the group fee rates based on a tiered asset "breakpoint" schedule that varies based on asset class. The Board considered that the group fee is designed to deliver the benefits of economies of scale to fund shareholders when total Fidelity fund assets increase, even if assets of any particular fund are unchanged or have declined, because some portion of Fidelity's costs are attributable to services provided to all Fidelity funds, and all funds benefit if those costs can be allocated among more assets. The Board concluded that, given the group fee structure, fund shareholders will benefit from lower management fees as assets under FMR's management increase at the fund complex level, regardless of whether Fidelity achieves any such economies of scale.
The Board concluded, taking into account the analysis of the Economies of Scale Committee, that economies of scale, if any, are being appropriately shared between fund shareholders and Fidelity.
Amendment to Description of Group Fee Rate. At its July 2013 meeting, the Board voted to approve an amendment to the fund's management contract to modify the description of the "group fee rate" effective August 1, 2013. The Board noted that under the prior description in the contract, the group fee rate was based on the average net assets of all registered investment companies with which FMR has management contracts. Under the contract's tiered asset breakpoint schedule, the group fee rate is lower as total fund assets under FMR's management increase, and higher as total fund assets under FMR's management decrease. The Board considered that the prior description would have excluded the assets of 64 Fidelity sector funds from the group fee rate calculation once Fidelity SelectCo, LLC, an affiliate of FMR, assumed management responsibilities for those funds. The Board noted that modifying the description of the group fee rate to continue to include the assets of those 64 funds for purposes of determining group fee rate breakpoints would avoid an immediate adverse impact on the group fee rate for any fund.
Additional Information Requested by the Board. In order to develop fully the factual basis for consideration of the Fidelity funds' Advisory Contracts, the Board requested and received additional information on certain topics, including: (i) fund performance trends and Fidelity's long-term strategies for certain funds; (ii) the potential to further rationalize the Fidelity fund lineup with the possibility of achieving savings for the funds and Fidelity; (iii) the methodology with respect to competitive fund data and peer group classifications; (iv) the arrangements with, and performance of, certain sub-advisers on behalf of the Fidelity funds, as well as certain proposed participating affiliate arrangements; (v) the realization of fall-out benefits in certain Fidelity business units; (vi) Fidelity's group fee structures, including the rationale for the individual fee rates of certain categories of funds and the definition of group assets; (vii) trends regarding industry use of performance fee structures and the performance adjustment methodologies applicable to the Fidelity funds; (viii) additional competitive analysis regarding the total expenses for certain classes; and (ix) fund profitability methodology, including Fidelity's cost allocation methodology, and the impact of certain factors on fund profitability results.
Based on its evaluation of all of the conclusions noted above, and after considering all factors it believed relevant, the Board ultimately concluded that the advisory fee structures are fair and reasonable, and that the fund's Advisory Contracts should be renewed.
Annual Report
Investment Adviser
Fidelity Management & Research Company
Boston, MA
Investment Sub-Advisers
FMR Co., Inc.
Fidelity Management & Research
(U.K.) Inc.
Fidelity Management & Research
(Hong Kong) Limited
Fidelity Management & Research
(Japan) Inc.
FIL Investment Advisors
FIL Investment Advisors
(UK) Limited
General Distributor
Fidelity Distributors Corporation
Smithfield, RI
Transfer and Service Agents
Fidelity Investments Institutional Operations Company, Inc.
Boston, MA
Fidelity Service Company, Inc.
Boston, MA
Custodian
Brown Brothers Harriman & Co.
Boston, MA
(Fidelity Investment logo)(registered trademark)
Corporate Headquarters
245 Summer St., Boston, MA 02210
www.fidelity.com
FALAI-UANN-1213
1.917407.103
Fidelity Advisor®
Japan
Fund - Class A, Class T, Class B, and Class C
Annual Report
October 31, 2013
(Fidelity Cover Art)
Class A, Class T, Class B, and Class C are
classes of Fidelity® Japan Fund
Contents
Performance | (Click Here) | How the fund has done over time. |
Management's Discussion of Fund Performance | (Click Here) | The Portfolio Manager's review of fund performance and strategy. |
Shareholder Expense Example | (Click Here) | An example of shareholder expenses. |
Investment Changes | (Click Here) | A summary of major shifts in the fund's investments over the past six months. |
Investments | (Click Here) | A complete list of the fund's investments with their market values. |
Financial Statements | (Click Here) | Statements of assets and liabilities, operations, and changes in net assets, as well as financial highlights. |
Notes | (Click Here) | Notes to the financial statements. |
Report of Independent Registered Public Accounting Firm | (Click Here) | |
Trustees and Officers | (Click Here) | |
Distributions | (Click Here) | |
Board Approval of Investment Advisory Contracts and Management Fees | (Click Here) | |
To view a fund's proxy voting guidelines and proxy voting record for the 12-month period ended June 30, visit http://www.fidelity.com/proxyvotingresults or visit the Securities and Exchange Commission's (SEC) web site at http://www.sec.gov. You may also call 1-877-208-0098 to request a free copy of the proxy voting guidelines.
Standard & Poor's, S&P and S&P 500 are registered service marks of The McGraw-Hill Companies, Inc. and have been licensed for use by Fidelity Distributors Corporation.
Other third-party marks appearing herein are the property of their respective owners.
All other marks appearing herein are registered or unregistered trademarks or service marks of FMR LLC or an affiliated company. © 2013 FMR LLC. All rights reserved.
This report and the financial statements contained herein are submitted for the general information of the shareholders of the fund. This report is not authorized for distribution to prospective investors in the fund unless preceded or accompanied by an effective prospectus.
A fund files its complete schedule of portfolio holdings with the SEC for the first and third quarters of each fiscal year on Form N-Q. Forms N-Q are available on the SEC's web site at http://www.sec.gov. A fund's Forms N-Q may be reviewed and copied at the SEC's Public Reference Room in Washington, DC. Information regarding the operation of the SEC's Public Reference Room may be obtained by calling 1-800-SEC-0330. For a complete list of a fund's portfolio holdings, view the most recent holdings listing, semiannual report, or annual report on Fidelity's web site at http://www.fidelity.com, http://www.advisor.fidelity.com, or http://www.401k.com, as applicable.
NOT FDIC INSURED • MAY LOSE VALUE • NO BANK GUARANTEE
Neither the fund nor Fidelity Distributors Corporation is a bank.
Annual Report
Average annual total return reflects the change in the value of an investment, assuming reinvestment of the class' distributions from dividend income and capital gains (the profits earned upon the sale of securities that have grown in value, if any) and assuming a constant rate of performance each year. The $10,000 table and the fund's returns do not reflect the deduction of taxes that a shareholder would pay on fund distributions or the redemption of fund shares. During periods of reimbursement by Fidelity, a fund's total return will be greater than it would be had the reimbursement not occurred. How a fund did yesterday is no guarantee of how it will do tomorrow.
Average Annual Total Returns
Periods ended October 31, 2013 | Past 1
year | Past 5
years | Past 10
years |
Class A (incl. 5.75% sales charge) A | 24.01% | 6.90% | 2.87% |
Class T (incl. 3.50% sales charge) B | 26.45% | 7.22% | 3.03% |
Class B (incl. contingent deferred sales charge) C | 25.52% | 7.41% | 3.26% |
Class C (incl. contingent deferred sales charge) D | 29.55% | 7.73% | 3.27% |
A Class A shares bear a 0.25% 12b-1 fee. The initial offering of Class A shares took place on December 14, 2010. Returns prior to December 14, 2010, are those of Fidelity® Japan Fund, the original class of the fund, which has no 12b-1 fee. Had Class A's 12b-1 fee been reflected, returns prior to December 14, 2010, would have been lower.
B Class T shares bear a 0.50% 12b-1 fee. The initial offering of Class T shares took place on December 14, 2010. Returns prior to December 14, 2010, are those of Fidelity® Japan Fund, the original class of the fund, which has no 12b-1 fee. Had Class T's 12b-1 fee been reflected, returns prior to December 14, 2010, would have been lower.
C Class B shares bear a 1.00% 12b-1 fee. The initial offering of Class B shares took place on December 14, 2010. Returns prior to December 14, 2010, are those of Fidelity Japan Fund, the original class of the fund, which has no 12b-1 fee. Had Class B's 12b-1 fee been reflected, returns prior to December 14, 2010, would have been lower. Class B shares' contingent deferred sales charges included in the past one year, past five years, and past ten years total return figures are 5%, 2%, and 0%, respectively.
D Class C shares bear a 1.00% 12b-1 fee. The initial offering of Class C shares took place on December 14, 2010. Returns prior to December 14, 2010, are those of Fidelity Japan Fund, the original class of the fund, which has no 12b-1 fee. Had Class C's 12b-1 fee been reflected, returns prior to December 14, 2010, would have been lower. Class C shares' contingent deferred sales charges included in the past one year, past five years, and past ten years total return figures are 1%, 0%, and 0%, respectively.
$10,000 Over 10 Years
Let's say hypothetically that $10,000 was invested in Fidelity Advisor® Japan Fund - Class A on October 31, 2003, and the current 5.75% sales charge was paid. The chart shows how the value of your investment would have changed, and also shows how the Tokyo Stock Price Index (TOPIX) performed over the same period. See footnote A above for additional information regarding the performance of Class A.
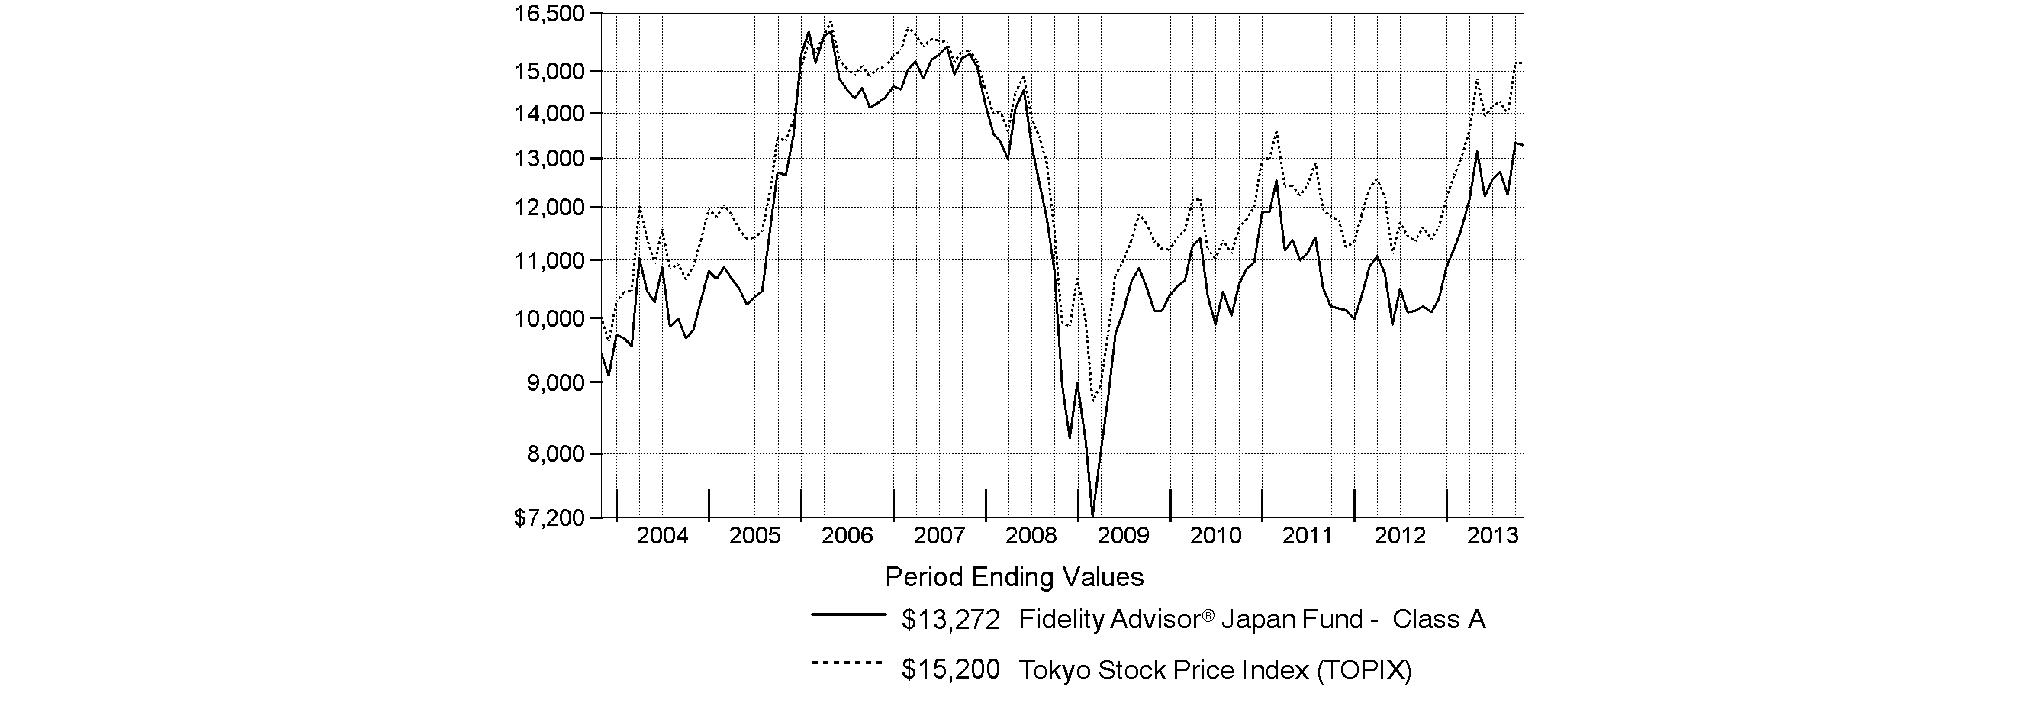
-
Annual Report
Market Recap: On balance, global equity markets remained upbeat for the 12-month period ending October 31, 2013. The MSCI® ACWI® (All Country World Index) Index gained 23.75% for the period, amid investor preference for higher-risk assets. The period was not without turbulence, however. In the spring and summer, central banks worldwide, especially in the U.S. and China, made clear their intentions to maintain accommodative monetary policies. That stance, combined with modest cyclical improvements around the globe and generally low valuations, underpinned the broad rally in equities. Europe (+32%) shone brightly, with most markets in the region - large and small - registering solid, index-beating gains. Another bright spot was Japan, which, despite a struggling yen and taking a second-half breather, posted a 34% result for the full year. The U.S. - by far the index's biggest constituent - also outperformed the global market with a roughly 28% advance. Meanwhile, Asia-Pacific ex Japan (+14%) lagged, hurt in part by a slowdown in Australia's mining industry as well as currency headwinds. Foreign-exchange and commodity weakness also curbed results in resource-heavy Canada and emerging markets (EM), both of which were up 7%. Country-level EM performance diverged meaningfully for the period, as evidenced by performance in Brazil (-1%), Russia (+12%), India (+1%) and China (+8%).
Comments from Rie Shigekawa, Portfolio Manager of Fidelity Advisor® Japan Fund: For the year, the fund's Class A, Class T, Class B and Class C shares returned 31.58%, 31.04%, 30.52% and 30.55%, respectively (excluding sales charges), lagging the 33.59% gain of the Tokyo Stock Price Index. Versus the index, unrewarding stock selection and a modest cash position in a soaring market dampened the fund's relative performance, outweighing the positive impact of sector and industry weightings. Specifically, not owning strong-performing index component SoftBank significantly detracted. Other detractors included a large overweighting in materials stock Toray Industries, as well as negligible exposure to Nomura Holdings, which I sold, and not owning Daiwa Securities Group, two market-beating brokerage stocks in the index. Lastly, the much weaker yen was a significant headwind for U.S. investors in Japanese stocks. Conversely, a large overweighting in the automobiles & components group bolstered relative performance. The fund's largest contributor and also its largest holding was automaker Toyota Motor. Although Toyota remained the fund's largest position at period end, I reduced it as the stock advanced in an effort to lessen risk and nail down profits. Other contributors were bank stock Sumitomo Mitsui Financial Group and Nidec, a manufacturer of electric motors and related components.
The views expressed above reflect those of the portfolio manager(s) only through the end of the period as stated on the cover of this report and do not necessarily represent the views of Fidelity or any other person in the Fidelity organization. Any such views are subject to change at any time based upon market or other conditions and Fidelity disclaims any responsibility to update such views. These views may not be relied on as investment advice and, because investment decisions for a Fidelity fund are based on numerous factors, may not be relied on as an indication of trading intent on behalf of any Fidelity fund.
Annual Report
Fidelity Japan Fund
As a shareholder of the Fund, you incur two types of costs: (1) transaction costs, including sales charges (loads) on purchase payments or redemption proceeds, redemption fees and (2) ongoing costs, including management fees, distribution and/or service (12b-1) fees and other Fund expenses. This Example is intended to help you understand your ongoing costs (in dollars) of investing in the Fund and to compare these costs with the ongoing costs of investing in other mutual funds.
The Example is based on an investment of $1,000 invested at the beginning of the period and held for the entire period (May 1, 2013 to October 31, 2013).
Actual Expenses
The first line of the accompanying table for each class of the Fund provides information about actual account values and actual expenses. You may use the information in this line, together with the amount you invested, to estimate the expenses that you paid over the period. Simply divide your account value by $1,000.00 (for example, an $8,600 account value divided by $1,000.00 = 8.6), then multiply the result by the number in the first line for a class of the Fund under the heading entitled "Expenses Paid During Period" to estimate the expenses you paid on your account during this period. A small balance maintenance fee of $12.00 that is charged once a year may apply for certain accounts with a value of less than $2,000. This fee is not included in the table below. If it was, the estimate of expenses you paid during the period would be higher, and your ending account value lower, by this amount. In addition, the Fund, as a shareholder in the underlying Fidelity Central Funds, will indirectly bear its pro-rata share of the fees and expenses incurred by the underlying Fidelity Central Funds. These fees and expenses are not included in the Fund's annualized expense ratio used to calculate the expense estimate in the table below.
Hypothetical Example for Comparison Purposes
The second line of the accompanying table for each class of the Fund provides information about hypothetical account values and hypothetical expenses based on a Class' actual expense ratio and an assumed rate of return of 5% per year before expenses, which is not the Class' actual return. The hypothetical account values and expenses may not be used to estimate the actual ending account balance or expenses you paid for the period. You may use this information to compare the ongoing costs of investing in the Fund and other funds. To do so, compare this 5% hypothetical example with the 5% hypothetical examples that appear in the shareholder reports of the other funds. A small balance maintenance fee of $12.00 that is charged once a year may apply for certain accounts with a value of less than $2,000. This fee is not included in the table below. If it was, the estimate of expenses you paid during the period would be higher, and your ending account value lower, by this amount. In addition, the Fund, as a shareholder in the underlying Fidelity Central Funds, will indirectly bear its pro-rata share of the fees and expenses incurred by the underlying Fidelity Central Funds. These fees and expenses are not included in the Fund's annualized expense ratio used to calculate the expense estimate in the table below.
Please note that the expenses shown in the table are meant to highlight your ongoing costs only and do not reflect any transaction costs. Therefore, the second line of the table is useful in comparing ongoing costs only, and will not help you determine the relative total costs of owning different funds. In addition, if these transactional costs were included, your costs would have been higher.
| Annualized
Expense Ratio B | Beginning
Account Value
May 1, 2013 | Ending
Account Value
October 31, 2013 | Expenses Paid
During Period*
May 1, 2013
to October 31, 2013 |
Class A | 1.27% | | | |
Actual | | $ 1,000.00 | $ 1,009.30 | $ 6.43 |
HypotheticalA | | $ 1,000.00 | $ 1,018.80 | $ 6.46 |
Class T | 1.55% | | | |
Actual | | $ 1,000.00 | $ 1,007.60 | $ 7.84 |
HypotheticalA | | $ 1,000.00 | $ 1,017.39 | $ 7.88 |
Class B | 2.02% | | | |
Actual | | $ 1,000.00 | $ 1,005.00 | $ 10.21 |
HypotheticalA | | $ 1,000.00 | $ 1,015.02 | $ 10.26 |
Class C | 1.97% | | | |
Actual | | $ 1,000.00 | $ 1,005.90 | $ 9.96 |
HypotheticalA | | $ 1,000.00 | $ 1,015.27 | $ 10.01 |
Japan | .92% | | | |
Actual | | $ 1,000.00 | $ 1,010.90 | $ 4.66 |
HypotheticalA | | $ 1,000.00 | $ 1,020.57 | $ 4.69 |
Institutional Class | .91% | | | |
Actual | | $ 1,000.00 | $ 1,010.90 | $ 4.61 |
HypotheticalA | | $ 1,000.00 | $ 1,020.62 | $ 4.63 |
A 5% return per year before expenses
B Annualized expense ratio reflects expenses net of applicable fee waivers.
* Expenses are equal to each Class' annualized expense ratio, multiplied by the average account value over the period, multiplied by 184/365 (to reflect the one-half year period).
Annual Report
Fidelity Japan Fund
Investment Changes (Unaudited)
Geographic Diversification (% of fund's net assets) |
As of October 31, 2013 |
 | Japan | 97.1% | |
 | United States of America* | 2.9% | |

* Includes Short-Term Investments and Net Other Assets (Liabilities). |
Percentages are based on country or territory of incorporation and are adjusted for the effect of futures contracts, if applicable. |
As of April 30, 2013 |
| Japan | 96.3% | |
| United States of America* | 3.7% | |

* Includes Short-Term Investments and Net Other Assets (Liabilities). |
Percentages are based on country or territory of incorporation and are adjusted for the effect of futures contracts, if applicable. |
Asset Allocation as of October 31, 2013 |
| % of fund's
net assets | % of fund's net assets
6 months ago |
Stocks | 97.1 | 96.3 |
Short-Term Investments and Net Other Assets (Liabilities) | 2.9 | 3.7 |
Top Ten Stocks as of October 31, 2013 |
| % of fund's
net assets | % of fund's net assets
6 months ago |
Toyota Motor Corp. (Automobiles) | 6.4 | 6.5 |
Mitsubishi UFJ Financial Group, Inc. (Commercial Banks) | 4.9 | 5.2 |
Sumitomo Mitsui Financial Group, Inc. (Commercial Banks) | 4.9 | 4.6 |
Honda Motor Co. Ltd. (Automobiles) | 3.8 | 3.8 |
Nissan Motor Co. Ltd. (Automobiles) | 3.6 | 3.2 |
Toray Industries, Inc. (Chemicals) | 3.4 | 3.8 |
Bridgestone Corp. (Auto Components) | 3.2 | 2.5 |
KDDI Corp. (Wireless Telecommunication Services) | 3.2 | 0.0 |
Shimadzu Corp. (Electronic Equipment & Components) | 3.0 | 2.3 |
Mizuho Financial Group, Inc. (Commercial Banks) | 2.9 | 3.0 |
| 39.3 | |
Market Sectors as of October 31, 2013 |
| % of fund's
net assets | % of fund's net assets
6 months ago |
Consumer Discretionary | 25.4 | 24.7 |
Financials | 20.3 | 22.3 |
Industrials | 13.0 | 10.3 |
Information Technology | 12.8 | 13.3 |
Materials | 11.5 | 12.2 |
Health Care | 7.4 | 9.2 |
Telecommunication Services | 3.2 | 1.7 |
Consumer Staples | 2.1 | 2.1 |
Utilities | 1.4 | 0.5 |
Annual Report
Fidelity Japan Fund
Investments October 31, 2013
Showing Percentage of Net Assets
Common Stocks - 97.1% |
| Shares | | Value |
CONSUMER DISCRETIONARY - 25.4% |
Auto Components - 5.2% |
Bridgestone Corp. | 502,600 | | $ 17,230,494 |
Calsonic Kansei Corp. | 898,000 | | 4,317,370 |
DENSO Corp. | 135,400 | | 6,508,464 |
| | 28,056,328 |
Automobiles - 15.1% |
Honda Motor Co. Ltd. | 516,900 | | 20,641,324 |
Nissan Motor Co. Ltd. | 1,904,700 | | 19,125,593 |
Suzuki Motor Corp. | 287,600 | | 7,231,810 |
Toyota Motor Corp. | 532,300 | | 34,513,369 |
| | 81,512,096 |
Hotels, Restaurants & Leisure - 0.5% |
St. Marc Holdings Co. Ltd. | 29,400 | | 1,513,267 |
Toridoll.Corporation | 140,100 | | 1,319,102 |
| | 2,832,369 |
Household Durables - 0.6% |
Fujitsu General Ltd. | 266,000 | | 3,222,933 |
Media - 0.5% |
Daiichikosho Co. Ltd. | 19,400 | | 554,367 |
Tohokushinsha Film Corp. | 209,700 | | 2,065,936 |
| | 2,620,303 |
Multiline Retail - 1.2% |
Marui Group Co. Ltd. | 696,200 | | 6,664,501 |
Specialty Retail - 0.6% |
Arc Land Sakamoto Co. Ltd. | 7,200 | | 107,558 |
K's Denki Corp. | 99,300 | | 2,915,731 |
| | 3,023,289 |
Textiles, Apparel & Luxury Goods - 1.7% |
Onward Holdings Co. Ltd. | 1,118,000 | | 9,253,438 |
TOTAL CONSUMER DISCRETIONARY | | 137,185,257 |
CONSUMER STAPLES - 2.1% |
Food & Staples Retailing - 2.1% |
Seven & i Holdings Co., Ltd. | 261,600 | | 9,681,459 |
Valor Co. Ltd. | 106,800 | | 1,541,477 |
| | 11,222,936 |
FINANCIALS - 20.3% |
Commercial Banks - 12.7% |
Mitsubishi UFJ Financial Group, Inc. | 4,169,400 | | 26,551,852 |
Mizuho Financial Group, Inc. | 7,531,700 | | 15,809,514 |
Sumitomo Mitsui Financial Group, Inc. | 546,800 | | 26,430,067 |
| | 68,791,433 |
Consumer Finance - 1.7% |
ACOM Co. Ltd. (a) | 925,400 | | 3,623,562 |
AEON Financial Service Co. Ltd. | 181,100 | | 5,561,627 |
| | 9,185,189 |
Insurance - 2.9% |
MS&AD Insurance Group Holdings, Inc. | 604,900 | | 15,641,114 |
|
| Shares | | Value |
Real Estate Investment Trusts - 0.4% |
Frontier Real Estate Investment Corp. | 111 | | $ 1,109,096 |
Japan Logistics Fund, Inc. | 112 | | 1,164,928 |
| | 2,274,024 |
Real Estate Management & Development - 2.6% |
Daibiru Corp. | 98,800 | | 1,259,067 |
Nomura Real Estate Holdings, Inc. | 501,100 | | 12,678,547 |
| | 13,937,614 |
TOTAL FINANCIALS | | 109,829,374 |
HEALTH CARE - 7.4% |
Health Care Equipment & Supplies - 3.2% |
ASAHI INTECC Co. Ltd. (d) | 42,000 | | 2,825,632 |
Nihon Kohden Corp. | 101,700 | | 4,188,679 |
Terumo Corp. | 215,900 | | 10,456,188 |
| | 17,470,499 |
Health Care Providers & Services - 1.0% |
Message Co. Ltd. (d) | 192,100 | | 5,422,373 |
Pharmaceuticals - 3.2% |
Nippon Shinyaku Co. Ltd. | 231,000 | | 3,981,888 |
Takeda Pharmaceutical Co. Ltd. | 277,800 | | 13,238,442 |
| | 17,220,330 |
TOTAL HEALTH CARE | | 40,113,202 |
INDUSTRIALS - 13.0% |
Commercial Services & Supplies - 0.3% |
Moshi Moshi Hotline, Inc. | 123,100 | | 1,547,319 |
Construction & Engineering - 0.3% |
Toyo Engineering Corp. | 455,000 | | 1,938,740 |
Electrical Equipment - 5.8% |
Fujikura Ltd. | 469,000 | | 2,140,123 |
Mitsubishi Electric Corp. | 1,401,000 | | 15,399,744 |
Nidec Corp. (d) | 140,900 | | 13,731,011 |
| | 31,270,878 |
Industrial Conglomerates - 2.4% |
Toshiba Corp. | 3,051,000 | | 12,967,565 |
Machinery - 2.9% |
Makita Corp. | 91,300 | | 4,616,983 |
Sumitomo Heavy Industries Ltd. | 2,496,000 | | 11,047,145 |
| | 15,664,128 |
Road & Rail - 0.4% |
Hitachi Transport System Ltd. | 130,800 | | 2,074,096 |
Trading Companies & Distributors - 0.9% |
Sumitomo Corp. | 356,700 | | 4,641,846 |
TOTAL INDUSTRIALS | | 70,104,572 |
Common Stocks - continued |
| Shares | | Value |
INFORMATION TECHNOLOGY - 12.8% |
Computers & Peripherals - 0.8% |
Japan Digital Laboratory Co. | 77,600 | | $ 926,185 |
Wacom Co. Ltd. | 441,800 | | 3,282,413 |
| | 4,208,598 |
Electronic Equipment & Components - 9.0% |
Azbil Corp. | 283,600 | | 6,833,237 |
ESPEC Corp. | 120,700 | | 939,903 |
Hamamatsu Photonics K.K. | 155,600 | | 5,822,462 |
Horiba Ltd. | 240,000 | | 8,769,708 |
Nichicon Corp. | 225,200 | | 2,358,487 |
Shimadzu Corp. | 1,656,000 | | 16,216,186 |
TDK Corp. | 146,000 | | 6,205,021 |
Topcon Corp. | 94,300 | | 1,421,926 |
| | 48,566,930 |
IT Services - 1.8% |
Fujitsu Ltd. | 1,381,000 | | 5,933,057 |
Otsuka Corp. | 30,600 | | 3,968,920 |
| | 9,901,977 |
Semiconductors & Semiconductor Equipment - 1.2% |
Disco Corp. | 58,000 | | 3,665,230 |
NuFlare Technology, Inc. | 18,700 | | 2,503,567 |
| | 6,168,797 |
TOTAL INFORMATION TECHNOLOGY | | 68,846,302 |
MATERIALS - 11.5% |
Chemicals - 9.0% |
Asahi Kasei Corp. | 1,785,000 | | 13,584,930 |
Hitachi Chemical Co. Ltd. | 363,700 | | 5,579,808 |
Nihon Nohyaku Co. Ltd. | 212,000 | | 2,541,070 |
Nitto Denko Corp. | 97,300 | | 5,102,505 |
Toray Industries, Inc. | 2,930,000 | | 18,308,803 |
Zeon Corp. | 271,000 | | 3,229,543 |
| | 48,346,659 |
Metals & Mining - 2.5% |
Nippon Steel & Sumitomo Metal Corp. | 3,937,000 | | 12,994,281 |
Pacific Metals Co. Ltd. | 210,000 | | 769,544 |
| | 13,763,825 |
TOTAL MATERIALS | | 62,110,484 |
|
| Shares | | Value |
TELECOMMUNICATION SERVICES - 3.2% |
Wireless Telecommunication Services - 3.2% |
KDDI Corp. | 317,000 | | $ 17,167,607 |
UTILITIES - 1.4% |
Electric Utilities - 1.4% |
Kansai Electric Power Co., Inc. (a) | 204,200 | | 2,584,564 |
Tohoku Electric Power Co., Inc. (a) | 399,100 | | 4,830,784 |
| | 7,415,348 |
TOTAL COMMON STOCKS (Cost $504,921,967) |
523,995,082
|
Money Market Funds - 3.3% |
| | | |
Fidelity Cash Central Fund, 0.09% (b) | 9,955,567 | | 9,955,567 |
Fidelity Securities Lending Cash Central Fund, 0.09% (b)(c) | 7,668,401 | | 7,668,401 |
TOTAL MONEY MARKET FUNDS (Cost $17,623,968) |
17,623,968
|
TOTAL INVESTMENT PORTFOLIO - 100.4% (Cost $522,545,935) | | 541,619,050 |
NET OTHER ASSETS (LIABILITIES) - (0.4)% | | (2,238,378) |
NET ASSETS - 100% | $ 539,380,672 |
Legend |
(a) Non-income producing |
(b) Affiliated fund that is generally available only to investment companies and other accounts managed by Fidelity Investments. The rate quoted is the annualized seven-day yield of the fund at period end. A complete unaudited listing of the fund's holdings as of its most recent quarter end is available upon request. In addition, each Fidelity Central Fund's financial statements, which are not covered by the Fund's Report of Independent Registered Public Accounting Firm, are available on the SEC's website or upon request. |
(c) Investment made with cash collateral received from securities on loan. |
(d) Security or a portion of the security is on loan at period end. |
Affiliated Central Funds |
Information regarding fiscal year to date income earned by the Fund from investments in Fidelity Central Funds is as follows: |
Fund | Income earned |
Fidelity Cash Central Fund | $ 15,638 |
Fidelity Securities Lending Cash Central Fund | 93,183 |
Total | $ 108,821 |
Other Information |
The following is a summary of the inputs used, as of October 31, 2013, involving the Fund's assets and liabilities carried at fair value. The inputs or methodology used for valuing securities may not be an indication of the risk associated with investing in those securities. For more information on valuation inputs, and their aggregation into the levels used in the tables below, please refer to the Investment Valuation section in the accompanying Notes to Financial Statements. |
Valuation Inputs at Reporting Date: |
Description | Total | Level 1 | Level 2 | Level 3 |
Investments in Securities: | | | | |
Equities: | | | | |
Consumer Discretionary | $ 137,185,257 | $ - | $ 137,185,257 | $ - |
Consumer Staples | 11,222,936 | - | 11,222,936 | - |
Financials | 109,829,374 | - | 109,829,374 | - |
Health Care | 40,113,202 | - | 40,113,202 | - |
Industrials | 70,104,572 | - | 70,104,572 | - |
Information Technology | 68,846,302 | - | 68,846,302 | - |
Materials | 62,110,484 | - | 62,110,484 | - |
Telecommunication Services | 17,167,607 | - | 17,167,607 | - |
Utilities | 7,415,348 | - | 7,415,348 | - |
Money Market Funds | 17,623,968 | 17,623,968 | - | - |
Total Investments in Securities: | $ 541,619,050 | $ 17,623,968 | $ 523,995,082 | $ - |
The following is a summary of transfers between Level 1 and Level 2 for the period ended October 31, 2013. Transfers are assumed to have occurred at the beginning of the period, and are primarily attributable to the valuation techniques used for foreign equity securities, as discussed in the accompanying Notes to Financial Statements: |
Transfers | Total |
Level 1 to Level 2 | $ 185,243,204 |
Level 2 to Level 1 | $ 0 |
See accompanying notes which are an integral part of the financial statements.
Annual Report
Fidelity Japan Fund
Statement of Assets and Liabilities
| October 31, 2013 |
| | |
Assets | | |
Investment in securities, at value (including securities loaned of $7,293,099) - See accompanying schedule: Unaffiliated issuers (cost $504,921,967) | $ 523,995,082 | |
Fidelity Central Funds (cost $17,623,968) | 17,623,968 | |
Total Investments (cost $522,545,935) | | $ 541,619,050 |
Receivable for investments sold | | 2,851,415 |
Receivable for fund shares sold | | 679,527 |
Dividends receivable | | 3,870,202 |
Distributions receivable from Fidelity Central Funds | | 6,131 |
Prepaid expenses | | 1,910 |
Other receivables | | 26,529 |
Total assets | | 549,054,764 |
| | |
Liabilities | | |
Payable for investments purchased | $ 646,082 | |
Payable for fund shares redeemed | 886,923 | |
Accrued management fee | 265,409 | |
Distribution and service plan fees payable | 16,866 | |
Other affiliated payables | 110,934 | |
Other payables and accrued expenses | 79,477 | |
Collateral on securities loaned, at value | 7,668,401 | |
Total liabilities | | 9,674,092 |
| | |
Net Assets | | $ 539,380,672 |
Net Assets consist of: | | |
Paid in capital | | $ 713,501,665 |
Undistributed net investment income | | 4,547,036 |
Accumulated undistributed net realized gain (loss) on investments and foreign currency transactions | | (197,749,320) |
Net unrealized appreciation (depreciation) on investments and assets and liabilities in foreign currencies | | 19,081,291 |
Net Assets | | $ 539,380,672 |
Statement of Assets and Liabilities - continued
| October 31, 2013 |
| | |
Calculation of Maximum Offering Price Class A:
Net Asset Value and redemption price per share ($20,519,915 ÷ 1,709,790 shares) | | $ 12.00 |
| | |
Maximum offering price per share (100/94.25 of $12.00) | | $ 12.73 |
Class T:
Net Asset Value and redemption price per share ($5,356,999 ÷ 447,738 shares) | | $ 11.96 |
| | |
Maximum offering price per share (100/96.50 of $11.96) | | $ 12.39 |
Class B:
Net Asset Value and offering price per share ($874,018 ÷ 72,837 shares)A | | $ 12.00 |
| | |
Class C:
Net Asset Value and offering price per share ($11,823,577 ÷ 988,738 shares)A | | $ 11.96 |
| | |
Japan:
Net Asset Value, offering price and redemption price per share ($480,773,281 ÷ 39,971,447 shares) | | $ 12.03 |
| | |
Institutional Class:
Net Asset Value, offering price and redemption price per share ($20,032,882 ÷ 1,666,824 shares) | | $ 12.02 |
A Redemption price per share is equal to net asset value less any applicable contingent deferred sales charge.
See accompanying notes which are an integral part of the financial statements.
Annual Report
Fidelity Japan Fund
Financial Statements - continued
Statement of Operations
| Year ended October 31, 2013 |
| | |
Investment Income | | |
Dividends | | $ 10,225,631 |
Income from Fidelity Central Funds | | 108,821 |
Income before foreign taxes withheld | | 10,334,452 |
Less foreign taxes withheld | | (730,071) |
Total income | | 9,604,381 |
| | |
Expenses | | |
Management fee | | |
Basic fee | $ 3,381,267 | |
Performance adjustment | (364,882) | |
Transfer agent fees | 1,005,993 | |
Distribution and service plan fees | 164,646 | |
Accounting and security lending fees | 250,524 | |
Custodian fees and expenses | 64,515 | |
Independent trustees' compensation | 2,744 | |
Registration fees | 86,829 | |
Audit | 69,145 | |
Legal | 1,108 | |
Interest | 85 | |
Miscellaneous | 3,524 | |
Total expenses before reductions | 4,665,498 | |
Expense reductions | (78,932) | 4,586,566 |
Net investment income (loss) | | 5,017,815 |
Realized and Unrealized Gain (Loss) Net realized gain (loss) on: | | |
Investment securities: | | |
Unaffiliated issuers | 22,728,384 | |
Foreign currency transactions | (386,358) | |
Total net realized gain (loss) | | 22,342,026 |
Change in net unrealized appreciation (depreciation) on: Investment securities | 92,533,961 | |
Assets and liabilities in foreign currencies | 99,827 | |
Total change in net unrealized appreciation (depreciation) | | 92,633,788 |
Net gain (loss) | | 114,975,814 |
Net increase (decrease) in net assets resulting from operations | | $ 119,993,629 |
Statement of Changes in Net Assets
| Year ended
October 31,
2013 | Year ended
October 31,
2012 |
Increase (Decrease) in Net Assets | | |
Operations | | |
Net investment income (loss) | $ 5,017,815 | $ 5,368,143 |
Net realized gain (loss) | 22,342,026 | (8,912,266) |
Change in net unrealized appreciation (depreciation) | 92,633,788 | 3,021,959 |
Net increase (decrease) in net assets resulting from operations | 119,993,629 | (522,164) |
Distributions to shareholders from net investment income | (5,641,978) | (7,688,787) |
Distributions to shareholders from net realized gain | (3,106,863) | (2,570,905) |
Total distributions | (8,748,841) | (10,259,692) |
Share transactions - net increase (decrease) | 51,180,009 | (93,975,629) |
Redemption fees | 461,366 | 61,543 |
Total increase (decrease) in net assets | 162,886,163 | (104,695,942) |
| | |
Net Assets | | |
Beginning of period | 376,494,509 | 481,190,451 |
End of period (including undistributed net investment income of $4,547,036 and undistributed net investment income of $5,171,198, respectively) | $ 539,380,672 | $ 376,494,509 |
See accompanying notes which are an integral part of the financial statements.
Annual Report
Financial Highlights - Class A
Years ended October 31, | 2013 | 2012 | 2011 H |
Selected Per-Share Data | | | |
Net asset value, beginning of period | $ 9.30 | $ 9.54 | $ 10.83 |
Income from Investment Operations | | | |
Net investment income (loss) E | .08 | .09 | .09 |
Net realized and unrealized gain (loss) | 2.80 | (.15) | (1.39) |
Total from investment operations | 2.88 | (.06) | (1.30) |
Distributions from net investment income | (.11) | (.13) | - |
Distributions from net realized gain | (.08) | (.05) | - |
Total distributions | (.19) | (.18) | - |
Redemption fees added to paid in capital E | .01 | - K | .01 |
Net asset value, end of period | $ 12.00 | $ 9.30 | $ 9.54 |
Total Return B, C, D | 31.58% | (.64)% | (11.91)% |
Ratios to Average Net Assets F, I | | | |
Expenses before reductions | 1.26% | 1.42% | 1.20% A |
Expenses net of fee waivers, if any | 1.26% | 1.38% | 1.20% A |
Expenses net of all reductions | 1.25% | 1.36% | 1.16% A |
Net investment income (loss) | .75% | .94% | 1.02% A |
Supplemental Data | | | |
Net assets, end of period (000 omitted) | $ 20,520 | $ 9,495 | $ 13,208 |
Portfolio turnover rate G | 68% | 52% | 134% J |
A Annualized B Total returns for periods of less than one year are not annualized. C Total returns would have been lower if certain expenses had not been reduced during the applicable periods shown. D Total returns do not include the effect of the sales charges. E Calculated based on average shares outstanding during the period. F Fees and expenses of any underlying Fidelity Central Funds are not included in the Fund's expense ratio. The Fund indirectly bears its proportionate share of the expenses of any underlying Fidelity Central Funds. G Amount does not include the portfolio activity of any underlying Fidelity Central Funds. H For the period December 14, 2010 (commencement of sale of shares) to October 31, 2011. I Expense ratios reflect operating expenses of the class. Expenses before reductions do not reflect amounts reimbursed by the investment adviser or reductions from brokerage service arrangements or reductions from other expense offset arrangements and do not represent the amount paid by the class during periods when reimbursements or reductions occur. Expense ratios before reductions for start-up periods may not be representative of longer-term operating periods. Expenses net of fee waivers reflect expenses after reimbursement by the investment adviser but prior to reductions from brokerage service arrangements or other expense offset arrangements. Expenses net of all reductions represent the net expenses paid by the class. J The portfolio turnover rate does not include the assets acquired in the merger. K Amount represents less than $.01 per share. |
Financial Highlights - Class T
Years ended October 31, | 2013 | 2012 | 2011 H |
Selected Per-Share Data | | | |
Net asset value, beginning of period | $ 9.28 | $ 9.51 | $ 10.83 |
Income from Investment Operations | | | |
Net investment income (loss) E | .05 | .06 | .07 |
Net realized and unrealized gain (loss) | 2.78 | (.13) | (1.40) |
Total from investment operations | 2.83 | (.07) | (1.33) |
Distributions from net investment income | (.08) | (.11) | - |
Distributions from net realized gain | (.08) | (.05) | - |
Total distributions | (.16) | (.16) | - |
Redemption fees added to paid in capital E | .01 | - K | .01 |
Net asset value, end of period | $ 11.96 | $ 9.28 | $ 9.51 |
Total Return B, C, D | 31.04% | (.75)% | (12.19)% |
Ratios to Average Net Assets F, I | | | |
Expenses before reductions | 1.55% | 1.70% | 1.48% A |
Expenses net of fee waivers, if any | 1.55% | 1.66% | 1.48% A |
Expenses net of all reductions | 1.53% | 1.64% | 1.44% A |
Net investment income (loss) | .46% | .66% | .74% A |
Supplemental Data | | | |
Net assets, end of period (000 omitted) | $ 5,357 | $ 3,934 | $ 4,643 |
Portfolio turnover rate G | 68% | 52% | 134% J |
A Annualized B Total returns for periods of less than one year are not annualized. C Total returns would have been lower if certain expenses had not been reduced during the applicable periods shown. D Total returns do not include the effect of the sales charges. E Calculated based on average shares outstanding during the period. F Fees and expenses of any underlying Fidelity Central Funds are not included in the Fund's expense ratio. The Fund indirectly bears its proportionate share of the expenses of any underlying Fidelity Central Funds. G Amount does not include the portfolio activity of any underlying Fidelity Central Funds. H For the period December 14, 2010 (commencement of sale of shares) to October 31, 2011. I Expense ratios reflect operating expenses of the class. Expenses before reductions do not reflect amounts reimbursed by the investment adviser or reductions from brokerage service arrangements or reductions from other expense offset arrangements and do not represent the amount paid by the class during periods when reimbursements or reductions occur. Expense ratios before reductions for start-up periods may not be representative of longer-term operating periods. Expenses net of fee waivers reflect expenses after reimbursement by the investment adviser but prior to reductions from brokerage service arrangements or other expense offset arrangements. Expenses net of all reductions represent the net expenses paid by the class. J The portfolio turnover rate does not include the assets acquired in the merger. K Amount represents less than $.01 per share. |
See accompanying notes which are an integral part of the financial statements.
Annual Report
Financial Highlights - Class B
Years ended October 31, | 2013 | 2012 | 2011 H |
Selected Per-Share Data | | | |
Net asset value, beginning of period | $ 9.26 | $ 9.47 | $ 10.83 |
Income from Investment Operations | | | |
Net investment income (loss) E | - K | .02 | .02 |
Net realized and unrealized gain (loss) | 2.80 | (.14) | (1.39) |
Total from investment operations | 2.80 | (.12) | (1.37) |
Distributions from net investment income | - | (.04) | - |
Distributions from net realized gain | (.07) | (.05) | - |
Total distributions | (.07) | (.09) | - |
Redemption fees added to paid in capital E | .01 | - K | .01 |
Net asset value, end of period | $ 12.00 | $ 9.26 | $ 9.47 |
Total Return B, C, D | 30.52% | (1.24)% | (12.56)% |
Ratios to Average Net Assets F, I | | | |
Expenses before reductions | 2.02% | 2.17% | 1.95% A |
Expenses net of fee waivers, if any | 2.02% | 2.13% | 1.95% A |
Expenses net of all reductions | 2.01% | 2.11% | 1.91% A |
Net investment income (loss) | (.02)% | .19% | .27% A |
Supplemental Data | | | |
Net assets, end of period (000 omitted) | $ 874 | $ 1,012 | $ 1,458 |
Portfolio turnover rate G | 68% | 52% | 134% J |
A Annualized B Total returns for periods of less than one year are not annualized. C Total returns would have been lower if certain expenses had not been reduced during the applicable periods shown. D Total returns do not include the effect of the contingent deferred sales charge. E Calculated based on average shares outstanding during the period. F Fees and expenses of any underlying Fidelity Central Funds are not included in the Fund's expense ratio. The Fund indirectly bears its proportionate share of the expenses of any underlying Fidelity Central Funds. G Amount does not include the portfolio activity of any underlying Fidelity Central Funds. H For the period December 14, 2010 (commencement of sale of shares) to October 31, 2011. I Expense ratios reflect operating expenses of the class. Expenses before reductions do not reflect amounts reimbursed by the investment adviser or reductions from brokerage service arrangements or reductions from other expense offset arrangements and do not represent the amount paid by the class during periods when reimbursements or reductions occur. Expense ratios before reductions for start-up periods may not be representative of longer-term operating periods. Expenses net of fee waivers reflect expenses after reimbursement by the investment adviser but prior to reductions from brokerage service arrangements or other expense offset arrangements. Expenses net of all reductions represent the net expenses paid by the class. J The portfolio turnover rate does not include the assets acquired in the merger. K Amount represents less than $.01 per share. |
Financial Highlights - Class C
Years ended October 31, | 2013 | 2012 | 2011 H |
Selected Per-Share Data | | | |
Net asset value, beginning of period | $ 9.25 | $ 9.48 | $ 10.83 |
Income from Investment Operations | | | |
Net investment income (loss) E | - K | .02 | .03 |
Net realized and unrealized gain (loss) | 2.79 | (.14) | (1.39) |
Total from investment operations | 2.79 | (.12) | (1.36) |
Distributions from net investment income | (.01) | (.06) | - |
Distributions from net realized gain | (.08) | (.05) | - |
Total distributions | (.09) | (.11) | - |
Redemption fees added to paid in capital E | .01 | - K | .01 |
Net asset value, end of period | $ 11.96 | $ 9.25 | $ 9.48 |
Total Return B, C, D | 30.55% | (1.27)% | (12.47)% |
Ratios to Average Net Assets F, I | | | |
Expenses before reductions | 1.97% | 2.15% | 1.92% A |
Expenses net of fee waivers, if any | 1.97% | 2.11% | 1.92% A |
Expenses net of all reductions | 1.95% | 2.09% | 1.88% A |
Net investment income (loss) | .04% | .21% | .30% A |
Supplemental Data | | | |
Net assets, end of period (000 omitted) | $ 11,824 | $ 7,015 | $ 8,750 |
Portfolio turnover rate G | 68% | 52% | 134% J |
A Annualized B Total returns for periods of less than one year are not annualized. C Total returns would have been lower if certain expenses had not been reduced during the applicable periods shown. D Total returns do not include the effect of the contingent deferred sales charge. E Calculated based on average shares outstanding during the period. F Fees and expenses of any underlying Fidelity Central Funds are not included in the Fund's expense ratio. The Fund indirectly bears its proportionate share of the expenses of any underlying Fidelity Central Funds. G Amount does not include the portfolio activity of any underlying Fidelity Central Funds. H For the period December 14, 2010 (commencement of sale of shares) to October 31, 2011. I Expense ratios reflect operating expenses of the class. Expenses before reductions do not reflect amounts reimbursed by the investment adviser or reductions from brokerage service arrangements or reductions from other expense offset arrangements and do not represent the amount paid by the class during periods when reimbursements or reductions occur. Expense ratios before reductions for start-up periods may not be representative of longer-term operating periods. Expenses net of fee waivers reflect expenses after reimbursement by the investment adviser but prior to reductions from brokerage service arrangements or other expense offset arrangements. Expenses net of all reductions represent the net expenses paid by the class. J The portfolio turnover rate does not include the assets acquired in the merger. K Amount represents less than $.01 per share. |
See accompanying notes which are an integral part of the financial statements.
Annual Report
Financial Highlights - Japan
Years ended October 31, | 2013 | 2012 | 2011 | 2010 | 2009 |
Selected Per-Share Data | | | | | |
Net asset value, beginning of period | $ 9.34 | $ 9.57 | $ 10.57 | $ 10.03 | $ 9.03 |
Income from Investment Operations | | | | | |
Net investment income (loss) B | .12 | .12 | .15 | .10 | .08 |
Net realized and unrealized gain (loss) | 2.79 | (.14) | (.75) | .61 | 1.04 |
Total from investment operations | 2.91 | (.02) | (.60) | .71 | 1.12 |
Distributions from net investment income | (.15) | (.16) | (.20) | (.07) | (.11) |
Distributions from net realized gain | (.08) | (.05) | (.21) | (.10) | (.01) |
Total distributions | (.23) | (.21) | (.41) | (.17) | (.12) |
Redemption fees added to paid in capital B | .01 | - G | .01 | - G | - G |
Net asset value, end of period | $ 12.03 | $ 9.34 | $ 9.57 | $ 10.57 | $ 10.03 |
Total Return A | 31.92% | (.19)% | (6.00)% | 7.12% | 12.84% |
Ratios to Average Net Assets C, E | | | | | |
Expenses before reductions | .93% | 1.09% | .86% | .93% | .90% |
Expenses net of fee waivers, if any | .93% | 1.06% | .84% | .93% | .90% |
Expenses net of all reductions | .91% | 1.04% | .80% | .93% | .89% |
Net investment income (loss) | 1.08% | 1.26% | 1.38% | .97% | .90% |
Supplemental Data | | | | | |
Net assets, end of period (000 omitted) | $ 480,773 | $ 353,550 | $ 450,417 | $ 649,316 | $ 944,902 |
Portfolio turnover rate D | 68% | 52% | 134% F | 43% | 73% |
A Total returns would have been lower if certain expenses had not been reduced during the applicable periods shown. B Calculated based on average shares outstanding during the period. C Fees and expenses of any underlying Fidelity Central Funds are not included in the Fund's expense ratio. The Fund indirectly bears its proportionate share of the expenses of any underlying Fidelity Central Funds. D Amount does not include the portfolio activity of any underlying Fidelity Central Funds. E Expense ratios reflect operating expenses of the class. Expenses before reductions do not reflect amounts reimbursed by the investment adviser or reductions from brokerage service arrangements or reductions from other expense offset arrangements and do not represent the amount paid by the class during periods when reimbursements or reductions occur. Expenses net of fee waivers reflect expenses after reimbursement by the investment adviser but prior to reductions from brokerage service arrangements or other expense offset arrangements. Expenses net of all reductions represent the net expenses paid by the class. F The portfolio turnover rate does not include the assets acquired in the merger. G Amount represents less than $.01 per share. |
Financial Highlights - Institutional Class
Years ended October 31, | 2013 | 2012 | 2011 G |
Selected Per-Share Data | | | |
Net asset value, beginning of period | $ 9.33 | $ 9.57 | $ 10.83 |
Income from Investment Operations | | | |
Net investment income (loss) D | .13 | .12 | .13 |
Net realized and unrealized gain (loss) | 2.78 | (.14) | (1.40) |
Total from investment operations | 2.91 | (.02) | (1.27) |
Distributions from net investment income | (.15) | (.17) | - |
Distributions from net realized gain | (.08) | (.05) | - |
Total distributions | (.23) | (.22) | - |
Redemption fees added to paid in capital D | .01 | - J | .01 |
Net asset value, end of period | $ 12.02 | $ 9.33 | $ 9.57 |
Total Return B, C | 32.04% | (.18)% | (11.63)% |
Ratios to Average Net Assets E, H | | | |
Expenses before reductions | .90% | 1.03% | .79% A |
Expenses net of fee waivers, if any | .90% | 1.01% | .79% A |
Expenses net of all reductions | .88% | .99% | .75% A |
Net investment income (loss) | 1.11% | 1.31% | 1.43% A |
Supplemental Data | | | |
Net assets, end of period (000 omitted) | $ 20,033 | $ 1,488 | $ 2,715 |
Portfolio turnover rate F | 68% | 52% | 134% I |
A Annualized B Total returns for periods of less than one year are not annualized. C Total returns would have been lower if certain expenses had not been reduced during the applicable periods shown. D Calculated based on average shares outstanding during the period. E Fees and expenses of any underlying Fidelity Central Funds are not included in the Fund's expense ratio. The Fund indirectly bears its proportionate share of the expenses of any underlying Fidelity Central Funds. F Amount does not include the portfolio activity of any underlying Fidelity Central Funds. G For the period December 14, 2010 (commencement of sale of shares) to October 31, 2011. H Expense ratios reflect operating expenses of the class. Expenses before reductions do not reflect amounts reimbursed by the investment adviser or reductions from brokerage service arrangements or reductions from other expense offset arrangements and do not represent the amount paid by the class during periods when reimbursements or reductions occur. Expense ratios before reductions for start-up periods may not be representative of longer-term operating periods. Expenses net of fee waivers reflect expenses after reimbursement by the investment adviser but prior to reductions from brokerage service arrangements or other expense offset arrangements. Expenses net of all reductions represent the net expenses paid by the class. I The portfolio turnover rate does not include the assets acquired in the merger. J Amount represents less than $.01 per share. |
See accompanying notes which are an integral part of the financial statements.
Annual Report
Notes to Financial Statements
For the period ended October 31, 2013
1. Organization.
Fidelity Japan Fund (the Fund) is a fund of Fidelity Investment Trust (the Trust) and is authorized to issue an unlimited number of shares. The Trust is registered under the Investment Company Act of 1940, as amended (the 1940 Act), as an open-end management investment company organized as a Massachusetts business trust. The Fund offers Class A, Class T, Class C, Japan and Institutional Class shares, each of which, along with Class B shares, has equal rights as to assets and voting privileges. Class B shares are closed to new accounts and additional purchases, except for exchanges and reinvestments. Each class has exclusive voting rights with respect to matters that affect that class. Class B shares will automatically convert to Class A shares after a holding period of seven years from the initial date of purchase.
2. Investments in Fidelity Central Funds.
The Fund invests in Fidelity Central Funds, which are open-end investment companies generally available only to other investment companies and accounts managed by Fidelity Management & Research Company (FMR) and its affiliates. The Fund's Schedule of Investments lists each of the Fidelity Central Funds held as of period end, if any, as an investment of the Fund, but does not include the underlying holdings of each Fidelity Central Fund. As an Investing Fund, the Fund indirectly bears its proportionate share of the expenses of the underlying Fidelity Central Funds.
The Money Market Central Funds seek preservation of capital and current income and are managed by Fidelity Investments Money Management, Inc. (FIMM), an affiliate of FMR.
A complete unaudited list of holdings for each Fidelity Central Fund is available upon request or at the Securities and Exchange Commission (the SEC) website at www.sec.gov. In addition, the financial statements of the Fidelity Central Funds, which are not covered by the Fund's Report of Independent Registered Public Accounting Firm, are available on the SEC website or upon request.
3. Significant Accounting Policies.
The financial statements have been prepared in conformity with accounting principles generally accepted in the United States of America (GAAP), which require management to make certain estimates and assumptions at the date of the financial statements. Actual results could differ from those estimates. Subsequent events, if any, through the date that the financial statements were issued have been evaluated in the preparation of the financial statements. The following summarizes the significant accounting policies of the Fund:
Investment Valuation. Investments are valued as of 4:00 p.m. Eastern time on the last calendar day of the period. In accordance with valuation policies and procedures approved by the Board of Trustees (the Board), the Fund attempts to obtain prices from one or more third party pricing vendors or brokers to value its investments. When current market prices, quotations or currency exchange rates are not readily available or reliable, investments will be fair valued in good faith by the FMR Fair Value Committee (the Committee), in accordance with procedures adopted by the Board. Factors used in determining fair value vary by investment type and may include market or investment specific events. The frequency with which these procedures are used cannot be predicted and they may be utilized to a significant extent. The Committee oversees the Fund's valuation policies and procedures and is responsible for approving and reporting to the Board all fair value determinations.
The Fund categorizes the inputs to valuation techniques used to value its investments into a disclosure hierarchy consisting of three levels as shown below:
Level 1 - quoted prices in active markets for identical investments
Level 2 - other significant observable inputs (including quoted prices for similar investments, interest rates, prepayment speeds, etc.)
Level 3 - unobservable inputs (including the Fund's own assumptions based on the best information available)
Valuation techniques used to value the Fund's investments by major category are as follows:
Equity securities, including restricted securities, for which market quotations are readily available, are valued at the last reported sale price or official closing price as reported by a third party pricing vendor on the primary market or exchange on which they are traded and are categorized as Level 1 in the hierarchy. In the event there were no sales during the day or closing prices are not available, securities are valued at the last quoted bid price or may be valued using the last available price and are generally categorized as Level 2 in the hierarchy. For foreign equity securities, when market or security specific events arise, comparisons to the valuation of American Depositary Receipts (ADRs), futures contracts, Exchange-Traded Funds (ETFs) and certain indexes as well as quoted prices for similar securities may be used and would be categorized as Level 2 in the hierarchy. Utilizing these techniques may result in transfers between Level 1 and Level 2. For equity securities, including restricted securities, where observable inputs are limited, assumptions about market activity and risk are used and these securities may be categorized as Level 3 in the hierarchy.
Investments in open-end mutual funds, including the Fidelity Central Funds, are valued at their closing net asset value (NAV) each business day and are categorized as Level 1 in the hierarchy.
Annual Report
Notes to Financial Statements - continued
3. Significant Accounting Policies - continued
Investment Valuation - continued
Changes in valuation techniques may result in transfers in or out of an assigned level within the disclosure hierarchy. The aggregate value of investments by input level, as of October 31, 2013, including information on transfers between Levels 1 and 2 is included at the end of the Fund's Schedule of Investments.
Foreign Currency. The Fund may use foreign currency contracts to facilitate transactions in foreign-denominated securities. Gains and losses from these transactions may arise from changes in the value of the foreign currency or if the counterparties do not perform under the contracts' terms.
Foreign-denominated assets, including investment securities, and liabilities are translated into U.S. dollars at the exchange rates at period end. Purchases and sales of investment securities, income and dividends received and expenses denominated in foreign currencies are translated into U.S. dollars at the exchange rate in effect on the transaction date.
The effects of exchange rate fluctuations on investments are included with the net realized and unrealized gain (loss) on investment securities. Other foreign currency transactions resulting in realized and unrealized gain (loss) are disclosed separately.
Investment Transactions and Income. For financial reporting purposes, the Fund's investment holdings and NAV include trades executed through the end of the last business day of the period. The NAV per share for processing shareholder transactions is calculated as of the close of business of the New York Stock Exchange (NYSE), normally 4:00 p.m. Eastern time and includes trades executed through the end of the prior business day. Gains and losses on securities sold are determined on the basis of identified cost. Dividend income is recorded on the ex-dividend date, except for certain dividends from foreign securities where the ex-dividend date may have passed, which are recorded as soon as the Fund is informed of the ex-dividend date. Non-cash dividends included in dividend income, if any, are recorded at the fair market value of the securities received. Interest income and distributions from the Fidelity Central Funds are accrued as earned. Investment income is recorded net of foreign taxes withheld where recovery of such taxes is uncertain.
Class Allocations and Expenses. Investment income, realized and unrealized capital gains and losses, common expenses of the Fund, and certain fund-level expense reductions, if any, are allocated daily on a pro-rata basis to each class based on the relative net assets of each class to the total net assets of the Fund. Each class differs with respect to transfer agent and distribution and service plan fees incurred. Certain expense reductions may also differ by class. For the reporting period, the allocated portion of income and expenses to each class as a percent of its average net assets may vary due to the timing of recording these transactions in relation to fluctuating net assets of the classes. Expenses directly attributable to a fund are charged to that fund. Expenses attributable to more than one fund are allocated among the respective funds on the basis of relative net assets or other appropriate methods. Expense estimates are accrued in the period to which they relate and adjustments are made when actual amounts are known.
Income Tax Information and Distributions to Shareholders. Each year, the Fund intends to qualify as a regulated investment company under Subchapter M of the Internal Revenue Code, including distributing substantially all of its taxable income and realized gains. As a result, no provision for U.S. Federal income taxes is required. As of October 31, 2013, the Fund did not have any unrecognized tax benefits in the financial statements; nor is the Fund aware of any tax positions for which it is reasonably possible that the total amounts of unrecognized tax benefits will significantly change in the next twelve months. The Fund files a U.S. federal tax return, in addition to state and local tax returns as required. The Fund's federal income tax returns are subject to examination by the Internal Revenue Service (IRS) for a period of three fiscal years after they are filed. State and local tax returns may be subject to examination for an additional fiscal year depending on the jurisdiction. Foreign taxes are provided for based on the Fund's understanding of the tax rules and rates that exist in the foreign markets in which it invests.
Distributions are declared and recorded on the ex-dividend date. Income dividends and capital gain distributions are declared separately for each class. Income and capital gain distributions are determined in accordance with income tax regulations, which may differ from GAAP.
Capital accounts within the financial statements are adjusted for permanent book-tax differences. These adjustments have no impact on net assets or the results of operations. Temporary book-tax differences will reverse in a subsequent period.
Book-tax differences are primarily due to foreign currency transactions, passive foreign investment companies (PFIC), deferred trustees compensation, capital loss carryforwards and losses deferred due to wash sales.
The federal tax cost of investment securities and unrealized appreciation (depreciation) as of period end were as follows:
Gross unrealized appreciation | $ 55,398,617 |
Gross unrealized depreciation | (43,857,029) |
Net unrealized appreciation (depreciation) on securities and other investments | $ 11,541,588 |
| |
Tax Cost | $ 530,077,462 |
Annual Report
3. Significant Accounting Policies - continued
Income Tax Information and Distributions to Shareholders - continued
The tax-based components of distributable earnings as of period end were as follows:
Undistributed ordinary income | $ 4,845,246 |
Capital loss carryforward | $ (190,515,854) |
Net unrealized appreciation (depreciation) | $ 11,549,764 |
Capital loss carryforwards are only available to offset future capital gains of the Fund to the extent provided by regulations and may be limited. Under the Regulated Investment Company Modernization Act of 2010 (the Act), the Fund is permitted to carry forward capital losses incurred in taxable years beginning after December 22, 2010 for an unlimited period and such capital losses are required to be used prior to any losses that expire. The capital loss carryforward information presented below, including any applicable limitation, is estimated as of fiscal period end and is subject to adjustment.
Fiscal year of expiration | |
2016 | (3,870,588) |
2017 | (60,951,366) |
2018 | (26,887,863) |
2019 | (98,806,037) |
Total with expiration | (190,515,854) |
The tax character of distributions paid was as follows:
| October 31, 2013 | October 31, 2012 |
| | |
Ordinary Income | $ 8,748,841 | $ 10,259,692 |
Due to large redemptions in a prior period, $161,303,179 of capital losses that will be available to offset future capital gains of the Fund will be limited to approximately $18,885,324 per year.
The Fund acquired $5,487,891 of its capital loss carryforward as part of a merger in a prior period. The losses acquired that will be available to offset future capital gains of the Fund will be limited to approximately $1,371,973 per year.
Short-Term Trading (Redemption) Fees. Shares held by investors in the Fund less than 90 days may have been subject to a redemption fee equal to 1.50% of the net asset value of shares redeemed. All redemption fees, which reduce the proceeds of the shareholder redemption, are retained by the Fund and accounted for as an addition to paid in capital.
4. Purchases and Sales of Investments.
Purchases and sales of securities, other than short-term securities, aggregated $351,084,154 and $314,554,352, respectively.
5. Fees and Other Transactions with Affiliates.
Management Fee. FMR and its affiliates provide the Fund with investment management related services for which the Fund pays a monthly management fee. The management fee is the sum of an individual fund fee rate that is based on an annual rate of .45% of the Fund's average net assets and an annualized group fee rate that averaged .25% during the period. The group fee rate is based upon the average net assets of all the mutual funds advised by FMR, including any mutual funds previously advised by FMR that are currently advised by Fidelity SelectCo, LLC, an affiliate of FMR. The group fee rate decreases as assets under management increase and increases as assets under management decrease. In addition, the management fee is subject to a performance adjustment (up to a maximum of ± .20% of the Fund's average net assets over a 36 month performance period). The upward or downward adjustment to the management fee is based on the relative investment performance of Japan as compared to an appropriate benchmark index over the same 36 month performance period. For the reporting period, the total annual management fee rate, including the performance adjustment, was .63% of the Fund's average net assets. The performance adjustment included in the management fee rate may be higher or lower than the maximum performance adjustment rate due to the difference between the average net assets for the reporting and performance periods.
Distribution and Service Plan Fees. In accordance with Rule 12b-1 of the 1940 Act, the Fund has adopted separate Distribution and Service Plans for each class of shares. Certain classes pay Fidelity Distributors Corporation (FDC), an affiliate of FMR, separate Distribution and Service Fees, each of which is based on an annual percentage of each class' average net assets. In addition, FDC may pay financial intermediaries for selling shares of the
Annual Report
Notes to Financial Statements - continued
5. Fees and Other Transactions with Affiliates - continued
Distribution and Service Plan Fees - continued
Fund and providing shareholder support services. For the period, the Distribution and Service Fee rates, total fees and amounts retained by FDC were as follows:
| Distribution
Fee | Service
Fee | Total Fees | Retained
by FDC |
Class A | -% | .25% | $ 38,678 | $ 1,182 |
Class T | .25% | .25% | 24,976 | - |
Class B | .75% | .25% | 9,235 | 6,947 |
Class C | .75% | .25% | 91,757 | 26,746 |
| | | $ 164,646 | $ 34,875 |
Sales Load. FDC may receive a front-end sales charge of up to 5.75% for selling Class A shares and 3.50% for selling Class T shares, some of which is paid to financial intermediaries for selling shares of the Fund. Depending on the holding period, FDC may receive contingent deferred sales charges levied on Class A, Class T, Class B and Class C redemptions. The deferred sales charges range from 5.00% to 1.00% for Class B shares, 1.00% for Class C shares, 1.00% for certain purchases of Class A shares and .25% for certain purchases of Class T shares.
For the period, sales charge amounts retained by FDC were as follows:
| Retained
by FDC |
Class A | $ 23,911 |
Class T | 2,514 |
Class B* | 629 |
Class C* | 3,853 |
| $ 30,907 |
* When Class B and Class C shares are initially sold, FDC pays commissions from its own resources to financial intermediaries through which the sales are made.
Transfer Agent Fees. Fidelity Investments Institutional Operations Company, Inc., (FIIOC), an affiliate of FMR, is the transfer, dividend disbursing and shareholder servicing agent for each class of the Fund. FIIOC receives account fees and asset-based fees that vary according to the account size and type of account of the shareholders of the respective classes of the Fund. FIIOC pays for typesetting, printing and mailing of shareholder reports, except proxy statements.
For the period, transfer agent fees for each applicable class were as follows:
| Amount | % of
Average
Net Assets |
Class A | $ 45,115 | .29 |
Class T | 16,311 | .33 |
Class B | 2,767 | .30 |
Class C | 22,846 | .25 |
Japan | 901,696 | .20 |
Institutional Class | 17,258 | .17 |
| $ 1,005,993 | |
Accounting and Security Lending Fees. Fidelity Service Company, Inc. (FSC), an affiliate of FMR, maintains the Fund's accounting records. The accounting fee is based on the level of average net assets for each month. Under a separate contract, FSC administers the security lending program. The security lending fee is based on the number and duration of lending transactions.
Interfund Lending Program. Pursuant to an Exemptive Order issued by the SEC, the Fund, along with other registered investment companies having management contracts with FMR, may participate in an interfund lending program. This program provides an alternative credit facility allowing the funds to borrow from, or lend money to, other participating affiliated funds. At period end, there were no interfund loans outstanding. The Fund's activity in this program during the period for which loans were outstanding was as follows:
Borrower or Lender | Average Loan
Balance | Weighted Average Interest Rate | Interest
Expense |
Borrower | $ 2,436,750 | .31% | $ 85 |
Annual Report
6. Committed Line of Credit.
The Fund participates with other funds managed by FMR or an affiliate in a $4.25 billion credit facility (the "line of credit") to be utilized for temporary or emergency purposes to fund shareholder redemptions or for other short-term liquidity purposes. The Fund has agreed to pay commitment fees on its pro-rata portion of the line of credit, which amounted to $993 and is reflected in Miscellaneous expenses on the Statement of Operations. During the period, there were no borrowings on this line of credit.
7. Security Lending.
The Fund lends portfolio securities through a lending agent from time to time in order to earn additional income. For equity securities, a lending agent is used and may loan securities to certain qualified borrowers, including Fidelity Capital Markets (FCM), a broker-dealer affiliated with the Fund. On the settlement date of the loan, the Fund receives collateral (in the form of U.S. Treasury obligations, letters of credit and/or cash) against the loaned securities and maintains collateral in an amount not less than 100% of the market value of the loaned securities during the period of the loan. The market value of the loaned securities is determined at the close of business of the Fund and any additional required collateral is delivered to the Fund on the next business day. If the borrower defaults on its obligation to return the securities loaned because of insolvency or other reasons, the Fund may apply collateral received from the borrower against the obligation. The Fund may experience delays and costs in recovering the securities loaned. Any cash collateral received is invested in the Fidelity Securities Lending Cash Central Fund. The value of loaned securities and cash collateral at period end are disclosed on the Fund's Statement of Assets and Liabilities. Security lending income represents the income earned on investing cash collateral, less rebates paid to borrowers and any lending agent fees associated with the loan, plus any premium payments received for lending certain types of securities. Security lending income is presented in the Statement of Operations as a component of income from Fidelity Central Funds. Total security lending income during the period amounted to $93,183. During the period, there were no securities loaned to FCM.
8. Expense Reductions.
Commissions paid to certain brokers with whom FMR, or its affiliates, places trades on behalf of the Fund include an amount in addition to trade execution, which may be rebated back to the Fund to offset certain expenses. This amount totaled $76,363 for the period.
In addition, FMR reimbursed a portion of the Fund's operating expenses during the period in the amount of $2,569.
9. Distributions to Shareholders.
Distributions to shareholders of each class were as follows:
Years ended October 31, | 2013 | 2012 |
From net investment income | | |
Class A | $ 106,946 | $ 168,535 |
Class T | 32,766 | 50,833 |
Class B | - | 6,144 |
Class C | 8,397 | 52,214 |
Japan | 5,470,176 | 7,354,386 |
Institutional Class | 23,693 | 56,675 |
Total | $ 5,641,978 | $ 7,688,787 |
From net realized gain | | |
Class A | $ 79,705 | $ 69,007 |
Class T | 33,186 | 24,703 |
Class B | 6,644 | 7,792 |
Class C | 55,283 | 46,858 |
Japan | 2,919,891 | 2,405,209 |
Institutional Class | 12,154 | 17,336 |
Total | $ 3,106,863 | $ 2,570,905 |
Annual Report
Notes to Financial Statements - continued
10. Share Transactions.
Transactions for each class of shares were as follows:
| Shares | Dollars |
Years ended October 31, | 2013 | 2012 | 2013 | 2012 |
Class A | | | | |
Shares sold | 1,327,321 | 272,417 | $ 15,043,376 | $ 2,571,605 |
Reinvestment of distributions | 17,701 | 22,132 | 165,861 | 206,271 |
Shares redeemed | (655,691) | (659,149) | (7,373,829) | (6,253,228) |
Net increase (decrease) | 689,331 | (364,600) | $ 7,835,408 | $ (3,475,352) |
Class T | | | | |
Shares sold | 195,003 | 61,409 | $ 2,164,942 | $ 587,072 |
Reinvestment of distributions | 6,834 | 7,853 | 64,034 | 73,111 |
Shares redeemed | (178,171) | (133,261) | (1,988,129) | (1,264,265) |
Net increase (decrease) | 23,666 | (63,999) | $ 240,847 | $ (604,082) |
Class B | | | | |
Shares sold | 14,757 | 6,716 | $ 173,151 | $ 66,720 |
Reinvestment of distributions | 463 | 1,058 | 4,366 | 9,881 |
Shares redeemed | (51,705) | (52,372) | (551,755) | (495,118) |
Net increase (decrease) | (36,485) | (44,598) | $ (374,238) | $ (418,517) |
Class C | | | | |
Shares sold | 526,927 | 108,642 | $ 5,994,932 | $ 1,051,805 |
Reinvestment of distributions | 5,172 | 7,654 | 48,618 | 71,333 |
Shares redeemed | (302,151) | (280,979) | (3,208,131) | (2,637,126) |
Net increase (decrease) | 229,948 | (164,683) | $ 2,835,419 | $ (1,513,988) |
Japan | | | | |
Shares sold | 14,062,957 | 2,737,496 | $ 157,503,214 | $ 26,290,775 |
Reinvestment of distributions | 872,770 | 1,014,920 | 8,177,855 | 9,459,053 |
Shares redeemed | (12,837,219) | (12,951,522) | (141,848,609) | (122,521,103) |
Net increase (decrease) | 2,098,508 | (9,199,106) | $ 23,832,460 | $ (86,771,275) |
Institutional Class | | | | |
Shares sold | 1,891,907 | 238,239 | $ 21,220,551 | $ 2,250,127 |
Reinvestment of distributions | 2,940 | 6,735 | 27,514 | 62,700 |
Shares redeemed | (387,518) | (369,198) | (4,437,952) | (3,505,242) |
Net increase (decrease) | 1,507,329 | (124,224) | $ 16,810,113 | $ (1,192,415) |
11. Other.
The Fund's organizational documents provide former and current trustees and officers with a limited indemnification against liabilities arising in connection with the performance of their duties to the Fund. In the normal course of business, the Fund may also enter into contracts that provide general indemnifications. The Fund's maximum exposure under these arrangements is unknown as this would be dependent on future claims that may be made against the Fund. The risk of material loss from such claims is considered remote.
At the end of the period, Strategic Advisers International Fund was the owner of record of approximately 37% of the total outstanding shares of the Fund. Mutual Funds managed by FMR or its affiliates were the owners of record, in the aggregate, of approximately 42% of the total outstanding shares of the Fund.
Annual Report
Report of Independent Registered Public Accounting Firm
To the Trustees of Fidelity Investment Trust and the Shareholders of Fidelity Japan Fund:
In our opinion, the accompanying statement of assets and liabilities, including the schedule of investments, and the related statements of operations and of changes in net assets and the financial highlights present fairly, in all material respects, the financial position of Fidelity Japan Fund (a fund of Fidelity Investment Trust) at October 31, 2013, the results of its operations for the year then ended, the changes in its net assets for each of the two years in the period then ended and the financial highlights for each of the five years in the period then ended, in conformity with accounting principles generally accepted in the United States of America. These financial statements and financial highlights (hereafter referred to as "financial statements") are the responsibility of the Fidelity Japan Fund's management. Our responsibility is to express an opinion on these financial statements based on our audits. We conducted our audits of these financial statements in accordance with the standards of the Public Company Accounting Oversight Board (United States). Those standards require that we plan and perform the audit to obtain reasonable assurance about whether the financial statements are free of material misstatement. An audit includes examining, on a test basis, evidence supporting the amounts and disclosures in the financial statements, assessing the accounting principles used and significant estimates made by management, and evaluating the overall financial statement presentation. We believe that our audits, which included confirmation of securities at October 31, 2013 by correspondence with the custodian and brokers, provide a reasonable basis for our opinion.
PricewaterhouseCoopers LLP
Boston, Massachusetts
December 16, 2013
Annual Report
The Trustees, Member of the Advisory Board, and executive officers of the trust and fund, as applicable, are listed below. The Board of Trustees governs the fund and is responsible for protecting the interests of shareholders. The Trustees are experienced executives who meet periodically throughout the year to oversee the fund's activities, review contractual arrangements with companies that provide services to the fund, oversee management of the risks associated with such activities and contractual arrangements, and review the fund's performance. Except for James C. Curvey, Ned C. Lautenbach, Ronald P. O'Hanley, and William S. Stavropoulos, each of the Trustees oversees 171 funds. Mr. Curvey oversees 394 funds. Mr. Lautenbach, Mr. O'Hanley, and Mr. Stavropoulos each oversees 245 funds.
The Trustees hold office without limit in time except that (a) any Trustee may resign; (b) any Trustee may be removed by written instrument, signed by at least two-thirds of the number of Trustees prior to such removal; (c) any Trustee who requests to be retired or who has become incapacitated by illness or injury may be retired by written instrument signed by a majority of the other Trustees; and (d) any Trustee may be removed at any special meeting of shareholders by a two-thirds vote of the outstanding voting securities of the trust. Each Trustee who is not an interested person of the trust and the fund (as defined in the 1940 Act) (Independent Trustee), shall retire not later than the last day of the calendar year in which his or her 75th birthday occurs. The Independent Trustees may waive this mandatory retirement age policy with respect to individual Trustees. The executive officers and Advisory Board Member hold office without limit in time, except that any officer and Advisory Board Member may resign or may be removed by a vote of a majority of the Trustees at any regular meeting or any special meeting of the Trustees. Except as indicated, each individual has held the office shown or other offices in the same company for the past five years.
Experience, Skills, Attributes, and Qualifications of the Fund's Trustees. The Governance and Nominating Committee has adopted a statement of policy that describes the experience, qualifications, attributes, and skills that are necessary and desirable for potential Independent Trustee candidates (Statement of Policy). The Board believes that each Trustee satisfied at the time he or she was initially elected or appointed a Trustee, and continues to satisfy, the standards contemplated by the Statement of Policy. The Governance and Nominating Committee also engages professional search firms to help identify potential Independent Trustee candidates who have the experience, qualifications, attributes, and skills consistent with the Statement of Policy. From time to time, additional criteria based on the composition and skills of the current Independent Trustees, as well as experience or skills that may be appropriate in light of future changes to board composition, business conditions, and regulatory or other developments, have also been considered by the professional search firms and the Governance and Nominating Committee. In addition, the Board takes into account the Trustees' commitment and participation in Board and committee meetings, as well as their leadership of standing and ad hoc committees throughout their tenure.
In determining that a particular Trustee was and continues to be qualified to serve as a Trustee, the Board has considered a variety of criteria, none of which, in isolation, was controlling. The Board believes that, collectively, the Trustees have balanced and diverse experience, qualifications, attributes, and skills, which allow the Board to operate effectively in governing the fund and protecting the interests of shareholders. Information about the specific experience, skills, attributes, and qualifications of each Trustee, which in each case led to the Board's conclusion that the Trustee should serve (or continue to serve) as a trustee of the fund, is provided below.
Board Structure and Oversight Function. James C. Curvey is an interested person (as defined in the 1940 Act) and currently serves as Chairman. The Trustees have determined that an interested Chairman is appropriate and benefits shareholders because an interested Chairman has a personal and professional stake in the quality and continuity of services provided to the fund. Independent Trustees exercise their informed business judgment to appoint an individual of their choosing to serve as Chairman, regardless of whether the Trustee happens to be independent or a member of management. The Independent Trustees have determined that they can act independently and effectively without having an Independent Trustee serve as Chairman and that a key structural component for assuring that they are in a position to do so is for the Independent Trustees to constitute a substantial majority for the Board. The Independent Trustees also regularly meet in executive session. Ned C. Lautenbach serves as Chairman of the Independent Trustees and as such (i) acts as a liaison between the Independent Trustees and management with respect to matters important to the Independent Trustees and (ii) with management prepares agendas for Board meetings.
Fidelity funds are overseen by different Boards of Trustees. The fund's Board oversees Fidelity's equity and high income funds and another Board oversees Fidelity's investment-grade bond, money market, and asset allocation funds. The asset allocation funds may invest in Fidelity funds overseen by the fund's Board. The use of separate Boards, each with its own committee structure, allows the Trustees of each group of Fidelity funds to focus on the unique issues of the funds they oversee, including common research, investment, and operational issues. On occasion, the separate Boards establish joint committees to address issues of overlapping consequences for the Fidelity funds overseen by each Board.
The Trustees operate using a system of committees to facilitate the timely and efficient consideration of all matters of importance to the Trustees, the fund, and fund shareholders and to facilitate compliance with legal and regulatory requirements and oversight of the fund's activities and associated risks. The Board, acting through its committees, has charged FMR and its affiliates with (i) identifying events or circumstances the occurrence of which could have demonstrably adverse effects on the fund's business and/or reputation; (ii) implementing processes and controls to lessen the possibility that such events or circumstances occur or to mitigate the effects of such events or circumstances if they do occur; and (iii) creating and maintaining a system designed to evaluate continuously business and market conditions in order to facilitate the identification and implementation processes described in (i) and (ii) above. Because the day-to-day operations and activities of the fund are carried out by or through FMR, its affiliates and other service providers, the fund's exposure to risks is mitigated but not eliminated by the processes overseen by the Trustees. While each of the Board's committees has responsibility for overseeing different aspects of the fund's activities, oversight is exercised primarily through the Operations, Audit, and Compliance Committees. In addition, the Independent Trustees have worked with FMR to enhance the Board's oversight of investment and financial risks, legal and regulatory risks, technology risks, and operational risks, including the development of additional risk reporting to the Board. For example, a working group comprised of Independent Trustees and FMR has worked and continues to work to review the Fidelity funds' valuation-related activities, reporting and risk management. Appropriate personnel, including but not limited to the fund's Chief Compliance Officer (CCO), FMR's internal auditor, the independent accountants, the fund's Treasurer and portfolio management personnel, make periodic reports to the Board's committees, as appropriate, including an annual review of FMR's risk management program for the Fidelity funds. The responsibilities of each standing committee, including their oversight responsibilities, are described further under "Standing Committees of the Fund's Trustees."
Annual Report
Trustees and Officers - continued
The fund's Statement of Additional Information (SAI) includes more information about the Trustees. To request a free copy, call Fidelity at 1-877-208-0098.
Interested Trustees*:
Correspondence intended for each Trustee who is an interested person may be sent to Fidelity Investments, 245 Summer Street, Boston, Massachusetts 02210.
Name, Year of Birth; Principal Occupations and Other Relevant Experience+ |
James C. Curvey (1935) |
Year of Election or Appointment: 2007 Trustee Chairman of the Board of Trustees |
| Mr. Curvey also serves as Trustee of other Fidelity funds. Mr. Curvey is a Director of Fidelity Investments Money Management, Inc. (2009-present), Director of Fidelity Research & Analysis Co. (2009-present) and Director of FMR and FMR Co., Inc. (2007-present). Mr. Curvey is also Vice Chairman (2007-present) and Director of FMR LLC. In addition, Mr. Curvey serves as an Overseer for the Boston Symphony Orchestra and a member of the Trustees of Villanova University. Previously, Mr. Curvey was the Vice Chairman (2006-2007) and Director (2000-2007) of FMR Corp. |
Ronald P. O'Hanley (1957) |
Year of Election or Appointment: 2011 Trustee |
| Mr. O'Hanley also serves as Trustee of other Fidelity funds. He is Director of Fidelity SelectCo, LLC (2013-present), FMR Co., Inc. (2010-present), Director of Fidelity Investments Money Management, Inc. (2010-present), Director of Fidelity Research & Analysis Company (2010-present), President of Fidelity Asset Management and Corporate Services and a Member of Fidelity's Executive Committee (2010-present). Previously, Mr. O'Hanley served as President and Chief Executive Officer of BNY Mellon Asset Management (2007-2010). Mr. O'Hanley also served as Vice Chairman of Bank New York Mellon Corp. and a member of that firm's Executive Committee. Prior to the 2007 merger of The Bank of New York and Mellon Financial Corporation, he was Vice Chairman of Mellon Financial Corporation and President and Chief Executive Officer of Mellon Asset Management. He joined Mellon in February 1997. Mr. O'Hanley currently serves as Chairman of the Boston Public Library Foundation Board of Directors and sits on the Board of Directors of Beth Israel Deaconess Medical Center, the Board of Trustees of the Marine Biological Laboratory and the Advisory Board of the Maxwell School of Citizenship and Public Administration at Syracuse University. Mr. O'Hanley also chairs the Council on Asset Management for the Financial Services Roundtable and is a member of the Board of Directors of Institutional Investor's U.S. Institute. |
* Trustees have been determined to be "Interested Trustees" by virtue of, among other things, their affiliation with the trust or various entities under common control with FMR.
+ The information above includes each Trustee's principal occupation during the last five years and other information relating to the experience, attributes, and skills relevant to each Trustee's qualifications to serve as a Trustee, which led to the conclusion that each Trustee should serve as a Trustee for the fund.
Annual Report
Independent Trustees:
Correspondence intended for each Independent Trustee (that is, the Trustees other than the Interested Trustees) may be sent to Fidelity Investments, P.O. Box 55235, Boston, Massachusetts 02205-5235.
Name, Year of Birth; Principal Occupations and Other Relevant Experience+ |
Dennis J. Dirks (1948) |
Year of Election or Appointment: 2005 Trustee |
| Mr. Dirks also serves as Trustee of other Fidelity funds. Prior to his retirement in May 2003, Mr. Dirks was Chief Operating Officer and a member of the Board of The Depository Trust & Clearing Corporation (DTCC). He also served as President, Chief Operating Officer, and Board member of The Depository Trust Company (DTC) and President and Board member of the National Securities Clearing Corporation (NSCC). In addition, Mr. Dirks served as Chief Executive Officer and Board member of the Government Securities Clearing Corporation, Chief Executive Officer and Board member of the Mortgage-Backed Securities Clearing Corporation, as a Trustee and a member of the Finance Committee of Manhattan College (2005-2008), and as a Trustee and a member of the Finance Committee of AHRC of Nassau County (2006-2008). Mr. Dirks is a member of the Independent Directors Council (IDC) Governing Council (2010-present) and Board of Directors for The Brookville Center for Children's Services, Inc. (2009-present). |
Alan J. Lacy (1953) |
Year of Election or Appointment: 2008 Trustee |
| Mr. Lacy also serves as Trustee of other Fidelity funds. Mr. Lacy serves as Senior Adviser (2007-present) of Oak Hill Capital Partners, L.P. (private equity). Mr. Lacy also served as Chief Executive Officer (2000-2005) and Vice Chairman (2005-2006) of Sears Holdings Corporation and Sears, Roebuck and Co. (retail). In addition, Mr. Lacy serves as a member of the Board of Directors of Dave & Buster's Entertainment, Inc. (restaurant and entertainment complexes, 2010-present), Earth Fare, Inc. (retail grocery, 2012-present), The Hillman Companies, Inc. (hardware wholesalers, 2010-present), and Bristol-Myers Squibb Company (global pharmaceuticals, 2008-present). Mr. Lacy is a member of the Board of Trustees of The National Parks Conservation Association (2006-present). Previously, Mr. Lacy served as Chairman of the Board of Trustees of the National Parks Conservation Association (2008-2011) and as a member of the Board of Directors for the Western Union Company (global money transfer, 2006-2011). |
Ned C. Lautenbach (1944) |
Year of Election or Appointment: 2000 Trustee Chairman of the Independent Trustees |
| Mr. Lautenbach also serves as Trustee of other Fidelity funds. Mr. Lautenbach currently serves as the Lead Director of the Eaton Corporation Board of Directors (diversified industrial, 1997-present). Mr. Lautenbach is Chairman of the Board of Directors of the Philharmonic Center for the Arts in Naples, Florida (2012-present) and a member of the Council on Foreign Relations (1994-present). Previously, Mr. Lautenbach was a Partner/Advisory Partner at Clayton, Dubilier & Rice, LLC (private equity investment, 1998-2010), as well as a Director of Sony Corporation (2006-2007). |
Joseph Mauriello (1944) |
Year of Election or Appointment: 2008 Trustee |
| Mr. Mauriello also serves as Trustee of other Fidelity funds. Prior to his retirement in January 2006, Mr. Mauriello served in numerous senior management positions including Deputy Chairman and Chief Operating Officer (2004-2005), and Vice Chairman of Financial Services (2002-2004) of KPMG LLP US (professional services, 1965-2005). Mr. Mauriello currently serves as a member of the Board of Directors of XL Group plc. (global insurance and re-insurance, 2006-present). Previously, Mr. Mauriello served as a Director of the Hamilton Funds of the Bank of New York (2006-2007) and of Arcadia Resources Inc. (health care services and products, 2007-2012). |
Robert W. Selander (1950) |
Year of Election or Appointment: 2011 Trustee |
| Mr. Selander also serves as Trustee of other Fidelity funds. Previously, Mr. Selander served as a Member of the Advisory Board of other Fidelity funds (2011), and Executive Vice Chairman (2010), Chief Executive Officer (2009-2010), and President and Chief Executive Officer (1997-2009) of Mastercard, Inc. |
Cornelia M. Small (1944) |
Year of Election or Appointment: 2005 Trustee |
| Ms. Small also serves as Trustee of other Fidelity funds. Ms. Small is a member of the Board of Directors (2009-present) and Chair of the Investment Committee (2010-present) of the Teagle Foundation. Ms. Small also serves on the Investment Committee of the Berkshire Taconic Community Foundation (2008-present). Previously, Ms. Small served as Chairperson (2002-2008) and a member of the Investment Committee and Chairperson (2008-2012) and a member of the Board of Trustees of Smith College. In addition, Ms. Small served as Chief Investment Officer, Director of Global Equity Investments, and a member of the Board of Directors of Scudder, Stevens & Clark and Scudder Kemper Investments. |
William S. Stavropoulos (1939) |
Year of Election or Appointment: 2001 Trustee Vice Chairman of the Independent Trustees |
| Mr. Stavropoulos also serves as Trustee of other Fidelity funds. Mr. Stavropoulos serves as President and Founder of the Michigan Baseball Foundation, the Great Lakes Loons (2007-present). Mr. Stavropoulos is Chairman Emeritus of the Board of Directors of The Dow Chemical Company, where he previously served in numerous senior management positions, including President, CEO (1995-2000; 2002-2004), Chairman of the Executive Committee (2000-2006), and as a member of the Board of Directors (1990-2006). Currently, Mr. Stavropoulos is Chairman of the Board of Directors of Univar Inc. (global distributor of commodity and specialty chemicals), a Director of Teradata Corporation (data warehousing and technology solutions), and Maersk Inc. (industrial conglomerate), and a member of the Advisory Board for Metalmark Capital LLC (private equity investment, 2005-present). Mr. Stavropoulos is an operating advisor to Clayton, Dubilier & Rice, LLC (private equity investment). In addition, Mr. Stavropoulos is a member of the University of Notre Dame Advisory Council for the College of Science, a Trustee of the Rollin L. Gerstacker Foundation, and a Director of the Naples Philharmonic Center for the Arts. Previously, Mr. Stavropoulos served as a Director of Chemical Financial Corporation (bank holding company, 1993-2012) and Tyco International, Ltd. (multinational manufacturing and services, 2007-2012). |
David M. Thomas (1949) |
Year of Election or Appointment: 2008 Trustee |
| Mr. Thomas also serves as Trustee of other Fidelity funds. Mr. Thomas serves as Non-Executive Chairman of the Board of Directors of Fortune Brands Home and Security (home and security products, 2011-present), and as a member of the Board of Directors of Interpublic Group of Companies, Inc. (marketing communication, 2004-present). Previously, Mr. Thomas served as Executive Chairman (2005-2006) and Chairman and Chief Executive Officer (2000-2005) of IMS Health, Inc. (pharmaceutical and healthcare information solutions), and a Director of Fortune Brands, Inc. (consumer products, 2000-2011). |
+ The information above includes each Trustee's principal occupation during the last five years and other information relating to the experience, attributes, and skills relevant to each Trustee's qualifications to serve as a Trustee, which led to the conclusion that each Trustee should serve as a Trustee for the fund.
Advisory Board Member and Executive Officers:
Correspondence intended for each executive officer and Peter S. Lynch may be sent to Fidelity Investments, 245 Summer Street, Boston, Massachusetts 02210. Executive officers appear below in alphabetical order.
Name, Year of Birth; Principal Occupation |
Peter S. Lynch (1944) |
Year of Election or Appointment: 2003 Member of the Advisory Board |
| Mr. Lynch also serves as Member of the Advisory Board of other Fidelity funds. Mr. Lynch is Vice Chairman and a Director of FMR and FMR Co., Inc. In addition, Mr. Lynch serves as a Trustee of Boston College and as the Chairman of the Inner-City Scholarship Fund. Previously, Mr. Lynch served on the Special Olympics International Board of Directors (1997-2006). |
Elizabeth Paige Baumann (1968) |
Year of Election or Appointment: 2012 Anti-Money Laundering (AML) Officer |
| Ms. Baumann also serves as AML Officer of other funds. She is Chief AML Officer of FMR LLC (2012-present) and is an employee of Fidelity Investments. Previously, Ms. Baumann served as Vice President and Deputy Anti-Money Laundering Officer (2007-2012). |
William C. Coffey (1969) |
Year of Election or Appointment: 2009 Assistant Secretary |
| Mr. Coffey also serves as Assistant Secretary of other funds. He is Senior Vice President and Deputy General Counsel of FMR LLC (2010-present), and is an employee of Fidelity Investments. Previously, Mr. Coffey served as Vice President and Associate General Counsel of FMR LLC (2005-2009). |
Jonathan Davis (1968) |
Year of Election or Appointment: 2010 Assistant Treasurer |
| Mr. Davis also serves as Assistant Treasurer of other funds. Mr. Davis is an employee of Fidelity Investments. Previously, Mr. Davis served as Vice President and Associate General Counsel of FMR LLC (2003-2010). |
Adrien E. Deberghes (1967) |
Year of Election or Appointment: 2008 Deputy Treasurer |
| Mr. Deberghes also serves as an officer of other funds. He is an employee of Fidelity Investments (2008-present). Prior to joining Fidelity Investments, Mr. Deberghes was Senior Vice President of Mutual Fund Administration at State Street Corporation (2007-2008), Senior Director of Mutual Fund Administration at Investors Bank & Trust (2005-2007), and Director of Finance for Dunkin' Brands (2000-2005). |
Stephanie J. Dorsey (1969) |
Year of Election or Appointment: 2010 Assistant Treasurer |
| Ms. Dorsey also serves as an officer of other funds. She is an employee of Fidelity Investments (2008-present) and has served in other fund officer roles. Prior to joining Fidelity Investments, Ms. Dorsey served as Treasurer (2004-2008) of the JPMorgan Mutual Funds and Vice President (2004-2008) of JPMorgan Chase Bank. |
Scott C. Goebel (1968) |
Year of Election or Appointment: 2008 Secretary and Chief Legal Officer (CLO) |
| Mr. Goebel serves as Secretary and CLO of other funds. Mr. Goebel also serves as Secretary of Fidelity Investments Money Management, Inc. (FIMM) (2010-present) and Fidelity Research and Analysis Company (FRAC) (2010-present); General Counsel, Secretary, and Senior Vice President of FMR (2008-present) and FMR Co., Inc. (2008-present); Chief Legal Officer of Fidelity Management & Research (Hong Kong) Limited (2008-present) and Assistant Secretary of Fidelity Management & Research (Japan) Inc. (2008-present), and Fidelity Management & Research (U.K.) Inc. (2008-present). Previously, Mr. Goebel served as Secretary and CLO of other Fidelity funds (2008-2013), Assistant Secretary of FIMM (2008-2010), FRAC (2008-2010), and certain funds (2007-2008); and as Vice President and Secretary of Fidelity Distributors Corporation (FDC) (2005-2007). Mr. Goebel has been employed by FMR LLC or an affiliate since 2001. |
Joseph A. Hanlon (1968) |
Year of Election or Appointment: 2012 Chief Compliance Officer |
| Mr. Hanlon also serves as Chief Compliance Officer of other funds. Mr. Hanlon serves as Compliance Officer of FMR, FMR Co., Inc., Fidelity Investments Money Management, Inc. (FIMM), Fidelity Research and Analysis Company (FRAC), and Fidelity Management & Research (Hong Kong) (2009-present), as Senior Vice President of the Fidelity Asset Management Division (2009-present), and is an employee of Fidelity Investments. Previously, Mr. Hanlon served as Compliance Officer of Fidelity Management & Research (Japan) Inc. (2009-2013), Strategic Advisers, Inc. (2009-2013), and Fidelity Management & Research (U.K.) Inc. (2009-2013). |
Bruce T. Herring (1965) |
Year of Election or Appointment: 2006 Vice President of certain Equity Funds |
| Mr. Herring also serves as Vice President of other funds. He serves as Chief Investment Officer of Fidelity Global Asset Allocation (GAA) (2013-present), Chief Investment Officer and Director of Fidelity Management & Research (U.K.) Inc. (2010-present), Group Chief Investment Officer of FMR, and President of Fidelity Research & Analysis Company (2010-present). Previously, Mr. Herring served as Vice President (2005-2006) and Senior Vice President (2006-2007) of Fidelity Management & Research Company, Vice President of FMR Co., Inc. (2001-2007), and as a portfolio manager for Fidelity U.S. Equity Funds. |
Brian B. Hogan (1964) |
Year of Election or Appointment: 2009 Vice President |
| Mr. Hogan also serves as Vice President of other funds. Mr. Hogan serves as President of FMR's Equity Division (2009-present). Previously, Mr. Hogan served as Senior Vice President, Equity Research of FMR (2006-2009) and as a portfolio manager. |
Chris Maher (1972) |
Year of Election or Appointment: 2013 Assistant Treasurer |
| Mr. Maher serves as Assistant Treasurer of other funds. Mr. Maher is Vice President of Valuation Oversight and is an employee of Fidelity Investments. Previously, Mr. Maher served as Vice President of Asset Management Compliance (2013), Vice President of FMR's Program Management Group (2010-2013), and Vice President of Valuation Oversight (2008-2010). |
Christine Reynolds (1958) |
Year of Election or Appointment: 2008 Chief Financial Officer |
| Ms. Reynolds also serves as Chief Financial Officer of other funds. Ms. Reynolds became President of Fidelity Pricing and Cash Management Services (FPCMS) in August 2008. Ms. Reynolds served as Chief Operating Officer of FPCMS (2007-2008). Previously, Ms. Reynolds served as President, Treasurer, and Anti-Money Laundering officer of the Fidelity funds (2004-2007). |
Kenneth B. Robins (1969) |
Year of Election or Appointment: 2008 President and Treasurer |
| Mr. Robins also serves as an officer of other funds. Mr. Robins serves as Executive Vice President of Fidelity Investments Money Management, Inc. (FIMM) (2013-present) and is an employee of Fidelity Investments (2004-present). Previously, Mr. Robins served in other fund officer roles. |
Gary W. Ryan (1958) |
Year of Election or Appointment: 2005 Assistant Treasurer |
| Mr. Ryan also serves as Assistant Treasurer of other funds. Mr. Ryan is an employee of Fidelity Investments and has served in other fund officer roles. Previously, Mr. Ryan served as Vice President of Fund Reporting in Fidelity Pricing and Cash Management Services (FPCMS) (1999-2005). |
Stephen Sadoski (1971) |
Year of Election or Appointment: 2012 Deputy Treasurer |
| Mr. Sadoski also serves as Deputy Treasurer of other funds. He is an employee of Fidelity Investments (2012-present) and has served in another fund officer role. Prior to joining Fidelity Investments, Mr. Sadoski served as an assistant chief accountant in the Division of Investment Management of the Securities and Exchange Commission (SEC) (2009-2012) and as a senior manager at Deloitte & Touche LLP (1997-2009). |
Stacie M. Smith (1974) |
Year of Election or Appointment: 2013 Deputy Treasurer |
| Ms. Smith also serves as an officer of other funds. She is an employee of Fidelity Investments (2009-present) and has served in other fund officer roles. Prior to joining Fidelity Investments, Ms. Smith served as Senior Audit Manager of Ernst & Young LLP (1996-2009). |
Renee Stagnone (1975) |
Year of Election or Appointment: 2013 Deputy Treasurer |
| Ms. Stagnone also serves as Deputy Treasurer of other funds. Ms. Stagnone is an employee of Fidelity Investments. |
Joseph F. Zambello (1957) |
Year of Election or Appointment: 2011 Deputy Treasurer |
| Mr. Zambello also serves as Deputy Treasurer of other funds. Mr. Zambello is an employee of Fidelity Investments. Previously, Mr. Zambello served as Vice President of FMR's Program Management Group (2009-2011) and Vice President of the Transfer Agent Oversight Group (2005-2009). |
Annual Report
The Board of Trustees of Fidelity Japan Fund voted to pay to shareholders of record at the opening of business on record date, the following distributions per share derived from capital gains realized from sales of portfolio securities, and dividends derived from net investment income:
| Pay Date | Record Date | Dividends | Capital Gains |
Class A | 12/09/13 | 12/06/13 | $0.081 | $0.009 |
Class T | 12/09/13 | 12/06/13 | $0.043 | $0.009 |
Class B | 12/09/13 | 12/06/13 | $0.000 | $0.000 |
Class C | 12/09/13 | 12/06/13 | $0.025 | $0.009 |
Class A, Class T, Class B and Class C designates 100% of the dividends distributed during the fiscal year as amounts which may be taken into account as a dividend for purposes of the maximum rate under section 1(h)(11) of the Internal Revenue Code.
The amounts per share which represent income derived from sources within, and taxes paid to, foreign countries or possessions of the United States are as follows:
| Pay Date | Income | Taxes |
Class A | 12/10/12 | $0.089 | $0.0178 |
Class T | 12/10/12 | $0.076 | $0.0178 |
Class B | 12/10/12 | $0.038 | $0.0178 |
Class C | 12/10/12 | $0.048 | $0.0178 |
The fund will notify shareholders in January 2014 of amounts for use in preparing 2013 income tax returns.
Annual Report
Board Approval of Investment Advisory Contracts and Management Fees
Fidelity Japan Fund
Each year, the Board of Trustees, including the Independent Trustees (together, the Board), votes on the renewal of the management contract and sub-advisory agreements (together, the Advisory Contracts) for the fund. The Board, assisted by the advice of fund counsel and Independent Trustees' counsel, requests and considers a broad range of information relevant to the renewal of the Advisory Contracts throughout the year.
The Board meets regularly and, at each of its meetings, covers an extensive agenda of topics and materials and considers factors that are relevant to its annual consideration of the renewal of the fund's Advisory Contracts, including the services and support provided to the fund and its shareholders. The Board has established various standing committees, each composed of and chaired by Independent Trustees with varying backgrounds, to which the Board has assigned specific subject matter responsibilities in order to enhance effective decision-making by the Board. The Board, acting directly and through its Committees, requests and receives information concerning the annual consideration of the renewal of the fund's Advisory Contracts. The Board also meets as needed to consider matters specifically related to the Board's annual consideration of the renewal of Advisory Contracts. Members of the Board may also meet with trustees of other Fidelity funds through ad hoc joint committees to discuss certain matters relevant to the Fidelity funds.
At its July 2013 meeting, the Board, including the Independent Trustees, unanimously determined to renew the fund's Advisory Contracts. In reaching its determination, the Board considered all factors it believed relevant, including (i) the nature, extent, and quality of the services to be provided to the fund and its shareholders (including the investment performance of the fund); (ii) the competitiveness of the fund's management fee and total expense ratio relative to peer funds; (iii) the total costs of the services to be provided by and the profits to be realized by Fidelity from its relationship with the fund; (iv) the extent to which economies of scale exist and would be realized as the fund grows; and (v) whether fee levels reflect these economies of scale, if any, for the benefit of fund shareholders.
In considering whether to renew the Advisory Contracts for the fund, the Board reached a determination, with the assistance of fund counsel and Independent Trustees' counsel and through the exercise of its business judgment, that the renewal of the Advisory Contracts was in the best interests of the fund and its shareholders and that the compensation payable under the Advisory Contracts was fair and reasonable. The Board's decision to renew the Advisory Contracts was not based on any single factor, but rather was based on a comprehensive consideration of all the information provided to the Board at its meetings throughout the year. The Board, in reaching its determination to renew the Advisory Contracts, was aware that shareholders in the fund have a broad range of investment choices available to them, including a wide choice among mutual funds offered by Fidelity's competitors, and that the fund's shareholders, who have the opportunity to review and weigh the disclosure provided by the fund in its prospectus and other public disclosures, have chosen to invest in this fund, which is a part of the Fidelity family of funds.
Nature, Extent, and Quality of Services Provided. The Board considered the staffing within the investment adviser, Fidelity Management & Research Company (FMR), and the sub-advisers (together, the Investment Advisers) as it relates to the fund, including the backgrounds of the fund's investment personnel, and also considered the fund's investment objective, strategies, and related investment philosophy. The Independent Trustees also had discussions with senior management of Fidelity's investment operations and investment groups. The Board considered the structure of the portfolio manager compensation program and whether this structure provides appropriate incentives to act in the best interests of the fund.
Resources Dedicated to Investment Management and Support Services. The Board and the Fund Oversight and Research Committees reviewed the general qualifications and capabilities of the Investment Advisers' investment staff, including its size, education, experience, and resources, as well as the Investment Advisers' approach to recruiting, training, managing, and compensating investment personnel. The Board noted that FMR has continued to increase the resources devoted to non-U.S. offices, including expansion of Fidelity's global investment organization. The Board also noted that Fidelity's analysts have extensive resources, tools and capabilities that allow them to conduct sophisticated quantitative and fundamental analysis, as well as credit analysis of issuers, counterparties and guarantors. Further, the Board believes that Fidelity's investment professionals have sufficient access to global information and data so as to provide competitive investment results over time, and that those professionals also have access to sophisticated tools that permit them to assess portfolio construction and risk and performance attribution characteristics continuously, as well as to transmit new information and research conclusions rapidly around the world. Additionally, in its deliberations, the Board considered the Investment Advisers' trading and risk management capabilities and resources, which are an integral part of the investment management process.
Shareholder and Administrative Services. The Board considered (i) the nature, extent, quality, and cost of advisory, administrative, and shareholder services performed by the Investment Advisers and their affiliates under the Advisory Contracts and under separate agreements covering transfer agency, pricing and bookkeeping, and securities lending services for the fund; (ii) the nature and extent of the supervision of third party service providers, principally custodians and subcustodians; and (iii) the resources devoted to, and the record of compliance with, the fund's compliance policies and procedures. The Board also reviewed the allocation of fund brokerage, including allocations to brokers affiliated with the Investment Advisers, the use of brokerage commissions to pay fund expenses, and the use of "soft" commission dollars to pay for research services.
The Board noted that the growth of fund assets over time across the complex allows Fidelity to reinvest in the development of services designed to enhance the value or convenience of the Fidelity funds as investment vehicles. These services include 24-hour access to account information and market information through telephone representatives and over the Internet, investor education materials and asset allocation tools, and the expanded availability of Fidelity Investor Centers.
Annual Report
Board Approval of Investment Advisory Contracts and Management Fees - continued
Investment in a Large Fund Family. The Board considered the benefits to shareholders of investing in a Fidelity fund, including the benefits of investing in a fund that is part of a large family of funds offering a variety of investment disciplines and providing a large variety of mutual fund investor services. The Board noted that Fidelity had taken, or had made recommendations that resulted in the Fidelity funds taking, a number of actions over the previous year that benefited particular funds, including (i) continuing to dedicate additional resources to investment research and to the support of the senior management team that oversees asset management; (ii) persisting in efforts to enhance Fidelity's global research capabilities; (iii) launching new funds and making other enhancements to meet client needs for global and income-oriented solutions; (iv) continuing to launch dedicated lower cost underlying funds to meet portfolio construction needs related to expanding underlying fund options for Fidelity funds of funds, specifically for the Freedom Fund product lines; (v) rationalizing product lines and gaining increased efficiencies through the mergers of several funds into other funds; (vi) strengthening Fidelity's index fund offerings by reducing investment minimums and adopting or lowering existing expense caps for certain funds and classes; (vii) enhancing Global Asset Allocation product offerings by launching new funds and strategies, including "open architecture" target date funds that utilize affiliated and unaffiliated sub-advisers; (viii) modifying the eligibility criteria for Institutional Class shares of Advisor funds to increase their marketability to a portion of the defined contribution plan market; (ix) creating a new low-cost retirement share class for certain Advisor funds to appeal to large retirement plans; (x) transitioning the management of certain Fidelity commodity funds to Geode Capital Management LLC, a registered commodity pool operator, while retaining administrative responsibilities for the funds; (xi) reorganizing a number of funds; and (xii) taking steps toward establishing a new Fidelity adviser to manage sector-based funds and products.
Investment Performance. The Board considered whether the fund has operated in accordance with its investment objective, as well as its record of compliance with its investment restrictions and its performance history.
The Board took into account discussions with the Investment Advisers about fund investment performance that occur at Board meetings throughout the year. In this regard the Board noted that as part of regularly scheduled fund reviews and other reports to the Board on fund performance, the Board periodically considers annualized return information for the fund, for different time periods, measured against a securities market index ("benchmark index") and a peer group of mutual funds with similar objectives ("peer group"). In its evaluation of fund investment performance, the Board gave particular attention to information indicating changes in performance of certain Fidelity funds for specific time periods and the Investment Advisers' explanations for any overperformance or underperformance.
In addition to reviewing absolute and relative fund performance, the Independent Trustees periodically consider the appropriateness of fund performance metrics in evaluating the results achieved. In general, the Independent Trustees believe that fund performance should be evaluated based on net performance (after fees and expenses) of both the highest performing and lowest performing classes, where applicable, compared to appropriate benchmark indices, over appropriate time periods which may include full market cycles, and compared to peer groups, as applicable, over the same periods, taking into account relevant factors including the following: general market conditions; issuer-specific information; tactical opportunities for investment; and fund cash flows and other factors.
The Independent Trustees recognize that shareholders evaluate performance on a net basis over their own holding periods, for which one-, three-, and five-year periods are used as a proxy. For this reason, the performance information reviewed by the Board also included net cumulative calendar year total return information for the fund and an appropriate benchmark index and peer group for the most recent one-, three-, and five-year periods, as shown below. Returns are shown compared to the 25th percentile (top of box) and 75th percentile (bottom of box) of the peer universe.
Annual Report
Fidelity Japan Fund

The Board also considered that the fund's management fee is subject to upward or downward adjustment depending upon whether, and to what extent, the fund's investment performance for the performance period exceeds, or is exceeded by, a securities index, thus leading to a performance adjustment for the same period. The Board noted that the performance adjustment provides FMR with a strong economic incentive to seek to achieve superior performance for the fund's shareholders and helps to more closely align the interests of FMR and the fund's shareholders.
Based on its review, the Board concluded that the nature, extent, and quality of services provided to the fund under the Advisory Contracts should benefit the fund's shareholders.
Competitiveness of Management Fee and Total Expense Ratio. The Board considered the fund's management fee and total expense ratio compared to "mapped groups" of competitive funds and classes. Fidelity creates "mapped groups" by combining similar Lipper investment objective categories that have comparable management fee characteristics. Combining Lipper investment objective categories aids the Board's management fee and total expense ratio comparisons by broadening the competitive group used for comparison and by reducing the number of universes to which various Fidelity funds are compared.
Management Fee. The Board considered two proprietary management fee comparisons for the 12-month periods shown in the chart below. The group of Lipper funds used by the Board for management fee comparisons is referred to below as the "Total Mapped Group." The Total Mapped Group is broader than the Lipper peer group used by the Board for performance comparisons because the Total Mapped Group combines several Lipper investment objective categories while the Lipper peer group does not. The Total Mapped Group comparison focuses on a fund's standing in terms of gross management fees before expense reimbursements or caps, and without giving effect to the fund's performance adjustment, relative to the total universe of funds with comparable investment mandates, regardless of whether their management fee structures also are comparable. Funds with comparable investment mandates offer exposure to similar types of securities. Funds with comparable management fee structures have similar management fee contractual arrangements (e.g., flat rate charged for advisory services, all-inclusive fee rate, etc.). "TMG %" represents the percentage of funds in the Total Mapped Group that had management fees that were lower than the fund's. For example, a TMG % of 16% means that 84% of the funds in the Total Mapped Group had higher management fees than the fund. The "Asset-Size Peer Group" (ASPG) comparison focuses on a fund's standing relative to a subset of non-Fidelity funds within the Total Mapped Group that are similar in size and management fee structure. The ASPG represents at least 15% of the funds in the Total Mapped Group with comparable asset size and management fee structures, subject to a minimum of 50 funds (or all funds in the Total Mapped Group if fewer than 50). Additional information, such as the ASPG quartile in which the fund's management fee ranked and the impact of the fund's performance adjustment, is also included in the chart and considered by the Board.
Annual Report
Board Approval of Investment Advisory Contracts and Management Fees - continued
Fidelity Japan Fund

The Board noted that the fund's management fee ranked below the median of its Total Mapped Group and below the median of its ASPG for 2012. The Board also noted the effect of the fund's positive performance adjustment on the fund's management fee ranking.
Based on its review, the Board concluded that the fund's management fee is fair and reasonable in light of the services that the fund receives and the other factors considered.
Total Expense Ratio. In its review of each class's total expense ratio, the Board considered the fund's management fee as well as other fund or class expenses, as applicable, such as transfer agent fees, pricing and bookkeeping fees, fund-paid 12b-1 fees, and custodial, legal, and audit fees. The Board also noted the effects of any waivers and reimbursements on fees and expenses, as well as the impact of the fund's performance adjustment. As part of its review, the Board also considered the current and historical total expense ratios of each class of the fund compared to competitive fund median expenses. Each class of the fund is compared to those funds and classes in the Total Mapped Group (used by the Board for management fee comparisons) that have a similar sales load structure.
The Board noted that the total expense ratio of each of Class A, Class B, Class C, Institutional Class, and the retail class ranked below its competitive median for 2012 and the total expense ratio of Class T ranked above its competitive median for 2012. The Board considered that, in general, various factors can affect total expense ratios. The Board noted that the total expense ratio of Class T was above the competitive median primarily because of higher 12b-1 fees on Class T. Class T has a higher 12b-1 fee, but a lower front-end sales charge, than traditionally priced front-end sales charge classes. The Board considered that Class T is primarily sold load-waived in the retirement plan market where its 0.50% 12b-1 fee is comparable to competing no-load, higher 12b-1 fee classes designed specifically for retirement plans. The Board noted that the fund offers multiple classes, each of which has a different sales load and 12b-1 fee structure, and that the multiple structures are intended to offer a range of pricing options for the intermediary market. The Board also noted that the total expense ratios of the classes vary primarily by the level of their 12b-1 fees, although differences in transfer agent fees may also cause expenses to vary from class to class.
Fees Charged to Other Fidelity Clients. The Board also considered Fidelity fee structures and other information with respect to clients of FMR and its affiliates, such as other mutual funds advised or subadvised by FMR or its affiliates, pension plan clients, and other institutional clients. The Board noted the findings of the 2013 ad hoc joint committee (created with the board of other Fidelity funds), which reviewed and compared Fidelity's institutional investment advisory business with its business of providing services to the Fidelity funds, including the differences in services provided, fees charged, and costs incurred, as well as competition in their respective marketplaces.
Based on its review of total expense ratios and fees charged to other Fidelity clients, the Board concluded that the total expense ratio of each class of the fund was reasonable, although Class T was above the median of the universe presented for comparison, in light of the services that the fund and its shareholders receive and the other factors considered.
Costs of the Services and Profitability. The Board considered the revenues earned and the expenses incurred by Fidelity in conducting the business of developing, marketing, distributing, managing, administering and servicing the fund and servicing the fund's shareholders. The Board also considered the level of Fidelity's profits in respect of all the Fidelity funds.
Annual Report
On an annual basis, FMR presents to the Board Fidelity's profitability for the fund. Fidelity calculates the profitability for each fund, as well as aggregate profitability for groups of Fidelity funds and all Fidelity funds, using a series of detailed revenue and cost allocation methodologies which originate with the books and records of Fidelity on which Fidelity's audited financial statements are based. The Audit Committee of the Board reviews any significant changes from the prior year's methodologies.
PricewaterhouseCoopers LLP (PwC), independent registered public accounting firm and auditor to Fidelity and certain Fidelity funds, has been engaged annually by the Board as part of the Board's assessment of Fidelity's profitability analysis. PwC's engagement includes the review and assessment of the methodologies used by Fidelity in determining the revenues and expenses attributable to Fidelity's mutual fund business, and completion of agreed-upon procedures surrounding the mathematical accuracy of fund profitability and its conformity to allocation methodologies. After considering PwC's reports issued under the engagement and information provided by Fidelity, the Board concluded that while other allocation methods may also be reasonable, Fidelity's profitability methodologies are reasonable in all material respects.
The Board also reviewed Fidelity's non-fund businesses and fall-out benefits related to the mutual fund business as well as cases where Fidelity's affiliates may benefit from or be related to the fund's business.
The Board considered the costs of the services provided by and the profits realized by Fidelity in connection with the operation of the fund and was satisfied that the profitability was not excessive in the circumstances.
Economies of Scale. The Board considered whether there have been economies of scale in respect of the management of the Fidelity funds, whether the Fidelity funds (including the fund) have appropriately benefited from any such economies of scale, and whether there is potential for realization of any further economies of scale. The Board considered the extent to which the fund will benefit from economies of scale through increased services to the fund, through waivers or reimbursements, or through fee or expense reductions. The Board also noted that in 2009, it and the board of other Fidelity funds created an ad hoc committee (the Economies of Scale Committee) to analyze whether FMR attains economies of scale in respect of the management and servicing of the Fidelity funds, whether the Fidelity funds have appropriately benefited from such economies of scale, and whether there is potential for realization of any further economies of scale.
The Board recognized that the fund's management contract incorporates a "group fee" structure, which provides for lower group fee rates as total fund assets under FMR's management increase, and for higher group fee rates as total fund assets under FMR's management decrease. FMR calculates the group fee rates based on a tiered asset "breakpoint" schedule that varies based on asset class. The Board considered that the group fee is designed to deliver the benefits of economies of scale to fund shareholders when total Fidelity fund assets increase, even if assets of any particular fund are unchanged or have declined, because some portion of Fidelity's costs are attributable to services provided to all Fidelity funds, and all funds benefit if those costs can be allocated among more assets. The Board concluded that, given the group fee structure, fund shareholders will benefit from lower management fees as assets under FMR's management increase at the fund complex level, regardless of whether Fidelity achieves any such economies of scale.
The Board concluded, taking into account the analysis of the Economies of Scale Committee, that economies of scale, if any, are being appropriately shared between fund shareholders and Fidelity.
Amendment to Description of Group Fee Rate. At its July 2013 meeting, the Board voted to approve an amendment to the fund's management contract to modify the description of the "group fee rate" effective August 1, 2013. The Board noted that under the prior description in the contract, the group fee rate was based on the average net assets of all registered investment companies with which FMR has management contracts. Under the contract's tiered asset breakpoint schedule, the group fee rate is lower as total fund assets under FMR's management increase, and higher as total fund assets under FMR's management decrease. The Board considered that the prior description would have excluded the assets of 64 Fidelity sector funds from the group fee rate calculation once Fidelity SelectCo, LLC, an affiliate of FMR, assumed management responsibilities for those funds. The Board noted that modifying the description of the group fee rate to continue to include the assets of those 64 funds for purposes of determining group fee rate breakpoints would avoid an immediate adverse impact on the group fee rate for any fund.
Additional Information Requested by the Board. In order to develop fully the factual basis for consideration of the Fidelity funds' Advisory Contracts, the Board requested and received additional information on certain topics, including: (i) fund performance trends and Fidelity's long-term strategies for certain funds; (ii) the potential to further rationalize the Fidelity fund lineup with the possibility of achieving savings for the funds and Fidelity; (iii) the methodology with respect to competitive fund data and peer group classifications; (iv) the arrangements with, and performance of, certain sub-advisers on behalf of the Fidelity funds, as well as certain proposed participating affiliate arrangements; (v) the realization of fall-out benefits in certain Fidelity business units; (vi) Fidelity's group fee structures, including the rationale for the individual fee rates of certain categories of funds and the definition of group assets; (vii) trends regarding industry use of performance fee structures and the performance adjustment methodologies applicable to the Fidelity funds; (viii) additional competitive analysis regarding the total expenses for certain classes; and (ix) fund profitability methodology, including Fidelity's cost allocation methodology, and the impact of certain factors on fund profitability results.
Based on its evaluation of all of the conclusions noted above, and after considering all factors it believed relevant, the Board ultimately concluded that the advisory fee structures are fair and reasonable, and that the fund's Advisory Contracts should be renewed.
Annual Report
Investment Adviser
Fidelity Management & Research Company
Boston, MA
Investment Sub-Advisers
FMR Co., Inc.
Fidelity Management & Research
(U.K.) Inc.
Fidelity Management & Research
(Hong Kong) Limited
Fidelity Management & Research
(Japan) Inc.
FIL Investment Advisors
FIL Investments (Japan) Limited
FIL Investment Advisors (UK) Limited
General Distributor
Fidelity Distributors Corporation
Smithfield, RI
Transfer and Service Agents
Fidelity Investments Institutional Operations Company, Inc.
Boston, MA
Fidelity Service Company, Inc.
Boston, MA
Custodian
JPMorgan Chase Bank
New York, NY
(Fidelity Investment logo)(registered trademark)
Corporate Headquarters
245 Summer St., Boston, MA 02210
www.fidelity.com
AJPNA-UANN-1213
1.917388.102
Fidelity Advisor®
Japan
Fund - Institutional Class
Annual Report
October 31, 2013
(Fidelity Cover Art)
Institutional Class is a class of
Fidelity® Japan Fund
Contents
Performance | (Click Here) | How the fund has done over time. |
Management's Discussion of Fund Performance | (Click Here) | The Portfolio Manager's review of fund performance and strategy. |
Shareholder Expense Example | (Click Here) | An example of shareholder expenses. |
Investment Changes | (Click Here) | A summary of major shifts in the fund's investments over the past six months. |
Investments | (Click Here) | A complete list of the fund's investments with their market values. |
Financial Statements | (Click Here) | Statements of assets and liabilities, operations, and changes in net assets, as well as financial highlights. |
Notes | (Click Here) | Notes to the financial statements. |
Report of Independent Registered Public Accounting Firm | (Click Here) | |
Trustees and Officers | (Click Here) | |
Distributions | (Click Here) | |
Board Approval of Investment Advisory Contracts and Management Fees | (Click Here) | |
To view a fund's proxy voting guidelines and proxy voting record for the 12-month period ended June 30, visit http://www.fidelity.com/proxyvotingresults or visit the Securities and Exchange Commission's (SEC) web site at http://www.sec.gov. You may also call 1-877-208-0098 to request a free copy of the proxy voting guidelines.
Standard & Poor's, S&P and S&P 500 are registered service marks of The McGraw-Hill Companies, Inc. and have been licensed for use by Fidelity Distributors Corporation.
Other third-party marks appearing herein are the property of their respective owners.
All other marks appearing herein are registered or unregistered trademarks or service marks of FMR LLC or an affiliated company. © 2013 FMR LLC. All rights reserved.
This report and the financial statements contained herein are submitted for the general information of the shareholders of the fund. This report is not authorized for distribution to prospective investors in the fund unless preceded or accompanied by an effective prospectus.
A fund files its complete schedule of portfolio holdings with the SEC for the first and third quarters of each fiscal year on Form N-Q. Forms N-Q are available on the SEC's web site at http://www.sec.gov. A fund's Forms N-Q may be reviewed and copied at the SEC's Public Reference Room in Washington, DC. Information regarding the operation of the SEC's Public Reference Room may be obtained by calling 1-800-SEC-0330. For a complete list of a fund's portfolio holdings, view the most recent holdings listing, semiannual report, or annual report on Fidelity's web site at http://www.fidelity.com, http://www.advisor.fidelity.com, or http://www.401k.com, as applicable.
NOT FDIC INSURED • MAY LOSE VALUE • NO BANK GUARANTEE
Neither the fund nor Fidelity Distributors Corporation is a bank.
Annual Report
Average annual total return reflects the change in the value of an investment, assuming reinvestment of the class' distributions from dividend income and capital gains (the profits earned upon the sale of securities that have grown in value, if any) and assuming a constant rate of performance each year. The $10,000 table and the fund's returns do not reflect the deduction of taxes that a shareholder would pay on fund distributions or the redemption of fund shares. During periods of reimbursement by Fidelity, a fund's total return will be greater than it would be had the reimbursement not occurred. How a fund did yesterday is no guarantee of how it will do tomorrow.
Average Annual Total Returns
Periods ended October 31, 2013 | Past 1
year | Past 5
years | Past 10
years |
Institutional Class A | 32.04% | 8.41% | 3.60% |
A The initial offering of Institutional Class shares took place on December 14, 2010. Returns prior to December 14, 2010, are those of Fidelity® Japan Fund, the original class of the fund.
$10,000 Over 10 Years
Let's say hypothetically that $10,000 was invested in Fidelity Advisor® Japan Fund - Institutional Class on October 31, 2003. The chart shows how the value of your investment would have changed, and also shows how the Tokyo Stock Price Index (TOPIX) performed over the same period. See footnote A above for additional information regarding the performance of Institutional Class.
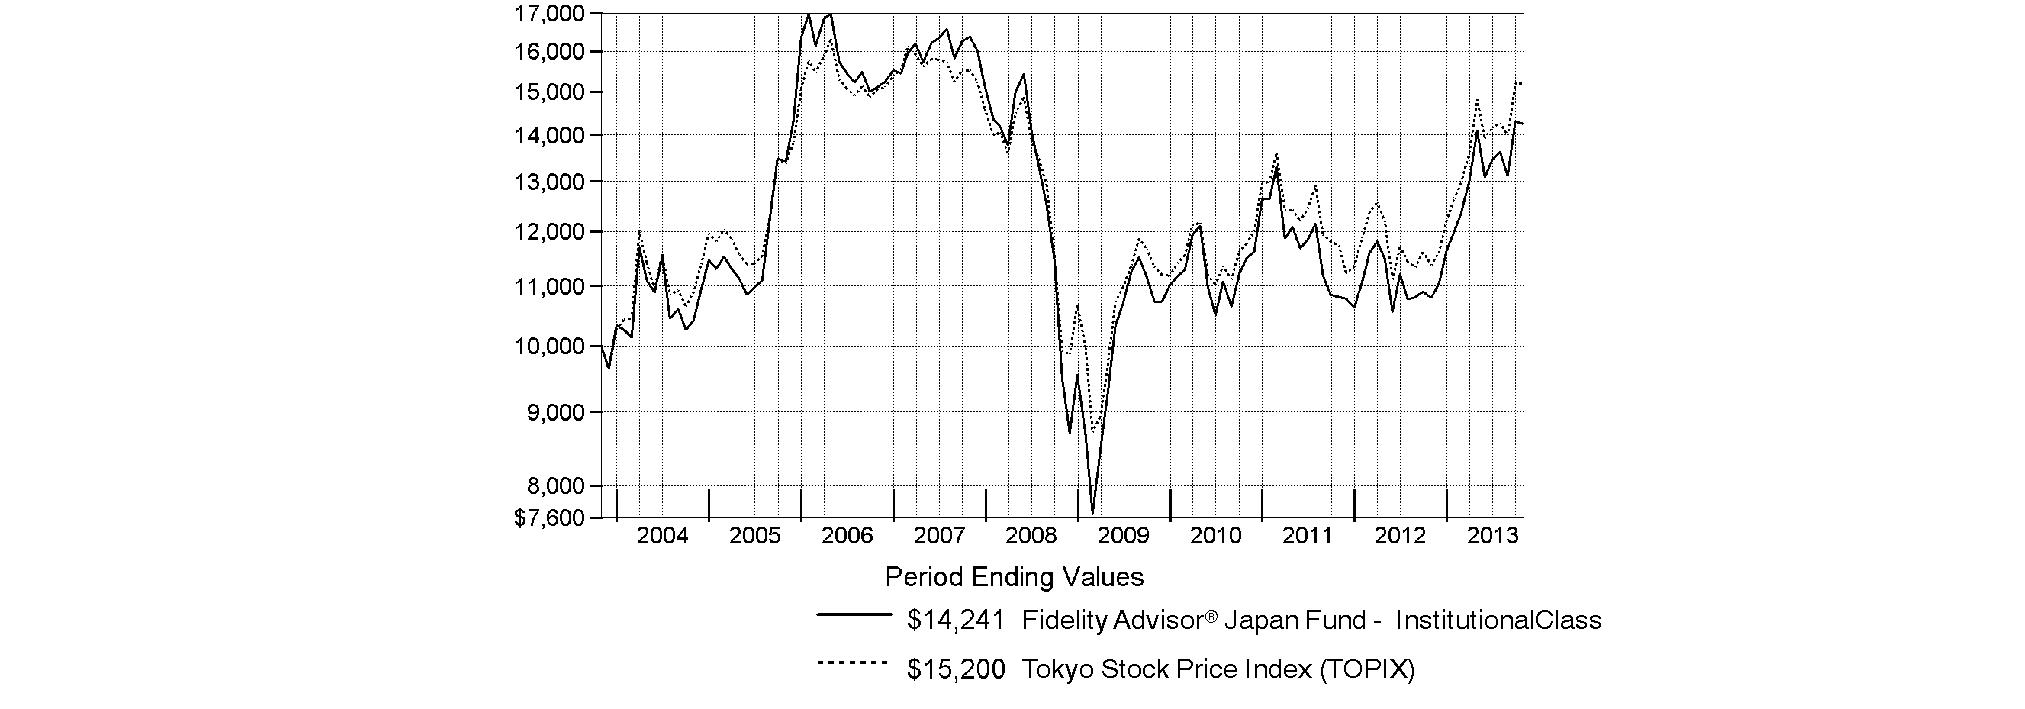
-
Annual Report
Market Recap: On balance, global equity markets remained upbeat for the 12-month period ending October 31, 2013. The MSCI® ACWI® (All Country World Index) Index gained 23.75% for the period, amid investor preference for higher-risk assets. The period was not without turbulence, however. In the spring and summer, central banks worldwide, especially in the U.S. and China, made clear their intentions to maintain accommodative monetary policies. That stance, combined with modest cyclical improvements around the globe and generally low valuations, underpinned the broad rally in equities. Europe (+32%) shone brightly, with most markets in the region - large and small - registering solid, index-beating gains. Another bright spot was Japan, which, despite a struggling yen and taking a second-half breather, posted a 34% result for the full year. The U.S. - by far the index's biggest constituent - also outperformed the global market with a roughly 28% advance. Meanwhile, Asia-Pacific ex Japan (+14%) lagged, hurt in part by a slowdown in Australia's mining industry as well as currency headwinds. Foreign-exchange and commodity weakness also curbed results in resource-heavy Canada and emerging markets (EM), both of which were up 7%. Country-level EM performance diverged meaningfully for the period, as evidenced by performance in Brazil (-1%), Russia (+12%), India (+1%) and China (+8%).
Comments from Rie Shigekawa, Portfolio Manager of Fidelity Advisor® Japan Fund: For the year, the fund's Institutional Class shares returned 32.04%, lagging the 33.59% gain of the Tokyo Stock Price Index. Versus the index, unrewarding stock selection and a modest cash position in a soaring market dampened the fund's relative performance, outweighing the positive impact of sector and industry weightings. Specifically, not owning strong-performing index component SoftBank significantly detracted. Other detractors included a large overweighting in materials stock Toray Industries, as well as negligible exposure to Nomura Holdings, which I sold, and not owning Daiwa Securities Group, two market-beating brokerage stocks in the index. Lastly, the much weaker yen was a significant headwind for U.S. investors in Japanese stocks. Conversely, a large overweighting in the automobiles & components group bolstered relative performance. The fund's largest contributor and also its largest holding was automaker Toyota Motor. Although Toyota remained the fund's largest position at period end, I reduced it as the stock advanced in an effort to lessen risk and nail down profits. Other contributors were bank stock Sumitomo Mitsui Financial Group and Nidec, a manufacturer of electric motors and related components.
The views expressed above reflect those of the portfolio manager(s) only through the end of the period as stated on the cover of this report and do not necessarily represent the views of Fidelity or any other person in the Fidelity organization. Any such views are subject to change at any time based upon market or other conditions and Fidelity disclaims any responsibility to update such views. These views may not be relied on as investment advice and, because investment decisions for a Fidelity fund are based on numerous factors, may not be relied on as an indication of trading intent on behalf of any Fidelity fund.
Annual Report
Fidelity Japan Fund
As a shareholder of the Fund, you incur two types of costs: (1) transaction costs, including sales charges (loads) on purchase payments or redemption proceeds, redemption fees and (2) ongoing costs, including management fees, distribution and/or service (12b-1) fees and other Fund expenses. This Example is intended to help you understand your ongoing costs (in dollars) of investing in the Fund and to compare these costs with the ongoing costs of investing in other mutual funds.
The Example is based on an investment of $1,000 invested at the beginning of the period and held for the entire period (May 1, 2013 to October 31, 2013).
Actual Expenses
The first line of the accompanying table for each class of the Fund provides information about actual account values and actual expenses. You may use the information in this line, together with the amount you invested, to estimate the expenses that you paid over the period. Simply divide your account value by $1,000.00 (for example, an $8,600 account value divided by $1,000.00 = 8.6), then multiply the result by the number in the first line for a class of the Fund under the heading entitled "Expenses Paid During Period" to estimate the expenses you paid on your account during this period. A small balance maintenance fee of $12.00 that is charged once a year may apply for certain accounts with a value of less than $2,000. This fee is not included in the table below. If it was, the estimate of expenses you paid during the period would be higher, and your ending account value lower, by this amount. In addition, the Fund, as a shareholder in the underlying Fidelity Central Funds, will indirectly bear its pro-rata share of the fees and expenses incurred by the underlying Fidelity Central Funds. These fees and expenses are not included in the Fund's annualized expense ratio used to calculate the expense estimate in the table below.
Hypothetical Example for Comparison Purposes
The second line of the accompanying table for each class of the Fund provides information about hypothetical account values and hypothetical expenses based on a Class' actual expense ratio and an assumed rate of return of 5% per year before expenses, which is not the Class' actual return. The hypothetical account values and expenses may not be used to estimate the actual ending account balance or expenses you paid for the period. You may use this information to compare the ongoing costs of investing in the Fund and other funds. To do so, compare this 5% hypothetical example with the 5% hypothetical examples that appear in the shareholder reports of the other funds. A small balance maintenance fee of $12.00 that is charged once a year may apply for certain accounts with a value of less than $2,000. This fee is not included in the table below. If it was, the estimate of expenses you paid during the period would be higher, and your ending account value lower, by this amount. In addition, the Fund, as a shareholder in the underlying Fidelity Central Funds, will indirectly bear its pro-rata share of the fees and expenses incurred by the underlying Fidelity Central Funds. These fees and expenses are not included in the Fund's annualized expense ratio used to calculate the expense estimate in the table below.
Please note that the expenses shown in the table are meant to highlight your ongoing costs only and do not reflect any transaction costs. Therefore, the second line of the table is useful in comparing ongoing costs only, and will not help you determine the relative total costs of owning different funds. In addition, if these transactional costs were included, your costs would have been higher.
| Annualized
Expense Ratio B | Beginning
Account Value
May 1, 2013 | Ending
Account Value
October 31, 2013 | Expenses Paid
During Period*
May 1, 2013
to October 31, 2013 |
Class A | 1.27% | | | |
Actual | | $ 1,000.00 | $ 1,009.30 | $ 6.43 |
HypotheticalA | | $ 1,000.00 | $ 1,018.80 | $ 6.46 |
Class T | 1.55% | | | |
Actual | | $ 1,000.00 | $ 1,007.60 | $ 7.84 |
HypotheticalA | | $ 1,000.00 | $ 1,017.39 | $ 7.88 |
Class B | 2.02% | | | |
Actual | | $ 1,000.00 | $ 1,005.00 | $ 10.21 |
HypotheticalA | | $ 1,000.00 | $ 1,015.02 | $ 10.26 |
Class C | 1.97% | | | |
Actual | | $ 1,000.00 | $ 1,005.90 | $ 9.96 |
HypotheticalA | | $ 1,000.00 | $ 1,015.27 | $ 10.01 |
Japan | .92% | | | |
Actual | | $ 1,000.00 | $ 1,010.90 | $ 4.66 |
HypotheticalA | | $ 1,000.00 | $ 1,020.57 | $ 4.69 |
Institutional Class | .91% | | | |
Actual | | $ 1,000.00 | $ 1,010.90 | $ 4.61 |
HypotheticalA | | $ 1,000.00 | $ 1,020.62 | $ 4.63 |
A 5% return per year before expenses
B Annualized expense ratio reflects expenses net of applicable fee waivers.
* Expenses are equal to each Class' annualized expense ratio, multiplied by the average account value over the period, multiplied by 184/365 (to reflect the one-half year period).
Annual Report
Fidelity Japan Fund
Investment Changes (Unaudited)
Geographic Diversification (% of fund's net assets) |
As of October 31, 2013 |
| Japan | 97.1% | |
| United States of America* | 2.9% | |

* Includes Short-Term Investments and Net Other Assets (Liabilities). |
Percentages are based on country or territory of incorporation and are adjusted for the effect of futures contracts, if applicable. |
As of April 30, 2013 |
| Japan | 96.3% | |
| United States of America* | 3.7% | |

* Includes Short-Term Investments and Net Other Assets (Liabilities). |
Percentages are based on country or territory of incorporation and are adjusted for the effect of futures contracts, if applicable. |
Asset Allocation as of October 31, 2013 |
| % of fund's
net assets | % of fund's net assets
6 months ago |
Stocks | 97.1 | 96.3 |
Short-Term Investments and Net Other Assets (Liabilities) | 2.9 | 3.7 |
Top Ten Stocks as of October 31, 2013 |
| % of fund's
net assets | % of fund's net assets
6 months ago |
Toyota Motor Corp. (Automobiles) | 6.4 | 6.5 |
Mitsubishi UFJ Financial Group, Inc. (Commercial Banks) | 4.9 | 5.2 |
Sumitomo Mitsui Financial Group, Inc. (Commercial Banks) | 4.9 | 4.6 |
Honda Motor Co. Ltd. (Automobiles) | 3.8 | 3.8 |
Nissan Motor Co. Ltd. (Automobiles) | 3.6 | 3.2 |
Toray Industries, Inc. (Chemicals) | 3.4 | 3.8 |
Bridgestone Corp. (Auto Components) | 3.2 | 2.5 |
KDDI Corp. (Wireless Telecommunication Services) | 3.2 | 0.0 |
Shimadzu Corp. (Electronic Equipment & Components) | 3.0 | 2.3 |
Mizuho Financial Group, Inc. (Commercial Banks) | 2.9 | 3.0 |
| 39.3 | |
Market Sectors as of October 31, 2013 |
| % of fund's
net assets | % of fund's net assets
6 months ago |
Consumer Discretionary | 25.4 | 24.7 |
Financials | 20.3 | 22.3 |
Industrials | 13.0 | 10.3 |
Information Technology | 12.8 | 13.3 |
Materials | 11.5 | 12.2 |
Health Care | 7.4 | 9.2 |
Telecommunication Services | 3.2 | 1.7 |
Consumer Staples | 2.1 | 2.1 |
Utilities | 1.4 | 0.5 |
Annual Report
Fidelity Japan Fund
Investments October 31, 2013
Showing Percentage of Net Assets
Common Stocks - 97.1% |
| Shares | | Value |
CONSUMER DISCRETIONARY - 25.4% |
Auto Components - 5.2% |
Bridgestone Corp. | 502,600 | | $ 17,230,494 |
Calsonic Kansei Corp. | 898,000 | | 4,317,370 |
DENSO Corp. | 135,400 | | 6,508,464 |
| | 28,056,328 |
Automobiles - 15.1% |
Honda Motor Co. Ltd. | 516,900 | | 20,641,324 |
Nissan Motor Co. Ltd. | 1,904,700 | | 19,125,593 |
Suzuki Motor Corp. | 287,600 | | 7,231,810 |
Toyota Motor Corp. | 532,300 | | 34,513,369 |
| | 81,512,096 |
Hotels, Restaurants & Leisure - 0.5% |
St. Marc Holdings Co. Ltd. | 29,400 | | 1,513,267 |
Toridoll.Corporation | 140,100 | | 1,319,102 |
| | 2,832,369 |
Household Durables - 0.6% |
Fujitsu General Ltd. | 266,000 | | 3,222,933 |
Media - 0.5% |
Daiichikosho Co. Ltd. | 19,400 | | 554,367 |
Tohokushinsha Film Corp. | 209,700 | | 2,065,936 |
| | 2,620,303 |
Multiline Retail - 1.2% |
Marui Group Co. Ltd. | 696,200 | | 6,664,501 |
Specialty Retail - 0.6% |
Arc Land Sakamoto Co. Ltd. | 7,200 | | 107,558 |
K's Denki Corp. | 99,300 | | 2,915,731 |
| | 3,023,289 |
Textiles, Apparel & Luxury Goods - 1.7% |
Onward Holdings Co. Ltd. | 1,118,000 | | 9,253,438 |
TOTAL CONSUMER DISCRETIONARY | | 137,185,257 |
CONSUMER STAPLES - 2.1% |
Food & Staples Retailing - 2.1% |
Seven & i Holdings Co., Ltd. | 261,600 | | 9,681,459 |
Valor Co. Ltd. | 106,800 | | 1,541,477 |
| | 11,222,936 |
FINANCIALS - 20.3% |
Commercial Banks - 12.7% |
Mitsubishi UFJ Financial Group, Inc. | 4,169,400 | | 26,551,852 |
Mizuho Financial Group, Inc. | 7,531,700 | | 15,809,514 |
Sumitomo Mitsui Financial Group, Inc. | 546,800 | | 26,430,067 |
| | 68,791,433 |
Consumer Finance - 1.7% |
ACOM Co. Ltd. (a) | 925,400 | | 3,623,562 |
AEON Financial Service Co. Ltd. | 181,100 | | 5,561,627 |
| | 9,185,189 |
Insurance - 2.9% |
MS&AD Insurance Group Holdings, Inc. | 604,900 | | 15,641,114 |
|
| Shares | | Value |
Real Estate Investment Trusts - 0.4% |
Frontier Real Estate Investment Corp. | 111 | | $ 1,109,096 |
Japan Logistics Fund, Inc. | 112 | | 1,164,928 |
| | 2,274,024 |
Real Estate Management & Development - 2.6% |
Daibiru Corp. | 98,800 | | 1,259,067 |
Nomura Real Estate Holdings, Inc. | 501,100 | | 12,678,547 |
| | 13,937,614 |
TOTAL FINANCIALS | | 109,829,374 |
HEALTH CARE - 7.4% |
Health Care Equipment & Supplies - 3.2% |
ASAHI INTECC Co. Ltd. (d) | 42,000 | | 2,825,632 |
Nihon Kohden Corp. | 101,700 | | 4,188,679 |
Terumo Corp. | 215,900 | | 10,456,188 |
| | 17,470,499 |
Health Care Providers & Services - 1.0% |
Message Co. Ltd. (d) | 192,100 | | 5,422,373 |
Pharmaceuticals - 3.2% |
Nippon Shinyaku Co. Ltd. | 231,000 | | 3,981,888 |
Takeda Pharmaceutical Co. Ltd. | 277,800 | | 13,238,442 |
| | 17,220,330 |
TOTAL HEALTH CARE | | 40,113,202 |
INDUSTRIALS - 13.0% |
Commercial Services & Supplies - 0.3% |
Moshi Moshi Hotline, Inc. | 123,100 | | 1,547,319 |
Construction & Engineering - 0.3% |
Toyo Engineering Corp. | 455,000 | | 1,938,740 |
Electrical Equipment - 5.8% |
Fujikura Ltd. | 469,000 | | 2,140,123 |
Mitsubishi Electric Corp. | 1,401,000 | | 15,399,744 |
Nidec Corp. (d) | 140,900 | | 13,731,011 |
| | 31,270,878 |
Industrial Conglomerates - 2.4% |
Toshiba Corp. | 3,051,000 | | 12,967,565 |
Machinery - 2.9% |
Makita Corp. | 91,300 | | 4,616,983 |
Sumitomo Heavy Industries Ltd. | 2,496,000 | | 11,047,145 |
| | 15,664,128 |
Road & Rail - 0.4% |
Hitachi Transport System Ltd. | 130,800 | | 2,074,096 |
Trading Companies & Distributors - 0.9% |
Sumitomo Corp. | 356,700 | | 4,641,846 |
TOTAL INDUSTRIALS | | 70,104,572 |
Common Stocks - continued |
| Shares | | Value |
INFORMATION TECHNOLOGY - 12.8% |
Computers & Peripherals - 0.8% |
Japan Digital Laboratory Co. | 77,600 | | $ 926,185 |
Wacom Co. Ltd. | 441,800 | | 3,282,413 |
| | 4,208,598 |
Electronic Equipment & Components - 9.0% |
Azbil Corp. | 283,600 | | 6,833,237 |
ESPEC Corp. | 120,700 | | 939,903 |
Hamamatsu Photonics K.K. | 155,600 | | 5,822,462 |
Horiba Ltd. | 240,000 | | 8,769,708 |
Nichicon Corp. | 225,200 | | 2,358,487 |
Shimadzu Corp. | 1,656,000 | | 16,216,186 |
TDK Corp. | 146,000 | | 6,205,021 |
Topcon Corp. | 94,300 | | 1,421,926 |
| | 48,566,930 |
IT Services - 1.8% |
Fujitsu Ltd. | 1,381,000 | | 5,933,057 |
Otsuka Corp. | 30,600 | | 3,968,920 |
| | 9,901,977 |
Semiconductors & Semiconductor Equipment - 1.2% |
Disco Corp. | 58,000 | | 3,665,230 |
NuFlare Technology, Inc. | 18,700 | | 2,503,567 |
| | 6,168,797 |
TOTAL INFORMATION TECHNOLOGY | | 68,846,302 |
MATERIALS - 11.5% |
Chemicals - 9.0% |
Asahi Kasei Corp. | 1,785,000 | | 13,584,930 |
Hitachi Chemical Co. Ltd. | 363,700 | | 5,579,808 |
Nihon Nohyaku Co. Ltd. | 212,000 | | 2,541,070 |
Nitto Denko Corp. | 97,300 | | 5,102,505 |
Toray Industries, Inc. | 2,930,000 | | 18,308,803 |
Zeon Corp. | 271,000 | | 3,229,543 |
| | 48,346,659 |
Metals & Mining - 2.5% |
Nippon Steel & Sumitomo Metal Corp. | 3,937,000 | | 12,994,281 |
Pacific Metals Co. Ltd. | 210,000 | | 769,544 |
| | 13,763,825 |
TOTAL MATERIALS | | 62,110,484 |
|
| Shares | | Value |
TELECOMMUNICATION SERVICES - 3.2% |
Wireless Telecommunication Services - 3.2% |
KDDI Corp. | 317,000 | | $ 17,167,607 |
UTILITIES - 1.4% |
Electric Utilities - 1.4% |
Kansai Electric Power Co., Inc. (a) | 204,200 | | 2,584,564 |
Tohoku Electric Power Co., Inc. (a) | 399,100 | | 4,830,784 |
| | 7,415,348 |
TOTAL COMMON STOCKS (Cost $504,921,967) |
523,995,082
|
Money Market Funds - 3.3% |
| | | |
Fidelity Cash Central Fund, 0.09% (b) | 9,955,567 | | 9,955,567 |
Fidelity Securities Lending Cash Central Fund, 0.09% (b)(c) | 7,668,401 | | 7,668,401 |
TOTAL MONEY MARKET FUNDS (Cost $17,623,968) |
17,623,968
|
TOTAL INVESTMENT PORTFOLIO - 100.4% (Cost $522,545,935) | | 541,619,050 |
NET OTHER ASSETS (LIABILITIES) - (0.4)% | | (2,238,378) |
NET ASSETS - 100% | $ 539,380,672 |
Legend |
(a) Non-income producing |
(b) Affiliated fund that is generally available only to investment companies and other accounts managed by Fidelity Investments. The rate quoted is the annualized seven-day yield of the fund at period end. A complete unaudited listing of the fund's holdings as of its most recent quarter end is available upon request. In addition, each Fidelity Central Fund's financial statements, which are not covered by the Fund's Report of Independent Registered Public Accounting Firm, are available on the SEC's website or upon request. |
(c) Investment made with cash collateral received from securities on loan. |
(d) Security or a portion of the security is on loan at period end. |
Affiliated Central Funds |
Information regarding fiscal year to date income earned by the Fund from investments in Fidelity Central Funds is as follows: |
Fund | Income earned |
Fidelity Cash Central Fund | $ 15,638 |
Fidelity Securities Lending Cash Central Fund | 93,183 |
Total | $ 108,821 |
Other Information |
The following is a summary of the inputs used, as of October 31, 2013, involving the Fund's assets and liabilities carried at fair value. The inputs or methodology used for valuing securities may not be an indication of the risk associated with investing in those securities. For more information on valuation inputs, and their aggregation into the levels used in the tables below, please refer to the Investment Valuation section in the accompanying Notes to Financial Statements. |
Valuation Inputs at Reporting Date: |
Description | Total | Level 1 | Level 2 | Level 3 |
Investments in Securities: | | | | |
Equities: | | | | |
Consumer Discretionary | $ 137,185,257 | $ - | $ 137,185,257 | $ - |
Consumer Staples | 11,222,936 | - | 11,222,936 | - |
Financials | 109,829,374 | - | 109,829,374 | - |
Health Care | 40,113,202 | - | 40,113,202 | - |
Industrials | 70,104,572 | - | 70,104,572 | - |
Information Technology | 68,846,302 | - | 68,846,302 | - |
Materials | 62,110,484 | - | 62,110,484 | - |
Telecommunication Services | 17,167,607 | - | 17,167,607 | - |
Utilities | 7,415,348 | - | 7,415,348 | - |
Money Market Funds | 17,623,968 | 17,623,968 | - | - |
Total Investments in Securities: | $ 541,619,050 | $ 17,623,968 | $ 523,995,082 | $ - |
The following is a summary of transfers between Level 1 and Level 2 for the period ended October 31, 2013. Transfers are assumed to have occurred at the beginning of the period, and are primarily attributable to the valuation techniques used for foreign equity securities, as discussed in the accompanying Notes to Financial Statements: |
Transfers | Total |
Level 1 to Level 2 | $ 185,243,204 |
Level 2 to Level 1 | $ 0 |
See accompanying notes which are an integral part of the financial statements.
Annual Report
Fidelity Japan Fund
Statement of Assets and Liabilities
| October 31, 2013 |
| | |
Assets | | |
Investment in securities, at value (including securities loaned of $7,293,099) - See accompanying schedule: Unaffiliated issuers (cost $504,921,967) | $ 523,995,082 | |
Fidelity Central Funds (cost $17,623,968) | 17,623,968 | |
Total Investments (cost $522,545,935) | | $ 541,619,050 |
Receivable for investments sold | | 2,851,415 |
Receivable for fund shares sold | | 679,527 |
Dividends receivable | | 3,870,202 |
Distributions receivable from Fidelity Central Funds | | 6,131 |
Prepaid expenses | | 1,910 |
Other receivables | | 26,529 |
Total assets | | 549,054,764 |
| | |
Liabilities | | |
Payable for investments purchased | $ 646,082 | |
Payable for fund shares redeemed | 886,923 | |
Accrued management fee | 265,409 | |
Distribution and service plan fees payable | 16,866 | |
Other affiliated payables | 110,934 | |
Other payables and accrued expenses | 79,477 | |
Collateral on securities loaned, at value | 7,668,401 | |
Total liabilities | | 9,674,092 |
| | |
Net Assets | | $ 539,380,672 |
Net Assets consist of: | | |
Paid in capital | | $ 713,501,665 |
Undistributed net investment income | | 4,547,036 |
Accumulated undistributed net realized gain (loss) on investments and foreign currency transactions | | (197,749,320) |
Net unrealized appreciation (depreciation) on investments and assets and liabilities in foreign currencies | | 19,081,291 |
Net Assets | | $ 539,380,672 |
Statement of Assets and Liabilities - continued
| October 31, 2013 |
| | |
Calculation of Maximum Offering Price Class A:
Net Asset Value and redemption price per share ($20,519,915 ÷ 1,709,790 shares) | | $ 12.00 |
| | |
Maximum offering price per share (100/94.25 of $12.00) | | $ 12.73 |
Class T:
Net Asset Value and redemption price per share ($5,356,999 ÷ 447,738 shares) | | $ 11.96 |
| | |
Maximum offering price per share (100/96.50 of $11.96) | | $ 12.39 |
Class B:
Net Asset Value and offering price per share ($874,018 ÷ 72,837 shares)A | | $ 12.00 |
| | |
Class C:
Net Asset Value and offering price per share ($11,823,577 ÷ 988,738 shares)A | | $ 11.96 |
| | |
Japan:
Net Asset Value, offering price and redemption price per share ($480,773,281 ÷ 39,971,447 shares) | | $ 12.03 |
| | |
Institutional Class:
Net Asset Value, offering price and redemption price per share ($20,032,882 ÷ 1,666,824 shares) | | $ 12.02 |
A Redemption price per share is equal to net asset value less any applicable contingent deferred sales charge.
See accompanying notes which are an integral part of the financial statements.
Annual Report
Fidelity Japan Fund
Financial Statements - continued
Statement of Operations
| Year ended October 31, 2013 |
| | |
Investment Income | | |
Dividends | | $ 10,225,631 |
Income from Fidelity Central Funds | | 108,821 |
Income before foreign taxes withheld | | 10,334,452 |
Less foreign taxes withheld | | (730,071) |
Total income | | 9,604,381 |
| | |
Expenses | | |
Management fee | | |
Basic fee | $ 3,381,267 | |
Performance adjustment | (364,882) | |
Transfer agent fees | 1,005,993 | |
Distribution and service plan fees | 164,646 | |
Accounting and security lending fees | 250,524 | |
Custodian fees and expenses | 64,515 | |
Independent trustees' compensation | 2,744 | |
Registration fees | 86,829 | |
Audit | 69,145 | |
Legal | 1,108 | |
Interest | 85 | |
Miscellaneous | 3,524 | |
Total expenses before reductions | 4,665,498 | |
Expense reductions | (78,932) | 4,586,566 |
Net investment income (loss) | | 5,017,815 |
Realized and Unrealized Gain (Loss) Net realized gain (loss) on: | | |
Investment securities: | | |
Unaffiliated issuers | 22,728,384 | |
Foreign currency transactions | (386,358) | |
Total net realized gain (loss) | | 22,342,026 |
Change in net unrealized appreciation (depreciation) on: Investment securities | 92,533,961 | |
Assets and liabilities in foreign currencies | 99,827 | |
Total change in net unrealized appreciation (depreciation) | | 92,633,788 |
Net gain (loss) | | 114,975,814 |
Net increase (decrease) in net assets resulting from operations | | $ 119,993,629 |
Statement of Changes in Net Assets
| Year ended
October 31,
2013 | Year ended
October 31,
2012 |
Increase (Decrease) in Net Assets | | |
Operations | | |
Net investment income (loss) | $ 5,017,815 | $ 5,368,143 |
Net realized gain (loss) | 22,342,026 | (8,912,266) |
Change in net unrealized appreciation (depreciation) | 92,633,788 | 3,021,959 |
Net increase (decrease) in net assets resulting from operations | 119,993,629 | (522,164) |
Distributions to shareholders from net investment income | (5,641,978) | (7,688,787) |
Distributions to shareholders from net realized gain | (3,106,863) | (2,570,905) |
Total distributions | (8,748,841) | (10,259,692) |
Share transactions - net increase (decrease) | 51,180,009 | (93,975,629) |
Redemption fees | 461,366 | 61,543 |
Total increase (decrease) in net assets | 162,886,163 | (104,695,942) |
| | |
Net Assets | | |
Beginning of period | 376,494,509 | 481,190,451 |
End of period (including undistributed net investment income of $4,547,036 and undistributed net investment income of $5,171,198, respectively) | $ 539,380,672 | $ 376,494,509 |
See accompanying notes which are an integral part of the financial statements.
Annual Report
Financial Highlights - Class A
Years ended October 31, | 2013 | 2012 | 2011 H |
Selected Per-Share Data | | | |
Net asset value, beginning of period | $ 9.30 | $ 9.54 | $ 10.83 |
Income from Investment Operations | | | |
Net investment income (loss) E | .08 | .09 | .09 |
Net realized and unrealized gain (loss) | 2.80 | (.15) | (1.39) |
Total from investment operations | 2.88 | (.06) | (1.30) |
Distributions from net investment income | (.11) | (.13) | - |
Distributions from net realized gain | (.08) | (.05) | - |
Total distributions | (.19) | (.18) | - |
Redemption fees added to paid in capital E | .01 | - K | .01 |
Net asset value, end of period | $ 12.00 | $ 9.30 | $ 9.54 |
Total Return B, C, D | 31.58% | (.64)% | (11.91)% |
Ratios to Average Net Assets F, I | | | |
Expenses before reductions | 1.26% | 1.42% | 1.20% A |
Expenses net of fee waivers, if any | 1.26% | 1.38% | 1.20% A |
Expenses net of all reductions | 1.25% | 1.36% | 1.16% A |
Net investment income (loss) | .75% | .94% | 1.02% A |
Supplemental Data | | | |
Net assets, end of period (000 omitted) | $ 20,520 | $ 9,495 | $ 13,208 |
Portfolio turnover rate G | 68% | 52% | 134% J |
A Annualized B Total returns for periods of less than one year are not annualized. C Total returns would have been lower if certain expenses had not been reduced during the applicable periods shown. D Total returns do not include the effect of the sales charges. E Calculated based on average shares outstanding during the period. F Fees and expenses of any underlying Fidelity Central Funds are not included in the Fund's expense ratio. The Fund indirectly bears its proportionate share of the expenses of any underlying Fidelity Central Funds. G Amount does not include the portfolio activity of any underlying Fidelity Central Funds. H For the period December 14, 2010 (commencement of sale of shares) to October 31, 2011. I Expense ratios reflect operating expenses of the class. Expenses before reductions do not reflect amounts reimbursed by the investment adviser or reductions from brokerage service arrangements or reductions from other expense offset arrangements and do not represent the amount paid by the class during periods when reimbursements or reductions occur. Expense ratios before reductions for start-up periods may not be representative of longer-term operating periods. Expenses net of fee waivers reflect expenses after reimbursement by the investment adviser but prior to reductions from brokerage service arrangements or other expense offset arrangements. Expenses net of all reductions represent the net expenses paid by the class. J The portfolio turnover rate does not include the assets acquired in the merger. K Amount represents less than $.01 per share. |
Financial Highlights - Class T
Years ended October 31, | 2013 | 2012 | 2011 H |
Selected Per-Share Data | | | |
Net asset value, beginning of period | $ 9.28 | $ 9.51 | $ 10.83 |
Income from Investment Operations | | | |
Net investment income (loss) E | .05 | .06 | .07 |
Net realized and unrealized gain (loss) | 2.78 | (.13) | (1.40) |
Total from investment operations | 2.83 | (.07) | (1.33) |
Distributions from net investment income | (.08) | (.11) | - |
Distributions from net realized gain | (.08) | (.05) | - |
Total distributions | (.16) | (.16) | - |
Redemption fees added to paid in capital E | .01 | - K | .01 |
Net asset value, end of period | $ 11.96 | $ 9.28 | $ 9.51 |
Total Return B, C, D | 31.04% | (.75)% | (12.19)% |
Ratios to Average Net Assets F, I | | | |
Expenses before reductions | 1.55% | 1.70% | 1.48% A |
Expenses net of fee waivers, if any | 1.55% | 1.66% | 1.48% A |
Expenses net of all reductions | 1.53% | 1.64% | 1.44% A |
Net investment income (loss) | .46% | .66% | .74% A |
Supplemental Data | | | |
Net assets, end of period (000 omitted) | $ 5,357 | $ 3,934 | $ 4,643 |
Portfolio turnover rate G | 68% | 52% | 134% J |
A Annualized B Total returns for periods of less than one year are not annualized. C Total returns would have been lower if certain expenses had not been reduced during the applicable periods shown. D Total returns do not include the effect of the sales charges. E Calculated based on average shares outstanding during the period. F Fees and expenses of any underlying Fidelity Central Funds are not included in the Fund's expense ratio. The Fund indirectly bears its proportionate share of the expenses of any underlying Fidelity Central Funds. G Amount does not include the portfolio activity of any underlying Fidelity Central Funds. H For the period December 14, 2010 (commencement of sale of shares) to October 31, 2011. I Expense ratios reflect operating expenses of the class. Expenses before reductions do not reflect amounts reimbursed by the investment adviser or reductions from brokerage service arrangements or reductions from other expense offset arrangements and do not represent the amount paid by the class during periods when reimbursements or reductions occur. Expense ratios before reductions for start-up periods may not be representative of longer-term operating periods. Expenses net of fee waivers reflect expenses after reimbursement by the investment adviser but prior to reductions from brokerage service arrangements or other expense offset arrangements. Expenses net of all reductions represent the net expenses paid by the class. J The portfolio turnover rate does not include the assets acquired in the merger. K Amount represents less than $.01 per share. |
See accompanying notes which are an integral part of the financial statements.
Annual Report
Financial Highlights - Class B
Years ended October 31, | 2013 | 2012 | 2011 H |
Selected Per-Share Data | | | |
Net asset value, beginning of period | $ 9.26 | $ 9.47 | $ 10.83 |
Income from Investment Operations | | | |
Net investment income (loss) E | - K | .02 | .02 |
Net realized and unrealized gain (loss) | 2.80 | (.14) | (1.39) |
Total from investment operations | 2.80 | (.12) | (1.37) |
Distributions from net investment income | - | (.04) | - |
Distributions from net realized gain | (.07) | (.05) | - |
Total distributions | (.07) | (.09) | - |
Redemption fees added to paid in capital E | .01 | - K | .01 |
Net asset value, end of period | $ 12.00 | $ 9.26 | $ 9.47 |
Total Return B, C, D | 30.52% | (1.24)% | (12.56)% |
Ratios to Average Net Assets F, I | | | |
Expenses before reductions | 2.02% | 2.17% | 1.95% A |
Expenses net of fee waivers, if any | 2.02% | 2.13% | 1.95% A |
Expenses net of all reductions | 2.01% | 2.11% | 1.91% A |
Net investment income (loss) | (.02)% | .19% | .27% A |
Supplemental Data | | | |
Net assets, end of period (000 omitted) | $ 874 | $ 1,012 | $ 1,458 |
Portfolio turnover rate G | 68% | 52% | 134% J |
A Annualized B Total returns for periods of less than one year are not annualized. C Total returns would have been lower if certain expenses had not been reduced during the applicable periods shown. D Total returns do not include the effect of the contingent deferred sales charge. E Calculated based on average shares outstanding during the period. F Fees and expenses of any underlying Fidelity Central Funds are not included in the Fund's expense ratio. The Fund indirectly bears its proportionate share of the expenses of any underlying Fidelity Central Funds. G Amount does not include the portfolio activity of any underlying Fidelity Central Funds. H For the period December 14, 2010 (commencement of sale of shares) to October 31, 2011. I Expense ratios reflect operating expenses of the class. Expenses before reductions do not reflect amounts reimbursed by the investment adviser or reductions from brokerage service arrangements or reductions from other expense offset arrangements and do not represent the amount paid by the class during periods when reimbursements or reductions occur. Expense ratios before reductions for start-up periods may not be representative of longer-term operating periods. Expenses net of fee waivers reflect expenses after reimbursement by the investment adviser but prior to reductions from brokerage service arrangements or other expense offset arrangements. Expenses net of all reductions represent the net expenses paid by the class. J The portfolio turnover rate does not include the assets acquired in the merger. K Amount represents less than $.01 per share. |
Financial Highlights - Class C
Years ended October 31, | 2013 | 2012 | 2011 H |
Selected Per-Share Data | | | |
Net asset value, beginning of period | $ 9.25 | $ 9.48 | $ 10.83 |
Income from Investment Operations | | | |
Net investment income (loss) E | - K | .02 | .03 |
Net realized and unrealized gain (loss) | 2.79 | (.14) | (1.39) |
Total from investment operations | 2.79 | (.12) | (1.36) |
Distributions from net investment income | (.01) | (.06) | - |
Distributions from net realized gain | (.08) | (.05) | - |
Total distributions | (.09) | (.11) | - |
Redemption fees added to paid in capital E | .01 | - K | .01 |
Net asset value, end of period | $ 11.96 | $ 9.25 | $ 9.48 |
Total Return B, C, D | 30.55% | (1.27)% | (12.47)% |
Ratios to Average Net Assets F, I | | | |
Expenses before reductions | 1.97% | 2.15% | 1.92% A |
Expenses net of fee waivers, if any | 1.97% | 2.11% | 1.92% A |
Expenses net of all reductions | 1.95% | 2.09% | 1.88% A |
Net investment income (loss) | .04% | .21% | .30% A |
Supplemental Data | | | |
Net assets, end of period (000 omitted) | $ 11,824 | $ 7,015 | $ 8,750 |
Portfolio turnover rate G | 68% | 52% | 134% J |
A Annualized B Total returns for periods of less than one year are not annualized. C Total returns would have been lower if certain expenses had not been reduced during the applicable periods shown. D Total returns do not include the effect of the contingent deferred sales charge. E Calculated based on average shares outstanding during the period. F Fees and expenses of any underlying Fidelity Central Funds are not included in the Fund's expense ratio. The Fund indirectly bears its proportionate share of the expenses of any underlying Fidelity Central Funds. G Amount does not include the portfolio activity of any underlying Fidelity Central Funds. H For the period December 14, 2010 (commencement of sale of shares) to October 31, 2011. I Expense ratios reflect operating expenses of the class. Expenses before reductions do not reflect amounts reimbursed by the investment adviser or reductions from brokerage service arrangements or reductions from other expense offset arrangements and do not represent the amount paid by the class during periods when reimbursements or reductions occur. Expense ratios before reductions for start-up periods may not be representative of longer-term operating periods. Expenses net of fee waivers reflect expenses after reimbursement by the investment adviser but prior to reductions from brokerage service arrangements or other expense offset arrangements. Expenses net of all reductions represent the net expenses paid by the class. J The portfolio turnover rate does not include the assets acquired in the merger. K Amount represents less than $.01 per share. |
See accompanying notes which are an integral part of the financial statements.
Annual Report
Financial Highlights - Japan
Years ended October 31, | 2013 | 2012 | 2011 | 2010 | 2009 |
Selected Per-Share Data | | | | | |
Net asset value, beginning of period | $ 9.34 | $ 9.57 | $ 10.57 | $ 10.03 | $ 9.03 |
Income from Investment Operations | | | | | |
Net investment income (loss) B | .12 | .12 | .15 | .10 | .08 |
Net realized and unrealized gain (loss) | 2.79 | (.14) | (.75) | .61 | 1.04 |
Total from investment operations | 2.91 | (.02) | (.60) | .71 | 1.12 |
Distributions from net investment income | (.15) | (.16) | (.20) | (.07) | (.11) |
Distributions from net realized gain | (.08) | (.05) | (.21) | (.10) | (.01) |
Total distributions | (.23) | (.21) | (.41) | (.17) | (.12) |
Redemption fees added to paid in capital B | .01 | - G | .01 | - G | - G |
Net asset value, end of period | $ 12.03 | $ 9.34 | $ 9.57 | $ 10.57 | $ 10.03 |
Total Return A | 31.92% | (.19)% | (6.00)% | 7.12% | 12.84% |
Ratios to Average Net Assets C, E | | | | | |
Expenses before reductions | .93% | 1.09% | .86% | .93% | .90% |
Expenses net of fee waivers, if any | .93% | 1.06% | .84% | .93% | .90% |
Expenses net of all reductions | .91% | 1.04% | .80% | .93% | .89% |
Net investment income (loss) | 1.08% | 1.26% | 1.38% | .97% | .90% |
Supplemental Data | | | | | |
Net assets, end of period (000 omitted) | $ 480,773 | $ 353,550 | $ 450,417 | $ 649,316 | $ 944,902 |
Portfolio turnover rate D | 68% | 52% | 134% F | 43% | 73% |
A Total returns would have been lower if certain expenses had not been reduced during the applicable periods shown. B Calculated based on average shares outstanding during the period. C Fees and expenses of any underlying Fidelity Central Funds are not included in the Fund's expense ratio. The Fund indirectly bears its proportionate share of the expenses of any underlying Fidelity Central Funds. D Amount does not include the portfolio activity of any underlying Fidelity Central Funds. E Expense ratios reflect operating expenses of the class. Expenses before reductions do not reflect amounts reimbursed by the investment adviser or reductions from brokerage service arrangements or reductions from other expense offset arrangements and do not represent the amount paid by the class during periods when reimbursements or reductions occur. Expenses net of fee waivers reflect expenses after reimbursement by the investment adviser but prior to reductions from brokerage service arrangements or other expense offset arrangements. Expenses net of all reductions represent the net expenses paid by the class. F The portfolio turnover rate does not include the assets acquired in the merger. G Amount represents less than $.01 per share. |
Financial Highlights - Institutional Class
Years ended October 31, | 2013 | 2012 | 2011 G |
Selected Per-Share Data | | | |
Net asset value, beginning of period | $ 9.33 | $ 9.57 | $ 10.83 |
Income from Investment Operations | | | |
Net investment income (loss) D | .13 | .12 | .13 |
Net realized and unrealized gain (loss) | 2.78 | (.14) | (1.40) |
Total from investment operations | 2.91 | (.02) | (1.27) |
Distributions from net investment income | (.15) | (.17) | - |
Distributions from net realized gain | (.08) | (.05) | - |
Total distributions | (.23) | (.22) | - |
Redemption fees added to paid in capital D | .01 | - J | .01 |
Net asset value, end of period | $ 12.02 | $ 9.33 | $ 9.57 |
Total Return B, C | 32.04% | (.18)% | (11.63)% |
Ratios to Average Net Assets E, H | | | |
Expenses before reductions | .90% | 1.03% | .79% A |
Expenses net of fee waivers, if any | .90% | 1.01% | .79% A |
Expenses net of all reductions | .88% | .99% | .75% A |
Net investment income (loss) | 1.11% | 1.31% | 1.43% A |
Supplemental Data | | | |
Net assets, end of period (000 omitted) | $ 20,033 | $ 1,488 | $ 2,715 |
Portfolio turnover rate F | 68% | 52% | 134% I |
A Annualized B Total returns for periods of less than one year are not annualized. C Total returns would have been lower if certain expenses had not been reduced during the applicable periods shown. D Calculated based on average shares outstanding during the period. E Fees and expenses of any underlying Fidelity Central Funds are not included in the Fund's expense ratio. The Fund indirectly bears its proportionate share of the expenses of any underlying Fidelity Central Funds. F Amount does not include the portfolio activity of any underlying Fidelity Central Funds. G For the period December 14, 2010 (commencement of sale of shares) to October 31, 2011. H Expense ratios reflect operating expenses of the class. Expenses before reductions do not reflect amounts reimbursed by the investment adviser or reductions from brokerage service arrangements or reductions from other expense offset arrangements and do not represent the amount paid by the class during periods when reimbursements or reductions occur. Expense ratios before reductions for start-up periods may not be representative of longer-term operating periods. Expenses net of fee waivers reflect expenses after reimbursement by the investment adviser but prior to reductions from brokerage service arrangements or other expense offset arrangements. Expenses net of all reductions represent the net expenses paid by the class. I The portfolio turnover rate does not include the assets acquired in the merger. J Amount represents less than $.01 per share. |
See accompanying notes which are an integral part of the financial statements.
Annual Report
Notes to Financial Statements
For the period ended October 31, 2013
1. Organization.
Fidelity Japan Fund (the Fund) is a fund of Fidelity Investment Trust (the Trust) and is authorized to issue an unlimited number of shares. The Trust is registered under the Investment Company Act of 1940, as amended (the 1940 Act), as an open-end management investment company organized as a Massachusetts business trust. The Fund offers Class A, Class T, Class C, Japan and Institutional Class shares, each of which, along with Class B shares, has equal rights as to assets and voting privileges. Class B shares are closed to new accounts and additional purchases, except for exchanges and reinvestments. Each class has exclusive voting rights with respect to matters that affect that class. Class B shares will automatically convert to Class A shares after a holding period of seven years from the initial date of purchase.
2. Investments in Fidelity Central Funds.
The Fund invests in Fidelity Central Funds, which are open-end investment companies generally available only to other investment companies and accounts managed by Fidelity Management & Research Company (FMR) and its affiliates. The Fund's Schedule of Investments lists each of the Fidelity Central Funds held as of period end, if any, as an investment of the Fund, but does not include the underlying holdings of each Fidelity Central Fund. As an Investing Fund, the Fund indirectly bears its proportionate share of the expenses of the underlying Fidelity Central Funds.
The Money Market Central Funds seek preservation of capital and current income and are managed by Fidelity Investments Money Management, Inc. (FIMM), an affiliate of FMR.
A complete unaudited list of holdings for each Fidelity Central Fund is available upon request or at the Securities and Exchange Commission (the SEC) website at www.sec.gov. In addition, the financial statements of the Fidelity Central Funds, which are not covered by the Fund's Report of Independent Registered Public Accounting Firm, are available on the SEC website or upon request.
3. Significant Accounting Policies.
The financial statements have been prepared in conformity with accounting principles generally accepted in the United States of America (GAAP), which require management to make certain estimates and assumptions at the date of the financial statements. Actual results could differ from those estimates. Subsequent events, if any, through the date that the financial statements were issued have been evaluated in the preparation of the financial statements. The following summarizes the significant accounting policies of the Fund:
Investment Valuation. Investments are valued as of 4:00 p.m. Eastern time on the last calendar day of the period. In accordance with valuation policies and procedures approved by the Board of Trustees (the Board), the Fund attempts to obtain prices from one or more third party pricing vendors or brokers to value its investments. When current market prices, quotations or currency exchange rates are not readily available or reliable, investments will be fair valued in good faith by the FMR Fair Value Committee (the Committee), in accordance with procedures adopted by the Board. Factors used in determining fair value vary by investment type and may include market or investment specific events. The frequency with which these procedures are used cannot be predicted and they may be utilized to a significant extent. The Committee oversees the Fund's valuation policies and procedures and is responsible for approving and reporting to the Board all fair value determinations.
The Fund categorizes the inputs to valuation techniques used to value its investments into a disclosure hierarchy consisting of three levels as shown below:
Level 1 - quoted prices in active markets for identical investments
Level 2 - other significant observable inputs (including quoted prices for similar investments, interest rates, prepayment speeds, etc.)
Level 3 - unobservable inputs (including the Fund's own assumptions based on the best information available)
Valuation techniques used to value the Fund's investments by major category are as follows:
Equity securities, including restricted securities, for which market quotations are readily available, are valued at the last reported sale price or official closing price as reported by a third party pricing vendor on the primary market or exchange on which they are traded and are categorized as Level 1 in the hierarchy. In the event there were no sales during the day or closing prices are not available, securities are valued at the last quoted bid price or may be valued using the last available price and are generally categorized as Level 2 in the hierarchy. For foreign equity securities, when market or security specific events arise, comparisons to the valuation of American Depositary Receipts (ADRs), futures contracts, Exchange-Traded Funds (ETFs) and certain indexes as well as quoted prices for similar securities may be used and would be categorized as Level 2 in the hierarchy. Utilizing these techniques may result in transfers between Level 1 and Level 2. For equity securities, including restricted securities, where observable inputs are limited, assumptions about market activity and risk are used and these securities may be categorized as Level 3 in the hierarchy.
Investments in open-end mutual funds, including the Fidelity Central Funds, are valued at their closing net asset value (NAV) each business day and are categorized as Level 1 in the hierarchy.
Annual Report
Notes to Financial Statements - continued
3. Significant Accounting Policies - continued
Investment Valuation - continued
Changes in valuation techniques may result in transfers in or out of an assigned level within the disclosure hierarchy. The aggregate value of investments by input level, as of October 31, 2013, including information on transfers between Levels 1 and 2 is included at the end of the Fund's Schedule of Investments.
Foreign Currency. The Fund may use foreign currency contracts to facilitate transactions in foreign-denominated securities. Gains and losses from these transactions may arise from changes in the value of the foreign currency or if the counterparties do not perform under the contracts' terms.
Foreign-denominated assets, including investment securities, and liabilities are translated into U.S. dollars at the exchange rates at period end. Purchases and sales of investment securities, income and dividends received and expenses denominated in foreign currencies are translated into U.S. dollars at the exchange rate in effect on the transaction date.
The effects of exchange rate fluctuations on investments are included with the net realized and unrealized gain (loss) on investment securities. Other foreign currency transactions resulting in realized and unrealized gain (loss) are disclosed separately.
Investment Transactions and Income. For financial reporting purposes, the Fund's investment holdings and NAV include trades executed through the end of the last business day of the period. The NAV per share for processing shareholder transactions is calculated as of the close of business of the New York Stock Exchange (NYSE), normally 4:00 p.m. Eastern time and includes trades executed through the end of the prior business day. Gains and losses on securities sold are determined on the basis of identified cost. Dividend income is recorded on the ex-dividend date, except for certain dividends from foreign securities where the ex-dividend date may have passed, which are recorded as soon as the Fund is informed of the ex-dividend date. Non-cash dividends included in dividend income, if any, are recorded at the fair market value of the securities received. Interest income and distributions from the Fidelity Central Funds are accrued as earned. Investment income is recorded net of foreign taxes withheld where recovery of such taxes is uncertain.
Class Allocations and Expenses. Investment income, realized and unrealized capital gains and losses, common expenses of the Fund, and certain fund-level expense reductions, if any, are allocated daily on a pro-rata basis to each class based on the relative net assets of each class to the total net assets of the Fund. Each class differs with respect to transfer agent and distribution and service plan fees incurred. Certain expense reductions may also differ by class. For the reporting period, the allocated portion of income and expenses to each class as a percent of its average net assets may vary due to the timing of recording these transactions in relation to fluctuating net assets of the classes. Expenses directly attributable to a fund are charged to that fund. Expenses attributable to more than one fund are allocated among the respective funds on the basis of relative net assets or other appropriate methods. Expense estimates are accrued in the period to which they relate and adjustments are made when actual amounts are known.
Income Tax Information and Distributions to Shareholders. Each year, the Fund intends to qualify as a regulated investment company under Subchapter M of the Internal Revenue Code, including distributing substantially all of its taxable income and realized gains. As a result, no provision for U.S. Federal income taxes is required. As of October 31, 2013, the Fund did not have any unrecognized tax benefits in the financial statements; nor is the Fund aware of any tax positions for which it is reasonably possible that the total amounts of unrecognized tax benefits will significantly change in the next twelve months. The Fund files a U.S. federal tax return, in addition to state and local tax returns as required. The Fund's federal income tax returns are subject to examination by the Internal Revenue Service (IRS) for a period of three fiscal years after they are filed. State and local tax returns may be subject to examination for an additional fiscal year depending on the jurisdiction. Foreign taxes are provided for based on the Fund's understanding of the tax rules and rates that exist in the foreign markets in which it invests.
Distributions are declared and recorded on the ex-dividend date. Income dividends and capital gain distributions are declared separately for each class. Income and capital gain distributions are determined in accordance with income tax regulations, which may differ from GAAP.
Capital accounts within the financial statements are adjusted for permanent book-tax differences. These adjustments have no impact on net assets or the results of operations. Temporary book-tax differences will reverse in a subsequent period.
Book-tax differences are primarily due to foreign currency transactions, passive foreign investment companies (PFIC), deferred trustees compensation, capital loss carryforwards and losses deferred due to wash sales.
The federal tax cost of investment securities and unrealized appreciation (depreciation) as of period end were as follows:
Gross unrealized appreciation | $ 55,398,617 |
Gross unrealized depreciation | (43,857,029) |
Net unrealized appreciation (depreciation) on securities and other investments | $ 11,541,588 |
| |
Tax Cost | $ 530,077,462 |
Annual Report
3. Significant Accounting Policies - continued
Income Tax Information and Distributions to Shareholders - continued
The tax-based components of distributable earnings as of period end were as follows:
Undistributed ordinary income | $ 4,845,246 |
Capital loss carryforward | $ (190,515,854) |
Net unrealized appreciation (depreciation) | $ 11,549,764 |
Capital loss carryforwards are only available to offset future capital gains of the Fund to the extent provided by regulations and may be limited. Under the Regulated Investment Company Modernization Act of 2010 (the Act), the Fund is permitted to carry forward capital losses incurred in taxable years beginning after December 22, 2010 for an unlimited period and such capital losses are required to be used prior to any losses that expire. The capital loss carryforward information presented below, including any applicable limitation, is estimated as of fiscal period end and is subject to adjustment.
Fiscal year of expiration | |
2016 | (3,870,588) |
2017 | (60,951,366) |
2018 | (26,887,863) |
2019 | (98,806,037) |
Total with expiration | (190,515,854) |
The tax character of distributions paid was as follows:
| October 31, 2013 | October 31, 2012 |
| | |
Ordinary Income | $ 8,748,841 | $ 10,259,692 |
Due to large redemptions in a prior period, $161,303,179 of capital losses that will be available to offset future capital gains of the Fund will be limited to approximately $18,885,324 per year.
The Fund acquired $5,487,891 of its capital loss carryforward as part of a merger in a prior period. The losses acquired that will be available to offset future capital gains of the Fund will be limited to approximately $1,371,973 per year.
Short-Term Trading (Redemption) Fees. Shares held by investors in the Fund less than 90 days may have been subject to a redemption fee equal to 1.50% of the net asset value of shares redeemed. All redemption fees, which reduce the proceeds of the shareholder redemption, are retained by the Fund and accounted for as an addition to paid in capital.
4. Purchases and Sales of Investments.
Purchases and sales of securities, other than short-term securities, aggregated $351,084,154 and $314,554,352, respectively.
5. Fees and Other Transactions with Affiliates.
Management Fee. FMR and its affiliates provide the Fund with investment management related services for which the Fund pays a monthly management fee. The management fee is the sum of an individual fund fee rate that is based on an annual rate of .45% of the Fund's average net assets and an annualized group fee rate that averaged .25% during the period. The group fee rate is based upon the average net assets of all the mutual funds advised by FMR, including any mutual funds previously advised by FMR that are currently advised by Fidelity SelectCo, LLC, an affiliate of FMR. The group fee rate decreases as assets under management increase and increases as assets under management decrease. In addition, the management fee is subject to a performance adjustment (up to a maximum of ± .20% of the Fund's average net assets over a 36 month performance period). The upward or downward adjustment to the management fee is based on the relative investment performance of Japan as compared to an appropriate benchmark index over the same 36 month performance period. For the reporting period, the total annual management fee rate, including the performance adjustment, was .63% of the Fund's average net assets. The performance adjustment included in the management fee rate may be higher or lower than the maximum performance adjustment rate due to the difference between the average net assets for the reporting and performance periods.
Distribution and Service Plan Fees. In accordance with Rule 12b-1 of the 1940 Act, the Fund has adopted separate Distribution and Service Plans for each class of shares. Certain classes pay Fidelity Distributors Corporation (FDC), an affiliate of FMR, separate Distribution and Service Fees, each of which is based on an annual percentage of each class' average net assets. In addition, FDC may pay financial intermediaries for selling shares of the
Annual Report
Notes to Financial Statements - continued
5. Fees and Other Transactions with Affiliates - continued
Distribution and Service Plan Fees - continued
Fund and providing shareholder support services. For the period, the Distribution and Service Fee rates, total fees and amounts retained by FDC were as follows:
| Distribution
Fee | Service
Fee | Total Fees | Retained
by FDC |
Class A | -% | .25% | $ 38,678 | $ 1,182 |
Class T | .25% | .25% | 24,976 | - |
Class B | .75% | .25% | 9,235 | 6,947 |
Class C | .75% | .25% | 91,757 | 26,746 |
| | | $ 164,646 | $ 34,875 |
Sales Load. FDC may receive a front-end sales charge of up to 5.75% for selling Class A shares and 3.50% for selling Class T shares, some of which is paid to financial intermediaries for selling shares of the Fund. Depending on the holding period, FDC may receive contingent deferred sales charges levied on Class A, Class T, Class B and Class C redemptions. The deferred sales charges range from 5.00% to 1.00% for Class B shares, 1.00% for Class C shares, 1.00% for certain purchases of Class A shares and .25% for certain purchases of Class T shares.
For the period, sales charge amounts retained by FDC were as follows:
| Retained
by FDC |
Class A | $ 23,911 |
Class T | 2,514 |
Class B* | 629 |
Class C* | 3,853 |
| $ 30,907 |
* When Class B and Class C shares are initially sold, FDC pays commissions from its own resources to financial intermediaries through which the sales are made.
Transfer Agent Fees. Fidelity Investments Institutional Operations Company, Inc., (FIIOC), an affiliate of FMR, is the transfer, dividend disbursing and shareholder servicing agent for each class of the Fund. FIIOC receives account fees and asset-based fees that vary according to the account size and type of account of the shareholders of the respective classes of the Fund. FIIOC pays for typesetting, printing and mailing of shareholder reports, except proxy statements.
For the period, transfer agent fees for each applicable class were as follows:
| Amount | % of
Average
Net Assets |
Class A | $ 45,115 | .29 |
Class T | 16,311 | .33 |
Class B | 2,767 | .30 |
Class C | 22,846 | .25 |
Japan | 901,696 | .20 |
Institutional Class | 17,258 | .17 |
| $ 1,005,993 | |
Accounting and Security Lending Fees. Fidelity Service Company, Inc. (FSC), an affiliate of FMR, maintains the Fund's accounting records. The accounting fee is based on the level of average net assets for each month. Under a separate contract, FSC administers the security lending program. The security lending fee is based on the number and duration of lending transactions.
Interfund Lending Program. Pursuant to an Exemptive Order issued by the SEC, the Fund, along with other registered investment companies having management contracts with FMR, may participate in an interfund lending program. This program provides an alternative credit facility allowing the funds to borrow from, or lend money to, other participating affiliated funds. At period end, there were no interfund loans outstanding. The Fund's activity in this program during the period for which loans were outstanding was as follows:
Borrower or Lender | Average Loan
Balance | Weighted Average Interest Rate | Interest
Expense |
Borrower | $ 2,436,750 | .31% | $ 85 |
Annual Report
6. Committed Line of Credit.
The Fund participates with other funds managed by FMR or an affiliate in a $4.25 billion credit facility (the "line of credit") to be utilized for temporary or emergency purposes to fund shareholder redemptions or for other short-term liquidity purposes. The Fund has agreed to pay commitment fees on its pro-rata portion of the line of credit, which amounted to $993 and is reflected in Miscellaneous expenses on the Statement of Operations. During the period, there were no borrowings on this line of credit.
7. Security Lending.
The Fund lends portfolio securities through a lending agent from time to time in order to earn additional income. For equity securities, a lending agent is used and may loan securities to certain qualified borrowers, including Fidelity Capital Markets (FCM), a broker-dealer affiliated with the Fund. On the settlement date of the loan, the Fund receives collateral (in the form of U.S. Treasury obligations, letters of credit and/or cash) against the loaned securities and maintains collateral in an amount not less than 100% of the market value of the loaned securities during the period of the loan. The market value of the loaned securities is determined at the close of business of the Fund and any additional required collateral is delivered to the Fund on the next business day. If the borrower defaults on its obligation to return the securities loaned because of insolvency or other reasons, the Fund may apply collateral received from the borrower against the obligation. The Fund may experience delays and costs in recovering the securities loaned. Any cash collateral received is invested in the Fidelity Securities Lending Cash Central Fund. The value of loaned securities and cash collateral at period end are disclosed on the Fund's Statement of Assets and Liabilities. Security lending income represents the income earned on investing cash collateral, less rebates paid to borrowers and any lending agent fees associated with the loan, plus any premium payments received for lending certain types of securities. Security lending income is presented in the Statement of Operations as a component of income from Fidelity Central Funds. Total security lending income during the period amounted to $93,183. During the period, there were no securities loaned to FCM.
8. Expense Reductions.
Commissions paid to certain brokers with whom FMR, or its affiliates, places trades on behalf of the Fund include an amount in addition to trade execution, which may be rebated back to the Fund to offset certain expenses. This amount totaled $76,363 for the period.
In addition, FMR reimbursed a portion of the Fund's operating expenses during the period in the amount of $2,569.
9. Distributions to Shareholders.
Distributions to shareholders of each class were as follows:
Years ended October 31, | 2013 | 2012 |
From net investment income | | |
Class A | $ 106,946 | $ 168,535 |
Class T | 32,766 | 50,833 |
Class B | - | 6,144 |
Class C | 8,397 | 52,214 |
Japan | 5,470,176 | 7,354,386 |
Institutional Class | 23,693 | 56,675 |
Total | $ 5,641,978 | $ 7,688,787 |
From net realized gain | | |
Class A | $ 79,705 | $ 69,007 |
Class T | 33,186 | 24,703 |
Class B | 6,644 | 7,792 |
Class C | 55,283 | 46,858 |
Japan | 2,919,891 | 2,405,209 |
Institutional Class | 12,154 | 17,336 |
Total | $ 3,106,863 | $ 2,570,905 |
Annual Report
Notes to Financial Statements - continued
10. Share Transactions.
Transactions for each class of shares were as follows:
| Shares | Dollars |
Years ended October 31, | 2013 | 2012 | 2013 | 2012 |
Class A | | | | |
Shares sold | 1,327,321 | 272,417 | $ 15,043,376 | $ 2,571,605 |
Reinvestment of distributions | 17,701 | 22,132 | 165,861 | 206,271 |
Shares redeemed | (655,691) | (659,149) | (7,373,829) | (6,253,228) |
Net increase (decrease) | 689,331 | (364,600) | $ 7,835,408 | $ (3,475,352) |
Class T | | | | |
Shares sold | 195,003 | 61,409 | $ 2,164,942 | $ 587,072 |
Reinvestment of distributions | 6,834 | 7,853 | 64,034 | 73,111 |
Shares redeemed | (178,171) | (133,261) | (1,988,129) | (1,264,265) |
Net increase (decrease) | 23,666 | (63,999) | $ 240,847 | $ (604,082) |
Class B | | | | |
Shares sold | 14,757 | 6,716 | $ 173,151 | $ 66,720 |
Reinvestment of distributions | 463 | 1,058 | 4,366 | 9,881 |
Shares redeemed | (51,705) | (52,372) | (551,755) | (495,118) |
Net increase (decrease) | (36,485) | (44,598) | $ (374,238) | $ (418,517) |
Class C | | | | |
Shares sold | 526,927 | 108,642 | $ 5,994,932 | $ 1,051,805 |
Reinvestment of distributions | 5,172 | 7,654 | 48,618 | 71,333 |
Shares redeemed | (302,151) | (280,979) | (3,208,131) | (2,637,126) |
Net increase (decrease) | 229,948 | (164,683) | $ 2,835,419 | $ (1,513,988) |
Japan | | | | |
Shares sold | 14,062,957 | 2,737,496 | $ 157,503,214 | $ 26,290,775 |
Reinvestment of distributions | 872,770 | 1,014,920 | 8,177,855 | 9,459,053 |
Shares redeemed | (12,837,219) | (12,951,522) | (141,848,609) | (122,521,103) |
Net increase (decrease) | 2,098,508 | (9,199,106) | $ 23,832,460 | $ (86,771,275) |
Institutional Class | | | | |
Shares sold | 1,891,907 | 238,239 | $ 21,220,551 | $ 2,250,127 |
Reinvestment of distributions | 2,940 | 6,735 | 27,514 | 62,700 |
Shares redeemed | (387,518) | (369,198) | (4,437,952) | (3,505,242) |
Net increase (decrease) | 1,507,329 | (124,224) | $ 16,810,113 | $ (1,192,415) |
11. Other.
The Fund's organizational documents provide former and current trustees and officers with a limited indemnification against liabilities arising in connection with the performance of their duties to the Fund. In the normal course of business, the Fund may also enter into contracts that provide general indemnifications. The Fund's maximum exposure under these arrangements is unknown as this would be dependent on future claims that may be made against the Fund. The risk of material loss from such claims is considered remote.
At the end of the period, Strategic Advisers International Fund was the owner of record of approximately 37% of the total outstanding shares of the Fund. Mutual Funds managed by FMR or its affiliates were the owners of record, in the aggregate, of approximately 42% of the total outstanding shares of the Fund.
Annual Report
Report of Independent Registered Public Accounting Firm
To the Trustees of Fidelity Investment Trust and the Shareholders of Fidelity Japan Fund:
In our opinion, the accompanying statement of assets and liabilities, including the schedule of investments, and the related statements of operations and of changes in net assets and the financial highlights present fairly, in all material respects, the financial position of Fidelity Japan Fund (a fund of Fidelity Investment Trust) at October 31, 2013, the results of its operations for the year then ended, the changes in its net assets for each of the two years in the period then ended and the financial highlights for each of the five years in the period then ended, in conformity with accounting principles generally accepted in the United States of America. These financial statements and financial highlights (hereafter referred to as "financial statements") are the responsibility of the Fidelity Japan Fund's management. Our responsibility is to express an opinion on these financial statements based on our audits. We conducted our audits of these financial statements in accordance with the standards of the Public Company Accounting Oversight Board (United States). Those standards require that we plan and perform the audit to obtain reasonable assurance about whether the financial statements are free of material misstatement. An audit includes examining, on a test basis, evidence supporting the amounts and disclosures in the financial statements, assessing the accounting principles used and significant estimates made by management, and evaluating the overall financial statement presentation. We believe that our audits, which included confirmation of securities at October 31, 2013 by correspondence with the custodian and brokers, provide a reasonable basis for our opinion.
PricewaterhouseCoopers LLP
Boston, Massachusetts
December 16, 2013
Annual Report
The Trustees, Member of the Advisory Board, and executive officers of the trust and fund, as applicable, are listed below. The Board of Trustees governs the fund and is responsible for protecting the interests of shareholders. The Trustees are experienced executives who meet periodically throughout the year to oversee the fund's activities, review contractual arrangements with companies that provide services to the fund, oversee management of the risks associated with such activities and contractual arrangements, and review the fund's performance. Except for James C. Curvey, Ned C. Lautenbach, Ronald P. O'Hanley, and William S. Stavropoulos, each of the Trustees oversees 171 funds. Mr. Curvey oversees 394 funds. Mr. Lautenbach, Mr. O'Hanley, and Mr. Stavropoulos each oversees 245 funds.
The Trustees hold office without limit in time except that (a) any Trustee may resign; (b) any Trustee may be removed by written instrument, signed by at least two-thirds of the number of Trustees prior to such removal; (c) any Trustee who requests to be retired or who has become incapacitated by illness or injury may be retired by written instrument signed by a majority of the other Trustees; and (d) any Trustee may be removed at any special meeting of shareholders by a two-thirds vote of the outstanding voting securities of the trust. Each Trustee who is not an interested person of the trust and the fund (as defined in the 1940 Act) (Independent Trustee), shall retire not later than the last day of the calendar year in which his or her 75th birthday occurs. The Independent Trustees may waive this mandatory retirement age policy with respect to individual Trustees. The executive officers and Advisory Board Member hold office without limit in time, except that any officer and Advisory Board Member may resign or may be removed by a vote of a majority of the Trustees at any regular meeting or any special meeting of the Trustees. Except as indicated, each individual has held the office shown or other offices in the same company for the past five years.
Experience, Skills, Attributes, and Qualifications of the Fund's Trustees. The Governance and Nominating Committee has adopted a statement of policy that describes the experience, qualifications, attributes, and skills that are necessary and desirable for potential Independent Trustee candidates (Statement of Policy). The Board believes that each Trustee satisfied at the time he or she was initially elected or appointed a Trustee, and continues to satisfy, the standards contemplated by the Statement of Policy. The Governance and Nominating Committee also engages professional search firms to help identify potential Independent Trustee candidates who have the experience, qualifications, attributes, and skills consistent with the Statement of Policy. From time to time, additional criteria based on the composition and skills of the current Independent Trustees, as well as experience or skills that may be appropriate in light of future changes to board composition, business conditions, and regulatory or other developments, have also been considered by the professional search firms and the Governance and Nominating Committee. In addition, the Board takes into account the Trustees' commitment and participation in Board and committee meetings, as well as their leadership of standing and ad hoc committees throughout their tenure.
In determining that a particular Trustee was and continues to be qualified to serve as a Trustee, the Board has considered a variety of criteria, none of which, in isolation, was controlling. The Board believes that, collectively, the Trustees have balanced and diverse experience, qualifications, attributes, and skills, which allow the Board to operate effectively in governing the fund and protecting the interests of shareholders. Information about the specific experience, skills, attributes, and qualifications of each Trustee, which in each case led to the Board's conclusion that the Trustee should serve (or continue to serve) as a trustee of the fund, is provided below.
Board Structure and Oversight Function. James C. Curvey is an interested person (as defined in the 1940 Act) and currently serves as Chairman. The Trustees have determined that an interested Chairman is appropriate and benefits shareholders because an interested Chairman has a personal and professional stake in the quality and continuity of services provided to the fund. Independent Trustees exercise their informed business judgment to appoint an individual of their choosing to serve as Chairman, regardless of whether the Trustee happens to be independent or a member of management. The Independent Trustees have determined that they can act independently and effectively without having an Independent Trustee serve as Chairman and that a key structural component for assuring that they are in a position to do so is for the Independent Trustees to constitute a substantial majority for the Board. The Independent Trustees also regularly meet in executive session. Ned C. Lautenbach serves as Chairman of the Independent Trustees and as such (i) acts as a liaison between the Independent Trustees and management with respect to matters important to the Independent Trustees and (ii) with management prepares agendas for Board meetings.
Fidelity funds are overseen by different Boards of Trustees. The fund's Board oversees Fidelity's equity and high income funds and another Board oversees Fidelity's investment-grade bond, money market, and asset allocation funds. The asset allocation funds may invest in Fidelity funds overseen by the fund's Board. The use of separate Boards, each with its own committee structure, allows the Trustees of each group of Fidelity funds to focus on the unique issues of the funds they oversee, including common research, investment, and operational issues. On occasion, the separate Boards establish joint committees to address issues of overlapping consequences for the Fidelity funds overseen by each Board.
The Trustees operate using a system of committees to facilitate the timely and efficient consideration of all matters of importance to the Trustees, the fund, and fund shareholders and to facilitate compliance with legal and regulatory requirements and oversight of the fund's activities and associated risks. The Board, acting through its committees, has charged FMR and its affiliates with (i) identifying events or circumstances the occurrence of which could have demonstrably adverse effects on the fund's business and/or reputation; (ii) implementing processes and controls to lessen the possibility that such events or circumstances occur or to mitigate the effects of such events or circumstances if they do occur; and (iii) creating and maintaining a system designed to evaluate continuously business and market conditions in order to facilitate the identification and implementation processes described in (i) and (ii) above. Because the day-to-day operations and activities of the fund are carried out by or through FMR, its affiliates and other service providers, the fund's exposure to risks is mitigated but not eliminated by the processes overseen by the Trustees. While each of the Board's committees has responsibility for overseeing different aspects of the fund's activities, oversight is exercised primarily through the Operations, Audit, and Compliance Committees. In addition, the Independent Trustees have worked with FMR to enhance the Board's oversight of investment and financial risks, legal and regulatory risks, technology risks, and operational risks, including the development of additional risk reporting to the Board. For example, a working group comprised of Independent Trustees and FMR has worked and continues to work to review the Fidelity funds' valuation-related activities, reporting and risk management. Appropriate personnel, including but not limited to the fund's Chief Compliance Officer (CCO), FMR's internal auditor, the independent accountants, the fund's Treasurer and portfolio management personnel, make periodic reports to the Board's committees, as appropriate, including an annual review of FMR's risk management program for the Fidelity funds. The responsibilities of each standing committee, including their oversight responsibilities, are described further under "Standing Committees of the Fund's Trustees."
Annual Report
Trustees and Officers - continued
The fund's Statement of Additional Information (SAI) includes more information about the Trustees. To request a free copy, call Fidelity at 1-877-208-0098.
Interested Trustees*:
Correspondence intended for each Trustee who is an interested person may be sent to Fidelity Investments, 245 Summer Street, Boston, Massachusetts 02210.
Name, Year of Birth; Principal Occupations and Other Relevant Experience+ |
James C. Curvey (1935) |
Year of Election or Appointment: 2007 Trustee Chairman of the Board of Trustees |
| Mr. Curvey also serves as Trustee of other Fidelity funds. Mr. Curvey is a Director of Fidelity Investments Money Management, Inc. (2009-present), Director of Fidelity Research & Analysis Co. (2009-present) and Director of FMR and FMR Co., Inc. (2007-present). Mr. Curvey is also Vice Chairman (2007-present) and Director of FMR LLC. In addition, Mr. Curvey serves as an Overseer for the Boston Symphony Orchestra and a member of the Trustees of Villanova University. Previously, Mr. Curvey was the Vice Chairman (2006-2007) and Director (2000-2007) of FMR Corp. |
Ronald P. O'Hanley (1957) |
Year of Election or Appointment: 2011 Trustee |
| Mr. O'Hanley also serves as Trustee of other Fidelity funds. He is Director of Fidelity SelectCo, LLC (2013-present), FMR Co., Inc. (2010-present), Director of Fidelity Investments Money Management, Inc. (2010-present), Director of Fidelity Research & Analysis Company (2010-present), President of Fidelity Asset Management and Corporate Services and a Member of Fidelity's Executive Committee (2010-present). Previously, Mr. O'Hanley served as President and Chief Executive Officer of BNY Mellon Asset Management (2007-2010). Mr. O'Hanley also served as Vice Chairman of Bank New York Mellon Corp. and a member of that firm's Executive Committee. Prior to the 2007 merger of The Bank of New York and Mellon Financial Corporation, he was Vice Chairman of Mellon Financial Corporation and President and Chief Executive Officer of Mellon Asset Management. He joined Mellon in February 1997. Mr. O'Hanley currently serves as Chairman of the Boston Public Library Foundation Board of Directors and sits on the Board of Directors of Beth Israel Deaconess Medical Center, the Board of Trustees of the Marine Biological Laboratory and the Advisory Board of the Maxwell School of Citizenship and Public Administration at Syracuse University. Mr. O'Hanley also chairs the Council on Asset Management for the Financial Services Roundtable and is a member of the Board of Directors of Institutional Investor's U.S. Institute. |
* Trustees have been determined to be "Interested Trustees" by virtue of, among other things, their affiliation with the trust or various entities under common control with FMR.
+ The information above includes each Trustee's principal occupation during the last five years and other information relating to the experience, attributes, and skills relevant to each Trustee's qualifications to serve as a Trustee, which led to the conclusion that each Trustee should serve as a Trustee for the fund.
Annual Report
Independent Trustees:
Correspondence intended for each Independent Trustee (that is, the Trustees other than the Interested Trustees) may be sent to Fidelity Investments, P.O. Box 55235, Boston, Massachusetts 02205-5235.
Name, Year of Birth; Principal Occupations and Other Relevant Experience+ |
Dennis J. Dirks (1948) |
Year of Election or Appointment: 2005 Trustee |
| Mr. Dirks also serves as Trustee of other Fidelity funds. Prior to his retirement in May 2003, Mr. Dirks was Chief Operating Officer and a member of the Board of The Depository Trust & Clearing Corporation (DTCC). He also served as President, Chief Operating Officer, and Board member of The Depository Trust Company (DTC) and President and Board member of the National Securities Clearing Corporation (NSCC). In addition, Mr. Dirks served as Chief Executive Officer and Board member of the Government Securities Clearing Corporation, Chief Executive Officer and Board member of the Mortgage-Backed Securities Clearing Corporation, as a Trustee and a member of the Finance Committee of Manhattan College (2005-2008), and as a Trustee and a member of the Finance Committee of AHRC of Nassau County (2006-2008). Mr. Dirks is a member of the Independent Directors Council (IDC) Governing Council (2010-present) and Board of Directors for The Brookville Center for Children's Services, Inc. (2009-present). |
Alan J. Lacy (1953) |
Year of Election or Appointment: 2008 Trustee |
| Mr. Lacy also serves as Trustee of other Fidelity funds. Mr. Lacy serves as Senior Adviser (2007-present) of Oak Hill Capital Partners, L.P. (private equity). Mr. Lacy also served as Chief Executive Officer (2000-2005) and Vice Chairman (2005-2006) of Sears Holdings Corporation and Sears, Roebuck and Co. (retail). In addition, Mr. Lacy serves as a member of the Board of Directors of Dave & Buster's Entertainment, Inc. (restaurant and entertainment complexes, 2010-present), Earth Fare, Inc. (retail grocery, 2012-present), The Hillman Companies, Inc. (hardware wholesalers, 2010-present), and Bristol-Myers Squibb Company (global pharmaceuticals, 2008-present). Mr. Lacy is a member of the Board of Trustees of The National Parks Conservation Association (2006-present). Previously, Mr. Lacy served as Chairman of the Board of Trustees of the National Parks Conservation Association (2008-2011) and as a member of the Board of Directors for the Western Union Company (global money transfer, 2006-2011). |
Ned C. Lautenbach (1944) |
Year of Election or Appointment: 2000 Trustee Chairman of the Independent Trustees |
| Mr. Lautenbach also serves as Trustee of other Fidelity funds. Mr. Lautenbach currently serves as the Lead Director of the Eaton Corporation Board of Directors (diversified industrial, 1997-present). Mr. Lautenbach is Chairman of the Board of Directors of the Philharmonic Center for the Arts in Naples, Florida (2012-present) and a member of the Council on Foreign Relations (1994-present). Previously, Mr. Lautenbach was a Partner/Advisory Partner at Clayton, Dubilier & Rice, LLC (private equity investment, 1998-2010), as well as a Director of Sony Corporation (2006-2007). |
Joseph Mauriello (1944) |
Year of Election or Appointment: 2008 Trustee |
| Mr. Mauriello also serves as Trustee of other Fidelity funds. Prior to his retirement in January 2006, Mr. Mauriello served in numerous senior management positions including Deputy Chairman and Chief Operating Officer (2004-2005), and Vice Chairman of Financial Services (2002-2004) of KPMG LLP US (professional services, 1965-2005). Mr. Mauriello currently serves as a member of the Board of Directors of XL Group plc. (global insurance and re-insurance, 2006-present). Previously, Mr. Mauriello served as a Director of the Hamilton Funds of the Bank of New York (2006-2007) and of Arcadia Resources Inc. (health care services and products, 2007-2012). |
Robert W. Selander (1950) |
Year of Election or Appointment: 2011 Trustee |
| Mr. Selander also serves as Trustee of other Fidelity funds. Previously, Mr. Selander served as a Member of the Advisory Board of other Fidelity funds (2011), and Executive Vice Chairman (2010), Chief Executive Officer (2009-2010), and President and Chief Executive Officer (1997-2009) of Mastercard, Inc. |
Cornelia M. Small (1944) |
Year of Election or Appointment: 2005 Trustee |
| Ms. Small also serves as Trustee of other Fidelity funds. Ms. Small is a member of the Board of Directors (2009-present) and Chair of the Investment Committee (2010-present) of the Teagle Foundation. Ms. Small also serves on the Investment Committee of the Berkshire Taconic Community Foundation (2008-present). Previously, Ms. Small served as Chairperson (2002-2008) and a member of the Investment Committee and Chairperson (2008-2012) and a member of the Board of Trustees of Smith College. In addition, Ms. Small served as Chief Investment Officer, Director of Global Equity Investments, and a member of the Board of Directors of Scudder, Stevens & Clark and Scudder Kemper Investments. |
William S. Stavropoulos (1939) |
Year of Election or Appointment: 2001 Trustee Vice Chairman of the Independent Trustees |
| Mr. Stavropoulos also serves as Trustee of other Fidelity funds. Mr. Stavropoulos serves as President and Founder of the Michigan Baseball Foundation, the Great Lakes Loons (2007-present). Mr. Stavropoulos is Chairman Emeritus of the Board of Directors of The Dow Chemical Company, where he previously served in numerous senior management positions, including President, CEO (1995-2000; 2002-2004), Chairman of the Executive Committee (2000-2006), and as a member of the Board of Directors (1990-2006). Currently, Mr. Stavropoulos is Chairman of the Board of Directors of Univar Inc. (global distributor of commodity and specialty chemicals), a Director of Teradata Corporation (data warehousing and technology solutions), and Maersk Inc. (industrial conglomerate), and a member of the Advisory Board for Metalmark Capital LLC (private equity investment, 2005-present). Mr. Stavropoulos is an operating advisor to Clayton, Dubilier & Rice, LLC (private equity investment). In addition, Mr. Stavropoulos is a member of the University of Notre Dame Advisory Council for the College of Science, a Trustee of the Rollin L. Gerstacker Foundation, and a Director of the Naples Philharmonic Center for the Arts. Previously, Mr. Stavropoulos served as a Director of Chemical Financial Corporation (bank holding company, 1993-2012) and Tyco International, Ltd. (multinational manufacturing and services, 2007-2012). |
David M. Thomas (1949) |
Year of Election or Appointment: 2008 Trustee |
| Mr. Thomas also serves as Trustee of other Fidelity funds. Mr. Thomas serves as Non-Executive Chairman of the Board of Directors of Fortune Brands Home and Security (home and security products, 2011-present), and as a member of the Board of Directors of Interpublic Group of Companies, Inc. (marketing communication, 2004-present). Previously, Mr. Thomas served as Executive Chairman (2005-2006) and Chairman and Chief Executive Officer (2000-2005) of IMS Health, Inc. (pharmaceutical and healthcare information solutions), and a Director of Fortune Brands, Inc. (consumer products, 2000-2011). |
+ The information above includes each Trustee's principal occupation during the last five years and other information relating to the experience, attributes, and skills relevant to each Trustee's qualifications to serve as a Trustee, which led to the conclusion that each Trustee should serve as a Trustee for the fund.
Advisory Board Member and Executive Officers:
Correspondence intended for each executive officer and Peter S. Lynch may be sent to Fidelity Investments, 245 Summer Street, Boston, Massachusetts 02210. Executive officers appear below in alphabetical order.
Name, Year of Birth; Principal Occupation |
Peter S. Lynch (1944) |
Year of Election or Appointment: 2003 Member of the Advisory Board |
| Mr. Lynch also serves as Member of the Advisory Board of other Fidelity funds. Mr. Lynch is Vice Chairman and a Director of FMR and FMR Co., Inc. In addition, Mr. Lynch serves as a Trustee of Boston College and as the Chairman of the Inner-City Scholarship Fund. Previously, Mr. Lynch served on the Special Olympics International Board of Directors (1997-2006). |
Elizabeth Paige Baumann (1968) |
Year of Election or Appointment: 2012 Anti-Money Laundering (AML) Officer |
| Ms. Baumann also serves as AML Officer of other funds. She is Chief AML Officer of FMR LLC (2012-present) and is an employee of Fidelity Investments. Previously, Ms. Baumann served as Vice President and Deputy Anti-Money Laundering Officer (2007-2012). |
William C. Coffey (1969) |
Year of Election or Appointment: 2009 Assistant Secretary |
| Mr. Coffey also serves as Assistant Secretary of other funds. He is Senior Vice President and Deputy General Counsel of FMR LLC (2010-present), and is an employee of Fidelity Investments. Previously, Mr. Coffey served as Vice President and Associate General Counsel of FMR LLC (2005-2009). |
Jonathan Davis (1968) |
Year of Election or Appointment: 2010 Assistant Treasurer |
| Mr. Davis also serves as Assistant Treasurer of other funds. Mr. Davis is an employee of Fidelity Investments. Previously, Mr. Davis served as Vice President and Associate General Counsel of FMR LLC (2003-2010). |
Adrien E. Deberghes (1967) |
Year of Election or Appointment: 2008 Deputy Treasurer |
| Mr. Deberghes also serves as an officer of other funds. He is an employee of Fidelity Investments (2008-present). Prior to joining Fidelity Investments, Mr. Deberghes was Senior Vice President of Mutual Fund Administration at State Street Corporation (2007-2008), Senior Director of Mutual Fund Administration at Investors Bank & Trust (2005-2007), and Director of Finance for Dunkin' Brands (2000-2005). |
Stephanie J. Dorsey (1969) |
Year of Election or Appointment: 2010 Assistant Treasurer |
| Ms. Dorsey also serves as an officer of other funds. She is an employee of Fidelity Investments (2008-present) and has served in other fund officer roles. Prior to joining Fidelity Investments, Ms. Dorsey served as Treasurer (2004-2008) of the JPMorgan Mutual Funds and Vice President (2004-2008) of JPMorgan Chase Bank. |
Scott C. Goebel (1968) |
Year of Election or Appointment: 2008 Secretary and Chief Legal Officer (CLO) |
| Mr. Goebel serves as Secretary and CLO of other funds. Mr. Goebel also serves as Secretary of Fidelity Investments Money Management, Inc. (FIMM) (2010-present) and Fidelity Research and Analysis Company (FRAC) (2010-present); General Counsel, Secretary, and Senior Vice President of FMR (2008-present) and FMR Co., Inc. (2008-present); Chief Legal Officer of Fidelity Management & Research (Hong Kong) Limited (2008-present) and Assistant Secretary of Fidelity Management & Research (Japan) Inc. (2008-present), and Fidelity Management & Research (U.K.) Inc. (2008-present). Previously, Mr. Goebel served as Secretary and CLO of other Fidelity funds (2008-2013), Assistant Secretary of FIMM (2008-2010), FRAC (2008-2010), and certain funds (2007-2008); and as Vice President and Secretary of Fidelity Distributors Corporation (FDC) (2005-2007). Mr. Goebel has been employed by FMR LLC or an affiliate since 2001. |
Joseph A. Hanlon (1968) |
Year of Election or Appointment: 2012 Chief Compliance Officer |
| Mr. Hanlon also serves as Chief Compliance Officer of other funds. Mr. Hanlon serves as Compliance Officer of FMR, FMR Co., Inc., Fidelity Investments Money Management, Inc. (FIMM), Fidelity Research and Analysis Company (FRAC), and Fidelity Management & Research (Hong Kong) (2009-present), as Senior Vice President of the Fidelity Asset Management Division (2009-present), and is an employee of Fidelity Investments. Previously, Mr. Hanlon served as Compliance Officer of Fidelity Management & Research (Japan) Inc. (2009-2013), Strategic Advisers, Inc. (2009-2013), and Fidelity Management & Research (U.K.) Inc. (2009-2013). |
Bruce T. Herring (1965) |
Year of Election or Appointment: 2006 Vice President of certain Equity Funds |
| Mr. Herring also serves as Vice President of other funds. He serves as Chief Investment Officer of Fidelity Global Asset Allocation (GAA) (2013-present), Chief Investment Officer and Director of Fidelity Management & Research (U.K.) Inc. (2010-present), Group Chief Investment Officer of FMR, and President of Fidelity Research & Analysis Company (2010-present). Previously, Mr. Herring served as Vice President (2005-2006) and Senior Vice President (2006-2007) of Fidelity Management & Research Company, Vice President of FMR Co., Inc. (2001-2007), and as a portfolio manager for Fidelity U.S. Equity Funds. |
Brian B. Hogan (1964) |
Year of Election or Appointment: 2009 Vice President |
| Mr. Hogan also serves as Vice President of other funds. Mr. Hogan serves as President of FMR's Equity Division (2009-present). Previously, Mr. Hogan served as Senior Vice President, Equity Research of FMR (2006-2009) and as a portfolio manager. |
Chris Maher (1972) |
Year of Election or Appointment: 2013 Assistant Treasurer |
| Mr. Maher serves as Assistant Treasurer of other funds. Mr. Maher is Vice President of Valuation Oversight and is an employee of Fidelity Investments. Previously, Mr. Maher served as Vice President of Asset Management Compliance (2013), Vice President of FMR's Program Management Group (2010-2013), and Vice President of Valuation Oversight (2008-2010). |
Christine Reynolds (1958) |
Year of Election or Appointment: 2008 Chief Financial Officer |
| Ms. Reynolds also serves as Chief Financial Officer of other funds. Ms. Reynolds became President of Fidelity Pricing and Cash Management Services (FPCMS) in August 2008. Ms. Reynolds served as Chief Operating Officer of FPCMS (2007-2008). Previously, Ms. Reynolds served as President, Treasurer, and Anti-Money Laundering officer of the Fidelity funds (2004-2007). |
Kenneth B. Robins (1969) |
Year of Election or Appointment: 2008 President and Treasurer |
| Mr. Robins also serves as an officer of other funds. Mr. Robins serves as Executive Vice President of Fidelity Investments Money Management, Inc. (FIMM) (2013-present) and is an employee of Fidelity Investments (2004-present). Previously, Mr. Robins served in other fund officer roles. |
Gary W. Ryan (1958) |
Year of Election or Appointment: 2005 Assistant Treasurer |
| Mr. Ryan also serves as Assistant Treasurer of other funds. Mr. Ryan is an employee of Fidelity Investments and has served in other fund officer roles. Previously, Mr. Ryan served as Vice President of Fund Reporting in Fidelity Pricing and Cash Management Services (FPCMS) (1999-2005). |
Stephen Sadoski (1971) |
Year of Election or Appointment: 2012 Deputy Treasurer |
| Mr. Sadoski also serves as Deputy Treasurer of other funds. He is an employee of Fidelity Investments (2012-present) and has served in another fund officer role. Prior to joining Fidelity Investments, Mr. Sadoski served as an assistant chief accountant in the Division of Investment Management of the Securities and Exchange Commission (SEC) (2009-2012) and as a senior manager at Deloitte & Touche LLP (1997-2009). |
Stacie M. Smith (1974) |
Year of Election or Appointment: 2013 Deputy Treasurer |
| Ms. Smith also serves as an officer of other funds. She is an employee of Fidelity Investments (2009-present) and has served in other fund officer roles. Prior to joining Fidelity Investments, Ms. Smith served as Senior Audit Manager of Ernst & Young LLP (1996-2009). |
Renee Stagnone (1975) |
Year of Election or Appointment: 2013 Deputy Treasurer |
| Ms. Stagnone also serves as Deputy Treasurer of other funds. Ms. Stagnone is an employee of Fidelity Investments. |
Joseph F. Zambello (1957) |
Year of Election or Appointment: 2011 Deputy Treasurer |
| Mr. Zambello also serves as Deputy Treasurer of other funds. Mr. Zambello is an employee of Fidelity Investments. Previously, Mr. Zambello served as Vice President of FMR's Program Management Group (2009-2011) and Vice President of the Transfer Agent Oversight Group (2005-2009). |
Annual Report
The Board of Trustees of Fidelity Japan Fund voted to pay to shareholders of record at the opening of business on record date, the following distributions per share derived from capital gains realized from sales of portfolio securities, and dividends derived from net investment income:
| Pay Date | Record Date | Dividends | Capital Gains |
Institutional Class | 12/09/13 | 12/06/13 | $0.115 | $0.009 |
Institutional Class designates 100% of the dividends distributed during the fiscal year as amounts which may be taken into account as a dividend for the purposes of the maximum rate under section 1(h)(11) of the Internal Revenue Code.
The amounts per share which represent income derived from sources within, and taxes paid to, foreign countries or possessions of the United States are as follows:
| Pay Date | Income | Taxes |
Institutional Class | 12/10/12 | $0.110 | $0.0178 |
The fund will notify shareholders in January 2014 of amounts for use in preparing 2013 income tax returns.
Annual Report
Board Approval of Investment Advisory Contracts and Management Fees
Fidelity Japan Fund
Each year, the Board of Trustees, including the Independent Trustees (together, the Board), votes on the renewal of the management contract and sub-advisory agreements (together, the Advisory Contracts) for the fund. The Board, assisted by the advice of fund counsel and Independent Trustees' counsel, requests and considers a broad range of information relevant to the renewal of the Advisory Contracts throughout the year.
The Board meets regularly and, at each of its meetings, covers an extensive agenda of topics and materials and considers factors that are relevant to its annual consideration of the renewal of the fund's Advisory Contracts, including the services and support provided to the fund and its shareholders. The Board has established various standing committees, each composed of and chaired by Independent Trustees with varying backgrounds, to which the Board has assigned specific subject matter responsibilities in order to enhance effective decision-making by the Board. The Board, acting directly and through its Committees, requests and receives information concerning the annual consideration of the renewal of the fund's Advisory Contracts. The Board also meets as needed to consider matters specifically related to the Board's annual consideration of the renewal of Advisory Contracts. Members of the Board may also meet with trustees of other Fidelity funds through ad hoc joint committees to discuss certain matters relevant to the Fidelity funds.
At its July 2013 meeting, the Board, including the Independent Trustees, unanimously determined to renew the fund's Advisory Contracts. In reaching its determination, the Board considered all factors it believed relevant, including (i) the nature, extent, and quality of the services to be provided to the fund and its shareholders (including the investment performance of the fund); (ii) the competitiveness of the fund's management fee and total expense ratio relative to peer funds; (iii) the total costs of the services to be provided by and the profits to be realized by Fidelity from its relationship with the fund; (iv) the extent to which economies of scale exist and would be realized as the fund grows; and (v) whether fee levels reflect these economies of scale, if any, for the benefit of fund shareholders.
In considering whether to renew the Advisory Contracts for the fund, the Board reached a determination, with the assistance of fund counsel and Independent Trustees' counsel and through the exercise of its business judgment, that the renewal of the Advisory Contracts was in the best interests of the fund and its shareholders and that the compensation payable under the Advisory Contracts was fair and reasonable. The Board's decision to renew the Advisory Contracts was not based on any single factor, but rather was based on a comprehensive consideration of all the information provided to the Board at its meetings throughout the year. The Board, in reaching its determination to renew the Advisory Contracts, was aware that shareholders in the fund have a broad range of investment choices available to them, including a wide choice among mutual funds offered by Fidelity's competitors, and that the fund's shareholders, who have the opportunity to review and weigh the disclosure provided by the fund in its prospectus and other public disclosures, have chosen to invest in this fund, which is a part of the Fidelity family of funds.
Nature, Extent, and Quality of Services Provided. The Board considered the staffing within the investment adviser, Fidelity Management & Research Company (FMR), and the sub-advisers (together, the Investment Advisers) as it relates to the fund, including the backgrounds of the fund's investment personnel, and also considered the fund's investment objective, strategies, and related investment philosophy. The Independent Trustees also had discussions with senior management of Fidelity's investment operations and investment groups. The Board considered the structure of the portfolio manager compensation program and whether this structure provides appropriate incentives to act in the best interests of the fund.
Resources Dedicated to Investment Management and Support Services. The Board and the Fund Oversight and Research Committees reviewed the general qualifications and capabilities of the Investment Advisers' investment staff, including its size, education, experience, and resources, as well as the Investment Advisers' approach to recruiting, training, managing, and compensating investment personnel. The Board noted that FMR has continued to increase the resources devoted to non-U.S. offices, including expansion of Fidelity's global investment organization. The Board also noted that Fidelity's analysts have extensive resources, tools and capabilities that allow them to conduct sophisticated quantitative and fundamental analysis, as well as credit analysis of issuers, counterparties and guarantors. Further, the Board believes that Fidelity's investment professionals have sufficient access to global information and data so as to provide competitive investment results over time, and that those professionals also have access to sophisticated tools that permit them to assess portfolio construction and risk and performance attribution characteristics continuously, as well as to transmit new information and research conclusions rapidly around the world. Additionally, in its deliberations, the Board considered the Investment Advisers' trading and risk management capabilities and resources, which are an integral part of the investment management process.
Shareholder and Administrative Services. The Board considered (i) the nature, extent, quality, and cost of advisory, administrative, and shareholder services performed by the Investment Advisers and their affiliates under the Advisory Contracts and under separate agreements covering transfer agency, pricing and bookkeeping, and securities lending services for the fund; (ii) the nature and extent of the supervision of third party service providers, principally custodians and subcustodians; and (iii) the resources devoted to, and the record of compliance with, the fund's compliance policies and procedures. The Board also reviewed the allocation of fund brokerage, including allocations to brokers affiliated with the Investment Advisers, the use of brokerage commissions to pay fund expenses, and the use of "soft" commission dollars to pay for research services.
The Board noted that the growth of fund assets over time across the complex allows Fidelity to reinvest in the development of services designed to enhance the value or convenience of the Fidelity funds as investment vehicles. These services include 24-hour access to account information and market information through telephone representatives and over the Internet, investor education materials and asset allocation tools, and the expanded availability of Fidelity Investor Centers.
Annual Report
Board Approval of Investment Advisory Contracts and Management Fees - continued
Investment in a Large Fund Family. The Board considered the benefits to shareholders of investing in a Fidelity fund, including the benefits of investing in a fund that is part of a large family of funds offering a variety of investment disciplines and providing a large variety of mutual fund investor services. The Board noted that Fidelity had taken, or had made recommendations that resulted in the Fidelity funds taking, a number of actions over the previous year that benefited particular funds, including (i) continuing to dedicate additional resources to investment research and to the support of the senior management team that oversees asset management; (ii) persisting in efforts to enhance Fidelity's global research capabilities; (iii) launching new funds and making other enhancements to meet client needs for global and income-oriented solutions; (iv) continuing to launch dedicated lower cost underlying funds to meet portfolio construction needs related to expanding underlying fund options for Fidelity funds of funds, specifically for the Freedom Fund product lines; (v) rationalizing product lines and gaining increased efficiencies through the mergers of several funds into other funds; (vi) strengthening Fidelity's index fund offerings by reducing investment minimums and adopting or lowering existing expense caps for certain funds and classes; (vii) enhancing Global Asset Allocation product offerings by launching new funds and strategies, including "open architecture" target date funds that utilize affiliated and unaffiliated sub-advisers; (viii) modifying the eligibility criteria for Institutional Class shares of Advisor funds to increase their marketability to a portion of the defined contribution plan market; (ix) creating a new low-cost retirement share class for certain Advisor funds to appeal to large retirement plans; (x) transitioning the management of certain Fidelity commodity funds to Geode Capital Management LLC, a registered commodity pool operator, while retaining administrative responsibilities for the funds; (xi) reorganizing a number of funds; and (xii) taking steps toward establishing a new Fidelity adviser to manage sector-based funds and products.
Investment Performance. The Board considered whether the fund has operated in accordance with its investment objective, as well as its record of compliance with its investment restrictions and its performance history.
The Board took into account discussions with the Investment Advisers about fund investment performance that occur at Board meetings throughout the year. In this regard the Board noted that as part of regularly scheduled fund reviews and other reports to the Board on fund performance, the Board periodically considers annualized return information for the fund, for different time periods, measured against a securities market index ("benchmark index") and a peer group of mutual funds with similar objectives ("peer group"). In its evaluation of fund investment performance, the Board gave particular attention to information indicating changes in performance of certain Fidelity funds for specific time periods and the Investment Advisers' explanations for any overperformance or underperformance.
In addition to reviewing absolute and relative fund performance, the Independent Trustees periodically consider the appropriateness of fund performance metrics in evaluating the results achieved. In general, the Independent Trustees believe that fund performance should be evaluated based on net performance (after fees and expenses) of both the highest performing and lowest performing classes, where applicable, compared to appropriate benchmark indices, over appropriate time periods which may include full market cycles, and compared to peer groups, as applicable, over the same periods, taking into account relevant factors including the following: general market conditions; issuer-specific information; tactical opportunities for investment; and fund cash flows and other factors.
The Independent Trustees recognize that shareholders evaluate performance on a net basis over their own holding periods, for which one-, three-, and five-year periods are used as a proxy. For this reason, the performance information reviewed by the Board also included net cumulative calendar year total return information for the fund and an appropriate benchmark index and peer group for the most recent one-, three-, and five-year periods, as shown below. Returns are shown compared to the 25th percentile (top of box) and 75th percentile (bottom of box) of the peer universe.
Annual Report
Fidelity Japan Fund
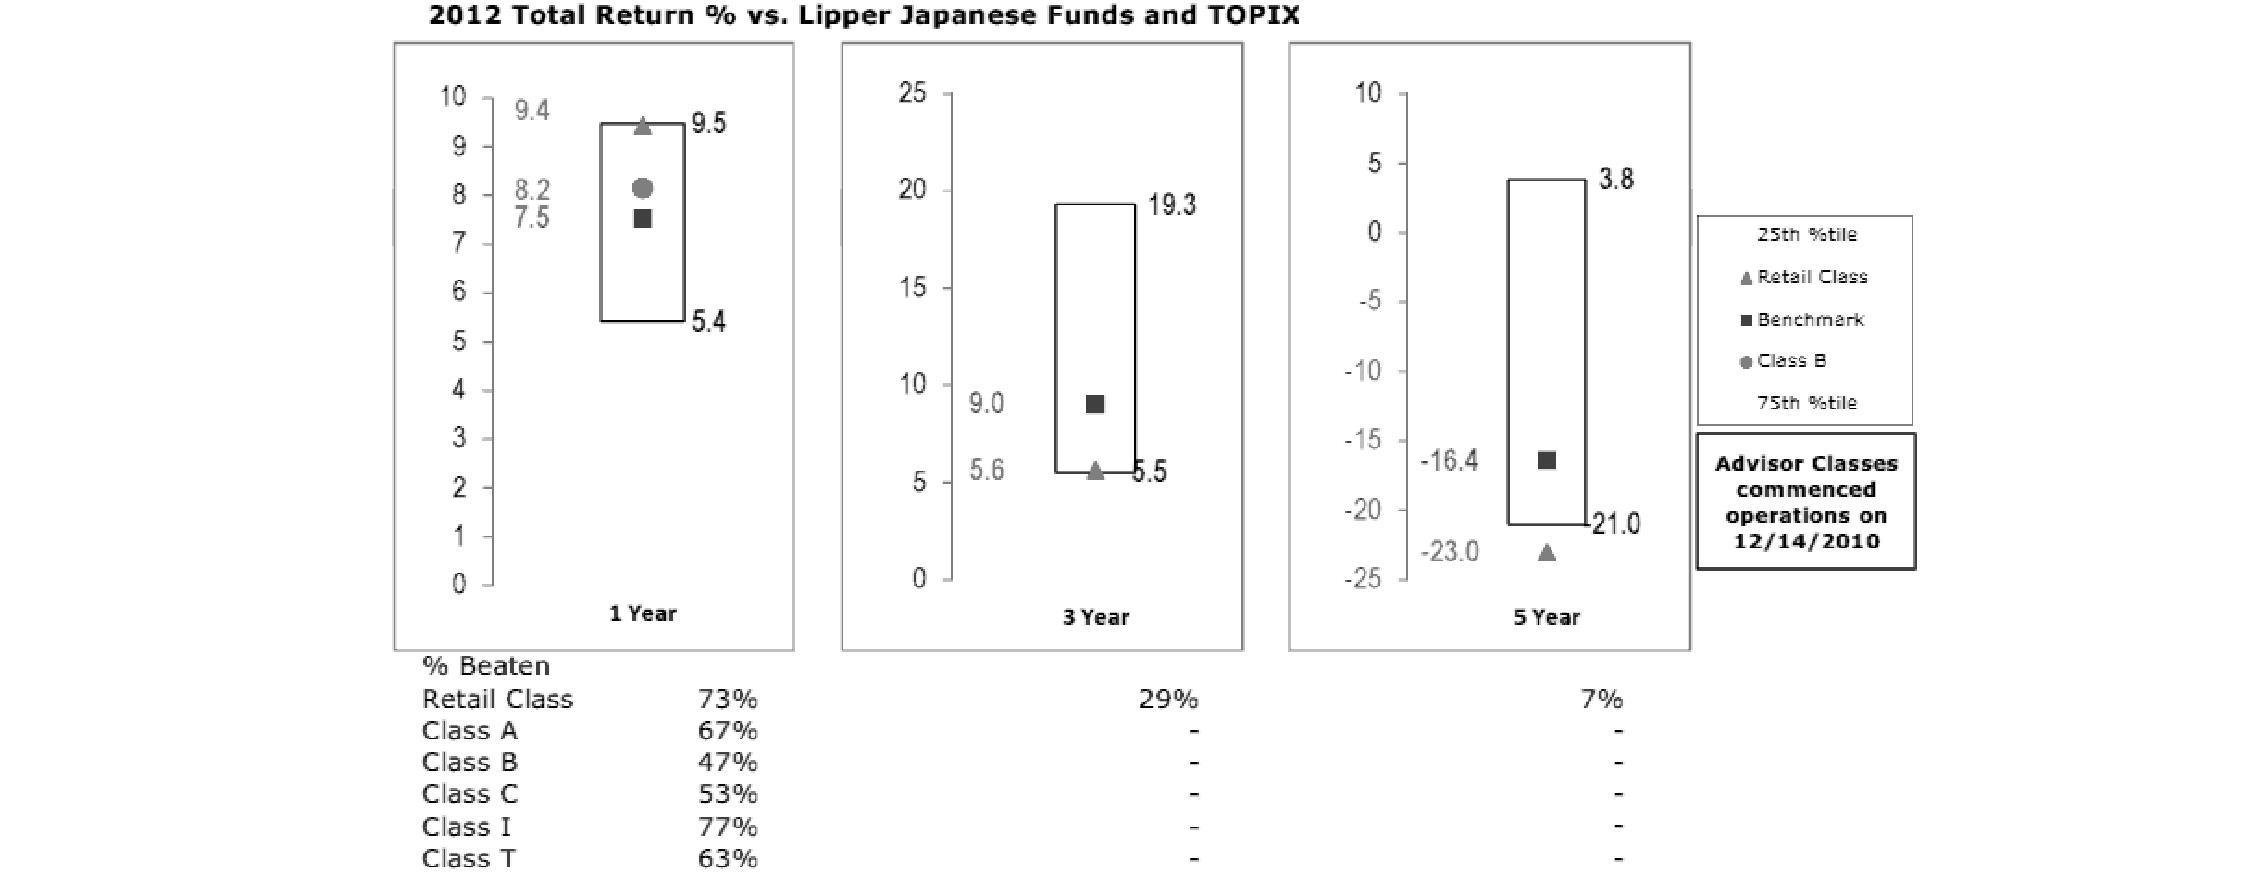
The Board also considered that the fund's management fee is subject to upward or downward adjustment depending upon whether, and to what extent, the fund's investment performance for the performance period exceeds, or is exceeded by, a securities index, thus leading to a performance adjustment for the same period. The Board noted that the performance adjustment provides FMR with a strong economic incentive to seek to achieve superior performance for the fund's shareholders and helps to more closely align the interests of FMR and the fund's shareholders.
Based on its review, the Board concluded that the nature, extent, and quality of services provided to the fund under the Advisory Contracts should benefit the fund's shareholders.
Competitiveness of Management Fee and Total Expense Ratio. The Board considered the fund's management fee and total expense ratio compared to "mapped groups" of competitive funds and classes. Fidelity creates "mapped groups" by combining similar Lipper investment objective categories that have comparable management fee characteristics. Combining Lipper investment objective categories aids the Board's management fee and total expense ratio comparisons by broadening the competitive group used for comparison and by reducing the number of universes to which various Fidelity funds are compared.
Management Fee. The Board considered two proprietary management fee comparisons for the 12-month periods shown in the chart below. The group of Lipper funds used by the Board for management fee comparisons is referred to below as the "Total Mapped Group." The Total Mapped Group is broader than the Lipper peer group used by the Board for performance comparisons because the Total Mapped Group combines several Lipper investment objective categories while the Lipper peer group does not. The Total Mapped Group comparison focuses on a fund's standing in terms of gross management fees before expense reimbursements or caps, and without giving effect to the fund's performance adjustment, relative to the total universe of funds with comparable investment mandates, regardless of whether their management fee structures also are comparable. Funds with comparable investment mandates offer exposure to similar types of securities. Funds with comparable management fee structures have similar management fee contractual arrangements (e.g., flat rate charged for advisory services, all-inclusive fee rate, etc.). "TMG %" represents the percentage of funds in the Total Mapped Group that had management fees that were lower than the fund's. For example, a TMG % of 16% means that 84% of the funds in the Total Mapped Group had higher management fees than the fund. The "Asset-Size Peer Group" (ASPG) comparison focuses on a fund's standing relative to a subset of non-Fidelity funds within the Total Mapped Group that are similar in size and management fee structure. The ASPG represents at least 15% of the funds in the Total Mapped Group with comparable asset size and management fee structures, subject to a minimum of 50 funds (or all funds in the Total Mapped Group if fewer than 50). Additional information, such as the ASPG quartile in which the fund's management fee ranked and the impact of the fund's performance adjustment, is also included in the chart and considered by the Board.
Annual Report
Board Approval of Investment Advisory Contracts and Management Fees - continued
Fidelity Japan Fund
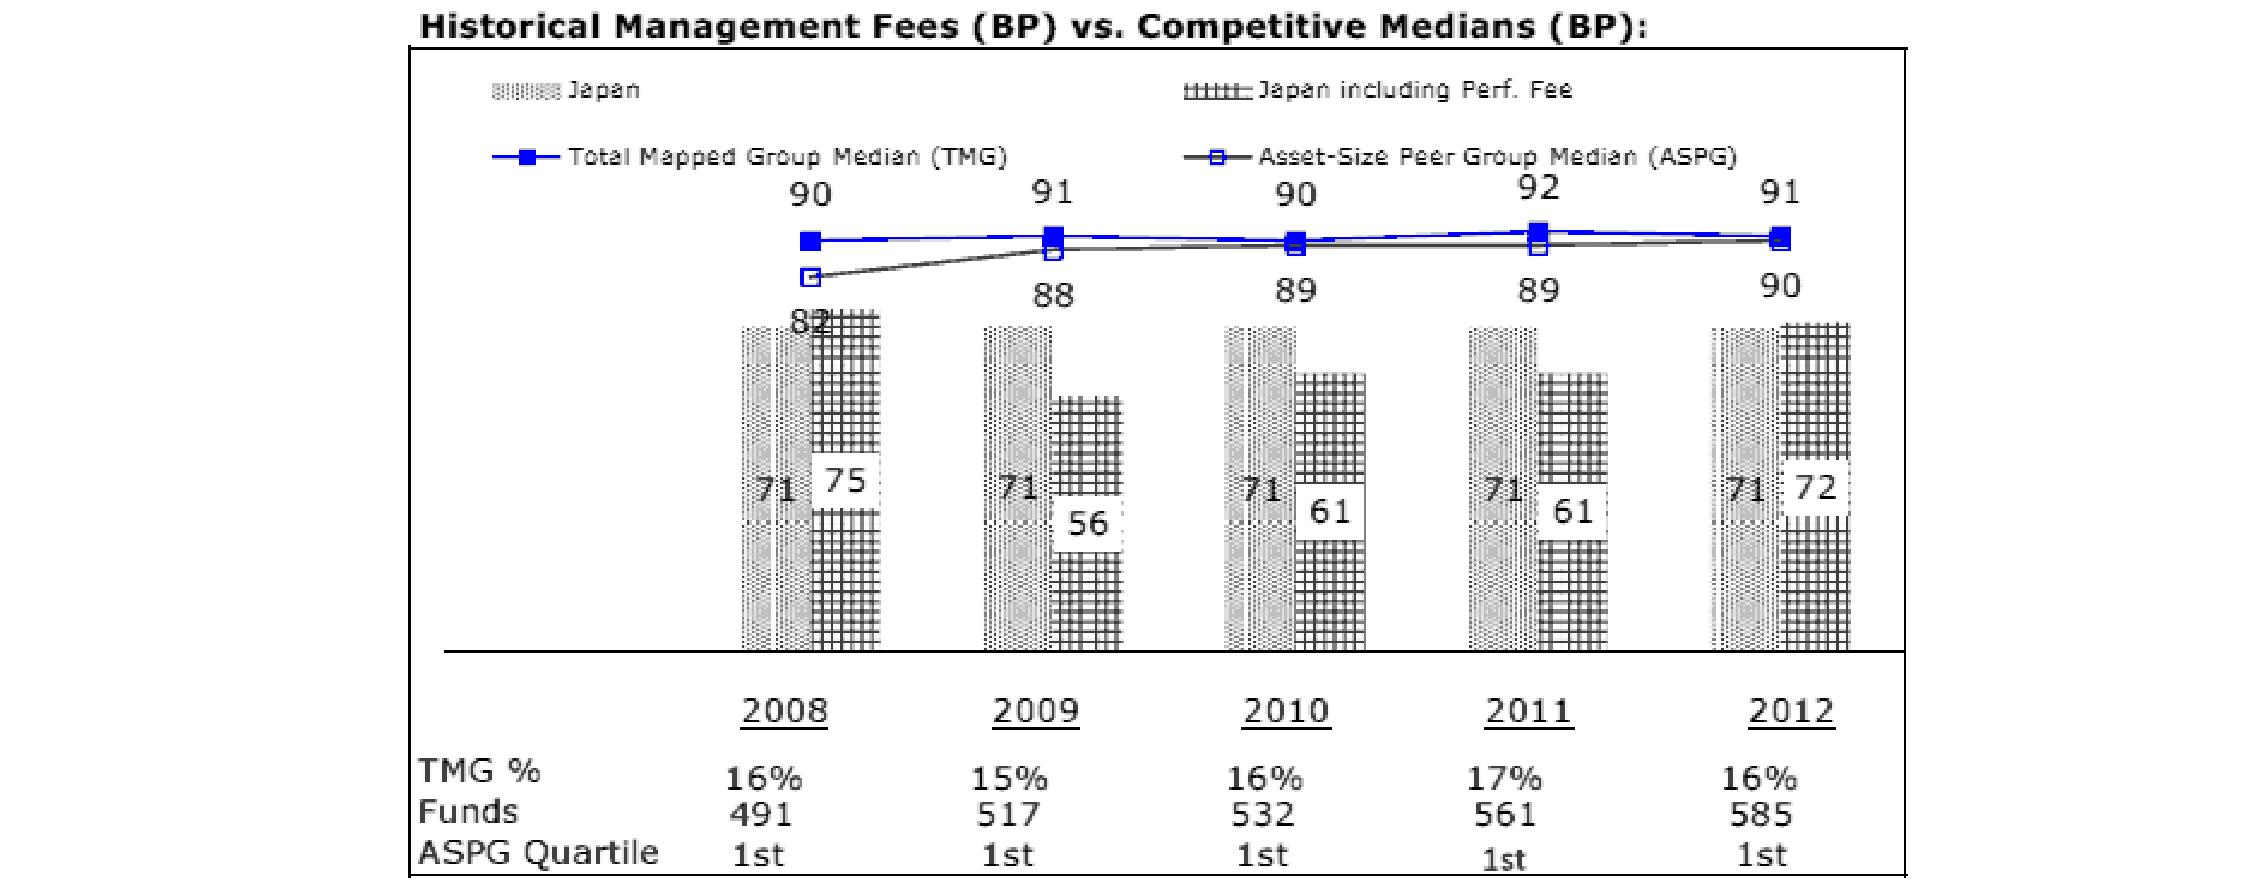
The Board noted that the fund's management fee ranked below the median of its Total Mapped Group and below the median of its ASPG for 2012. The Board also noted the effect of the fund's positive performance adjustment on the fund's management fee ranking.
Based on its review, the Board concluded that the fund's management fee is fair and reasonable in light of the services that the fund receives and the other factors considered.
Total Expense Ratio. In its review of each class's total expense ratio, the Board considered the fund's management fee as well as other fund or class expenses, as applicable, such as transfer agent fees, pricing and bookkeeping fees, fund-paid 12b-1 fees, and custodial, legal, and audit fees. The Board also noted the effects of any waivers and reimbursements on fees and expenses, as well as the impact of the fund's performance adjustment. As part of its review, the Board also considered the current and historical total expense ratios of each class of the fund compared to competitive fund median expenses. Each class of the fund is compared to those funds and classes in the Total Mapped Group (used by the Board for management fee comparisons) that have a similar sales load structure.
The Board noted that the total expense ratio of each of Class A, Class B, Class C, Institutional Class, and the retail class ranked below its competitive median for 2012 and the total expense ratio of Class T ranked above its competitive median for 2012. The Board considered that, in general, various factors can affect total expense ratios. The Board noted that the total expense ratio of Class T was above the competitive median primarily because of higher 12b-1 fees on Class T. Class T has a higher 12b-1 fee, but a lower front-end sales charge, than traditionally priced front-end sales charge classes. The Board considered that Class T is primarily sold load-waived in the retirement plan market where its 0.50% 12b-1 fee is comparable to competing no-load, higher 12b-1 fee classes designed specifically for retirement plans. The Board noted that the fund offers multiple classes, each of which has a different sales load and 12b-1 fee structure, and that the multiple structures are intended to offer a range of pricing options for the intermediary market. The Board also noted that the total expense ratios of the classes vary primarily by the level of their 12b-1 fees, although differences in transfer agent fees may also cause expenses to vary from class to class.
Fees Charged to Other Fidelity Clients. The Board also considered Fidelity fee structures and other information with respect to clients of FMR and its affiliates, such as other mutual funds advised or subadvised by FMR or its affiliates, pension plan clients, and other institutional clients. The Board noted the findings of the 2013 ad hoc joint committee (created with the board of other Fidelity funds), which reviewed and compared Fidelity's institutional investment advisory business with its business of providing services to the Fidelity funds, including the differences in services provided, fees charged, and costs incurred, as well as competition in their respective marketplaces.
Based on its review of total expense ratios and fees charged to other Fidelity clients, the Board concluded that the total expense ratio of each class of the fund was reasonable, although Class T was above the median of the universe presented for comparison, in light of the services that the fund and its shareholders receive and the other factors considered.
Costs of the Services and Profitability. The Board considered the revenues earned and the expenses incurred by Fidelity in conducting the business of developing, marketing, distributing, managing, administering and servicing the fund and servicing the fund's shareholders. The Board also considered the level of Fidelity's profits in respect of all the Fidelity funds.
Annual Report
On an annual basis, FMR presents to the Board Fidelity's profitability for the fund. Fidelity calculates the profitability for each fund, as well as aggregate profitability for groups of Fidelity funds and all Fidelity funds, using a series of detailed revenue and cost allocation methodologies which originate with the books and records of Fidelity on which Fidelity's audited financial statements are based. The Audit Committee of the Board reviews any significant changes from the prior year's methodologies.
PricewaterhouseCoopers LLP (PwC), independent registered public accounting firm and auditor to Fidelity and certain Fidelity funds, has been engaged annually by the Board as part of the Board's assessment of Fidelity's profitability analysis. PwC's engagement includes the review and assessment of the methodologies used by Fidelity in determining the revenues and expenses attributable to Fidelity's mutual fund business, and completion of agreed-upon procedures surrounding the mathematical accuracy of fund profitability and its conformity to allocation methodologies. After considering PwC's reports issued under the engagement and information provided by Fidelity, the Board concluded that while other allocation methods may also be reasonable, Fidelity's profitability methodologies are reasonable in all material respects.
The Board also reviewed Fidelity's non-fund businesses and fall-out benefits related to the mutual fund business as well as cases where Fidelity's affiliates may benefit from or be related to the fund's business.
The Board considered the costs of the services provided by and the profits realized by Fidelity in connection with the operation of the fund and was satisfied that the profitability was not excessive in the circumstances.
Economies of Scale. The Board considered whether there have been economies of scale in respect of the management of the Fidelity funds, whether the Fidelity funds (including the fund) have appropriately benefited from any such economies of scale, and whether there is potential for realization of any further economies of scale. The Board considered the extent to which the fund will benefit from economies of scale through increased services to the fund, through waivers or reimbursements, or through fee or expense reductions. The Board also noted that in 2009, it and the board of other Fidelity funds created an ad hoc committee (the Economies of Scale Committee) to analyze whether FMR attains economies of scale in respect of the management and servicing of the Fidelity funds, whether the Fidelity funds have appropriately benefited from such economies of scale, and whether there is potential for realization of any further economies of scale.
The Board recognized that the fund's management contract incorporates a "group fee" structure, which provides for lower group fee rates as total fund assets under FMR's management increase, and for higher group fee rates as total fund assets under FMR's management decrease. FMR calculates the group fee rates based on a tiered asset "breakpoint" schedule that varies based on asset class. The Board considered that the group fee is designed to deliver the benefits of economies of scale to fund shareholders when total Fidelity fund assets increase, even if assets of any particular fund are unchanged or have declined, because some portion of Fidelity's costs are attributable to services provided to all Fidelity funds, and all funds benefit if those costs can be allocated among more assets. The Board concluded that, given the group fee structure, fund shareholders will benefit from lower management fees as assets under FMR's management increase at the fund complex level, regardless of whether Fidelity achieves any such economies of scale.
The Board concluded, taking into account the analysis of the Economies of Scale Committee, that economies of scale, if any, are being appropriately shared between fund shareholders and Fidelity.
Amendment to Description of Group Fee Rate. At its July 2013 meeting, the Board voted to approve an amendment to the fund's management contract to modify the description of the "group fee rate" effective August 1, 2013. The Board noted that under the prior description in the contract, the group fee rate was based on the average net assets of all registered investment companies with which FMR has management contracts. Under the contract's tiered asset breakpoint schedule, the group fee rate is lower as total fund assets under FMR's management increase, and higher as total fund assets under FMR's management decrease. The Board considered that the prior description would have excluded the assets of 64 Fidelity sector funds from the group fee rate calculation once Fidelity SelectCo, LLC, an affiliate of FMR, assumed management responsibilities for those funds. The Board noted that modifying the description of the group fee rate to continue to include the assets of those 64 funds for purposes of determining group fee rate breakpoints would avoid an immediate adverse impact on the group fee rate for any fund.
Additional Information Requested by the Board. In order to develop fully the factual basis for consideration of the Fidelity funds' Advisory Contracts, the Board requested and received additional information on certain topics, including: (i) fund performance trends and Fidelity's long-term strategies for certain funds; (ii) the potential to further rationalize the Fidelity fund lineup with the possibility of achieving savings for the funds and Fidelity; (iii) the methodology with respect to competitive fund data and peer group classifications; (iv) the arrangements with, and performance of, certain sub-advisers on behalf of the Fidelity funds, as well as certain proposed participating affiliate arrangements; (v) the realization of fall-out benefits in certain Fidelity business units; (vi) Fidelity's group fee structures, including the rationale for the individual fee rates of certain categories of funds and the definition of group assets; (vii) trends regarding industry use of performance fee structures and the performance adjustment methodologies applicable to the Fidelity funds; (viii) additional competitive analysis regarding the total expenses for certain classes; and (ix) fund profitability methodology, including Fidelity's cost allocation methodology, and the impact of certain factors on fund profitability results.
Based on its evaluation of all of the conclusions noted above, and after considering all factors it believed relevant, the Board ultimately concluded that the advisory fee structures are fair and reasonable, and that the fund's Advisory Contracts should be renewed.
Annual Report
Investment Adviser
Fidelity Management & Research Company
Boston, MA
Investment Sub-Advisers
FMR Co., Inc.
Fidelity Management & Research
(U.K.) Inc.
Fidelity Management & Research
(Hong Kong) Limited
Fidelity Management & Research
(Japan) Inc.
FIL Investment Advisors
FIL Investments (Japan) Limited
FIL Investment Advisors (UK) Limited
General Distributor
Fidelity Distributors Corporation
Smithfield, RI
Transfer and Service Agents
Fidelity Investments Institutional Operations Company, Inc.
Boston, MA
Fidelity Service Company, Inc.
Boston, MA
Custodian
JPMorgan Chase Bank
New York, NY
(Fidelity Investment logo)(registered trademark)
Corporate Headquarters
245 Summer St., Boston, MA 02210
www.fidelity.com
AJPNI-UANN-1213
1.917380.102
Fidelity Advisor®
China Region Fund -
Class A, Class T, Class B, and Class C
Annual Report
October 31, 2013
Class A, Class T, Class B, and Class C are
classes of Fidelity® China Region Fund
(Fidelity Cover Art)
Contents
Performance | (Click Here) | How the fund has done over time. |
Management's Discussion of Fund Performance | (Click Here) | The Portfolio Manager's review of fund performance and strategy. |
Shareholder Expense Example | (Click Here) | An example of shareholder expenses. |
Investment Changes | (Click Here) | A summary of major shifts in the fund's investments over the past six months. |
Investments | (Click Here) | A complete list of the fund's investments with their market values. |
Financial Statements | (Click Here) | Statements of assets and liabilities, operations, and changes in net assets, as well as financial highlights. |
Notes | (Click Here) | Notes to the financial statements. |
Report of Independent Registered Public Accounting Firm | (Click Here) | |
Trustees and Officers | (Click Here) | |
Distributions | (Click Here) | |
Board Approval of Investment Advisory Contracts and Management Fees | (Click Here) | |
To view a fund's proxy voting guidelines and proxy voting record for the 12-month period ended June 30, visit http://www.fidelity.com/proxyvotingresults or visit the Securities and Exchange Commission's (SEC) web site at http://www.sec.gov. You may also call 1-877-208-0098 to request a free copy of the proxy voting guidelines.
Standard & Poor's, S&P and S&P 500 are registered service marks of The McGraw-Hill Companies, Inc. and have been licensed for use by Fidelity Distributors Corporation.
Other third-party marks appearing herein are the property of their respective owners.
All other marks appearing herein are registered or unregistered trademarks or service marks of FMR LLC or an affiliated company. © 2013 FMR LLC. All rights reserved.
This report and the financial statements contained herein are submitted for the general information of the shareholders of the fund. This report is not authorized for distribution to prospective investors in the fund unless preceded or accompanied by an effective prospectus.
A fund files its complete schedule of portfolio holdings with the SEC for the first and third quarters of each fiscal year on Form N-Q. Forms N-Q are available on the SEC's web site at http://www.sec.gov. A fund's Forms N-Q may be reviewed and copied at the SEC's Public Reference Room in Washington, DC. Information regarding the operation of the SEC's Public Reference Room may be obtained by calling 1-800-SEC-0330. For a complete list of a fund's portfolio holdings, view the most recent holdings listing, semiannual report, or annual report on Fidelity's web site at http://www.fidelity.com, http://www.advisor.fidelity.com, or http://www.401k.com, as applicable.
NOT FDIC INSURED • MAY LOSE VALUE • NO BANK GUARANTEE
Neither the fund nor Fidelity Distributors Corporation is a bank.
Annual Report
Performance: The Bottom Line
Average annual total return reflects the change in the value of an investment, assuming reinvestment of the class' distributions from dividend income and capital gains (the profits earned upon the sale of securities that have grown in value, if any) and assuming a constant rate of performance each year. The $10,000 table and the fund's returns do not reflect the deduction of taxes that a shareholder would pay on fund distributions or the redemption of fund shares. During periods of reimbursement by Fidelity, a fund's total return will be greater than it would be had the reimbursement not occurred. How a fund did yesterday is no guarantee of how it will do tomorrow.
Average Annual Total Returns
Periods ended October 31, 2013 | Past 1
year | Past 5
years | Past 10
years |
Class A (incl. 5.75% sales charge) A | 18.82% | 16.41% | 11.19% |
Class T (incl. 3.50% sales charge) B | 21.34% | 16.64% | 11.29% |
Class B (incl. contingent deferred sales charge) C | 20.12% | 16.69% | 11.39% |
Class C (incl. contingent deferred sales charge) D | 24.14% | 16.91% | 11.39% |
A Class A shares bear a 0.25% 12b-1 fee. The initial offering of Class A shares took place on May 9, 2008. Returns prior to May 9, 2008 are those of Fidelity® China Region Fund, the original class of the fund, which has no 12b-1 fee. Had Class A's 12b-1 fee been reflected, returns prior to May 9, 2008 would have been lower.
B Class T shares bear a 0.50% 12b-1 fee. The initial offering of Class T shares took place on May 9, 2008. Returns prior to May 9, 2008 are those of Fidelity China Region Fund, the original class of the fund, which has no 12b-1 fee. Had Class T's 12b-1 fee been reflected, returns prior to May 9, 2008 would have been lower.
C Class B shares bear a 1.00% 12b-1 fee. The initial offering of Class B shares took place on May 9, 2008. Returns prior to May 9, 2008 are those of Fidelity China Region Fund, the original class of the fund, which has no 12b-1 fee. Had Class B's 12b-1 fee been reflected, returns prior to May 9, 2008 would have been lower. Class B shares' contingent deferred sales charges included in the past one year, past five years, and past ten years total return figures are 5%, 2%, and 0% respectively.
D Class C shares bear a 1.00% 12b-1 fee. The initial offering of Class C shares took place on May 9, 2008. Returns prior to May 9, 2008 are those of Fidelity China Region Fund, the original class of the fund, which has no 12b-1 fee. Had Class C's 12b-1 fee been reflected, returns prior to May 9, 2008 would have been lower. Class C shares' contingent deferred sales charges included in the past one year, past five years, and past ten years total return figures are 1%, 0%, and 0%, respectively.
$10,000 Over 10 Years
Let's say hypothetically that $10,000 was invested in Fidelity Advisor® China Region Fund - Class A on October 31, 2003, and the current 5.75% sales charge was paid. The chart shows how the value of your investment would have changed, and also shows how the MSCI® Golden Dragon Index performed over the same period. See footnote A above for additional information regarding the performance of Class A.
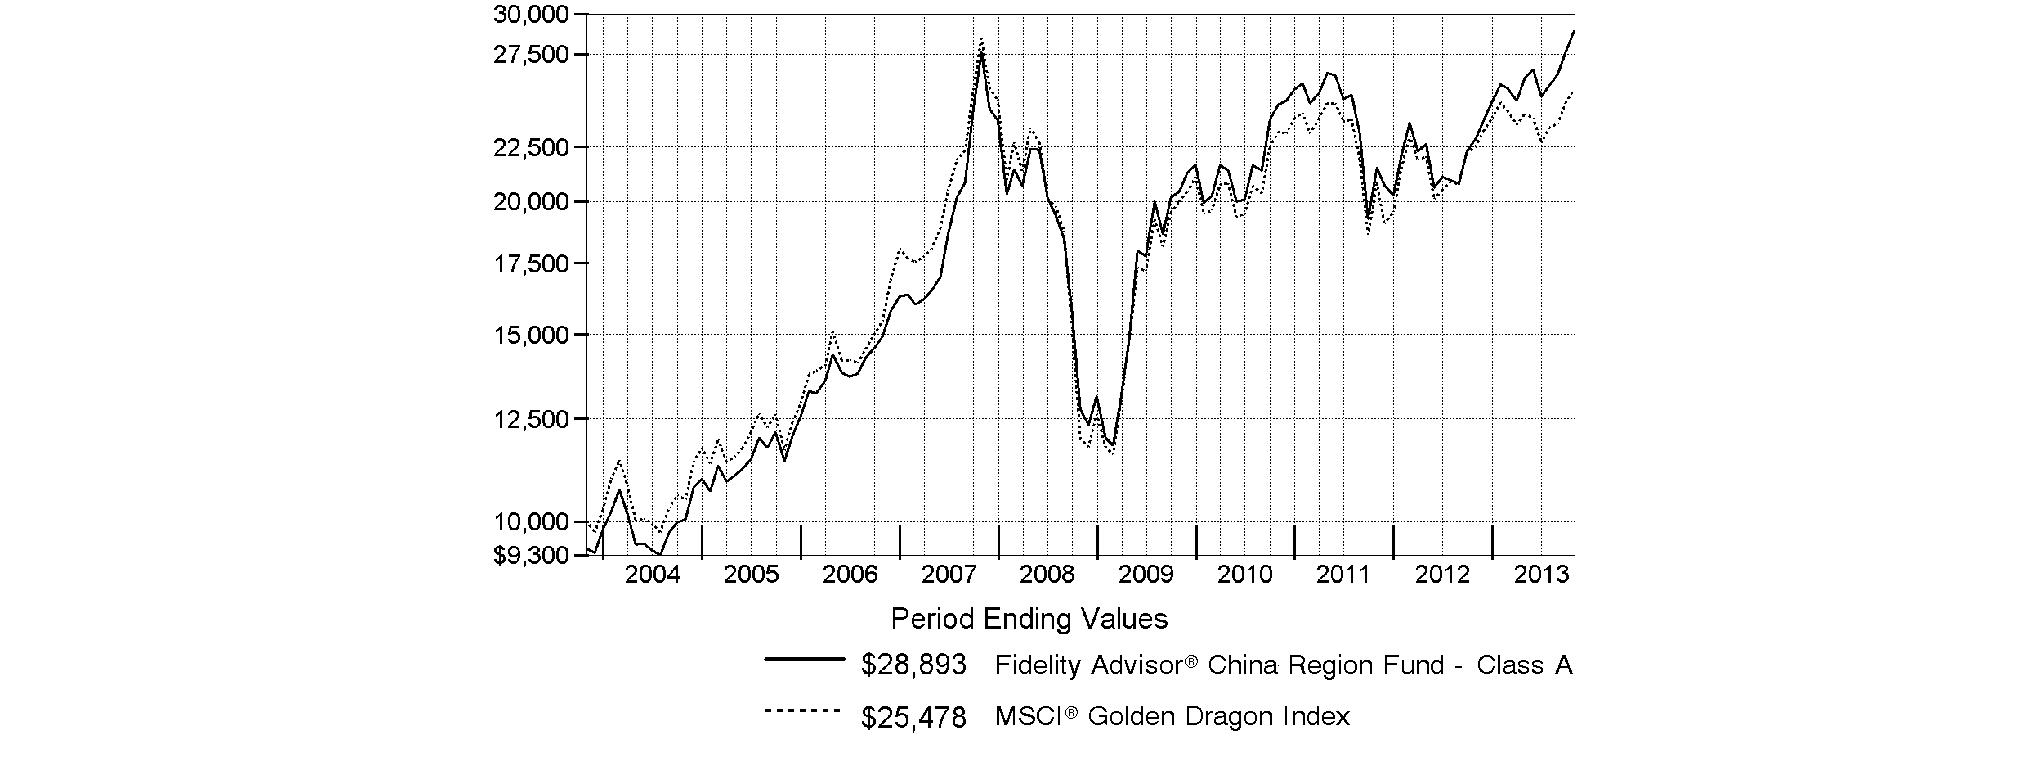
Annual Report
Market Recap: On balance, global equity markets remained upbeat for the 12-month period ending October 31, 2013. The MSCI® ACWI® (All Country World Index) Index gained 23.75% for the period, amid investor preference for higher-risk assets. The period was not without turbulence, however. In the spring and summer, central banks worldwide, especially in the U.S. and China, made clear their intentions to maintain accommodative monetary policies. That stance, combined with modest cyclical improvements around the globe and generally low valuations, underpinned the broad rally in equities. Europe (+32%) shone brightly, with most markets in the region - large and small - registering solid, index-beating gains. Another bright spot was Japan, which, despite a struggling yen and taking a second-half breather, posted a 34% result for the full year. The U.S. - by far the index's biggest constituent - also outperformed the global market with a roughly 28% advance. Meanwhile, Asia-Pacific ex Japan (+14%) lagged, hurt in part by a slowdown in Australia's mining industry as well as currency headwinds. Foreign-exchange and commodity weakness also curbed results in resource-heavy Canada and emerging markets (EM), both of which were up 7%. Country-level EM performance diverged meaningfully for the period, as evidenced by performance in Brazil (-1%), Russia (+12%), India (+1%) and China (+8%).
Comments from Robert Bao, Portfolio Manager of Fidelity Advisor® China Region Fund: For the year, the fund's Class A, Class T, Class B and Class C shares returned 26.07%, 25.74%, 25.12% and 25.14%, respectively (excluding sales charges), almost doubling the 13.27% gain of the MSCI® Golden Dragon Index. Consumer discretionary was a sector in which I significantly increased the fund's weighting during the period. Versus the index, this sector bolstered our results the most by a wide margin and accounted for the fund's three largest relative contributors. The top relative contributor was China-based automaker Chongqing Changan Automobile, a non-index position I added to the fund during the period. The company's joint venture with U.S.-based Ford Motor continued to move in the right direction. Other notable contributors were Taiwan-headquartered ECLAT Textile and Chinese Internet travel portal Ctrip.com International, the latter of which was not in the index and benefited from the surging popularity of online travel reservations in China. On the negative side, financials was the most noteworthy detractor, with stock picking in banks particularly problematic. At the stock level, the largest relative detractor was Spreadtrum Communications, a non-index semiconductor company located in China. The firm was pressured early in the period by greater competition, and with its growth prospects apparently deteriorating, I sold it in January. Also detracting was Chinese property developer Greenland Hong Kong Holdings, which changed its name from SPG Land in August 2013. This non-index stock faltered in part because of a delay in an expected capital injection from its parent company.
Note to shareholders: Fidelity Advisor China Region Fund may invest up to 35% of its total assets in any industry that represents more than 20% of the Hong Kong, Taiwanese and Chinese market. As of October 31, 2013, the fund did not have more than 25% of its total assets invested in any one industry.
The views expressed above reflect those of the portfolio manager(s) only through the end of the period as stated on the cover of this report and do not necessarily represent the views of Fidelity or any other person in the Fidelity organization. Any such views are subject to change at any time based upon market or other conditions and Fidelity disclaims any responsibility to update such views. These views may not be relied on as investment advice and, because investment decisions for a Fidelity fund are based on numerous factors, may not be relied on as an indication of trading intent on behalf of any Fidelity fund.
Annual Report
Fidelity China Region Fund
As a shareholder of the Fund, you incur two types of costs: (1) transaction costs, including sales charges (loads) on purchase payments or redemption proceeds, redemption fees and (2) ongoing costs, including management fees, distribution and/or service (12b-1) fees and other Fund expenses. This Example is intended to help you understand your ongoing costs (in dollars) of investing in the Fund and to compare these costs with the ongoing costs of investing in other mutual funds.
The Example is based on an investment of $1,000 invested at the beginning of the period and held for the entire period (May 1, 2013 to October 31, 2013).
Actual Expenses
The first line of the accompanying table for each class of the Fund provides information about actual account values and actual expenses. You may use the information in this line, together with the amount you invested, to estimate the expenses that you paid over the period. Simply divide your account value by $1,000.00 (for example, an $8,600 account value divided by $1,000.00 = 8.6), then multiply the result by the number in the first line for a class of the Fund under the heading entitled "Expenses Paid During Period" to estimate the expenses you paid on your account during this period. A small balance maintenance fee of $12.00 that is charged once a year may apply for certain accounts with a value of less than $2,000. This fee is not included in the table below. If it was, the estimate of expenses you paid during the period would be higher, and your ending account value lower, by this amount. In addition, the Fund, as a shareholder in the underlying Fidelity Central Funds, will indirectly bear its pro-rata share of the fees and expenses incurred by the underlying Fidelity Central Funds. These fees and expenses are not included in the Fund's annualized expense ratio used to calculate the expense estimate in the table below.
Hypothetical Example for Comparison Purposes
The second line of the accompanying table for each class of the Fund provides information about hypothetical account values and hypothetical expenses based on a Class' actual expense ratio and an assumed rate of return of 5% per year before expenses, which is not the Class' actual return. The hypothetical account values and expenses may not be used to estimate the actual ending account balance or expenses you paid for the period. You may use this information to compare the ongoing costs of investing in the Fund and other funds. To do so, compare this 5% hypothetical example with the 5% hypothetical examples that appear in the shareholder reports of the other funds. A small balance maintenance fee of $12.00 that is charged once a year may apply for certain accounts with a value of less than $2,000. This fee is not included in the table below. If it was, the estimate of expenses you paid during the period would be higher, and your ending account value lower, by this amount. In addition, the Fund, as a shareholder in the underlying Fidelity Central Funds, will indirectly bear its pro-rata share of the fees and expenses incurred by the underlying Fidelity Central Funds. These fees and expenses are not included in the Fund's annualized expense ratio used to calculate the expense estimate in the table below.
Please note that the expenses shown in the table are meant to highlight your ongoing costs only and do not reflect any transaction costs. Therefore, the second line of the table is useful in comparing ongoing costs only, and will not help you determine the relative total costs of owning different funds. In addition, if these transactional costs were included, your costs would have been higher.
| Annualized
Expense RatioB | Beginning
Account Value
May 1, 2013 | Ending
Account Value
October 31, 2013 | Expenses Paid
During Period*
May 1, 2013
to October 31, 2013 |
Class A | 1.34% | | | |
Actual | | $ 1,000.00 | $ 1,106.80 | $ 7.12 |
HypotheticalA | | $ 1,000.00 | $ 1,018.45 | $ 6.82 |
Class T | 1.64% | | | |
Actual | | $ 1,000.00 | $ 1,105.20 | $ 8.70 |
HypotheticalA | | $ 1,000.00 | $ 1,016.94 | $ 8.34 |
Class B | 2.09% | | | |
Actual | | $ 1,000.00 | $ 1,102.70 | $ 11.08 |
HypotheticalA | | $ 1,000.00 | $ 1,014.67 | $ 10.61 |
Class C | 2.09% | | | |
Actual | | $ 1,000.00 | $ 1,102.40 | $ 11.08 |
HypotheticalA | | $ 1,000.00 | $ 1,014.67 | $ 10.61 |
China Region | 1.01% | | | |
Actual | | $ 1,000.00 | $ 1,108.60 | $ 5.37 |
HypotheticalA | | $ 1,000.00 | $ 1,020.11 | $ 5.14 |
Institutional Class | .95% | | | |
Actual | | $ 1,000.00 | $ 1,108.90 | $ 5.05 |
HypotheticalA | | $ 1,000.00 | $ 1,020.42 | $ 4.84 |
A 5% return per year before expenses
B Annualized expense ratio reflects expenses net of applicable fee waivers.
* Expenses are equal to each Class' annualized expense ratio, multiplied by the average account value over the period, multiplied by 184/365 (to reflect the one-half year period).
Annual Report
Fidelity China Region Fund
Investment Changes (Unaudited)
Geographic Diversification (% of fund's net assets) |
As of October 31, 2013 |
 | Cayman Islands | 24.1% | |
 | China | 20.9% | |
 | Hong Kong | 16.7% | |
 | Taiwan | 14.8% | |
 | Bermuda | 10.6% | |
 | United States of America* | 6.9% | |
 | Japan | 2.1% | |
 | Korea (South) | 1.7% | |
 | Italy | 1.5% | |
 | Other | 0.7% | |

* Includes Short-Term Investments and Net Other Assets (Liabilities). |
Percentages are based on country or territory of incorporation and are adjusted for the effect of futures contracts, if applicable. |
As of April 30, 2013 |
| Hong Kong | 24.3% | |
| China | 23.8% | |
| Cayman Islands | 20.9% | |
| Taiwan | 19.2% | |
| Bermuda | 6.8% | |
| Korea (South) | 1.3% | |
| United States of America* | 1.2% | |
| Italy | 1.0% | |
| Thailand | 0.6% | |
| Other | 0.9% | |

* Includes Short-Term Investments and Net Other Assets (Liabilities). |
Percentages are based on country or territory of incorporation and are adjusted for the effect of futures contracts, if applicable. |
Asset Allocation as of October 31, 2013 |
| % of fund's
net assets | % of fund's net assets
6 months ago |
Stocks | 95.3 | 99.3 |
Short-Term Investments and Net Other Assets (Liabilities) | 4.7 | 0.7 |
Top Ten Stocks as of October 31, 2013 |
| % of fund's
net assets | % of fund's net assets
6 months ago |
Tencent Holdings Ltd. (Internet Software & Services) | 6.8 | 4.4 |
Taiwan Semiconductor Manufacturing Co. Ltd. (Semiconductors & Semiconductor Equipment) | 5.7 | 5.7 |
AIA Group Ltd. (Insurance) | 5.1 | 4.8 |
Industrial & Commercial Bank of China Ltd. (H Shares) (Commercial Banks) | 3.7 | 4.0 |
China Construction Bank Corp. (H Shares) (Commercial Banks) | 3.7 | 3.9 |
Chongqing Changan Automobile Co. Ltd. (B Shares) (Automobiles) | 3.0 | 2.3 |
Summit Ascent Holdings Ltd. (Trading Companies & Distributors) | 2.5 | 0.0 |
Sinopec Kantons Holdings Ltd. (Oil, Gas & Consumable Fuels) | 2.3 | 1.4 |
Galaxy Entertainment Group Ltd. (Hotels, Restaurants & Leisure) | 1.7 | 1.3 |
Brilliance China Automotive Holdings Ltd. (Automobiles) | 1.7 | 0.5 |
| 36.2 | |
Market Sectors as of October 31, 2013 |
| % of fund's
net assets | % of fund's net assets
6 months ago |
Consumer Discretionary | 25.7 | 21.7 |
Information Technology | 24.8 | 21.5 |
Financials | 21.8 | 32.1 |
Industrials | 7.6 | 7.3 |
Materials | 3.9 | 5.2 |
Energy | 3.2 | 3.0 |
Health Care | 3.1 | 2.1 |
Utilities | 3.0 | 3.9 |
Telecommunication Services | 1.6 | 2.1 |
Consumer Staples | 0.6 | 0.4 |
Annual Report
Fidelity China Region Fund
Investments October 31, 2013
Showing Percentage of Net Assets
Common Stocks - 95.3% |
| Shares | | Value |
CONSUMER DISCRETIONARY - 25.7% |
Automobiles - 7.2% |
Brilliance China Automotive Holdings Ltd. | 14,164,000 | | $ 24,772,841 |
Chongqing Changan Automobile Co. Ltd. (B Shares) | 24,223,686 | | 44,679,312 |
Geely Automobile Holdings Ltd. | 25,170,000 | | 12,693,757 |
Great Wall Motor Co. Ltd. (H Shares) | 1,600,000 | | 9,400,232 |
Guangzhou Automobile Group Co. Ltd. (H Shares) | 12,000,000 | | 14,239,649 |
| | 105,785,791 |
Hotels, Restaurants & Leisure - 6.9% |
Galaxy Entertainment Group Ltd. (a) | 3,451,000 | | 25,750,077 |
Hotel Shilla Co. | 132,714 | | 8,565,982 |
Melco International Development Ltd. | 7,009,000 | | 22,013,304 |
Melco Crown Entertainment Ltd. sponsored ADR (a) | 403,400 | | 13,376,744 |
Sands China Ltd. | 3,241,800 | | 23,039,234 |
Shangri-La Asia Ltd. | 5,000,000 | | 9,157,745 |
| | 101,903,086 |
Household Durables - 1.3% |
Techtronic Industries Co. Ltd. | 7,728,000 | | 19,437,121 |
Internet & Catalog Retail - 1.0% |
Ctrip.com International Ltd. sponsored ADR (a) | 260,916 | | 14,154,693 |
Leisure Equipment & Products - 1.2% |
Goodbaby International Holdings Ltd. | 16,000,000 | | 7,904,037 |
Merida Industry Co. Ltd. | 1,309,450 | | 9,920,413 |
| | 17,824,450 |
Media - 1.4% |
ChinaVision Media Group Ltd. (a) | 110,780,000 | | 6,787,115 |
Fuji Media Holdings, Inc. | 350,000 | | 6,977,377 |
SinoMedia Holding Ltd. | 8,000,000 | | 7,450,019 |
| | 21,214,511 |
Multiline Retail - 1.6% |
Lifestyle International Holdings Ltd. | 3,953,500 | | 8,617,845 |
Springland International Holdings Ltd. | 25,897,000 | | 14,196,085 |
| | 22,813,930 |
Specialty Retail - 2.0% |
Baoxin Auto Group Ltd. (d) | 21,494,000 | | 22,151,046 |
Oriental Watch Holdings Ltd. | 23,466,000 | | 7,506,214 |
| | 29,657,260 |
Textiles, Apparel & Luxury Goods - 3.1% |
ECLAT Textile Co. Ltd. | 1,486,140 | | 16,333,151 |
Prada SpA | 2,299,200 | | 22,419,647 |
Shenzhou International Group Holdings Ltd. | 2,046,000 | | 7,046,072 |
| | 45,798,870 |
TOTAL CONSUMER DISCRETIONARY | | 378,589,712 |
|
| Shares | | Value |
CONSUMER STAPLES - 0.6% |
Food Products - 0.6% |
China Mengniu Dairy Co. Ltd. | 2,000,000 | | $ 8,796,595 |
ENERGY - 3.2% |
Energy Equipment & Services - 0.9% |
China Oilfield Services Ltd. (H Shares) | 3,520,000 | | 9,852,186 |
Hilong Holding Ltd. | 5,400,000 | | 3,593,964 |
| | 13,446,150 |
Oil, Gas & Consumable Fuels - 2.3% |
Sinopec Kantons Holdings Ltd. (d) | 37,162,000 | | 33,888,216 |
TOTAL ENERGY | | 47,334,366 |
FINANCIALS - 21.8% |
Capital Markets - 0.1% |
SAIC Motor Corp. Ltd. Class A (UBS Warrant Programme) warrants 9/16/14 (a) | 798,200 | | 1,878,118 |
Commercial Banks - 9.4% |
BOC Hong Kong (Holdings) Ltd. | 7,402,000 | | 24,154,598 |
China Construction Bank Corp. (H Shares) | 69,778,000 | | 54,180,776 |
Industrial & Commercial Bank of China Ltd. (H Shares) | 78,024,000 | | 54,645,985 |
SAIC Motor Corp. Ltd. Class A (BNP Paribas Warrant Program) warrants 8/5/15 (a) | 2,201,800 | | 5,180,706 |
| | 138,162,065 |
Insurance - 6.6% |
AIA Group Ltd. | 14,982,600 | | 76,043,507 |
China Pacific Insurance Group Co. Ltd. (H Shares) | 5,999,200 | | 21,666,142 |
| | 97,709,649 |
Real Estate Investment Trusts - 0.5% |
Champion (REIT) | 15,000,000 | | 6,694,183 |
Real Estate Management & Development - 5.2% |
CSI Properties Ltd. | 144,620,000 | | 5,036,425 |
Great Eagle Holdings Ltd. | 2,150,000 | | 7,653,811 |
Greenland Hong Kong Holdings Ltd. | 15,000,000 | | 10,602,347 |
Greentown China Holdings Ltd. | 4,400,000 | | 8,546,885 |
Hopson Development Holdings Ltd. (a) | 14,240,000 | | 17,503,831 |
Lifestyle Property Development Ltd. | 197,675 | | 40,030 |
Shimao Property Holdings Ltd. | 3,908,500 | | 9,840,567 |
Sun Hung Kai Properties Ltd. | 1,282,000 | | 16,800,103 |
| | 76,023,999 |
TOTAL FINANCIALS | | 320,468,014 |
HEALTH CARE - 3.1% |
Health Care Equipment & Supplies - 0.4% |
Pacific Hospital Supply Co. Ltd. | 1,300,000 | | 4,836,079 |
Common Stocks - continued |
| Shares | | Value |
HEALTH CARE - continued |
Pharmaceuticals - 2.7% |
China Pharmaceutical Group Ltd. | 30,500,000 | | $ 19,001,032 |
Lee's Pharmaceutical Holdings Ltd. | 8,290,000 | | 7,688,005 |
Tong Ren Tang Technologies Co. Ltd. (H Shares) (d) | 4,351,000 | | 13,188,250 |
| | 39,877,287 |
TOTAL HEALTH CARE | | 44,713,366 |
INDUSTRIALS - 7.6% |
Commercial Services & Supplies - 0.6% |
Cleanaway Co. Ltd. | 1,409,000 | | 8,807,746 |
Construction & Engineering - 1.2% |
China State Construction International Holdings Ltd. | 10,482,000 | | 17,657,026 |
Machinery - 0.7% |
Cimc Enric Holdings Ltd. | 7,400,000 | | 10,422,804 |
Marine - 1.7% |
China Shipping Development Co. Ltd. (H Shares) (a) | 31,444,000 | | 17,804,612 |
Orient Overseas International Ltd. | 1,506,500 | | 7,782,191 |
| | 25,586,803 |
Road & Rail - 0.1% |
PT Express Transindo Utama Tbk | 10,253,000 | | 1,364,331 |
Trading Companies & Distributors - 2.8% |
Shanghai Waigaoqiao Free Trade Zone Development Co. Ltd. (B Shares) | 1,762,725 | | 3,587,145 |
Summit Ascent Holdings Ltd. (a) | 24,986,000 | | 37,255,019 |
| | 40,842,164 |
Transportation Infrastructure - 0.5% |
Airports of Thailand PCL (For. Reg.) | 1,041,000 | | 7,090,506 |
TOTAL INDUSTRIALS | | 111,771,380 |
INFORMATION TECHNOLOGY - 24.8% |
Communications Equipment - 0.9% |
KMC Kuei Meng International, Inc. | 3,075,000 | | 13,580,771 |
Computers & Peripherals - 3.1% |
Advantech Co. Ltd. | 2,854,000 | | 18,276,847 |
Lenovo Group Ltd. | 18,902,000 | | 20,235,599 |
LITE-ON Technology Corp. | 4,144,537 | | 7,237,275 |
| | 45,749,721 |
Electronic Equipment & Components - 0.2% |
Tong Hsing Electronics Industries Ltd. | 666,000 | | 3,518,362 |
Internet Software & Services - 10.7% |
58.com, Inc. ADR | 7,300 | | 176,076 |
|
| Shares | | Value |
NHN Corp. | 30,000 | | $ 16,875,841 |
Sohu.com, Inc. (a)(d) | 325,000 | | 21,762,000 |
Tencent Holdings Ltd. | 1,827,200 | | 99,738,299 |
Yahoo!, Inc. (a) | 300,000 | | 9,879,000 |
Youku Tudou, Inc. ADR (a)(d) | 300,000 | | 8,172,000 |
| | 156,603,216 |
Semiconductors & Semiconductor Equipment - 9.3% |
Chipbond Technology Corp. | 6,011,000 | | 12,130,233 |
GCL-Poly Energy Holdings Ltd. (a) | 26,000,000 | | 7,981,427 |
Inotera Memories, Inc. (a) | 16,657,000 | | 10,723,633 |
MediaTek, Inc. | 816,000 | | 11,144,284 |
Novatek Microelectronics Corp. | 2,674,000 | | 10,583,353 |
Taiwan Semiconductor Manufacturing Co. Ltd. | 22,911,796 | | 84,283,698 |
| | 136,846,628 |
Software - 0.6% |
Forgame Holdings Ltd. | 1,086,700 | | 8,970,566 |
TOTAL INFORMATION TECHNOLOGY | | 365,269,264 |
MATERIALS - 3.9% |
Chemicals - 0.5% |
Taiwan Fertilizer Co. Ltd. | 3,015,000 | | 7,170,036 |
Construction Materials - 1.9% |
Anhui Conch Cement Co. Ltd. (H Shares) | 6,898,000 | | 24,066,929 |
Asia Cement (China) Holdings Corp. | 6,409,500 | | 3,505,260 |
| | 27,572,189 |
Containers & Packaging - 0.8% |
Greatview Aseptic Pack Co. Ltd. | 19,157,000 | | 12,058,063 |
Paper & Forest Products - 0.7% |
Lee & Man Paper Manufacturing Ltd. | 15,012,000 | | 10,765,732 |
TOTAL MATERIALS | | 57,566,020 |
TELECOMMUNICATION SERVICES - 1.6% |
Wireless Telecommunication Services - 1.6% |
SoftBank Corp. | 316,000 | | 23,598,535 |
UTILITIES - 3.0% |
Electric Utilities - 0.7% |
Power Assets Holdings Ltd. | 1,173,500 | | 9,777,905 |
Independent Power Producers & Energy Traders - 2.3% |
Beijing Jingneng Clean Energy Co. Ltd. (H Shares) | 27,500,000 | | 11,421,385 |
China Longyuan Power Grid Corp. Ltd. (H Shares) | 8,487,000 | | 9,753,537 |
Huadian Fuxin Energy Corp. Ltd. | 43,672,000 | | 13,462,670 |
| | 34,637,592 |
TOTAL UTILITIES | | 44,415,497 |
TOTAL COMMON STOCKS (Cost $1,030,690,335) |
1,402,522,749
|
Money Market Funds - 6.6% |
| Shares | | Value |
Fidelity Cash Central Fund, 0.09% (b) | 62,559,358 | | $ 62,559,358 |
Fidelity Securities Lending Cash Central Fund, 0.09% (b)(c) | 33,705,375 | | 33,705,375 |
TOTAL MONEY MARKET FUNDS (Cost $96,264,733) |
96,264,733
|
TOTAL INVESTMENT PORTFOLIO - 101.9% (Cost $1,126,955,068) | | 1,498,787,482 |
NET OTHER ASSETS (LIABILITIES) - (1.9)% | | (27,714,773) |
NET ASSETS - 100% | $ 1,471,072,709 |
Legend |
(a) Non-income producing |
(b) Affiliated fund that is generally available only to investment companies and other accounts managed by Fidelity Investments. The rate quoted is the annualized seven-day yield of the fund at period end. A complete unaudited listing of the fund's holdings as of its most recent quarter end is available upon request. In addition, each Fidelity Central Fund's financial statements, which are not covered by the Fund's Report of Independent Registered Public Accounting Firm, are available on the SEC's website or upon request. |
(c) Investment made with cash collateral received from securities on loan. |
(d) Security or a portion of the security is on loan at period end. |
Affiliated Central Funds |
Information regarding fiscal year to date income earned by the Fund from investments in Fidelity Central Funds is as follows: |
Fund | Income earned |
Fidelity Cash Central Fund | $ 52,688 |
Fidelity Securities Lending Cash Central Fund | 104,014 |
Total | $ 156,702 |
Other Information |
The following is a summary of the inputs used, as of October 31, 2013, involving the Fund's assets and liabilities carried at fair value. The inputs or methodology used for valuing securities may not be an indication of the risk associated with investing in those securities. For more information on valuation inputs, and their aggregation into the levels used in the table below, please refer to the Investment Valuation section in the accompanying Notes to Financial Statements. |
Valuation Inputs at Reporting Date: |
Description | Total | Level 1 | Level 2 | Level 3 |
Investments in Securities: | | | | |
Equities: | | | | |
Consumer Discretionary | $ 378,589,712 | $ 371,612,335 | $ 6,977,377 | $ - |
Consumer Staples | 8,796,595 | 8,796,595 | - | - |
Energy | 47,334,366 | 47,334,366 | - | - |
Financials | 320,468,014 | 313,409,190 | 7,058,824 | - |
Health Care | 44,713,366 | 44,713,366 | - | - |
Industrials | 111,771,380 | 111,771,380 | - | - |
Information Technology | 365,269,264 | 280,985,566 | 84,283,698 | - |
Materials | 57,566,020 | 57,566,020 | - | - |
Telecommunication Services | 23,598,535 | - | 23,598,535 | - |
Utilities | 44,415,497 | 44,415,497 | - | - |
Money Market Funds | 96,264,733 | 96,264,733 | - | - |
Total Investments in Securities: | $ 1,498,787,482 | $ 1,376,869,048 | $ 121,918,434 | $ - |
See accompanying notes which are an integral part of the financial statements.
Annual Report
Fidelity China Region Fund
Statement of Assets and Liabilities
| October 31, 2013 |
| | |
Assets | | |
Investment in securities, at value (including securities loaned of $32,990,653) - See accompanying schedule: Unaffiliated issuers (cost $1,030,690,335) | $ 1,402,522,749 | |
Fidelity Central Funds (cost $96,264,733) | 96,264,733 | |
Total Investments (cost $1,126,955,068) | | $ 1,498,787,482 |
Foreign currency held at value (cost $642,377) | | 642,196 |
Receivable for investments sold | | 7,139,250 |
Receivable for fund shares sold | | 1,079,646 |
Dividends receivable | | 145,217 |
Distributions receivable from Fidelity Central Funds | | 18,788 |
Prepaid expenses | | 4,105 |
Other receivables | | 202,494 |
Total assets | | 1,508,019,178 |
| | |
Liabilities | | |
Payable for investments purchased | $ 124,100 | |
Payable for fund shares redeemed | 1,709,290 | |
Accrued management fee | 854,776 | |
Distribution and service plan fees payable | 13,438 | |
Other affiliated payables | 298,538 | |
Other payables and accrued expenses | 240,952 | |
Collateral on securities loaned, at value | 33,705,375 | |
Total liabilities | | 36,946,469 |
| | |
Net Assets | | $ 1,471,072,709 |
Net Assets consist of: | | |
Paid in capital | | $ 953,599,430 |
Undistributed net investment income | | 15,463,609 |
Accumulated undistributed net realized gain (loss) on investments and foreign currency transactions | | 130,182,313 |
Net unrealized appreciation (depreciation) on investments and assets and liabilities in foreign currencies | | 371,827,357 |
Net Assets | | $ 1,471,072,709 |
Statement of Assets and Liabilities - continued
| October 31, 2013 |
| | |
Calculation of Maximum Offering Price Class A:
Net Asset Value and redemption price per share ($20,622,669 ÷ 579,951 shares) | | $ 35.56 |
| | |
Maximum offering price per share (100/94.25 of $35.56) | | $ 37.73 |
Class T:
Net Asset Value and redemption price per share ($5,964,876 ÷ 168,514 shares) | | $ 35.40 |
| | |
Maximum offering price per share (100/96.50 of $35.40) | | $ 36.68 |
Class B:
Net Asset Value and offering price per share ($1,494,199 ÷ 42,544 shares)A | | $ 35.12 |
| | |
Class C:
Net Asset Value and offering price per share ($6,956,980 ÷ 198,810 shares)A | | $ 34.99 |
| | |
China Region:
Net Asset Value, offering price and redemption price per share ($1,425,828,353 ÷ 39,795,030 shares) | | $ 35.83 |
| | |
Institutional Class:
Net Asset Value, offering price and redemption price per share ($10,205,632 ÷ 285,481 shares) | | $ 35.75 |
A Redemption price per share is equal to net asset value less any applicable contingent deferred sales charge.
See accompanying notes which are an integral part of the financial statements.
Annual Report
Statement of Operations
| Year ended October 31, 2013 |
| | |
Investment Income | | |
Dividends | | $ 34,175,261 |
Interest | | 33 |
Income from Fidelity Central Funds | | 156,702 |
Income before foreign taxes withheld | | 34,331,996 |
Less foreign taxes withheld | | (2,083,075) |
Total income | | 32,248,921 |
| | |
Expenses | | |
Management fee | $ 10,087,253 | |
Transfer agent fees | 3,112,421 | |
Distribution and service plan fees | 144,087 | |
Accounting and security lending fees | 647,972 | |
Custodian fees and expenses | 548,229 | |
Independent trustees' compensation | 8,224 | |
Registration fees | 103,330 | |
Audit | 73,742 | |
Legal | 3,695 | |
Interest | 515 | |
Miscellaneous | 11,843 | |
Total expenses before reductions | 14,741,311 | |
Expense reductions | (531,119) | 14,210,192 |
Net investment income (loss) | | 18,038,729 |
Realized and Unrealized Gain (Loss) Net realized gain (loss) on: | | |
Investment securities: | | |
Unaffiliated issuers | 182,788,330 | |
Foreign currency transactions | (157,631) | |
Total net realized gain (loss) | | 182,630,699 |
Change in net unrealized appreciation (depreciation) on: Investment securities | 120,644,687 | |
Assets and liabilities in foreign currencies | (5,059) | |
Total change in net unrealized appreciation (depreciation) | | 120,639,628 |
Net gain (loss) | | 303,270,327 |
Net increase (decrease) in net assets resulting from operations | | $ 321,309,056 |
Statement of Changes in Net Assets
| Year ended
October 31,
2013 | Year ended
October 31,
2012 |
Increase (Decrease) in Net Assets | | |
Operations | | |
Net investment income (loss) | $ 18,038,729 | $ 22,782,166 |
Net realized gain (loss) | 182,630,699 | (16,515,956) |
Change in net unrealized appreciation (depreciation) | 120,639,628 | 76,673,702 |
Net increase (decrease) in net assets resulting from operations | 321,309,056 | 82,939,912 |
Distributions to shareholders from net investment income | (19,616,401) | (15,687,379) |
Distributions to shareholders from net realized gain | - | (18,721,345) |
Total distributions | (19,616,401) | (34,408,724) |
Share transactions - net increase (decrease) | (122,395,498) | (301,570,428) |
Redemption fees | 393,175 | 184,146 |
Total increase (decrease) in net assets | 179,690,332 | (252,855,094) |
| | |
Net Assets | | |
Beginning of period | 1,291,382,377 | 1,544,237,471 |
End of period (including undistributed net investment income of $15,463,609 and undistributed net investment income of $19,540,796, respectively) | $ 1,471,072,709 | $ 1,291,382,377 |
See accompanying notes which are an integral part of the financial statements.
Annual Report
Financial Highlights - Class A
Years ended October 31, | 2013 | 2012 | 2011 | 2010 | 2009 |
Selected Per-Share Data | | | | | |
Net asset value, beginning of period | $ 28.53 | $ 27.28 | $ 31.61 | $ 26.47 | $ 16.67 |
Income from Investment Operations | | | | | |
Net investment income (loss) C | .30 | .36 | .33 | .25 | .30 |
Net realized and unrealized gain (loss) | 7.06 | 1.42 | (4.33) | 5.15 | 9.63 |
Total from investment operations | 7.36 | 1.78 | (4.00) | 5.40 | 9.93 |
Distributions from net investment income | (.34) | (.19) | (.31) | (.20) | (.16) |
Distributions from net realized gain | - | (.34) | (.03) | (.07) | - |
Total distributions | (.34) | (.53) | (.34) | (.27) | (.16) |
Redemption fees added to paid in capital C | .01 | - G | .01 | .01 | .03 |
Net asset value, end of period | $ 35.56 | $ 28.53 | $ 27.28 | $ 31.61 | $ 26.47 |
Total Return A, B | 26.07% | 6.70% | (12.79)% | 20.54% | 60.41% |
Ratios to Average Net Assets D, F | | | | | |
Expenses before reductions | 1.35% | 1.36% | 1.37% | 1.38% | 1.39% |
Expenses net of fee waivers, if any | 1.35% | 1.36% | 1.37% | 1.38% | 1.39% |
Expenses net of all reductions | 1.31% | 1.29% | 1.31% | 1.31% | 1.31% |
Net investment income (loss) | .94% | 1.35% | 1.07% | .91% | 1.27% |
Supplemental Data | | | | | |
Net assets, end of period (000 omitted) | $ 20,623 | $ 13,539 | $ 14,808 | $ 16,047 | $ 11,842 |
Portfolio turnover rate E | 92% | 107% | 87% | 57% | 88% |
ATotal returns would have been lower if certain expenses had not been reduced during the applicable periods shown. BTotal returns do not include the effect of the sales charges. CCalculated based on average shares outstanding during the period. DFees and expenses of any underlying Fidelity Central Funds are not included in the Fund's expense ratio. The Fund indirectly bears its proportionate share of the expenses of any underlying Fidelity Central Funds. EAmount does not include the portfolio activity of any underlying Fidelity Central Funds. FExpense ratios reflect operating expenses of the class. Expenses before reductions do not reflect amounts reimbursed by the investment adviser or reductions from brokerage service arrangements or reductions from other expense offset arrangements and do not represent the amount paid by the class during periods when reimbursements or reductions occur. Expenses net of fee waivers reflect expenses after reimbursement by the investment adviser but prior to reductions from brokerage service arrangements or other expense offset arrangements. Expenses net of all reductions represent the net expenses paid by the class. GAmount represents less than $.01 per share. |
Financial Highlights - Class T
Years ended October 31, | 2013 | 2012 | 2011 | 2010 | 2009 |
Selected Per-Share Data | | | | | |
Net asset value, beginning of period | $ 28.40 | $ 27.13 | $ 31.48 | $ 26.40 | $ 16.65 |
Income from Investment Operations | | | | | |
Net investment income (loss) C | .21 | .29 | .25 | .18 | .23 |
Net realized and unrealized gain (loss) | 7.04 | 1.40 | (4.32) | 5.13 | 9.64 |
Total from investment operations | 7.25 | 1.69 | (4.07) | 5.31 | 9.87 |
Distributions from net investment income | (.26) | (.08) | (.27) | (.18) | (.14) |
Distributions from net realized gain | - | (.34) | (.03) | (.07) | - |
Total distributions | (.26) | (.42) | (.29) H | (.24) I | (.14) |
Redemption fees added to paid in capital C | .01 | - G | .01 | .01 | .02 |
Net asset value, end of period | $ 35.40 | $ 28.40 | $ 27.13 | $ 31.48 | $ 26.40 |
Total Return A, B | 25.74% | 6.38% | (13.04)% | 20.27% | 59.92% |
Ratios to Average Net Assets D, F | | | | | |
Expenses before reductions | 1.64% | 1.64% | 1.63% | 1.64% | 1.66% |
Expenses net of fee waivers, if any | 1.64% | 1.64% | 1.63% | 1.64% | 1.66% |
Expenses net of all reductions | 1.60% | 1.57% | 1.57% | 1.58% | 1.58% |
Net investment income (loss) | .65% | 1.06% | .81% | .64% | 1.00% |
Supplemental Data | | | | | |
Net assets, end of period (000 omitted) | $ 5,965 | $ 4,349 | $ 5,281 | $ 6,070 | $ 3,139 |
Portfolio turnover rate E | 92% | 107% | 87% | 57% | 88% |
ATotal returns would have been lower if certain expenses had not been reduced during the applicable periods shown. BTotal returns do not include the effect of the sales charges. CCalculated based on average shares outstanding during the period. DFees and expenses of any underlying Fidelity Central Funds are not included in the Fund's expense ratio. The Fund indirectly bears its proportionate share of the expenses of any underlying Fidelity Central Funds. EAmount does not include the portfolio activity of any underlying Fidelity Central Funds. FExpense ratios reflect operating expenses of the class. Expenses before reductions do not reflect amounts reimbursed by the investment adviser or reductions from brokerage service arrangements or reductions from other expense offset arrangements and do not represent the amount paid by the class during periods when reimbursements or reductions occur. Expenses net of fee waivers reflect expenses after reimbursement by the investment adviser but prior to reductions from brokerage service arrangements or other expense offset arrangements. Expenses net of all reductions represent the net expenses paid by the class. GAmount represents less than $.01 per share. HTotal distributions of $.29 per share is comprised of distributions from net investment income of $.268 and distributions from net realized gain of $.025 per share. ITotal distributions of $.24 per share is comprised of distributions from net investment income of $.177 and distributions from net realized gain of $.065 per share. |
See accompanying notes which are an integral part of the financial statements.
Annual Report
Financial Highlights - Class B
Years ended October 31, | 2013 | 2012 | 2011 | 2010 | 2009 |
Selected Per-Share Data | | | | | |
Net asset value, beginning of period | $ 28.16 | $ 26.94 | $ 31.23 | $ 26.28 | $ 16.61 |
Income from Investment Operations | | | | | |
Net investment income (loss) C | .06 | .16 | .10 | .04 | .12 |
Net realized and unrealized gain (loss) | 6.99 | 1.40 | (4.29) | 5.09 | 9.63 |
Total from investment operations | 7.05 | 1.56 | (4.19) | 5.13 | 9.75 |
Distributions from net investment income | (.10) | - | (.08) | (.12) | (.10) |
Distributions from net realized gain | - | (.34) | (.03) | (.07) | - |
Total distributions | (.10) | (.34) | (.11) | (.19) | (.10) |
Redemption fees added to paid in capital C | .01 | - G | .01 | .01 | .02 |
Net asset value, end of period | $ 35.12 | $ 28.16 | $ 26.94 | $ 31.23 | $ 26.28 |
Total Return A, B | 25.12% | 5.90% | (13.45)% | 19.63% | 59.16% |
Ratios to Average Net Assets D, F | | | | | |
Expenses before reductions | 2.10% | 2.11% | 2.12% | 2.14% | 2.15% |
Expenses net of fee waivers, if any | 2.10% | 2.11% | 2.12% | 2.14% | 2.15% |
Expenses net of all reductions | 2.07% | 2.04% | 2.06% | 2.08% | 2.06% |
Net investment income (loss) | .19% | .59% | .32% | .14% | .51% |
Supplemental Data | | | | | |
Net assets, end of period (000 omitted) | $ 1,494 | $ 1,533 | $ 1,801 | $ 2,496 | $ 1,915 |
Portfolio turnover rate E | 92% | 107% | 87% | 57% | 88% |
ATotal returns would have been lower if certain expenses had not been reduced during the applicable periods shown. BTotal returns do not include the effect of the contingent deferred sales charge. CCalculated based on average shares outstanding during the period. DFees and expenses of any underlying Fidelity Central Funds are not included in the Fund's expense ratio. The Fund indirectly bears its proportionate share of the expenses of any underlying Fidelity Central Funds. EAmount does not include the portfolio activity of any underlying Fidelity Central Funds. FExpense ratios reflect operating expenses of the class. Expenses before reductions do not reflect amounts reimbursed by the investment adviser or reductions from brokerage service arrangements or reductions from other expense offset arrangements and do not represent the amount paid by the class during periods when reimbursements or reductions occur. Expenses net of fee waivers reflect expenses after reimbursement by the investment adviser but prior to reductions from brokerage service arrangements or other expense offset arrangements. Expenses net of all reductions represent the net expenses paid by the class. GAmount represents less than $.01 per share. |
Financial Highlights - Class C
Years ended October 31, | 2013 | 2012 | 2011 | 2010 | 2009 |
Selected Per-Share Data | | | | | |
Net asset value, beginning of period | $ 28.07 | $ 26.86 | $ 31.19 | $ 26.25 | $ 16.61 |
Income from Investment Operations | | | | | |
Net investment income (loss) C | .06 | .16 | .10 | .04 | .12 |
Net realized and unrealized gain (loss) | 6.97 | 1.39 | (4.28) | 5.09 | 9.62 |
Total from investment operations | 7.03 | 1.55 | (4.18) | 5.13 | 9.74 |
Distributions from net investment income | (.12) | - | (.13) | (.13) | (.12) |
Distributions from net realized gain | - | (.34) | (.03) | (.07) | - |
Total distributions | (.12) | (.34) | (.16) | (.20) | (.12) |
Redemption fees added to paid in capital C | .01 | - G | .01 | .01 | .02 |
Net asset value, end of period | $ 34.99 | $ 28.07 | $ 26.86 | $ 31.19 | $ 26.25 |
Total Return A, B | 25.14% | 5.88% | (13.46)% | 19.66% | 59.18% |
Ratios to Average Net Assets D, F | | | | | |
Expenses before reductions | 2.10% | 2.11% | 2.12% | 2.14% | 2.15% |
Expenses net of fee waivers, if any | 2.10% | 2.11% | 2.12% | 2.14% | 2.15% |
Expenses net of all reductions | 2.07% | 2.04% | 2.06% | 2.07% | 2.07% |
Net investment income (loss) | .19% | .59% | .32% | .15% | .51% |
Supplemental Data | | | | | |
Net assets, end of period (000 omitted) | $ 6,957 | $ 4,515 | $ 5,230 | $ 5,938 | $ 3,806 |
Portfolio turnover rate E | 92% | 107% | 87% | 57% | 88% |
ATotal returns would have been lower if certain expenses had not been reduced during the applicable periods shown. BTotal returns do not include the effect of the contingent deferred sales charge. CCalculated based on average shares outstanding during the period. DFees and expenses of any underlying Fidelity Central Funds are not included in the Fund's expense ratio. The Fund indirectly bears its proportionate share of the expenses of any underlying Fidelity Central Funds. EAmount does not include the portfolio activity of any underlying Fidelity Central Funds. FExpense ratios reflect operating expenses of the class. Expenses before reductions do not reflect amounts reimbursed by the investment adviser or reductions from brokerage service arrangements or reductions from other expense offset arrangements and do not represent the amount paid by the class during periods when reimbursements or reductions occur. Expenses net of fee waivers reflect expenses after reimbursement by the investment adviser but prior to reductions from brokerage service arrangements or other expense offset arrangements. Expenses net of all reductions represent the net expenses paid by the class. GAmount represents less than $.01 per share. |
See accompanying notes which are an integral part of the financial statements.
Annual Report
Financial Highlights - China Region
Years ended October 31, | 2013 | 2012 | 2011 | 2010 | 2009 |
Selected Per-Share Data | | | | | |
Net asset value, beginning of period | $ 28.73 | $ 27.49 | $ 31.81 | $ 26.55 | $ 16.69 |
Income from Investment Operations | | | | | |
Net investment income (loss) B | .41 | .45 | .44 | .34 | .33 |
Net realized and unrealized gain (loss) | 7.11 | 1.42 | (4.37) | 5.18 | 9.68 |
Total from investment operations | 7.52 | 1.87 | (3.93) | 5.52 | 10.01 |
Distributions from net investment income | (.43) | (.29) | (.38) | (.21) | (.17) |
Distributions from net realized gain | - | (.34) | (.03) | (.07) | - |
Total distributions | (.43) | (.63) | (.40) G | (.27) H | (.17) |
Redemption fees added to paid in capital B | .01 | - F | .01 | .01 | .02 |
Net asset value, end of period | $ 35.83 | $ 28.73 | $ 27.49 | $ 31.81 | $ 26.55 |
Total Return A | 26.51% | 7.01% | (12.52)% | 20.97% | 60.77% |
Ratios to Average Net Assets C, E | | | | | |
Expenses before reductions | 1.02% | 1.04% | 1.04% | 1.06% | 1.12% |
Expenses net of fee waivers, if any | 1.02% | 1.04% | 1.04% | 1.06% | 1.12% |
Expenses net of all reductions | .98% | .98% | .98% | 1.00% | 1.03% |
Net investment income (loss) | 1.27% | 1.66% | 1.40% | 1.22% | 1.54% |
Supplemental Data | | | | | |
Net assets, end of period (000 omitted) | $ 1,425,828 | $ 1,265,488 | $ 1,515,084 | $ 2,130,070 | $ 2,138,141 |
Portfolio turnover rate D | 92% | 107% | 87% | 57% | 88% |
ATotal returns would have been lower if certain expenses had not been reduced during the applicable periods shown. BCalculated based on average shares outstanding during the period. CFees and expenses of any underlying Fidelity Central Funds are not included in the Fund's expense ratio. The Fund indirectly bears its proportionate share of the expenses of any underlying Fidelity Central Funds. DAmount does not include the portfolio activity of any underlying Fidelity Central Funds. EExpense ratios reflect operating expenses of the class. Expenses before reductions do not reflect amounts reimbursed by the investment adviser or reductions from brokerage service arrangements or reductions from other expense offset arrangements and do not represent the amount paid by the class during periods when reimbursements or reductions occur. Expenses net of fee waivers reflect expenses after reimbursement by the investment adviser but prior to reductions from brokerage service arrangements or other expense offset arrangements. Expenses net of all reductions represent the net expenses paid by the class. FAmount represents less than $.01 per share. GTotal distributions of $.40 per share is comprised of distributions from net investment income of $.376 and distributions from net realized gain of $.025 per share. HTotal distributions of $.27 per share is comprised of distributions from net investment income of $.209 and distributions from net realized gain of $.065 per share. |
Financial Highlights - Institutional Class
Years ended October 31, | 2013 | 2012 | 2011 | 2010 | 2009 |
Selected Per-Share Data | | | | | |
Net asset value, beginning of period | $ 28.68 | $ 27.46 | $ 31.79 | $ 26.55 | $ 16.70 |
Income from Investment Operations | | | | | |
Net investment income (loss) B | .42 | .45 | .43 | .33 | .37 |
Net realized and unrealized gain (loss) | 7.10 | 1.42 | (4.37) | 5.18 | 9.64 |
Total from investment operations | 7.52 | 1.87 | (3.94) | 5.51 | 10.01 |
Distributions from net investment income | (.46) | (.31) | (.37) | (.22) | (.18) |
Distributions from net realized gain | - | (.34) | (.03) | (.07) | - |
Total distributions | (.46) | (.65) | (.40) | (.28) G | (.18) |
Redemption fees added to paid in capital B | .01 | - F | .01 | .01 | .02 |
Net asset value, end of period | $ 35.75 | $ 28.68 | $ 27.46 | $ 31.79 | $ 26.55 |
Total Return A | 26.58% | 7.02% | (12.56)% | 20.92% | 60.78% |
Ratios to Average Net Assets C, E | | | | | |
Expenses before reductions | .97% | 1.04% | 1.06% | 1.11% | 1.08% |
Expenses net of fee waivers, if any | .97% | 1.04% | 1.06% | 1.11% | 1.08% |
Expenses net of all reductions | .93% | .98% | 1.01% | 1.04% | 1.00% |
Net investment income (loss) | 1.32% | 1.66% | 1.38% | 1.18% | 1.58% |
Supplemental Data | | | | | |
Net assets, end of period (000 omitted) | $ 10,206 | $ 1,958 | $ 2,034 | $ 1,904 | $ 1,684 |
Portfolio turnover rate D | 92% | 107% | 87% | 57% | 88% |
ATotal returns would have been lower if certain expenses had not been reduced during the applicable periods shown. BCalculated based on average shares outstanding during the period. CFees and expenses of any underlying Fidelity Central Funds are not included in the Fund's expense ratio. The Fund indirectly bears its proportionate share of the expenses of any underlying Fidelity Central Funds. DAmount does not include the portfolio activity of any underlying Fidelity Central Funds. EExpense ratios reflect operating expenses of the class. Expenses before reductions do not reflect amounts reimbursed by the investment adviser or reductions from brokerage service arrangements or reductions from other expense offset arrangements and do not represent the amount paid by the class during periods when reimbursements or reductions occur. Expenses net of fee waivers reflect expenses after reimbursement by the investment adviser but prior to reductions from brokerage service arrangements or other expense offset arrangements. Expenses net of all reductions represent the net expenses paid by the class. FAmount represents less than $.01 per share. GTotal distributions of $.28 per share is comprised of distributions from net investment income of $.216 and distributions from net realized gain of $.065 per share. |
See accompanying notes which are an integral part of the financial statements.
Annual Report
Notes to Financial Statements
For the period ended October 31, 2013
1. Organization.
Fidelity China Region Fund (the Fund) is a fund of Fidelity Investment Trust (the Trust) and is authorized to issue an unlimited number of shares. The Trust is registered under the Investment Company Act of 1940, as amended (the 1940 Act), as an open-end management investment company organized as a Massachusetts business trust. The Fund offers Class A, Class T, Class C, China Region and Institutional Class shares, each of which, along with Class B shares, has equal rights as to assets and voting privileges. Class B shares are closed to new accounts and additional purchases, except for exchanges and reinvestments. Each class has exclusive voting rights with respect to matters that affect that class. Class B shares will automatically convert to Class A shares after a holding period of seven years from the initial date of purchase. The Fund's investments in emerging markets can be subject to social, economic, regulatory, and political uncertainties and can be extremely volatile.
2. Investments in Fidelity Central Funds.
The Fund invests in Fidelity Central Funds, which are open-end investment companies generally available only to other investment companies and accounts managed by Fidelity Management & Research Company (FMR) and its affiliates. The Fund's Schedule of Investments lists each of the Fidelity Central Funds held as of period end, if any, as an investment of the Fund, but does not include the underlying holdings of each Fidelity Central Fund. As an Investing Fund, the Fund indirectly bears its proportionate share of the expenses of the underlying Fidelity Central Funds.
The Money Market Central Funds seek preservation of capital and current income and are managed by Fidelity Investments Money Management, Inc. (FIMM), an affiliate of FMR.
A complete unaudited list of holdings for each Fidelity Central Fund is available upon request or at the Securities and Exchange Commission (the SEC) website at www.sec.gov. In addition, the financial statements of the Fidelity Central Funds, which are not covered by the Fund's Report of Independent Registered Public Accounting Firm, are available on the SEC website or upon request.
3. Significant Accounting Policies.
The financial statements have been prepared in conformity with accounting principles generally accepted in the United States of America (GAAP), which require management to make certain estimates and assumptions at the date of the financial statements. Actual results could differ from those estimates. Subsequent events, if any, through the date that the financial statements were issued have been evaluated in the preparation of the financial statements. The following summarizes the significant accounting policies of the Fund:
Investment Valuation. Investments are valued as of 4:00 p.m. Eastern time on the last calendar day of the period. In accordance with valuation policies and procedures approved by the Board of Trustees (the Board), the Fund attempts to obtain prices from one or more third party pricing vendors or brokers to value its investments. When current market prices, quotations or currency exchange rates are not readily available or reliable, investments will be fair valued in good faith by the FMR Fair Value Committee (the Committee), in accordance with procedures adopted by the Board. Factors used in determining fair value vary by investment type and may include market or investment specific events. The frequency with which these procedures are used cannot be predicted and they may be utilized to a significant extent. The Committee oversees the Fund's valuation policies and procedures and is responsible for approving and reporting to the Board all fair value determinations.
The Fund categorizes the inputs to valuation techniques used to value its investments into a disclosure hierarchy consisting of three levels as shown below:
Level 1 - quoted prices in active markets for identical investments
Level 2 - other significant observable inputs (including quoted prices for similar investments, interest rates, prepayment speeds, etc.)
Level 3 - unobservable inputs (including the Fund's own assumptions based on the best information available)
Valuation techniques used to value the Fund's investments by major category are as follows:
Equity securities, including restricted securities, for which market quotations are readily available, are valued at the last reported sale price or official closing price as reported by a third party pricing vendor on the primary market or exchange on which they are traded and are categorized as Level 1 in the hierarchy. In the event there were no sales during the day or closing prices are not available, securities are valued at the last quoted bid price or may be valued using the last available price and are generally categorized as Level 2 in the hierarchy. For foreign equity securities, when market or security specific events arise, comparisons to the valuation of American Depositary Receipts (ADRs), futures contracts, Exchange-Traded Funds (ETFs) and certain indexes as well as quoted prices for similar securities may be used and would be categorized as Level 2 in the hierarchy. Utilizing these techniques may result in transfers between Level 1 and Level 2. For equity securities, including restricted securities, where observable inputs are limited, assumptions about market activity and risk are used and these securities may be categorized as Level 3 in the hierarchy.
Investments in open-end mutual funds, including the Fidelity Central Funds, are valued at their closing net asset value (NAV) each business day and are categorized as Level 1 in the hierarchy.
Annual Report
3. Significant Accounting Policies - continued
Investment Valuation - continued
Changes in valuation techniques may result in transfers in or out of an assigned level within the disclosure hierarchy. The aggregate value of investments by input level, as of October 31, 2013, is included at the end of the Fund's Schedule of Investments.
Foreign Currency. The Fund may use foreign currency contracts to facilitate transactions in foreign-denominated securities. Gains and losses from these transactions may arise from changes in the value of the foreign currency or if the counterparties do not perform under the contracts' terms.
Foreign-denominated assets, including investment securities, and liabilities are translated into U.S. dollars at the exchange rates at period end. Purchases and sales of investment securities, income and dividends received and expenses denominated in foreign currencies are translated into U.S. dollars at the exchange rate in effect on the transaction date.
The effects of exchange rate fluctuations on investments are included with the net realized and unrealized gain (loss) on investment securities. Other foreign currency transactions resulting in realized and unrealized gain (loss) are disclosed separately.
Investment Transactions and Income. For financial reporting purposes, the Fund's investment holdings and NAV include trades executed through the end of the last business day of the period. The NAV per share for processing shareholder transactions is calculated as of the close of business of the New York Stock Exchange (NYSE), normally 4:00 p.m. Eastern time and includes trades executed through the end of the prior business day. Gains and losses on securities sold are determined on the basis of identified cost and may include proceeds received from litigation. Dividend income is recorded on the ex-dividend date, except for certain dividends from foreign securities where the ex-dividend date may have passed, which are recorded as soon as the Fund is informed of the ex-dividend date. Non-cash dividends included in dividend income, if any, are recorded at the fair market value of the securities received. Interest income and distributions from the Fidelity Central Funds are accrued as earned. Interest income includes coupon interest and amortization of premium and accretion of discount on debt securities. Investment income is recorded net of foreign taxes withheld where recovery of such taxes is uncertain.
Class Allocations and Expenses. Investment income, realized and unrealized capital gains and losses, common expenses of the Fund, and certain fund-level expense reductions, if any, are allocated daily on a pro-rata basis to each class based on the relative net assets of each class to the total net assets of the Fund. Each class differs with respect to transfer agent and distribution and service plan fees incurred. Certain expense reductions may also differ by class. For the reporting period, the allocated portion of income and expenses to each class as a percent of its average net assets may vary due to the timing of recording these transactions in relation to fluctuating net assets of the classes. Expenses directly attributable to a fund are charged to that fund. Expenses attributable to more than one fund are allocated among the respective funds on the basis of relative net assets or other appropriate methods. Expense estimates are accrued in the period to which they relate and adjustments are made when actual amounts are known.
Income Tax Information and Distributions to Shareholders. Each year, the Fund intends to qualify as a regulated investment company under Subchapter M of the Internal Revenue Code, including distributing substantially all of its taxable income and realized gains. As a result, no provision for U.S. Federal income taxes is required. As of October 31, 2013, the Fund did not have any unrecognized tax benefits in the financial statements; nor is the Fund aware of any tax positions for which it is reasonably possible that the total amounts of unrecognized tax benefits will significantly change in the next twelve months. The Fund files a U.S. federal tax return, in addition to state and local tax returns as required. The Fund's federal income tax returns are subject to examination by the Internal Revenue Service (IRS) for a period of three fiscal years after they are filed. State and local tax returns may be subject to examination for an additional fiscal year depending on the jurisdiction. Foreign taxes are provided for based on the Fund's understanding of the tax rules and rates that exist in the foreign markets in which it invests.
Distributions are declared and recorded on the ex-dividend date. Income dividends and capital gain distributions are declared separately for each class. Income and capital gain distributions are determined in accordance with income tax regulations, which may differ from GAAP. In addition, the Fund claimed a portion of the payment made to redeeming shareholders as a distribution for income tax purposes.
Capital accounts within the financial statements are adjusted for permanent book-tax differences. These adjustments have no impact on net assets or the results of operations. Temporary book-tax differences will reverse in a subsequent period.
Book-tax differences are primarily due to foreign currency transactions, passive foreign investment companies (PFIC), deferred trustees compensation, capital loss carryforwards and losses deferred due to wash sales.
The federal tax cost of investment securities and unrealized appreciation (depreciation) as of period end were as follows:
Gross unrealized appreciation | $ 393,506,024 |
Gross unrealized depreciation | (27,550,991) |
Net unrealized appreciation (depreciation) on securities and other investments | $ 365,955,033 |
| |
Tax Cost | $ 1,132,832,449 |
Annual Report
Notes to Financial Statements - continued
3. Significant Accounting Policies - continued
Income Tax Information and Distributions to Shareholders - continued
The tax-based components of distributable earnings as of period end were as follows:
Undistributed ordinary income | $ 31,209,233 |
Undistributed long-term capital gain | $ 120,314,075 |
Net unrealized appreciation (depreciation) | $ 365,949,974 |
The tax character of distributions paid was as follows:
| October 31, 2013 | October 31, 2012 |
| | |
Ordinary Income | $ 19,616,401 | $ 15,687,379 |
Long-term Capital Gains | - | 18,721,345 |
Total | $ 19,616,401 | $ 34,408,724 |
Short-Term Trading (Redemption) Fees. Shares held by investors in the Fund less than 90 days may have been subject to a redemption fee equal to 1.50% of the net asset value of shares redeemed. All redemption fees, which reduce the proceeds of the shareholder redemption, are retained by the Fund and accounted for as an addition to paid in capital.
4. Purchases and Sales of Investments.
Purchases and sales of securities, other than short-term securities, aggregated $1,273,312,174 and $1,463,403,074, respectively.
5. Fees and Other Transactions with Affiliates.
Management Fee. FMR and its affiliates provide the Fund with investment management related services for which the Fund pays a monthly management fee. The management fee is the sum of an individual fund fee rate that is based on an annual rate of .45% of the Fund's average net assets and an annualized group fee rate that averaged .25% during the period. The group fee rate is based upon the average net assets of all the mutual funds advised by FMR, including any mutual funds previously advised by FMR that are currently advised by Fidelity SelectCo, LLC, an affiliate of FMR. The group fee rate decreases as assets under management increase and increases as assets under management decrease. For the reporting period, the total annual management fee rate was .70% of the Fund's average net assets.
Distribution and Service Plan Fees. In accordance with Rule 12b-1 of the 1940 Act, the Fund has adopted separate Distribution and Service Plans for each class of shares. Certain classes pay Fidelity Distributors Corporation (FDC), an affiliate of FMR, separate Distribution and Service Fees, each of which is based on an annual percentage of each class' average net assets. In addition, FDC may pay financial intermediaries for selling shares of the Fund and providing shareholder support services. For the period, the Distribution and Service Fee rates, total fees and amounts retained by FDC were as follows:
| Distribution
Fee | Service
Fee | Total Fees | Retained
by FDC |
Class A | -% | .25% | $ 41,731 | $ 701 |
Class T | .25% | .25% | 26,168 | 64 |
Class B | .75% | .25% | 15,256 | 11,538 |
Class C | .75% | .25% | 60,932 | 17,612 |
| | | $ 144,087 | $ 29,915 |
Sales Load. FDC may receive a front-end sales charge of up to 5.75% for selling Class A shares and 3.50% for selling Class T shares, some of which is paid to financial intermediaries for selling shares of the Fund. Depending on the holding period, FDC may receive contingent deferred sales charges levied on Class A, Class T, Class B, and Class C redemptions. The deferred sales charges range from 5.00% to 1.00% for Class B shares, 1.00% for Class C shares, 1.00% for certain purchases of Class A shares and .25% for certain purchases of Class T shares.
For the period, sales charge amounts retained by FDC were as follows:
| Retained
by FDC |
Class A | $ 23,503 |
Class T | 4,468 |
Class B* | 4,857 |
Class C* | 2,325 |
| $ 35,153 |
* When Class B and Class C shares are initially sold, FDC pays commissions from its own resources to financial intermediaries through which the sales are made.
Annual Report
5. Fees and Other Transactions with Affiliates - continued
Transfer Agent Fees. Fidelity Investments Institutional Operations Company, Inc., (FIIOC), an affiliate of FMR, is the transfer, dividend disbursing and shareholder servicing agent for each class of the Fund. FIIOC receives account fees and asset-based fees that vary according to the account size and type of account of the shareholders of the respective classes of the Fund. FIIOC pays for typesetting, printing and mailing of shareholder reports, except proxy statements.
For the period, transfer agent fees for each class were as follows:
| Amount | % of
Average
Net Assets |
Class A | $ 49,843 | .30 |
Class T | 17,685 | .34 |
Class B | 4,586 | .30 |
Class C | 18,274 | .30 |
China Region | 3,014,566 | .22 |
Institutional Class | 7,467 | .17 |
| $ 3,112,421 | |
Accounting and Security Lending Fees. Fidelity Service Company, Inc. (FSC), an affiliate of FMR, maintains the Fund's accounting records. The accounting fee is based on the level of average net assets for each month. Under a separate contract, FSC administers the security lending program. The security lending fee is based on the number and duration of lending transactions.
Brokerage Commissions. The Fund placed a portion of its portfolio transactions with brokerage firms which are affiliates of the investment adviser. Brokerage commissions are included in net realized gain (loss) and change in net unrealized appreciation (depreciation) in the Statement of Operations. The commissions paid to these affiliated firms were $2,982 for the period.
Interfund Lending Program. Pursuant to an Exemptive Order issued by the SEC, the Fund, along with other registered investment companies having management contracts with FMR, may participate in an interfund lending program. This program provides an alternative credit facility allowing the funds to borrow from, or lend money to, other participating affiliated funds. At period end, there were no interfund loans outstanding. The Fund's activity in this program during the period for which loans were outstanding was as follows:
Borrower or Lender | Average Loan
Balance | Weighted Average Interest Rate | Interest Expense |
Borrower | $ 8,690,333 | .36% | $ 515 |
6. Committed Line of Credit.
The Fund participates with other funds managed by FMR or an affiliate in a $4.25 billion credit facility (the "line of credit") to be utilized for temporary or emergency purposes to fund shareholder redemptions or for other short-term liquidity purposes. The Fund has agreed to pay commitment fees on its pro-rata portion of the line of credit, which amounted to $3,108 and is reflected in Miscellaneous expenses on the Statement of Operations. During the period, there were no borrowings on this line of credit.
7. Security Lending.
The Fund lends portfolio securities through a lending agent from time to time in order to earn additional income. For equity securities, a lending agent is used and may loan securities to certain qualified borrowers, including Fidelity Capital Markets (FCM), a broker-dealer affiliated with the Fund. On the settlement date of the loan, the Fund receives collateral (in the form of U.S. Treasury obligations, letters of credit and/or cash) against the loaned securities and maintains collateral in an amount not less than 100% of the market value of the loaned securities during the period of the loan. The market value of the loaned securities is determined at the close of business of the Fund and any additional required collateral is delivered to the Fund on the next business day. If the borrower defaults on its obligation to return the securities loaned because of insolvency or other reasons, the Fund may apply collateral received from the borrower against the obligation. The Fund may experience delays and costs in recovering the securities loaned. Any cash collateral received is invested in the Fidelity Securities Lending Cash Central Fund. The value of loaned securities and cash collateral at period end are disclosed on the Fund's Statement of Assets and Liabilities. Security lending income represents the income earned on investing cash collateral, less rebates paid to borrowers and any lending agent fees associated with the loan, plus any premium payments received for lending certain types of securities. Security lending income is presented in the Statement of Operations as a component of income from Fidelity Central Funds. Total security lending income during the period amounted to $104,014. During the period, there were no securities loaned to FCM.
Annual Report
Notes to Financial Statements - continued
8. Expense Reductions.
Commissions paid to certain brokers with whom FMR, or its affiliates, places trades on behalf of the Fund include an amount in addition to trade execution, which may be rebated back to the Fund to offset certain expenses. This amount totaled $505,020 for the period.
In addition, FMR reimbursed a portion of the Fund's operating expenses during the period in the amount of $26,099.
9. Distributions to Shareholders.
Distributions to shareholders of each class were as follows:
Years ended October 31, | 2013 | 2012 |
From net investment income | | |
Class A | $ 161,788 | $ 100,983 |
Class T | 40,503 | 14,853 |
Class B | 4,993 | - |
Class C | 18,782 | - |
China Region | 19,344,002 | 15,549,167 |
Institutional Class | 46,333 | 22,376 |
Total | $ 19,616,401 | $ 15,687,379 |
From net realized gain | | |
Class A | $ - | $ 182,091 |
Class T | - | 60,664 |
Class B | - | 21,876 |
Class C | - | 65,490 |
China Region | - | 18,366,435 |
Institutional Class | - | 24,789 |
Total | $ - | $ 18,721,345 |
10. Share Transactions.
Transactions for each class of shares were as follows:
| Shares | Dollars |
Years ended October 31, | 2013 | 2012 | 2013 | 2012 |
Class A | | | | |
Shares sold | 284,743 | 128,967 | $ 9,232,019 | $ 3,497,936 |
Reinvestment of distributions | 5,112 | 10,227 | 151,768 | 266,217 |
Shares redeemed | (184,522) | (207,420) | (5,803,916) | (5,547,035) |
Net increase (decrease) | 105,333 | (68,226) | $ 3,579,871 | $ (1,782,882) |
Class T | | | | |
Shares sold | 70,191 | 40,215 | $ 2,215,632 | $ 1,078,486 |
Reinvestment of distributions | 1,321 | 2,834 | 39,167 | 73,623 |
Shares redeemed | (56,116) | (84,588) | (1,759,294) | (2,252,505) |
Net increase (decrease) | 15,396 | (41,539) | $ 495,505 | $ (1,100,396) |
Class B | | | | |
Shares sold | 6,343 | 4,773 | $ 197,892 | $ 131,481 |
Reinvestment of distributions | 151 | 760 | 4,455 | 19,651 |
Shares redeemed | (18,382) | (17,966) | (569,584) | (477,343) |
Net increase (decrease) | (11,888) | (12,433) | $ (367,237) | $ (326,211) |
Class C | | | | |
Shares sold | 120,235 | 39,150 | $ 3,792,024 | $ 1,051,097 |
Reinvestment of distributions | 573 | 2,380 | 16,859 | 61,380 |
Shares redeemed | (82,838) | (75,401) | (2,577,162) | (1,981,464) |
Net increase (decrease) | 37,970 | (33,871) | $ 1,231,721 | $ (868,987) |
China Region | | | | |
Shares sold | 11,534,725 | 5,981,804 | $ 362,586,439 | $ 163,640,090 |
Reinvestment of distributions | 622,145 | 1,245,751 | 18,558,580 | 32,563,934 |
Shares redeemed | (16,406,195) | (18,300,659) | (515,921,780) | (493,563,874) |
Net increase (decrease) | (4,249,325) | (11,073,104) | $ (134,776,761) | $ (297,359,850) |
Annual Report
10. Share Transactions - continued
| Shares | Dollars |
Years ended October 31, | 2013 | 2012 | 2013 | 2012 |
Institutional Class | | | | |
Shares sold | 333,624 | 33,539 | $ 11,106,364 | $ 913,352 |
Reinvestment of distributions | 1,452 | 1,708 | 43,199 | 44,574 |
Shares redeemed | (117,838) | (41,079) | (3,708,160) | (1,090,028) |
Net increase (decrease) | 217,238 | (5,832) | $ 7,441,403 | $ (132,102) |
11. Other.
The Fund's organizational documents provide former and current trustees and officers with a limited indemnification against liabilities arising in connection with the performance of their duties to the Fund. In the normal course of business, the Fund may also enter into contracts that provide general indemnifications. The Fund's maximum exposure under these arrangements is unknown as this would be dependent on future claims that may be made against the Fund. The risk of material loss from such claims is considered remote.
Annual Report
Report of Independent Registered Public Accounting Firm
To the Trustees of Fidelity Investment Trust and the Shareholders of Fidelity China Region Fund:
In our opinion, the accompanying statement of assets and liabilities, including the schedule of investments, and the related statements of operations and of changes in net assets and the financial highlights present fairly, in all material respects, the financial position of Fidelity China Region Fund (a fund of Fidelity Investment Trust) at October 31, 2013, the results of its operations for the year then ended, the changes in its net assets for each of the two years in the period then ended and the financial highlights for each of the five years in the period then ended, in conformity with accounting principles generally accepted in the United States of America. These financial statements and financial highlights (hereafter referred to as "financial statements") are the responsibility of the Fidelity China Region Fund's management. Our responsibility is to express an opinion on these financial statements based on our audits. We conducted our audits of these financial statements in accordance with the standards of the Public Company Accounting Oversight Board (United States). Those standards require that we plan and perform the audit to obtain reasonable assurance about whether the financial statements are free of material misstatement. An audit includes examining, on a test basis, evidence supporting the amounts and disclosures in the financial statements, assessing the accounting principles used and significant estimates made by management, and evaluating the overall financial statement presentation. We believe that our audits, which included confirmation of securities at October 31, 2013 by correspondence with the custodian and brokers, provide a reasonable basis for our opinion.
PricewaterhouseCoopers LLP
Boston, Massachusetts
December 16, 2013
Annual Report
The Trustees, Member of the Advisory Board, and executive officers of the trust and fund, as applicable, are listed below. The Board of Trustees governs the fund and is responsible for protecting the interests of shareholders. The Trustees are experienced executives who meet periodically throughout the year to oversee the fund's activities, review contractual arrangements with companies that provide services to the fund, oversee management of the risks associated with such activities and contractual arrangements, and review the fund's performance. Except for James C. Curvey, Ned C. Lautenbach, Ronald P. O'Hanley, and William S. Stavropoulos, each of the Trustees oversees 171 funds. Mr. Curvey oversees 394 funds. Mr. Lautenbach, Mr. O'Hanley, and Mr. Stavropoulos each oversees 245 funds.
The Trustees hold office without limit in time except that (a) any Trustee may resign; (b) any Trustee may be removed by written instrument, signed by at least two-thirds of the number of Trustees prior to such removal; (c) any Trustee who requests to be retired or who has become incapacitated by illness or injury may be retired by written instrument signed by a majority of the other Trustees; and (d) any Trustee may be removed at any special meeting of shareholders by a two-thirds vote of the outstanding voting securities of the trust. Each Trustee who is not an interested person of the trust and the fund (as defined in the 1940 Act) (Independent Trustee), shall retire not later than the last day of the calendar year in which his or her 75th birthday occurs. The Independent Trustees may waive this mandatory retirement age policy with respect to individual Trustees. The executive officers and Advisory Board Member hold office without limit in time, except that any officer and Advisory Board Member may resign or may be removed by a vote of a majority of the Trustees at any regular meeting or any special meeting of the Trustees. Except as indicated, each individual has held the office shown or other offices in the same company for the past five years.
Experience, Skills, Attributes, and Qualifications of the Fund's Trustees. The Governance and Nominating Committee has adopted a statement of policy that describes the experience, qualifications, attributes, and skills that are necessary and desirable for potential Independent Trustee candidates (Statement of Policy). The Board believes that each Trustee satisfied at the time he or she was initially elected or appointed a Trustee, and continues to satisfy, the standards contemplated by the Statement of Policy. The Governance and Nominating Committee also engages professional search firms to help identify potential Independent Trustee candidates who have the experience, qualifications, attributes, and skills consistent with the Statement of Policy. From time to time, additional criteria based on the composition and skills of the current Independent Trustees, as well as experience or skills that may be appropriate in light of future changes to board composition, business conditions, and regulatory or other developments, have also been considered by the professional search firms and the Governance and Nominating Committee. In addition, the Board takes into account the Trustees' commitment and participation in Board and committee meetings, as well as their leadership of standing and ad hoc committees throughout their tenure.
In determining that a particular Trustee was and continues to be qualified to serve as a Trustee, the Board has considered a variety of criteria, none of which, in isolation, was controlling. The Board believes that, collectively, the Trustees have balanced and diverse experience, qualifications, attributes, and skills, which allow the Board to operate effectively in governing the fund and protecting the interests of shareholders. Information about the specific experience, skills, attributes, and qualifications of each Trustee, which in each case led to the Board's conclusion that the Trustee should serve (or continue to serve) as a trustee of the fund, is provided below.
Board Structure and Oversight Function. James C. Curvey is an interested person (as defined in the 1940 Act) and currently serves as Chairman. The Trustees have determined that an interested Chairman is appropriate and benefits shareholders because an interested Chairman has a personal and professional stake in the quality and continuity of services provided to the fund. Independent Trustees exercise their informed business judgment to appoint an individual of their choosing to serve as Chairman, regardless of whether the Trustee happens to be independent or a member of management. The Independent Trustees have determined that they can act independently and effectively without having an Independent Trustee serve as Chairman and that a key structural component for assuring that they are in a position to do so is for the Independent Trustees to constitute a substantial majority for the Board. The Independent Trustees also regularly meet in executive session. Ned C. Lautenbach serves as Chairman of the Independent Trustees and as such (i) acts as a liaison between the Independent Trustees and management with respect to matters important to the Independent Trustees and (ii) with management prepares agendas for Board meetings.
Fidelity funds are overseen by different Boards of Trustees. The fund's Board oversees Fidelity's equity and high income funds and another Board oversees Fidelity's investment-grade bond, money market, and asset allocation funds. The asset allocation funds may invest in Fidelity funds overseen by the fund's Board. The use of separate Boards, each with its own committee structure, allows the Trustees of each group of Fidelity funds to focus on the unique issues of the funds they oversee, including common research, investment, and operational issues. On occasion, the separate Boards establish joint committees to address issues of overlapping consequences for the Fidelity funds overseen by each Board.
The Trustees operate using a system of committees to facilitate the timely and efficient consideration of all matters of importance to the Trustees, the fund, and fund shareholders and to facilitate compliance with legal and regulatory requirements and oversight of the fund's activities and associated risks. The Board, acting through its committees, has charged FMR and its affiliates with (i) identifying events or circumstances the occurrence of which could have demonstrably adverse effects on the fund's business and/or reputation; (ii) implementing processes and controls to lessen the possibility that such events or circumstances occur or to mitigate the effects of such events or circumstances if they do occur; and (iii) creating and maintaining a system designed to evaluate continuously business and market conditions in order to facilitate the identification and implementation processes described in (i) and (ii) above. Because the day-to-day operations and activities of the fund are carried out by or through FMR, its affiliates and other service providers, the fund's exposure to risks is mitigated but not eliminated by the processes overseen by the Trustees. While each of the Board's committees has responsibility for overseeing different aspects of the fund's activities, oversight is exercised primarily through the Operations, Audit, and Compliance Committees. In addition, the Independent Trustees have worked with FMR to enhance the Board's oversight of investment and financial risks, legal and regulatory risks, technology risks, and operational risks, including the development of additional risk reporting to the Board. For example, a working group comprised of Independent Trustees and FMR has worked and continues to work to review the Fidelity funds' valuation-related activities, reporting and risk management. Appropriate personnel, including but not limited to the fund's Chief Compliance Officer (CCO), FMR's internal auditor, the independent accountants, the fund's Treasurer and portfolio management personnel, make periodic reports to the Board's committees, as appropriate, including an annual review of FMR's risk management program for the Fidelity funds. The responsibilities of each standing committee, including their oversight responsibilities, are described further under "Standing Committees of the Fund's Trustees."
Annual Report
Trustees and Officers - continued
The fund's Statement of Additional Information (SAI) includes more information about the Trustees. To request a free copy, call Fidelity at 1-877-208-0098.
Interested Trustees*:
Correspondence intended for each Trustee who is an interested person may be sent to Fidelity Investments, 245 Summer Street, Boston, Massachusetts 02210.
Name, Year of Birth; Principal Occupations and Other Relevant Experience+ |
James C. Curvey (1935) |
Year of Election or Appointment: 2007 Trustee Chairman of the Board of Trustees |
| Mr. Curvey also serves as Trustee of other Fidelity funds. Mr. Curvey is a Director of Fidelity Investments Money Management, Inc. (2009-present), Director of Fidelity Research & Analysis Co. (2009-present) and Director of FMR and FMR Co., Inc. (2007-present). Mr. Curvey is also Vice Chairman (2007-present) and Director of FMR LLC. In addition, Mr. Curvey serves as an Overseer for the Boston Symphony Orchestra and a member of the Trustees of Villanova University. Previously, Mr. Curvey was the Vice Chairman (2006-2007) and Director (2000-2007) of FMR Corp. |
Ronald P. O'Hanley (1957) |
Year of Election or Appointment: 2011 Trustee |
| Mr. O'Hanley also serves as Trustee of other Fidelity funds. He is Director of Fidelity SelectCo, LLC (2013-present), FMR Co., Inc. (2010-present), Director of Fidelity Investments Money Management, Inc. (2010-present), Director of Fidelity Research & Analysis Company (2010-present), President of Fidelity Asset Management and Corporate Services and a Member of Fidelity's Executive Committee (2010-present). Previously, Mr. O'Hanley served as President and Chief Executive Officer of BNY Mellon Asset Management (2007-2010). Mr. O'Hanley also served as Vice Chairman of Bank New York Mellon Corp. and a member of that firm's Executive Committee. Prior to the 2007 merger of The Bank of New York and Mellon Financial Corporation, he was Vice Chairman of Mellon Financial Corporation and President and Chief Executive Officer of Mellon Asset Management. He joined Mellon in February 1997. Mr. O'Hanley currently serves as Chairman of the Boston Public Library Foundation Board of Directors and sits on the Board of Directors of Beth Israel Deaconess Medical Center, the Board of Trustees of the Marine Biological Laboratory and the Advisory Board of the Maxwell School of Citizenship and Public Administration at Syracuse University. Mr. O'Hanley also chairs the Council on Asset Management for the Financial Services Roundtable and is a member of the Board of Directors of Institutional Investor's U.S. Institute. |
* Trustees have been determined to be "Interested Trustees" by virtue of, among other things, their affiliation with the trust or various entities under common control with FMR.
+ The information above includes each Trustee's principal occupation during the last five years and other information relating to the experience, attributes, and skills relevant to each Trustee's qualifications to serve as a Trustee, which led to the conclusion that each Trustee should serve as a Trustee for the fund.
Annual Report
Independent Trustees:
Correspondence intended for each Independent Trustee (that is, the Trustees other than the Interested Trustees) may be sent to Fidelity Investments, P.O. Box 55235, Boston, Massachusetts 02205-5235.
Name, Year of Birth; Principal Occupations and Other Relevant Experience+ |
Dennis J. Dirks (1948) |
Year of Election or Appointment: 2005 Trustee |
| Mr. Dirks also serves as Trustee of other Fidelity funds. Prior to his retirement in May 2003, Mr. Dirks was Chief Operating Officer and a member of the Board of The Depository Trust & Clearing Corporation (DTCC). He also served as President, Chief Operating Officer, and Board member of The Depository Trust Company (DTC) and President and Board member of the National Securities Clearing Corporation (NSCC). In addition, Mr. Dirks served as Chief Executive Officer and Board member of the Government Securities Clearing Corporation, Chief Executive Officer and Board member of the Mortgage-Backed Securities Clearing Corporation, as a Trustee and a member of the Finance Committee of Manhattan College (2005-2008), and as a Trustee and a member of the Finance Committee of AHRC of Nassau County (2006-2008). Mr. Dirks is a member of the Independent Directors Council (IDC) Governing Council (2010-present) and Board of Directors for The Brookville Center for Children's Services, Inc. (2009-present). |
Alan J. Lacy (1953) |
Year of Election or Appointment: 2008 Trustee |
| Mr. Lacy also serves as Trustee of other Fidelity funds. Mr. Lacy serves as Senior Adviser (2007-present) of Oak Hill Capital Partners, L.P. (private equity). Mr. Lacy also served as Chief Executive Officer (2000-2005) and Vice Chairman (2005-2006) of Sears Holdings Corporation and Sears, Roebuck and Co. (retail). In addition, Mr. Lacy serves as a member of the Board of Directors of Dave & Buster's Entertainment, Inc. (restaurant and entertainment complexes, 2010-present), Earth Fare, Inc. (retail grocery, 2012-present), The Hillman Companies, Inc. (hardware wholesalers, 2010-present), and Bristol-Myers Squibb Company (global pharmaceuticals, 2008-present). Mr. Lacy is a member of the Board of Trustees of The National Parks Conservation Association (2006-present). Previously, Mr. Lacy served as Chairman of the Board of Trustees of the National Parks Conservation Association (2008-2011) and as a member of the Board of Directors for the Western Union Company (global money transfer, 2006-2011). |
Ned C. Lautenbach (1944) |
Year of Election or Appointment: 2000 Trustee Chairman of the Independent Trustees |
| Mr. Lautenbach also serves as Trustee of other Fidelity funds. Mr. Lautenbach currently serves as the Lead Director of the Eaton Corporation Board of Directors (diversified industrial, 1997-present). Mr. Lautenbach is Chairman of the Board of Directors of the Philharmonic Center for the Arts in Naples, Florida (2012-present) and a member of the Council on Foreign Relations (1994-present). Previously, Mr. Lautenbach was a Partner/Advisory Partner at Clayton, Dubilier & Rice, LLC (private equity investment, 1998-2010), as well as a Director of Sony Corporation (2006-2007). |
Joseph Mauriello (1944) |
Year of Election or Appointment: 2008 Trustee |
| Mr. Mauriello also serves as Trustee of other Fidelity funds. Prior to his retirement in January 2006, Mr. Mauriello served in numerous senior management positions including Deputy Chairman and Chief Operating Officer (2004-2005), and Vice Chairman of Financial Services (2002-2004) of KPMG LLP US (professional services, 1965-2005). Mr. Mauriello currently serves as a member of the Board of Directors of XL Group plc. (global insurance and re-insurance, 2006-present). Previously, Mr. Mauriello served as a Director of the Hamilton Funds of the Bank of New York (2006-2007) and of Arcadia Resources Inc. (health care services and products, 2007-2012). |
Robert W. Selander (1950) |
Year of Election or Appointment: 2011 Trustee |
| Mr. Selander also serves as Trustee of other Fidelity funds. Previously, Mr. Selander served as a Member of the Advisory Board of other Fidelity funds (2011), and Executive Vice Chairman (2010), Chief Executive Officer (2009-2010), and President and Chief Executive Officer (1997-2009) of Mastercard, Inc. |
Cornelia M. Small (1944) |
Year of Election or Appointment: 2005 Trustee |
| Ms. Small also serves as Trustee of other Fidelity funds. Ms. Small is a member of the Board of Directors (2009-present) and Chair of the Investment Committee (2010-present) of the Teagle Foundation. Ms. Small also serves on the Investment Committee of the Berkshire Taconic Community Foundation (2008-present). Previously, Ms. Small served as Chairperson (2002-2008) and a member of the Investment Committee and Chairperson (2008-2012) and a member of the Board of Trustees of Smith College. In addition, Ms. Small served as Chief Investment Officer, Director of Global Equity Investments, and a member of the Board of Directors of Scudder, Stevens & Clark and Scudder Kemper Investments. |
William S. Stavropoulos (1939) |
Year of Election or Appointment: 2001 Trustee Vice Chairman of the Independent Trustees |
| Mr. Stavropoulos also serves as Trustee of other Fidelity funds. Mr. Stavropoulos serves as President and Founder of the Michigan Baseball Foundation, the Great Lakes Loons (2007-present). Mr. Stavropoulos is Chairman Emeritus of the Board of Directors of The Dow Chemical Company, where he previously served in numerous senior management positions, including President, CEO (1995-2000; 2002-2004), Chairman of the Executive Committee (2000-2006), and as a member of the Board of Directors (1990-2006). Currently, Mr. Stavropoulos is Chairman of the Board of Directors of Univar Inc. (global distributor of commodity and specialty chemicals), a Director of Teradata Corporation (data warehousing and technology solutions), and Maersk Inc. (industrial conglomerate), and a member of the Advisory Board for Metalmark Capital LLC (private equity investment, 2005-present). Mr. Stavropoulos is an operating advisor to Clayton, Dubilier & Rice, LLC (private equity investment). In addition, Mr. Stavropoulos is a member of the University of Notre Dame Advisory Council for the College of Science, a Trustee of the Rollin L. Gerstacker Foundation, and a Director of the Naples Philharmonic Center for the Arts. Previously, Mr. Stavropoulos served as a Director of Chemical Financial Corporation (bank holding company, 1993-2012) and Tyco International, Ltd. (multinational manufacturing and services, 2007-2012). |
David M. Thomas (1949) |
Year of Election or Appointment: 2008 Trustee |
| Mr. Thomas also serves as Trustee of other Fidelity funds. Mr. Thomas serves as Non-Executive Chairman of the Board of Directors of Fortune Brands Home and Security (home and security products, 2011-present), and as a member of the Board of Directors of Interpublic Group of Companies, Inc. (marketing communication, 2004-present). Previously, Mr. Thomas served as Executive Chairman (2005-2006) and Chairman and Chief Executive Officer (2000-2005) of IMS Health, Inc. (pharmaceutical and healthcare information solutions), and a Director of Fortune Brands, Inc. (consumer products, 2000-2011). |
+ The information above includes each Trustee's principal occupation during the last five years and other information relating to the experience, attributes, and skills relevant to each Trustee's qualifications to serve as a Trustee, which led to the conclusion that each Trustee should serve as a Trustee for the fund.
Advisory Board Member and Executive Officers:
Correspondence intended for each executive officer and Peter S. Lynch may be sent to Fidelity Investments, 245 Summer Street, Boston, Massachusetts 02210. Executive officers appear below in alphabetical order.
Name, Year of Birth; Principal Occupation |
Peter S. Lynch (1944) |
Year of Election or Appointment: 2003 Member of the Advisory Board |
| Mr. Lynch also serves as Member of the Advisory Board of other Fidelity funds. Mr. Lynch is Vice Chairman and a Director of FMR and FMR Co., Inc. In addition, Mr. Lynch serves as a Trustee of Boston College and as the Chairman of the Inner-City Scholarship Fund. Previously, Mr. Lynch served on the Special Olympics International Board of Directors (1997-2006). |
Elizabeth Paige Baumann (1968) |
Year of Election or Appointment: 2012 Anti-Money Laundering (AML) Officer |
| Ms. Baumann also serves as AML Officer of other funds. She is Chief AML Officer of FMR LLC (2012-present) and is an employee of Fidelity Investments. Previously, Ms. Baumann served as Vice President and Deputy Anti-Money Laundering Officer (2007-2012). |
William C. Coffey (1969) |
Year of Election or Appointment: 2009 Assistant Secretary |
| Mr. Coffey also serves as Assistant Secretary of other funds. He is Senior Vice President and Deputy General Counsel of FMR LLC (2010-present), and is an employee of Fidelity Investments. Previously, Mr. Coffey served as Vice President and Associate General Counsel of FMR LLC (2005-2009). |
Jonathan Davis (1968) |
Year of Election or Appointment: 2010 Assistant Treasurer |
| Mr. Davis also serves as Assistant Treasurer of other funds. Mr. Davis is an employee of Fidelity Investments. Previously, Mr. Davis served as Vice President and Associate General Counsel of FMR LLC (2003-2010). |
Adrien E. Deberghes (1967) |
Year of Election or Appointment: 2008 Deputy Treasurer |
| Mr. Deberghes also serves as an officer of other funds. He is an employee of Fidelity Investments (2008-present). Prior to joining Fidelity Investments, Mr. Deberghes was Senior Vice President of Mutual Fund Administration at State Street Corporation (2007-2008), Senior Director of Mutual Fund Administration at Investors Bank & Trust (2005-2007), and Director of Finance for Dunkin' Brands (2000-2005). |
Stephanie J. Dorsey (1969) |
Year of Election or Appointment: 2010 Assistant Treasurer |
| Ms. Dorsey also serves as an officer of other funds. She is an employee of Fidelity Investments (2008-present) and has served in other fund officer roles. Prior to joining Fidelity Investments, Ms. Dorsey served as Treasurer (2004-2008) of the JPMorgan Mutual Funds and Vice President (2004-2008) of JPMorgan Chase Bank. |
Scott C. Goebel (1968) |
Year of Election or Appointment: 2008 Secretary and Chief Legal Officer (CLO) |
| Mr. Goebel serves as Secretary and CLO of other funds. Mr. Goebel also serves as Secretary of Fidelity Investments Money Management, Inc. (FIMM) (2010-present) and Fidelity Research and Analysis Company (FRAC) (2010-present); General Counsel, Secretary, and Senior Vice President of FMR (2008-present) and FMR Co., Inc. (2008-present); Chief Legal Officer of Fidelity Management & Research (Hong Kong) Limited (2008-present) and Assistant Secretary of Fidelity Management & Research (Japan) Inc. (2008-present), and Fidelity Management & Research (U.K.) Inc. (2008-present). Previously, Mr. Goebel served as Secretary and CLO of other Fidelity funds (2008-2013), Assistant Secretary of FIMM (2008-2010), FRAC (2008-2010), and certain funds (2007-2008); and as Vice President and Secretary of Fidelity Distributors Corporation (FDC) (2005-2007). Mr. Goebel has been employed by FMR LLC or an affiliate since 2001. |
Joseph A. Hanlon (1968) |
Year of Election or Appointment: 2012 Chief Compliance Officer |
| Mr. Hanlon also serves as Chief Compliance Officer of other funds. Mr. Hanlon serves as Compliance Officer of FMR, FMR Co., Inc., Fidelity Investments Money Management, Inc. (FIMM), Fidelity Research and Analysis Company (FRAC), and Fidelity Management & Research (Hong Kong) (2009-present), as Senior Vice President of the Fidelity Asset Management Division (2009-present), and is an employee of Fidelity Investments. Previously, Mr. Hanlon served as Compliance Officer of Fidelity Management & Research (Japan) Inc. (2009-2013), Strategic Advisers, Inc. (2009-2013), and Fidelity Management & Research (U.K.) Inc. (2009-2013). |
Bruce T. Herring (1965) |
Year of Election or Appointment: 2006 Vice President of certain Equity Funds |
| Mr. Herring also serves as Vice President of other funds. He serves as Chief Investment Officer of Fidelity Global Asset Allocation (GAA) (2013-present), Chief Investment Officer and Director of Fidelity Management & Research (U.K.) Inc. (2010-present), Group Chief Investment Officer of FMR, and President of Fidelity Research & Analysis Company (2010-present). Previously, Mr. Herring served as Vice President (2005-2006) and Senior Vice President (2006-2007) of Fidelity Management & Research Company, Vice President of FMR Co., Inc. (2001-2007), and as a portfolio manager for Fidelity U.S. Equity Funds. |
Brian B. Hogan (1964) |
Year of Election or Appointment: 2009 Vice President |
| Mr. Hogan also serves as Vice President of other funds. Mr. Hogan serves as President of FMR's Equity Division (2009-present). Previously, Mr. Hogan served as Senior Vice President, Equity Research of FMR (2006-2009) and as a portfolio manager. |
Chris Maher (1972) |
Year of Election or Appointment: 2013 Assistant Treasurer |
| Mr. Maher serves as Assistant Treasurer of other funds. Mr. Maher is Vice President of Valuation Oversight and is an employee of Fidelity Investments. Previously, Mr. Maher served as Vice President of Asset Management Compliance (2013), Vice President of FMR's Program Management Group (2010-2013), and Vice President of Valuation Oversight (2008-2010). |
Christine Reynolds (1958) |
Year of Election or Appointment: 2008 Chief Financial Officer |
| Ms. Reynolds also serves as Chief Financial Officer of other funds. Ms. Reynolds became President of Fidelity Pricing and Cash Management Services (FPCMS) in August 2008. Ms. Reynolds served as Chief Operating Officer of FPCMS (2007-2008). Previously, Ms. Reynolds served as President, Treasurer, and Anti-Money Laundering officer of the Fidelity funds (2004-2007). |
Kenneth B. Robins (1969) |
Year of Election or Appointment: 2008 President and Treasurer |
| Mr. Robins also serves as an officer of other funds. Mr. Robins serves as Executive Vice President of Fidelity Investments Money Management, Inc. (FIMM) (2013-present) and is an employee of Fidelity Investments (2004-present). Previously, Mr. Robins served in other fund officer roles. |
Gary W. Ryan (1958) |
Year of Election or Appointment: 2005 Assistant Treasurer |
| Mr. Ryan also serves as Assistant Treasurer of other funds. Mr. Ryan is an employee of Fidelity Investments and has served in other fund officer roles. Previously, Mr. Ryan served as Vice President of Fund Reporting in Fidelity Pricing and Cash Management Services (FPCMS) (1999-2005). |
Stephen Sadoski (1971) |
Year of Election or Appointment: 2012 Deputy Treasurer |
| Mr. Sadoski also serves as Deputy Treasurer of other funds. He is an employee of Fidelity Investments (2012-present) and has served in another fund officer role. Prior to joining Fidelity Investments, Mr. Sadoski served as an assistant chief accountant in the Division of Investment Management of the Securities and Exchange Commission (SEC) (2009-2012) and as a senior manager at Deloitte & Touche LLP (1997-2009). |
Stacie M. Smith (1974) |
Year of Election or Appointment: 2013 Deputy Treasurer |
| Ms. Smith also serves as an officer of other funds. She is an employee of Fidelity Investments (2009-present) and has served in other fund officer roles. Prior to joining Fidelity Investments, Ms. Smith served as Senior Audit Manager of Ernst & Young LLP (1996-2009). |
Renee Stagnone (1975) |
Year of Election or Appointment: 2013 Deputy Treasurer |
| Ms. Stagnone also serves as Deputy Treasurer of other funds. Ms. Stagnone is an employee of Fidelity Investments. |
Joseph F. Zambello (1957) |
Year of Election or Appointment: 2011 Deputy Treasurer |
| Mr. Zambello also serves as Deputy Treasurer of other funds. Mr. Zambello is an employee of Fidelity Investments. Previously, Mr. Zambello served as Vice President of FMR's Program Management Group (2009-2011) and Vice President of the Transfer Agent Oversight Group (2005-2009). |
Annual Report
The Board of Trustees of Fidelity Advisor China Region Fund voted to pay to shareholders of record at the opening of business on record date, the following distributions per share derived from capital gains realized from sales of portfolio securities, and dividends derived from net investment income:
| Pay Date | Record Date | Dividends | Capital Gains |
Class A | 12/09/13 | 12/06/13 | $0.301 | $3.306 |
| | | | |
Class T | 12/09/13 | 12/06/13 | $0.193 | $3.306 |
| | | | |
Class B | 12/09/13 | 12/06/13 | $0.000 | $3.286 |
| | | | |
Class C | 12/09/13 | 12/06/13 | $0.081 | $3.306 |
The fund hereby designates as a capital gain dividend with respect to the taxable year ended October 31, 2013, $120,314,075, or, if subsequently determined to be different, the net capital gain of such year.
Class A designates 63%; Class T designates 78%; Class B designates 100%; and Class C designates 100%; of the dividends distributed in during the fiscal year as amounts which may be taken into account as a dividend for purposes of the maximum rate under section 1(h)(11) of the Internal Revenue Code.
The amounts per share which represent income derived from sources within, and taxes paid to, foreign countries or possessions of the United States are as follows:
| Pay Date | Income | Taxes |
Class A | 12/10/2012 | $0.405 | $0.0650 |
| | | |
Class T | 12/10/2012 | $0.324 | $0.0650 |
| | | |
Class B | 12/10/2012 | $0.160 | $0.0650 |
| | | |
Class C | 12/10/2012 | $0.180 | $0.0650 |
The fund will notify shareholders in January 2014 of amounts for use in preparing 2013 income tax returns.
Annual Report
Board Approval of Investment Advisory Contracts and Management Fees
Fidelity China Region Fund
Each year, the Board of Trustees, including the Independent Trustees (together, the Board), votes on the renewal of the management contract and sub-advisory agreements (together, the Advisory Contracts) for the fund. The Board, assisted by the advice of fund counsel and Independent Trustees' counsel, requests and considers a broad range of information relevant to the renewal of the Advisory Contracts throughout the year.
The Board meets regularly and, at each of its meetings, covers an extensive agenda of topics and materials and considers factors that are relevant to its annual consideration of the renewal of the fund's Advisory Contracts, including the services and support provided to the fund and its shareholders. The Board has established various standing committees, each composed of and chaired by Independent Trustees with varying backgrounds, to which the Board has assigned specific subject matter responsibilities in order to enhance effective decision-making by the Board. The Board, acting directly and through its Committees, requests and receives information concerning the annual consideration of the renewal of the fund's Advisory Contracts. The Board also meets as needed to consider matters specifically related to the Board's annual consideration of the renewal of Advisory Contracts. Members of the Board may also meet with trustees of other Fidelity funds through ad hoc joint committees to discuss certain matters relevant to the Fidelity funds.
At its July 2013 meeting, the Board, including the Independent Trustees, unanimously determined to renew the fund's Advisory Contracts. In reaching its determination, the Board considered all factors it believed relevant, including (i) the nature, extent, and quality of the services to be provided to the fund and its shareholders (including the investment performance of the fund); (ii) the competitiveness of the fund's management fee and total expense ratio relative to peer funds; (iii) the total costs of the services to be provided by and the profits to be realized by Fidelity from its relationship with the fund; (iv) the extent to which economies of scale exist and would be realized as the fund grows; and (v) whether fee levels reflect these economies of scale, if any, for the benefit of fund shareholders.
In considering whether to renew the Advisory Contracts for the fund, the Board reached a determination, with the assistance of fund counsel and Independent Trustees' counsel and through the exercise of its business judgment, that the renewal of the Advisory Contracts was in the best interests of the fund and its shareholders and that the compensation payable under the Advisory Contracts was fair and reasonable. The Board's decision to renew the Advisory Contracts was not based on any single factor, but rather was based on a comprehensive consideration of all the information provided to the Board at its meetings throughout the year. The Board, in reaching its determination to renew the Advisory Contracts, was aware that shareholders in the fund have a broad range of investment choices available to them, including a wide choice among mutual funds offered by Fidelity's competitors, and that the fund's shareholders, who have the opportunity to review and weigh the disclosure provided by the fund in its prospectus and other public disclosures, have chosen to invest in this fund, which is a part of the Fidelity family of funds.
Nature, Extent, and Quality of Services Provided. The Board considered the staffing within the investment adviser, Fidelity Management & Research Company (FMR), and the sub-advisers (together, the Investment Advisers) as it relates to the fund, including the backgrounds of the fund's investment personnel, and also considered the fund's investment objective, strategies, and related investment philosophy. The Independent Trustees also had discussions with senior management of Fidelity's investment operations and investment groups. The Board considered the structure of the portfolio manager compensation program and whether this structure provides appropriate incentives to act in the best interests of the fund.
Resources Dedicated to Investment Management and Support Services. The Board and the Fund Oversight and Research Committees reviewed the general qualifications and capabilities of the Investment Advisers' investment staff, including its size, education, experience, and resources, as well as the Investment Advisers' approach to recruiting, training, managing, and compensating investment personnel. The Board noted that FMR has continued to increase the resources devoted to non-U.S. offices, including expansion of Fidelity's global investment organization. The Board also noted that Fidelity's analysts have extensive resources, tools and capabilities that allow them to conduct sophisticated quantitative and fundamental analysis, as well as credit analysis of issuers, counterparties and guarantors. Further, the Board believes that Fidelity's investment professionals have sufficient access to global information and data so as to provide competitive investment results over time, and that those professionals also have access to sophisticated tools that permit them to assess portfolio construction and risk and performance attribution characteristics continuously, as well as to transmit new information and research conclusions rapidly around the world. Additionally, in its deliberations, the Board considered the Investment Advisers' trading and risk management capabilities and resources, which are an integral part of the investment management process.
Shareholder and Administrative Services. The Board considered (i) the nature, extent, quality, and cost of advisory, administrative, and shareholder services performed by the Investment Advisers and their affiliates under the Advisory Contracts and under separate agreements covering transfer agency, pricing and bookkeeping, and securities lending services for the fund; (ii) the nature and extent of the supervision of third party service providers, principally custodians and subcustodians; and (iii) the resources devoted to, and the record of compliance with, the fund's compliance policies and procedures. The Board also reviewed the allocation of fund brokerage, including allocations to brokers affiliated with the Investment Advisers, the use of brokerage commissions to pay fund expenses, and the use of "soft" commission dollars to pay for research services.
The Board noted that the growth of fund assets over time across the complex allows Fidelity to reinvest in the development of services designed to enhance the value or convenience of the Fidelity funds as investment vehicles. These services include 24-hour access to account information and market information through telephone representatives and over the Internet, investor education materials and asset allocation tools, and the expanded availability of Fidelity Investor Centers.
Annual Report
Board Approval of Investment Advisory Contracts and Management Fees - continued
Investment in a Large Fund Family. The Board considered the benefits to shareholders of investing in a Fidelity fund, including the benefits of investing in a fund that is part of a large family of funds offering a variety of investment disciplines and providing a large variety of mutual fund investor services. The Board noted that Fidelity had taken, or had made recommendations that resulted in the Fidelity funds taking, a number of actions over the previous year that benefited particular funds, including (i) continuing to dedicate additional resources to investment research and to the support of the senior management team that oversees asset management; (ii) persisting in efforts to enhance Fidelity's global research capabilities; (iii) launching new funds and making other enhancements to meet client needs for global and income-oriented solutions; (iv) continuing to launch dedicated lower cost underlying funds to meet portfolio construction needs related to expanding underlying fund options for Fidelity funds of funds, specifically for the Freedom Fund product lines; (v) rationalizing product lines and gaining increased efficiencies through the mergers of several funds into other funds; (vi) strengthening Fidelity's index fund offerings by reducing investment minimums and adopting or lowering existing expense caps for certain funds and classes; (vii) enhancing Global Asset Allocation product offerings by launching new funds and strategies, including "open architecture" target date funds that utilize affiliated and unaffiliated sub-advisers; (viii) modifying the eligibility criteria for Institutional Class shares of Advisor funds to increase their marketability to a portion of the defined contribution plan market; (ix) creating a new low-cost retirement share class for certain Advisor funds to appeal to large retirement plans; (x) transitioning the management of certain Fidelity commodity funds to Geode Capital Management LLC, a registered commodity pool operator, while retaining administrative responsibilities for the funds; (xi) reorganizing a number of funds; and (xii) taking steps toward establishing a new Fidelity adviser to manage sector-based funds and products.
Investment Performance. The Board considered whether the fund has operated in accordance with its investment objective, as well as its record of compliance with its investment restrictions and its performance history. The Board noted that there was a portfolio management change for the fund in October 2011.
The Board took into account discussions with the Investment Advisers about fund investment performance that occur at Board meetings throughout the year. In this regard the Board noted that as part of regularly scheduled fund reviews and other reports to the Board on fund performance, the Board periodically considers annualized return information for the fund, for different time periods, measured against a securities market index ("benchmark index") and a peer group of mutual funds with similar objectives ("peer group"). In its evaluation of fund investment performance, the Board gave particular attention to information indicating changes in performance of certain Fidelity funds for specific time periods and the Investment Advisers' explanations for any overperformance or underperformance.
In addition to reviewing absolute and relative fund performance, the Independent Trustees periodically consider the appropriateness of fund performance metrics in evaluating the results achieved. In general, the Independent Trustees believe that fund performance should be evaluated based on net performance (after fees and expenses) of both the highest performing and lowest performing classes, where applicable, compared to appropriate benchmark indices, over appropriate time periods which may include full market cycles, and compared to peer groups, as applicable, over the same periods, taking into account relevant factors including the following: general market conditions; issuer-specific information; tactical opportunities for investment; and fund cash flows and other factors.
The Independent Trustees recognize that shareholders evaluate performance on a net basis over their own holding periods, for which one-, three-, and five-year periods are used as a proxy. For this reason, the performance information reviewed by the Board also included net cumulative calendar year total return information for the fund and an appropriate benchmark index for the most recent one-, three-, and five-year periods, as shown below. A peer group comparison is not shown below.
Annual Report
Fidelity China Region Fund

Based on its review, the Board concluded that the nature, extent, and quality of services provided to the fund under the Advisory Contracts should benefit the fund's shareholders.
Competitiveness of Management Fee and Total Expense Ratio. The Board considered the fund's management fee and total expense ratio compared to "mapped groups" of competitive funds and classes. Fidelity creates "mapped groups" by combining similar Lipper investment objective categories that have comparable management fee characteristics. Combining Lipper investment objective categories aids the Board's management fee and total expense ratio comparisons by broadening the competitive group used for comparison and by reducing the number of universes to which various Fidelity funds are compared.
Management Fee. The Board considered two proprietary management fee comparisons for the 12-month periods shown in the chart below. The group of Lipper funds used by the Board for management fee comparisons is referred to below as the "Total Mapped Group." The Total Mapped Group comparison focuses on a fund's standing in terms of gross management fees before expense reimbursements or caps relative to the total universe of funds with comparable investment mandates, regardless of whether their management fee structures also are comparable. Funds with comparable investment mandates offer exposure to similar types of securities. Funds with comparable management fee structures have similar management fee contractual arrangements (e.g., flat rate charged for advisory services, all-inclusive fee rate, etc.). "TMG %" represents the percentage of funds in the Total Mapped Group that had management fees that were lower than the fund's. For example, a TMG % of 8% means that 92% of the funds in the Total Mapped Group had higher management fees than the fund. The "Asset-Size Peer Group" (ASPG) comparison focuses on a fund's standing relative to a subset of non-Fidelity funds within the Total Mapped Group that are similar in size and management fee structure. The ASPG represents at least 15% of the funds in the Total Mapped Group with comparable asset size and management fee structures, subject to a minimum of 50 funds (or all funds in the Total Mapped Group if fewer than 50). Additional information, such as the ASPG quartile in which the fund's management fee ranked, is also included in the chart and considered by the Board.
Annual Report
Board Approval of Investment Advisory Contracts and Management Fees - continued
Fidelity China Region Fund

The Board noted that the fund's management fee ranked below the median of its Total Mapped Group and below the median of its ASPG for 2012.
Based on its review, the Board concluded that the fund's management fee is fair and reasonable in light of the services that the fund receives and the other factors considered.
Total Expense Ratio. In its review of each class's total expense ratio, the Board considered the fund's management fee as well as other fund or class expenses, as applicable, such as transfer agent fees, pricing and bookkeeping fees, fund-paid 12b-1 fees, and custodial, legal, and audit fees. The Board also noted the effects of any waivers and reimbursements on fees and expenses. As part of its review, the Board also considered the current and historical total expense ratios of each class of the fund compared to competitive fund median expenses. Each class of the fund is compared to those funds and classes in the Total Mapped Group (used by the Board for management fee comparisons) that have a similar sales load structure.
The Board noted that the total expense ratio of each class ranked below its competitive median for 2012.
Fees Charged to Other Fidelity Clients. The Board also considered Fidelity fee structures and other information with respect to clients of FMR and its affiliates, such as other mutual funds advised or subadvised by FMR or its affiliates, pension plan clients, and other institutional clients. The Board noted the findings of the 2013 ad hoc joint committee (created with the board of other Fidelity funds), which reviewed and compared Fidelity's institutional investment advisory business with its business of providing services to the Fidelity funds, including the differences in services provided, fees charged, and costs incurred, as well as competition in their respective marketplaces.
Based on its review of total expense ratios and fees charged to other Fidelity clients, the Board concluded that the total expense ratio of each class of the fund was reasonable in light of the services that the fund and its shareholders receive and the other factors considered.
Costs of the Services and Profitability. The Board considered the revenues earned and the expenses incurred by Fidelity in conducting the business of developing, marketing, distributing, managing, administering and servicing the fund and servicing the fund's shareholders. The Board also considered the level of Fidelity's profits in respect of all the Fidelity funds.
On an annual basis, FMR presents to the Board Fidelity's profitability for the fund. Fidelity calculates the profitability for each fund, as well as aggregate profitability for groups of Fidelity funds and all Fidelity funds, using a series of detailed revenue and cost allocation methodologies which originate with the books and records of Fidelity on which Fidelity's audited financial statements are based. The Audit Committee of the Board reviews any significant changes from the prior year's methodologies.
PricewaterhouseCoopers LLP (PwC), independent registered public accounting firm and auditor to Fidelity and certain Fidelity funds, has been engaged annually by the Board as part of the Board's assessment of Fidelity's profitability analysis. PwC's engagement includes the review and assessment of the methodologies used by Fidelity in determining the revenues and expenses attributable to Fidelity's mutual fund business, and completion of agreed-upon procedures surrounding the mathematical accuracy of fund profitability and its conformity to allocation methodologies. After considering PwC's reports issued under the engagement and information provided by Fidelity, the Board concluded that while other allocation methods may also be reasonable, Fidelity's profitability methodologies are reasonable in all material respects.
Annual Report
The Board also reviewed Fidelity's non-fund businesses and fall-out benefits related to the mutual fund business as well as cases where Fidelity's affiliates may benefit from or be related to the fund's business.
The Board considered the costs of the services provided by and the profits realized by Fidelity in connection with the operation of the fund and was satisfied that the profitability was not excessive in the circumstances.
Economies of Scale. The Board considered whether there have been economies of scale in respect of the management of the Fidelity funds, whether the Fidelity funds (including the fund) have appropriately benefited from any such economies of scale, and whether there is potential for realization of any further economies of scale. The Board considered the extent to which the fund will benefit from economies of scale through increased services to the fund, through waivers or reimbursements, or through fee or expense reductions. The Board also noted that in 2009, it and the board of other Fidelity funds created an ad hoc committee (the Economies of Scale Committee) to analyze whether FMR attains economies of scale in respect of the management and servicing of the Fidelity funds, whether the Fidelity funds have appropriately benefited from such economies of scale, and whether there is potential for realization of any further economies of scale.
The Board recognized that the fund's management contract incorporates a "group fee" structure, which provides for lower group fee rates as total fund assets under FMR's management increase, and for higher group fee rates as total fund assets under FMR's management decrease. FMR calculates the group fee rates based on a tiered asset "breakpoint" schedule that varies based on asset class. The Board considered that the group fee is designed to deliver the benefits of economies of scale to fund shareholders when total Fidelity fund assets increase, even if assets of any particular fund are unchanged or have declined, because some portion of Fidelity's costs are attributable to services provided to all Fidelity funds, and all funds benefit if those costs can be allocated among more assets. The Board concluded that, given the group fee structure, fund shareholders will benefit from lower management fees as assets under FMR's management increase at the fund complex level, regardless of whether Fidelity achieves any such economies of scale.
The Board concluded, taking into account the analysis of the Economies of Scale Committee, that economies of scale, if any, are being appropriately shared between fund shareholders and Fidelity.
Amendment to Description of Group Fee Rate. At its July 2013 meeting, the Board voted to approve an amendment to the fund's management contract to modify the description of the "group fee rate" effective August 1, 2013. The Board noted that under the prior description in the contract, the group fee rate was based on the average net assets of all registered investment companies with which FMR has management contracts. Under the contract's tiered asset breakpoint schedule, the group fee rate is lower as total fund assets under FMR's management increase, and higher as total fund assets under FMR's management decrease. The Board considered that the prior description would have excluded the assets of 64 Fidelity sector funds from the group fee rate calculation once Fidelity SelectCo, LLC, an affiliate of FMR, assumed management responsibilities for those funds. The Board noted that modifying the description of the group fee rate to continue to include the assets of those 64 funds for purposes of determining group fee rate breakpoints would avoid an immediate adverse impact on the group fee rate for any fund.
Additional Information Requested by the Board. In order to develop fully the factual basis for consideration of the Fidelity funds' Advisory Contracts, the Board requested and received additional information on certain topics, including: (i) fund performance trends and Fidelity's long-term strategies for certain funds; (ii) the potential to further rationalize the Fidelity fund lineup with the possibility of achieving savings for the funds and Fidelity; (iii) the methodology with respect to competitive fund data and peer group classifications; (iv) the arrangements with, and performance of, certain sub-advisers on behalf of the Fidelity funds, as well as certain proposed participating affiliate arrangements; (v) the realization of fall-out benefits in certain Fidelity business units; (vi) Fidelity's group fee structures, including the rationale for the individual fee rates of certain categories of funds and the definition of group assets; (vii) trends regarding industry use of performance fee structures and the performance adjustment methodologies applicable to the Fidelity funds; (viii) additional competitive analysis regarding the total expenses for certain classes; and (ix) fund profitability methodology, including Fidelity's cost allocation methodology, and the impact of certain factors on fund profitability results.
Based on its evaluation of all of the conclusions noted above, and after considering all factors it believed relevant, the Board ultimately concluded that the advisory fee structures are fair and reasonable, and that the fund's Advisory Contracts should be renewed.
Annual Report
Investment Adviser
Fidelity Management & Research Company
Boston, MA
Investment Sub-Advisers
FMR Co., Inc.
Fidelity Management & Research
(U.K.) Inc.
Fidelity Management & Research
(Japan) Inc.
Fidelity Management & Research
(Hong Kong) Limited
FIL Investments (Japan) Limited
FIL Investment Advisors
FIL Investment Advisors
(UK) Limited
General Distributor
Fidelity Distributors Corporation
Smithfield, RI
Transfer and Service Agents
Fidelity Investments Institutional
Operations Company, Inc.
Boston, MA
Fidelity Service Company, Inc.
Boston, MA
Custodian
Brown Brothers Harriman & Co.,
Boston, MA
(Fidelity Investment logo)(registered trademark)
Corporate Headquarters
245 Summer St., Boston, MA 02210
www.fidelity.com
AHKC-UANN-1213
1.861458.105
Fidelity Advisor®
China Region Fund -
Institutional Class
Annual Report
October 31, 2013
Institutional Class is a class of
Fidelity® China Region Fund
(Fidelity Cover Art)
Contents
Performance | (Click Here) | How the fund has done over time. |
Management's Discussion of Fund Performance | (Click Here) | The Portfolio Manager's review of fund performance and strategy. |
Shareholder Expense Example | (Click Here) | An example of shareholder expenses. |
Investment Changes | (Click Here) | A summary of major shifts in the fund's investments over the past six months. |
Investments | (Click Here) | A complete list of the fund's investments with their market values. |
Financial Statements | (Click Here) | Statements of assets and liabilities, operations, and changes in net assets, as well as financial highlights. |
Notes | (Click Here) | Notes to the financial statements. |
Report of Independent Registered Public Accounting Firm | (Click Here) | |
Trustees and Officers | (Click Here) | |
Distributions | (Click Here) | |
Board Approval of Investment Advisory Contracts and Management Fees | (Click Here) | |
To view a fund's proxy voting guidelines and proxy voting record for the 12-month period ended June 30, visit http://www.fidelity.com/proxyvotingresults or visit the Securities and Exchange Commission's (SEC) web site at http://www.sec.gov. You may also call 1-877-208-0098 to request a free copy of the proxy voting guidelines.
Standard & Poor's, S&P and S&P 500 are registered service marks of The McGraw-Hill Companies, Inc. and have been licensed for use by Fidelity Distributors Corporation.
Other third-party marks appearing herein are the property of their respective owners.
All other marks appearing herein are registered or unregistered trademarks or service marks of FMR LLC or an affiliated company. © 2013 FMR LLC. All rights reserved.
This report and the financial statements contained herein are submitted for the general information of the shareholders of the fund. This report is not authorized for distribution to prospective investors in the fund unless preceded or accompanied by an effective prospectus.
A fund files its complete schedule of portfolio holdings with the SEC for the first and third quarters of each fiscal year on Form N-Q. Forms N-Q are available on the SEC's web site at http://www.sec.gov. A fund's Forms N-Q may be reviewed and copied at the SEC's Public Reference Room in Washington, DC. Information regarding the operation of the SEC's Public Reference Room may be obtained by calling 1-800-SEC-0330. For a complete list of a fund's portfolio holdings, view the most recent holdings listing, semiannual report, or annual report on Fidelity's web site at http://www.fidelity.com, http://www.advisor.fidelity.com, or http://www.401k.com, as applicable.
NOT FDIC INSURED • MAY LOSE VALUE • NO BANK GUARANTEE
Neither the fund nor Fidelity Distributors Corporation is a bank.
Annual Report
Performance: The Bottom Line
Average annual total return reflects the change in the value of an investment, assuming reinvestment of the class' distributions from dividend income and capital gains (the profits earned upon the sale of securities that have grown in value, if any) and assuming a constant rate of performance each year. The $10,000 table and the fund's returns do not reflect the deduction of taxes that a shareholder would pay on fund distributions or the redemption of fund shares. During periods of reimbursement by Fidelity, a fund's total return will be greater than it would be had the reimbursement not occurred. How a fund did yesterday is no guarantee of how it will do tomorrow.
Average Annual Total Returns
Periods ended October 31, 2013 | Past 1
year | Past 5
years | Past 10
years |
Institutional Class A | 26.58% | 18.16% | 12.04% |
A The initial offering of Institutional Class shares took place on May 9, 2008. Returns prior to May 9, 2008, are those of Fidelity® China Region Fund, the original class of the fund.
$10,000 Over 10 Years
Let's say hypothetically that $10,000 was invested in Fidelity Advisor® China Region Fund - Institutional Class on October 31, 2003. The chart shows how the value of your investment would have changed, and also shows how the MSCI® Golden Dragon Index performed over the same period. See footnote A above for additional information regarding the performance of Institutional Class.
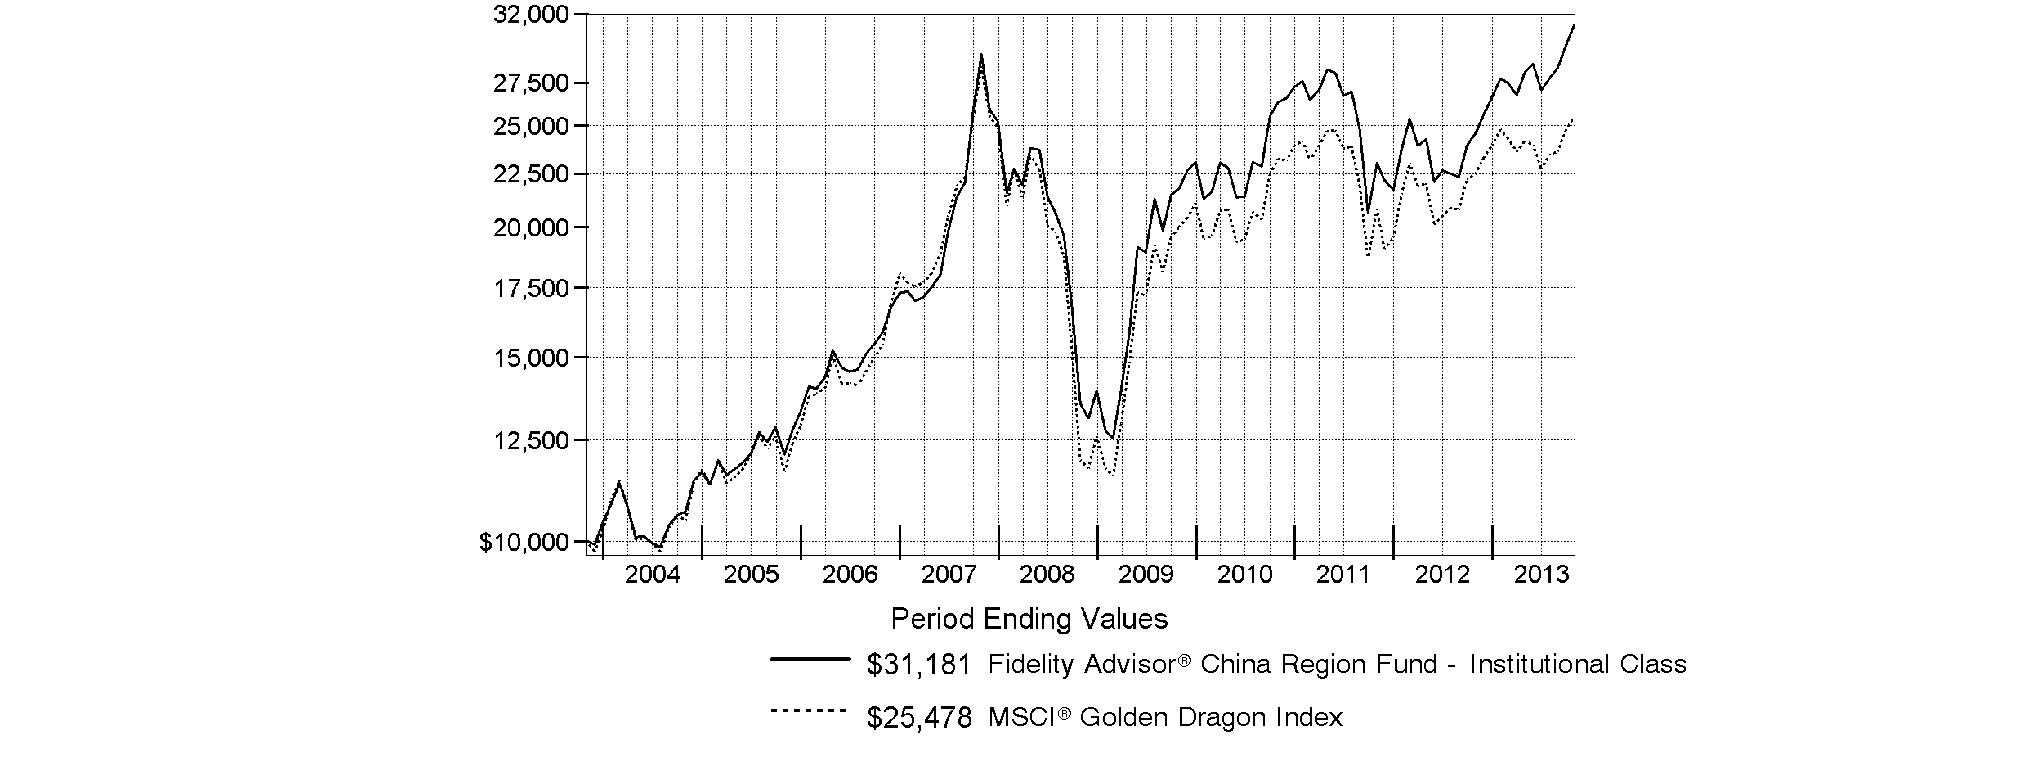
Annual Report
Market Recap: On balance, global equity markets remained upbeat for the 12-month period ending October 31, 2013. The MSCI® ACWI® (All Country World Index) Index gained 23.75% for the period, amid investor preference for higher-risk assets. The period was not without turbulence, however. In the spring and summer, central banks worldwide, especially in the U.S. and China, made clear their intentions to maintain accommodative monetary policies. That stance, combined with modest cyclical improvements around the globe and generally low valuations, underpinned the broad rally in equities. Europe (+32%) shone brightly, with most markets in the region - large and small - registering solid, index-beating gains. Another bright spot was Japan, which, despite a struggling yen and taking a second-half breather, posted a 34% result for the full year. The U.S. - by far the index's biggest constituent - also outperformed the global market with a roughly 28% advance. Meanwhile, Asia-Pacific ex Japan (+14%) lagged, hurt in part by a slowdown in Australia's mining industry as well as currency headwinds. Foreign-exchange and commodity weakness also curbed results in resource-heavy Canada and emerging markets (EM), both of which were up 7%. Country-level EM performance diverged meaningfully for the period, as evidenced by performance in Brazil (-1%), Russia (+12%), India (+1%) and China (+8%).
Comments from Robert Bao, Portfolio Manager of Fidelity Advisor® China Region Fund: For the year, the fund's Institutional Class shares returned 26.58%, roughly doubling the 13.27% gain of the MSCI® Golden Dragon Index. Consumer discretionary was a sector in which I significantly increased the fund's weighting during the period. Versus the index, this sector bolstered our results the most by a wide margin and accounted for the fund's three largest relative contributors. The top relative contributor was China-based automaker Chongqing Changan Automobile, a non-index position I added to the fund during the period. The company's joint venture with U.S.-based Ford Motor continued to move in the right direction. Other notable contributors were Taiwan-headquartered ECLAT Textile and Chinese Internet travel portal Ctrip.com International, the latter of which was not in the index and benefited from the surging popularity of online travel reservations in China. On the negative side, financials was the most noteworthy detractor, with stock picking in banks particularly problematic. At the stock level, the largest relative detractor was Spreadtrum Communications, a non-index semiconductor company located in China. The firm was pressured early in the period by greater competition, and with its growth prospects apparently deteriorating, I sold it in January. Also detracting was Chinese property developer Greenland Hong Kong Holdings, which changed its name from SPG Land in August 2013. This non-index stock faltered in part because of a delay in an expected capital injection from its parent company.
Note to shareholders: Fidelity Advisor China Region Fund may invest up to 35% of its total assets in any industry that represents more than 20% of the Hong Kong, Taiwanese and Chinese market. As of October 31, 2013, the fund did not have more than 25% of its total assets invested in any one industry.
The views expressed above reflect those of the portfolio manager(s) only through the end of the period as stated on the cover of this report and do not necessarily represent the views of Fidelity or any other person in the Fidelity organization. Any such views are subject to change at any time based upon market or other conditions and Fidelity disclaims any responsibility to update such views. These views may not be relied on as investment advice and, because investment decisions for a Fidelity fund are based on numerous factors, may not be relied on as an indication of trading intent on behalf of any Fidelity fund.
Annual Report
Fidelity China Region Fund
As a shareholder of the Fund, you incur two types of costs: (1) transaction costs, including sales charges (loads) on purchase payments or redemption proceeds, redemption fees and (2) ongoing costs, including management fees, distribution and/or service (12b-1) fees and other Fund expenses. This Example is intended to help you understand your ongoing costs (in dollars) of investing in the Fund and to compare these costs with the ongoing costs of investing in other mutual funds.
The Example is based on an investment of $1,000 invested at the beginning of the period and held for the entire period (May 1, 2013 to October 31, 2013).
Actual Expenses
The first line of the accompanying table for each class of the Fund provides information about actual account values and actual expenses. You may use the information in this line, together with the amount you invested, to estimate the expenses that you paid over the period. Simply divide your account value by $1,000.00 (for example, an $8,600 account value divided by $1,000.00 = 8.6), then multiply the result by the number in the first line for a class of the Fund under the heading entitled "Expenses Paid During Period" to estimate the expenses you paid on your account during this period. A small balance maintenance fee of $12.00 that is charged once a year may apply for certain accounts with a value of less than $2,000. This fee is not included in the table below. If it was, the estimate of expenses you paid during the period would be higher, and your ending account value lower, by this amount. In addition, the Fund, as a shareholder in the underlying Fidelity Central Funds, will indirectly bear its pro-rata share of the fees and expenses incurred by the underlying Fidelity Central Funds. These fees and expenses are not included in the Fund's annualized expense ratio used to calculate the expense estimate in the table below.
Hypothetical Example for Comparison Purposes
The second line of the accompanying table for each class of the Fund provides information about hypothetical account values and hypothetical expenses based on a Class' actual expense ratio and an assumed rate of return of 5% per year before expenses, which is not the Class' actual return. The hypothetical account values and expenses may not be used to estimate the actual ending account balance or expenses you paid for the period. You may use this information to compare the ongoing costs of investing in the Fund and other funds. To do so, compare this 5% hypothetical example with the 5% hypothetical examples that appear in the shareholder reports of the other funds. A small balance maintenance fee of $12.00 that is charged once a year may apply for certain accounts with a value of less than $2,000. This fee is not included in the table below. If it was, the estimate of expenses you paid during the period would be higher, and your ending account value lower, by this amount. In addition, the Fund, as a shareholder in the underlying Fidelity Central Funds, will indirectly bear its pro-rata share of the fees and expenses incurred by the underlying Fidelity Central Funds. These fees and expenses are not included in the Fund's annualized expense ratio used to calculate the expense estimate in the table below.
Please note that the expenses shown in the table are meant to highlight your ongoing costs only and do not reflect any transaction costs. Therefore, the second line of the table is useful in comparing ongoing costs only, and will not help you determine the relative total costs of owning different funds. In addition, if these transactional costs were included, your costs would have been higher.
| Annualized
Expense RatioB | Beginning
Account Value
May 1, 2013 | Ending
Account Value
October 31, 2013 | Expenses Paid
During Period*
May 1, 2013
to October 31, 2013 |
Class A | 1.34% | | | |
Actual | | $ 1,000.00 | $ 1,106.80 | $ 7.12 |
HypotheticalA | | $ 1,000.00 | $ 1,018.45 | $ 6.82 |
Class T | 1.64% | | | |
Actual | | $ 1,000.00 | $ 1,105.20 | $ 8.70 |
HypotheticalA | | $ 1,000.00 | $ 1,016.94 | $ 8.34 |
Class B | 2.09% | | | |
Actual | | $ 1,000.00 | $ 1,102.70 | $ 11.08 |
HypotheticalA | | $ 1,000.00 | $ 1,014.67 | $ 10.61 |
Class C | 2.09% | | | |
Actual | | $ 1,000.00 | $ 1,102.40 | $ 11.08 |
HypotheticalA | | $ 1,000.00 | $ 1,014.67 | $ 10.61 |
China Region | 1.01% | | | |
Actual | | $ 1,000.00 | $ 1,108.60 | $ 5.37 |
HypotheticalA | | $ 1,000.00 | $ 1,020.11 | $ 5.14 |
Institutional Class | .95% | | | |
Actual | | $ 1,000.00 | $ 1,108.90 | $ 5.05 |
HypotheticalA | | $ 1,000.00 | $ 1,020.42 | $ 4.84 |
A 5% return per year before expenses
B Annualized expense ratio reflects expenses net of applicable fee waivers.
* Expenses are equal to each Class' annualized expense ratio, multiplied by the average account value over the period, multiplied by 184/365 (to reflect the one-half year period).
Annual Report
Fidelity China Region Fund
Investment Changes (Unaudited)
Geographic Diversification (% of fund's net assets) |
As of October 31, 2013 |
| Cayman Islands | 24.1% | |
| China | 20.9% | |
| Hong Kong | 16.7% | |
| Taiwan | 14.8% | |
| Bermuda | 10.6% | |
| United States of America* | 6.9% | |
| Japan | 2.1% | |
| Korea (South) | 1.7% | |
| Italy | 1.5% | |
| Other | 0.7% | |

* Includes Short-Term Investments and Net Other Assets (Liabilities). |
Percentages are based on country or territory of incorporation and are adjusted for the effect of futures contracts, if applicable. |
As of April 30, 2013 |
| Hong Kong | 24.3% | |
| China | 23.8% | |
| Cayman Islands | 20.9% | |
| Taiwan | 19.2% | |
| Bermuda | 6.8% | |
| Korea (South) | 1.3% | |
| United States of America* | 1.2% | |
| Italy | 1.0% | |
| Thailand | 0.6% | |
| Other | 0.9% | |

* Includes Short-Term Investments and Net Other Assets (Liabilities). |
Percentages are based on country or territory of incorporation and are adjusted for the effect of futures contracts, if applicable. |
Asset Allocation as of October 31, 2013 |
| % of fund's
net assets | % of fund's net assets
6 months ago |
Stocks | 95.3 | 99.3 |
Short-Term Investments and Net Other Assets (Liabilities) | 4.7 | 0.7 |
Top Ten Stocks as of October 31, 2013 |
| % of fund's
net assets | % of fund's net assets
6 months ago |
Tencent Holdings Ltd. (Internet Software & Services) | 6.8 | 4.4 |
Taiwan Semiconductor Manufacturing Co. Ltd. (Semiconductors & Semiconductor Equipment) | 5.7 | 5.7 |
AIA Group Ltd. (Insurance) | 5.1 | 4.8 |
Industrial & Commercial Bank of China Ltd. (H Shares) (Commercial Banks) | 3.7 | 4.0 |
China Construction Bank Corp. (H Shares) (Commercial Banks) | 3.7 | 3.9 |
Chongqing Changan Automobile Co. Ltd. (B Shares) (Automobiles) | 3.0 | 2.3 |
Summit Ascent Holdings Ltd. (Trading Companies & Distributors) | 2.5 | 0.0 |
Sinopec Kantons Holdings Ltd. (Oil, Gas & Consumable Fuels) | 2.3 | 1.4 |
Galaxy Entertainment Group Ltd. (Hotels, Restaurants & Leisure) | 1.7 | 1.3 |
Brilliance China Automotive Holdings Ltd. (Automobiles) | 1.7 | 0.5 |
| 36.2 | |
Market Sectors as of October 31, 2013 |
| % of fund's
net assets | % of fund's net assets
6 months ago |
Consumer Discretionary | 25.7 | 21.7 |
Information Technology | 24.8 | 21.5 |
Financials | 21.8 | 32.1 |
Industrials | 7.6 | 7.3 |
Materials | 3.9 | 5.2 |
Energy | 3.2 | 3.0 |
Health Care | 3.1 | 2.1 |
Utilities | 3.0 | 3.9 |
Telecommunication Services | 1.6 | 2.1 |
Consumer Staples | 0.6 | 0.4 |
Annual Report
Fidelity China Region Fund
Investments October 31, 2013
Showing Percentage of Net Assets
Common Stocks - 95.3% |
| Shares | | Value |
CONSUMER DISCRETIONARY - 25.7% |
Automobiles - 7.2% |
Brilliance China Automotive Holdings Ltd. | 14,164,000 | | $ 24,772,841 |
Chongqing Changan Automobile Co. Ltd. (B Shares) | 24,223,686 | | 44,679,312 |
Geely Automobile Holdings Ltd. | 25,170,000 | | 12,693,757 |
Great Wall Motor Co. Ltd. (H Shares) | 1,600,000 | | 9,400,232 |
Guangzhou Automobile Group Co. Ltd. (H Shares) | 12,000,000 | | 14,239,649 |
| | 105,785,791 |
Hotels, Restaurants & Leisure - 6.9% |
Galaxy Entertainment Group Ltd. (a) | 3,451,000 | | 25,750,077 |
Hotel Shilla Co. | 132,714 | | 8,565,982 |
Melco International Development Ltd. | 7,009,000 | | 22,013,304 |
Melco Crown Entertainment Ltd. sponsored ADR (a) | 403,400 | | 13,376,744 |
Sands China Ltd. | 3,241,800 | | 23,039,234 |
Shangri-La Asia Ltd. | 5,000,000 | | 9,157,745 |
| | 101,903,086 |
Household Durables - 1.3% |
Techtronic Industries Co. Ltd. | 7,728,000 | | 19,437,121 |
Internet & Catalog Retail - 1.0% |
Ctrip.com International Ltd. sponsored ADR (a) | 260,916 | | 14,154,693 |
Leisure Equipment & Products - 1.2% |
Goodbaby International Holdings Ltd. | 16,000,000 | | 7,904,037 |
Merida Industry Co. Ltd. | 1,309,450 | | 9,920,413 |
| | 17,824,450 |
Media - 1.4% |
ChinaVision Media Group Ltd. (a) | 110,780,000 | | 6,787,115 |
Fuji Media Holdings, Inc. | 350,000 | | 6,977,377 |
SinoMedia Holding Ltd. | 8,000,000 | | 7,450,019 |
| | 21,214,511 |
Multiline Retail - 1.6% |
Lifestyle International Holdings Ltd. | 3,953,500 | | 8,617,845 |
Springland International Holdings Ltd. | 25,897,000 | | 14,196,085 |
| | 22,813,930 |
Specialty Retail - 2.0% |
Baoxin Auto Group Ltd. (d) | 21,494,000 | | 22,151,046 |
Oriental Watch Holdings Ltd. | 23,466,000 | | 7,506,214 |
| | 29,657,260 |
Textiles, Apparel & Luxury Goods - 3.1% |
ECLAT Textile Co. Ltd. | 1,486,140 | | 16,333,151 |
Prada SpA | 2,299,200 | | 22,419,647 |
Shenzhou International Group Holdings Ltd. | 2,046,000 | | 7,046,072 |
| | 45,798,870 |
TOTAL CONSUMER DISCRETIONARY | | 378,589,712 |
|
| Shares | | Value |
CONSUMER STAPLES - 0.6% |
Food Products - 0.6% |
China Mengniu Dairy Co. Ltd. | 2,000,000 | | $ 8,796,595 |
ENERGY - 3.2% |
Energy Equipment & Services - 0.9% |
China Oilfield Services Ltd. (H Shares) | 3,520,000 | | 9,852,186 |
Hilong Holding Ltd. | 5,400,000 | | 3,593,964 |
| | 13,446,150 |
Oil, Gas & Consumable Fuels - 2.3% |
Sinopec Kantons Holdings Ltd. (d) | 37,162,000 | | 33,888,216 |
TOTAL ENERGY | | 47,334,366 |
FINANCIALS - 21.8% |
Capital Markets - 0.1% |
SAIC Motor Corp. Ltd. Class A (UBS Warrant Programme) warrants 9/16/14 (a) | 798,200 | | 1,878,118 |
Commercial Banks - 9.4% |
BOC Hong Kong (Holdings) Ltd. | 7,402,000 | | 24,154,598 |
China Construction Bank Corp. (H Shares) | 69,778,000 | | 54,180,776 |
Industrial & Commercial Bank of China Ltd. (H Shares) | 78,024,000 | | 54,645,985 |
SAIC Motor Corp. Ltd. Class A (BNP Paribas Warrant Program) warrants 8/5/15 (a) | 2,201,800 | | 5,180,706 |
| | 138,162,065 |
Insurance - 6.6% |
AIA Group Ltd. | 14,982,600 | | 76,043,507 |
China Pacific Insurance Group Co. Ltd. (H Shares) | 5,999,200 | | 21,666,142 |
| | 97,709,649 |
Real Estate Investment Trusts - 0.5% |
Champion (REIT) | 15,000,000 | | 6,694,183 |
Real Estate Management & Development - 5.2% |
CSI Properties Ltd. | 144,620,000 | | 5,036,425 |
Great Eagle Holdings Ltd. | 2,150,000 | | 7,653,811 |
Greenland Hong Kong Holdings Ltd. | 15,000,000 | | 10,602,347 |
Greentown China Holdings Ltd. | 4,400,000 | | 8,546,885 |
Hopson Development Holdings Ltd. (a) | 14,240,000 | | 17,503,831 |
Lifestyle Property Development Ltd. | 197,675 | | 40,030 |
Shimao Property Holdings Ltd. | 3,908,500 | | 9,840,567 |
Sun Hung Kai Properties Ltd. | 1,282,000 | | 16,800,103 |
| | 76,023,999 |
TOTAL FINANCIALS | | 320,468,014 |
HEALTH CARE - 3.1% |
Health Care Equipment & Supplies - 0.4% |
Pacific Hospital Supply Co. Ltd. | 1,300,000 | | 4,836,079 |
Common Stocks - continued |
| Shares | | Value |
HEALTH CARE - continued |
Pharmaceuticals - 2.7% |
China Pharmaceutical Group Ltd. | 30,500,000 | | $ 19,001,032 |
Lee's Pharmaceutical Holdings Ltd. | 8,290,000 | | 7,688,005 |
Tong Ren Tang Technologies Co. Ltd. (H Shares) (d) | 4,351,000 | | 13,188,250 |
| | 39,877,287 |
TOTAL HEALTH CARE | | 44,713,366 |
INDUSTRIALS - 7.6% |
Commercial Services & Supplies - 0.6% |
Cleanaway Co. Ltd. | 1,409,000 | | 8,807,746 |
Construction & Engineering - 1.2% |
China State Construction International Holdings Ltd. | 10,482,000 | | 17,657,026 |
Machinery - 0.7% |
Cimc Enric Holdings Ltd. | 7,400,000 | | 10,422,804 |
Marine - 1.7% |
China Shipping Development Co. Ltd. (H Shares) (a) | 31,444,000 | | 17,804,612 |
Orient Overseas International Ltd. | 1,506,500 | | 7,782,191 |
| | 25,586,803 |
Road & Rail - 0.1% |
PT Express Transindo Utama Tbk | 10,253,000 | | 1,364,331 |
Trading Companies & Distributors - 2.8% |
Shanghai Waigaoqiao Free Trade Zone Development Co. Ltd. (B Shares) | 1,762,725 | | 3,587,145 |
Summit Ascent Holdings Ltd. (a) | 24,986,000 | | 37,255,019 |
| | 40,842,164 |
Transportation Infrastructure - 0.5% |
Airports of Thailand PCL (For. Reg.) | 1,041,000 | | 7,090,506 |
TOTAL INDUSTRIALS | | 111,771,380 |
INFORMATION TECHNOLOGY - 24.8% |
Communications Equipment - 0.9% |
KMC Kuei Meng International, Inc. | 3,075,000 | | 13,580,771 |
Computers & Peripherals - 3.1% |
Advantech Co. Ltd. | 2,854,000 | | 18,276,847 |
Lenovo Group Ltd. | 18,902,000 | | 20,235,599 |
LITE-ON Technology Corp. | 4,144,537 | | 7,237,275 |
| | 45,749,721 |
Electronic Equipment & Components - 0.2% |
Tong Hsing Electronics Industries Ltd. | 666,000 | | 3,518,362 |
Internet Software & Services - 10.7% |
58.com, Inc. ADR | 7,300 | | 176,076 |
|
| Shares | | Value |
NHN Corp. | 30,000 | | $ 16,875,841 |
Sohu.com, Inc. (a)(d) | 325,000 | | 21,762,000 |
Tencent Holdings Ltd. | 1,827,200 | | 99,738,299 |
Yahoo!, Inc. (a) | 300,000 | | 9,879,000 |
Youku Tudou, Inc. ADR (a)(d) | 300,000 | | 8,172,000 |
| | 156,603,216 |
Semiconductors & Semiconductor Equipment - 9.3% |
Chipbond Technology Corp. | 6,011,000 | | 12,130,233 |
GCL-Poly Energy Holdings Ltd. (a) | 26,000,000 | | 7,981,427 |
Inotera Memories, Inc. (a) | 16,657,000 | | 10,723,633 |
MediaTek, Inc. | 816,000 | | 11,144,284 |
Novatek Microelectronics Corp. | 2,674,000 | | 10,583,353 |
Taiwan Semiconductor Manufacturing Co. Ltd. | 22,911,796 | | 84,283,698 |
| | 136,846,628 |
Software - 0.6% |
Forgame Holdings Ltd. | 1,086,700 | | 8,970,566 |
TOTAL INFORMATION TECHNOLOGY | | 365,269,264 |
MATERIALS - 3.9% |
Chemicals - 0.5% |
Taiwan Fertilizer Co. Ltd. | 3,015,000 | | 7,170,036 |
Construction Materials - 1.9% |
Anhui Conch Cement Co. Ltd. (H Shares) | 6,898,000 | | 24,066,929 |
Asia Cement (China) Holdings Corp. | 6,409,500 | | 3,505,260 |
| | 27,572,189 |
Containers & Packaging - 0.8% |
Greatview Aseptic Pack Co. Ltd. | 19,157,000 | | 12,058,063 |
Paper & Forest Products - 0.7% |
Lee & Man Paper Manufacturing Ltd. | 15,012,000 | | 10,765,732 |
TOTAL MATERIALS | | 57,566,020 |
TELECOMMUNICATION SERVICES - 1.6% |
Wireless Telecommunication Services - 1.6% |
SoftBank Corp. | 316,000 | | 23,598,535 |
UTILITIES - 3.0% |
Electric Utilities - 0.7% |
Power Assets Holdings Ltd. | 1,173,500 | | 9,777,905 |
Independent Power Producers & Energy Traders - 2.3% |
Beijing Jingneng Clean Energy Co. Ltd. (H Shares) | 27,500,000 | | 11,421,385 |
China Longyuan Power Grid Corp. Ltd. (H Shares) | 8,487,000 | | 9,753,537 |
Huadian Fuxin Energy Corp. Ltd. | 43,672,000 | | 13,462,670 |
| | 34,637,592 |
TOTAL UTILITIES | | 44,415,497 |
TOTAL COMMON STOCKS (Cost $1,030,690,335) |
1,402,522,749
|
Money Market Funds - 6.6% |
| Shares | | Value |
Fidelity Cash Central Fund, 0.09% (b) | 62,559,358 | | $ 62,559,358 |
Fidelity Securities Lending Cash Central Fund, 0.09% (b)(c) | 33,705,375 | | 33,705,375 |
TOTAL MONEY MARKET FUNDS (Cost $96,264,733) |
96,264,733
|
TOTAL INVESTMENT PORTFOLIO - 101.9% (Cost $1,126,955,068) | | 1,498,787,482 |
NET OTHER ASSETS (LIABILITIES) - (1.9)% | | (27,714,773) |
NET ASSETS - 100% | $ 1,471,072,709 |
Legend |
(a) Non-income producing |
(b) Affiliated fund that is generally available only to investment companies and other accounts managed by Fidelity Investments. The rate quoted is the annualized seven-day yield of the fund at period end. A complete unaudited listing of the fund's holdings as of its most recent quarter end is available upon request. In addition, each Fidelity Central Fund's financial statements, which are not covered by the Fund's Report of Independent Registered Public Accounting Firm, are available on the SEC's website or upon request. |
(c) Investment made with cash collateral received from securities on loan. |
(d) Security or a portion of the security is on loan at period end. |
Affiliated Central Funds |
Information regarding fiscal year to date income earned by the Fund from investments in Fidelity Central Funds is as follows: |
Fund | Income earned |
Fidelity Cash Central Fund | $ 52,688 |
Fidelity Securities Lending Cash Central Fund | 104,014 |
Total | $ 156,702 |
Other Information |
The following is a summary of the inputs used, as of October 31, 2013, involving the Fund's assets and liabilities carried at fair value. The inputs or methodology used for valuing securities may not be an indication of the risk associated with investing in those securities. For more information on valuation inputs, and their aggregation into the levels used in the table below, please refer to the Investment Valuation section in the accompanying Notes to Financial Statements. |
Valuation Inputs at Reporting Date: |
Description | Total | Level 1 | Level 2 | Level 3 |
Investments in Securities: | | | | |
Equities: | | | | |
Consumer Discretionary | $ 378,589,712 | $ 371,612,335 | $ 6,977,377 | $ - |
Consumer Staples | 8,796,595 | 8,796,595 | - | - |
Energy | 47,334,366 | 47,334,366 | - | - |
Financials | 320,468,014 | 313,409,190 | 7,058,824 | - |
Health Care | 44,713,366 | 44,713,366 | - | - |
Industrials | 111,771,380 | 111,771,380 | - | - |
Information Technology | 365,269,264 | 280,985,566 | 84,283,698 | - |
Materials | 57,566,020 | 57,566,020 | - | - |
Telecommunication Services | 23,598,535 | - | 23,598,535 | - |
Utilities | 44,415,497 | 44,415,497 | - | - |
Money Market Funds | 96,264,733 | 96,264,733 | - | - |
Total Investments in Securities: | $ 1,498,787,482 | $ 1,376,869,048 | $ 121,918,434 | $ - |
See accompanying notes which are an integral part of the financial statements.
Annual Report
Fidelity China Region Fund
Statement of Assets and Liabilities
| October 31, 2013 |
| | |
Assets | | |
Investment in securities, at value (including securities loaned of $32,990,653) - See accompanying schedule: Unaffiliated issuers (cost $1,030,690,335) | $ 1,402,522,749 | |
Fidelity Central Funds (cost $96,264,733) | 96,264,733 | |
Total Investments (cost $1,126,955,068) | | $ 1,498,787,482 |
Foreign currency held at value (cost $642,377) | | 642,196 |
Receivable for investments sold | | 7,139,250 |
Receivable for fund shares sold | | 1,079,646 |
Dividends receivable | | 145,217 |
Distributions receivable from Fidelity Central Funds | | 18,788 |
Prepaid expenses | | 4,105 |
Other receivables | | 202,494 |
Total assets | | 1,508,019,178 |
| | |
Liabilities | | |
Payable for investments purchased | $ 124,100 | |
Payable for fund shares redeemed | 1,709,290 | |
Accrued management fee | 854,776 | |
Distribution and service plan fees payable | 13,438 | |
Other affiliated payables | 298,538 | |
Other payables and accrued expenses | 240,952 | |
Collateral on securities loaned, at value | 33,705,375 | |
Total liabilities | | 36,946,469 |
| | |
Net Assets | | $ 1,471,072,709 |
Net Assets consist of: | | |
Paid in capital | | $ 953,599,430 |
Undistributed net investment income | | 15,463,609 |
Accumulated undistributed net realized gain (loss) on investments and foreign currency transactions | | 130,182,313 |
Net unrealized appreciation (depreciation) on investments and assets and liabilities in foreign currencies | | 371,827,357 |
Net Assets | | $ 1,471,072,709 |
Statement of Assets and Liabilities - continued
| October 31, 2013 |
| | |
Calculation of Maximum Offering Price Class A:
Net Asset Value and redemption price per share ($20,622,669 ÷ 579,951 shares) | | $ 35.56 |
| | |
Maximum offering price per share (100/94.25 of $35.56) | | $ 37.73 |
Class T:
Net Asset Value and redemption price per share ($5,964,876 ÷ 168,514 shares) | | $ 35.40 |
| | |
Maximum offering price per share (100/96.50 of $35.40) | | $ 36.68 |
Class B:
Net Asset Value and offering price per share ($1,494,199 ÷ 42,544 shares)A | | $ 35.12 |
| | |
Class C:
Net Asset Value and offering price per share ($6,956,980 ÷ 198,810 shares)A | | $ 34.99 |
| | |
China Region:
Net Asset Value, offering price and redemption price per share ($1,425,828,353 ÷ 39,795,030 shares) | | $ 35.83 |
| | |
Institutional Class:
Net Asset Value, offering price and redemption price per share ($10,205,632 ÷ 285,481 shares) | | $ 35.75 |
A Redemption price per share is equal to net asset value less any applicable contingent deferred sales charge.
See accompanying notes which are an integral part of the financial statements.
Annual Report
Statement of Operations
| Year ended October 31, 2013 |
| | |
Investment Income | | |
Dividends | | $ 34,175,261 |
Interest | | 33 |
Income from Fidelity Central Funds | | 156,702 |
Income before foreign taxes withheld | | 34,331,996 |
Less foreign taxes withheld | | (2,083,075) |
Total income | | 32,248,921 |
| | |
Expenses | | |
Management fee | $ 10,087,253 | |
Transfer agent fees | 3,112,421 | |
Distribution and service plan fees | 144,087 | |
Accounting and security lending fees | 647,972 | |
Custodian fees and expenses | 548,229 | |
Independent trustees' compensation | 8,224 | |
Registration fees | 103,330 | |
Audit | 73,742 | |
Legal | 3,695 | |
Interest | 515 | |
Miscellaneous | 11,843 | |
Total expenses before reductions | 14,741,311 | |
Expense reductions | (531,119) | 14,210,192 |
Net investment income (loss) | | 18,038,729 |
Realized and Unrealized Gain (Loss) Net realized gain (loss) on: | | |
Investment securities: | | |
Unaffiliated issuers | 182,788,330 | |
Foreign currency transactions | (157,631) | |
Total net realized gain (loss) | | 182,630,699 |
Change in net unrealized appreciation (depreciation) on: Investment securities | 120,644,687 | |
Assets and liabilities in foreign currencies | (5,059) | |
Total change in net unrealized appreciation (depreciation) | | 120,639,628 |
Net gain (loss) | | 303,270,327 |
Net increase (decrease) in net assets resulting from operations | | $ 321,309,056 |
Statement of Changes in Net Assets
| Year ended
October 31,
2013 | Year ended
October 31,
2012 |
Increase (Decrease) in Net Assets | | |
Operations | | |
Net investment income (loss) | $ 18,038,729 | $ 22,782,166 |
Net realized gain (loss) | 182,630,699 | (16,515,956) |
Change in net unrealized appreciation (depreciation) | 120,639,628 | 76,673,702 |
Net increase (decrease) in net assets resulting from operations | 321,309,056 | 82,939,912 |
Distributions to shareholders from net investment income | (19,616,401) | (15,687,379) |
Distributions to shareholders from net realized gain | - | (18,721,345) |
Total distributions | (19,616,401) | (34,408,724) |
Share transactions - net increase (decrease) | (122,395,498) | (301,570,428) |
Redemption fees | 393,175 | 184,146 |
Total increase (decrease) in net assets | 179,690,332 | (252,855,094) |
| | |
Net Assets | | |
Beginning of period | 1,291,382,377 | 1,544,237,471 |
End of period (including undistributed net investment income of $15,463,609 and undistributed net investment income of $19,540,796, respectively) | $ 1,471,072,709 | $ 1,291,382,377 |
See accompanying notes which are an integral part of the financial statements.
Annual Report
Financial Highlights - Class A
Years ended October 31, | 2013 | 2012 | 2011 | 2010 | 2009 |
Selected Per-Share Data | | | | | |
Net asset value, beginning of period | $ 28.53 | $ 27.28 | $ 31.61 | $ 26.47 | $ 16.67 |
Income from Investment Operations | | | | | |
Net investment income (loss) C | .30 | .36 | .33 | .25 | .30 |
Net realized and unrealized gain (loss) | 7.06 | 1.42 | (4.33) | 5.15 | 9.63 |
Total from investment operations | 7.36 | 1.78 | (4.00) | 5.40 | 9.93 |
Distributions from net investment income | (.34) | (.19) | (.31) | (.20) | (.16) |
Distributions from net realized gain | - | (.34) | (.03) | (.07) | - |
Total distributions | (.34) | (.53) | (.34) | (.27) | (.16) |
Redemption fees added to paid in capital C | .01 | - G | .01 | .01 | .03 |
Net asset value, end of period | $ 35.56 | $ 28.53 | $ 27.28 | $ 31.61 | $ 26.47 |
Total Return A, B | 26.07% | 6.70% | (12.79)% | 20.54% | 60.41% |
Ratios to Average Net Assets D, F | | | | | |
Expenses before reductions | 1.35% | 1.36% | 1.37% | 1.38% | 1.39% |
Expenses net of fee waivers, if any | 1.35% | 1.36% | 1.37% | 1.38% | 1.39% |
Expenses net of all reductions | 1.31% | 1.29% | 1.31% | 1.31% | 1.31% |
Net investment income (loss) | .94% | 1.35% | 1.07% | .91% | 1.27% |
Supplemental Data | | | | | |
Net assets, end of period (000 omitted) | $ 20,623 | $ 13,539 | $ 14,808 | $ 16,047 | $ 11,842 |
Portfolio turnover rate E | 92% | 107% | 87% | 57% | 88% |
ATotal returns would have been lower if certain expenses had not been reduced during the applicable periods shown. BTotal returns do not include the effect of the sales charges. CCalculated based on average shares outstanding during the period. DFees and expenses of any underlying Fidelity Central Funds are not included in the Fund's expense ratio. The Fund indirectly bears its proportionate share of the expenses of any underlying Fidelity Central Funds. EAmount does not include the portfolio activity of any underlying Fidelity Central Funds. FExpense ratios reflect operating expenses of the class. Expenses before reductions do not reflect amounts reimbursed by the investment adviser or reductions from brokerage service arrangements or reductions from other expense offset arrangements and do not represent the amount paid by the class during periods when reimbursements or reductions occur. Expenses net of fee waivers reflect expenses after reimbursement by the investment adviser but prior to reductions from brokerage service arrangements or other expense offset arrangements. Expenses net of all reductions represent the net expenses paid by the class. GAmount represents less than $.01 per share. |
Financial Highlights - Class T
Years ended October 31, | 2013 | 2012 | 2011 | 2010 | 2009 |
Selected Per-Share Data | | | | | |
Net asset value, beginning of period | $ 28.40 | $ 27.13 | $ 31.48 | $ 26.40 | $ 16.65 |
Income from Investment Operations | | | | | |
Net investment income (loss) C | .21 | .29 | .25 | .18 | .23 |
Net realized and unrealized gain (loss) | 7.04 | 1.40 | (4.32) | 5.13 | 9.64 |
Total from investment operations | 7.25 | 1.69 | (4.07) | 5.31 | 9.87 |
Distributions from net investment income | (.26) | (.08) | (.27) | (.18) | (.14) |
Distributions from net realized gain | - | (.34) | (.03) | (.07) | - |
Total distributions | (.26) | (.42) | (.29) H | (.24) I | (.14) |
Redemption fees added to paid in capital C | .01 | - G | .01 | .01 | .02 |
Net asset value, end of period | $ 35.40 | $ 28.40 | $ 27.13 | $ 31.48 | $ 26.40 |
Total Return A, B | 25.74% | 6.38% | (13.04)% | 20.27% | 59.92% |
Ratios to Average Net Assets D, F | | | | | |
Expenses before reductions | 1.64% | 1.64% | 1.63% | 1.64% | 1.66% |
Expenses net of fee waivers, if any | 1.64% | 1.64% | 1.63% | 1.64% | 1.66% |
Expenses net of all reductions | 1.60% | 1.57% | 1.57% | 1.58% | 1.58% |
Net investment income (loss) | .65% | 1.06% | .81% | .64% | 1.00% |
Supplemental Data | | | | | |
Net assets, end of period (000 omitted) | $ 5,965 | $ 4,349 | $ 5,281 | $ 6,070 | $ 3,139 |
Portfolio turnover rate E | 92% | 107% | 87% | 57% | 88% |
ATotal returns would have been lower if certain expenses had not been reduced during the applicable periods shown. BTotal returns do not include the effect of the sales charges. CCalculated based on average shares outstanding during the period. DFees and expenses of any underlying Fidelity Central Funds are not included in the Fund's expense ratio. The Fund indirectly bears its proportionate share of the expenses of any underlying Fidelity Central Funds. EAmount does not include the portfolio activity of any underlying Fidelity Central Funds. FExpense ratios reflect operating expenses of the class. Expenses before reductions do not reflect amounts reimbursed by the investment adviser or reductions from brokerage service arrangements or reductions from other expense offset arrangements and do not represent the amount paid by the class during periods when reimbursements or reductions occur. Expenses net of fee waivers reflect expenses after reimbursement by the investment adviser but prior to reductions from brokerage service arrangements or other expense offset arrangements. Expenses net of all reductions represent the net expenses paid by the class. GAmount represents less than $.01 per share. HTotal distributions of $.29 per share is comprised of distributions from net investment income of $.268 and distributions from net realized gain of $.025 per share. ITotal distributions of $.24 per share is comprised of distributions from net investment income of $.177 and distributions from net realized gain of $.065 per share. |
See accompanying notes which are an integral part of the financial statements.
Annual Report
Financial Highlights - Class B
Years ended October 31, | 2013 | 2012 | 2011 | 2010 | 2009 |
Selected Per-Share Data | | | | | |
Net asset value, beginning of period | $ 28.16 | $ 26.94 | $ 31.23 | $ 26.28 | $ 16.61 |
Income from Investment Operations | | | | | |
Net investment income (loss) C | .06 | .16 | .10 | .04 | .12 |
Net realized and unrealized gain (loss) | 6.99 | 1.40 | (4.29) | 5.09 | 9.63 |
Total from investment operations | 7.05 | 1.56 | (4.19) | 5.13 | 9.75 |
Distributions from net investment income | (.10) | - | (.08) | (.12) | (.10) |
Distributions from net realized gain | - | (.34) | (.03) | (.07) | - |
Total distributions | (.10) | (.34) | (.11) | (.19) | (.10) |
Redemption fees added to paid in capital C | .01 | - G | .01 | .01 | .02 |
Net asset value, end of period | $ 35.12 | $ 28.16 | $ 26.94 | $ 31.23 | $ 26.28 |
Total Return A, B | 25.12% | 5.90% | (13.45)% | 19.63% | 59.16% |
Ratios to Average Net Assets D, F | | | | | |
Expenses before reductions | 2.10% | 2.11% | 2.12% | 2.14% | 2.15% |
Expenses net of fee waivers, if any | 2.10% | 2.11% | 2.12% | 2.14% | 2.15% |
Expenses net of all reductions | 2.07% | 2.04% | 2.06% | 2.08% | 2.06% |
Net investment income (loss) | .19% | .59% | .32% | .14% | .51% |
Supplemental Data | | | | | |
Net assets, end of period (000 omitted) | $ 1,494 | $ 1,533 | $ 1,801 | $ 2,496 | $ 1,915 |
Portfolio turnover rate E | 92% | 107% | 87% | 57% | 88% |
ATotal returns would have been lower if certain expenses had not been reduced during the applicable periods shown. BTotal returns do not include the effect of the contingent deferred sales charge. CCalculated based on average shares outstanding during the period. DFees and expenses of any underlying Fidelity Central Funds are not included in the Fund's expense ratio. The Fund indirectly bears its proportionate share of the expenses of any underlying Fidelity Central Funds. EAmount does not include the portfolio activity of any underlying Fidelity Central Funds. FExpense ratios reflect operating expenses of the class. Expenses before reductions do not reflect amounts reimbursed by the investment adviser or reductions from brokerage service arrangements or reductions from other expense offset arrangements and do not represent the amount paid by the class during periods when reimbursements or reductions occur. Expenses net of fee waivers reflect expenses after reimbursement by the investment adviser but prior to reductions from brokerage service arrangements or other expense offset arrangements. Expenses net of all reductions represent the net expenses paid by the class. GAmount represents less than $.01 per share. |
Financial Highlights - Class C
Years ended October 31, | 2013 | 2012 | 2011 | 2010 | 2009 |
Selected Per-Share Data | | | | | |
Net asset value, beginning of period | $ 28.07 | $ 26.86 | $ 31.19 | $ 26.25 | $ 16.61 |
Income from Investment Operations | | | | | |
Net investment income (loss) C | .06 | .16 | .10 | .04 | .12 |
Net realized and unrealized gain (loss) | 6.97 | 1.39 | (4.28) | 5.09 | 9.62 |
Total from investment operations | 7.03 | 1.55 | (4.18) | 5.13 | 9.74 |
Distributions from net investment income | (.12) | - | (.13) | (.13) | (.12) |
Distributions from net realized gain | - | (.34) | (.03) | (.07) | - |
Total distributions | (.12) | (.34) | (.16) | (.20) | (.12) |
Redemption fees added to paid in capital C | .01 | - G | .01 | .01 | .02 |
Net asset value, end of period | $ 34.99 | $ 28.07 | $ 26.86 | $ 31.19 | $ 26.25 |
Total Return A, B | 25.14% | 5.88% | (13.46)% | 19.66% | 59.18% |
Ratios to Average Net Assets D, F | | | | | |
Expenses before reductions | 2.10% | 2.11% | 2.12% | 2.14% | 2.15% |
Expenses net of fee waivers, if any | 2.10% | 2.11% | 2.12% | 2.14% | 2.15% |
Expenses net of all reductions | 2.07% | 2.04% | 2.06% | 2.07% | 2.07% |
Net investment income (loss) | .19% | .59% | .32% | .15% | .51% |
Supplemental Data | | | | | |
Net assets, end of period (000 omitted) | $ 6,957 | $ 4,515 | $ 5,230 | $ 5,938 | $ 3,806 |
Portfolio turnover rate E | 92% | 107% | 87% | 57% | 88% |
ATotal returns would have been lower if certain expenses had not been reduced during the applicable periods shown. BTotal returns do not include the effect of the contingent deferred sales charge. CCalculated based on average shares outstanding during the period. DFees and expenses of any underlying Fidelity Central Funds are not included in the Fund's expense ratio. The Fund indirectly bears its proportionate share of the expenses of any underlying Fidelity Central Funds. EAmount does not include the portfolio activity of any underlying Fidelity Central Funds. FExpense ratios reflect operating expenses of the class. Expenses before reductions do not reflect amounts reimbursed by the investment adviser or reductions from brokerage service arrangements or reductions from other expense offset arrangements and do not represent the amount paid by the class during periods when reimbursements or reductions occur. Expenses net of fee waivers reflect expenses after reimbursement by the investment adviser but prior to reductions from brokerage service arrangements or other expense offset arrangements. Expenses net of all reductions represent the net expenses paid by the class. GAmount represents less than $.01 per share. |
See accompanying notes which are an integral part of the financial statements.
Annual Report
Financial Highlights - China Region
Years ended October 31, | 2013 | 2012 | 2011 | 2010 | 2009 |
Selected Per-Share Data | | | | | |
Net asset value, beginning of period | $ 28.73 | $ 27.49 | $ 31.81 | $ 26.55 | $ 16.69 |
Income from Investment Operations | | | | | |
Net investment income (loss) B | .41 | .45 | .44 | .34 | .33 |
Net realized and unrealized gain (loss) | 7.11 | 1.42 | (4.37) | 5.18 | 9.68 |
Total from investment operations | 7.52 | 1.87 | (3.93) | 5.52 | 10.01 |
Distributions from net investment income | (.43) | (.29) | (.38) | (.21) | (.17) |
Distributions from net realized gain | - | (.34) | (.03) | (.07) | - |
Total distributions | (.43) | (.63) | (.40) G | (.27) H | (.17) |
Redemption fees added to paid in capital B | .01 | - F | .01 | .01 | .02 |
Net asset value, end of period | $ 35.83 | $ 28.73 | $ 27.49 | $ 31.81 | $ 26.55 |
Total Return A | 26.51% | 7.01% | (12.52)% | 20.97% | 60.77% |
Ratios to Average Net Assets C, E | | | | | |
Expenses before reductions | 1.02% | 1.04% | 1.04% | 1.06% | 1.12% |
Expenses net of fee waivers, if any | 1.02% | 1.04% | 1.04% | 1.06% | 1.12% |
Expenses net of all reductions | .98% | .98% | .98% | 1.00% | 1.03% |
Net investment income (loss) | 1.27% | 1.66% | 1.40% | 1.22% | 1.54% |
Supplemental Data | | | | | |
Net assets, end of period (000 omitted) | $ 1,425,828 | $ 1,265,488 | $ 1,515,084 | $ 2,130,070 | $ 2,138,141 |
Portfolio turnover rate D | 92% | 107% | 87% | 57% | 88% |
ATotal returns would have been lower if certain expenses had not been reduced during the applicable periods shown. BCalculated based on average shares outstanding during the period. CFees and expenses of any underlying Fidelity Central Funds are not included in the Fund's expense ratio. The Fund indirectly bears its proportionate share of the expenses of any underlying Fidelity Central Funds. DAmount does not include the portfolio activity of any underlying Fidelity Central Funds. EExpense ratios reflect operating expenses of the class. Expenses before reductions do not reflect amounts reimbursed by the investment adviser or reductions from brokerage service arrangements or reductions from other expense offset arrangements and do not represent the amount paid by the class during periods when reimbursements or reductions occur. Expenses net of fee waivers reflect expenses after reimbursement by the investment adviser but prior to reductions from brokerage service arrangements or other expense offset arrangements. Expenses net of all reductions represent the net expenses paid by the class. FAmount represents less than $.01 per share. GTotal distributions of $.40 per share is comprised of distributions from net investment income of $.376 and distributions from net realized gain of $.025 per share. HTotal distributions of $.27 per share is comprised of distributions from net investment income of $.209 and distributions from net realized gain of $.065 per share. |
Financial Highlights - Institutional Class
Years ended October 31, | 2013 | 2012 | 2011 | 2010 | 2009 |
Selected Per-Share Data | | | | | |
Net asset value, beginning of period | $ 28.68 | $ 27.46 | $ 31.79 | $ 26.55 | $ 16.70 |
Income from Investment Operations | | | | | |
Net investment income (loss) B | .42 | .45 | .43 | .33 | .37 |
Net realized and unrealized gain (loss) | 7.10 | 1.42 | (4.37) | 5.18 | 9.64 |
Total from investment operations | 7.52 | 1.87 | (3.94) | 5.51 | 10.01 |
Distributions from net investment income | (.46) | (.31) | (.37) | (.22) | (.18) |
Distributions from net realized gain | - | (.34) | (.03) | (.07) | - |
Total distributions | (.46) | (.65) | (.40) | (.28) G | (.18) |
Redemption fees added to paid in capital B | .01 | - F | .01 | .01 | .02 |
Net asset value, end of period | $ 35.75 | $ 28.68 | $ 27.46 | $ 31.79 | $ 26.55 |
Total Return A | 26.58% | 7.02% | (12.56)% | 20.92% | 60.78% |
Ratios to Average Net Assets C, E | | | | | |
Expenses before reductions | .97% | 1.04% | 1.06% | 1.11% | 1.08% |
Expenses net of fee waivers, if any | .97% | 1.04% | 1.06% | 1.11% | 1.08% |
Expenses net of all reductions | .93% | .98% | 1.01% | 1.04% | 1.00% |
Net investment income (loss) | 1.32% | 1.66% | 1.38% | 1.18% | 1.58% |
Supplemental Data | | | | | |
Net assets, end of period (000 omitted) | $ 10,206 | $ 1,958 | $ 2,034 | $ 1,904 | $ 1,684 |
Portfolio turnover rate D | 92% | 107% | 87% | 57% | 88% |
ATotal returns would have been lower if certain expenses had not been reduced during the applicable periods shown. BCalculated based on average shares outstanding during the period. CFees and expenses of any underlying Fidelity Central Funds are not included in the Fund's expense ratio. The Fund indirectly bears its proportionate share of the expenses of any underlying Fidelity Central Funds. DAmount does not include the portfolio activity of any underlying Fidelity Central Funds. EExpense ratios reflect operating expenses of the class. Expenses before reductions do not reflect amounts reimbursed by the investment adviser or reductions from brokerage service arrangements or reductions from other expense offset arrangements and do not represent the amount paid by the class during periods when reimbursements or reductions occur. Expenses net of fee waivers reflect expenses after reimbursement by the investment adviser but prior to reductions from brokerage service arrangements or other expense offset arrangements. Expenses net of all reductions represent the net expenses paid by the class. FAmount represents less than $.01 per share. GTotal distributions of $.28 per share is comprised of distributions from net investment income of $.216 and distributions from net realized gain of $.065 per share. |
See accompanying notes which are an integral part of the financial statements.
Annual Report
Notes to Financial Statements
For the period ended October 31, 2013
1. Organization.
Fidelity China Region Fund (the Fund) is a fund of Fidelity Investment Trust (the Trust) and is authorized to issue an unlimited number of shares. The Trust is registered under the Investment Company Act of 1940, as amended (the 1940 Act), as an open-end management investment company organized as a Massachusetts business trust. The Fund offers Class A, Class T, Class C, China Region and Institutional Class shares, each of which, along with Class B shares, has equal rights as to assets and voting privileges. Class B shares are closed to new accounts and additional purchases, except for exchanges and reinvestments. Each class has exclusive voting rights with respect to matters that affect that class. Class B shares will automatically convert to Class A shares after a holding period of seven years from the initial date of purchase. The Fund's investments in emerging markets can be subject to social, economic, regulatory, and political uncertainties and can be extremely volatile.
2. Investments in Fidelity Central Funds.
The Fund invests in Fidelity Central Funds, which are open-end investment companies generally available only to other investment companies and accounts managed by Fidelity Management & Research Company (FMR) and its affiliates. The Fund's Schedule of Investments lists each of the Fidelity Central Funds held as of period end, if any, as an investment of the Fund, but does not include the underlying holdings of each Fidelity Central Fund. As an Investing Fund, the Fund indirectly bears its proportionate share of the expenses of the underlying Fidelity Central Funds.
The Money Market Central Funds seek preservation of capital and current income and are managed by Fidelity Investments Money Management, Inc. (FIMM), an affiliate of FMR.
A complete unaudited list of holdings for each Fidelity Central Fund is available upon request or at the Securities and Exchange Commission (the SEC) website at www.sec.gov. In addition, the financial statements of the Fidelity Central Funds, which are not covered by the Fund's Report of Independent Registered Public Accounting Firm, are available on the SEC website or upon request.
3. Significant Accounting Policies.
The financial statements have been prepared in conformity with accounting principles generally accepted in the United States of America (GAAP), which require management to make certain estimates and assumptions at the date of the financial statements. Actual results could differ from those estimates. Subsequent events, if any, through the date that the financial statements were issued have been evaluated in the preparation of the financial statements. The following summarizes the significant accounting policies of the Fund:
Investment Valuation. Investments are valued as of 4:00 p.m. Eastern time on the last calendar day of the period. In accordance with valuation policies and procedures approved by the Board of Trustees (the Board), the Fund attempts to obtain prices from one or more third party pricing vendors or brokers to value its investments. When current market prices, quotations or currency exchange rates are not readily available or reliable, investments will be fair valued in good faith by the FMR Fair Value Committee (the Committee), in accordance with procedures adopted by the Board. Factors used in determining fair value vary by investment type and may include market or investment specific events. The frequency with which these procedures are used cannot be predicted and they may be utilized to a significant extent. The Committee oversees the Fund's valuation policies and procedures and is responsible for approving and reporting to the Board all fair value determinations.
The Fund categorizes the inputs to valuation techniques used to value its investments into a disclosure hierarchy consisting of three levels as shown below:
Level 1 - quoted prices in active markets for identical investments
Level 2 - other significant observable inputs (including quoted prices for similar investments, interest rates, prepayment speeds, etc.)
Level 3 - unobservable inputs (including the Fund's own assumptions based on the best information available)
Valuation techniques used to value the Fund's investments by major category are as follows:
Equity securities, including restricted securities, for which market quotations are readily available, are valued at the last reported sale price or official closing price as reported by a third party pricing vendor on the primary market or exchange on which they are traded and are categorized as Level 1 in the hierarchy. In the event there were no sales during the day or closing prices are not available, securities are valued at the last quoted bid price or may be valued using the last available price and are generally categorized as Level 2 in the hierarchy. For foreign equity securities, when market or security specific events arise, comparisons to the valuation of American Depositary Receipts (ADRs), futures contracts, Exchange-Traded Funds (ETFs) and certain indexes as well as quoted prices for similar securities may be used and would be categorized as Level 2 in the hierarchy. Utilizing these techniques may result in transfers between Level 1 and Level 2. For equity securities, including restricted securities, where observable inputs are limited, assumptions about market activity and risk are used and these securities may be categorized as Level 3 in the hierarchy.
Investments in open-end mutual funds, including the Fidelity Central Funds, are valued at their closing net asset value (NAV) each business day and are categorized as Level 1 in the hierarchy.
Annual Report
3. Significant Accounting Policies - continued
Investment Valuation - continued
Changes in valuation techniques may result in transfers in or out of an assigned level within the disclosure hierarchy. The aggregate value of investments by input level, as of October 31, 2013, is included at the end of the Fund's Schedule of Investments.
Foreign Currency. The Fund may use foreign currency contracts to facilitate transactions in foreign-denominated securities. Gains and losses from these transactions may arise from changes in the value of the foreign currency or if the counterparties do not perform under the contracts' terms.
Foreign-denominated assets, including investment securities, and liabilities are translated into U.S. dollars at the exchange rates at period end. Purchases and sales of investment securities, income and dividends received and expenses denominated in foreign currencies are translated into U.S. dollars at the exchange rate in effect on the transaction date.
The effects of exchange rate fluctuations on investments are included with the net realized and unrealized gain (loss) on investment securities. Other foreign currency transactions resulting in realized and unrealized gain (loss) are disclosed separately.
Investment Transactions and Income. For financial reporting purposes, the Fund's investment holdings and NAV include trades executed through the end of the last business day of the period. The NAV per share for processing shareholder transactions is calculated as of the close of business of the New York Stock Exchange (NYSE), normally 4:00 p.m. Eastern time and includes trades executed through the end of the prior business day. Gains and losses on securities sold are determined on the basis of identified cost and may include proceeds received from litigation. Dividend income is recorded on the ex-dividend date, except for certain dividends from foreign securities where the ex-dividend date may have passed, which are recorded as soon as the Fund is informed of the ex-dividend date. Non-cash dividends included in dividend income, if any, are recorded at the fair market value of the securities received. Interest income and distributions from the Fidelity Central Funds are accrued as earned. Interest income includes coupon interest and amortization of premium and accretion of discount on debt securities. Investment income is recorded net of foreign taxes withheld where recovery of such taxes is uncertain.
Class Allocations and Expenses. Investment income, realized and unrealized capital gains and losses, common expenses of the Fund, and certain fund-level expense reductions, if any, are allocated daily on a pro-rata basis to each class based on the relative net assets of each class to the total net assets of the Fund. Each class differs with respect to transfer agent and distribution and service plan fees incurred. Certain expense reductions may also differ by class. For the reporting period, the allocated portion of income and expenses to each class as a percent of its average net assets may vary due to the timing of recording these transactions in relation to fluctuating net assets of the classes. Expenses directly attributable to a fund are charged to that fund. Expenses attributable to more than one fund are allocated among the respective funds on the basis of relative net assets or other appropriate methods. Expense estimates are accrued in the period to which they relate and adjustments are made when actual amounts are known.
Income Tax Information and Distributions to Shareholders. Each year, the Fund intends to qualify as a regulated investment company under Subchapter M of the Internal Revenue Code, including distributing substantially all of its taxable income and realized gains. As a result, no provision for U.S. Federal income taxes is required. As of October 31, 2013, the Fund did not have any unrecognized tax benefits in the financial statements; nor is the Fund aware of any tax positions for which it is reasonably possible that the total amounts of unrecognized tax benefits will significantly change in the next twelve months. The Fund files a U.S. federal tax return, in addition to state and local tax returns as required. The Fund's federal income tax returns are subject to examination by the Internal Revenue Service (IRS) for a period of three fiscal years after they are filed. State and local tax returns may be subject to examination for an additional fiscal year depending on the jurisdiction. Foreign taxes are provided for based on the Fund's understanding of the tax rules and rates that exist in the foreign markets in which it invests.
Distributions are declared and recorded on the ex-dividend date. Income dividends and capital gain distributions are declared separately for each class. Income and capital gain distributions are determined in accordance with income tax regulations, which may differ from GAAP. In addition, the Fund claimed a portion of the payment made to redeeming shareholders as a distribution for income tax purposes.
Capital accounts within the financial statements are adjusted for permanent book-tax differences. These adjustments have no impact on net assets or the results of operations. Temporary book-tax differences will reverse in a subsequent period.
Book-tax differences are primarily due to foreign currency transactions, passive foreign investment companies (PFIC), deferred trustees compensation, capital loss carryforwards and losses deferred due to wash sales.
The federal tax cost of investment securities and unrealized appreciation (depreciation) as of period end were as follows:
Gross unrealized appreciation | $ 393,506,024 |
Gross unrealized depreciation | (27,550,991) |
Net unrealized appreciation (depreciation) on securities and other investments | $ 365,955,033 |
| |
Tax Cost | $ 1,132,832,449 |
Annual Report
Notes to Financial Statements - continued
3. Significant Accounting Policies - continued
Income Tax Information and Distributions to Shareholders - continued
The tax-based components of distributable earnings as of period end were as follows:
Undistributed ordinary income | $ 31,209,233 |
Undistributed long-term capital gain | $ 120,314,075 |
Net unrealized appreciation (depreciation) | $ 365,949,974 |
The tax character of distributions paid was as follows:
| October 31, 2013 | October 31, 2012 |
| | |
Ordinary Income | $ 19,616,401 | $ 15,687,379 |
Long-term Capital Gains | - | 18,721,345 |
Total | $ 19,616,401 | $ 34,408,724 |
Short-Term Trading (Redemption) Fees. Shares held by investors in the Fund less than 90 days may have been subject to a redemption fee equal to 1.50% of the net asset value of shares redeemed. All redemption fees, which reduce the proceeds of the shareholder redemption, are retained by the Fund and accounted for as an addition to paid in capital.
4. Purchases and Sales of Investments.
Purchases and sales of securities, other than short-term securities, aggregated $1,273,312,174 and $1,463,403,074, respectively.
5. Fees and Other Transactions with Affiliates.
Management Fee. FMR and its affiliates provide the Fund with investment management related services for which the Fund pays a monthly management fee. The management fee is the sum of an individual fund fee rate that is based on an annual rate of .45% of the Fund's average net assets and an annualized group fee rate that averaged .25% during the period. The group fee rate is based upon the average net assets of all the mutual funds advised by FMR, including any mutual funds previously advised by FMR that are currently advised by Fidelity SelectCo, LLC, an affiliate of FMR. The group fee rate decreases as assets under management increase and increases as assets under management decrease. For the reporting period, the total annual management fee rate was .70% of the Fund's average net assets.
Distribution and Service Plan Fees. In accordance with Rule 12b-1 of the 1940 Act, the Fund has adopted separate Distribution and Service Plans for each class of shares. Certain classes pay Fidelity Distributors Corporation (FDC), an affiliate of FMR, separate Distribution and Service Fees, each of which is based on an annual percentage of each class' average net assets. In addition, FDC may pay financial intermediaries for selling shares of the Fund and providing shareholder support services. For the period, the Distribution and Service Fee rates, total fees and amounts retained by FDC were as follows:
| Distribution
Fee | Service
Fee | Total Fees | Retained
by FDC |
Class A | -% | .25% | $ 41,731 | $ 701 |
Class T | .25% | .25% | 26,168 | 64 |
Class B | .75% | .25% | 15,256 | 11,538 |
Class C | .75% | .25% | 60,932 | 17,612 |
| | | $ 144,087 | $ 29,915 |
Sales Load. FDC may receive a front-end sales charge of up to 5.75% for selling Class A shares and 3.50% for selling Class T shares, some of which is paid to financial intermediaries for selling shares of the Fund. Depending on the holding period, FDC may receive contingent deferred sales charges levied on Class A, Class T, Class B, and Class C redemptions. The deferred sales charges range from 5.00% to 1.00% for Class B shares, 1.00% for Class C shares, 1.00% for certain purchases of Class A shares and .25% for certain purchases of Class T shares.
For the period, sales charge amounts retained by FDC were as follows:
| Retained
by FDC |
Class A | $ 23,503 |
Class T | 4,468 |
Class B* | 4,857 |
Class C* | 2,325 |
| $ 35,153 |
* When Class B and Class C shares are initially sold, FDC pays commissions from its own resources to financial intermediaries through which the sales are made.
Annual Report
5. Fees and Other Transactions with Affiliates - continued
Transfer Agent Fees. Fidelity Investments Institutional Operations Company, Inc., (FIIOC), an affiliate of FMR, is the transfer, dividend disbursing and shareholder servicing agent for each class of the Fund. FIIOC receives account fees and asset-based fees that vary according to the account size and type of account of the shareholders of the respective classes of the Fund. FIIOC pays for typesetting, printing and mailing of shareholder reports, except proxy statements.
For the period, transfer agent fees for each class were as follows:
| Amount | % of
Average
Net Assets |
Class A | $ 49,843 | .30 |
Class T | 17,685 | .34 |
Class B | 4,586 | .30 |
Class C | 18,274 | .30 |
China Region | 3,014,566 | .22 |
Institutional Class | 7,467 | .17 |
| $ 3,112,421 | |
Accounting and Security Lending Fees. Fidelity Service Company, Inc. (FSC), an affiliate of FMR, maintains the Fund's accounting records. The accounting fee is based on the level of average net assets for each month. Under a separate contract, FSC administers the security lending program. The security lending fee is based on the number and duration of lending transactions.
Brokerage Commissions. The Fund placed a portion of its portfolio transactions with brokerage firms which are affiliates of the investment adviser. Brokerage commissions are included in net realized gain (loss) and change in net unrealized appreciation (depreciation) in the Statement of Operations. The commissions paid to these affiliated firms were $2,982 for the period.
Interfund Lending Program. Pursuant to an Exemptive Order issued by the SEC, the Fund, along with other registered investment companies having management contracts with FMR, may participate in an interfund lending program. This program provides an alternative credit facility allowing the funds to borrow from, or lend money to, other participating affiliated funds. At period end, there were no interfund loans outstanding. The Fund's activity in this program during the period for which loans were outstanding was as follows:
Borrower or Lender | Average Loan
Balance | Weighted Average Interest Rate | Interest Expense |
Borrower | $ 8,690,333 | .36% | $ 515 |
6. Committed Line of Credit.
The Fund participates with other funds managed by FMR or an affiliate in a $4.25 billion credit facility (the "line of credit") to be utilized for temporary or emergency purposes to fund shareholder redemptions or for other short-term liquidity purposes. The Fund has agreed to pay commitment fees on its pro-rata portion of the line of credit, which amounted to $3,108 and is reflected in Miscellaneous expenses on the Statement of Operations. During the period, there were no borrowings on this line of credit.
7. Security Lending.
The Fund lends portfolio securities through a lending agent from time to time in order to earn additional income. For equity securities, a lending agent is used and may loan securities to certain qualified borrowers, including Fidelity Capital Markets (FCM), a broker-dealer affiliated with the Fund. On the settlement date of the loan, the Fund receives collateral (in the form of U.S. Treasury obligations, letters of credit and/or cash) against the loaned securities and maintains collateral in an amount not less than 100% of the market value of the loaned securities during the period of the loan. The market value of the loaned securities is determined at the close of business of the Fund and any additional required collateral is delivered to the Fund on the next business day. If the borrower defaults on its obligation to return the securities loaned because of insolvency or other reasons, the Fund may apply collateral received from the borrower against the obligation. The Fund may experience delays and costs in recovering the securities loaned. Any cash collateral received is invested in the Fidelity Securities Lending Cash Central Fund. The value of loaned securities and cash collateral at period end are disclosed on the Fund's Statement of Assets and Liabilities. Security lending income represents the income earned on investing cash collateral, less rebates paid to borrowers and any lending agent fees associated with the loan, plus any premium payments received for lending certain types of securities. Security lending income is presented in the Statement of Operations as a component of income from Fidelity Central Funds. Total security lending income during the period amounted to $104,014. During the period, there were no securities loaned to FCM.
Annual Report
Notes to Financial Statements - continued
8. Expense Reductions.
Commissions paid to certain brokers with whom FMR, or its affiliates, places trades on behalf of the Fund include an amount in addition to trade execution, which may be rebated back to the Fund to offset certain expenses. This amount totaled $505,020 for the period.
In addition, FMR reimbursed a portion of the Fund's operating expenses during the period in the amount of $26,099.
9. Distributions to Shareholders.
Distributions to shareholders of each class were as follows:
Years ended October 31, | 2013 | 2012 |
From net investment income | | |
Class A | $ 161,788 | $ 100,983 |
Class T | 40,503 | 14,853 |
Class B | 4,993 | - |
Class C | 18,782 | - |
China Region | 19,344,002 | 15,549,167 |
Institutional Class | 46,333 | 22,376 |
Total | $ 19,616,401 | $ 15,687,379 |
From net realized gain | | |
Class A | $ - | $ 182,091 |
Class T | - | 60,664 |
Class B | - | 21,876 |
Class C | - | 65,490 |
China Region | - | 18,366,435 |
Institutional Class | - | 24,789 |
Total | $ - | $ 18,721,345 |
10. Share Transactions.
Transactions for each class of shares were as follows:
| Shares | Dollars |
Years ended October 31, | 2013 | 2012 | 2013 | 2012 |
Class A | | | | |
Shares sold | 284,743 | 128,967 | $ 9,232,019 | $ 3,497,936 |
Reinvestment of distributions | 5,112 | 10,227 | 151,768 | 266,217 |
Shares redeemed | (184,522) | (207,420) | (5,803,916) | (5,547,035) |
Net increase (decrease) | 105,333 | (68,226) | $ 3,579,871 | $ (1,782,882) |
Class T | | | | |
Shares sold | 70,191 | 40,215 | $ 2,215,632 | $ 1,078,486 |
Reinvestment of distributions | 1,321 | 2,834 | 39,167 | 73,623 |
Shares redeemed | (56,116) | (84,588) | (1,759,294) | (2,252,505) |
Net increase (decrease) | 15,396 | (41,539) | $ 495,505 | $ (1,100,396) |
Class B | | | | |
Shares sold | 6,343 | 4,773 | $ 197,892 | $ 131,481 |
Reinvestment of distributions | 151 | 760 | 4,455 | 19,651 |
Shares redeemed | (18,382) | (17,966) | (569,584) | (477,343) |
Net increase (decrease) | (11,888) | (12,433) | $ (367,237) | $ (326,211) |
Class C | | | | |
Shares sold | 120,235 | 39,150 | $ 3,792,024 | $ 1,051,097 |
Reinvestment of distributions | 573 | 2,380 | 16,859 | 61,380 |
Shares redeemed | (82,838) | (75,401) | (2,577,162) | (1,981,464) |
Net increase (decrease) | 37,970 | (33,871) | $ 1,231,721 | $ (868,987) |
China Region | | | | |
Shares sold | 11,534,725 | 5,981,804 | $ 362,586,439 | $ 163,640,090 |
Reinvestment of distributions | 622,145 | 1,245,751 | 18,558,580 | 32,563,934 |
Shares redeemed | (16,406,195) | (18,300,659) | (515,921,780) | (493,563,874) |
Net increase (decrease) | (4,249,325) | (11,073,104) | $ (134,776,761) | $ (297,359,850) |
Annual Report
10. Share Transactions - continued
| Shares | Dollars |
Years ended October 31, | 2013 | 2012 | 2013 | 2012 |
Institutional Class | | | | |
Shares sold | 333,624 | 33,539 | $ 11,106,364 | $ 913,352 |
Reinvestment of distributions | 1,452 | 1,708 | 43,199 | 44,574 |
Shares redeemed | (117,838) | (41,079) | (3,708,160) | (1,090,028) |
Net increase (decrease) | 217,238 | (5,832) | $ 7,441,403 | $ (132,102) |
11. Other.
The Fund's organizational documents provide former and current trustees and officers with a limited indemnification against liabilities arising in connection with the performance of their duties to the Fund. In the normal course of business, the Fund may also enter into contracts that provide general indemnifications. The Fund's maximum exposure under these arrangements is unknown as this would be dependent on future claims that may be made against the Fund. The risk of material loss from such claims is considered remote.
Annual Report
Report of Independent Registered Public Accounting Firm
To the Trustees of Fidelity Investment Trust and the Shareholders of Fidelity China Region Fund:
In our opinion, the accompanying statement of assets and liabilities, including the schedule of investments, and the related statements of operations and of changes in net assets and the financial highlights present fairly, in all material respects, the financial position of Fidelity China Region Fund (a fund of Fidelity Investment Trust) at October 31, 2013, the results of its operations for the year then ended, the changes in its net assets for each of the two years in the period then ended and the financial highlights for each of the five years in the period then ended, in conformity with accounting principles generally accepted in the United States of America. These financial statements and financial highlights (hereafter referred to as "financial statements") are the responsibility of the Fidelity China Region Fund's management. Our responsibility is to express an opinion on these financial statements based on our audits. We conducted our audits of these financial statements in accordance with the standards of the Public Company Accounting Oversight Board (United States). Those standards require that we plan and perform the audit to obtain reasonable assurance about whether the financial statements are free of material misstatement. An audit includes examining, on a test basis, evidence supporting the amounts and disclosures in the financial statements, assessing the accounting principles used and significant estimates made by management, and evaluating the overall financial statement presentation. We believe that our audits, which included confirmation of securities at October 31, 2013 by correspondence with the custodian and brokers, provide a reasonable basis for our opinion.
PricewaterhouseCoopers LLP
Boston, Massachusetts
December 16, 2013
Annual Report
The Trustees, Member of the Advisory Board, and executive officers of the trust and fund, as applicable, are listed below. The Board of Trustees governs the fund and is responsible for protecting the interests of shareholders. The Trustees are experienced executives who meet periodically throughout the year to oversee the fund's activities, review contractual arrangements with companies that provide services to the fund, oversee management of the risks associated with such activities and contractual arrangements, and review the fund's performance. Except for James C. Curvey, Ned C. Lautenbach, Ronald P. O'Hanley, and William S. Stavropoulos, each of the Trustees oversees 171 funds. Mr. Curvey oversees 394 funds. Mr. Lautenbach, Mr. O'Hanley, and Mr. Stavropoulos each oversees 245 funds.
The Trustees hold office without limit in time except that (a) any Trustee may resign; (b) any Trustee may be removed by written instrument, signed by at least two-thirds of the number of Trustees prior to such removal; (c) any Trustee who requests to be retired or who has become incapacitated by illness or injury may be retired by written instrument signed by a majority of the other Trustees; and (d) any Trustee may be removed at any special meeting of shareholders by a two-thirds vote of the outstanding voting securities of the trust. Each Trustee who is not an interested person of the trust and the fund (as defined in the 1940 Act) (Independent Trustee), shall retire not later than the last day of the calendar year in which his or her 75th birthday occurs. The Independent Trustees may waive this mandatory retirement age policy with respect to individual Trustees. The executive officers and Advisory Board Member hold office without limit in time, except that any officer and Advisory Board Member may resign or may be removed by a vote of a majority of the Trustees at any regular meeting or any special meeting of the Trustees. Except as indicated, each individual has held the office shown or other offices in the same company for the past five years.
Experience, Skills, Attributes, and Qualifications of the Fund's Trustees. The Governance and Nominating Committee has adopted a statement of policy that describes the experience, qualifications, attributes, and skills that are necessary and desirable for potential Independent Trustee candidates (Statement of Policy). The Board believes that each Trustee satisfied at the time he or she was initially elected or appointed a Trustee, and continues to satisfy, the standards contemplated by the Statement of Policy. The Governance and Nominating Committee also engages professional search firms to help identify potential Independent Trustee candidates who have the experience, qualifications, attributes, and skills consistent with the Statement of Policy. From time to time, additional criteria based on the composition and skills of the current Independent Trustees, as well as experience or skills that may be appropriate in light of future changes to board composition, business conditions, and regulatory or other developments, have also been considered by the professional search firms and the Governance and Nominating Committee. In addition, the Board takes into account the Trustees' commitment and participation in Board and committee meetings, as well as their leadership of standing and ad hoc committees throughout their tenure.
In determining that a particular Trustee was and continues to be qualified to serve as a Trustee, the Board has considered a variety of criteria, none of which, in isolation, was controlling. The Board believes that, collectively, the Trustees have balanced and diverse experience, qualifications, attributes, and skills, which allow the Board to operate effectively in governing the fund and protecting the interests of shareholders. Information about the specific experience, skills, attributes, and qualifications of each Trustee, which in each case led to the Board's conclusion that the Trustee should serve (or continue to serve) as a trustee of the fund, is provided below.
Board Structure and Oversight Function. James C. Curvey is an interested person (as defined in the 1940 Act) and currently serves as Chairman. The Trustees have determined that an interested Chairman is appropriate and benefits shareholders because an interested Chairman has a personal and professional stake in the quality and continuity of services provided to the fund. Independent Trustees exercise their informed business judgment to appoint an individual of their choosing to serve as Chairman, regardless of whether the Trustee happens to be independent or a member of management. The Independent Trustees have determined that they can act independently and effectively without having an Independent Trustee serve as Chairman and that a key structural component for assuring that they are in a position to do so is for the Independent Trustees to constitute a substantial majority for the Board. The Independent Trustees also regularly meet in executive session. Ned C. Lautenbach serves as Chairman of the Independent Trustees and as such (i) acts as a liaison between the Independent Trustees and management with respect to matters important to the Independent Trustees and (ii) with management prepares agendas for Board meetings.
Fidelity funds are overseen by different Boards of Trustees. The fund's Board oversees Fidelity's equity and high income funds and another Board oversees Fidelity's investment-grade bond, money market, and asset allocation funds. The asset allocation funds may invest in Fidelity funds overseen by the fund's Board. The use of separate Boards, each with its own committee structure, allows the Trustees of each group of Fidelity funds to focus on the unique issues of the funds they oversee, including common research, investment, and operational issues. On occasion, the separate Boards establish joint committees to address issues of overlapping consequences for the Fidelity funds overseen by each Board.
The Trustees operate using a system of committees to facilitate the timely and efficient consideration of all matters of importance to the Trustees, the fund, and fund shareholders and to facilitate compliance with legal and regulatory requirements and oversight of the fund's activities and associated risks. The Board, acting through its committees, has charged FMR and its affiliates with (i) identifying events or circumstances the occurrence of which could have demonstrably adverse effects on the fund's business and/or reputation; (ii) implementing processes and controls to lessen the possibility that such events or circumstances occur or to mitigate the effects of such events or circumstances if they do occur; and (iii) creating and maintaining a system designed to evaluate continuously business and market conditions in order to facilitate the identification and implementation processes described in (i) and (ii) above. Because the day-to-day operations and activities of the fund are carried out by or through FMR, its affiliates and other service providers, the fund's exposure to risks is mitigated but not eliminated by the processes overseen by the Trustees. While each of the Board's committees has responsibility for overseeing different aspects of the fund's activities, oversight is exercised primarily through the Operations, Audit, and Compliance Committees. In addition, the Independent Trustees have worked with FMR to enhance the Board's oversight of investment and financial risks, legal and regulatory risks, technology risks, and operational risks, including the development of additional risk reporting to the Board. For example, a working group comprised of Independent Trustees and FMR has worked and continues to work to review the Fidelity funds' valuation-related activities, reporting and risk management. Appropriate personnel, including but not limited to the fund's Chief Compliance Officer (CCO), FMR's internal auditor, the independent accountants, the fund's Treasurer and portfolio management personnel, make periodic reports to the Board's committees, as appropriate, including an annual review of FMR's risk management program for the Fidelity funds. The responsibilities of each standing committee, including their oversight responsibilities, are described further under "Standing Committees of the Fund's Trustees."
Annual Report
Trustees and Officers - continued
The fund's Statement of Additional Information (SAI) includes more information about the Trustees. To request a free copy, call Fidelity at 1-877-208-0098.
Interested Trustees*:
Correspondence intended for each Trustee who is an interested person may be sent to Fidelity Investments, 245 Summer Street, Boston, Massachusetts 02210.
Name, Year of Birth; Principal Occupations and Other Relevant Experience+ |
James C. Curvey (1935) |
Year of Election or Appointment: 2007 Trustee Chairman of the Board of Trustees |
| Mr. Curvey also serves as Trustee of other Fidelity funds. Mr. Curvey is a Director of Fidelity Investments Money Management, Inc. (2009-present), Director of Fidelity Research & Analysis Co. (2009-present) and Director of FMR and FMR Co., Inc. (2007-present). Mr. Curvey is also Vice Chairman (2007-present) and Director of FMR LLC. In addition, Mr. Curvey serves as an Overseer for the Boston Symphony Orchestra and a member of the Trustees of Villanova University. Previously, Mr. Curvey was the Vice Chairman (2006-2007) and Director (2000-2007) of FMR Corp. |
Ronald P. O'Hanley (1957) |
Year of Election or Appointment: 2011 Trustee |
| Mr. O'Hanley also serves as Trustee of other Fidelity funds. He is Director of Fidelity SelectCo, LLC (2013-present), FMR Co., Inc. (2010-present), Director of Fidelity Investments Money Management, Inc. (2010-present), Director of Fidelity Research & Analysis Company (2010-present), President of Fidelity Asset Management and Corporate Services and a Member of Fidelity's Executive Committee (2010-present). Previously, Mr. O'Hanley served as President and Chief Executive Officer of BNY Mellon Asset Management (2007-2010). Mr. O'Hanley also served as Vice Chairman of Bank New York Mellon Corp. and a member of that firm's Executive Committee. Prior to the 2007 merger of The Bank of New York and Mellon Financial Corporation, he was Vice Chairman of Mellon Financial Corporation and President and Chief Executive Officer of Mellon Asset Management. He joined Mellon in February 1997. Mr. O'Hanley currently serves as Chairman of the Boston Public Library Foundation Board of Directors and sits on the Board of Directors of Beth Israel Deaconess Medical Center, the Board of Trustees of the Marine Biological Laboratory and the Advisory Board of the Maxwell School of Citizenship and Public Administration at Syracuse University. Mr. O'Hanley also chairs the Council on Asset Management for the Financial Services Roundtable and is a member of the Board of Directors of Institutional Investor's U.S. Institute. |
* Trustees have been determined to be "Interested Trustees" by virtue of, among other things, their affiliation with the trust or various entities under common control with FMR.
+ The information above includes each Trustee's principal occupation during the last five years and other information relating to the experience, attributes, and skills relevant to each Trustee's qualifications to serve as a Trustee, which led to the conclusion that each Trustee should serve as a Trustee for the fund.
Annual Report
Independent Trustees:
Correspondence intended for each Independent Trustee (that is, the Trustees other than the Interested Trustees) may be sent to Fidelity Investments, P.O. Box 55235, Boston, Massachusetts 02205-5235.
Name, Year of Birth; Principal Occupations and Other Relevant Experience+ |
Dennis J. Dirks (1948) |
Year of Election or Appointment: 2005 Trustee |
| Mr. Dirks also serves as Trustee of other Fidelity funds. Prior to his retirement in May 2003, Mr. Dirks was Chief Operating Officer and a member of the Board of The Depository Trust & Clearing Corporation (DTCC). He also served as President, Chief Operating Officer, and Board member of The Depository Trust Company (DTC) and President and Board member of the National Securities Clearing Corporation (NSCC). In addition, Mr. Dirks served as Chief Executive Officer and Board member of the Government Securities Clearing Corporation, Chief Executive Officer and Board member of the Mortgage-Backed Securities Clearing Corporation, as a Trustee and a member of the Finance Committee of Manhattan College (2005-2008), and as a Trustee and a member of the Finance Committee of AHRC of Nassau County (2006-2008). Mr. Dirks is a member of the Independent Directors Council (IDC) Governing Council (2010-present) and Board of Directors for The Brookville Center for Children's Services, Inc. (2009-present). |
Alan J. Lacy (1953) |
Year of Election or Appointment: 2008 Trustee |
| Mr. Lacy also serves as Trustee of other Fidelity funds. Mr. Lacy serves as Senior Adviser (2007-present) of Oak Hill Capital Partners, L.P. (private equity). Mr. Lacy also served as Chief Executive Officer (2000-2005) and Vice Chairman (2005-2006) of Sears Holdings Corporation and Sears, Roebuck and Co. (retail). In addition, Mr. Lacy serves as a member of the Board of Directors of Dave & Buster's Entertainment, Inc. (restaurant and entertainment complexes, 2010-present), Earth Fare, Inc. (retail grocery, 2012-present), The Hillman Companies, Inc. (hardware wholesalers, 2010-present), and Bristol-Myers Squibb Company (global pharmaceuticals, 2008-present). Mr. Lacy is a member of the Board of Trustees of The National Parks Conservation Association (2006-present). Previously, Mr. Lacy served as Chairman of the Board of Trustees of the National Parks Conservation Association (2008-2011) and as a member of the Board of Directors for the Western Union Company (global money transfer, 2006-2011). |
Ned C. Lautenbach (1944) |
Year of Election or Appointment: 2000 Trustee Chairman of the Independent Trustees |
| Mr. Lautenbach also serves as Trustee of other Fidelity funds. Mr. Lautenbach currently serves as the Lead Director of the Eaton Corporation Board of Directors (diversified industrial, 1997-present). Mr. Lautenbach is Chairman of the Board of Directors of the Philharmonic Center for the Arts in Naples, Florida (2012-present) and a member of the Council on Foreign Relations (1994-present). Previously, Mr. Lautenbach was a Partner/Advisory Partner at Clayton, Dubilier & Rice, LLC (private equity investment, 1998-2010), as well as a Director of Sony Corporation (2006-2007). |
Joseph Mauriello (1944) |
Year of Election or Appointment: 2008 Trustee |
| Mr. Mauriello also serves as Trustee of other Fidelity funds. Prior to his retirement in January 2006, Mr. Mauriello served in numerous senior management positions including Deputy Chairman and Chief Operating Officer (2004-2005), and Vice Chairman of Financial Services (2002-2004) of KPMG LLP US (professional services, 1965-2005). Mr. Mauriello currently serves as a member of the Board of Directors of XL Group plc. (global insurance and re-insurance, 2006-present). Previously, Mr. Mauriello served as a Director of the Hamilton Funds of the Bank of New York (2006-2007) and of Arcadia Resources Inc. (health care services and products, 2007-2012). |
Robert W. Selander (1950) |
Year of Election or Appointment: 2011 Trustee |
| Mr. Selander also serves as Trustee of other Fidelity funds. Previously, Mr. Selander served as a Member of the Advisory Board of other Fidelity funds (2011), and Executive Vice Chairman (2010), Chief Executive Officer (2009-2010), and President and Chief Executive Officer (1997-2009) of Mastercard, Inc. |
Cornelia M. Small (1944) |
Year of Election or Appointment: 2005 Trustee |
| Ms. Small also serves as Trustee of other Fidelity funds. Ms. Small is a member of the Board of Directors (2009-present) and Chair of the Investment Committee (2010-present) of the Teagle Foundation. Ms. Small also serves on the Investment Committee of the Berkshire Taconic Community Foundation (2008-present). Previously, Ms. Small served as Chairperson (2002-2008) and a member of the Investment Committee and Chairperson (2008-2012) and a member of the Board of Trustees of Smith College. In addition, Ms. Small served as Chief Investment Officer, Director of Global Equity Investments, and a member of the Board of Directors of Scudder, Stevens & Clark and Scudder Kemper Investments. |
William S. Stavropoulos (1939) |
Year of Election or Appointment: 2001 Trustee Vice Chairman of the Independent Trustees |
| Mr. Stavropoulos also serves as Trustee of other Fidelity funds. Mr. Stavropoulos serves as President and Founder of the Michigan Baseball Foundation, the Great Lakes Loons (2007-present). Mr. Stavropoulos is Chairman Emeritus of the Board of Directors of The Dow Chemical Company, where he previously served in numerous senior management positions, including President, CEO (1995-2000; 2002-2004), Chairman of the Executive Committee (2000-2006), and as a member of the Board of Directors (1990-2006). Currently, Mr. Stavropoulos is Chairman of the Board of Directors of Univar Inc. (global distributor of commodity and specialty chemicals), a Director of Teradata Corporation (data warehousing and technology solutions), and Maersk Inc. (industrial conglomerate), and a member of the Advisory Board for Metalmark Capital LLC (private equity investment, 2005-present). Mr. Stavropoulos is an operating advisor to Clayton, Dubilier & Rice, LLC (private equity investment). In addition, Mr. Stavropoulos is a member of the University of Notre Dame Advisory Council for the College of Science, a Trustee of the Rollin L. Gerstacker Foundation, and a Director of the Naples Philharmonic Center for the Arts. Previously, Mr. Stavropoulos served as a Director of Chemical Financial Corporation (bank holding company, 1993-2012) and Tyco International, Ltd. (multinational manufacturing and services, 2007-2012). |
David M. Thomas (1949) |
Year of Election or Appointment: 2008 Trustee |
| Mr. Thomas also serves as Trustee of other Fidelity funds. Mr. Thomas serves as Non-Executive Chairman of the Board of Directors of Fortune Brands Home and Security (home and security products, 2011-present), and as a member of the Board of Directors of Interpublic Group of Companies, Inc. (marketing communication, 2004-present). Previously, Mr. Thomas served as Executive Chairman (2005-2006) and Chairman and Chief Executive Officer (2000-2005) of IMS Health, Inc. (pharmaceutical and healthcare information solutions), and a Director of Fortune Brands, Inc. (consumer products, 2000-2011). |
+ The information above includes each Trustee's principal occupation during the last five years and other information relating to the experience, attributes, and skills relevant to each Trustee's qualifications to serve as a Trustee, which led to the conclusion that each Trustee should serve as a Trustee for the fund.
Advisory Board Member and Executive Officers:
Correspondence intended for each executive officer and Peter S. Lynch may be sent to Fidelity Investments, 245 Summer Street, Boston, Massachusetts 02210. Executive officers appear below in alphabetical order.
Name, Year of Birth; Principal Occupation |
Peter S. Lynch (1944) |
Year of Election or Appointment: 2003 Member of the Advisory Board |
| Mr. Lynch also serves as Member of the Advisory Board of other Fidelity funds. Mr. Lynch is Vice Chairman and a Director of FMR and FMR Co., Inc. In addition, Mr. Lynch serves as a Trustee of Boston College and as the Chairman of the Inner-City Scholarship Fund. Previously, Mr. Lynch served on the Special Olympics International Board of Directors (1997-2006). |
Elizabeth Paige Baumann (1968) |
Year of Election or Appointment: 2012 Anti-Money Laundering (AML) Officer |
| Ms. Baumann also serves as AML Officer of other funds. She is Chief AML Officer of FMR LLC (2012-present) and is an employee of Fidelity Investments. Previously, Ms. Baumann served as Vice President and Deputy Anti-Money Laundering Officer (2007-2012). |
William C. Coffey (1969) |
Year of Election or Appointment: 2009 Assistant Secretary |
| Mr. Coffey also serves as Assistant Secretary of other funds. He is Senior Vice President and Deputy General Counsel of FMR LLC (2010-present), and is an employee of Fidelity Investments. Previously, Mr. Coffey served as Vice President and Associate General Counsel of FMR LLC (2005-2009). |
Jonathan Davis (1968) |
Year of Election or Appointment: 2010 Assistant Treasurer |
| Mr. Davis also serves as Assistant Treasurer of other funds. Mr. Davis is an employee of Fidelity Investments. Previously, Mr. Davis served as Vice President and Associate General Counsel of FMR LLC (2003-2010). |
Adrien E. Deberghes (1967) |
Year of Election or Appointment: 2008 Deputy Treasurer |
| Mr. Deberghes also serves as an officer of other funds. He is an employee of Fidelity Investments (2008-present). Prior to joining Fidelity Investments, Mr. Deberghes was Senior Vice President of Mutual Fund Administration at State Street Corporation (2007-2008), Senior Director of Mutual Fund Administration at Investors Bank & Trust (2005-2007), and Director of Finance for Dunkin' Brands (2000-2005). |
Stephanie J. Dorsey (1969) |
Year of Election or Appointment: 2010 Assistant Treasurer |
| Ms. Dorsey also serves as an officer of other funds. She is an employee of Fidelity Investments (2008-present) and has served in other fund officer roles. Prior to joining Fidelity Investments, Ms. Dorsey served as Treasurer (2004-2008) of the JPMorgan Mutual Funds and Vice President (2004-2008) of JPMorgan Chase Bank. |
Scott C. Goebel (1968) |
Year of Election or Appointment: 2008 Secretary and Chief Legal Officer (CLO) |
| Mr. Goebel serves as Secretary and CLO of other funds. Mr. Goebel also serves as Secretary of Fidelity Investments Money Management, Inc. (FIMM) (2010-present) and Fidelity Research and Analysis Company (FRAC) (2010-present); General Counsel, Secretary, and Senior Vice President of FMR (2008-present) and FMR Co., Inc. (2008-present); Chief Legal Officer of Fidelity Management & Research (Hong Kong) Limited (2008-present) and Assistant Secretary of Fidelity Management & Research (Japan) Inc. (2008-present), and Fidelity Management & Research (U.K.) Inc. (2008-present). Previously, Mr. Goebel served as Secretary and CLO of other Fidelity funds (2008-2013), Assistant Secretary of FIMM (2008-2010), FRAC (2008-2010), and certain funds (2007-2008); and as Vice President and Secretary of Fidelity Distributors Corporation (FDC) (2005-2007). Mr. Goebel has been employed by FMR LLC or an affiliate since 2001. |
Joseph A. Hanlon (1968) |
Year of Election or Appointment: 2012 Chief Compliance Officer |
| Mr. Hanlon also serves as Chief Compliance Officer of other funds. Mr. Hanlon serves as Compliance Officer of FMR, FMR Co., Inc., Fidelity Investments Money Management, Inc. (FIMM), Fidelity Research and Analysis Company (FRAC), and Fidelity Management & Research (Hong Kong) (2009-present), as Senior Vice President of the Fidelity Asset Management Division (2009-present), and is an employee of Fidelity Investments. Previously, Mr. Hanlon served as Compliance Officer of Fidelity Management & Research (Japan) Inc. (2009-2013), Strategic Advisers, Inc. (2009-2013), and Fidelity Management & Research (U.K.) Inc. (2009-2013). |
Bruce T. Herring (1965) |
Year of Election or Appointment: 2006 Vice President of certain Equity Funds |
| Mr. Herring also serves as Vice President of other funds. He serves as Chief Investment Officer of Fidelity Global Asset Allocation (GAA) (2013-present), Chief Investment Officer and Director of Fidelity Management & Research (U.K.) Inc. (2010-present), Group Chief Investment Officer of FMR, and President of Fidelity Research & Analysis Company (2010-present). Previously, Mr. Herring served as Vice President (2005-2006) and Senior Vice President (2006-2007) of Fidelity Management & Research Company, Vice President of FMR Co., Inc. (2001-2007), and as a portfolio manager for Fidelity U.S. Equity Funds. |
Brian B. Hogan (1964) |
Year of Election or Appointment: 2009 Vice President |
| Mr. Hogan also serves as Vice President of other funds. Mr. Hogan serves as President of FMR's Equity Division (2009-present). Previously, Mr. Hogan served as Senior Vice President, Equity Research of FMR (2006-2009) and as a portfolio manager. |
Chris Maher (1972) |
Year of Election or Appointment: 2013 Assistant Treasurer |
| Mr. Maher serves as Assistant Treasurer of other funds. Mr. Maher is Vice President of Valuation Oversight and is an employee of Fidelity Investments. Previously, Mr. Maher served as Vice President of Asset Management Compliance (2013), Vice President of FMR's Program Management Group (2010-2013), and Vice President of Valuation Oversight (2008-2010). |
Christine Reynolds (1958) |
Year of Election or Appointment: 2008 Chief Financial Officer |
| Ms. Reynolds also serves as Chief Financial Officer of other funds. Ms. Reynolds became President of Fidelity Pricing and Cash Management Services (FPCMS) in August 2008. Ms. Reynolds served as Chief Operating Officer of FPCMS (2007-2008). Previously, Ms. Reynolds served as President, Treasurer, and Anti-Money Laundering officer of the Fidelity funds (2004-2007). |
Kenneth B. Robins (1969) |
Year of Election or Appointment: 2008 President and Treasurer |
| Mr. Robins also serves as an officer of other funds. Mr. Robins serves as Executive Vice President of Fidelity Investments Money Management, Inc. (FIMM) (2013-present) and is an employee of Fidelity Investments (2004-present). Previously, Mr. Robins served in other fund officer roles. |
Gary W. Ryan (1958) |
Year of Election or Appointment: 2005 Assistant Treasurer |
| Mr. Ryan also serves as Assistant Treasurer of other funds. Mr. Ryan is an employee of Fidelity Investments and has served in other fund officer roles. Previously, Mr. Ryan served as Vice President of Fund Reporting in Fidelity Pricing and Cash Management Services (FPCMS) (1999-2005). |
Stephen Sadoski (1971) |
Year of Election or Appointment: 2012 Deputy Treasurer |
| Mr. Sadoski also serves as Deputy Treasurer of other funds. He is an employee of Fidelity Investments (2012-present) and has served in another fund officer role. Prior to joining Fidelity Investments, Mr. Sadoski served as an assistant chief accountant in the Division of Investment Management of the Securities and Exchange Commission (SEC) (2009-2012) and as a senior manager at Deloitte & Touche LLP (1997-2009). |
Stacie M. Smith (1974) |
Year of Election or Appointment: 2013 Deputy Treasurer |
| Ms. Smith also serves as an officer of other funds. She is an employee of Fidelity Investments (2009-present) and has served in other fund officer roles. Prior to joining Fidelity Investments, Ms. Smith served as Senior Audit Manager of Ernst & Young LLP (1996-2009). |
Renee Stagnone (1975) |
Year of Election or Appointment: 2013 Deputy Treasurer |
| Ms. Stagnone also serves as Deputy Treasurer of other funds. Ms. Stagnone is an employee of Fidelity Investments. |
Joseph F. Zambello (1957) |
Year of Election or Appointment: 2011 Deputy Treasurer |
| Mr. Zambello also serves as Deputy Treasurer of other funds. Mr. Zambello is an employee of Fidelity Investments. Previously, Mr. Zambello served as Vice President of FMR's Program Management Group (2009-2011) and Vice President of the Transfer Agent Oversight Group (2005-2009). |
Annual Report
The Board of Trustees of Fidelity China Region Fund voted to pay to shareholders of record at the opening of business on record date, the following distributions per share derived from capital gains realized from sales of portfolio securities, and dividends derived from net investment income:
| Pay Date | Record Date | Dividends | Capital Gains |
Institutional Class | 12/9/2013 | 12/06/2013 | $0.425 | $3.306 |
The fund hereby designates as a capital gain dividend with respect to the taxable year ended October 31, 2013, $120,314,075, or, if subsequently determined to be different, the net capital gain of such year.
The fund designates 48% of the dividends distributed during the fiscal year as amounts which may be taken into account as a dividend for the purposes of the maximum rate under section 1(h)(11) of the Internal Revenue Code.
The amounts per share which represent income derived from sources within, and taxes paid to, foreign countries or possessions of the United States are as follows:
| Pay Date | Income | Taxes |
Institutional Class | 12/10/2012 | $0.525 | $0.0650 |
The fund will notify shareholders in January 2014 of amounts for use in preparing 2013 income tax returns.
Annual Report
Board Approval of Investment Advisory Contracts and Management Fees
Fidelity China Region Fund
Each year, the Board of Trustees, including the Independent Trustees (together, the Board), votes on the renewal of the management contract and sub-advisory agreements (together, the Advisory Contracts) for the fund. The Board, assisted by the advice of fund counsel and Independent Trustees' counsel, requests and considers a broad range of information relevant to the renewal of the Advisory Contracts throughout the year.
The Board meets regularly and, at each of its meetings, covers an extensive agenda of topics and materials and considers factors that are relevant to its annual consideration of the renewal of the fund's Advisory Contracts, including the services and support provided to the fund and its shareholders. The Board has established various standing committees, each composed of and chaired by Independent Trustees with varying backgrounds, to which the Board has assigned specific subject matter responsibilities in order to enhance effective decision-making by the Board. The Board, acting directly and through its Committees, requests and receives information concerning the annual consideration of the renewal of the fund's Advisory Contracts. The Board also meets as needed to consider matters specifically related to the Board's annual consideration of the renewal of Advisory Contracts. Members of the Board may also meet with trustees of other Fidelity funds through ad hoc joint committees to discuss certain matters relevant to the Fidelity funds.
At its July 2013 meeting, the Board, including the Independent Trustees, unanimously determined to renew the fund's Advisory Contracts. In reaching its determination, the Board considered all factors it believed relevant, including (i) the nature, extent, and quality of the services to be provided to the fund and its shareholders (including the investment performance of the fund); (ii) the competitiveness of the fund's management fee and total expense ratio relative to peer funds; (iii) the total costs of the services to be provided by and the profits to be realized by Fidelity from its relationship with the fund; (iv) the extent to which economies of scale exist and would be realized as the fund grows; and (v) whether fee levels reflect these economies of scale, if any, for the benefit of fund shareholders.
In considering whether to renew the Advisory Contracts for the fund, the Board reached a determination, with the assistance of fund counsel and Independent Trustees' counsel and through the exercise of its business judgment, that the renewal of the Advisory Contracts was in the best interests of the fund and its shareholders and that the compensation payable under the Advisory Contracts was fair and reasonable. The Board's decision to renew the Advisory Contracts was not based on any single factor, but rather was based on a comprehensive consideration of all the information provided to the Board at its meetings throughout the year. The Board, in reaching its determination to renew the Advisory Contracts, was aware that shareholders in the fund have a broad range of investment choices available to them, including a wide choice among mutual funds offered by Fidelity's competitors, and that the fund's shareholders, who have the opportunity to review and weigh the disclosure provided by the fund in its prospectus and other public disclosures, have chosen to invest in this fund, which is a part of the Fidelity family of funds.
Nature, Extent, and Quality of Services Provided. The Board considered the staffing within the investment adviser, Fidelity Management & Research Company (FMR), and the sub-advisers (together, the Investment Advisers) as it relates to the fund, including the backgrounds of the fund's investment personnel, and also considered the fund's investment objective, strategies, and related investment philosophy. The Independent Trustees also had discussions with senior management of Fidelity's investment operations and investment groups. The Board considered the structure of the portfolio manager compensation program and whether this structure provides appropriate incentives to act in the best interests of the fund.
Resources Dedicated to Investment Management and Support Services. The Board and the Fund Oversight and Research Committees reviewed the general qualifications and capabilities of the Investment Advisers' investment staff, including its size, education, experience, and resources, as well as the Investment Advisers' approach to recruiting, training, managing, and compensating investment personnel. The Board noted that FMR has continued to increase the resources devoted to non-U.S. offices, including expansion of Fidelity's global investment organization. The Board also noted that Fidelity's analysts have extensive resources, tools and capabilities that allow them to conduct sophisticated quantitative and fundamental analysis, as well as credit analysis of issuers, counterparties and guarantors. Further, the Board believes that Fidelity's investment professionals have sufficient access to global information and data so as to provide competitive investment results over time, and that those professionals also have access to sophisticated tools that permit them to assess portfolio construction and risk and performance attribution characteristics continuously, as well as to transmit new information and research conclusions rapidly around the world. Additionally, in its deliberations, the Board considered the Investment Advisers' trading and risk management capabilities and resources, which are an integral part of the investment management process.
Shareholder and Administrative Services. The Board considered (i) the nature, extent, quality, and cost of advisory, administrative, and shareholder services performed by the Investment Advisers and their affiliates under the Advisory Contracts and under separate agreements covering transfer agency, pricing and bookkeeping, and securities lending services for the fund; (ii) the nature and extent of the supervision of third party service providers, principally custodians and subcustodians; and (iii) the resources devoted to, and the record of compliance with, the fund's compliance policies and procedures. The Board also reviewed the allocation of fund brokerage, including allocations to brokers affiliated with the Investment Advisers, the use of brokerage commissions to pay fund expenses, and the use of "soft" commission dollars to pay for research services.
The Board noted that the growth of fund assets over time across the complex allows Fidelity to reinvest in the development of services designed to enhance the value or convenience of the Fidelity funds as investment vehicles. These services include 24-hour access to account information and market information through telephone representatives and over the Internet, investor education materials and asset allocation tools, and the expanded availability of Fidelity Investor Centers.
Annual Report
Board Approval of Investment Advisory Contracts and Management Fees - continued
Investment in a Large Fund Family. The Board considered the benefits to shareholders of investing in a Fidelity fund, including the benefits of investing in a fund that is part of a large family of funds offering a variety of investment disciplines and providing a large variety of mutual fund investor services. The Board noted that Fidelity had taken, or had made recommendations that resulted in the Fidelity funds taking, a number of actions over the previous year that benefited particular funds, including (i) continuing to dedicate additional resources to investment research and to the support of the senior management team that oversees asset management; (ii) persisting in efforts to enhance Fidelity's global research capabilities; (iii) launching new funds and making other enhancements to meet client needs for global and income-oriented solutions; (iv) continuing to launch dedicated lower cost underlying funds to meet portfolio construction needs related to expanding underlying fund options for Fidelity funds of funds, specifically for the Freedom Fund product lines; (v) rationalizing product lines and gaining increased efficiencies through the mergers of several funds into other funds; (vi) strengthening Fidelity's index fund offerings by reducing investment minimums and adopting or lowering existing expense caps for certain funds and classes; (vii) enhancing Global Asset Allocation product offerings by launching new funds and strategies, including "open architecture" target date funds that utilize affiliated and unaffiliated sub-advisers; (viii) modifying the eligibility criteria for Institutional Class shares of Advisor funds to increase their marketability to a portion of the defined contribution plan market; (ix) creating a new low-cost retirement share class for certain Advisor funds to appeal to large retirement plans; (x) transitioning the management of certain Fidelity commodity funds to Geode Capital Management LLC, a registered commodity pool operator, while retaining administrative responsibilities for the funds; (xi) reorganizing a number of funds; and (xii) taking steps toward establishing a new Fidelity adviser to manage sector-based funds and products.
Investment Performance. The Board considered whether the fund has operated in accordance with its investment objective, as well as its record of compliance with its investment restrictions and its performance history. The Board noted that there was a portfolio management change for the fund in October 2011.
The Board took into account discussions with the Investment Advisers about fund investment performance that occur at Board meetings throughout the year. In this regard the Board noted that as part of regularly scheduled fund reviews and other reports to the Board on fund performance, the Board periodically considers annualized return information for the fund, for different time periods, measured against a securities market index ("benchmark index") and a peer group of mutual funds with similar objectives ("peer group"). In its evaluation of fund investment performance, the Board gave particular attention to information indicating changes in performance of certain Fidelity funds for specific time periods and the Investment Advisers' explanations for any overperformance or underperformance.
In addition to reviewing absolute and relative fund performance, the Independent Trustees periodically consider the appropriateness of fund performance metrics in evaluating the results achieved. In general, the Independent Trustees believe that fund performance should be evaluated based on net performance (after fees and expenses) of both the highest performing and lowest performing classes, where applicable, compared to appropriate benchmark indices, over appropriate time periods which may include full market cycles, and compared to peer groups, as applicable, over the same periods, taking into account relevant factors including the following: general market conditions; issuer-specific information; tactical opportunities for investment; and fund cash flows and other factors.
The Independent Trustees recognize that shareholders evaluate performance on a net basis over their own holding periods, for which one-, three-, and five-year periods are used as a proxy. For this reason, the performance information reviewed by the Board also included net cumulative calendar year total return information for the fund and an appropriate benchmark index for the most recent one-, three-, and five-year periods, as shown below. A peer group comparison is not shown below.
Annual Report
Fidelity China Region Fund

Based on its review, the Board concluded that the nature, extent, and quality of services provided to the fund under the Advisory Contracts should benefit the fund's shareholders.
Competitiveness of Management Fee and Total Expense Ratio. The Board considered the fund's management fee and total expense ratio compared to "mapped groups" of competitive funds and classes. Fidelity creates "mapped groups" by combining similar Lipper investment objective categories that have comparable management fee characteristics. Combining Lipper investment objective categories aids the Board's management fee and total expense ratio comparisons by broadening the competitive group used for comparison and by reducing the number of universes to which various Fidelity funds are compared.
Management Fee. The Board considered two proprietary management fee comparisons for the 12-month periods shown in the chart below. The group of Lipper funds used by the Board for management fee comparisons is referred to below as the "Total Mapped Group." The Total Mapped Group comparison focuses on a fund's standing in terms of gross management fees before expense reimbursements or caps relative to the total universe of funds with comparable investment mandates, regardless of whether their management fee structures also are comparable. Funds with comparable investment mandates offer exposure to similar types of securities. Funds with comparable management fee structures have similar management fee contractual arrangements (e.g., flat rate charged for advisory services, all-inclusive fee rate, etc.). "TMG %" represents the percentage of funds in the Total Mapped Group that had management fees that were lower than the fund's. For example, a TMG % of 8% means that 92% of the funds in the Total Mapped Group had higher management fees than the fund. The "Asset-Size Peer Group" (ASPG) comparison focuses on a fund's standing relative to a subset of non-Fidelity funds within the Total Mapped Group that are similar in size and management fee structure. The ASPG represents at least 15% of the funds in the Total Mapped Group with comparable asset size and management fee structures, subject to a minimum of 50 funds (or all funds in the Total Mapped Group if fewer than 50). Additional information, such as the ASPG quartile in which the fund's management fee ranked, is also included in the chart and considered by the Board.
Annual Report
Board Approval of Investment Advisory Contracts and Management Fees - continued
Fidelity China Region Fund
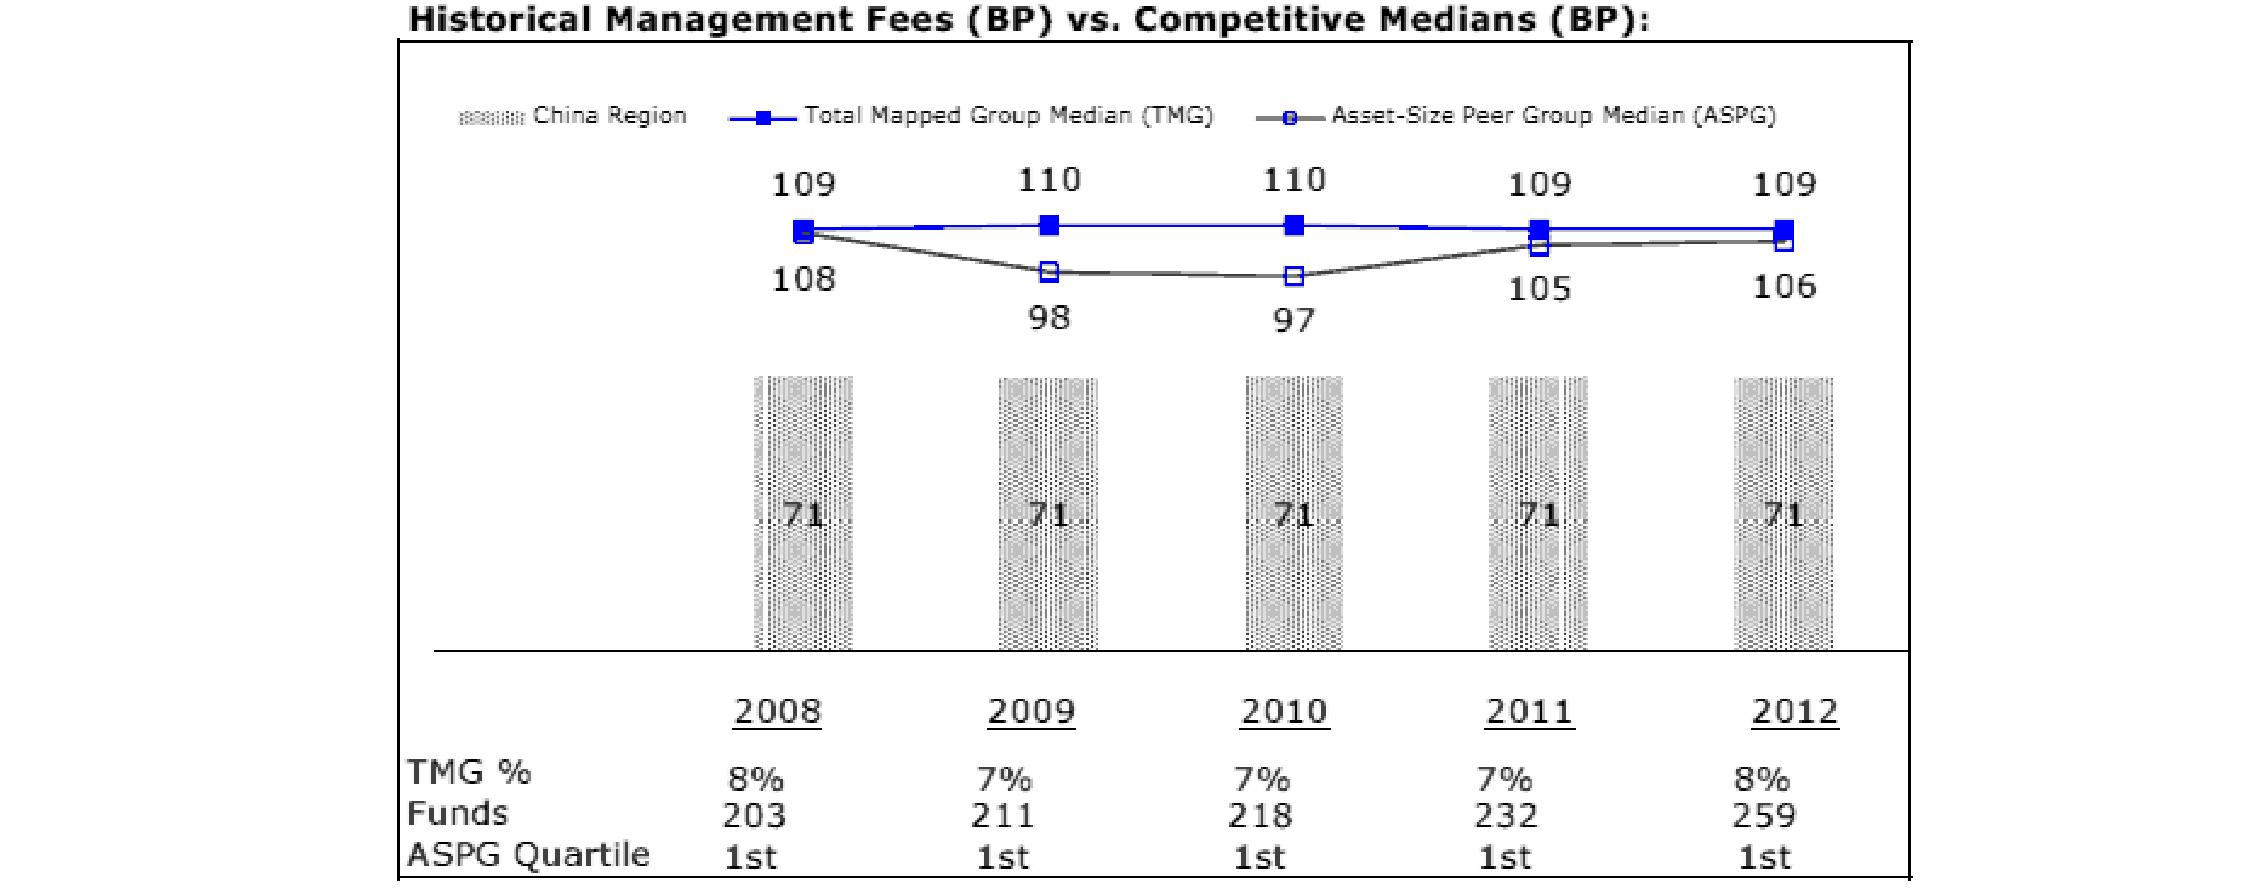
The Board noted that the fund's management fee ranked below the median of its Total Mapped Group and below the median of its ASPG for 2012.
Based on its review, the Board concluded that the fund's management fee is fair and reasonable in light of the services that the fund receives and the other factors considered.
Total Expense Ratio. In its review of each class's total expense ratio, the Board considered the fund's management fee as well as other fund or class expenses, as applicable, such as transfer agent fees, pricing and bookkeeping fees, fund-paid 12b-1 fees, and custodial, legal, and audit fees. The Board also noted the effects of any waivers and reimbursements on fees and expenses. As part of its review, the Board also considered the current and historical total expense ratios of each class of the fund compared to competitive fund median expenses. Each class of the fund is compared to those funds and classes in the Total Mapped Group (used by the Board for management fee comparisons) that have a similar sales load structure.
The Board noted that the total expense ratio of each class ranked below its competitive median for 2012.
Fees Charged to Other Fidelity Clients. The Board also considered Fidelity fee structures and other information with respect to clients of FMR and its affiliates, such as other mutual funds advised or subadvised by FMR or its affiliates, pension plan clients, and other institutional clients. The Board noted the findings of the 2013 ad hoc joint committee (created with the board of other Fidelity funds), which reviewed and compared Fidelity's institutional investment advisory business with its business of providing services to the Fidelity funds, including the differences in services provided, fees charged, and costs incurred, as well as competition in their respective marketplaces.
Based on its review of total expense ratios and fees charged to other Fidelity clients, the Board concluded that the total expense ratio of each class of the fund was reasonable in light of the services that the fund and its shareholders receive and the other factors considered.
Costs of the Services and Profitability. The Board considered the revenues earned and the expenses incurred by Fidelity in conducting the business of developing, marketing, distributing, managing, administering and servicing the fund and servicing the fund's shareholders. The Board also considered the level of Fidelity's profits in respect of all the Fidelity funds.
On an annual basis, FMR presents to the Board Fidelity's profitability for the fund. Fidelity calculates the profitability for each fund, as well as aggregate profitability for groups of Fidelity funds and all Fidelity funds, using a series of detailed revenue and cost allocation methodologies which originate with the books and records of Fidelity on which Fidelity's audited financial statements are based. The Audit Committee of the Board reviews any significant changes from the prior year's methodologies.
PricewaterhouseCoopers LLP (PwC), independent registered public accounting firm and auditor to Fidelity and certain Fidelity funds, has been engaged annually by the Board as part of the Board's assessment of Fidelity's profitability analysis. PwC's engagement includes the review and assessment of the methodologies used by Fidelity in determining the revenues and expenses attributable to Fidelity's mutual fund business, and completion of agreed-upon procedures surrounding the mathematical accuracy of fund profitability and its conformity to allocation methodologies. After considering PwC's reports issued under the engagement and information provided by Fidelity, the Board concluded that while other allocation methods may also be reasonable, Fidelity's profitability methodologies are reasonable in all material respects.
Annual Report
The Board also reviewed Fidelity's non-fund businesses and fall-out benefits related to the mutual fund business as well as cases where Fidelity's affiliates may benefit from or be related to the fund's business.
The Board considered the costs of the services provided by and the profits realized by Fidelity in connection with the operation of the fund and was satisfied that the profitability was not excessive in the circumstances.
Economies of Scale. The Board considered whether there have been economies of scale in respect of the management of the Fidelity funds, whether the Fidelity funds (including the fund) have appropriately benefited from any such economies of scale, and whether there is potential for realization of any further economies of scale. The Board considered the extent to which the fund will benefit from economies of scale through increased services to the fund, through waivers or reimbursements, or through fee or expense reductions. The Board also noted that in 2009, it and the board of other Fidelity funds created an ad hoc committee (the Economies of Scale Committee) to analyze whether FMR attains economies of scale in respect of the management and servicing of the Fidelity funds, whether the Fidelity funds have appropriately benefited from such economies of scale, and whether there is potential for realization of any further economies of scale.
The Board recognized that the fund's management contract incorporates a "group fee" structure, which provides for lower group fee rates as total fund assets under FMR's management increase, and for higher group fee rates as total fund assets under FMR's management decrease. FMR calculates the group fee rates based on a tiered asset "breakpoint" schedule that varies based on asset class. The Board considered that the group fee is designed to deliver the benefits of economies of scale to fund shareholders when total Fidelity fund assets increase, even if assets of any particular fund are unchanged or have declined, because some portion of Fidelity's costs are attributable to services provided to all Fidelity funds, and all funds benefit if those costs can be allocated among more assets. The Board concluded that, given the group fee structure, fund shareholders will benefit from lower management fees as assets under FMR's management increase at the fund complex level, regardless of whether Fidelity achieves any such economies of scale.
The Board concluded, taking into account the analysis of the Economies of Scale Committee, that economies of scale, if any, are being appropriately shared between fund shareholders and Fidelity.
Amendment to Description of Group Fee Rate. At its July 2013 meeting, the Board voted to approve an amendment to the fund's management contract to modify the description of the "group fee rate" effective August 1, 2013. The Board noted that under the prior description in the contract, the group fee rate was based on the average net assets of all registered investment companies with which FMR has management contracts. Under the contract's tiered asset breakpoint schedule, the group fee rate is lower as total fund assets under FMR's management increase, and higher as total fund assets under FMR's management decrease. The Board considered that the prior description would have excluded the assets of 64 Fidelity sector funds from the group fee rate calculation once Fidelity SelectCo, LLC, an affiliate of FMR, assumed management responsibilities for those funds. The Board noted that modifying the description of the group fee rate to continue to include the assets of those 64 funds for purposes of determining group fee rate breakpoints would avoid an immediate adverse impact on the group fee rate for any fund.
Additional Information Requested by the Board. In order to develop fully the factual basis for consideration of the Fidelity funds' Advisory Contracts, the Board requested and received additional information on certain topics, including: (i) fund performance trends and Fidelity's long-term strategies for certain funds; (ii) the potential to further rationalize the Fidelity fund lineup with the possibility of achieving savings for the funds and Fidelity; (iii) the methodology with respect to competitive fund data and peer group classifications; (iv) the arrangements with, and performance of, certain sub-advisers on behalf of the Fidelity funds, as well as certain proposed participating affiliate arrangements; (v) the realization of fall-out benefits in certain Fidelity business units; (vi) Fidelity's group fee structures, including the rationale for the individual fee rates of certain categories of funds and the definition of group assets; (vii) trends regarding industry use of performance fee structures and the performance adjustment methodologies applicable to the Fidelity funds; (viii) additional competitive analysis regarding the total expenses for certain classes; and (ix) fund profitability methodology, including Fidelity's cost allocation methodology, and the impact of certain factors on fund profitability results.
Based on its evaluation of all of the conclusions noted above, and after considering all factors it believed relevant, the Board ultimately concluded that the advisory fee structures are fair and reasonable, and that the fund's Advisory Contracts should be renewed.
Annual Report
Investment Adviser
Fidelity Management & Research Company
Boston, MA
Investment Sub-Advisers
FMR Co., Inc.
Fidelity Management & Research
(U.K.) Inc.
Fidelity Management & Research
(Hong Kong) Limited
Fidelity Management & Research
(Japan) Inc.
FIL Investments (Japan) Limited
FIL Investment Advisors
FIL Investment Advisors
(UK) Limited
General Distributor
Fidelity Distributors Corporation
Smithfield, RI
Transfer and Service Agents
Fidelity Investments Institutional
Operations Company, Inc.
Boston, MA
Fidelity Service Company, Inc.
Boston, MA
Custodian
Brown Brothers Harriman & Co.,
Boston, MA
(Fidelity Investment logo)(registered trademark)
Corporate Headquarters
245 Summer St., Boston, MA 02210
www.fidelity.com
AHKCI-UANN-1213
1.861450.105
Item 2. Code of Ethics
As of the end of the period, October 31, 2013, Fidelity Investment Trust (the trust) has adopted a code of ethics, as defined in Item 2 of Form N-CSR, that applies to its President and Treasurer and its Chief Financial Officer. A copy of the code of ethics is filed as an exhibit to this Form N-CSR.
Item 3. Audit Committee Financial Expert
The Board of Trustees of the trust has determined that Joseph Mauriello is an audit committee financial expert, as defined in Item 3 of Form N-CSR. Mr. Mauriello is independent for purposes of Item 3 of Form N-CSR.
Item 4. Principal Accountant Fees and Services
Fees and Services
The following table presents fees billed by Deloitte & Touche LLP, the member firms of Deloitte Touche Tohmatsu, and their respective affiliates (collectively, "Deloitte Entities") in each of the last two fiscal years for services rendered to Fidelity Europe Capital Appreciation Fund (the "Fund"):
Services Billed by Deloitte Entities
October 31, 2013 FeesA
| Audit Fees | Audit-Related Fees | Tax Fees | All Other Fees |
Fidelity Europe Capital Appreciation Fund | $44,000 | $- | $5,800 | $600 |
October 31, 2012 FeesA
| Audit Fees | Audit-Related Fees | Tax Fees | All Other Fees |
Fidelity Europe Capital Appreciation Fund | $43,000 | $- | $5,700 | $400 |
A Amounts may reflect rounding.
The following table presents fees billed by PricewaterhouseCoopers LLP ("PwC") in each of the last two fiscal years for services rendered to Fidelity Canada Fund, Fidelity China Region Fund, Fidelity Emerging Asia Fund, Fidelity Emerging Markets Fund, Fidelity Europe Fund, Fidelity Japan Fund, Fidelity Japan Smaller Companies Fund, Fidelity Latin America Fund, Fidelity Nordic Fund and Fidelity Pacific Basin Fund (the "Funds"):
Services Billed by PwC
October 31, 2013 FeesA
| Audit Fees | Audit-Related Fees | Tax Fees | All Other Fees |
Fidelity Canada Fund | $63,000 | $- | $5,200 | $2,600 |
Fidelity China Region Fund | $60,000 | $- | $5,200 | $2,000 |
Fidelity Emerging Asia Fund | $62,000 | $- | $5,200 | $2,000 |
Fidelity Emerging Markets Fund | $78,000 | $- | $5,400 | $2,500 |
Fidelity Europe Fund | $63,000 | $- | $9,800 | $1,700 |
Fidelity Japan Fund | $62,000 | $- | $5,200 | $1,700 |
Fidelity Japan Smaller Companies Fund | $51,000 | $- | $5,200 | $1,600 |
Fidelity Latin America Fund | $64,000 | $- | $5,200 | $2,200 |
Fidelity Nordic Fund | $51,000 | $- | $5,200 | $1,600 |
Fidelity Pacific Basin Fund | $63,000 | $- | $5,400 | $1,700 |
October 31, 2012 FeesA
| Audit Fees | Audit-Related Fees | Tax Fees | All Other Fees |
Fidelity Canada Fund | $64,000 | $- | $5,100 | $3,100 |
Fidelity China Region Fund | $59,000 | $- | $5,100 | $2,100 |
Fidelity Emerging Asia Fund | $61,000 | $- | $5,100 | $2,100 |
Fidelity Emerging Markets Fund | $77,000 | $- | $5,300 | $2,800 |
Fidelity Europe Fund | $62,000 | $- | $8,200 | $1,800 |
Fidelity Japan Fund | $60,000 | $- | $5,100 | $1,700 |
Fidelity Japan Smaller Companies Fund | $50,000 | $- | $5,100 | $1,600 |
Fidelity Latin America Fund | $62,000 | $- | $5,100 | $2,700 |
Fidelity Nordic Fund | $50,000 | $- | $5,100 | $1,600 |
Fidelity Pacific Basin Fund | $61,000 | $- | $5,300 | $1,800 |
A Amounts may reflect rounding.
The following table presents fees billed by PwC and Deloitte Entities that were required to be approved by the Audit Committee for services that relate directly to the operations and financial reporting of the Funds and that are rendered on behalf of Fidelity Management & Research Company ("FMR") and entities controlling, controlled by, or under common control with FMR (not including any sub-adviser whose role is primarily portfolio management and is subcontracted with or overseen by another investment adviser) that provide ongoing services to the Funds ("Fund Service Providers"):
Services Billed by Deloitte Entities
| October 31, 2013A | October 31, 2012A |
Audit-Related Fees | $1,010,000 | $720,000 |
Tax Fees | $- | $- |
All Other Fees | $800,000 | $1,305,000 |
A Amounts may reflect rounding.
Services Billed by PwC
| October 31, 2013A | October 31, 2012A |
Audit-Related Fees | $5,395,000 | $3,640,000 |
Tax Fees | $- | $- |
All Other Fees | $50,000 | $- |
A Amounts may reflect rounding.
"Audit-Related Fees" represent fees billed for assurance and related services that are reasonably related to the performance of the fund audit or the review of the fund's financial statements and that are not reported under Audit Fees.
"Tax Fees" represent fees billed for tax compliance, tax advice or tax planning that relate directly to the operations and financial reporting of the fund.
"All Other Fees" represent fees billed for services provided to the fund or Fund Service Provider, a significant portion of which are assurance related, that relate directly to the operations and financial reporting of the fund, excluding those services that are reported under Audit Fees, Audit-Related Fees or Tax Fees.
Assurance services must be performed by an independent public accountant.
* * *
The aggregate non-audit fees billed by PwC and Deloitte Entities for services rendered to the Funds, FMR (not including any sub-adviser whose role is primarily portfolio management and is subcontracted with or overseen by another investment adviser), and any Fund Service Provider for each of the last two fiscal years of the Funds are as follows:
Billed By | October 31, 2013 A | October 31, 2012 A |
PwC | $6,370,000 | $4,245,000 |
Deloitte Entities | $1,925,000 | $2,070,000 |
A Amounts may reflect rounding.
The trust's Audit Committee has considered non-audit services that were not pre-approved that were provided by PwC and Deloitte Entities to Fund Service Providers to be compatible with maintaining the independence of PwC and Deloitte Entities in their audits of the Funds, taking into account representations from PwC and Deloitte Entities, in accordance with Public Company Accounting Oversight Board rules, regarding their independence from the Funds and their related entities and FMR's review of the appropriateness and permissibility under applicable law of such non-audit services prior to their provision to the Fund Service Providers.
Audit Committee Pre-Approval Policies and Procedures
The trust's Audit Committee must pre-approve all audit and non-audit services provided by a fund's independent registered public accounting firm relating to the operations or financial reporting of the fund. Prior to the commencement of any audit or non-audit services to a fund, the Audit Committee reviews the services to determine whether they are appropriate and permissible under applicable law.
The Audit Committee has adopted policies and procedures to, among other purposes, provide a framework for the Committee's consideration of non-audit services by the audit firms that audit the Fidelity funds. The policies and procedures require that any non-audit service provided by a fund audit firm to a Fidelity fund and any non-audit service provided by a fund auditor to a Fund Service Provider that relates directly to the operations and financial reporting of a Fidelity fund ("Covered Service") are subject to approval by the Audit Committee before such service is provided.
All Covered Services must be approved in advance of provision of the service either: (i) by formal resolution of the Audit Committee, or (ii) by oral or written approval of the service by the Chair of the Audit Committee (or if the Chair is unavailable, such other member of the Audit Committee as may be designated by the Chair to act in the Chair's absence). The approval contemplated by (ii) above is permitted where the Treasurer determines that action on such an engagement is necessary before the next meeting of the Audit Committee.
Non-audit services provided by a fund audit firm to a Fund Service Provider that do not relate directly to the operations and financial reporting of a Fidelity fund are reported to the Audit Committee on a periodic basis.
Non-Audit Services Approved Pursuant to Rule 2-01(c)(7)(i)(C) and (ii) of Regulation S-X ("De Minimis Exception")
There were no non-audit services approved or required to be approved by the Audit Committee pursuant to the De Minimis Exception during the Funds' last two fiscal years relating to services provided to (i) the Funds or (ii) any Fund Service Provider that relate directly to the operations and financial reporting of the Funds.
Item 5. Audit Committee of Listed Registrants
Not applicable.
Item 6. Investments
(a) Not applicable.
(b) Not applicable
Item 7. Disclosure of Proxy Voting Policies and Procedures for Closed-End Management Investment Companies
Not applicable.
Item 8. Portfolio Managers of Closed-End Management Investment Companies
Not applicable.
Item 9. Purchase of Equity Securities by Closed-End Management Investment Company and Affiliated Purchasers
Not applicable.
Item 10. Submission of Matters to a Vote of Security Holders
There were no material changes to the procedures by which shareholders may recommend nominees to the trust's Board of Trustees.
Item 11. Controls and Procedures
(a)(i) The President and Treasurer and the Chief Financial Officer have concluded that the trust's disclosure controls and procedures (as defined in Rule 30a-3(c) under the Investment Company Act) provide reasonable assurances that material information relating to the trust is made known to them by the appropriate persons, based on their evaluation of these controls and procedures as of a date within 90 days of the filing date of this report.
(a)(ii) There was no change in the trust's internal control over financial reporting (as defined in Rule 30a-3(d) under the Investment Company Act) that occurred during the second fiscal quarter of the period covered by this report that has materially affected, or is reasonably likely to materially affect, the trust's internal control over financial reporting.
Item 12. Exhibits
(a) | (1) | Code of Ethics pursuant to Item 2 of Form N-CSR is filed and attached hereto as EX-99.CODE ETH. |
(a) | (2) | Certification pursuant to Rule 30a-2(a) under the Investment Company Act of 1940 (17 CFR 270.30a-2(a)) is filed and attached hereto as Exhibit 99.CERT. |
(a) | (3) | Not applicable. |
(b) | | Certification pursuant to Rule 30a-2(b) under the Investment Company Act of 1940 (17 CFR 270.30a-2(b)) is furnished and attached hereto as Exhibit 99.906CERT. |
SIGNATURES
Pursuant to the requirements of the Securities Exchange Act of 1934 and the Investment Company Act of 1940, the registrant has duly caused this report to be signed on its behalf by the undersigned, thereunto duly authorized.
Fidelity Investment Trust
By: | /s/Kenneth B. Robins |
| Kenneth B. Robins |
| President and Treasurer |
| |
Date: | December 26, 2013 |
Pursuant to the requirements of the Securities Exchange Act of 1934 and the Investment Company Act of 1940, this report has been signed below by the following persons on behalf of the registrant and in the capacities and on the dates indicated.
By: | /s/Kenneth B. Robins |
| Kenneth B. Robins |
| President and Treasurer |
| |
Date: | December 26, 2013 |
By: | /s/Christine Reynolds |
| Christine Reynolds |
| Chief Financial Officer |
| |
Date: | December 26, 2013 |