UNITED STATES
SECURITIES AND EXCHANGE COMMISSION
Washington, D.C. 20549
FORM N-CSR
CERTIFIED SHAREHOLDER REPORT OF REGISTERED
MANAGEMENT INVESTMENT COMPANIES
Investment Company Act file number 811-4008
Fidelity Investment Trust
(Exact name of registrant as specified in charter)
245 Summer St., Boston, Massachusetts 02210
(Address of principal executive offices) (Zip code)
Marc Bryant, Secretary
245 Summer St.
Boston, Massachusetts 02210
(Name and address of agent for service)
Registrant's telephone number, including area code: 617-563-7000
Date of fiscal year end: | October 31 |
| |
Date of reporting period: | October 31, 2015 |
This report on Form N-CSR relates solely to the Registrant's Fidelity Canada Fund, Fidelity China Region Fund, Fidelity Emerging Asia Fund, Fidelity Emerging Markets Fund, Fidelity Europe Fund, Fidelity Japan Fund, Fidelity Japan Smaller Companies Fund, Fidelity Latin America Fund, Fidelity Nordic Fund and Fidelity Pacific Basin Fund (each, a "Fund" and collectively, the "Funds").
Item 1. Reports to Stockholders
ContentsPerformance: The Bottom LineManagement's Discussion of Fund PerformanceShareholder Expense ExampleInvestment Changes (Unaudited)Investments October 31, 2015Financial StatementsNotes to Financial StatementsReport of Independent Registered Public Accounting FirmTrustees and OfficersDistributions (Unaudited)Board Approval of Investment Advisory Contracts and Management FeesContentsPerformance: The Bottom LineManagement's Discussion of Fund PerformanceShareholder Expense ExampleInvestment Changes (Unaudited)Investments October 31, 2015Financial StatementsNotes to Financial StatementsReport of Independent Registered Public Accounting FirmTrustees and OfficersDistributions (Unaudited)Board Approval of Investment Advisory Contracts and Management Fees
Fidelity Advisor®
Europe Fund -
Class A, Class T, Class B and Class C
Annual Report
October 31, 2015
Class A, Class T, Class B, and Class C are
classes of Fidelity® Europe Fund
(Fidelity Cover Art)
Contents
Performance | (Click Here) | How the fund has done over time. |
Management's Discussion of Fund Performance | (Click Here) | The Portfolio Manager's review of fund performance and strategy. |
Shareholder Expense Example | (Click Here) | An example of shareholder expenses. |
Investment Changes | (Click Here) | A summary of major shifts in the fund's investments over the past six months. |
Investments | (Click Here) | A complete list of the fund's investments with their market values. |
Financial Statements | (Click Here) | Statements of assets and liabilities, operations, and changes in net assets, as well as financial highlights. |
Notes | (Click Here) | Notes to the financial statements. |
Report of Independent Registered Public Accounting Firm | (Click Here) | |
Trustees and Officers | (Click Here) | |
Distributions | (Click Here) | |
Board Approval of Investment Advisory Contracts and Management Fees | (Click Here) | |
To view a fund's proxy voting guidelines and proxy voting record for the 12-month period ended June 30, visit http://www.fidelity.com/proxyvotingresults or visit the Securities and Exchange Commission's (SEC) web site at http://www.sec.gov. You may also call 1-877-208-0098 to request a free copy of the proxy voting guidelines.
Standard & Poor's, S&P and S&P 500 are registered service marks of The McGraw-Hill Companies, Inc. and have been licensed for use by Fidelity Distributors Corporation.
Other third-party marks appearing herein are the property of their respective owners.
All other marks appearing herein are registered or unregistered trademarks or service marks of FMR LLC or an affiliated company. © 2015 FMR LLC. All rights reserved.
This report and the financial statements contained herein are submitted for the general information of the shareholders of the fund. This report is not authorized for distribution to prospective investors in the fund unless preceded or accompanied by an effective prospectus.
A fund files its complete schedule of portfolio holdings with the SEC for the first and third quarters of each fiscal year on Form N-Q. Forms N-Q are available on the SEC's web site at http://www.sec.gov. A fund's Forms N-Q may be reviewed and copied at the SEC's Public Reference Room in Washington, DC. Information regarding the operation of the SEC's Public Reference Room may be obtained by calling 1-800-SEC-0330. For a complete list of a fund's portfolio holdings, view the most recent holdings listing, semiannual report, or annual report on Fidelity's web site at http://www.fidelity.com, http://www.advisor.fidelity.com, or http://www.401k.com, as applicable.
NOT FDIC INSURED • MAY LOSE VALUE • NO BANK GUARANTEE
Neither the fund nor Fidelity Distributors Corporation is a bank.
Annual Report
Average annual total return reflects the change in the value of an investment, assuming reinvestment of the class' distributions from dividend income and capital gains (the profits earned upon the sale of securities that have grown in value, if any) and assuming a constant rate of performance each year. The $10,000 table and the fund's returns do not reflect the deduction of taxes that a shareholder would pay on fund distributions or the redemption of fund shares. During periods of reimbursement by Fidelity, a fund's total return will be greater than it would be had the reimbursement not occurred. How a fund did yesterday is no guarantee of how it will do tomorrow.
Average Annual Total Returns
Periods ended October 31, 2015 | Past 1
year | Past 5
years | Past 10
years |
Class A (incl. 5.75% sales charge) A | -1.39% | 4.70% | 4.35% |
Class T (incl. 3.50% sales charge) B | 0.68% | 5.10% | 4.55% |
Class B (incl. contingent deferred sales charge) C | -1.22% | 5.36% | 4.84% |
Class C (incl. contingent deferred sales charge) D | 2.79% | 5.68% | 4.84% |
A Class A shares bear a 0.25% 12b-1 fee. The initial offering of Class A shares took place on March 18, 2014. Returns prior to March 18, 2014, are those of Fidelity® Europe Fund, the original class of the fund, which has no 12b-1 fee. Had Class A's 12b-1 fee been reflected, returns prior to March 18, 2014, would have been lower.
B Class T shares bear a 0.50% 12b-1 fee. The initial offering of Class T shares took place on March 18, 2014. Returns prior to March 18, 2014, are those of Fidelity® Europe Fund, the original class of the fund, which has no 12b-1 fee. Had Class T's 12b-1 fee been reflected, returns prior to March 18, 2014, would have been lower.
C Class B shares bear a 1.00% 12b-1 fee. The initial offering of Class B shares took place on March 18, 2014. Returns prior to March 18, 2014, are those of Fidelity Europe Fund, the original class of the fund, which has no 12b-1 fee. Had Class B's 12b-1 fee been reflected, returns prior to March 18, 2014, would have been lower. Class B shares' contingent deferred sales charges included in the past one year, past five years, and past ten years total return figures are 5%, 2%, and 0%, respectively.
D Class C shares bear a 1.00% 12b-1 fee. The initial offering of Class C shares took place on March 18, 2014. Returns prior to March 18, 2014, are those of Fidelity Europe Fund, the original class of the fund, which has no 12b-1 fee. Had Class C's 12b-1 fee been reflected, returns prior to March 18, 2014, would have been lower. Class C shares' contingent deferred sales charges included in the past one year, past five years, and past ten years total return figures are 1%, 0%, and 0%, respectively.
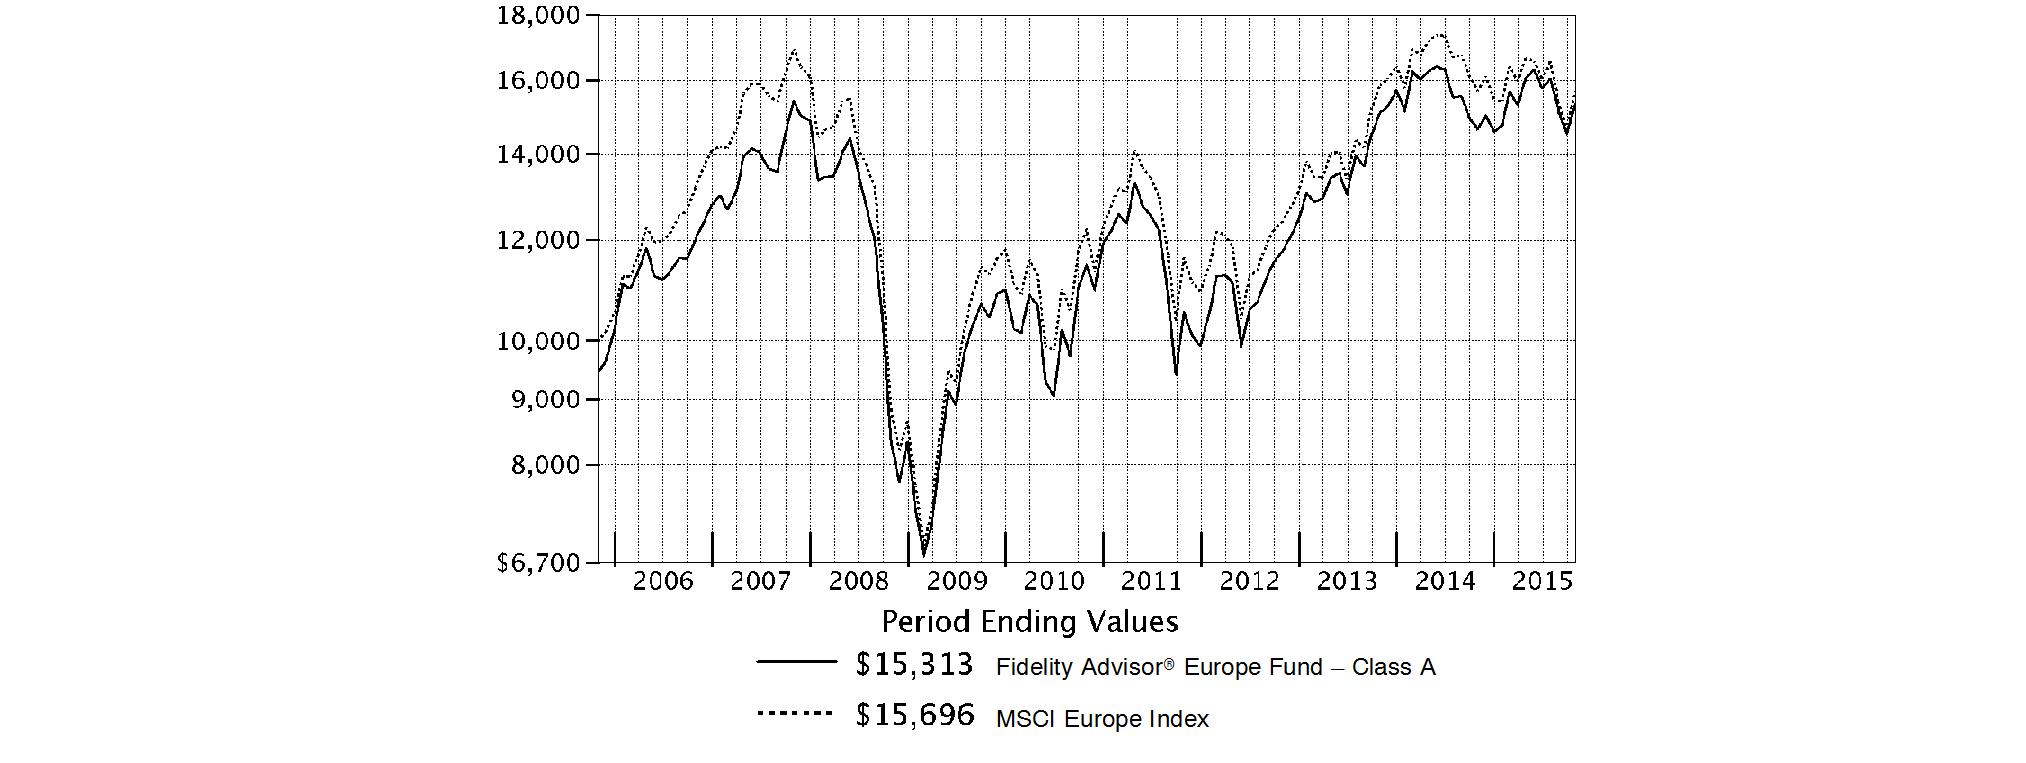
$10,000 Over 10 Years
Let's say hypothetically that $10,000 was invested in Fidelity Advisor® Europe Fund - Class A on October 31, 2005, and the current 5.75% sales charge was paid. The chart shows how the value of your investment would have changed, and also shows how the MSCI Europe Index performed over the same period. See footnote A above for additional information regarding the performance of Class A.
Annual Report
Fidelity Europe Fund
Market Recap: International equities suffered a moderate setback for the 12 months ending October 31, 2015, held back by a collapse in commodities prices that hurt resources-related sectors and geographies. The MSCI ACWI (All Country World Index) ex USA Index returned -4.55% for the period, affected also by concerns about global economic growth. Commodity producers remained under pressure for much of the past year, largely related to economic deceleration in China (-1%), the world's second-largest economy and a leading consumer of raw materials. This effect was exacerbated by U.S. dollar strength relative to global currencies, which weighed on commodities priced in dollars and acutely impacted equity returns within regions most exposed to resources prices. The emerging-markets group, for example, returned about -15% this period. Canada, a significant energy producer, returned roughly -17%. Net energy consumer Japan (+9%) was the best-performing region by far. Only about a quarter of the nearly 50 index countries managed a gain this period: Ireland (+19%) - the EU's fastest-growing economy - and Israel (+17%) proved top performers; Greece (-56%) and Brazil (-46%), among the worst. As for sectors, energy (-25%) and materials (-16%) declined sharply, whereas the two consumer sectors each gained about 6%.
Comments from Portfolio Manager Stefan Lindblad: For the year, the fund's share classes (excluding sales charges, if applicable) delivered mid-single-digit gains, handily outpacing the 0.04% return of the MSCI Europe Index. It was a volatile period for European stocks, partly stoked by European Central Bank intervention and weakness in commodities. Stock selection by far drove the fund's performance relative to the MSCI index, led by choices in health care, energy and financials. Avoiding poor-performing index component U.K.-based oil and gas company Royal Dutch Shell provided the fund's top individual contributor. Underweighting U.K.-based HSBC and avoiding Spanish bank Banco Santander also proved additive. On the downside, choices in the food, beverage & tobacco industry group hurt, as was positioning in telecommunication services. The most significant individual detractor was U.K.-based international bank Standard Chartered. I underestimated the company's balance sheet issues, and I did not foresee the slowdown in emerging markets, which weighed heavily on the stock's price. Encouraged by the company's management changes, I increased the fund's stake on weakness by period end.
The views expressed above reflect those of the portfolio manager(s) only through the end of the period as stated on the cover of this report and do not necessarily represent the views of Fidelity or any other person in the Fidelity organization. Any such views are subject to change at any time based upon market or other conditions and Fidelity disclaims any responsibility to update such views. These views may not be relied on as investment advice and, because investment decisions for a Fidelity fund are based on numerous factors, may not be relied on as an indication of trading intent on behalf of any Fidelity fund.
Annual Report
Fidelity Europe Fund
As a shareholder of the Fund, you incur two types of costs: (1) transaction costs, including sales charges (loads) on purchase payments or redemption proceeds, redemption fees and (2) ongoing costs, including management fees, distribution and/or service (12b-1) fees and other Fund expenses. This Example is intended to help you understand your ongoing costs (in dollars) of investing in the Fund and to compare these costs with the ongoing costs of investing in other mutual funds.
The Example is based on an investment of $1,000 invested at the beginning of the period and held for the entire period (May 1, 2015 to October 31, 2015).
Actual Expenses
The first line of the accompanying table for each class of the Fund provides information about actual account values and actual expenses. You may use the information in this line, together with the amount you invested, to estimate the expenses that you paid over the period. Simply divide your account value by $1,000.00 (for example, an $8,600 account value divided by $1,000.00 = 8.6), then multiply the result by the number in the first line for a class of the Fund under the heading entitled "Expenses Paid During Period" to estimate the expenses you paid on your account during this period. A small balance maintenance fee of $12.00 that is charged once a year may apply for certain accounts with a value of less than $2,000. This fee is not included in the table below. If it was, the estimate of expenses you paid during the period would be higher, and your ending account value lower, by this amount. In addition, the Fund, as a shareholder in the underlying Fidelity Central Funds, will indirectly bear its pro-rata share of the fees and expenses incurred by the underlying Fidelity Central Funds. These fees and expenses are not included in the Fund's annualized expense ratio used to calculate the expense estimate in the table below.
Hypothetical Example for Comparison Purposes
The second line of the accompanying table for each class of the Fund provides information about hypothetical account values and hypothetical expenses based on a Class' actual expense ratio and an assumed rate of return of 5% per year before expenses, which is not the Class' actual return. The hypothetical account values and expenses may not be used to estimate the actual ending account balance or expenses you paid for the period. You may use this information to compare the ongoing costs of investing in the Fund and other funds. To do so, compare this 5% hypothetical example with the 5% hypothetical examples that appear in the shareholder reports of the other funds. A small balance maintenance fee of $12.00 that is charged once a year may apply for certain accounts with a value of less than $2,000. This fee is not included in the table below. If it was, the estimate of expenses you paid during the period would be higher, and your ending account value lower, by this amount. In addition, the Fund, as a shareholder in the underlying Fidelity Central Funds, will indirectly bear its pro-rata share of the fees and expenses incurred by the underlying Fidelity Central Funds. These fees and expenses are not included in the Fund's annualized expense ratio used to calculate the expense estimate in the table below.
Please note that the expenses shown in the table are meant to highlight your ongoing costs only and do not reflect any transaction costs. Therefore, the second line of the table is useful in comparing ongoing costs only, and will not help you determine the relative total costs of owning different funds. In addition, if these transactional costs were included, your costs would have been higher.
| Annualized
Expense RatioB | Beginning
Account Value
May 1, 2015 | Ending
Account Value
October 31, 2015 | Expenses Paid
During PeriodC
May 1, 2015
to October 31, 2015 |
Class A | 1.33% | | | |
Actual | | $ 1,000.00 | $ 952.70 | $ 6.55 |
HypotheticalA | | $ 1,000.00 | $ 1,018.50 | $ 6.77 |
Class T | 1.61% | | | |
Actual | | $ 1,000.00 | $ 951.60 | $ 7.92 |
HypotheticalA | | $ 1,000.00 | $ 1,017.09 | $ 8.19 |
Class B | 2.14% | | | |
Actual | | $ 1,000.00 | $ 948.90 | $ 10.51 |
HypotheticalA | | $ 1,000.00 | $ 1,014.42 | $ 10.87 |
Class C | 2.15% | | | |
Actual | | $ 1,000.00 | $ 949.00 | $ 10.56 |
HypotheticalA | | $ 1,000.00 | $ 1,014.37 | $ 10.92 |
Europe | 1.03% | | | |
Actual | | $ 1,000.00 | $ 954.30 | $ 5.07 |
HypotheticalA | | $ 1,000.00 | $ 1,020.01 | $ 5.24 |
Class I | .97% | | | |
Actual | | $ 1,000.00 | $ 954.60 | $ 4.78 |
HypotheticalA | | $ 1,000.00 | $ 1,020.32 | $ 4.94 |
A 5% return per year before expenses
B Annualized expense ratio reflects expenses net of applicable fee waivers.
C Expenses are equal to each Class' annualized expense ratio, multiplied by the average account value over the period, multiplied by 184/365 (to reflect the one-half year period).
Annual Report
Fidelity Europe Fund
Investment Changes (Unaudited)
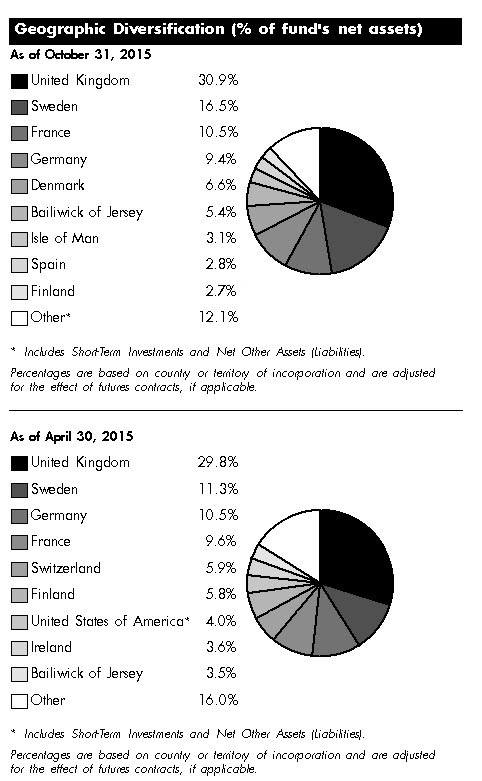
Asset Allocation as of October 31, 2015 |
| % of fund's
net assets | % of fund's net assets
6 months ago |
Stocks | 99.7 | 96.0 |
Short-Term Investments and Net Other Assets (Liabilities) | 0.3 | 4.0 |
Top Ten Stocks as of October 31, 2015 |
| % of fund's
net assets | % of fund's net assets
6 months ago |
Shire PLC (Bailiwick of Jersey, Pharmaceuticals) | 3.2 | 2.5 |
Getinge AB (B Shares) (Sweden, Health Care Equipment & Supplies) | 2.9 | 2.7 |
Standard Chartered PLC (United Kingdom) (United Kingdom, Banks) | 2.9 | 2.5 |
Sanofi SA (France, Pharmaceuticals) | 2.7 | 0.0 |
Bayer AG (Germany, Pharmaceuticals) | 2.4 | 2.1 |
Novozymes A/S Series B (Denmark, Chemicals) | 2.2 | 0.0 |
William Hill PLC (United Kingdom, Hotels, Restaurants & Leisure) | 2.0 | 1.1 |
William Demant Holding A/S (Denmark, Health Care Equipment & Supplies) | 1.8 | 1.0 |
Prudential PLC (United Kingdom, Insurance) | 1.8 | 1.7 |
H&M Hennes & Mauritz AB (B Shares) (Sweden, Specialty Retail) | 1.8 | 0.0 |
| 23.7 | |
Market Sectors as of October 31, 2015 |
| % of fund's
net assets | % of fund's net assets
6 months ago |
Financials | 31.6 | 26.0 |
Health Care | 19.8 | 21.0 |
Industrials | 17.5 | 20.1 |
Consumer Discretionary | 16.8 | 13.1 |
Information Technology | 5.4 | 3.7 |
Materials | 4.3 | 2.0 |
Consumer Staples | 3.0 | 7.7 |
Utilities | 1.3 | 1.1 |
Energy | 0.0 | 1.3 |
Percentages shown as 0.0% may reflect amounts less than 0.05%. |
Annual Report
Fidelity Europe Fund
Investments October 31, 2015
Showing Percentage of Net Assets
Common Stocks - 99.7% |
| Shares | | Value |
Austria - 1.9% |
Andritz AG | 276,800 | | $ 13,940,747 |
Erste Group Bank AG (a) | 483,000 | | 14,165,262 |
TOTAL AUSTRIA | | 28,106,009 |
Bailiwick of Jersey - 5.4% |
Shire PLC | 611,200 | | 46,286,714 |
Wolseley PLC | 264,819 | | 15,547,875 |
WPP PLC | 681,400 | | 15,274,830 |
TOTAL BAILIWICK OF JERSEY | | 77,109,419 |
Bermuda - 1.7% |
Vostok Emerging Finance Ltd. (depository receipt) (a) | 6,042,107 | | 1,697,310 |
Vostok New Ventures Ltd. SDR (a) | 3,662,236 | | 23,361,701 |
TOTAL BERMUDA | | 25,059,011 |
Denmark - 6.6% |
Carlsberg A/S Series B | 245,400 | | 20,117,275 |
DSV de Sammensluttede Vognmaend A/S | 414,000 | | 16,786,217 |
Novozymes A/S Series B | 685,500 | | 31,786,881 |
William Demant Holding A/S (a) | 308,800 | | 26,817,136 |
TOTAL DENMARK | | 95,507,509 |
Finland - 2.7% |
Amer Group PLC (A Shares) | 496,800 | | 13,941,732 |
Huhtamaki Oyj | 367,765 | | 12,981,650 |
Valmet Corp. | 1,119,700 | | 11,807,957 |
TOTAL FINLAND | | 38,731,339 |
France - 10.5% |
Bollore Group | 3,447,549 | | 17,067,520 |
Christian Dior SA | 116,895 | | 23,022,156 |
Eurazeo SA | 207,255 | | 14,604,342 |
Havas SA | 2,906,500 | | 25,217,487 |
Publicis Groupe SA | 230,946 | | 14,998,864 |
Sanofi SA | 387,964 | | 39,136,203 |
Wendel SA | 134,300 | | 16,119,599 |
TOTAL FRANCE | | 150,166,171 |
Germany - 9.4% |
adidas AG | 210,600 | | 18,873,652 |
Bayer AG | 258,700 | | 34,521,582 |
Brenntag AG | 343,400 | | 20,750,209 |
CompuGroup Medical AG | 259,600 | | 7,650,573 |
Fresenius SE & Co. KGaA | 244,797 | | 17,988,270 |
GEA Group AG | 337,429 | | 13,530,477 |
LEG Immobilien AG | 265,057 | | 21,146,143 |
TOTAL GERMANY | | 134,460,906 |
Ireland - 2.4% |
DCC PLC (United Kingdom) | 149,700 | | 12,011,970 |
|
| Shares | | Value |
Ryanair Holdings PLC sponsored ADR | 137,767 | | $ 10,772,002 |
United Drug PLC (United Kingdom) | 1,554,241 | | 11,385,877 |
TOTAL IRELAND | | 34,169,849 |
Isle of Man - 3.1% |
Optimal Payments PLC (a) | 4,443,710 | | 20,825,287 |
Playtech Ltd. | 1,767,361 | | 23,322,265 |
TOTAL ISLE OF MAN | | 44,147,552 |
Israel - 1.0% |
Teva Pharmaceutical Industries Ltd. sponsored ADR | 243,500 | | 14,412,765 |
Italy - 1.3% |
Mediolanum SpA | 2,236,635 | | 18,237,309 |
Mediolanum SpA rights | 2,236,635 | | 137 |
TOTAL ITALY | | 18,237,446 |
Netherlands - 1.4% |
RELX NV | 1,181,199 | | 20,197,980 |
Spain - 2.8% |
Amadeus IT Holding SA Class A | 496,600 | | 21,166,301 |
Red Electrica Corporacion SA | 210,300 | | 18,546,763 |
TOTAL SPAIN | | 39,713,064 |
Sweden - 16.5% |
Elekta AB (B Shares) (d) | 2,935,902 | | 22,697,395 |
Getinge AB (B Shares) | 1,679,200 | | 42,041,175 |
H&M Hennes & Mauritz AB (B Shares) | 663,852 | | 25,820,417 |
Hemfosa Fastigheter AB | 1,312,500 | | 14,248,688 |
Indutrade AB | 367,400 | | 17,545,306 |
Kungsleden AB | 1,996,700 | | 14,957,342 |
Lundbergfoeretagen AB | 94,092 | | 4,798,460 |
Nordea Bank AB | 1,897,200 | | 20,984,883 |
Pandox AB (a) | 1,087,500 | | 17,795,003 |
Sandvik AB | 2,359,600 | | 22,067,178 |
Svenska Cellulosa AB (SCA) (B Shares) | 789,200 | | 23,245,081 |
Svenska Handelsbanken AB (A Shares) | 809,700 | | 10,996,924 |
TOTAL SWEDEN | | 237,197,852 |
Switzerland - 2.1% |
Credit Suisse Group AG (e)(f) | 478,733 | | 11,018,439 |
Julius Baer Group Ltd. | 399,440 | | 19,805,238 |
TOTAL SWITZERLAND | | 30,823,677 |
United Kingdom - 30.9% |
Aberdeen Asset Management PLC | 3,164,057 | | 16,911,022 |
Aldermore Group PLC | 2,775,037 | | 11,285,356 |
Ashmore Group PLC (d) | 1,759,300 | | 7,322,770 |
Babcock International Group PLC | 1,323,700 | | 19,671,537 |
Big Yellow Group PLC | 1,465,300 | | 16,941,799 |
Bunzl PLC | 683,458 | | 19,586,774 |
Compass Group PLC | 1,270,417 | | 21,839,618 |
Dechra Pharmaceuticals PLC | 781,752 | | 11,683,918 |
Diploma PLC | 1,297,100 | | 12,827,494 |
Common Stocks - continued |
| Shares | | Value |
United Kingdom - continued |
Essentra PLC | 1,355,136 | | $ 17,590,034 |
International Personal Finance PLC | 3,944,403 | | 22,504,640 |
ITV PLC | 3,587,700 | | 13,959,735 |
LivaNova PLC (a) | 170,566 | | 11,305,114 |
Lloyds Banking Group PLC | 22,279,800 | | 25,287,845 |
London Stock Exchange Group PLC | 405,300 | | 15,901,427 |
Micro Focus International PLC | 595,700 | | 11,534,239 |
Prudential PLC | 1,142,519 | | 26,685,240 |
Rolls-Royce Group PLC | 1,501,292 | | 15,875,437 |
Schroders PLC | 359,422 | | 16,528,354 |
Senior Engineering Group PLC | 3,385,600 | | 11,837,238 |
Shawbrook Group Ltd. | 2,398,200 | | 12,544,142 |
St. James's Place Capital PLC | 577,862 | | 8,592,075 |
Standard Chartered PLC (United Kingdom) | 3,773,966 | | 41,970,662 |
Unite Group PLC | 1,670,087 | | 17,121,131 |
Virgin Money Holdings Uk PLC | 1,163,048 | | 6,953,079 |
William Hill PLC | 5,883,073 | | 28,705,132 |
TOTAL UNITED KINGDOM | | 442,965,812 |
TOTAL COMMON STOCKS (Cost $1,369,293,912) |
1,431,006,361
|
Nonconvertible Preferred Stocks - 0.0% |
| | | |
United Kingdom - 0.0% |
Rolls-Royce Group PLC
(Cost $214,231) | 139,169,768 | |
214,544
|
Money Market Funds - 2.1% |
| Shares | | Value |
Fidelity Cash Central Fund, 0.18% (b) | 14,053,296 | | $ 14,053,296 |
Fidelity Securities Lending Cash Central Fund, 0.19% (b)(c) | 15,283,267 | | 15,283,267 |
TOTAL MONEY MARKET FUNDS (Cost $29,336,563) |
29,336,563
|
TOTAL INVESTMENT
PORTFOLIO - 101.8% (Cost $1,398,844,706) | | 1,460,557,468 |
NET OTHER ASSETS (LIABILITIES) - (1.8)% | | (25,176,509) |
NET ASSETS - 100% | $ 1,435,380,959 |
Legend |
(a) Non-income producing |
(b) Affiliated fund that is generally available only to investment companies and other accounts managed by Fidelity Investments. The rate quoted is the annualized seven-day yield of the fund at period end. A complete unaudited listing of the fund's holdings as of its most recent quarter end is available upon request. In addition, each Fidelity Central Fund's financial statements, which are not covered by the Fund's Report of Independent Registered Public Accounting Firm, are available on the SEC's website or upon request. |
(c) Investment made with cash collateral received from securities on loan. |
(d) Security or a portion of the security is on loan at period end. |
(e) Security or a portion of the security purchased on a delayed delivery or when-issued basis. |
(f) Restricted securities - Investment in securities not registered under the Securities Act of 1933 (excluding 144A issues). At the end of the period, the value of restricted securities (excluding 144A issues) amounted to $11,018,439 or 0.8% of net assets. |
Additional information on each restricted holding is as follows: |
Security | Acquisition Date | Acquisition Cost |
Credit Suisse Group AG | 10/21/15 | $ 11,351,478 |
Affiliated Central Funds |
Information regarding fiscal year to date income earned by the Fund from investments in Fidelity Central Funds is as follows: |
Fund | Income earned |
Fidelity Cash Central Fund | $ 58,484 |
Fidelity Securities Lending Cash Central Fund | 924,214 |
Total | $ 982,698 |
Other Information |
Categorizations in the Schedule of Investments are based on country or territory of incorporation. |
The following is a summary of the inputs used, as of October 31, 2015, involving the Fund's assets and liabilities carried at fair value. The inputs or methodology used for valuing securities may not be an indication of the risk associated with investing in those securities. For more information on valuation inputs, and their aggregation into the levels used in the tables below, please refer to the Investment Valuation section in the accompanying Notes to Financial Statements. |
Valuation Inputs at Reporting Date: |
Description | Total | Level 1 | Level 2 | Level 3 |
Investments in Securities: | | | | |
Equities: | | | | |
Consumer Discretionary | $ 239,646,606 | $ 154,953,374 | $ 84,693,232 | $ - |
Consumer Staples | 43,362,356 | 20,117,275 | 23,245,081 | - |
Financials | 452,691,319 | 358,897,496 | 93,793,823 | - |
Health Care | 285,926,722 | 182,515,535 | 103,411,187 | - |
Industrials | 251,840,482 | 220,417,170 | 31,423,312 | - |
Information Technology | 76,848,092 | 76,848,092 | - | - |
Materials | 62,358,565 | 62,358,565 | - | - |
Utilities | 18,546,763 | 18,546,763 | - | - |
Money Market Funds | 29,336,563 | 29,336,563 | - | - |
Total Investments in Securities: | $ 1,460,557,468 | $ 1,123,990,833 | $ 336,566,635 | $ - |
The following is a summary of transfers between Level 1 and Level 2 for the period ended October 31, 2015. Transfers are assumed to have occurred at the beginning of the period, and are primarily attributable to the valuation techniques used for foreign equity securities, as discussed in the accompanying Notes to Financial Statements: |
Transfers | Total |
Level 1 to Level 2 | $ 86,522,583 |
Level 2 to Level 1 | $ 0 |
See accompanying notes which are an integral part of the financial statements.
Annual Report
Fidelity Europe Fund
Statement of Assets and Liabilities
| | October 31, 2015 |
| | |
Assets | | |
Investment in securities, at value (including securities loaned of $14,512,421) - See accompanying schedule: Unaffiliated issuers (cost $1,369,508,143) | $ 1,431,220,905 | |
Fidelity Central Funds (cost $29,336,563) | 29,336,563 | |
Total Investments (cost $1,398,844,706) | | $ 1,460,557,468 |
Foreign currency held at value (cost $131,652) | | 131,612 |
Receivable for investments sold | | 5,679,719 |
Receivable for fund shares sold | | 444,635 |
Dividends receivable | | 3,187,421 |
Distributions receivable from Fidelity Central Funds | | 20,249 |
Prepaid expenses | | 4,115 |
Other receivables | | 470,045 |
Total assets | | 1,470,495,264 |
| | |
Liabilities | | |
Payable for investments purchased | | |
Regular delivery | $ 6,076,814 | |
Delayed delivery | 11,018,439 | |
Payable for fund shares redeemed | 1,416,898 | |
Accrued management fee | 933,754 | |
Distribution and service plan fees payable | 18,340 | |
Other affiliated payables | 283,034 | |
Other payables and accrued expenses | 83,759 | |
Collateral on securities loaned, at value | 15,283,267 | |
Total liabilities | | 35,114,305 |
| | |
Net Assets | | $ 1,435,380,959 |
Net Assets consist of: | | |
Paid in capital | | $ 1,586,026,086 |
Undistributed net investment income | | 15,983,003 |
Accumulated undistributed net realized gain (loss) on investments and foreign currency transactions | | (228,558,075) |
Net unrealized appreciation (depreciation) on investments and assets and liabilities in foreign currencies | | 61,929,945 |
Net Assets | | $ 1,435,380,959 |
Statement of Assets and Liabilities - continued
| | October 31, 2015 |
| | |
Calculation of Maximum Offering Price | | |
Class A:
Net Asset Value and redemption price per share ($23,381,485 ÷ 630,873 shares) | | $ 37.06 |
| | |
Maximum offering price per share (100/94.25 of $37.06) | | $ 39.32 |
Class T:
Net Asset Value and redemption price per share ($9,631,696 ÷ 260,751 shares) | | $ 36.94 |
| | |
Maximum offering price per share (100/96.50 of $36.94) | | $ 38.28 |
Class B:
Net Asset Value and offering price per share ($530,359 ÷ 14,424 shares)A | | $ 36.77 |
| | |
Class C:
Net Asset Value and offering price per share ($11,151,092 ÷ 302,926 shares)A | | $ 36.81 |
| | |
Europe:
Net Asset Value, offering price and redemption price per share ($1,384,134,439 ÷ 37,219,706 shares) | | $ 37.19 |
| | |
Class I:
Net Asset Value, offering price and redemption price per share ($6,551,888 ÷ 176,075 shares) | | $ 37.21 |
A Redemption price per share is equal to net asset value less any applicable contingent deferred sales charge.
See accompanying notes which are an integral part of the financial statements.
Annual Report
Fidelity Europe Fund
Financial Statements - continued
Statement of Operations
| Year ended October 31, 2015 |
| | |
Investment Income | | |
Dividends | | $ 34,182,184 |
Interest | | 1,295 |
Income from Fidelity Central Funds | | 982,698 |
Income before foreign taxes withheld | | 35,166,177 |
Less foreign taxes withheld | | (2,877,247) |
Total income | | 32,288,930 |
| | |
Expenses | | |
Management fee | | |
Basic fee | $ 9,840,222 | |
Performance adjustment | 1,149,586 | |
Transfer agent fees | 2,655,538 | |
Distribution and service plan fees | 230,307 | |
Accounting and security lending fees | 642,501 | |
Custodian fees and expenses | 135,244 | |
Independent trustees' compensation | 6,071 | |
Registration fees | 81,226 | |
Audit | 92,356 | |
Legal | 8,636 | |
Interest | 963 | |
Miscellaneous | 13,056 | |
Total expenses before reductions | 14,855,706 | |
Expense reductions | (309,471) | 14,546,235 |
Net investment income (loss) | | 17,742,695 |
Realized and Unrealized Gain (Loss) | | |
Net realized gain (loss) on: | | |
Investment securities: | | |
Unaffiliated issuers | 56,522,314 | |
Foreign currency transactions | 333,984 | |
Total net realized gain (loss) | | 56,856,298 |
Change in net unrealized appreciation (depreciation) on: Investment securities | (21,707,177) | |
Assets and liabilities in foreign currencies | 330,244 | |
Total change in net unrealized appreciation (depreciation) | | (21,376,933) |
Net gain (loss) | | 35,479,365 |
Net increase (decrease) in net assets resulting from operations | | $ 53,222,060 |
Statement of Changes in Net Assets
| Year ended
October 31,
2015 | Year ended
October 31,
2014 |
Increase (Decrease) in Net Assets | | |
Operations | | |
Net investment income (loss) | $ 17,742,695 | $ 31,583,880 |
Net realized gain (loss) | 56,856,298 | 61,093,776 |
Change in net unrealized appreciation (depreciation) | (21,376,933) | (149,418,761) |
Net increase (decrease) in net assets resulting from operations | 53,222,060 | (56,741,105) |
Distributions to shareholders from net investment income | (31,603,696) | (13,272,490) |
Distributions to shareholders from net realized gain | - | (612,576) |
Total distributions | (31,603,696) | (13,885,066) |
Share transactions - net increase (decrease) | 125,806,049 | 401,467,296 |
Redemption fees | 48,244 | 18,788 |
Total increase (decrease) in net assets | 147,472,657 | 330,859,913 |
| | |
Net Assets | | |
Beginning of period | 1,287,908,302 | 957,048,389 |
End of period (including undistributed net investment income of $15,983,003 and undistributed net investment income of $29,844,004, respectively) | $ 1,435,380,959 | $ 1,287,908,302 |
See accompanying notes which are an integral part of the financial statements.
Annual Report
Financial Highlights - Fidelity Europe Fund Class A
Years ended October 31, | 2015 | 2014 H |
Selected Per-Share Data | | |
Net asset value, beginning of period | $ 36.24 | $ 39.45 |
Income from Investment Operations | | |
Net investment income (loss) E | .37 | .47 |
Net realized and unrealized gain (loss) | 1.29 | (3.68) |
Total from investment operations | 1.66 | (3.21) |
Distributions from net investment income | (.84) | - |
Redemption fees added to paid in capitalE, K | - | - |
Net asset value, end of period | $ 37.06 | $ 36.24 |
Total ReturnB, C, D | 4.63% | (8.14)% |
Ratios to Average Net AssetsF, I | | |
Expenses before reductions | 1.33% | 1.35%A |
Expenses net of fee waivers, if any | 1.33% | 1.35%A |
Expenses net of all reductions | 1.31% | 1.35%A |
Net investment income (loss) | .98% | 1.94%A |
Supplemental Data | | |
Net assets, end of period (000 omitted) | $ 23,381 | $ 23,633 |
Portfolio turnover rateG | 87% | 80%J |
AAnnualized BTotal returns for periods of less than one year are not annualized. CTotal returns would have been lower if certain expenses had not been reduced during the applicable periods shown. DTotal returns do not include the effect of the sales charges. ECalculated based on average shares outstanding during the period. FFees and expenses of any underlying Fidelity Central Funds are not included in the Fund's expense ratio. The Fund indirectly bears its proportionate share of the expenses of any underlying Fidelity Central Funds. GAmount does not include the portfolio activity of any underlying Fidelity Central Funds. HFor the period March 18, 2014 (commencement of sale of shares) to October 31, 2014. IExpense ratios reflect operating expenses of the class. Expenses before reductions do not reflect amounts reimbursed by the investment adviser or reductions from brokerage service arrangements or reductions from other expense offset arrangements and do not represent the amount paid by the class during periods when reimbursements or reductions occur. Expenses net of fee waivers reflect expenses after reimbursement by the investment adviser but prior to reductions from brokerage service arrangements or other expense offset arrangements. Expenses net of all reductions represent the net expenses paid by the class. JThe portfolio turnover rate does not include the assets acquired in the merger. KAmount represents less than $.005 per share. |
Financial Highlights - Fidelity Europe Fund Class T
Years ended October 31, | 2015 | 2014 H |
Selected Per-Share Data | | |
Net asset value, beginning of period | $ 36.18 | $ 39.45 |
Income from Investment Operations | | |
Net investment income (loss) E | .26 | .40 |
Net realized and unrealized gain (loss) | 1.29 | (3.67) |
Total from investment operations | 1.55 | (3.27) |
Distributions from net investment income | (.79) | - |
Redemption fees added to paid in capitalE, K | - | - |
Net asset value, end of period | $ 36.94 | $ 36.18 |
Total ReturnB, C, D | 4.33% | (8.29)% |
Ratios to Average Net AssetsF, I | | |
Expenses before reductions | 1.61% | 1.62%A |
Expenses net of fee waivers, if any | 1.61% | 1.61%A |
Expenses net of all reductions | 1.59% | 1.61%A |
Net investment income (loss) | .70% | 1.68%A |
Supplemental Data | | |
Net assets, end of period (000 omitted) | $ 9,632 | $ 13,679 |
Portfolio turnover rateG | 87% | 80%J |
AAnnualized BTotal returns for periods of less than one year are not annualized. CTotal returns would have been lower if certain expenses had not been reduced during the applicable periods shown. DTotal returns do not include the effect of the sales charges. ECalculated based on average shares outstanding during the period. FFees and expenses of any underlying Fidelity Central Funds are not included in the Fund's expense ratio. The Fund indirectly bears its proportionate share of the expenses of any underlying Fidelity Central Funds. GAmount does not include the portfolio activity of any underlying Fidelity Central Funds. HFor the period March 18, 2014 (commencement of sale of shares) to October 31, 2014. IExpense ratios reflect operating expenses of the class. Expenses before reductions do not reflect amounts reimbursed by the investment adviser or reductions from brokerage service arrangements or reductions from other expense offset arrangements and do not represent the amount paid by the class during periods when reimbursements or reductions occur. Expenses net of fee waivers reflect expenses after reimbursement by the investment adviser but prior to reductions from brokerage service arrangements or other expense offset arrangements. Expenses net of all reductions represent the net expenses paid by the class. JThe portfolio turnover rate does not include the assets acquired in the merger. KAmount represents less than $.005 per share. |
See accompanying notes which are an integral part of the financial statements.
Annual Report
Financial Highlights - Fidelity Europe Fund Class B
Years ended October 31, | 2015 | 2014 H |
Selected Per-Share Data | | |
Net asset value, beginning of period | $ 36.07 | $ 39.45 |
Income from Investment Operations | | |
Net investment income (loss) E | .06 | .28 |
Net realized and unrealized gain (loss) | 1.29 | (3.66) |
Total from investment operations | 1.35 | (3.38) |
Distributions from net investment income | (.65) | - |
Redemption fees added to paid in capitalE, K | - | - |
Net asset value, end of period | $ 36.77 | $ 36.07 |
Total ReturnB, C, D | 3.78% | (8.57)% |
Ratios to Average Net AssetsF, I | | |
Expenses before reductions | 2.15% | 2.11%A |
Expenses net of fee waivers, if any | 2.15% | 2.11%A |
Expenses net of all reductions | 2.13% | 2.11%A |
Net investment income (loss) | .16% | 1.19%A |
Supplemental Data | | |
Net assets, end of period (000 omitted) | $ 530 | $ 1,065 |
Portfolio turnover rateG | 87% | 80%J |
AAnnualized BTotal returns for periods of less than one year are not annualized. CTotal returns would have been lower if certain expenses had not been reduced during the applicable periods shown. DTotal returns do not include the effect of the contingent deferred sales charge. ECalculated based on average shares outstanding during the period. FFees and expenses of any underlying Fidelity Central Funds are not included in the Fund's expense ratio. The Fund indirectly bears its proportionate share of the expenses of any underlying Fidelity Central Funds. GAmount does not include the portfolio activity of any underlying Fidelity Central Funds. HFor the period March 18, 2014 (commencement of sale of shares) to October 31, 2014. IExpense ratios reflect operating expenses of the class. Expenses before reductions do not reflect amounts reimbursed by the investment adviser or reductions from brokerage service arrangements or reductions from other expense offset arrangements and do not represent the amount paid by the class during periods when reimbursements or reductions occur. Expenses net of fee waivers reflect expenses after reimbursement by the investment adviser but prior to reductions from brokerage service arrangements or other expense offset arrangements. Expenses net of all reductions represent the net expenses paid by the class. JThe portfolio turnover rate does not include the assets acquired in the merger. KAmount represents less than $.005 per share. |
Financial Highlights - Fidelity Europe Fund Class C
Years ended October 31, | 2015 | 2014 H |
Selected Per-Share Data | | |
Net asset value, beginning of period | $ 36.07 | $ 39.45 |
Income from Investment Operations | | |
Net investment income (loss) E | .07 | .29 |
Net realized and unrealized gain (loss) | 1.29 | (3.67) |
Total from investment operations | 1.36 | (3.38) |
Distributions from net investment income | (.62) | - |
Redemption fees added to paid in capitalE, K | - | - |
Net asset value, end of period | $ 36.81 | $ 36.07 |
Total ReturnB, C, D | 3.79% | (8.57)% |
Ratios to Average Net AssetsF, I | | |
Expenses before reductions | 2.13% | 2.10%A |
Expenses net of fee waivers, if any | 2.13% | 2.10%A |
Expenses net of all reductions | 2.11% | 2.10%A |
Net investment income (loss) | .18% | 1.19%A |
Supplemental Data | | |
Net assets, end of period (000 omitted) | $ 11,151 | $ 6,818 |
Portfolio turnover rateG | 87% | 80%J |
AAnnualized BTotal returns for periods of less than one year are not annualized. CTotal returns would have been lower if certain expenses had not been reduced during the applicable periods shown. DTotal returns do not include the effect of the contingent deferred sales charge. ECalculated based on average shares outstanding during the period. FFees and expenses of any underlying Fidelity Central Funds are not included in the Fund's expense ratio. The Fund indirectly bears its proportionate share of the expenses of any underlying Fidelity Central Funds. GAmount does not include the portfolio activity of any underlying Fidelity Central Funds. HFor the period March 18, 2014 (commencement of sale of shares) to October 31, 2014. IExpense ratios reflect operating expenses of the class. Expenses before reductions do not reflect amounts reimbursed by the investment adviser or reductions from brokerage service arrangements or reductions from other expense offset arrangements and do not represent the amount paid by the class during periods when reimbursements or reductions occur. Expenses net of fee waivers reflect expenses after reimbursement by the investment adviser but prior to reductions from brokerage service arrangements or other expense offset arrangements. Expenses net of all reductions represent the net expenses paid by the class. JThe portfolio turnover rate does not include the assets acquired in the merger. KAmount represents less than $.005 per share. |
See accompanying notes which are an integral part of the financial statements.
Annual Report
Financial Highlights - Fidelity Europe Fund
Years ended October 31, | 2015 | 2014 | 2013 | 2012 | 2011 |
Selected Per-Share Data | | | | | |
Net asset value, beginning of period | $ 36.32 | $ 37.92 | $ 30.15 | $ 27.67 | $ 30.83 |
Income from Investment Operations | | | | | |
Net investment income (loss) B | .48 | .94E | .61 | .64 | .48 |
Net realized and unrealized gain (loss) | 1.30 | (2.00) | 7.87 | 2.45 | (2.97) |
Total from investment operations | 1.78 | (1.06) | 8.48 | 3.09 | (2.49) |
Distributions from net investment income | (.91) | (.52) | (.70) | (.60) | (.67) |
Distributions from net realized gain | - | (.02) | (.01) | (.02) | - |
Total distributions | (.91) | (.54) | (.71) | (.61) I | (.67) |
Redemption fees added to paid in capitalB, H | - | - | - | - | - |
Net asset value, end of period | $ 37.19 | $ 36.32 | $ 37.92 | $ 30.15 | $ 27.67 |
Total Return A | 4.97% | (2.82)% | 28.71% | 11.53% | (8.32)% |
Ratios to Average Net AssetsC, F | | | | | |
Expenses before reductions | 1.03% | .97% | 1.06% | .83% | 1.10% |
Expenses net of fee waivers, if any | 1.03% | .97% | 1.05% | .83% | 1.10% |
Expenses net of all reductions | 1.01% | .96% | 1.02% | .80% | 1.06% |
Net investment income (loss) | 1.28% | 2.43%E | 1.82% | 2.33% | 1.56% |
Supplemental Data | | | | | |
Net assets, end of period (000 omitted) | $ 1,384,134 | $ 1,237,047 | $ 957,048 | $ 602,520 | $ 621,778 |
Portfolio turnover rateD | 87% | 80%G | 59% | 127% | 117% |
ATotal returns would have been lower if certain expenses had not been reduced during the applicable periods shown. BCalculated based on average shares outstanding during the period. CFees and expenses of any underlying Fidelity Central Funds are not included in the Fund's expense ratio. The Fund indirectly bears its proportionate share of the expenses of any underlying Fidelity Central Funds. DAmount does not include the portfolio activity of any underlying Fidelity Central Funds. EInvestment income per share reflects a large, non-recurring dividend which amounted to $.19 per share. Excluding this non-recurring dividend, the ratio of net investment income (loss) to average net assets would have been 1.93%. FExpense ratios reflect operating expenses of the class. Expenses before reductions do not reflect amounts reimbursed by the investment adviser or reductions from brokerage service arrangements or reductions from other expense offset arrangements and do not represent the amount paid by the class during periods when reimbursements or reductions occur. Expenses net of fee waivers reflect expenses after reimbursement by the investment adviser but prior to reductions from brokerage service arrangements or other expense offset arrangements. Expenses net of all reductions represent the net expenses paid by the class. GThe portfolio turnover rate does not include the assets acquired in the merger. HAmount represents less than $.005 per share. ITotal distributions of $.61 per share is comprised of distributions from net investment income of $.595 and distributions from net realized gain of $.017 per share. |
Financial Highlights - Fidelity Europe Fund Class I
Years ended October 31, | 2015 | 2014 G |
Selected Per-Share Data | | |
Net asset value, beginning of period | $ 36.32 | $ 39.45 |
Income from Investment Operations | | |
Net investment income (loss) D | .50 | .56 |
Net realized and unrealized gain (loss) | 1.30 | (3.69) |
Total from investment operations | 1.80 | (3.13) |
Distributions from net investment income | (.91) | - |
Redemption fees added to paid in capitalD, J | - | - |
Net asset value, end of period | $ 37.21 | $ 36.32 |
Total ReturnB, C | 5.02% | (7.93)% |
Ratios to Average Net AssetsE, H | | |
Expenses before reductions | .98% | .97%A |
Expenses net of fee waivers, if any | .98% | .97%A |
Expenses net of all reductions | .96% | .96%A |
Net investment income (loss) | 1.33% | 2.33%A |
Supplemental Data | | |
Net assets, end of period (000 omitted) | $ 6,552 | $ 5,666 |
Portfolio turnover rateF | 87% | 80%I |
AAnnualized BTotal returns for periods of less than one year are not annualized. CTotal returns would have been lower if certain expenses had not been reduced during the applicable periods shown. DCalculated based on average shares outstanding during the period. EFees and expenses of any underlying Fidelity Central Funds are not included in the Fund's expense ratio. The Fund indirectly bears its proportionate share of the expenses of any underlying Fidelity Central Funds. FAmount does not include the portfolio activity of any underlying Fidelity Central Funds. GFor the period March 18, 2014 (commencement of sale of shares) to October 31, 2014. HExpense ratios reflect operating expenses of the class. Expenses before reductions do not reflect amounts reimbursed by the investment adviser or reductions from brokerage service arrangements or reductions from other expense offset arrangements and do not represent the amount paid by the class during periods when reimbursements or reductions occur. Expenses net of fee waivers reflect expenses after reimbursement by the investment adviser but prior to reductions from brokerage service arrangements or other expense offset arrangements. Expenses net of all reductions represent the net expenses paid by the class. IThe portfolio turnover rate does not include the assets acquired in the merger. JAmount represents less than $.005 per share. |
See accompanying notes which are an integral part of the financial statements.
Annual Report
For the period ended October 31, 2015
1. Organization.
Fidelity Europe Fund (the Fund) is a fund of Fidelity Investment Trust (the Trust) and is authorized to issue an unlimited number of shares. The Trust is registered under the Investment Company Act of 1940, as amended (the 1940 Act), as an open-end management investment company organized as a Massachusetts business trust. The Fund offers Class A, Class T, Class C, Europe and Class I (formerly Institutional Class) shares, each of which, along with Class B shares, has equal rights as to assets and voting privileges. Class B shares are closed to new accounts and additional purchases, except for exchanges and reinvestments. Each class has exclusive voting rights with respect to matters that affect that class. Class B shares will automatically convert to class A shares after a holding period of seven years from the initial date of purchase.
2. Investments in Fidelity Central Funds.
The Fund invests in Fidelity Central Funds, which are open-end investment companies generally available only to other investment companies and accounts managed by the investment adviser and its affiliates. The Fund's Schedule of Investments lists each of the Fidelity Central Funds held as of period end, if any, as an investment of the Fund, but does not include the underlying holdings of each Fidelity Central Fund. As an Investing Fund, the Fund indirectly bears its proportionate share of the expenses of the underlying Fidelity Central Funds.
The Money Market Central Funds seek preservation of capital and current income and are managed by Fidelity Investments Money Management, Inc. (FIMM), an affiliate of the investment adviser. Annualized expenses of the Money Market Central Funds as of their most recent shareholder report date are less than .005%.
A complete unaudited list of holdings for each Fidelity Central Fund is available upon request or at the Securities and Exchange Commission (the SEC) website at www.sec.gov. In addition, the financial statements of the Fidelity Central Funds, which are not covered by the Fund's Report of Independent Registered Public Accounting Firm, are available on the SEC website or upon request.
3. Significant Accounting Policies.
The financial statements have been prepared in conformity with accounting principles generally accepted in the United States of America (GAAP), which require management to make certain estimates and assumptions at the date of the financial statements. Actual results could differ from those estimates. Subsequent events, if any, through the date that the financial statements were issued have been evaluated in the preparation of the financial statements. The following summarizes the significant accounting policies of the Fund:
Investment Valuation. Investments are valued as of 4:00 p.m. Eastern time on the last calendar day of the period. The Board of Trustees (the Board) has delegated the day to day responsibility for the valuation of the Fund's investments to the Fidelity Management & Research Company (FMR) Fair Value Committee (the Committee). In accordance with valuation policies and procedures approved by the Board, the Fund attempts to obtain prices from one or more third party pricing vendors or brokers to value its investments. When current market prices, quotations or currency exchange rates are not readily available or reliable, investments will be fair valued in good faith by the Committee, in accordance with procedures adopted by the Board. Factors used in determining fair value vary by investment type and may include market or investment specific events. The frequency with which these procedures are used cannot be predicted and they may be utilized to a significant extent. The Committee oversees the Fund's valuation policies and procedures and reports to the Board on the Committee's activities and fair value determinations. The Board monitors the appropriateness of the procedures used in valuing the Fund's investments and ratifies the fair value determinations of the Committee.
The Fund categorizes the inputs to valuation techniques used to value its investments into a disclosure hierarchy consisting of three levels as shown below:
Level 1 - quoted prices in active markets for identical investments
Level 2 - other significant observable inputs (including quoted prices for similar investments, interest rates, prepayment speeds, etc.)
Level 3 - unobservable inputs (including the Fund's own assumptions based on the best information available)
Valuation techniques used to value the Fund's investments by major category are as follows:
Equity securities, including restricted securities, for which market quotations are readily available, are valued at the last reported sale price or official closing price as reported by a third party pricing vendor on the primary market or exchange on which they are traded and are categorized as Level 1 in the hierarchy. In the event there were no sales during the day or closing prices are not available, securities are valued at the last quoted bid price or may be valued using the last available price and are generally categorized as Level 2 in the hierarchy. For foreign equity securities, when market or security specific events arise, comparisons to the valuation of American Depositary Receipts (ADRs), futures contracts, Exchange-Traded Funds (ETFs) and certain indexes as well as quoted prices for similar securities may be used and would be categorized as Level 2 in the hierarchy. Utilizing these techniques may result in transfers between Level 1 and Level 2. For equity securities, including restricted securities, where observable inputs are limited, assumptions about market activity and risk are used and these securities may be categorized as Level 3 in the hierarchy.
Annual Report
3. Significant Accounting Policies - continued
Investment Valuation - continued
Investments in open-end mutual funds, including the Fidelity Central Funds, are valued at their closing net asset value (NAV) each business day and are categorized as Level 1 in the hierarchy.
Changes in valuation techniques may result in transfers in or out of an assigned level within the disclosure hierarchy. The aggregate value of investments by input level as of October 31, 2015, including information on transfers between Levels 1 and 2, is included at the end of the Fund's Schedule of Investments.
Foreign Currency. The Fund may use foreign currency contracts to facilitate transactions in foreign-denominated securities. Gains and losses from these transactions may arise from changes in the value of the foreign currency or if the counterparties do not perform under the contracts' terms.
Foreign-denominated assets, including investment securities, and liabilities are translated into U.S. dollars at the exchange rates at period end. Purchases and sales of investment securities, income and dividends received and expenses denominated in foreign currencies are translated into U.S. dollars at the exchange rate in effect on the transaction date.
The effects of exchange rate fluctuations on investments are included with the net realized and unrealized gain (loss) on investment securities. Other foreign currency transactions resulting in realized and unrealized gain (loss) are disclosed separately.
Investment Transactions and Income. For financial reporting purposes, the Fund's investment holdings and NAV include trades executed through the end of the last business day of the period. The NAV per share for processing shareholder transactions is calculated as of the close of business of the New York Stock Exchange (NYSE), normally 4:00 p.m. Eastern time and includes trades executed through the end of the prior business day. Gains and losses on securities sold are determined on the basis of identified cost and may include proceeds received from litigation. Dividend income is recorded on the ex-dividend date, except for certain dividends from foreign securities where the ex-dividend date may have passed, which are recorded as soon as the Fund is informed of the ex-dividend date. Non-cash dividends included in dividend income, if any, are recorded at the fair market value of the securities received. Income and capital gain distributions from Fidelity Central Funds, if any, are recorded on the ex-dividend date. Interest income is accrued as earned and includes coupon interest and amortization of premium and accretion of discount on debt securities as applicable. Investment income is recorded net of foreign taxes withheld where recovery of such taxes is uncertain.
Class Allocations and Expenses. Investment income, realized and unrealized capital gains and losses, common expenses of the Fund, and certain fund-level expense reductions, if any, are allocated daily on a pro-rata basis to each class based on the relative net assets of each class to the total net assets of the Fund. Each class differs with respect to transfer agent and distribution and service plan fees incurred. Certain expense reductions may also differ by class. For the reporting period, the allocated portion of income and expenses to each class as a percent of its average net assets may vary due to the timing of recording these transactions in relation to fluctuating net assets of the classes. Expenses directly attributable to a fund are charged to that fund. Expenses attributable to more than one fund are allocated among the respective funds on the basis of relative net assets or other appropriate methods. Expense estimates are accrued in the period to which they relate and adjustments are made when actual amounts are known.
Income Tax Information and Distributions to Shareholders. Each year, the Fund intends to qualify as a regulated investment company under Subchapter M of the Internal Revenue Code, including distributing substantially all of its taxable income and realized gains. As a result, no provision for U.S. Federal income taxes is required. As of October 31, 2015, the Fund did not have any unrecognized tax benefits in the financial statements; nor is the Fund aware of any tax positions for which it is reasonably possible that the total amounts of unrecognized tax benefits will significantly change in the next twelve months. The Fund files a U.S. federal tax return, in addition to state and local tax returns as required. The Fund's federal income tax returns are subject to examination by the Internal Revenue Service (IRS) for a period of three fiscal years after they are filed. State and local tax returns may be subject to examination for an additional fiscal year depending on the jurisdiction. Foreign taxes are provided for based on the Fund's understanding of the tax rules and rates that exist in the foreign markets in which it invests.
Distributions are declared and recorded on the ex-dividend date. Income dividends and capital gain distributions are declared separately for each class. Income and capital gain distributions are determined in accordance with income tax regulations, which may differ from GAAP.
Capital accounts within the financial statements are adjusted for permanent book-tax differences. These adjustments have no impact on net assets or the results of operations. Capital accounts are not adjusted for temporary book-tax differences which will reverse in a subsequent period.
Book-tax differences are primarily due to foreign currency transactions, passive foreign investment companies (PFIC), deferred trustees compensation, expiring capital loss carryforwards, capital loss carryforwards and losses deferred due to wash sales.
Annual Report
Notes to Financial Statements - continued
3. Significant Accounting Policies - continued
Income Tax Information and Distributions to Shareholders - continued
The federal tax cost of investment securities and unrealized appreciation (depreciation) as of period end were as follows:
Gross unrealized appreciation | $ 138,842,139 |
Gross unrealized depreciation | (83,135,977) |
Net unrealized appreciation (depreciation) on securities | $ 55,706,162 |
Tax Cost | $ 1,404,851,306 |
The tax-based components of distributable earnings as of period end were as follows:
Undistributed ordinary income | $ 21,804,337 |
Capital loss carryforward | $ (228,371,583) |
Net unrealized appreciation (depreciation) on securities and other investments | $ 55,923,345 |
Capital loss carryforwards are only available to offset future capital gains of the Fund to the extent provided by regulations and may be limited. Under the Regulated Investment Company Modernization Act of 2010 (the Act), the Fund is permitted to carry forward capital losses incurred in taxable years beginning after December 22, 2010 for an unlimited period and such capital losses are required to be used prior to any losses that expire. The capital loss carryforward information presented below, including any applicable limitation, is estimated as of fiscal period end and is subject to adjustment.
Fiscal year of expiration | |
2016 | $ (29,326,707) |
2017 | (199,044,876) |
Total capital loss carryforward | $ (228,371,583) |
The Fund acquired $27,783,139 of its capital loss carryforward as part of a merger in a prior period. The losses acquired that will be available to offset future capital gains of the Fund will be limited to approximately $13,187,073 per year.
In addition, due to large redemptions in a prior period, $199,044,876 of capital losses that existed in the Fund prior to the mergers will be limited to approximately $32,029,274 per year.
The tax character of distributions paid was as follows:
| October 31, 2015 | October 31, 2014 |
Ordinary Income | $ 31,603,696 | $ 13,885,066 |
Short-Term Trading (Redemption) Fees. Shares held by investors in the Fund less than 30 days may have been subject to a redemption fee equal to 1.00% of the NAV of shares redeemed. All redemption fees, which reduce the proceeds of the shareholder redemption, are retained by the Fund and accounted for as an addition to paid in capital.
Delayed Delivery Transactions and When-Issued Securities. During the period, the Fund transacted in securities on a delayed delivery or when-issued basis. Payment and delivery may take place after the customary settlement period for that security. The price of the underlying securities and the date when the securities will be delivered and paid for are fixed at the time the transaction is negotiated. The securities purchased on a delayed delivery or when-issued basis are identified as such in the Fund's Schedule of Investments. With respect to purchase commitments, the Fund identifies securities as segregated in its records with a value at least equal to the amount of the commitment. Losses may arise due to changes in the value of the underlying securities or if the counterparty does not perform under the contract's terms, or if the issuer does not issue the securities due to political, economic, or other factors.
Restricted Securities. The Fund may invest in securities that are subject to legal or contractual restrictions on resale. These securities generally may be resold in transactions exempt from registration or to the public if the securities are registered. Disposal of these securities may involve time-consuming negotiations and expense, and prompt sale at an acceptable price may be difficult. Information regarding restricted securities is included at the end of the Fund's Schedule of Investments.
4. Purchases and Sales of Investments.
Purchases and sales of securities, other than short-term securities, aggregated $1,313,859,833 and $1,189,248,991, respectively.
Annual Report
5. Fees and Other Transactions with Affiliates.
Management Fee. Fidelity Management & Research Company (the investment adviser) and its affiliates provide the Fund with investment management related services for which the Fund pays a monthly management fee. The management fee is the sum of an individual fund fee rate that is based on an annual rate of .45% of the Fund's average net assets and an annualized group fee rate that averaged .25% during the period. The group fee rate is based upon the average net assets of all the mutual funds advised by the investment adviser, including any mutual funds previously advised by the investment adviser that are currently advised by Fidelity SelectCo, LLC, an affiliate of the investment adviser. The group fee rate decreases as assets under management increase and increases as assets under management decrease. In addition, the management fee is subject to a performance adjustment (up to a maximum of ± .20% of the Fund's average net assets over a 36 month performance period). The upward or downward adjustment to the management fee is based on the relative investment performance of Europe as compared to its benchmark index, the MSCI Europe Index, over the same 36 month performance period. For the reporting period, the total annual management fee rate, including the performance adjustment, was .78% of the Fund's average net assets. The performance adjustment included in the management fee rate may be higher or lower than the maximum performance adjustment rate due to the difference between the average net assets for the reporting and performance periods.
Distribution and Service Plan Fees. In accordance with Rule 12b-1 of the 1940 Act, the Fund has adopted separate Distribution and Service Plans for each class of shares. Certain classes pay Fidelity Distributors Corporation (FDC), an affiliate of the investment adviser, separate Distribution and Service Fees, each of which is based on an annual percentage of each class' average net assets. In addition, FDC may pay financial intermediaries for selling shares of the Fund and providing shareholder support services. For the period, the Distribution and Service Fee rates, total fees and amounts retained by FDC were as follows:
| Distribution
Fee | Service
Fee | Total Fees | Retained
by FDC |
Class A | -% | .25% | $ 66,329 | $ 2,913 |
Class T | .25% | .25% | 66,616 | 328 |
Class B | .75% | .25% | 8,617 | 6,637 |
Class C | .75% | .25% | 88,745 | 29,623 |
| | | $ 230,307 | $ 39,501 |
Sales Load. FDC may receive a front-end sales charge of up to 5.75% for selling Class A shares and 3.50% for selling Class T shares, some of which is paid to financial intermediaries for selling shares of the Fund. Depending on the holding period, FDC may receive contingent deferred sales charges levied on Class A, Class T, Class B, and Class C redemptions. The deferred sales charges range from 5.00% to 1.00% for Class B shares, 1.00% for Class C shares, 1.00% for certain purchases of Class A shares and .25% for certain purchases of Class T shares.
For the period, sales charge amounts retained by FDC were as follows:
| Retained
by FDC |
Class A | $ 23,090 |
Class T | 5,193 |
Class BA | 281 |
Class C A | 6,136 |
| $ 34,700 |
A When Class B and Class C shares are initially sold, FDC pays commissions from its own resources to financial intermediaries through which the sales are made.
Transfer Agent Fees. Fidelity Investments Institutional Operations Company, Inc., (FIIOC), an affiliate of the investment adviser, is the transfer, dividend disbursing and shareholder servicing agent for each class of the Fund. FIIOC receives account fees and asset-based fees that vary according to the account size and type of account of the shareholders of the respective classes of the Fund. FIIOC pays for typesetting, printing and mailing of shareholder reports, except proxy statements.
For the period, transfer agent fees for each class were as follows:
| Amount | % of
Class-Level Average
Net Assets |
Class A | $ 60,801 | .23 |
Class T | 35,189 | .26 |
Class B | 2,566 | .30 |
Class C | 25,900 | .29 |
Europe | 2,522,706 | .19 |
Class I | 8,376 | .13 |
| $ 2,655,538 | |
Annual Report
Notes to Financial Statements - continued
5. Fees and Other Transactions with Affiliates - continued
Accounting and Security Lending Fees. Fidelity Service Company, Inc. (FSC), an affiliate of the investment adviser, maintains the Fund's accounting records. The accounting fee is based on the level of average net assets for each month. Under a separate contract, FSC administers the security lending program. The security lending fee is based on the number and duration of lending transactions.
Brokerage Commissions. The Fund placed a portion of its portfolio transactions with brokerage firms which are affiliates of the investment adviser. Brokerage commissions are included in net realized gain (loss) and change in net unrealized appreciation (depreciation) in the Statement of Operations. The commissions paid to these affiliated firms were $36 for the period.
Interfund Lending Program. Pursuant to an Exemptive Order issued by the SEC, the Fund, along with other registered investment companies having management contracts with FMR or other affiliated entities of FMR, may participate in an interfund lending program. This program provides an alternative credit facility allowing the funds to borrow from, or lend money to, other participating affiliated funds. At period end, there were no interfund loans outstanding. The Fund's activity in this program during the period for which loans were outstanding was as follows:
Borrower or Lender | Average Loan
Balance | Weighted Average
Interest Rate | Interest Expense |
Borrower | $ 8,546,818 | .37% | $ 963 |
6. Committed Line of Credit.
The Fund participates with other funds managed by the investment adviser or an affiliate in a $4.25 billion credit facility (the "line of credit") to be utilized for temporary or emergency purposes to fund shareholder redemptions or for other short-term liquidity purposes. The Fund has agreed to pay commitment fees on its pro-rata portion of the line of credit, which amounted to $1,988 and is reflected in Miscellaneous expenses on the Statement of Operations. During the period, the Fund did not borrow on this line of credit.
7. Security Lending.
The Fund lends portfolio securities through a lending agent from time to time in order to earn additional income. For equity securities, a lending agent is used and may loan securities to certain qualified borrowers, including Fidelity Capital Markets (FCM), a broker-dealer affiliated with the Fund. On the settlement date of the loan, the Fund receives collateral (in the form of U.S. Treasury obligations, letters of credit and/or cash) against the loaned securities and maintains collateral in an amount not less than 100% of the market value of the loaned securities during the period of the loan. The market value of the loaned securities is determined at the close of business of the Fund and any additional required collateral is delivered to the Fund on the next business day. The Fund or borrower may terminate the loan at any time, and if the borrower defaults on its obligation to return the securities loaned because of insolvency or other reasons, the Fund may apply collateral received from the borrower against the obligation. The Fund may experience delays and costs in recovering the securities loaned. Any cash collateral received is invested in the Fidelity Securities Lending Cash Central Fund. The value of loaned securities and cash collateral at period end are disclosed on the Fund's Statement of Assets and Liabilities. Security lending income represents the income earned on investing cash collateral, less rebates paid to borrowers and any lending agent fees associated with the loan, plus any premium payments received for lending certain types of securities. Security lending income is presented in the Statement of Operations as a component of income from Fidelity Central Funds. Total security lending income during the period amounted to $924,214. During the period, there were no securities loaned to FCM.
8. Expense Reductions.
Commissions paid to certain brokers with whom the investment adviser, or its affiliates, places trades on behalf of the Fund include an amount in addition to trade execution, which may be rebated back to the Fund to offset certain expenses. This amount totaled $274,757 for the period.
In addition, during the period the investment adviser reimbursed and/or waived a portion of fund-level operating expenses in the amount of $6,201 and a portion of class-level operating expenses as follows:
| Amount |
Class A | $ 87 |
Class T | 44 |
Class B | 2 |
Class C | 30 |
Europe | 28,324 |
Class I | 26 |
| $ 28,513 |
Annual Report
9. Distributions to Shareholders.
Distributions to shareholders of each class were as follows:
Years ended October 31, | 2015 | 2014 |
From net investment income | | |
Class A | $ 549,660 | $ - |
Class T | 299,142 | - |
Class B | 18,443 | - |
Class C | 108,670 | - |
Europe | 30,497,764 | 13,272,490 |
Class I | 130,017 | - |
Total | $ 31,603,696 | $ 13,272,490 |
From net realized gain | | |
Europe | $ - | $ 612,576 |
10. Share Transactions.
Share transactions for each class were as follows and may contain automatic conversions between classes or exchanges between funds:
| Shares | Dollars |
Years ended October 31, | 2015 | 2014A | 2015 | 2014A |
Class A | | | | |
Shares sold | 402,890 | 302,227 | $ 15,313,815 | $ 12,108,972 |
Issued in exchange for shares of Fidelity Advisor Europe Capital Appreciation Fund | - | 483,084 | - | 18,719,498 |
Reinvestment of distributions | 14,493 | - | 527,143 | - |
Shares redeemed | (438,670) | (133,151) | (16,388,542) | (5,066,903) |
Net increase (decrease) | (21,287) | 652,160 | $ (547,584) | $ 25,761,567 |
Class T | | | | |
Shares sold | 101,998 | 196,712 | $ 3,848,880 | $ 7,929,579 |
Issued in exchange for shares of Fidelity Advisor Europe Capital Appreciation Fund | - | 218,383 | - | 8,462,341 |
Reinvestment of distributions | 8,153 | - | 296,280 | - |
Shares redeemed | (227,511) | (36,984) | (8,571,443) | (1,400,101) |
Net increase (decrease) | (117,360) | 378,111 | $ (4,426,283) | $ 14,991,819 |
Class B | | | | |
Shares sold | 7,973 | 16,454 | $ 306,370 | $ 662,209 |
Issued in exchange for shares of Fidelity Advisor Europe Capital Appreciation Fund | - | 19,997 | - | 774,699 |
Reinvestment of distributions | 481 | - | 17,468 | - |
Shares redeemed | (23,568) | (6,913) | (877,823) | (266,573) |
Net increase (decrease) | (15,114) | 29,538 | $ (553,985) | $ 1,170,335 |
Class C | | | | |
Shares sold | 197,774 | 43,185 | $ 7,494,390 | $ 1,703,471 |
Issued in exchange for shares of Fidelity Advisor Europe Capital Appreciation Fund | - | 183,082 | - | 7,092,587 |
Reinvestment of distributions | 2,632 | - | 95,708 | - |
Shares redeemed | (86,511) | (37,236) | (3,194,278) | (1,401,102) |
Net increase (decrease) | 113,895 | 189,031 | $ 4,395,820 | $ 7,394,956 |
Europe | | | | |
Shares sold | 10,168,406 | 8,548,440 | $ 387,319,779 | $ 332,957,735 |
Issued in exchange for shares of Fidelity Europe Capital Appreciation Fund | - | 9,559,313 | - | 370,423,391 |
Reinvestment of distributions | 803,462 | 358,728 | 29,241,922 | 13,351,865 |
Shares redeemed | (7,807,853) | (9,647,960) | (290,372,067) | (370,706,278) |
Net increase (decrease) | 3,164,015 | 8,818,521 | $ 126,189,634 | $ 346,026,713 |
Class I | | | | |
Shares sold | 130,676 | 33,328 | $ 4,946,083 | $ 1,310,054 |
Issued in exchange for shares of Fidelity Advisor Europe Capital Appreciation Fund | - | 214,439 | - | 8,309,529 |
Reinvestment of distributions | 2,526 | - | 91,940 | - |
Shares redeemed | (113,122) | (91,772) | (4,289,576) | (3,497,677) |
Net increase (decrease) | 20,080 | 155,995 | $ 748,447 | $ 6,121,906 |
A Share transactions for Class A, Class T, Class B, Class C and Class I are for the period March 18, 2014 (commencement of sale of shares) to October 31, 2014.
Annual Report
Notes to Financial Statements - continued
11. Prior Fiscal Year Merger Information.
On March 21, 2014, the Fund acquired all of the assets and assumed all of the liabilities of Fidelity Europe Capital Appreciation Fund and Fidelity Advisor Europe Capital Appreciation Fund ("Target Funds") pursuant to Agreements and Plans of Reorganization approved by the Board of Trustees ("The Board") on September 18, 2013. The acquisition was accomplished by an exchange of shares of each class of the Fund for corresponding shares then outstanding of the Target Funds at their net asset value on the acquisition date. In addition, the Board approved the creation of additional classes of shares that commenced sale of shares on March 18, 2014. The reorganization provides shareholders of the Target Funds access to a larger portfolio with a similar investment objective and lower expenses. The reorganization qualified as a tax-free reorganization for federal income tax purposes with no gain or loss recognized to the funds or their shareholders. The Target Funds' net assets of $370,423,391, including securities of $369,430,411 and unrealized appreciation of $56,486,181 for Fidelity Europe Capital Appreciation Fund; and net assets of $43,358,654, including securities of $43,267,919 and unrealized appreciation of $4,301,890 for Fidelity Advisor Europe Capital Appreciation Fund; were combined with the Fund's net assets of $1,103,858,646 for total net assets after the acquisition of $1,517,640,691.
Pro forma results of operations of the combined entity for the entire period ended October 31, 2014, as though the acquisition had occurred as of the beginning of the year (rather than on the actual acquisition dates), are as follows:
Net Investment income (loss) | $ 36,003,400 |
Total net realized gain (loss) | 70,453,821 |
Total change in net unrealized appreciation (depreciation) | (148,729,606) |
Net increase (decrease) in net assets resulting from operations | $ (42,272,385) |
Because the combined investment portfolios have been managed as a single portfolio since the acquisitions were completed, it is not practicable to separate the amounts of revenue and earnings of the acquired funds that have been included in the Fund's accompanying Statement of Operations since March 21, 2014.
12. Other.
The Fund's organizational documents provide former and current trustees and officers with a limited indemnification against liabilities arising in connection with the performance of their duties to the Fund. In the normal course of business, the Fund may also enter into contracts that provide general indemnifications. The Fund's maximum exposure under these arrangements is unknown as this would be dependent on future claims that may be made against the Fund. The risk of material loss from such claims is considered remote.
Annual Report
To the Trustees of Fidelity Investment Trust and the Shareholders of Fidelity Europe Fund:
In our opinion, the accompanying statement of assets and liabilities, including the schedule of investments, and the related statements of operations and of changes in net assets and the financial highlights present fairly, in all material respects, the financial position of Fidelity Europe Fund (a fund of Fidelity Investment Trust) at October 31, 2015, the results of its operations for the year then ended, the changes in its net assets for each of the two years in the period then ended and the financial highlights for each of the periods indicated, in conformity with accounting principles generally accepted in the United States of America. These financial statements and financial highlights (hereafter referred to as "financial statements") are the responsibility of the Fidelity Europe Fund's management. Our responsibility is to express an opinion on these financial statements based on our audits. We conducted our audits of these financial statements in accordance with the standards of the Public Company Accounting Oversight Board (United States). Those standards require that we plan and perform the audit to obtain reasonable assurance about whether the financial statements are free of material misstatement. An audit includes examining, on a test basis, evidence supporting the amounts and disclosures in the financial statements, assessing the accounting principles used and significant estimates made by management, and evaluating the overall financial statement presentation. We believe that our audits, which included confirmation of securities at October 31, 2015 by correspondence with the custodian and brokers, provide a reasonable basis for our opinion.
PricewaterhouseCoopers LLP
Boston, Massachusetts
December 22, 2015
Annual Report
The Trustees, Member of the Advisory Board, and officers of the trust and fund, as applicable, are listed below. The Board of Trustees governs the fund and is responsible for protecting the interests of shareholders. The Trustees are experienced executives who meet periodically throughout the year to oversee the fund's activities, review contractual arrangements with companies that provide services to the fund, oversee management of the risks associated with such activities and contractual arrangements, and review the fund's performance. Each of the Trustees oversees 170 funds.
The Trustees hold office without limit in time except that (a) any Trustee may resign; (b) any Trustee may be removed by written instrument, signed by at least two-thirds of the number of Trustees prior to such removal; (c) any Trustee who requests to be retired or who has become incapacitated by illness or injury may be retired by written instrument signed by a majority of the other Trustees; and (d) any Trustee may be removed at any special meeting of shareholders by a two-thirds vote of the outstanding voting securities of the trust. Each Trustee who is not an interested person (as defined in the 1940 Act) of the trust and the fund (Independent Trustee), shall retire not later than the last day of the calendar year in which his or her 75th birthday occurs. The Independent Trustees may waive this mandatory retirement age policy with respect to individual Trustees. The officers and Advisory Board Member hold office without limit in time, except that any officer and Advisory Board Member may resign or may be removed by a vote of a majority of the Trustees at any regular meeting or any special meeting of the Trustees. Except as indicated, each individual has held the office shown or other offices in the same company for the past five years.
Experience, Skills, Attributes, and Qualifications of the Fund's Trustees. The Governance and Nominating Committee has adopted a statement of policy that describes the experience, qualifications, attributes, and skills that are necessary and desirable for potential Independent Trustee candidates (Statement of Policy). The Board believes that each Trustee satisfied at the time he or she was initially elected or appointed a Trustee, and continues to satisfy, the standards contemplated by the Statement of Policy. The Governance and Nominating Committee also engages professional search firms to help identify potential Independent Trustee candidates who have the experience, qualifications, attributes, and skills consistent with the Statement of Policy. From time to time, additional criteria based on the composition and skills of the current Independent Trustees, as well as experience or skills that may be appropriate in light of future changes to board composition, business conditions, and regulatory or other developments, have also been considered by the professional search firms and the Governance and Nominating Committee. In addition, the Board takes into account the Trustees' commitment and participation in Board and committee meetings, as well as their leadership of standing and ad hoc committees throughout their tenure.
In determining that a particular Trustee was and continues to be qualified to serve as a Trustee, the Board has considered a variety of criteria, none of which, in isolation, was controlling. The Board believes that, collectively, the Trustees have balanced and diverse experience, qualifications, attributes, and skills, which allow the Board to operate effectively in governing the fund and protecting the interests of shareholders. Information about the specific experience, skills, attributes, and qualifications of each Trustee, which in each case led to the Board's conclusion that the Trustee should serve (or continue to serve) as a trustee of the fund, is provided below.
Board Structure and Oversight Function. James C. Curvey is an interested person (as defined in the 1940 Act) and currently serves as Chairman. The Trustees have determined that an interested Chairman is appropriate and benefits shareholders because an interested Chairman has a personal and professional stake in the quality and continuity of services provided to the fund. Independent Trustees exercise their informed business judgment to appoint an individual of their choosing to serve as Chairman, regardless of whether the Trustee happens to be independent or a member of management. The Independent Trustees have determined that they can act independently and effectively without having an Independent Trustee serve as Chairman and that a key structural component for assuring that they are in a position to do so is for the Independent Trustees to constitute a substantial majority for the Board. The Independent Trustees also regularly meet in executive session. Ned C. Lautenbach serves as Chairman of the Independent Trustees and as such (i) acts as a liaison between the Independent Trustees and management with respect to matters important to the Independent Trustees and (ii) with management prepares agendas for Board meetings.
Fidelity funds are overseen by different Boards of Trustees. The fund's Board oversees Fidelity's high income and certain equity funds, and other Boards oversee Fidelity's investment-grade bond, money market, asset allocation, and sector funds. The asset allocation funds may invest in Fidelity funds overseen by the fund's Board. The use of separate Boards, each with its own committee structure, allows the Trustees of each group of Fidelity funds to focus on the unique issues of the funds they oversee, including common research, investment, and operational issues. On occasion, the separate Boards establish joint committees to address issues of overlapping consequences for the Fidelity funds overseen by each Board.
The Trustees operate using a system of committees to facilitate the timely and efficient consideration of all matters of importance to the Trustees, the fund, and fund shareholders and to facilitate compliance with legal and regulatory requirements and oversight of the fund's activities and associated risks. The Board, acting through its committees, has charged FMR and its affiliates with (i) identifying events or circumstances the occurrence of which could have demonstrably adverse effects on the fund's business and/or reputation; (ii) implementing processes and controls to lessen the possibility that such events or circumstances occur or to mitigate the effects of such events or circumstances if they do occur; and (iii) creating and maintaining a system designed to evaluate continuously business and market conditions in order to facilitate the identification and implementation processes described in (i) and (ii) above. Because the day-to-day operations and activities of the fund are carried out by or through FMR, its affiliates and other service providers, the fund's exposure to risks is mitigated but not eliminated by the processes overseen by the Trustees. While each of the Board's committees has responsibility for overseeing different aspects of the fund's activities, oversight is exercised primarily through the Operations, Audit, and Compliance Committees. In addition, the Independent Trustees have worked with FMR to enhance the Board's oversight of investment and financial risks, legal and regulatory risks, technology risks, and operational risks, including the development of additional risk reporting to the Board. For example, a working group comprised of Independent Trustees and FMR has worked and continues to work to review the Fidelity funds' valuation-related activities, reporting and risk management. Appropriate personnel, including but not limited to the fund's Chief Compliance Officer (CCO), FMR's internal auditor, the independent accountants, the fund's Treasurer and portfolio management personnel, make periodic reports to the Board's committees, as appropriate, including an annual review of Fidelity's risk management program for the Fidelity funds. The responsibilities of each standing committee, including their oversight responsibilities, are described further under "Standing Committees of the Fund's Trustees."
Annual Report
The fund's Statement of Additional Information (SAI) includes more information about the Trustees. To request a free copy, call Fidelity at 1-877-208-0098.
Interested Trustees*:
Correspondence intended for each Trustee who is an interested person may be sent to Fidelity Investments, 245 Summer Street, Boston, Massachusetts 02210.
Name, Year of Birth; Principal Occupations and Other Relevant Experience+ |
James C. Curvey (1935) |
Year of Election or Appointment: 2007 Trustee Chairman of the Board of Trustees |
| Mr. Curvey also serves as Trustee of other Fidelity funds. Mr. Curvey is a Director of Fidelity Research & Analysis Co. (investment adviser firm, 2009-present), and Vice Chairman (2007-present) and Director of FMR LLC (diversified financial services company). In addition, Mr. Curvey serves as an Overseer for the Boston Symphony Orchestra and a member of the board of Artis-Naples, Naples, Florida, and as a Trustee for Brewster Academy, Wolfeboro, New Hampshire. Previously, Mr. Curvey served as a Director of Fidelity Investments Money Management, Inc. (investment adviser firm, 2009-2014) and a Director of FMR and FMR Co., Inc. (investment adviser firms, 2007-2014). |
Charles S. Morrison (1960) |
Year of Election or Appointment: 2014 Trustee |
| Mr. Morrison also serves as Trustee of other funds. He serves as a Director of Fidelity Investments Money Management, Inc. (FIMM) (investment adviser firm, 2014-present), Director of Fidelity SelectCo, LLC (investment adviser firm, 2014-present), President, Asset Management (2014-present), and is an employee of Fidelity Investments. Previously, Mr. Morrison served as Vice President of Fidelity's Fixed Income and Asset Allocation Funds (2012-2014), President, Fixed Income (2011-2014), Vice President of Fidelity's Money Market Funds (2005-2009), President, Money Market Group Leader of FMR (investment adviser firm, 2009), and Senior Vice President, Money Market Group of FMR (2004-2009). Mr. Morrison also served as Vice President of Fidelity's Bond Funds (2002-2005), certain Balanced Funds (2002-2005), and certain Asset Allocation Funds (2002-2007), and as Senior Vice President (2002-2005) of Fidelity's Bond Division. |
* Trustees have been determined to be "Interested Trustees" by virtue of, among other things, their affiliation with the trust or various entities under common control with FMR.
+ The information above includes each Trustee's principal occupation during the last five years and other information relating to the experience, attributes, and skills relevant to each Trustee's qualifications to serve as a Trustee, which led to the conclusion that each Trustee should serve as a Trustee for the fund.
Annual Report
Trustees and Officers - continued
Independent Trustees:
Correspondence intended for each Independent Trustee (that is, the Trustees other than the Interested Trustees) may be sent to Fidelity Investments, P.O. Box 55235, Boston, Massachusetts 02205-5235.
Name, Year of Birth; Principal Occupations and Other Relevant Experience+ |
Dennis J. Dirks (1948) |
Year of Election or Appointment: 2005 Trustee |
| Mr. Dirks also serves as Trustee of other Fidelity funds. Prior to his retirement in May 2003, Mr. Dirks was Chief Operating Officer and a member of the Board of The Depository Trust & Clearing Corporation (DTCC). He also served as President, Chief Operating Officer, and Board member of The Depository Trust Company (DTC) and President and Board member of the National Securities Clearing Corporation (NSCC). In addition, Mr. Dirks served as Chief Executive Officer and Board member of the Government Securities Clearing Corporation, Chief Executive Officer and Board member of the Mortgage-Backed Securities Clearing Corporation, as a Trustee and a member of the Finance Committee of Manhattan College (2005-2008), as a Trustee and a member of the Finance Committee of AHRC of Nassau County (2006-2008), and as a member of the Independent Directors Council (IDC) Governing Council (2010-2015). Mr. Dirks is a member of the Board of Directors for The Brookville Center for Children's Services, Inc. (2009-present). |
Alan J. Lacy (1953) |
Year of Election or Appointment: 2008 Trustee |
| Mr. Lacy also serves as Trustee of other Fidelity funds. Mr. Lacy serves as a member of the Board of Directors of Dave & Buster's Entertainment, Inc. (restaurant and entertainment complexes, 2010-present) and Bristol-Myers Squibb Company (global pharmaceuticals, 2008-present). In addition, Mr. Lacy served as Senior Adviser (2007-2014) of Oak Hill Capital Partners, L.P. (private equity) and also served as Chief Executive Officer (2000-2005) and Vice Chairman (2005-2006) of Sears Holdings Corporation and Sears, Roebuck and Co. (retail). Mr. Lacy is a member of the Board of Trustees of The National Parks Conservation Association (2006-present). Previously, Mr. Lacy served as Chairman of the Board of Trustees of the National Parks Conservation Association (2008-2011) and as a member of the Board of Directors for The Western Union Company (global money transfer, 2006-2011), The Hillman Companies, Inc. (hardware wholesalers, 2010-2014), and Earth Fare, Inc. (retail grocery, 2010-2014). |
Ned C. Lautenbach (1944) |
Year of Election or Appointment: 2000 Trustee Chairman of the Independent Trustees |
| Mr. Lautenbach also serves as Trustee of other Fidelity funds. Mr. Lautenbach currently serves as the Lead Director of the Eaton Corporation Board of Directors (diversified industrial, 1997-present). Mr. Lautenbach is Chairman of the Board of Directors of Artis-Naples in Naples, Florida (2012-present), a member of the Council on Foreign Relations (1994-present), and a member of the Board of Governors, State University System of Florida (2013-present). Previously, Mr. Lautenbach was a Partner/Advisory Partner at Clayton, Dubilier & Rice, LLC (private equity investment, 1998-2010), as well as a Director of Sony Corporation (2006-2007). |
Joseph Mauriello (1944) |
Year of Election or Appointment: 2008 Trustee |
| Mr. Mauriello also serves as Trustee of other Fidelity funds. Prior to his retirement in January 2006, Mr. Mauriello served in numerous senior management positions including Deputy Chairman and Chief Operating Officer (2004-2005), and Vice Chairman of Financial Services (2002-2004) of KPMG LLP US (professional services, 1965-2005). Mr. Mauriello currently serves as a member of the Board of Directors of XL Group plc. (global insurance and re-insurance, 2006-present) and the Independent Directors Council (IDC) Governing Council (2015-present). Previously, Mr. Mauriello served as a Director of the Hamilton Funds of the Bank of New York (2006-2007) and of Arcadia Resources Inc. (health care services and products, 2007-2012). |
Robert W. Selander (1950) |
Year of Election or Appointment: 2011 Trustee |
| Mr. Selander also serves as Trustee of other Fidelity funds. Mr. Selander serves as a Director of The Western Union Company (global money transfer, 2014-present). Previously, Mr. Selander served as a Member of the Advisory Board of other Fidelity funds (2011), and Executive Vice Chairman (2010), Chief Executive Officer (2009-2010), and President and Chief Executive Officer (1997-2009) of Mastercard, Inc. |
Cornelia M. Small (1944) |
Year of Election or Appointment: 2005 Trustee |
| Ms. Small also serves as Trustee of other Fidelity funds. Ms. Small is a member of the Board of Directors (2009-present) and Chair of the Investment Committee (2010-present) of the Teagle Foundation. Ms. Small also serves on the Investment Committee of the Berkshire Taconic Community Foundation (2008-present). Previously, Ms. Small served as Chairperson (2002-2008) and a member of the Investment Committee and Chairperson (2008-2012) and a member of the Board of Trustees of Smith College. In addition, Ms. Small served as Chief Investment Officer, Director of Global Equity Investments, and a member of the Board of Directors of Scudder, Stevens & Clark and Scudder Kemper Investments. |
William S. Stavropoulos (1939) |
Year of Election or Appointment: 2001 Trustee Vice Chairman of the Independent Trustees |
| Mr. Stavropoulos also serves as Trustee of other Fidelity funds. Mr. Stavropoulos serves as President and Founder of the Michigan Baseball Foundation, the Great Lakes Loons (2007-present). Mr. Stavropoulos is Chairman Emeritus of the Board of Directors of The Dow Chemical Company, where he previously served in numerous senior management positions, including President, CEO (1995-2000; 2002-2004), Chairman of the Executive Committee (2000-2006), and as a member of the Board of Directors (1990-2006). Currently, Mr. Stavropoulos is Chairman of the Board of Directors of Univar Inc. (global distributor of commodity and specialty chemicals), a Director of Teradata Corporation (data warehousing and technology solutions), and Maersk Inc. (industrial conglomerate), and a member of the Advisory Board for Metalmark Capital LLC (private equity investment, 2005-present). Mr. Stavropoulos is an operating advisor to Clayton, Dubilier & Rice, LLC (private equity investment). In addition, Mr. Stavropoulos is a member of the University of Notre Dame Advisory Council for the College of Science, a Trustee of the Rollin L. Gerstacker Foundation, and a Director of the Naples Philharmonic Center for the Arts. Previously, Mr. Stavropoulos served as a Director of Chemical Financial Corporation (bank holding company, 1993-2012) and Tyco International, Ltd. (multinational manufacturing and services, 2007-2012). |
David M. Thomas (1949) |
Year of Election or Appointment: 2008 Trustee |
| Mr. Thomas also serves as Trustee of other Fidelity funds. Mr. Thomas serves as Non-Executive Chairman of the Board of Directors of Fortune Brands Home and Security (home and security products, 2011-present), as a member of the Board of Directors (2004-present) and Presiding Director (2013-present) of Interpublic Group of Companies, Inc. (marketing communication), and as a member of the Board of Trustees of the University of Florida (2013-present). Previously, Mr. Thomas served as Executive Chairman (2005-2006) and Chairman and Chief Executive Officer (2000-2005) of IMS Health, Inc. (pharmaceutical and healthcare information solutions), and a Director of Fortune Brands, Inc. (consumer products, 2000-2011). |
+ The information above includes each Trustee's principal occupation during the last five years and other information relating to the experience, attributes, and skills relevant to each Trustee's qualifications to serve as a Trustee, which led to the conclusion that each Trustee should serve as a Trustee for the fund.
Advisory Board Member and Officers:
Correspondence intended for each officer and Peter S. Lynch may be sent to Fidelity Investments, 245 Summer Street, Boston, Massachusetts 02210. Officers appear below in alphabetical order.
Name, Year of Birth; Principal Occupation |
Peter S. Lynch (1944) |
Year of Election or Appointment: 2003 Member of the Advisory Board |
| Mr. Lynch also serves as Member of the Advisory Board of other Fidelity funds. Mr. Lynch is Vice Chairman and a Director of FMR (investment adviser firm) and FMR Co., Inc. (investment adviser firm). In addition, Mr. Lynch serves as a Trustee of Boston College and as the Chairman of the Inner-City Scholarship Fund. Previously, Mr. Lynch served on the Special Olympics International Board of Directors (1997-2006). |
Elizabeth Paige Baumann (1968) |
Year of Election or Appointment: 2012 Anti-Money Laundering (AML) Officer |
| Ms. Baumann also serves as AML Officer of other funds. She is Chief AML Officer of FMR LLC (diversified financial services company, 2012-present) and is an employee of Fidelity Investments. Previously, Ms. Baumann served as Vice President and Deputy Anti-Money Laundering Officer (2007-2012). |
Marc R. Bryant (1966) |
Year of Election or Appointment: 2015 Secretary and Chief Legal Officer (CLO) |
| Mr. Bryant also serves as Secretary and CLO of other funds. Mr. Bryant serves as CLO, Secretary, and Senior Vice President of Fidelity Management & Research Company (investment adviser firm, 2015-present) and FMR Co., Inc. (investment adviser firm, 2015-present); Secretary of Fidelity SelectCo, LLC (investment adviser firm, 2015-present) and Fidelity Investments Money Management, Inc. (investment adviser firm, 2015-present); and CLO of Fidelity Management & Research (Hong Kong) Limited (investment adviser firm, 2015-present). He is Senior Vice President and Deputy General Counsel of FMR LLC (diversified financial services company). Previously, Mr. Bryant served as Secretary and Chief Legal Officer of Fidelity Rutland Square Trust II (2010-2014) and Assistant Secretary of Fidelity's Fixed Income and Asset Allocation Funds (2013-2015). Prior to joining Fidelity Investments, Mr. Bryant served as a Senior Vice President and the Head of Global Retail Legal for AllianceBernstein L.P. (2006-2010), and as the General Counsel for ProFund Advisors LLC (2001-2006). |
William C. Coffey (1969) |
Year of Election or Appointment: 2009 Assistant Secretary |
| Mr. Coffey also serves as Assistant Secretary of other funds. He is Senior Vice President and Deputy General Counsel of FMR LLC (diversified financial services company, 2010-present), and is an employee of Fidelity Investments. Previously, Mr. Coffey served as Vice President and Associate General Counsel of FMR LLC (2005-2009). |
Timothy M. Cohen (1969) |
Year of Election or Appointment: 2014 Vice President of certain Equity Funds |
| Mr. Cohen also serves as Vice President of other funds. Mr. Cohen serves as Chief Compliance Officer of FMR Investment Management (U.K.) Limited (investment adviser firm, 2013-present) and is an employee of Fidelity Investments. Previously, Mr. Cohen served as a Director of FMR Investment Management (U.K.) Limited (2013-2015). |
Jonathan Davis (1968) |
Year of Election or Appointment: 2010 Assistant Treasurer |
| Mr. Davis also serves as Assistant Treasurer of other funds, and is an employee of Fidelity Investments. Previously, Mr. Davis served as Vice President and Associate General Counsel of FMR LLC (diversified financial services company, 2003-2010). |
Adrien E. Deberghes (1967) |
Year of Election or Appointment: 2008 Deputy Treasurer |
| Mr. Deberghes also serves as an officer of other funds. He is an employee of Fidelity Investments (2008-present). Prior to joining Fidelity Investments, Mr. Deberghes was Senior Vice President of Mutual Fund Administration at State Street Corporation (2007-2008), Senior Director of Mutual Fund Administration at Investors Bank & Trust (2005-2007), and Director of Finance for Dunkin' Brands (2000-2005). |
Stephanie J. Dorsey (1969) |
Year of Election or Appointment: 2010 Assistant Treasurer |
| Ms. Dorsey also serves as an officer of other funds. She is an employee of Fidelity Investments (2008-present) and has served in other fund officer roles. Prior to joining Fidelity Investments, Ms. Dorsey served as Treasurer (2004-2008) of the JPMorgan Mutual Funds and Vice President (2004-2008) of JPMorgan Chase Bank. |
Howard J. Galligan III (1966) |
Year of Election or Appointment: 2014 Chief Financial Officer |
| Mr. Galligan also serves as Chief Financial Officer of other funds. Mr. Galligan serves as President of Fidelity Pricing and Cash Management Services (FPCMS) (2014-present) and as a Director of Strategic Advisers, Inc. (investment adviser firm, 2008-present). Previously, Mr. Galligan served as Chief Administrative Officer of Asset Management (2011-2014) and Chief Operating Officer and Senior Vice President of Investment Support for Strategic Advisers, Inc. (2003-2011). |
Scott C. Goebel (1968) |
Year of Election or Appointment: 2015 Vice President |
| Mr. Goebel serves as Vice President of other funds and is an employee of Fidelity Investments (2001-present). Previously, Mr. Goebel served as Secretary of Fidelity SelectCo, LLC (investment adviser firm, 2013-2015), Fidelity Investments Money Management, Inc. (FIMM) (investment adviser firm, 2010-2015), and Fidelity Research and Analysis Company (FRAC) (investment adviser firm, 2010-2015); General Counsel, Secretary, and Senior Vice President of Fidelity Management & Research Company (investment adviser firm, 2008-2015) and FMR Co., Inc. (investment adviser firm, 2008-2015); Assistant Secretary of Fidelity Management & Research (Japan) Limited (investment adviser firm, 2008-2015) and FMR Investment Management (U.K.) Limited (investment adviser firm, 2008-2015); Chief Legal Officer (CLO) of Fidelity Management & Research (Hong Kong) Limited (investment adviser firm, 2008-2015); Secretary and CLO of certain Fidelity funds (2008-2015); Assistant Secretary of FIMM (2008-2010), FRAC (2008-2010), and certain funds (2007-2008); and as Vice President and Secretary of Fidelity Distributors Corporation (FDC) (2005-2007). |
Brian B. Hogan (1964) |
Year of Election or Appointment: 2009 Vice President |
| Mr. Hogan also serves as Trustee or Vice President of other funds. Mr. Hogan serves as a Director of Fidelity SelectCo, LLC (investment adviser firm, 2014-present) and President of the Equity Division of FMR (investment adviser firm, 2009-present). Previously, Mr. Hogan served as Senior Vice President, Equity Research of FMR (2006-2009) and as a portfolio manager. |
Chris Maher (1972) |
Year of Election or Appointment: 2013 Assistant Treasurer |
| Mr. Maher serves as Assistant Treasurer of other funds. Mr. Maher is Vice President of Valuation Oversight and is an employee of Fidelity Investments. Previously, Mr. Maher served as Vice President of Asset Management Compliance (2013), Vice President of the Program Management Group of FMR (investment adviser firm, 2010-2013), and Vice President of Valuation Oversight (2008-2010). |
Kenneth B. Robins (1969) |
Year of Election or Appointment: 2008 President and Treasurer |
| Mr. Robins also serves as an officer of other funds. Mr. Robins serves as Executive Vice President of Fidelity Investments Money Management, Inc. (FIMM) (investment adviser firm, 2013-present) and is an employee of Fidelity Investments (2004-present). Previously, Mr. Robins served in other fund officer roles. |
Stacie M. Smith (1974) |
Year of Election or Appointment: 2013 Deputy Treasurer |
| Ms. Smith also serves as an officer of other funds. She is an employee of Fidelity Investments (2009-present) and has served in other fund officer roles. Prior to joining Fidelity Investments, Ms. Smith served as Senior Audit Manager of Ernst & Young LLP (1996-2009). |
Renee Stagnone (1975) |
Year of Election or Appointment: 2013 Deputy Treasurer |
| Ms. Stagnone also serves as Deputy Treasurer of other funds. Ms. Stagnone is an employee of Fidelity Investments (1997-present). |
Linda J. Wondrack (1964) |
Year of Election or Appointment: 2014 Chief Compliance Officer |
| Ms. Wondrack also serves as Chief Compliance Officer of other funds. Ms. Wondrack is Executive Vice President and head of the Ethics Office and Asset Management Compliance for Fidelity Investments (2012-present). Ms. Wondrack also serves as Chief Compliance Officer of Fidelity SelectCo, LLC (investment adviser firm, 2014-present); Chief Compliance Officer of Impresa Management LLC (2013-present); and Chief Compliance Officer of FMR Co., Inc. (investment adviser firm), Fidelity Investments Money Management, Inc. (investment adviser firm), Fidelity Management & Research (Japan) Limited (investment adviser firm), FMR Investment Management (U.K.) Limited (investment adviser firm), Fidelity Management & Research (Hong Kong) (investment adviser firm), Fidelity Management & Research Company (investment adviser firm), FIAM LLC (investment adviser firm), and Strategic Advisers, Inc. (investment adviser firm), Ballyrock Investment Advisors LLC, and Northern Neck Investors LLC (2012-present). Previously, Ms. Wondrack served as Senior Vice President and Chief Compliance Officer for Columbia Management Investment Advisers, LLC (2005-2012); Chief Compliance Officer for certain funds within the Columbia Family of Funds (2007-2012); and Senior Vice President of Compliance Risk Management at Bank of America (2005-2010). |
Joseph F. Zambello (1957) |
Year of Election or Appointment: 2011 Deputy Treasurer |
| Mr. Zambello also serves as Deputy Treasurer of other funds. Mr. Zambello is an employee of Fidelity Investments (1991-present). Previously, Mr. Zambello served as Vice President of the Program Management Group of FMR (investment adviser firm, 2009-2011) and Vice President of the Transfer Agent Oversight Group (2005-2009). |
Annual Report
The Board of Trustees of Fidelity Europe Fund voted to pay to shareholders of record at the opening of business on record date, the following distributions per share derived from capital gains realized from sales of portfolio securities, and dividends derived from net investment income:
| Pay Date | Record Date | Dividends | Capital Gains |
Class A | 12/07/15 | 12/04/15 | $0.285 | $0.154 |
Class T | 12/07/15 | 12/04/15 | $0.092 | $0.154 |
Class B | 12/07/15 | 12/04/15 | $0.000 | $0.000 |
Class C | 12/07/15 | 12/04/15 | $0.123 | $0.154 |
Class A designates 1%; Class T designates 1%; Class B designates 2%; and Class C designates 2%; of the dividends distributed during the fiscal year as qualifying for the dividends-received deduction for corporate shareholders.
Class A, Class T, Class B, and Class C designates 100% of dividends distributed during the fiscal year as amounts which may be taken into account as a dividend for purposes of the maximum rate under section 1(h)(11) of the Internal Revenue Code.
The amounts per share which represent income derived from sources within, and taxes paid to, foreign countries or possessions of the United States are as follows:
| Pay Date | Income | Taxes |
Class A | 12/08/14 | $0.8645 | $0.0715 |
| 12/29/14 | $0.0480 | $0.0000 |
Class T | 12/08/14 | $0.8165 | $0.0715 |
| 12/29/14 | $0.0480 | $0.0000 |
Class B | 12/08/14 | $0.6775 | $0.0715 |
| 12/29/14 | $0.0480 | $0.0000 |
Class C | 12/08/14 | $0.6425 | $0.0715 |
| 12/29/14 | $0.0480 | $0.0000 |
The fund will notify shareholders in January 2016 of amounts for use in preparing 2015 income tax returns.
Annual Report
Fidelity Europe Fund
Each year, the Board of Trustees, including the Independent Trustees (together, the Board), votes on the renewal of the management contract with Fidelity Management & Research Company (FMR) and the sub-advisory agreements (together, the Advisory Contracts) for the fund. The Board, assisted by the advice of fund counsel and Independent Trustees' counsel, requests and considers a broad range of information relevant to the renewal of the Advisory Contracts throughout the year.
The Board meets regularly and, at each of its meetings, covers an extensive agenda of topics and materials and considers factors that are relevant to its annual consideration of the renewal of the fund's Advisory Contracts, including the services and support provided to the fund and its shareholders. The Board has established various standing committees (Committees), each composed of and chaired by Independent Trustees with varying backgrounds, to which the Board has assigned specific subject matter responsibilities in order to enhance effective decision-making by the Board. The Board, acting directly and through its Committees, requests and receives information concerning the annual consideration of the renewal of the fund's Advisory Contracts. The Board also meets as needed to consider matters specifically related to the Board's annual consideration of the renewal of the Advisory Contracts. Members of the Board may also meet with trustees of other Fidelity funds through ad hoc joint committees to discuss certain matters relevant to all of the Fidelity funds.
At its July 2015 meeting, the Board unanimously determined to renew the fund's Advisory Contracts. In reaching its determination, the Board considered all factors it believed relevant, including (i) the nature, extent, and quality of the services to be provided to the fund and its shareholders (including the investment performance of the fund); (ii) the competitiveness of the fund's management fee and total expense ratio relative to peer funds; (iii) the total costs of the services to be provided by and the profits to be realized by Fidelity from its relationship with the fund; and (iv) the extent to which (if any) economies of scale exist and would be realized as the fund grows, and whether any economies of scale are appropriately shared with fund shareholders.
In considering whether to renew the Advisory Contracts for the fund, the Board reached a determination, with the assistance of fund counsel and Independent Trustees' counsel and through the exercise of its business judgment, that the renewal of the Advisory Contracts was in the best interests of the fund and its shareholders and that the compensation payable under the Advisory Contracts was fair and reasonable. The Board's decision to renew the Advisory Contracts was not based on any single factor, but rather was based on a comprehensive consideration of all the information provided to the Board at its meetings throughout the year. The Board, in reaching its determination to renew the Advisory Contracts, was aware that shareholders of the fund have a broad range of investment choices available to them, including a wide choice among funds offered by Fidelity's competitors, and that the fund's shareholders, who have the opportunity to review and weigh the disclosure provided by the fund in its prospectus and other public disclosures, have chosen to invest in this fund, which is part of the Fidelity family of funds.
Nature, Extent, and Quality of Services Provided. The Board considered Fidelity's staffing as it relates to the fund, including the backgrounds of investment personnel of Fidelity, and also considered the fund's investment objective, strategies, and related investment philosophy. The Independent Trustees also had discussions with senior management of Fidelity's investment operations and investment groups. The Board considered the structure of the portfolio manager compensation program and whether this structure provides appropriate incentives to act in the best interests of the fund. Additionally, the Board considered the portfolio managers' investments, if any, in the funds that they manage.
Resources Dedicated to Investment Management and Support Services. The Board and the Fund Oversight and Research Committees reviewed the general qualifications and capabilities of Fidelity's investment staff, including its size, education, experience, and resources, as well as Fidelity's approach to recruiting, training, managing, and compensating investment personnel. The Board noted that Fidelity has continued to increase the resources devoted to non-U.S. offices, including expansion of Fidelity's global investment organization. The Board also noted that Fidelity's analysts have extensive resources, tools and capabilities that allow them to conduct sophisticated quantitative and fundamental analysis, as well as credit analysis of issuers, counterparties and guarantors. Further, the Board considered that Fidelity's investment professionals have sufficient access to global information and data so as to provide competitive investment results over time, and that those professionals also have access to sophisticated tools that permit them to assess portfolio construction and risk and performance attribution characteristics continuously, as well as to transmit new information and research conclusions rapidly around the world. Additionally, in its deliberations, the Board considered Fidelity's trading, risk management, and compliance capabilities and resources, which are integral parts of the investment management process.
Shareholder and Administrative Services. The Board considered (i) the nature, extent, quality, and cost of advisory, administrative, and shareholder services performed by FMR, the sub-advisers (together with FMR, the Investment Advisers), and their affiliates under the Advisory Contracts and under separate agreements covering transfer agency, pricing and bookkeeping, and securities lending services for the fund; (ii) the nature and extent of the supervision of third party service providers, principally custodians and subcustodians; and (iii) the resources devoted to, and the record of compliance with, the fund's compliance policies and procedures. The Board also reviewed the allocation of fund brokerage, including allocations to brokers affiliated with the Investment Advisers, the use of brokerage commissions to pay fund expenses, and the use of "soft" commission dollars to pay for research services.
Annual Report
Board Approval of Investment Advisory Contracts and Management Fees - continued
The Board noted that the growth of fund assets over time across the complex allows Fidelity to reinvest in the development of services designed to enhance the value or convenience of the Fidelity funds as investment vehicles. These services include 24-hour access to account information and market information through telephone representatives and over the Internet, investor education materials and asset allocation tools, and the expanded availability of Fidelity Investor Centers.
In 2014, the Board formed an ad hoc Committee on Transfer Agency Fees to review the variety of transfer agency fee structures throughout the industry and Fidelity's competitive positioning with respect to industry participants.
Investment in a Large Fund Family. The Board considered the benefits to shareholders of investing in a Fidelity fund, including the benefits of investing in a fund that is part of a large family of funds offering a variety of investment disciplines and providing a large variety of mutual fund investor services. The Board noted that Fidelity had taken, or had made recommendations that resulted in the Fidelity funds taking, a number of actions over the previous year that benefited particular funds, including (i) continuing to dedicate additional resources to investment research and to the support of the senior management team that oversees asset management; (ii) continuing efforts to enhance Fidelity's global research capabilities; (iii) launching new funds and making other enhancements to meet client needs; (iv) reducing management fees and total expenses for certain index funds and diversified international funds; (v) continuing to launch dedicated lower cost underlying funds to meet portfolio construction needs related to expanding underlying fund options for Fidelity funds of funds, specifically for the Freedom Fund product lines; (vi) rationalizing product lines and gaining increased efficiencies through fund mergers; (vii) launching active fixed-income exchange-traded funds; (viii) continuing to develop, acquire and implement systems and technology to improve services to the funds and information security and to increase efficiency; (ix) implementing investment enhancements to further strengthen Fidelity's target date product line to increase investors' probability of success in achieving their goals; (x) modifying the eligibility criteria for certain share classes to accommodate roll-over assets from employer-sponsored retirement plans; (xi) launching a new Class W of the Freedom Index Funds to attract and retain Fidelity record-kept retirement plan assets; and (xii) implementing changes to Fidelity's money market product line in response to recent money market regulatory reforms.
Investment Performance. The Board considered whether the fund has operated in accordance with its investment objective, as well as its record of compliance with its investment restrictions and its performance history. The Board noted that there was a portfolio management change for the fund in December 2013 and September 2014.
The Board took into account discussions with representatives of the Investment Advisers about fund investment performance that occur at Board meetings throughout the year. In this regard the Board noted that as part of regularly scheduled fund reviews and other reports to the Board on fund performance, the Board considers annualized return information for the fund, for different time periods, measured against a securities market index ("benchmark index") and a peer group of funds with similar objectives ("peer group"), if any. In its evaluation of fund investment performance, the Board gave particular attention to information indicating changes in performance of certain Fidelity funds for specific time periods and discussed with the Investment Advisers the reasons for any overperformance or underperformance.
In addition to reviewing absolute and relative fund performance, the Independent Trustees periodically consider the appropriateness of fund performance metrics in evaluating the results achieved. In general, the Independent Trustees believe that fund performance should be evaluated based on net performance (after fees and expenses) of both the highest performing and lowest performing fund share classes, where applicable, compared to appropriate benchmark indices, over appropriate time periods that may include full market cycles, and compared to peer groups, as applicable, over the same periods, taking into account relevant factors including the following: general market conditions; issuer-specific information; and fund cash flows and other factors.
The Independent Trustees recognize that shareholders evaluate performance on a net basis over their own holding periods, for which one-, three-, and five-year periods are often used as a proxy. For this reason, the performance information reviewed by the Board also included net cumulative calendar year total return information for the fund and an appropriate benchmark index and peer group for the most recent one-, three-, and five-year periods, as shown below. Returns are shown compared to the 25th percentile (top of box, 75% beaten) and 75th percentile (bottom of box, 25% beaten) of the peer universe. Returns of the benchmark index are "net MA," i.e., adjusted for tax withholding rates applicable to U.S.-based funds organized as Massachusetts business trusts. Class A, Class T, Class B, Class C, and Class I commenced operations after the periods shown in the chart below.
Annual Report
Fidelity Europe Fund
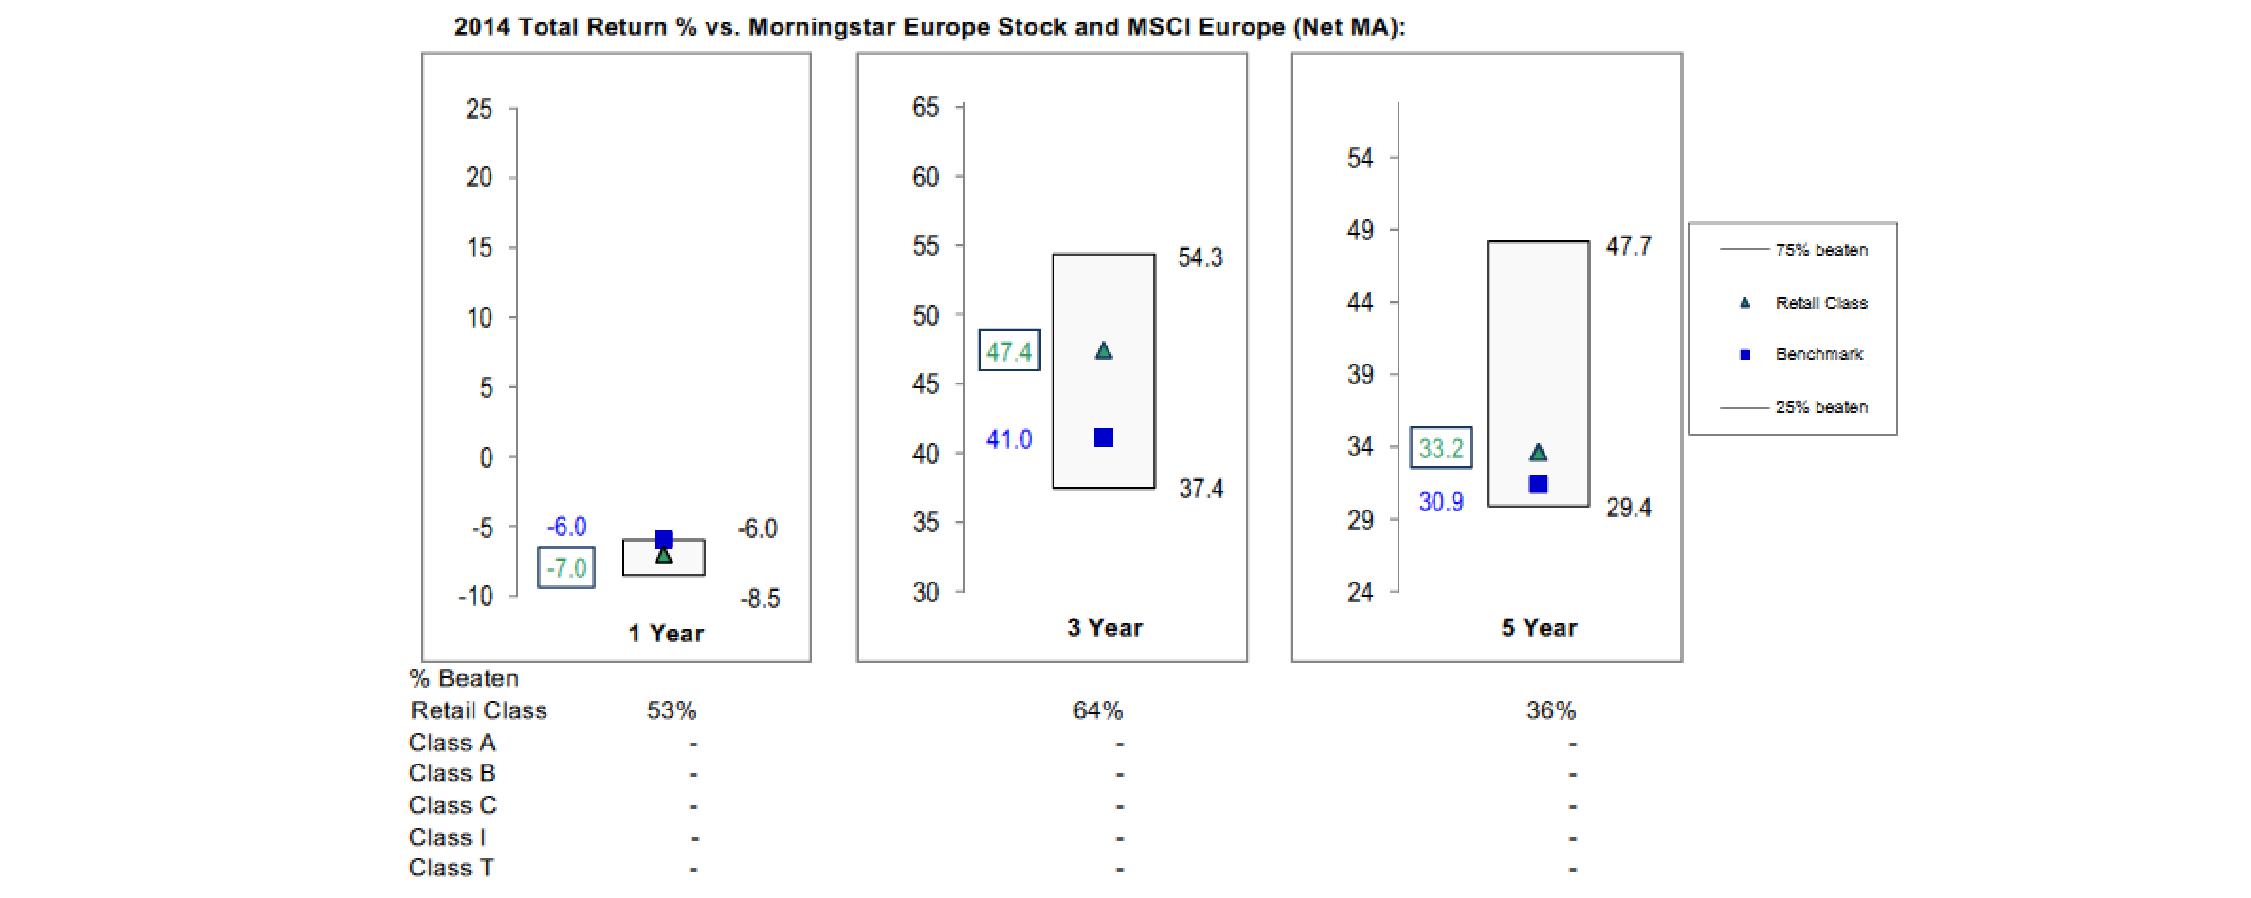
The Board also considered that the fund's management fee is subject to upward or downward adjustment depending upon whether, and to what extent, the fund's investment performance for the performance period exceeds, or is exceeded by, a securities index, thus leading to a performance adjustment for the same period. The Board noted that the performance adjustment provides FMR with a strong economic incentive to seek to achieve superior performance for the fund's shareholders and helps to more closely align the interests of FMR and the shareholders of the fund.
Based on its review, the Board concluded that the nature, extent, and quality of services provided to the fund under the Advisory Contracts should benefit the shareholders of the fund.
Competitiveness of Management Fee and Total Expense Ratio. The Board considered the fund's management fee and total expense ratio compared to "mapped groups" of competitive funds and classes created for the purpose of facilitating the Trustees' competitive analysis of management fees and total expenses. Fidelity creates "mapped groups" by combining similar Lipper investment objective categories that have comparable investment mandates. Combining Lipper investment objective categories aids the Board's management fee and total expense ratio comparisons by broadening the competitive group used for comparison.
Management Fee. The Board considered two proprietary management fee comparisons for the 12-month periods shown in basis points (BP) in the chart below. The group of Lipper funds used by the Board for management fee comparisons is referred to below as the "Total Mapped Group." The Total Mapped Group comparison focuses on a fund's standing in terms of gross management fees before expense reimbursements or caps, and without giving effect to the fund's performance adjustment, relative to the total universe of funds with comparable investment mandates, regardless of whether their management fee structures also are comparable. Funds with comparable investment mandates offer exposure to similar types of securities. Funds with comparable management fee structures have similar management fee contractual arrangements (e.g., flat rate charged for advisory services, all-inclusive fee rate, etc.). "TMG %" represents the percentage of funds in the Total Mapped Group that had management fees that were lower than the fund's. For example, a hypothetical TMG % of 20% would mean that 80% of the funds in the Total Mapped Group had higher, and 20% had lower, management fees than the fund. The fund's actual TMG %s and the number of funds in the Total Mapped Group are in the chart below. The "Asset-Size Peer Group" (ASPG) comparison focuses on a fund's standing relative to a subset of non-Fidelity funds within the Total Mapped Group that are similar in size and management fee structure without taking into account performance adjustments, if any. For example, if a fund is in the first quartile of the ASPG, the fund's management fee ranks in the least expensive or lowest 25% of funds in the ASPG. The ASPG represents at least 15% of the funds in the Total Mapped Group with comparable asset size and management fee structures, subject to a minimum of 50 funds (or all funds in the Total Mapped Group if fewer than 50). Additional information, such as the ASPG quartile in which the fund's management fee rate ranked and the impact of the fund's performance adjustment, is also included in the chart and considered by the Board.
Annual Report
Board Approval of Investment Advisory Contracts and Management Fees - continued
Fidelity Europe Fund

The Board noted that the fund's management fee rate ranked below the median of its Total Mapped Group and below the median of its ASPG for 2014. The Board also noted the effect of the fund's performance adjustment, if any, on the fund's management fee ranking.
The Board noted that, in 2014, the ad hoc Committee on Group Fee was formed by it and other Fidelity fund boards to conduct an in-depth review of the "group fee" component of the management fee of funds with such management fee structures. Committee focus included the mechanics of the group fee, the competitive landscape of group fee structures, Fidelity funds with no group fee component and investment products not included in group fee assets. The Board also considered that, for funds subject to the group fee, FMR agreed to voluntarily waive fees over a specified period of time in amounts designed to account for assets converted from certain funds to certain collective investment trusts.
The Board also noted that, in 2013, the ad hoc Committee on Management Fees was formed to conduct an in-depth review of the management fee rates of Fidelity's active equity mutual funds. The Committee focused on the following areas: (i) standard fee structures; (ii) research consumption and trading evolution; (iii) management fee competitiveness/profitability by category; and (iv) factors that drive institutional pricing.
Based on its review, the Board concluded that the fund's management fee is fair and reasonable in light of the services that the fund receives and the other factors considered.
Total Expense Ratio. In its review of the fund's total expense ratio, the Board considered the fund's management fee as well as other fund expenses, such as transfer agent fees, pricing and bookkeeping fees, and custodial, legal, and audit fees. The Board noted the impact of the fund's performance adjustment. The Board also noted that Fidelity may agree to waive fees and expenses from time to time, and the extent to which, if any, it has done so for the fund. As part of its review, the Board also considered the current and historical total expense ratios of the fund compared to competitive fund median expenses. The fund is compared to those funds and classes in the Total Mapped Group (used by the Board for management fee comparisons) that have a similar sales load structure.
The Board noted that the fund's total expense ratio ranked below its competitive median for 2014.
Fees Charged to Other Fidelity Clients. The Board also considered Fidelity fee structures and other information with respect to clients of Fidelity, such as other funds advised or subadvised by Fidelity, pension plan clients, and other institutional clients with similar mandates. The Board noted the findings of the 2013 ad hoc joint committee (created with the board of other Fidelity funds), which reviewed and compared Fidelity's institutional investment advisory business with its business of providing services to the Fidelity funds, including the differences in services provided, fees charged, and costs incurred, as well as competition in their respective marketplaces.
Based on its review of total expense ratios and fees charged to other Fidelity clients, the Board concluded that the total expense ratio of each class of the fund was reasonable in light of the services that the fund and its shareholders receive and the other factors considered.
Costs of the Services and Profitability. The Board considered the revenues earned and the expenses incurred by Fidelity in conducting the business of developing, marketing, distributing, managing, administering and servicing the fund and servicing the fund's shareholders. The Board also considered the level of Fidelity's profits in respect of all the Fidelity funds.
Annual Report
On an annual basis, Fidelity presents to the Board information about the profitability of its relationship with the fund. Fidelity calculates profitability information for each fund, as well as aggregate profitability information for groups of Fidelity funds and all Fidelity funds, using a series of detailed revenue and cost allocation methodologies which originate with the books and records of Fidelity on which Fidelity's audited financial statements are based. The Audit Committee of the Board reviews any significant changes from the prior year's methodologies.
PricewaterhouseCoopers LLP (PwC), independent registered public accounting firm and auditor to Fidelity and certain Fidelity funds, has been engaged annually by the Board as part of the Board's assessment of Fidelity's profitability analysis. PwC's engagement includes the review and assessment of the methodologies used by Fidelity in determining the revenues and expenses attributable to Fidelity's mutual fund business, and completion of agreed-upon procedures in respect of the mathematical accuracy of fund profitability and its conformity to established allocation methodologies. After considering PwC's reports issued under the engagement and information provided by Fidelity, the Board concluded that while other allocation methods may also be reasonable, Fidelity's profitability methodologies are reasonable in all material respects.
The Board also reviewed Fidelity's non-fund businesses and fall-out benefits related to the mutual fund business as well as cases where Fidelity's affiliates may benefit from or be related to the fund's business.
The Board considered the costs of the services provided by and the profits realized by Fidelity in connection with the operation of the fund and was satisfied that the profitability was not excessive.
Economies of Scale. The Board considered whether there have been economies of scale in respect of the management of the Fidelity funds, whether the Fidelity funds (including the fund) have appropriately benefited from any such economies of scale, and whether there is potential for realization of any further economies of scale. The Board considered the extent to which the fund will benefit from economies of scale as assets grow through increased services to the fund, through waivers or reimbursements, or through fee or expense ratio reductions. The Board also noted that in 2013, it and the boards of other Fidelity funds created an ad hoc committee (the Economies of Scale Committee) to analyze whether Fidelity attains economies of scale in respect of the management and servicing of the Fidelity funds, whether the Fidelity funds have appropriately benefited from such economies of scale, and whether there is potential for realization of any further economies of scale.
The Board recognized that the fund's management contract incorporates a "group fee" structure, which provides for lower group fee rates as total group assets increase, and for higher group fee rates as total group assets decrease (with "group assets" defined to include fund assets under FMR's management plus sector fund assets previously under FMR's management and currently managed by Fidelity SelectCo, LLC). FMR calculates the group fee rates based on a tiered asset "breakpoint" schedule that varies based on asset class. The Board considered that the group fee is designed to deliver the benefits of economies of scale to fund shareholders when total Fidelity fund assets increase, even if assets of any particular fund are unchanged or have declined, because some portion of Fidelity's costs are attributable to services provided to all Fidelity funds, and all funds benefit if those costs can be allocated among more assets. The Board concluded that, given the group fee structure, fund shareholders will benefit from lower management fees as group assets increase at the fund complex level, regardless of whether Fidelity achieves any such economies of scale.
The Board concluded, taking into account the analysis of the Economies of Scale Committee, that economies of scale, if any, are being appropriately shared between fund shareholders and Fidelity.
Additional Information Requested by the Board. In order to develop fully the factual basis for consideration of the Fidelity funds' Advisory Contracts, the Board requested and received additional information on certain topics, including: (i) fund performance trends and Fidelity's long-term strategies for certain funds; (ii) the various share classes employed by Fidelity and the attributes of each class, together with similar information on the distribution and servicing payments made by Fidelity or the funds to third-party participants in the distribution channels; (iii) fund profitability, and fund performance in relation to fund profitability; (iv) the methodology with respect to evaluating competitive fund data and peer group classifications and fee comparisons; (v) annual fund profitability margins, with particular focus on certain funds with negative margins; (vi) the realization of fall-out benefits in certain Fidelity business units; (vii) economies of scale and the way in which they are shared with fund shareholders; (viii) Fidelity's group fee structures, including the group fee schedule of breakpoints; (ix) the impact of cost containment measures on the funds; and (x) the transfer agent fee structure.
Based on its evaluation of all of the conclusions noted above, and after considering all factors it believed relevant, the Board concluded that the advisory fee structures are fair and reasonable, and that the fund's Advisory Contracts should be renewed.
Annual Report
Investment Adviser
Fidelity Management & Research Company
Boston, MA
Investment Sub-Advisers
FMR Co., Inc.
FMR Investment Management
(U.K.) Limited
FIL Investment Advisors
FIL Investment Advisors (UK) Limited
Fidelity Management & Research
(Hong Kong) Limited
Fidelity Management & Research
(Japan) Limited
General Distributor
Fidelity Distributors Corporation
Smithfield, RI
Transfer and Service Agents
Fidelity Investments Institutional
Operations Company, Inc.
Boston, MA
Fidelity Service Company, Inc.
Boston, MA
Custodian
State Street Bank and Trust Company
Quincy, MA
(Fidelity Investment logo)(registered trademark)
AEUF-UANN-1215
1.9585992.101
Fidelity Advisor®
Europe Fund -
Class I
(formerly Institutional Class)
Annual Report
October 31, 2015
Class I is a class
of Fidelity® Europe Fund
(Fidelity Cover Art)
Contents
Performance | (Click Here) | How the fund has done over time. |
Management's Discussion of Fund Performance | (Click Here) | The Portfolio Manager's review of fund performance and strategy. |
Shareholder Expense Example | (Click Here) | An example of shareholder expenses. |
Investment Changes | (Click Here) | A summary of major shifts in the fund's investments over the past six months. |
Investments | (Click Here) | A complete list of the fund's investments with their market values. |
Financial Statements | (Click Here) | Statements of assets and liabilities, operations, and changes in net assets, as well as financial highlights. |
Notes | (Click Here) | Notes to the financial statements. |
Report of Independent Registered Public Accounting Firm | (Click Here) | |
Trustees and Officers | (Click Here) | |
Distributions | (Click Here) | |
Board Approval of Investment Advisory Contracts and Management Fees | (Click Here) | |
To view a fund's proxy voting guidelines and proxy voting record for the 12-month period ended June 30, visit http://www.fidelity.com/proxyvotingresults or visit the Securities and Exchange Commission's (SEC) web site at http://www.sec.gov. You may also call 1-877-208-0098 to request a free copy of the proxy voting guidelines.
Standard & Poor's, S&P and S&P 500 are registered service marks of The McGraw-Hill Companies, Inc. and have been licensed for use by Fidelity Distributors Corporation.
Other third-party marks appearing herein are the property of their respective owners.
All other marks appearing herein are registered or unregistered trademarks or service marks of FMR LLC or an affiliated company. © 2015 FMR LLC. All rights reserved.
This report and the financial statements contained herein are submitted for the general information of the shareholders of the fund. This report is not authorized for distribution to prospective investors in the fund unless preceded or accompanied by an effective prospectus.
A fund files its complete schedule of portfolio holdings with the SEC for the first and third quarters of each fiscal year on Form N-Q. Forms N-Q are available on the SEC's web site at http://www.sec.gov. A fund's Forms N-Q may be reviewed and copied at the SEC's Public Reference Room in Washington, DC. Information regarding the operation of the SEC's Public Reference Room may be obtained by calling 1-800-SEC-0330. For a complete list of a fund's portfolio holdings, view the most recent holdings listing, semiannual report, or annual report on Fidelity's web site at http://www.fidelity.com, http://www.advisor.fidelity.com, or http://www.401k.com, as applicable.
NOT FDIC INSURED • MAY LOSE VALUE • NO BANK GUARANTEE
Neither the fund nor Fidelity Distributors Corporation is a bank.
Annual Report
Average annual total return reflects the change in the value of an investment, assuming reinvestment of the class' distributions from dividend income and capital gains (the profits earned upon the sale of securities that have grown in value, if any) and assuming a constant rate of performance each year. The $10,000 table and the fund's returns do not reflect the deduction of taxes that a shareholder would pay on fund distributions or the redemption of fund shares. During periods of reimbursement by Fidelity, a fund's total return will be greater than it would be had the reimbursement not occurred. How a fund did yesterday is no guarantee of how it will do tomorrow.
Average Annual Total Returns
Periods ended October 31, 2015 | Past 1
year | Past 5
years | Past 10
years |
Class I A | 5.02% | 6.08% | 5.03% |
A The initial offering of Class I shares took place on March 18, 2014. Returns prior to March 18, 2014, are those of Fidelity® Europe Fund, the original class of the fund.
$10,000 Over 10 Years
Let's say hypothetically that $10,000 was invested in Fidelity Advisor® Europe Fund - Class I on October 31, 2005. The chart shows how the value of your investment would have changed, and also shows how the MSCI Europe Index performed over the same period. See footnote A above for additional information regarding the performance of Class I.
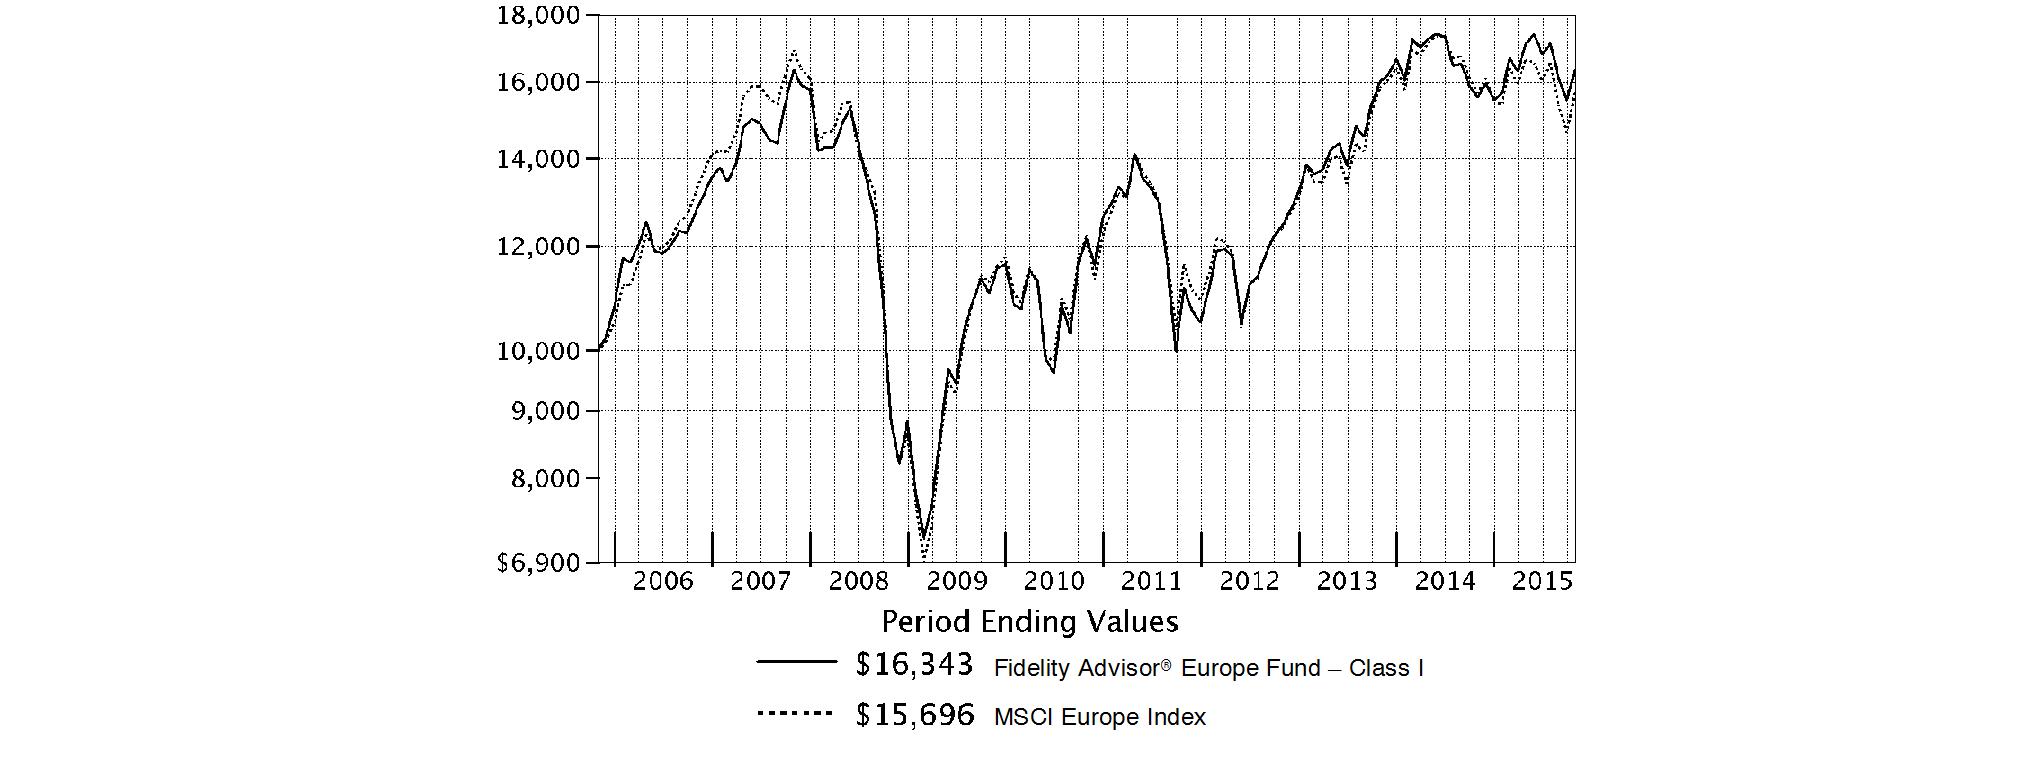
Annual Report
Fidelity Europe Fund
Market Recap: International equities suffered a moderate setback for the 12 months ending October 31, 2015, held back by a collapse in commodities prices that hurt resources-related sectors and geographies. The MSCI ACWI (All Country World Index) ex USA Index returned -4.55% for the period, affected also by concerns about global economic growth. Commodity producers remained under pressure for much of the past year, largely related to economic deceleration in China (-1%), the world's second-largest economy and a leading consumer of raw materials. This effect was exacerbated by U.S. dollar strength relative to global currencies, which weighed on commodities priced in dollars and acutely impacted equity returns within regions most exposed to resources prices. The emerging-markets group, for example, returned about -15% this period. Canada, a significant energy producer, returned roughly -17%. Net energy consumer Japan (+9%) was the best-performing region by far. Only about a quarter of the nearly 50 index countries managed a gain this period: Ireland (+19%) - the EU's fastest-growing economy - and Israel (+17%) proved top performers; Greece (-56%) and Brazil (-46%), among the worst. As for sectors, energy (-25%) and materials (-16%) declined sharply, whereas the two consumer sectors each gained about 6%.
Comments from Portfolio Manager Stefan Lindblad: For the year, the fund's share classes (excluding sales charges, if applicable) delivered mid-single-digit gains, handily outpacing the 0.04% return of the MSCI Europe Index. It was a volatile period for European stocks, partly stoked by European Central Bank intervention and weakness in commodities. Stock selection by far drove the fund's performance relative to the MSCI index, led by choices in health care, energy and financials. Avoiding poor-performing index component U.K.-based oil and gas company Royal Dutch Shell provided the fund's top individual contributor. Underweighting U.K.-based HSBC and avoiding Spanish bank Banco Santander also proved additive. On the downside, choices in the food, beverage & tobacco industry group hurt, as was positioning in telecommunication services. The most significant individual detractor was U.K.-based international bank Standard Chartered. I underestimated the company's balance sheet issues, and I did not foresee the slowdown in emerging markets, which weighed heavily on the stock's price. Encouraged by the company's management changes, I increased the fund's stake on weakness by period end.
The views expressed above reflect those of the portfolio manager(s) only through the end of the period as stated on the cover of this report and do not necessarily represent the views of Fidelity or any other person in the Fidelity organization. Any such views are subject to change at any time based upon market or other conditions and Fidelity disclaims any responsibility to update such views. These views may not be relied on as investment advice and, because investment decisions for a Fidelity fund are based on numerous factors, may not be relied on as an indication of trading intent on behalf of any Fidelity fund.
Annual Report
Fidelity Europe Fund
As a shareholder of the Fund, you incur two types of costs: (1) transaction costs, including sales charges (loads) on purchase payments or redemption proceeds, redemption fees and (2) ongoing costs, including management fees, distribution and/or service (12b-1) fees and other Fund expenses. This Example is intended to help you understand your ongoing costs (in dollars) of investing in the Fund and to compare these costs with the ongoing costs of investing in other mutual funds.
The Example is based on an investment of $1,000 invested at the beginning of the period and held for the entire period (May 1, 2015 to October 31, 2015).
Actual Expenses
The first line of the accompanying table for each class of the Fund provides information about actual account values and actual expenses. You may use the information in this line, together with the amount you invested, to estimate the expenses that you paid over the period. Simply divide your account value by $1,000.00 (for example, an $8,600 account value divided by $1,000.00 = 8.6), then multiply the result by the number in the first line for a class of the Fund under the heading entitled "Expenses Paid During Period" to estimate the expenses you paid on your account during this period. A small balance maintenance fee of $12.00 that is charged once a year may apply for certain accounts with a value of less than $2,000. This fee is not included in the table below. If it was, the estimate of expenses you paid during the period would be higher, and your ending account value lower, by this amount. In addition, the Fund, as a shareholder in the underlying Fidelity Central Funds, will indirectly bear its pro-rata share of the fees and expenses incurred by the underlying Fidelity Central Funds. These fees and expenses are not included in the Fund's annualized expense ratio used to calculate the expense estimate in the table below.
Hypothetical Example for Comparison Purposes
The second line of the accompanying table for each class of the Fund provides information about hypothetical account values and hypothetical expenses based on a Class' actual expense ratio and an assumed rate of return of 5% per year before expenses, which is not the Class' actual return. The hypothetical account values and expenses may not be used to estimate the actual ending account balance or expenses you paid for the period. You may use this information to compare the ongoing costs of investing in the Fund and other funds. To do so, compare this 5% hypothetical example with the 5% hypothetical examples that appear in the shareholder reports of the other funds. A small balance maintenance fee of $12.00 that is charged once a year may apply for certain accounts with a value of less than $2,000. This fee is not included in the table below. If it was, the estimate of expenses you paid during the period would be higher, and your ending account value lower, by this amount. In addition, the Fund, as a shareholder in the underlying Fidelity Central Funds, will indirectly bear its pro-rata share of the fees and expenses incurred by the underlying Fidelity Central Funds. These fees and expenses are not included in the Fund's annualized expense ratio used to calculate the expense estimate in the table below.
Please note that the expenses shown in the table are meant to highlight your ongoing costs only and do not reflect any transaction costs. Therefore, the second line of the table is useful in comparing ongoing costs only, and will not help you determine the relative total costs of owning different funds. In addition, if these transactional costs were included, your costs would have been higher.
| Annualized
Expense RatioB | Beginning
Account Value
May 1, 2015 | Ending
Account Value
October 31, 2015 | Expenses Paid
During PeriodC
May 1, 2015
to October 31, 2015 |
Class A | 1.33% | | | |
Actual | | $ 1,000.00 | $ 952.70 | $ 6.55 |
HypotheticalA | | $ 1,000.00 | $ 1,018.50 | $ 6.77 |
Class T | 1.61% | | | |
Actual | | $ 1,000.00 | $ 951.60 | $ 7.92 |
HypotheticalA | | $ 1,000.00 | $ 1,017.09 | $ 8.19 |
Class B | 2.14% | | | |
Actual | | $ 1,000.00 | $ 948.90 | $ 10.51 |
HypotheticalA | | $ 1,000.00 | $ 1,014.42 | $ 10.87 |
Class C | 2.15% | | | |
Actual | | $ 1,000.00 | $ 949.00 | $ 10.56 |
HypotheticalA | | $ 1,000.00 | $ 1,014.37 | $ 10.92 |
Europe | 1.03% | | | |
Actual | | $ 1,000.00 | $ 954.30 | $ 5.07 |
HypotheticalA | | $ 1,000.00 | $ 1,020.01 | $ 5.24 |
Class I | .97% | | | |
Actual | | $ 1,000.00 | $ 954.60 | $ 4.78 |
HypotheticalA | | $ 1,000.00 | $ 1,020.32 | $ 4.94 |
A 5% return per year before expenses
B Annualized expense ratio reflects expenses net of applicable fee waivers.
C Expenses are equal to each Class' annualized expense ratio, multiplied by the average account value over the period, multiplied by 184/365 (to reflect the one-half year period).
Annual Report
Fidelity Europe Fund
Investment Changes (Unaudited)
Asset Allocation as of October 31, 2015 |
| % of fund's
net assets | % of fund's net assets
6 months ago |
Stocks | 99.7 | 96.0 |
Short-Term Investments and Net Other Assets (Liabilities) | 0.3 | 4.0 |
Top Ten Stocks as of October 31, 2015 |
| % of fund's
net assets | % of fund's net assets
6 months ago |
Shire PLC (Bailiwick of Jersey, Pharmaceuticals) | 3.2 | 2.5 |
Getinge AB (B Shares) (Sweden, Health Care Equipment & Supplies) | 2.9 | 2.7 |
Standard Chartered PLC (United Kingdom) (United Kingdom, Banks) | 2.9 | 2.5 |
Sanofi SA (France, Pharmaceuticals) | 2.7 | 0.0 |
Bayer AG (Germany, Pharmaceuticals) | 2.4 | 2.1 |
Novozymes A/S Series B (Denmark, Chemicals) | 2.2 | 0.0 |
William Hill PLC (United Kingdom, Hotels, Restaurants & Leisure) | 2.0 | 1.1 |
William Demant Holding A/S (Denmark, Health Care Equipment & Supplies) | 1.8 | 1.0 |
Prudential PLC (United Kingdom, Insurance) | 1.8 | 1.7 |
H&M Hennes & Mauritz AB (B Shares) (Sweden, Specialty Retail) | 1.8 | 0.0 |
| 23.7 | |
Market Sectors as of October 31, 2015 |
| % of fund's
net assets | % of fund's net assets
6 months ago |
Financials | 31.6 | 26.0 |
Health Care | 19.8 | 21.0 |
Industrials | 17.5 | 20.1 |
Consumer Discretionary | 16.8 | 13.1 |
Information Technology | 5.4 | 3.7 |
Materials | 4.3 | 2.0 |
Consumer Staples | 3.0 | 7.7 |
Utilities | 1.3 | 1.1 |
Energy | 0.0 | 1.3 |
Percentages shown as 0.0% may reflect amounts less than 0.05%. |
Annual Report
Fidelity Europe Fund
Investments October 31, 2015
Showing Percentage of Net Assets
Common Stocks - 99.7% |
| Shares | | Value |
Austria - 1.9% |
Andritz AG | 276,800 | | $ 13,940,747 |
Erste Group Bank AG (a) | 483,000 | | 14,165,262 |
TOTAL AUSTRIA | | 28,106,009 |
Bailiwick of Jersey - 5.4% |
Shire PLC | 611,200 | | 46,286,714 |
Wolseley PLC | 264,819 | | 15,547,875 |
WPP PLC | 681,400 | | 15,274,830 |
TOTAL BAILIWICK OF JERSEY | | 77,109,419 |
Bermuda - 1.7% |
Vostok Emerging Finance Ltd. (depository receipt) (a) | 6,042,107 | | 1,697,310 |
Vostok New Ventures Ltd. SDR (a) | 3,662,236 | | 23,361,701 |
TOTAL BERMUDA | | 25,059,011 |
Denmark - 6.6% |
Carlsberg A/S Series B | 245,400 | | 20,117,275 |
DSV de Sammensluttede Vognmaend A/S | 414,000 | | 16,786,217 |
Novozymes A/S Series B | 685,500 | | 31,786,881 |
William Demant Holding A/S (a) | 308,800 | | 26,817,136 |
TOTAL DENMARK | | 95,507,509 |
Finland - 2.7% |
Amer Group PLC (A Shares) | 496,800 | | 13,941,732 |
Huhtamaki Oyj | 367,765 | | 12,981,650 |
Valmet Corp. | 1,119,700 | | 11,807,957 |
TOTAL FINLAND | | 38,731,339 |
France - 10.5% |
Bollore Group | 3,447,549 | | 17,067,520 |
Christian Dior SA | 116,895 | | 23,022,156 |
Eurazeo SA | 207,255 | | 14,604,342 |
Havas SA | 2,906,500 | | 25,217,487 |
Publicis Groupe SA | 230,946 | | 14,998,864 |
Sanofi SA | 387,964 | | 39,136,203 |
Wendel SA | 134,300 | | 16,119,599 |
TOTAL FRANCE | | 150,166,171 |
Germany - 9.4% |
adidas AG | 210,600 | | 18,873,652 |
Bayer AG | 258,700 | | 34,521,582 |
Brenntag AG | 343,400 | | 20,750,209 |
CompuGroup Medical AG | 259,600 | | 7,650,573 |
Fresenius SE & Co. KGaA | 244,797 | | 17,988,270 |
GEA Group AG | 337,429 | | 13,530,477 |
LEG Immobilien AG | 265,057 | | 21,146,143 |
TOTAL GERMANY | | 134,460,906 |
Ireland - 2.4% |
DCC PLC (United Kingdom) | 149,700 | | 12,011,970 |
|
| Shares | | Value |
Ryanair Holdings PLC sponsored ADR | 137,767 | | $ 10,772,002 |
United Drug PLC (United Kingdom) | 1,554,241 | | 11,385,877 |
TOTAL IRELAND | | 34,169,849 |
Isle of Man - 3.1% |
Optimal Payments PLC (a) | 4,443,710 | | 20,825,287 |
Playtech Ltd. | 1,767,361 | | 23,322,265 |
TOTAL ISLE OF MAN | | 44,147,552 |
Israel - 1.0% |
Teva Pharmaceutical Industries Ltd. sponsored ADR | 243,500 | | 14,412,765 |
Italy - 1.3% |
Mediolanum SpA | 2,236,635 | | 18,237,309 |
Mediolanum SpA rights | 2,236,635 | | 137 |
TOTAL ITALY | | 18,237,446 |
Netherlands - 1.4% |
RELX NV | 1,181,199 | | 20,197,980 |
Spain - 2.8% |
Amadeus IT Holding SA Class A | 496,600 | | 21,166,301 |
Red Electrica Corporacion SA | 210,300 | | 18,546,763 |
TOTAL SPAIN | | 39,713,064 |
Sweden - 16.5% |
Elekta AB (B Shares) (d) | 2,935,902 | | 22,697,395 |
Getinge AB (B Shares) | 1,679,200 | | 42,041,175 |
H&M Hennes & Mauritz AB (B Shares) | 663,852 | | 25,820,417 |
Hemfosa Fastigheter AB | 1,312,500 | | 14,248,688 |
Indutrade AB | 367,400 | | 17,545,306 |
Kungsleden AB | 1,996,700 | | 14,957,342 |
Lundbergfoeretagen AB | 94,092 | | 4,798,460 |
Nordea Bank AB | 1,897,200 | | 20,984,883 |
Pandox AB (a) | 1,087,500 | | 17,795,003 |
Sandvik AB | 2,359,600 | | 22,067,178 |
Svenska Cellulosa AB (SCA) (B Shares) | 789,200 | | 23,245,081 |
Svenska Handelsbanken AB (A Shares) | 809,700 | | 10,996,924 |
TOTAL SWEDEN | | 237,197,852 |
Switzerland - 2.1% |
Credit Suisse Group AG (e)(f) | 478,733 | | 11,018,439 |
Julius Baer Group Ltd. | 399,440 | | 19,805,238 |
TOTAL SWITZERLAND | | 30,823,677 |
United Kingdom - 30.9% |
Aberdeen Asset Management PLC | 3,164,057 | | 16,911,022 |
Aldermore Group PLC | 2,775,037 | | 11,285,356 |
Ashmore Group PLC (d) | 1,759,300 | | 7,322,770 |
Babcock International Group PLC | 1,323,700 | | 19,671,537 |
Big Yellow Group PLC | 1,465,300 | | 16,941,799 |
Bunzl PLC | 683,458 | | 19,586,774 |
Compass Group PLC | 1,270,417 | | 21,839,618 |
Dechra Pharmaceuticals PLC | 781,752 | | 11,683,918 |
Diploma PLC | 1,297,100 | | 12,827,494 |
Common Stocks - continued |
| Shares | | Value |
United Kingdom - continued |
Essentra PLC | 1,355,136 | | $ 17,590,034 |
International Personal Finance PLC | 3,944,403 | | 22,504,640 |
ITV PLC | 3,587,700 | | 13,959,735 |
LivaNova PLC (a) | 170,566 | | 11,305,114 |
Lloyds Banking Group PLC | 22,279,800 | | 25,287,845 |
London Stock Exchange Group PLC | 405,300 | | 15,901,427 |
Micro Focus International PLC | 595,700 | | 11,534,239 |
Prudential PLC | 1,142,519 | | 26,685,240 |
Rolls-Royce Group PLC | 1,501,292 | | 15,875,437 |
Schroders PLC | 359,422 | | 16,528,354 |
Senior Engineering Group PLC | 3,385,600 | | 11,837,238 |
Shawbrook Group Ltd. | 2,398,200 | | 12,544,142 |
St. James's Place Capital PLC | 577,862 | | 8,592,075 |
Standard Chartered PLC (United Kingdom) | 3,773,966 | | 41,970,662 |
Unite Group PLC | 1,670,087 | | 17,121,131 |
Virgin Money Holdings Uk PLC | 1,163,048 | | 6,953,079 |
William Hill PLC | 5,883,073 | | 28,705,132 |
TOTAL UNITED KINGDOM | | 442,965,812 |
TOTAL COMMON STOCKS (Cost $1,369,293,912) |
1,431,006,361
|
Nonconvertible Preferred Stocks - 0.0% |
| | | |
United Kingdom - 0.0% |
Rolls-Royce Group PLC
(Cost $214,231) | 139,169,768 | |
214,544
|
Money Market Funds - 2.1% |
| Shares | | Value |
Fidelity Cash Central Fund, 0.18% (b) | 14,053,296 | | $ 14,053,296 |
Fidelity Securities Lending Cash Central Fund, 0.19% (b)(c) | 15,283,267 | | 15,283,267 |
TOTAL MONEY MARKET FUNDS (Cost $29,336,563) |
29,336,563
|
TOTAL INVESTMENT
PORTFOLIO - 101.8% (Cost $1,398,844,706) | | 1,460,557,468 |
NET OTHER ASSETS (LIABILITIES) - (1.8)% | | (25,176,509) |
NET ASSETS - 100% | $ 1,435,380,959 |
Legend |
(a) Non-income producing |
(b) Affiliated fund that is generally available only to investment companies and other accounts managed by Fidelity Investments. The rate quoted is the annualized seven-day yield of the fund at period end. A complete unaudited listing of the fund's holdings as of its most recent quarter end is available upon request. In addition, each Fidelity Central Fund's financial statements, which are not covered by the Fund's Report of Independent Registered Public Accounting Firm, are available on the SEC's website or upon request. |
(c) Investment made with cash collateral received from securities on loan. |
(d) Security or a portion of the security is on loan at period end. |
(e) Security or a portion of the security purchased on a delayed delivery or when-issued basis. |
(f) Restricted securities - Investment in securities not registered under the Securities Act of 1933 (excluding 144A issues). At the end of the period, the value of restricted securities (excluding 144A issues) amounted to $11,018,439 or 0.8% of net assets. |
Additional information on each restricted holding is as follows: |
Security | Acquisition Date | Acquisition Cost |
Credit Suisse Group AG | 10/21/15 | $ 11,351,478 |
Affiliated Central Funds |
Information regarding fiscal year to date income earned by the Fund from investments in Fidelity Central Funds is as follows: |
Fund | Income earned |
Fidelity Cash Central Fund | $ 58,484 |
Fidelity Securities Lending Cash Central Fund | 924,214 |
Total | $ 982,698 |
Other Information |
Categorizations in the Schedule of Investments are based on country or territory of incorporation. |
The following is a summary of the inputs used, as of October 31, 2015, involving the Fund's assets and liabilities carried at fair value. The inputs or methodology used for valuing securities may not be an indication of the risk associated with investing in those securities. For more information on valuation inputs, and their aggregation into the levels used in the tables below, please refer to the Investment Valuation section in the accompanying Notes to Financial Statements. |
Valuation Inputs at Reporting Date: |
Description | Total | Level 1 | Level 2 | Level 3 |
Investments in Securities: | | | | |
Equities: | | | | |
Consumer Discretionary | $ 239,646,606 | $ 154,953,374 | $ 84,693,232 | $ - |
Consumer Staples | 43,362,356 | 20,117,275 | 23,245,081 | - |
Financials | 452,691,319 | 358,897,496 | 93,793,823 | - |
Health Care | 285,926,722 | 182,515,535 | 103,411,187 | - |
Industrials | 251,840,482 | 220,417,170 | 31,423,312 | - |
Information Technology | 76,848,092 | 76,848,092 | - | - |
Materials | 62,358,565 | 62,358,565 | - | - |
Utilities | 18,546,763 | 18,546,763 | - | - |
Money Market Funds | 29,336,563 | 29,336,563 | - | - |
Total Investments in Securities: | $ 1,460,557,468 | $ 1,123,990,833 | $ 336,566,635 | $ - |
The following is a summary of transfers between Level 1 and Level 2 for the period ended October 31, 2015. Transfers are assumed to have occurred at the beginning of the period, and are primarily attributable to the valuation techniques used for foreign equity securities, as discussed in the accompanying Notes to Financial Statements: |
Transfers | Total |
Level 1 to Level 2 | $ 86,522,583 |
Level 2 to Level 1 | $ 0 |
See accompanying notes which are an integral part of the financial statements.
Annual Report
Fidelity Europe Fund
Statement of Assets and Liabilities
| | October 31, 2015 |
| | |
Assets | | |
Investment in securities, at value (including securities loaned of $14,512,421) - See accompanying schedule: Unaffiliated issuers (cost $1,369,508,143) | $ 1,431,220,905 | |
Fidelity Central Funds (cost $29,336,563) | 29,336,563 | |
Total Investments (cost $1,398,844,706) | | $ 1,460,557,468 |
Foreign currency held at value (cost $131,652) | | 131,612 |
Receivable for investments sold | | 5,679,719 |
Receivable for fund shares sold | | 444,635 |
Dividends receivable | | 3,187,421 |
Distributions receivable from Fidelity Central Funds | | 20,249 |
Prepaid expenses | | 4,115 |
Other receivables | | 470,045 |
Total assets | | 1,470,495,264 |
| | |
Liabilities | | |
Payable for investments purchased | | |
Regular delivery | $ 6,076,814 | |
Delayed delivery | 11,018,439 | |
Payable for fund shares redeemed | 1,416,898 | |
Accrued management fee | 933,754 | |
Distribution and service plan fees payable | 18,340 | |
Other affiliated payables | 283,034 | |
Other payables and accrued expenses | 83,759 | |
Collateral on securities loaned, at value | 15,283,267 | |
Total liabilities | | 35,114,305 |
| | |
Net Assets | | $ 1,435,380,959 |
Net Assets consist of: | | |
Paid in capital | | $ 1,586,026,086 |
Undistributed net investment income | | 15,983,003 |
Accumulated undistributed net realized gain (loss) on investments and foreign currency transactions | | (228,558,075) |
Net unrealized appreciation (depreciation) on investments and assets and liabilities in foreign currencies | | 61,929,945 |
Net Assets | | $ 1,435,380,959 |
Statement of Assets and Liabilities - continued
| | October 31, 2015 |
| | |
Calculation of Maximum Offering Price | | |
Class A:
Net Asset Value and redemption price per share ($23,381,485 ÷ 630,873 shares) | | $ 37.06 |
| | |
Maximum offering price per share (100/94.25 of $37.06) | | $ 39.32 |
Class T:
Net Asset Value and redemption price per share ($9,631,696 ÷ 260,751 shares) | | $ 36.94 |
| | |
Maximum offering price per share (100/96.50 of $36.94) | | $ 38.28 |
Class B:
Net Asset Value and offering price per share ($530,359 ÷ 14,424 shares)A | | $ 36.77 |
| | |
Class C:
Net Asset Value and offering price per share ($11,151,092 ÷ 302,926 shares)A | | $ 36.81 |
| | |
Europe:
Net Asset Value, offering price and redemption price per share ($1,384,134,439 ÷ 37,219,706 shares) | | $ 37.19 |
| | |
Class I:
Net Asset Value, offering price and redemption price per share ($6,551,888 ÷ 176,075 shares) | | $ 37.21 |
A Redemption price per share is equal to net asset value less any applicable contingent deferred sales charge.
See accompanying notes which are an integral part of the financial statements.
Annual Report
Fidelity Europe Fund
Financial Statements - continued
Statement of Operations
| Year ended October 31, 2015 |
| | |
Investment Income | | |
Dividends | | $ 34,182,184 |
Interest | | 1,295 |
Income from Fidelity Central Funds | | 982,698 |
Income before foreign taxes withheld | | 35,166,177 |
Less foreign taxes withheld | | (2,877,247) |
Total income | | 32,288,930 |
| | |
Expenses | | |
Management fee | | |
Basic fee | $ 9,840,222 | |
Performance adjustment | 1,149,586 | |
Transfer agent fees | 2,655,538 | |
Distribution and service plan fees | 230,307 | |
Accounting and security lending fees | 642,501 | |
Custodian fees and expenses | 135,244 | |
Independent trustees' compensation | 6,071 | |
Registration fees | 81,226 | |
Audit | 92,356 | |
Legal | 8,636 | |
Interest | 963 | |
Miscellaneous | 13,056 | |
Total expenses before reductions | 14,855,706 | |
Expense reductions | (309,471) | 14,546,235 |
Net investment income (loss) | | 17,742,695 |
Realized and Unrealized Gain (Loss) | | |
Net realized gain (loss) on: | | |
Investment securities: | | |
Unaffiliated issuers | 56,522,314 | |
Foreign currency transactions | 333,984 | |
Total net realized gain (loss) | | 56,856,298 |
Change in net unrealized appreciation (depreciation) on: Investment securities | (21,707,177) | |
Assets and liabilities in foreign currencies | 330,244 | |
Total change in net unrealized appreciation (depreciation) | | (21,376,933) |
Net gain (loss) | | 35,479,365 |
Net increase (decrease) in net assets resulting from operations | | $ 53,222,060 |
Statement of Changes in Net Assets
| Year ended
October 31,
2015 | Year ended
October 31,
2014 |
Increase (Decrease) in Net Assets | | |
Operations | | |
Net investment income (loss) | $ 17,742,695 | $ 31,583,880 |
Net realized gain (loss) | 56,856,298 | 61,093,776 |
Change in net unrealized appreciation (depreciation) | (21,376,933) | (149,418,761) |
Net increase (decrease) in net assets resulting from operations | 53,222,060 | (56,741,105) |
Distributions to shareholders from net investment income | (31,603,696) | (13,272,490) |
Distributions to shareholders from net realized gain | - | (612,576) |
Total distributions | (31,603,696) | (13,885,066) |
Share transactions - net increase (decrease) | 125,806,049 | 401,467,296 |
Redemption fees | 48,244 | 18,788 |
Total increase (decrease) in net assets | 147,472,657 | 330,859,913 |
| | |
Net Assets | | |
Beginning of period | 1,287,908,302 | 957,048,389 |
End of period (including undistributed net investment income of $15,983,003 and undistributed net investment income of $29,844,004, respectively) | $ 1,435,380,959 | $ 1,287,908,302 |
See accompanying notes which are an integral part of the financial statements.
Annual Report
Financial Highlights - Fidelity Europe Fund Class A
Years ended October 31, | 2015 | 2014 H |
Selected Per-Share Data | | |
Net asset value, beginning of period | $ 36.24 | $ 39.45 |
Income from Investment Operations | | |
Net investment income (loss) E | .37 | .47 |
Net realized and unrealized gain (loss) | 1.29 | (3.68) |
Total from investment operations | 1.66 | (3.21) |
Distributions from net investment income | (.84) | - |
Redemption fees added to paid in capitalE, K | - | - |
Net asset value, end of period | $ 37.06 | $ 36.24 |
Total ReturnB, C, D | 4.63% | (8.14)% |
Ratios to Average Net AssetsF, I | | |
Expenses before reductions | 1.33% | 1.35%A |
Expenses net of fee waivers, if any | 1.33% | 1.35%A |
Expenses net of all reductions | 1.31% | 1.35%A |
Net investment income (loss) | .98% | 1.94%A |
Supplemental Data | | |
Net assets, end of period (000 omitted) | $ 23,381 | $ 23,633 |
Portfolio turnover rateG | 87% | 80%J |
AAnnualized BTotal returns for periods of less than one year are not annualized. CTotal returns would have been lower if certain expenses had not been reduced during the applicable periods shown. DTotal returns do not include the effect of the sales charges. ECalculated based on average shares outstanding during the period. FFees and expenses of any underlying Fidelity Central Funds are not included in the Fund's expense ratio. The Fund indirectly bears its proportionate share of the expenses of any underlying Fidelity Central Funds. GAmount does not include the portfolio activity of any underlying Fidelity Central Funds. HFor the period March 18, 2014 (commencement of sale of shares) to October 31, 2014. IExpense ratios reflect operating expenses of the class. Expenses before reductions do not reflect amounts reimbursed by the investment adviser or reductions from brokerage service arrangements or reductions from other expense offset arrangements and do not represent the amount paid by the class during periods when reimbursements or reductions occur. Expenses net of fee waivers reflect expenses after reimbursement by the investment adviser but prior to reductions from brokerage service arrangements or other expense offset arrangements. Expenses net of all reductions represent the net expenses paid by the class. JThe portfolio turnover rate does not include the assets acquired in the merger. KAmount represents less than $.005 per share. |
Financial Highlights - Fidelity Europe Fund Class T
Years ended October 31, | 2015 | 2014 H |
Selected Per-Share Data | | |
Net asset value, beginning of period | $ 36.18 | $ 39.45 |
Income from Investment Operations | | |
Net investment income (loss) E | .26 | .40 |
Net realized and unrealized gain (loss) | 1.29 | (3.67) |
Total from investment operations | 1.55 | (3.27) |
Distributions from net investment income | (.79) | - |
Redemption fees added to paid in capitalE, K | - | - |
Net asset value, end of period | $ 36.94 | $ 36.18 |
Total ReturnB, C, D | 4.33% | (8.29)% |
Ratios to Average Net AssetsF, I | | |
Expenses before reductions | 1.61% | 1.62%A |
Expenses net of fee waivers, if any | 1.61% | 1.61%A |
Expenses net of all reductions | 1.59% | 1.61%A |
Net investment income (loss) | .70% | 1.68%A |
Supplemental Data | | |
Net assets, end of period (000 omitted) | $ 9,632 | $ 13,679 |
Portfolio turnover rateG | 87% | 80%J |
AAnnualized BTotal returns for periods of less than one year are not annualized. CTotal returns would have been lower if certain expenses had not been reduced during the applicable periods shown. DTotal returns do not include the effect of the sales charges. ECalculated based on average shares outstanding during the period. FFees and expenses of any underlying Fidelity Central Funds are not included in the Fund's expense ratio. The Fund indirectly bears its proportionate share of the expenses of any underlying Fidelity Central Funds. GAmount does not include the portfolio activity of any underlying Fidelity Central Funds. HFor the period March 18, 2014 (commencement of sale of shares) to October 31, 2014. IExpense ratios reflect operating expenses of the class. Expenses before reductions do not reflect amounts reimbursed by the investment adviser or reductions from brokerage service arrangements or reductions from other expense offset arrangements and do not represent the amount paid by the class during periods when reimbursements or reductions occur. Expenses net of fee waivers reflect expenses after reimbursement by the investment adviser but prior to reductions from brokerage service arrangements or other expense offset arrangements. Expenses net of all reductions represent the net expenses paid by the class. JThe portfolio turnover rate does not include the assets acquired in the merger. KAmount represents less than $.005 per share. |
See accompanying notes which are an integral part of the financial statements.
Annual Report
Financial Highlights - Fidelity Europe Fund Class B
Years ended October 31, | 2015 | 2014 H |
Selected Per-Share Data | | |
Net asset value, beginning of period | $ 36.07 | $ 39.45 |
Income from Investment Operations | | |
Net investment income (loss) E | .06 | .28 |
Net realized and unrealized gain (loss) | 1.29 | (3.66) |
Total from investment operations | 1.35 | (3.38) |
Distributions from net investment income | (.65) | - |
Redemption fees added to paid in capitalE, K | - | - |
Net asset value, end of period | $ 36.77 | $ 36.07 |
Total ReturnB, C, D | 3.78% | (8.57)% |
Ratios to Average Net AssetsF, I | | |
Expenses before reductions | 2.15% | 2.11%A |
Expenses net of fee waivers, if any | 2.15% | 2.11%A |
Expenses net of all reductions | 2.13% | 2.11%A |
Net investment income (loss) | .16% | 1.19%A |
Supplemental Data | | |
Net assets, end of period (000 omitted) | $ 530 | $ 1,065 |
Portfolio turnover rateG | 87% | 80%J |
AAnnualized BTotal returns for periods of less than one year are not annualized. CTotal returns would have been lower if certain expenses had not been reduced during the applicable periods shown. DTotal returns do not include the effect of the contingent deferred sales charge. ECalculated based on average shares outstanding during the period. FFees and expenses of any underlying Fidelity Central Funds are not included in the Fund's expense ratio. The Fund indirectly bears its proportionate share of the expenses of any underlying Fidelity Central Funds. GAmount does not include the portfolio activity of any underlying Fidelity Central Funds. HFor the period March 18, 2014 (commencement of sale of shares) to October 31, 2014. IExpense ratios reflect operating expenses of the class. Expenses before reductions do not reflect amounts reimbursed by the investment adviser or reductions from brokerage service arrangements or reductions from other expense offset arrangements and do not represent the amount paid by the class during periods when reimbursements or reductions occur. Expenses net of fee waivers reflect expenses after reimbursement by the investment adviser but prior to reductions from brokerage service arrangements or other expense offset arrangements. Expenses net of all reductions represent the net expenses paid by the class. JThe portfolio turnover rate does not include the assets acquired in the merger. KAmount represents less than $.005 per share. |
Financial Highlights - Fidelity Europe Fund Class C
Years ended October 31, | 2015 | 2014 H |
Selected Per-Share Data | | |
Net asset value, beginning of period | $ 36.07 | $ 39.45 |
Income from Investment Operations | | |
Net investment income (loss) E | .07 | .29 |
Net realized and unrealized gain (loss) | 1.29 | (3.67) |
Total from investment operations | 1.36 | (3.38) |
Distributions from net investment income | (.62) | - |
Redemption fees added to paid in capitalE, K | - | - |
Net asset value, end of period | $ 36.81 | $ 36.07 |
Total ReturnB, C, D | 3.79% | (8.57)% |
Ratios to Average Net AssetsF, I | | |
Expenses before reductions | 2.13% | 2.10%A |
Expenses net of fee waivers, if any | 2.13% | 2.10%A |
Expenses net of all reductions | 2.11% | 2.10%A |
Net investment income (loss) | .18% | 1.19%A |
Supplemental Data | | |
Net assets, end of period (000 omitted) | $ 11,151 | $ 6,818 |
Portfolio turnover rateG | 87% | 80%J |
AAnnualized BTotal returns for periods of less than one year are not annualized. CTotal returns would have been lower if certain expenses had not been reduced during the applicable periods shown. DTotal returns do not include the effect of the contingent deferred sales charge. ECalculated based on average shares outstanding during the period. FFees and expenses of any underlying Fidelity Central Funds are not included in the Fund's expense ratio. The Fund indirectly bears its proportionate share of the expenses of any underlying Fidelity Central Funds. GAmount does not include the portfolio activity of any underlying Fidelity Central Funds. HFor the period March 18, 2014 (commencement of sale of shares) to October 31, 2014. IExpense ratios reflect operating expenses of the class. Expenses before reductions do not reflect amounts reimbursed by the investment adviser or reductions from brokerage service arrangements or reductions from other expense offset arrangements and do not represent the amount paid by the class during periods when reimbursements or reductions occur. Expenses net of fee waivers reflect expenses after reimbursement by the investment adviser but prior to reductions from brokerage service arrangements or other expense offset arrangements. Expenses net of all reductions represent the net expenses paid by the class. JThe portfolio turnover rate does not include the assets acquired in the merger. KAmount represents less than $.005 per share. |
See accompanying notes which are an integral part of the financial statements.
Annual Report
Financial Highlights - Fidelity Europe Fund
Years ended October 31, | 2015 | 2014 | 2013 | 2012 | 2011 |
Selected Per-Share Data | | | | | |
Net asset value, beginning of period | $ 36.32 | $ 37.92 | $ 30.15 | $ 27.67 | $ 30.83 |
Income from Investment Operations | | | | | |
Net investment income (loss) B | .48 | .94E | .61 | .64 | .48 |
Net realized and unrealized gain (loss) | 1.30 | (2.00) | 7.87 | 2.45 | (2.97) |
Total from investment operations | 1.78 | (1.06) | 8.48 | 3.09 | (2.49) |
Distributions from net investment income | (.91) | (.52) | (.70) | (.60) | (.67) |
Distributions from net realized gain | - | (.02) | (.01) | (.02) | - |
Total distributions | (.91) | (.54) | (.71) | (.61) I | (.67) |
Redemption fees added to paid in capitalB, H | - | - | - | - | - |
Net asset value, end of period | $ 37.19 | $ 36.32 | $ 37.92 | $ 30.15 | $ 27.67 |
Total Return A | 4.97% | (2.82)% | 28.71% | 11.53% | (8.32)% |
Ratios to Average Net AssetsC, F | | | | | |
Expenses before reductions | 1.03% | .97% | 1.06% | .83% | 1.10% |
Expenses net of fee waivers, if any | 1.03% | .97% | 1.05% | .83% | 1.10% |
Expenses net of all reductions | 1.01% | .96% | 1.02% | .80% | 1.06% |
Net investment income (loss) | 1.28% | 2.43%E | 1.82% | 2.33% | 1.56% |
Supplemental Data | | | | | |
Net assets, end of period (000 omitted) | $ 1,384,134 | $ 1,237,047 | $ 957,048 | $ 602,520 | $ 621,778 |
Portfolio turnover rateD | 87% | 80%G | 59% | 127% | 117% |
ATotal returns would have been lower if certain expenses had not been reduced during the applicable periods shown. BCalculated based on average shares outstanding during the period. CFees and expenses of any underlying Fidelity Central Funds are not included in the Fund's expense ratio. The Fund indirectly bears its proportionate share of the expenses of any underlying Fidelity Central Funds. DAmount does not include the portfolio activity of any underlying Fidelity Central Funds. EInvestment income per share reflects a large, non-recurring dividend which amounted to $.19 per share. Excluding this non-recurring dividend, the ratio of net investment income (loss) to average net assets would have been 1.93%. FExpense ratios reflect operating expenses of the class. Expenses before reductions do not reflect amounts reimbursed by the investment adviser or reductions from brokerage service arrangements or reductions from other expense offset arrangements and do not represent the amount paid by the class during periods when reimbursements or reductions occur. Expenses net of fee waivers reflect expenses after reimbursement by the investment adviser but prior to reductions from brokerage service arrangements or other expense offset arrangements. Expenses net of all reductions represent the net expenses paid by the class. GThe portfolio turnover rate does not include the assets acquired in the merger. HAmount represents less than $.005 per share. ITotal distributions of $.61 per share is comprised of distributions from net investment income of $.595 and distributions from net realized gain of $.017 per share. |
Financial Highlights - Fidelity Europe Fund Class I
Years ended October 31, | 2015 | 2014 G |
Selected Per-Share Data | | |
Net asset value, beginning of period | $ 36.32 | $ 39.45 |
Income from Investment Operations | | |
Net investment income (loss) D | .50 | .56 |
Net realized and unrealized gain (loss) | 1.30 | (3.69) |
Total from investment operations | 1.80 | (3.13) |
Distributions from net investment income | (.91) | - |
Redemption fees added to paid in capitalD, J | - | - |
Net asset value, end of period | $ 37.21 | $ 36.32 |
Total ReturnB, C | 5.02% | (7.93)% |
Ratios to Average Net AssetsE, H | | |
Expenses before reductions | .98% | .97%A |
Expenses net of fee waivers, if any | .98% | .97%A |
Expenses net of all reductions | .96% | .96%A |
Net investment income (loss) | 1.33% | 2.33%A |
Supplemental Data | | |
Net assets, end of period (000 omitted) | $ 6,552 | $ 5,666 |
Portfolio turnover rateF | 87% | 80%I |
AAnnualized BTotal returns for periods of less than one year are not annualized. CTotal returns would have been lower if certain expenses had not been reduced during the applicable periods shown. DCalculated based on average shares outstanding during the period. EFees and expenses of any underlying Fidelity Central Funds are not included in the Fund's expense ratio. The Fund indirectly bears its proportionate share of the expenses of any underlying Fidelity Central Funds. FAmount does not include the portfolio activity of any underlying Fidelity Central Funds. GFor the period March 18, 2014 (commencement of sale of shares) to October 31, 2014. HExpense ratios reflect operating expenses of the class. Expenses before reductions do not reflect amounts reimbursed by the investment adviser or reductions from brokerage service arrangements or reductions from other expense offset arrangements and do not represent the amount paid by the class during periods when reimbursements or reductions occur. Expenses net of fee waivers reflect expenses after reimbursement by the investment adviser but prior to reductions from brokerage service arrangements or other expense offset arrangements. Expenses net of all reductions represent the net expenses paid by the class. IThe portfolio turnover rate does not include the assets acquired in the merger. JAmount represents less than $.005 per share. |
See accompanying notes which are an integral part of the financial statements.
Annual Report
For the period ended October 31, 2015
1. Organization.
Fidelity Europe Fund (the Fund) is a fund of Fidelity Investment Trust (the Trust) and is authorized to issue an unlimited number of shares. The Trust is registered under the Investment Company Act of 1940, as amended (the 1940 Act), as an open-end management investment company organized as a Massachusetts business trust. The Fund offers Class A, Class T, Class C, Europe and Class I (formerly Institutional Class) shares, each of which, along with Class B shares, has equal rights as to assets and voting privileges. Class B shares are closed to new accounts and additional purchases, except for exchanges and reinvestments. Each class has exclusive voting rights with respect to matters that affect that class. Class B shares will automatically convert to class A shares after a holding period of seven years from the initial date of purchase.
2. Investments in Fidelity Central Funds.
The Fund invests in Fidelity Central Funds, which are open-end investment companies generally available only to other investment companies and accounts managed by the investment adviser and its affiliates. The Fund's Schedule of Investments lists each of the Fidelity Central Funds held as of period end, if any, as an investment of the Fund, but does not include the underlying holdings of each Fidelity Central Fund. As an Investing Fund, the Fund indirectly bears its proportionate share of the expenses of the underlying Fidelity Central Funds.
The Money Market Central Funds seek preservation of capital and current income and are managed by Fidelity Investments Money Management, Inc. (FIMM), an affiliate of the investment adviser. Annualized expenses of the Money Market Central Funds as of their most recent shareholder report date are less than .005%.
A complete unaudited list of holdings for each Fidelity Central Fund is available upon request or at the Securities and Exchange Commission (the SEC) website at www.sec.gov. In addition, the financial statements of the Fidelity Central Funds, which are not covered by the Fund's Report of Independent Registered Public Accounting Firm, are available on the SEC website or upon request.
3. Significant Accounting Policies.
The financial statements have been prepared in conformity with accounting principles generally accepted in the United States of America (GAAP), which require management to make certain estimates and assumptions at the date of the financial statements. Actual results could differ from those estimates. Subsequent events, if any, through the date that the financial statements were issued have been evaluated in the preparation of the financial statements. The following summarizes the significant accounting policies of the Fund:
Investment Valuation. Investments are valued as of 4:00 p.m. Eastern time on the last calendar day of the period. The Board of Trustees (the Board) has delegated the day to day responsibility for the valuation of the Fund's investments to the Fidelity Management & Research Company (FMR) Fair Value Committee (the Committee). In accordance with valuation policies and procedures approved by the Board, the Fund attempts to obtain prices from one or more third party pricing vendors or brokers to value its investments. When current market prices, quotations or currency exchange rates are not readily available or reliable, investments will be fair valued in good faith by the Committee, in accordance with procedures adopted by the Board. Factors used in determining fair value vary by investment type and may include market or investment specific events. The frequency with which these procedures are used cannot be predicted and they may be utilized to a significant extent. The Committee oversees the Fund's valuation policies and procedures and reports to the Board on the Committee's activities and fair value determinations. The Board monitors the appropriateness of the procedures used in valuing the Fund's investments and ratifies the fair value determinations of the Committee.
The Fund categorizes the inputs to valuation techniques used to value its investments into a disclosure hierarchy consisting of three levels as shown below:
Level 1 - quoted prices in active markets for identical investments
Level 2 - other significant observable inputs (including quoted prices for similar investments, interest rates, prepayment speeds, etc.)
Level 3 - unobservable inputs (including the Fund's own assumptions based on the best information available)
Valuation techniques used to value the Fund's investments by major category are as follows:
Equity securities, including restricted securities, for which market quotations are readily available, are valued at the last reported sale price or official closing price as reported by a third party pricing vendor on the primary market or exchange on which they are traded and are categorized as Level 1 in the hierarchy. In the event there were no sales during the day or closing prices are not available, securities are valued at the last quoted bid price or may be valued using the last available price and are generally categorized as Level 2 in the hierarchy. For foreign equity securities, when market or security specific events arise, comparisons to the valuation of American Depositary Receipts (ADRs), futures contracts, Exchange-Traded Funds (ETFs) and certain indexes as well as quoted prices for similar securities may be used and would be categorized as Level 2 in the hierarchy. Utilizing these techniques may result in transfers between Level 1 and Level 2. For equity securities, including restricted securities, where observable inputs are limited, assumptions about market activity and risk are used and these securities may be categorized as Level 3 in the hierarchy.
Annual Report
3. Significant Accounting Policies - continued
Investment Valuation - continued
Investments in open-end mutual funds, including the Fidelity Central Funds, are valued at their closing net asset value (NAV) each business day and are categorized as Level 1 in the hierarchy.
Changes in valuation techniques may result in transfers in or out of an assigned level within the disclosure hierarchy. The aggregate value of investments by input level as of October 31, 2015, including information on transfers between Levels 1 and 2, is included at the end of the Fund's Schedule of Investments.
Foreign Currency. The Fund may use foreign currency contracts to facilitate transactions in foreign-denominated securities. Gains and losses from these transactions may arise from changes in the value of the foreign currency or if the counterparties do not perform under the contracts' terms.
Foreign-denominated assets, including investment securities, and liabilities are translated into U.S. dollars at the exchange rates at period end. Purchases and sales of investment securities, income and dividends received and expenses denominated in foreign currencies are translated into U.S. dollars at the exchange rate in effect on the transaction date.
The effects of exchange rate fluctuations on investments are included with the net realized and unrealized gain (loss) on investment securities. Other foreign currency transactions resulting in realized and unrealized gain (loss) are disclosed separately.
Investment Transactions and Income. For financial reporting purposes, the Fund's investment holdings and NAV include trades executed through the end of the last business day of the period. The NAV per share for processing shareholder transactions is calculated as of the close of business of the New York Stock Exchange (NYSE), normally 4:00 p.m. Eastern time and includes trades executed through the end of the prior business day. Gains and losses on securities sold are determined on the basis of identified cost and may include proceeds received from litigation. Dividend income is recorded on the ex-dividend date, except for certain dividends from foreign securities where the ex-dividend date may have passed, which are recorded as soon as the Fund is informed of the ex-dividend date. Non-cash dividends included in dividend income, if any, are recorded at the fair market value of the securities received. Income and capital gain distributions from Fidelity Central Funds, if any, are recorded on the ex-dividend date. Interest income is accrued as earned and includes coupon interest and amortization of premium and accretion of discount on debt securities as applicable. Investment income is recorded net of foreign taxes withheld where recovery of such taxes is uncertain.
Class Allocations and Expenses. Investment income, realized and unrealized capital gains and losses, common expenses of the Fund, and certain fund-level expense reductions, if any, are allocated daily on a pro-rata basis to each class based on the relative net assets of each class to the total net assets of the Fund. Each class differs with respect to transfer agent and distribution and service plan fees incurred. Certain expense reductions may also differ by class. For the reporting period, the allocated portion of income and expenses to each class as a percent of its average net assets may vary due to the timing of recording these transactions in relation to fluctuating net assets of the classes. Expenses directly attributable to a fund are charged to that fund. Expenses attributable to more than one fund are allocated among the respective funds on the basis of relative net assets or other appropriate methods. Expense estimates are accrued in the period to which they relate and adjustments are made when actual amounts are known.
Income Tax Information and Distributions to Shareholders. Each year, the Fund intends to qualify as a regulated investment company under Subchapter M of the Internal Revenue Code, including distributing substantially all of its taxable income and realized gains. As a result, no provision for U.S. Federal income taxes is required. As of October 31, 2015, the Fund did not have any unrecognized tax benefits in the financial statements; nor is the Fund aware of any tax positions for which it is reasonably possible that the total amounts of unrecognized tax benefits will significantly change in the next twelve months. The Fund files a U.S. federal tax return, in addition to state and local tax returns as required. The Fund's federal income tax returns are subject to examination by the Internal Revenue Service (IRS) for a period of three fiscal years after they are filed. State and local tax returns may be subject to examination for an additional fiscal year depending on the jurisdiction. Foreign taxes are provided for based on the Fund's understanding of the tax rules and rates that exist in the foreign markets in which it invests.
Distributions are declared and recorded on the ex-dividend date. Income dividends and capital gain distributions are declared separately for each class. Income and capital gain distributions are determined in accordance with income tax regulations, which may differ from GAAP.
Capital accounts within the financial statements are adjusted for permanent book-tax differences. These adjustments have no impact on net assets or the results of operations. Capital accounts are not adjusted for temporary book-tax differences which will reverse in a subsequent period.
Book-tax differences are primarily due to foreign currency transactions, passive foreign investment companies (PFIC), deferred trustees compensation, expiring capital loss carryforwards, capital loss carryforwards and losses deferred due to wash sales.
Annual Report
Notes to Financial Statements - continued
3. Significant Accounting Policies - continued
Income Tax Information and Distributions to Shareholders - continued
The federal tax cost of investment securities and unrealized appreciation (depreciation) as of period end were as follows:
Gross unrealized appreciation | $ 138,842,139 |
Gross unrealized depreciation | (83,135,977) |
Net unrealized appreciation (depreciation) on securities | $ 55,706,162 |
Tax Cost | $ 1,404,851,306 |
The tax-based components of distributable earnings as of period end were as follows:
Undistributed ordinary income | $ 21,804,337 |
Capital loss carryforward | $ (228,371,583) |
Net unrealized appreciation (depreciation) on securities and other investments | $ 55,923,345 |
Capital loss carryforwards are only available to offset future capital gains of the Fund to the extent provided by regulations and may be limited. Under the Regulated Investment Company Modernization Act of 2010 (the Act), the Fund is permitted to carry forward capital losses incurred in taxable years beginning after December 22, 2010 for an unlimited period and such capital losses are required to be used prior to any losses that expire. The capital loss carryforward information presented below, including any applicable limitation, is estimated as of fiscal period end and is subject to adjustment.
Fiscal year of expiration | |
2016 | $ (29,326,707) |
2017 | (199,044,876) |
Total capital loss carryforward | $ (228,371,583) |
The Fund acquired $27,783,139 of its capital loss carryforward as part of a merger in a prior period. The losses acquired that will be available to offset future capital gains of the Fund will be limited to approximately $13,187,073 per year.
In addition, due to large redemptions in a prior period, $199,044,876 of capital losses that existed in the Fund prior to the mergers will be limited to approximately $32,029,274 per year.
The tax character of distributions paid was as follows:
| October 31, 2015 | October 31, 2014 |
Ordinary Income | $ 31,603,696 | $ 13,885,066 |
Short-Term Trading (Redemption) Fees. Shares held by investors in the Fund less than 30 days may have been subject to a redemption fee equal to 1.00% of the NAV of shares redeemed. All redemption fees, which reduce the proceeds of the shareholder redemption, are retained by the Fund and accounted for as an addition to paid in capital.
Delayed Delivery Transactions and When-Issued Securities. During the period, the Fund transacted in securities on a delayed delivery or when-issued basis. Payment and delivery may take place after the customary settlement period for that security. The price of the underlying securities and the date when the securities will be delivered and paid for are fixed at the time the transaction is negotiated. The securities purchased on a delayed delivery or when-issued basis are identified as such in the Fund's Schedule of Investments. With respect to purchase commitments, the Fund identifies securities as segregated in its records with a value at least equal to the amount of the commitment. Losses may arise due to changes in the value of the underlying securities or if the counterparty does not perform under the contract's terms, or if the issuer does not issue the securities due to political, economic, or other factors.
Restricted Securities. The Fund may invest in securities that are subject to legal or contractual restrictions on resale. These securities generally may be resold in transactions exempt from registration or to the public if the securities are registered. Disposal of these securities may involve time-consuming negotiations and expense, and prompt sale at an acceptable price may be difficult. Information regarding restricted securities is included at the end of the Fund's Schedule of Investments.
4. Purchases and Sales of Investments.
Purchases and sales of securities, other than short-term securities, aggregated $1,313,859,833 and $1,189,248,991, respectively.
Annual Report
5. Fees and Other Transactions with Affiliates.
Management Fee. Fidelity Management & Research Company (the investment adviser) and its affiliates provide the Fund with investment management related services for which the Fund pays a monthly management fee. The management fee is the sum of an individual fund fee rate that is based on an annual rate of .45% of the Fund's average net assets and an annualized group fee rate that averaged .25% during the period. The group fee rate is based upon the average net assets of all the mutual funds advised by the investment adviser, including any mutual funds previously advised by the investment adviser that are currently advised by Fidelity SelectCo, LLC, an affiliate of the investment adviser. The group fee rate decreases as assets under management increase and increases as assets under management decrease. In addition, the management fee is subject to a performance adjustment (up to a maximum of ± .20% of the Fund's average net assets over a 36 month performance period). The upward or downward adjustment to the management fee is based on the relative investment performance of Europe as compared to its benchmark index, the MSCI Europe Index, over the same 36 month performance period. For the reporting period, the total annual management fee rate, including the performance adjustment, was .78% of the Fund's average net assets. The performance adjustment included in the management fee rate may be higher or lower than the maximum performance adjustment rate due to the difference between the average net assets for the reporting and performance periods.
Distribution and Service Plan Fees. In accordance with Rule 12b-1 of the 1940 Act, the Fund has adopted separate Distribution and Service Plans for each class of shares. Certain classes pay Fidelity Distributors Corporation (FDC), an affiliate of the investment adviser, separate Distribution and Service Fees, each of which is based on an annual percentage of each class' average net assets. In addition, FDC may pay financial intermediaries for selling shares of the Fund and providing shareholder support services. For the period, the Distribution and Service Fee rates, total fees and amounts retained by FDC were as follows:
| Distribution
Fee | Service
Fee | Total Fees | Retained
by FDC |
Class A | -% | .25% | $ 66,329 | $ 2,913 |
Class T | .25% | .25% | 66,616 | 328 |
Class B | .75% | .25% | 8,617 | 6,637 |
Class C | .75% | .25% | 88,745 | 29,623 |
| | | $ 230,307 | $ 39,501 |
Sales Load. FDC may receive a front-end sales charge of up to 5.75% for selling Class A shares and 3.50% for selling Class T shares, some of which is paid to financial intermediaries for selling shares of the Fund. Depending on the holding period, FDC may receive contingent deferred sales charges levied on Class A, Class T, Class B, and Class C redemptions. The deferred sales charges range from 5.00% to 1.00% for Class B shares, 1.00% for Class C shares, 1.00% for certain purchases of Class A shares and .25% for certain purchases of Class T shares.
For the period, sales charge amounts retained by FDC were as follows:
| Retained
by FDC |
Class A | $ 23,090 |
Class T | 5,193 |
Class BA | 281 |
Class C A | 6,136 |
| $ 34,700 |
A When Class B and Class C shares are initially sold, FDC pays commissions from its own resources to financial intermediaries through which the sales are made.
Transfer Agent Fees. Fidelity Investments Institutional Operations Company, Inc., (FIIOC), an affiliate of the investment adviser, is the transfer, dividend disbursing and shareholder servicing agent for each class of the Fund. FIIOC receives account fees and asset-based fees that vary according to the account size and type of account of the shareholders of the respective classes of the Fund. FIIOC pays for typesetting, printing and mailing of shareholder reports, except proxy statements.
For the period, transfer agent fees for each class were as follows:
| Amount | % of
Class-Level Average
Net Assets |
Class A | $ 60,801 | .23 |
Class T | 35,189 | .26 |
Class B | 2,566 | .30 |
Class C | 25,900 | .29 |
Europe | 2,522,706 | .19 |
Class I | 8,376 | .13 |
| $ 2,655,538 | |
Annual Report
Notes to Financial Statements - continued
5. Fees and Other Transactions with Affiliates - continued
Accounting and Security Lending Fees. Fidelity Service Company, Inc. (FSC), an affiliate of the investment adviser, maintains the Fund's accounting records. The accounting fee is based on the level of average net assets for each month. Under a separate contract, FSC administers the security lending program. The security lending fee is based on the number and duration of lending transactions.
Brokerage Commissions. The Fund placed a portion of its portfolio transactions with brokerage firms which are affiliates of the investment adviser. Brokerage commissions are included in net realized gain (loss) and change in net unrealized appreciation (depreciation) in the Statement of Operations. The commissions paid to these affiliated firms were $36 for the period.
Interfund Lending Program. Pursuant to an Exemptive Order issued by the SEC, the Fund, along with other registered investment companies having management contracts with FMR or other affiliated entities of FMR, may participate in an interfund lending program. This program provides an alternative credit facility allowing the funds to borrow from, or lend money to, other participating affiliated funds. At period end, there were no interfund loans outstanding. The Fund's activity in this program during the period for which loans were outstanding was as follows:
Borrower or Lender | Average Loan
Balance | Weighted Average
Interest Rate | Interest Expense |
Borrower | $ 8,546,818 | .37% | $ 963 |
6. Committed Line of Credit.
The Fund participates with other funds managed by the investment adviser or an affiliate in a $4.25 billion credit facility (the "line of credit") to be utilized for temporary or emergency purposes to fund shareholder redemptions or for other short-term liquidity purposes. The Fund has agreed to pay commitment fees on its pro-rata portion of the line of credit, which amounted to $1,988 and is reflected in Miscellaneous expenses on the Statement of Operations. During the period, the Fund did not borrow on this line of credit.
7. Security Lending.
The Fund lends portfolio securities through a lending agent from time to time in order to earn additional income. For equity securities, a lending agent is used and may loan securities to certain qualified borrowers, including Fidelity Capital Markets (FCM), a broker-dealer affiliated with the Fund. On the settlement date of the loan, the Fund receives collateral (in the form of U.S. Treasury obligations, letters of credit and/or cash) against the loaned securities and maintains collateral in an amount not less than 100% of the market value of the loaned securities during the period of the loan. The market value of the loaned securities is determined at the close of business of the Fund and any additional required collateral is delivered to the Fund on the next business day. The Fund or borrower may terminate the loan at any time, and if the borrower defaults on its obligation to return the securities loaned because of insolvency or other reasons, the Fund may apply collateral received from the borrower against the obligation. The Fund may experience delays and costs in recovering the securities loaned. Any cash collateral received is invested in the Fidelity Securities Lending Cash Central Fund. The value of loaned securities and cash collateral at period end are disclosed on the Fund's Statement of Assets and Liabilities. Security lending income represents the income earned on investing cash collateral, less rebates paid to borrowers and any lending agent fees associated with the loan, plus any premium payments received for lending certain types of securities. Security lending income is presented in the Statement of Operations as a component of income from Fidelity Central Funds. Total security lending income during the period amounted to $924,214. During the period, there were no securities loaned to FCM.
8. Expense Reductions.
Commissions paid to certain brokers with whom the investment adviser, or its affiliates, places trades on behalf of the Fund include an amount in addition to trade execution, which may be rebated back to the Fund to offset certain expenses. This amount totaled $274,757 for the period.
In addition, during the period the investment adviser reimbursed and/or waived a portion of fund-level operating expenses in the amount of $6,201 and a portion of class-level operating expenses as follows:
| Amount |
Class A | $ 87 |
Class T | 44 |
Class B | 2 |
Class C | 30 |
Europe | 28,324 |
Class I | 26 |
| $ 28,513 |
Annual Report
9. Distributions to Shareholders.
Distributions to shareholders of each class were as follows:
Years ended October 31, | 2015 | 2014 |
From net investment income | | |
Class A | $ 549,660 | $ - |
Class T | 299,142 | - |
Class B | 18,443 | - |
Class C | 108,670 | - |
Europe | 30,497,764 | 13,272,490 |
Class I | 130,017 | - |
Total | $ 31,603,696 | $ 13,272,490 |
From net realized gain | | |
Europe | $ - | $ 612,576 |
10. Share Transactions.
Share transactions for each class were as follows and may contain automatic conversions between classes or exchanges between funds:
| Shares | Dollars |
Years ended October 31, | 2015 | 2014A | 2015 | 2014A |
Class A | | | | |
Shares sold | 402,890 | 302,227 | $ 15,313,815 | $ 12,108,972 |
Issued in exchange for shares of Fidelity Advisor Europe Capital Appreciation Fund | - | 483,084 | - | 18,719,498 |
Reinvestment of distributions | 14,493 | - | 527,143 | - |
Shares redeemed | (438,670) | (133,151) | (16,388,542) | (5,066,903) |
Net increase (decrease) | (21,287) | 652,160 | $ (547,584) | $ 25,761,567 |
Class T | | | | |
Shares sold | 101,998 | 196,712 | $ 3,848,880 | $ 7,929,579 |
Issued in exchange for shares of Fidelity Advisor Europe Capital Appreciation Fund | - | 218,383 | - | 8,462,341 |
Reinvestment of distributions | 8,153 | - | 296,280 | - |
Shares redeemed | (227,511) | (36,984) | (8,571,443) | (1,400,101) |
Net increase (decrease) | (117,360) | 378,111 | $ (4,426,283) | $ 14,991,819 |
Class B | | | | |
Shares sold | 7,973 | 16,454 | $ 306,370 | $ 662,209 |
Issued in exchange for shares of Fidelity Advisor Europe Capital Appreciation Fund | - | 19,997 | - | 774,699 |
Reinvestment of distributions | 481 | - | 17,468 | - |
Shares redeemed | (23,568) | (6,913) | (877,823) | (266,573) |
Net increase (decrease) | (15,114) | 29,538 | $ (553,985) | $ 1,170,335 |
Class C | | | | |
Shares sold | 197,774 | 43,185 | $ 7,494,390 | $ 1,703,471 |
Issued in exchange for shares of Fidelity Advisor Europe Capital Appreciation Fund | - | 183,082 | - | 7,092,587 |
Reinvestment of distributions | 2,632 | - | 95,708 | - |
Shares redeemed | (86,511) | (37,236) | (3,194,278) | (1,401,102) |
Net increase (decrease) | 113,895 | 189,031 | $ 4,395,820 | $ 7,394,956 |
Europe | | | | |
Shares sold | 10,168,406 | 8,548,440 | $ 387,319,779 | $ 332,957,735 |
Issued in exchange for shares of Fidelity Europe Capital Appreciation Fund | - | 9,559,313 | - | 370,423,391 |
Reinvestment of distributions | 803,462 | 358,728 | 29,241,922 | 13,351,865 |
Shares redeemed | (7,807,853) | (9,647,960) | (290,372,067) | (370,706,278) |
Net increase (decrease) | 3,164,015 | 8,818,521 | $ 126,189,634 | $ 346,026,713 |
Class I | | | | |
Shares sold | 130,676 | 33,328 | $ 4,946,083 | $ 1,310,054 |
Issued in exchange for shares of Fidelity Advisor Europe Capital Appreciation Fund | - | 214,439 | - | 8,309,529 |
Reinvestment of distributions | 2,526 | - | 91,940 | - |
Shares redeemed | (113,122) | (91,772) | (4,289,576) | (3,497,677) |
Net increase (decrease) | 20,080 | 155,995 | $ 748,447 | $ 6,121,906 |
A Share transactions for Class A, Class T, Class B, Class C and Class I are for the period March 18, 2014 (commencement of sale of shares) to October 31, 2014.
Annual Report
Notes to Financial Statements - continued
11. Prior Fiscal Year Merger Information.
On March 21, 2014, the Fund acquired all of the assets and assumed all of the liabilities of Fidelity Europe Capital Appreciation Fund and Fidelity Advisor Europe Capital Appreciation Fund ("Target Funds") pursuant to Agreements and Plans of Reorganization approved by the Board of Trustees ("The Board") on September 18, 2013. The acquisition was accomplished by an exchange of shares of each class of the Fund for corresponding shares then outstanding of the Target Funds at their net asset value on the acquisition date. In addition, the Board approved the creation of additional classes of shares that commenced sale of shares on March 18, 2014. The reorganization provides shareholders of the Target Funds access to a larger portfolio with a similar investment objective and lower expenses. The reorganization qualified as a tax-free reorganization for federal income tax purposes with no gain or loss recognized to the funds or their shareholders. The Target Funds' net assets of $370,423,391, including securities of $369,430,411 and unrealized appreciation of $56,486,181 for Fidelity Europe Capital Appreciation Fund; and net assets of $43,358,654, including securities of $43,267,919 and unrealized appreciation of $4,301,890 for Fidelity Advisor Europe Capital Appreciation Fund; were combined with the Fund's net assets of $1,103,858,646 for total net assets after the acquisition of $1,517,640,691.
Pro forma results of operations of the combined entity for the entire period ended October 31, 2014, as though the acquisition had occurred as of the beginning of the year (rather than on the actual acquisition dates), are as follows:
Net Investment income (loss) | $ 36,003,400 |
Total net realized gain (loss) | 70,453,821 |
Total change in net unrealized appreciation (depreciation) | (148,729,606) |
Net increase (decrease) in net assets resulting from operations | $ (42,272,385) |
Because the combined investment portfolios have been managed as a single portfolio since the acquisitions were completed, it is not practicable to separate the amounts of revenue and earnings of the acquired funds that have been included in the Fund's accompanying Statement of Operations since March 21, 2014.
12. Other.
The Fund's organizational documents provide former and current trustees and officers with a limited indemnification against liabilities arising in connection with the performance of their duties to the Fund. In the normal course of business, the Fund may also enter into contracts that provide general indemnifications. The Fund's maximum exposure under these arrangements is unknown as this would be dependent on future claims that may be made against the Fund. The risk of material loss from such claims is considered remote.
Annual Report
To the Trustees of Fidelity Investment Trust and the Shareholders of Fidelity Europe Fund:
In our opinion, the accompanying statement of assets and liabilities, including the schedule of investments, and the related statements of operations and of changes in net assets and the financial highlights present fairly, in all material respects, the financial position of Fidelity Europe Fund (a fund of Fidelity Investment Trust) at October 31, 2015, the results of its operations for the year then ended, the changes in its net assets for each of the two years in the period then ended and the financial highlights for each of the periods indicated, in conformity with accounting principles generally accepted in the United States of America. These financial statements and financial highlights (hereafter referred to as "financial statements") are the responsibility of the Fidelity Europe Fund's management. Our responsibility is to express an opinion on these financial statements based on our audits. We conducted our audits of these financial statements in accordance with the standards of the Public Company Accounting Oversight Board (United States). Those standards require that we plan and perform the audit to obtain reasonable assurance about whether the financial statements are free of material misstatement. An audit includes examining, on a test basis, evidence supporting the amounts and disclosures in the financial statements, assessing the accounting principles used and significant estimates made by management, and evaluating the overall financial statement presentation. We believe that our audits, which included confirmation of securities at October 31, 2015 by correspondence with the custodian and brokers, provide a reasonable basis for our opinion.
PricewaterhouseCoopers LLP
Boston, Massachusetts
December 22, 2015
Annual Report
The Trustees, Member of the Advisory Board, and officers of the trust and fund, as applicable, are listed below. The Board of Trustees governs the fund and is responsible for protecting the interests of shareholders. The Trustees are experienced executives who meet periodically throughout the year to oversee the fund's activities, review contractual arrangements with companies that provide services to the fund, oversee management of the risks associated with such activities and contractual arrangements, and review the fund's performance. Each of the Trustees oversees 170 funds.
The Trustees hold office without limit in time except that (a) any Trustee may resign; (b) any Trustee may be removed by written instrument, signed by at least two-thirds of the number of Trustees prior to such removal; (c) any Trustee who requests to be retired or who has become incapacitated by illness or injury may be retired by written instrument signed by a majority of the other Trustees; and (d) any Trustee may be removed at any special meeting of shareholders by a two-thirds vote of the outstanding voting securities of the trust. Each Trustee who is not an interested person (as defined in the 1940 Act) of the trust and the fund (Independent Trustee), shall retire not later than the last day of the calendar year in which his or her 75th birthday occurs. The Independent Trustees may waive this mandatory retirement age policy with respect to individual Trustees. The officers and Advisory Board Member hold office without limit in time, except that any officer and Advisory Board Member may resign or may be removed by a vote of a majority of the Trustees at any regular meeting or any special meeting of the Trustees. Except as indicated, each individual has held the office shown or other offices in the same company for the past five years.
Experience, Skills, Attributes, and Qualifications of the Fund's Trustees. The Governance and Nominating Committee has adopted a statement of policy that describes the experience, qualifications, attributes, and skills that are necessary and desirable for potential Independent Trustee candidates (Statement of Policy). The Board believes that each Trustee satisfied at the time he or she was initially elected or appointed a Trustee, and continues to satisfy, the standards contemplated by the Statement of Policy. The Governance and Nominating Committee also engages professional search firms to help identify potential Independent Trustee candidates who have the experience, qualifications, attributes, and skills consistent with the Statement of Policy. From time to time, additional criteria based on the composition and skills of the current Independent Trustees, as well as experience or skills that may be appropriate in light of future changes to board composition, business conditions, and regulatory or other developments, have also been considered by the professional search firms and the Governance and Nominating Committee. In addition, the Board takes into account the Trustees' commitment and participation in Board and committee meetings, as well as their leadership of standing and ad hoc committees throughout their tenure.
In determining that a particular Trustee was and continues to be qualified to serve as a Trustee, the Board has considered a variety of criteria, none of which, in isolation, was controlling. The Board believes that, collectively, the Trustees have balanced and diverse experience, qualifications, attributes, and skills, which allow the Board to operate effectively in governing the fund and protecting the interests of shareholders. Information about the specific experience, skills, attributes, and qualifications of each Trustee, which in each case led to the Board's conclusion that the Trustee should serve (or continue to serve) as a trustee of the fund, is provided below.
Board Structure and Oversight Function. James C. Curvey is an interested person (as defined in the 1940 Act) and currently serves as Chairman. The Trustees have determined that an interested Chairman is appropriate and benefits shareholders because an interested Chairman has a personal and professional stake in the quality and continuity of services provided to the fund. Independent Trustees exercise their informed business judgment to appoint an individual of their choosing to serve as Chairman, regardless of whether the Trustee happens to be independent or a member of management. The Independent Trustees have determined that they can act independently and effectively without having an Independent Trustee serve as Chairman and that a key structural component for assuring that they are in a position to do so is for the Independent Trustees to constitute a substantial majority for the Board. The Independent Trustees also regularly meet in executive session. Ned C. Lautenbach serves as Chairman of the Independent Trustees and as such (i) acts as a liaison between the Independent Trustees and management with respect to matters important to the Independent Trustees and (ii) with management prepares agendas for Board meetings.
Fidelity funds are overseen by different Boards of Trustees. The fund's Board oversees Fidelity's high income and certain equity funds, and other Boards oversee Fidelity's investment-grade bond, money market, asset allocation, and sector funds. The asset allocation funds may invest in Fidelity funds overseen by the fund's Board. The use of separate Boards, each with its own committee structure, allows the Trustees of each group of Fidelity funds to focus on the unique issues of the funds they oversee, including common research, investment, and operational issues. On occasion, the separate Boards establish joint committees to address issues of overlapping consequences for the Fidelity funds overseen by each Board.
The Trustees operate using a system of committees to facilitate the timely and efficient consideration of all matters of importance to the Trustees, the fund, and fund shareholders and to facilitate compliance with legal and regulatory requirements and oversight of the fund's activities and associated risks. The Board, acting through its committees, has charged FMR and its affiliates with (i) identifying events or circumstances the occurrence of which could have demonstrably adverse effects on the fund's business and/or reputation; (ii) implementing processes and controls to lessen the possibility that such events or circumstances occur or to mitigate the effects of such events or circumstances if they do occur; and (iii) creating and maintaining a system designed to evaluate continuously business and market conditions in order to facilitate the identification and implementation processes described in (i) and (ii) above. Because the day-to-day operations and activities of the fund are carried out by or through FMR, its affiliates and other service providers, the fund's exposure to risks is mitigated but not eliminated by the processes overseen by the Trustees. While each of the Board's committees has responsibility for overseeing different aspects of the fund's activities, oversight is exercised primarily through the Operations, Audit, and Compliance Committees. In addition, the Independent Trustees have worked with FMR to enhance the Board's oversight of investment and financial risks, legal and regulatory risks, technology risks, and operational risks, including the development of additional risk reporting to the Board. For example, a working group comprised of Independent Trustees and FMR has worked and continues to work to review the Fidelity funds' valuation-related activities, reporting and risk management. Appropriate personnel, including but not limited to the fund's Chief Compliance Officer (CCO), FMR's internal auditor, the independent accountants, the fund's Treasurer and portfolio management personnel, make periodic reports to the Board's committees, as appropriate, including an annual review of Fidelity's risk management program for the Fidelity funds. The responsibilities of each standing committee, including their oversight responsibilities, are described further under "Standing Committees of the Fund's Trustees."
Annual Report
The fund's Statement of Additional Information (SAI) includes more information about the Trustees. To request a free copy, call Fidelity at 1-877-208-0098.
Interested Trustees*:
Correspondence intended for each Trustee who is an interested person may be sent to Fidelity Investments, 245 Summer Street, Boston, Massachusetts 02210.
Name, Year of Birth; Principal Occupations and Other Relevant Experience+ |
James C. Curvey (1935) |
Year of Election or Appointment: 2007 Trustee Chairman of the Board of Trustees |
| Mr. Curvey also serves as Trustee of other Fidelity funds. Mr. Curvey is a Director of Fidelity Research & Analysis Co. (investment adviser firm, 2009-present), and Vice Chairman (2007-present) and Director of FMR LLC (diversified financial services company). In addition, Mr. Curvey serves as an Overseer for the Boston Symphony Orchestra and a member of the board of Artis-Naples, Naples, Florida, and as a Trustee for Brewster Academy, Wolfeboro, New Hampshire. Previously, Mr. Curvey served as a Director of Fidelity Investments Money Management, Inc. (investment adviser firm, 2009-2014) and a Director of FMR and FMR Co., Inc. (investment adviser firms, 2007-2014). |
Charles S. Morrison (1960) |
Year of Election or Appointment: 2014 Trustee |
| Mr. Morrison also serves as Trustee of other funds. He serves as a Director of Fidelity Investments Money Management, Inc. (FIMM) (investment adviser firm, 2014-present), Director of Fidelity SelectCo, LLC (investment adviser firm, 2014-present), President, Asset Management (2014-present), and is an employee of Fidelity Investments. Previously, Mr. Morrison served as Vice President of Fidelity's Fixed Income and Asset Allocation Funds (2012-2014), President, Fixed Income (2011-2014), Vice President of Fidelity's Money Market Funds (2005-2009), President, Money Market Group Leader of FMR (investment adviser firm, 2009), and Senior Vice President, Money Market Group of FMR (2004-2009). Mr. Morrison also served as Vice President of Fidelity's Bond Funds (2002-2005), certain Balanced Funds (2002-2005), and certain Asset Allocation Funds (2002-2007), and as Senior Vice President (2002-2005) of Fidelity's Bond Division. |
* Trustees have been determined to be "Interested Trustees" by virtue of, among other things, their affiliation with the trust or various entities under common control with FMR.
+ The information above includes each Trustee's principal occupation during the last five years and other information relating to the experience, attributes, and skills relevant to each Trustee's qualifications to serve as a Trustee, which led to the conclusion that each Trustee should serve as a Trustee for the fund.
Annual Report
Trustees and Officers - continued
Independent Trustees:
Correspondence intended for each Independent Trustee (that is, the Trustees other than the Interested Trustees) may be sent to Fidelity Investments, P.O. Box 55235, Boston, Massachusetts 02205-5235.
Name, Year of Birth; Principal Occupations and Other Relevant Experience+ |
Dennis J. Dirks (1948) |
Year of Election or Appointment: 2005 Trustee |
| Mr. Dirks also serves as Trustee of other Fidelity funds. Prior to his retirement in May 2003, Mr. Dirks was Chief Operating Officer and a member of the Board of The Depository Trust & Clearing Corporation (DTCC). He also served as President, Chief Operating Officer, and Board member of The Depository Trust Company (DTC) and President and Board member of the National Securities Clearing Corporation (NSCC). In addition, Mr. Dirks served as Chief Executive Officer and Board member of the Government Securities Clearing Corporation, Chief Executive Officer and Board member of the Mortgage-Backed Securities Clearing Corporation, as a Trustee and a member of the Finance Committee of Manhattan College (2005-2008), as a Trustee and a member of the Finance Committee of AHRC of Nassau County (2006-2008), and as a member of the Independent Directors Council (IDC) Governing Council (2010-2015). Mr. Dirks is a member of the Board of Directors for The Brookville Center for Children's Services, Inc. (2009-present). |
Alan J. Lacy (1953) |
Year of Election or Appointment: 2008 Trustee |
| Mr. Lacy also serves as Trustee of other Fidelity funds. Mr. Lacy serves as a member of the Board of Directors of Dave & Buster's Entertainment, Inc. (restaurant and entertainment complexes, 2010-present) and Bristol-Myers Squibb Company (global pharmaceuticals, 2008-present). In addition, Mr. Lacy served as Senior Adviser (2007-2014) of Oak Hill Capital Partners, L.P. (private equity) and also served as Chief Executive Officer (2000-2005) and Vice Chairman (2005-2006) of Sears Holdings Corporation and Sears, Roebuck and Co. (retail). Mr. Lacy is a member of the Board of Trustees of The National Parks Conservation Association (2006-present). Previously, Mr. Lacy served as Chairman of the Board of Trustees of the National Parks Conservation Association (2008-2011) and as a member of the Board of Directors for The Western Union Company (global money transfer, 2006-2011), The Hillman Companies, Inc. (hardware wholesalers, 2010-2014), and Earth Fare, Inc. (retail grocery, 2010-2014). |
Ned C. Lautenbach (1944) |
Year of Election or Appointment: 2000 Trustee Chairman of the Independent Trustees |
| Mr. Lautenbach also serves as Trustee of other Fidelity funds. Mr. Lautenbach currently serves as the Lead Director of the Eaton Corporation Board of Directors (diversified industrial, 1997-present). Mr. Lautenbach is Chairman of the Board of Directors of Artis-Naples in Naples, Florida (2012-present), a member of the Council on Foreign Relations (1994-present), and a member of the Board of Governors, State University System of Florida (2013-present). Previously, Mr. Lautenbach was a Partner/Advisory Partner at Clayton, Dubilier & Rice, LLC (private equity investment, 1998-2010), as well as a Director of Sony Corporation (2006-2007). |
Joseph Mauriello (1944) |
Year of Election or Appointment: 2008 Trustee |
| Mr. Mauriello also serves as Trustee of other Fidelity funds. Prior to his retirement in January 2006, Mr. Mauriello served in numerous senior management positions including Deputy Chairman and Chief Operating Officer (2004-2005), and Vice Chairman of Financial Services (2002-2004) of KPMG LLP US (professional services, 1965-2005). Mr. Mauriello currently serves as a member of the Board of Directors of XL Group plc. (global insurance and re-insurance, 2006-present) and the Independent Directors Council (IDC) Governing Council (2015-present). Previously, Mr. Mauriello served as a Director of the Hamilton Funds of the Bank of New York (2006-2007) and of Arcadia Resources Inc. (health care services and products, 2007-2012). |
Robert W. Selander (1950) |
Year of Election or Appointment: 2011 Trustee |
| Mr. Selander also serves as Trustee of other Fidelity funds. Mr. Selander serves as a Director of The Western Union Company (global money transfer, 2014-present). Previously, Mr. Selander served as a Member of the Advisory Board of other Fidelity funds (2011), and Executive Vice Chairman (2010), Chief Executive Officer (2009-2010), and President and Chief Executive Officer (1997-2009) of Mastercard, Inc. |
Cornelia M. Small (1944) |
Year of Election or Appointment: 2005 Trustee |
| Ms. Small also serves as Trustee of other Fidelity funds. Ms. Small is a member of the Board of Directors (2009-present) and Chair of the Investment Committee (2010-present) of the Teagle Foundation. Ms. Small also serves on the Investment Committee of the Berkshire Taconic Community Foundation (2008-present). Previously, Ms. Small served as Chairperson (2002-2008) and a member of the Investment Committee and Chairperson (2008-2012) and a member of the Board of Trustees of Smith College. In addition, Ms. Small served as Chief Investment Officer, Director of Global Equity Investments, and a member of the Board of Directors of Scudder, Stevens & Clark and Scudder Kemper Investments. |
William S. Stavropoulos (1939) |
Year of Election or Appointment: 2001 Trustee Vice Chairman of the Independent Trustees |
| Mr. Stavropoulos also serves as Trustee of other Fidelity funds. Mr. Stavropoulos serves as President and Founder of the Michigan Baseball Foundation, the Great Lakes Loons (2007-present). Mr. Stavropoulos is Chairman Emeritus of the Board of Directors of The Dow Chemical Company, where he previously served in numerous senior management positions, including President, CEO (1995-2000; 2002-2004), Chairman of the Executive Committee (2000-2006), and as a member of the Board of Directors (1990-2006). Currently, Mr. Stavropoulos is Chairman of the Board of Directors of Univar Inc. (global distributor of commodity and specialty chemicals), a Director of Teradata Corporation (data warehousing and technology solutions), and Maersk Inc. (industrial conglomerate), and a member of the Advisory Board for Metalmark Capital LLC (private equity investment, 2005-present). Mr. Stavropoulos is an operating advisor to Clayton, Dubilier & Rice, LLC (private equity investment). In addition, Mr. Stavropoulos is a member of the University of Notre Dame Advisory Council for the College of Science, a Trustee of the Rollin L. Gerstacker Foundation, and a Director of the Naples Philharmonic Center for the Arts. Previously, Mr. Stavropoulos served as a Director of Chemical Financial Corporation (bank holding company, 1993-2012) and Tyco International, Ltd. (multinational manufacturing and services, 2007-2012). |
David M. Thomas (1949) |
Year of Election or Appointment: 2008 Trustee |
| Mr. Thomas also serves as Trustee of other Fidelity funds. Mr. Thomas serves as Non-Executive Chairman of the Board of Directors of Fortune Brands Home and Security (home and security products, 2011-present), as a member of the Board of Directors (2004-present) and Presiding Director (2013-present) of Interpublic Group of Companies, Inc. (marketing communication), and as a member of the Board of Trustees of the University of Florida (2013-present). Previously, Mr. Thomas served as Executive Chairman (2005-2006) and Chairman and Chief Executive Officer (2000-2005) of IMS Health, Inc. (pharmaceutical and healthcare information solutions), and a Director of Fortune Brands, Inc. (consumer products, 2000-2011). |
+ The information above includes each Trustee's principal occupation during the last five years and other information relating to the experience, attributes, and skills relevant to each Trustee's qualifications to serve as a Trustee, which led to the conclusion that each Trustee should serve as a Trustee for the fund.
Advisory Board Member and Officers:
Correspondence intended for each officer and Peter S. Lynch may be sent to Fidelity Investments, 245 Summer Street, Boston, Massachusetts 02210. Officers appear below in alphabetical order.
Name, Year of Birth; Principal Occupation |
Peter S. Lynch (1944) |
Year of Election or Appointment: 2003 Member of the Advisory Board |
| Mr. Lynch also serves as Member of the Advisory Board of other Fidelity funds. Mr. Lynch is Vice Chairman and a Director of FMR (investment adviser firm) and FMR Co., Inc. (investment adviser firm). In addition, Mr. Lynch serves as a Trustee of Boston College and as the Chairman of the Inner-City Scholarship Fund. Previously, Mr. Lynch served on the Special Olympics International Board of Directors (1997-2006). |
Elizabeth Paige Baumann (1968) |
Year of Election or Appointment: 2012 Anti-Money Laundering (AML) Officer |
| Ms. Baumann also serves as AML Officer of other funds. She is Chief AML Officer of FMR LLC (diversified financial services company, 2012-present) and is an employee of Fidelity Investments. Previously, Ms. Baumann served as Vice President and Deputy Anti-Money Laundering Officer (2007-2012). |
Marc R. Bryant (1966) |
Year of Election or Appointment: 2015 Secretary and Chief Legal Officer (CLO) |
| Mr. Bryant also serves as Secretary and CLO of other funds. Mr. Bryant serves as CLO, Secretary, and Senior Vice President of Fidelity Management & Research Company (investment adviser firm, 2015-present) and FMR Co., Inc. (investment adviser firm, 2015-present); Secretary of Fidelity SelectCo, LLC (investment adviser firm, 2015-present) and Fidelity Investments Money Management, Inc. (investment adviser firm, 2015-present); and CLO of Fidelity Management & Research (Hong Kong) Limited (investment adviser firm, 2015-present). He is Senior Vice President and Deputy General Counsel of FMR LLC (diversified financial services company). Previously, Mr. Bryant served as Secretary and Chief Legal Officer of Fidelity Rutland Square Trust II (2010-2014) and Assistant Secretary of Fidelity's Fixed Income and Asset Allocation Funds (2013-2015). Prior to joining Fidelity Investments, Mr. Bryant served as a Senior Vice President and the Head of Global Retail Legal for AllianceBernstein L.P. (2006-2010), and as the General Counsel for ProFund Advisors LLC (2001-2006). |
William C. Coffey (1969) |
Year of Election or Appointment: 2009 Assistant Secretary |
| Mr. Coffey also serves as Assistant Secretary of other funds. He is Senior Vice President and Deputy General Counsel of FMR LLC (diversified financial services company, 2010-present), and is an employee of Fidelity Investments. Previously, Mr. Coffey served as Vice President and Associate General Counsel of FMR LLC (2005-2009). |
Timothy M. Cohen (1969) |
Year of Election or Appointment: 2014 Vice President of certain Equity Funds |
| Mr. Cohen also serves as Vice President of other funds. Mr. Cohen serves as Chief Compliance Officer of FMR Investment Management (U.K.) Limited (investment adviser firm, 2013-present) and is an employee of Fidelity Investments. Previously, Mr. Cohen served as a Director of FMR Investment Management (U.K.) Limited (2013-2015). |
Jonathan Davis (1968) |
Year of Election or Appointment: 2010 Assistant Treasurer |
| Mr. Davis also serves as Assistant Treasurer of other funds, and is an employee of Fidelity Investments. Previously, Mr. Davis served as Vice President and Associate General Counsel of FMR LLC (diversified financial services company, 2003-2010). |
Adrien E. Deberghes (1967) |
Year of Election or Appointment: 2008 Deputy Treasurer |
| Mr. Deberghes also serves as an officer of other funds. He is an employee of Fidelity Investments (2008-present). Prior to joining Fidelity Investments, Mr. Deberghes was Senior Vice President of Mutual Fund Administration at State Street Corporation (2007-2008), Senior Director of Mutual Fund Administration at Investors Bank & Trust (2005-2007), and Director of Finance for Dunkin' Brands (2000-2005). |
Stephanie J. Dorsey (1969) |
Year of Election or Appointment: 2010 Assistant Treasurer |
| Ms. Dorsey also serves as an officer of other funds. She is an employee of Fidelity Investments (2008-present) and has served in other fund officer roles. Prior to joining Fidelity Investments, Ms. Dorsey served as Treasurer (2004-2008) of the JPMorgan Mutual Funds and Vice President (2004-2008) of JPMorgan Chase Bank. |
Howard J. Galligan III (1966) |
Year of Election or Appointment: 2014 Chief Financial Officer |
| Mr. Galligan also serves as Chief Financial Officer of other funds. Mr. Galligan serves as President of Fidelity Pricing and Cash Management Services (FPCMS) (2014-present) and as a Director of Strategic Advisers, Inc. (investment adviser firm, 2008-present). Previously, Mr. Galligan served as Chief Administrative Officer of Asset Management (2011-2014) and Chief Operating Officer and Senior Vice President of Investment Support for Strategic Advisers, Inc. (2003-2011). |
Scott C. Goebel (1968) |
Year of Election or Appointment: 2015 Vice President |
| Mr. Goebel serves as Vice President of other funds and is an employee of Fidelity Investments (2001-present). Previously, Mr. Goebel served as Secretary of Fidelity SelectCo, LLC (investment adviser firm, 2013-2015), Fidelity Investments Money Management, Inc. (FIMM) (investment adviser firm, 2010-2015), and Fidelity Research and Analysis Company (FRAC) (investment adviser firm, 2010-2015); General Counsel, Secretary, and Senior Vice President of Fidelity Management & Research Company (investment adviser firm, 2008-2015) and FMR Co., Inc. (investment adviser firm, 2008-2015); Assistant Secretary of Fidelity Management & Research (Japan) Limited (investment adviser firm, 2008-2015) and FMR Investment Management (U.K.) Limited (investment adviser firm, 2008-2015); Chief Legal Officer (CLO) of Fidelity Management & Research (Hong Kong) Limited (investment adviser firm, 2008-2015); Secretary and CLO of certain Fidelity funds (2008-2015); Assistant Secretary of FIMM (2008-2010), FRAC (2008-2010), and certain funds (2007-2008); and as Vice President and Secretary of Fidelity Distributors Corporation (FDC) (2005-2007). |
Brian B. Hogan (1964) |
Year of Election or Appointment: 2009 Vice President |
| Mr. Hogan also serves as Trustee or Vice President of other funds. Mr. Hogan serves as a Director of Fidelity SelectCo, LLC (investment adviser firm, 2014-present) and President of the Equity Division of FMR (investment adviser firm, 2009-present). Previously, Mr. Hogan served as Senior Vice President, Equity Research of FMR (2006-2009) and as a portfolio manager. |
Chris Maher (1972) |
Year of Election or Appointment: 2013 Assistant Treasurer |
| Mr. Maher serves as Assistant Treasurer of other funds. Mr. Maher is Vice President of Valuation Oversight and is an employee of Fidelity Investments. Previously, Mr. Maher served as Vice President of Asset Management Compliance (2013), Vice President of the Program Management Group of FMR (investment adviser firm, 2010-2013), and Vice President of Valuation Oversight (2008-2010). |
Kenneth B. Robins (1969) |
Year of Election or Appointment: 2008 President and Treasurer |
| Mr. Robins also serves as an officer of other funds. Mr. Robins serves as Executive Vice President of Fidelity Investments Money Management, Inc. (FIMM) (investment adviser firm, 2013-present) and is an employee of Fidelity Investments (2004-present). Previously, Mr. Robins served in other fund officer roles. |
Stacie M. Smith (1974) |
Year of Election or Appointment: 2013 Deputy Treasurer |
| Ms. Smith also serves as an officer of other funds. She is an employee of Fidelity Investments (2009-present) and has served in other fund officer roles. Prior to joining Fidelity Investments, Ms. Smith served as Senior Audit Manager of Ernst & Young LLP (1996-2009). |
Renee Stagnone (1975) |
Year of Election or Appointment: 2013 Deputy Treasurer |
| Ms. Stagnone also serves as Deputy Treasurer of other funds. Ms. Stagnone is an employee of Fidelity Investments (1997-present). |
Linda J. Wondrack (1964) |
Year of Election or Appointment: 2014 Chief Compliance Officer |
| Ms. Wondrack also serves as Chief Compliance Officer of other funds. Ms. Wondrack is Executive Vice President and head of the Ethics Office and Asset Management Compliance for Fidelity Investments (2012-present). Ms. Wondrack also serves as Chief Compliance Officer of Fidelity SelectCo, LLC (investment adviser firm, 2014-present); Chief Compliance Officer of Impresa Management LLC (2013-present); and Chief Compliance Officer of FMR Co., Inc. (investment adviser firm), Fidelity Investments Money Management, Inc. (investment adviser firm), Fidelity Management & Research (Japan) Limited (investment adviser firm), FMR Investment Management (U.K.) Limited (investment adviser firm), Fidelity Management & Research (Hong Kong) (investment adviser firm), Fidelity Management & Research Company (investment adviser firm), FIAM LLC (investment adviser firm), and Strategic Advisers, Inc. (investment adviser firm), Ballyrock Investment Advisors LLC, and Northern Neck Investors LLC (2012-present). Previously, Ms. Wondrack served as Senior Vice President and Chief Compliance Officer for Columbia Management Investment Advisers, LLC (2005-2012); Chief Compliance Officer for certain funds within the Columbia Family of Funds (2007-2012); and Senior Vice President of Compliance Risk Management at Bank of America (2005-2010). |
Joseph F. Zambello (1957) |
Year of Election or Appointment: 2011 Deputy Treasurer |
| Mr. Zambello also serves as Deputy Treasurer of other funds. Mr. Zambello is an employee of Fidelity Investments (1991-present). Previously, Mr. Zambello served as Vice President of the Program Management Group of FMR (investment adviser firm, 2009-2011) and Vice President of the Transfer Agent Oversight Group (2005-2009). |
Annual Report
The Board of Trustees of Fidelity Europe Fund voted to pay to shareholders of record at the opening of business on record date, the following distributions per share derived from capital gains realized from sales of portfolio securities, and dividends derived from net investment income:
| Pay Date | Record Date | Dividends | Capital Gains |
Class I | 12/07/15 | 12/04/15 | $0.447 | $0.154 |
Class I designates 1% of the dividends distributed during the fiscal year as qualifying for the dividends-received deduction for corporate shareholders.
Class I designates 100% of the dividends distributed during the fiscal year as amounts which may be taken into account as a dividend for the purposes of the maximum rate under section 1(h)(11) of the Internal Revenue Code.
The amounts per share which represent income derived from sources within, and taxes paid to, foreign countries or possessions of the United States are as follows:
| Pay Date | Income | Taxes |
Class I | 12/08/14 | $0.9345 | $0.0715 |
| 12/29/14 | $0.048 | $0.0000 |
The fund will notify shareholders in January 2016 of amounts for use in preparing 2015 income tax returns.
Annual Report
Fidelity Europe Fund
Each year, the Board of Trustees, including the Independent Trustees (together, the Board), votes on the renewal of the management contract with Fidelity Management & Research Company (FMR) and the sub-advisory agreements (together, the Advisory Contracts) for the fund. The Board, assisted by the advice of fund counsel and Independent Trustees' counsel, requests and considers a broad range of information relevant to the renewal of the Advisory Contracts throughout the year.
The Board meets regularly and, at each of its meetings, covers an extensive agenda of topics and materials and considers factors that are relevant to its annual consideration of the renewal of the fund's Advisory Contracts, including the services and support provided to the fund and its shareholders. The Board has established various standing committees (Committees), each composed of and chaired by Independent Trustees with varying backgrounds, to which the Board has assigned specific subject matter responsibilities in order to enhance effective decision-making by the Board. The Board, acting directly and through its Committees, requests and receives information concerning the annual consideration of the renewal of the fund's Advisory Contracts. The Board also meets as needed to consider matters specifically related to the Board's annual consideration of the renewal of the Advisory Contracts. Members of the Board may also meet with trustees of other Fidelity funds through ad hoc joint committees to discuss certain matters relevant to all of the Fidelity funds.
At its July 2015 meeting, the Board unanimously determined to renew the fund's Advisory Contracts. In reaching its determination, the Board considered all factors it believed relevant, including (i) the nature, extent, and quality of the services to be provided to the fund and its shareholders (including the investment performance of the fund); (ii) the competitiveness of the fund's management fee and total expense ratio relative to peer funds; (iii) the total costs of the services to be provided by and the profits to be realized by Fidelity from its relationship with the fund; and (iv) the extent to which (if any) economies of scale exist and would be realized as the fund grows, and whether any economies of scale are appropriately shared with fund shareholders.
In considering whether to renew the Advisory Contracts for the fund, the Board reached a determination, with the assistance of fund counsel and Independent Trustees' counsel and through the exercise of its business judgment, that the renewal of the Advisory Contracts was in the best interests of the fund and its shareholders and that the compensation payable under the Advisory Contracts was fair and reasonable. The Board's decision to renew the Advisory Contracts was not based on any single factor, but rather was based on a comprehensive consideration of all the information provided to the Board at its meetings throughout the year. The Board, in reaching its determination to renew the Advisory Contracts, was aware that shareholders of the fund have a broad range of investment choices available to them, including a wide choice among funds offered by Fidelity's competitors, and that the fund's shareholders, who have the opportunity to review and weigh the disclosure provided by the fund in its prospectus and other public disclosures, have chosen to invest in this fund, which is part of the Fidelity family of funds.
Nature, Extent, and Quality of Services Provided. The Board considered Fidelity's staffing as it relates to the fund, including the backgrounds of investment personnel of Fidelity, and also considered the fund's investment objective, strategies, and related investment philosophy. The Independent Trustees also had discussions with senior management of Fidelity's investment operations and investment groups. The Board considered the structure of the portfolio manager compensation program and whether this structure provides appropriate incentives to act in the best interests of the fund. Additionally, the Board considered the portfolio managers' investments, if any, in the funds that they manage.
Resources Dedicated to Investment Management and Support Services. The Board and the Fund Oversight and Research Committees reviewed the general qualifications and capabilities of Fidelity's investment staff, including its size, education, experience, and resources, as well as Fidelity's approach to recruiting, training, managing, and compensating investment personnel. The Board noted that Fidelity has continued to increase the resources devoted to non-U.S. offices, including expansion of Fidelity's global investment organization. The Board also noted that Fidelity's analysts have extensive resources, tools and capabilities that allow them to conduct sophisticated quantitative and fundamental analysis, as well as credit analysis of issuers, counterparties and guarantors. Further, the Board considered that Fidelity's investment professionals have sufficient access to global information and data so as to provide competitive investment results over time, and that those professionals also have access to sophisticated tools that permit them to assess portfolio construction and risk and performance attribution characteristics continuously, as well as to transmit new information and research conclusions rapidly around the world. Additionally, in its deliberations, the Board considered Fidelity's trading, risk management, and compliance capabilities and resources, which are integral parts of the investment management process.
Shareholder and Administrative Services. The Board considered (i) the nature, extent, quality, and cost of advisory, administrative, and shareholder services performed by FMR, the sub-advisers (together with FMR, the Investment Advisers), and their affiliates under the Advisory Contracts and under separate agreements covering transfer agency, pricing and bookkeeping, and securities lending services for the fund; (ii) the nature and extent of the supervision of third party service providers, principally custodians and subcustodians; and (iii) the resources devoted to, and the record of compliance with, the fund's compliance policies and procedures. The Board also reviewed the allocation of fund brokerage, including allocations to brokers affiliated with the Investment Advisers, the use of brokerage commissions to pay fund expenses, and the use of "soft" commission dollars to pay for research services.
Annual Report
The Board noted that the growth of fund assets over time across the complex allows Fidelity to reinvest in the development of services designed to enhance the value or convenience of the Fidelity funds as investment vehicles. These services include 24-hour access to account information and market information through telephone representatives and over the Internet, investor education materials and asset allocation tools, and the expanded availability of Fidelity Investor Centers.
In 2014, the Board formed an ad hoc Committee on Transfer Agency Fees to review the variety of transfer agency fee structures throughout the industry and Fidelity's competitive positioning with respect to industry participants.
Investment in a Large Fund Family. The Board considered the benefits to shareholders of investing in a Fidelity fund, including the benefits of investing in a fund that is part of a large family of funds offering a variety of investment disciplines and providing a large variety of mutual fund investor services. The Board noted that Fidelity had taken, or had made recommendations that resulted in the Fidelity funds taking, a number of actions over the previous year that benefited particular funds, including (i) continuing to dedicate additional resources to investment research and to the support of the senior management team that oversees asset management; (ii) continuing efforts to enhance Fidelity's global research capabilities; (iii) launching new funds and making other enhancements to meet client needs; (iv) reducing management fees and total expenses for certain index funds and diversified international funds; (v) continuing to launch dedicated lower cost underlying funds to meet portfolio construction needs related to expanding underlying fund options for Fidelity funds of funds, specifically for the Freedom Fund product lines; (vi) rationalizing product lines and gaining increased efficiencies through fund mergers; (vii) launching active fixed-income exchange-traded funds; (viii) continuing to develop, acquire and implement systems and technology to improve services to the funds and information security and to increase efficiency; (ix) implementing investment enhancements to further strengthen Fidelity's target date product line to increase investors' probability of success in achieving their goals; (x) modifying the eligibility criteria for certain share classes to accommodate roll-over assets from employer-sponsored retirement plans; (xi) launching a new Class W of the Freedom Index Funds to attract and retain Fidelity record-kept retirement plan assets; and (xii) implementing changes to Fidelity's money market product line in response to recent money market regulatory reforms.
Investment Performance. The Board considered whether the fund has operated in accordance with its investment objective, as well as its record of compliance with its investment restrictions and its performance history. The Board noted that there was a portfolio management change for the fund in December 2013 and September 2014.
The Board took into account discussions with representatives of the Investment Advisers about fund investment performance that occur at Board meetings throughout the year. In this regard the Board noted that as part of regularly scheduled fund reviews and other reports to the Board on fund performance, the Board considers annualized return information for the fund, for different time periods, measured against a securities market index ("benchmark index") and a peer group of funds with similar objectives ("peer group"), if any. In its evaluation of fund investment performance, the Board gave particular attention to information indicating changes in performance of certain Fidelity funds for specific time periods and discussed with the Investment Advisers the reasons for any overperformance or underperformance.
In addition to reviewing absolute and relative fund performance, the Independent Trustees periodically consider the appropriateness of fund performance metrics in evaluating the results achieved. In general, the Independent Trustees believe that fund performance should be evaluated based on net performance (after fees and expenses) of both the highest performing and lowest performing fund share classes, where applicable, compared to appropriate benchmark indices, over appropriate time periods that may include full market cycles, and compared to peer groups, as applicable, over the same periods, taking into account relevant factors including the following: general market conditions; issuer-specific information; and fund cash flows and other factors.
The Independent Trustees recognize that shareholders evaluate performance on a net basis over their own holding periods, for which one-, three-, and five-year periods are often used as a proxy. For this reason, the performance information reviewed by the Board also included net cumulative calendar year total return information for the fund and an appropriate benchmark index and peer group for the most recent one-, three-, and five-year periods, as shown below. Returns are shown compared to the 25th percentile (top of box, 75% beaten) and 75th percentile (bottom of box, 25% beaten) of the peer universe. Returns of the benchmark index are "net MA," i.e., adjusted for tax withholding rates applicable to U.S.-based funds organized as Massachusetts business trusts. Class A, Class T, Class B, Class C, and Class I commenced operations after the periods shown in the chart below.
Annual Report
Board Approval of Investment Advisory Contracts and Management Fees - continued
Fidelity Europe Fund

The Board also considered that the fund's management fee is subject to upward or downward adjustment depending upon whether, and to what extent, the fund's investment performance for the performance period exceeds, or is exceeded by, a securities index, thus leading to a performance adjustment for the same period. The Board noted that the performance adjustment provides FMR with a strong economic incentive to seek to achieve superior performance for the fund's shareholders and helps to more closely align the interests of FMR and the shareholders of the fund.
Based on its review, the Board concluded that the nature, extent, and quality of services provided to the fund under the Advisory Contracts should benefit the shareholders of the fund.
Competitiveness of Management Fee and Total Expense Ratio. The Board considered the fund's management fee and total expense ratio compared to "mapped groups" of competitive funds and classes created for the purpose of facilitating the Trustees' competitive analysis of management fees and total expenses. Fidelity creates "mapped groups" by combining similar Lipper investment objective categories that have comparable investment mandates. Combining Lipper investment objective categories aids the Board's management fee and total expense ratio comparisons by broadening the competitive group used for comparison.
Management Fee. The Board considered two proprietary management fee comparisons for the 12-month periods shown in basis points (BP) in the chart below. The group of Lipper funds used by the Board for management fee comparisons is referred to below as the "Total Mapped Group." The Total Mapped Group comparison focuses on a fund's standing in terms of gross management fees before expense reimbursements or caps, and without giving effect to the fund's performance adjustment, relative to the total universe of funds with comparable investment mandates, regardless of whether their management fee structures also are comparable. Funds with comparable investment mandates offer exposure to similar types of securities. Funds with comparable management fee structures have similar management fee contractual arrangements (e.g., flat rate charged for advisory services, all-inclusive fee rate, etc.). "TMG %" represents the percentage of funds in the Total Mapped Group that had management fees that were lower than the fund's. For example, a hypothetical TMG % of 20% would mean that 80% of the funds in the Total Mapped Group had higher, and 20% had lower, management fees than the fund. The fund's actual TMG %s and the number of funds in the Total Mapped Group are in the chart below. The "Asset-Size Peer Group" (ASPG) comparison focuses on a fund's standing relative to a subset of non-Fidelity funds within the Total Mapped Group that are similar in size and management fee structure without taking into account performance adjustments, if any. For example, if a fund is in the first quartile of the ASPG, the fund's management fee ranks in the least expensive or lowest 25% of funds in the ASPG. The ASPG represents at least 15% of the funds in the Total Mapped Group with comparable asset size and management fee structures, subject to a minimum of 50 funds (or all funds in the Total Mapped Group if fewer than 50). Additional information, such as the ASPG quartile in which the fund's management fee rate ranked and the impact of the fund's performance adjustment, is also included in the chart and considered by the Board.
Annual Report
Fidelity Europe Fund
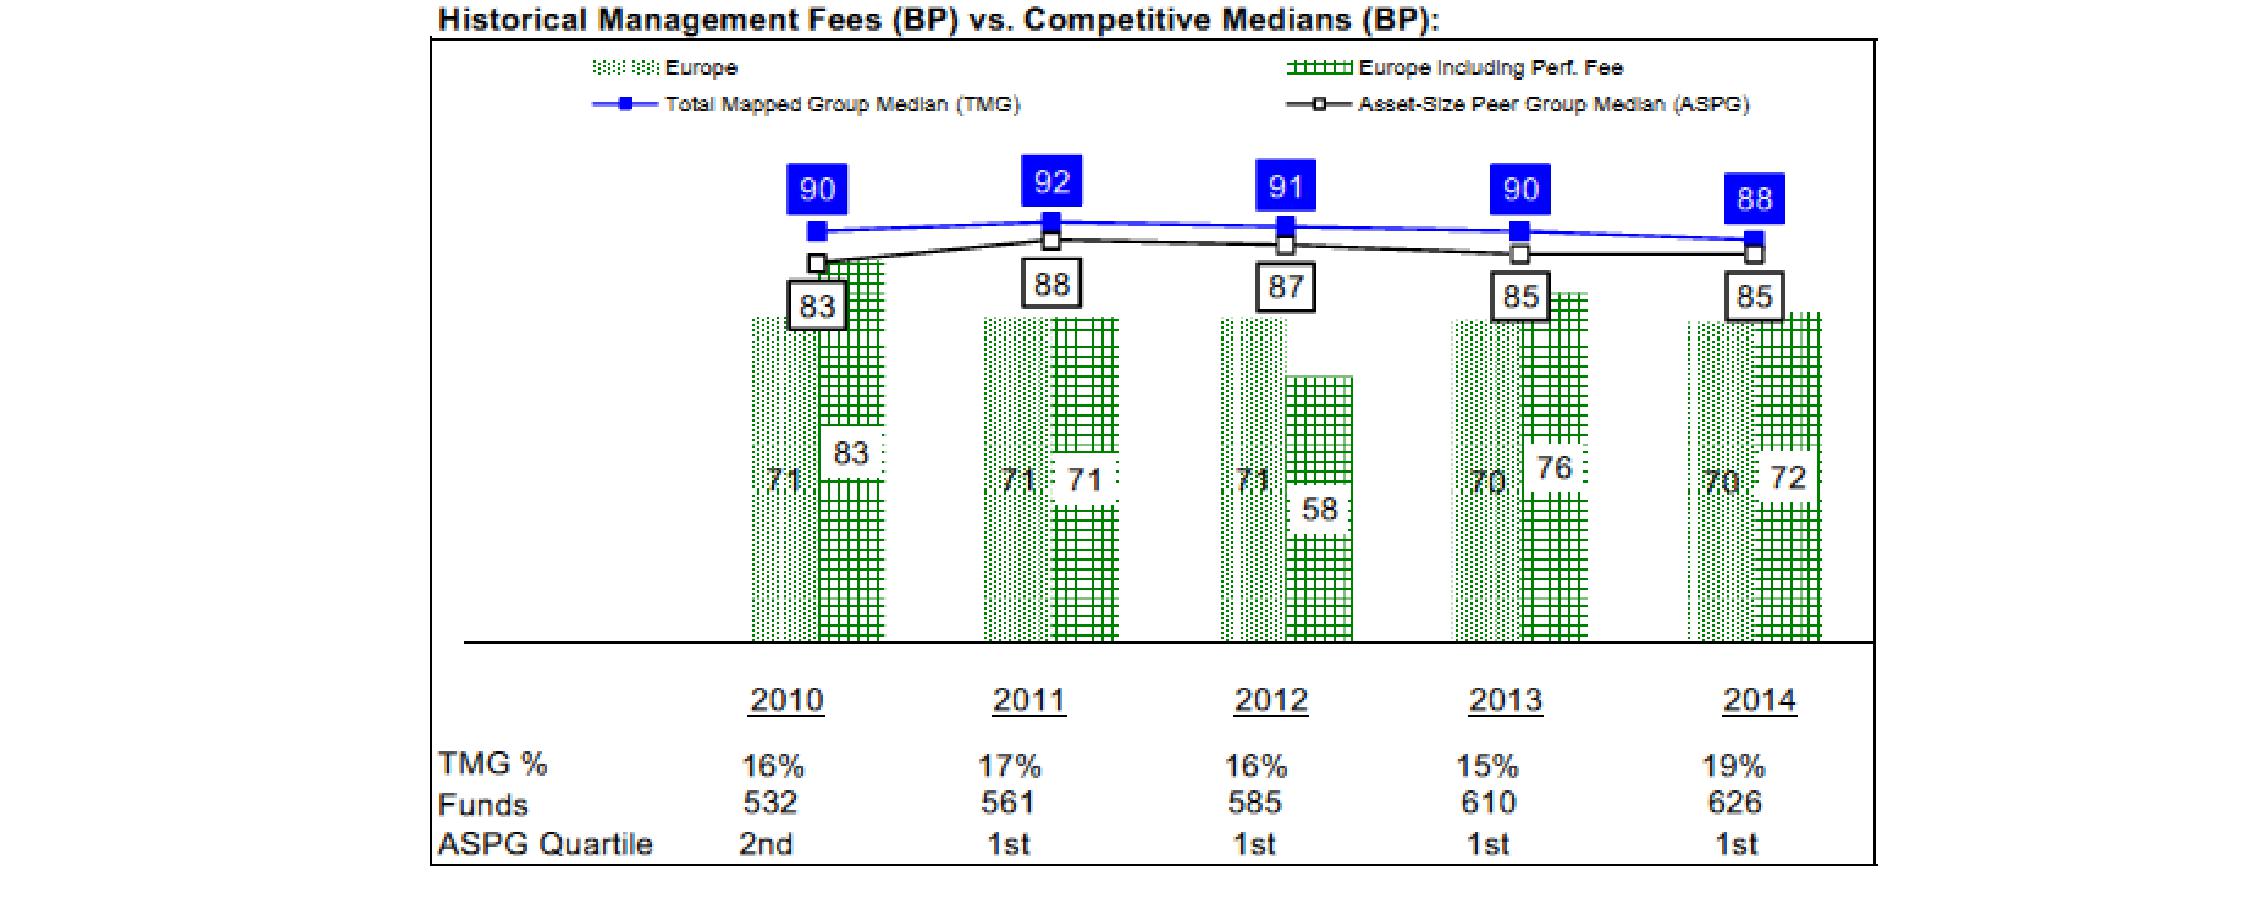
The Board noted that the fund's management fee rate ranked below the median of its Total Mapped Group and below the median of its ASPG for 2014. The Board also noted the effect of the fund's performance adjustment, if any, on the fund's management fee ranking.
The Board noted that, in 2014, the ad hoc Committee on Group Fee was formed by it and other Fidelity fund boards to conduct an in-depth review of the "group fee" component of the management fee of funds with such management fee structures. Committee focus included the mechanics of the group fee, the competitive landscape of group fee structures, Fidelity funds with no group fee component and investment products not included in group fee assets. The Board also considered that, for funds subject to the group fee, FMR agreed to voluntarily waive fees over a specified period of time in amounts designed to account for assets converted from certain funds to certain collective investment trusts.
The Board also noted that, in 2013, the ad hoc Committee on Management Fees was formed to conduct an in-depth review of the management fee rates of Fidelity's active equity mutual funds. The Committee focused on the following areas: (i) standard fee structures; (ii) research consumption and trading evolution; (iii) management fee competitiveness/profitability by category; and (iv) factors that drive institutional pricing.
Based on its review, the Board concluded that the fund's management fee is fair and reasonable in light of the services that the fund receives and the other factors considered.
Total Expense Ratio. In its review of the fund's total expense ratio, the Board considered the fund's management fee as well as other fund expenses, such as transfer agent fees, pricing and bookkeeping fees, and custodial, legal, and audit fees. The Board noted the impact of the fund's performance adjustment. The Board also noted that Fidelity may agree to waive fees and expenses from time to time, and the extent to which, if any, it has done so for the fund. As part of its review, the Board also considered the current and historical total expense ratios of the fund compared to competitive fund median expenses. The fund is compared to those funds and classes in the Total Mapped Group (used by the Board for management fee comparisons) that have a similar sales load structure.
The Board noted that the fund's total expense ratio ranked below its competitive median for 2014.
Fees Charged to Other Fidelity Clients. The Board also considered Fidelity fee structures and other information with respect to clients of Fidelity, such as other funds advised or subadvised by Fidelity, pension plan clients, and other institutional clients with similar mandates. The Board noted the findings of the 2013 ad hoc joint committee (created with the board of other Fidelity funds), which reviewed and compared Fidelity's institutional investment advisory business with its business of providing services to the Fidelity funds, including the differences in services provided, fees charged, and costs incurred, as well as competition in their respective marketplaces.
Based on its review of total expense ratios and fees charged to other Fidelity clients, the Board concluded that the total expense ratio of each class of the fund was reasonable in light of the services that the fund and its shareholders receive and the other factors considered.
Costs of the Services and Profitability. The Board considered the revenues earned and the expenses incurred by Fidelity in conducting the business of developing, marketing, distributing, managing, administering and servicing the fund and servicing the fund's shareholders. The Board also considered the level of Fidelity's profits in respect of all the Fidelity funds.
Annual Report
Board Approval of Investment Advisory Contracts and Management Fees - continued
On an annual basis, Fidelity presents to the Board information about the profitability of its relationship with the fund. Fidelity calculates profitability information for each fund, as well as aggregate profitability information for groups of Fidelity funds and all Fidelity funds, using a series of detailed revenue and cost allocation methodologies which originate with the books and records of Fidelity on which Fidelity's audited financial statements are based. The Audit Committee of the Board reviews any significant changes from the prior year's methodologies.
PricewaterhouseCoopers LLP (PwC), independent registered public accounting firm and auditor to Fidelity and certain Fidelity funds, has been engaged annually by the Board as part of the Board's assessment of Fidelity's profitability analysis. PwC's engagement includes the review and assessment of the methodologies used by Fidelity in determining the revenues and expenses attributable to Fidelity's mutual fund business, and completion of agreed-upon procedures in respect of the mathematical accuracy of fund profitability and its conformity to established allocation methodologies. After considering PwC's reports issued under the engagement and information provided by Fidelity, the Board concluded that while other allocation methods may also be reasonable, Fidelity's profitability methodologies are reasonable in all material respects.
The Board also reviewed Fidelity's non-fund businesses and fall-out benefits related to the mutual fund business as well as cases where Fidelity's affiliates may benefit from or be related to the fund's business.
The Board considered the costs of the services provided by and the profits realized by Fidelity in connection with the operation of the fund and was satisfied that the profitability was not excessive.
Economies of Scale. The Board considered whether there have been economies of scale in respect of the management of the Fidelity funds, whether the Fidelity funds (including the fund) have appropriately benefited from any such economies of scale, and whether there is potential for realization of any further economies of scale. The Board considered the extent to which the fund will benefit from economies of scale as assets grow through increased services to the fund, through waivers or reimbursements, or through fee or expense ratio reductions. The Board also noted that in 2013, it and the boards of other Fidelity funds created an ad hoc committee (the Economies of Scale Committee) to analyze whether Fidelity attains economies of scale in respect of the management and servicing of the Fidelity funds, whether the Fidelity funds have appropriately benefited from such economies of scale, and whether there is potential for realization of any further economies of scale.
The Board recognized that the fund's management contract incorporates a "group fee" structure, which provides for lower group fee rates as total group assets increase, and for higher group fee rates as total group assets decrease (with "group assets" defined to include fund assets under FMR's management plus sector fund assets previously under FMR's management and currently managed by Fidelity SelectCo, LLC). FMR calculates the group fee rates based on a tiered asset "breakpoint" schedule that varies based on asset class. The Board considered that the group fee is designed to deliver the benefits of economies of scale to fund shareholders when total Fidelity fund assets increase, even if assets of any particular fund are unchanged or have declined, because some portion of Fidelity's costs are attributable to services provided to all Fidelity funds, and all funds benefit if those costs can be allocated among more assets. The Board concluded that, given the group fee structure, fund shareholders will benefit from lower management fees as group assets increase at the fund complex level, regardless of whether Fidelity achieves any such economies of scale.
The Board concluded, taking into account the analysis of the Economies of Scale Committee, that economies of scale, if any, are being appropriately shared between fund shareholders and Fidelity.
Additional Information Requested by the Board. In order to develop fully the factual basis for consideration of the Fidelity funds' Advisory Contracts, the Board requested and received additional information on certain topics, including: (i) fund performance trends and Fidelity's long-term strategies for certain funds; (ii) the various share classes employed by Fidelity and the attributes of each class, together with similar information on the distribution and servicing payments made by Fidelity or the funds to third-party participants in the distribution channels; (iii) fund profitability, and fund performance in relation to fund profitability; (iv) the methodology with respect to evaluating competitive fund data and peer group classifications and fee comparisons; (v) annual fund profitability margins, with particular focus on certain funds with negative margins; (vi) the realization of fall-out benefits in certain Fidelity business units; (vii) economies of scale and the way in which they are shared with fund shareholders; (viii) Fidelity's group fee structures, including the group fee schedule of breakpoints; (ix) the impact of cost containment measures on the funds; and (x) the transfer agent fee structure.
Based on its evaluation of all of the conclusions noted above, and after considering all factors it believed relevant, the Board concluded that the advisory fee structures are fair and reasonable, and that the fund's Advisory Contracts should be renewed.
Annual Report
Investment Adviser
Fidelity Management & Research Company
Boston, MA
Investment Sub-Advisers
FMR Co., Inc.
FMR Investment Management
(U.K.) Limited
FIL Investment Advisors
FIL Investment Advisors (UK) Limited
Fidelity Management & Research
(Hong Kong) Limited
Fidelity Management & Research
(Japan) Limited
General Distributor
Fidelity Distributors Corporation
Smithfield, RI
Transfer and Service Agents
Fidelity Investments Institutional
Operations Company, Inc.
Boston, MA
Fidelity Service Company, Inc.
Boston, MA
Custodian
State Street Bank and Trust Company
Quincy, MA
(Fidelity Investment logo)(registered trademark)
AEUFI-UANN-1215
1.9586001.101
ContentsManagement's Discussion of Fund PerformanceShareholder Expense ExampleInvestment Changes (Unaudited)Investments October 31, 2015Financial StatementsNotes to Financial StatementsReport of Independent Registered Public Accounting FirmTrustees and OfficersDistributions (Unaudited)Board Approval of Investment Advisory Contracts and Management FeesContentsManagement's Discussion of Fund PerformanceShareholder Expense ExampleInvestment Changes (Unaudited)Investments October 31, 2015Financial StatementsNotes to Financial StatementsReport of Independent Registered Public Accounting FirmTrustees and OfficersDistributions (Unaudited)Board Approval of Investment Advisory Contracts and Management Fees
Fidelity Advisor®
China Region Fund -
Class A, Class T, Class B, and Class C
Annual Report
October 31, 2015
Class A, Class T, Class B, and Class C are
classes of Fidelity® China Region Fund
(Fidelity Cover Art)
Contents
Performance | (Click Here) | How the fund has done over time. |
Management's Discussion of Fund Performance | (Click Here) | The Portfolio Manager's review of fund performance and strategy. |
Shareholder Expense Example | (Click Here) | An example of shareholder expenses. |
Investment Changes | (Click Here) | A summary of major shifts in the fund's investments over the past six months. |
Investments | (Click Here) | A complete list of the fund's investments with their market values. |
Financial Statements | (Click Here) | Statements of assets and liabilities, operations, and changes in net assets, as well as financial highlights. |
Notes | (Click Here) | Notes to the financial statements. |
Report of Independent Registered Public Accounting Firm | (Click Here) | |
Trustees and Officers | (Click Here) | |
Distributions | (Click Here) | |
Board Approval of Investment Advisory Contracts and Management Fees | (Click Here) | |
To view a fund's proxy voting guidelines and proxy voting record for the 12-month period ended June 30, visit http://www.fidelity.com/proxyvotingresults or visit the Securities and Exchange Commission's (SEC) web site at http://www.sec.gov. You may also call 1-877-208-0098 to request a free copy of the proxy voting guidelines.
Standard & Poor's, S&P and S&P 500 are registered service marks of The McGraw-Hill Companies, Inc. and have been licensed for use by Fidelity Distributors Corporation.
Other third-party marks appearing herein are the property of their respective owners.
All other marks appearing herein are registered or unregistered trademarks or service marks of FMR LLC or an affiliated company. © 2015 FMR LLC. All rights reserved.
This report and the financial statements contained herein are submitted for the general information of the shareholders of the fund. This report is not authorized for distribution to prospective investors in the fund unless preceded or accompanied by an effective prospectus.
A fund files its complete schedule of portfolio holdings with the SEC for the first and third quarters of each fiscal year on Form N-Q. Forms N-Q are available on the SEC's web site at http://www.sec.gov. A fund's Forms N-Q may be reviewed and copied at the SEC's Public Reference Room in Washington, DC. Information regarding the operation of the SEC's Public Reference Room may be obtained by calling 1-800-SEC-0330. For a complete list of a fund's portfolio holdings, view the most recent holdings listing, semiannual report, or annual report on Fidelity's web site at http://www.fidelity.com, http://www.advisor.fidelity.com, or http://www.401k.com, as applicable.
NOT FDIC INSURED • MAY LOSE VALUE • NO BANK GUARANTEE
Neither the fund nor Fidelity Distributors Corporation is a bank.
Annual Report
Performance: The Bottom Line
Average annual total return reflects the change in the value of an investment, assuming reinvestment of the class' distributions from dividend income and capital gains (the profits earned upon the sale of securities that have grown in value, if any) and assuming a constant rate of performance each year. The $10,000 table and the fund's returns do not reflect the deduction of taxes that a shareholder would pay on fund distributions or the redemption of fund shares. During periods of reimbursement by Fidelity, a fund's total return will be greater than it would be had the reimbursement not occurred. How a fund did yesterday is no guarantee of how it will do tomorrow. Returns reflect the conversion of Class B shares to Class A shares after a maximum of seven years.
Average Annual Total Returns
Periods ended October 31, 2015 | Past 1
year | Past 5
years | Past 10
years |
Class A (incl. 5.75% sales charge) A | -7.12% | 3.01% | 9.61% |
Class T (incl. 3.50% sales charge) B | -5.23% | 3.19% | 9.64% |
Class B (incl. contingent deferred sales charge) C | -6.51% | 3.13% | 9.68% |
Class C (incl. contingent deferred sales charge) D | -3.07% | 3.46% | 9.65% |
A Class A shares bear a 0.25% 12b-1 fee. The initial offering of Class A shares took place on May 9, 2008. Returns prior to May 9, 2008 are those of Fidelity® China Region Fund, the original class of the fund, which has no 12b-1 fee. Had Class A's 12b-1 fee been reflected, returns prior to May 9, 2008 would have been lower.
B Class T shares bear a 0.50% 12b-1 fee. The initial offering of Class T shares took place on May 9, 2008. Returns prior to May 9, 2008 are those of Fidelity China Region Fund, the original class of the fund, which has no 12b-1 fee. Had Class T's 12b-1 fee been reflected, returns prior to May 9, 2008 would have been lower.
C Class B shares bear a 1.00% 12b-1 fee. The initial offering of Class B shares took place on May 9, 2008. Returns prior to May 9, 2008 are those of Fidelity China Region Fund, the original class of the fund, which has no 12b-1 fee. Had Class B's 12b-1 fee been reflected, returns prior to May 9, 2008 would have been lower. Class B shares' contingent deferred sales charges included in the past one year, past five years, and past ten years total return figures are 5%, 2%, and 0% respectively.
D Class C shares bear a 1.00% 12b-1 fee. The initial offering of Class C shares took place on May 9, 2008. Returns prior to May 9, 2008 are those of Fidelity China Region Fund, the original class of the fund, which has no 12b-1 fee. Had Class C's 12b-1 fee been reflected, returns prior to May 9, 2008 would have been lower. Class C shares' contingent deferred sales charges included in the past one year, past five years, and past ten years total return figures are 1%, 0%, and 0%, respectively.
$10,000 Over 10 Years
Let's say hypothetically that $10,000 was invested in Fidelity Advisor® China Region Fund - Class A on October 31, 2005, and the current 5.75% sales charge was paid. The chart shows how the value of your investment would have changed, and also shows how the MSCI Golden Dragon Index performed over the same period. See footnote A above for additional information regarding the performance of Class A.
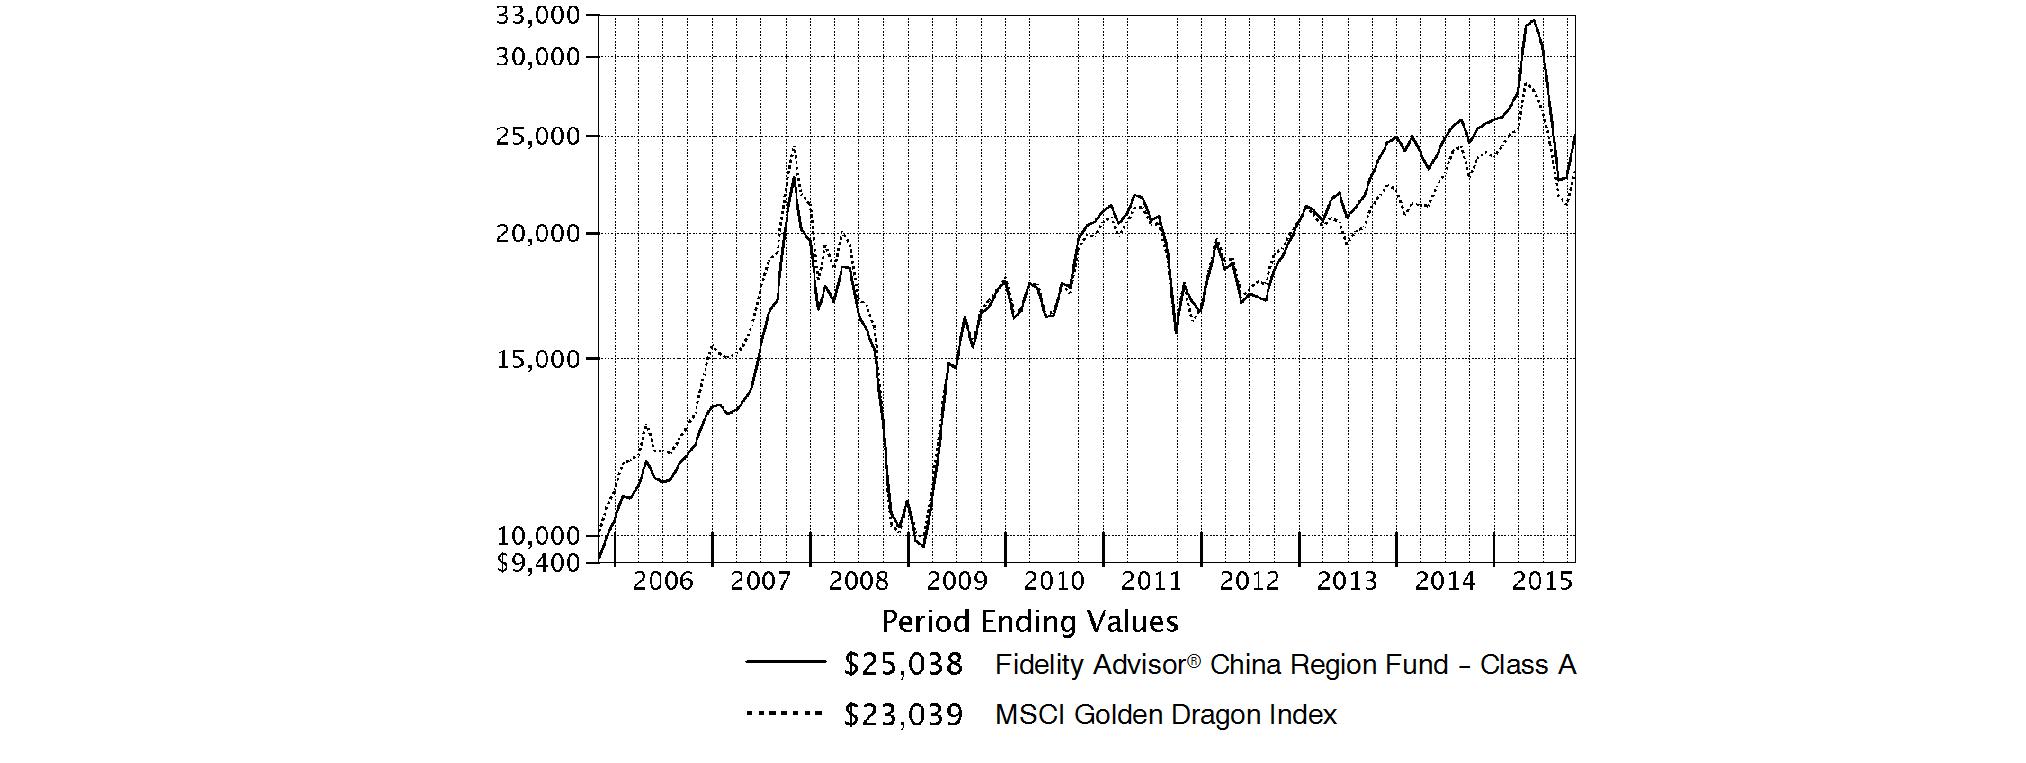
Annual Report
Fidelity China Region Fund
Market Recap: International equities suffered a moderate setback for the 12 months ending October 31, 2015, held back by a collapse in commodities prices that hurt resources-related sectors and geographies. The MSCI ACWI (All Country World Index) ex USA Index returned -4.55% for the period, affected also by concerns about global economic growth. Commodity producers remained under pressure for much of the past year, largely related to economic deceleration in China (-1%), the world's second-largest economy and a leading consumer of raw materials. This effect was exacerbated by U.S. dollar strength relative to global currencies, which weighed on commodities priced in dollars and acutely impacted equity returns within regions most exposed to resources prices. The emerging-markets group, for example, returned about -15% this period. Canada, a significant energy producer, returned roughly -17%. Net energy consumer Japan (+9%) was the best-performing region by far. Only about a quarter of the nearly 50 index countries managed a gain this period: Ireland (+19%) - the EU's fastest-growing economy - and Israel (+17%) proved top performers; Greece (-56%) and Brazil (-46%), among the worst. As for sectors, energy (-25%) and materials (-16%) declined sharply, whereas the two consumer sectors each gained about 6%.
Comments from Portfolio Manager Robert Bao: For the year, the fund's share classes (excluding sales charges, if applicable) posted low single-digit declines but outpaced the -2.99% return of the benchmark MSCI Golden Dragon Index. Stock selection was the primary driver of the fund's relative success, especially in consumer discretionary and health care. Versus the benchmark, performance was lifted by two cement companies in the materials sector, West China Cement - the fund's largest relative contributor - and China Shanshui Cement Group. Other contributors included China Life Insurance, People's Insurance Group of China, China Southern Airlines, which I bought in December, and China-based online classified advertising portal 58.com. Conversely, a large overweighting in consumer discretionary offset much of the benefits of solid stock picking there. Positioning in financials further detracted. At the stock level, moving to a significant underweighting in China-based Internet media firm Tencent Holdings made this index name the fund's biggest relative detractor, in view of its 19% advance. Underweighting and ultimately selling benchmark component CK Hutchison Holdings, which returned roughly 16%, also worked against us. Lastly, I'll mention an underweighting in benchmark heavyweight Taiwan Semiconductor Manufacturing, whose shares posted a modest gain and therefore detracted from our relative result.
The views expressed above reflect those of the portfolio manager(s) only through the end of the period as stated on the cover of this report and do not necessarily represent the views of Fidelity or any other person in the Fidelity organization. Any such views are subject to change at any time based upon market or other conditions and Fidelity disclaims any responsibility to update such views. These views may not be relied on as investment advice and, because investment decisions for a Fidelity fund are based on numerous factors, may not be relied on as an indication of trading intent on behalf of any Fidelity fund.
Annual Report
Fidelity China Region Fund
As a shareholder of the Fund, you incur two types of costs: (1) transaction costs, including sales charges (loads) on purchase payments or redemption proceeds, redemption fees and (2) ongoing costs, including management fees, distribution and/or service (12b-1) fees and other Fund expenses. This Example is intended to help you understand your ongoing costs (in dollars) of investing in the Fund and to compare these costs with the ongoing costs of investing in other mutual funds.
The Example is based on an investment of $1,000 invested at the beginning of the period and held for the entire period (May 1, 2015 to October 31, 2015).
Actual Expenses
The first line of the accompanying table for each class of the Fund provides information about actual account values and actual expenses. You may use the information in this line, together with the amount you invested, to estimate the expenses that you paid over the period. Simply divide your account value by $1,000.00 (for example, an $8,600 account value divided by $1,000.00 = 8.6), then multiply the result by the number in the first line for a class of the Fund under the heading entitled "Expenses Paid During Period" to estimate the expenses you paid on your account during this period. A small balance maintenance fee of $12.00 that is charged once a year may apply for certain accounts with a value of less than $2,000. This fee is not included in the table below. If it was, the estimate of expenses you paid during the period would be higher, and your ending account value lower, by this amount. In addition, the Fund, as a shareholder in the underlying Fidelity Central Funds, will indirectly bear its pro-rata share of the fees and expenses incurred by the underlying Fidelity Central Funds. These fees and expenses are not included in the Fund's annualized expense ratio used to calculate the expense estimate in the table below.
Hypothetical Example for Comparison Purposes
The second line of the accompanying table for each class of the Fund provides information about hypothetical account values and hypothetical expenses based on a Class' actual expense ratio and an assumed rate of return of 5% per year before expenses, which is not the Class' actual return. The hypothetical account values and expenses may not be used to estimate the actual ending account balance or expenses you paid for the period. You may use this information to compare the ongoing costs of investing in the Fund and other funds. To do so, compare this 5% hypothetical example with the 5% hypothetical examples that appear in the shareholder reports of the other funds. A small balance maintenance fee of $12.00 that is charged once a year may apply for certain accounts with a value of less than $2,000. This fee is not included in the table below. If it was, the estimate of expenses you paid during the period would be higher, and your ending account value lower, by this amount. In addition, the Fund, as a shareholder in the underlying Fidelity Central Funds, will indirectly bear its pro-rata share of the fees and expenses incurred by the underlying Fidelity Central Funds. These fees and expenses are not included in the Fund's annualized expense ratio used to calculate the expense estimate in the table below.
Please note that the expenses shown in the table are meant to highlight your ongoing costs only and do not reflect any transaction costs. Therefore, the second line of the table is useful in comparing ongoing costs only, and will not help you determine the relative total costs of owning different funds. In addition, if these transactional costs were included, your costs would have been higher.
| Annualized
Expense RatioB | Beginning
Account Value
May 1, 2015 | Ending
Account Value
October 31, 2015 | Expenses Paid
During PeriodC
May 1, 2015
to October 31, 2015 |
Class A | 1.29% | | | |
Actual | | $ 1,000.00 | $ 779.10 | $ 5.78 |
HypotheticalA | | $ 1,000.00 | $ 1,018.70 | $ 6.56 |
Class T | 1.63% | | | |
Actual | | $ 1,000.00 | $ 777.70 | $ 7.30 |
HypotheticalA | | $ 1,000.00 | $ 1,016.99 | $ 8.29 |
Class B | 2.10% | | | |
Actual | | $ 1,000.00 | $ 776.30 | $ 9.40 |
HypotheticalA | | $ 1,000.00 | $ 1,014.62 | $ 10.66 |
Class C | 2.06% | | | |
Actual | | $ 1,000.00 | $ 776.20 | $ 9.22 |
HypotheticalA | | $ 1,000.00 | $ 1,014.82 | $ 10.46 |
China Region | .99% | | | |
Actual | | $ 1,000.00 | $ 780.50 | $ 4.35 |
HypotheticalA | | $ 1,000.00 | $ 1,020.21 | $ 5.04 |
Class I | .97% | | | |
Actual | | $ 1,000.00 | $ 780.50 | $ 4.35 |
HypotheticalA | | $ 1,000.00 | $ 1,020.32 | $ 4.94 |
A 5% return per year before expenses
B Annualized expense ratio reflects expenses net of applicable fee waivers.
C Expenses are equal to each Class' annualized expense ratio, multiplied by the average account value over the period, multiplied by 184/365 (to reflect the one-half year period).
Annual Report
Fidelity China Region Fund
Investment Changes (Unaudited)
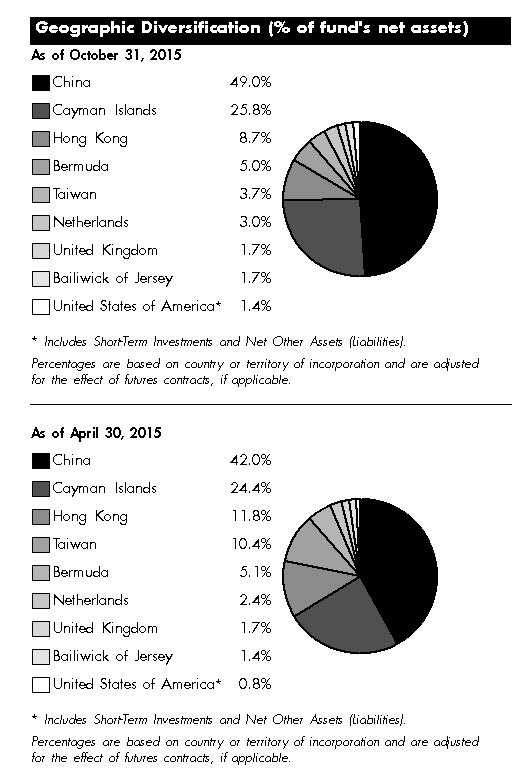
Asset Allocation as of October 31, 2015 |
| % of fund's
net assets | % of fund's net assets
6 months ago |
Stocks | 98.6 | 99.2 |
Short-Term Investments and Net Other Assets (Liabilities) | 1.4 | 0.8 |
Top Ten Stocks as of October 31, 2015 |
| % of fund's
net assets | % of fund's net assets
6 months ago |
Tencent Holdings Ltd. (Internet Software & Services) | 6.0 | 3.2 |
China Construction Bank Corp. (H Shares) (Banks) | 4.9 | 3.6 |
AIA Group Ltd. (Insurance) | 3.3 | 4.4 |
Bank of China Ltd. (H Shares) (Banks) | 3.1 | 3.1 |
Ping An Insurance (Group) Co. of China Ltd. (H Shares) (Insurance) | 2.8 | 2.3 |
China Pacific Insurance (Group) Co. Ltd. (H Shares) (Insurance) | 2.3 | 2.3 |
Industrial & Commercial Bank of China Ltd. (H Shares) (Banks) | 2.3 | 4.1 |
Chongqing Changan Automobile Co. Ltd. (B Shares) (Automobiles) | 2.2 | 1.4 |
Hangzhou Hikvision Digital Technology Co. Ltd. ELS (BNP Paribas Warrant Program) warrants 11/27/17 (Banks) | 2.0 | 0.9 |
China Merchants Bank Co. Ltd. (H Shares) (Banks) | 1.9 | 1.6 |
| 30.8 | |
Market Sectors as of October 31, 2015 |
| % of fund's net assets | % of fund's net assets
6 months ago |
Financials | 37.8 | 40.4 |
Consumer Discretionary | 14.4 | 13.3 |
Information Technology | 14.0 | 16.6 |
Industrials | 12.9 | 12.2 |
Materials | 6.7 | 4.0 |
Health Care | 5.5 | 9.1 |
Telecommunication Services | 2.4 | 1.4 |
Consumer Staples | 2.0 | 1.7 |
Energy | 1.6 | 0.0 |
Utilities | 1.3 | 0.5 |
The fund may invest up to 35% of its total assets in any industry that represents more than 20% of the Hong Kong, Taiwanese and Chinese market. As of October 31, 2015, the fund did not have more than 25% of its total assets invested in any one industry. Percentages shown as 0.0% may reflect amounts less than 0.05%. |
Annual Report
Fidelity China Region Fund
Investments October 31, 2015
Showing Percentage of Net Assets
Common Stocks - 98.0% |
| Shares | | Value |
CONSUMER DISCRETIONARY - 13.8% |
Auto Components - 1.4% |
Weifu High-Technology Co. Ltd. (B Shares) | 4,257,836 | | $ 10,855,699 |
Xingda International Holdings Ltd. | 34,649,000 | | 7,697,062 |
| | 18,552,761 |
Automobiles - 3.3% |
Brilliance China Automotive Holdings Ltd. | 10,008,000 | | 13,877,531 |
Chongqing Changan Automobile Co. Ltd. (B Shares) | 15,733,741 | | 28,957,143 |
Geely Automobile Holdings Ltd. | 3,490,000 | | 1,861,105 |
| | 44,695,779 |
Diversified Consumer Services - 0.2% |
Perfect Shape (PRC) Holdings Ltd. | 10,848,000 | | 2,037,136 |
Hotels, Restaurants & Leisure - 2.2% |
500.com Ltd. sponsored ADR Class A (a)(d) | 300,000 | | 6,090,000 |
Huangshan Tourism Development Co. Ltd. | 5,899,876 | | 10,098,245 |
Tuniu Corp. Class A sponsored ADR (a)(d) | 895,000 | | 13,809,850 |
| | 29,998,095 |
Household Durables - 1.1% |
Haier Electronics Group Co. Ltd. | 5,492,000 | | 10,614,115 |
Qingdao Haier Co. Ltd. | 3,099,822 | | 4,719,036 |
| | 15,333,151 |
Internet & Catalog Retail - 2.7% |
Ctrip.com International Ltd. sponsored ADR (a)(d) | 243,000 | | 22,591,710 |
Qunar Cayman Islands Ltd. sponsored ADR (a)(d) | 285,000 | | 13,833,900 |
| | 36,425,610 |
Media - 0.9% |
Poly Culture Group Corp. Ltd. (H Shares) (d) | 4,978,100 | | 11,968,205 |
Specialty Retail - 0.4% |
China Harmony New Energy Auto | 7,500,000 | | 5,002,429 |
Textiles, Apparel & Luxury Goods - 1.6% |
Best Pacific International Holdings Ltd. | 9,297,000 | | 3,946,589 |
Lao Feng Xiang Co. Ltd. (B Shares) | 2,499,988 | | 10,757,394 |
Toung Loong Textile Manufacturing Co. Ltd. | 2,375,000 | | 7,191,206 |
| | 21,895,189 |
TOTAL CONSUMER DISCRETIONARY | | 185,908,355 |
CONSUMER STAPLES - 2.0% |
Beverages - 1.4% |
Kweichow Moutai Co. Ltd. | 555,952 | | 18,771,044 |
|
| Shares | | Value |
Food & Staples Retailing - 0.6% |
China Resources Beer Holdings Co. Ltd. | 3,942,000 | | $ 7,443,167 |
TOTAL CONSUMER STAPLES | | 26,214,211 |
ENERGY - 1.6% |
Oil, Gas & Consumable Fuels - 1.6% |
China Petroleum & Chemical Corp. (H Shares) | 29,576,000 | | 21,319,684 |
FINANCIALS - 37.8% |
Banks - 17.6% |
Bank Communications Co. Ltd. (H Shares) | 29,071,000 | | 21,442,752 |
Bank of China Ltd. (H Shares) | 89,124,000 | | 42,027,437 |
China Construction Bank Corp. (H Shares) | 90,503,000 | | 65,592,590 |
China Merchants Bank Co. Ltd. (H Shares) | 9,776,000 | | 25,524,331 |
China Minsheng Banking Corp. Ltd. (H Shares) | 10,800,000 | | 10,853,532 |
Hangzhou Hikvision Digital Technology Co. Ltd. ELS (BNP Paribas Warrant Program) warrants 11/27/17 (a)(f) | 4,809,000 | | 26,200,354 |
Industrial & Commercial Bank of China Ltd. (H Shares) | 48,916,000 | | 31,027,702 |
Midea Group Co. Ltd. ELS (BNP Paribas Arbitrage Warrant Program) warrants 2/10/17 (a)(f) | 3,090,600 | | 13,619,332 |
| | 236,288,030 |
Capital Markets - 4.6% |
Beijing Yanjing Brewery Co. Ltd. ELS (UBS Warrant Programme) warrants 7/30/18 (a)(f) | 10,595,900 | | 14,753,023 |
Guotai Junan International Holdings Ltd. | 27,600,000 | | 10,181,009 |
Haitong Securities Co. Ltd. (H Shares) | 5,600,000 | | 9,743,426 |
Huatai Securities Co. Ltd. (a) | 2,727,564 | | 6,189,058 |
Huayi Brothers Media Corp. (UBS Warrant Programme) warrants 5/19/16 ELS (a)(f) | 1,490,000 | | 8,649,929 |
Tai Fook Securities Group Ltd. | 21,756,000 | | 12,022,457 |
Value Partners Group Ltd. | 956,000 | | 1,012,325 |
| | 62,551,227 |
Insurance - 12.0% |
AIA Group Ltd. | 7,498,200 | | 43,964,430 |
China Life Insurance Co. Ltd. (H Shares) | 2,796,200 | | 10,083,333 |
China Pacific Insurance (Group) Co. Ltd. (H Shares) | 7,908,800 | | 31,503,886 |
New China Life Insurance Co. Ltd. (H Shares) | 3,477,000 | | 15,310,621 |
People's Insurance Co. of China Group (H Shares) | 43,065,000 | | 23,047,521 |
Ping An Insurance (Group) Co. of China Ltd. (H Shares) | 6,745,500 | | 37,864,178 |
| | 161,773,969 |
Real Estate Management & Development - 3.6% |
Beijing Capital Land Ltd. (H Shares) | 35,170,000 | | 16,877,281 |
Common Stocks - continued |
| Shares | | Value |
FINANCIALS - continued |
Real Estate Management & Development - continued |
Greenland Hong Kong Holdings Ltd. (a) | 12,000,000 | | $ 5,066,888 |
Greentown China Holdings Ltd. (a)(d) | 15,740,500 | | 13,767,822 |
Shimao Property Holdings Ltd. | 6,908,500 | | 12,099,133 |
| | 47,811,124 |
TOTAL FINANCIALS | | 508,424,350 |
HEALTH CARE - 5.5% |
Health Care Providers & Services - 1.0% |
China National Accord Medicines Corp. Ltd. | 1,256,673 | | 6,282,359 |
Phoenix Healthcare Group Ltd. (d) | 4,576,500 | | 6,930,318 |
| | 13,212,677 |
Life Sciences Tools & Services - 0.7% |
JHL Biotech, Inc. (a) | 4,010,696 | | 8,944,229 |
Pharmaceuticals - 3.8% |
CSPC Pharmaceutical Group Ltd. | 19,732,000 | | 18,371,405 |
Lee's Pharmaceutical Holdings Ltd. | 8,273,500 | | 10,682,214 |
Livzon Pharmaceutical Group, Inc. | 1,690,000 | | 8,087,083 |
Sino Biopharmaceutical Ltd. | 11,404,000 | | 14,171,754 |
| | 51,312,456 |
TOTAL HEALTH CARE | | 73,469,362 |
INDUSTRIALS - 12.9% |
Air Freight & Logistics - 0.5% |
Sinotrans Air Transportation Development Co. Ltd. (A Shares) | 1,599,830 | | 6,628,659 |
Airlines - 3.0% |
Air China Ltd. (H Shares) | 6,648,000 | | 6,403,457 |
China Eastern Airlines Corp. Ltd. (H Shares) (a) | 26,446,000 | | 16,966,898 |
China Southern Airlines Ltd. (H Shares) | 20,194,000 | | 17,162,111 |
| | 40,532,466 |
Construction & Engineering - 1.9% |
Beijing Urban Consolidated & Development Group Ltd. (H Shares) (d) | 20,963,000 | | 12,897,334 |
China Communications Construction Co. Ltd. (H Shares) | 9,859,000 | | 13,607,270 |
| | 26,504,604 |
Electrical Equipment - 1.7% |
Harbin Electric Machinery Co. Ltd. (H Shares) (d) | 21,974,000 | | 13,099,547 |
Jiangnan Group Ltd. | 44,374,000 | | 10,161,406 |
| | 23,260,953 |
Machinery - 2.6% |
HIWIN Technologies Corp. | 1,339,000 | | 7,485,862 |
Lonking Holdings Ltd. | 28,600,000 | | 4,587,050 |
Sinotruk Hong Kong Ltd. | 8,000,000 | | 3,329,894 |
|
| Shares | | Value |
Weichai Power Co. Ltd. (H Shares) | 7,850,000 | | $ 8,323,944 |
Zhengzhou Yutong Bus Co. Ltd. | 3,149,956 | | 10,849,396 |
| | 34,576,146 |
Marine - 1.4% |
China Shipping Development Co. Ltd. (H Shares) (d) | 22,444,000 | | 15,897,809 |
Sinotrans Shipping Ltd. (d) | 12,186,000 | | 2,567,548 |
| | 18,465,357 |
Trading Companies & Distributors - 1.8% |
Summit Ascent Holdings Ltd. (a)(d) | 48,136,000 | | 23,957,754 |
TOTAL INDUSTRIALS | | 173,925,939 |
INFORMATION TECHNOLOGY - 14.0% |
Electronic Equipment & Components - 3.4% |
Largan Precision Co. Ltd. | 159,000 | | 12,415,370 |
Sunny Optical Technology Group Co. Ltd. (d) | 4,500,000 | | 10,463,038 |
Tongda Group Holdings Ltd. | 65,800,000 | | 13,400,975 |
Wasion Group Holdings Ltd. | 8,250,000 | | 9,152,424 |
| | 45,431,807 |
Internet Software & Services - 8.7% |
58.com, Inc. ADR (a)(d) | 254,478 | | 13,357,550 |
Alibaba Group Holding Ltd. sponsored ADR (a) | 95,000 | | 7,963,850 |
Baozun, Inc. sponsored ADR (d) | 382,374 | | 3,303,711 |
NetEase, Inc. sponsored ADR | 30,000 | | 4,335,900 |
SINA Corp. (a) | 150,000 | | 7,146,000 |
Tencent Holdings Ltd. | 4,263,400 | | 80,362,442 |
| | 116,469,453 |
Software - 0.9% |
China City Railway Transportation Technology Holdings Co. Ltd. (a) | 48,540,000 | | 12,889,066 |
Technology Hardware, Storage & Peripherals - 1.0% |
ADLINK Technology, Inc. | 3,488,336 | | 9,412,544 |
Axiomtek Co. Ltd. | 2,000,000 | | 4,281,534 |
| | 13,694,078 |
TOTAL INFORMATION TECHNOLOGY | | 188,484,404 |
MATERIALS - 6.7% |
Construction Materials - 4.7% |
Asia Cement (China) Holdings Corp. | 2,818,000 | | 875,515 |
BBMG Corp. (H Shares) | 34,800,000 | | 24,387,043 |
China Shanshui Cement Group Ltd. (a)(d) | 20,656,000 | | 14,440,021 |
West China Cement Ltd. (d) | 133,122,000 | | 22,887,052 |
| | 62,589,631 |
Metals & Mining - 1.1% |
Angang Steel Co. Ltd. (H Shares) (d) | 16,946,000 | | 7,041,687 |
Common Stocks - continued |
| Shares | | Value |
MATERIALS - continued |
Metals & Mining - continued |
Fushan International Energy Group Ltd. (d) | 30,000,000 | | $ 4,047,633 |
Maanshan Iron & Steel Ltd. (H Shares) (a)(d) | 20,000,000 | | 4,281,653 |
| | 15,370,973 |
Paper & Forest Products - 0.9% |
Lee & Man Paper Manufacturing Ltd. | 9,455,000 | | 5,886,341 |
Nine Dragons Paper (Holdings) Ltd. | 9,000,000 | | 5,938,554 |
| | 11,824,895 |
TOTAL MATERIALS | | 89,785,499 |
TELECOMMUNICATION SERVICES - 2.4% |
Diversified Telecommunication Services - 2.4% |
China Telecom Corp. Ltd. (H Shares) | 13,024,000 | | 6,793,608 |
China Unicom Ltd. | 13,784,000 | | 16,798,406 |
CITIC 1616 Holdings Ltd. | 19,565,000 | | 8,110,882 |
| | 31,702,896 |
UTILITIES - 1.3% |
Independent Power and Renewable Electricity Producers - 1.3% |
Beijing Jingneng Clean Energy Co. Ltd. (H Shares) (d) | 50,462,000 | | 17,460,148 |
TOTAL COMMON STOCKS (Cost $1,406,055,507) |
1,316,694,848
|
Nonconvertible Preferred Stocks - 0.6% |
| | | |
CONSUMER DISCRETIONARY - 0.6% |
Internet & Catalog Retail - 0.6% |
China Internet Plus Holdings Ltd. (e) (Cost $6,268,244) | 1,983,088 | | 7,654,720 |
Money Market Funds - 7.0% |
| Shares | | Value |
Fidelity Cash Central Fund, 0.18% (b) | 20,040,108 | | $ 20,040,108 |
Fidelity Securities Lending Cash Central Fund, 0.19% (b)(c) | 74,180,545 | | 74,180,545 |
TOTAL MONEY MARKET FUNDS (Cost $94,220,653) |
94,220,653
|
TOTAL INVESTMENT
PORTFOLIO - 105.6% (Cost $1,506,544,404) | | 1,418,570,221 |
NET OTHER ASSETS (LIABILITIES) - (5.6)% | | (75,006,869) |
NET ASSETS - 100% | $ 1,343,563,352 |
Security Type Abbreviations |
ELS - Equity-Linked Security |
Legend |
(a) Non-income producing |
(b) Affiliated fund that is generally available only to investment companies and other accounts managed by Fidelity Investments. The rate quoted is the annualized seven-day yield of the fund at period end. A complete unaudited listing of the fund's holdings as of its most recent quarter end is available upon request. In addition, each Fidelity Central Fund's financial statements, which are not covered by the Fund's Report of Independent Registered Public Accounting Firm, are available on the SEC's website or upon request. |
(c) Investment made with cash collateral received from securities on loan. |
(d) Security or a portion of the security is on loan at period end. |
(e) Restricted securities - Investment in securities not registered under the Securities Act of 1933 (excluding 144A issues). At the end of the period, the value of restricted securities (excluding 144A issues) amounted to $7,654,720 or 0.6% of net assets. |
(f) Security exempt from registration under Rule 144A of the Securities Act of 1933. These securities may be resold in transactions exempt from registration, normally to qualified institutional buyers. At the end of the period, the value of these securities amounted to $63,222,638 or 4.7% of net assets. |
Additional information on each restricted holding is as follows: |
Security | Acquisition Date | Acquisition Cost |
China Internet Plus Holdings Ltd. (formerly Meituan Corp. Series D) | 1/26/15 | $ 6,268,244 |
Affiliated Central Funds |
Information regarding fiscal year to date income earned by the Fund from investments in Fidelity Central Funds is as follows: |
Fund | Income earned |
Fidelity Cash Central Fund | $ 41,819 |
Fidelity Securities Lending Cash Central Fund | 1,591,746 |
Total | $ 1,633,565 |
Other Affiliated Issuers |
An affiliated company is a company in which the Fund has ownership of at least 5% of the voting securities. Fiscal year to date transactions with companies which are or were affiliates are as follows: |
Affiliate | Value,
beginning of
period | Purchases | Sales
Proceeds | Dividend
Income | Value,
end of
period |
Jintex Corp. Ltd. | $ 4,548,561 | $ - | $ 3,438,888 | $ 67,797 | $ - |
Perfect Shape (PRC) Holdings Ltd. | 11,817,466 | - | 11,514,825 | 618,242 | - |
Total | $ 16,366,027 | $ - | $ 14,953,713 | $ 686,039 | $ - |
Other Information |
Categorizations in the Schedule of Investments are based on country or territory of incorporation. |
The following is a summary of the inputs used, as of October 31, 2015, involving the Fund's assets and liabilities carried at fair value. The inputs or methodology used for valuing securities may not be an indication of the risk associated with investing in those securities. For more information on valuation inputs, and their aggregation into the levels used in the tables below, please refer to the Investment Valuation section in the accompanying Notes to Financial Statements. |
Valuation Inputs at Reporting Date: |
Description | Total | Level 1 | Level 2 | Level 3 |
Investments in Securities: | | | | |
Equities: | | | | |
Consumer Discretionary | $ 193,563,075 | $ 63,516,666 | $ 117,672,653 | $ 12,373,756 |
Consumer Staples | 26,214,211 | - | 26,214,211 | - |
Energy | 21,319,684 | - | 21,319,684 | - |
Financials | 508,424,350 | - | 508,424,350 | - |
Health Care | 73,469,362 | 8,944,229 | 50,155,691 | 14,369,442 |
Industrials | 173,925,939 | 7,485,862 | 150,542,268 | 15,897,809 |
Information Technology | 188,484,404 | 62,216,459 | 126,267,945 | - |
Materials | 89,785,499 | - | 75,345,478 | 14,440,021 |
Telecommunication Services | 31,702,896 | - | 31,702,896 | - |
Utilities | 17,460,148 | - | 17,460,148 | - |
Money Market Funds | 94,220,653 | 94,220,653 | - | - |
Total Investments in Securities: | $ 1,418,570,221 | $ 236,383,869 | $ 1,125,105,324 | $ 57,081,028 |
Valuation Inputs at Reporting Date: |
The following is a reconciliation of Investments in Securities for which Level 3 inputs were used in determining value: |
Investments in Securities: | |
Equities - Health Care | |
Beginning Balance | $ - |
Net Realized Gain (Loss) on Investment Securities | (1,817,855) |
Net Unrealized Gain (Loss) on Investment Securities | (5,958,733) |
Cost of Purchases | 25,544,803 |
Proceeds of Sales | (3,398,773) |
Amortization/Accretion | - |
Transfers into Level 3 | - |
Transfers out of Level 3 | - |
Ending Balance | $ 14,369,442 |
The change in unrealized gain (loss) for the period attributable to Level 3 securities held at October 31, 2015 | $ (5,958,733) |
Investments in Securities: - continued | |
Equities - Industrials | |
Beginning Balance | $ 28,267,179 |
Net Realized Gain (Loss) on Investment Securities | 26,158,350 |
Net Unrealized Gain (Loss) on Investment Securities | (2,283,451) |
Cost of Purchases | - |
Proceeds of Sales | (56,940,777) |
Amortization/Accretion | - |
Transfers into Level 3 | 20,696,508 |
Transfers out of Level 3 | - |
Ending Balance | $ 15,897,809 |
The change in unrealized gain (loss) for the period attributable to Level 3 securities held at October 31, 2015 | $ 106,019 |
Equities - Materials | |
Beginning Balance | $ - |
Net Realized Gain (Loss) on Investment Securities | 756,975 |
Net Unrealized Gain (Loss) on Investment Securities | 8,418,482 |
Cost of Purchases | 4,180,368 |
Proceeds of Sales | (11,841,958) |
Amortization/Accretion | - |
Transfers into Level 3 | 12,926,154 |
Transfers out of Level 3 | - |
Ending Balance | $ 14,440,021 |
The change in unrealized gain (loss) for the period attributable to Level 3 securities held at October 31, 2015 | $ 8,418,482 |
Other Investments in Securities | |
Beginning Balance | $ - |
Net Realized Gain (Loss) on Investment Securities | - |
Net Unrealized Gain (Loss) on Investment Securities | 1,098,419 |
Cost of Purchases | 11,275,337 |
Proceeds of Sales | - |
Amortization/Accretion | - |
Transfers into Level 3 | - |
Transfers out of Level 3 | - |
Ending Balance | $ 12,373,756 |
The change in unrealized gain (loss) for the period attributable to Level 3 securities held at October 31, 2015 | $ 1,098,419 |
The information used in the above reconciliations represents fiscal year to date activity for any Investments in Securities identified as using Level 3 inputs at either the beginning or the end of the current fiscal period. Transfers into Level 3 were attributable to a lack of observable market data resulting from decreases in market activity, decreases in liquidity, security restructurings or corporate actions. Transfers out of Level 3 were attributable to observable market data becoming available for those securities. Transfers in or out of Level 3 represent the beginning value of any Security or Instrument where a change in the pricing level occurred from the beginning to the end of the period. The cost of purchases and the proceeds of sales may include securities received or delivered through corporate actions or exchanges. Realized and unrealized gains (losses) disclosed in the reconciliations are included in Net Gain (Loss) on the Fund's Statement of Operations. |
See accompanying notes which are an integral part of the financial statements.
Annual Report
Fidelity China Region Fund
Statement of Assets and Liabilities
| | October 31, 2015 |
| | |
Assets | | |
Investment in securities, at value (including securities loaned of $71,336,273) - See accompanying schedule: Unaffiliated issuers (cost $1,412,323,751) | $ 1,324,349,568 | |
Fidelity Central Funds (cost $94,220,653) | 94,220,653 | |
Total Investments (cost $1,506,544,404) | | $ 1,418,570,221 |
Foreign currency held at value (cost $10,322) | | 10,322 |
Receivable for investments sold | | 31,588,752 |
Receivable for fund shares sold | | 744,097 |
Distributions receivable from Fidelity Central Funds | | 146,630 |
Prepaid expenses | | 4,421 |
Other receivables | | 64,001 |
Total assets | | 1,451,128,444 |
| | |
Liabilities | | |
Payable to custodian bank | $ 614,622 | |
Payable for investments purchased | 29,848,266 | |
Payable for fund shares redeemed | 1,720,602 | |
Accrued management fee | 778,922 | |
Distribution and service plan fees payable | 21,873 | |
Other affiliated payables | 279,048 | |
Other payables and accrued expenses | 121,214 | |
Collateral on securities loaned, at value | 74,180,545 | |
Total liabilities | | 107,565,092 |
| | |
Net Assets | | $ 1,343,563,352 |
Net Assets consist of: | | |
Paid in capital | | $ 1,260,547,395 |
Undistributed net investment income | | 15,009,760 |
Accumulated undistributed net realized gain (loss) on investments and foreign currency transactions | | 155,980,478 |
Net unrealized appreciation (depreciation) on investments and assets and liabilities in foreign currencies | | (87,974,281) |
Net Assets | | $ 1,343,563,352 |
Statement of Assets and Liabilities - continued
| | October 31, 2015 |
| | |
Calculation of Maximum Offering Price | | |
Class A:
Net Asset Value and redemption price per share ($32,761,115 ÷ 1,116,422 shares) | | $ 29.34 |
| | |
Maximum offering price per share (100/94.25 of $29.34) | | $ 31.13 |
Class T:
Net Asset Value and redemption price per share ($6,409,433 ÷ 219,622 shares) | | $ 29.18 |
| | |
Maximum offering price per share (100/96.50 of $29.18) | | $ 30.24 |
Class B:
Net Asset Value and offering price per share ($803,297 ÷ 27,731 shares)A | | $ 28.97 |
| | |
Class C:
Net Asset Value and offering price per share ($14,354,928 ÷ 500,466 shares)A | | $ 28.68 |
| | |
China Region:
Net Asset Value, offering price and redemption price per share ($1,262,273,952 ÷ 42,556,989 shares) | | $ 29.66 |
| | |
Class I:
Net Asset Value, offering price and redemption price per share ($26,960,627 ÷ 913,526 shares) | | $ 29.51 |
A Redemption price per share is equal to net asset value less any applicable contingent deferred sales charge.
See accompanying notes which are an integral part of the financial statements.
Annual Report
Fidelity China Region Fund
Financial Statements - continued
Statement of Operations
| Year ended October 31, 2015 |
Investment Income | | |
Dividends | | $ 33,758,610 |
Special dividends | | 6,256,295 |
Interest | | 52 |
Income from Fidelity Central Funds | | 1,633,565 |
Income before foreign taxes withheld | | 41,648,522 |
Less foreign taxes withheld | | (2,809,673) |
Total income | | 38,838,849 |
| | |
Expenses | | |
Management fee | $ 10,781,575 | |
Transfer agent fees | 3,034,252 | |
Distribution and service plan fees | 263,655 | |
Accounting and security lending fees | 701,186 | |
Custodian fees and expenses | 496,967 | |
Independent trustees' compensation | 6,577 | |
Registration fees | 169,544 | |
Audit | 76,554 | |
Legal | 3,876 | |
Interest | 8,766 | |
Miscellaneous | 11,466 | |
Total expenses before reductions | 15,554,418 | |
Expense reductions | (386,498) | 15,167,920 |
Net investment income (loss) | | 23,670,929 |
Realized and Unrealized Gain (Loss) | | |
Net realized gain (loss) on: | | |
Investment securities: | | |
Unaffiliated issuers (net of foreign taxes of $22,185) | 238,768,578 | |
Other affiliated issuers | (1,777,152) | |
Foreign currency transactions | (1,517,412) | |
Total net realized gain (loss) | | 235,474,014 |
Change in net unrealized appreciation (depreciation) on: Investment securities | (344,544,479) | |
Assets and liabilities in foreign currencies | 3,269 | |
Total change in net unrealized appreciation (depreciation) | | (344,541,210) |
Net gain (loss) | | (109,067,196) |
Net increase (decrease) in net assets resulting from operations | | $ (85,396,267) |
Statement of Changes in Net Assets
| Year ended
October 31,
2015 | Year ended
October 31,
2014 |
Increase (Decrease) in Net Assets | | |
Operations | | |
Net investment income (loss) | $ 23,670,929 | $ 13,925,917 |
Net realized gain (loss) | 235,474,014 | 191,786,909 |
Change in net unrealized appreciation (depreciation) | (344,541,210) | (115,260,428) |
Net increase (decrease) in net assets resulting from operations | (85,396,267) | 90,452,398 |
Distributions to shareholders from net investment income | (13,114,934) | (15,459,434) |
Distributions to shareholders from net realized gain | (172,413,722) | (136,131,549) |
Total distributions | (185,528,656) | (151,590,983) |
Share transactions - net increase (decrease) | 200,238,928 | 1,574,280 |
Redemption fees | 2,391,591 | 349,352 |
Total increase (decrease) in net assets | (68,294,404) | (59,214,953) |
| | |
Net Assets | | |
Beginning of period | 1,411,857,756 | 1,471,072,709 |
End of period (including undistributed net investment income of $15,009,760 and undistributed net investment income of $12,102,115, respectively) | $ 1,343,563,352 | $ 1,411,857,756 |
See accompanying notes which are an integral part of the financial statements.
Annual Report
Financial Highlights - Fidelity China Region Fund Class A
Years ended October 31, | 2015 | 2014 | 2013 | 2012 | 2011 |
Selected Per-Share Data | | | | | |
Net asset value, beginning of period | $ 34.18 | $ 35.56 | $ 28.53 | $ 27.28 | $ 31.61 |
Income from Investment Operations | | | | | |
Net investment income (loss) C | .40F | .21 | .30 | .36 | .33 |
Net realized and unrealized gain (loss) | (.83) | 2.01 I | 7.06 | 1.42 | (4.33) |
Total from investment operations | (.43) | 2.22 | 7.36 | 1.78 | (4.00) |
Distributions from net investment income | (.22) | (.30) | (.34) | (.19) | (.31) |
Distributions from net realized gain | (4.24) | (3.31) | - | (.34) | (.03) |
Total distributions | (4.46) | (3.61) | (.34) | (.53) | (.34) |
Redemption fees added to paid in capitalC | .05 | .01 | .01 | -H | .01 |
Net asset value, end of period | $ 29.34 | $ 34.18 | $ 35.56 | $ 28.53 | $ 27.28 |
Total ReturnA, B | (1.45)% | 6.45% I | 26.07% | 6.70% | (12.79)% |
Ratios to Average Net AssetsD, G | | | | | |
Expenses before reductions | 1.28% | 1.35% | 1.35% | 1.36% | 1.37% |
Expenses net of fee waivers, if any | 1.28% | 1.35% | 1.35% | 1.36% | 1.37% |
Expenses net of all reductions | 1.26% | 1.35% | 1.31% | 1.29% | 1.31% |
Net investment income (loss) | 1.26%F | .64% | .94% | 1.35% | 1.07% |
Supplemental Data | | | | | |
Net assets, end of period (000 omitted) | $ 32,761 | $ 21,728 | $ 20,623 | $ 13,539 | $ 14,808 |
Portfolio turnover rateE | 151% | 87% | 92% | 107% | 87% |
ATotal returns would have been lower if certain expenses had not been reduced during the applicable periods shown. BTotal returns do not include the effect of the sales charges. CCalculated based on average shares outstanding during the period. DFees and expenses of any underlying Fidelity Central Funds are not included in the Fund's expense ratio. The Fund indirectly bears its proportionate share of the expenses of any underlying Fidelity Central Funds. EAmount does not include the portfolio activity of any underlying Fidelity Central Funds. FInvestment income per share reflects a large, non-recurring dividend which amounted to $.13 per share. Excluding this non-recurring dividend, the ratio of net investment income (loss) to average net assets would have been .85%. GExpense ratios reflect operating expenses of the class. Expenses before reductions do not reflect amounts reimbursed by the investment adviser or reductions from brokerage service arrangements or reductions from other expense offset arrangements and do not represent the amount paid by the class during periods when reimbursements or reductions occur. Expenses net of fee waivers reflect expenses after reimbursement by the investment adviser but prior to reductions from brokerage service arrangements or other expense offset arrangements. Expenses net of all reductions represent the net expenses paid by the class. HAmount represents less than $.005 per share. IAmount includes a reimbursement from the investment adviser for an operational error which amounted to $.01 per share. Excluding this reimbursement, the total return would have been 6.42%. |
Financial Highlights - Fidelity China Region Fund Class T
Years ended October 31, | 2015 | 2014 | 2013 | 2012 | 2011 |
Selected Per-Share Data | | | | | |
Net asset value, beginning of period | $ 34.02 | $ 35.40 | $ 28.40 | $ 27.13 | $ 31.48 |
Income from Investment Operations | | | | | |
Net investment income (loss) C | .30F | .12 | .21 | .29 | .25 |
Net realized and unrealized gain (loss) | (.83) | 1.99 J | 7.04 | 1.40 | (4.32) |
Total from investment operations | (.53) | 2.11 | 7.25 | 1.69 | (4.07) |
Distributions from net investment income | (.12) | (.19) | (.26) | (.08) | (.27) |
Distributions from net realized gain | (4.24) | (3.31) | - | (.34) | (.03) |
Total distributions | (4.36) | (3.50) | (.26) | (.42) | (.29) I |
Redemption fees added to paid in capitalC | .05 | .01 | .01 | -H | .01 |
Net asset value, end of period | $ 29.18 | $ 34.02 | $ 35.40 | $ 28.40 | $ 27.13 |
Total ReturnA, B | (1.79)% | 6.15% J | 25.74% | 6.38% | (13.04)% |
Ratios to Average Net AssetsD, G | | | | | |
Expenses before reductions | 1.62% | 1.65% | 1.64% | 1.64% | 1.63% |
Expenses net of fee waivers, if any | 1.62% | 1.65% | 1.64% | 1.64% | 1.63% |
Expenses net of all reductions | 1.60% | 1.65% | 1.60% | 1.57% | 1.57% |
Net investment income (loss) | .92%F | .35% | .65% | 1.06% | .81% |
Supplemental Data | | | | | |
Net assets, end of period (000 omitted) | $ 6,409 | $ 6,305 | $ 5,965 | $ 4,349 | $ 5,281 |
Portfolio turnover rateE | 151% | 87% | 92% | 107% | 87% |
ATotal returns would have been lower if certain expenses had not been reduced during the applicable periods shown. BTotal returns do not include the effect of the sales charges. CCalculated based on average shares outstanding during the period. DFees and expenses of any underlying Fidelity Central Funds are not included in the Fund's expense ratio. The Fund indirectly bears its proportionate share of the expenses of any underlying Fidelity Central Funds. EAmount does not include the portfolio activity of any underlying Fidelity Central Funds. FInvestment income per share reflects a large, non-recurring dividend which amounted to $.13 per share. Excluding this non-recurring dividend, the ratio of net investment income (loss) to average net assets would have been .51%. GExpense ratios reflect operating expenses of the class. Expenses before reductions do not reflect amounts reimbursed by the investment adviser or reductions from brokerage service arrangements or reductions from other expense offset arrangements and do not represent the amount paid by the class during periods when reimbursements or reductions occur. Expenses net of fee waivers reflect expenses after reimbursement by the investment adviser but prior to reductions from brokerage service arrangements or other expense offset arrangements. Expenses net of all reductions represent the net expenses paid by the class. HAmount represents less than $.005 per share. ITotal distributions of $.29 per share is comprised of distributions from net investment income of $.268 and distributions from net realized gain of $.025 per share. JAmount includes a reimbursement from the investment adviser for an operational error which amounted to $.01 per share. Excluding this reimbursement, the total return would have been 6.12%. |
See accompanying notes which are an integral part of the financial statements.
Annual Report
Financial Highlights - Fidelity China Region Fund Class B
Years ended October 31, | 2015 | 2014 | 2013 | 2012 | 2011 |
Selected Per-Share Data | | | | | |
Net asset value, beginning of period | $ 33.79 | $ 35.12 | $ 28.16 | $ 26.94 | $ 31.23 |
Income from Investment Operations | | | | | |
Net investment income (loss) C | .14F | (.04) | .06 | .16 | .10 |
Net realized and unrealized gain (loss) | (.80) | 1.99 I | 6.99 | 1.40 | (4.29) |
Total from investment operations | (.66) | 1.95 | 7.05 | 1.56 | (4.19) |
Distributions from net investment income | - | - | (.10) | - | (.08) |
Distributions from net realized gain | (4.21) | (3.29) | - | (.34) | (.03) |
Total distributions | (4.21) | (3.29) | (.10) | (.34) | (.11) |
Redemption fees added to paid in capitalC | .05 | .01 | .01 | -H | .01 |
Net asset value, end of period | $ 28.97 | $ 33.79 | $ 35.12 | $ 28.16 | $ 26.94 |
Total ReturnA, B | (2.23)% | 5.68% I | 25.12% | 5.90% | (13.45)% |
Ratios to Average Net AssetsD, G | | | | | |
Expenses before reductions | 2.10% | 2.11% | 2.10% | 2.11% | 2.12% |
Expenses net of fee waivers, if any | 2.10% | 2.11% | 2.10% | 2.11% | 2.12% |
Expenses net of all reductions | 2.07% | 2.11% | 2.07% | 2.04% | 2.06% |
Net investment income (loss) | .44%F | (.12)% | .19% | .59% | .32% |
Supplemental Data | | | | | |
Net assets, end of period (000 omitted) | $ 803 | $ 1,215 | $ 1,494 | $ 1,533 | $ 1,801 |
Portfolio turnover rateE | 151% | 87% | 92% | 107% | 87% |
ATotal returns would have been lower if certain expenses had not been reduced during the applicable periods shown. BTotal returns do not include the effect of the contingent deferred sales charge. CCalculated based on average shares outstanding during the period. DFees and expenses of any underlying Fidelity Central Funds are not included in the Fund's expense ratio. The Fund indirectly bears its proportionate share of the expenses of any underlying Fidelity Central Funds. EAmount does not include the portfolio activity of any underlying Fidelity Central Funds. FInvestment income per share reflects a large, non-recurring dividend which amounted to $.13 per share. Excluding this non-recurring dividend, the ratio of net investment income (loss) to average net assets would have been .04%. GExpense ratios reflect operating expenses of the class. Expenses before reductions do not reflect amounts reimbursed by the investment adviser or reductions from brokerage service arrangements or reductions from other expense offset arrangements and do not represent the amount paid by the class during periods when reimbursements or reductions occur. Expenses net of fee waivers reflect expenses after reimbursement by the investment adviser but prior to reductions from brokerage service arrangements or other expense offset arrangements. Expenses net of all reductions represent the net expenses paid by the class. HAmount represents less than $.005 per share. IAmount includes a reimbursement from the investment adviser for an operational error which amounted to $.01 per share. Excluding this reimbursement, the total return would have been 5.65%. |
Financial Highlights - Fidelity China Region Fund Class C
Years ended October 31, | 2015 | 2014 | 2013 | 2012 | 2011 |
Selected Per-Share Data | | | | | |
Net asset value, beginning of period | $ 33.56 | $ 34.99 | $ 28.07 | $ 26.86 | $ 31.19 |
Income from Investment Operations | | | | | |
Net investment income (loss) C | .15F | (.02) | .06 | .16 | .10 |
Net realized and unrealized gain (loss) | (.80) | 1.97 I | 6.97 | 1.39 | (4.28) |
Total from investment operations | (.65) | 1.95 | 7.03 | 1.55 | (4.18) |
Distributions from net investment income | (.04) | (.08) | (.12) | - | (.13) |
Distributions from net realized gain | (4.24) | (3.31) | - | (.34) | (.03) |
Total distributions | (4.28) | (3.39) | (.12) | (.34) | (.16) |
Redemption fees added to paid in capitalC | .05 | .01 | .01 | -H | .01 |
Net asset value, end of period | $ 28.68 | $ 33.56 | $ 34.99 | $ 28.07 | $ 26.86 |
Total ReturnA, B | (2.21)% | 5.71% I | 25.14% | 5.88% | (13.46)% |
Ratios to Average Net AssetsD, G | | | | | |
Expenses before reductions | 2.05% | 2.07% | 2.10% | 2.11% | 2.12% |
Expenses net of fee waivers, if any | 2.05% | 2.07% | 2.10% | 2.11% | 2.12% |
Expenses net of all reductions | 2.02% | 2.07% | 2.07% | 2.04% | 2.06% |
Net investment income (loss) | .49%F | (.07)% | .19% | .59% | .32% |
Supplemental Data | | | | | |
Net assets, end of period (000 omitted) | $ 14,355 | $ 10,445 | $ 6,957 | $ 4,515 | $ 5,230 |
Portfolio turnover rateE | 151% | 87% | 92% | 107% | 87% |
ATotal returns would have been lower if certain expenses had not been reduced during the applicable periods shown. BTotal returns do not include the effect of the contingent deferred sales charge. CCalculated based on average shares outstanding during the period. DFees and expenses of any underlying Fidelity Central Funds are not included in the Fund's expense ratio. The Fund indirectly bears its proportionate share of the expenses of any underlying Fidelity Central Funds. EAmount does not include the portfolio activity of any underlying Fidelity Central Funds. FInvestment income per share reflects a large, non-recurring dividend which amounted to $.13 per share. Excluding this non-recurring dividend, the ratio of net investment income (loss) to average net assets would have been .09%. GExpense ratios reflect operating expenses of the class. Expenses before reductions do not reflect amounts reimbursed by the investment adviser or reductions from brokerage service arrangements or reductions from other expense offset arrangements and do not represent the amount paid by the class during periods when reimbursements or reductions occur. Expenses net of fee waivers reflect expenses after reimbursement by the investment adviser but prior to reductions from brokerage service arrangements or other expense offset arrangements. Expenses net of all reductions represent the net expenses paid by the class. HAmount represents less than $.005 per share. IAmount includes a reimbursement from the investment adviser for an operational error which amounted to $.01 per share. Excluding this reimbursement, the total return would have been 5.68%. |
See accompanying notes which are an integral part of the financial statements.
Annual Report
Financial Highlights - Fidelity China Region Fund
Years ended October 31, | 2015 | 2014 | 2013 | 2012 | 2011 |
Selected Per-Share Data | | | | | |
Net asset value, beginning of period | $ 34.51 | $ 35.83 | $ 28.73 | $ 27.49 | $ 31.81 |
Income from Investment Operations | | | | | |
Net investment income (loss) B | .51E | .33 | .41 | .45 | .44 |
Net realized and unrealized gain (loss) | (.84) | 2.03 I | 7.11 | 1.42 | (4.37) |
Total from investment operations | (.33) | 2.36 | 7.52 | 1.87 | (3.93) |
Distributions from net investment income | (.33) | (.38) | (.43) | (.29) | (.38) |
Distributions from net realized gain | (4.24) | (3.31) | - | (.34) | (.03) |
Total distributions | (4.57) | (3.69) | (.43) | (.63) | (.40) H |
Redemption fees added to paid in capitalB | .05 | .01 | .01 | -G | .01 |
Net asset value, end of period | $ 29.66 | $ 34.51 | $ 35.83 | $ 28.73 | $ 27.49 |
Total ReturnA | (1.14)% | 6.83% I | 26.51% | 7.01% | (12.52)% |
Ratios to Average Net AssetsC, F | | | | | |
Expenses before reductions | .99% | 1.01% | 1.02% | 1.04% | 1.04% |
Expenses net of fee waivers, if any | .98% | 1.01% | 1.02% | 1.04% | 1.04% |
Expenses net of all reductions | .96% | 1.01% | .98% | .98% | .98% |
Net investment income (loss) | 1.55%E | .99% | 1.27% | 1.66% | 1.40% |
Supplemental Data | | | | | |
Net assets, end of period (000 omitted) | $1,262,274 | $ 1,352,761 | $ 1,425,828 | $ 1,265,488 | $ 1,515,084 |
Portfolio turnover rateD | 151% | 87% | 92% | 107% | 87% |
ATotal returns would have been lower if certain expenses had not been reduced during the applicable periods shown. BCalculated based on average shares outstanding during the period. CFees and expenses of any underlying Fidelity Central Funds are not included in the Fund's expense ratio. The Fund indirectly bears its proportionate share of the expenses of any underlying Fidelity Central Funds. DAmount does not include the portfolio activity of any underlying Fidelity Central Funds. EInvestment income per share reflects a large, non-recurring dividend which amounted to $.13 per share. Excluding this non-recurring dividend, the ratio of net investment income (loss) to average net assets would have been 1.15%. FExpense ratios reflect operating expenses of the class. Expenses before reductions do not reflect amounts reimbursed by the investment adviser or reductions from brokerage service arrangements or reductions from other expense offset arrangements and do not represent the amount paid by the class during periods when reimbursements or reductions occur. Expenses net of fee waivers reflect expenses after reimbursement by the investment adviser but prior to reductions from brokerage service arrangements or other expense offset arrangements. Expenses net of all reductions represent the net expenses paid by the class. GAmount represents less than $.005 per share. HTotal distributions of $.40 per share is comprised of distributions from net investment income of $.376 and distributions from net realized gain of $.025 per share. IAmount includes a reimbursement from the investment adviser for an operational error which amounted to $.01 per share. Excluding this reimbursement, the total return would have been 6.80%. |
Financial Highlights - Fidelity China Region Fund Class I
Years ended October 31, | 2015 | 2014 | 2013 | 2012 | 2011 |
Selected Per-Share Data | | | | | |
Net asset value, beginning of period | $ 34.39 | $ 35.75 | $ 28.68 | $ 27.46 | $ 31.79 |
Income from Investment Operations | | | | | |
Net investment income (loss) B | .51E | .34 | .42 | .45 | .43 |
Net realized and unrealized gain (loss) | (.84) | 2.02 I | 7.10 | 1.42 | (4.37) |
Total from investment operations | (.33) | 2.36 | 7.52 | 1.87 | (3.94) |
Distributions from net investment income | (.36) | (.43) | (.46) | (.31) | (.37) |
Distributions from net realized gain | (4.24) | (3.31) | - | (.34) | (.03) |
Total distributions | (4.60) | (3.73) H | (.46) | (.65) | (.40) |
Redemption fees added to paid in capitalB | .05 | .01 | .01 | -G | .01 |
Net asset value, end of period | $ 29.51 | $ 34.39 | $ 35.75 | $ 28.68 | $ 27.46 |
Total ReturnA | (1.14)% | 6.87% I | 26.58% | 7.02% | (12.56)% |
Ratios to Average Net AssetsC, F | | | | | |
Expenses before reductions | .97% | .98% | .97% | 1.04% | 1.06% |
Expenses net of fee waivers, if any | .97% | .98% | .97% | 1.04% | 1.06% |
Expenses net of all reductions | .95% | .98% | .93% | .98% | 1.01% |
Net investment income (loss) | 1.57%E | 1.01% | 1.32% | 1.66% | 1.38% |
Supplemental Data | | | | | |
Net assets, end of period (000 omitted) | $ 26,961 | $ 19,404 | $ 10,206 | $ 1,958 | $ 2,034 |
Portfolio turnover rateD | 151% | 87% | 92% | 107% | 87% |
ATotal returns would have been lower if certain expenses had not been reduced during the applicable periods shown. BCalculated based on average shares outstanding during the period. CFees and expenses of any underlying Fidelity Central Funds are not included in the Fund's expense ratio. The Fund indirectly bears its proportionate share of the expenses of any underlying Fidelity Central Funds. DAmount does not include the portfolio activity of any underlying Fidelity Central Funds. EInvestment income per share reflects a large, non-recurring dividend which amounted to $.13 per share. Excluding this non-recurring dividend, the ratio of net investment income (loss) to average net assets would have been 1.16%. FExpense ratios reflect operating expenses of the class. Expenses before reductions do not reflect amounts reimbursed by the investment adviser or reductions from brokerage service arrangements or reductions from other expense offset arrangements and do not represent the amount paid by the class during periods when reimbursements or reductions occur. Expenses net of fee waivers reflect expenses after reimbursement by the investment adviser but prior to reductions from brokerage service arrangements or other expense offset arrangements. Expenses net of all reductions represent the net expenses paid by the class. GAmount represents less than $.005 per share. HTotal distributions of $3.73 per share is comprised of distributions from net investment income of $.425 and distributions from net realized gain of $3.306 per share. IAmount includes a reimbursement from the investment adviser for an operational error which amounted to $.01 per share. Excluding this reimbursement, the total return would have been 6.84%. |
See accompanying notes which are an integral part of the financial statements.
Annual Report
For the period ended October 31, 2015
1. Organization.
Fidelity China Region Fund (the Fund) is a fund of Fidelity Investment Trust (the Trust) and is authorized to issue an unlimited number of shares. The Trust is registered under the Investment Company Act of 1940, as amended (the 1940 Act), as an open-end management investment company organized as a Massachusetts business trust. The Fund offers Class A, Class T, Class C, China Region and Class I (formerly Institutional Class) shares, each of which, along with Class B shares, has equal rights as to assets and voting privileges. Class B shares are closed to new accounts and additional purchases, except for exchanges and reinvestments. Each class has exclusive voting rights with respect to matters that affect that class. Class B shares will automatically convert to Class A shares after a holding period of seven years from the initial date of purchase. The Fund's investments in emerging markets can be subject to social, economic, regulatory, and political uncertainties and can be extremely volatile.
2. Investments in Fidelity Central Funds.
The Fund invests in Fidelity Central Funds, which are open-end investment companies generally available only to other investment companies and accounts managed by the investment adviser and its affiliates. The Fund's Schedule of Investments lists each of the Fidelity Central Funds held as of period end, if any, as an investment of the Fund, but does not include the underlying holdings of each Fidelity Central Fund. As an Investing Fund, the Fund indirectly bears its proportionate share of the expenses of the underlying Fidelity Central Funds.
The Money Market Central Funds seek preservation of capital and current income and are managed by Fidelity Investments Money Management, Inc. (FIMM), an affiliate of the investment adviser. Annualized expenses of the Money Market Central Funds as of their most recent shareholder report date are less than .005%.
A complete unaudited list of holdings for each Fidelity Central Fund is available upon request or at the Securities and Exchange Commission (the SEC) website at www.sec.gov. In addition, the financial statements of the Fidelity Central Funds, which are not covered by the Fund's Report of Independent Registered Public Accounting Firm, are available on the SEC website or upon request.
3. Significant Accounting Policies.
The financial statements have been prepared in conformity with accounting principles generally accepted in the United States of America (GAAP), which require management to make certain estimates and assumptions at the date of the financial statements. Actual results could differ from those estimates. Subsequent events, if any, through the date that the financial statements were issued have been evaluated in the preparation of the financial statements. The following summarizes the significant accounting policies of the Fund:
Investment Valuation. Investments are valued as of 4:00 p.m. Eastern time on the last calendar day of the period. The Board of Trustees (the Board) has delegated the day to day responsibility for the valuation of the Fund's investments to the Fidelity Management & Research Company (FMR) Fair Value Committee (the Committee). In accordance with valuation policies and procedures approved by the Board, the Fund attempts to obtain prices from one or more third party pricing vendors or brokers to value its investments. When current market prices, quotations or currency exchange rates are not readily available or reliable, investments will be fair valued in good faith by the Committee, in accordance with procedures adopted by the Board. Factors used in determining fair value vary by investment type and may include market or investment specific events. The frequency with which these procedures are used cannot be predicted and they may be utilized to a significant extent. The Committee oversees the Fund's valuation policies and procedures and reports to the Board on the Committee's activities and fair value determinations. The Board monitors the appropriateness of the procedures used in valuing the Fund's investments and ratifies the fair value determinations of the Committee.
The Fund categorizes the inputs to valuation techniques used to value its investments into a disclosure hierarchy consisting of three levels as shown below:
Level 1 - quoted prices in active markets for identical investments
Level 2 - other significant observable inputs (including quoted prices for similar investments, interest rates, prepayment speeds, etc.)
Level 3 - unobservable inputs (including the Fund's own assumptions based on the best information available)
Valuation techniques used to value the Fund's investments by major category are as follows:
Equity securities, including restricted securities, for which market quotations are readily available, are valued at the last reported sale price or official closing price as reported by a third party pricing vendor on the primary market or exchange on which they are traded and are categorized as Level 1 in the hierarchy. In the event there were no sales during the day or closing prices are not available, securities are valued at the last quoted bid price or may be valued using the last available price and are generally categorized as Level 2 in the hierarchy. For foreign equity securities, when market or security specific events arise, comparisons to the valuation of American Depositary Receipts (ADRs), futures contracts, Exchange-Traded Funds (ETFs) and certain indexes as well as quoted prices for similar securities may be used and would be categorized as Level 2 in the hierarchy. Utilizing
Annual Report
3. Significant Accounting Policies - continued
Investment Valuation - continued
these techniques may result in transfers between Level 1 and Level 2. For equity securities, including restricted securities, where observable inputs are limited, assumptions about market activity and risk are used and these securities may be categorized as Level 3 in the hierarchy. Equity securities, including restricted securities, for which observable inputs are not available are valued using alternate valuation approaches, including the market approach and the income approach and are categorized as Level 3 in the hierarchy. The market approach generally consists of using comparable market transactions while the income approach generally consists of using the net present value of estimated future cash flows, adjusted as appropriate for liquidity, credit, market and/or other risk factors.
Investments in open-end mutual funds, including the Fidelity Central Funds, are valued at their closing net asset value (NAV) each business day and are categorized as Level 1 in the hierarchy.
The following provides information on Level 3 securities held by the Fund that were valued at period end based on unobservable inputs. These amounts exclude valuations provided by a broker.
Asset Type | Fair Value at
10/31/15 | Valuation
Technique(s) | Unobservable Input | Amount or Range/
Weighted Average | Impact to Valuation
from an Increase
in InputA |
Equities | $ 57,081,027 | Adjusted transaction price | Proxy movement | 0.0% - 0.1% / 0.1% | Increase |
| | Last transaction price | Transaction price | $ 5.49 | Increase |
| | Proposed transaction price | Transaction price | $ 4.97 | Increase |
A Represents the expected directional change in the fair value of the Level 3 investments that would result from an increase in the corresponding input. A decrease to the unobservable input would have the opposite effect. Significant changes in these inputs could result in significantly higher or lower fair value measurements.
Changes in valuation techniques may result in transfers in or out of an assigned level within the disclosure hierarchy. The aggregate value of investments by input level as of October 31, 2015, as well as a roll forward of Level 3 investments, is included at the end of the Fund's Schedule of Investments.
Foreign Currency. The Fund may use foreign currency contracts to facilitate transactions in foreign-denominated securities. Gains and losses from these transactions may arise from changes in the value of the foreign currency or if the counterparties do not perform under the contracts' terms.
Foreign-denominated assets, including investment securities, and liabilities are translated into U.S. dollars at the exchange rates at period end. Purchases and sales of investment securities, income and dividends received and expenses denominated in foreign currencies are translated into U.S. dollars at the exchange rate in effect on the transaction date.
The effects of exchange rate fluctuations on investments are included with the net realized and unrealized gain (loss) on investment securities. Other foreign currency transactions resulting in realized and unrealized gain (loss) are disclosed separately.
Investment Transactions and Income. For financial reporting purposes, the Fund's investment holdings and NAV include trades executed through the end of the last business day of the period. The NAV per share for processing shareholder transactions is calculated as of the close of business of the New York Stock Exchange (NYSE), normally 4:00 p.m. Eastern time and includes trades executed through the end of the prior business day. Gains and losses on securities sold are determined on the basis of identified cost. Dividend income is recorded on the ex-dividend date, except for certain dividends from foreign securities where the ex-dividend date may have passed, which are recorded as soon as the Fund is informed of the ex-dividend date. Non-cash dividends included in dividend income, if any, are recorded at the fair market value of the securities received. Income and capital gain distributions from Fidelity Central Funds, if any, are recorded on the ex-dividend date. Large, non-recurring dividends recognized by the Fund are presented separately on the Statement of Operations as "Special Dividends" and the impact of these dividends is presented in the Financial Highlights. Interest income is accrued as earned and includes coupon interest and amortization of premium and accretion of discount on debt securities as applicable. Investment income is recorded net of foreign taxes withheld where recovery of such taxes is uncertain.
Class Allocations and Expenses. Investment income, realized and unrealized capital gains and losses, common expenses of the Fund, and certain fund-level expense reductions, if any, are allocated daily on a pro-rata basis to each class based on the relative net assets of each class to the total net assets of the Fund. Each class differs with respect to transfer agent and distribution and service plan fees incurred. Certain expense reductions may also differ by class. For the reporting period, the allocated portion of income and expenses to each class as a percent of its average net assets may vary
Annual Report
Notes to Financial Statements - continued
3. Significant Accounting Policies - continued
Class Allocations and Expenses - continued
due to the timing of recording these transactions in relation to fluctuating net assets of the classes. Expenses directly attributable to a fund are charged to that fund. Expenses attributable to more than one fund are allocated among the respective funds on the basis of relative net assets or other appropriate methods. Expense estimates are accrued in the period to which they relate and adjustments are made when actual amounts are known.
Income Tax Information and Distributions to Shareholders. Each year, the Fund intends to qualify as a regulated investment company under Subchapter M of the Internal Revenue Code, including distributing substantially all of its taxable income and realized gains. As a result, no provision for U.S. Federal income taxes is required. As of October 31, 2015, the Fund did not have any unrecognized tax benefits in the financial statements; nor is the Fund aware of any tax positions for which it is reasonably possible that the total amounts of unrecognized tax benefits will significantly change in the next twelve months. The Fund files a U.S. federal tax return, in addition to state and local tax returns as required. The Fund's federal income tax returns are subject to examination by the Internal Revenue Service (IRS) for a period of three fiscal years after they are filed. State and local tax returns may be subject to examination for an additional fiscal year depending on the jurisdiction. Foreign taxes are provided for based on the Fund's understanding of the tax rules and rates that exist in the foreign markets in which it invests. The Fund is subject to a tax imposed on capital gains by certain countries in which it invests.
Distributions are declared and recorded on the ex-dividend date. Income dividends and capital gain distributions are declared separately for each class. Income and capital gain distributions are determined in accordance with income tax regulations, which may differ from GAAP. In addition, the Fund claimed a portion of the payment made to redeeming shareholders as a distribution for income tax purposes.
Capital accounts within the financial statements are adjusted for permanent book-tax differences. These adjustments have no impact on net assets or the results of operations. Capital accounts are not adjusted for temporary book-tax differences which will reverse in a subsequent period.
Book-tax differences are primarily due to foreign currency transactions, certain foreign taxes, passive foreign investment companies (PFIC), deferred trustees compensation and losses deferred due to wash sales.
The federal tax cost of investment securities and unrealized appreciation (depreciation) as of period end were as follows:
Gross unrealized appreciation | $ 101,234,198 |
Gross unrealized depreciation | (193,197,636) |
Net unrealized appreciation (depreciation) on securities | $ (91,963,438) |
Tax Cost | $ 1,510,533,659 |
The tax-based components of distributable earnings as of period end were as follows:
Undistributed ordinary income | $ 15,009,766 |
Undistributed long-term capital gain | $ 159,969,732 |
Net unrealized appreciation (depreciation) on securities and other investments | $ (91,963,536) |
The tax character of distributions paid was as follows:
| October 31, 2015 | October 31, 2014 |
Ordinary Income | $ 14,374,708 | $ 31,270,708 |
Long-term Capital Gains | 171,153,948 | 120,320,275 |
Total | $ 185,528,656 | $ 151,590,983 |
Short-Term Trading (Redemption) Fees. Shares held by investors in the Fund less than 90 days may have been subject to a redemption fee equal to 1.50% of the NAV of shares redeemed. All redemption fees, which reduce the proceeds of the shareholder redemption, are retained by the Fund and accounted for as an addition to paid in capital.
Restricted Securities. The Fund may invest in securities that are subject to legal or contractual restrictions on resale. These securities generally may be resold in transactions exempt from registration or to the public if the securities are registered. Disposal of these securities may involve time-consuming negotiations and expense, and prompt sale at an acceptable price may be difficult. Information regarding restricted securities is included at the end of the Fund's Schedule of Investments.
4. Purchases and Sales of Investments.
Purchases and sales of securities, other than short-term securities, aggregated $2,320,693,042 and $2,245,851,175, respectively.
Annual Report
5. Fees and Other Transactions with Affiliates.
Management Fee. Fidelity Management & Research Company (the investment adviser) and its affiliates provide the Fund with investment management related services for which the Fund pays a monthly management fee. The management fee is the sum of an individual fund fee rate that is based on an annual rate of .45% of the Fund's average net assets and an annualized group fee rate that averaged .25% during the period. The group fee rate is based upon the average net assets of all the mutual funds advised by the investment adviser, including any mutual funds previously advised by the investment adviser that are currently advised by Fidelity SelectCo, LLC, an affiliate of the investment adviser. The group fee rate decreases as assets under management increase and increases as assets under management decrease. For the reporting period, the total annual management fee rate was .70% of the Fund's average net assets.
Distribution and Service Plan Fees. In accordance with Rule 12b-1 of the 1940 Act, the Fund has adopted separate Distribution and Service Plans for each class of shares. Certain classes pay Fidelity Distributors Corporation (FDC), an affiliate of the investment adviser, separate Distribution and Service Fees, each of which is based on an annual percentage of each class' average net assets. In addition, FDC may pay financial intermediaries for selling shares of the Fund and providing shareholder support services. For the period, the Distribution and Service Fee rates, total fees and amounts retained by FDC were as follows:
| Distribution
Fee | Service
Fee | Total Fees | Retained
by FDC |
Class A | -% | .25% | $ 79,736 | $ 10,281 |
Class T | .25% | .25% | 35,794 | 168 |
Class B | .75% | .25% | 11,489 | 8,617 |
Class C | .75% | .25% | 136,636 | 61,680 |
| | | $ 263,655 | $ 80,746 |
Sales Load. FDC may receive a front-end sales charge of up to 5.75% for selling Class A shares and 3.50% for selling Class T shares, some of which is paid to financial intermediaries for selling shares of the Fund. Depending on the holding period, FDC may receive contingent deferred sales charges levied on Class A, Class T, Class B, and Class C redemptions. The deferred sales charges range from 5.00% to 1.00% for Class B shares, 1.00% for Class C shares, 1.00% for certain purchases of Class A shares and .25% for certain purchases of Class T shares.
For the period, sales charge amounts retained by FDC were as follows:
| Retained
by FDC |
Class A | $ 52,066 |
Class T | 5,399 |
Class B A | 593 |
Class C A | 11,997 |
| $ 70,055 |
A When Class B and Class C shares are initially sold, FDC pays commissions from its own resources to financial intermediaries through which the sales are made.
Transfer Agent Fees. Fidelity Investments Institutional Operations Company, Inc., (FIIOC), an affiliate of the investment adviser, is the transfer, dividend disbursing and shareholder servicing agent for each class of the Fund. FIIOC receives account fees and asset-based fees that vary according to the account size and type of account of the shareholders of the respective classes of the Fund. FIIOC pays for typesetting, printing and mailing of shareholder reports, except proxy statements.
For the period, transfer agent fees for each class were as follows:
| Amount | % of
Class-Level Average
Net Assets |
Class A | $ 76,868 | .24 |
Class T | 23,452 | .33 |
Class B | 3,439 | .30 |
Class C | 35,649 | .26 |
China Region | 2,845,557 | .19 |
Class I | 49,287 | .18 |
| $ 3,034,252 | |
Accounting and Security Lending Fees. Fidelity Service Company, Inc. (FSC), an affiliate of the investment adviser, maintains the Fund's accounting records. The accounting fee is based on the level of average net assets for each month. Under a separate contract, FSC administers the security lending program. The security lending fee is based on the number and duration of lending transactions.
Annual Report
Notes to Financial Statements - continued
5. Fees and Other Transactions with Affiliates - continued
Brokerage Commissions. The Fund placed a portion of its portfolio transactions with brokerage firms which are affiliates of the investment adviser. Brokerage commissions are included in net realized gain (loss) and change in net unrealized appreciation (depreciation) in the Statement of Operations. The commissions paid to these affiliated firms were $12,235 for the period.
Interfund Lending Program. Pursuant to an Exemptive Order issued by the SEC, the Fund, along with other registered investment companies having management contracts with FMR or other affiliated entities of FMR, may participate in an interfund lending program. This program provides an alternative credit facility allowing the funds to borrow from, or lend money to, other participating affiliated funds. At period end, there were no interfund loans outstanding. The Fund's activity in this program during the period for which loans were outstanding was as follows:
Borrower or Lender | Average Loan Balance | Weighted Average
Interest Rate | Interest Expense |
Borrower | $ 14,713,842 | .36% | $ 5,540 |
Other. During the period, the investment adviser reimbursed the Fund for certain losses in the amount of $25,050.
6. Committed Line of Credit.
The Fund participates with other funds managed by the investment adviseror an affiliate in a $4.25 billion credit facility (the "line of credit") to be utilized for temporary or emergency purposes to fund shareholder redemptions or for other short-term liquidity purposes. The Fund has agreed to pay commitment fees on its pro-rata portion of the line of credit, which amounted to $2,209 and is reflected in Miscellaneous expenses on the Statement of Operations. During the period, the Fund did not borrow on this line of credit.
7. Security Lending.
The Fund lends portfolio securities through a lending agent from time to time in order to earn additional income. For equity securities, a lending agent is used and may loan securities to certain qualified borrowers, including Fidelity Capital Markets (FCM), a broker-dealer affiliated with the Fund. On the settlement date of the loan, the Fund receives collateral (in the form of U.S. Treasury obligations, letters of credit and/or cash) against the loaned securities and maintains collateral in an amount not less than 100% of the market value of the loaned securities during the period of the loan. The market value of the loaned securities is determined at the close of business of the Fund and any additional required collateral is delivered to the Fund on the next business day. The Fund or borrower may terminate the loan at any time, and if the borrower defaults on its obligation to return the securities loaned because of insolvency or other reasons, the Fund may apply collateral received from the borrower against the obligation. The Fund may experience delays and costs in recovering the securities loaned. Any cash collateral received is invested in the Fidelity Securities Lending Cash Central Fund. The value of loaned securities and cash collateral at period end are disclosed on the Fund's Statement of Assets and Liabilities. The value of securities loaned to FCM at period end was $2,320,290. Security lending income represents the income earned on investing cash collateral, less rebates paid to borrowers and any lending agent fees associated with the loan, plus any premium payments received for lending certain types of securities. Security lending income is presented in the Statement of Operations as a component of income from Fidelity Central Funds, and includes $11,395 from securities loaned to FCM.
8. Bank Borrowings.
The Fund is permitted to have bank borrowings for temporary or emergency purposes to fund shareholder redemptions or for other short-term liquidity requirements. The Fund has established borrowing arrangements with certain banks. The interest rate on the borrowings is the bank's base rate, as revised from time to time. The average loan balance during the period for which loans were outstanding amounted to $30,719,500. The weighted average interest rate was .63%. The interest expense amounted to $3,226 under the bank borrowing program. At period end, there were no bank borrowings outstanding.
9. Expense Reductions.
Commissions paid to certain brokers with whom the investment adviser, or its affiliates, places trades on behalf of the Fund include an amount in addition to trade execution, which may be rebated back to the Fund to offset certain expenses. This amount totaled $336,939 for the period.
Through arrangements with the Fund's custodian, credits realized as a result of certain uninvested cash balances were used to reduce the Fund's expenses. During the period, these credits reduced the Fund's custody expenses by $217.
Annual Report
9. Expense Reductions - continued
In addition, during the period the investment adviser reimbursed and/or waived a portion of fund-level operating expenses in the amount of $7,986 and a portion of class-level operating expenses as follows:
| Reimbursement |
Class A | $ 320 |
Class T | 14 |
Class B | 3 |
Class C | 160 |
China Region | 40,540 |
Class I | 319 |
| $ 41,356 |
10. Distributions to Shareholders.
Distributions to shareholders of each class were as follows:
Years ended October 31, | 2015 | 2014 |
From net investment income | | |
Class A | $ 147,088 | $ 180,108 |
Class T | 22,529 | 32,344 |
Class C | 12,652 | 17,191 |
China Region | 12,728,622 | 15,122,632 |
Class I | 204,043 | 107,159 |
Total | $ 13,114,934 | $ 15,459,434 |
From net realized gain | | |
Class A | $ 2,783,517 | $ 1,978,191 |
Class T | 789,251 | 554,033 |
Class B | 149,794 | 137,166 |
Class C | 1,276,956 | 701,626 |
China Region | 165,004,911 | 131,926,962 |
Class I | 2,409,293 | 833,571 |
Total | $ 172,413,722 | $ 136,131,549 |
11. Share Transactions.
Share transactions for each class were as follows and may contain automatic conversions between classes or exchanges between funds:
| Shares | Dollars |
Years ended October 31, | 2015 | 2014 | 2015 | 2014 |
Class A | | | | |
Shares sold | 1,058,546 | 299,718 | $ 35,978,665 | $ 10,085,846 |
Reinvestment of distributions | 93,297 | 60,028 | 2,812,898 | 2,013,956 |
Shares redeemed | (671,056) | (304,062) | (22,101,227) | (10,090,492) |
Net increase (decrease) | 480,787 | 55,684 | $ 16,690,336 | $ 2,009,310 |
Class T | | | | |
Shares sold | 151,664 | 59,364 | $ 5,390,399 | $ 1,971,301 |
Reinvestment of distributions | 26,640 | 17,176 | 801,072 | 574,877 |
Shares redeemed | (143,989) | (59,747) | (4,554,275) | (1,983,826) |
Net increase (decrease) | 34,315 | 16,793 | $ 1,637,196 | $ 562,352 |
Class B | | | | |
Shares sold | 2,771 | 1,463 | $ 95,500 | $ 48,104 |
Reinvestment of distributions | 4,834 | 3,586 | 144,877 | 119,685 |
Shares redeemed | (15,827) | (11,640) | (523,534) | (382,157) |
Net increase (decrease) | (8,222) | (6,591) | $ (283,157) | $ (214,368) |
Annual Report
Notes to Financial Statements - continued
11. Share Transactions - continued
| Shares | Dollars |
Years ended October 31, | 2015 | 2014 | 2015 | 2014 |
Class C | | | | |
Shares sold | 412,366 | 172,291 | $ 14,420,908 | $ 5,779,242 |
Reinvestment of distributions | 38,139 | 18,485 | 1,131,586 | 612,773 |
Shares redeemed | (261,252) | (78,373) | (7,778,046) | (2,559,009) |
Net increase (decrease) | 189,253 | 112,403 | $ 7,774,448 | $ 3,833,006 |
China Region | | | | |
Shares sold | 18,091,274 | 6,962,379 | $ 635,141,274 | $ 236,836,534 |
Reinvestment of distributions | 5,608,420 | 4,157,611 | 170,439,887 | 140,360,927 |
Shares redeemed | (20,336,385) | (11,721,340) | (642,334,138) | (391,493,808) |
Net increase (decrease) | 3,363,309 | (601,350) | $ 163,247,023 | $ (14,296,347) |
Class I | | | | |
Shares sold | 1,017,162 | 632,067 | $ 33,130,120 | $ 21,560,054 |
Reinvestment of distributions | 58,945 | 23,866 | 1,781,897 | 802,629 |
Shares redeemed | (726,796) | (377,199) | (23,738,935) | (12,682,356) |
Net increase (decrease) | 349,311 | 278,734 | $ 11,173,082 | $ 9,680,327 |
12. Other.
The Fund's organizational documents provide former and current trustees and officers with a limited indemnification against liabilities arising in connection with the performance of their duties to the Fund. In the normal course of business, the Fund may also enter into contracts that provide general indemnifications. The Fund's maximum exposure under these arrangements is unknown as this would be dependent on future claims that may be made against the Fund. The risk of material loss from such claims is considered remote.
Annual Report
To the Trustees of Fidelity Investment Trust and the Shareholders of Fidelity China Region Fund:
In our opinion, the accompanying statement of assets and liabilities, including the schedule of investments, and the related statements of operations and of changes in net assets and the financial highlights present fairly, in all material respects, the financial position of Fidelity China Region Fund (a fund of Fidelity Investment Trust) at October 31, 2015, the results of its operations for the year then ended, the changes in its net assets for each of the two years in the period then ended and the financial highlights for each of the five years in the period then ended, in conformity with accounting principles generally accepted in the United States of America. These financial statements and financial highlights (hereafter referred to as "financial statements") are the responsibility of the Fidelity China Region Fund's management. Our responsibility is to express an opinion on these financial statements based on our audits. We conducted our audits of these financial statements in accordance with the standards of the Public Company Accounting Oversight Board (United States). Those standards require that we plan and perform the audit to obtain reasonable assurance about whether the financial statements are free of material misstatement. An audit includes examining, on a test basis, evidence supporting the amounts and disclosures in the financial statements, assessing the accounting principles used and significant estimates made by management, and evaluating the overall financial statement presentation. We believe that our audits, which included confirmation of securities at October 31, 2015 by correspondence with the custodian and brokers, provide a reasonable basis for our opinion.
PricewaterhouseCoopers LLP
Boston, Massachusetts
December 22, 2015
Annual Report
The Trustees, Member of the Advisory Board, and officers of the trust and fund, as applicable, are listed below. The Board of Trustees governs the fund and is responsible for protecting the interests of shareholders. The Trustees are experienced executives who meet periodically throughout the year to oversee the fund's activities, review contractual arrangements with companies that provide services to the fund, oversee management of the risks associated with such activities and contractual arrangements, and review the fund's performance. Each of the Trustees oversees 170 funds.
The Trustees hold office without limit in time except that (a) any Trustee may resign; (b) any Trustee may be removed by written instrument, signed by at least two-thirds of the number of Trustees prior to such removal; (c) any Trustee who requests to be retired or who has become incapacitated by illness or injury may be retired by written instrument signed by a majority of the other Trustees; and (d) any Trustee may be removed at any special meeting of shareholders by a two-thirds vote of the outstanding voting securities of the trust. Each Trustee who is not an interested person (as defined in the 1940 Act) of the trust and the fund (Independent Trustee), shall retire not later than the last day of the calendar year in which his or her 75th birthday occurs. The Independent Trustees may waive this mandatory retirement age policy with respect to individual Trustees. The officers and Advisory Board Member hold office without limit in time, except that any officer and Advisory Board Member may resign or may be removed by a vote of a majority of the Trustees at any regular meeting or any special meeting of the Trustees. Except as indicated, each individual has held the office shown or other offices in the same company for the past five years.
Experience, Skills, Attributes, and Qualifications of the Fund's Trustees. The Governance and Nominating Committee has adopted a statement of policy that describes the experience, qualifications, attributes, and skills that are necessary and desirable for potential Independent Trustee candidates (Statement of Policy). The Board believes that each Trustee satisfied at the time he or she was initially elected or appointed a Trustee, and continues to satisfy, the standards contemplated by the Statement of Policy. The Governance and Nominating Committee also engages professional search firms to help identify potential Independent Trustee candidates who have the experience, qualifications, attributes, and skills consistent with the Statement of Policy. From time to time, additional criteria based on the composition and skills of the current Independent Trustees, as well as experience or skills that may be appropriate in light of future changes to board composition, business conditions, and regulatory or other developments, have also been considered by the professional search firms and the Governance and Nominating Committee. In addition, the Board takes into account the Trustees' commitment and participation in Board and committee meetings, as well as their leadership of standing and ad hoc committees throughout their tenure.
In determining that a particular Trustee was and continues to be qualified to serve as a Trustee, the Board has considered a variety of criteria, none of which, in isolation, was controlling. The Board believes that, collectively, the Trustees have balanced and diverse experience, qualifications, attributes, and skills, which allow the Board to operate effectively in governing the fund and protecting the interests of shareholders. Information about the specific experience, skills, attributes, and qualifications of each Trustee, which in each case led to the Board's conclusion that the Trustee should serve (or continue to serve) as a trustee of the fund, is provided below.
Board Structure and Oversight Function. James C. Curvey is an interested person (as defined in the 1940 Act) and currently serves as Chairman. The Trustees have determined that an interested Chairman is appropriate and benefits shareholders because an interested Chairman has a personal and professional stake in the quality and continuity of services provided to the fund. Independent Trustees exercise their informed business judgment to appoint an individual of their choosing to serve as Chairman, regardless of whether the Trustee happens to be independent or a member of management. The Independent Trustees have determined that they can act independently and effectively without having an Independent Trustee serve as Chairman and that a key structural component for assuring that they are in a position to do so is for the Independent Trustees to constitute a substantial majority for the Board. The Independent Trustees also regularly meet in executive session. Ned C. Lautenbach serves as Chairman of the Independent Trustees and as such (i) acts as a liaison between the Independent Trustees and management with respect to matters important to the Independent Trustees and (ii) with management prepares agendas for Board meetings.
Fidelity funds are overseen by different Boards of Trustees. The fund's Board oversees Fidelity's high income and certain equity funds, and other Boards oversee Fidelity's investment-grade bond, money market, asset allocation, and sector funds. The asset allocation funds may invest in Fidelity funds overseen by the fund's Board. The use of separate Boards, each with its own committee structure, allows the Trustees of each group of Fidelity funds to focus on the unique issues of the funds they oversee, including common research, investment, and operational issues. On occasion, the separate Boards establish joint committees to address issues of overlapping consequences for the Fidelity funds overseen by each Board.
The Trustees operate using a system of committees to facilitate the timely and efficient consideration of all matters of importance to the Trustees, the fund, and fund shareholders and to facilitate compliance with legal and regulatory requirements and oversight of the fund's activities and associated risks. The Board, acting through its committees, has charged FMR and its affiliates with (i) identifying events or circumstances the occurrence of which could have demonstrably adverse effects on the fund's business and/or reputation; (ii) implementing processes and controls to lessen the possibility that such events or circumstances occur or to mitigate the effects of such events or circumstances if they do occur; and (iii) creating and maintaining a system designed to evaluate continuously business and market conditions in order to facilitate the identification and implementation processes described in (i) and (ii) above. Because the day-to-day operations and activities of the fund are carried out by or through FMR, its affiliates and other service providers, the fund's exposure to risks is mitigated but not eliminated by the processes overseen by the Trustees. While each of the Board's committees has responsibility for overseeing different aspects of the fund's activities, oversight is exercised primarily through the Operations, Audit, and Compliance Committees. In addition, the Independent Trustees have worked with FMR to enhance the Board's oversight of investment and financial risks, legal and regulatory risks, technology risks, and operational risks, including the development of additional risk reporting to the Board. For example, a working group comprised of Independent Trustees and FMR has worked and continues to work to review the Fidelity funds' valuation-related activities, reporting and risk management. Appropriate personnel, including but not limited to the fund's Chief Compliance Officer (CCO), FMR's internal auditor, the independent accountants, the fund's Treasurer and portfolio management personnel, make periodic reports to the Board's committees, as appropriate, including an annual review of Fidelity's risk management program for the Fidelity funds. The responsibilities of each standing committee, including their oversight responsibilities, are described further under "Standing Committees of the Fund's Trustees."
Annual Report
The fund's Statement of Additional Information (SAI) includes more information about the Trustees. To request a free copy, call Fidelity at 1-877-208-0098.
Interested Trustees*:
Correspondence intended for each Trustee who is an interested person may be sent to Fidelity Investments, 245 Summer Street, Boston, Massachusetts 02210.
Name, Year of Birth; Principal Occupations and Other Relevant Experience+ |
James C. Curvey (1935) |
Year of Election or Appointment: 2007 Trustee Chairman of the Board of Trustees |
| Mr. Curvey also serves as Trustee of other Fidelity funds. Mr. Curvey is a Director of Fidelity Research & Analysis Co. (investment adviser firm, 2009-present), and Vice Chairman (2007-present) and Director of FMR LLC (diversified financial services company). In addition, Mr. Curvey serves as an Overseer for the Boston Symphony Orchestra and a member of the board of Artis-Naples, Naples, Florida, and as a Trustee for Brewster Academy, Wolfeboro, New Hampshire. Previously, Mr. Curvey served as a Director of Fidelity Investments Money Management, Inc. (investment adviser firm, 2009-2014) and a Director of FMR and FMR Co., Inc. (investment adviser firms, 2007-2014). |
Charles S. Morrison (1960) |
Year of Election or Appointment: 2014 Trustee |
| Mr. Morrison also serves as Trustee of other funds. He serves as a Director of Fidelity Investments Money Management, Inc. (FIMM) (investment adviser firm, 2014-present), Director of Fidelity SelectCo, LLC (investment adviser firm, 2014-present), President, Asset Management (2014-present), and is an employee of Fidelity Investments. Previously, Mr. Morrison served as Vice President of Fidelity's Fixed Income and Asset Allocation Funds (2012-2014), President, Fixed Income (2011-2014), Vice President of Fidelity's Money Market Funds (2005-2009), President, Money Market Group Leader of FMR (investment adviser firm, 2009), and Senior Vice President, Money Market Group of FMR (2004-2009). Mr. Morrison also served as Vice President of Fidelity's Bond Funds (2002-2005), certain Balanced Funds (2002-2005), and certain Asset Allocation Funds (2002-2007), and as Senior Vice President (2002-2005) of Fidelity's Bond Division. |
* Trustees have been determined to be "Interested Trustees" by virtue of, among other things, their affiliation with the trust or various entities under common control with FMR.
+ The information above includes each Trustee's principal occupation during the last five years and other information relating to the experience, attributes, and skills relevant to each Trustee's qualifications to serve as a Trustee, which led to the conclusion that each Trustee should serve as a Trustee for the fund.
Annual Report
Trustees and Officers - continued
Independent Trustees:
Correspondence intended for each Independent Trustee (that is, the Trustees other than the Interested Trustees) may be sent to Fidelity Investments, P.O. Box 55235, Boston, Massachusetts 02205-5235.
Name, Year of Birth; Principal Occupations and Other Relevant Experience+ |
Dennis J. Dirks (1948) |
Year of Election or Appointment: 2005 Trustee |
| Mr. Dirks also serves as Trustee of other Fidelity funds. Prior to his retirement in May 2003, Mr. Dirks was Chief Operating Officer and a member of the Board of The Depository Trust & Clearing Corporation (DTCC). He also served as President, Chief Operating Officer, and Board member of The Depository Trust Company (DTC) and President and Board member of the National Securities Clearing Corporation (NSCC). In addition, Mr. Dirks served as Chief Executive Officer and Board member of the Government Securities Clearing Corporation, Chief Executive Officer and Board member of the Mortgage-Backed Securities Clearing Corporation, as a Trustee and a member of the Finance Committee of Manhattan College (2005-2008), as a Trustee and a member of the Finance Committee of AHRC of Nassau County (2006-2008), and as a member of the Independent Directors Council (IDC) Governing Council (2010-2015). Mr. Dirks is a member of the Board of Directors for The Brookville Center for Children's Services, Inc. (2009-present). |
Alan J. Lacy (1953) |
Year of Election or Appointment: 2008 Trustee |
| Mr. Lacy also serves as Trustee of other Fidelity funds. Mr. Lacy serves as a member of the Board of Directors of Dave & Buster's Entertainment, Inc. (restaurant and entertainment complexes, 2010-present) and Bristol-Myers Squibb Company (global pharmaceuticals, 2008-present). In addition, Mr. Lacy served as Senior Adviser (2007-2014) of Oak Hill Capital Partners, L.P. (private equity) and also served as Chief Executive Officer (2000-2005) and Vice Chairman (2005-2006) of Sears Holdings Corporation and Sears, Roebuck and Co. (retail). Mr. Lacy is a member of the Board of Trustees of The National Parks Conservation Association (2006-present). Previously, Mr. Lacy served as Chairman of the Board of Trustees of the National Parks Conservation Association (2008-2011) and as a member of the Board of Directors for The Western Union Company (global money transfer, 2006-2011), The Hillman Companies, Inc. (hardware wholesalers, 2010-2014), and Earth Fare, Inc. (retail grocery, 2010-2014). |
Ned C. Lautenbach (1944) |
Year of Election or Appointment: 2000 Trustee Chairman of the Independent Trustees |
| Mr. Lautenbach also serves as Trustee of other Fidelity funds. Mr. Lautenbach currently serves as the Lead Director of the Eaton Corporation Board of Directors (diversified industrial, 1997-present). Mr. Lautenbach is Chairman of the Board of Directors of Artis-Naples in Naples, Florida (2012-present), a member of the Council on Foreign Relations (1994-present), and a member of the Board of Governors, State University System of Florida (2013-present). Previously, Mr. Lautenbach was a Partner/Advisory Partner at Clayton, Dubilier & Rice, LLC (private equity investment, 1998-2010), as well as a Director of Sony Corporation (2006-2007). |
Joseph Mauriello (1944) |
Year of Election or Appointment: 2008 Trustee |
| Mr. Mauriello also serves as Trustee of other Fidelity funds. Prior to his retirement in January 2006, Mr. Mauriello served in numerous senior management positions including Deputy Chairman and Chief Operating Officer (2004-2005), and Vice Chairman of Financial Services (2002-2004) of KPMG LLP US (professional services, 1965-2005). Mr. Mauriello currently serves as a member of the Board of Directors of XL Group plc. (global insurance and re-insurance, 2006-present) and the Independent Directors Council (IDC) Governing Council (2015-present). Previously, Mr. Mauriello served as a Director of the Hamilton Funds of the Bank of New York (2006-2007) and of Arcadia Resources Inc. (health care services and products, 2007-2012). |
Robert W. Selander (1950) |
Year of Election or Appointment: 2011 Trustee |
| Mr. Selander also serves as Trustee of other Fidelity funds. Mr. Selander serves as a Director of The Western Union Company (global money transfer, 2014-present). Previously, Mr. Selander served as a Member of the Advisory Board of other Fidelity funds (2011), and Executive Vice Chairman (2010), Chief Executive Officer (2009-2010), and President and Chief Executive Officer (1997-2009) of Mastercard, Inc. |
Cornelia M. Small (1944) |
Year of Election or Appointment: 2005 Trustee |
| Ms. Small also serves as Trustee of other Fidelity funds. Ms. Small is a member of the Board of Directors (2009-present) and Chair of the Investment Committee (2010-present) of the Teagle Foundation. Ms. Small also serves on the Investment Committee of the Berkshire Taconic Community Foundation (2008-present). Previously, Ms. Small served as Chairperson (2002-2008) and a member of the Investment Committee and Chairperson (2008-2012) and a member of the Board of Trustees of Smith College. In addition, Ms. Small served as Chief Investment Officer, Director of Global Equity Investments, and a member of the Board of Directors of Scudder, Stevens & Clark and Scudder Kemper Investments. |
William S. Stavropoulos (1939) |
Year of Election or Appointment: 2001 Trustee Vice Chairman of the Independent Trustees |
| Mr. Stavropoulos also serves as Trustee of other Fidelity funds. Mr. Stavropoulos serves as President and Founder of the Michigan Baseball Foundation, the Great Lakes Loons (2007-present). Mr. Stavropoulos is Chairman Emeritus of the Board of Directors of The Dow Chemical Company, where he previously served in numerous senior management positions, including President, CEO (1995-2000; 2002-2004), Chairman of the Executive Committee (2000-2006), and as a member of the Board of Directors (1990-2006). Currently, Mr. Stavropoulos is Chairman of the Board of Directors of Univar Inc. (global distributor of commodity and specialty chemicals), a Director of Teradata Corporation (data warehousing and technology solutions), and Maersk Inc. (industrial conglomerate), and a member of the Advisory Board for Metalmark Capital LLC (private equity investment, 2005-present). Mr. Stavropoulos is an operating advisor to Clayton, Dubilier & Rice, LLC (private equity investment). In addition, Mr. Stavropoulos is a member of the University of Notre Dame Advisory Council for the College of Science, a Trustee of the Rollin L. Gerstacker Foundation, and a Director of the Naples Philharmonic Center for the Arts. Previously, Mr. Stavropoulos served as a Director of Chemical Financial Corporation (bank holding company, 1993-2012) and Tyco International, Ltd. (multinational manufacturing and services, 2007-2012). |
David M. Thomas (1949) |
Year of Election or Appointment: 2008 Trustee |
| Mr. Thomas also serves as Trustee of other Fidelity funds. Mr. Thomas serves as Non-Executive Chairman of the Board of Directors of Fortune Brands Home and Security (home and security products, 2011-present), as a member of the Board of Directors (2004-present) and Presiding Director (2013-present) of Interpublic Group of Companies, Inc. (marketing communication), and as a member of the Board of Trustees of the University of Florida (2013-present). Previously, Mr. Thomas served as Executive Chairman (2005-2006) and Chairman and Chief Executive Officer (2000-2005) of IMS Health, Inc. (pharmaceutical and healthcare information solutions), and a Director of Fortune Brands, Inc. (consumer products, 2000-2011). |
+ The information above includes each Trustee's principal occupation during the last five years and other information relating to the experience, attributes, and skills relevant to each Trustee's qualifications to serve as a Trustee, which led to the conclusion that each Trustee should serve as a Trustee for the fund.
Advisory Board Member and Officers:
Correspondence intended for each officer and Peter S. Lynch may be sent to Fidelity Investments, 245 Summer Street, Boston, Massachusetts 02210. Officers appear below in alphabetical order.
Name, Year of Birth; Principal Occupation |
Peter S. Lynch (1944) |
Year of Election or Appointment: 2003 Member of the Advisory Board |
| Mr. Lynch also serves as Member of the Advisory Board of other Fidelity funds. Mr. Lynch is Vice Chairman and a Director of FMR (investment adviser firm) and FMR Co., Inc. (investment adviser firm). In addition, Mr. Lynch serves as a Trustee of Boston College and as the Chairman of the Inner-City Scholarship Fund. Previously, Mr. Lynch served on the Special Olympics International Board of Directors (1997-2006). |
Elizabeth Paige Baumann (1968) |
Year of Election or Appointment: 2012 Anti-Money Laundering (AML) Officer |
| Ms. Baumann also serves as AML Officer of other funds. She is Chief AML Officer of FMR LLC (diversified financial services company, 2012-present) and is an employee of Fidelity Investments. Previously, Ms. Baumann served as Vice President and Deputy Anti-Money Laundering Officer (2007-2012). |
Marc R. Bryant (1966) |
Year of Election or Appointment: 2015 Secretary and Chief Legal Officer (CLO) |
| Mr. Bryant also serves as Secretary and CLO of other funds. Mr. Bryant serves as CLO, Secretary, and Senior Vice President of Fidelity Management & Research Company (investment adviser firm, 2015-present) and FMR Co., Inc. (investment adviser firm, 2015-present); Secretary of Fidelity SelectCo, LLC (investment adviser firm, 2015-present) and Fidelity Investments Money Management, Inc. (investment adviser firm, 2015-present); and CLO of Fidelity Management & Research (Hong Kong) Limited (investment adviser firm, 2015-present). He is Senior Vice President and Deputy General Counsel of FMR LLC (diversified financial services company). Previously, Mr. Bryant served as Secretary and Chief Legal Officer of Fidelity Rutland Square Trust II (2010-2014) and Assistant Secretary of Fidelity's Fixed Income and Asset Allocation Funds (2013-2015). Prior to joining Fidelity Investments, Mr. Bryant served as a Senior Vice President and the Head of Global Retail Legal for AllianceBernstein L.P. (2006-2010), and as the General Counsel for ProFund Advisors LLC (2001-2006). |
William C. Coffey (1969) |
Year of Election or Appointment: 2009 Assistant Secretary |
| Mr. Coffey also serves as Assistant Secretary of other funds. He is Senior Vice President and Deputy General Counsel of FMR LLC (diversified financial services company, 2010-present), and is an employee of Fidelity Investments. Previously, Mr. Coffey served as Vice President and Associate General Counsel of FMR LLC (2005-2009). |
Timothy M. Cohen (1969) |
Year of Election or Appointment: 2014 Vice President of certain Equity Funds |
| Mr. Cohen also serves as Vice President of other funds. Mr. Cohen serves as Chief Compliance Officer of FMR Investment Management (U.K.) Limited (investment adviser firm, 2013-present) and is an employee of Fidelity Investments. Previously, Mr. Cohen served as a Director of FMR Investment Management (U.K.) Limited (2013-2015). |
Jonathan Davis (1968) |
Year of Election or Appointment: 2010 Assistant Treasurer |
| Mr. Davis also serves as Assistant Treasurer of other funds, and is an employee of Fidelity Investments. Previously, Mr. Davis served as Vice President and Associate General Counsel of FMR LLC (diversified financial services company, 2003-2010). |
Adrien E. Deberghes (1967) |
Year of Election or Appointment: 2008 Deputy Treasurer |
| Mr. Deberghes also serves as an officer of other funds. He is an employee of Fidelity Investments (2008-present). Prior to joining Fidelity Investments, Mr. Deberghes was Senior Vice President of Mutual Fund Administration at State Street Corporation (2007-2008), Senior Director of Mutual Fund Administration at Investors Bank & Trust (2005-2007), and Director of Finance for Dunkin' Brands (2000-2005). |
Stephanie J. Dorsey (1969) |
Year of Election or Appointment: 2010 Assistant Treasurer |
| Ms. Dorsey also serves as an officer of other funds. She is an employee of Fidelity Investments (2008-present) and has served in other fund officer roles. Prior to joining Fidelity Investments, Ms. Dorsey served as Treasurer (2004-2008) of the JPMorgan Mutual Funds and Vice President (2004-2008) of JPMorgan Chase Bank. |
Howard J. Galligan III (1966) |
Year of Election or Appointment: 2014 Chief Financial Officer |
| Mr. Galligan also serves as Chief Financial Officer of other funds. Mr. Galligan serves as President of Fidelity Pricing and Cash Management Services (FPCMS) (2014-present) and as a Director of Strategic Advisers, Inc. (investment adviser firm, 2008-present). Previously, Mr. Galligan served as Chief Administrative Officer of Asset Management (2011-2014) and Chief Operating Officer and Senior Vice President of Investment Support for Strategic Advisers, Inc. (2003-2011). |
Scott C. Goebel (1968) |
Year of Election or Appointment: 2015 Vice President |
| Mr. Goebel serves as Vice President of other funds and is an employee of Fidelity Investments (2001-present). Previously, Mr. Goebel served as Secretary of Fidelity SelectCo, LLC (investment adviser firm, 2013-2015), Fidelity Investments Money Management, Inc. (FIMM) (investment adviser firm, 2010-2015), and Fidelity Research and Analysis Company (FRAC) (investment adviser firm, 2010-2015); General Counsel, Secretary, and Senior Vice President of Fidelity Management & Research Company (investment adviser firm, 2008-2015) and FMR Co., Inc. (investment adviser firm, 2008-2015); Assistant Secretary of Fidelity Management & Research (Japan) Limited (investment adviser firm, 2008-2015) and FMR Investment Management (U.K.) Limited (investment adviser firm, 2008-2015); Chief Legal Officer (CLO) of Fidelity Management & Research (Hong Kong) Limited (investment adviser firm, 2008-2015); Secretary and CLO of certain Fidelity funds (2008-2015); Assistant Secretary of FIMM (2008-2010), FRAC (2008-2010), and certain funds (2007-2008); and as Vice President and Secretary of Fidelity Distributors Corporation (FDC) (2005-2007). |
Brian B. Hogan (1964) |
Year of Election or Appointment: 2009 Vice President |
| Mr. Hogan also serves as Trustee or Vice President of other funds. Mr. Hogan serves as a Director of Fidelity SelectCo, LLC (investment adviser firm, 2014-present) and President of the Equity Division of FMR (investment adviser firm, 2009-present). Previously, Mr. Hogan served as Senior Vice President, Equity Research of FMR (2006-2009) and as a portfolio manager. |
Chris Maher (1972) |
Year of Election or Appointment: 2013 Assistant Treasurer |
| Mr. Maher serves as Assistant Treasurer of other funds. Mr. Maher is Vice President of Valuation Oversight and is an employee of Fidelity Investments. Previously, Mr. Maher served as Vice President of Asset Management Compliance (2013), Vice President of the Program Management Group of FMR (investment adviser firm, 2010-2013), and Vice President of Valuation Oversight (2008-2010). |
Kenneth B. Robins (1969) |
Year of Election or Appointment: 2008 President and Treasurer |
| Mr. Robins also serves as an officer of other funds. Mr. Robins serves as Executive Vice President of Fidelity Investments Money Management, Inc. (FIMM) (investment adviser firm, 2013-present) and is an employee of Fidelity Investments (2004-present). Previously, Mr. Robins served in other fund officer roles. |
Stacie M. Smith (1974) |
Year of Election or Appointment: 2013 Deputy Treasurer |
| Ms. Smith also serves as an officer of other funds. She is an employee of Fidelity Investments (2009-present) and has served in other fund officer roles. Prior to joining Fidelity Investments, Ms. Smith served as Senior Audit Manager of Ernst & Young LLP (1996-2009). |
Renee Stagnone (1975) |
Year of Election or Appointment: 2013 Deputy Treasurer |
| Ms. Stagnone also serves as Deputy Treasurer of other funds. Ms. Stagnone is an employee of Fidelity Investments (1997-present). |
Linda J. Wondrack (1964) |
Year of Election or Appointment: 2014 Chief Compliance Officer |
| Ms. Wondrack also serves as Chief Compliance Officer of other funds. Ms. Wondrack is Executive Vice President and head of the Ethics Office and Asset Management Compliance for Fidelity Investments (2012-present). Ms. Wondrack also serves as Chief Compliance Officer of Fidelity SelectCo, LLC (investment adviser firm, 2014-present); Chief Compliance Officer of Impresa Management LLC (2013-present); and Chief Compliance Officer of FMR Co., Inc. (investment adviser firm), Fidelity Investments Money Management, Inc. (investment adviser firm), Fidelity Management & Research (Japan) Limited (investment adviser firm), FMR Investment Management (U.K.) Limited (investment adviser firm), Fidelity Management & Research (Hong Kong) (investment adviser firm), Fidelity Management & Research Company (investment adviser firm), FIAM LLC (investment adviser firm), and Strategic Advisers, Inc. (investment adviser firm), Ballyrock Investment Advisors LLC, and Northern Neck Investors LLC (2012-present). Previously, Ms. Wondrack served as Senior Vice President and Chief Compliance Officer for Columbia Management Investment Advisers, LLC (2005-2012); Chief Compliance Officer for certain funds within the Columbia Family of Funds (2007-2012); and Senior Vice President of Compliance Risk Management at Bank of America (2005-2010). |
Joseph F. Zambello (1957) |
Year of Election or Appointment: 2011 Deputy Treasurer |
| Mr. Zambello also serves as Deputy Treasurer of other funds. Mr. Zambello is an employee of Fidelity Investments (1991-present). Previously, Mr. Zambello served as Vice President of the Program Management Group of FMR (investment adviser firm, 2009-2011) and Vice President of the Transfer Agent Oversight Group (2005-2009). |
Annual Report
The Board of Trustees of Fidelity Advisor China Region Fund voted to pay to shareholders of record at the opening of business on record date, the following distributions per share derived from capital gains realized from sales of portfolio securities, and dividends derived from net investment income:
| Pay Date | Record Date | Dividends | Capital Gains |
Class A | 12/07/15 | 12/04/15 | $0.270 | $3.588 |
| | | | |
Class T | 12/07/15 | 12/04/15 | $0.134 | $3.588 |
| | | | |
Class B | 12/07/15 | 12/04/15 | - | $3.588 |
| | | | |
Class C | 12/07/15 | 12/04/15 | $0.060 | $3.588 |
The fund hereby designates as a capital gain dividend with respect to the taxable year ended October 31, 2015, $202,354,150, or, if subsequently determined to be different, the net capital gain of such year.
Class A designates 95%; Class T designates 100%; and Class C designates 100%; of the dividends distributed in during the fiscal year as amounts which may be taken into account as a dividend for purposes of the maximum rate under section 1(h)(11) of the Internal Revenue Code.
The amounts per share which represent income derived from sources within, and taxes paid to, foreign countries or possessions of the United States are as follows:
| Pay Date | Income | Taxes |
Class A | 12/8/2014 | $0.3158 | $0.0608 |
| | | |
Class T | 12/8/2014 | $0.2128 | $0.0608 |
| | | |
Class C | 12/8/2014 | $0.1338 | $0.0608 |
The fund will notify shareholders in January 2016 of amounts for use in preparing 2015 income tax returns.
Annual Report
Fidelity China Region Fund
Each year, the Board of Trustees, including the Independent Trustees (together, the Board), votes on the renewal of the management contract with Fidelity Management & Research Company (FMR) and the sub-advisory agreements (together, the Advisory Contracts) for the fund. The Board, assisted by the advice of fund counsel and Independent Trustees' counsel, requests and considers a broad range of information relevant to the renewal of the Advisory Contracts throughout the year.
The Board meets regularly and, at each of its meetings, covers an extensive agenda of topics and materials and considers factors that are relevant to its annual consideration of the renewal of the fund's Advisory Contracts, including the services and support provided to the fund and its shareholders. The Board has established various standing committees (Committees), each composed of and chaired by Independent Trustees with varying backgrounds, to which the Board has assigned specific subject matter responsibilities in order to enhance effective decision-making by the Board. The Board, acting directly and through its Committees, requests and receives information concerning the annual consideration of the renewal of the fund's Advisory Contracts. The Board also meets as needed to consider matters specifically related to the Board's annual consideration of the renewal of the Advisory Contracts. Members of the Board may also meet with trustees of other Fidelity funds through ad hoc joint committees to discuss certain matters relevant to all of the Fidelity funds.
At its July 2015 meeting, the Board unanimously determined to renew the fund's Advisory Contracts. In reaching its determination, the Board considered all factors it believed relevant, including (i) the nature, extent, and quality of the services to be provided to the fund and its shareholders (including the investment performance of the fund); (ii) the competitiveness of the fund's management fee and total expense ratio relative to peer funds; (iii) the total costs of the services to be provided by and the profits to be realized by Fidelity from its relationship with the fund; and (iv) the extent to which (if any) economies of scale exist and would be realized as the fund grows, and whether any economies of scale are appropriately shared with fund shareholders.
In considering whether to renew the Advisory Contracts for the fund, the Board reached a determination, with the assistance of fund counsel and Independent Trustees' counsel and through the exercise of its business judgment, that the renewal of the Advisory Contracts was in the best interests of the fund and its shareholders and that the compensation payable under the Advisory Contracts was fair and reasonable. The Board's decision to renew the Advisory Contracts was not based on any single factor, but rather was based on a comprehensive consideration of all the information provided to the Board at its meetings throughout the year. The Board, in reaching its determination to renew the Advisory Contracts, was aware that shareholders of the fund have a broad range of investment choices available to them, including a wide choice among funds offered by Fidelity's competitors, and that the fund's shareholders, who have the opportunity to review and weigh the disclosure provided by the fund in its prospectus and other public disclosures, have chosen to invest in this fund, which is part of the Fidelity family of funds.
Nature, Extent, and Quality of Services Provided. The Board considered Fidelity's staffing as it relates to the fund, including the backgrounds of investment personnel of Fidelity, and also considered the fund's investment objective, strategies, and related investment philosophy. The Independent Trustees also had discussions with senior management of Fidelity's investment operations and investment groups. The Board considered the structure of the portfolio manager compensation program and whether this structure provides appropriate incentives to act in the best interests of the fund. Additionally, the Board considered the portfolio managers' investments, if any, in the funds that they manage.
Resources Dedicated to Investment Management and Support Services. The Board and the Fund Oversight and Research Committees reviewed the general qualifications and capabilities of Fidelity's investment staff, including its size, education, experience, and resources, as well as Fidelity's approach to recruiting, training, managing, and compensating investment personnel. The Board noted that Fidelity has continued to increase the resources devoted to non-U.S. offices, including expansion of Fidelity's global investment organization. The Board also noted that Fidelity's analysts have extensive resources, tools and capabilities that allow them to conduct sophisticated quantitative and fundamental analysis, as well as credit analysis of issuers, counterparties and guarantors. Further, the Board considered that Fidelity's investment professionals have sufficient access to global information and data so as to provide competitive investment results over time, and that those professionals also have access to sophisticated tools that permit them to assess portfolio construction and risk and performance attribution characteristics continuously, as well as to transmit new information and research conclusions rapidly around the world. Additionally, in its deliberations, the Board considered Fidelity's trading, risk management, and compliance capabilities and resources, which are integral parts of the investment management process.
Shareholder and Administrative Services. The Board considered (i) the nature, extent, quality, and cost of advisory, administrative, and shareholder services performed by FMR, the sub-advisers (together with FMR, the Investment Advisers), and their affiliates under the Advisory Contracts and under separate agreements covering transfer agency, pricing and bookkeeping, and securities lending services for the fund; (ii) the nature and extent of the supervision of third party service providers, principally custodians and subcustodians; and (iii) the resources devoted to, and the record of compliance with, the fund's compliance policies and procedures. The Board also reviewed the allocation of fund brokerage, including allocations to brokers affiliated with the Investment Advisers, the use of brokerage commissions to pay fund expenses, and the use of "soft" commission dollars to pay for research services.
Annual Report
The Board noted that the growth of fund assets over time across the complex allows Fidelity to reinvest in the development of services designed to enhance the value or convenience of the Fidelity funds as investment vehicles. These services include 24-hour access to account information and market information through telephone representatives and over the Internet, investor education materials and asset allocation tools, and the expanded availability of Fidelity Investor Centers.
In 2014, the Board formed an ad hoc Committee on Transfer Agency Fees to review the variety of transfer agency fee structures throughout the industry and Fidelity's competitive positioning with respect to industry participants.
Investment in a Large Fund Family. The Board considered the benefits to shareholders of investing in a Fidelity fund, including the benefits of investing in a fund that is part of a large family of funds offering a variety of investment disciplines and providing a large variety of mutual fund investor services. The Board noted that Fidelity had taken, or had made recommendations that resulted in the Fidelity funds taking, a number of actions over the previous year that benefited particular funds, including (i) continuing to dedicate additional resources to investment research and to the support of the senior management team that oversees asset management; (ii) continuing efforts to enhance Fidelity's global research capabilities; (iii) launching new funds and making other enhancements to meet client needs; (iv) reducing management fees and total expenses for certain index funds and diversified international funds; (v) continuing to launch dedicated lower cost underlying funds to meet portfolio construction needs related to expanding underlying fund options for Fidelity funds of funds, specifically for the Freedom Fund product lines; (vi) rationalizing product lines and gaining increased efficiencies through fund mergers; (vii) launching active fixed-income exchange-traded funds; (viii) continuing to develop, acquire and implement systems and technology to improve services to the funds and information security and to increase efficiency; (ix) implementing investment enhancements to further strengthen Fidelity's target date product line to increase investors' probability of success in achieving their goals; (x) modifying the eligibility criteria for certain share classes to accommodate roll-over assets from employer-sponsored retirement plans; (xi) launching a new Class W of the Freedom Index Funds to attract and retain Fidelity record-kept retirement plan assets; and (xii) implementing changes to Fidelity's money market product line in response to recent money market regulatory reforms.
Investment Performance. The Board considered whether the fund has operated in accordance with its investment objective, as well as its record of compliance with its investment restrictions and its performance history.
The Board took into account discussions with representatives of the Investment Advisers about fund investment performance that occur at Board meetings throughout the year. In this regard the Board noted that as part of regularly scheduled fund reviews and other reports to the Board on fund performance, the Board considers annualized return information for the fund, for different time periods, measured against a securities market index ("benchmark index") and a peer group of funds with similar objectives ("peer group"), if any. In its evaluation of fund investment performance, the Board gave particular attention to information indicating changes in performance of certain Fidelity funds for specific time periods and discussed with the Investment Advisers the reasons for any overperformance or underperformance.
In addition to reviewing absolute and relative fund performance, the Independent Trustees periodically consider the appropriateness of fund performance metrics in evaluating the results achieved. In general, the Independent Trustees believe that fund performance should be evaluated based on net performance (after fees and expenses) of both the highest performing and lowest performing fund share classes, where applicable, compared to appropriate benchmark indices, over appropriate time periods that may include full market cycles, and compared to peer groups, as applicable, over the same periods, taking into account relevant factors including the following: general market conditions; issuer-specific information; and fund cash flows and other factors.
The Independent Trustees recognize that shareholders evaluate performance on a net basis over their own holding periods, for which one-, three-, and five-year periods are often used as a proxy. For this reason, the performance information reviewed by the Board also included net cumulative calendar year total return information for the fund and an appropriate benchmark index for the most recent one-, three-, and five-year periods, as shown below. A peer group is not shown below because the fund does not generally utilize a peer group for performance comparison purposes.
Annual Report
Board Approval of Investment Advisory Contracts and Management Fees - continued
Fidelity China Region Fund
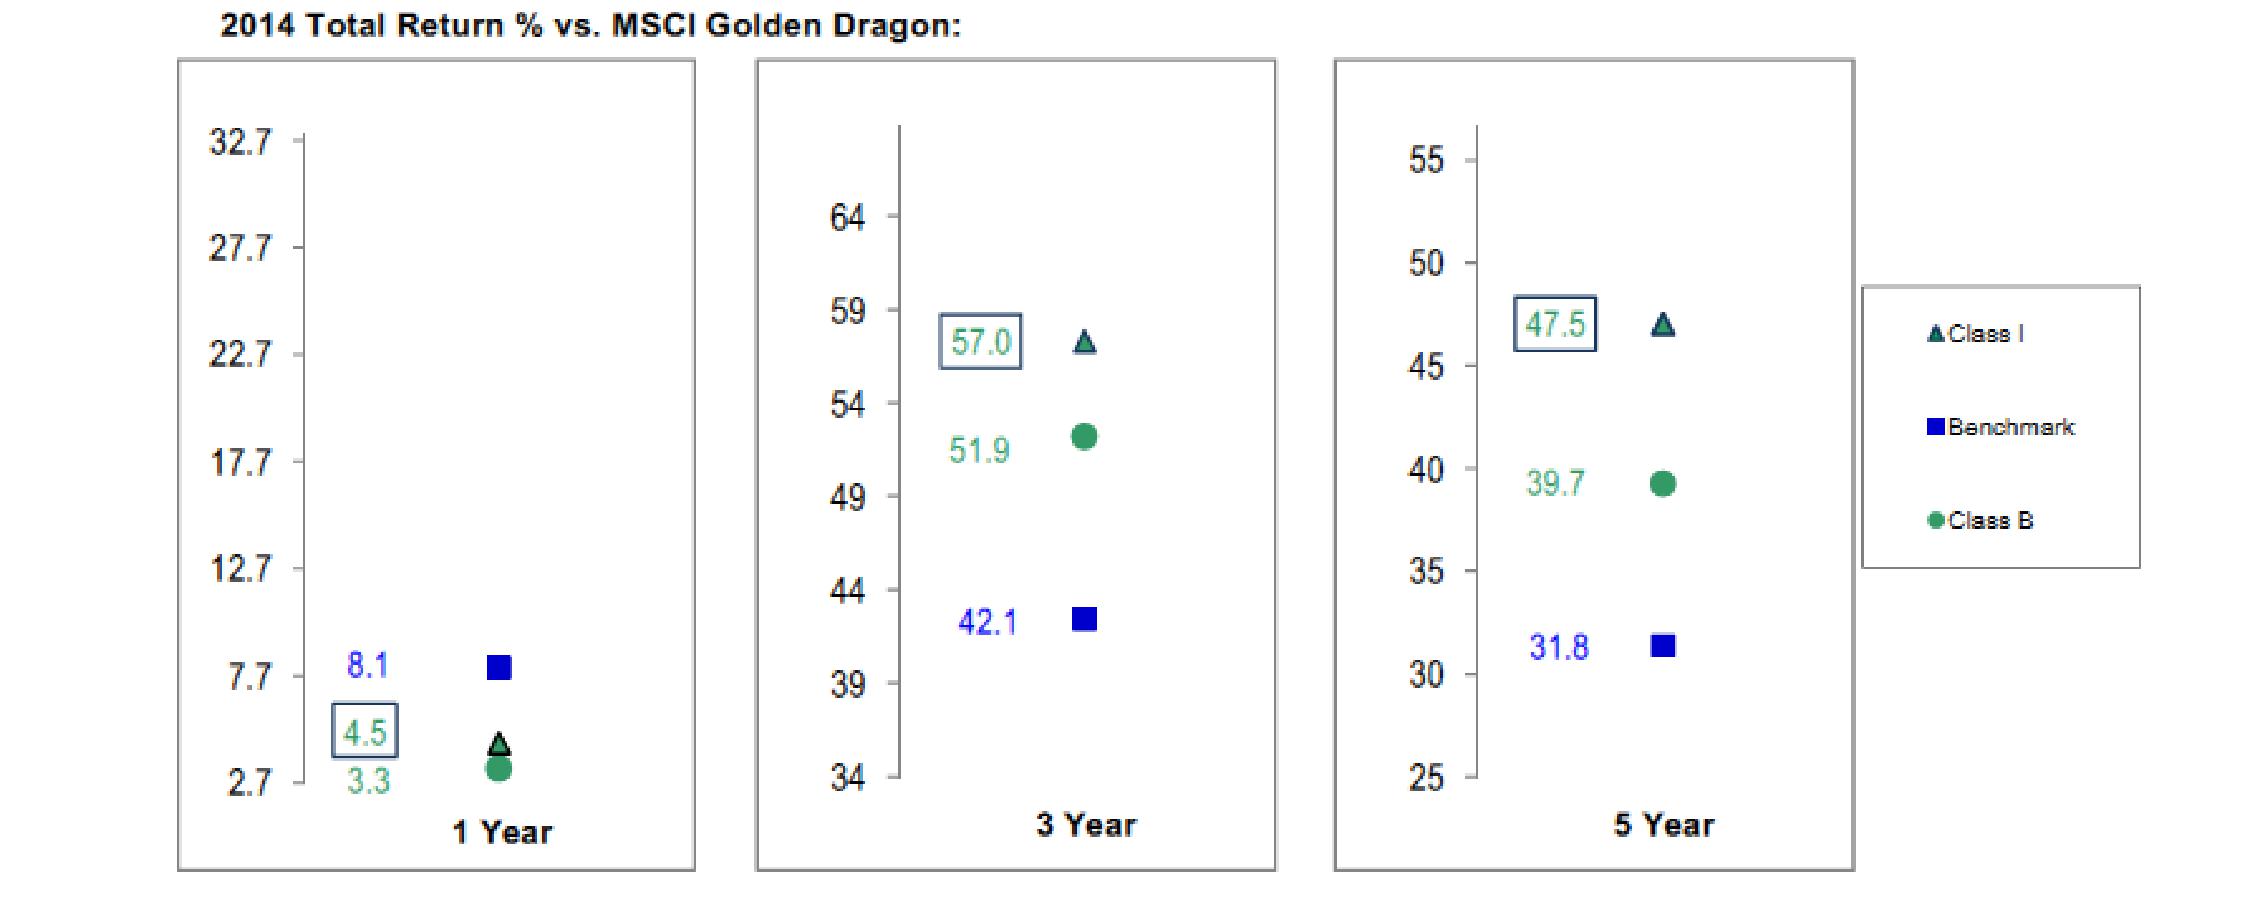
Based on its review, the Board concluded that the nature, extent, and quality of services provided to the fund under the Advisory Contracts should benefit the shareholders of the fund.
Competitiveness of Management Fee and Total Expense Ratio. The Board considered the fund's management fee and total expense ratio compared to "mapped groups" of competitive funds and classes created for the purpose of facilitating the Trustees' competitive analysis of management fees and total expenses. Fidelity creates "mapped groups" by combining similar Lipper investment objective categories that have comparable investment mandates. Combining Lipper investment objective categories aids the Board's management fee and total expense ratio comparisons by broadening the competitive group used for comparison.
Management Fee. The Board considered two proprietary management fee comparisons for the 12-month periods shown in basis points (BP) in the chart below. The group of Lipper funds used by the Board for management fee comparisons is referred to below as the "Total Mapped Group." The Total Mapped Group comparison focuses on a fund's standing in terms of gross management fees before expense reimbursements or caps, and without giving effect to the fund's performance adjustment, relative to the total universe of funds with comparable investment mandates, regardless of whether their management fee structures also are comparable. Funds with comparable investment mandates offer exposure to similar types of securities. Funds with comparable management fee structures have similar management fee contractual arrangements (e.g., flat rate charged for advisory services, all-inclusive fee rate, etc.). "TMG %" represents the percentage of funds in the Total Mapped Group that had management fees that were lower than the fund's. For example, a hypothetical TMG % of 20% would mean that 80% of the funds in the Total Mapped Group had higher, and 20% had lower, management fees than the fund. The fund's actual TMG %s and the number of funds in the Total Mapped Group are in the chart below. The "Asset-Size Peer Group" (ASPG) comparison focuses on a fund's standing relative to a subset of non-Fidelity funds within the Total Mapped Group that are similar in size and management fee structure without taking into account performance adjustments, if any. For example, if a fund is in the first quartile of the ASPG, the fund's management fee ranks in the least expensive or lowest 25% of funds in the ASPG. The ASPG represents at least 15% of the funds in the Total Mapped Group with comparable asset size and management fee structures, subject to a minimum of 50 funds (or all funds in the Total Mapped Group if fewer than 50). Additional information, such as the ASPG quartile in which the fund's management fee rate ranked and the impact of the fund's performance adjustment, is also included in the chart and considered by the Board.
Annual Report
Fidelity China Region Fund
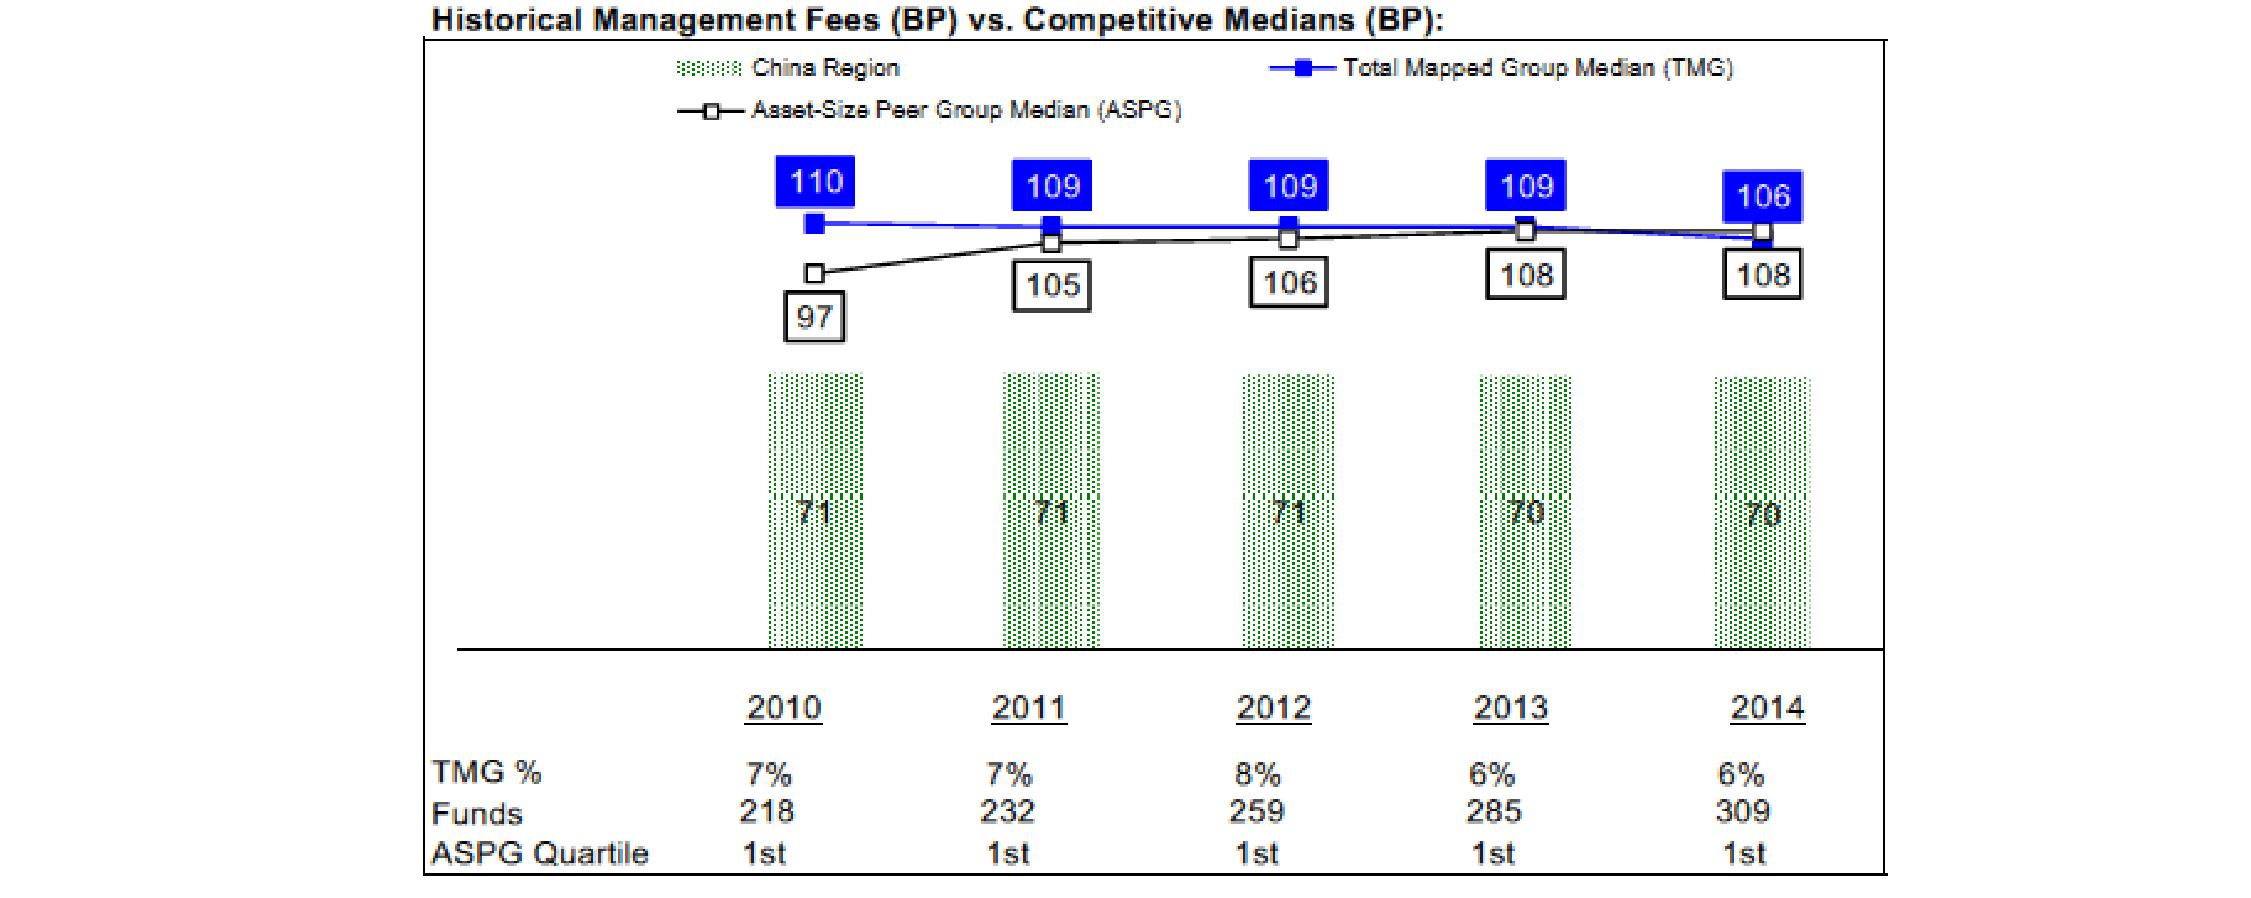
The Board noted that the fund's management fee rate ranked below the median of its Total Mapped Group and below the median of its ASPG for 2014.
The Board noted that, in 2014, the ad hoc Committee on Group Fee was formed by it and other Fidelity fund boards to conduct an in-depth review of the "group fee" component of the management fee of funds with such management fee structures. Committee focus included the mechanics of the group fee, the competitive landscape of group fee structures, Fidelity funds with no group fee component and investment products not included in group fee assets. The Board also considered that, for funds subject to the group fee, FMR agreed to voluntarily waive fees over a specified period of time in amounts designed to account for assets converted from certain funds to certain collective investment trusts.
The Board also noted that, in 2013, the ad hoc Committee on Management Fees was formed to conduct an in-depth review of the management fee rates of Fidelity's active equity mutual funds. The Committee focused on the following areas: (i) standard fee structures; (ii) research consumption and trading evolution; (iii) management fee competitiveness/profitability by category; and (iv) factors that drive institutional pricing.
Based on its review, the Board concluded that the fund's management fee is fair and reasonable in light of the services that the fund receives and the other factors considered.
Total Expense Ratio. In its review of each class's total expense ratio, the Board considered the fund's management fee as well as other fund or class expenses, as applicable, such as transfer agent fees, pricing and bookkeeping fees, fund-paid 12b-1 fees, and custodial, legal, and audit fees. The Board also noted that Fidelity may agree to waive fees and expenses from time to time, and the extent to which, if any, it has done so for the fund. As part of its review, the Board also considered the current and historical total expense ratios of each class of the fund compared to competitive fund median expenses. Each class of the fund is compared to those funds and classes in the Total Mapped Group (used by the Board for management fee comparisons) that have a similar sales load structure.
The Board noted that the total expense ratio of each class ranked below its competitive median for 2014.
Fees Charged to Other Fidelity Clients. The Board also considered Fidelity fee structures and other information with respect to clients of Fidelity, such as other funds advised or subadvised by Fidelity, pension plan clients, and other institutional clients with similar mandates. The Board noted the findings of the 2013 ad hoc joint committee (created with the board of other Fidelity funds), which reviewed and compared Fidelity's institutional investment advisory business with its business of providing services to the Fidelity funds, including the differences in services provided, fees charged, and costs incurred, as well as competition in their respective marketplaces.
Based on its review of total expense ratios and fees charged to other Fidelity clients, the Board concluded that the total expense ratio of each class of the fund was reasonable in light of the services that the fund and its shareholders receive and the other factors considered.
Costs of the Services and Profitability. The Board considered the revenues earned and the expenses incurred by Fidelity in conducting the business of developing, marketing, distributing, managing, administering and servicing the fund and servicing the fund's shareholders. The Board also considered the level of Fidelity's profits in respect of all the Fidelity funds.
On an annual basis, Fidelity presents to the Board information about the profitability of its relationship with the fund. Fidelity calculates profitability information for each fund, as well as aggregate profitability information for groups of Fidelity funds and all Fidelity funds, using a series of detailed revenue and cost allocation methodologies which originate with the books and records of Fidelity on which Fidelity's audited financial statements are based. The Audit Committee of the Board reviews any significant changes from the prior year's methodologies.
Annual Report
Board Approval of Investment Advisory Contracts and Management Fees - continued
PricewaterhouseCoopers LLP (PwC), independent registered public accounting firm and auditor to Fidelity and certain Fidelity funds, has been engaged annually by the Board as part of the Board's assessment of Fidelity's profitability analysis. PwC's engagement includes the review and assessment of the methodologies used by Fidelity in determining the revenues and expenses attributable to Fidelity's mutual fund business, and completion of agreed-upon procedures in respect of the mathematical accuracy of fund profitability and its conformity to established allocation methodologies. After considering PwC's reports issued under the engagement and information provided by Fidelity, the Board concluded that while other allocation methods may also be reasonable, Fidelity's profitability methodologies are reasonable in all material respects.
The Board also reviewed Fidelity's non-fund businesses and fall-out benefits related to the mutual fund business as well as cases where Fidelity's affiliates may benefit from or be related to the fund's business.
The Board considered the costs of the services provided by and the profits realized by Fidelity in connection with the operation of the fund and was satisfied that the profitability was not excessive.
Economies of Scale. The Board considered whether there have been economies of scale in respect of the management of the Fidelity funds, whether the Fidelity funds (including the fund) have appropriately benefited from any such economies of scale, and whether there is potential for realization of any further economies of scale. The Board considered the extent to which the fund will benefit from economies of scale as assets grow through increased services to the fund, through waivers or reimbursements, or through fee or expense ratio reductions. The Board also noted that in 2013, it and the boards of other Fidelity funds created an ad hoc committee (the Economies of Scale Committee) to analyze whether Fidelity attains economies of scale in respect of the management and servicing of the Fidelity funds, whether the Fidelity funds have appropriately benefited from such economies of scale, and whether there is potential for realization of any further economies of scale.
The Board recognized that the fund's management contract incorporates a "group fee" structure, which provides for lower group fee rates as total group assets increase, and for higher group fee rates as total group assets decrease (with "group assets" defined to include fund assets under FMR's management plus sector fund assets previously under FMR's management and currently managed by Fidelity SelectCo, LLC). FMR calculates the group fee rates based on a tiered asset "breakpoint" schedule that varies based on asset class. The Board considered that the group fee is designed to deliver the benefits of economies of scale to fund shareholders when total Fidelity fund assets increase, even if assets of any particular fund are unchanged or have declined, because some portion of Fidelity's costs are attributable to services provided to all Fidelity funds, and all funds benefit if those costs can be allocated among more assets. The Board concluded that, given the group fee structure, fund shareholders will benefit from lower management fees as group assets increase at the fund complex level, regardless of whether Fidelity achieves any such economies of scale.
The Board concluded, taking into account the analysis of the Economies of Scale Committee, that economies of scale, if any, are being appropriately shared between fund shareholders and Fidelity.
Additional Information Requested by the Board. In order to develop fully the factual basis for consideration of the Fidelity funds' Advisory Contracts, the Board requested and received additional information on certain topics, including: (i) fund performance trends and Fidelity's long-term strategies for certain funds; (ii) the various share classes employed by Fidelity and the attributes of each class, together with similar information on the distribution and servicing payments made by Fidelity or the funds to third-party participants in the distribution channels; (iii) fund profitability, and fund performance in relation to fund profitability; (iv) the methodology with respect to evaluating competitive fund data and peer group classifications and fee comparisons; (v) annual fund profitability margins, with particular focus on certain funds with negative margins; (vi) the realization of fall-out benefits in certain Fidelity business units; (vii) economies of scale and the way in which they are shared with fund shareholders; (viii) Fidelity's group fee structures, including the group fee schedule of breakpoints; (ix) the impact of cost containment measures on the funds; and (x) the transfer agent fee structure.
Based on its evaluation of all of the conclusions noted above, and after considering all factors it believed relevant, the Board concluded that the advisory fee structures are fair and reasonable, and that the fund's Advisory Contracts should be renewed.
Annual Report
Investment Adviser
Fidelity Management & Research Company
Boston, MA
Investment Sub-Advisers
FMR Co., Inc.
FMR Investment Management
(U.K.) Limited
Fidelity Management & Research
(Japan) Limited
Fidelity Management & Research
(Hong Kong) Limited
FIL Investments (Japan) Limited
FIL Investment Advisors
FIL Investment Advisors
(UK) Limited
General Distributor
Fidelity Distributors Corporation
Smithfield, RI
Transfer and Service Agents
Fidelity Investments Institutional
Operations Company, Inc.
Boston, MA
Fidelity Service Company, Inc.
Boston, MA
Custodian
Brown Brothers Harriman & Co.,
Boston, MA
(Fidelity Investment logo)(registered trademark)
AHKC-UANN-1215
1.861458.107
Fidelity Advisor®
China Region Fund -
Class I
(formerly Institutional Class)
Annual Report
October 31, 2015
Class I is a class of
Fidelity® China Region Fund
(Fidelity Cover Art)
Contents
Performance | (Click Here) | How the fund has done over time. |
Management's Discussion of Fund Performance | (Click Here) | The Portfolio Manager's review of fund performance and strategy. |
Shareholder Expense Example | (Click Here) | An example of shareholder expenses. |
Investment Changes | (Click Here) | A summary of major shifts in the fund's investments over the past six months. |
Investments | (Click Here) | A complete list of the fund's investments with their market values. |
Financial Statements | (Click Here) | Statements of assets and liabilities, operations, and changes in net assets, as well as financial highlights. |
Notes | (Click Here) | Notes to the financial statements. |
Report of Independent Registered Public Accounting Firm | (Click Here) | |
Trustees and Officers | (Click Here) | |
Distributions | (Click Here) | |
Board Approval of Investment Advisory Contracts and Management Fees | (Click Here) | |
To view a fund's proxy voting guidelines and proxy voting record for the 12-month period ended June 30, visit http://www.fidelity.com/proxyvotingresults or visit the Securities and Exchange Commission's (SEC) web site at http://www.sec.gov. You may also call 1-877-208-0098 to request a free copy of the proxy voting guidelines.
Standard & Poor's, S&P and S&P 500 are registered service marks of The McGraw-Hill Companies, Inc. and have been licensed for use by Fidelity Distributors Corporation.
Other third-party marks appearing herein are the property of their respective owners.
All other marks appearing herein are registered or unregistered trademarks or service marks of FMR LLC or an affiliated company. © 2015 FMR LLC. All rights reserved.
This report and the financial statements contained herein are submitted for the general information of the shareholders of the fund. This report is not authorized for distribution to prospective investors in the fund unless preceded or accompanied by an effective prospectus.
A fund files its complete schedule of portfolio holdings with the SEC for the first and third quarters of each fiscal year on Form N-Q. Forms N-Q are available on the SEC's web site at http://www.sec.gov. A fund's Forms N-Q may be reviewed and copied at the SEC's Public Reference Room in Washington, DC. Information regarding the operation of the SEC's Public Reference Room may be obtained by calling 1-800-SEC-0330. For a complete list of a fund's portfolio holdings, view the most recent holdings listing, semiannual report, or annual report on Fidelity's web site at http://www.fidelity.com, http://www.advisor.fidelity.com, or http://www.401k.com, as applicable.
NOT FDIC INSURED • MAY LOSE VALUE • NO BANK GUARANTEE
Neither the fund nor Fidelity Distributors Corporation is a bank.
Annual Report
Performance: The Bottom Line
Average annual total return reflects the change in the value of an investment, assuming reinvestment of the class' distributions from dividend income and capital gains (the profits earned upon the sale of securities that have grown in value, if any) and assuming a constant rate of performance each year. The $10,000 table and the fund's returns do not reflect the deduction of taxes that a shareholder would pay on fund distributions or the redemption of fund shares. During periods of reimbursement by Fidelity, a fund's total return will be greater than it would be had the reimbursement not occurred. How a fund did yesterday is no guarantee of how it will do tomorrow.
Average Annual Total Returns
Periods ended October 31, 2015 | Past 1
year | Past 5
years | Past 10
years |
Class I A | -1.14% | 4.59% | 10.53% |
A The initial offering of Class I shares took place on May 9, 2008. Returns prior to May 9, 2008, are those of Fidelity® China Region Fund, the original class of the fund.
$10,000 Over 10 Years
Let's say hypothetically that $10,000 was invested in Fidelity Advisor® China Region Fund - Class I on October 31, 2005. The chart shows how the value of your investment would have changed, and also shows how the MSCI Golden Dragon Index performed over the same period. See footnote A above for additional information regarding the performance of Class I.
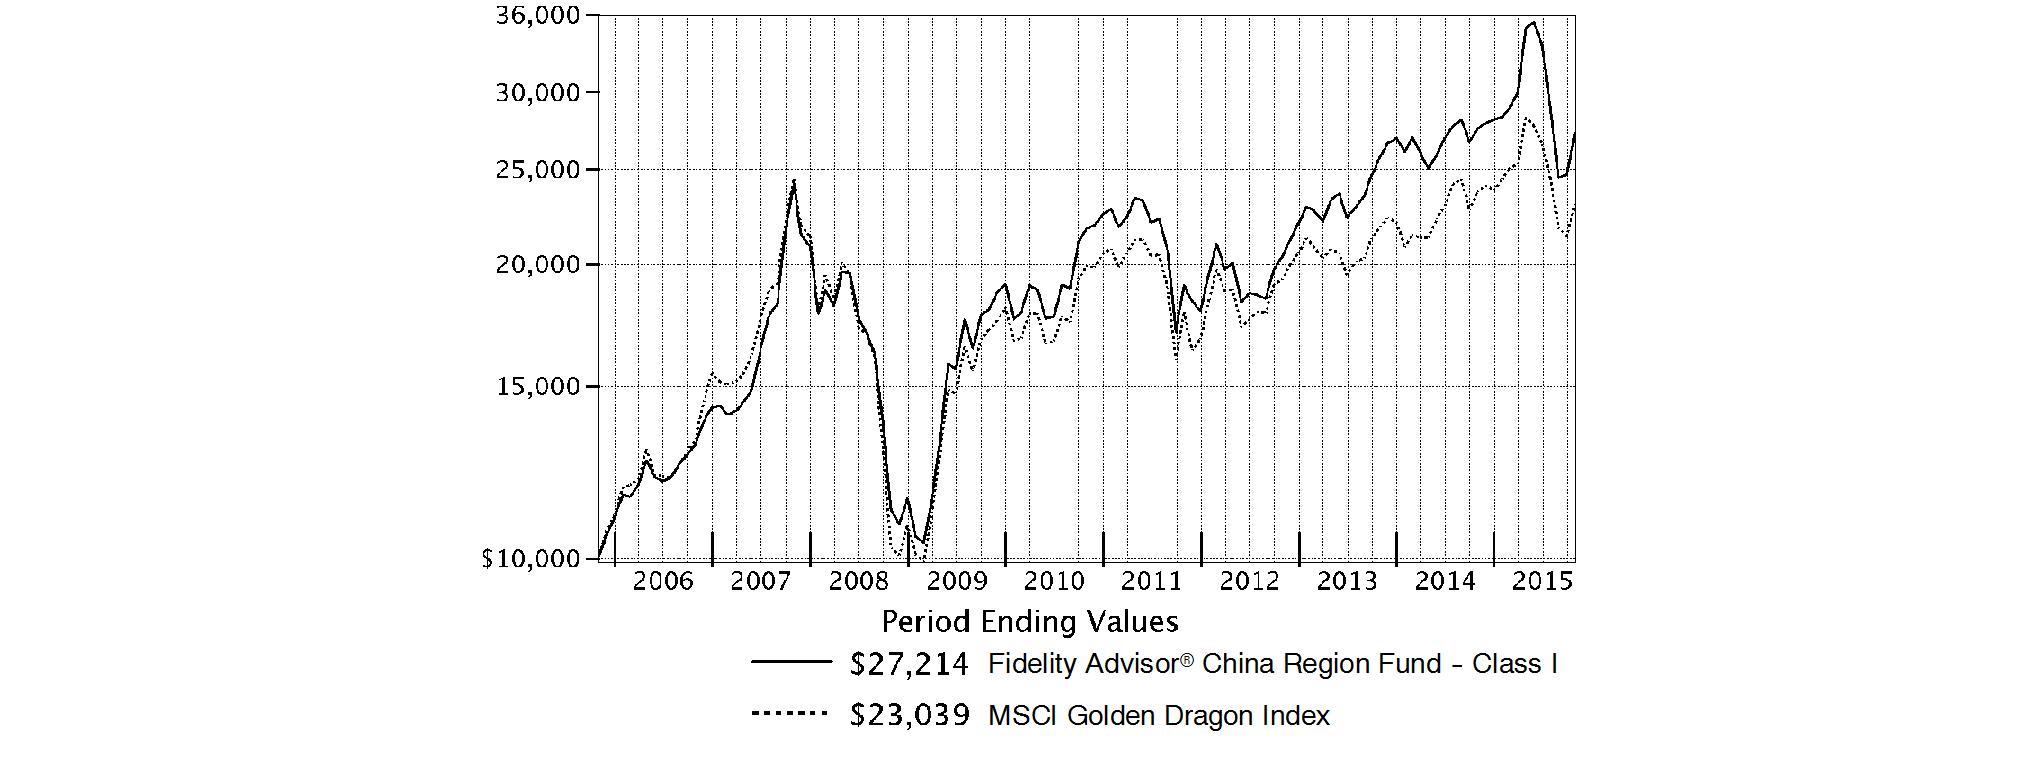
Annual Report
Fidelity China Region Fund
Market Recap: International equities suffered a moderate setback for the 12 months ending October 31, 2015, held back by a collapse in commodities prices that hurt resources-related sectors and geographies. The MSCI ACWI (All Country World Index) ex USA Index returned -4.55% for the period, affected also by concerns about global economic growth. Commodity producers remained under pressure for much of the past year, largely related to economic deceleration in China (-1%), the world's second-largest economy and a leading consumer of raw materials. This effect was exacerbated by U.S. dollar strength relative to global currencies, which weighed on commodities priced in dollars and acutely impacted equity returns within regions most exposed to resources prices. The emerging-markets group, for example, returned about -15% this period. Canada, a significant energy producer, returned roughly -17%. Net energy consumer Japan (+9%) was the best-performing region by far. Only about a quarter of the nearly 50 index countries managed a gain this period: Ireland (+19%) - the EU's fastest-growing economy - and Israel (+17%) proved top performers; Greece (-56%) and Brazil (-46%), among the worst. As for sectors, energy (-25%) and materials (-16%) declined sharply, whereas the two consumer sectors each gained about 6%.
Comments from Portfolio Manager Robert Bao: For the year, the fund's share classes (excluding sales charges, if applicable) posted low single-digit declines but outpaced the -2.99% return of the benchmark MSCI Golden Dragon Index. Stock selection was the primary driver of the fund's relative success, especially in consumer discretionary and health care. Versus the benchmark, performance was lifted by two cement companies in the materials sector, West China Cement - the fund's largest relative contributor - and China Shanshui Cement Group. Other contributors included China Life Insurance, People's Insurance Group of China, China Southern Airlines, which I bought in December, and China-based online classified advertising portal 58.com. Conversely, a large overweighting in consumer discretionary offset much of the benefits of solid stock picking there. Positioning in financials further detracted. At the stock level, moving to a significant underweighting in China-based Internet media firm Tencent Holdings made this index name the fund's biggest relative detractor, in view of its 19% advance. Underweighting and ultimately selling benchmark component CK Hutchison Holdings, which returned roughly 16%, also worked against us. Lastly, I'll mention an underweighting in benchmark heavyweight Taiwan Semiconductor Manufacturing, whose shares posted a modest gain and therefore detracted from our relative result.
The views expressed above reflect those of the portfolio manager(s) only through the end of the period as stated on the cover of this report and do not necessarily represent the views of Fidelity or any other person in the Fidelity organization. Any such views are subject to change at any time based upon market or other conditions and Fidelity disclaims any responsibility to update such views. These views may not be relied on as investment advice and, because investment decisions for a Fidelity fund are based on numerous factors, may not be relied on as an indication of trading intent on behalf of any Fidelity fund.
Annual Report
Fidelity China Region Fund
As a shareholder of the Fund, you incur two types of costs: (1) transaction costs, including sales charges (loads) on purchase payments or redemption proceeds, redemption fees and (2) ongoing costs, including management fees, distribution and/or service (12b-1) fees and other Fund expenses. This Example is intended to help you understand your ongoing costs (in dollars) of investing in the Fund and to compare these costs with the ongoing costs of investing in other mutual funds.
The Example is based on an investment of $1,000 invested at the beginning of the period and held for the entire period (May 1, 2015 to October 31, 2015).
Actual Expenses
The first line of the accompanying table for each class of the Fund provides information about actual account values and actual expenses. You may use the information in this line, together with the amount you invested, to estimate the expenses that you paid over the period. Simply divide your account value by $1,000.00 (for example, an $8,600 account value divided by $1,000.00 = 8.6), then multiply the result by the number in the first line for a class of the Fund under the heading entitled "Expenses Paid During Period" to estimate the expenses you paid on your account during this period. A small balance maintenance fee of $12.00 that is charged once a year may apply for certain accounts with a value of less than $2,000. This fee is not included in the table below. If it was, the estimate of expenses you paid during the period would be higher, and your ending account value lower, by this amount. In addition, the Fund, as a shareholder in the underlying Fidelity Central Funds, will indirectly bear its pro-rata share of the fees and expenses incurred by the underlying Fidelity Central Funds. These fees and expenses are not included in the Fund's annualized expense ratio used to calculate the expense estimate in the table below.
Hypothetical Example for Comparison Purposes
The second line of the accompanying table for each class of the Fund provides information about hypothetical account values and hypothetical expenses based on a Class' actual expense ratio and an assumed rate of return of 5% per year before expenses, which is not the Class' actual return. The hypothetical account values and expenses may not be used to estimate the actual ending account balance or expenses you paid for the period. You may use this information to compare the ongoing costs of investing in the Fund and other funds. To do so, compare this 5% hypothetical example with the 5% hypothetical examples that appear in the shareholder reports of the other funds. A small balance maintenance fee of $12.00 that is charged once a year may apply for certain accounts with a value of less than $2,000. This fee is not included in the table below. If it was, the estimate of expenses you paid during the period would be higher, and your ending account value lower, by this amount. In addition, the Fund, as a shareholder in the underlying Fidelity Central Funds, will indirectly bear its pro-rata share of the fees and expenses incurred by the underlying Fidelity Central Funds. These fees and expenses are not included in the Fund's annualized expense ratio used to calculate the expense estimate in the table below.
Please note that the expenses shown in the table are meant to highlight your ongoing costs only and do not reflect any transaction costs. Therefore, the second line of the table is useful in comparing ongoing costs only, and will not help you determine the relative total costs of owning different funds. In addition, if these transactional costs were included, your costs would have been higher.
| Annualized
Expense RatioB | Beginning
Account Value
May 1, 2015 | Ending
Account Value
October 31, 2015 | Expenses Paid
During PeriodC
May 1, 2015
to October 31, 2015 |
Class A | 1.29% | | | |
Actual | | $ 1,000.00 | $ 779.10 | $ 5.78 |
HypotheticalA | | $ 1,000.00 | $ 1,018.70 | $ 6.56 |
Class T | 1.63% | | | |
Actual | | $ 1,000.00 | $ 777.70 | $ 7.30 |
HypotheticalA | | $ 1,000.00 | $ 1,016.99 | $ 8.29 |
Class B | 2.10% | | | |
Actual | | $ 1,000.00 | $ 776.30 | $ 9.40 |
HypotheticalA | | $ 1,000.00 | $ 1,014.62 | $ 10.66 |
Class C | 2.06% | | | |
Actual | | $ 1,000.00 | $ 776.20 | $ 9.22 |
HypotheticalA | | $ 1,000.00 | $ 1,014.82 | $ 10.46 |
China Region | .99% | | | |
Actual | | $ 1,000.00 | $ 780.50 | $ 4.35 |
HypotheticalA | | $ 1,000.00 | $ 1,020.21 | $ 5.04 |
Class I | .97% | | | |
Actual | | $ 1,000.00 | $ 780.50 | $ 4.35 |
HypotheticalA | | $ 1,000.00 | $ 1,020.32 | $ 4.94 |
A 5% return per year before expenses
B Annualized expense ratio reflects expenses net of applicable fee waivers.
C Expenses are equal to each Class' annualized expense ratio, multiplied by the average account value over the period, multiplied by 184/365 (to reflect the one-half year period).
Annual Report
Fidelity China Region Fund
Investment Changes (Unaudited)
Asset Allocation as of October 31, 2015 |
| % of fund's
net assets | % of fund's net assets
6 months ago |
Stocks | 98.6 | 99.2 |
Short-Term Investments and Net Other Assets (Liabilities) | 1.4 | 0.8 |
Top Ten Stocks as of October 31, 2015 |
| % of fund's
net assets | % of fund's net assets
6 months ago |
Tencent Holdings Ltd. (Internet Software & Services) | 6.0 | 3.2 |
China Construction Bank Corp. (H Shares) (Banks) | 4.9 | 3.6 |
AIA Group Ltd. (Insurance) | 3.3 | 4.4 |
Bank of China Ltd. (H Shares) (Banks) | 3.1 | 3.1 |
Ping An Insurance (Group) Co. of China Ltd. (H Shares) (Insurance) | 2.8 | 2.3 |
China Pacific Insurance (Group) Co. Ltd. (H Shares) (Insurance) | 2.3 | 2.3 |
Industrial & Commercial Bank of China Ltd. (H Shares) (Banks) | 2.3 | 4.1 |
Chongqing Changan Automobile Co. Ltd. (B Shares) (Automobiles) | 2.2 | 1.4 |
Hangzhou Hikvision Digital Technology Co. Ltd. ELS (BNP Paribas Warrant Program) warrants 11/27/17 (Banks) | 2.0 | 0.9 |
China Merchants Bank Co. Ltd. (H Shares) (Banks) | 1.9 | 1.6 |
| 30.8 | |
Market Sectors as of October 31, 2015 |
| % of fund's net assets | % of fund's net assets
6 months ago |
Financials | 37.8 | 40.4 |
Consumer Discretionary | 14.4 | 13.3 |
Information Technology | 14.0 | 16.6 |
Industrials | 12.9 | 12.2 |
Materials | 6.7 | 4.0 |
Health Care | 5.5 | 9.1 |
Telecommunication Services | 2.4 | 1.4 |
Consumer Staples | 2.0 | 1.7 |
Energy | 1.6 | 0.0 |
Utilities | 1.3 | 0.5 |
The fund may invest up to 35% of its total assets in any industry that represents more than 20% of the Hong Kong, Taiwanese and Chinese market. As of October 31, 2015, the fund did not have more than 25% of its total assets invested in any one industry. Percentages shown as 0.0% may reflect amounts less than 0.05%. |
Annual Report
Fidelity China Region Fund
Investments October 31, 2015
Showing Percentage of Net Assets
Common Stocks - 98.0% |
| Shares | | Value |
CONSUMER DISCRETIONARY - 13.8% |
Auto Components - 1.4% |
Weifu High-Technology Co. Ltd. (B Shares) | 4,257,836 | | $ 10,855,699 |
Xingda International Holdings Ltd. | 34,649,000 | | 7,697,062 |
| | 18,552,761 |
Automobiles - 3.3% |
Brilliance China Automotive Holdings Ltd. | 10,008,000 | | 13,877,531 |
Chongqing Changan Automobile Co. Ltd. (B Shares) | 15,733,741 | | 28,957,143 |
Geely Automobile Holdings Ltd. | 3,490,000 | | 1,861,105 |
| | 44,695,779 |
Diversified Consumer Services - 0.2% |
Perfect Shape (PRC) Holdings Ltd. | 10,848,000 | | 2,037,136 |
Hotels, Restaurants & Leisure - 2.2% |
500.com Ltd. sponsored ADR Class A (a)(d) | 300,000 | | 6,090,000 |
Huangshan Tourism Development Co. Ltd. | 5,899,876 | | 10,098,245 |
Tuniu Corp. Class A sponsored ADR (a)(d) | 895,000 | | 13,809,850 |
| | 29,998,095 |
Household Durables - 1.1% |
Haier Electronics Group Co. Ltd. | 5,492,000 | | 10,614,115 |
Qingdao Haier Co. Ltd. | 3,099,822 | | 4,719,036 |
| | 15,333,151 |
Internet & Catalog Retail - 2.7% |
Ctrip.com International Ltd. sponsored ADR (a)(d) | 243,000 | | 22,591,710 |
Qunar Cayman Islands Ltd. sponsored ADR (a)(d) | 285,000 | | 13,833,900 |
| | 36,425,610 |
Media - 0.9% |
Poly Culture Group Corp. Ltd. (H Shares) (d) | 4,978,100 | | 11,968,205 |
Specialty Retail - 0.4% |
China Harmony New Energy Auto | 7,500,000 | | 5,002,429 |
Textiles, Apparel & Luxury Goods - 1.6% |
Best Pacific International Holdings Ltd. | 9,297,000 | | 3,946,589 |
Lao Feng Xiang Co. Ltd. (B Shares) | 2,499,988 | | 10,757,394 |
Toung Loong Textile Manufacturing Co. Ltd. | 2,375,000 | | 7,191,206 |
| | 21,895,189 |
TOTAL CONSUMER DISCRETIONARY | | 185,908,355 |
CONSUMER STAPLES - 2.0% |
Beverages - 1.4% |
Kweichow Moutai Co. Ltd. | 555,952 | | 18,771,044 |
|
| Shares | | Value |
Food & Staples Retailing - 0.6% |
China Resources Beer Holdings Co. Ltd. | 3,942,000 | | $ 7,443,167 |
TOTAL CONSUMER STAPLES | | 26,214,211 |
ENERGY - 1.6% |
Oil, Gas & Consumable Fuels - 1.6% |
China Petroleum & Chemical Corp. (H Shares) | 29,576,000 | | 21,319,684 |
FINANCIALS - 37.8% |
Banks - 17.6% |
Bank Communications Co. Ltd. (H Shares) | 29,071,000 | | 21,442,752 |
Bank of China Ltd. (H Shares) | 89,124,000 | | 42,027,437 |
China Construction Bank Corp. (H Shares) | 90,503,000 | | 65,592,590 |
China Merchants Bank Co. Ltd. (H Shares) | 9,776,000 | | 25,524,331 |
China Minsheng Banking Corp. Ltd. (H Shares) | 10,800,000 | | 10,853,532 |
Hangzhou Hikvision Digital Technology Co. Ltd. ELS (BNP Paribas Warrant Program) warrants 11/27/17 (a)(f) | 4,809,000 | | 26,200,354 |
Industrial & Commercial Bank of China Ltd. (H Shares) | 48,916,000 | | 31,027,702 |
Midea Group Co. Ltd. ELS (BNP Paribas Arbitrage Warrant Program) warrants 2/10/17 (a)(f) | 3,090,600 | | 13,619,332 |
| | 236,288,030 |
Capital Markets - 4.6% |
Beijing Yanjing Brewery Co. Ltd. ELS (UBS Warrant Programme) warrants 7/30/18 (a)(f) | 10,595,900 | | 14,753,023 |
Guotai Junan International Holdings Ltd. | 27,600,000 | | 10,181,009 |
Haitong Securities Co. Ltd. (H Shares) | 5,600,000 | | 9,743,426 |
Huatai Securities Co. Ltd. (a) | 2,727,564 | | 6,189,058 |
Huayi Brothers Media Corp. (UBS Warrant Programme) warrants 5/19/16 ELS (a)(f) | 1,490,000 | | 8,649,929 |
Tai Fook Securities Group Ltd. | 21,756,000 | | 12,022,457 |
Value Partners Group Ltd. | 956,000 | | 1,012,325 |
| | 62,551,227 |
Insurance - 12.0% |
AIA Group Ltd. | 7,498,200 | | 43,964,430 |
China Life Insurance Co. Ltd. (H Shares) | 2,796,200 | | 10,083,333 |
China Pacific Insurance (Group) Co. Ltd. (H Shares) | 7,908,800 | | 31,503,886 |
New China Life Insurance Co. Ltd. (H Shares) | 3,477,000 | | 15,310,621 |
People's Insurance Co. of China Group (H Shares) | 43,065,000 | | 23,047,521 |
Ping An Insurance (Group) Co. of China Ltd. (H Shares) | 6,745,500 | | 37,864,178 |
| | 161,773,969 |
Real Estate Management & Development - 3.6% |
Beijing Capital Land Ltd. (H Shares) | 35,170,000 | | 16,877,281 |
Common Stocks - continued |
| Shares | | Value |
FINANCIALS - continued |
Real Estate Management & Development - continued |
Greenland Hong Kong Holdings Ltd. (a) | 12,000,000 | | $ 5,066,888 |
Greentown China Holdings Ltd. (a)(d) | 15,740,500 | | 13,767,822 |
Shimao Property Holdings Ltd. | 6,908,500 | | 12,099,133 |
| | 47,811,124 |
TOTAL FINANCIALS | | 508,424,350 |
HEALTH CARE - 5.5% |
Health Care Providers & Services - 1.0% |
China National Accord Medicines Corp. Ltd. | 1,256,673 | | 6,282,359 |
Phoenix Healthcare Group Ltd. (d) | 4,576,500 | | 6,930,318 |
| | 13,212,677 |
Life Sciences Tools & Services - 0.7% |
JHL Biotech, Inc. (a) | 4,010,696 | | 8,944,229 |
Pharmaceuticals - 3.8% |
CSPC Pharmaceutical Group Ltd. | 19,732,000 | | 18,371,405 |
Lee's Pharmaceutical Holdings Ltd. | 8,273,500 | | 10,682,214 |
Livzon Pharmaceutical Group, Inc. | 1,690,000 | | 8,087,083 |
Sino Biopharmaceutical Ltd. | 11,404,000 | | 14,171,754 |
| | 51,312,456 |
TOTAL HEALTH CARE | | 73,469,362 |
INDUSTRIALS - 12.9% |
Air Freight & Logistics - 0.5% |
Sinotrans Air Transportation Development Co. Ltd. (A Shares) | 1,599,830 | | 6,628,659 |
Airlines - 3.0% |
Air China Ltd. (H Shares) | 6,648,000 | | 6,403,457 |
China Eastern Airlines Corp. Ltd. (H Shares) (a) | 26,446,000 | | 16,966,898 |
China Southern Airlines Ltd. (H Shares) | 20,194,000 | | 17,162,111 |
| | 40,532,466 |
Construction & Engineering - 1.9% |
Beijing Urban Consolidated & Development Group Ltd. (H Shares) (d) | 20,963,000 | | 12,897,334 |
China Communications Construction Co. Ltd. (H Shares) | 9,859,000 | | 13,607,270 |
| | 26,504,604 |
Electrical Equipment - 1.7% |
Harbin Electric Machinery Co. Ltd. (H Shares) (d) | 21,974,000 | | 13,099,547 |
Jiangnan Group Ltd. | 44,374,000 | | 10,161,406 |
| | 23,260,953 |
Machinery - 2.6% |
HIWIN Technologies Corp. | 1,339,000 | | 7,485,862 |
Lonking Holdings Ltd. | 28,600,000 | | 4,587,050 |
Sinotruk Hong Kong Ltd. | 8,000,000 | | 3,329,894 |
|
| Shares | | Value |
Weichai Power Co. Ltd. (H Shares) | 7,850,000 | | $ 8,323,944 |
Zhengzhou Yutong Bus Co. Ltd. | 3,149,956 | | 10,849,396 |
| | 34,576,146 |
Marine - 1.4% |
China Shipping Development Co. Ltd. (H Shares) (d) | 22,444,000 | | 15,897,809 |
Sinotrans Shipping Ltd. (d) | 12,186,000 | | 2,567,548 |
| | 18,465,357 |
Trading Companies & Distributors - 1.8% |
Summit Ascent Holdings Ltd. (a)(d) | 48,136,000 | | 23,957,754 |
TOTAL INDUSTRIALS | | 173,925,939 |
INFORMATION TECHNOLOGY - 14.0% |
Electronic Equipment & Components - 3.4% |
Largan Precision Co. Ltd. | 159,000 | | 12,415,370 |
Sunny Optical Technology Group Co. Ltd. (d) | 4,500,000 | | 10,463,038 |
Tongda Group Holdings Ltd. | 65,800,000 | | 13,400,975 |
Wasion Group Holdings Ltd. | 8,250,000 | | 9,152,424 |
| | 45,431,807 |
Internet Software & Services - 8.7% |
58.com, Inc. ADR (a)(d) | 254,478 | | 13,357,550 |
Alibaba Group Holding Ltd. sponsored ADR (a) | 95,000 | | 7,963,850 |
Baozun, Inc. sponsored ADR (d) | 382,374 | | 3,303,711 |
NetEase, Inc. sponsored ADR | 30,000 | | 4,335,900 |
SINA Corp. (a) | 150,000 | | 7,146,000 |
Tencent Holdings Ltd. | 4,263,400 | | 80,362,442 |
| | 116,469,453 |
Software - 0.9% |
China City Railway Transportation Technology Holdings Co. Ltd. (a) | 48,540,000 | | 12,889,066 |
Technology Hardware, Storage & Peripherals - 1.0% |
ADLINK Technology, Inc. | 3,488,336 | | 9,412,544 |
Axiomtek Co. Ltd. | 2,000,000 | | 4,281,534 |
| | 13,694,078 |
TOTAL INFORMATION TECHNOLOGY | | 188,484,404 |
MATERIALS - 6.7% |
Construction Materials - 4.7% |
Asia Cement (China) Holdings Corp. | 2,818,000 | | 875,515 |
BBMG Corp. (H Shares) | 34,800,000 | | 24,387,043 |
China Shanshui Cement Group Ltd. (a)(d) | 20,656,000 | | 14,440,021 |
West China Cement Ltd. (d) | 133,122,000 | | 22,887,052 |
| | 62,589,631 |
Metals & Mining - 1.1% |
Angang Steel Co. Ltd. (H Shares) (d) | 16,946,000 | | 7,041,687 |
Common Stocks - continued |
| Shares | | Value |
MATERIALS - continued |
Metals & Mining - continued |
Fushan International Energy Group Ltd. (d) | 30,000,000 | | $ 4,047,633 |
Maanshan Iron & Steel Ltd. (H Shares) (a)(d) | 20,000,000 | | 4,281,653 |
| | 15,370,973 |
Paper & Forest Products - 0.9% |
Lee & Man Paper Manufacturing Ltd. | 9,455,000 | | 5,886,341 |
Nine Dragons Paper (Holdings) Ltd. | 9,000,000 | | 5,938,554 |
| | 11,824,895 |
TOTAL MATERIALS | | 89,785,499 |
TELECOMMUNICATION SERVICES - 2.4% |
Diversified Telecommunication Services - 2.4% |
China Telecom Corp. Ltd. (H Shares) | 13,024,000 | | 6,793,608 |
China Unicom Ltd. | 13,784,000 | | 16,798,406 |
CITIC 1616 Holdings Ltd. | 19,565,000 | | 8,110,882 |
| | 31,702,896 |
UTILITIES - 1.3% |
Independent Power and Renewable Electricity Producers - 1.3% |
Beijing Jingneng Clean Energy Co. Ltd. (H Shares) (d) | 50,462,000 | | 17,460,148 |
TOTAL COMMON STOCKS (Cost $1,406,055,507) |
1,316,694,848
|
Nonconvertible Preferred Stocks - 0.6% |
| | | |
CONSUMER DISCRETIONARY - 0.6% |
Internet & Catalog Retail - 0.6% |
China Internet Plus Holdings Ltd. (e) (Cost $6,268,244) | 1,983,088 | | 7,654,720 |
Money Market Funds - 7.0% |
| Shares | | Value |
Fidelity Cash Central Fund, 0.18% (b) | 20,040,108 | | $ 20,040,108 |
Fidelity Securities Lending Cash Central Fund, 0.19% (b)(c) | 74,180,545 | | 74,180,545 |
TOTAL MONEY MARKET FUNDS (Cost $94,220,653) |
94,220,653
|
TOTAL INVESTMENT
PORTFOLIO - 105.6% (Cost $1,506,544,404) | | 1,418,570,221 |
NET OTHER ASSETS (LIABILITIES) - (5.6)% | | (75,006,869) |
NET ASSETS - 100% | $ 1,343,563,352 |
Security Type Abbreviations |
ELS - Equity-Linked Security |
Legend |
(a) Non-income producing |
(b) Affiliated fund that is generally available only to investment companies and other accounts managed by Fidelity Investments. The rate quoted is the annualized seven-day yield of the fund at period end. A complete unaudited listing of the fund's holdings as of its most recent quarter end is available upon request. In addition, each Fidelity Central Fund's financial statements, which are not covered by the Fund's Report of Independent Registered Public Accounting Firm, are available on the SEC's website or upon request. |
(c) Investment made with cash collateral received from securities on loan. |
(d) Security or a portion of the security is on loan at period end. |
(e) Restricted securities - Investment in securities not registered under the Securities Act of 1933 (excluding 144A issues). At the end of the period, the value of restricted securities (excluding 144A issues) amounted to $7,654,720 or 0.6% of net assets. |
(f) Security exempt from registration under Rule 144A of the Securities Act of 1933. These securities may be resold in transactions exempt from registration, normally to qualified institutional buyers. At the end of the period, the value of these securities amounted to $63,222,638 or 4.7% of net assets. |
Additional information on each restricted holding is as follows: |
Security | Acquisition Date | Acquisition Cost |
China Internet Plus Holdings Ltd. (formerly Meituan Corp. Series D) | 1/26/15 | $ 6,268,244 |
Affiliated Central Funds |
Information regarding fiscal year to date income earned by the Fund from investments in Fidelity Central Funds is as follows: |
Fund | Income earned |
Fidelity Cash Central Fund | $ 41,819 |
Fidelity Securities Lending Cash Central Fund | 1,591,746 |
Total | $ 1,633,565 |
Other Affiliated Issuers |
An affiliated company is a company in which the Fund has ownership of at least 5% of the voting securities. Fiscal year to date transactions with companies which are or were affiliates are as follows: |
Affiliate | Value,
beginning of
period | Purchases | Sales
Proceeds | Dividend
Income | Value,
end of
period |
Jintex Corp. Ltd. | $ 4,548,561 | $ - | $ 3,438,888 | $ 67,797 | $ - |
Perfect Shape (PRC) Holdings Ltd. | 11,817,466 | - | 11,514,825 | 618,242 | - |
Total | $ 16,366,027 | $ - | $ 14,953,713 | $ 686,039 | $ - |
Other Information |
Categorizations in the Schedule of Investments are based on country or territory of incorporation. |
The following is a summary of the inputs used, as of October 31, 2015, involving the Fund's assets and liabilities carried at fair value. The inputs or methodology used for valuing securities may not be an indication of the risk associated with investing in those securities. For more information on valuation inputs, and their aggregation into the levels used in the tables below, please refer to the Investment Valuation section in the accompanying Notes to Financial Statements. |
Valuation Inputs at Reporting Date: |
Description | Total | Level 1 | Level 2 | Level 3 |
Investments in Securities: | | | | |
Equities: | | | | |
Consumer Discretionary | $ 193,563,075 | $ 63,516,666 | $ 117,672,653 | $ 12,373,756 |
Consumer Staples | 26,214,211 | - | 26,214,211 | - |
Energy | 21,319,684 | - | 21,319,684 | - |
Financials | 508,424,350 | - | 508,424,350 | - |
Health Care | 73,469,362 | 8,944,229 | 50,155,691 | 14,369,442 |
Industrials | 173,925,939 | 7,485,862 | 150,542,268 | 15,897,809 |
Information Technology | 188,484,404 | 62,216,459 | 126,267,945 | - |
Materials | 89,785,499 | - | 75,345,478 | 14,440,021 |
Telecommunication Services | 31,702,896 | - | 31,702,896 | - |
Utilities | 17,460,148 | - | 17,460,148 | - |
Money Market Funds | 94,220,653 | 94,220,653 | - | - |
Total Investments in Securities: | $ 1,418,570,221 | $ 236,383,869 | $ 1,125,105,324 | $ 57,081,028 |
Valuation Inputs at Reporting Date: |
The following is a reconciliation of Investments in Securities for which Level 3 inputs were used in determining value: |
Investments in Securities: | |
Equities - Health Care | |
Beginning Balance | $ - |
Net Realized Gain (Loss) on Investment Securities | (1,817,855) |
Net Unrealized Gain (Loss) on Investment Securities | (5,958,733) |
Cost of Purchases | 25,544,803 |
Proceeds of Sales | (3,398,773) |
Amortization/Accretion | - |
Transfers into Level 3 | - |
Transfers out of Level 3 | - |
Ending Balance | $ 14,369,442 |
The change in unrealized gain (loss) for the period attributable to Level 3 securities held at October 31, 2015 | $ (5,958,733) |
Investments in Securities: - continued | |
Equities - Industrials | |
Beginning Balance | $ 28,267,179 |
Net Realized Gain (Loss) on Investment Securities | 26,158,350 |
Net Unrealized Gain (Loss) on Investment Securities | (2,283,451) |
Cost of Purchases | - |
Proceeds of Sales | (56,940,777) |
Amortization/Accretion | - |
Transfers into Level 3 | 20,696,508 |
Transfers out of Level 3 | - |
Ending Balance | $ 15,897,809 |
The change in unrealized gain (loss) for the period attributable to Level 3 securities held at October 31, 2015 | $ 106,019 |
Equities - Materials | |
Beginning Balance | $ - |
Net Realized Gain (Loss) on Investment Securities | 756,975 |
Net Unrealized Gain (Loss) on Investment Securities | 8,418,482 |
Cost of Purchases | 4,180,368 |
Proceeds of Sales | (11,841,958) |
Amortization/Accretion | - |
Transfers into Level 3 | 12,926,154 |
Transfers out of Level 3 | - |
Ending Balance | $ 14,440,021 |
The change in unrealized gain (loss) for the period attributable to Level 3 securities held at October 31, 2015 | $ 8,418,482 |
Other Investments in Securities | |
Beginning Balance | $ - |
Net Realized Gain (Loss) on Investment Securities | - |
Net Unrealized Gain (Loss) on Investment Securities | 1,098,419 |
Cost of Purchases | 11,275,337 |
Proceeds of Sales | - |
Amortization/Accretion | - |
Transfers into Level 3 | - |
Transfers out of Level 3 | - |
Ending Balance | $ 12,373,756 |
The change in unrealized gain (loss) for the period attributable to Level 3 securities held at October 31, 2015 | $ 1,098,419 |
The information used in the above reconciliations represents fiscal year to date activity for any Investments in Securities identified as using Level 3 inputs at either the beginning or the end of the current fiscal period. Transfers into Level 3 were attributable to a lack of observable market data resulting from decreases in market activity, decreases in liquidity, security restructurings or corporate actions. Transfers out of Level 3 were attributable to observable market data becoming available for those securities. Transfers in or out of Level 3 represent the beginning value of any Security or Instrument where a change in the pricing level occurred from the beginning to the end of the period. The cost of purchases and the proceeds of sales may include securities received or delivered through corporate actions or exchanges. Realized and unrealized gains (losses) disclosed in the reconciliations are included in Net Gain (Loss) on the Fund's Statement of Operations. |
See accompanying notes which are an integral part of the financial statements.
Annual Report
Fidelity China Region Fund
Statement of Assets and Liabilities
| | October 31, 2015 |
| | |
Assets | | |
Investment in securities, at value (including securities loaned of $71,336,273) - See accompanying schedule: Unaffiliated issuers (cost $1,412,323,751) | $ 1,324,349,568 | |
Fidelity Central Funds (cost $94,220,653) | 94,220,653 | |
Total Investments (cost $1,506,544,404) | | $ 1,418,570,221 |
Foreign currency held at value (cost $10,322) | | 10,322 |
Receivable for investments sold | | 31,588,752 |
Receivable for fund shares sold | | 744,097 |
Distributions receivable from Fidelity Central Funds | | 146,630 |
Prepaid expenses | | 4,421 |
Other receivables | | 64,001 |
Total assets | | 1,451,128,444 |
| | |
Liabilities | | |
Payable to custodian bank | $ 614,622 | |
Payable for investments purchased | 29,848,266 | |
Payable for fund shares redeemed | 1,720,602 | |
Accrued management fee | 778,922 | |
Distribution and service plan fees payable | 21,873 | |
Other affiliated payables | 279,048 | |
Other payables and accrued expenses | 121,214 | |
Collateral on securities loaned, at value | 74,180,545 | |
Total liabilities | | 107,565,092 |
| | |
Net Assets | | $ 1,343,563,352 |
Net Assets consist of: | | |
Paid in capital | | $ 1,260,547,395 |
Undistributed net investment income | | 15,009,760 |
Accumulated undistributed net realized gain (loss) on investments and foreign currency transactions | | 155,980,478 |
Net unrealized appreciation (depreciation) on investments and assets and liabilities in foreign currencies | | (87,974,281) |
Net Assets | | $ 1,343,563,352 |
Statement of Assets and Liabilities - continued
| | October 31, 2015 |
| | |
Calculation of Maximum Offering Price | | |
Class A:
Net Asset Value and redemption price per share ($32,761,115 ÷ 1,116,422 shares) | | $ 29.34 |
| | |
Maximum offering price per share (100/94.25 of $29.34) | | $ 31.13 |
Class T:
Net Asset Value and redemption price per share ($6,409,433 ÷ 219,622 shares) | | $ 29.18 |
| | |
Maximum offering price per share (100/96.50 of $29.18) | | $ 30.24 |
Class B:
Net Asset Value and offering price per share ($803,297 ÷ 27,731 shares)A | | $ 28.97 |
| | |
Class C:
Net Asset Value and offering price per share ($14,354,928 ÷ 500,466 shares)A | | $ 28.68 |
| | |
China Region:
Net Asset Value, offering price and redemption price per share ($1,262,273,952 ÷ 42,556,989 shares) | | $ 29.66 |
| | |
Class I:
Net Asset Value, offering price and redemption price per share ($26,960,627 ÷ 913,526 shares) | | $ 29.51 |
A Redemption price per share is equal to net asset value less any applicable contingent deferred sales charge.
See accompanying notes which are an integral part of the financial statements.
Annual Report
Fidelity China Region Fund
Financial Statements - continued
Statement of Operations
| Year ended October 31, 2015 |
Investment Income | | |
Dividends | | $ 33,758,610 |
Special dividends | | 6,256,295 |
Interest | | 52 |
Income from Fidelity Central Funds | | 1,633,565 |
Income before foreign taxes withheld | | 41,648,522 |
Less foreign taxes withheld | | (2,809,673) |
Total income | | 38,838,849 |
| | |
Expenses | | |
Management fee | $ 10,781,575 | |
Transfer agent fees | 3,034,252 | |
Distribution and service plan fees | 263,655 | |
Accounting and security lending fees | 701,186 | |
Custodian fees and expenses | 496,967 | |
Independent trustees' compensation | 6,577 | |
Registration fees | 169,544 | |
Audit | 76,554 | |
Legal | 3,876 | |
Interest | 8,766 | |
Miscellaneous | 11,466 | |
Total expenses before reductions | 15,554,418 | |
Expense reductions | (386,498) | 15,167,920 |
Net investment income (loss) | | 23,670,929 |
Realized and Unrealized Gain (Loss) | | |
Net realized gain (loss) on: | | |
Investment securities: | | |
Unaffiliated issuers (net of foreign taxes of $22,185) | 238,768,578 | |
Other affiliated issuers | (1,777,152) | |
Foreign currency transactions | (1,517,412) | |
Total net realized gain (loss) | | 235,474,014 |
Change in net unrealized appreciation (depreciation) on: Investment securities | (344,544,479) | |
Assets and liabilities in foreign currencies | 3,269 | |
Total change in net unrealized appreciation (depreciation) | | (344,541,210) |
Net gain (loss) | | (109,067,196) |
Net increase (decrease) in net assets resulting from operations | | $ (85,396,267) |
Statement of Changes in Net Assets
| Year ended
October 31,
2015 | Year ended
October 31,
2014 |
Increase (Decrease) in Net Assets | | |
Operations | | |
Net investment income (loss) | $ 23,670,929 | $ 13,925,917 |
Net realized gain (loss) | 235,474,014 | 191,786,909 |
Change in net unrealized appreciation (depreciation) | (344,541,210) | (115,260,428) |
Net increase (decrease) in net assets resulting from operations | (85,396,267) | 90,452,398 |
Distributions to shareholders from net investment income | (13,114,934) | (15,459,434) |
Distributions to shareholders from net realized gain | (172,413,722) | (136,131,549) |
Total distributions | (185,528,656) | (151,590,983) |
Share transactions - net increase (decrease) | 200,238,928 | 1,574,280 |
Redemption fees | 2,391,591 | 349,352 |
Total increase (decrease) in net assets | (68,294,404) | (59,214,953) |
| | |
Net Assets | | |
Beginning of period | 1,411,857,756 | 1,471,072,709 |
End of period (including undistributed net investment income of $15,009,760 and undistributed net investment income of $12,102,115, respectively) | $ 1,343,563,352 | $ 1,411,857,756 |
See accompanying notes which are an integral part of the financial statements.
Annual Report
Financial Highlights - Fidelity China Region Fund Class A
Years ended October 31, | 2015 | 2014 | 2013 | 2012 | 2011 |
Selected Per-Share Data | | | | | |
Net asset value, beginning of period | $ 34.18 | $ 35.56 | $ 28.53 | $ 27.28 | $ 31.61 |
Income from Investment Operations | | | | | |
Net investment income (loss) C | .40F | .21 | .30 | .36 | .33 |
Net realized and unrealized gain (loss) | (.83) | 2.01 I | 7.06 | 1.42 | (4.33) |
Total from investment operations | (.43) | 2.22 | 7.36 | 1.78 | (4.00) |
Distributions from net investment income | (.22) | (.30) | (.34) | (.19) | (.31) |
Distributions from net realized gain | (4.24) | (3.31) | - | (.34) | (.03) |
Total distributions | (4.46) | (3.61) | (.34) | (.53) | (.34) |
Redemption fees added to paid in capitalC | .05 | .01 | .01 | -H | .01 |
Net asset value, end of period | $ 29.34 | $ 34.18 | $ 35.56 | $ 28.53 | $ 27.28 |
Total ReturnA, B | (1.45)% | 6.45% I | 26.07% | 6.70% | (12.79)% |
Ratios to Average Net AssetsD, G | | | | | |
Expenses before reductions | 1.28% | 1.35% | 1.35% | 1.36% | 1.37% |
Expenses net of fee waivers, if any | 1.28% | 1.35% | 1.35% | 1.36% | 1.37% |
Expenses net of all reductions | 1.26% | 1.35% | 1.31% | 1.29% | 1.31% |
Net investment income (loss) | 1.26%F | .64% | .94% | 1.35% | 1.07% |
Supplemental Data | | | | | |
Net assets, end of period (000 omitted) | $ 32,761 | $ 21,728 | $ 20,623 | $ 13,539 | $ 14,808 |
Portfolio turnover rateE | 151% | 87% | 92% | 107% | 87% |
ATotal returns would have been lower if certain expenses had not been reduced during the applicable periods shown. BTotal returns do not include the effect of the sales charges. CCalculated based on average shares outstanding during the period. DFees and expenses of any underlying Fidelity Central Funds are not included in the Fund's expense ratio. The Fund indirectly bears its proportionate share of the expenses of any underlying Fidelity Central Funds. EAmount does not include the portfolio activity of any underlying Fidelity Central Funds. FInvestment income per share reflects a large, non-recurring dividend which amounted to $.13 per share. Excluding this non-recurring dividend, the ratio of net investment income (loss) to average net assets would have been .85%. GExpense ratios reflect operating expenses of the class. Expenses before reductions do not reflect amounts reimbursed by the investment adviser or reductions from brokerage service arrangements or reductions from other expense offset arrangements and do not represent the amount paid by the class during periods when reimbursements or reductions occur. Expenses net of fee waivers reflect expenses after reimbursement by the investment adviser but prior to reductions from brokerage service arrangements or other expense offset arrangements. Expenses net of all reductions represent the net expenses paid by the class. HAmount represents less than $.005 per share. IAmount includes a reimbursement from the investment adviser for an operational error which amounted to $.01 per share. Excluding this reimbursement, the total return would have been 6.42%. |
Financial Highlights - Fidelity China Region Fund Class T
Years ended October 31, | 2015 | 2014 | 2013 | 2012 | 2011 |
Selected Per-Share Data | | | | | |
Net asset value, beginning of period | $ 34.02 | $ 35.40 | $ 28.40 | $ 27.13 | $ 31.48 |
Income from Investment Operations | | | | | |
Net investment income (loss) C | .30F | .12 | .21 | .29 | .25 |
Net realized and unrealized gain (loss) | (.83) | 1.99 J | 7.04 | 1.40 | (4.32) |
Total from investment operations | (.53) | 2.11 | 7.25 | 1.69 | (4.07) |
Distributions from net investment income | (.12) | (.19) | (.26) | (.08) | (.27) |
Distributions from net realized gain | (4.24) | (3.31) | - | (.34) | (.03) |
Total distributions | (4.36) | (3.50) | (.26) | (.42) | (.29) I |
Redemption fees added to paid in capitalC | .05 | .01 | .01 | -H | .01 |
Net asset value, end of period | $ 29.18 | $ 34.02 | $ 35.40 | $ 28.40 | $ 27.13 |
Total ReturnA, B | (1.79)% | 6.15% J | 25.74% | 6.38% | (13.04)% |
Ratios to Average Net AssetsD, G | | | | | |
Expenses before reductions | 1.62% | 1.65% | 1.64% | 1.64% | 1.63% |
Expenses net of fee waivers, if any | 1.62% | 1.65% | 1.64% | 1.64% | 1.63% |
Expenses net of all reductions | 1.60% | 1.65% | 1.60% | 1.57% | 1.57% |
Net investment income (loss) | .92%F | .35% | .65% | 1.06% | .81% |
Supplemental Data | | | | | |
Net assets, end of period (000 omitted) | $ 6,409 | $ 6,305 | $ 5,965 | $ 4,349 | $ 5,281 |
Portfolio turnover rateE | 151% | 87% | 92% | 107% | 87% |
ATotal returns would have been lower if certain expenses had not been reduced during the applicable periods shown. BTotal returns do not include the effect of the sales charges. CCalculated based on average shares outstanding during the period. DFees and expenses of any underlying Fidelity Central Funds are not included in the Fund's expense ratio. The Fund indirectly bears its proportionate share of the expenses of any underlying Fidelity Central Funds. EAmount does not include the portfolio activity of any underlying Fidelity Central Funds. FInvestment income per share reflects a large, non-recurring dividend which amounted to $.13 per share. Excluding this non-recurring dividend, the ratio of net investment income (loss) to average net assets would have been .51%. GExpense ratios reflect operating expenses of the class. Expenses before reductions do not reflect amounts reimbursed by the investment adviser or reductions from brokerage service arrangements or reductions from other expense offset arrangements and do not represent the amount paid by the class during periods when reimbursements or reductions occur. Expenses net of fee waivers reflect expenses after reimbursement by the investment adviser but prior to reductions from brokerage service arrangements or other expense offset arrangements. Expenses net of all reductions represent the net expenses paid by the class. HAmount represents less than $.005 per share. ITotal distributions of $.29 per share is comprised of distributions from net investment income of $.268 and distributions from net realized gain of $.025 per share. JAmount includes a reimbursement from the investment adviser for an operational error which amounted to $.01 per share. Excluding this reimbursement, the total return would have been 6.12%. |
See accompanying notes which are an integral part of the financial statements.
Annual Report
Financial Highlights - Fidelity China Region Fund Class B
Years ended October 31, | 2015 | 2014 | 2013 | 2012 | 2011 |
Selected Per-Share Data | | | | | |
Net asset value, beginning of period | $ 33.79 | $ 35.12 | $ 28.16 | $ 26.94 | $ 31.23 |
Income from Investment Operations | | | | | |
Net investment income (loss) C | .14F | (.04) | .06 | .16 | .10 |
Net realized and unrealized gain (loss) | (.80) | 1.99 I | 6.99 | 1.40 | (4.29) |
Total from investment operations | (.66) | 1.95 | 7.05 | 1.56 | (4.19) |
Distributions from net investment income | - | - | (.10) | - | (.08) |
Distributions from net realized gain | (4.21) | (3.29) | - | (.34) | (.03) |
Total distributions | (4.21) | (3.29) | (.10) | (.34) | (.11) |
Redemption fees added to paid in capitalC | .05 | .01 | .01 | -H | .01 |
Net asset value, end of period | $ 28.97 | $ 33.79 | $ 35.12 | $ 28.16 | $ 26.94 |
Total ReturnA, B | (2.23)% | 5.68% I | 25.12% | 5.90% | (13.45)% |
Ratios to Average Net AssetsD, G | | | | | |
Expenses before reductions | 2.10% | 2.11% | 2.10% | 2.11% | 2.12% |
Expenses net of fee waivers, if any | 2.10% | 2.11% | 2.10% | 2.11% | 2.12% |
Expenses net of all reductions | 2.07% | 2.11% | 2.07% | 2.04% | 2.06% |
Net investment income (loss) | .44%F | (.12)% | .19% | .59% | .32% |
Supplemental Data | | | | | |
Net assets, end of period (000 omitted) | $ 803 | $ 1,215 | $ 1,494 | $ 1,533 | $ 1,801 |
Portfolio turnover rateE | 151% | 87% | 92% | 107% | 87% |
ATotal returns would have been lower if certain expenses had not been reduced during the applicable periods shown. BTotal returns do not include the effect of the contingent deferred sales charge. CCalculated based on average shares outstanding during the period. DFees and expenses of any underlying Fidelity Central Funds are not included in the Fund's expense ratio. The Fund indirectly bears its proportionate share of the expenses of any underlying Fidelity Central Funds. EAmount does not include the portfolio activity of any underlying Fidelity Central Funds. FInvestment income per share reflects a large, non-recurring dividend which amounted to $.13 per share. Excluding this non-recurring dividend, the ratio of net investment income (loss) to average net assets would have been .04%. GExpense ratios reflect operating expenses of the class. Expenses before reductions do not reflect amounts reimbursed by the investment adviser or reductions from brokerage service arrangements or reductions from other expense offset arrangements and do not represent the amount paid by the class during periods when reimbursements or reductions occur. Expenses net of fee waivers reflect expenses after reimbursement by the investment adviser but prior to reductions from brokerage service arrangements or other expense offset arrangements. Expenses net of all reductions represent the net expenses paid by the class. HAmount represents less than $.005 per share. IAmount includes a reimbursement from the investment adviser for an operational error which amounted to $.01 per share. Excluding this reimbursement, the total return would have been 5.65%. |
Financial Highlights - Fidelity China Region Fund Class C
Years ended October 31, | 2015 | 2014 | 2013 | 2012 | 2011 |
Selected Per-Share Data | | | | | |
Net asset value, beginning of period | $ 33.56 | $ 34.99 | $ 28.07 | $ 26.86 | $ 31.19 |
Income from Investment Operations | | | | | |
Net investment income (loss) C | .15F | (.02) | .06 | .16 | .10 |
Net realized and unrealized gain (loss) | (.80) | 1.97 I | 6.97 | 1.39 | (4.28) |
Total from investment operations | (.65) | 1.95 | 7.03 | 1.55 | (4.18) |
Distributions from net investment income | (.04) | (.08) | (.12) | - | (.13) |
Distributions from net realized gain | (4.24) | (3.31) | - | (.34) | (.03) |
Total distributions | (4.28) | (3.39) | (.12) | (.34) | (.16) |
Redemption fees added to paid in capitalC | .05 | .01 | .01 | -H | .01 |
Net asset value, end of period | $ 28.68 | $ 33.56 | $ 34.99 | $ 28.07 | $ 26.86 |
Total ReturnA, B | (2.21)% | 5.71% I | 25.14% | 5.88% | (13.46)% |
Ratios to Average Net AssetsD, G | | | | | |
Expenses before reductions | 2.05% | 2.07% | 2.10% | 2.11% | 2.12% |
Expenses net of fee waivers, if any | 2.05% | 2.07% | 2.10% | 2.11% | 2.12% |
Expenses net of all reductions | 2.02% | 2.07% | 2.07% | 2.04% | 2.06% |
Net investment income (loss) | .49%F | (.07)% | .19% | .59% | .32% |
Supplemental Data | | | | | |
Net assets, end of period (000 omitted) | $ 14,355 | $ 10,445 | $ 6,957 | $ 4,515 | $ 5,230 |
Portfolio turnover rateE | 151% | 87% | 92% | 107% | 87% |
ATotal returns would have been lower if certain expenses had not been reduced during the applicable periods shown. BTotal returns do not include the effect of the contingent deferred sales charge. CCalculated based on average shares outstanding during the period. DFees and expenses of any underlying Fidelity Central Funds are not included in the Fund's expense ratio. The Fund indirectly bears its proportionate share of the expenses of any underlying Fidelity Central Funds. EAmount does not include the portfolio activity of any underlying Fidelity Central Funds. FInvestment income per share reflects a large, non-recurring dividend which amounted to $.13 per share. Excluding this non-recurring dividend, the ratio of net investment income (loss) to average net assets would have been .09%. GExpense ratios reflect operating expenses of the class. Expenses before reductions do not reflect amounts reimbursed by the investment adviser or reductions from brokerage service arrangements or reductions from other expense offset arrangements and do not represent the amount paid by the class during periods when reimbursements or reductions occur. Expenses net of fee waivers reflect expenses after reimbursement by the investment adviser but prior to reductions from brokerage service arrangements or other expense offset arrangements. Expenses net of all reductions represent the net expenses paid by the class. HAmount represents less than $.005 per share. IAmount includes a reimbursement from the investment adviser for an operational error which amounted to $.01 per share. Excluding this reimbursement, the total return would have been 5.68%. |
See accompanying notes which are an integral part of the financial statements.
Annual Report
Financial Highlights - Fidelity China Region Fund
Years ended October 31, | 2015 | 2014 | 2013 | 2012 | 2011 |
Selected Per-Share Data | | | | | |
Net asset value, beginning of period | $ 34.51 | $ 35.83 | $ 28.73 | $ 27.49 | $ 31.81 |
Income from Investment Operations | | | | | |
Net investment income (loss) B | .51E | .33 | .41 | .45 | .44 |
Net realized and unrealized gain (loss) | (.84) | 2.03 I | 7.11 | 1.42 | (4.37) |
Total from investment operations | (.33) | 2.36 | 7.52 | 1.87 | (3.93) |
Distributions from net investment income | (.33) | (.38) | (.43) | (.29) | (.38) |
Distributions from net realized gain | (4.24) | (3.31) | - | (.34) | (.03) |
Total distributions | (4.57) | (3.69) | (.43) | (.63) | (.40) H |
Redemption fees added to paid in capitalB | .05 | .01 | .01 | -G | .01 |
Net asset value, end of period | $ 29.66 | $ 34.51 | $ 35.83 | $ 28.73 | $ 27.49 |
Total ReturnA | (1.14)% | 6.83% I | 26.51% | 7.01% | (12.52)% |
Ratios to Average Net AssetsC, F | | | | | |
Expenses before reductions | .99% | 1.01% | 1.02% | 1.04% | 1.04% |
Expenses net of fee waivers, if any | .98% | 1.01% | 1.02% | 1.04% | 1.04% |
Expenses net of all reductions | .96% | 1.01% | .98% | .98% | .98% |
Net investment income (loss) | 1.55%E | .99% | 1.27% | 1.66% | 1.40% |
Supplemental Data | | | | | |
Net assets, end of period (000 omitted) | $1,262,274 | $ 1,352,761 | $ 1,425,828 | $ 1,265,488 | $ 1,515,084 |
Portfolio turnover rateD | 151% | 87% | 92% | 107% | 87% |
ATotal returns would have been lower if certain expenses had not been reduced during the applicable periods shown. BCalculated based on average shares outstanding during the period. CFees and expenses of any underlying Fidelity Central Funds are not included in the Fund's expense ratio. The Fund indirectly bears its proportionate share of the expenses of any underlying Fidelity Central Funds. DAmount does not include the portfolio activity of any underlying Fidelity Central Funds. EInvestment income per share reflects a large, non-recurring dividend which amounted to $.13 per share. Excluding this non-recurring dividend, the ratio of net investment income (loss) to average net assets would have been 1.15%. FExpense ratios reflect operating expenses of the class. Expenses before reductions do not reflect amounts reimbursed by the investment adviser or reductions from brokerage service arrangements or reductions from other expense offset arrangements and do not represent the amount paid by the class during periods when reimbursements or reductions occur. Expenses net of fee waivers reflect expenses after reimbursement by the investment adviser but prior to reductions from brokerage service arrangements or other expense offset arrangements. Expenses net of all reductions represent the net expenses paid by the class. GAmount represents less than $.005 per share. HTotal distributions of $.40 per share is comprised of distributions from net investment income of $.376 and distributions from net realized gain of $.025 per share. IAmount includes a reimbursement from the investment adviser for an operational error which amounted to $.01 per share. Excluding this reimbursement, the total return would have been 6.80%. |
Financial Highlights - Fidelity China Region Fund Class I
Years ended October 31, | 2015 | 2014 | 2013 | 2012 | 2011 |
Selected Per-Share Data | | | | | |
Net asset value, beginning of period | $ 34.39 | $ 35.75 | $ 28.68 | $ 27.46 | $ 31.79 |
Income from Investment Operations | | | | | |
Net investment income (loss) B | .51E | .34 | .42 | .45 | .43 |
Net realized and unrealized gain (loss) | (.84) | 2.02 I | 7.10 | 1.42 | (4.37) |
Total from investment operations | (.33) | 2.36 | 7.52 | 1.87 | (3.94) |
Distributions from net investment income | (.36) | (.43) | (.46) | (.31) | (.37) |
Distributions from net realized gain | (4.24) | (3.31) | - | (.34) | (.03) |
Total distributions | (4.60) | (3.73) H | (.46) | (.65) | (.40) |
Redemption fees added to paid in capitalB | .05 | .01 | .01 | -G | .01 |
Net asset value, end of period | $ 29.51 | $ 34.39 | $ 35.75 | $ 28.68 | $ 27.46 |
Total ReturnA | (1.14)% | 6.87% I | 26.58% | 7.02% | (12.56)% |
Ratios to Average Net AssetsC, F | | | | | |
Expenses before reductions | .97% | .98% | .97% | 1.04% | 1.06% |
Expenses net of fee waivers, if any | .97% | .98% | .97% | 1.04% | 1.06% |
Expenses net of all reductions | .95% | .98% | .93% | .98% | 1.01% |
Net investment income (loss) | 1.57%E | 1.01% | 1.32% | 1.66% | 1.38% |
Supplemental Data | | | | | |
Net assets, end of period (000 omitted) | $ 26,961 | $ 19,404 | $ 10,206 | $ 1,958 | $ 2,034 |
Portfolio turnover rateD | 151% | 87% | 92% | 107% | 87% |
ATotal returns would have been lower if certain expenses had not been reduced during the applicable periods shown. BCalculated based on average shares outstanding during the period. CFees and expenses of any underlying Fidelity Central Funds are not included in the Fund's expense ratio. The Fund indirectly bears its proportionate share of the expenses of any underlying Fidelity Central Funds. DAmount does not include the portfolio activity of any underlying Fidelity Central Funds. EInvestment income per share reflects a large, non-recurring dividend which amounted to $.13 per share. Excluding this non-recurring dividend, the ratio of net investment income (loss) to average net assets would have been 1.16%. FExpense ratios reflect operating expenses of the class. Expenses before reductions do not reflect amounts reimbursed by the investment adviser or reductions from brokerage service arrangements or reductions from other expense offset arrangements and do not represent the amount paid by the class during periods when reimbursements or reductions occur. Expenses net of fee waivers reflect expenses after reimbursement by the investment adviser but prior to reductions from brokerage service arrangements or other expense offset arrangements. Expenses net of all reductions represent the net expenses paid by the class. GAmount represents less than $.005 per share. HTotal distributions of $3.73 per share is comprised of distributions from net investment income of $.425 and distributions from net realized gain of $3.306 per share. IAmount includes a reimbursement from the investment adviser for an operational error which amounted to $.01 per share. Excluding this reimbursement, the total return would have been 6.84%. |
See accompanying notes which are an integral part of the financial statements.
Annual Report
For the period ended October 31, 2015
1. Organization.
Fidelity China Region Fund (the Fund) is a fund of Fidelity Investment Trust (the Trust) and is authorized to issue an unlimited number of shares. The Trust is registered under the Investment Company Act of 1940, as amended (the 1940 Act), as an open-end management investment company organized as a Massachusetts business trust. The Fund offers Class A, Class T, Class C, China Region and Class I (formerly Institutional Class) shares, each of which, along with Class B shares, has equal rights as to assets and voting privileges. Class B shares are closed to new accounts and additional purchases, except for exchanges and reinvestments. Each class has exclusive voting rights with respect to matters that affect that class. Class B shares will automatically convert to Class A shares after a holding period of seven years from the initial date of purchase. The Fund's investments in emerging markets can be subject to social, economic, regulatory, and political uncertainties and can be extremely volatile.
2. Investments in Fidelity Central Funds.
The Fund invests in Fidelity Central Funds, which are open-end investment companies generally available only to other investment companies and accounts managed by the investment adviser and its affiliates. The Fund's Schedule of Investments lists each of the Fidelity Central Funds held as of period end, if any, as an investment of the Fund, but does not include the underlying holdings of each Fidelity Central Fund. As an Investing Fund, the Fund indirectly bears its proportionate share of the expenses of the underlying Fidelity Central Funds.
The Money Market Central Funds seek preservation of capital and current income and are managed by Fidelity Investments Money Management, Inc. (FIMM), an affiliate of the investment adviser. Annualized expenses of the Money Market Central Funds as of their most recent shareholder report date are less than .005%.
A complete unaudited list of holdings for each Fidelity Central Fund is available upon request or at the Securities and Exchange Commission (the SEC) website at www.sec.gov. In addition, the financial statements of the Fidelity Central Funds, which are not covered by the Fund's Report of Independent Registered Public Accounting Firm, are available on the SEC website or upon request.
3. Significant Accounting Policies.
The financial statements have been prepared in conformity with accounting principles generally accepted in the United States of America (GAAP), which require management to make certain estimates and assumptions at the date of the financial statements. Actual results could differ from those estimates. Subsequent events, if any, through the date that the financial statements were issued have been evaluated in the preparation of the financial statements. The following summarizes the significant accounting policies of the Fund:
Investment Valuation. Investments are valued as of 4:00 p.m. Eastern time on the last calendar day of the period. The Board of Trustees (the Board) has delegated the day to day responsibility for the valuation of the Fund's investments to the Fidelity Management & Research Company (FMR) Fair Value Committee (the Committee). In accordance with valuation policies and procedures approved by the Board, the Fund attempts to obtain prices from one or more third party pricing vendors or brokers to value its investments. When current market prices, quotations or currency exchange rates are not readily available or reliable, investments will be fair valued in good faith by the Committee, in accordance with procedures adopted by the Board. Factors used in determining fair value vary by investment type and may include market or investment specific events. The frequency with which these procedures are used cannot be predicted and they may be utilized to a significant extent. The Committee oversees the Fund's valuation policies and procedures and reports to the Board on the Committee's activities and fair value determinations. The Board monitors the appropriateness of the procedures used in valuing the Fund's investments and ratifies the fair value determinations of the Committee.
The Fund categorizes the inputs to valuation techniques used to value its investments into a disclosure hierarchy consisting of three levels as shown below:
Level 1 - quoted prices in active markets for identical investments
Level 2 - other significant observable inputs (including quoted prices for similar investments, interest rates, prepayment speeds, etc.)
Level 3 - unobservable inputs (including the Fund's own assumptions based on the best information available)
Valuation techniques used to value the Fund's investments by major category are as follows:
Equity securities, including restricted securities, for which market quotations are readily available, are valued at the last reported sale price or official closing price as reported by a third party pricing vendor on the primary market or exchange on which they are traded and are categorized as Level 1 in the hierarchy. In the event there were no sales during the day or closing prices are not available, securities are valued at the last quoted bid price or may be valued using the last available price and are generally categorized as Level 2 in the hierarchy. For foreign equity securities, when market or security specific events arise, comparisons to the valuation of American Depositary Receipts (ADRs), futures contracts, Exchange-Traded Funds (ETFs) and certain indexes as well as quoted prices for similar securities may be used and would be categorized as Level 2 in the hierarchy. Utilizing
Annual Report
3. Significant Accounting Policies - continued
Investment Valuation - continued
these techniques may result in transfers between Level 1 and Level 2. For equity securities, including restricted securities, where observable inputs are limited, assumptions about market activity and risk are used and these securities may be categorized as Level 3 in the hierarchy. Equity securities, including restricted securities, for which observable inputs are not available are valued using alternate valuation approaches, including the market approach and the income approach and are categorized as Level 3 in the hierarchy. The market approach generally consists of using comparable market transactions while the income approach generally consists of using the net present value of estimated future cash flows, adjusted as appropriate for liquidity, credit, market and/or other risk factors.
Investments in open-end mutual funds, including the Fidelity Central Funds, are valued at their closing net asset value (NAV) each business day and are categorized as Level 1 in the hierarchy.
The following provides information on Level 3 securities held by the Fund that were valued at period end based on unobservable inputs. These amounts exclude valuations provided by a broker.
Asset Type | Fair Value at
10/31/15 | Valuation
Technique(s) | Unobservable Input | Amount or Range/
Weighted Average | Impact to Valuation
from an Increase
in InputA |
Equities | $ 57,081,027 | Adjusted transaction price | Proxy movement | 0.0% - 0.1% / 0.1% | Increase |
| | Last transaction price | Transaction price | $ 5.49 | Increase |
| | Proposed transaction price | Transaction price | $ 4.97 | Increase |
A Represents the expected directional change in the fair value of the Level 3 investments that would result from an increase in the corresponding input. A decrease to the unobservable input would have the opposite effect. Significant changes in these inputs could result in significantly higher or lower fair value measurements.
Changes in valuation techniques may result in transfers in or out of an assigned level within the disclosure hierarchy. The aggregate value of investments by input level as of October 31, 2015, as well as a roll forward of Level 3 investments, is included at the end of the Fund's Schedule of Investments.
Foreign Currency. The Fund may use foreign currency contracts to facilitate transactions in foreign-denominated securities. Gains and losses from these transactions may arise from changes in the value of the foreign currency or if the counterparties do not perform under the contracts' terms.
Foreign-denominated assets, including investment securities, and liabilities are translated into U.S. dollars at the exchange rates at period end. Purchases and sales of investment securities, income and dividends received and expenses denominated in foreign currencies are translated into U.S. dollars at the exchange rate in effect on the transaction date.
The effects of exchange rate fluctuations on investments are included with the net realized and unrealized gain (loss) on investment securities. Other foreign currency transactions resulting in realized and unrealized gain (loss) are disclosed separately.
Investment Transactions and Income. For financial reporting purposes, the Fund's investment holdings and NAV include trades executed through the end of the last business day of the period. The NAV per share for processing shareholder transactions is calculated as of the close of business of the New York Stock Exchange (NYSE), normally 4:00 p.m. Eastern time and includes trades executed through the end of the prior business day. Gains and losses on securities sold are determined on the basis of identified cost. Dividend income is recorded on the ex-dividend date, except for certain dividends from foreign securities where the ex-dividend date may have passed, which are recorded as soon as the Fund is informed of the ex-dividend date. Non-cash dividends included in dividend income, if any, are recorded at the fair market value of the securities received. Income and capital gain distributions from Fidelity Central Funds, if any, are recorded on the ex-dividend date. Large, non-recurring dividends recognized by the Fund are presented separately on the Statement of Operations as "Special Dividends" and the impact of these dividends is presented in the Financial Highlights. Interest income is accrued as earned and includes coupon interest and amortization of premium and accretion of discount on debt securities as applicable. Investment income is recorded net of foreign taxes withheld where recovery of such taxes is uncertain.
Class Allocations and Expenses. Investment income, realized and unrealized capital gains and losses, common expenses of the Fund, and certain fund-level expense reductions, if any, are allocated daily on a pro-rata basis to each class based on the relative net assets of each class to the total net assets of the Fund. Each class differs with respect to transfer agent and distribution and service plan fees incurred. Certain expense reductions may also differ by class. For the reporting period, the allocated portion of income and expenses to each class as a percent of its average net assets may vary
Annual Report
Notes to Financial Statements - continued
3. Significant Accounting Policies - continued
Class Allocations and Expenses - continued
due to the timing of recording these transactions in relation to fluctuating net assets of the classes. Expenses directly attributable to a fund are charged to that fund. Expenses attributable to more than one fund are allocated among the respective funds on the basis of relative net assets or other appropriate methods. Expense estimates are accrued in the period to which they relate and adjustments are made when actual amounts are known.
Income Tax Information and Distributions to Shareholders. Each year, the Fund intends to qualify as a regulated investment company under Subchapter M of the Internal Revenue Code, including distributing substantially all of its taxable income and realized gains. As a result, no provision for U.S. Federal income taxes is required. As of October 31, 2015, the Fund did not have any unrecognized tax benefits in the financial statements; nor is the Fund aware of any tax positions for which it is reasonably possible that the total amounts of unrecognized tax benefits will significantly change in the next twelve months. The Fund files a U.S. federal tax return, in addition to state and local tax returns as required. The Fund's federal income tax returns are subject to examination by the Internal Revenue Service (IRS) for a period of three fiscal years after they are filed. State and local tax returns may be subject to examination for an additional fiscal year depending on the jurisdiction. Foreign taxes are provided for based on the Fund's understanding of the tax rules and rates that exist in the foreign markets in which it invests. The Fund is subject to a tax imposed on capital gains by certain countries in which it invests.
Distributions are declared and recorded on the ex-dividend date. Income dividends and capital gain distributions are declared separately for each class. Income and capital gain distributions are determined in accordance with income tax regulations, which may differ from GAAP. In addition, the Fund claimed a portion of the payment made to redeeming shareholders as a distribution for income tax purposes.
Capital accounts within the financial statements are adjusted for permanent book-tax differences. These adjustments have no impact on net assets or the results of operations. Capital accounts are not adjusted for temporary book-tax differences which will reverse in a subsequent period.
Book-tax differences are primarily due to foreign currency transactions, certain foreign taxes, passive foreign investment companies (PFIC), deferred trustees compensation and losses deferred due to wash sales.
The federal tax cost of investment securities and unrealized appreciation (depreciation) as of period end were as follows:
Gross unrealized appreciation | $ 101,234,198 |
Gross unrealized depreciation | (193,197,636) |
Net unrealized appreciation (depreciation) on securities | $ (91,963,438) |
Tax Cost | $ 1,510,533,659 |
The tax-based components of distributable earnings as of period end were as follows:
Undistributed ordinary income | $ 15,009,766 |
Undistributed long-term capital gain | $ 159,969,732 |
Net unrealized appreciation (depreciation) on securities and other investments | $ (91,963,536) |
The tax character of distributions paid was as follows:
| October 31, 2015 | October 31, 2014 |
Ordinary Income | $ 14,374,708 | $ 31,270,708 |
Long-term Capital Gains | 171,153,948 | 120,320,275 |
Total | $ 185,528,656 | $ 151,590,983 |
Short-Term Trading (Redemption) Fees. Shares held by investors in the Fund less than 90 days may have been subject to a redemption fee equal to 1.50% of the NAV of shares redeemed. All redemption fees, which reduce the proceeds of the shareholder redemption, are retained by the Fund and accounted for as an addition to paid in capital.
Restricted Securities. The Fund may invest in securities that are subject to legal or contractual restrictions on resale. These securities generally may be resold in transactions exempt from registration or to the public if the securities are registered. Disposal of these securities may involve time-consuming negotiations and expense, and prompt sale at an acceptable price may be difficult. Information regarding restricted securities is included at the end of the Fund's Schedule of Investments.
4. Purchases and Sales of Investments.
Purchases and sales of securities, other than short-term securities, aggregated $2,320,693,042 and $2,245,851,175, respectively.
Annual Report
5. Fees and Other Transactions with Affiliates.
Management Fee. Fidelity Management & Research Company (the investment adviser) and its affiliates provide the Fund with investment management related services for which the Fund pays a monthly management fee. The management fee is the sum of an individual fund fee rate that is based on an annual rate of .45% of the Fund's average net assets and an annualized group fee rate that averaged .25% during the period. The group fee rate is based upon the average net assets of all the mutual funds advised by the investment adviser, including any mutual funds previously advised by the investment adviser that are currently advised by Fidelity SelectCo, LLC, an affiliate of the investment adviser. The group fee rate decreases as assets under management increase and increases as assets under management decrease. For the reporting period, the total annual management fee rate was .70% of the Fund's average net assets.
Distribution and Service Plan Fees. In accordance with Rule 12b-1 of the 1940 Act, the Fund has adopted separate Distribution and Service Plans for each class of shares. Certain classes pay Fidelity Distributors Corporation (FDC), an affiliate of the investment adviser, separate Distribution and Service Fees, each of which is based on an annual percentage of each class' average net assets. In addition, FDC may pay financial intermediaries for selling shares of the Fund and providing shareholder support services. For the period, the Distribution and Service Fee rates, total fees and amounts retained by FDC were as follows:
| Distribution
Fee | Service
Fee | Total Fees | Retained
by FDC |
Class A | -% | .25% | $ 79,736 | $ 10,281 |
Class T | .25% | .25% | 35,794 | 168 |
Class B | .75% | .25% | 11,489 | 8,617 |
Class C | .75% | .25% | 136,636 | 61,680 |
| | | $ 263,655 | $ 80,746 |
Sales Load. FDC may receive a front-end sales charge of up to 5.75% for selling Class A shares and 3.50% for selling Class T shares, some of which is paid to financial intermediaries for selling shares of the Fund. Depending on the holding period, FDC may receive contingent deferred sales charges levied on Class A, Class T, Class B, and Class C redemptions. The deferred sales charges range from 5.00% to 1.00% for Class B shares, 1.00% for Class C shares, 1.00% for certain purchases of Class A shares and .25% for certain purchases of Class T shares.
For the period, sales charge amounts retained by FDC were as follows:
| Retained
by FDC |
Class A | $ 52,066 |
Class T | 5,399 |
Class B A | 593 |
Class C A | 11,997 |
| $ 70,055 |
A When Class B and Class C shares are initially sold, FDC pays commissions from its own resources to financial intermediaries through which the sales are made.
Transfer Agent Fees. Fidelity Investments Institutional Operations Company, Inc., (FIIOC), an affiliate of the investment adviser, is the transfer, dividend disbursing and shareholder servicing agent for each class of the Fund. FIIOC receives account fees and asset-based fees that vary according to the account size and type of account of the shareholders of the respective classes of the Fund. FIIOC pays for typesetting, printing and mailing of shareholder reports, except proxy statements.
For the period, transfer agent fees for each class were as follows:
| Amount | % of
Class-Level Average
Net Assets |
Class A | $ 76,868 | .24 |
Class T | 23,452 | .33 |
Class B | 3,439 | .30 |
Class C | 35,649 | .26 |
China Region | 2,845,557 | .19 |
Class I | 49,287 | .18 |
| $ 3,034,252 | |
Accounting and Security Lending Fees. Fidelity Service Company, Inc. (FSC), an affiliate of the investment adviser, maintains the Fund's accounting records. The accounting fee is based on the level of average net assets for each month. Under a separate contract, FSC administers the security lending program. The security lending fee is based on the number and duration of lending transactions.
Annual Report
Notes to Financial Statements - continued
5. Fees and Other Transactions with Affiliates - continued
Brokerage Commissions. The Fund placed a portion of its portfolio transactions with brokerage firms which are affiliates of the investment adviser. Brokerage commissions are included in net realized gain (loss) and change in net unrealized appreciation (depreciation) in the Statement of Operations. The commissions paid to these affiliated firms were $12,235 for the period.
Interfund Lending Program. Pursuant to an Exemptive Order issued by the SEC, the Fund, along with other registered investment companies having management contracts with FMR or other affiliated entities of FMR, may participate in an interfund lending program. This program provides an alternative credit facility allowing the funds to borrow from, or lend money to, other participating affiliated funds. At period end, there were no interfund loans outstanding. The Fund's activity in this program during the period for which loans were outstanding was as follows:
Borrower or Lender | Average Loan Balance | Weighted Average
Interest Rate | Interest Expense |
Borrower | $ 14,713,842 | .36% | $ 5,540 |
Other. During the period, the investment adviser reimbursed the Fund for certain losses in the amount of $25,050.
6. Committed Line of Credit.
The Fund participates with other funds managed by the investment adviseror an affiliate in a $4.25 billion credit facility (the "line of credit") to be utilized for temporary or emergency purposes to fund shareholder redemptions or for other short-term liquidity purposes. The Fund has agreed to pay commitment fees on its pro-rata portion of the line of credit, which amounted to $2,209 and is reflected in Miscellaneous expenses on the Statement of Operations. During the period, the Fund did not borrow on this line of credit.
7. Security Lending.
The Fund lends portfolio securities through a lending agent from time to time in order to earn additional income. For equity securities, a lending agent is used and may loan securities to certain qualified borrowers, including Fidelity Capital Markets (FCM), a broker-dealer affiliated with the Fund. On the settlement date of the loan, the Fund receives collateral (in the form of U.S. Treasury obligations, letters of credit and/or cash) against the loaned securities and maintains collateral in an amount not less than 100% of the market value of the loaned securities during the period of the loan. The market value of the loaned securities is determined at the close of business of the Fund and any additional required collateral is delivered to the Fund on the next business day. The Fund or borrower may terminate the loan at any time, and if the borrower defaults on its obligation to return the securities loaned because of insolvency or other reasons, the Fund may apply collateral received from the borrower against the obligation. The Fund may experience delays and costs in recovering the securities loaned. Any cash collateral received is invested in the Fidelity Securities Lending Cash Central Fund. The value of loaned securities and cash collateral at period end are disclosed on the Fund's Statement of Assets and Liabilities. The value of securities loaned to FCM at period end was $2,320,290. Security lending income represents the income earned on investing cash collateral, less rebates paid to borrowers and any lending agent fees associated with the loan, plus any premium payments received for lending certain types of securities. Security lending income is presented in the Statement of Operations as a component of income from Fidelity Central Funds, and includes $11,395 from securities loaned to FCM.
8. Bank Borrowings.
The Fund is permitted to have bank borrowings for temporary or emergency purposes to fund shareholder redemptions or for other short-term liquidity requirements. The Fund has established borrowing arrangements with certain banks. The interest rate on the borrowings is the bank's base rate, as revised from time to time. The average loan balance during the period for which loans were outstanding amounted to $30,719,500. The weighted average interest rate was .63%. The interest expense amounted to $3,226 under the bank borrowing program. At period end, there were no bank borrowings outstanding.
9. Expense Reductions.
Commissions paid to certain brokers with whom the investment adviser, or its affiliates, places trades on behalf of the Fund include an amount in addition to trade execution, which may be rebated back to the Fund to offset certain expenses. This amount totaled $336,939 for the period.
Through arrangements with the Fund's custodian, credits realized as a result of certain uninvested cash balances were used to reduce the Fund's expenses. During the period, these credits reduced the Fund's custody expenses by $217.
Annual Report
9. Expense Reductions - continued
In addition, during the period the investment adviser reimbursed and/or waived a portion of fund-level operating expenses in the amount of $7,986 and a portion of class-level operating expenses as follows:
| Reimbursement |
Class A | $ 320 |
Class T | 14 |
Class B | 3 |
Class C | 160 |
China Region | 40,540 |
Class I | 319 |
| $ 41,356 |
10. Distributions to Shareholders.
Distributions to shareholders of each class were as follows:
Years ended October 31, | 2015 | 2014 |
From net investment income | | |
Class A | $ 147,088 | $ 180,108 |
Class T | 22,529 | 32,344 |
Class C | 12,652 | 17,191 |
China Region | 12,728,622 | 15,122,632 |
Class I | 204,043 | 107,159 |
Total | $ 13,114,934 | $ 15,459,434 |
From net realized gain | | |
Class A | $ 2,783,517 | $ 1,978,191 |
Class T | 789,251 | 554,033 |
Class B | 149,794 | 137,166 |
Class C | 1,276,956 | 701,626 |
China Region | 165,004,911 | 131,926,962 |
Class I | 2,409,293 | 833,571 |
Total | $ 172,413,722 | $ 136,131,549 |
11. Share Transactions.
Share transactions for each class were as follows and may contain automatic conversions between classes or exchanges between funds:
| Shares | Dollars |
Years ended October 31, | 2015 | 2014 | 2015 | 2014 |
Class A | | | | |
Shares sold | 1,058,546 | 299,718 | $ 35,978,665 | $ 10,085,846 |
Reinvestment of distributions | 93,297 | 60,028 | 2,812,898 | 2,013,956 |
Shares redeemed | (671,056) | (304,062) | (22,101,227) | (10,090,492) |
Net increase (decrease) | 480,787 | 55,684 | $ 16,690,336 | $ 2,009,310 |
Class T | | | | |
Shares sold | 151,664 | 59,364 | $ 5,390,399 | $ 1,971,301 |
Reinvestment of distributions | 26,640 | 17,176 | 801,072 | 574,877 |
Shares redeemed | (143,989) | (59,747) | (4,554,275) | (1,983,826) |
Net increase (decrease) | 34,315 | 16,793 | $ 1,637,196 | $ 562,352 |
Class B | | | | |
Shares sold | 2,771 | 1,463 | $ 95,500 | $ 48,104 |
Reinvestment of distributions | 4,834 | 3,586 | 144,877 | 119,685 |
Shares redeemed | (15,827) | (11,640) | (523,534) | (382,157) |
Net increase (decrease) | (8,222) | (6,591) | $ (283,157) | $ (214,368) |
Annual Report
Notes to Financial Statements - continued
11. Share Transactions - continued
| Shares | Dollars |
Years ended October 31, | 2015 | 2014 | 2015 | 2014 |
Class C | | | | |
Shares sold | 412,366 | 172,291 | $ 14,420,908 | $ 5,779,242 |
Reinvestment of distributions | 38,139 | 18,485 | 1,131,586 | 612,773 |
Shares redeemed | (261,252) | (78,373) | (7,778,046) | (2,559,009) |
Net increase (decrease) | 189,253 | 112,403 | $ 7,774,448 | $ 3,833,006 |
China Region | | | | |
Shares sold | 18,091,274 | 6,962,379 | $ 635,141,274 | $ 236,836,534 |
Reinvestment of distributions | 5,608,420 | 4,157,611 | 170,439,887 | 140,360,927 |
Shares redeemed | (20,336,385) | (11,721,340) | (642,334,138) | (391,493,808) |
Net increase (decrease) | 3,363,309 | (601,350) | $ 163,247,023 | $ (14,296,347) |
Class I | | | | |
Shares sold | 1,017,162 | 632,067 | $ 33,130,120 | $ 21,560,054 |
Reinvestment of distributions | 58,945 | 23,866 | 1,781,897 | 802,629 |
Shares redeemed | (726,796) | (377,199) | (23,738,935) | (12,682,356) |
Net increase (decrease) | 349,311 | 278,734 | $ 11,173,082 | $ 9,680,327 |
12. Other.
The Fund's organizational documents provide former and current trustees and officers with a limited indemnification against liabilities arising in connection with the performance of their duties to the Fund. In the normal course of business, the Fund may also enter into contracts that provide general indemnifications. The Fund's maximum exposure under these arrangements is unknown as this would be dependent on future claims that may be made against the Fund. The risk of material loss from such claims is considered remote.
Annual Report
To the Trustees of Fidelity Investment Trust and the Shareholders of Fidelity China Region Fund:
In our opinion, the accompanying statement of assets and liabilities, including the schedule of investments, and the related statements of operations and of changes in net assets and the financial highlights present fairly, in all material respects, the financial position of Fidelity China Region Fund (a fund of Fidelity Investment Trust) at October 31, 2015, the results of its operations for the year then ended, the changes in its net assets for each of the two years in the period then ended and the financial highlights for each of the five years in the period then ended, in conformity with accounting principles generally accepted in the United States of America. These financial statements and financial highlights (hereafter referred to as "financial statements") are the responsibility of the Fidelity China Region Fund's management. Our responsibility is to express an opinion on these financial statements based on our audits. We conducted our audits of these financial statements in accordance with the standards of the Public Company Accounting Oversight Board (United States). Those standards require that we plan and perform the audit to obtain reasonable assurance about whether the financial statements are free of material misstatement. An audit includes examining, on a test basis, evidence supporting the amounts and disclosures in the financial statements, assessing the accounting principles used and significant estimates made by management, and evaluating the overall financial statement presentation. We believe that our audits, which included confirmation of securities at October 31, 2015 by correspondence with the custodian and brokers, provide a reasonable basis for our opinion.
PricewaterhouseCoopers LLP
Boston, Massachusetts
December 22, 2015
Annual Report
The Trustees, Member of the Advisory Board, and officers of the trust and fund, as applicable, are listed below. The Board of Trustees governs the fund and is responsible for protecting the interests of shareholders. The Trustees are experienced executives who meet periodically throughout the year to oversee the fund's activities, review contractual arrangements with companies that provide services to the fund, oversee management of the risks associated with such activities and contractual arrangements, and review the fund's performance. Each of the Trustees oversees 170 funds.
The Trustees hold office without limit in time except that (a) any Trustee may resign; (b) any Trustee may be removed by written instrument, signed by at least two-thirds of the number of Trustees prior to such removal; (c) any Trustee who requests to be retired or who has become incapacitated by illness or injury may be retired by written instrument signed by a majority of the other Trustees; and (d) any Trustee may be removed at any special meeting of shareholders by a two-thirds vote of the outstanding voting securities of the trust. Each Trustee who is not an interested person (as defined in the 1940 Act) of the trust and the fund (Independent Trustee), shall retire not later than the last day of the calendar year in which his or her 75th birthday occurs. The Independent Trustees may waive this mandatory retirement age policy with respect to individual Trustees. The officers and Advisory Board Member hold office without limit in time, except that any officer and Advisory Board Member may resign or may be removed by a vote of a majority of the Trustees at any regular meeting or any special meeting of the Trustees. Except as indicated, each individual has held the office shown or other offices in the same company for the past five years.
Experience, Skills, Attributes, and Qualifications of the Fund's Trustees. The Governance and Nominating Committee has adopted a statement of policy that describes the experience, qualifications, attributes, and skills that are necessary and desirable for potential Independent Trustee candidates (Statement of Policy). The Board believes that each Trustee satisfied at the time he or she was initially elected or appointed a Trustee, and continues to satisfy, the standards contemplated by the Statement of Policy. The Governance and Nominating Committee also engages professional search firms to help identify potential Independent Trustee candidates who have the experience, qualifications, attributes, and skills consistent with the Statement of Policy. From time to time, additional criteria based on the composition and skills of the current Independent Trustees, as well as experience or skills that may be appropriate in light of future changes to board composition, business conditions, and regulatory or other developments, have also been considered by the professional search firms and the Governance and Nominating Committee. In addition, the Board takes into account the Trustees' commitment and participation in Board and committee meetings, as well as their leadership of standing and ad hoc committees throughout their tenure.
In determining that a particular Trustee was and continues to be qualified to serve as a Trustee, the Board has considered a variety of criteria, none of which, in isolation, was controlling. The Board believes that, collectively, the Trustees have balanced and diverse experience, qualifications, attributes, and skills, which allow the Board to operate effectively in governing the fund and protecting the interests of shareholders. Information about the specific experience, skills, attributes, and qualifications of each Trustee, which in each case led to the Board's conclusion that the Trustee should serve (or continue to serve) as a trustee of the fund, is provided below.
Board Structure and Oversight Function. James C. Curvey is an interested person (as defined in the 1940 Act) and currently serves as Chairman. The Trustees have determined that an interested Chairman is appropriate and benefits shareholders because an interested Chairman has a personal and professional stake in the quality and continuity of services provided to the fund. Independent Trustees exercise their informed business judgment to appoint an individual of their choosing to serve as Chairman, regardless of whether the Trustee happens to be independent or a member of management. The Independent Trustees have determined that they can act independently and effectively without having an Independent Trustee serve as Chairman and that a key structural component for assuring that they are in a position to do so is for the Independent Trustees to constitute a substantial majority for the Board. The Independent Trustees also regularly meet in executive session. Ned C. Lautenbach serves as Chairman of the Independent Trustees and as such (i) acts as a liaison between the Independent Trustees and management with respect to matters important to the Independent Trustees and (ii) with management prepares agendas for Board meetings.
Fidelity funds are overseen by different Boards of Trustees. The fund's Board oversees Fidelity's high income and certain equity funds, and other Boards oversee Fidelity's investment-grade bond, money market, asset allocation, and sector funds. The asset allocation funds may invest in Fidelity funds overseen by the fund's Board. The use of separate Boards, each with its own committee structure, allows the Trustees of each group of Fidelity funds to focus on the unique issues of the funds they oversee, including common research, investment, and operational issues. On occasion, the separate Boards establish joint committees to address issues of overlapping consequences for the Fidelity funds overseen by each Board.
The Trustees operate using a system of committees to facilitate the timely and efficient consideration of all matters of importance to the Trustees, the fund, and fund shareholders and to facilitate compliance with legal and regulatory requirements and oversight of the fund's activities and associated risks. The Board, acting through its committees, has charged FMR and its affiliates with (i) identifying events or circumstances the occurrence of which could have demonstrably adverse effects on the fund's business and/or reputation; (ii) implementing processes and controls to lessen the possibility that such events or circumstances occur or to mitigate the effects of such events or circumstances if they do occur; and (iii) creating and maintaining a system designed to evaluate continuously business and market conditions in order to facilitate the identification and implementation processes described in (i) and (ii) above. Because the day-to-day operations and activities of the fund are carried out by or through FMR, its affiliates and other service providers, the fund's exposure to risks is mitigated but not eliminated by the processes overseen by the Trustees. While each of the Board's committees has responsibility for overseeing different aspects of the fund's activities, oversight is exercised primarily through the Operations, Audit, and Compliance Committees. In addition, the Independent Trustees have worked with FMR to enhance the Board's oversight of investment and financial risks, legal and regulatory risks, technology risks, and operational risks, including the development of additional risk reporting to the Board. For example, a working group comprised of Independent Trustees and FMR has worked and continues to work to review the Fidelity funds' valuation-related activities, reporting and risk management. Appropriate personnel, including but not limited to the fund's Chief Compliance Officer (CCO), FMR's internal auditor, the independent accountants, the fund's Treasurer and portfolio management personnel, make periodic reports to the Board's committees, as appropriate, including an annual review of Fidelity's risk management program for the Fidelity funds. The responsibilities of each standing committee, including their oversight responsibilities, are described further under "Standing Committees of the Fund's Trustees."
Annual Report
The fund's Statement of Additional Information (SAI) includes more information about the Trustees. To request a free copy, call Fidelity at 1-877-208-0098.
Interested Trustees*:
Correspondence intended for each Trustee who is an interested person may be sent to Fidelity Investments, 245 Summer Street, Boston, Massachusetts 02210.
Name, Year of Birth; Principal Occupations and Other Relevant Experience+ |
James C. Curvey (1935) |
Year of Election or Appointment: 2007 Trustee Chairman of the Board of Trustees |
| Mr. Curvey also serves as Trustee of other Fidelity funds. Mr. Curvey is a Director of Fidelity Research & Analysis Co. (investment adviser firm, 2009-present), and Vice Chairman (2007-present) and Director of FMR LLC (diversified financial services company). In addition, Mr. Curvey serves as an Overseer for the Boston Symphony Orchestra and a member of the board of Artis-Naples, Naples, Florida, and as a Trustee for Brewster Academy, Wolfeboro, New Hampshire. Previously, Mr. Curvey served as a Director of Fidelity Investments Money Management, Inc. (investment adviser firm, 2009-2014) and a Director of FMR and FMR Co., Inc. (investment adviser firms, 2007-2014). |
Charles S. Morrison (1960) |
Year of Election or Appointment: 2014 Trustee |
| Mr. Morrison also serves as Trustee of other funds. He serves as a Director of Fidelity Investments Money Management, Inc. (FIMM) (investment adviser firm, 2014-present), Director of Fidelity SelectCo, LLC (investment adviser firm, 2014-present), President, Asset Management (2014-present), and is an employee of Fidelity Investments. Previously, Mr. Morrison served as Vice President of Fidelity's Fixed Income and Asset Allocation Funds (2012-2014), President, Fixed Income (2011-2014), Vice President of Fidelity's Money Market Funds (2005-2009), President, Money Market Group Leader of FMR (investment adviser firm, 2009), and Senior Vice President, Money Market Group of FMR (2004-2009). Mr. Morrison also served as Vice President of Fidelity's Bond Funds (2002-2005), certain Balanced Funds (2002-2005), and certain Asset Allocation Funds (2002-2007), and as Senior Vice President (2002-2005) of Fidelity's Bond Division. |
* Trustees have been determined to be "Interested Trustees" by virtue of, among other things, their affiliation with the trust or various entities under common control with FMR.
+ The information above includes each Trustee's principal occupation during the last five years and other information relating to the experience, attributes, and skills relevant to each Trustee's qualifications to serve as a Trustee, which led to the conclusion that each Trustee should serve as a Trustee for the fund.
Annual Report
Trustees and Officers - continued
Independent Trustees:
Correspondence intended for each Independent Trustee (that is, the Trustees other than the Interested Trustees) may be sent to Fidelity Investments, P.O. Box 55235, Boston, Massachusetts 02205-5235.
Name, Year of Birth; Principal Occupations and Other Relevant Experience+ |
Dennis J. Dirks (1948) |
Year of Election or Appointment: 2005 Trustee |
| Mr. Dirks also serves as Trustee of other Fidelity funds. Prior to his retirement in May 2003, Mr. Dirks was Chief Operating Officer and a member of the Board of The Depository Trust & Clearing Corporation (DTCC). He also served as President, Chief Operating Officer, and Board member of The Depository Trust Company (DTC) and President and Board member of the National Securities Clearing Corporation (NSCC). In addition, Mr. Dirks served as Chief Executive Officer and Board member of the Government Securities Clearing Corporation, Chief Executive Officer and Board member of the Mortgage-Backed Securities Clearing Corporation, as a Trustee and a member of the Finance Committee of Manhattan College (2005-2008), as a Trustee and a member of the Finance Committee of AHRC of Nassau County (2006-2008), and as a member of the Independent Directors Council (IDC) Governing Council (2010-2015). Mr. Dirks is a member of the Board of Directors for The Brookville Center for Children's Services, Inc. (2009-present). |
Alan J. Lacy (1953) |
Year of Election or Appointment: 2008 Trustee |
| Mr. Lacy also serves as Trustee of other Fidelity funds. Mr. Lacy serves as a member of the Board of Directors of Dave & Buster's Entertainment, Inc. (restaurant and entertainment complexes, 2010-present) and Bristol-Myers Squibb Company (global pharmaceuticals, 2008-present). In addition, Mr. Lacy served as Senior Adviser (2007-2014) of Oak Hill Capital Partners, L.P. (private equity) and also served as Chief Executive Officer (2000-2005) and Vice Chairman (2005-2006) of Sears Holdings Corporation and Sears, Roebuck and Co. (retail). Mr. Lacy is a member of the Board of Trustees of The National Parks Conservation Association (2006-present). Previously, Mr. Lacy served as Chairman of the Board of Trustees of the National Parks Conservation Association (2008-2011) and as a member of the Board of Directors for The Western Union Company (global money transfer, 2006-2011), The Hillman Companies, Inc. (hardware wholesalers, 2010-2014), and Earth Fare, Inc. (retail grocery, 2010-2014). |
Ned C. Lautenbach (1944) |
Year of Election or Appointment: 2000 Trustee Chairman of the Independent Trustees |
| Mr. Lautenbach also serves as Trustee of other Fidelity funds. Mr. Lautenbach currently serves as the Lead Director of the Eaton Corporation Board of Directors (diversified industrial, 1997-present). Mr. Lautenbach is Chairman of the Board of Directors of Artis-Naples in Naples, Florida (2012-present), a member of the Council on Foreign Relations (1994-present), and a member of the Board of Governors, State University System of Florida (2013-present). Previously, Mr. Lautenbach was a Partner/Advisory Partner at Clayton, Dubilier & Rice, LLC (private equity investment, 1998-2010), as well as a Director of Sony Corporation (2006-2007). |
Joseph Mauriello (1944) |
Year of Election or Appointment: 2008 Trustee |
| Mr. Mauriello also serves as Trustee of other Fidelity funds. Prior to his retirement in January 2006, Mr. Mauriello served in numerous senior management positions including Deputy Chairman and Chief Operating Officer (2004-2005), and Vice Chairman of Financial Services (2002-2004) of KPMG LLP US (professional services, 1965-2005). Mr. Mauriello currently serves as a member of the Board of Directors of XL Group plc. (global insurance and re-insurance, 2006-present) and the Independent Directors Council (IDC) Governing Council (2015-present). Previously, Mr. Mauriello served as a Director of the Hamilton Funds of the Bank of New York (2006-2007) and of Arcadia Resources Inc. (health care services and products, 2007-2012). |
Robert W. Selander (1950) |
Year of Election or Appointment: 2011 Trustee |
| Mr. Selander also serves as Trustee of other Fidelity funds. Mr. Selander serves as a Director of The Western Union Company (global money transfer, 2014-present). Previously, Mr. Selander served as a Member of the Advisory Board of other Fidelity funds (2011), and Executive Vice Chairman (2010), Chief Executive Officer (2009-2010), and President and Chief Executive Officer (1997-2009) of Mastercard, Inc. |
Cornelia M. Small (1944) |
Year of Election or Appointment: 2005 Trustee |
| Ms. Small also serves as Trustee of other Fidelity funds. Ms. Small is a member of the Board of Directors (2009-present) and Chair of the Investment Committee (2010-present) of the Teagle Foundation. Ms. Small also serves on the Investment Committee of the Berkshire Taconic Community Foundation (2008-present). Previously, Ms. Small served as Chairperson (2002-2008) and a member of the Investment Committee and Chairperson (2008-2012) and a member of the Board of Trustees of Smith College. In addition, Ms. Small served as Chief Investment Officer, Director of Global Equity Investments, and a member of the Board of Directors of Scudder, Stevens & Clark and Scudder Kemper Investments. |
William S. Stavropoulos (1939) |
Year of Election or Appointment: 2001 Trustee Vice Chairman of the Independent Trustees |
| Mr. Stavropoulos also serves as Trustee of other Fidelity funds. Mr. Stavropoulos serves as President and Founder of the Michigan Baseball Foundation, the Great Lakes Loons (2007-present). Mr. Stavropoulos is Chairman Emeritus of the Board of Directors of The Dow Chemical Company, where he previously served in numerous senior management positions, including President, CEO (1995-2000; 2002-2004), Chairman of the Executive Committee (2000-2006), and as a member of the Board of Directors (1990-2006). Currently, Mr. Stavropoulos is Chairman of the Board of Directors of Univar Inc. (global distributor of commodity and specialty chemicals), a Director of Teradata Corporation (data warehousing and technology solutions), and Maersk Inc. (industrial conglomerate), and a member of the Advisory Board for Metalmark Capital LLC (private equity investment, 2005-present). Mr. Stavropoulos is an operating advisor to Clayton, Dubilier & Rice, LLC (private equity investment). In addition, Mr. Stavropoulos is a member of the University of Notre Dame Advisory Council for the College of Science, a Trustee of the Rollin L. Gerstacker Foundation, and a Director of the Naples Philharmonic Center for the Arts. Previously, Mr. Stavropoulos served as a Director of Chemical Financial Corporation (bank holding company, 1993-2012) and Tyco International, Ltd. (multinational manufacturing and services, 2007-2012). |
David M. Thomas (1949) |
Year of Election or Appointment: 2008 Trustee |
| Mr. Thomas also serves as Trustee of other Fidelity funds. Mr. Thomas serves as Non-Executive Chairman of the Board of Directors of Fortune Brands Home and Security (home and security products, 2011-present), as a member of the Board of Directors (2004-present) and Presiding Director (2013-present) of Interpublic Group of Companies, Inc. (marketing communication), and as a member of the Board of Trustees of the University of Florida (2013-present). Previously, Mr. Thomas served as Executive Chairman (2005-2006) and Chairman and Chief Executive Officer (2000-2005) of IMS Health, Inc. (pharmaceutical and healthcare information solutions), and a Director of Fortune Brands, Inc. (consumer products, 2000-2011). |
+ The information above includes each Trustee's principal occupation during the last five years and other information relating to the experience, attributes, and skills relevant to each Trustee's qualifications to serve as a Trustee, which led to the conclusion that each Trustee should serve as a Trustee for the fund.
Advisory Board Member and Officers:
Correspondence intended for each officer and Peter S. Lynch may be sent to Fidelity Investments, 245 Summer Street, Boston, Massachusetts 02210. Officers appear below in alphabetical order.
Name, Year of Birth; Principal Occupation |
Peter S. Lynch (1944) |
Year of Election or Appointment: 2003 Member of the Advisory Board |
| Mr. Lynch also serves as Member of the Advisory Board of other Fidelity funds. Mr. Lynch is Vice Chairman and a Director of FMR (investment adviser firm) and FMR Co., Inc. (investment adviser firm). In addition, Mr. Lynch serves as a Trustee of Boston College and as the Chairman of the Inner-City Scholarship Fund. Previously, Mr. Lynch served on the Special Olympics International Board of Directors (1997-2006). |
Elizabeth Paige Baumann (1968) |
Year of Election or Appointment: 2012 Anti-Money Laundering (AML) Officer |
| Ms. Baumann also serves as AML Officer of other funds. She is Chief AML Officer of FMR LLC (diversified financial services company, 2012-present) and is an employee of Fidelity Investments. Previously, Ms. Baumann served as Vice President and Deputy Anti-Money Laundering Officer (2007-2012). |
Marc R. Bryant (1966) |
Year of Election or Appointment: 2015 Secretary and Chief Legal Officer (CLO) |
| Mr. Bryant also serves as Secretary and CLO of other funds. Mr. Bryant serves as CLO, Secretary, and Senior Vice President of Fidelity Management & Research Company (investment adviser firm, 2015-present) and FMR Co., Inc. (investment adviser firm, 2015-present); Secretary of Fidelity SelectCo, LLC (investment adviser firm, 2015-present) and Fidelity Investments Money Management, Inc. (investment adviser firm, 2015-present); and CLO of Fidelity Management & Research (Hong Kong) Limited (investment adviser firm, 2015-present). He is Senior Vice President and Deputy General Counsel of FMR LLC (diversified financial services company). Previously, Mr. Bryant served as Secretary and Chief Legal Officer of Fidelity Rutland Square Trust II (2010-2014) and Assistant Secretary of Fidelity's Fixed Income and Asset Allocation Funds (2013-2015). Prior to joining Fidelity Investments, Mr. Bryant served as a Senior Vice President and the Head of Global Retail Legal for AllianceBernstein L.P. (2006-2010), and as the General Counsel for ProFund Advisors LLC (2001-2006). |
William C. Coffey (1969) |
Year of Election or Appointment: 2009 Assistant Secretary |
| Mr. Coffey also serves as Assistant Secretary of other funds. He is Senior Vice President and Deputy General Counsel of FMR LLC (diversified financial services company, 2010-present), and is an employee of Fidelity Investments. Previously, Mr. Coffey served as Vice President and Associate General Counsel of FMR LLC (2005-2009). |
Timothy M. Cohen (1969) |
Year of Election or Appointment: 2014 Vice President of certain Equity Funds |
| Mr. Cohen also serves as Vice President of other funds. Mr. Cohen serves as Chief Compliance Officer of FMR Investment Management (U.K.) Limited (investment adviser firm, 2013-present) and is an employee of Fidelity Investments. Previously, Mr. Cohen served as a Director of FMR Investment Management (U.K.) Limited (2013-2015). |
Jonathan Davis (1968) |
Year of Election or Appointment: 2010 Assistant Treasurer |
| Mr. Davis also serves as Assistant Treasurer of other funds, and is an employee of Fidelity Investments. Previously, Mr. Davis served as Vice President and Associate General Counsel of FMR LLC (diversified financial services company, 2003-2010). |
Adrien E. Deberghes (1967) |
Year of Election or Appointment: 2008 Deputy Treasurer |
| Mr. Deberghes also serves as an officer of other funds. He is an employee of Fidelity Investments (2008-present). Prior to joining Fidelity Investments, Mr. Deberghes was Senior Vice President of Mutual Fund Administration at State Street Corporation (2007-2008), Senior Director of Mutual Fund Administration at Investors Bank & Trust (2005-2007), and Director of Finance for Dunkin' Brands (2000-2005). |
Stephanie J. Dorsey (1969) |
Year of Election or Appointment: 2010 Assistant Treasurer |
| Ms. Dorsey also serves as an officer of other funds. She is an employee of Fidelity Investments (2008-present) and has served in other fund officer roles. Prior to joining Fidelity Investments, Ms. Dorsey served as Treasurer (2004-2008) of the JPMorgan Mutual Funds and Vice President (2004-2008) of JPMorgan Chase Bank. |
Howard J. Galligan III (1966) |
Year of Election or Appointment: 2014 Chief Financial Officer |
| Mr. Galligan also serves as Chief Financial Officer of other funds. Mr. Galligan serves as President of Fidelity Pricing and Cash Management Services (FPCMS) (2014-present) and as a Director of Strategic Advisers, Inc. (investment adviser firm, 2008-present). Previously, Mr. Galligan served as Chief Administrative Officer of Asset Management (2011-2014) and Chief Operating Officer and Senior Vice President of Investment Support for Strategic Advisers, Inc. (2003-2011). |
Scott C. Goebel (1968) |
Year of Election or Appointment: 2015 Vice President |
| Mr. Goebel serves as Vice President of other funds and is an employee of Fidelity Investments (2001-present). Previously, Mr. Goebel served as Secretary of Fidelity SelectCo, LLC (investment adviser firm, 2013-2015), Fidelity Investments Money Management, Inc. (FIMM) (investment adviser firm, 2010-2015), and Fidelity Research and Analysis Company (FRAC) (investment adviser firm, 2010-2015); General Counsel, Secretary, and Senior Vice President of Fidelity Management & Research Company (investment adviser firm, 2008-2015) and FMR Co., Inc. (investment adviser firm, 2008-2015); Assistant Secretary of Fidelity Management & Research (Japan) Limited (investment adviser firm, 2008-2015) and FMR Investment Management (U.K.) Limited (investment adviser firm, 2008-2015); Chief Legal Officer (CLO) of Fidelity Management & Research (Hong Kong) Limited (investment adviser firm, 2008-2015); Secretary and CLO of certain Fidelity funds (2008-2015); Assistant Secretary of FIMM (2008-2010), FRAC (2008-2010), and certain funds (2007-2008); and as Vice President and Secretary of Fidelity Distributors Corporation (FDC) (2005-2007). |
Brian B. Hogan (1964) |
Year of Election or Appointment: 2009 Vice President |
| Mr. Hogan also serves as Trustee or Vice President of other funds. Mr. Hogan serves as a Director of Fidelity SelectCo, LLC (investment adviser firm, 2014-present) and President of the Equity Division of FMR (investment adviser firm, 2009-present). Previously, Mr. Hogan served as Senior Vice President, Equity Research of FMR (2006-2009) and as a portfolio manager. |
Chris Maher (1972) |
Year of Election or Appointment: 2013 Assistant Treasurer |
| Mr. Maher serves as Assistant Treasurer of other funds. Mr. Maher is Vice President of Valuation Oversight and is an employee of Fidelity Investments. Previously, Mr. Maher served as Vice President of Asset Management Compliance (2013), Vice President of the Program Management Group of FMR (investment adviser firm, 2010-2013), and Vice President of Valuation Oversight (2008-2010). |
Kenneth B. Robins (1969) |
Year of Election or Appointment: 2008 President and Treasurer |
| Mr. Robins also serves as an officer of other funds. Mr. Robins serves as Executive Vice President of Fidelity Investments Money Management, Inc. (FIMM) (investment adviser firm, 2013-present) and is an employee of Fidelity Investments (2004-present). Previously, Mr. Robins served in other fund officer roles. |
Stacie M. Smith (1974) |
Year of Election or Appointment: 2013 Deputy Treasurer |
| Ms. Smith also serves as an officer of other funds. She is an employee of Fidelity Investments (2009-present) and has served in other fund officer roles. Prior to joining Fidelity Investments, Ms. Smith served as Senior Audit Manager of Ernst & Young LLP (1996-2009). |
Renee Stagnone (1975) |
Year of Election or Appointment: 2013 Deputy Treasurer |
| Ms. Stagnone also serves as Deputy Treasurer of other funds. Ms. Stagnone is an employee of Fidelity Investments (1997-present). |
Linda J. Wondrack (1964) |
Year of Election or Appointment: 2014 Chief Compliance Officer |
| Ms. Wondrack also serves as Chief Compliance Officer of other funds. Ms. Wondrack is Executive Vice President and head of the Ethics Office and Asset Management Compliance for Fidelity Investments (2012-present). Ms. Wondrack also serves as Chief Compliance Officer of Fidelity SelectCo, LLC (investment adviser firm, 2014-present); Chief Compliance Officer of Impresa Management LLC (2013-present); and Chief Compliance Officer of FMR Co., Inc. (investment adviser firm), Fidelity Investments Money Management, Inc. (investment adviser firm), Fidelity Management & Research (Japan) Limited (investment adviser firm), FMR Investment Management (U.K.) Limited (investment adviser firm), Fidelity Management & Research (Hong Kong) (investment adviser firm), Fidelity Management & Research Company (investment adviser firm), FIAM LLC (investment adviser firm), and Strategic Advisers, Inc. (investment adviser firm), Ballyrock Investment Advisors LLC, and Northern Neck Investors LLC (2012-present). Previously, Ms. Wondrack served as Senior Vice President and Chief Compliance Officer for Columbia Management Investment Advisers, LLC (2005-2012); Chief Compliance Officer for certain funds within the Columbia Family of Funds (2007-2012); and Senior Vice President of Compliance Risk Management at Bank of America (2005-2010). |
Joseph F. Zambello (1957) |
Year of Election or Appointment: 2011 Deputy Treasurer |
| Mr. Zambello also serves as Deputy Treasurer of other funds. Mr. Zambello is an employee of Fidelity Investments (1991-present). Previously, Mr. Zambello served as Vice President of the Program Management Group of FMR (investment adviser firm, 2009-2011) and Vice President of the Transfer Agent Oversight Group (2005-2009). |
Annual Report
The Board of Trustees of Fidelity China Region Fund voted to pay to shareholders of record at the opening of business on record date, the following distributions per share derived from capital gains realized from sales of portfolio securities, and dividends derived from net investment income:
| Pay Date | Record Date | Dividends | Capital Gains |
Class I | 12/07/2015 | 12/04/2015 | $0.357 | $3.588 |
The fund hereby designates as a capital gain dividend with respect to the taxable year ended October 31, 2015, $202,354,150, or, if subsequently determined to be different, the net capital gain of such year.
The fund designates 66% of the dividends distributed during the fiscal year as amounts which may be taken into account as a dividend for the purposes of the maximum rate under section 1(h)(11) of the Internal Revenue Code.
The amounts per share which represent income derived from sources within, and taxes paid to, foreign countries or possessions of the United States are as follows:
| Pay Date | Income | Taxes |
Class I | 12/08/2014 | $0.4508 | $0.0608 |
The fund will notify shareholders in January 2016 of amounts for use in preparing 2015 income tax returns.
Annual Report
Fidelity China Region Fund
Each year, the Board of Trustees, including the Independent Trustees (together, the Board), votes on the renewal of the management contract with Fidelity Management & Research Company (FMR) and the sub-advisory agreements (together, the Advisory Contracts) for the fund. The Board, assisted by the advice of fund counsel and Independent Trustees' counsel, requests and considers a broad range of information relevant to the renewal of the Advisory Contracts throughout the year.
The Board meets regularly and, at each of its meetings, covers an extensive agenda of topics and materials and considers factors that are relevant to its annual consideration of the renewal of the fund's Advisory Contracts, including the services and support provided to the fund and its shareholders. The Board has established various standing committees (Committees), each composed of and chaired by Independent Trustees with varying backgrounds, to which the Board has assigned specific subject matter responsibilities in order to enhance effective decision-making by the Board. The Board, acting directly and through its Committees, requests and receives information concerning the annual consideration of the renewal of the fund's Advisory Contracts. The Board also meets as needed to consider matters specifically related to the Board's annual consideration of the renewal of the Advisory Contracts. Members of the Board may also meet with trustees of other Fidelity funds through ad hoc joint committees to discuss certain matters relevant to all of the Fidelity funds.
At its July 2015 meeting, the Board unanimously determined to renew the fund's Advisory Contracts. In reaching its determination, the Board considered all factors it believed relevant, including (i) the nature, extent, and quality of the services to be provided to the fund and its shareholders (including the investment performance of the fund); (ii) the competitiveness of the fund's management fee and total expense ratio relative to peer funds; (iii) the total costs of the services to be provided by and the profits to be realized by Fidelity from its relationship with the fund; and (iv) the extent to which (if any) economies of scale exist and would be realized as the fund grows, and whether any economies of scale are appropriately shared with fund shareholders.
In considering whether to renew the Advisory Contracts for the fund, the Board reached a determination, with the assistance of fund counsel and Independent Trustees' counsel and through the exercise of its business judgment, that the renewal of the Advisory Contracts was in the best interests of the fund and its shareholders and that the compensation payable under the Advisory Contracts was fair and reasonable. The Board's decision to renew the Advisory Contracts was not based on any single factor, but rather was based on a comprehensive consideration of all the information provided to the Board at its meetings throughout the year. The Board, in reaching its determination to renew the Advisory Contracts, was aware that shareholders of the fund have a broad range of investment choices available to them, including a wide choice among funds offered by Fidelity's competitors, and that the fund's shareholders, who have the opportunity to review and weigh the disclosure provided by the fund in its prospectus and other public disclosures, have chosen to invest in this fund, which is part of the Fidelity family of funds.
Nature, Extent, and Quality of Services Provided. The Board considered Fidelity's staffing as it relates to the fund, including the backgrounds of investment personnel of Fidelity, and also considered the fund's investment objective, strategies, and related investment philosophy. The Independent Trustees also had discussions with senior management of Fidelity's investment operations and investment groups. The Board considered the structure of the portfolio manager compensation program and whether this structure provides appropriate incentives to act in the best interests of the fund. Additionally, the Board considered the portfolio managers' investments, if any, in the funds that they manage.
Resources Dedicated to Investment Management and Support Services. The Board and the Fund Oversight and Research Committees reviewed the general qualifications and capabilities of Fidelity's investment staff, including its size, education, experience, and resources, as well as Fidelity's approach to recruiting, training, managing, and compensating investment personnel. The Board noted that Fidelity has continued to increase the resources devoted to non-U.S. offices, including expansion of Fidelity's global investment organization. The Board also noted that Fidelity's analysts have extensive resources, tools and capabilities that allow them to conduct sophisticated quantitative and fundamental analysis, as well as credit analysis of issuers, counterparties and guarantors. Further, the Board considered that Fidelity's investment professionals have sufficient access to global information and data so as to provide competitive investment results over time, and that those professionals also have access to sophisticated tools that permit them to assess portfolio construction and risk and performance attribution characteristics continuously, as well as to transmit new information and research conclusions rapidly around the world. Additionally, in its deliberations, the Board considered Fidelity's trading, risk management, and compliance capabilities and resources, which are integral parts of the investment management process.
Shareholder and Administrative Services. The Board considered (i) the nature, extent, quality, and cost of advisory, administrative, and shareholder services performed by FMR, the sub-advisers (together with FMR, the Investment Advisers), and their affiliates under the Advisory Contracts and under separate agreements covering transfer agency, pricing and bookkeeping, and securities lending services for the fund; (ii) the nature and extent of the supervision of third party service providers, principally custodians and subcustodians; and (iii) the resources devoted to, and the record of compliance with, the fund's compliance policies and procedures. The Board also reviewed the allocation of fund brokerage, including allocations to brokers affiliated with the Investment Advisers, the use of brokerage commissions to pay fund expenses, and the use of "soft" commission dollars to pay for research services.
Annual Report
The Board noted that the growth of fund assets over time across the complex allows Fidelity to reinvest in the development of services designed to enhance the value or convenience of the Fidelity funds as investment vehicles. These services include 24-hour access to account information and market information through telephone representatives and over the Internet, investor education materials and asset allocation tools, and the expanded availability of Fidelity Investor Centers.
In 2014, the Board formed an ad hoc Committee on Transfer Agency Fees to review the variety of transfer agency fee structures throughout the industry and Fidelity's competitive positioning with respect to industry participants.
Investment in a Large Fund Family. The Board considered the benefits to shareholders of investing in a Fidelity fund, including the benefits of investing in a fund that is part of a large family of funds offering a variety of investment disciplines and providing a large variety of mutual fund investor services. The Board noted that Fidelity had taken, or had made recommendations that resulted in the Fidelity funds taking, a number of actions over the previous year that benefited particular funds, including (i) continuing to dedicate additional resources to investment research and to the support of the senior management team that oversees asset management; (ii) continuing efforts to enhance Fidelity's global research capabilities; (iii) launching new funds and making other enhancements to meet client needs; (iv) reducing management fees and total expenses for certain index funds and diversified international funds; (v) continuing to launch dedicated lower cost underlying funds to meet portfolio construction needs related to expanding underlying fund options for Fidelity funds of funds, specifically for the Freedom Fund product lines; (vi) rationalizing product lines and gaining increased efficiencies through fund mergers; (vii) launching active fixed-income exchange-traded funds; (viii) continuing to develop, acquire and implement systems and technology to improve services to the funds and information security and to increase efficiency; (ix) implementing investment enhancements to further strengthen Fidelity's target date product line to increase investors' probability of success in achieving their goals; (x) modifying the eligibility criteria for certain share classes to accommodate roll-over assets from employer-sponsored retirement plans; (xi) launching a new Class W of the Freedom Index Funds to attract and retain Fidelity record-kept retirement plan assets; and (xii) implementing changes to Fidelity's money market product line in response to recent money market regulatory reforms.
Investment Performance. The Board considered whether the fund has operated in accordance with its investment objective, as well as its record of compliance with its investment restrictions and its performance history.
The Board took into account discussions with representatives of the Investment Advisers about fund investment performance that occur at Board meetings throughout the year. In this regard the Board noted that as part of regularly scheduled fund reviews and other reports to the Board on fund performance, the Board considers annualized return information for the fund, for different time periods, measured against a securities market index ("benchmark index") and a peer group of funds with similar objectives ("peer group"), if any. In its evaluation of fund investment performance, the Board gave particular attention to information indicating changes in performance of certain Fidelity funds for specific time periods and discussed with the Investment Advisers the reasons for any overperformance or underperformance.
In addition to reviewing absolute and relative fund performance, the Independent Trustees periodically consider the appropriateness of fund performance metrics in evaluating the results achieved. In general, the Independent Trustees believe that fund performance should be evaluated based on net performance (after fees and expenses) of both the highest performing and lowest performing fund share classes, where applicable, compared to appropriate benchmark indices, over appropriate time periods that may include full market cycles, and compared to peer groups, as applicable, over the same periods, taking into account relevant factors including the following: general market conditions; issuer-specific information; and fund cash flows and other factors.
The Independent Trustees recognize that shareholders evaluate performance on a net basis over their own holding periods, for which one-, three-, and five-year periods are often used as a proxy. For this reason, the performance information reviewed by the Board also included net cumulative calendar year total return information for the fund and an appropriate benchmark index for the most recent one-, three-, and five-year periods, as shown below. A peer group is not shown below because the fund does not generally utilize a peer group for performance comparison purposes.
Annual Report
Board Approval of Investment Advisory Contracts and Management Fees - continued
Fidelity China Region Fund

Based on its review, the Board concluded that the nature, extent, and quality of services provided to the fund under the Advisory Contracts should benefit the shareholders of the fund.
Competitiveness of Management Fee and Total Expense Ratio. The Board considered the fund's management fee and total expense ratio compared to "mapped groups" of competitive funds and classes created for the purpose of facilitating the Trustees' competitive analysis of management fees and total expenses. Fidelity creates "mapped groups" by combining similar Lipper investment objective categories that have comparable investment mandates. Combining Lipper investment objective categories aids the Board's management fee and total expense ratio comparisons by broadening the competitive group used for comparison.
Management Fee. The Board considered two proprietary management fee comparisons for the 12-month periods shown in basis points (BP) in the chart below. The group of Lipper funds used by the Board for management fee comparisons is referred to below as the "Total Mapped Group." The Total Mapped Group comparison focuses on a fund's standing in terms of gross management fees before expense reimbursements or caps, and without giving effect to the fund's performance adjustment, relative to the total universe of funds with comparable investment mandates, regardless of whether their management fee structures also are comparable. Funds with comparable investment mandates offer exposure to similar types of securities. Funds with comparable management fee structures have similar management fee contractual arrangements (e.g., flat rate charged for advisory services, all-inclusive fee rate, etc.). "TMG %" represents the percentage of funds in the Total Mapped Group that had management fees that were lower than the fund's. For example, a hypothetical TMG % of 20% would mean that 80% of the funds in the Total Mapped Group had higher, and 20% had lower, management fees than the fund. The fund's actual TMG %s and the number of funds in the Total Mapped Group are in the chart below. The "Asset-Size Peer Group" (ASPG) comparison focuses on a fund's standing relative to a subset of non-Fidelity funds within the Total Mapped Group that are similar in size and management fee structure without taking into account performance adjustments, if any. For example, if a fund is in the first quartile of the ASPG, the fund's management fee ranks in the least expensive or lowest 25% of funds in the ASPG. The ASPG represents at least 15% of the funds in the Total Mapped Group with comparable asset size and management fee structures, subject to a minimum of 50 funds (or all funds in the Total Mapped Group if fewer than 50). Additional information, such as the ASPG quartile in which the fund's management fee rate ranked and the impact of the fund's performance adjustment, is also included in the chart and considered by the Board.
Annual Report
Fidelity China Region Fund

The Board noted that the fund's management fee rate ranked below the median of its Total Mapped Group and below the median of its ASPG for 2014.
The Board noted that, in 2014, the ad hoc Committee on Group Fee was formed by it and other Fidelity fund boards to conduct an in-depth review of the "group fee" component of the management fee of funds with such management fee structures. Committee focus included the mechanics of the group fee, the competitive landscape of group fee structures, Fidelity funds with no group fee component and investment products not included in group fee assets. The Board also considered that, for funds subject to the group fee, FMR agreed to voluntarily waive fees over a specified period of time in amounts designed to account for assets converted from certain funds to certain collective investment trusts.
The Board also noted that, in 2013, the ad hoc Committee on Management Fees was formed to conduct an in-depth review of the management fee rates of Fidelity's active equity mutual funds. The Committee focused on the following areas: (i) standard fee structures; (ii) research consumption and trading evolution; (iii) management fee competitiveness/profitability by category; and (iv) factors that drive institutional pricing.
Based on its review, the Board concluded that the fund's management fee is fair and reasonable in light of the services that the fund receives and the other factors considered.
Total Expense Ratio. In its review of each class's total expense ratio, the Board considered the fund's management fee as well as other fund or class expenses, as applicable, such as transfer agent fees, pricing and bookkeeping fees, fund-paid 12b-1 fees, and custodial, legal, and audit fees. The Board also noted that Fidelity may agree to waive fees and expenses from time to time, and the extent to which, if any, it has done so for the fund. As part of its review, the Board also considered the current and historical total expense ratios of each class of the fund compared to competitive fund median expenses. Each class of the fund is compared to those funds and classes in the Total Mapped Group (used by the Board for management fee comparisons) that have a similar sales load structure.
The Board noted that the total expense ratio of each class ranked below its competitive median for 2014.
Fees Charged to Other Fidelity Clients. The Board also considered Fidelity fee structures and other information with respect to clients of Fidelity, such as other funds advised or subadvised by Fidelity, pension plan clients, and other institutional clients with similar mandates. The Board noted the findings of the 2013 ad hoc joint committee (created with the board of other Fidelity funds), which reviewed and compared Fidelity's institutional investment advisory business with its business of providing services to the Fidelity funds, including the differences in services provided, fees charged, and costs incurred, as well as competition in their respective marketplaces.
Based on its review of total expense ratios and fees charged to other Fidelity clients, the Board concluded that the total expense ratio of each class of the fund was reasonable in light of the services that the fund and its shareholders receive and the other factors considered.
Costs of the Services and Profitability. The Board considered the revenues earned and the expenses incurred by Fidelity in conducting the business of developing, marketing, distributing, managing, administering and servicing the fund and servicing the fund's shareholders. The Board also considered the level of Fidelity's profits in respect of all the Fidelity funds.
On an annual basis, Fidelity presents to the Board information about the profitability of its relationship with the fund. Fidelity calculates profitability information for each fund, as well as aggregate profitability information for groups of Fidelity funds and all Fidelity funds, using a series of detailed revenue and cost allocation methodologies which originate with the books and records of Fidelity on which Fidelity's audited financial statements are based. The Audit Committee of the Board reviews any significant changes from the prior year's methodologies.
Annual Report
Board Approval of Investment Advisory Contracts and Management Fees - continued
PricewaterhouseCoopers LLP (PwC), independent registered public accounting firm and auditor to Fidelity and certain Fidelity funds, has been engaged annually by the Board as part of the Board's assessment of Fidelity's profitability analysis. PwC's engagement includes the review and assessment of the methodologies used by Fidelity in determining the revenues and expenses attributable to Fidelity's mutual fund business, and completion of agreed-upon procedures in respect of the mathematical accuracy of fund profitability and its conformity to established allocation methodologies. After considering PwC's reports issued under the engagement and information provided by Fidelity, the Board concluded that while other allocation methods may also be reasonable, Fidelity's profitability methodologies are reasonable in all material respects.
The Board also reviewed Fidelity's non-fund businesses and fall-out benefits related to the mutual fund business as well as cases where Fidelity's affiliates may benefit from or be related to the fund's business.
The Board considered the costs of the services provided by and the profits realized by Fidelity in connection with the operation of the fund and was satisfied that the profitability was not excessive.
Economies of Scale. The Board considered whether there have been economies of scale in respect of the management of the Fidelity funds, whether the Fidelity funds (including the fund) have appropriately benefited from any such economies of scale, and whether there is potential for realization of any further economies of scale. The Board considered the extent to which the fund will benefit from economies of scale as assets grow through increased services to the fund, through waivers or reimbursements, or through fee or expense ratio reductions. The Board also noted that in 2013, it and the boards of other Fidelity funds created an ad hoc committee (the Economies of Scale Committee) to analyze whether Fidelity attains economies of scale in respect of the management and servicing of the Fidelity funds, whether the Fidelity funds have appropriately benefited from such economies of scale, and whether there is potential for realization of any further economies of scale.
The Board recognized that the fund's management contract incorporates a "group fee" structure, which provides for lower group fee rates as total group assets increase, and for higher group fee rates as total group assets decrease (with "group assets" defined to include fund assets under FMR's management plus sector fund assets previously under FMR's management and currently managed by Fidelity SelectCo, LLC). FMR calculates the group fee rates based on a tiered asset "breakpoint" schedule that varies based on asset class. The Board considered that the group fee is designed to deliver the benefits of economies of scale to fund shareholders when total Fidelity fund assets increase, even if assets of any particular fund are unchanged or have declined, because some portion of Fidelity's costs are attributable to services provided to all Fidelity funds, and all funds benefit if those costs can be allocated among more assets. The Board concluded that, given the group fee structure, fund shareholders will benefit from lower management fees as group assets increase at the fund complex level, regardless of whether Fidelity achieves any such economies of scale.
The Board concluded, taking into account the analysis of the Economies of Scale Committee, that economies of scale, if any, are being appropriately shared between fund shareholders and Fidelity.
Additional Information Requested by the Board. In order to develop fully the factual basis for consideration of the Fidelity funds' Advisory Contracts, the Board requested and received additional information on certain topics, including: (i) fund performance trends and Fidelity's long-term strategies for certain funds; (ii) the various share classes employed by Fidelity and the attributes of each class, together with similar information on the distribution and servicing payments made by Fidelity or the funds to third-party participants in the distribution channels; (iii) fund profitability, and fund performance in relation to fund profitability; (iv) the methodology with respect to evaluating competitive fund data and peer group classifications and fee comparisons; (v) annual fund profitability margins, with particular focus on certain funds with negative margins; (vi) the realization of fall-out benefits in certain Fidelity business units; (vii) economies of scale and the way in which they are shared with fund shareholders; (viii) Fidelity's group fee structures, including the group fee schedule of breakpoints; (ix) the impact of cost containment measures on the funds; and (x) the transfer agent fee structure.
Based on its evaluation of all of the conclusions noted above, and after considering all factors it believed relevant, the Board concluded that the advisory fee structures are fair and reasonable, and that the fund's Advisory Contracts should be renewed.
Annual Report
Investment Adviser
Fidelity Management & Research Company
Boston, MA
Investment Sub-Advisers
FMR Co., Inc.
FMR Investment Management
(U.K.) Limited
Fidelity Management & Research
(Hong Kong) Limited
Fidelity Management & Research
(Japan) Limited
FIL Investments (Japan) Limited
FIL Investment Advisors
FIL Investment Advisors
(UK) Limited
General Distributor
Fidelity Distributors Corporation
Smithfield, RI
Transfer and Service Agents
Fidelity Investments Institutional
Operations Company, Inc.
Boston, MA
Fidelity Service Company, Inc.
Boston, MA
Custodian
Brown Brothers Harriman & Co.,
Boston, MA
(Fidelity Investment logo)(registered trademark)
AHKCI-UANN-1215
1.861450.107
ContentsPerformance: The Bottom LineManagement's Discussion of Fund PerformanceShareholder Expense ExampleInvestment Changes (Unaudited)Investments October 31, 2015Financial StatementsNotes to Financial StatementsReport of Independent Registered Public Accounting FirmTrustees and OfficersDistributions (Unaudited)Board Approval of Investment Advisory Contracts and Management FeesContentsPerformance: The Bottom LineManagement's Discussion of Fund PerformanceShareholder Expense ExampleInvestment Changes (Unaudited)Investments October 31, 2015Financial StatementsNotes to Financial StatementsReport of Independent Registered Public Accounting FirmTrustees and OfficersDistributions (Unaudited)Board Approval of Investment Advisory Contracts and Management Fees
Fidelity Advisor®
Canada Fund -
Class A, Class T, Class B, and Class C
Annual Report
October 31, 2015
Class A, Class T, Class B, and Class C are
classes of Fidelity® Canada Fund
(Fidelity Cover Art)
Contents
Performance | (Click Here) | How the fund has done over time. |
Management's Discussion of Fund Performance | (Click Here) | The Portfolio Manager's review of fund performance and strategy. |
Shareholder Expense Example | (Click Here) | An example of shareholder expenses. |
Investment Changes | (Click Here) | A summary of major shifts in the fund's investments over the past six months. |
Investments | (Click Here) | A complete list of the fund's investments with their market values. |
Financial Statements | (Click Here) | Statements of assets and liabilities, operations, and changes in net assets, as well as financial highlights. |
Notes | (Click Here) | Notes to the financial statements. |
Report of Independent Registered Public Accounting Firm | (Click Here) | |
Trustees and Officers | (Click Here) | |
Distributions | (Click Here) | |
Board Approval of Investment Advisory Contracts and Management Fees | (Click Here) | |
To view a fund's proxy voting guidelines and proxy voting record for the 12-month period ended June 30, visit http://www.fidelity.com/proxyvotingresults or visit the Securities and Exchange Commission's (SEC) web site at http://www.sec.gov. You may also call 1-877-208-0098 to request a free copy of the proxy voting guidelines.
Standard & Poor's, S&P and S&P 500 are registered service marks of The McGraw-Hill Companies, Inc. and have been licensed for use by Fidelity Distributors Corporation.
Other third-party marks appearing herein are the property of their respective owners.
All other marks appearing herein are registered or unregistered trademarks or service marks of FMR LLC or an affiliated company. © 2015 FMR LLC. All rights reserved.
This report and the financial statements contained herein are submitted for the general information of the shareholders of the fund. This report is not authorized for distribution to prospective investors in the fund unless preceded or accompanied by an effective prospectus.
A fund files its complete schedule of portfolio holdings with the SEC for the first and third quarters of each fiscal year on Form N-Q. Forms N-Q are available on the SEC's web site at http://www.sec.gov. A fund's Forms N-Q may be reviewed and copied at the SEC's Public Reference Room in Washington, DC. Information regarding the operation of the SEC's Public Reference Room may be obtained by calling 1-800-SEC-0330. For a complete list of a fund's portfolio holdings, view the most recent holdings listing, semiannual report, or annual report on Fidelity's web site at http://www.fidelity.com, http://www.advisor.fidelity.com, or http://www.401k.com, as applicable.
NOT FDIC INSURED • MAY LOSE VALUE • NO BANK GUARANTEE
Neither the fund nor Fidelity Distributors Corporation is a bank.
Annual Report
Average annual total return reflects the change in the value of an investment, assuming reinvestment of the class' distributions from dividend income and capital gains (the profits earned upon the sale of securities that have grown in value, if any) and assuming a constant rate of performance each year. The $10,000 table and the fund's returns do not reflect the deduction of taxes that a shareholder would pay on fund distributions or the redemption of fund shares. During periods of reimbursement by Fidelity, a fund's total return will be greater than it would be had the reimbursement not occurred. How a fund did yesterday is no guarantee of how it will do tomorrow. Returns reflect the conversion of Class B shares to Class A shares after a maximum of seven years.
Average Annual Total Returns
Periods ended October 31, 2015 | Past 1
year | Past 5
years | Past 10
years |
Class A (incl. 5.75% sales charge)A | -19.25% | -1.05% | 3.74% |
Class T (incl. 3.50% sales charge) B | -17.57% | -0.87% | 3.74% |
Class B (incl. contingent deferred sales charge) C | -18.72% | -0.99% | 3.79% |
Class C (incl. contingent deferred sales charge) D | -15.71% | -0.61% | 3.70% |
A Class A shares bear a 0.25% 12b-1 fee. The initial offering of Class A shares took place on May 2, 2007. Returns prior to May 2, 2007 are those of Fidelity® Canada Fund, the original class of the fund, which has no 12b-1 fee. Had Class A shares' 12b-1 fee been reflected, returns prior to May 2, 2007 would have been lower.
B Class T shares bear a 0.50% 12b-1 fee. The initial offering of Class T shares took place on May 2, 2007. Returns prior to May 2, 2007 are those of Fidelity® Canada Fund, the original class of the fund, which has no 12b-1 fee. Had Class T shares' 12b-1 fee been reflected, returns prior to May 2, 2007 would have been lower.
C Class B shares bear a 1.00% 12b-1 fee. The initial offering of Class B shares took place on May 2, 2007. Returns prior to May 2, 2007 are those of Fidelity Canada Fund, the original class of the fund, which has no 12b-1 fee. Had Class B shares' 12b-1 fee been reflected, returns prior to May 2, 2007 would have been lower. Class B shares' contingent deferred sales charge included in the past one year, past five years, and past ten years total return figures are 5%, 2%, and 0%, respectively.
D Class C shares bear a 1.00% 12b-1 fee. The initial offering of Class C shares took place on May 2, 2007. Returns prior to May 2, 2007 are those of Fidelity Canada Fund, the original class of the fund, which has no 12b-1 fee. Had Class C shares' 12b-1 fee been reflected, returns prior to May 2, 2007 would have been lower. Class C shares' contingent deferred sales charge included in the past one year, past five years, and past ten years total return figures are 1%, 0%, and 0%, respectively.
$10,000 Over 10 Years
Let's say hypothetically that $10,000 was invested in Fidelity Advisor® Canada Fund - Class A on October 31, 2005, and the current 5.75% sales charge was paid. The chart shows how the value of your investment would have changed, and also shows how the S&P®/TSX Composite Index performed over the same period. See footnote A above for additional information regarding the performance of Class A.
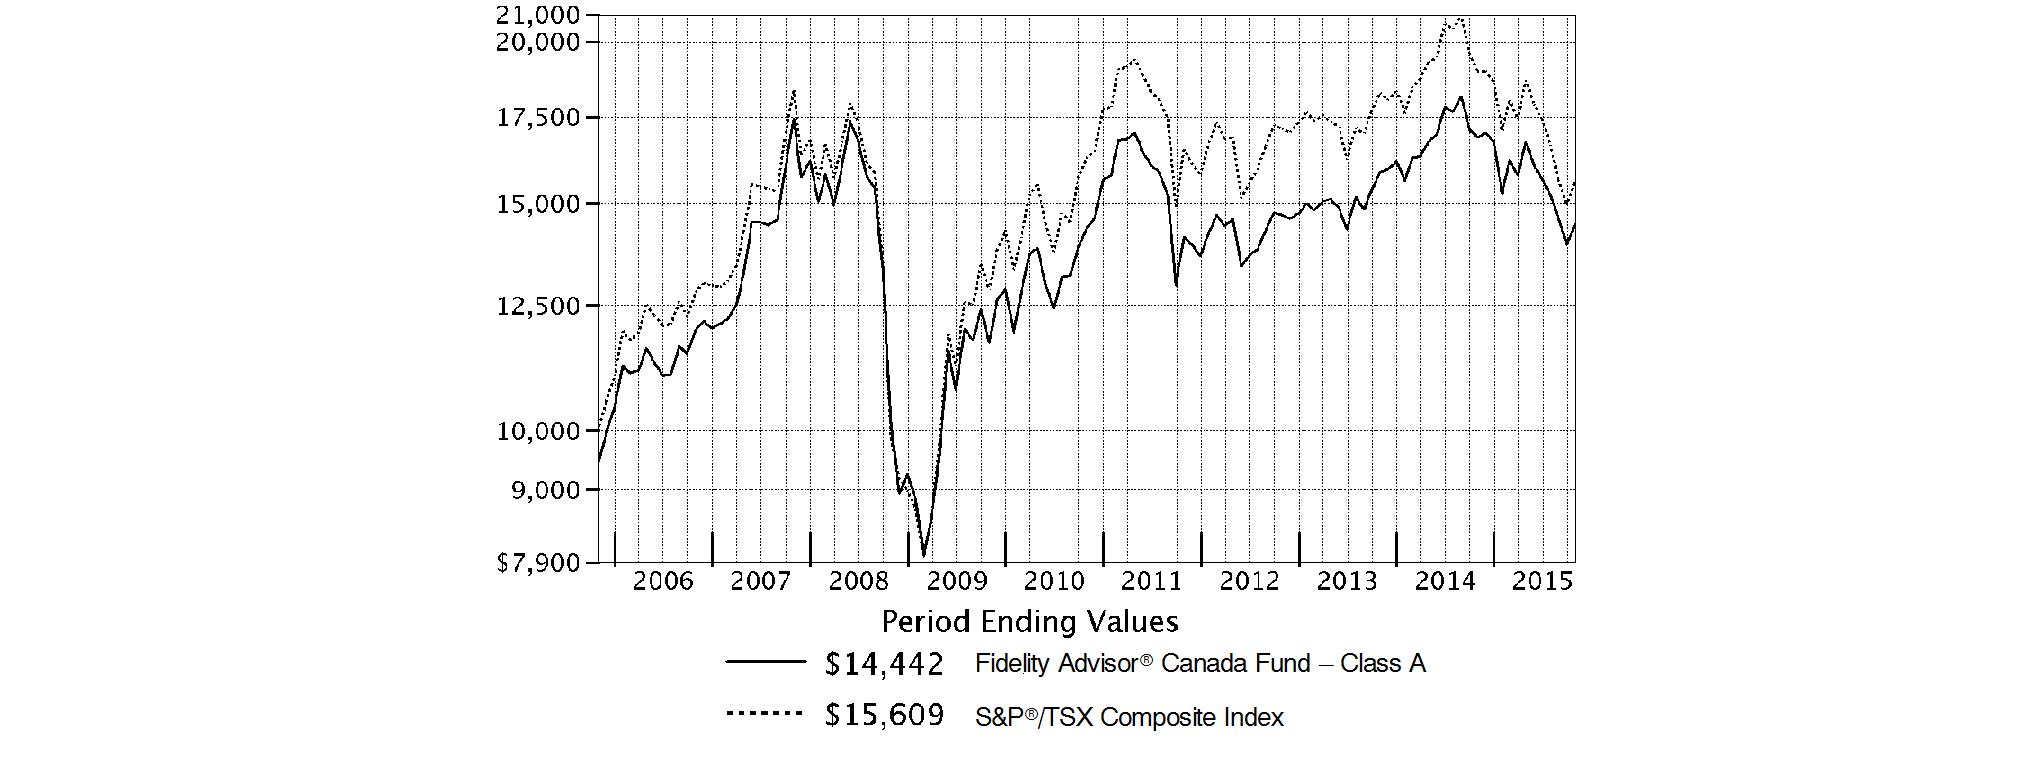
Annual Report
Fidelity Canada Fund
Market Recap: International equities suffered a moderate setback for the 12 months ending October 31, 2015, held back by a collapse in commodities prices that hurt resources-related sectors and geographies. The MSCI ACWI (All Country World Index) ex USA Index returned -4.55% for the period, affected also by concerns about global economic growth. Commodity producers remained under pressure for much of the past year, largely related to economic deceleration in China (-1%), the world's second-largest economy and a leading consumer of raw materials. This effect was exacerbated by U.S. dollar strength relative to global currencies, which weighed on commodities priced in dollars and acutely impacted equity returns within regions most exposed to resources prices. The emerging-markets group, for example, returned about -15% this period. Canada, a significant energy producer, returned roughly -17%. Net energy consumer Japan (+9%) was the best-performing region by far. Only about a quarter of the nearly 50 index countries managed a gain this period: Ireland (+19%) - the EU's fastest-growing economy - and Israel (+17%) proved top performers; Greece (-56%) and Brazil (-46%), among the worst. As for sectors, energy (-25%) and materials (-16%) declined sharply, whereas the two consumer sectors each gained about 6%.
Comments from Portfolio Manager Risteard Hogan: For the year, the fund's share classes (excluding sales charges, if applicable) delivered double-digit negative returns, but solidly outpaced the S&P/TSX Composite Index, which returned -17.81%. Amid a backdrop of weak demand for commodities, mainly due to slowing growth in China, Canada's resource-rich, export-driven market struggled. Strong stock selection in energy and materials drove the fund's outperformance versus the index. In energy, avoiding poor-performing index components Encana, Crescent Point Energy and Baytex Energy was beneficial. A position in telecommunications company Rogers Communications was the fund's No. 1 relative contributor and one of its largest holdings at period end. The company benefited from a recent government decision not to add additional competitors to the market. On the downside, avoiding asset manager and index component Brookfield Asset Management proved detrimental. I felt the stock's valuation was high, so I looked elsewhere for better growth opportunities. However, the company continued to execute well, which buoyed its stock price.
The views expressed above reflect those of the portfolio manager(s) only through the end of the period as stated on the cover of this report and do not necessarily represent the views of Fidelity or any other person in the Fidelity organization. Any such views are subject to change at any time based upon market or other conditions and Fidelity disclaims any responsibility to update such views. These views may not be relied on as investment advice and, because investment decisions for a Fidelity fund are based on numerous factors, may not be relied on as an indication of trading intent on behalf of any Fidelity fund.
Annual Report
Fidelity Canada Fund
As a shareholder of the Fund, you incur two types of costs: (1) transaction costs, including sales charges (loads) on purchase payments or redemption proceeds, redemption fees and (2) ongoing costs, including management fees, distribution and/or service (12b-1) fees and other Fund expenses. This Example is intended to help you understand your ongoing costs (in dollars) of investing in the Fund and to compare these costs with the ongoing costs of investing in other mutual funds.
The Example is based on an investment of $1,000 invested at the beginning of the period and held for the entire period (May 1, 2015 to October 31, 2015).
Actual Expenses
The first line of the accompanying table for each class of the Fund provides information about actual account values and actual expenses. You may use the information in this line, together with the amount you invested, to estimate the expenses that you paid over the period. Simply divide your account value by $1,000.00 (for example, an $8,600 account value divided by $1,000.00 = 8.6), then multiply the result by the number in the first line for a class of the Fund under the heading entitled "Expenses Paid During Period" to estimate the expenses you paid on your account during this period. A small balance maintenance fee of $12.00 that is charged once a year may apply for certain accounts with a value of less than $2,000. This fee is not included in the table below. If it was, the estimate of expenses you paid during the period would be higher, and your ending account value lower, by this amount. In addition, the Fund, as a shareholder in the underlying Fidelity Central Funds, will indirectly bear its pro-rata share of the fees and expenses incurred by the underlying Fidelity Central Funds. These fees and expenses are not included in the Fund's annualized expense ratio used to calculate the expense estimate in the table below.
Hypothetical Example for Comparison Purposes
The second line of the accompanying table for each class of the Fund provides information about hypothetical account values and hypothetical expenses based on a Class' actual expense ratio and an assumed rate of return of 5% per year before expenses, which is not the Class' actual return. The hypothetical account values and expenses may not be used to estimate the actual ending account balance or expenses you paid for the period. You may use this information to compare the ongoing costs of investing in the Fund and other funds. To do so, compare this 5% hypothetical example with the 5% hypothetical examples that appear in the shareholder reports of the other funds. A small balance maintenance fee of $12.00 that is charged once a year may apply for certain accounts with a value of less than $2,000. This fee is not included in the table below. If it was, the estimate of expenses you paid during the period would be higher, and your ending account value lower, by this amount. In addition, the Fund, as a shareholder in the underlying Fidelity Central Funds, will indirectly bear its pro-rata share of the fees and expenses incurred by the underlying Fidelity Central Funds. These fees and expenses are not included in the Fund's annualized expense ratio used to calculate the expense estimate in the table below.
Please note that the expenses shown in the table are meant to highlight your ongoing costs only and do not reflect any transaction costs. Therefore, the second line of the table is useful in comparing ongoing costs only, and will not help you determine the relative total costs of owning different funds. In addition, if these transactional costs were included, your costs would have been higher.
| Annualized
Expense RatioB | Beginning
Account Value
May 1, 2015 | Ending
Account Value
October 31, 2015 | Expenses Paid
During PeriodC
May 1, 2015
to October 31, 2015 |
Class A | 1.45% | | | |
Actual | | $ 1,000.00 | $ 862.20 | $ 6.81 |
HypotheticalA | | $ 1,000.00 | $ 1,017.90 | $ 7.38 |
Class T | 1.76% | | | |
Actual | | $ 1,000.00 | $ 860.90 | $ 8.26 |
HypotheticalA | | $ 1,000.00 | $ 1,016.33 | $ 8.94 |
Class B | 2.24% | | | |
Actual | | $ 1,000.00 | $ 858.80 | $ 10.49 |
HypotheticalA | | $ 1,000.00 | $ 1,013.91 | $ 11.37 |
Class C | 2.19% | | | |
Actual | | $ 1,000.00 | $ 858.90 | $ 10.26 |
HypotheticalA | | $ 1,000.00 | $ 1,014.17 | $ 11.12 |
Canada | 1.16% | | | |
Actual | | $ 1,000.00 | $ 863.30 | $ 5.45 |
HypotheticalA | | $ 1,000.00 | $ 1,019.36 | $ 5.90 |
Class I | 1.13% | | | |
Actual | | $ 1,000.00 | $ 863.50 | $ 5.31 |
HypotheticalA | | $ 1,000.00 | $ 1,019.51 | $ 5.75 |
A 5% return per year before expenses
B Annualized expense ratio reflects expenses net of applicable fee waivers.
C Expenses are equal to each Class' annualized expense ratio, multiplied by the average account value over the period, multiplied by 184/365 (to reflect the one-half year period).
Annual Report
Fidelity Canada Fund
Investment Changes (Unaudited)
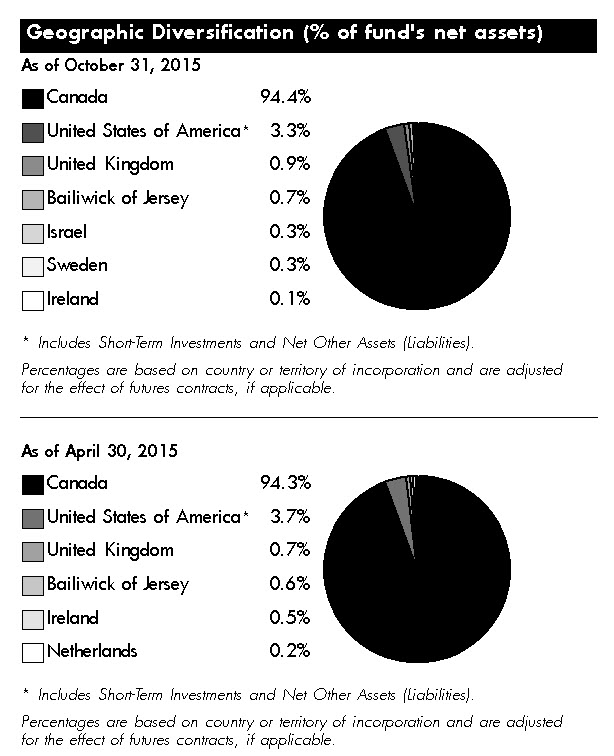
Asset Allocation as of October 31, 2015 |
| % of fund's
net assets | % of fund's net assets
6 months ago |
Stocks | 97.8 | 97.9 |
Short-Term Investments and Net Other Assets (Liabilities) | 2.2 | 2.1 |
Top Ten Stocks as of October 31, 2015 |
| % of fund's
net assets | % of fund's net assets
6 months ago |
Royal Bank of Canada (Banks) | 8.9 | 8.3 |
The Toronto-Dominion Bank (Banks) | 8.3 | 7.7 |
Canadian National Railway Co. (Road & Rail) | 6.1 | 5.4 |
Suncor Energy, Inc. (Oil, Gas & Consumable Fuels) | 5.7 | 5.2 |
Enbridge, Inc. (Oil, Gas & Consumable Fuels) | 4.4 | 4.8 |
Sun Life Financial, Inc. (Insurance) | 4.1 | 2.8 |
TELUS Corp. (Diversified Telecommunication Services) | 3.9 | 3.0 |
Rogers Communications, Inc. Class B (non-vtg.) (Wireless Telecommunication Services) | 3.8 | 2.6 |
Intact Financial Corp. (Insurance) | 2.3 | 2.3 |
Imperial Oil Ltd. (Oil, Gas & Consumable Fuels) | 2.3 | 2.8 |
| 48.5 | |
Market Sectors as of October 31, 2015 |
| % of fund's
net assets | % of fund's net assets
6 months ago |
Financials | 33.1 | 30.7 |
Energy | 20.7 | 23.1 |
Materials | 10.2 | 10.8 |
Consumer Staples | 8.7 | 7.4 |
Industrials | 8.2 | 7.5 |
Telecommunication Services | 7.7 | 5.6 |
Information Technology | 3.3 | 4.6 |
Health Care | 3.0 | 4.9 |
Consumer Discretionary | 2.6 | 3.3 |
Utilities | 0.3 | 0.0 |
Market Sectors may include more than one industry category. The fund may invest up to 35% of its total assets in any industry that represents more than 20% of the Canadian market. As of October 31, 2015, the fund did not have more than 25% of its assets invested in any one industry. Percentages shown as 0.0% may reflect amounts less than 0.05%. |
Annual Report
Fidelity Canada Fund
Investments October 31, 2015
Showing Percentage of Net Assets
Common Stocks - 97.8% |
| Shares | | Value |
CONSUMER DISCRETIONARY - 2.6% |
Household Durables - 0.1% |
Cairn Homes PLC (a) | 1,401,800 | | $ 1,556,904 |
Media - 0.6% |
Quebecor, Inc. Class B (sub. vtg.) | 371,700 | | 8,752,404 |
Specialty Retail - 0.9% |
AutoCanada, Inc. (d) | 152,900 | | 3,704,399 |
RONA, Inc. | 888,200 | | 9,271,895 |
| | 12,976,294 |
Textiles, Apparel & Luxury Goods - 1.0% |
Gildan Activewear, Inc. | 465,690 | | 13,387,341 |
TOTAL CONSUMER DISCRETIONARY | | 36,672,943 |
CONSUMER STAPLES - 8.7% |
Food & Staples Retailing - 7.4% |
Alimentation Couche-Tard, Inc. Class B (sub. vtg.) | 709,200 | | 30,508,183 |
George Weston Ltd. | 349,500 | | 29,433,267 |
Jean Coutu Group, Inc. Class A (sub. vtg.) | 943,500 | | 14,380,510 |
Metro, Inc. Class A (sub. vtg.) | 545,995 | | 15,612,384 |
North West Co., Inc. | 557,700 | | 12,368,691 |
| | 102,303,035 |
Food Products - 0.7% |
AGT Food & Ingredients, Inc. | 152,500 | | 3,408,974 |
Mead Johnson Nutrition Co. Class A | 71,900 | | 5,895,800 |
| | 9,304,774 |
Tobacco - 0.6% |
British American Tobacco PLC (United Kingdom) | 151,200 | | 8,982,735 |
TOTAL CONSUMER STAPLES | | 120,590,544 |
ENERGY - 20.7% |
Energy Equipment & Services - 1.0% |
Pason Systems, Inc. | 545,300 | | 8,023,533 |
ZCL Composites, Inc. | 1,272,800 | | 6,034,995 |
| | 14,058,528 |
Oil, Gas & Consumable Fuels - 19.7% |
ARC Resources Ltd. (d) | 1,075,300 | | 15,854,836 |
Black Stone Minerals LP | 330,700 | | 4,540,511 |
Canadian Natural Resources Ltd. | 212,498 | | 4,927,301 |
Cenovus Energy, Inc. | 293,600 | | 4,373,913 |
Enbridge, Inc. | 1,444,400 | | 61,737,164 |
Imperial Oil Ltd. | 942,400 | | 31,358,079 |
Keyera Corp. (d) | 515,904 | | 15,919,797 |
Painted Pony Petroleum Ltd. (a) | 994,400 | | 3,391,728 |
Paramount Resources Ltd. Class A (a) | 462,900 | | 4,683,517 |
Parkland Fuel Corp. | 422,600 | | 7,352,516 |
Peyto Exploration & Development Corp. | 445,400 | | 9,196,849 |
|
| Shares | | Value |
PrairieSky Royalty Ltd. (d) | 450,063 | | $ 8,856,012 |
Raging River Exploration, Inc. (a) | 914,200 | | 5,802,891 |
Spartan Energy Corp. (a) | 2,992,400 | | 5,469,437 |
Suncor Energy, Inc. | 2,636,400 | | 78,450,844 |
Whitecap Resources, Inc. | 1,263,400 | | 11,217,554 |
| | 273,132,949 |
TOTAL ENERGY | | 287,191,477 |
FINANCIALS - 33.1% |
Banks - 20.6% |
Bank of Nova Scotia | 475,000 | | 22,336,915 |
National Bank of Canada | 731,600 | | 24,231,872 |
Royal Bank of Canada (d) | 2,151,600 | | 123,030,842 |
The Toronto-Dominion Bank | 2,823,900 | | 115,927,617 |
| | 285,527,246 |
Capital Markets - 0.7% |
AGF Management Ltd. Class B (non-vtg.) | 355,200 | | 1,475,020 |
Ashmore Group PLC (d) | 1,044,000 | | 4,345,462 |
CI Financial Corp. | 166,100 | | 3,963,230 |
| | 9,783,712 |
Insurance - 10.2% |
Fairfax Financial Holdings Ltd. (sub. vtg.) | 44,400 | | 21,864,521 |
Intact Financial Corp. | 448,825 | | 32,055,496 |
Power Corp. of Canada (sub. vtg.) | 1,362,700 | | 30,628,444 |
Sun Life Financial, Inc. | 1,704,200 | | 57,475,696 |
| | 142,024,157 |
Real Estate Investment Trusts - 1.6% |
Allied Properties (REIT) | 437,900 | | 12,015,794 |
H&R REIT/H&R Finance Trust | 631,200 | | 10,127,391 |
| | 22,143,185 |
TOTAL FINANCIALS | | 459,478,300 |
HEALTH CARE - 3.0% |
Health Care Equipment & Supplies - 0.4% |
Getinge AB (B Shares) | 159,200 | | 3,985,800 |
Novadaq Technologies, Inc. (a) | 142,687 | | 1,795,003 |
| | 5,780,803 |
Pharmaceuticals - 2.6% |
Teva Pharmaceutical Industries Ltd. sponsored ADR | 80,000 | | 4,735,200 |
Valeant Pharmaceuticals International, Inc. (Canada) (a) | 334,421 | | 31,211,945 |
| | 35,947,145 |
TOTAL HEALTH CARE | | 41,727,948 |
INDUSTRIALS - 8.2% |
Airlines - 0.7% |
WestJet Airlines Ltd. | 510,100 | | 9,440,517 |
Common Stocks - continued |
| Shares | | Value |
INDUSTRIALS - continued |
Professional Services - 0.8% |
Stantec, Inc. | 433,700 | | $ 10,885,618 |
Road & Rail - 6.7% |
Canadian National Railway Co. | 1,393,100 | | 85,092,457 |
TransForce, Inc. | 441,300 | | 8,632,957 |
| | 93,725,414 |
TOTAL INDUSTRIALS | | 114,051,549 |
INFORMATION TECHNOLOGY - 3.3% |
Electronic Equipment & Components - 0.2% |
Avigilon Corp. (a)(d) | 285,700 | | 3,205,276 |
IT Services - 1.0% |
CGI Group, Inc. Class A (sub. vtg.) (a) | 374,500 | | 13,910,573 |
Software - 2.1% |
Constellation Software, Inc. | 36,600 | | 15,814,469 |
Open Text Corp. | 285,414 | | 13,229,537 |
| | 29,044,006 |
TOTAL INFORMATION TECHNOLOGY | | 46,159,855 |
MATERIALS - 10.2% |
Chemicals - 2.4% |
Agrium, Inc. | 209,300 | | 19,471,815 |
Monsanto Co. | 31,900 | | 2,973,718 |
Potash Corp. of Saskatchewan, Inc. | 563,400 | | 11,409,324 |
| | 33,854,857 |
Containers & Packaging - 1.3% |
CCL Industries, Inc. Class B | 90,000 | | 12,750,459 |
Winpak Ltd. | 179,600 | | 5,426,733 |
| | 18,177,192 |
Metals & Mining - 5.2% |
Agnico Eagle Mines Ltd. (Canada) | 434,600 | | 12,284,197 |
Eldorado Gold Corp. | 1,999,600 | | 6,988,507 |
Freeport-McMoRan, Inc. | 276,300 | | 3,252,051 |
Goldcorp, Inc. | 375,000 | | 4,797,912 |
Labrador Iron Ore Royalty Corp. (d) | 292,700 | | 3,404,686 |
Lundin Mining Corp. (a) | 2,301,300 | | 7,761,344 |
Randgold Resources Ltd. | 145,464 | | 9,755,819 |
Silver Wheaton Corp. | 874,700 | | 11,886,983 |
Tahoe Resources, Inc. | 670,700 | | 5,601,135 |
Teck Resources Ltd. Class B (sub. vtg.) | 259,400 | | 1,519,581 |
Torex Gold Resources, Inc. (a) | 5,532,400 | | 5,246,387 |
| | 72,498,602 |
Paper & Forest Products - 1.3% |
Stella-Jones, Inc. | 182,400 | | 6,712,365 |
West Fraser Timber Co. Ltd. | 309,000 | | 10,934,101 |
| | 17,646,466 |
TOTAL MATERIALS | | 142,177,117 |
|
| Shares | | Value |
TELECOMMUNICATION SERVICES - 7.7% |
Diversified Telecommunication Services - 3.9% |
TELUS Corp. | 1,646,200 | | $ 54,940,478 |
Wireless Telecommunication Services - 3.8% |
Rogers Communications, Inc. Class B (non-vtg.) | 1,323,400 | | 52,658,689 |
TOTAL TELECOMMUNICATION SERVICES | | 107,599,167 |
UTILITIES - 0.3% |
Electric Utilities - 0.3% |
Hydro One Ltd. (a) | 221,400 | | 3,471,016 |
TOTAL COMMON STOCKS (Cost $1,209,742,368) |
1,359,119,916
|
Money Market Funds - 4.4% |
| | | |
Fidelity Cash Central Fund, 0.18% (b) | 28,325,905 | | 28,325,905 |
Fidelity Securities Lending Cash Central Fund, 0.19% (b)(c) | 33,251,267 | | 33,251,267 |
TOTAL MONEY MARKET FUNDS (Cost $61,577,172) |
61,577,172
|
TOTAL INVESTMENT PORTFOLIO - 102.2% (Cost $1,271,319,540) | | 1,420,697,088 |
NET OTHER ASSETS (LIABILITIES) - (2.2)% | | (30,969,506) |
NET ASSETS - 100% | $ 1,389,727,582 |
Legend |
(a) Non-income producing |
(b) Affiliated fund that is generally available only to investment companies and other accounts managed by Fidelity Investments. The rate quoted is the annualized seven-day yield of the fund at period end. A complete unaudited listing of the fund's holdings as of its most recent quarter end is available upon request. In addition, each Fidelity Central Fund's financial statements, which are not covered by the Fund's Report of Independent Registered Public Accounting Firm, are available on the SEC's website or upon request. |
(c) Investment made with cash collateral received from securities on loan. |
(d) Security or a portion of the security is on loan at period end. |
Affiliated Central Funds |
Information regarding fiscal year to date income earned by the Fund from investments in Fidelity Central Funds is as follows: |
Fund | Income earned |
Fidelity Cash Central Fund | $ 46,391 |
Fidelity Securities Lending Cash Central Fund | 2,422,196 |
Total | $ 2,468,587 |
Other Information |
Categorizations in the Schedule of Investments are based on country or territory of incorporation. |
The following is a summary of the inputs used, as of October 31, 2015, involving the Fund's assets and liabilities carried at fair value. The inputs or methodology used for valuing securities may not be an indication of the risk associated with investing in those securities. For more information on valuation inputs, and their aggregation into the levels used in the table below, please refer to the Investment Valuation section in the accompanying Notes to Financial Statements. |
Valuation Inputs at Reporting Date: |
Description | Total | Level 1 | Level 2 | Level 3 |
Investments in Securities: | | | | |
Equities: | | | | |
Consumer Discretionary | $ 36,672,943 | $ 36,672,943 | $ - | $ - |
Consumer Staples | 120,590,544 | 111,607,809 | 8,982,735 | - |
Energy | 287,191,477 | 287,191,477 | - | - |
Financials | 459,478,300 | 459,478,300 | - | - |
Health Care | 41,727,948 | 41,727,948 | - | - |
Industrials | 114,051,549 | 114,051,549 | - | - |
Information Technology | 46,159,855 | 46,159,855 | - | - |
Materials | 142,177,117 | 132,421,298 | 9,755,819 | - |
Telecommunication Services | 107,599,167 | 107,599,167 | - | - |
Utilities | 3,471,016 | - | 3,471,016 | - |
Money Market Funds | 61,577,172 | 61,577,172 | - | - |
Total Investments in Securities: | $ 1,420,697,088 | $ 1,398,487,518 | $ 22,209,570 | $ - |
See accompanying notes which are an integral part of the financial statements.
Annual Report
Fidelity Canada Fund
Statement of Assets and Liabilities
| | October 31, 2015 |
| | |
Assets | | |
Investment in securities, at value (including securities loaned of $31,571,540) - See accompanying schedule: Unaffiliated issuers (cost $1,209,742,368) | $ 1,359,119,916 | |
Fidelity Central Funds (cost $61,577,172) | 61,577,172 | |
Total Investments (cost $1,271,319,540) | | $ 1,420,697,088 |
Foreign currency held at value (cost $1,009,637) | | 1,009,637 |
Receivable for investments sold | | 9,236,873 |
Receivable for fund shares sold | | 257,082 |
Dividends receivable | | 1,907,666 |
Distributions receivable from Fidelity Central Funds | | 316,344 |
Prepaid expenses | | 4,446 |
Other receivables | | 3,054 |
Total assets | | 1,433,432,190 |
| | |
Liabilities | | |
Payable for investments purchased | $ 6,691,159 | |
Payable for fund shares redeemed | 2,185,614 | |
Accrued management fee | 1,150,326 | |
Distribution and service plan fees payable | 38,976 | |
Other affiliated payables | 324,021 | |
Other payables and accrued expenses | 63,245 | |
Collateral on securities loaned, at value | 33,251,267 | |
Total liabilities | | 43,704,608 |
| | |
Net Assets | | $ 1,389,727,582 |
Net Assets consist of: | | |
Paid in capital | | $ 1,236,604,194 |
Undistributed net investment income | | 14,473,984 |
Accumulated undistributed net realized gain (loss) on investments and foreign currency transactions | | (10,711,888) |
Net unrealized appreciation (depreciation) on investments and assets and liabilities in foreign currencies | | 149,361,292 |
Net Assets | | $ 1,389,727,582 |
Statement of Assets and Liabilities - continued
| | October 31, 2015 |
| | |
Calculation of Maximum Offering Price Class A:
Net Asset Value and redemption price per share ($58,286,357 ÷ 1,288,166 shares) | | $ 45.25 |
| | |
Maximum offering price per share (100/94.25 of $45.25) | | $ 48.01 |
Class T:
Net Asset Value and redemption price per share ($12,820,215 ÷ 284,977 shares) | | $ 44.99 |
| | |
Maximum offering price per share (100/96.50 of $44.99) | | $ 46.62 |
Class B:
Net Asset Value and offering price per share ($2,677,631 ÷ 60,548 shares)A | | $ 44.22 |
| | |
Class C:
Net Asset Value and offering price per share ($21,609,613 ÷ 490,895 shares)A | | $ 44.02 |
| | |
Canada:
Net Asset Value, offering price and redemption price per share ($1,279,487,995 ÷ 28,086,893 shares) | | $ 45.55 |
| | |
Class I:
Net Asset Value, offering price and redemption price per share ($14,845,771 ÷ 326,722 shares) | | $ 45.44 |
A Redemption price per share is equal to net asset value less any applicable contingent deferred sales charge.
See accompanying notes which are an integral part of the financial statements.
Annual Report
Fidelity Canada Fund
Financial Statements - continued
Statement of Operations
| Year ended October 31, 2015 |
| | |
Investment Income | | |
Dividends | | $ 46,076,720 |
Interest | | 774 |
Income from Fidelity Central Funds (including $2,422,196 from security lending) | | 2,468,587 |
Income before foreign taxes withheld | | 48,546,081 |
Less foreign taxes withheld | | (6,671,693) |
Total income | | 41,874,388 |
| | |
Expenses | | |
Management fee | | |
Basic fee | $ 12,628,027 | |
Performance adjustment | 3,229,143 | |
Transfer agent fees | 3,835,510 | |
Distribution and service plan fees | 622,244 | |
Accounting and security lending fees | 823,779 | |
Custodian fees and expenses | 32,498 | |
Independent trustees' compensation | 7,941 | |
Registration fees | 81,078 | |
Audit | 72,385 | |
Legal | 5,911 | |
Miscellaneous | 13,840 | |
Total expenses before reductions | 21,352,356 | |
Expense reductions | (107,309) | 21,245,047 |
Net investment income (loss) | | 20,629,341 |
Realized and Unrealized Gain (Loss) | | |
Net realized gain (loss) on: | | |
Investment securities: | | |
Unaffiliated issuers | (6,519,666) | |
Foreign currency transactions | (476,530) | |
Total net realized gain (loss) | | (6,996,196) |
Change in net unrealized appreciation (depreciation) on: Investment securities | (283,149,563) | |
Assets and liabilities in foreign currencies | (7,842) | |
Total change in net unrealized appreciation (depreciation) | | (283,157,405) |
Net gain (loss) | | (290,153,601) |
Net increase (decrease) in net assets resulting from operations | | $ (269,524,260) |
Statement of Changes in Net Assets
| Year ended
October 31,
2015 | Year ended
October 31,
2014 |
Increase (Decrease) in Net Assets | | |
Operations | | |
Net investment income (loss) | $ 20,629,341 | $ 24,923,588 |
Net realized gain (loss) | (6,996,196) | 290,863,952 |
Change in net unrealized appreciation (depreciation) | (283,157,405) | (164,747,262) |
Net increase (decrease) in net assets resulting from operations | (269,524,260) | 151,040,278 |
Distributions to shareholders from net investment income | (24,029,674) | (9,338,915) |
Distributions to shareholders from net realized gain | (262,730,704) | (13,503,099) |
Total distributions | (286,760,378) | (22,842,014) |
Share transactions - net increase (decrease) | (304,156,881) | (365,686,992) |
Redemption fees | 128,345 | 129,289 |
Total increase (decrease) in net assets | (860,313,174) | (237,359,439) |
| | |
Net Assets | | |
Beginning of period | 2,250,040,756 | 2,487,400,195 |
End of period (including undistributed net investment income of $14,473,984 and undistributed net investment income of $20,538,750, respectively) | $ 1,389,727,582 | $ 2,250,040,756 |
See accompanying notes which are an integral part of the financial statements.
Annual Report
Financial Highlights - Fidelity Canada Fund Class A
Years ended October 31, | 2015 | 2014 | 2013 | 2012 | 2011 |
Selected Per-Share Data | | | | | |
Net asset value, beginning of period | $ 60.56 | $ 57.31 | $ 53.65 | $ 52.20 | $ 53.81 |
Income from Investment Operations | | | | | |
Net investment income (loss) C | .45 | .47 | .60 | .57 | .34 |
Net realized and unrealized gain (loss) | (8.04) | 3.13 | 3.63 | 1.50 | (1.17) |
Total from investment operations | (7.59) | 3.60 | 4.23 | 2.07 | (.83) |
Distributions from net investment income | (.50) | (.03) | (.57) | (.33) | (.35) |
Distributions from net realized gain | (7.22) | (.32) | - | (.29) | (.44) |
Total distributions | (7.72) | (.35) | (.57) | (.62) | (.79) |
Redemption fees added to paid in capitalC | -G | -G | -G | -G | .01 |
Net asset value, end of period | $ 45.25 | $ 60.56 | $ 57.31 | $ 53.65 | $ 52.20 |
Total ReturnA, B | (14.32)% | 6.32% | 7.98% | 4.04% | (1.64)% |
Ratios to Average Net AssetsD, F | | | | | |
Expenses before reductions | 1.43% | 1.29% | 1.19% | 1.08% | 1.12% |
Expenses net of fee waivers, if any | 1.43% | 1.29% | 1.19% | 1.08% | 1.12% |
Expenses net of all reductions | 1.43% | 1.29% | 1.18% | 1.08% | 1.12% |
Net investment income (loss) | .90% | .79% | 1.11% | 1.11% | .59% |
Supplemental Data | | | | | |
Net assets, end of period (000 omitted) | $ 58,286 | $ 95,004 | $ 116,661 | $ 159,597 | $ 215,369 |
Portfolio turnover rateE | 24% | 85% | 64% | 86% | 104% |
A Total returns would have been lower if certain expenses had not been reduced during the applicable periods shown. B Total returns do not include the effect of the sales charges. C Calculated based on average shares outstanding during the period. D Fees and expenses of any underlying Fidelity Central Funds are not included in the Fund's expense ratio. The Fund indirectly bears its proportionate share of the expenses of any underlying Fidelity Central Funds. E Amount does not include the portfolio activity of any underlying Fidelity Central Funds. F Expense ratios reflect operating expenses of the class. Expenses before reductions do not reflect amounts reimbursed by the investment adviser or reductions from brokerage service arrangements or reductions from other expense offset arrangements and do not represent the amount paid by the class during periods when reimbursements or reductions occur. Expenses net of fee waivers reflect expenses after reimbursement by the investment adviser but prior to reductions from brokerage service arrangements or other expense offset arrangements. Expenses net of all reductions represent the net expenses paid by the class. G Amount represents less than $.005 per share. |
Financial Highlights - Fidelity Canada Fund Class T
Years ended October 31, | 2015 | 2014 | 2013 | 2012 | 2011 |
Selected Per-Share Data | | | | | |
Net asset value, beginning of period | $ 60.22 | $ 57.14 | $ 53.48 | $ 52.01 | $ 53.64 |
Income from Investment Operations | | | | | |
Net investment income (loss) C | .29 | .29 | .45 | .43 | .17 |
Net realized and unrealized gain (loss) | (8.00) | 3.11 | 3.63 | 1.49 | (1.16) |
Total from investment operations | (7.71) | 3.40 | 4.08 | 1.92 | (.99) |
Distributions from net investment income | (.30) | - | (.42) | (.16) | (.21) |
Distributions from net realized gain | (7.22) | (.32) | - | (.29) | (.44) |
Total distributions | (7.52) | (.32) | (.42) | (.45) | (.65) |
Redemption fees added to paid in capitalC | -G | -G | -G | -G | .01 |
Net asset value, end of period | $ 44.99 | $ 60.22 | $ 57.14 | $ 53.48 | $ 52.01 |
Total ReturnA, B | (14.58)% | 5.99% | 7.69% | 3.74% | (1.93)% |
Ratios to Average Net AssetsD, F | | | | | |
Expenses before reductions | 1.75% | 1.59% | 1.47% | 1.36% | 1.42% |
Expenses net of fee waivers, if any | 1.75% | 1.59% | 1.47% | 1.36% | 1.42% |
Expenses net of all reductions | 1.75% | 1.59% | 1.46% | 1.36% | 1.42% |
Net investment income (loss) | .58% | .48% | .83% | .83% | .30% |
Supplemental Data | | | | | |
Net assets, end of period (000 omitted) | $ 12,820 | $ 21,989 | $ 23,751 | $ 29,626 | $ 34,323 |
Portfolio turnover rateE | 24% | 85% | 64% | 86% | 104% |
A Total returns would have been lower if certain expenses had not been reduced during the applicable periods shown. B Total returns do not include the effect of the sales charges. C Calculated based on average shares outstanding during the period. D Fees and expenses of any underlying Fidelity Central Funds are not included in the Fund's expense ratio. The Fund indirectly bears its proportionate share of the expenses of any underlying Fidelity Central Funds. E Amount does not include the portfolio activity of any underlying Fidelity Central Funds. F Expense ratios reflect operating expenses of the class. Expenses before reductions do not reflect amounts reimbursed by the investment adviser or reductions from brokerage service arrangements or reductions from other expense offset arrangements and do not represent the amount paid by the class during periods when reimbursements or reductions occur. Expenses net of fee waivers reflect expenses after reimbursement by the investment adviser but prior to reductions from brokerage service arrangements or other expense offset arrangements. Expenses net of all reductions represent the net expenses paid by the class. G Amount represents less than $.005 per share. |
See accompanying notes which are an integral part of the financial statements.
Annual Report
Financial Highlights - Fidelity Canada Fund Class B
Years ended October 31, | 2015 | 2014 | 2013 | 2012 | 2011 |
Selected Per-Share Data | | | | | |
Net asset value, beginning of period | $ 59.27 | $ 56.53 | $ 52.89 | $ 51.37 | $ 53.03 |
Income from Investment Operations | | | | | |
Net investment income (loss) C | .05 | (.01) | .18 | .17 | (.11) |
Net realized and unrealized gain (loss) | (7.88) | 3.07 | 3.60 | 1.49 | (1.14) |
Total from investment operations | (7.83) | 3.06 | 3.78 | 1.66 | (1.25) |
Distributions from net investment income | - | - | (.14) | - | (.01) |
Distributions from net realized gain | (7.22) | (.32) | - | (.14) | (.41) |
Total distributions | (7.22) | (.32) | (.14) | (.14) | (.42) |
Redemption fees added to paid in capitalC | -G | -G | -G | -G | .01 |
Net asset value, end of period | $ 44.22 | $ 59.27 | $ 56.53 | $ 52.89 | $ 51.37 |
Total ReturnA, B | (14.99)% | 5.45% | 7.17% | 3.25% | (2.41)% |
Ratios to Average Net AssetsD, F | | | | | |
Expenses before reductions | 2.22% | 2.09% | 1.96% | 1.85% | 1.91% |
Expenses net of fee waivers, if any | 2.22% | 2.09% | 1.96% | 1.85% | 1.91% |
Expenses net of all reductions | 2.22% | 2.09% | 1.95% | 1.85% | 1.91% |
Net investment income (loss) | .11% | (.01)% | .34% | .34% | (.20)% |
Supplemental Data | | | | | |
Net assets, end of period (000 omitted) | $ 2,678 | $ 6,290 | $ 7,737 | $ 9,804 | $ 11,866 |
Portfolio turnover rateE | 24% | 85% | 64% | 86% | 104% |
A Total returns would have been lower if certain expenses had not been reduced during the applicable periods shown. B Total returns do not include the effect of the contingent deferred sales charge. C Calculated based on average shares outstanding during the period. D Fees and expenses of any underlying Fidelity Central Funds are not included in the Fund's expense ratio. The Fund indirectly bears its proportionate share of the expenses of any underlying Fidelity Central Funds. E Amount does not include the portfolio activity of any underlying Fidelity Central Funds. F Expense ratios reflect operating expenses of the class. Expenses before reductions do not reflect amounts reimbursed by the investment adviser or reductions from brokerage service arrangements or reductions from other expense offset arrangements and do not represent the amount paid by the class during periods when reimbursements or reductions occur. Expenses net of fee waivers reflect expenses after reimbursement by the investment adviser but prior to reductions from brokerage service arrangements or other expense offset arrangements. Expenses net of all reductions represent the net expenses paid by the class. G Amount represents less than $.005 per share. |
Financial Highlights - Fidelity Canada Fund Class C
Years ended October 31, | 2015 | 2014 | 2013 | 2012 | 2011 |
Selected Per-Share Data | | | | | |
Net asset value, beginning of period | $ 59.04 | $ 56.27 | $ 52.61 | $ 51.19 | $ 52.87 |
Income from Investment Operations | | | | | |
Net investment income (loss) C | .07 | .02 | .20 | .19 | (.08) |
Net realized and unrealized gain (loss) | (7.85) | 3.07 | 3.58 | 1.46 | (1.14) |
Total from investment operations | (7.78) | 3.09 | 3.78 | 1.65 | (1.22) |
Distributions from net investment income | (.02) | - | (.12) | - | (.03) |
Distributions from net realized gain | (7.22) | (.32) | - | (.23) | (.44) |
Total distributions | (7.24) | (.32) | (.12) | (.23) | (.47) |
Redemption fees added to paid in capitalC | -G | -G | -G | -G | .01 |
Net asset value, end of period | $ 44.02 | $ 59.04 | $ 56.27 | $ 52.61 | $ 51.19 |
Total ReturnA, B | (14.96)% | 5.53% | 7.21% | 3.26% | (2.36)% |
Ratios to Average Net AssetsD, F | | | | | |
Expenses before reductions | 2.19% | 2.03% | 1.93% | 1.82% | 1.86% |
Expenses net of fee waivers, if any | 2.19% | 2.03% | 1.92% | 1.82% | 1.86% |
Expenses net of all reductions | 2.18% | 2.03% | 1.92% | 1.82% | 1.86% |
Net investment income (loss) | .14% | .04% | .37% | .37% | (.15)% |
Supplemental Data | | | | | |
Net assets, end of period (000 omitted) | $ 21,610 | $ 38,749 | $ 46,040 | $ 66,500 | $ 87,990 |
Portfolio turnover rateE | 24% | 85% | 64% | 86% | 104% |
A Total returns would have been lower if certain expenses had not been reduced during the applicable periods shown. B Total returns do not include the effect of the contingent deferred sales charge. C Calculated based on average shares outstanding during the period. D Fees and expenses of any underlying Fidelity Central Funds are not included in the Fund's expense ratio. The Fund indirectly bears its proportionate share of the expenses of any underlying Fidelity Central Funds. E Amount does not include the portfolio activity of any underlying Fidelity Central Funds. F Expense ratios reflect operating expenses of the class. Expenses before reductions do not reflect amounts reimbursed by the investment adviser or reductions from brokerage service arrangements or reductions from other expense offset arrangements and do not represent the amount paid by the class during periods when reimbursements or reductions occur. Expenses net of fee waivers reflect expenses after reimbursement by the investment adviser but prior to reductions from brokerage service arrangements or other expense offset arrangements. Expenses net of all reductions represent the net expenses paid by the class. G Amount represents less than $.005 per share. |
See accompanying notes which are an integral part of the financial statements.
Annual Report
Financial Highlights - Fidelity Canada Fund
Years ended October 31, | 2015 | 2014 | 2013 | 2012 | 2011 |
Selected Per-Share Data | | | | | |
Net asset value, beginning of period | $ 60.95 | $ 57.72 | $ 54.05 | $ 52.59 | $ 54.14 |
Income from Investment Operations | | | | | |
Net investment income (loss) B | .60 | .66 | .77 | .73 | .52 |
Net realized and unrealized gain (loss) | (8.09) | 3.13 | 3.66 | 1.51 | (1.18) |
Total from investment operations | (7.49) | 3.79 | 4.43 | 2.24 | (.66) |
Distributions from net investment income | (.69) | (.24) | (.76) | (.49) | (.46) |
Distributions from net realized gain | (7.22) | (.32) | - | (.29) | (.44) |
Total distributions | (7.91) | (.56) | (.76) | (.78) | (.90) |
Redemption fees added to paid in capitalB | -F | -F | -F | -F | .01 |
Net asset value, end of period | $ 45.55 | $ 60.95 | $ 57.72 | $ 54.05 | $ 52.59 |
Total ReturnA | (14.08)% | 6.64% | 8.32% | 4.36% | (1.33)% |
Ratios to Average Net AssetsC, E | | | | | |
Expenses before reductions | 1.15% | .98% | .87% | .77% | .82% |
Expenses net of fee waivers, if any | 1.15% | .98% | .87% | .77% | .82% |
Expenses net of all reductions | 1.14% | .98% | .86% | .77% | .82% |
Net investment income (loss) | 1.18% | 1.09% | 1.42% | 1.42% | .90% |
Supplemental Data | | | | | |
Net assets, end of period (000 omitted) | $ 1,279,488 | $ 2,057,843 | $ 2,262,380 | $ 2,992,597 | $ 3,778,765 |
Portfolio turnover rateD | 24% | 85% | 64% | 86% | 104% |
A Total returns would have been lower if certain expenses had not been reduced during the applicable periods shown. B Calculated based on average shares outstanding during the period. C Fees and expenses of any underlying Fidelity Central Funds are not included in the Fund's expense ratio. The Fund indirectly bears its proportionate share of the expenses of any underlying Fidelity Central Funds. D Amount does not include the portfolio activity of any underlying Fidelity Central Funds. E Expense ratios reflect operating expenses of the class. Expenses before reductions do not reflect amounts reimbursed by the investment adviser or reductions from brokerage service arrangements or reductions from other expense offset arrangements and do not represent the amount paid by the class during periods when reimbursements or reductions occur. Expenses net of fee waivers reflect expenses after reimbursement by the investment adviser but prior to reductions from brokerage service arrangements or other expense offset arrangements. Expenses net of all reductions represent the net expenses paid by the class. F Amount represents less than $.005 per share. |
Financial Highlights - Fidelity Canada Fund Class I
Years ended October 31, | 2015 | 2014 | 2013 | 2012 | 2011 |
Selected Per-Share Data | | | | | |
Net asset value, beginning of period | $ 60.80 | $ 57.57 | $ 53.91 | $ 52.44 | $ 54.02 |
Income from Investment Operations | | | | | |
Net investment income (loss) B | .61 | .65 | .78 | .74 | .51 |
Net realized and unrealized gain (loss) | (8.07) | 3.12 | 3.64 | 1.50 | (1.18) |
Total from investment operations | (7.46) | 3.77 | 4.42 | 2.24 | (.67) |
Distributions from net investment income | (.68) | (.22) | (.76) | (.48) | (.48) |
Distributions from net realized gain | (7.22) | (.32) | - | (.29) | (.44) |
Total distributions | (7.90) | (.54) | (.76) | (.77) | (.92) |
Redemption fees added to paid in capitalB | -F | -F | -F | -F | .01 |
Net asset value, end of period | $ 45.44 | $ 60.80 | $ 57.57 | $ 53.91 | $ 52.44 |
Total ReturnA | (14.05)% | 6.62% | 8.34% | 4.38% | (1.35)% |
Ratios to Average Net AssetsC, E | | | | | |
Expenses before reductions | 1.13% | 1.00% | .86% | .76% | .82% |
Expenses net of fee waivers, if any | 1.12% | 1.00% | .86% | .76% | .82% |
Expenses net of all reductions | 1.12% | 1.00% | .85% | .76% | .82% |
Net investment income (loss) | 1.21% | 1.08% | 1.43% | 1.42% | .89% |
Supplemental Data | | | | | |
Net assets, end of period (000 omitted) | $ 14,846 | $ 30,165 | $ 30,831 | $ 59,245 | $ 68,112 |
Portfolio turnover rateD | 24% | 85% | 64% | 86% | 104% |
A Total returns would have been lower if certain expenses had not been reduced during the applicable periods shown. B Calculated based on average shares outstanding during the period. C Fees and expenses of any underlying Fidelity Central Funds are not included in the Fund's expense ratio. The Fund indirectly bears its proportionate share of the expenses of any underlying Fidelity Central Funds. D Amount does not include the portfolio activity of any underlying Fidelity Central Funds. E Expense ratios reflect operating expenses of the class. Expenses before reductions do not reflect amounts reimbursed by the investment adviser or reductions from brokerage service arrangements or reductions from other expense offset arrangements and do not represent the amount paid by the class during periods when reimbursements or reductions occur. Expenses net of fee waivers reflect expenses after reimbursement by the investment adviser but prior to reductions from brokerage service arrangements or other expense offset arrangements. Expenses net of all reductions represent the net expenses paid by the class. F Amount represents less than $.005 per share. |
See accompanying notes which are an integral part of the financial statements.
Annual Report
For the period ended October 31, 2015
1. Organization.
Fidelity Canada Fund (the Fund) is a fund of Fidelity Investment Trust (the Trust) and is authorized to issue an unlimited number of shares. The Trust is registered under the Investment Company Act of 1940, as amended (the 1940 Act), as an open-end management investment company organized as a Massachusetts business trust. The Fund offers Class A, Class T, Class C, Canada and Class I (formerly Institutional Class) shares, each of which, along with Class B shares, has equal rights as to assets and voting privileges. Class B shares are closed to new accounts and additional purchases, except for exchanges and reinvestments. Each class has exclusive voting rights with respect to matters that affect that class. Class B shares will automatically convert to Class A shares after a holding period of seven years from the initial date of purchase.
2. Investments in Fidelity Central Funds.
The Fund invests in Fidelity Central Funds, which are open-end investment companies generally available only to other investment companies and accounts managed by the investment adviser and its affiliates. The Fund's Schedule of Investments lists each of the Fidelity Central Funds held as of period end, if any, as an investment of the Fund, but does not include the underlying holdings of each Fidelity Central Fund. As an Investing Fund, the Fund indirectly bears its proportionate share of the expenses of the underlying Fidelity Central Funds.
The Money Market Central Funds seek preservation of capital and current income and are managed by Fidelity Investments Money Management, Inc. (FIMM), an affiliate of the investment adviser. Annualized expenses of the Money Market Central Funds as of their most recent shareholder report date are less than .005%.
A complete unaudited list of holdings for each Fidelity Central Fund is available upon request or at the Securities and Exchange Commission (the SEC) website at www.sec.gov. In addition, the financial statements of the Fidelity Central Funds, which are not covered by the Fund's Report of Independent Registered Public Accounting Firm, are available on the SEC website or upon request.
3. Significant Accounting Policies.
The financial statements have been prepared in conformity with accounting principles generally accepted in the United States of America (GAAP), which require management to make certain estimates and assumptions at the date of the financial statements. Actual results could differ from those estimates. Subsequent events, if any, through the date that the financial statements were issued have been evaluated in the preparation of the financial statements. The following summarizes the significant accounting policies of the Fund:
Investment Valuation. Investments are valued as of 4:00 p.m. Eastern time on the last calendar day of the period. The Board of Trustees (the Board) has delegated the day to day responsibility for the valuation of the Fund's investments to the Fidelity Management & Research Company (FMR) Fair Value Committee (the Committee). In accordance with valuation policies and procedures approved by the Board, the Fund attempts to obtain prices from one or more third party pricing vendors or brokers to value its investments. When current market prices, quotations or currency exchange rates are not readily available or reliable, investments will be fair valued in good faith by the Committee, in accordance with procedures adopted by the Board. Factors used in determining fair value vary by investment type and may include market or investment specific events. The frequency with which these procedures are used cannot be predicted and they may be utilized to a significant extent. The Committee oversees the Fund's valuation policies and procedures and reports to the Board on the Committee's activities and fair value determinations. The Board monitors the appropriateness of the procedures used in valuing the Fund's investments and ratifies the fair value determinations of the Committee.
The Fund categorizes the inputs to valuation techniques used to value its investments into a disclosure hierarchy consisting of three levels as shown below:
Level 1 - quoted prices in active markets for identical investments
Level 2 - other significant observable inputs (including quoted prices for similar investments, interest rates, prepayment speeds, etc.)
Level 3 - unobservable inputs (including the Fund's own assumptions based on the best information available)
Valuation techniques used to value the Fund's investments by major category are as follows:
Equity securities, including restricted securities, for which market quotations are readily available, are valued at the last reported sale price or official closing price as reported by a third party pricing vendor on the primary market or exchange on which they are traded and are categorized as Level 1 in the hierarchy. In the event there were no sales during the day or closing prices are not available, securities are valued at the last quoted bid price or may be valued using the last available price and are generally categorized as Level 2 in the hierarchy. For foreign equity securities, when market or security specific events arise, comparisons to the valuation of American Depositary Receipts (ADRs), futures contracts, Exchange-Traded Funds (ETFs) and certain indexes as well as quoted prices for similar securities may be used and would be categorized as Level 2 in the hierarchy. Utilizing these techniques may result in transfers between Level 1 and Level 2. For equity securities, including restricted securities, where observable inputs are limited, assumptions about market activity and risk are used and these securities may be categorized as Level 3 in the hierarchy.
Annual Report
3. Significant Accounting Policies - continued
Investment Valuation - continued
Investments in open-end mutual funds, including the Fidelity Central Funds, are valued at their closing net asset value (NAV) each business day and are categorized as Level 1 in the hierarchy.
Changes in valuation techniques may result in transfers in or out of an assigned level within the disclosure hierarchy. The aggregate value of investments by input level as of October 31, 2015 is included at the end of the Fund's Schedule of Investments.
Foreign Currency. The Fund may use foreign currency contracts to facilitate transactions in foreign-denominated securities. Gains and losses from these transactions may arise from changes in the value of the foreign currency or if the counterparties do not perform under the contracts' terms.
Foreign-denominated assets, including investment securities, and liabilities are translated into U.S. dollars at the exchange rates at period end. Purchases and sales of investment securities, income and dividends received and expenses denominated in foreign currencies are translated into U.S. dollars at the exchange rate in effect on the transaction date.
The effects of exchange rate fluctuations on investments are included with the net realized and unrealized gain (loss) on investment securities. Other foreign currency transactions resulting in realized and unrealized gain (loss) are disclosed separately.
Investment Transactions and Income. For financial reporting purposes, the Fund's investment holdings and NAV include trades executed through the end of the last business day of the period. The NAV per share for processing shareholder transactions is calculated as of the close of business of the New York Stock Exchange (NYSE), normally 4:00 p.m. Eastern time and includes trades executed through the end of the prior business day. Gains and losses on securities sold are determined on the basis of identified cost and may include proceeds received from litigation. Dividend income is recorded on the ex-dividend date, except for certain dividends from foreign securities where the ex-dividend date may have passed, which are recorded as soon as the Fund is informed of the ex-dividend date. Non-cash dividends included in dividend income, if any, are recorded at the fair market value of the securities received. Income and capital gain distributions from Fidelity Central Funds, if any, are recorded on the ex-dividend date. Distributions received on securities that represent a return of capital or capital gain are recorded as a reduction of cost of investments and/or as a realized gain. Subsequent to ex-dividend date the Fund determines the components of these distributions, based upon receipt of tax filings or other correspondence relating to the underlying investment. Interest income is accrued as earned and includes coupon interest and amortization of premium and accretion of discount on debt securities as applicable. Investment income is recorded net of foreign taxes withheld where recovery of such taxes is uncertain.
Class Allocations and Expenses. Investment income, realized and unrealized capital gains and losses, common expenses of the Fund, and certain fund-level expense reductions, if any, are allocated daily on a pro-rata basis to each class based on the relative net assets of each class to the total net assets of the Fund. Each class differs with respect to transfer agent and distribution and service plan fees incurred. Certain expense reductions may also differ by class. For the reporting period, the allocated portion of income and expenses to each class as a percent of its average net assets may vary due to the timing of recording these transactions in relation to fluctuating net assets of the classes. Expenses directly attributable to a fund are charged to that fund. Expenses attributable to more than one fund are allocated among the respective funds on the basis of relative net assets or other appropriate methods. Expense estimates are accrued in the period to which they relate and adjustments are made when actual amounts are known.
Income Tax Information and Distributions to Shareholders. Each year, the Fund intends to qualify as a regulated investment company under Subchapter M of the Internal Revenue Code, including distributing substantially all of its taxable income and realized gains. As a result, no provision for U.S. Federal income taxes is required. As of October 31, 2015, the Fund did not have any unrecognized tax benefits in the financial statements; nor is the Fund aware of any tax positions for which it is reasonably possible that the total amounts of unrecognized tax benefits will significantly change in the next twelve months. The Fund files a U.S. federal tax return, in addition to state and local tax returns as required. The Fund's federal income tax returns are subject to examination by the Internal Revenue Service (IRS) for a period of three fiscal years after they are filed. State and local tax returns may be subject to examination for an additional fiscal year depending on the jurisdiction. Foreign taxes are provided for based on the Fund's understanding of the tax rules and rates that exist in the foreign markets in which it invests.
Distributions are declared and recorded on the ex-dividend date. Income dividends and capital gain distributions are declared separately for each class. Income and capital gain distributions are determined in accordance with income tax regulations, which may differ from GAAP. In addition, the Fund claimed a portion of the payment made to redeeming shareholders as a distribution for income tax purposes.
Capital accounts within the financial statements are adjusted for permanent book-tax differences. These adjustments have no impact on net assets or the results of operations. Capital accounts are not adjusted for temporary book-tax differences which will reverse in a subsequent period.
Book-tax differences are primarily due to foreign currency transactions, passive foreign investment companies (PFIC), deferred trustees compensation and losses deferred due to wash sales.
Annual Report
Notes to Financial Statements - continued
3. Significant Accounting Policies - continued
Income Tax Information and Distributions to Shareholders - continued
The federal tax cost of investment securities and unrealized appreciation (depreciation) as of period end were as follows:
Gross unrealized appreciation | $ 287,975,691 |
Gross unrealized depreciation | (151,197,499) |
Net unrealized appreciation (depreciation) on securities | $ 136,778,192 |
Tax Cost | $ 1,283,918,896 |
The tax-based components of distributable earnings as of period end were as follows:
Undistributed ordinary income | $ 14,466,211 |
Undistributed long-term capital gain | $ 1,887,468 |
Net unrealized appreciation (depreciation) on securities and other investments | $ 136,769,940 |
The tax character of distributions paid was as follows:
| October 31, 2015 | October 31, 2014 |
Ordinary Income | $ 24,029,674 | $ 9,338,915 |
Long-term Capital Gains | 262,730,704 | 13,503,099 |
Total | $ 286,760,378 | $ 22,842,014 |
Short-Term Trading (Redemption) Fees. Shares held by investors in the Fund less than 90 days may have been subject to a redemption fee equal to 1.50% of the NAV of shares redeemed. All redemption fees, which reduce the proceeds of the shareholder redemption, are retained by the Fund and accounted for as an addition to paid in capital.
4. Purchases and Sales of Investments.
Purchases and sales of securities, other than short-term securities, aggregated $424,331,275 and $975,977,104, respectively.
5. Fees and Other Transactions with Affiliates.
Management Fee. Fidelity Management & Research Company (the investment adviser) and its affiliates provide the Fund with investment management related services for which the Fund pays a monthly management fee. The management fee is the sum of an individual fund fee rate that is based on an annual rate of .45% of the Fund's average net assets and an annualized group fee rate that averaged .25% during the period. The group fee rate is based upon the average net assets of all the mutual funds advised by the investment adviser, including any mutual funds previously advised by the investment adviser that are currently advised by Fidelity SelectCo, LLC, an affiliate of the investment adviser. The group fee rate decreases as assets under management increase and increases as assets under management decrease. In addition, the management fee is subject to a performance adjustment (up to a maximum of ± .20% of the Fund's average net assets over a 36 month performance period). The upward or downward adjustment to the management fee is based on the relative investment performance of Canada as compared to its benchmark index, the S&P/TSX Composite Index, over the same 36 month performance period. For the reporting period, the total annual management fee rate, including the performance adjustment, was .88% of the Fund's average net assets. The performance adjustment included in the management fee rate may be higher or lower than the maximum performance adjustment rate due to the difference between the average net assets for the reporting and performance periods.
Distribution and Service Plan Fees. In accordance with Rule 12b-1 of the 1940 Act, the Fund has adopted separate Distribution and Service Plans for each class of shares. Certain classes pay Fidelity Distributors Corporation (FDC), an affiliate of the investment adviser, separate Distribution and Service Fees, each of which is based on an annual percentage of each class' average net assets. In addition, FDC may pay financial intermediaries for selling shares of the Fund and providing shareholder support services. For the period, the Distribution and Service Fee rates, total fees and amounts retained by FDC were as follows:
| Distribution
Fee | Service
Fee | Total Fees | Retained
by FDC |
Class A | -% | .25% | $ 191,960 | $ 4,821 |
Class T | .25% | .25% | 83,690 | 504 |
Class B | .75% | .25% | 44,747 | 33,560 |
Class C | .75% | .25% | 301,847 | 11,953 |
| | | $ 622,244 | $ 50,838 |
Annual Report
5. Fees and Other Transactions with Affiliates - continued
Sales Load. FDC may receive a front-end sales charge of up to 5.75% for selling Class A shares and 3.50% for selling Class T shares, some of which is paid to financial intermediaries for selling shares of the Fund. Depending on the holding period, FDC may receive contingent deferred sales charges levied on Class A, Class T, Class B, and Class C redemptions. The deferred sales charges range from 5.00% to 1.00% for Class B shares, 1.00% for Class C shares, 1.00% for certain purchases of Class A shares and .25% for certain purchases of Class T shares.
For the period, sales charge amounts retained by FDC were as follows:
| Retained
by FDC |
Class A | $ 15,562 |
Class T | 3,236 |
Class BA | 7,910 |
Class C A | 1,549 |
| $ 28,257 |
A When Class B and Class C shares are initially sold, FDC pays commissions from its own resources to financial intermediaries through which the sales are made.
Transfer Agent Fees. Fidelity Investments Institutional Operations Company, Inc., (FIIOC), an affiliate of the investment adviser, is the transfer, dividend disbursing and shareholder servicing agent for each class of the Fund. FIIOC receives account fees and asset-based fees that vary according to the account size and type of account of the shareholders of the respective classes of the Fund. FIIOC pays for typesetting, printing and mailing of shareholder reports, except proxy statements.
For the period, transfer agent fees for each class were as follows:
| Amount | % of
Class-Level Average
Net Assets |
Class A | $ 186,677 | .24 |
Class T | 51,332 | .31 |
Class B | 12,380 | .28 |
Class C | 73,747 | .25 |
Canada | 3,470,909 | .21 |
Class I | 40,465 | .19 |
| $ 3,835,510 | |
Accounting and Security Lending Fees. Fidelity Service Company, Inc. (FSC), an affiliate of the investment adviser, maintains the Fund's accounting records. The accounting fee is based on the level of average net assets for each month. Under a separate contract, FSC administers the security lending program. The security lending fee is based on the number and duration of lending transactions.
Brokerage Commissions. The fund placed a portion of its portfolio transactions with brokerage firms which are affiliates of the investment adviser. Brokerage commissions are included in net realized gain (loss) and change in net unrealized appreciation (depreciation) in the Statement of Operations. The commissions paid to these affiliated firms were $680 for the period.
6. Committed Line of Credit.
The Fund participates with other funds managed by the investment adviser or an affiliate in a $4.25 billion credit facility (the "line of credit") to be utilized for temporary or emergency purposes to fund shareholder redemptions or for other short-term liquidity purposes. The Fund has agreed to pay commitment fees on its pro-rata portion of the line of credit, which amounted to $2,735 and is reflected in Miscellaneous expenses on the Statement of Operations. During the period, the Fund did not borrow on this line of credit.
Annual Report
Notes to Financial Statements - continued
7. Security Lending.
The Fund lends portfolio securities through a lending agent from time to time in order to earn additional income. For equity securities, a lending agent is used and may loan securities to certain qualified borrowers, including Fidelity Capital Markets (FCM), a broker-dealer affiliated with the Fund. On the settlement date of the loan, the Fund receives collateral (in the form of U.S. Treasury obligations, letters of credit and/or cash) against the loaned securities and maintains collateral in an amount not less than 100% of the market value of the loaned securities during the period of the loan. The market value of the loaned securities is determined at the close of business of the Fund and any additional required collateral is delivered to the Fund on the next business day. The Fund or borrower may terminate the loan at any time, and if the borrower defaults on its obligation to return the securities loaned because of insolvency or other reasons, the Fund may apply collateral received from the borrower against the obligation. The Fund may experience delays and costs in recovering the securities loaned. Any cash collateral received is invested in the Fidelity Securities Lending Cash Central Fund. The value of loaned securities and cash collateral at period end are disclosed on the Fund's Statement of Assets and Liabilities. The value of securities loaned to FCM at period end was $920,121. Security lending income represents the income earned on investing cash collateral, less rebates paid to borrowers and any lending agent fees associated with the loan, plus any premium payments received for lending certain types of securities. Security lending income is presented in the Statement of Operations as a component of income from Fidelity Central Funds, and includes $33,265 from securities loaned to FCM.
8. Expense Reductions.
Commissions paid to certain brokers with whom the investment adviser, or its affiliates, places trades on behalf of the Fund include an amount in addition to trade execution, which may be rebated back to the Fund to offset certain expenses. This amount totaled $30,896 for the period.
In addition, during the period the investment adviser reimbursed and/or waived a portion of fund-level operating expenses in the amount of $6,891 and a portion of class-level operating expenses as follows:
| Amount |
Class A | $ 2,472 |
Class T | 46 |
Class B | 30 |
Class C | 993 |
Canada | 65,257 |
Class I | 724 |
| $ 69,522 |
9. Distributions to Shareholders.
Distributions to shareholders of each class were as follows:
Years ended October 31, | 2015 | 2014 |
From net investment income | | |
Class A | $ 783,478 | $ 53,142 |
Class T | 106,245 | - |
Class C | 12,920 | - |
Canada | 22,800,214 | 9,173,811 |
Class I | 326,817 | 111,962 |
Total | $ 24,029,674 | $ 9,338,915 |
From net realized gain | | |
Class A | $ 11,358,847 | $ 629,831 |
Class T | 2,548,483 | 130,152 |
Class B | 742,098 | 42,217 |
Class C | 4,664,328 | 256,584 |
Canada | 239,967,215 | 12,282,929 |
Class I | 3,449,733 | 161,386 |
Total | $ 262,730,704 | $ 13,503,099 |
Annual Report
10. Share Transactions.
Share transactions for each class were as follows and may contain automatic conversions between classes or exchanges between funds:
| Shares | Dollars |
Years ended October 31, | 2015 | 2014 | 2015 | 2014 |
Class A | | | | |
Shares sold | 153,407 | 144,381 | $ 8,099,168 | $ 8,740,780 |
Reinvestment of distributions | 200,582 | 9,784 | 10,552,616 | 552,980 |
Shares redeemed | (634,705) | (620,817) | (31,737,294) | (36,791,904) |
Net increase (decrease) | (280,716) | (466,652) | $ (13,085,510) | $ (27,498,144) |
Class T | | | | |
Shares sold | 21,812 | 29,501 | $ 1,102,045 | $ 1,790,320 |
Reinvestment of distributions | 49,518 | 2,264 | 2,597,730 | 127,592 |
Shares redeemed | (151,491) | (82,268) | (7,597,599) | (4,830,983) |
Net increase (decrease) | (80,161) | (50,503) | $ (3,897,824) | $ (2,913,071) |
Class B | | | | |
Shares sold | 1,663 | 547 | $ 85,823 | $ 32,504 |
Reinvestment of distributions | 12,380 | 630 | 641,184 | 35,107 |
Shares redeemed | (59,611) | (31,942) | (2,906,257) | (1,874,606) |
Net increase (decrease) | (45,568) | (30,765) | $ (2,179,250) | $ (1,806,995) |
Class C | | | | |
Shares sold | 42,631 | 50,749 | $ 2,146,853 | $ 2,984,240 |
Reinvestment of distributions | 75,003 | 3,715 | 3,864,885 | 206,074 |
Shares redeemed | (283,087) | (216,291) | (13,692,762) | (12,480,545) |
Net increase (decrease) | (165,453) | (161,827) | $ (7,681,024) | $ (9,290,231) |
Canada | | | | |
Shares sold | 1,250,697 | 1,968,387 | $ 63,450,179 | $ 119,959,708 |
Reinvestment of distributions | 4,716,591 | 358,786 | 249,177,482 | 20,353,959 |
Shares redeemed | (11,643,757) | (7,758,261) | (581,614,067) | (462,389,717) |
Net increase (decrease) | (5,676,469) | (5,431,088) | $ (268,986,406) | $ (322,076,050) |
Class I | | | | |
Shares sold | 66,679 | 331,645 | $ 3,430,310 | $ 20,156,294 |
Reinvestment of distributions | 49,883 | 3,804 | 2,628,352 | 215,319 |
Shares redeemed | (285,976) | (374,817) | (14,385,529) | (22,474,114) |
Net increase (decrease) | (169,414) | (39,368) | $ (8,326,867) | $ (2,102,501) |
11. Other.
The Fund's organizational documents provide former and current trustees and officers with a limited indemnification against liabilities arising in connection with the performance of their duties to the Fund. In the normal course of business, the Fund may also enter into contracts that provide general indemnifications. The Fund's maximum exposure under these arrangements is unknown as this would be dependent on future claims that may be made against the Fund. The risk of material loss from such claims is considered remote.
Annual Report
To the Trustees of Fidelity Investment Trust and the Shareholders of Fidelity Canada Fund:
In our opinion, the accompanying statement of assets and liabilities, including the schedule of investments, and the related statements of operations and of changes in net assets and the financial highlights present fairly, in all material respects, the financial position of Fidelity Canada Fund (a fund of Fidelity Investment Trust) at October 31, 2015, the results of its operations for the year then ended, the changes in its net assets for each of the two years in the period then ended and the financial highlights for each of the five years in the period then ended, in conformity with accounting principles generally accepted in the United States of America. These financial statements and financial highlights (hereafter referred to as "financial statements") are the responsibility of the Fidelity Canada Fund's management. Our responsibility is to express an opinion on these financial statements based on our audits. We conducted our audits of these financial statements in accordance with the standards of the Public Company Accounting Oversight Board (United States). Those standards require that we plan and perform the audit to obtain reasonable assurance about whether the financial statements are free of material misstatement. An audit includes examining, on a test basis, evidence supporting the amounts and disclosures in the financial statements, assessing the accounting principles used and significant estimates made by management, and evaluating the overall financial statement presentation. We believe that our audits, which included confirmation of securities at October 31, 2015 by correspondence with the custodian and brokers, provide a reasonable basis for our opinion.
PricewaterhouseCoopers LLP
Boston, Massachusetts
December 22, 2015
Annual Report
The Trustees, Member of the Advisory Board, and officers of the trust and fund, as applicable, are listed below. The Board of Trustees governs the fund and is responsible for protecting the interests of shareholders. The Trustees are experienced executives who meet periodically throughout the year to oversee the fund's activities, review contractual arrangements with companies that provide services to the fund, oversee management of the risks associated with such activities and contractual arrangements, and review the fund's performance. Each of the Trustees oversees 170 funds.
The Trustees hold office without limit in time except that (a) any Trustee may resign; (b) any Trustee may be removed by written instrument, signed by at least two-thirds of the number of Trustees prior to such removal; (c) any Trustee who requests to be retired or who has become incapacitated by illness or injury may be retired by written instrument signed by a majority of the other Trustees; and (d) any Trustee may be removed at any special meeting of shareholders by a two-thirds vote of the outstanding voting securities of the trust. Each Trustee who is not an interested person (as defined in the 1940 Act) of the trust and the fund (Independent Trustee), shall retire not later than the last day of the calendar year in which his or her 75th birthday occurs. The Independent Trustees may waive this mandatory retirement age policy with respect to individual Trustees. The officers and Advisory Board Member hold office without limit in time, except that any officer and Advisory Board Member may resign or may be removed by a vote of a majority of the Trustees at any regular meeting or any special meeting of the Trustees. Except as indicated, each individual has held the office shown or other offices in the same company for the past five years.
Experience, Skills, Attributes, and Qualifications of the Fund's Trustees. The Governance and Nominating Committee has adopted a statement of policy that describes the experience, qualifications, attributes, and skills that are necessary and desirable for potential Independent Trustee candidates (Statement of Policy). The Board believes that each Trustee satisfied at the time he or she was initially elected or appointed a Trustee, and continues to satisfy, the standards contemplated by the Statement of Policy. The Governance and Nominating Committee also engages professional search firms to help identify potential Independent Trustee candidates who have the experience, qualifications, attributes, and skills consistent with the Statement of Policy. From time to time, additional criteria based on the composition and skills of the current Independent Trustees, as well as experience or skills that may be appropriate in light of future changes to board composition, business conditions, and regulatory or other developments, have also been considered by the professional search firms and the Governance and Nominating Committee. In addition, the Board takes into account the Trustees' commitment and participation in Board and committee meetings, as well as their leadership of standing and ad hoc committees throughout their tenure.
In determining that a particular Trustee was and continues to be qualified to serve as a Trustee, the Board has considered a variety of criteria, none of which, in isolation, was controlling. The Board believes that, collectively, the Trustees have balanced and diverse experience, qualifications, attributes, and skills, which allow the Board to operate effectively in governing the fund and protecting the interests of shareholders. Information about the specific experience, skills, attributes, and qualifications of each Trustee, which in each case led to the Board's conclusion that the Trustee should serve (or continue to serve) as a trustee of the fund, is provided below.
Board Structure and Oversight Function. James C. Curvey is an interested person (as defined in the 1940 Act) and currently serves as Chairman. The Trustees have determined that an interested Chairman is appropriate and benefits shareholders because an interested Chairman has a personal and professional stake in the quality and continuity of services provided to the fund. Independent Trustees exercise their informed business judgment to appoint an individual of their choosing to serve as Chairman, regardless of whether the Trustee happens to be independent or a member of management. The Independent Trustees have determined that they can act independently and effectively without having an Independent Trustee serve as Chairman and that a key structural component for assuring that they are in a position to do so is for the Independent Trustees to constitute a substantial majority for the Board. The Independent Trustees also regularly meet in executive session. Ned C. Lautenbach serves as Chairman of the Independent Trustees and as such (i) acts as a liaison between the Independent Trustees and management with respect to matters important to the Independent Trustees and (ii) with management prepares agendas for Board meetings.
Fidelity funds are overseen by different Boards of Trustees. The fund's Board oversees Fidelity's high income and certain equity funds, and other Boards oversee Fidelity's investment-grade bond, money market, asset allocation, and sector funds. The asset allocation funds may invest in Fidelity funds overseen by the fund's Board. The use of separate Boards, each with its own committee structure, allows the Trustees of each group of Fidelity funds to focus on the unique issues of the funds they oversee, including common research, investment, and operational issues. On occasion, the separate Boards establish joint committees to address issues of overlapping consequences for the Fidelity funds overseen by each Board.
The Trustees operate using a system of committees to facilitate the timely and efficient consideration of all matters of importance to the Trustees, the fund, and fund shareholders and to facilitate compliance with legal and regulatory requirements and oversight of the fund's activities and associated risks. The Board, acting through its committees, has charged FMR and its affiliates with (i) identifying events or circumstances the occurrence of which could have demonstrably adverse effects on the fund's business and/or reputation; (ii) implementing processes and controls to lessen the possibility that such events or circumstances occur or to mitigate the effects of such events or circumstances if they do occur; and (iii) creating and maintaining a system designed to evaluate continuously business and market conditions in order to facilitate the identification and implementation processes described in (i) and (ii) above. Because the day-to-day operations and activities of the fund are carried out by or through FMR, its affiliates and other service providers, the fund's exposure to risks is mitigated but not eliminated by the processes overseen by the Trustees. While each of the Board's committees has responsibility for overseeing different aspects of the fund's activities, oversight is exercised primarily through the Operations, Audit, and Compliance Committees. In addition, the Independent Trustees have worked with FMR to enhance the Board's oversight of investment and financial risks, legal and regulatory risks, technology risks, and operational risks, including the development of additional risk reporting to the Board. For example, a working group comprised of Independent Trustees and FMR has worked and continues to work to review the Fidelity funds' valuation-related activities, reporting and risk management. Appropriate personnel, including but not limited to the fund's Chief Compliance Officer (CCO), FMR's internal auditor, the independent accountants, the fund's Treasurer and portfolio management personnel, make periodic reports to the Board's committees, as appropriate, including an annual review of Fidelity's risk management program for the Fidelity funds. The responsibilities of each standing committee, including their oversight responsibilities, are described further under "Standing Committees of the Fund's Trustees."
Annual Report
Trustees and Officers - continued
The fund's Statement of Additional Information (SAI) includes more information about the Trustees. To request a free copy, call Fidelity at 1-877-208-0098.
Interested Trustees*:
Correspondence intended for each Trustee who is an interested person may be sent to Fidelity Investments, 245 Summer Street, Boston, Massachusetts 02210.
Name, Year of Birth; Principal Occupations and Other Relevant Experience+ |
James C. Curvey (1935) |
Year of Election or Appointment: 2007 Trustee Chairman of the Board of Trustees |
| Mr. Curvey also serves as Trustee of other Fidelity funds. Mr. Curvey is a Director of Fidelity Research & Analysis Co. (investment adviser firm, 2009-present), and Vice Chairman (2007-present) and Director of FMR LLC (diversified financial services company). In addition, Mr. Curvey serves as an Overseer for the Boston Symphony Orchestra and a member of the board of Artis-Naples, Naples, Florida, and as a Trustee for Brewster Academy, Wolfeboro, New Hampshire. Previously, Mr. Curvey served as a Director of Fidelity Investments Money Management, Inc. (investment adviser firm, 2009-2014) and a Director of FMR and FMR Co., Inc. (investment adviser firms, 2007-2014). |
Charles S. Morrison (1960) |
Year of Election or Appointment: 2014 Trustee |
| Mr. Morrison also serves as Trustee of other funds. He serves as a Director of Fidelity Investments Money Management, Inc. (FIMM) (investment adviser firm, 2014-present), Director of Fidelity SelectCo, LLC (investment adviser firm, 2014-present), President, Asset Management (2014-present), and is an employee of Fidelity Investments. Previously, Mr. Morrison served as Vice President of Fidelity's Fixed Income and Asset Allocation Funds (2012-2014), President, Fixed Income (2011-2014), Vice President of Fidelity's Money Market Funds (2005-2009), President, Money Market Group Leader of FMR (investment adviser firm, 2009), and Senior Vice President, Money Market Group of FMR (2004-2009). Mr. Morrison also served as Vice President of Fidelity's Bond Funds (2002-2005), certain Balanced Funds (2002-2005), and certain Asset Allocation Funds (2002-2007), and as Senior Vice President (2002-2005) of Fidelity's Bond Division. |
* Trustees have been determined to be "Interested Trustees" by virtue of, among other things, their affiliation with the trust or various entities under common control with FMR.
+ The information above includes each Trustee's principal occupation during the last five years and other information relating to the experience, attributes, and skills relevant to each Trustee's qualifications to serve as a Trustee, which led to the conclusion that each Trustee should serve as a Trustee for the fund.
Annual Report
Independent Trustees:
Correspondence intended for each Independent Trustee (that is, the Trustees other than the Interested Trustees) may be sent to Fidelity Investments, P.O. Box 55235, Boston, Massachusetts 02205-5235.
Name, Year of Birth; Principal Occupations and Other Relevant Experience+ |
Dennis J. Dirks (1948) |
Year of Election or Appointment: 2005 Trustee |
| Mr. Dirks also serves as Trustee of other Fidelity funds. Prior to his retirement in May 2003, Mr. Dirks was Chief Operating Officer and a member of the Board of The Depository Trust & Clearing Corporation (DTCC). He also served as President, Chief Operating Officer, and Board member of The Depository Trust Company (DTC) and President and Board member of the National Securities Clearing Corporation (NSCC). In addition, Mr. Dirks served as Chief Executive Officer and Board member of the Government Securities Clearing Corporation, Chief Executive Officer and Board member of the Mortgage-Backed Securities Clearing Corporation, as a Trustee and a member of the Finance Committee of Manhattan College (2005-2008), as a Trustee and a member of the Finance Committee of AHRC of Nassau County (2006-2008), and as a member of the Independent Directors Council (IDC) Governing Council (2010-2015). Mr. Dirks is a member of the Board of Directors for The Brookville Center for Children's Services, Inc. (2009-present). |
Alan J. Lacy (1953) |
Year of Election or Appointment: 2008 Trustee |
| Mr. Lacy also serves as Trustee of other Fidelity funds. Mr. Lacy serves as a member of the Board of Directors of Dave & Buster's Entertainment, Inc. (restaurant and entertainment complexes, 2010-present) and Bristol-Myers Squibb Company (global pharmaceuticals, 2008-present). In addition, Mr. Lacy served as Senior Adviser (2007-2014) of Oak Hill Capital Partners, L.P. (private equity) and also served as Chief Executive Officer (2000-2005) and Vice Chairman (2005-2006) of Sears Holdings Corporation and Sears, Roebuck and Co. (retail). Mr. Lacy is a member of the Board of Trustees of The National Parks Conservation Association (2006-present). Previously, Mr. Lacy served as Chairman of the Board of Trustees of the National Parks Conservation Association (2008-2011) and as a member of the Board of Directors for The Western Union Company (global money transfer, 2006-2011), The Hillman Companies, Inc. (hardware wholesalers, 2010-2014), and Earth Fare, Inc. (retail grocery, 2010-2014). |
Ned C. Lautenbach (1944) |
Year of Election or Appointment: 2000 Trustee Chairman of the Independent Trustees |
| Mr. Lautenbach also serves as Trustee of other Fidelity funds. Mr. Lautenbach currently serves as the Lead Director of the Eaton Corporation Board of Directors (diversified industrial, 1997-present). Mr. Lautenbach is Chairman of the Board of Directors of Artis-Naples in Naples, Florida (2012-present), a member of the Council on Foreign Relations (1994-present), and a member of the Board of Governors, State University System of Florida (2013-present). Previously, Mr. Lautenbach was a Partner/Advisory Partner at Clayton, Dubilier & Rice, LLC (private equity investment, 1998-2010), as well as a Director of Sony Corporation (2006-2007). |
Joseph Mauriello (1944) |
Year of Election or Appointment: 2008 Trustee |
| Mr. Mauriello also serves as Trustee of other Fidelity funds. Prior to his retirement in January 2006, Mr. Mauriello served in numerous senior management positions including Deputy Chairman and Chief Operating Officer (2004-2005), and Vice Chairman of Financial Services (2002-2004) of KPMG LLP US (professional services, 1965-2005). Mr. Mauriello currently serves as a member of the Board of Directors of XL Group plc. (global insurance and re-insurance, 2006-present) and the Independent Directors Council (IDC) Governing Council (2015-present). Previously, Mr. Mauriello served as a Director of the Hamilton Funds of the Bank of New York (2006-2007) and of Arcadia Resources Inc. (health care services and products, 2007-2012). |
Robert W. Selander (1950) |
Year of Election or Appointment: 2011 Trustee |
| Mr. Selander also serves as Trustee of other Fidelity funds. Mr. Selander serves as a Director of The Western Union Company (global money transfer, 2014-present). Previously, Mr. Selander served as a Member of the Advisory Board of other Fidelity funds (2011), and Executive Vice Chairman (2010), Chief Executive Officer (2009-2010), and President and Chief Executive Officer (1997-2009) of Mastercard, Inc. |
Cornelia M. Small (1944) |
Year of Election or Appointment: 2005 Trustee |
| Ms. Small also serves as Trustee of other Fidelity funds. Ms. Small is a member of the Board of Directors (2009-present) and Chair of the Investment Committee (2010-present) of the Teagle Foundation. Ms. Small also serves on the Investment Committee of the Berkshire Taconic Community Foundation (2008-present). Previously, Ms. Small served as Chairperson (2002-2008) and a member of the Investment Committee and Chairperson (2008-2012) and a member of the Board of Trustees of Smith College. In addition, Ms. Small served as Chief Investment Officer, Director of Global Equity Investments, and a member of the Board of Directors of Scudder, Stevens & Clark and Scudder Kemper Investments. |
William S. Stavropoulos (1939) |
Year of Election or Appointment: 2001 Trustee Vice Chairman of the Independent Trustees |
| Mr. Stavropoulos also serves as Trustee of other Fidelity funds. Mr. Stavropoulos serves as President and Founder of the Michigan Baseball Foundation, the Great Lakes Loons (2007-present). Mr. Stavropoulos is Chairman Emeritus of the Board of Directors of The Dow Chemical Company, where he previously served in numerous senior management positions, including President, CEO (1995-2000; 2002-2004), Chairman of the Executive Committee (2000-2006), and as a member of the Board of Directors (1990-2006). Currently, Mr. Stavropoulos is Chairman of the Board of Directors of Univar Inc. (global distributor of commodity and specialty chemicals), a Director of Teradata Corporation (data warehousing and technology solutions), and Maersk Inc. (industrial conglomerate), and a member of the Advisory Board for Metalmark Capital LLC (private equity investment, 2005-present). Mr. Stavropoulos is an operating advisor to Clayton, Dubilier & Rice, LLC (private equity investment). In addition, Mr. Stavropoulos is a member of the University of Notre Dame Advisory Council for the College of Science, a Trustee of the Rollin L. Gerstacker Foundation, and a Director of the Naples Philharmonic Center for the Arts. Previously, Mr. Stavropoulos served as a Director of Chemical Financial Corporation (bank holding company, 1993-2012) and Tyco International, Ltd. (multinational manufacturing and services, 2007-2012). |
David M. Thomas (1949) |
Year of Election or Appointment: 2008 Trustee |
| Mr. Thomas also serves as Trustee of other Fidelity funds. Mr. Thomas serves as Non-Executive Chairman of the Board of Directors of Fortune Brands Home and Security (home and security products, 2011-present), as a member of the Board of Directors (2004-present) and Presiding Director (2013-present) of Interpublic Group of Companies, Inc. (marketing communication), and as a member of the Board of Trustees of the University of Florida (2013-present). Previously, Mr. Thomas served as Executive Chairman (2005-2006) and Chairman and Chief Executive Officer (2000-2005) of IMS Health, Inc. (pharmaceutical and healthcare information solutions), and a Director of Fortune Brands, Inc. (consumer products, 2000-2011). |
+ The information above includes each Trustee's principal occupation during the last five years and other information relating to the experience, attributes, and skills relevant to each Trustee's qualifications to serve as a Trustee, which led to the conclusion that each Trustee should serve as a Trustee for the fund.
Advisory Board Member and Officers:
Correspondence intended for each officer and Peter S. Lynch may be sent to Fidelity Investments, 245 Summer Street, Boston, Massachusetts 02210. Officers appear below in alphabetical order.
Name, Year of Birth; Principal Occupation |
Peter S. Lynch (1944) |
Year of Election or Appointment: 2003 Member of the Advisory Board |
| Mr. Lynch also serves as Member of the Advisory Board of other Fidelity funds. Mr. Lynch is Vice Chairman and a Director of FMR (investment adviser firm) and FMR Co., Inc. (investment adviser firm). In addition, Mr. Lynch serves as a Trustee of Boston College and as the Chairman of the Inner-City Scholarship Fund. Previously, Mr. Lynch served on the Special Olympics International Board of Directors (1997-2006). |
Elizabeth Paige Baumann (1968) |
Year of Election or Appointment: 2012 Anti-Money Laundering (AML) Officer |
| Ms. Baumann also serves as AML Officer of other funds. She is Chief AML Officer of FMR LLC (diversified financial services company, 2012-present) and is an employee of Fidelity Investments. Previously, Ms. Baumann served as Vice President and Deputy Anti-Money Laundering Officer (2007-2012). |
Marc R. Bryant (1966) |
Year of Election or Appointment: 2015 Secretary and Chief Legal Officer (CLO) |
| Mr. Bryant also serves as Secretary and CLO of other funds. Mr. Bryant serves as CLO, Secretary, and Senior Vice President of Fidelity Management & Research Company (investment adviser firm, 2015-present) and FMR Co., Inc. (investment adviser firm, 2015-present); Secretary of Fidelity SelectCo, LLC (investment adviser firm, 2015-present) and Fidelity Investments Money Management, Inc. (investment adviser firm, 2015-present); and CLO of Fidelity Management & Research (Hong Kong) Limited (investment adviser firm, 2015-present). He is Senior Vice President and Deputy General Counsel of FMR LLC (diversified financial services company). Previously, Mr. Bryant served as Secretary and Chief Legal Officer of Fidelity Rutland Square Trust II (2010-2014) and Assistant Secretary of Fidelity's Fixed Income and Asset Allocation Funds (2013-2015). Prior to joining Fidelity Investments, Mr. Bryant served as a Senior Vice President and the Head of Global Retail Legal for AllianceBernstein L.P. (2006-2010), and as the General Counsel for ProFund Advisors LLC (2001-2006). |
William C. Coffey (1969) |
Year of Election or Appointment: 2009 Assistant Secretary |
| Mr. Coffey also serves as Assistant Secretary of other funds. He is Senior Vice President and Deputy General Counsel of FMR LLC (diversified financial services company, 2010-present), and is an employee of Fidelity Investments. Previously, Mr. Coffey served as Vice President and Associate General Counsel of FMR LLC (2005-2009). |
Timothy M. Cohen (1969) |
Year of Election or Appointment: 2014 Vice President of certain Equity Funds |
| Mr. Cohen also serves as Vice President of other funds. Mr. Cohen serves as Chief Compliance Officer of FMR Investment Management (U.K.) Limited (investment adviser firm, 2013-present) and is an employee of Fidelity Investments. Previously, Mr. Cohen served as a Director of FMR Investment Management (U.K.) Limited (2013-2015). |
Jonathan Davis (1968) |
Year of Election or Appointment: 2010 Assistant Treasurer |
| Mr. Davis also serves as Assistant Treasurer of other funds, and is an employee of Fidelity Investments. Previously, Mr. Davis served as Vice President and Associate General Counsel of FMR LLC (diversified financial services company, 2003-2010). |
Adrien E. Deberghes (1967) |
Year of Election or Appointment: 2008 Deputy Treasurer |
| Mr. Deberghes also serves as an officer of other funds. He is an employee of Fidelity Investments (2008-present). Prior to joining Fidelity Investments, Mr. Deberghes was Senior Vice President of Mutual Fund Administration at State Street Corporation (2007-2008), Senior Director of Mutual Fund Administration at Investors Bank & Trust (2005-2007), and Director of Finance for Dunkin' Brands (2000-2005). |
Stephanie J. Dorsey (1969) |
Year of Election or Appointment: 2010 Assistant Treasurer |
| Ms. Dorsey also serves as an officer of other funds. She is an employee of Fidelity Investments (2008-present) and has served in other fund officer roles. Prior to joining Fidelity Investments, Ms. Dorsey served as Treasurer (2004-2008) of the JPMorgan Mutual Funds and Vice President (2004-2008) of JPMorgan Chase Bank. |
Howard J. Galligan III (1966) |
Year of Election or Appointment: 2014 Chief Financial Officer |
| Mr. Galligan also serves as Chief Financial Officer of other funds. Mr. Galligan serves as President of Fidelity Pricing and Cash Management Services (FPCMS) (2014-present) and as a Director of Strategic Advisers, Inc. (investment adviser firm, 2008-present). Previously, Mr. Galligan served as Chief Administrative Officer of Asset Management (2011-2014) and Chief Operating Officer and Senior Vice President of Investment Support for Strategic Advisers, Inc. (2003-2011). |
Scott C. Goebel (1968) |
Year of Election or Appointment: 2015 Vice President |
| Mr. Goebel serves as Vice President of other funds and is an employee of Fidelity Investments (2001-present). Previously, Mr. Goebel served as Secretary of Fidelity SelectCo, LLC (investment adviser firm, 2013-2015), Fidelity Investments Money Management, Inc. (FIMM) (investment adviser firm, 2010-2015), and Fidelity Research and Analysis Company (FRAC) (investment adviser firm, 2010-2015); General Counsel, Secretary, and Senior Vice President of Fidelity Management & Research Company (investment adviser firm, 2008-2015) and FMR Co., Inc. (investment adviser firm, 2008-2015); Assistant Secretary of Fidelity Management & Research (Japan) Limited (investment adviser firm, 2008-2015) and FMR Investment Management (U.K.) Limited (investment adviser firm, 2008-2015); Chief Legal Officer (CLO) of Fidelity Management & Research (Hong Kong) Limited (investment adviser firm, 2008-2015); Secretary and CLO of certain Fidelity funds (2008-2015); Assistant Secretary of FIMM (2008-2010), FRAC (2008-2010), and certain funds (2007-2008); and as Vice President and Secretary of Fidelity Distributors Corporation (FDC) (2005-2007). |
Brian B. Hogan (1964) |
Year of Election or Appointment: 2009 Vice President |
| Mr. Hogan also serves as Trustee or Vice President of other funds. Mr. Hogan serves as a Director of Fidelity SelectCo, LLC (investment adviser firm, 2014-present) and President of the Equity Division of FMR (investment adviser firm, 2009-present). Previously, Mr. Hogan served as Senior Vice President, Equity Research of FMR (2006-2009) and as a portfolio manager. |
Chris Maher (1972) |
Year of Election or Appointment: 2013 Assistant Treasurer |
| Mr. Maher serves as Assistant Treasurer of other funds. Mr. Maher is Vice President of Valuation Oversight and is an employee of Fidelity Investments. Previously, Mr. Maher served as Vice President of Asset Management Compliance (2013), Vice President of the Program Management Group of FMR (investment adviser firm, 2010-2013), and Vice President of Valuation Oversight (2008-2010). |
Kenneth B. Robins (1969) |
Year of Election or Appointment: 2008 President and Treasurer |
| Mr. Robins also serves as an officer of other funds. Mr. Robins serves as Executive Vice President of Fidelity Investments Money Management, Inc. (FIMM) (investment adviser firm, 2013-present) and is an employee of Fidelity Investments (2004-present). Previously, Mr. Robins served in other fund officer roles. |
Stacie M. Smith (1974) |
Year of Election or Appointment: 2013 Deputy Treasurer |
| Ms. Smith also serves as an officer of other funds. She is an employee of Fidelity Investments (2009-present) and has served in other fund officer roles. Prior to joining Fidelity Investments, Ms. Smith served as Senior Audit Manager of Ernst & Young LLP (1996-2009). |
Renee Stagnone (1975) |
Year of Election or Appointment: 2013 Deputy Treasurer |
| Ms. Stagnone also serves as Deputy Treasurer of other funds. Ms. Stagnone is an employee of Fidelity Investments (1997-present). |
Linda J. Wondrack (1964) |
Year of Election or Appointment: 2014 Chief Compliance Officer |
| Ms. Wondrack also serves as Chief Compliance Officer of other funds. Ms. Wondrack is Executive Vice President and head of the Ethics Office and Asset Management Compliance for Fidelity Investments (2012-present). Ms. Wondrack also serves as Chief Compliance Officer of Fidelity SelectCo, LLC (investment adviser firm, 2014-present); Chief Compliance Officer of Impresa Management LLC (2013-present); and Chief Compliance Officer of FMR Co., Inc. (investment adviser firm), Fidelity Investments Money Management, Inc. (investment adviser firm), Fidelity Management & Research (Japan) Limited (investment adviser firm), FMR Investment Management (U.K.) Limited (investment adviser firm), Fidelity Management & Research (Hong Kong) (investment adviser firm), Fidelity Management & Research Company (investment adviser firm), FIAM LLC (investment adviser firm), and Strategic Advisers, Inc. (investment adviser firm), Ballyrock Investment Advisors LLC, and Northern Neck Investors LLC (2012-present). Previously, Ms. Wondrack served as Senior Vice President and Chief Compliance Officer for Columbia Management Investment Advisers, LLC (2005-2012); Chief Compliance Officer for certain funds within the Columbia Family of Funds (2007-2012); and Senior Vice President of Compliance Risk Management at Bank of America (2005-2010). |
Joseph F. Zambello (1957) |
Year of Election or Appointment: 2011 Deputy Treasurer |
| Mr. Zambello also serves as Deputy Treasurer of other funds. Mr. Zambello is an employee of Fidelity Investments (1991-present). Previously, Mr. Zambello served as Vice President of the Program Management Group of FMR (investment adviser firm, 2009-2011) and Vice President of the Transfer Agent Oversight Group (2005-2009). |
Annual Report
The Board of Trustees of Fidelity Canada Fund voted to pay to shareholders of record at the opening of business on record date, the following distributions per share derived from capital gains realized from sales of portfolio securities, and dividends derived from net investment income:
| Pay Date | Record Date | Dividends | Capital Gains |
Class A | 12/07/15 | 12/04/15 | $0.418 | $0.060 |
| | | | |
Class T | 12/07/15 | 12/04/15 | $0.286 | $0.060 |
| | | | |
Class B | 12/07/15 | 12/04/15 | $0.0000 | $0.060 |
| | | | |
Class C | 12/07/15 | 12/04/15 | $0.018 | $0.060 |
The fund hereby designates as a capital gain dividend with respect to the taxable year ended October 31, 2015 $2,181,885 or, if subsequently determined to be different, the net capital gain of such year.
A percentage of the dividends distributed during the fiscal year for the following funds qualifies for the dividends-received deduction for corporate shareholders:
| December 05, 2014 |
Class A | 4% |
| |
Class T | 5% |
| |
Class C | 15% |
A percentage of the dividends distributed during the fiscal year for the following funds may be taken into account as a dividend for purposes of the maximum rate under section 1(h)(11) of the Internal Revenue Code.
| December 05, 2014 |
Class A | 100% |
| |
Class T | 100% |
| |
Class C | 100% |
The amounts per share which represent income derived from sources within, and taxes paid to, foreign countries or possessions of the United States are as follows:
| Pay Date | Income | Taxes |
Class A | 12/08/2014 | $0.6343 | $0.1363 |
| | | |
Class T | 12/08/2014 | $0.4373 | $0.1363 |
| | | |
Class B | 12/08/2014 | $0.0000 | $0.0000 |
| | | |
Class C | 12/08/2014 | $0.1563 | $0.1363 |
The fund will notify shareholders in January 2016 of amounts for use in preparing 2015 income tax returns.
Annual Report
Fidelity Canada Fund
Each year, the Board of Trustees, including the Independent Trustees (together, the Board), votes on the renewal of the management contract with Fidelity Management & Research Company (FMR) and the sub-advisory agreements (together, the Advisory Contracts) for the fund. The Board, assisted by the advice of fund counsel and Independent Trustees' counsel, requests and considers a broad range of information relevant to the renewal of the Advisory Contracts throughout the year.
The Board meets regularly and, at each of its meetings, covers an extensive agenda of topics and materials and considers factors that are relevant to its annual consideration of the renewal of the fund's Advisory Contracts, including the services and support provided to the fund and its shareholders. The Board has established various standing committees (Committees), each composed of and chaired by Independent Trustees with varying backgrounds, to which the Board has assigned specific subject matter responsibilities in order to enhance effective decision-making by the Board. The Board, acting directly and through its Committees, requests and receives information concerning the annual consideration of the renewal of the fund's Advisory Contracts. The Board also meets as needed to consider matters specifically related to the Board's annual consideration of the renewal of the Advisory Contracts. Members of the Board may also meet with trustees of other Fidelity funds through ad hoc joint committees to discuss certain matters relevant to all of the Fidelity funds.
At its July 2015 meeting, the Board unanimously determined to renew the fund's Advisory Contracts. In reaching its determination, the Board considered all factors it believed relevant, including (i) the nature, extent, and quality of the services to be provided to the fund and its shareholders (including the investment performance of the fund); (ii) the competitiveness of the fund's management fee and total expense ratio relative to peer funds; (iii) the total costs of the services to be provided by and the profits to be realized by Fidelity from its relationship with the fund; and (iv) the extent to which (if any) economies of scale exist and would be realized as the fund grows, and whether any economies of scale are appropriately shared with fund shareholders.
In considering whether to renew the Advisory Contracts for the fund, the Board reached a determination, with the assistance of fund counsel and Independent Trustees' counsel and through the exercise of its business judgment, that the renewal of the Advisory Contracts was in the best interests of the fund and its shareholders and that the compensation payable under the Advisory Contracts was fair and reasonable. The Board's decision to renew the Advisory Contracts was not based on any single factor, but rather was based on a comprehensive consideration of all the information provided to the Board at its meetings throughout the year. The Board, in reaching its determination to renew the Advisory Contracts, was aware that shareholders of the fund have a broad range of investment choices available to them, including a wide choice among funds offered by Fidelity's competitors, and that the fund's shareholders, who have the opportunity to review and weigh the disclosure provided by the fund in its prospectus and other public disclosures, have chosen to invest in this fund, which is part of the Fidelity family of funds.
Nature, Extent, and Quality of Services Provided. The Board considered Fidelity's staffing as it relates to the fund, including the backgrounds of investment personnel of Fidelity, and also considered the fund's investment objective, strategies, and related investment philosophy. The Independent Trustees also had discussions with senior management of Fidelity's investment operations and investment groups. The Board considered the structure of the portfolio manager compensation program and whether this structure provides appropriate incentives to act in the best interests of the fund. Additionally, the Board considered the portfolio managers' investments, if any, in the funds that they manage.
Resources Dedicated to Investment Management and Support Services. The Board and the Fund Oversight and Research Committees reviewed the general qualifications and capabilities of Fidelity's investment staff, including its size, education, experience, and resources, as well as Fidelity's approach to recruiting, training, managing, and compensating investment personnel. The Board noted that Fidelity has continued to increase the resources devoted to non-U.S. offices, including expansion of Fidelity's global investment organization. The Board also noted that Fidelity's analysts have extensive resources, tools and capabilities that allow them to conduct sophisticated quantitative and fundamental analysis, as well as credit analysis of issuers, counterparties and guarantors. Further, the Board considered that Fidelity's investment professionals have sufficient access to global information and data so as to provide competitive investment results over time, and that those professionals also have access to sophisticated tools that permit them to assess portfolio construction and risk and performance attribution characteristics continuously, as well as to transmit new information and research conclusions rapidly around the world. Additionally, in its deliberations, the Board considered Fidelity's trading, risk management, and compliance capabilities and resources, which are integral parts of the investment management process.
Shareholder and Administrative Services. The Board considered (i) the nature, extent, quality, and cost of advisory, administrative, and shareholder services performed by FMR, the sub-advisers (together with FMR, the Investment Advisers), and their affiliates under the Advisory Contracts and under separate agreements covering transfer agency, pricing and bookkeeping, and securities lending services for the fund; (ii) the nature and extent of the supervision of third party service providers, principally custodians and subcustodians; and (iii) the resources devoted to, and the record of compliance with, the fund's compliance policies and procedures. The Board also reviewed the allocation of fund brokerage, including allocations to brokers affiliated with the Investment Advisers, the use of brokerage commissions to pay fund expenses, and the use of "soft" commission dollars to pay for research services.
Annual Report
Board Approval of Investment Advisory Contracts and Management Fees - continued
The Board noted that the growth of fund assets over time across the complex allows Fidelity to reinvest in the development of services designed to enhance the value or convenience of the Fidelity funds as investment vehicles. These services include 24-hour access to account information and market information through telephone representatives and over the Internet, investor education materials and asset allocation tools, and the expanded availability of Fidelity Investor Centers.
In 2014, the Board formed an ad hoc Committee on Transfer Agency Fees to review the variety of transfer agency fee structures throughout the industry and Fidelity's competitive positioning with respect to industry participants.
Investment in a Large Fund Family. The Board considered the benefits to shareholders of investing in a Fidelity fund, including the benefits of investing in a fund that is part of a large family of funds offering a variety of investment disciplines and providing a large variety of mutual fund investor services. The Board noted that Fidelity had taken, or had made recommendations that resulted in the Fidelity funds taking, a number of actions over the previous year that benefited particular funds, including (i) continuing to dedicate additional resources to investment research and to the support of the senior management team that oversees asset management; (ii) continuing efforts to enhance Fidelity's global research capabilities; (iii) launching new funds and making other enhancements to meet client needs; (iv) reducing management fees and total expenses for certain index funds and diversified international funds; (v) continuing to launch dedicated lower cost underlying funds to meet portfolio construction needs related to expanding underlying fund options for Fidelity funds of funds, specifically for the Freedom Fund product lines; (vi) rationalizing product lines and gaining increased efficiencies through fund mergers; (vii) launching active fixed-income exchange-traded funds; (viii) continuing to develop, acquire and implement systems and technology to improve services to the funds and information security and to increase efficiency; (ix) implementing investment enhancements to further strengthen Fidelity's target date product line to increase investors' probability of success in achieving their goals; (x) modifying the eligibility criteria for certain share classes to accommodate roll-over assets from employer-sponsored retirement plans; (xi) launching a new Class W of the Freedom Index Funds to attract and retain Fidelity record-kept retirement plan assets; and (xii) implementing changes to Fidelity's money market product line in response to recent money market regulatory reforms.
Investment Performance. The Board considered whether the fund has operated in accordance with its investment objective, as well as its record of compliance with its investment restrictions and its performance history. The Board noted that there was a portfolio management change for the fund in January 2014 and September 2014.
The Board took into account discussions with representatives of the Investment Advisers about fund investment performance that occur at Board meetings throughout the year. In this regard the Board noted that as part of regularly scheduled fund reviews and other reports to the Board on fund performance, the Board considers annualized return information for the fund, for different time periods, measured against a securities market index ("benchmark index") and a peer group of funds with similar objectives ("peer group"), if any. In its evaluation of fund investment performance, the Board gave particular attention to information indicating changes in performance of certain Fidelity funds for specific time periods and discussed with the Investment Advisers the reasons for any overperformance or underperformance.
In addition to reviewing absolute and relative fund performance, the Independent Trustees periodically consider the appropriateness of fund performance metrics in evaluating the results achieved. In general, the Independent Trustees believe that fund performance should be evaluated based on net performance (after fees and expenses) of both the highest performing and lowest performing fund share classes, where applicable, compared to appropriate benchmark indices, over appropriate time periods that may include full market cycles, and compared to peer groups, as applicable, over the same periods, taking into account relevant factors including the following: general market conditions; issuer-specific information; and fund cash flows and other factors.
The Independent Trustees recognize that shareholders evaluate performance on a net basis over their own holding periods, for which one-, three-, and five-year periods are often used as a proxy. For this reason, the performance information reviewed by the Board also included net cumulative calendar year total return information for the fund and an appropriate benchmark index for the most recent one-, three-, and five-year periods, as shown below. A peer group is not shown below because the fund does not generally utilize a peer group for performance comparison purposes.
Annual Report
Fidelity Canada Fund
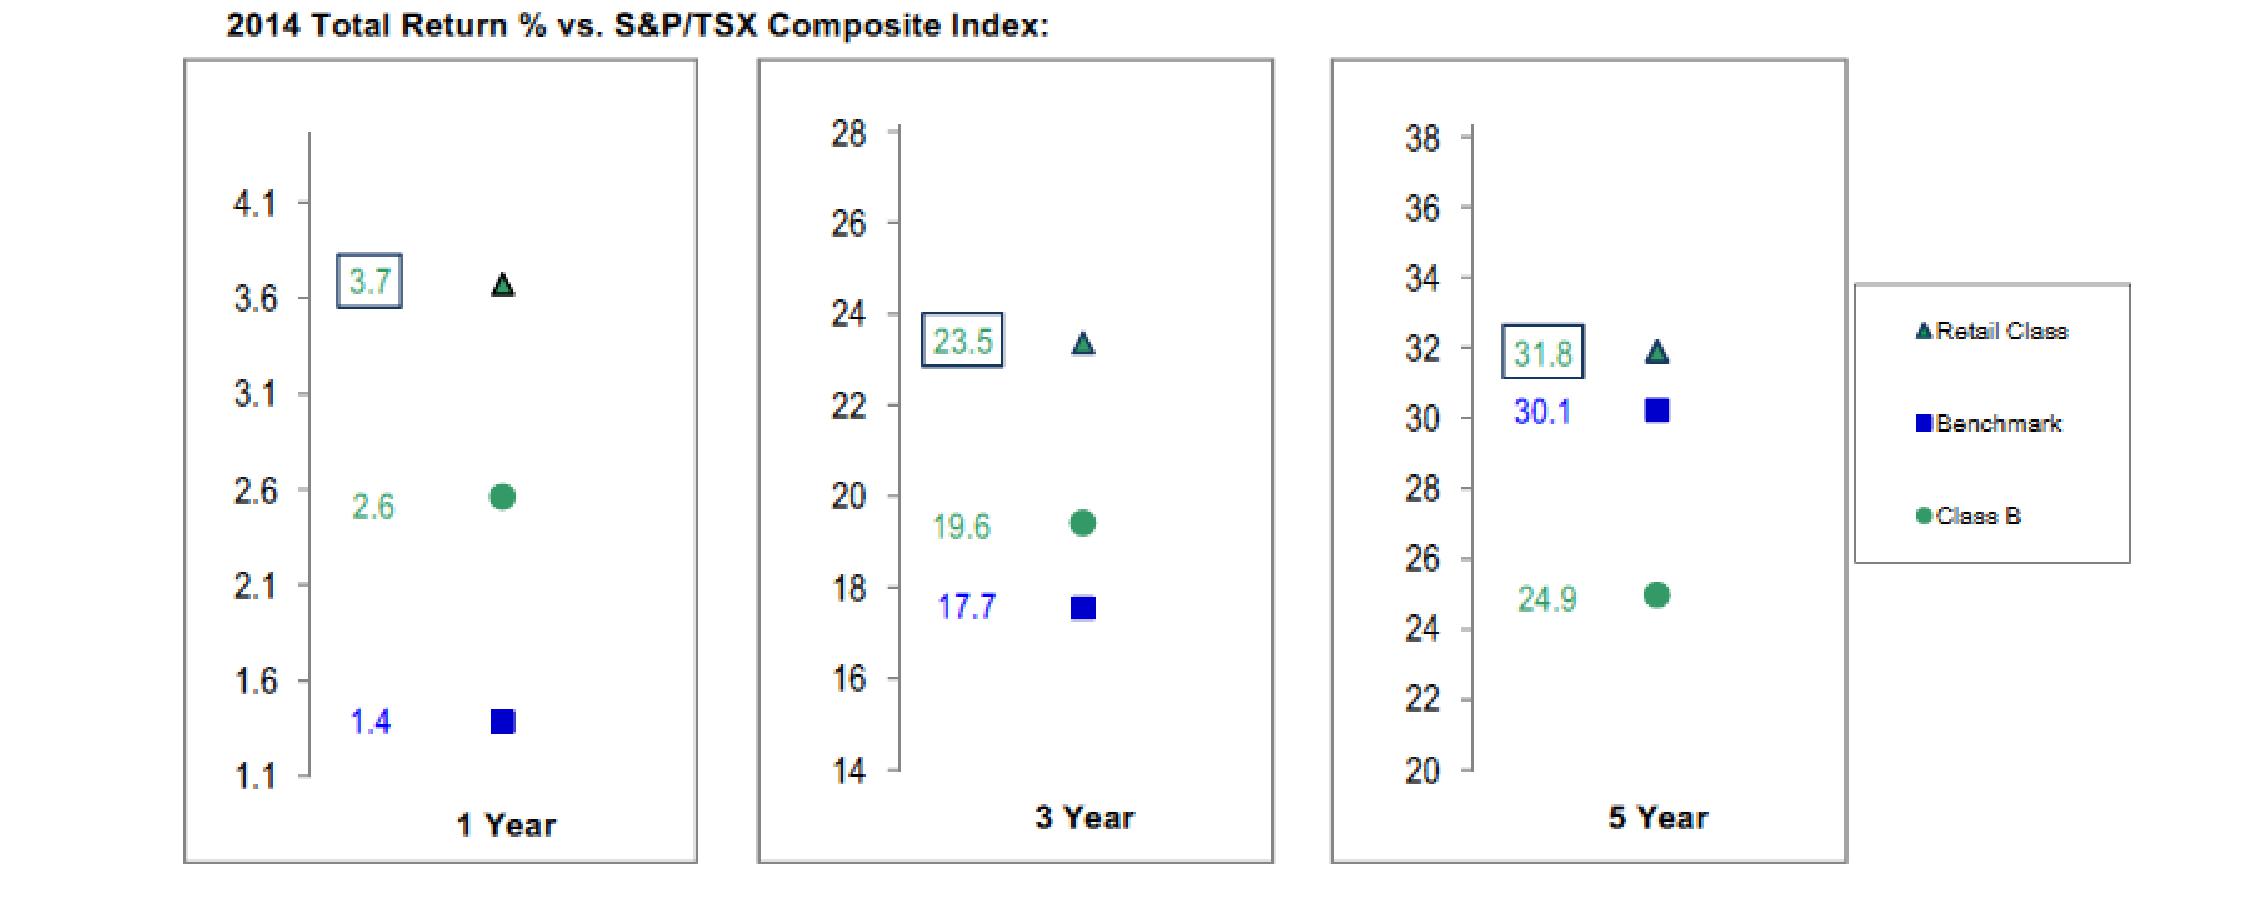
The Board also considered that the fund's management fee is subject to upward or downward adjustment depending upon whether, and to what extent, the fund's investment performance for the performance period exceeds, or is exceeded by, a securities index, thus leading to a performance adjustment for the same period. The Board noted that the performance adjustment provides FMR with a strong economic incentive to seek to achieve superior performance for the fund's shareholders and helps to more closely align the interests of FMR and the shareholders of the fund.
Based on its review, the Board concluded that the nature, extent, and quality of services provided to the fund under the Advisory Contracts should benefit the shareholders of the fund.
Competitiveness of Management Fee and Total Expense Ratio. The Board considered the fund's management fee and total expense ratio compared to "mapped groups" of competitive funds and classes created for the purpose of facilitating the Trustees' competitive analysis of management fees and total expenses. Fidelity creates "mapped groups" by combining similar Lipper investment objective categories that have comparable investment mandates. Combining Lipper investment objective categories aids the Board's management fee and total expense ratio comparisons by broadening the competitive group used for comparison.
Management Fee. The Board considered two proprietary management fee comparisons for the 12-month periods shown in basis points (BP) in the chart below. The group of Lipper funds used by the Board for management fee comparisons is referred to below as the "Total Mapped Group." The Total Mapped Group comparison focuses on a fund's standing in terms of gross management fees before expense reimbursements or caps, and without giving effect to the fund's performance adjustment, relative to the total universe of funds with comparable investment mandates, regardless of whether their management fee structures also are comparable. Funds with comparable investment mandates offer exposure to similar types of securities. Funds with comparable management fee structures have similar management fee contractual arrangements (e.g., flat rate charged for advisory services, all-inclusive fee rate, etc.). "TMG %" represents the percentage of funds in the Total Mapped Group that had management fees that were lower than the fund's. For example, a hypothetical TMG % of 20% would mean that 80% of the funds in the Total Mapped Group had higher, and 20% had lower, management fees than the fund. The fund's actual TMG %s and the number of funds in the Total Mapped Group are in the chart below. The "Asset-Size Peer Group" (ASPG) comparison focuses on a fund's standing relative to a subset of non-Fidelity funds within the Total Mapped Group that are similar in size and management fee structure without taking into account performance adjustments, if any. For example, if a fund is in the first quartile of the ASPG, the fund's management fee ranks in the least expensive or lowest 25% of funds in the ASPG. The ASPG represents at least 15% of the funds in the Total Mapped Group with comparable asset size and management fee structures, subject to a minimum of 50 funds (or all funds in the Total Mapped Group if fewer than 50). Additional information, such as the ASPG quartile in which the fund's management fee rate ranked and the impact of the fund's performance adjustment, is also included in the chart and considered by the Board.
Annual Report
Board Approval of Investment Advisory Contracts and Management Fees - continued
Fidelity Canada Fund

The Board noted that the fund's management fee rate ranked below the median of its Total Mapped Group and below the median of its ASPG for 2014. The Board also noted the effect of the fund's performance adjustment, if any, on the fund's management fee ranking.
The Board noted that, in 2014, the ad hoc Committee on Group Fee was formed by it and other Fidelity fund boards to conduct an in-depth review of the "group fee" component of the management fee of funds with such management fee structures. Committee focus included the mechanics of the group fee, the competitive landscape of group fee structures, Fidelity funds with no group fee component and investment products not included in group fee assets. The Board also considered that, for funds subject to the group fee, FMR agreed to voluntarily waive fees over a specified period of time in amounts designed to account for assets converted from certain funds to certain collective investment trusts.
The Board also noted that, in 2013, the ad hoc Committee on Management Fees was formed to conduct an in-depth review of the management fee rates of Fidelity's active equity mutual funds. The Committee focused on the following areas: (i) standard fee structures; (ii) research consumption and trading evolution; (iii) management fee competitiveness/profitability by category; and (iv) factors that drive institutional pricing.
Based on its review, the Board concluded that the fund's management fee is fair and reasonable in light of the services that the fund receives and the other factors considered.
Total Expense Ratio. In its review of each class's total expense ratio, the Board considered the fund's management fee as well as other fund or class expenses, as applicable, such as transfer agent fees, pricing and bookkeeping fees, fund-paid 12b-1 fees, and custodial, legal, and audit fees. The Board noted the impact of the fund's performance adjustment. The Board also noted that Fidelity may agree to waive fees and expenses from time to time, and the extent to which, if any, it has done so for the fund. As part of its review, the Board also considered the current and historical total expense ratios of each class of the fund compared to competitive fund median expenses. Each class of the fund is compared to those funds and classes in the Total Mapped Group (used by the Board for management fee comparisons) that have a similar sales load structure.
The Board noted that the total expense ratio of each of Class A, Class B, Class C, Class I, and the retail class ranked below its competitive median for 2014 and the total expense ratio of Class T ranked above its competitive median for 2014. The Board considered that, in general, various factors can affect total expense ratios. The Board noted that the total expense ratio of Class T was above the competitive median primarily because of higher 12b-1 fees on Class T as compared to most competitor funds. Class T has a higher 12b-1 fee, but a lower front-end sales charge, than traditionally priced front-end sales charge classes. The Board considered that Class T is primarily sold load-waived in the retirement plan market where its 0.50% 12b-1 fee is comparable to competing no-load, higher 12b-1 fee classes designed specifically for retirement plans. The Board noted that the fund offers multiple classes, each of which has a different sales load and 12b-1 fee structure, and that the multiple structures are intended to offer a range of pricing options for the intermediary market. The Board also noted that the total expense ratios of the classes vary primarily by the level of their 12b-1 fees, although differences in transfer agent fees may also cause expenses to vary from class to class.
Fees Charged to Other Fidelity Clients. The Board also considered Fidelity fee structures and other information with respect to clients of Fidelity, such as other funds advised or subadvised by Fidelity, pension plan clients, and other institutional clients with similar mandates. The Board noted the findings of the 2013 ad hoc joint committee (created with the board of other Fidelity funds), which reviewed and compared Fidelity's institutional investment advisory business with its business of providing services to the Fidelity funds, including the differences in services provided, fees charged, and costs incurred, as well as competition in their respective marketplaces.
Annual Report
Based on its review of total expense ratios and fees charged to other Fidelity clients, the Board concluded that, although Class T was above the median of the universe presented for comparison, the total expense ratio of each class of the fund was reasonable in light of the services that the fund and its shareholders receive and the other factors considered.
Costs of the Services and Profitability. The Board considered the revenues earned and the expenses incurred by Fidelity in conducting the business of developing, marketing, distributing, managing, administering and servicing the fund and servicing the fund's shareholders. The Board also considered the level of Fidelity's profits in respect of all the Fidelity funds.
On an annual basis, Fidelity presents to the Board information about the profitability of its relationship with the fund. Fidelity calculates profitability information for each fund, as well as aggregate profitability information for groups of Fidelity funds and all Fidelity funds, using a series of detailed revenue and cost allocation methodologies which originate with the books and records of Fidelity on which Fidelity's audited financial statements are based. The Audit Committee of the Board reviews any significant changes from the prior year's methodologies.
PricewaterhouseCoopers LLP (PwC), independent registered public accounting firm and auditor to Fidelity and certain Fidelity funds, has been engaged annually by the Board as part of the Board's assessment of Fidelity's profitability analysis. PwC's engagement includes the review and assessment of the methodologies used by Fidelity in determining the revenues and expenses attributable to Fidelity's mutual fund business, and completion of agreed-upon procedures in respect of the mathematical accuracy of fund profitability and its conformity to established allocation methodologies. After considering PwC's reports issued under the engagement and information provided by Fidelity, the Board concluded that while other allocation methods may also be reasonable, Fidelity's profitability methodologies are reasonable in all material respects.
The Board also reviewed Fidelity's non-fund businesses and fall-out benefits related to the mutual fund business as well as cases where Fidelity's affiliates may benefit from or be related to the fund's business.
The Board considered the costs of the services provided by and the profits realized by Fidelity in connection with the operation of the fund and was satisfied that the profitability was not excessive.
Economies of Scale. The Board considered whether there have been economies of scale in respect of the management of the Fidelity funds, whether the Fidelity funds (including the fund) have appropriately benefited from any such economies of scale, and whether there is potential for realization of any further economies of scale. The Board considered the extent to which the fund will benefit from economies of scale as assets grow through increased services to the fund, through waivers or reimbursements, or through fee or expense ratio reductions. The Board also noted that in 2013, it and the boards of other Fidelity funds created an ad hoc committee (the Economies of Scale Committee) to analyze whether Fidelity attains economies of scale in respect of the management and servicing of the Fidelity funds, whether the Fidelity funds have appropriately benefited from such economies of scale, and whether there is potential for realization of any further economies of scale.
The Board recognized that the fund's management contract incorporates a "group fee" structure, which provides for lower group fee rates as total group assets increase, and for higher group fee rates as total group assets decrease (with "group assets" defined to include fund assets under FMR's management plus sector fund assets previously under FMR's management and currently managed by Fidelity SelectCo, LLC). FMR calculates the group fee rates based on a tiered asset "breakpoint" schedule that varies based on asset class. The Board considered that the group fee is designed to deliver the benefits of economies of scale to fund shareholders when total Fidelity fund assets increase, even if assets of any particular fund are unchanged or have declined, because some portion of Fidelity's costs are attributable to services provided to all Fidelity funds, and all funds benefit if those costs can be allocated among more assets. The Board concluded that, given the group fee structure, fund shareholders will benefit from lower management fees as group assets increase at the fund complex level, regardless of whether Fidelity achieves any such economies of scale.
The Board concluded, taking into account the analysis of the Economies of Scale Committee, that economies of scale, if any, are being appropriately shared between fund shareholders and Fidelity.
Additional Information Requested by the Board. In order to develop fully the factual basis for consideration of the Fidelity funds' Advisory Contracts, the Board requested and received additional information on certain topics, including: (i) fund performance trends and Fidelity's long-term strategies for certain funds; (ii) the various share classes employed by Fidelity and the attributes of each class, together with similar information on the distribution and servicing payments made by Fidelity or the funds to third-party participants in the distribution channels; (iii) fund profitability, and fund performance in relation to fund profitability; (iv) the methodology with respect to evaluating competitive fund data and peer group classifications and fee comparisons; (v) annual fund profitability margins, with particular focus on certain funds with negative margins; (vi) the realization of fall-out benefits in certain Fidelity business units; (vii) economies of scale and the way in which they are shared with fund shareholders; (viii) Fidelity's group fee structures, including the group fee schedule of breakpoints; (ix) the impact of cost containment measures on the funds; and (x) the transfer agent fee structure.
Based on its evaluation of all of the conclusions noted above, and after considering all factors it believed relevant, the Board concluded that the advisory fee structures are fair and reasonable, and that the fund's Advisory Contracts should be renewed.
Annual Report
Investment Adviser
Fidelity Management & Research Company
Boston, MA
Investment Sub-Advisers
FMR Co., Inc.
FMR Investment Management
(U.K.) Limited
Fidelity Management & Research
(Hong Kong) Limited
Fidelity Management & Research
(Japan) Limited
FIL Investment Advisors
FIL Investment Advisors
(UK) Limited
General Distributor
Fidelity Distributors Corporation
Smithfield, RI
Transfer and Service Agents
Fidelity Investments Institutional
Operations Company, Inc.
Boston, MA
Fidelity Service Company, Inc.
Boston, MA
Custodian
State Street Bank and Trust Company
Quincy, MA
(Fidelity Investment logo)(registered trademark)
ACAN-UANN-1215
1.843164.108
Fidelity Advisor®
Canada Fund -
Class I
(formerly Institutional Class)
Annual Report
October 31, 2015
Class I is a class of
Fidelity® Canada Fund
(Fidelity Cover Art)
Contents
Performance | (Click Here) | How the fund has done over time. |
Management's Discussion of Fund Performance | (Click Here) | The Portfolio Manager's review of fund performance and strategy. |
Shareholder Expense Example | (Click Here) | An example of shareholder expenses. |
Investment Changes | (Click Here) | A summary of major shifts in the fund's investments over the past six months. |
Investments | (Click Here) | A complete list of the fund's investments with their market values. |
Financial Statements | (Click Here) | Statements of assets and liabilities, operations, and changes in net assets, as well as financial highlights. |
Notes | (Click Here) | Notes to the financial statements. |
Report of Independent Registered Public Accounting Firm | (Click Here) | |
Trustees and Officers | (Click Here) | |
Distributions | (Click Here) | |
Board Approval of Investment Advisory Contracts and Management Fees | (Click Here) | |
To view a fund's proxy voting guidelines and proxy voting record for the 12-month period ended June 30, visit http://www.fidelity.com/proxyvotingresults or visit the Securities and Exchange Commission's (SEC) web site at http://www.sec.gov. You may also call 1-877-208-0098 to request a free copy of the proxy voting guidelines.
Standard & Poor's, S&P and S&P 500 are registered service marks of The McGraw-Hill Companies, Inc. and have been licensed for use by Fidelity Distributors Corporation.
Other third-party marks appearing herein are the property of their respective owners.
All other marks appearing herein are registered or unregistered trademarks or service marks of FMR LLC or an affiliated company. © 2015 FMR LLC. All rights reserved.
This report and the financial statements contained herein are submitted for the general information of the shareholders of the fund. This report is not authorized for distribution to prospective investors in the fund unless preceded or accompanied by an effective prospectus.
A fund files its complete schedule of portfolio holdings with the SEC for the first and third quarters of each fiscal year on Form N-Q. Forms N-Q are available on the SEC's web site at http://www.sec.gov. A fund's Forms N-Q may be reviewed and copied at the SEC's Public Reference Room in Washington, DC. Information regarding the operation of the SEC's Public Reference Room may be obtained by calling 1-800-SEC-0330. For a complete list of a fund's portfolio holdings, view the most recent holdings listing, semiannual report, or annual report on Fidelity's web site at http://www.fidelity.com, http://www.advisor.fidelity.com, or http://www.401k.com, as applicable.
NOT FDIC INSURED • MAY LOSE VALUE • NO BANK GUARANTEE
Neither the fund nor Fidelity Distributors Corporation is a bank.
Annual Report
Average annual total return reflects the change in the value of an investment, assuming reinvestment of the class' distributions from dividend income and capital gains (the profits earned upon the sale of securities that have grown in value, if any) and assuming a constant rate of performance each year. The $10,000 table and the fund's returns do not reflect the deduction of taxes that a shareholder would pay on fund distributions or the redemption of fund shares. During periods of reimbursement by Fidelity, a fund's total return will be greater than it would be had the reimbursement not occurred. How a fund did yesterday is no guarantee of how it will do tomorrow.
Average Annual Total Returns
Periods ended October 31, 2015 | Past 1
year | Past 5
years | Past 10
years |
Class I A | -14.05% | 0.44% | 4.61% |
A The initial offering of Class I shares took place on May 2, 2007. Returns prior to May 2, 2007 are those of Fidelity® Canada Fund, the original class of the fund.
$10,000 Over 10 Years
Let's say hypothetically that $10,000 was invested in Fidelity Advisor® Canada Fund - Class I on October 31, 2005. The chart shows how the value of your investment would have changed, and also shows how the S&P®/TSX Composite Index performed over the same period. See footnote A above for additional information regarding the performance of Class I.
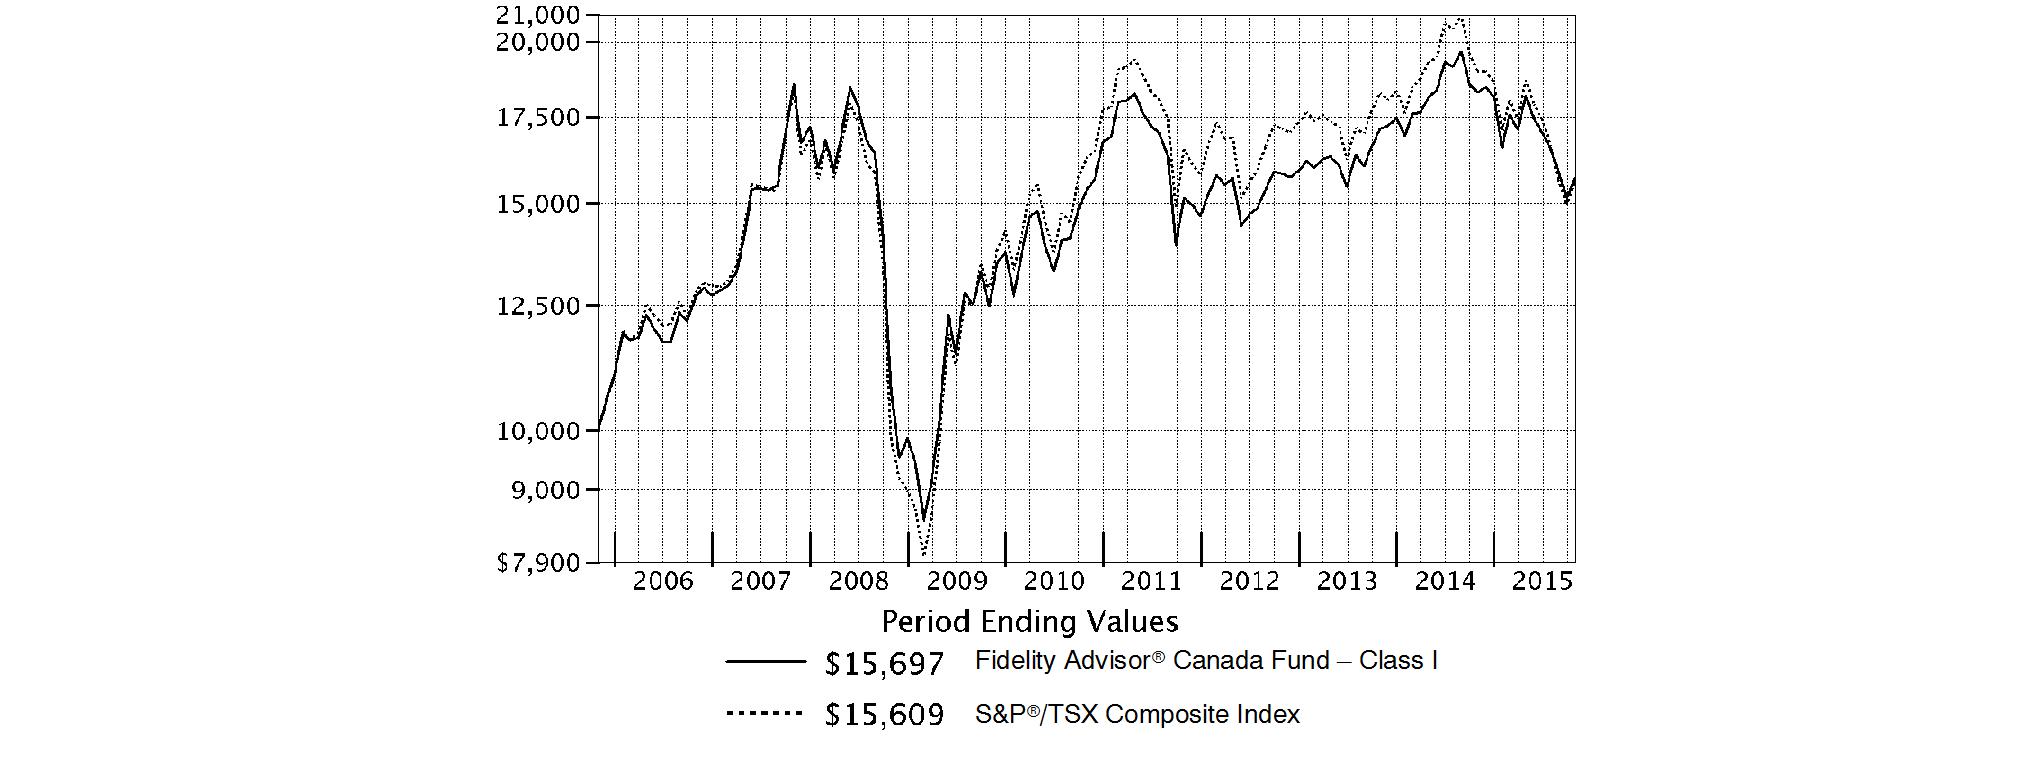
Annual Report
Fidelity Canada Fund
Market Recap: International equities suffered a moderate setback for the 12 months ending October 31, 2015, held back by a collapse in commodities prices that hurt resources-related sectors and geographies. The MSCI ACWI (All Country World Index) ex USA Index returned -4.55% for the period, affected also by concerns about global economic growth. Commodity producers remained under pressure for much of the past year, largely related to economic deceleration in China (-1%), the world's second-largest economy and a leading consumer of raw materials. This effect was exacerbated by U.S. dollar strength relative to global currencies, which weighed on commodities priced in dollars and acutely impacted equity returns within regions most exposed to resources prices. The emerging-markets group, for example, returned about -15% this period. Canada, a significant energy producer, returned roughly -17%. Net energy consumer Japan (+9%) was the best-performing region by far. Only about a quarter of the nearly 50 index countries managed a gain this period: Ireland (+19%) - the EU's fastest-growing economy - and Israel (+17%) proved top performers; Greece (-56%) and Brazil (-46%), among the worst. As for sectors, energy (-25%) and materials (-16%) declined sharply, whereas the two consumer sectors each gained about 6%.
Comments from Portfolio Manager Risteard Hogan: For the year, the fund's share classes (excluding sales charges, if applicable) delivered double-digit negative returns, but solidly outpaced the S&P/TSX Composite Index, which returned -17.81%. Amid a backdrop of weak demand for commodities, mainly due to slowing growth in China, Canada's resource-rich, export-driven market struggled. Strong stock selection in energy and materials drove the fund's outperformance versus the index. In energy, avoiding poor-performing index components Encana, Crescent Point Energy and Baytex Energy was beneficial. A position in telecommunications company Rogers Communications was the fund's No. 1 relative contributor and one of its largest holdings at period end. The company benefited from a recent government decision not to add additional competitors to the market. On the downside, avoiding asset manager and index component Brookfield Asset Management proved detrimental. I felt the stock's valuation was high, so I looked elsewhere for better growth opportunities. However, the company continued to execute well, which buoyed its stock price.
The views expressed above reflect those of the portfolio manager(s) only through the end of the period as stated on the cover of this report and do not necessarily represent the views of Fidelity or any other person in the Fidelity organization. Any such views are subject to change at any time based upon market or other conditions and Fidelity disclaims any responsibility to update such views. These views may not be relied on as investment advice and, because investment decisions for a Fidelity fund are based on numerous factors, may not be relied on as an indication of trading intent on behalf of any Fidelity fund.
Annual Report
Fidelity Canada Fund
As a shareholder of the Fund, you incur two types of costs: (1) transaction costs, including sales charges (loads) on purchase payments or redemption proceeds, redemption fees and (2) ongoing costs, including management fees, distribution and/or service (12b-1) fees and other Fund expenses. This Example is intended to help you understand your ongoing costs (in dollars) of investing in the Fund and to compare these costs with the ongoing costs of investing in other mutual funds.
The Example is based on an investment of $1,000 invested at the beginning of the period and held for the entire period (May 1, 2015 to October 31, 2015).
Actual Expenses
The first line of the accompanying table for each class of the Fund provides information about actual account values and actual expenses. You may use the information in this line, together with the amount you invested, to estimate the expenses that you paid over the period. Simply divide your account value by $1,000.00 (for example, an $8,600 account value divided by $1,000.00 = 8.6), then multiply the result by the number in the first line for a class of the Fund under the heading entitled "Expenses Paid During Period" to estimate the expenses you paid on your account during this period. A small balance maintenance fee of $12.00 that is charged once a year may apply for certain accounts with a value of less than $2,000. This fee is not included in the table below. If it was, the estimate of expenses you paid during the period would be higher, and your ending account value lower, by this amount. In addition, the Fund, as a shareholder in the underlying Fidelity Central Funds, will indirectly bear its pro-rata share of the fees and expenses incurred by the underlying Fidelity Central Funds. These fees and expenses are not included in the Fund's annualized expense ratio used to calculate the expense estimate in the table below.
Hypothetical Example for Comparison Purposes
The second line of the accompanying table for each class of the Fund provides information about hypothetical account values and hypothetical expenses based on a Class' actual expense ratio and an assumed rate of return of 5% per year before expenses, which is not the Class' actual return. The hypothetical account values and expenses may not be used to estimate the actual ending account balance or expenses you paid for the period. You may use this information to compare the ongoing costs of investing in the Fund and other funds. To do so, compare this 5% hypothetical example with the 5% hypothetical examples that appear in the shareholder reports of the other funds. A small balance maintenance fee of $12.00 that is charged once a year may apply for certain accounts with a value of less than $2,000. This fee is not included in the table below. If it was, the estimate of expenses you paid during the period would be higher, and your ending account value lower, by this amount. In addition, the Fund, as a shareholder in the underlying Fidelity Central Funds, will indirectly bear its pro-rata share of the fees and expenses incurred by the underlying Fidelity Central Funds. These fees and expenses are not included in the Fund's annualized expense ratio used to calculate the expense estimate in the table below.
Please note that the expenses shown in the table are meant to highlight your ongoing costs only and do not reflect any transaction costs. Therefore, the second line of the table is useful in comparing ongoing costs only, and will not help you determine the relative total costs of owning different funds. In addition, if these transactional costs were included, your costs would have been higher.
| Annualized
Expense RatioB | Beginning
Account Value
May 1, 2015 | Ending
Account Value
October 31, 2015 | Expenses Paid
During PeriodC
May 1, 2015
to October 31, 2015 |
Class A | 1.45% | | | |
Actual | | $ 1,000.00 | $ 862.20 | $ 6.81 |
HypotheticalA | | $ 1,000.00 | $ 1,017.90 | $ 7.38 |
Class T | 1.76% | | | |
Actual | | $ 1,000.00 | $ 860.90 | $ 8.26 |
HypotheticalA | | $ 1,000.00 | $ 1,016.33 | $ 8.94 |
Class B | 2.24% | | | |
Actual | | $ 1,000.00 | $ 858.80 | $ 10.49 |
HypotheticalA | | $ 1,000.00 | $ 1,013.91 | $ 11.37 |
Class C | 2.19% | | | |
Actual | | $ 1,000.00 | $ 858.90 | $ 10.26 |
HypotheticalA | | $ 1,000.00 | $ 1,014.17 | $ 11.12 |
Canada | 1.16% | | | |
Actual | | $ 1,000.00 | $ 863.30 | $ 5.45 |
HypotheticalA | | $ 1,000.00 | $ 1,019.36 | $ 5.90 |
Class I | 1.13% | | | |
Actual | | $ 1,000.00 | $ 863.50 | $ 5.31 |
HypotheticalA | | $ 1,000.00 | $ 1,019.51 | $ 5.75 |
A 5% return per year before expenses
B Annualized expense ratio reflects expenses net of applicable fee waivers.
C Expenses are equal to each Class' annualized expense ratio, multiplied by the average account value over the period, multiplied by 184/365 (to reflect the one-half year period).
Annual Report
Fidelity Canada Fund
Investment Changes (Unaudited)
Asset Allocation as of October 31, 2015 |
| % of fund's
net assets | % of fund's net assets
6 months ago |
Stocks | 97.8 | 97.9 |
Short-Term Investments and Net Other Assets (Liabilities) | 2.2 | 2.1 |
Top Ten Stocks as of October 31, 2015 |
| % of fund's
net assets | % of fund's net assets
6 months ago |
Royal Bank of Canada (Banks) | 8.9 | 8.3 |
The Toronto-Dominion Bank (Banks) | 8.3 | 7.7 |
Canadian National Railway Co. (Road & Rail) | 6.1 | 5.4 |
Suncor Energy, Inc. (Oil, Gas & Consumable Fuels) | 5.7 | 5.2 |
Enbridge, Inc. (Oil, Gas & Consumable Fuels) | 4.4 | 4.8 |
Sun Life Financial, Inc. (Insurance) | 4.1 | 2.8 |
TELUS Corp. (Diversified Telecommunication Services) | 3.9 | 3.0 |
Rogers Communications, Inc. Class B (non-vtg.) (Wireless Telecommunication Services) | 3.8 | 2.6 |
Intact Financial Corp. (Insurance) | 2.3 | 2.3 |
Imperial Oil Ltd. (Oil, Gas & Consumable Fuels) | 2.3 | 2.8 |
| 48.5 | |
Market Sectors as of October 31, 2015 |
| % of fund's
net assets | % of fund's net assets
6 months ago |
Financials | 33.1 | 30.7 |
Energy | 20.7 | 23.1 |
Materials | 10.2 | 10.8 |
Consumer Staples | 8.7 | 7.4 |
Industrials | 8.2 | 7.5 |
Telecommunication Services | 7.7 | 5.6 |
Information Technology | 3.3 | 4.6 |
Health Care | 3.0 | 4.9 |
Consumer Discretionary | 2.6 | 3.3 |
Utilities | 0.3 | 0.0 |
Market Sectors may include more than one industry category. The fund may invest up to 35% of its total assets in any industry that represents more than 20% of the Canadian market. As of October 31, 2015, the fund did not have more than 25% of its assets invested in any one industry. Percentages shown as 0.0% may reflect amounts less than 0.05%. |
Annual Report
Fidelity Canada Fund
Investments October 31, 2015
Showing Percentage of Net Assets
Common Stocks - 97.8% |
| Shares | | Value |
CONSUMER DISCRETIONARY - 2.6% |
Household Durables - 0.1% |
Cairn Homes PLC (a) | 1,401,800 | | $ 1,556,904 |
Media - 0.6% |
Quebecor, Inc. Class B (sub. vtg.) | 371,700 | | 8,752,404 |
Specialty Retail - 0.9% |
AutoCanada, Inc. (d) | 152,900 | | 3,704,399 |
RONA, Inc. | 888,200 | | 9,271,895 |
| | 12,976,294 |
Textiles, Apparel & Luxury Goods - 1.0% |
Gildan Activewear, Inc. | 465,690 | | 13,387,341 |
TOTAL CONSUMER DISCRETIONARY | | 36,672,943 |
CONSUMER STAPLES - 8.7% |
Food & Staples Retailing - 7.4% |
Alimentation Couche-Tard, Inc. Class B (sub. vtg.) | 709,200 | | 30,508,183 |
George Weston Ltd. | 349,500 | | 29,433,267 |
Jean Coutu Group, Inc. Class A (sub. vtg.) | 943,500 | | 14,380,510 |
Metro, Inc. Class A (sub. vtg.) | 545,995 | | 15,612,384 |
North West Co., Inc. | 557,700 | | 12,368,691 |
| | 102,303,035 |
Food Products - 0.7% |
AGT Food & Ingredients, Inc. | 152,500 | | 3,408,974 |
Mead Johnson Nutrition Co. Class A | 71,900 | | 5,895,800 |
| | 9,304,774 |
Tobacco - 0.6% |
British American Tobacco PLC (United Kingdom) | 151,200 | | 8,982,735 |
TOTAL CONSUMER STAPLES | | 120,590,544 |
ENERGY - 20.7% |
Energy Equipment & Services - 1.0% |
Pason Systems, Inc. | 545,300 | | 8,023,533 |
ZCL Composites, Inc. | 1,272,800 | | 6,034,995 |
| | 14,058,528 |
Oil, Gas & Consumable Fuels - 19.7% |
ARC Resources Ltd. (d) | 1,075,300 | | 15,854,836 |
Black Stone Minerals LP | 330,700 | | 4,540,511 |
Canadian Natural Resources Ltd. | 212,498 | | 4,927,301 |
Cenovus Energy, Inc. | 293,600 | | 4,373,913 |
Enbridge, Inc. | 1,444,400 | | 61,737,164 |
Imperial Oil Ltd. | 942,400 | | 31,358,079 |
Keyera Corp. (d) | 515,904 | | 15,919,797 |
Painted Pony Petroleum Ltd. (a) | 994,400 | | 3,391,728 |
Paramount Resources Ltd. Class A (a) | 462,900 | | 4,683,517 |
Parkland Fuel Corp. | 422,600 | | 7,352,516 |
Peyto Exploration & Development Corp. | 445,400 | | 9,196,849 |
|
| Shares | | Value |
PrairieSky Royalty Ltd. (d) | 450,063 | | $ 8,856,012 |
Raging River Exploration, Inc. (a) | 914,200 | | 5,802,891 |
Spartan Energy Corp. (a) | 2,992,400 | | 5,469,437 |
Suncor Energy, Inc. | 2,636,400 | | 78,450,844 |
Whitecap Resources, Inc. | 1,263,400 | | 11,217,554 |
| | 273,132,949 |
TOTAL ENERGY | | 287,191,477 |
FINANCIALS - 33.1% |
Banks - 20.6% |
Bank of Nova Scotia | 475,000 | | 22,336,915 |
National Bank of Canada | 731,600 | | 24,231,872 |
Royal Bank of Canada (d) | 2,151,600 | | 123,030,842 |
The Toronto-Dominion Bank | 2,823,900 | | 115,927,617 |
| | 285,527,246 |
Capital Markets - 0.7% |
AGF Management Ltd. Class B (non-vtg.) | 355,200 | | 1,475,020 |
Ashmore Group PLC (d) | 1,044,000 | | 4,345,462 |
CI Financial Corp. | 166,100 | | 3,963,230 |
| | 9,783,712 |
Insurance - 10.2% |
Fairfax Financial Holdings Ltd. (sub. vtg.) | 44,400 | | 21,864,521 |
Intact Financial Corp. | 448,825 | | 32,055,496 |
Power Corp. of Canada (sub. vtg.) | 1,362,700 | | 30,628,444 |
Sun Life Financial, Inc. | 1,704,200 | | 57,475,696 |
| | 142,024,157 |
Real Estate Investment Trusts - 1.6% |
Allied Properties (REIT) | 437,900 | | 12,015,794 |
H&R REIT/H&R Finance Trust | 631,200 | | 10,127,391 |
| | 22,143,185 |
TOTAL FINANCIALS | | 459,478,300 |
HEALTH CARE - 3.0% |
Health Care Equipment & Supplies - 0.4% |
Getinge AB (B Shares) | 159,200 | | 3,985,800 |
Novadaq Technologies, Inc. (a) | 142,687 | | 1,795,003 |
| | 5,780,803 |
Pharmaceuticals - 2.6% |
Teva Pharmaceutical Industries Ltd. sponsored ADR | 80,000 | | 4,735,200 |
Valeant Pharmaceuticals International, Inc. (Canada) (a) | 334,421 | | 31,211,945 |
| | 35,947,145 |
TOTAL HEALTH CARE | | 41,727,948 |
INDUSTRIALS - 8.2% |
Airlines - 0.7% |
WestJet Airlines Ltd. | 510,100 | | 9,440,517 |
Common Stocks - continued |
| Shares | | Value |
INDUSTRIALS - continued |
Professional Services - 0.8% |
Stantec, Inc. | 433,700 | | $ 10,885,618 |
Road & Rail - 6.7% |
Canadian National Railway Co. | 1,393,100 | | 85,092,457 |
TransForce, Inc. | 441,300 | | 8,632,957 |
| | 93,725,414 |
TOTAL INDUSTRIALS | | 114,051,549 |
INFORMATION TECHNOLOGY - 3.3% |
Electronic Equipment & Components - 0.2% |
Avigilon Corp. (a)(d) | 285,700 | | 3,205,276 |
IT Services - 1.0% |
CGI Group, Inc. Class A (sub. vtg.) (a) | 374,500 | | 13,910,573 |
Software - 2.1% |
Constellation Software, Inc. | 36,600 | | 15,814,469 |
Open Text Corp. | 285,414 | | 13,229,537 |
| | 29,044,006 |
TOTAL INFORMATION TECHNOLOGY | | 46,159,855 |
MATERIALS - 10.2% |
Chemicals - 2.4% |
Agrium, Inc. | 209,300 | | 19,471,815 |
Monsanto Co. | 31,900 | | 2,973,718 |
Potash Corp. of Saskatchewan, Inc. | 563,400 | | 11,409,324 |
| | 33,854,857 |
Containers & Packaging - 1.3% |
CCL Industries, Inc. Class B | 90,000 | | 12,750,459 |
Winpak Ltd. | 179,600 | | 5,426,733 |
| | 18,177,192 |
Metals & Mining - 5.2% |
Agnico Eagle Mines Ltd. (Canada) | 434,600 | | 12,284,197 |
Eldorado Gold Corp. | 1,999,600 | | 6,988,507 |
Freeport-McMoRan, Inc. | 276,300 | | 3,252,051 |
Goldcorp, Inc. | 375,000 | | 4,797,912 |
Labrador Iron Ore Royalty Corp. (d) | 292,700 | | 3,404,686 |
Lundin Mining Corp. (a) | 2,301,300 | | 7,761,344 |
Randgold Resources Ltd. | 145,464 | | 9,755,819 |
Silver Wheaton Corp. | 874,700 | | 11,886,983 |
Tahoe Resources, Inc. | 670,700 | | 5,601,135 |
Teck Resources Ltd. Class B (sub. vtg.) | 259,400 | | 1,519,581 |
Torex Gold Resources, Inc. (a) | 5,532,400 | | 5,246,387 |
| | 72,498,602 |
Paper & Forest Products - 1.3% |
Stella-Jones, Inc. | 182,400 | | 6,712,365 |
West Fraser Timber Co. Ltd. | 309,000 | | 10,934,101 |
| | 17,646,466 |
TOTAL MATERIALS | | 142,177,117 |
|
| Shares | | Value |
TELECOMMUNICATION SERVICES - 7.7% |
Diversified Telecommunication Services - 3.9% |
TELUS Corp. | 1,646,200 | | $ 54,940,478 |
Wireless Telecommunication Services - 3.8% |
Rogers Communications, Inc. Class B (non-vtg.) | 1,323,400 | | 52,658,689 |
TOTAL TELECOMMUNICATION SERVICES | | 107,599,167 |
UTILITIES - 0.3% |
Electric Utilities - 0.3% |
Hydro One Ltd. (a) | 221,400 | | 3,471,016 |
TOTAL COMMON STOCKS (Cost $1,209,742,368) |
1,359,119,916
|
Money Market Funds - 4.4% |
| | | |
Fidelity Cash Central Fund, 0.18% (b) | 28,325,905 | | 28,325,905 |
Fidelity Securities Lending Cash Central Fund, 0.19% (b)(c) | 33,251,267 | | 33,251,267 |
TOTAL MONEY MARKET FUNDS (Cost $61,577,172) |
61,577,172
|
TOTAL INVESTMENT PORTFOLIO - 102.2% (Cost $1,271,319,540) | | 1,420,697,088 |
NET OTHER ASSETS (LIABILITIES) - (2.2)% | | (30,969,506) |
NET ASSETS - 100% | $ 1,389,727,582 |
Legend |
(a) Non-income producing |
(b) Affiliated fund that is generally available only to investment companies and other accounts managed by Fidelity Investments. The rate quoted is the annualized seven-day yield of the fund at period end. A complete unaudited listing of the fund's holdings as of its most recent quarter end is available upon request. In addition, each Fidelity Central Fund's financial statements, which are not covered by the Fund's Report of Independent Registered Public Accounting Firm, are available on the SEC's website or upon request. |
(c) Investment made with cash collateral received from securities on loan. |
(d) Security or a portion of the security is on loan at period end. |
Affiliated Central Funds |
Information regarding fiscal year to date income earned by the Fund from investments in Fidelity Central Funds is as follows: |
Fund | Income earned |
Fidelity Cash Central Fund | $ 46,391 |
Fidelity Securities Lending Cash Central Fund | 2,422,196 |
Total | $ 2,468,587 |
Other Information |
Categorizations in the Schedule of Investments are based on country or territory of incorporation. |
The following is a summary of the inputs used, as of October 31, 2015, involving the Fund's assets and liabilities carried at fair value. The inputs or methodology used for valuing securities may not be an indication of the risk associated with investing in those securities. For more information on valuation inputs, and their aggregation into the levels used in the table below, please refer to the Investment Valuation section in the accompanying Notes to Financial Statements. |
Valuation Inputs at Reporting Date: |
Description | Total | Level 1 | Level 2 | Level 3 |
Investments in Securities: | | | | |
Equities: | | | | |
Consumer Discretionary | $ 36,672,943 | $ 36,672,943 | $ - | $ - |
Consumer Staples | 120,590,544 | 111,607,809 | 8,982,735 | - |
Energy | 287,191,477 | 287,191,477 | - | - |
Financials | 459,478,300 | 459,478,300 | - | - |
Health Care | 41,727,948 | 41,727,948 | - | - |
Industrials | 114,051,549 | 114,051,549 | - | - |
Information Technology | 46,159,855 | 46,159,855 | - | - |
Materials | 142,177,117 | 132,421,298 | 9,755,819 | - |
Telecommunication Services | 107,599,167 | 107,599,167 | - | - |
Utilities | 3,471,016 | - | 3,471,016 | - |
Money Market Funds | 61,577,172 | 61,577,172 | - | - |
Total Investments in Securities: | $ 1,420,697,088 | $ 1,398,487,518 | $ 22,209,570 | $ - |
See accompanying notes which are an integral part of the financial statements.
Annual Report
Fidelity Canada Fund
Statement of Assets and Liabilities
| | October 31, 2015 |
| | |
Assets | | |
Investment in securities, at value (including securities loaned of $31,571,540) - See accompanying schedule: Unaffiliated issuers (cost $1,209,742,368) | $ 1,359,119,916 | |
Fidelity Central Funds (cost $61,577,172) | 61,577,172 | |
Total Investments (cost $1,271,319,540) | | $ 1,420,697,088 |
Foreign currency held at value (cost $1,009,637) | | 1,009,637 |
Receivable for investments sold | | 9,236,873 |
Receivable for fund shares sold | | 257,082 |
Dividends receivable | | 1,907,666 |
Distributions receivable from Fidelity Central Funds | | 316,344 |
Prepaid expenses | | 4,446 |
Other receivables | | 3,054 |
Total assets | | 1,433,432,190 |
| | |
Liabilities | | |
Payable for investments purchased | $ 6,691,159 | |
Payable for fund shares redeemed | 2,185,614 | |
Accrued management fee | 1,150,326 | |
Distribution and service plan fees payable | 38,976 | |
Other affiliated payables | 324,021 | |
Other payables and accrued expenses | 63,245 | |
Collateral on securities loaned, at value | 33,251,267 | |
Total liabilities | | 43,704,608 |
| | |
Net Assets | | $ 1,389,727,582 |
Net Assets consist of: | | |
Paid in capital | | $ 1,236,604,194 |
Undistributed net investment income | | 14,473,984 |
Accumulated undistributed net realized gain (loss) on investments and foreign currency transactions | | (10,711,888) |
Net unrealized appreciation (depreciation) on investments and assets and liabilities in foreign currencies | | 149,361,292 |
Net Assets | | $ 1,389,727,582 |
Statement of Assets and Liabilities - continued
| | October 31, 2015 |
| | |
Calculation of Maximum Offering Price Class A:
Net Asset Value and redemption price per share ($58,286,357 ÷ 1,288,166 shares) | | $ 45.25 |
| | |
Maximum offering price per share (100/94.25 of $45.25) | | $ 48.01 |
Class T:
Net Asset Value and redemption price per share ($12,820,215 ÷ 284,977 shares) | | $ 44.99 |
| | |
Maximum offering price per share (100/96.50 of $44.99) | | $ 46.62 |
Class B:
Net Asset Value and offering price per share ($2,677,631 ÷ 60,548 shares)A | | $ 44.22 |
| | |
Class C:
Net Asset Value and offering price per share ($21,609,613 ÷ 490,895 shares)A | | $ 44.02 |
| | |
Canada:
Net Asset Value, offering price and redemption price per share ($1,279,487,995 ÷ 28,086,893 shares) | | $ 45.55 |
| | |
Class I:
Net Asset Value, offering price and redemption price per share ($14,845,771 ÷ 326,722 shares) | | $ 45.44 |
A Redemption price per share is equal to net asset value less any applicable contingent deferred sales charge.
See accompanying notes which are an integral part of the financial statements.
Annual Report
Statement of Operations
| Year ended October 31, 2015 |
| | |
Investment Income | | |
Dividends | | $ 46,076,720 |
Interest | | 774 |
Income from Fidelity Central Funds (including $2,422,196 from security lending) | | 2,468,587 |
Income before foreign taxes withheld | | 48,546,081 |
Less foreign taxes withheld | | (6,671,693) |
Total income | | 41,874,388 |
| | |
Expenses | | |
Management fee | | |
Basic fee | $ 12,628,027 | |
Performance adjustment | 3,229,143 | |
Transfer agent fees | 3,835,510 | |
Distribution and service plan fees | 622,244 | |
Accounting and security lending fees | 823,779 | |
Custodian fees and expenses | 32,498 | |
Independent trustees' compensation | 7,941 | |
Registration fees | 81,078 | |
Audit | 72,385 | |
Legal | 5,911 | |
Miscellaneous | 13,840 | |
Total expenses before reductions | 21,352,356 | |
Expense reductions | (107,309) | 21,245,047 |
Net investment income (loss) | | 20,629,341 |
Realized and Unrealized Gain (Loss) | | |
Net realized gain (loss) on: | | |
Investment securities: | | |
Unaffiliated issuers | (6,519,666) | |
Foreign currency transactions | (476,530) | |
Total net realized gain (loss) | | (6,996,196) |
Change in net unrealized appreciation (depreciation) on: Investment securities | (283,149,563) | |
Assets and liabilities in foreign currencies | (7,842) | |
Total change in net unrealized appreciation (depreciation) | | (283,157,405) |
Net gain (loss) | | (290,153,601) |
Net increase (decrease) in net assets resulting from operations | | $ (269,524,260) |
Statement of Changes in Net Assets
| Year ended
October 31,
2015 | Year ended
October 31,
2014 |
Increase (Decrease) in Net Assets | | |
Operations | | |
Net investment income (loss) | $ 20,629,341 | $ 24,923,588 |
Net realized gain (loss) | (6,996,196) | 290,863,952 |
Change in net unrealized appreciation (depreciation) | (283,157,405) | (164,747,262) |
Net increase (decrease) in net assets resulting from operations | (269,524,260) | 151,040,278 |
Distributions to shareholders from net investment income | (24,029,674) | (9,338,915) |
Distributions to shareholders from net realized gain | (262,730,704) | (13,503,099) |
Total distributions | (286,760,378) | (22,842,014) |
Share transactions - net increase (decrease) | (304,156,881) | (365,686,992) |
Redemption fees | 128,345 | 129,289 |
Total increase (decrease) in net assets | (860,313,174) | (237,359,439) |
| | |
Net Assets | | |
Beginning of period | 2,250,040,756 | 2,487,400,195 |
End of period (including undistributed net investment income of $14,473,984 and undistributed net investment income of $20,538,750, respectively) | $ 1,389,727,582 | $ 2,250,040,756 |
See accompanying notes which are an integral part of the financial statements.
Annual Report
Financial Highlights - Fidelity Canada Fund Class A
Years ended October 31, | 2015 | 2014 | 2013 | 2012 | 2011 |
Selected Per-Share Data | | | | | |
Net asset value, beginning of period | $ 60.56 | $ 57.31 | $ 53.65 | $ 52.20 | $ 53.81 |
Income from Investment Operations | | | | | |
Net investment income (loss) C | .45 | .47 | .60 | .57 | .34 |
Net realized and unrealized gain (loss) | (8.04) | 3.13 | 3.63 | 1.50 | (1.17) |
Total from investment operations | (7.59) | 3.60 | 4.23 | 2.07 | (.83) |
Distributions from net investment income | (.50) | (.03) | (.57) | (.33) | (.35) |
Distributions from net realized gain | (7.22) | (.32) | - | (.29) | (.44) |
Total distributions | (7.72) | (.35) | (.57) | (.62) | (.79) |
Redemption fees added to paid in capitalC | -G | -G | -G | -G | .01 |
Net asset value, end of period | $ 45.25 | $ 60.56 | $ 57.31 | $ 53.65 | $ 52.20 |
Total ReturnA, B | (14.32)% | 6.32% | 7.98% | 4.04% | (1.64)% |
Ratios to Average Net AssetsD, F | | | | | |
Expenses before reductions | 1.43% | 1.29% | 1.19% | 1.08% | 1.12% |
Expenses net of fee waivers, if any | 1.43% | 1.29% | 1.19% | 1.08% | 1.12% |
Expenses net of all reductions | 1.43% | 1.29% | 1.18% | 1.08% | 1.12% |
Net investment income (loss) | .90% | .79% | 1.11% | 1.11% | .59% |
Supplemental Data | | | | | |
Net assets, end of period (000 omitted) | $ 58,286 | $ 95,004 | $ 116,661 | $ 159,597 | $ 215,369 |
Portfolio turnover rateE | 24% | 85% | 64% | 86% | 104% |
A Total returns would have been lower if certain expenses had not been reduced during the applicable periods shown. B Total returns do not include the effect of the sales charges. C Calculated based on average shares outstanding during the period. D Fees and expenses of any underlying Fidelity Central Funds are not included in the Fund's expense ratio. The Fund indirectly bears its proportionate share of the expenses of any underlying Fidelity Central Funds. E Amount does not include the portfolio activity of any underlying Fidelity Central Funds. F Expense ratios reflect operating expenses of the class. Expenses before reductions do not reflect amounts reimbursed by the investment adviser or reductions from brokerage service arrangements or reductions from other expense offset arrangements and do not represent the amount paid by the class during periods when reimbursements or reductions occur. Expenses net of fee waivers reflect expenses after reimbursement by the investment adviser but prior to reductions from brokerage service arrangements or other expense offset arrangements. Expenses net of all reductions represent the net expenses paid by the class. G Amount represents less than $.005 per share. |
Financial Highlights - Fidelity Canada Fund Class T
Years ended October 31, | 2015 | 2014 | 2013 | 2012 | 2011 |
Selected Per-Share Data | | | | | |
Net asset value, beginning of period | $ 60.22 | $ 57.14 | $ 53.48 | $ 52.01 | $ 53.64 |
Income from Investment Operations | | | | | |
Net investment income (loss) C | .29 | .29 | .45 | .43 | .17 |
Net realized and unrealized gain (loss) | (8.00) | 3.11 | 3.63 | 1.49 | (1.16) |
Total from investment operations | (7.71) | 3.40 | 4.08 | 1.92 | (.99) |
Distributions from net investment income | (.30) | - | (.42) | (.16) | (.21) |
Distributions from net realized gain | (7.22) | (.32) | - | (.29) | (.44) |
Total distributions | (7.52) | (.32) | (.42) | (.45) | (.65) |
Redemption fees added to paid in capitalC | -G | -G | -G | -G | .01 |
Net asset value, end of period | $ 44.99 | $ 60.22 | $ 57.14 | $ 53.48 | $ 52.01 |
Total ReturnA, B | (14.58)% | 5.99% | 7.69% | 3.74% | (1.93)% |
Ratios to Average Net AssetsD, F | | | | | |
Expenses before reductions | 1.75% | 1.59% | 1.47% | 1.36% | 1.42% |
Expenses net of fee waivers, if any | 1.75% | 1.59% | 1.47% | 1.36% | 1.42% |
Expenses net of all reductions | 1.75% | 1.59% | 1.46% | 1.36% | 1.42% |
Net investment income (loss) | .58% | .48% | .83% | .83% | .30% |
Supplemental Data | | | | | |
Net assets, end of period (000 omitted) | $ 12,820 | $ 21,989 | $ 23,751 | $ 29,626 | $ 34,323 |
Portfolio turnover rateE | 24% | 85% | 64% | 86% | 104% |
A Total returns would have been lower if certain expenses had not been reduced during the applicable periods shown. B Total returns do not include the effect of the sales charges. C Calculated based on average shares outstanding during the period. D Fees and expenses of any underlying Fidelity Central Funds are not included in the Fund's expense ratio. The Fund indirectly bears its proportionate share of the expenses of any underlying Fidelity Central Funds. E Amount does not include the portfolio activity of any underlying Fidelity Central Funds. F Expense ratios reflect operating expenses of the class. Expenses before reductions do not reflect amounts reimbursed by the investment adviser or reductions from brokerage service arrangements or reductions from other expense offset arrangements and do not represent the amount paid by the class during periods when reimbursements or reductions occur. Expenses net of fee waivers reflect expenses after reimbursement by the investment adviser but prior to reductions from brokerage service arrangements or other expense offset arrangements. Expenses net of all reductions represent the net expenses paid by the class. G Amount represents less than $.005 per share. |
See accompanying notes which are an integral part of the financial statements.
Annual Report
Financial Highlights - Fidelity Canada Fund Class B
Years ended October 31, | 2015 | 2014 | 2013 | 2012 | 2011 |
Selected Per-Share Data | | | | | |
Net asset value, beginning of period | $ 59.27 | $ 56.53 | $ 52.89 | $ 51.37 | $ 53.03 |
Income from Investment Operations | | | | | |
Net investment income (loss) C | .05 | (.01) | .18 | .17 | (.11) |
Net realized and unrealized gain (loss) | (7.88) | 3.07 | 3.60 | 1.49 | (1.14) |
Total from investment operations | (7.83) | 3.06 | 3.78 | 1.66 | (1.25) |
Distributions from net investment income | - | - | (.14) | - | (.01) |
Distributions from net realized gain | (7.22) | (.32) | - | (.14) | (.41) |
Total distributions | (7.22) | (.32) | (.14) | (.14) | (.42) |
Redemption fees added to paid in capitalC | -G | -G | -G | -G | .01 |
Net asset value, end of period | $ 44.22 | $ 59.27 | $ 56.53 | $ 52.89 | $ 51.37 |
Total ReturnA, B | (14.99)% | 5.45% | 7.17% | 3.25% | (2.41)% |
Ratios to Average Net AssetsD, F | | | | | |
Expenses before reductions | 2.22% | 2.09% | 1.96% | 1.85% | 1.91% |
Expenses net of fee waivers, if any | 2.22% | 2.09% | 1.96% | 1.85% | 1.91% |
Expenses net of all reductions | 2.22% | 2.09% | 1.95% | 1.85% | 1.91% |
Net investment income (loss) | .11% | (.01)% | .34% | .34% | (.20)% |
Supplemental Data | | | | | |
Net assets, end of period (000 omitted) | $ 2,678 | $ 6,290 | $ 7,737 | $ 9,804 | $ 11,866 |
Portfolio turnover rateE | 24% | 85% | 64% | 86% | 104% |
A Total returns would have been lower if certain expenses had not been reduced during the applicable periods shown. B Total returns do not include the effect of the contingent deferred sales charge. C Calculated based on average shares outstanding during the period. D Fees and expenses of any underlying Fidelity Central Funds are not included in the Fund's expense ratio. The Fund indirectly bears its proportionate share of the expenses of any underlying Fidelity Central Funds. E Amount does not include the portfolio activity of any underlying Fidelity Central Funds. F Expense ratios reflect operating expenses of the class. Expenses before reductions do not reflect amounts reimbursed by the investment adviser or reductions from brokerage service arrangements or reductions from other expense offset arrangements and do not represent the amount paid by the class during periods when reimbursements or reductions occur. Expenses net of fee waivers reflect expenses after reimbursement by the investment adviser but prior to reductions from brokerage service arrangements or other expense offset arrangements. Expenses net of all reductions represent the net expenses paid by the class. G Amount represents less than $.005 per share. |
Financial Highlights - Fidelity Canada Fund Class C
Years ended October 31, | 2015 | 2014 | 2013 | 2012 | 2011 |
Selected Per-Share Data | | | | | |
Net asset value, beginning of period | $ 59.04 | $ 56.27 | $ 52.61 | $ 51.19 | $ 52.87 |
Income from Investment Operations | | | | | |
Net investment income (loss) C | .07 | .02 | .20 | .19 | (.08) |
Net realized and unrealized gain (loss) | (7.85) | 3.07 | 3.58 | 1.46 | (1.14) |
Total from investment operations | (7.78) | 3.09 | 3.78 | 1.65 | (1.22) |
Distributions from net investment income | (.02) | - | (.12) | - | (.03) |
Distributions from net realized gain | (7.22) | (.32) | - | (.23) | (.44) |
Total distributions | (7.24) | (.32) | (.12) | (.23) | (.47) |
Redemption fees added to paid in capitalC | -G | -G | -G | -G | .01 |
Net asset value, end of period | $ 44.02 | $ 59.04 | $ 56.27 | $ 52.61 | $ 51.19 |
Total ReturnA, B | (14.96)% | 5.53% | 7.21% | 3.26% | (2.36)% |
Ratios to Average Net AssetsD, F | | | | | |
Expenses before reductions | 2.19% | 2.03% | 1.93% | 1.82% | 1.86% |
Expenses net of fee waivers, if any | 2.19% | 2.03% | 1.92% | 1.82% | 1.86% |
Expenses net of all reductions | 2.18% | 2.03% | 1.92% | 1.82% | 1.86% |
Net investment income (loss) | .14% | .04% | .37% | .37% | (.15)% |
Supplemental Data | | | | | |
Net assets, end of period (000 omitted) | $ 21,610 | $ 38,749 | $ 46,040 | $ 66,500 | $ 87,990 |
Portfolio turnover rateE | 24% | 85% | 64% | 86% | 104% |
A Total returns would have been lower if certain expenses had not been reduced during the applicable periods shown. B Total returns do not include the effect of the contingent deferred sales charge. C Calculated based on average shares outstanding during the period. D Fees and expenses of any underlying Fidelity Central Funds are not included in the Fund's expense ratio. The Fund indirectly bears its proportionate share of the expenses of any underlying Fidelity Central Funds. E Amount does not include the portfolio activity of any underlying Fidelity Central Funds. F Expense ratios reflect operating expenses of the class. Expenses before reductions do not reflect amounts reimbursed by the investment adviser or reductions from brokerage service arrangements or reductions from other expense offset arrangements and do not represent the amount paid by the class during periods when reimbursements or reductions occur. Expenses net of fee waivers reflect expenses after reimbursement by the investment adviser but prior to reductions from brokerage service arrangements or other expense offset arrangements. Expenses net of all reductions represent the net expenses paid by the class. G Amount represents less than $.005 per share. |
See accompanying notes which are an integral part of the financial statements.
Annual Report
Financial Highlights - Fidelity Canada Fund
Years ended October 31, | 2015 | 2014 | 2013 | 2012 | 2011 |
Selected Per-Share Data | | | | | |
Net asset value, beginning of period | $ 60.95 | $ 57.72 | $ 54.05 | $ 52.59 | $ 54.14 |
Income from Investment Operations | | | | | |
Net investment income (loss) B | .60 | .66 | .77 | .73 | .52 |
Net realized and unrealized gain (loss) | (8.09) | 3.13 | 3.66 | 1.51 | (1.18) |
Total from investment operations | (7.49) | 3.79 | 4.43 | 2.24 | (.66) |
Distributions from net investment income | (.69) | (.24) | (.76) | (.49) | (.46) |
Distributions from net realized gain | (7.22) | (.32) | - | (.29) | (.44) |
Total distributions | (7.91) | (.56) | (.76) | (.78) | (.90) |
Redemption fees added to paid in capitalB | -F | -F | -F | -F | .01 |
Net asset value, end of period | $ 45.55 | $ 60.95 | $ 57.72 | $ 54.05 | $ 52.59 |
Total ReturnA | (14.08)% | 6.64% | 8.32% | 4.36% | (1.33)% |
Ratios to Average Net AssetsC, E | | | | | |
Expenses before reductions | 1.15% | .98% | .87% | .77% | .82% |
Expenses net of fee waivers, if any | 1.15% | .98% | .87% | .77% | .82% |
Expenses net of all reductions | 1.14% | .98% | .86% | .77% | .82% |
Net investment income (loss) | 1.18% | 1.09% | 1.42% | 1.42% | .90% |
Supplemental Data | | | | | |
Net assets, end of period (000 omitted) | $ 1,279,488 | $ 2,057,843 | $ 2,262,380 | $ 2,992,597 | $ 3,778,765 |
Portfolio turnover rateD | 24% | 85% | 64% | 86% | 104% |
A Total returns would have been lower if certain expenses had not been reduced during the applicable periods shown. B Calculated based on average shares outstanding during the period. C Fees and expenses of any underlying Fidelity Central Funds are not included in the Fund's expense ratio. The Fund indirectly bears its proportionate share of the expenses of any underlying Fidelity Central Funds. D Amount does not include the portfolio activity of any underlying Fidelity Central Funds. E Expense ratios reflect operating expenses of the class. Expenses before reductions do not reflect amounts reimbursed by the investment adviser or reductions from brokerage service arrangements or reductions from other expense offset arrangements and do not represent the amount paid by the class during periods when reimbursements or reductions occur. Expenses net of fee waivers reflect expenses after reimbursement by the investment adviser but prior to reductions from brokerage service arrangements or other expense offset arrangements. Expenses net of all reductions represent the net expenses paid by the class. F Amount represents less than $.005 per share. |
Financial Highlights - Fidelity Canada Fund Class I
Years ended October 31, | 2015 | 2014 | 2013 | 2012 | 2011 |
Selected Per-Share Data | | | | | |
Net asset value, beginning of period | $ 60.80 | $ 57.57 | $ 53.91 | $ 52.44 | $ 54.02 |
Income from Investment Operations | | | | | |
Net investment income (loss) B | .61 | .65 | .78 | .74 | .51 |
Net realized and unrealized gain (loss) | (8.07) | 3.12 | 3.64 | 1.50 | (1.18) |
Total from investment operations | (7.46) | 3.77 | 4.42 | 2.24 | (.67) |
Distributions from net investment income | (.68) | (.22) | (.76) | (.48) | (.48) |
Distributions from net realized gain | (7.22) | (.32) | - | (.29) | (.44) |
Total distributions | (7.90) | (.54) | (.76) | (.77) | (.92) |
Redemption fees added to paid in capitalB | -F | -F | -F | -F | .01 |
Net asset value, end of period | $ 45.44 | $ 60.80 | $ 57.57 | $ 53.91 | $ 52.44 |
Total ReturnA | (14.05)% | 6.62% | 8.34% | 4.38% | (1.35)% |
Ratios to Average Net AssetsC, E | | | | | |
Expenses before reductions | 1.13% | 1.00% | .86% | .76% | .82% |
Expenses net of fee waivers, if any | 1.12% | 1.00% | .86% | .76% | .82% |
Expenses net of all reductions | 1.12% | 1.00% | .85% | .76% | .82% |
Net investment income (loss) | 1.21% | 1.08% | 1.43% | 1.42% | .89% |
Supplemental Data | | | | | |
Net assets, end of period (000 omitted) | $ 14,846 | $ 30,165 | $ 30,831 | $ 59,245 | $ 68,112 |
Portfolio turnover rateD | 24% | 85% | 64% | 86% | 104% |
A Total returns would have been lower if certain expenses had not been reduced during the applicable periods shown. B Calculated based on average shares outstanding during the period. C Fees and expenses of any underlying Fidelity Central Funds are not included in the Fund's expense ratio. The Fund indirectly bears its proportionate share of the expenses of any underlying Fidelity Central Funds. D Amount does not include the portfolio activity of any underlying Fidelity Central Funds. E Expense ratios reflect operating expenses of the class. Expenses before reductions do not reflect amounts reimbursed by the investment adviser or reductions from brokerage service arrangements or reductions from other expense offset arrangements and do not represent the amount paid by the class during periods when reimbursements or reductions occur. Expenses net of fee waivers reflect expenses after reimbursement by the investment adviser but prior to reductions from brokerage service arrangements or other expense offset arrangements. Expenses net of all reductions represent the net expenses paid by the class. F Amount represents less than $.005 per share. |
See accompanying notes which are an integral part of the financial statements.
Annual Report
For the period ended October 31, 2015
1. Organization.
Fidelity Canada Fund (the Fund) is a fund of Fidelity Investment Trust (the Trust) and is authorized to issue an unlimited number of shares. The Trust is registered under the Investment Company Act of 1940, as amended (the 1940 Act), as an open-end management investment company organized as a Massachusetts business trust. The Fund offers Class A, Class T, Class C, Canada and Class I (formerly Institutional Class) shares, each of which, along with Class B shares, has equal rights as to assets and voting privileges. Class B shares are closed to new accounts and additional purchases, except for exchanges and reinvestments. Each class has exclusive voting rights with respect to matters that affect that class. Class B shares will automatically convert to Class A shares after a holding period of seven years from the initial date of purchase.
2. Investments in Fidelity Central Funds.
The Fund invests in Fidelity Central Funds, which are open-end investment companies generally available only to other investment companies and accounts managed by the investment adviser and its affiliates. The Fund's Schedule of Investments lists each of the Fidelity Central Funds held as of period end, if any, as an investment of the Fund, but does not include the underlying holdings of each Fidelity Central Fund. As an Investing Fund, the Fund indirectly bears its proportionate share of the expenses of the underlying Fidelity Central Funds.
The Money Market Central Funds seek preservation of capital and current income and are managed by Fidelity Investments Money Management, Inc. (FIMM), an affiliate of the investment adviser. Annualized expenses of the Money Market Central Funds as of their most recent shareholder report date are less than .005%.
A complete unaudited list of holdings for each Fidelity Central Fund is available upon request or at the Securities and Exchange Commission (the SEC) website at www.sec.gov. In addition, the financial statements of the Fidelity Central Funds, which are not covered by the Fund's Report of Independent Registered Public Accounting Firm, are available on the SEC website or upon request.
3. Significant Accounting Policies.
The financial statements have been prepared in conformity with accounting principles generally accepted in the United States of America (GAAP), which require management to make certain estimates and assumptions at the date of the financial statements. Actual results could differ from those estimates. Subsequent events, if any, through the date that the financial statements were issued have been evaluated in the preparation of the financial statements. The following summarizes the significant accounting policies of the Fund:
Investment Valuation. Investments are valued as of 4:00 p.m. Eastern time on the last calendar day of the period. The Board of Trustees (the Board) has delegated the day to day responsibility for the valuation of the Fund's investments to the Fidelity Management & Research Company (FMR) Fair Value Committee (the Committee). In accordance with valuation policies and procedures approved by the Board, the Fund attempts to obtain prices from one or more third party pricing vendors or brokers to value its investments. When current market prices, quotations or currency exchange rates are not readily available or reliable, investments will be fair valued in good faith by the Committee, in accordance with procedures adopted by the Board. Factors used in determining fair value vary by investment type and may include market or investment specific events. The frequency with which these procedures are used cannot be predicted and they may be utilized to a significant extent. The Committee oversees the Fund's valuation policies and procedures and reports to the Board on the Committee's activities and fair value determinations. The Board monitors the appropriateness of the procedures used in valuing the Fund's investments and ratifies the fair value determinations of the Committee.
The Fund categorizes the inputs to valuation techniques used to value its investments into a disclosure hierarchy consisting of three levels as shown below:
Level 1 - quoted prices in active markets for identical investments
Level 2 - other significant observable inputs (including quoted prices for similar investments, interest rates, prepayment speeds, etc.)
Level 3 - unobservable inputs (including the Fund's own assumptions based on the best information available)
Valuation techniques used to value the Fund's investments by major category are as follows:
Equity securities, including restricted securities, for which market quotations are readily available, are valued at the last reported sale price or official closing price as reported by a third party pricing vendor on the primary market or exchange on which they are traded and are categorized as Level 1 in the hierarchy. In the event there were no sales during the day or closing prices are not available, securities are valued at the last quoted bid price or may be valued using the last available price and are generally categorized as Level 2 in the hierarchy. For foreign equity securities, when market or security specific events arise, comparisons to the valuation of American Depositary Receipts (ADRs), futures contracts, Exchange-Traded Funds (ETFs) and certain indexes as well as quoted prices for similar securities may be used and would be categorized as Level 2 in the hierarchy. Utilizing these techniques may result in transfers between Level 1 and Level 2. For equity securities, including restricted securities, where observable inputs are limited, assumptions about market activity and risk are used and these securities may be categorized as Level 3 in the hierarchy.
Annual Report
3. Significant Accounting Policies - continued
Investment Valuation - continued
Investments in open-end mutual funds, including the Fidelity Central Funds, are valued at their closing net asset value (NAV) each business day and are categorized as Level 1 in the hierarchy.
Changes in valuation techniques may result in transfers in or out of an assigned level within the disclosure hierarchy. The aggregate value of investments by input level as of October 31, 2015 is included at the end of the Fund's Schedule of Investments.
Foreign Currency. The Fund may use foreign currency contracts to facilitate transactions in foreign-denominated securities. Gains and losses from these transactions may arise from changes in the value of the foreign currency or if the counterparties do not perform under the contracts' terms.
Foreign-denominated assets, including investment securities, and liabilities are translated into U.S. dollars at the exchange rates at period end. Purchases and sales of investment securities, income and dividends received and expenses denominated in foreign currencies are translated into U.S. dollars at the exchange rate in effect on the transaction date.
The effects of exchange rate fluctuations on investments are included with the net realized and unrealized gain (loss) on investment securities. Other foreign currency transactions resulting in realized and unrealized gain (loss) are disclosed separately.
Investment Transactions and Income. For financial reporting purposes, the Fund's investment holdings and NAV include trades executed through the end of the last business day of the period. The NAV per share for processing shareholder transactions is calculated as of the close of business of the New York Stock Exchange (NYSE), normally 4:00 p.m. Eastern time and includes trades executed through the end of the prior business day. Gains and losses on securities sold are determined on the basis of identified cost and may include proceeds received from litigation. Dividend income is recorded on the ex-dividend date, except for certain dividends from foreign securities where the ex-dividend date may have passed, which are recorded as soon as the Fund is informed of the ex-dividend date. Non-cash dividends included in dividend income, if any, are recorded at the fair market value of the securities received. Income and capital gain distributions from Fidelity Central Funds, if any, are recorded on the ex-dividend date. Distributions received on securities that represent a return of capital or capital gain are recorded as a reduction of cost of investments and/or as a realized gain. Subsequent to ex-dividend date the Fund determines the components of these distributions, based upon receipt of tax filings or other correspondence relating to the underlying investment. Interest income is accrued as earned and includes coupon interest and amortization of premium and accretion of discount on debt securities as applicable. Investment income is recorded net of foreign taxes withheld where recovery of such taxes is uncertain.
Class Allocations and Expenses. Investment income, realized and unrealized capital gains and losses, common expenses of the Fund, and certain fund-level expense reductions, if any, are allocated daily on a pro-rata basis to each class based on the relative net assets of each class to the total net assets of the Fund. Each class differs with respect to transfer agent and distribution and service plan fees incurred. Certain expense reductions may also differ by class. For the reporting period, the allocated portion of income and expenses to each class as a percent of its average net assets may vary due to the timing of recording these transactions in relation to fluctuating net assets of the classes. Expenses directly attributable to a fund are charged to that fund. Expenses attributable to more than one fund are allocated among the respective funds on the basis of relative net assets or other appropriate methods. Expense estimates are accrued in the period to which they relate and adjustments are made when actual amounts are known.
Income Tax Information and Distributions to Shareholders. Each year, the Fund intends to qualify as a regulated investment company under Subchapter M of the Internal Revenue Code, including distributing substantially all of its taxable income and realized gains. As a result, no provision for U.S. Federal income taxes is required. As of October 31, 2015, the Fund did not have any unrecognized tax benefits in the financial statements; nor is the Fund aware of any tax positions for which it is reasonably possible that the total amounts of unrecognized tax benefits will significantly change in the next twelve months. The Fund files a U.S. federal tax return, in addition to state and local tax returns as required. The Fund's federal income tax returns are subject to examination by the Internal Revenue Service (IRS) for a period of three fiscal years after they are filed. State and local tax returns may be subject to examination for an additional fiscal year depending on the jurisdiction. Foreign taxes are provided for based on the Fund's understanding of the tax rules and rates that exist in the foreign markets in which it invests.
Distributions are declared and recorded on the ex-dividend date. Income dividends and capital gain distributions are declared separately for each class. Income and capital gain distributions are determined in accordance with income tax regulations, which may differ from GAAP. In addition, the Fund claimed a portion of the payment made to redeeming shareholders as a distribution for income tax purposes.
Capital accounts within the financial statements are adjusted for permanent book-tax differences. These adjustments have no impact on net assets or the results of operations. Capital accounts are not adjusted for temporary book-tax differences which will reverse in a subsequent period.
Book-tax differences are primarily due to foreign currency transactions, passive foreign investment companies (PFIC), deferred trustees compensation and losses deferred due to wash sales.
Annual Report
Notes to Financial Statements - continued
3. Significant Accounting Policies - continued
Income Tax Information and Distributions to Shareholders - continued
The federal tax cost of investment securities and unrealized appreciation (depreciation) as of period end were as follows:
Gross unrealized appreciation | $ 287,975,691 |
Gross unrealized depreciation | (151,197,499) |
Net unrealized appreciation (depreciation) on securities | $ 136,778,192 |
Tax Cost | $ 1,283,918,896 |
The tax-based components of distributable earnings as of period end were as follows:
Undistributed ordinary income | $ 14,466,211 |
Undistributed long-term capital gain | $ 1,887,468 |
Net unrealized appreciation (depreciation) on securities and other investments | $ 136,769,940 |
The tax character of distributions paid was as follows:
| October 31, 2015 | October 31, 2014 |
Ordinary Income | $ 24,029,674 | $ 9,338,915 |
Long-term Capital Gains | 262,730,704 | 13,503,099 |
Total | $ 286,760,378 | $ 22,842,014 |
Short-Term Trading (Redemption) Fees. Shares held by investors in the Fund less than 90 days may have been subject to a redemption fee equal to 1.50% of the NAV of shares redeemed. All redemption fees, which reduce the proceeds of the shareholder redemption, are retained by the Fund and accounted for as an addition to paid in capital.
4. Purchases and Sales of Investments.
Purchases and sales of securities, other than short-term securities, aggregated $424,331,275 and $975,977,104, respectively.
5. Fees and Other Transactions with Affiliates.
Management Fee. Fidelity Management & Research Company (the investment adviser) and its affiliates provide the Fund with investment management related services for which the Fund pays a monthly management fee. The management fee is the sum of an individual fund fee rate that is based on an annual rate of .45% of the Fund's average net assets and an annualized group fee rate that averaged .25% during the period. The group fee rate is based upon the average net assets of all the mutual funds advised by the investment adviser, including any mutual funds previously advised by the investment adviser that are currently advised by Fidelity SelectCo, LLC, an affiliate of the investment adviser. The group fee rate decreases as assets under management increase and increases as assets under management decrease. In addition, the management fee is subject to a performance adjustment (up to a maximum of ± .20% of the Fund's average net assets over a 36 month performance period). The upward or downward adjustment to the management fee is based on the relative investment performance of Canada as compared to its benchmark index, the S&P/TSX Composite Index, over the same 36 month performance period. For the reporting period, the total annual management fee rate, including the performance adjustment, was .88% of the Fund's average net assets. The performance adjustment included in the management fee rate may be higher or lower than the maximum performance adjustment rate due to the difference between the average net assets for the reporting and performance periods.
Distribution and Service Plan Fees. In accordance with Rule 12b-1 of the 1940 Act, the Fund has adopted separate Distribution and Service Plans for each class of shares. Certain classes pay Fidelity Distributors Corporation (FDC), an affiliate of the investment adviser, separate Distribution and Service Fees, each of which is based on an annual percentage of each class' average net assets. In addition, FDC may pay financial intermediaries for selling shares of the Fund and providing shareholder support services. For the period, the Distribution and Service Fee rates, total fees and amounts retained by FDC were as follows:
| Distribution
Fee | Service
Fee | Total Fees | Retained
by FDC |
Class A | -% | .25% | $ 191,960 | $ 4,821 |
Class T | .25% | .25% | 83,690 | 504 |
Class B | .75% | .25% | 44,747 | 33,560 |
Class C | .75% | .25% | 301,847 | 11,953 |
| | | $ 622,244 | $ 50,838 |
Annual Report
5. Fees and Other Transactions with Affiliates - continued
Sales Load. FDC may receive a front-end sales charge of up to 5.75% for selling Class A shares and 3.50% for selling Class T shares, some of which is paid to financial intermediaries for selling shares of the Fund. Depending on the holding period, FDC may receive contingent deferred sales charges levied on Class A, Class T, Class B, and Class C redemptions. The deferred sales charges range from 5.00% to 1.00% for Class B shares, 1.00% for Class C shares, 1.00% for certain purchases of Class A shares and .25% for certain purchases of Class T shares.
For the period, sales charge amounts retained by FDC were as follows:
| Retained
by FDC |
Class A | $ 15,562 |
Class T | 3,236 |
Class BA | 7,910 |
Class C A | 1,549 |
| $ 28,257 |
A When Class B and Class C shares are initially sold, FDC pays commissions from its own resources to financial intermediaries through which the sales are made.
Transfer Agent Fees. Fidelity Investments Institutional Operations Company, Inc., (FIIOC), an affiliate of the investment adviser, is the transfer, dividend disbursing and shareholder servicing agent for each class of the Fund. FIIOC receives account fees and asset-based fees that vary according to the account size and type of account of the shareholders of the respective classes of the Fund. FIIOC pays for typesetting, printing and mailing of shareholder reports, except proxy statements.
For the period, transfer agent fees for each class were as follows:
| Amount | % of
Class-Level Average
Net Assets |
Class A | $ 186,677 | .24 |
Class T | 51,332 | .31 |
Class B | 12,380 | .28 |
Class C | 73,747 | .25 |
Canada | 3,470,909 | .21 |
Class I | 40,465 | .19 |
| $ 3,835,510 | |
Accounting and Security Lending Fees. Fidelity Service Company, Inc. (FSC), an affiliate of the investment adviser, maintains the Fund's accounting records. The accounting fee is based on the level of average net assets for each month. Under a separate contract, FSC administers the security lending program. The security lending fee is based on the number and duration of lending transactions.
Brokerage Commissions. The fund placed a portion of its portfolio transactions with brokerage firms which are affiliates of the investment adviser. Brokerage commissions are included in net realized gain (loss) and change in net unrealized appreciation (depreciation) in the Statement of Operations. The commissions paid to these affiliated firms were $680 for the period.
6. Committed Line of Credit.
The Fund participates with other funds managed by the investment adviser or an affiliate in a $4.25 billion credit facility (the "line of credit") to be utilized for temporary or emergency purposes to fund shareholder redemptions or for other short-term liquidity purposes. The Fund has agreed to pay commitment fees on its pro-rata portion of the line of credit, which amounted to $2,735 and is reflected in Miscellaneous expenses on the Statement of Operations. During the period, the Fund did not borrow on this line of credit.
Annual Report
Notes to Financial Statements - continued
7. Security Lending.
The Fund lends portfolio securities through a lending agent from time to time in order to earn additional income. For equity securities, a lending agent is used and may loan securities to certain qualified borrowers, including Fidelity Capital Markets (FCM), a broker-dealer affiliated with the Fund. On the settlement date of the loan, the Fund receives collateral (in the form of U.S. Treasury obligations, letters of credit and/or cash) against the loaned securities and maintains collateral in an amount not less than 100% of the market value of the loaned securities during the period of the loan. The market value of the loaned securities is determined at the close of business of the Fund and any additional required collateral is delivered to the Fund on the next business day. The Fund or borrower may terminate the loan at any time, and if the borrower defaults on its obligation to return the securities loaned because of insolvency or other reasons, the Fund may apply collateral received from the borrower against the obligation. The Fund may experience delays and costs in recovering the securities loaned. Any cash collateral received is invested in the Fidelity Securities Lending Cash Central Fund. The value of loaned securities and cash collateral at period end are disclosed on the Fund's Statement of Assets and Liabilities. The value of securities loaned to FCM at period end was $920,121. Security lending income represents the income earned on investing cash collateral, less rebates paid to borrowers and any lending agent fees associated with the loan, plus any premium payments received for lending certain types of securities. Security lending income is presented in the Statement of Operations as a component of income from Fidelity Central Funds, and includes $33,265 from securities loaned to FCM.
8. Expense Reductions.
Commissions paid to certain brokers with whom the investment adviser, or its affiliates, places trades on behalf of the Fund include an amount in addition to trade execution, which may be rebated back to the Fund to offset certain expenses. This amount totaled $30,896 for the period.
In addition, during the period the investment adviser reimbursed and/or waived a portion of fund-level operating expenses in the amount of $6,891 and a portion of class-level operating expenses as follows:
| Amount |
Class A | $ 2,472 |
Class T | 46 |
Class B | 30 |
Class C | 993 |
Canada | 65,257 |
Class I | 724 |
| $ 69,522 |
9. Distributions to Shareholders.
Distributions to shareholders of each class were as follows:
Years ended October 31, | 2015 | 2014 |
From net investment income | | |
Class A | $ 783,478 | $ 53,142 |
Class T | 106,245 | - |
Class C | 12,920 | - |
Canada | 22,800,214 | 9,173,811 |
Class I | 326,817 | 111,962 |
Total | $ 24,029,674 | $ 9,338,915 |
From net realized gain | | |
Class A | $ 11,358,847 | $ 629,831 |
Class T | 2,548,483 | 130,152 |
Class B | 742,098 | 42,217 |
Class C | 4,664,328 | 256,584 |
Canada | 239,967,215 | 12,282,929 |
Class I | 3,449,733 | 161,386 |
Total | $ 262,730,704 | $ 13,503,099 |
Annual Report
10. Share Transactions.
Share transactions for each class were as follows and may contain automatic conversions between classes or exchanges between funds:
| Shares | Dollars |
Years ended October 31, | 2015 | 2014 | 2015 | 2014 |
Class A | | | | |
Shares sold | 153,407 | 144,381 | $ 8,099,168 | $ 8,740,780 |
Reinvestment of distributions | 200,582 | 9,784 | 10,552,616 | 552,980 |
Shares redeemed | (634,705) | (620,817) | (31,737,294) | (36,791,904) |
Net increase (decrease) | (280,716) | (466,652) | $ (13,085,510) | $ (27,498,144) |
Class T | | | | |
Shares sold | 21,812 | 29,501 | $ 1,102,045 | $ 1,790,320 |
Reinvestment of distributions | 49,518 | 2,264 | 2,597,730 | 127,592 |
Shares redeemed | (151,491) | (82,268) | (7,597,599) | (4,830,983) |
Net increase (decrease) | (80,161) | (50,503) | $ (3,897,824) | $ (2,913,071) |
Class B | | | | |
Shares sold | 1,663 | 547 | $ 85,823 | $ 32,504 |
Reinvestment of distributions | 12,380 | 630 | 641,184 | 35,107 |
Shares redeemed | (59,611) | (31,942) | (2,906,257) | (1,874,606) |
Net increase (decrease) | (45,568) | (30,765) | $ (2,179,250) | $ (1,806,995) |
Class C | | | | |
Shares sold | 42,631 | 50,749 | $ 2,146,853 | $ 2,984,240 |
Reinvestment of distributions | 75,003 | 3,715 | 3,864,885 | 206,074 |
Shares redeemed | (283,087) | (216,291) | (13,692,762) | (12,480,545) |
Net increase (decrease) | (165,453) | (161,827) | $ (7,681,024) | $ (9,290,231) |
Canada | | | | |
Shares sold | 1,250,697 | 1,968,387 | $ 63,450,179 | $ 119,959,708 |
Reinvestment of distributions | 4,716,591 | 358,786 | 249,177,482 | 20,353,959 |
Shares redeemed | (11,643,757) | (7,758,261) | (581,614,067) | (462,389,717) |
Net increase (decrease) | (5,676,469) | (5,431,088) | $ (268,986,406) | $ (322,076,050) |
Class I | | | | |
Shares sold | 66,679 | 331,645 | $ 3,430,310 | $ 20,156,294 |
Reinvestment of distributions | 49,883 | 3,804 | 2,628,352 | 215,319 |
Shares redeemed | (285,976) | (374,817) | (14,385,529) | (22,474,114) |
Net increase (decrease) | (169,414) | (39,368) | $ (8,326,867) | $ (2,102,501) |
11. Other.
The Fund's organizational documents provide former and current trustees and officers with a limited indemnification against liabilities arising in connection with the performance of their duties to the Fund. In the normal course of business, the Fund may also enter into contracts that provide general indemnifications. The Fund's maximum exposure under these arrangements is unknown as this would be dependent on future claims that may be made against the Fund. The risk of material loss from such claims is considered remote.
Annual Report
To the Trustees of Fidelity Investment Trust and the Shareholders of Fidelity Canada Fund:
In our opinion, the accompanying statement of assets and liabilities, including the schedule of investments, and the related statements of operations and of changes in net assets and the financial highlights present fairly, in all material respects, the financial position of Fidelity Canada Fund (a fund of Fidelity Investment Trust) at October 31, 2015, the results of its operations for the year then ended, the changes in its net assets for each of the two years in the period then ended and the financial highlights for each of the five years in the period then ended, in conformity with accounting principles generally accepted in the United States of America. These financial statements and financial highlights (hereafter referred to as "financial statements") are the responsibility of the Fidelity Canada Fund's management. Our responsibility is to express an opinion on these financial statements based on our audits. We conducted our audits of these financial statements in accordance with the standards of the Public Company Accounting Oversight Board (United States). Those standards require that we plan and perform the audit to obtain reasonable assurance about whether the financial statements are free of material misstatement. An audit includes examining, on a test basis, evidence supporting the amounts and disclosures in the financial statements, assessing the accounting principles used and significant estimates made by management, and evaluating the overall financial statement presentation. We believe that our audits, which included confirmation of securities at October 31, 2015 by correspondence with the custodian and brokers, provide a reasonable basis for our opinion.
PricewaterhouseCoopers LLP
Boston, Massachusetts
December 22, 2015
Annual Report
The Trustees, Member of the Advisory Board, and officers of the trust and fund, as applicable, are listed below. The Board of Trustees governs the fund and is responsible for protecting the interests of shareholders. The Trustees are experienced executives who meet periodically throughout the year to oversee the fund's activities, review contractual arrangements with companies that provide services to the fund, oversee management of the risks associated with such activities and contractual arrangements, and review the fund's performance. Each of the Trustees oversees 170 funds.
The Trustees hold office without limit in time except that (a) any Trustee may resign; (b) any Trustee may be removed by written instrument, signed by at least two-thirds of the number of Trustees prior to such removal; (c) any Trustee who requests to be retired or who has become incapacitated by illness or injury may be retired by written instrument signed by a majority of the other Trustees; and (d) any Trustee may be removed at any special meeting of shareholders by a two-thirds vote of the outstanding voting securities of the trust. Each Trustee who is not an interested person (as defined in the 1940 Act) of the trust and the fund (Independent Trustee), shall retire not later than the last day of the calendar year in which his or her 75th birthday occurs. The Independent Trustees may waive this mandatory retirement age policy with respect to individual Trustees. The officers and Advisory Board Member hold office without limit in time, except that any officer and Advisory Board Member may resign or may be removed by a vote of a majority of the Trustees at any regular meeting or any special meeting of the Trustees. Except as indicated, each individual has held the office shown or other offices in the same company for the past five years.
Experience, Skills, Attributes, and Qualifications of the Fund's Trustees. The Governance and Nominating Committee has adopted a statement of policy that describes the experience, qualifications, attributes, and skills that are necessary and desirable for potential Independent Trustee candidates (Statement of Policy). The Board believes that each Trustee satisfied at the time he or she was initially elected or appointed a Trustee, and continues to satisfy, the standards contemplated by the Statement of Policy. The Governance and Nominating Committee also engages professional search firms to help identify potential Independent Trustee candidates who have the experience, qualifications, attributes, and skills consistent with the Statement of Policy. From time to time, additional criteria based on the composition and skills of the current Independent Trustees, as well as experience or skills that may be appropriate in light of future changes to board composition, business conditions, and regulatory or other developments, have also been considered by the professional search firms and the Governance and Nominating Committee. In addition, the Board takes into account the Trustees' commitment and participation in Board and committee meetings, as well as their leadership of standing and ad hoc committees throughout their tenure.
In determining that a particular Trustee was and continues to be qualified to serve as a Trustee, the Board has considered a variety of criteria, none of which, in isolation, was controlling. The Board believes that, collectively, the Trustees have balanced and diverse experience, qualifications, attributes, and skills, which allow the Board to operate effectively in governing the fund and protecting the interests of shareholders. Information about the specific experience, skills, attributes, and qualifications of each Trustee, which in each case led to the Board's conclusion that the Trustee should serve (or continue to serve) as a trustee of the fund, is provided below.
Board Structure and Oversight Function. James C. Curvey is an interested person (as defined in the 1940 Act) and currently serves as Chairman. The Trustees have determined that an interested Chairman is appropriate and benefits shareholders because an interested Chairman has a personal and professional stake in the quality and continuity of services provided to the fund. Independent Trustees exercise their informed business judgment to appoint an individual of their choosing to serve as Chairman, regardless of whether the Trustee happens to be independent or a member of management. The Independent Trustees have determined that they can act independently and effectively without having an Independent Trustee serve as Chairman and that a key structural component for assuring that they are in a position to do so is for the Independent Trustees to constitute a substantial majority for the Board. The Independent Trustees also regularly meet in executive session. Ned C. Lautenbach serves as Chairman of the Independent Trustees and as such (i) acts as a liaison between the Independent Trustees and management with respect to matters important to the Independent Trustees and (ii) with management prepares agendas for Board meetings.
Fidelity funds are overseen by different Boards of Trustees. The fund's Board oversees Fidelity's high income and certain equity funds, and other Boards oversee Fidelity's investment-grade bond, money market, asset allocation, and sector funds. The asset allocation funds may invest in Fidelity funds overseen by the fund's Board. The use of separate Boards, each with its own committee structure, allows the Trustees of each group of Fidelity funds to focus on the unique issues of the funds they oversee, including common research, investment, and operational issues. On occasion, the separate Boards establish joint committees to address issues of overlapping consequences for the Fidelity funds overseen by each Board.
The Trustees operate using a system of committees to facilitate the timely and efficient consideration of all matters of importance to the Trustees, the fund, and fund shareholders and to facilitate compliance with legal and regulatory requirements and oversight of the fund's activities and associated risks. The Board, acting through its committees, has charged FMR and its affiliates with (i) identifying events or circumstances the occurrence of which could have demonstrably adverse effects on the fund's business and/or reputation; (ii) implementing processes and controls to lessen the possibility that such events or circumstances occur or to mitigate the effects of such events or circumstances if they do occur; and (iii) creating and maintaining a system designed to evaluate continuously business and market conditions in order to facilitate the identification and implementation processes described in (i) and (ii) above. Because the day-to-day operations and activities of the fund are carried out by or through FMR, its affiliates and other service providers, the fund's exposure to risks is mitigated but not eliminated by the processes overseen by the Trustees. While each of the Board's committees has responsibility for overseeing different aspects of the fund's activities, oversight is exercised primarily through the Operations, Audit, and Compliance Committees. In addition, the Independent Trustees have worked with FMR to enhance the Board's oversight of investment and financial risks, legal and regulatory risks, technology risks, and operational risks, including the development of additional risk reporting to the Board. For example, a working group comprised of Independent Trustees and FMR has worked and continues to work to review the Fidelity funds' valuation-related activities, reporting and risk management. Appropriate personnel, including but not limited to the fund's Chief Compliance Officer (CCO), FMR's internal auditor, the independent accountants, the fund's Treasurer and portfolio management personnel, make periodic reports to the Board's committees, as appropriate, including an annual review of Fidelity's risk management program for the Fidelity funds. The responsibilities of each standing committee, including their oversight responsibilities, are described further under "Standing Committees of the Fund's Trustees."
Annual Report
Trustees and Officers - continued
The fund's Statement of Additional Information (SAI) includes more information about the Trustees. To request a free copy, call Fidelity at 1-877-208-0098.
Interested Trustees*:
Correspondence intended for each Trustee who is an interested person may be sent to Fidelity Investments, 245 Summer Street, Boston, Massachusetts 02210.
Name, Year of Birth; Principal Occupations and Other Relevant Experience+ |
James C. Curvey (1935) |
Year of Election or Appointment: 2007 Trustee Chairman of the Board of Trustees |
| Mr. Curvey also serves as Trustee of other Fidelity funds. Mr. Curvey is a Director of Fidelity Research & Analysis Co. (investment adviser firm, 2009-present), and Vice Chairman (2007-present) and Director of FMR LLC (diversified financial services company). In addition, Mr. Curvey serves as an Overseer for the Boston Symphony Orchestra and a member of the board of Artis-Naples, Naples, Florida, and as a Trustee for Brewster Academy, Wolfeboro, New Hampshire. Previously, Mr. Curvey served as a Director of Fidelity Investments Money Management, Inc. (investment adviser firm, 2009-2014) and a Director of FMR and FMR Co., Inc. (investment adviser firms, 2007-2014). |
Charles S. Morrison (1960) |
Year of Election or Appointment: 2014 Trustee |
| Mr. Morrison also serves as Trustee of other funds. He serves as a Director of Fidelity Investments Money Management, Inc. (FIMM) (investment adviser firm, 2014-present), Director of Fidelity SelectCo, LLC (investment adviser firm, 2014-present), President, Asset Management (2014-present), and is an employee of Fidelity Investments. Previously, Mr. Morrison served as Vice President of Fidelity's Fixed Income and Asset Allocation Funds (2012-2014), President, Fixed Income (2011-2014), Vice President of Fidelity's Money Market Funds (2005-2009), President, Money Market Group Leader of FMR (investment adviser firm, 2009), and Senior Vice President, Money Market Group of FMR (2004-2009). Mr. Morrison also served as Vice President of Fidelity's Bond Funds (2002-2005), certain Balanced Funds (2002-2005), and certain Asset Allocation Funds (2002-2007), and as Senior Vice President (2002-2005) of Fidelity's Bond Division. |
* Trustees have been determined to be "Interested Trustees" by virtue of, among other things, their affiliation with the trust or various entities under common control with FMR.
+ The information above includes each Trustee's principal occupation during the last five years and other information relating to the experience, attributes, and skills relevant to each Trustee's qualifications to serve as a Trustee, which led to the conclusion that each Trustee should serve as a Trustee for the fund.
Annual Report
Independent Trustees:
Correspondence intended for each Independent Trustee (that is, the Trustees other than the Interested Trustees) may be sent to Fidelity Investments, P.O. Box 55235, Boston, Massachusetts 02205-5235.
Name, Year of Birth; Principal Occupations and Other Relevant Experience+ |
Dennis J. Dirks (1948) |
Year of Election or Appointment: 2005 Trustee |
| Mr. Dirks also serves as Trustee of other Fidelity funds. Prior to his retirement in May 2003, Mr. Dirks was Chief Operating Officer and a member of the Board of The Depository Trust & Clearing Corporation (DTCC). He also served as President, Chief Operating Officer, and Board member of The Depository Trust Company (DTC) and President and Board member of the National Securities Clearing Corporation (NSCC). In addition, Mr. Dirks served as Chief Executive Officer and Board member of the Government Securities Clearing Corporation, Chief Executive Officer and Board member of the Mortgage-Backed Securities Clearing Corporation, as a Trustee and a member of the Finance Committee of Manhattan College (2005-2008), as a Trustee and a member of the Finance Committee of AHRC of Nassau County (2006-2008), and as a member of the Independent Directors Council (IDC) Governing Council (2010-2015). Mr. Dirks is a member of the Board of Directors for The Brookville Center for Children's Services, Inc. (2009-present). |
Alan J. Lacy (1953) |
Year of Election or Appointment: 2008 Trustee |
| Mr. Lacy also serves as Trustee of other Fidelity funds. Mr. Lacy serves as a member of the Board of Directors of Dave & Buster's Entertainment, Inc. (restaurant and entertainment complexes, 2010-present) and Bristol-Myers Squibb Company (global pharmaceuticals, 2008-present). In addition, Mr. Lacy served as Senior Adviser (2007-2014) of Oak Hill Capital Partners, L.P. (private equity) and also served as Chief Executive Officer (2000-2005) and Vice Chairman (2005-2006) of Sears Holdings Corporation and Sears, Roebuck and Co. (retail). Mr. Lacy is a member of the Board of Trustees of The National Parks Conservation Association (2006-present). Previously, Mr. Lacy served as Chairman of the Board of Trustees of the National Parks Conservation Association (2008-2011) and as a member of the Board of Directors for The Western Union Company (global money transfer, 2006-2011), The Hillman Companies, Inc. (hardware wholesalers, 2010-2014), and Earth Fare, Inc. (retail grocery, 2010-2014). |
Ned C. Lautenbach (1944) |
Year of Election or Appointment: 2000 Trustee Chairman of the Independent Trustees |
| Mr. Lautenbach also serves as Trustee of other Fidelity funds. Mr. Lautenbach currently serves as the Lead Director of the Eaton Corporation Board of Directors (diversified industrial, 1997-present). Mr. Lautenbach is Chairman of the Board of Directors of Artis-Naples in Naples, Florida (2012-present), a member of the Council on Foreign Relations (1994-present), and a member of the Board of Governors, State University System of Florida (2013-present). Previously, Mr. Lautenbach was a Partner/Advisory Partner at Clayton, Dubilier & Rice, LLC (private equity investment, 1998-2010), as well as a Director of Sony Corporation (2006-2007). |
Joseph Mauriello (1944) |
Year of Election or Appointment: 2008 Trustee |
| Mr. Mauriello also serves as Trustee of other Fidelity funds. Prior to his retirement in January 2006, Mr. Mauriello served in numerous senior management positions including Deputy Chairman and Chief Operating Officer (2004-2005), and Vice Chairman of Financial Services (2002-2004) of KPMG LLP US (professional services, 1965-2005). Mr. Mauriello currently serves as a member of the Board of Directors of XL Group plc. (global insurance and re-insurance, 2006-present) and the Independent Directors Council (IDC) Governing Council (2015-present). Previously, Mr. Mauriello served as a Director of the Hamilton Funds of the Bank of New York (2006-2007) and of Arcadia Resources Inc. (health care services and products, 2007-2012). |
Robert W. Selander (1950) |
Year of Election or Appointment: 2011 Trustee |
| Mr. Selander also serves as Trustee of other Fidelity funds. Mr. Selander serves as a Director of The Western Union Company (global money transfer, 2014-present). Previously, Mr. Selander served as a Member of the Advisory Board of other Fidelity funds (2011), and Executive Vice Chairman (2010), Chief Executive Officer (2009-2010), and President and Chief Executive Officer (1997-2009) of Mastercard, Inc. |
Cornelia M. Small (1944) |
Year of Election or Appointment: 2005 Trustee |
| Ms. Small also serves as Trustee of other Fidelity funds. Ms. Small is a member of the Board of Directors (2009-present) and Chair of the Investment Committee (2010-present) of the Teagle Foundation. Ms. Small also serves on the Investment Committee of the Berkshire Taconic Community Foundation (2008-present). Previously, Ms. Small served as Chairperson (2002-2008) and a member of the Investment Committee and Chairperson (2008-2012) and a member of the Board of Trustees of Smith College. In addition, Ms. Small served as Chief Investment Officer, Director of Global Equity Investments, and a member of the Board of Directors of Scudder, Stevens & Clark and Scudder Kemper Investments. |
William S. Stavropoulos (1939) |
Year of Election or Appointment: 2001 Trustee Vice Chairman of the Independent Trustees |
| Mr. Stavropoulos also serves as Trustee of other Fidelity funds. Mr. Stavropoulos serves as President and Founder of the Michigan Baseball Foundation, the Great Lakes Loons (2007-present). Mr. Stavropoulos is Chairman Emeritus of the Board of Directors of The Dow Chemical Company, where he previously served in numerous senior management positions, including President, CEO (1995-2000; 2002-2004), Chairman of the Executive Committee (2000-2006), and as a member of the Board of Directors (1990-2006). Currently, Mr. Stavropoulos is Chairman of the Board of Directors of Univar Inc. (global distributor of commodity and specialty chemicals), a Director of Teradata Corporation (data warehousing and technology solutions), and Maersk Inc. (industrial conglomerate), and a member of the Advisory Board for Metalmark Capital LLC (private equity investment, 2005-present). Mr. Stavropoulos is an operating advisor to Clayton, Dubilier & Rice, LLC (private equity investment). In addition, Mr. Stavropoulos is a member of the University of Notre Dame Advisory Council for the College of Science, a Trustee of the Rollin L. Gerstacker Foundation, and a Director of the Naples Philharmonic Center for the Arts. Previously, Mr. Stavropoulos served as a Director of Chemical Financial Corporation (bank holding company, 1993-2012) and Tyco International, Ltd. (multinational manufacturing and services, 2007-2012). |
David M. Thomas (1949) |
Year of Election or Appointment: 2008 Trustee |
| Mr. Thomas also serves as Trustee of other Fidelity funds. Mr. Thomas serves as Non-Executive Chairman of the Board of Directors of Fortune Brands Home and Security (home and security products, 2011-present), as a member of the Board of Directors (2004-present) and Presiding Director (2013-present) of Interpublic Group of Companies, Inc. (marketing communication), and as a member of the Board of Trustees of the University of Florida (2013-present). Previously, Mr. Thomas served as Executive Chairman (2005-2006) and Chairman and Chief Executive Officer (2000-2005) of IMS Health, Inc. (pharmaceutical and healthcare information solutions), and a Director of Fortune Brands, Inc. (consumer products, 2000-2011). |
+ The information above includes each Trustee's principal occupation during the last five years and other information relating to the experience, attributes, and skills relevant to each Trustee's qualifications to serve as a Trustee, which led to the conclusion that each Trustee should serve as a Trustee for the fund.
Advisory Board Member and Officers:
Correspondence intended for each officer and Peter S. Lynch may be sent to Fidelity Investments, 245 Summer Street, Boston, Massachusetts 02210. Officers appear below in alphabetical order.
Name, Year of Birth; Principal Occupation |
Peter S. Lynch (1944) |
Year of Election or Appointment: 2003 Member of the Advisory Board |
| Mr. Lynch also serves as Member of the Advisory Board of other Fidelity funds. Mr. Lynch is Vice Chairman and a Director of FMR (investment adviser firm) and FMR Co., Inc. (investment adviser firm). In addition, Mr. Lynch serves as a Trustee of Boston College and as the Chairman of the Inner-City Scholarship Fund. Previously, Mr. Lynch served on the Special Olympics International Board of Directors (1997-2006). |
Elizabeth Paige Baumann (1968) |
Year of Election or Appointment: 2012 Anti-Money Laundering (AML) Officer |
| Ms. Baumann also serves as AML Officer of other funds. She is Chief AML Officer of FMR LLC (diversified financial services company, 2012-present) and is an employee of Fidelity Investments. Previously, Ms. Baumann served as Vice President and Deputy Anti-Money Laundering Officer (2007-2012). |
Marc R. Bryant (1966) |
Year of Election or Appointment: 2015 Secretary and Chief Legal Officer (CLO) |
| Mr. Bryant also serves as Secretary and CLO of other funds. Mr. Bryant serves as CLO, Secretary, and Senior Vice President of Fidelity Management & Research Company (investment adviser firm, 2015-present) and FMR Co., Inc. (investment adviser firm, 2015-present); Secretary of Fidelity SelectCo, LLC (investment adviser firm, 2015-present) and Fidelity Investments Money Management, Inc. (investment adviser firm, 2015-present); and CLO of Fidelity Management & Research (Hong Kong) Limited (investment adviser firm, 2015-present). He is Senior Vice President and Deputy General Counsel of FMR LLC (diversified financial services company). Previously, Mr. Bryant served as Secretary and Chief Legal Officer of Fidelity Rutland Square Trust II (2010-2014) and Assistant Secretary of Fidelity's Fixed Income and Asset Allocation Funds (2013-2015). Prior to joining Fidelity Investments, Mr. Bryant served as a Senior Vice President and the Head of Global Retail Legal for AllianceBernstein L.P. (2006-2010), and as the General Counsel for ProFund Advisors LLC (2001-2006). |
William C. Coffey (1969) |
Year of Election or Appointment: 2009 Assistant Secretary |
| Mr. Coffey also serves as Assistant Secretary of other funds. He is Senior Vice President and Deputy General Counsel of FMR LLC (diversified financial services company, 2010-present), and is an employee of Fidelity Investments. Previously, Mr. Coffey served as Vice President and Associate General Counsel of FMR LLC (2005-2009). |
Timothy M. Cohen (1969) |
Year of Election or Appointment: 2014 Vice President of certain Equity Funds |
| Mr. Cohen also serves as Vice President of other funds. Mr. Cohen serves as Chief Compliance Officer of FMR Investment Management (U.K.) Limited (investment adviser firm, 2013-present) and is an employee of Fidelity Investments. Previously, Mr. Cohen served as a Director of FMR Investment Management (U.K.) Limited (2013-2015). |
Jonathan Davis (1968) |
Year of Election or Appointment: 2010 Assistant Treasurer |
| Mr. Davis also serves as Assistant Treasurer of other funds, and is an employee of Fidelity Investments. Previously, Mr. Davis served as Vice President and Associate General Counsel of FMR LLC (diversified financial services company, 2003-2010). |
Adrien E. Deberghes (1967) |
Year of Election or Appointment: 2008 Deputy Treasurer |
| Mr. Deberghes also serves as an officer of other funds. He is an employee of Fidelity Investments (2008-present). Prior to joining Fidelity Investments, Mr. Deberghes was Senior Vice President of Mutual Fund Administration at State Street Corporation (2007-2008), Senior Director of Mutual Fund Administration at Investors Bank & Trust (2005-2007), and Director of Finance for Dunkin' Brands (2000-2005). |
Stephanie J. Dorsey (1969) |
Year of Election or Appointment: 2010 Assistant Treasurer |
| Ms. Dorsey also serves as an officer of other funds. She is an employee of Fidelity Investments (2008-present) and has served in other fund officer roles. Prior to joining Fidelity Investments, Ms. Dorsey served as Treasurer (2004-2008) of the JPMorgan Mutual Funds and Vice President (2004-2008) of JPMorgan Chase Bank. |
Howard J. Galligan III (1966) |
Year of Election or Appointment: 2014 Chief Financial Officer |
| Mr. Galligan also serves as Chief Financial Officer of other funds. Mr. Galligan serves as President of Fidelity Pricing and Cash Management Services (FPCMS) (2014-present) and as a Director of Strategic Advisers, Inc. (investment adviser firm, 2008-present). Previously, Mr. Galligan served as Chief Administrative Officer of Asset Management (2011-2014) and Chief Operating Officer and Senior Vice President of Investment Support for Strategic Advisers, Inc. (2003-2011). |
Scott C. Goebel (1968) |
Year of Election or Appointment: 2015 Vice President |
| Mr. Goebel serves as Vice President of other funds and is an employee of Fidelity Investments (2001-present). Previously, Mr. Goebel served as Secretary of Fidelity SelectCo, LLC (investment adviser firm, 2013-2015), Fidelity Investments Money Management, Inc. (FIMM) (investment adviser firm, 2010-2015), and Fidelity Research and Analysis Company (FRAC) (investment adviser firm, 2010-2015); General Counsel, Secretary, and Senior Vice President of Fidelity Management & Research Company (investment adviser firm, 2008-2015) and FMR Co., Inc. (investment adviser firm, 2008-2015); Assistant Secretary of Fidelity Management & Research (Japan) Limited (investment adviser firm, 2008-2015) and FMR Investment Management (U.K.) Limited (investment adviser firm, 2008-2015); Chief Legal Officer (CLO) of Fidelity Management & Research (Hong Kong) Limited (investment adviser firm, 2008-2015); Secretary and CLO of certain Fidelity funds (2008-2015); Assistant Secretary of FIMM (2008-2010), FRAC (2008-2010), and certain funds (2007-2008); and as Vice President and Secretary of Fidelity Distributors Corporation (FDC) (2005-2007). |
Brian B. Hogan (1964) |
Year of Election or Appointment: 2009 Vice President |
| Mr. Hogan also serves as Trustee or Vice President of other funds. Mr. Hogan serves as a Director of Fidelity SelectCo, LLC (investment adviser firm, 2014-present) and President of the Equity Division of FMR (investment adviser firm, 2009-present). Previously, Mr. Hogan served as Senior Vice President, Equity Research of FMR (2006-2009) and as a portfolio manager. |
Chris Maher (1972) |
Year of Election or Appointment: 2013 Assistant Treasurer |
| Mr. Maher serves as Assistant Treasurer of other funds. Mr. Maher is Vice President of Valuation Oversight and is an employee of Fidelity Investments. Previously, Mr. Maher served as Vice President of Asset Management Compliance (2013), Vice President of the Program Management Group of FMR (investment adviser firm, 2010-2013), and Vice President of Valuation Oversight (2008-2010). |
Kenneth B. Robins (1969) |
Year of Election or Appointment: 2008 President and Treasurer |
| Mr. Robins also serves as an officer of other funds. Mr. Robins serves as Executive Vice President of Fidelity Investments Money Management, Inc. (FIMM) (investment adviser firm, 2013-present) and is an employee of Fidelity Investments (2004-present). Previously, Mr. Robins served in other fund officer roles. |
Stacie M. Smith (1974) |
Year of Election or Appointment: 2013 Deputy Treasurer |
| Ms. Smith also serves as an officer of other funds. She is an employee of Fidelity Investments (2009-present) and has served in other fund officer roles. Prior to joining Fidelity Investments, Ms. Smith served as Senior Audit Manager of Ernst & Young LLP (1996-2009). |
Renee Stagnone (1975) |
Year of Election or Appointment: 2013 Deputy Treasurer |
| Ms. Stagnone also serves as Deputy Treasurer of other funds. Ms. Stagnone is an employee of Fidelity Investments (1997-present). |
Linda J. Wondrack (1964) |
Year of Election or Appointment: 2014 Chief Compliance Officer |
| Ms. Wondrack also serves as Chief Compliance Officer of other funds. Ms. Wondrack is Executive Vice President and head of the Ethics Office and Asset Management Compliance for Fidelity Investments (2012-present). Ms. Wondrack also serves as Chief Compliance Officer of Fidelity SelectCo, LLC (investment adviser firm, 2014-present); Chief Compliance Officer of Impresa Management LLC (2013-present); and Chief Compliance Officer of FMR Co., Inc. (investment adviser firm), Fidelity Investments Money Management, Inc. (investment adviser firm), Fidelity Management & Research (Japan) Limited (investment adviser firm), FMR Investment Management (U.K.) Limited (investment adviser firm), Fidelity Management & Research (Hong Kong) (investment adviser firm), Fidelity Management & Research Company (investment adviser firm), FIAM LLC (investment adviser firm), and Strategic Advisers, Inc. (investment adviser firm), Ballyrock Investment Advisors LLC, and Northern Neck Investors LLC (2012-present). Previously, Ms. Wondrack served as Senior Vice President and Chief Compliance Officer for Columbia Management Investment Advisers, LLC (2005-2012); Chief Compliance Officer for certain funds within the Columbia Family of Funds (2007-2012); and Senior Vice President of Compliance Risk Management at Bank of America (2005-2010). |
Joseph F. Zambello (1957) |
Year of Election or Appointment: 2011 Deputy Treasurer |
| Mr. Zambello also serves as Deputy Treasurer of other funds. Mr. Zambello is an employee of Fidelity Investments (1991-present). Previously, Mr. Zambello served as Vice President of the Program Management Group of FMR (investment adviser firm, 2009-2011) and Vice President of the Transfer Agent Oversight Group (2005-2009). |
Annual Report
The Board of Trustees of Fidelity Canada Fund voted to pay to shareholders of record at the opening of business on record date, the following distributions per share derived from capital gains realized from sales of portfolio securities, and dividends derived from net investment income:
| Pay Date | Record Date | Dividends | Capital Gains |
Class I | 12/07/15 | 12/04/15 | $0.586 | $0.060 |
The fund hereby designates as a capital gain dividend with respect to the taxable year ended October 31, 2015 $2,181,885 or, if subsequently determined to be different, the net capital gain of such year.
A percentage of the dividends distributed during the fiscal year for the following funds qualifies for the dividends-received deduction for corporate shareholders:
| December 05, 2014 |
Class I | 3% |
Class I designates 100% of the dividends distributed during the fiscal year as amounts which may be taken into account as a dividend for purposes of the maximum rate under section 1(h)(11) of the Internal Revenue Code.
The amounts per share which represent income derived from sources within, and taxes paid to, foreign countries or possessions of the United States are as follows:
| Pay Date | Income | Taxes |
Class I | 12/08/2014 | $0.8203 | $0.1363 |
The fund will notify shareholders in January 2016 of amounts for use in preparing 2015 income tax returns.
Annual Report
Fidelity Canada Fund
Each year, the Board of Trustees, including the Independent Trustees (together, the Board), votes on the renewal of the management contract with Fidelity Management & Research Company (FMR) and the sub-advisory agreements (together, the Advisory Contracts) for the fund. The Board, assisted by the advice of fund counsel and Independent Trustees' counsel, requests and considers a broad range of information relevant to the renewal of the Advisory Contracts throughout the year.
The Board meets regularly and, at each of its meetings, covers an extensive agenda of topics and materials and considers factors that are relevant to its annual consideration of the renewal of the fund's Advisory Contracts, including the services and support provided to the fund and its shareholders. The Board has established various standing committees (Committees), each composed of and chaired by Independent Trustees with varying backgrounds, to which the Board has assigned specific subject matter responsibilities in order to enhance effective decision-making by the Board. The Board, acting directly and through its Committees, requests and receives information concerning the annual consideration of the renewal of the fund's Advisory Contracts. The Board also meets as needed to consider matters specifically related to the Board's annual consideration of the renewal of the Advisory Contracts. Members of the Board may also meet with trustees of other Fidelity funds through ad hoc joint committees to discuss certain matters relevant to all of the Fidelity funds.
At its July 2015 meeting, the Board unanimously determined to renew the fund's Advisory Contracts. In reaching its determination, the Board considered all factors it believed relevant, including (i) the nature, extent, and quality of the services to be provided to the fund and its shareholders (including the investment performance of the fund); (ii) the competitiveness of the fund's management fee and total expense ratio relative to peer funds; (iii) the total costs of the services to be provided by and the profits to be realized by Fidelity from its relationship with the fund; and (iv) the extent to which (if any) economies of scale exist and would be realized as the fund grows, and whether any economies of scale are appropriately shared with fund shareholders.
In considering whether to renew the Advisory Contracts for the fund, the Board reached a determination, with the assistance of fund counsel and Independent Trustees' counsel and through the exercise of its business judgment, that the renewal of the Advisory Contracts was in the best interests of the fund and its shareholders and that the compensation payable under the Advisory Contracts was fair and reasonable. The Board's decision to renew the Advisory Contracts was not based on any single factor, but rather was based on a comprehensive consideration of all the information provided to the Board at its meetings throughout the year. The Board, in reaching its determination to renew the Advisory Contracts, was aware that shareholders of the fund have a broad range of investment choices available to them, including a wide choice among funds offered by Fidelity's competitors, and that the fund's shareholders, who have the opportunity to review and weigh the disclosure provided by the fund in its prospectus and other public disclosures, have chosen to invest in this fund, which is part of the Fidelity family of funds.
Nature, Extent, and Quality of Services Provided. The Board considered Fidelity's staffing as it relates to the fund, including the backgrounds of investment personnel of Fidelity, and also considered the fund's investment objective, strategies, and related investment philosophy. The Independent Trustees also had discussions with senior management of Fidelity's investment operations and investment groups. The Board considered the structure of the portfolio manager compensation program and whether this structure provides appropriate incentives to act in the best interests of the fund. Additionally, the Board considered the portfolio managers' investments, if any, in the funds that they manage.
Resources Dedicated to Investment Management and Support Services. The Board and the Fund Oversight and Research Committees reviewed the general qualifications and capabilities of Fidelity's investment staff, including its size, education, experience, and resources, as well as Fidelity's approach to recruiting, training, managing, and compensating investment personnel. The Board noted that Fidelity has continued to increase the resources devoted to non-U.S. offices, including expansion of Fidelity's global investment organization. The Board also noted that Fidelity's analysts have extensive resources, tools and capabilities that allow them to conduct sophisticated quantitative and fundamental analysis, as well as credit analysis of issuers, counterparties and guarantors. Further, the Board considered that Fidelity's investment professionals have sufficient access to global information and data so as to provide competitive investment results over time, and that those professionals also have access to sophisticated tools that permit them to assess portfolio construction and risk and performance attribution characteristics continuously, as well as to transmit new information and research conclusions rapidly around the world. Additionally, in its deliberations, the Board considered Fidelity's trading, risk management, and compliance capabilities and resources, which are integral parts of the investment management process.
Shareholder and Administrative Services. The Board considered (i) the nature, extent, quality, and cost of advisory, administrative, and shareholder services performed by FMR, the sub-advisers (together with FMR, the Investment Advisers), and their affiliates under the Advisory Contracts and under separate agreements covering transfer agency, pricing and bookkeeping, and securities lending services for the fund; (ii) the nature and extent of the supervision of third party service providers, principally custodians and subcustodians; and (iii) the resources devoted to, and the record of compliance with, the fund's compliance policies and procedures. The Board also reviewed the allocation of fund brokerage, including allocations to brokers affiliated with the Investment Advisers, the use of brokerage commissions to pay fund expenses, and the use of "soft" commission dollars to pay for research services.
Annual Report
Board Approval of Investment Advisory Contracts and Management Fees - continued
The Board noted that the growth of fund assets over time across the complex allows Fidelity to reinvest in the development of services designed to enhance the value or convenience of the Fidelity funds as investment vehicles. These services include 24-hour access to account information and market information through telephone representatives and over the Internet, investor education materials and asset allocation tools, and the expanded availability of Fidelity Investor Centers.
In 2014, the Board formed an ad hoc Committee on Transfer Agency Fees to review the variety of transfer agency fee structures throughout the industry and Fidelity's competitive positioning with respect to industry participants.
Investment in a Large Fund Family. The Board considered the benefits to shareholders of investing in a Fidelity fund, including the benefits of investing in a fund that is part of a large family of funds offering a variety of investment disciplines and providing a large variety of mutual fund investor services. The Board noted that Fidelity had taken, or had made recommendations that resulted in the Fidelity funds taking, a number of actions over the previous year that benefited particular funds, including (i) continuing to dedicate additional resources to investment research and to the support of the senior management team that oversees asset management; (ii) continuing efforts to enhance Fidelity's global research capabilities; (iii) launching new funds and making other enhancements to meet client needs; (iv) reducing management fees and total expenses for certain index funds and diversified international funds; (v) continuing to launch dedicated lower cost underlying funds to meet portfolio construction needs related to expanding underlying fund options for Fidelity funds of funds, specifically for the Freedom Fund product lines; (vi) rationalizing product lines and gaining increased efficiencies through fund mergers; (vii) launching active fixed-income exchange-traded funds; (viii) continuing to develop, acquire and implement systems and technology to improve services to the funds and information security and to increase efficiency; (ix) implementing investment enhancements to further strengthen Fidelity's target date product line to increase investors' probability of success in achieving their goals; (x) modifying the eligibility criteria for certain share classes to accommodate roll-over assets from employer-sponsored retirement plans; (xi) launching a new Class W of the Freedom Index Funds to attract and retain Fidelity record-kept retirement plan assets; and (xii) implementing changes to Fidelity's money market product line in response to recent money market regulatory reforms.
Investment Performance. The Board considered whether the fund has operated in accordance with its investment objective, as well as its record of compliance with its investment restrictions and its performance history. The Board noted that there was a portfolio management change for the fund in January 2014 and September 2014.
The Board took into account discussions with representatives of the Investment Advisers about fund investment performance that occur at Board meetings throughout the year. In this regard the Board noted that as part of regularly scheduled fund reviews and other reports to the Board on fund performance, the Board considers annualized return information for the fund, for different time periods, measured against a securities market index ("benchmark index") and a peer group of funds with similar objectives ("peer group"), if any. In its evaluation of fund investment performance, the Board gave particular attention to information indicating changes in performance of certain Fidelity funds for specific time periods and discussed with the Investment Advisers the reasons for any overperformance or underperformance.
In addition to reviewing absolute and relative fund performance, the Independent Trustees periodically consider the appropriateness of fund performance metrics in evaluating the results achieved. In general, the Independent Trustees believe that fund performance should be evaluated based on net performance (after fees and expenses) of both the highest performing and lowest performing fund share classes, where applicable, compared to appropriate benchmark indices, over appropriate time periods that may include full market cycles, and compared to peer groups, as applicable, over the same periods, taking into account relevant factors including the following: general market conditions; issuer-specific information; and fund cash flows and other factors.
The Independent Trustees recognize that shareholders evaluate performance on a net basis over their own holding periods, for which one-, three-, and five-year periods are often used as a proxy. For this reason, the performance information reviewed by the Board also included net cumulative calendar year total return information for the fund and an appropriate benchmark index for the most recent one-, three-, and five-year periods, as shown below. A peer group is not shown below because the fund does not generally utilize a peer group for performance comparison purposes.
Annual Report
Fidelity Canada Fund

The Board also considered that the fund's management fee is subject to upward or downward adjustment depending upon whether, and to what extent, the fund's investment performance for the performance period exceeds, or is exceeded by, a securities index, thus leading to a performance adjustment for the same period. The Board noted that the performance adjustment provides FMR with a strong economic incentive to seek to achieve superior performance for the fund's shareholders and helps to more closely align the interests of FMR and the shareholders of the fund.
Based on its review, the Board concluded that the nature, extent, and quality of services provided to the fund under the Advisory Contracts should benefit the shareholders of the fund.
Competitiveness of Management Fee and Total Expense Ratio. The Board considered the fund's management fee and total expense ratio compared to "mapped groups" of competitive funds and classes created for the purpose of facilitating the Trustees' competitive analysis of management fees and total expenses. Fidelity creates "mapped groups" by combining similar Lipper investment objective categories that have comparable investment mandates. Combining Lipper investment objective categories aids the Board's management fee and total expense ratio comparisons by broadening the competitive group used for comparison.
Management Fee. The Board considered two proprietary management fee comparisons for the 12-month periods shown in basis points (BP) in the chart below. The group of Lipper funds used by the Board for management fee comparisons is referred to below as the "Total Mapped Group." The Total Mapped Group comparison focuses on a fund's standing in terms of gross management fees before expense reimbursements or caps, and without giving effect to the fund's performance adjustment, relative to the total universe of funds with comparable investment mandates, regardless of whether their management fee structures also are comparable. Funds with comparable investment mandates offer exposure to similar types of securities. Funds with comparable management fee structures have similar management fee contractual arrangements (e.g., flat rate charged for advisory services, all-inclusive fee rate, etc.). "TMG %" represents the percentage of funds in the Total Mapped Group that had management fees that were lower than the fund's. For example, a hypothetical TMG % of 20% would mean that 80% of the funds in the Total Mapped Group had higher, and 20% had lower, management fees than the fund. The fund's actual TMG %s and the number of funds in the Total Mapped Group are in the chart below. The "Asset-Size Peer Group" (ASPG) comparison focuses on a fund's standing relative to a subset of non-Fidelity funds within the Total Mapped Group that are similar in size and management fee structure without taking into account performance adjustments, if any. For example, if a fund is in the first quartile of the ASPG, the fund's management fee ranks in the least expensive or lowest 25% of funds in the ASPG. The ASPG represents at least 15% of the funds in the Total Mapped Group with comparable asset size and management fee structures, subject to a minimum of 50 funds (or all funds in the Total Mapped Group if fewer than 50). Additional information, such as the ASPG quartile in which the fund's management fee rate ranked and the impact of the fund's performance adjustment, is also included in the chart and considered by the Board.
Annual Report
Board Approval of Investment Advisory Contracts and Management Fees - continued
Fidelity Canada Fund

The Board noted that the fund's management fee rate ranked below the median of its Total Mapped Group and below the median of its ASPG for 2014. The Board also noted the effect of the fund's performance adjustment, if any, on the fund's management fee ranking.
The Board noted that, in 2014, the ad hoc Committee on Group Fee was formed by it and other Fidelity fund boards to conduct an in-depth review of the "group fee" component of the management fee of funds with such management fee structures. Committee focus included the mechanics of the group fee, the competitive landscape of group fee structures, Fidelity funds with no group fee component and investment products not included in group fee assets. The Board also considered that, for funds subject to the group fee, FMR agreed to voluntarily waive fees over a specified period of time in amounts designed to account for assets converted from certain funds to certain collective investment trusts.
The Board also noted that, in 2013, the ad hoc Committee on Management Fees was formed to conduct an in-depth review of the management fee rates of Fidelity's active equity mutual funds. The Committee focused on the following areas: (i) standard fee structures; (ii) research consumption and trading evolution; (iii) management fee competitiveness/profitability by category; and (iv) factors that drive institutional pricing.
Based on its review, the Board concluded that the fund's management fee is fair and reasonable in light of the services that the fund receives and the other factors considered.
Total Expense Ratio. In its review of each class's total expense ratio, the Board considered the fund's management fee as well as other fund or class expenses, as applicable, such as transfer agent fees, pricing and bookkeeping fees, fund-paid 12b-1 fees, and custodial, legal, and audit fees. The Board noted the impact of the fund's performance adjustment. The Board also noted that Fidelity may agree to waive fees and expenses from time to time, and the extent to which, if any, it has done so for the fund. As part of its review, the Board also considered the current and historical total expense ratios of each class of the fund compared to competitive fund median expenses. Each class of the fund is compared to those funds and classes in the Total Mapped Group (used by the Board for management fee comparisons) that have a similar sales load structure.
The Board noted that the total expense ratio of each of Class A, Class B, Class C, Class I, and the retail class ranked below its competitive median for 2014 and the total expense ratio of Class T ranked above its competitive median for 2014. The Board considered that, in general, various factors can affect total expense ratios. The Board noted that the total expense ratio of Class T was above the competitive median primarily because of higher 12b-1 fees on Class T as compared to most competitor funds. Class T has a higher 12b-1 fee, but a lower front-end sales charge, than traditionally priced front-end sales charge classes. The Board considered that Class T is primarily sold load-waived in the retirement plan market where its 0.50% 12b-1 fee is comparable to competing no-load, higher 12b-1 fee classes designed specifically for retirement plans. The Board noted that the fund offers multiple classes, each of which has a different sales load and 12b-1 fee structure, and that the multiple structures are intended to offer a range of pricing options for the intermediary market. The Board also noted that the total expense ratios of the classes vary primarily by the level of their 12b-1 fees, although differences in transfer agent fees may also cause expenses to vary from class to class.
Fees Charged to Other Fidelity Clients. The Board also considered Fidelity fee structures and other information with respect to clients of Fidelity, such as other funds advised or subadvised by Fidelity, pension plan clients, and other institutional clients with similar mandates. The Board noted the findings of the 2013 ad hoc joint committee (created with the board of other Fidelity funds), which reviewed and compared Fidelity's institutional investment advisory business with its business of providing services to the Fidelity funds, including the differences in services provided, fees charged, and costs incurred, as well as competition in their respective marketplaces.
Annual Report
Based on its review of total expense ratios and fees charged to other Fidelity clients, the Board concluded that, although Class T was above the median of the universe presented for comparison, the total expense ratio of each class of the fund was reasonable in light of the services that the fund and its shareholders receive and the other factors considered.
Costs of the Services and Profitability. The Board considered the revenues earned and the expenses incurred by Fidelity in conducting the business of developing, marketing, distributing, managing, administering and servicing the fund and servicing the fund's shareholders. The Board also considered the level of Fidelity's profits in respect of all the Fidelity funds.
On an annual basis, Fidelity presents to the Board information about the profitability of its relationship with the fund. Fidelity calculates profitability information for each fund, as well as aggregate profitability information for groups of Fidelity funds and all Fidelity funds, using a series of detailed revenue and cost allocation methodologies which originate with the books and records of Fidelity on which Fidelity's audited financial statements are based. The Audit Committee of the Board reviews any significant changes from the prior year's methodologies.
PricewaterhouseCoopers LLP (PwC), independent registered public accounting firm and auditor to Fidelity and certain Fidelity funds, has been engaged annually by the Board as part of the Board's assessment of Fidelity's profitability analysis. PwC's engagement includes the review and assessment of the methodologies used by Fidelity in determining the revenues and expenses attributable to Fidelity's mutual fund business, and completion of agreed-upon procedures in respect of the mathematical accuracy of fund profitability and its conformity to established allocation methodologies. After considering PwC's reports issued under the engagement and information provided by Fidelity, the Board concluded that while other allocation methods may also be reasonable, Fidelity's profitability methodologies are reasonable in all material respects.
The Board also reviewed Fidelity's non-fund businesses and fall-out benefits related to the mutual fund business as well as cases where Fidelity's affiliates may benefit from or be related to the fund's business.
The Board considered the costs of the services provided by and the profits realized by Fidelity in connection with the operation of the fund and was satisfied that the profitability was not excessive.
Economies of Scale. The Board considered whether there have been economies of scale in respect of the management of the Fidelity funds, whether the Fidelity funds (including the fund) have appropriately benefited from any such economies of scale, and whether there is potential for realization of any further economies of scale. The Board considered the extent to which the fund will benefit from economies of scale as assets grow through increased services to the fund, through waivers or reimbursements, or through fee or expense ratio reductions. The Board also noted that in 2013, it and the boards of other Fidelity funds created an ad hoc committee (the Economies of Scale Committee) to analyze whether Fidelity attains economies of scale in respect of the management and servicing of the Fidelity funds, whether the Fidelity funds have appropriately benefited from such economies of scale, and whether there is potential for realization of any further economies of scale.
The Board recognized that the fund's management contract incorporates a "group fee" structure, which provides for lower group fee rates as total group assets increase, and for higher group fee rates as total group assets decrease (with "group assets" defined to include fund assets under FMR's management plus sector fund assets previously under FMR's management and currently managed by Fidelity SelectCo, LLC). FMR calculates the group fee rates based on a tiered asset "breakpoint" schedule that varies based on asset class. The Board considered that the group fee is designed to deliver the benefits of economies of scale to fund shareholders when total Fidelity fund assets increase, even if assets of any particular fund are unchanged or have declined, because some portion of Fidelity's costs are attributable to services provided to all Fidelity funds, and all funds benefit if those costs can be allocated among more assets. The Board concluded that, given the group fee structure, fund shareholders will benefit from lower management fees as group assets increase at the fund complex level, regardless of whether Fidelity achieves any such economies of scale.
The Board concluded, taking into account the analysis of the Economies of Scale Committee, that economies of scale, if any, are being appropriately shared between fund shareholders and Fidelity.
Additional Information Requested by the Board. In order to develop fully the factual basis for consideration of the Fidelity funds' Advisory Contracts, the Board requested and received additional information on certain topics, including: (i) fund performance trends and Fidelity's long-term strategies for certain funds; (ii) the various share classes employed by Fidelity and the attributes of each class, together with similar information on the distribution and servicing payments made by Fidelity or the funds to third-party participants in the distribution channels; (iii) fund profitability, and fund performance in relation to fund profitability; (iv) the methodology with respect to evaluating competitive fund data and peer group classifications and fee comparisons; (v) annual fund profitability margins, with particular focus on certain funds with negative margins; (vi) the realization of fall-out benefits in certain Fidelity business units; (vii) economies of scale and the way in which they are shared with fund shareholders; (viii) Fidelity's group fee structures, including the group fee schedule of breakpoints; (ix) the impact of cost containment measures on the funds; and (x) the transfer agent fee structure.
Based on its evaluation of all of the conclusions noted above, and after considering all factors it believed relevant, the Board concluded that the advisory fee structures are fair and reasonable, and that the fund's Advisory Contracts should be renewed.
Annual Report
Investment Adviser
Fidelity Management & Research Company
Boston, MA
Investment Sub-Advisers
FMR Co., Inc.
FMR Investment Management
(U.K.) Limited
Fidelity Management & Research
(Hong Kong) Limited
Fidelity Management & Research
(Japan) Limited
FIL Investment Advisors
FIL Investment Advisors
(UK) Limited
General Distributor
Fidelity Distributors Corporation
Smithfield, RI
Transfer and Service Agents
Fidelity Investments Institutional
Operations Company, Inc.
Boston, MA
Fidelity Service Company, Inc.
Boston, MA
Custodian
State Street Bank and Trust Company
Quincy, MA
(Fidelity Investment logo)(registered trademark)
ACANI-UANN-1215
1.843157.108
ContentsPerformance: The Bottom LineManagement's Discussion of Fund PerformanceShareholder Expense ExampleInvestment Changes (Unaudited)Investments October 31, 2015Financial StatementsNotes to Financial StatementsReport of Independent Registered Public Accounting FirmTrustees and OfficersDistributions (Unaudited)Board Approval of Investment Advisory Contracts and Management FeesContentsPerformance: The Bottom LineManagement's Discussion of Fund PerformanceShareholder Expense ExampleInvestment Changes (Unaudited)Investments October 31, 2015Financial StatementsNotes to Financial StatementsReport of Independent Registered Public Accounting FirmTrustees and OfficersDistributions (Unaudited)Board Approval of Investment Advisory Contracts and Management Fees
Fidelity Advisor®
Japan
Fund - Class A, Class T, Class B, and Class C
Annual Report
October 31, 2015
(Fidelity Cover Art)
Class A, Class T, Class B, and Class C are
classes of Fidelity® Japan Fund
Contents
Performance | (Click Here) | How the fund has done over time. |
Management's Discussion of Fund Performance | (Click Here) | The Portfolio Manager's review of fund performance and strategy. |
Shareholder Expense Example | (Click Here) | An example of shareholder expenses. |
Investment Changes | (Click Here) | A summary of major shifts in the fund's investments over the past six months. |
Investments | (Click Here) | A complete list of the fund's investments with their market values. |
Financial Statements | (Click Here) | Statements of assets and liabilities, operations, and changes in net assets, as well as financial highlights. |
Notes | (Click Here) | Notes to the financial statements. |
Report of Independent Registered Public Accounting Firm | (Click Here) | |
Trustees and Officers | (Click Here) | |
Distributions | (Click Here) | |
Board Approval of Investment Advisory Contracts and Management Fees | (Click Here) | |
To view a fund's proxy voting guidelines and proxy voting record for the 12-month period ended June 30, visit http://www.fidelity.com/proxyvotingresults or visit the Securities and Exchange Commission's (SEC) web site at http://www.sec.gov. You may also call 1-877-208-0098 to request a free copy of the proxy voting guidelines.
Standard & Poor's, S&P and S&P 500 are registered service marks of The McGraw-Hill Companies, Inc. and have been licensed for use by Fidelity Distributors Corporation.
Other third-party marks appearing herein are the property of their respective owners.
All other marks appearing herein are registered or unregistered trademarks or service marks of FMR LLC or an affiliated company. © 2015 FMR LLC. All rights reserved.
This report and the financial statements contained herein are submitted for the general information of the shareholders of the fund. This report is not authorized for distribution to prospective investors in the fund unless preceded or accompanied by an effective prospectus.
A fund files its complete schedule of portfolio holdings with the SEC for the first and third quarters of each fiscal year on Form N-Q. Forms N-Q are available on the SEC's web site at http://www.sec.gov. A fund's Forms N-Q may be reviewed and copied at the SEC's Public Reference Room in Washington, DC. Information regarding the operation of the SEC's Public Reference Room may be obtained by calling 1-800-SEC-0330. For a complete list of a fund's portfolio holdings, view the most recent holdings listing, semiannual report, or annual report on Fidelity's web site at http://www.fidelity.com, http://www.advisor.fidelity.com, or http://www.401k.com, as applicable.
NOT FDIC INSURED • MAY LOSE VALUE • NO BANK GUARANTEE
Neither the fund nor Fidelity Distributors Corporation is a bank.
Annual Report
Average annual total return reflects the change in the value of an investment, assuming reinvestment of the class' distributions from dividend income and capital gains (the profits earned upon the sale of securities that have grown in value, if any) and assuming a constant rate of performance each year. The $10,000 table and the fund's returns do not reflect the deduction of taxes that a shareholder would pay on fund distributions or the redemption of fund shares. During periods of reimbursement by Fidelity, a fund's total return will be greater than it would be had the reimbursement not occurred. How a fund did yesterday is no guarantee of how it will do tomorrow.
Average Annual Total Returns
Periods ended October 31, 2015 | Past 1
year | Past 5
years | Past 10
years |
Class A (incl. 5.75% sales charge) A | -3.57% | 2.93% | -0.10% |
Class T (incl. 3.50% sales charge) B | -1.59% | 3.13% | 0.00% |
Class B (incl. contingent deferred sales charge) C | -3.54% | 3.03% | 0.12% |
Class C (incl. contingent deferred sales charge) D | 0.64% | 3.44% | 0.15% |
A Class A shares bear a 0.25% 12b-1 fee. The initial offering of Class A shares took place on December 14, 2010. Returns prior to December 14, 2010, are those of Fidelity® Japan Fund, the original class of the fund, which has no 12b-1 fee. Had Class A's 12b-1 fee been reflected, returns prior to December 14, 2010, would have been lower.
B Class T shares bear a 0.50% 12b-1 fee. The initial offering of Class T shares took place on December 14, 2010. Returns prior to December 14, 2010, are those of Fidelity® Japan Fund, the original class of the fund, which has no 12b-1 fee. Had Class T's 12b-1 fee been reflected, returns prior to December 14, 2010, would have been lower.
C Class B shares bear a 1.00% 12b-1 fee. The initial offering of Class B shares took place on December 14, 2010. Returns prior to December 14, 2010, are those of Fidelity Japan Fund, the original class of the fund, which has no 12b-1 fee. Had Class B's 12b-1 fee been reflected, returns prior to December 14, 2010, would have been lower. Class B shares' contingent deferred sales charges included in the past one year, past five years, and past ten years total return figures are 5%, 2%, and 0%, respectively.
D Class C shares bear a 1.00% 12b-1 fee. The initial offering of Class C shares took place on December 14, 2010. Returns prior to December 14, 2010, are those of Fidelity Japan Fund, the original class of the fund, which has no 12b-1 fee. Had Class C's 12b-1 fee been reflected, returns prior to December 14, 2010, would have been lower. Class C shares' contingent deferred sales charges included in the past one year, past five years, and past ten years total return figures are 1%, 0%, and 0%, respectively.
$10,000 Over 10 Years
Let's say hypothetically that $10,000 was invested in Fidelity Advisor® Japan Fund - Class A on October 31, 2005, and the current 5.75% sales charge was paid. The chart shows how the value of your investment would have changed, and also shows how the Tokyo Stock Price Index (TOPIX) performed over the same period. See footnote A above for additional information regarding the performance of Class A.
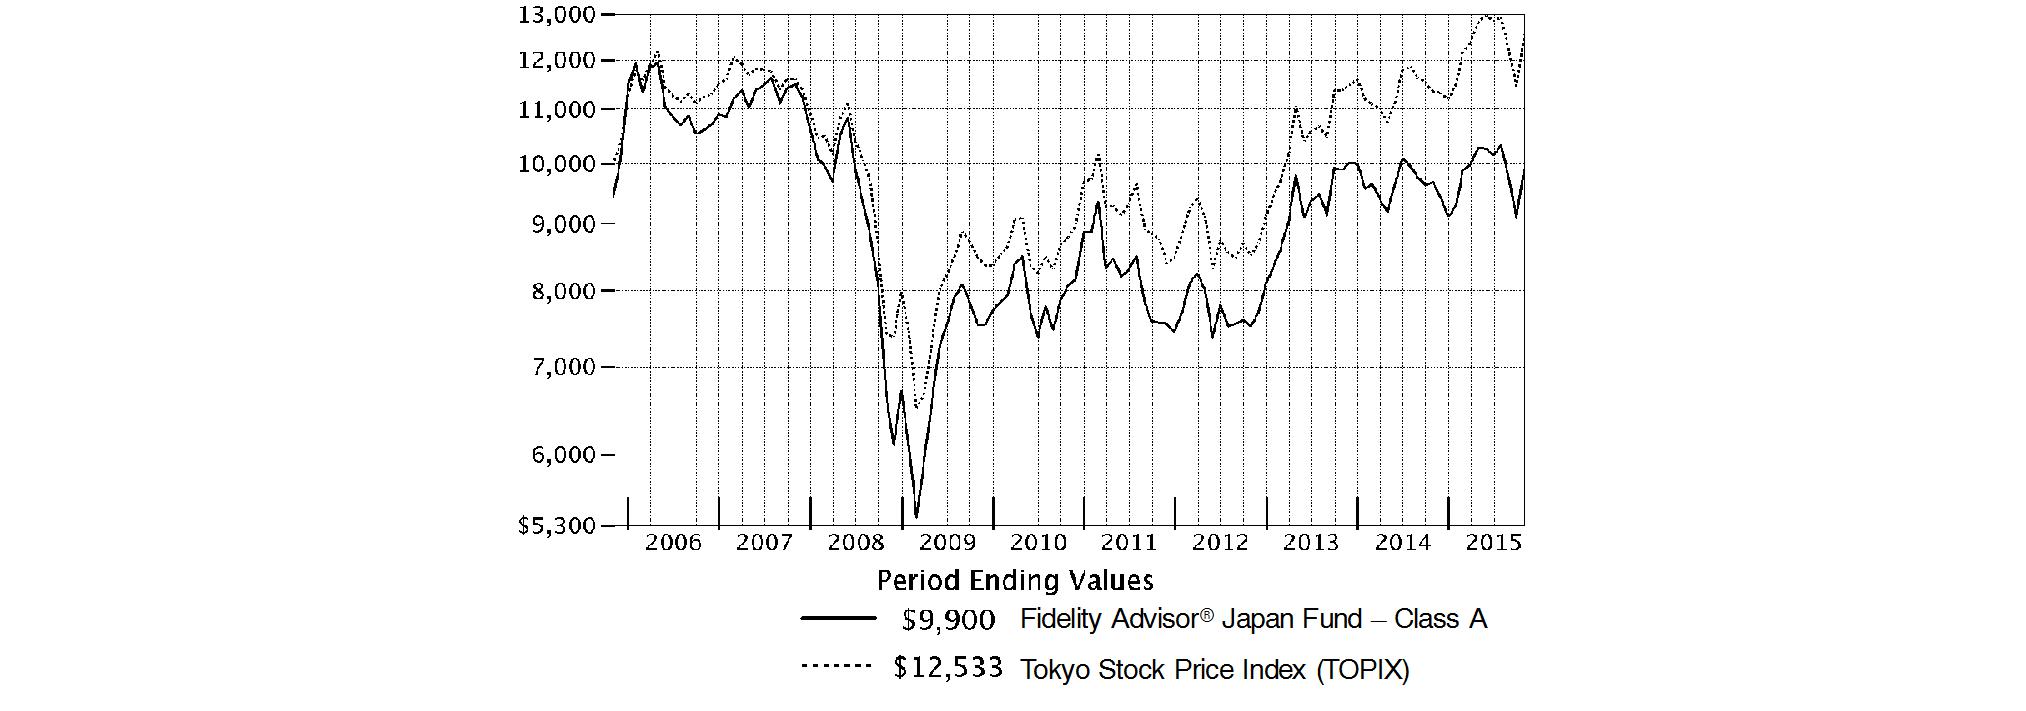
-
Annual Report
Fidelity Japan Fund
Market Recap: International equities suffered a moderate setback for the 12 months ending October 31, 2015, held back by a collapse in commodities prices that hurt resources-related sectors and geographies. The MSCI ACWI (All Country World Index) ex USA Index returned -4.55% for the period, affected also by concerns about global economic growth. Commodity producers remained under pressure for much of the past year, largely related to economic deceleration in China (-1%), the world's second-largest economy and a leading consumer of raw materials. This effect was exacerbated by U.S. dollar strength relative to global currencies, which weighed on commodities priced in dollars and acutely impacted equity returns within regions most exposed to resources prices. The emerging-markets group, for example, returned about -15% this period. Canada, a significant energy producer, returned roughly -17%. Net energy consumer Japan (+9%) was the best-performing region by far. Only about a quarter of the nearly 50 index countries managed a gain this period: Ireland (+19%) - the EU's fastest-growing economy - and Israel (+17%) proved top performers; Greece (-56%) and Brazil (-46%), among the worst. As for sectors, energy (-25%) and materials (-16%) declined sharply, whereas the two consumer sectors each gained about 6%.
Comments from Portfolio Manager Kirk Neureiter: For the year, the fund's share classes (excluding sales charges, if applicable) posted modest single-digit gains but fell considerably short of the 10.61% gain of the benchmark Tokyo Stock Price Index (TOPIX). A downward fair-value adjustment significantly detracted from performance versus the benchmark. Stock selection in health care, information technology, consumer staples and industrials were other meaningful negatives. At the stock level, a large overweighting in Hitachi was the fund's largest relative detractor. This large industrial electronics firm was undergoing a restructuring that I thought was going well, but exposure to a slowing Chinese economy hurt its Hitachi Construction Machinery segment. Other noteworthy detractors included Japan Tobacco; Sanken Electric, a supplier of the power-related integrated circuits for the consumer electronics and auto industries; and drug stock Astellas Pharma, the fund's largest holding at period end. Conversely, stock picking in consumer discretionary and financials lifted relative performance. E-commerce giant Rakuten was the fund's top contributor. As the share price of Rakuten increased, I sold most of our position, although we still ended the period with an overweighting. Other contributors were Shimadzu, a maker of measuring equipment, medical equipment, space equipment and industrial machinery; and East Japan Railway, the fund's second-largest position at period end.
The views expressed above reflect those of the portfolio manager(s) only through the end of the period as stated on the cover of this report and do not necessarily represent the views of Fidelity or any other person in the Fidelity organization. Any such views are subject to change at any time based upon market or other conditions and Fidelity disclaims any responsibility to update such views. These views may not be relied on as investment advice and, because investment decisions for a Fidelity fund are based on numerous factors, may not be relied on as an indication of trading intent on behalf of any Fidelity fund.
Annual Report
Fidelity Japan Fund
As a shareholder of the Fund, you incur two types of costs: (1) transaction costs, including sales charges (loads) on purchase payments or redemption proceeds, redemption fees and (2) ongoing costs, including management fees, distribution and/or service (12b-1) fees and other Fund expenses. This Example is intended to help you understand your ongoing costs (in dollars) of investing in the Fund and to compare these costs with the ongoing costs of investing in other mutual funds.
The Example is based on an investment of $1,000 invested at the beginning of the period and held for the entire period (May 1, 2015 to October 31, 2015).
Actual Expenses
The first line of the accompanying table for each class of the Fund provides information about actual account values and actual expenses. You may use the information in this line, together with the amount you invested, to estimate the expenses that you paid over the period. Simply divide your account value by $1,000.00 (for example, an $8,600 account value divided by $1,000.00 = 8.6), then multiply the result by the number in the first line for a class of the Fund under the heading entitled "Expenses Paid During Period" to estimate the expenses you paid on your account during this period. A small balance maintenance fee of $12.00 that is charged once a year may apply for certain accounts with a value of less than $2,000. This fee is not included in the table below. If it was, the estimate of expenses you paid during the period would be higher, and your ending account value lower, by this amount. In addition, the Fund, as a shareholder in the underlying Fidelity Central Funds, will indirectly bear its pro-rata share of the fees and expenses incurred by the underlying Fidelity Central Funds. These fees and expenses are not included in the Fund's annualized expense ratio used to calculate the expense estimate in the table below.
Hypothetical Example for Comparison Purposes
The second line of the accompanying table for each class of the Fund provides information about hypothetical account values and hypothetical expenses based on a Class' actual expense ratio and an assumed rate of return of 5% per year before expenses, which is not the Class' actual return. The hypothetical account values and expenses may not be used to estimate the actual ending account balance or expenses you paid for the period. You may use this information to compare the ongoing costs of investing in the Fund and other funds. To do so, compare this 5% hypothetical example with the 5% hypothetical examples that appear in the shareholder reports of the other funds. A small balance maintenance fee of $12.00 that is charged once a year may apply for certain accounts with a value of less than $2,000. This fee is not included in the table below. If it was, the estimate of expenses you paid during the period would be higher, and your ending account value lower, by this amount. In addition, the Fund, as a shareholder in the underlying Fidelity Central Funds, will indirectly bear its pro-rata share of the fees and expenses incurred by the underlying Fidelity Central Funds. These fees and expenses are not included in the Fund's annualized expense ratio used to calculate the expense estimate in the table below.
Please note that the expenses shown in the table are meant to highlight your ongoing costs only and do not reflect any transaction costs. Therefore, the second line of the table is useful in comparing ongoing costs only, and will not help you determine the relative total costs of owning different funds. In addition, if these transactional costs were included, your costs would have been higher.
| Annualized
Expense RatioB | Beginning
Account Value
May 1, 2015 | Ending
Account Value
October 31, 2015 | Expenses Paid
During PeriodC
May 1, 2015
to October 31, 2015 |
Class A | 1.09% | | | |
Actual | | $ 1,000.00 | $ 962.70 | $ 5.39 |
HypotheticalA | | $ 1,000.00 | $ 1,019.71 | $ 5.55 |
Class T | 1.42% | | | |
Actual | | $ 1,000.00 | $ 961.10 | $ 7.02 |
HypotheticalA | | $ 1,000.00 | $ 1,018.05 | $ 7.22 |
Class B | 1.90% | | | |
Actual | | $ 1,000.00 | $ 958.60 | $ 9.38 |
HypotheticalA | | $ 1,000.00 | $ 1,015.63 | $ 9.65 |
Class C | 1.80% | | | |
Actual | | $ 1,000.00 | $ 959.30 | $ 8.89 |
HypotheticalA | | $ 1,000.00 | $ 1,016.13 | $ 9.15 |
Japan | .79% | | | |
Actual | | $ 1,000.00 | $ 964.40 | $ 3.91 |
HypotheticalA | | $ 1,000.00 | $ 1,021.22 | $ 4.02 |
Class I | .80% | | | |
Actual | | $ 1,000.00 | $ 965.10 | $ 3.96 |
HypotheticalA | | $ 1,000.00 | $ 1,021.17 | $ 4.08 |
A 5% return per year before expenses
B Annualized expense ratio reflects expenses net of applicable fee waivers.
C Expenses are equal to each Class' annualized expense ratio, multiplied by the average account value over the period, multiplied by 184/365 (to reflect the one-half year period).
Annual Report
Fidelity Japan Fund
Investment Changes (Unaudited)
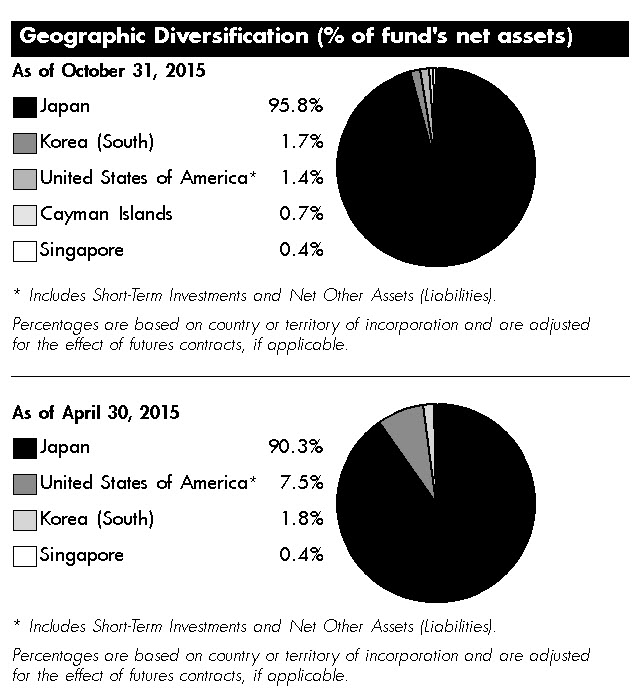
Asset Allocation as of October 31, 2015 |
| % of fund's
net assets | % of fund's net assets
6 months ago |
Stocks | 98.6 | 92.5 |
Short-Term Investments and Net Other Assets (Liabilities) | 1.4 | 7.5 |
Top Ten Stocks as of October 31, 2015 |
| % of fund's
net assets | % of fund's net assets
6 months ago |
Astellas Pharma, Inc. (Pharmaceuticals) | 4.9 | 4.7 |
East Japan Railway Co. (Road & Rail) | 4.2 | 4.1 |
Mitsubishi UFJ Financial Group, Inc. (Banks) | 4.0 | 4.1 |
KDDI Corp. (Wireless Telecommunication Services) | 3.3 | 3.4 |
Hoya Corp. (Health Care Equipment & Supplies) | 3.3 | 3.2 |
ORIX Corp. (Diversified Financial Services) | 3.0 | 3.1 |
Honda Motor Co. Ltd. (Automobiles) | 3.0 | 3.2 |
Mitsui Fudosan Co. Ltd. (Real Estate Management & Development) | 2.9 | 2.9 |
SoftBank Corp. (Wireless Telecommunication Services) | 2.8 | 3.1 |
Sony Corp. (Household Durables) | 2.6 | 1.4 |
| 34.0 | |
Market Sectors as of October 31, 2015 |
| % of fund's
net assets | % of fund's net assets
6 months ago |
Consumer Discretionary | 19.3 | 20.0 |
Financials | 19.0 | 19.2 |
Information Technology | 13.8 | 16.8 |
Industrials | 13.8 | 12.1 |
Health Care | 13.3 | 10.0 |
Telecommunication Services | 7.2 | 7.5 |
Consumer Staples | 7.0 | 3.8 |
Materials | 5.2 | 3.1 |
Annual Report
Fidelity Japan Fund
Investments October 31, 2015
Showing Percentage of Net Assets
Common Stocks - 98.6% |
| Shares | | Value |
CONSUMER DISCRETIONARY - 19.3% |
Auto Components - 3.3% |
Bridgestone Corp. | 236,400 | | $ 8,669,005 |
NGK Spark Plug Co. Ltd. | 195,200 | | 4,763,862 |
Sumitomo Electric Industries Ltd. | 351,900 | | 4,802,717 |
| | 18,235,584 |
Automobiles - 9.2% |
Fuji Heavy Industries Ltd. | 57,600 | | 2,227,601 |
Honda Motor Co. Ltd. | 495,700 | | 16,397,977 |
Isuzu Motors Ltd. | 306,800 | | 3,583,277 |
Mazda Motor Corp. | 276,900 | | 5,435,348 |
Suzuki Motor Corp. | 314,900 | | 10,310,916 |
Toyota Motor Corp. | 200,700 | | 12,295,772 |
| | 50,250,891 |
Hotels, Restaurants & Leisure - 0.6% |
Skylark Co. Ltd. | 250,300 | | 3,255,648 |
Household Durables - 4.0% |
Casio Computer Co. Ltd. (d) | 205,400 | | 3,869,605 |
Rinnai Corp. | 49,700 | | 3,940,019 |
Sony Corp. | 496,700 | | 14,118,910 |
| | 21,928,534 |
Internet & Catalog Retail - 0.5% |
Rakuten, Inc. | 177,700 | | 2,461,712 |
Media - 0.4% |
Proto Corp. | 174,000 | | 2,257,590 |
Multiline Retail - 0.4% |
Don Quijote Holdings Co. Ltd. | 55,000 | | 2,020,379 |
Specialty Retail - 0.9% |
United Arrows Ltd. | 119,700 | | 5,156,785 |
TOTAL CONSUMER DISCRETIONARY | | 105,567,123 |
CONSUMER STAPLES - 7.0% |
Beverages - 1.2% |
Asahi Group Holdings | 193,100 | | 5,956,400 |
Coca-Cola Central Japan Co. Ltd. | 32,500 | | 456,767 |
| | 6,413,167 |
Food & Staples Retailing - 4.0% |
Ain Holdings, Inc. | 38,100 | | 1,803,608 |
San-A Co. Ltd. | 47,900 | | 2,034,107 |
Seven & i Holdings Co. Ltd. | 208,600 | | 9,475,617 |
Sundrug Co. Ltd. | 56,600 | | 2,981,659 |
Tsuruha Holdings, Inc. | 24,800 | | 1,964,757 |
Welcia Holdings Co. Ltd. | 78,500 | | 3,868,891 |
| | 22,128,639 |
Tobacco - 1.8% |
Japan Tobacco, Inc. | 276,100 | | 9,556,315 |
TOTAL CONSUMER STAPLES | | 38,098,121 |
|
| Shares | | Value |
FINANCIALS - 19.0% |
Banks - 8.0% |
Mitsubishi UFJ Financial Group, Inc. | 3,380,400 | | $ 21,862,854 |
Seven Bank Ltd. | 1,358,900 | | 6,191,903 |
Shinsei Bank Ltd. | 3,139,000 | | 6,581,771 |
Sumitomo Mitsui Financial Group, Inc. | 232,500 | | 9,275,278 |
| | 43,911,806 |
Capital Markets - 0.8% |
Monex Group, Inc. | 1,462,000 | | 4,109,708 |
Diversified Financial Services - 3.0% |
ORIX Corp. | 1,141,000 | | 16,662,914 |
Insurance - 2.2% |
Tokio Marine Holdings, Inc. | 310,700 | | 11,971,797 |
Real Estate Investment Trusts - 1.3% |
Invincible Investment Corp. | 2,648 | | 1,570,091 |
Nippon Prologis REIT, Inc. | 942 | | 1,656,583 |
Parkway Life REIT | 1,347,000 | | 2,217,993 |
Sekisui House (REIT), Inc. | 1,502 | | 1,548,369 |
| | 6,993,036 |
Real Estate Management & Development - 3.7% |
AEON MALL Co. Ltd. | 252,100 | | 4,217,058 |
Mitsui Fudosan Co. Ltd. | 590,000 | | 16,056,055 |
| | 20,273,113 |
TOTAL FINANCIALS | | 103,922,374 |
HEALTH CARE - 13.3% |
Health Care Equipment & Supplies - 4.9% |
Hoya Corp. | 430,200 | | 17,752,968 |
Olympus Corp. | 259,400 | | 8,749,907 |
| | 26,502,875 |
Health Care Providers & Services - 3.5% |
Message Co. Ltd. (d) | 243,700 | | 6,006,654 |
Miraca Holdings, Inc. | 104,100 | | 4,633,000 |
Ship Healthcare Holdings, Inc. | 357,400 | | 8,657,380 |
| | 19,297,034 |
Pharmaceuticals - 4.9% |
Astellas Pharma, Inc. | 1,852,400 | | 26,886,627 |
TOTAL HEALTH CARE | | 72,686,536 |
INDUSTRIALS - 13.8% |
Airlines - 0.8% |
Japan Airlines Co. Ltd. | 120,600 | | 4,543,380 |
Building Products - 1.3% |
Daikin Industries Ltd. | 72,800 | | 4,677,471 |
LIXIL Group Corp. | 107,700 | | 2,305,862 |
| | 6,983,333 |
Construction & Engineering - 1.0% |
Toshiba Plant Systems & Services Corp. | 508,800 | | 5,449,983 |
Common Stocks - continued |
| Shares | | Value |
INDUSTRIALS - continued |
Electrical Equipment - 2.6% |
Mitsubishi Electric Corp. | 641,000 | | $ 6,675,849 |
Nidec Corp. | 99,000 | | 7,460,255 |
| | 14,136,104 |
Machinery - 2.7% |
IHI Corp. | 1,110,000 | | 3,131,774 |
Kubota Corp. | 334,000 | | 5,177,488 |
Makita Corp. | 117,000 | | 6,410,761 |
| | 14,720,023 |
Professional Services - 0.4% |
Funai Soken Holdings, Inc. | 145,800 | | 2,236,793 |
Road & Rail - 4.2% |
East Japan Railway Co. | 240,300 | | 22,846,664 |
Trading Companies & Distributors - 0.8% |
Misumi Group, Inc. | 349,200 | | 4,547,318 |
TOTAL INDUSTRIALS | | 75,463,598 |
INFORMATION TECHNOLOGY - 13.8% |
Electronic Equipment & Components - 6.8% |
Azbil Corp. | 207,200 | | 5,227,489 |
Hitachi Ltd. | 2,128,000 | | 12,275,993 |
OMRON Corp. | 123,900 | | 4,102,684 |
Shimadzu Corp. | 792,000 | | 12,285,888 |
TDK Corp. | 54,800 | | 3,490,565 |
| | 37,382,619 |
Internet Software & Services - 4.0% |
Alibaba Group Holding Ltd. sponsored ADR (a) | 46,900 | | 3,931,627 |
DeNA Co. Ltd. | 250,900 | | 4,025,511 |
Kakaku.com, Inc. (d) | 500,500 | | 9,336,956 |
NAVER Corp. | 8,563 | | 4,499,855 |
| | 21,793,949 |
Semiconductors & Semiconductor Equipment - 1.3% |
Sanken Electric Co. Ltd. | 750,000 | | 2,606,671 |
Sumco Corp. | 442,800 | | 4,463,736 |
| | 7,070,407 |
Software - 0.2% |
COLOPL, Inc. (d) | 81,000 | | 1,323,234 |
Technology Hardware, Storage & Peripherals - 1.5% |
NEC Corp. | 1,043,000 | | 3,217,637 |
Samsung Electronics Co. Ltd. | 4,206 | | 5,054,111 |
| | 8,271,748 |
TOTAL INFORMATION TECHNOLOGY | | 75,841,957 |
MATERIALS - 5.2% |
Chemicals - 4.9% |
Daicel Chemical Industries Ltd. | 261,500 | | 3,455,563 |
|
| Shares | | Value |
Hitachi Chemical Co. Ltd. | 155,500 | | $ 2,458,082 |
JSR Corp. | 289,800 | | 4,576,898 |
Kansai Paint Co. Ltd. | 232,000 | | 3,536,560 |
Shin-Etsu Chemical Co. Ltd. | 132,600 | | 7,885,613 |
Toray Industries, Inc. | 584,000 | | 5,094,934 |
| | 27,007,650 |
Metals & Mining - 0.3% |
Yamato Kogyo Co. Ltd. | 58,400 | | 1,555,608 |
TOTAL MATERIALS | | 28,563,258 |
TELECOMMUNICATION SERVICES - 7.2% |
Diversified Telecommunication Services - 1.1% |
Nippon Telegraph & Telephone Corp. | 162,200 | | 5,946,479 |
Wireless Telecommunication Services - 6.1% |
KDDI Corp. | 738,000 | | 17,858,371 |
SoftBank Corp. | 277,200 | | 15,530,937 |
| | 33,389,308 |
TOTAL TELECOMMUNICATION SERVICES | | 39,335,787 |
TOTAL COMMON STOCKS (Cost $530,190,692) |
539,478,754
|
Money Market Funds - 3.3% |
| | | |
Fidelity Cash Central Fund, 0.18% (b) | 5,556,318 | | 5,556,318 |
Fidelity Securities Lending Cash Central Fund, 0.19% (b)(c) | 12,649,386 | | 12,649,386 |
TOTAL MONEY MARKET FUNDS (Cost $18,205,704) |
18,205,704
|
TOTAL INVESTMENT
PORTFOLIO - 101.9% (Cost $548,396,396) | | 557,684,458 |
NET OTHER ASSETS (LIABILITIES) - (1.9)% | | (10,360,116) |
NET ASSETS - 100% | $ 547,324,342 |
Legend |
(a) Non-income producing |
(b) Affiliated fund that is generally available only to investment companies and other accounts managed by Fidelity Investments. The rate quoted is the annualized seven-day yield of the fund at period end. A complete unaudited listing of the fund's holdings as of its most recent quarter end is available upon request. In addition, each Fidelity Central Fund's financial statements, which are not covered by the Fund's Report of Independent Registered Public Accounting Firm, are available on the SEC's website or upon request. |
(c) Investment made with cash collateral received from securities on loan. |
(d) Security or a portion of the security is on loan at period end. |
Affiliated Central Funds |
Information regarding fiscal year to date income earned by the Fund from investments in Fidelity Central Funds is as follows: |
Fund | Income earned |
Fidelity Cash Central Fund | $ 20,597 |
Fidelity Securities Lending Cash Central Fund | 71,632 |
Total | $ 92,229 |
Other Information |
The following is a summary of the inputs used, as of October 31, 2015, involving the Fund's assets and liabilities carried at fair value. The inputs or methodology used for valuing securities may not be an indication of the risk associated with investing in those securities. For more information on valuation inputs, and their aggregation into the levels used in the table below, please refer to the Investment Valuation section in the accompanying Notes to Financial Statements. |
Valuation Inputs at Reporting Date: |
Description | Total | Level 1 | Level 2 | Level 3 |
Investments in Securities: | | | | |
Equities: | | | | |
Consumer Discretionary | $ 105,567,123 | $ - | $ 105,567,123 | $ - |
Consumer Staples | 38,098,121 | - | 38,098,121 | - |
Financials | 103,922,374 | - | 103,922,374 | - |
Health Care | 72,686,536 | - | 72,686,536 | - |
Industrials | 75,463,598 | - | 75,463,598 | - |
Information Technology | 75,841,957 | 13,485,593 | 62,356,364 | - |
Materials | 28,563,258 | - | 28,563,258 | - |
Telecommunication Services | 39,335,787 | - | 39,335,787 | - |
Money Market Funds | 18,205,704 | 18,205,704 | - | - |
Total Investments in Securities: | $ 557,684,458 | $ 31,691,297 | $ 525,993,161 | $ - |
See accompanying notes which are an integral part of the financial statements.
Annual Report
Fidelity Japan Fund
Statement of Assets and Liabilities
| | October 31, 2015 |
| | |
Assets | | |
Investment in securities, at value (including securities loaned of $12,036,815) - See accompanying schedule: Unaffiliated issuers (cost $530,190,692) | $ 539,478,754 | |
Fidelity Central Funds (cost $18,205,704) | 18,205,704 | |
Total Investments (cost $548,396,396) | | $ 557,684,458 |
Receivable for investments sold | | 574,282 |
Receivable for fund shares sold | | 516,884 |
Dividends receivable | | 3,045,252 |
Distributions receivable from Fidelity Central Funds | | 8,242 |
Prepaid expenses | | 1,495 |
Other receivables | | 1,228 |
Total assets | | 561,831,841 |
| | |
Liabilities | | |
Payable for investments purchased | $ 1,066,235 | |
Payable for fund shares redeemed | 356,790 | |
Accrued management fee | 229,677 | |
Distribution and service plan fees payable | 21,782 | |
Other affiliated payables | 106,395 | |
Other payables and accrued expenses | 77,234 | |
Collateral on securities loaned, at value | 12,649,386 | |
Total liabilities | | 14,507,499 |
| | |
Net Assets | | $ 547,324,342 |
Net Assets consist of: | | |
Paid in capital | | $ 717,255,617 |
Undistributed net investment income | | 3,017,018 |
Accumulated undistributed net realized gain (loss) on investments and foreign currency transactions | | (182,218,023) |
Net unrealized appreciation (depreciation) on investments and assets and liabilities in foreign currencies | | 9,269,730 |
Net Assets | | $ 547,324,342 |
Statement of Assets and Liabilities - continued
| | October 31, 2015 |
| | |
Calculation of Maximum Offering Price | | |
Class A:
Net Asset Value and redemption price per share ($23,917,721 ÷ 2,014,446 shares) | | $ 11.87 |
| | |
Maximum offering price per share (100/94.25 of $11.87) | | $ 12.59 |
Class T:
Net Asset Value and redemption price per share ($4,808,761 ÷ 405,871 shares) | | $ 11.85 |
| | |
Maximum offering price per share (100/96.50 of $11.85) | | $ 12.28 |
Class B:
Net Asset Value and offering price per share ($347,681 ÷ 29,411 shares)A | | $ 11.82 |
| | |
Class C:
Net Asset Value and offering price per share ($18,490,533 ÷ 1,571,218 shares)A | | $ 11.77 |
| | |
Japan:
Net Asset Value, offering price and redemption price per share ($485,803,076 ÷ 40,792,237 shares) | | $ 11.91 |
| | |
Class I:
Net Asset Value, offering price and redemption price per share ($13,956,570 ÷ 1,174,263 shares) | | $ 11.89 |
A Redemption price per share is equal to net asset value less any applicable contingent deferred sales charge.
See accompanying notes which are an integral part of the financial statements.
Annual Report
Fidelity Japan Fund
Financial Statements - continued
Statement of Operations
| Year ended October 31, 2015 |
| | |
Investment Income | | |
Dividends | | $ 8,050,801 |
Income from Fidelity Central Funds | | 92,229 |
Income before foreign taxes withheld | | 8,143,030 |
Less foreign taxes withheld | | (808,062) |
Total income | | 7,334,968 |
| | |
Expenses | | |
Management fee | | |
Basic fee | $ 3,498,174 | |
Performance adjustment | (907,813) | |
Transfer agent fees | 962,727 | |
Distribution and service plan fees | 222,835 | |
Accounting and security lending fees | 260,372 | |
Custodian fees and expenses | 52,192 | |
Independent trustees' compensation | 2,143 | |
Registration fees | 82,981 | |
Audit | 73,136 | |
Legal | 1,206 | |
Miscellaneous | 3,718 | |
Total expenses before reductions | 4,251,671 | |
Expense reductions | (28,886) | 4,222,785 |
Net investment income (loss) | | 3,112,183 |
Realized and Unrealized Gain (Loss) | | |
Net realized gain (loss) on: | | |
Investment securities: | | |
Unaffiliated issuers | (27,164) | |
Foreign currency transactions | (365,218) | |
Total net realized gain (loss) | | (392,382) |
Change in net unrealized appreciation (depreciation) on: Investment securities | 1,912,886 | |
Assets and liabilities in foreign currencies | 24,355 | |
Total change in net unrealized appreciation (depreciation) | | 1,937,241 |
Net gain (loss) | | 1,544,859 |
Net increase (decrease) in net assets resulting from operations | | $ 4,657,042 |
Statement of Changes in Net Assets
| Year ended
October 31,
2015 | Year ended
October 31,
2014 |
Increase (Decrease) in Net Assets | | |
Operations | | |
Net investment income (loss) | $ 3,112,183 | $ 3,447,815 |
Net realized gain (loss) | (392,382) | (3,239,373) |
Change in net unrealized appreciation (depreciation) | 1,937,241 | (11,748,802) |
Net increase (decrease) in net assets resulting from operations | 4,657,042 | (11,540,360) |
Distributions to shareholders from net investment income | (3,310,432) | (4,561,447) |
Distributions to shareholders from net realized gain | - | (402,380) |
Total distributions | (3,310,432) | (4,963,827) |
Share transactions - net increase (decrease) | 70,904,089 | (48,052,746) |
Redemption fees | 139,156 | 110,748 |
Total increase (decrease) in net assets | 72,389,855 | (64,446,185) |
| | |
Net Assets | | |
Beginning of period | 474,934,487 | 539,380,672 |
End of period (including undistributed net investment income of $3,017,018 and undistributed net investment income of $3,240,458, respectively) | $ 547,324,342 | $ 474,934,487 |
See accompanying notes which are an integral part of the financial statements.
Annual Report
Financial Highlights - Fidelity Japan Fund Class A
Years ended October 31, | 2015 | 2014 | 2013 | 2012 | 2011 H |
Selected Per-Share Data | | | | | |
Net asset value, beginning of period | $ 11.65 | $ 12.00 | $ 9.30 | $ 9.54 | $ 10.83 |
Income from Investment Operations | | | | | |
Net investment income (loss) E | .04 | .05 | .08 | .09 | .09 |
Net realized and unrealized gain (loss) | .23 | (.31) | 2.80 | (.15) | (1.39) |
Total from investment operations | .27 | (.26) | 2.88 | (.06) | (1.30) |
Distributions from net investment income | (.05) | (.08) | (.11) | (.13) | - |
Distributions from net realized gain | - | (.01) | (.08) | (.05) | - |
Total distributions | (.05) | (.09) | (.19) | (.18) | - |
Redemption fees added to paid in capitalE | -K | -K | .01 | -K | .01 |
Net asset value, end of period | $ 11.87 | $ 11.65 | $ 12.00 | $ 9.30 | $ 9.54 |
Total ReturnB, C, D | 2.31% | (2.18)% | 31.58% | (.64)% | (11.91)% |
Ratios to Average Net AssetsF, I | | | | | |
Expenses before reductions | 1.10% | 1.23% | 1.26% | 1.42% | 1.20%A |
Expenses net of fee waivers, if any | 1.10% | 1.23% | 1.26% | 1.38% | 1.20%A |
Expenses net of all reductions | 1.09% | 1.23% | 1.25% | 1.36% | 1.16%A |
Net investment income (loss) | .37% | .41% | .75% | .94% | 1.02%A |
Supplemental Data | | | | | |
Net assets, end of period (000 omitted) | $ 23,918 | $ 21,352 | $ 20,520 | $ 9,495 | $ 13,208 |
Portfolio turnover rateG | 35% | 112% | 68% | 52% | 134%J |
AAnnualized BTotal returns for periods of less than one year are not annualized. CTotal returns would have been lower if certain expenses had not been reduced during the applicable periods shown. DTotal returns do not include the effect of the sales charges. ECalculated based on average shares outstanding during the period. FFees and expenses of any underlying Fidelity Central Funds are not included in the Fund's expense ratio. The Fund indirectly bears its proportionate share of the expenses of any underlying Fidelity Central Funds. GAmount does not include the portfolio activity of any underlying Fidelity Central Funds. HFor the period December 14, 2010 (commencement of sale of shares) to October 31, 2011. IExpense ratios reflect operating expenses of the class. Expenses before reductions do not reflect amounts reimbursed by the investment adviser or reductions from brokerage service arrangements or reductions from other expense offset arrangements and do not represent the amount paid by the class during periods when reimbursements or reductions occur. Expenses net of fee waivers reflect expenses after reimbursement by the investment adviser but prior to reductions from brokerage service arrangements or other expense offset arrangements. Expenses net of all reductions represent the net expenses paid by the class. JThe portfolio turnover rate does not include the assets acquired in the merger. KAmount represents less than $.005 per share. |
Financial Highlights - Fidelity Japan Fund Class T
Years ended October 31, | 2015 | 2014 | 2013 | 2012 | 2011 H |
Selected Per-Share Data | | | | | |
Net asset value, beginning of period | $ 11.62 | $ 11.96 | $ 9.28 | $ 9.51 | $ 10.83 |
Income from Investment Operations | | | | | |
Net investment income (loss) E | -K | .01 | .05 | .06 | .07 |
Net realized and unrealized gain (loss) | .23 | (.30) | 2.78 | (.13) | (1.40) |
Total from investment operations | .23 | (.29) | 2.83 | (.07) | (1.33) |
Distributions from net investment income | - | (.04) | (.08) | (.11) | - |
Distributions from net realized gain | - | (.01) | (.08) | (.05) | - |
Total distributions | - | (.05) | (.16) | (.16) | - |
Redemption fees added to paid in capitalE | -K | -K | .01 | -K | .01 |
Net asset value, end of period | $ 11.85 | $ 11.62 | $ 11.96 | $ 9.28 | $ 9.51 |
Total ReturnB, C, D | 1.98% | (2.42)% | 31.04% | (.75)% | (12.19)% |
Ratios to Average Net AssetsF, I | | | | | |
Expenses before reductions | 1.43% | 1.54% | 1.55% | 1.70% | 1.48%A |
Expenses net of fee waivers, if any | 1.43% | 1.54% | 1.55% | 1.66% | 1.48%A |
Expenses net of all reductions | 1.42% | 1.54% | 1.53% | 1.64% | 1.44%A |
Net investment income (loss) | .04% | .10% | .46% | .66% | .74%A |
Supplemental Data | | | | | |
Net assets, end of period (000 omitted) | $ 4,809 | $ 4,104 | $ 5,357 | $ 3,934 | $ 4,643 |
Portfolio turnover rateG | 35% | 112% | 68% | 52% | 134%J |
AAnnualized BTotal returns for periods of less than one year are not annualized. CTotal returns would have been lower if certain expenses had not been reduced during the applicable periods shown. DTotal returns do not include the effect of the sales charges. ECalculated based on average shares outstanding during the period. FFees and expenses of any underlying Fidelity Central Funds are not included in the Fund's expense ratio. The Fund indirectly bears its proportionate share of the expenses of any underlying Fidelity Central Funds. GAmount does not include the portfolio activity of any underlying Fidelity Central Funds. HFor the period December 14, 2010 (commencement of sale of shares) to October 31, 2011. IExpense ratios reflect operating expenses of the class. Expenses before reductions do not reflect amounts reimbursed by the investment adviser or reductions from brokerage service arrangements or reductions from other expense offset arrangements and do not represent the amount paid by the class during periods when reimbursements or reductions occur. Expenses net of fee waivers reflect expenses after reimbursement by the investment adviser but prior to reductions from brokerage service arrangements or other expense offset arrangements. Expenses net of all reductions represent the net expenses paid by the class. JThe portfolio turnover rate does not include the assets acquired in the merger. KAmount represents less than $.005 per share. |
See accompanying notes which are an integral part of the financial statements.
Annual Report
Financial Highlights - Fidelity Japan Fund Class B
Years ended October 31, | 2015 | 2014 | 2013 | 2012 | 2011 H |
Selected Per-Share Data | | | | | |
Net asset value, beginning of period | $ 11.65 | $ 12.00 | $ 9.26 | $ 9.47 | $ 10.83 |
Income from Investment Operations | | | | | |
Net investment income (loss) E | (.05) | (.04) | -K | .02 | .02 |
Net realized and unrealized gain (loss) | .22 | (.31) | 2.80 | (.14) | (1.39) |
Total from investment operations | .17 | (.35) | 2.80 | (.12) | (1.37) |
Distributions from net investment income | - | - | - | (.04) | - |
Distributions from net realized gain | - | - | (.07) | (.05) | - |
Total distributions | - | - | (.07) | (.09) | - |
Redemption fees added to paid in capitalE | -K | -K | .01 | -K | .01 |
Net asset value, end of period | $ 11.82 | $ 11.65 | $ 12.00 | $ 9.26 | $ 9.47 |
Total ReturnB, C, D | 1.46% | (2.92)% | 30.52% | (1.24)% | (12.56)% |
Ratios to Average Net AssetsF, I | | | | | |
Expenses before reductions | 1.91% | 2.02% | 2.02% | 2.17% | 1.95%A |
Expenses net of fee waivers, if any | 1.91% | 2.02% | 2.02% | 2.13% | 1.95%A |
Expenses net of all reductions | 1.91% | 2.02% | 2.01% | 2.11% | 1.91%A |
Net investment income (loss) | (.45)% | (.37)% | (.02)% | .19% | .27%A |
Supplemental Data | | | | | |
Net assets, end of period (000 omitted) | $ 348 | $ 452 | $ 874 | $ 1,012 | $ 1,458 |
Portfolio turnover rateG | 35% | 112% | 68% | 52% | 134%J |
AAnnualized BTotal returns for periods of less than one year are not annualized. CTotal returns would have been lower if certain expenses had not been reduced during the applicable periods shown. DTotal returns do not include the effect of the contingent deferred sales charge. ECalculated based on average shares outstanding during the period. FFees and expenses of any underlying Fidelity Central Funds are not included in the Fund's expense ratio. The Fund indirectly bears its proportionate share of the expenses of any underlying Fidelity Central Funds. GAmount does not include the portfolio activity of any underlying Fidelity Central Funds. HFor the period December 14, 2010 (commencement of sale of shares) to October 31, 2011. IExpense ratios reflect operating expenses of the class. Expenses before reductions do not reflect amounts reimbursed by the investment adviser or reductions from brokerage service arrangements or reductions from other expense offset arrangements and do not represent the amount paid by the class during periods when reimbursements or reductions occur. Expenses net of fee waivers reflect expenses after reimbursement by the investment adviser but prior to reductions from brokerage service arrangements or other expense offset arrangements. Expenses net of all reductions represent the net expenses paid by the class. JThe portfolio turnover rate does not include the assets acquired in the merger. KAmount represents less than $.005 per share. |
Financial Highlights - Fidelity Japan Fund Class C
Years ended October 31, | 2015 | 2014 | 2013 | 2012 | 2011 H |
Selected Per-Share Data | | | | | |
Net asset value, beginning of period | $ 11.58 | $ 11.96 | $ 9.25 | $ 9.48 | $ 10.83 |
Income from Investment Operations | | | | | |
Net investment income (loss) E | (.04) | (.03) | -K | .02 | .03 |
Net realized and unrealized gain (loss) | .23 | (.32) | 2.79 | (.14) | (1.39) |
Total from investment operations | .19 | (.35) | 2.79 | (.12) | (1.36) |
Distributions from net investment income | - | (.03) | (.01) | (.06) | - |
Distributions from net realized gain | - | (.01) | (.08) | (.05) | - |
Total distributions | - | (.03) L | (.09) | (.11) | - |
Redemption fees added to paid in capitalE | -K | -K | .01 | -K | .01 |
Net asset value, end of period | $ 11.77 | $ 11.58 | $ 11.96 | $ 9.25 | $ 9.48 |
Total ReturnB, C, D | 1.64% | (2.90)% | 30.55% | (1.27)% | (12.47)% |
Ratios to Average Net AssetsF, I | | | | | |
Expenses before reductions | 1.81% | 1.93% | 1.97% | 2.15% | 1.92%A |
Expenses net of fee waivers, if any | 1.81% | 1.93% | 1.97% | 2.11% | 1.92%A |
Expenses net of all reductions | 1.80% | 1.93% | 1.95% | 2.09% | 1.88%A |
Net investment income (loss) | (.34)% | (.29)% | .04% | .21% | .30%A |
Supplemental Data | | | | | |
Net assets, end of period (000 omitted) | $ 18,491 | $ 13,162 | $ 11,824 | $ 7,015 | $ 8,750 |
Portfolio turnover rateG | 35% | 112% | 68% | 52% | 134%J |
AAnnualized BTotal returns for periods of less than one year are not annualized. CTotal returns would have been lower if certain expenses had not been reduced during the applicable periods shown. DTotal returns do not include the effect of the contingent deferred sales charge. ECalculated based on average shares outstanding during the period. FFees and expenses of any underlying Fidelity Central Funds are not included in the Fund's expense ratio. The Fund indirectly bears its proportionate share of the expenses of any underlying Fidelity Central Funds. GAmount does not include the portfolio activity of any underlying Fidelity Central Funds. HFor the period December 14, 2010 (commencement of sale of shares) to October 31, 2011. IExpense ratios reflect operating expenses of the class. Expenses before reductions do not reflect amounts reimbursed by the investment adviser or reductions from brokerage service arrangements or reductions from other expense offset arrangements and do not represent the amount paid by the class during periods when reimbursements or reductions occur. Expenses net of fee waivers reflect expenses after reimbursement by the investment adviser but prior to reductions from brokerage service arrangements or other expense offset arrangements. Expenses net of all reductions represent the net expenses paid by the class. JThe portfolio turnover rate does not include the assets acquired in the merger. KAmount represents less than $.005 per share. LTotal distributions of $.03 per share is comprised of distributions from net investment income of $.025 and distributions from net realized gain of $.009 per share. |
See accompanying notes which are an integral part of the financial statements.
Annual Report
Financial Highlights - Fidelity Japan Fund
Years ended October 31, | 2015 | 2014 | 2013 | 2012 | 2011 |
Selected Per-Share Data | | | | | |
Net asset value, beginning of period | $ 11.69 | $ 12.03 | $ 9.34 | $ 9.57 | $ 10.57 |
Income from Investment Operations | | | | | |
Net investment income (loss) B | .08 | .09 | .12 | .12 | .15 |
Net realized and unrealized gain (loss) | .23 | (.32) | 2.79 | (.14) | (.75) |
Total from investment operations | .31 | (.23) | 2.91 | (.02) | (.60) |
Distributions from net investment income | (.09) | (.11) | (.15) | (.16) | (.20) |
Distributions from net realized gain | - | (.01) | (.08) | (.05) | (.21) |
Total distributions | (.09) | (.11) H | (.23) | (.21) | (.41) |
Redemption fees added to paid in capitalB | -G | -G | .01 | -G | .01 |
Net asset value, end of period | $ 11.91 | $ 11.69 | $ 12.03 | $ 9.34 | $ 9.57 |
Total Return A | 2.66% | (1.90)% | 31.92% | (.19)% | (6.00)% |
Ratios to Average Net AssetsC, E | | | | | |
Expenses before reductions | .80% | .90% | .93% | 1.09% | .86% |
Expenses net of fee waivers, if any | .80% | .90% | .93% | 1.06% | .84% |
Expenses net of all reductions | .79% | .90% | .91% | 1.04% | .80% |
Net investment income (loss) | .67% | .74% | 1.08% | 1.26% | 1.38% |
Supplemental Data | | | | | |
Net assets, end of period (000 omitted) | $ 485,803 | $ 415,612 | $ 480,773 | $ 353,550 | $ 450,417 |
Portfolio turnover rateD | 35% | 112% | 68% | 52% | 134%F |
ATotal returns would have been lower if certain expenses had not been reduced during the applicable periods shown. BCalculated based on average shares outstanding during the period. CFees and expenses of any underlying Fidelity Central Funds are not included in the Fund's expense ratio. The Fund indirectly bears its proportionate share of the expenses of any underlying Fidelity Central Funds. DAmount does not include the portfolio activity of any underlying Fidelity Central Funds. EExpense ratios reflect operating expenses of the class. Expenses before reductions do not reflect amounts reimbursed by the investment adviser or reductions from brokerage service arrangements or reductions from other expense offset arrangements and do not represent the amount paid by the class during periods when reimbursements or reductions occur. Expenses net of fee waivers reflect expenses after reimbursement by the investment adviser but prior to reductions from brokerage service arrangements or other expense offset arrangements. Expenses net of all reductions represent the net expenses paid by the class. FThe portfolio turnover rate does not include the assets acquired in the merger. GAmount represents less than $.005 per share. HTotal distributions of $.11 per share is comprised of distributions from net investment income of $.105 and distributions from net realized gain of $.009 per share. |
Financial Highlights - Fidelity Japan Fund Class I
Years ended October 31, | 2015 | 2014 | 2013 | 2012 | 2011 G |
Selected Per-Share Data | | | | | |
Net asset value, beginning of period | $ 11.67 | $ 12.02 | $ 9.33 | $ 9.57 | $ 10.83 |
Income from Investment Operations | | | | | |
Net investment income (loss) D | .08 | .09 | .13 | .12 | .13 |
Net realized and unrealized gain (loss) | .23 | (.32) | 2.78 | (.14) | (1.40) |
Total from investment operations | .31 | (.23) | 2.91 | (.02) | (1.27) |
Distributions from net investment income | (.09) | (.12) | (.15) | (.17) | - |
Distributions from net realized gain | - | (.01) | (.08) | (.05) | - |
Total distributions | (.09) | (.12) K | (.23) | (.22) | - |
Redemption fees added to paid in capitalD | -J | -J | .01 | -J | .01 |
Net asset value, end of period | $ 11.89 | $ 11.67 | $ 12.02 | $ 9.33 | $ 9.57 |
Total ReturnB, C | 2.72% | (1.90)% | 32.04% | (.18)% | (11.63)% |
Ratios to Average Net AssetsE, H | | | | | |
Expenses before reductions | .80% | .89% | .90% | 1.03% | .79%A |
Expenses net of fee waivers, if any | .80% | .89% | .90% | 1.01% | .79%A |
Expenses net of all reductions | .79% | .89% | .88% | .99% | .75%A |
Net investment income (loss) | .67% | .76% | 1.11% | 1.31% | 1.43%A |
Supplemental Data | | | | | |
Net assets, end of period (000 omitted) | $ 13,957 | $ 20,253 | $ 20,033 | $ 1,488 | $ 2,715 |
Portfolio turnover rateF | 35% | 112% | 68% | 52% | 134%I |
AAnnualized BTotal returns for periods of less than one year are not annualized. CTotal returns would have been lower if certain expenses had not been reduced during the applicable periods shown. DCalculated based on average shares outstanding during the period. EFees and expenses of any underlying Fidelity Central Funds are not included in the Fund's expense ratio. The Fund indirectly bears its proportionate share of the expenses of any underlying Fidelity Central Funds. FAmount does not include the portfolio activity of any underlying Fidelity Central Funds. GFor the period December 14, 2010 (commencement of sale of shares) to October 31, 2011. HExpense ratios reflect operating expenses of the class. Expenses before reductions do not reflect amounts reimbursed by the investment adviser or reductions from brokerage service arrangements or reductions from other expense offset arrangements and do not represent the amount paid by the class during periods when reimbursements or reductions occur. Expenses net of fee waivers reflect expenses after reimbursement by the investment adviser but prior to reductions from brokerage service arrangements or other expense offset arrangements. Expenses net of all reductions represent the net expenses paid by the class. IThe portfolio turnover rate does not include the assets acquired in the merger. JAmount represents less than $.005 per share. KTotal distributions of $.12 per share is comprised of distributions from net investment income of $.115 and distributions from net realized gain of $.009 per share. |
See accompanying notes which are an integral part of the financial statements.
Annual Report
For the period ended October 31, 2015
1. Organization.
Fidelity Japan Fund (the Fund) is a fund of Fidelity Investment Trust (the Trust) and is authorized to issue an unlimited number of shares. The Trust is registered under the Investment Company Act of 1940, as amended (the 1940 Act), as an open-end management investment company organized as a Massachusetts business trust. The Fund offers Class A, Class T, Class C, Japan and Class I (formerly Institutional Class) shares, each of which, along with Class B shares, has equal rights as to assets and voting privileges. Class B shares are closed to new accounts and additional purchases, except for exchanges and reinvestments. Each class has exclusive voting rights with respect to matters that affect that class. Class B shares will automatically convert to Class A shares after a holding period of seven years from the initial date of purchase.
2. Investments in Fidelity Central Funds.
The Fund invests in Fidelity Central Funds, which are open-end investment companies generally available only to other investment companies and accounts managed by the investment adviser and its affiliates. The Fund's Schedule of Investments lists each of the Fidelity Central Funds held as of period end, if any, as an investment of the Fund, but does not include the underlying holdings of each Fidelity Central Fund. As an Investing Fund, the Fund indirectly bears its proportionate share of the expenses of the underlying Fidelity Central Funds.
The Money Market Central Funds seek preservation of capital and current income and are managed by Fidelity Investments Money Management, Inc. (FIMM), an affiliate of the investment adviser. Annualized expenses of the Money Market Central Funds as of their most recent shareholder report date are less than .005%.
A complete unaudited list of holdings for each Fidelity Central Fund is available upon request or at the Securities and Exchange Commission (the SEC) website at www.sec.gov. In addition, the financial statements of the Fidelity Central Funds, which are not covered by the Fund's Report of Independent Registered Public Accounting Firm, are available on the SEC website or upon request.
3. Significant Accounting Policies.
The financial statements have been prepared in conformity with accounting principles generally accepted in the United States of America (GAAP), which require management to make certain estimates and assumptions at the date of the financial statements. Actual results could differ from those estimates. Subsequent events, if any, through the date that the financial statements were issued have been evaluated in the preparation of the financial statements. The following summarizes the significant accounting policies of the Fund:
Investment Valuation. Investments are valued as of 4:00 p.m. Eastern time on the last calendar day of the period. The Board of Trustees (the Board) has delegated the day to day responsibility for the valuation of the Fund's investments to the Fidelity Management & Research Company (FMR) Fair Value Committee (the Committee). In accordance with valuation policies and procedures approved by the Board, the Fund attempts to obtain prices from one or more third party pricing vendors or brokers to value its investments. When current market prices, quotations or currency exchange rates are not readily available or reliable, investments will be fair valued in good faith by the Committee, in accordance with procedures adopted by the Board. Factors used in determining fair value vary by investment type and may include market or investment specific events. The frequency with which these procedures are used cannot be predicted and they may be utilized to a significant extent. The Committee oversees the Fund's valuation policies and procedures and reports to the Board on the Committee's activities and fair value determinations. The Board monitors the appropriateness of the procedures used in valuing the Fund's investments and ratifies the fair value determinations of the Committee.
The Fund categorizes the inputs to valuation techniques used to value its investments into a disclosure hierarchy consisting of three levels as shown below:
Level 1 - quoted prices in active markets for identical investments
Level 2 - other significant observable inputs (including quoted prices for similar investments, interest rates, prepayment speeds, etc.)
Level 3 - unobservable inputs (including the Fund's own assumptions based on the best information available)
Valuation techniques used to value the Fund's investments by major category are as follows:
Equity securities, including restricted securities, for which market quotations are readily available, are valued at the last reported sale price or official closing price as reported by a third party pricing vendor on the primary market or exchange on which they are traded and are categorized as Level 1 in the hierarchy. In the event there were no sales during the day or closing prices are not available, securities are valued at the last quoted bid price or may be valued using the last available price and are generally categorized as Level 2 in the hierarchy. For foreign equity securities, when market or security specific events arise, comparisons to the valuation of American Depositary Receipts (ADRs), futures contracts, Exchange-Traded Funds (ETFs) and certain indexes as well as quoted prices for similar securities may be used and would be categorized as Level 2 in the hierarchy. Utilizing these techniques may result in transfers between Level 1 and Level 2. For equity securities, including restricted securities, where observable inputs are limited, assumptions about market activity and risk are used and these securities may be categorized as Level 3 in the hierarchy.
Annual Report
3. Significant Accounting Policies - continued
Investment Valuation - continued
Investments in open-end mutual funds, including the Fidelity Central Funds, are valued at their closing net asset value (NAV) each business day and are categorized as Level 1 in the hierarchy.
Changes in valuation techniques may result in transfers in or out of an assigned level within the disclosure hierarchy. The aggregate value of investments by input level as of October 31, 2015 is included at the end of the Fund's Schedule of Investments.
Foreign Currency. The Fund may use foreign currency contracts to facilitate transactions in foreign-denominated securities. Gains and losses from these transactions may arise from changes in the value of the foreign currency or if the counterparties do not perform under the contracts' terms.
Foreign-denominated assets, including investment securities, and liabilities are translated into U.S. dollars at the exchange rates at period end. Purchases and sales of investment securities, income and dividends received and expenses denominated in foreign currencies are translated into U.S. dollars at the exchange rate in effect on the transaction date.
The effects of exchange rate fluctuations on investments are included with the net realized and unrealized gain (loss) on investment securities. Other foreign currency transactions resulting in realized and unrealized gain (loss) are disclosed separately.
Investment Transactions and Income. For financial reporting purposes, the Fund's investment holdings and NAV include trades executed through the end of the last business day of the period. The NAV per share for processing shareholder transactions is calculated as of the close of business of the New York Stock Exchange (NYSE), normally 4:00 p.m. Eastern time and includes trades executed through the end of the prior business day. Gains and losses on securities sold are determined on the basis of identified cost. Dividend income is recorded on the ex-dividend date, except for certain dividends from foreign securities where the ex-dividend date may have passed, which are recorded as soon as the Fund is informed of the ex-dividend date. Non-cash dividends included in dividend income, if any, are recorded at the fair market value of the securities received. Income and capital gain distributions from Fidelity Central Funds, if any, are recorded on the ex-dividend date. Investment income is recorded net of foreign taxes withheld where recovery of such taxes is uncertain.
Class Allocations and Expenses. Investment income, realized and unrealized capital gains and losses, common expenses of the Fund, and certain fund-level expense reductions, if any, are allocated daily on a pro-rata basis to each class based on the relative net assets of each class to the total net assets of the Fund. Each class differs with respect to transfer agent and distribution and service plan fees incurred. Certain expense reductions may also differ by class. For the reporting period, the allocated portion of income and expenses to each class as a percent of its average net assets may vary due to the timing of recording these transactions in relation to fluctuating net assets of the classes. Expenses directly attributable to a fund are charged to that fund. Expenses attributable to more than one fund are allocated among the respective funds on the basis of relative net assets or other appropriate methods. Expense estimates are accrued in the period to which they relate and adjustments are made when actual amounts are known.
Income Tax Information and Distributions to Shareholders. Each year, the Fund intends to qualify as a regulated investment company under Subchapter M of the Internal Revenue Code, including distributing substantially all of its taxable income and realized gains. As a result, no provision for U.S. Federal income taxes is required. As of October 31, 2015, the Fund did not have any unrecognized tax benefits in the financial statements; nor is the Fund aware of any tax positions for which it is reasonably possible that the total amounts of unrecognized tax benefits will significantly change in the next twelve months. The Fund files a U.S. federal tax return, in addition to state and local tax returns as required. The Fund's federal income tax returns are subject to examination by the Internal Revenue Service (IRS) for a period of three fiscal years after they are filed. State and local tax returns may be subject to examination for an additional fiscal year depending on the jurisdiction. Foreign taxes are provided for based on the Fund's understanding of the tax rules and rates that exist in the foreign markets in which it invests.
Distributions are declared and recorded on the ex-dividend date. Income dividends and capital gain distributions are declared separately for each class. Income and capital gain distributions are determined in accordance with income tax regulations, which may differ from GAAP.
Capital accounts within the financial statements are adjusted for permanent book-tax differences. These adjustments have no impact on net assets or the results of operations. Capital accounts are not adjusted for temporary book-tax differences which will reverse in a subsequent period.
Book-tax differences are primarily due to foreign currency transactions, passive-foreign investment companies (PFIC), expiring capital loss carryforwards, deferred trustees compensation, capital loss carryforwards and losses deferred due to wash sales.
The federal tax cost of investment securities and unrealized appreciation (depreciation) as of period end were as follows:
Gross unrealized appreciation | $ 49,425,970 |
Gross unrealized depreciation | (44,535,187) |
Net unrealized appreciation (depreciation) on securities | $ 4,890,783 |
Tax Cost | $ 552,793,675 |
Annual Report
Notes to Financial Statements - continued
3. Significant Accounting Policies - continued
Income Tax Information and Distributions to Shareholders - continued
The tax-based components of distributable earnings as of period end were as follows:
Undistributed ordinary income | $ 3,215,209 |
Capital loss carryforward | $ (178,019,200) |
Net unrealized appreciation (depreciation) on securities and other investments | $ 4,872,858 |
Capital loss carryforwards are only available to offset future capital gains of the Fund to the extent provided by regulations and may be limited. Under the Regulated Investment Company Modernization Act of 2010 (the Act), the Fund is permitted to carry forward capital losses incurred in taxable years beginning after December 22, 2010 for an unlimited period and such capital losses are required to be used prior to any losses that expire. The capital loss carryforward information presented below, including any applicable limitation, is estimated as of fiscal period end and is subject to adjustment.
Fiscal year of expiration | |
2016 | $ (3,870,588) |
2017 | (41,604,070) |
2018 | (26,887,863) |
2019 | (98,806,037) |
Total with expiration | (171,168,558) |
No expiration | |
Short-term | (6,850,642) |
Total capital loss carryforward | $ (178,019,200) |
The tax character of distributions paid was as follows:
| October 31, 2015 | October 31, 2014 |
Ordinary Income | $ 3,310,432 | $ 4,963,827 |
Due to large redemptions in a prior period, $141,955,883 of capital losses that will be available to offset future capital gains of the Fund will be limited to approximately $18,885,324 per year.
The Fund acquired $5,487,891 of its capital loss carryforward as part of a merger in a prior period. The losses acquired that will be available to offset future capital gains of the Fund will be limited to approximately $1,371,973 per year.
Short-Term Trading (Redemption) Fees. Shares held by investors in the Fund less than 90 days may have been subject to a redemption fee equal to 1.50% of the NAV of shares redeemed. All redemption fees, which reduce the proceeds of the shareholder redemption, are retained by the Fund and accounted for as an addition to paid in capital.
4. Purchases and Sales of Investments.
Purchases and sales of securities, other than short-term securities, aggregated $242,746,871 and $168,418,077, respectively.
5. Fees and Other Transactions with Affiliates.
Management Fee. Fidelity Management & Research Company (the investment adviser) and its affiliates provide the Fund with investment management related services for which the Fund pays a monthly management fee. The management fee is the sum of an individual fund fee rate that is based on an annual rate of .45% of the Fund's average net assets and an annualized group fee rate that averaged .25% during the period. The group fee rate is based upon the average net assets of all the mutual funds advised by the investment adviser, including any mutual funds previously advised by the investment adviser that are currently advised by Fidelity SelectCo, LLC, an affiliate of the investment adviser. The group fee rate decreases as assets under management increase and increases as assets under management decrease. In addition, the management fee is subject to a performance adjustment (up to a maximum of ± .20% of the Fund's average net assets over a 36 month performance period). The upward or downward adjustment to the management fee is based on the relative investment performance of Japan as compared to its benchmark index, the TOPIX, over the same 36 month performance period. For the reporting period, the total annual management fee rate, including the performance adjustment, was .52% of the Fund's average net assets. The performance adjustment included in the management fee rate may be higher or lower than the maximum performance adjustment rate due to the difference between the average net assets for the reporting and performance periods.
Annual Report
5. Fees and Other Transactions with Affiliates - continued
Distribution and Service Plan Fees. In accordance with Rule 12b-1 of the 1940 Act, the Fund has adopted separate Distribution and Service Plans for each class of shares. Certain classes pay Fidelity Distributors Corporation (FDC), an affiliate of the investment adviser, separate Distribution and Service Fees, each of which is based on an annual percentage of each class' average net assets. In addition, FDC may pay financial intermediaries for selling shares of the Fund and providing shareholder support services. For the period, the Distribution and Service Fee rates, total fees and amounts retained by FDC were as follows:
| Distribution
Fee | Service
Fee | Total Fees | Retained
by FDC |
Class A | -% | .25% | $ 50,273 | $ 1,164 |
Class T | .25% | .25% | 21,808 | 36 |
Class B | .75% | .25% | 4,103 | 3,078 |
Class C | .75% | .25% | 146,651 | 44,718 |
| | | $ 222,835 | $ 48,996 |
Sales Load. FDC may receive a front-end sales charge of up to 5.75% for selling Class A shares and 3.50% for selling Class T shares, some of which is paid to financial intermediaries for selling shares of the Fund. Depending on the holding period, FDC may receive contingent deferred sales charges levied on Class A, Class T, Class B, and Class C redemptions. The deferred sales charges range from 5.00% to 1.00% for Class B shares, 1.00% for Class C shares, 1.00% for certain purchases of Class A shares and .25% for certain purchases of Class T shares.
For the period, sales charge amounts retained by FDC were as follows:
| Retained
by FDC |
Class A | $ 45,946 |
Class T | 1,710 |
Class B A | 8 |
Class C A | 4,518 |
| $ 52,182 |
A When Class B and Class C shares are initially sold, FDC pays commissions from its own resources to financial intermediaries through which the sales are made.
Transfer Agent Fees. Fidelity Investments Institutional Operations Company, Inc., (FIIOC), an affiliate of the investment adviser, is the transfer, dividend disbursing and shareholder servicing agent for each class of the Fund. FIIOC receives account fees and asset-based fees that vary according to the account size and type of account of the shareholders of the respective classes of the Fund. FIIOC pays for typesetting, printing and mailing of shareholder reports, except proxy statements.
For the period, transfer agent fees for each class were as follows:
| Amount | % of
Class-Level Average
Net Assets |
Class A | $ 47,937 | .24 |
Class T | 13,899 | .32 |
Class B | 1,223 | .30 |
Class C | 29,557 | .20 |
Japan | 841,695 | .19 |
Class I | 28,416 | .19 |
| $ 962,727 | |
Accounting and Security Lending Fees. Fidelity Service Company, Inc. (FSC), an affiliate of the investment adviser, maintains the Fund's accounting records. The accounting fee is based on the level of average net assets for each month. Under a separate contract, FSC administers the security lending program. The security lending fee is based on the number and duration of lending transactions.
Annual Report
Notes to Financial Statements - continued
6. Committed Line of Credit.
The Fund participates with other funds managed by the investment adviser or an affiliate in a $4.25 billion credit facility (the "line of credit") to be utilized for temporary or emergency purposes to fund shareholder redemptions or for other short-term liquidity purposes. The Fund has agreed to pay commitment fees on its pro-rata portion of the line of credit, which amounted to $704 and is reflected in Miscellaneous expenses on the Statement of Operations. During the period, the Fund did not borrow on this line of credit.
7. Security Lending.
The Fund lends portfolio securities through a lending agent from time to time in order to earn additional income. For equity securities, a lending agent is used and may loan securities to certain qualified borrowers, including Fidelity Capital Markets (FCM), a broker-dealer affiliated with the Fund. On the settlement date of the loan, the Fund receives collateral (in the form of U.S. Treasury obligations, letters of credit and/or cash) against the loaned securities and maintains collateral in an amount not less than 100% of the market value of the loaned securities during the period of the loan. The market value of the loaned securities is determined at the close of business of the Fund and any additional required collateral is delivered to the Fund on the next business day. The Fund or borrower may terminate the loan at any time, and if the borrower defaults on its obligation to return the securities loaned because of insolvency or other reasons, the Fund may apply collateral received from the borrower against the obligation. The Fund may experience delays and costs in recovering the securities loaned. Any cash collateral received is invested in the Fidelity Securities Lending Cash Central Fund. The value of loaned securities and cash collateral at period end are disclosed on the Fund's Statement of Assets and Liabilities. Security lending income represents the income earned on investing cash collateral, less rebates paid to borrowers and any lending agent fees associated with the loan, plus any premium payments received for lending certain types of securities. Security lending income is presented in the Statement of Operations as a component of income from Fidelity Central Funds. Total security lending income during the period amounted to $71,632. During the period, there were no securities loaned to FCM.
8. Expense Reductions.
Commissions paid to certain brokers with whom the investment adviser, or its affiliates, places trades on behalf of the Fund include an amount in addition to trade execution, which may be rebated back to the Fund to offset certain expenses. This amount totaled $14,341 for the period.
In addition, during the period the investment adviser reimbursed and/or waived a portion of fund-level operating expenses in the amount of $2,192 and a portion of class-level operating expenses as follows:
| Amount |
Class A | $ 400 |
Class T | 8 |
Class B | 1 |
Class C | 278 |
Japan | 11,320 |
Class I | 346 |
| $ 12,353 |
9. Distributions to Shareholders.
Distributions to shareholders of each class were as follows:
Years ended October 31, | 2015 | 2014 |
From net investment income | | |
Class A | $ 79,823 | $ 141,802 |
Class T | - | 19,055 |
Class C | - | 25,435 |
Japan | 3,066,127 | 4,169,355 |
Class I | 164,482 | 205,800 |
Total | $ 3,310,432 | $ 4,561,447 |
From net realized gain | | |
Class A | $ - | $ 15,756 |
Class T | - | 3,988 |
Class C | - | 9,157 |
Japan | - | 357,373 |
Class I | - | 16,106 |
Total | $ - | $ 402,380 |
Annual Report
10. Share Transactions.
Share transactions for each class were as follows and may contain automatic conversions between classes or exchanges between funds:
| Shares | Dollars |
Years ended October 31, | 2015 | 2014 | 2015 | 2014 |
Class A | | | | |
Shares sold | 1,104,408 | 952,008 | $ 13,420,485 | $ 11,244,440 |
Reinvestment of distributions | 6,565 | 11,439 | 74,452 | 136,237 |
Shares redeemed | (929,216) | (840,548) | (10,724,499) | (9,766,930) |
Net increase (decrease) | 181,757 | 122,899 | $ 2,770,438 | $ 1,613,747 |
Class T | | | | |
Shares sold | 180,232 | 64,476 | $ 2,170,519 | $ 752,702 |
Reinvestment of distributions | - | 1,875 | - | 22,328 |
Shares redeemed | (127,640) | (160,810) | (1,490,023) | (1,872,832) |
Net increase (decrease) | 52,592 | (94,459) | $ 680,496 | $ (1,097,802) |
Class B | | | | |
Shares sold | 711 | 818 | $ 8,779 | $ 10,000 |
Shares redeemed | (10,106) | (34,849) | (116,253) | (406,096) |
Net increase (decrease) | (9,395) | (34,031) | $ (107,474) | $ (396,096) |
Class C | | | | |
Shares sold | 747,753 | 496,705 | $ 8,932,993 | $ 5,806,151 |
Reinvestment of distributions | - | 2,168 | - | 25,821 |
Shares redeemed | (312,924) | (351,222) | (3,580,602) | (4,038,883) |
Net increase (decrease) | 434,829 | 147,651 | $ 5,352,391 | $ 1,793,089 |
Japan | | | | |
Shares sold | 18,408,352 | 4,922,211 | $ 225,875,166 | $ 57,652,164 |
Reinvestment of distributions | 262,630 | 370,099 | 2,980,854 | 4,407,882 |
Shares redeemed | (13,426,033) | (9,716,469) | (161,325,584) | (112,632,153) |
Net increase (decrease) | 5,244,949 | (4,424,159) | $ 67,530,436 | $ (50,572,107) |
Class I | | | | |
Shares sold | 1,688,546 | 916,937 | $ 20,578,143 | $ 10,668,831 |
Reinvestment of distributions | 14,222 | 13,570 | 161,134 | 161,488 |
Shares redeemed | (2,263,385) | (862,451) | (26,061,475) | (10,223,896) |
Net increase (decrease) | (560,617) | 68,056 | $ (5,322,198) | $ 606,423 |
11. Other.
The Fund's organizational documents provide former and current trustees and officers with a limited indemnification against liabilities arising in connection with the performance of their duties to the Fund. In the normal course of business, the Fund may also enter into contracts that provide general indemnifications. The Fund's maximum exposure under these arrangements is unknown as this would be dependent on future claims that may be made against the Fund. The risk of material loss from such claims is considered remote.
At the end of the period, Strategic Advisers International Fund was the owner of record of approximately 23% of the total outstanding shares of the Fund. Mutual Funds managed by the investment adviser or its affiliates were the owners of record, in the aggregate, of approximately 53% of the total outstanding shares of the Fund.
Annual Report
To the Trustees of Fidelity Investment Trust and the Shareholders of Fidelity Japan Fund:
In our opinion, the accompanying statement of assets and liabilities, including the schedule of investments, and the related statements of operations and of changes in net assets and the financial highlights present fairly, in all material respects, the financial position of Fidelity Japan Fund (a fund of Fidelity Investment Trust) at October 31, 2015, the results of its operations for the year then ended, the changes in its net assets for each of the two years in the period then ended and the financial highlights for each of the periods indicated, in conformity with accounting principles generally accepted in the United States of America. These financial statements and financial highlights (hereafter referred to as "financial statements") are the responsibility of the Fidelity Japan Fund's management. Our responsibility is to express an opinion on these financial statements based on our audits. We conducted our audits of these financial statements in accordance with the standards of the Public Company Accounting Oversight Board (United States). Those standards require that we plan and perform the audit to obtain reasonable assurance about whether the financial statements are free of material misstatement. An audit includes examining, on a test basis, evidence supporting the amounts and disclosures in the financial statements, assessing the accounting principles used and significant estimates made by management, and evaluating the overall financial statement presentation. We believe that our audits, which included confirmation of securities at October 31, 2015 by correspondence with the custodian and brokers, provide a reasonable basis for our opinion.
PricewaterhouseCoopers LLP
Boston, Massachusetts
December 22, 2015
Annual Report
The Trustees, Member of the Advisory Board, and officers of the trust and fund, as applicable, are listed below. The Board of Trustees governs the fund and is responsible for protecting the interests of shareholders. The Trustees are experienced executives who meet periodically throughout the year to oversee the fund's activities, review contractual arrangements with companies that provide services to the fund, oversee management of the risks associated with such activities and contractual arrangements, and review the fund's performance. Each of the Trustees oversees 170 funds.
The Trustees hold office without limit in time except that (a) any Trustee may resign; (b) any Trustee may be removed by written instrument, signed by at least two-thirds of the number of Trustees prior to such removal; (c) any Trustee who requests to be retired or who has become incapacitated by illness or injury may be retired by written instrument signed by a majority of the other Trustees; and (d) any Trustee may be removed at any special meeting of shareholders by a two-thirds vote of the outstanding voting securities of the trust. Each Trustee who is not an interested person (as defined in the 1940 Act) of the trust and the fund (Independent Trustee), shall retire not later than the last day of the calendar year in which his or her 75th birthday occurs. The Independent Trustees may waive this mandatory retirement age policy with respect to individual Trustees. The officers and Advisory Board Member hold office without limit in time, except that any officer and Advisory Board Member may resign or may be removed by a vote of a majority of the Trustees at any regular meeting or any special meeting of the Trustees. Except as indicated, each individual has held the office shown or other offices in the same company for the past five years.
Experience, Skills, Attributes, and Qualifications of the Fund's Trustees. The Governance and Nominating Committee has adopted a statement of policy that describes the experience, qualifications, attributes, and skills that are necessary and desirable for potential Independent Trustee candidates (Statement of Policy). The Board believes that each Trustee satisfied at the time he or she was initially elected or appointed a Trustee, and continues to satisfy, the standards contemplated by the Statement of Policy. The Governance and Nominating Committee also engages professional search firms to help identify potential Independent Trustee candidates who have the experience, qualifications, attributes, and skills consistent with the Statement of Policy. From time to time, additional criteria based on the composition and skills of the current Independent Trustees, as well as experience or skills that may be appropriate in light of future changes to board composition, business conditions, and regulatory or other developments, have also been considered by the professional search firms and the Governance and Nominating Committee. In addition, the Board takes into account the Trustees' commitment and participation in Board and committee meetings, as well as their leadership of standing and ad hoc committees throughout their tenure.
In determining that a particular Trustee was and continues to be qualified to serve as a Trustee, the Board has considered a variety of criteria, none of which, in isolation, was controlling. The Board believes that, collectively, the Trustees have balanced and diverse experience, qualifications, attributes, and skills, which allow the Board to operate effectively in governing the fund and protecting the interests of shareholders. Information about the specific experience, skills, attributes, and qualifications of each Trustee, which in each case led to the Board's conclusion that the Trustee should serve (or continue to serve) as a trustee of the fund, is provided below.
Board Structure and Oversight Function. James C. Curvey is an interested person (as defined in the 1940 Act) and currently serves as Chairman. The Trustees have determined that an interested Chairman is appropriate and benefits shareholders because an interested Chairman has a personal and professional stake in the quality and continuity of services provided to the fund. Independent Trustees exercise their informed business judgment to appoint an individual of their choosing to serve as Chairman, regardless of whether the Trustee happens to be independent or a member of management. The Independent Trustees have determined that they can act independently and effectively without having an Independent Trustee serve as Chairman and that a key structural component for assuring that they are in a position to do so is for the Independent Trustees to constitute a substantial majority for the Board. The Independent Trustees also regularly meet in executive session. Ned C. Lautenbach serves as Chairman of the Independent Trustees and as such (i) acts as a liaison between the Independent Trustees and management with respect to matters important to the Independent Trustees and (ii) with management prepares agendas for Board meetings.
Fidelity funds are overseen by different Boards of Trustees. The fund's Board oversees Fidelity's high income and certain equity funds, and other Boards oversee Fidelity's investment-grade bond, money market, asset allocation, and sector funds. The asset allocation funds may invest in Fidelity funds overseen by the fund's Board. The use of separate Boards, each with its own committee structure, allows the Trustees of each group of Fidelity funds to focus on the unique issues of the funds they oversee, including common research, investment, and operational issues. On occasion, the separate Boards establish joint committees to address issues of overlapping consequences for the Fidelity funds overseen by each Board.
The Trustees operate using a system of committees to facilitate the timely and efficient consideration of all matters of importance to the Trustees, the fund, and fund shareholders and to facilitate compliance with legal and regulatory requirements and oversight of the fund's activities and associated risks. The Board, acting through its committees, has charged FMR and its affiliates with (i) identifying events or circumstances the occurrence of which could have demonstrably adverse effects on the fund's business and/or reputation; (ii) implementing processes and controls to lessen the possibility that such events or circumstances occur or to mitigate the effects of such events or circumstances if they do occur; and (iii) creating and maintaining a system designed to evaluate continuously business and market conditions in order to facilitate the identification and implementation processes described in (i) and (ii) above. Because the day-to-day operations and activities of the fund are carried out by or through FMR, its affiliates and other service providers, the fund's exposure to risks is mitigated but not eliminated by the processes overseen by the Trustees. While each of the Board's committees has responsibility for overseeing different aspects of the fund's activities, oversight is exercised primarily through the Operations, Audit, and Compliance Committees. In addition, the Independent Trustees have worked with FMR to enhance the Board's oversight of investment and financial risks, legal and regulatory risks, technology risks, and operational risks, including the development of additional risk reporting to the Board. For example, a working group comprised of Independent Trustees and FMR has worked and continues to work to review the Fidelity funds' valuation-related activities, reporting and risk management. Appropriate personnel, including but not limited to the fund's Chief Compliance Officer (CCO), FMR's internal auditor, the independent accountants, the fund's Treasurer and portfolio management personnel, make periodic reports to the Board's committees, as appropriate, including an annual review of Fidelity's risk management program for the Fidelity funds. The responsibilities of each standing committee, including their oversight responsibilities, are described further under "Standing Committees of the Fund's Trustees."
Annual Report
Trustees and Officers - continued
The fund's Statement of Additional Information (SAI) includes more information about the Trustees. To request a free copy, call Fidelity at 1-877-208-0098.
Interested Trustees*:
Correspondence intended for each Trustee who is an interested person may be sent to Fidelity Investments, 245 Summer Street, Boston, Massachusetts 02210.
Name, Year of Birth; Principal Occupations and Other Relevant Experience+ |
James C. Curvey (1935) |
Year of Election or Appointment: 2007 Trustee Chairman of the Board of Trustees |
| Mr. Curvey also serves as Trustee of other Fidelity funds. Mr. Curvey is a Director of Fidelity Research & Analysis Co. (investment adviser firm, 2009-present), and Vice Chairman (2007-present) and Director of FMR LLC (diversified financial services company). In addition, Mr. Curvey serves as an Overseer for the Boston Symphony Orchestra and a member of the board of Artis-Naples, Naples, Florida, and as a Trustee for Brewster Academy, Wolfeboro, New Hampshire. Previously, Mr. Curvey served as a Director of Fidelity Investments Money Management, Inc. (investment adviser firm, 2009-2014) and a Director of FMR and FMR Co., Inc. (investment adviser firms, 2007-2014). |
Charles S. Morrison (1960) |
Year of Election or Appointment: 2014 Trustee |
| Mr. Morrison also serves as Trustee of other funds. He serves as a Director of Fidelity Investments Money Management, Inc. (FIMM) (investment adviser firm, 2014-present), Director of Fidelity SelectCo, LLC (investment adviser firm, 2014-present), President, Asset Management (2014-present), and is an employee of Fidelity Investments. Previously, Mr. Morrison served as Vice President of Fidelity's Fixed Income and Asset Allocation Funds (2012-2014), President, Fixed Income (2011-2014), Vice President of Fidelity's Money Market Funds (2005-2009), President, Money Market Group Leader of FMR (investment adviser firm, 2009), and Senior Vice President, Money Market Group of FMR (2004-2009). Mr. Morrison also served as Vice President of Fidelity's Bond Funds (2002-2005), certain Balanced Funds (2002-2005), and certain Asset Allocation Funds (2002-2007), and as Senior Vice President (2002-2005) of Fidelity's Bond Division. |
* Trustees have been determined to be "Interested Trustees" by virtue of, among other things, their affiliation with the trust or various entities under common control with FMR.
+ The information above includes each Trustee's principal occupation during the last five years and other information relating to the experience, attributes, and skills relevant to each Trustee's qualifications to serve as a Trustee, which led to the conclusion that each Trustee should serve as a Trustee for the fund.
Annual Report
Independent Trustees:
Correspondence intended for each Independent Trustee (that is, the Trustees other than the Interested Trustees) may be sent to Fidelity Investments, P.O. Box 55235, Boston, Massachusetts 02205-5235.
Name, Year of Birth; Principal Occupations and Other Relevant Experience+ |
Dennis J. Dirks (1948) |
Year of Election or Appointment: 2005 Trustee |
| Mr. Dirks also serves as Trustee of other Fidelity funds. Prior to his retirement in May 2003, Mr. Dirks was Chief Operating Officer and a member of the Board of The Depository Trust & Clearing Corporation (DTCC). He also served as President, Chief Operating Officer, and Board member of The Depository Trust Company (DTC) and President and Board member of the National Securities Clearing Corporation (NSCC). In addition, Mr. Dirks served as Chief Executive Officer and Board member of the Government Securities Clearing Corporation, Chief Executive Officer and Board member of the Mortgage-Backed Securities Clearing Corporation, as a Trustee and a member of the Finance Committee of Manhattan College (2005-2008), as a Trustee and a member of the Finance Committee of AHRC of Nassau County (2006-2008), and as a member of the Independent Directors Council (IDC) Governing Council (2010-2015). Mr. Dirks is a member of the Board of Directors for The Brookville Center for Children's Services, Inc. (2009-present). |
Alan J. Lacy (1953) |
Year of Election or Appointment: 2008 Trustee |
| Mr. Lacy also serves as Trustee of other Fidelity funds. Mr. Lacy serves as a member of the Board of Directors of Dave & Buster's Entertainment, Inc. (restaurant and entertainment complexes, 2010-present) and Bristol-Myers Squibb Company (global pharmaceuticals, 2008-present). In addition, Mr. Lacy served as Senior Adviser (2007-2014) of Oak Hill Capital Partners, L.P. (private equity) and also served as Chief Executive Officer (2000-2005) and Vice Chairman (2005-2006) of Sears Holdings Corporation and Sears, Roebuck and Co. (retail). Mr. Lacy is a member of the Board of Trustees of The National Parks Conservation Association (2006-present). Previously, Mr. Lacy served as Chairman of the Board of Trustees of the National Parks Conservation Association (2008-2011) and as a member of the Board of Directors for The Western Union Company (global money transfer, 2006-2011), The Hillman Companies, Inc. (hardware wholesalers, 2010-2014), and Earth Fare, Inc. (retail grocery, 2010-2014). |
Ned C. Lautenbach (1944) |
Year of Election or Appointment: 2000 Trustee Chairman of the Independent Trustees |
| Mr. Lautenbach also serves as Trustee of other Fidelity funds. Mr. Lautenbach currently serves as the Lead Director of the Eaton Corporation Board of Directors (diversified industrial, 1997-present). Mr. Lautenbach is Chairman of the Board of Directors of Artis-Naples in Naples, Florida (2012-present), a member of the Council on Foreign Relations (1994-present), and a member of the Board of Governors, State University System of Florida (2013-present). Previously, Mr. Lautenbach was a Partner/Advisory Partner at Clayton, Dubilier & Rice, LLC (private equity investment, 1998-2010), as well as a Director of Sony Corporation (2006-2007). |
Joseph Mauriello (1944) |
Year of Election or Appointment: 2008 Trustee |
| Mr. Mauriello also serves as Trustee of other Fidelity funds. Prior to his retirement in January 2006, Mr. Mauriello served in numerous senior management positions including Deputy Chairman and Chief Operating Officer (2004-2005), and Vice Chairman of Financial Services (2002-2004) of KPMG LLP US (professional services, 1965-2005). Mr. Mauriello currently serves as a member of the Board of Directors of XL Group plc. (global insurance and re-insurance, 2006-present) and the Independent Directors Council (IDC) Governing Council (2015-present). Previously, Mr. Mauriello served as a Director of the Hamilton Funds of the Bank of New York (2006-2007) and of Arcadia Resources Inc. (health care services and products, 2007-2012). |
Robert W. Selander (1950) |
Year of Election or Appointment: 2011 Trustee |
| Mr. Selander also serves as Trustee of other Fidelity funds. Mr. Selander serves as a Director of The Western Union Company (global money transfer, 2014-present). Previously, Mr. Selander served as a Member of the Advisory Board of other Fidelity funds (2011), and Executive Vice Chairman (2010), Chief Executive Officer (2009-2010), and President and Chief Executive Officer (1997-2009) of Mastercard, Inc. |
Cornelia M. Small (1944) |
Year of Election or Appointment: 2005 Trustee |
| Ms. Small also serves as Trustee of other Fidelity funds. Ms. Small is a member of the Board of Directors (2009-present) and Chair of the Investment Committee (2010-present) of the Teagle Foundation. Ms. Small also serves on the Investment Committee of the Berkshire Taconic Community Foundation (2008-present). Previously, Ms. Small served as Chairperson (2002-2008) and a member of the Investment Committee and Chairperson (2008-2012) and a member of the Board of Trustees of Smith College. In addition, Ms. Small served as Chief Investment Officer, Director of Global Equity Investments, and a member of the Board of Directors of Scudder, Stevens & Clark and Scudder Kemper Investments. |
William S. Stavropoulos (1939) |
Year of Election or Appointment: 2001 Trustee Vice Chairman of the Independent Trustees |
| Mr. Stavropoulos also serves as Trustee of other Fidelity funds. Mr. Stavropoulos serves as President and Founder of the Michigan Baseball Foundation, the Great Lakes Loons (2007-present). Mr. Stavropoulos is Chairman Emeritus of the Board of Directors of The Dow Chemical Company, where he previously served in numerous senior management positions, including President, CEO (1995-2000; 2002-2004), Chairman of the Executive Committee (2000-2006), and as a member of the Board of Directors (1990-2006). Currently, Mr. Stavropoulos is Chairman of the Board of Directors of Univar Inc. (global distributor of commodity and specialty chemicals), a Director of Teradata Corporation (data warehousing and technology solutions), and Maersk Inc. (industrial conglomerate), and a member of the Advisory Board for Metalmark Capital LLC (private equity investment, 2005-present). Mr. Stavropoulos is an operating advisor to Clayton, Dubilier & Rice, LLC (private equity investment). In addition, Mr. Stavropoulos is a member of the University of Notre Dame Advisory Council for the College of Science, a Trustee of the Rollin L. Gerstacker Foundation, and a Director of the Naples Philharmonic Center for the Arts. Previously, Mr. Stavropoulos served as a Director of Chemical Financial Corporation (bank holding company, 1993-2012) and Tyco International, Ltd. (multinational manufacturing and services, 2007-2012). |
David M. Thomas (1949) |
Year of Election or Appointment: 2008 Trustee |
| Mr. Thomas also serves as Trustee of other Fidelity funds. Mr. Thomas serves as Non-Executive Chairman of the Board of Directors of Fortune Brands Home and Security (home and security products, 2011-present), as a member of the Board of Directors (2004-present) and Presiding Director (2013-present) of Interpublic Group of Companies, Inc. (marketing communication), and as a member of the Board of Trustees of the University of Florida (2013-present). Previously, Mr. Thomas served as Executive Chairman (2005-2006) and Chairman and Chief Executive Officer (2000-2005) of IMS Health, Inc. (pharmaceutical and healthcare information solutions), and a Director of Fortune Brands, Inc. (consumer products, 2000-2011). |
+ The information above includes each Trustee's principal occupation during the last five years and other information relating to the experience, attributes, and skills relevant to each Trustee's qualifications to serve as a Trustee, which led to the conclusion that each Trustee should serve as a Trustee for the fund.
Advisory Board Member and Officers:
Correspondence intended for each officer and Peter S. Lynch may be sent to Fidelity Investments, 245 Summer Street, Boston, Massachusetts 02210. Officers appear below in alphabetical order.
Name, Year of Birth; Principal Occupation |
Peter S. Lynch (1944) |
Year of Election or Appointment: 2003 Member of the Advisory Board |
| Mr. Lynch also serves as Member of the Advisory Board of other Fidelity funds. Mr. Lynch is Vice Chairman and a Director of FMR (investment adviser firm) and FMR Co., Inc. (investment adviser firm). In addition, Mr. Lynch serves as a Trustee of Boston College and as the Chairman of the Inner-City Scholarship Fund. Previously, Mr. Lynch served on the Special Olympics International Board of Directors (1997-2006). |
Elizabeth Paige Baumann (1968) |
Year of Election or Appointment: 2012 Anti-Money Laundering (AML) Officer |
| Ms. Baumann also serves as AML Officer of other funds. She is Chief AML Officer of FMR LLC (diversified financial services company, 2012-present) and is an employee of Fidelity Investments. Previously, Ms. Baumann served as Vice President and Deputy Anti-Money Laundering Officer (2007-2012). |
Marc R. Bryant (1966) |
Year of Election or Appointment: 2015 Secretary and Chief Legal Officer (CLO) |
| Mr. Bryant also serves as Secretary and CLO of other funds. Mr. Bryant serves as CLO, Secretary, and Senior Vice President of Fidelity Management & Research Company (investment adviser firm, 2015-present) and FMR Co., Inc. (investment adviser firm, 2015-present); Secretary of Fidelity SelectCo, LLC (investment adviser firm, 2015-present) and Fidelity Investments Money Management, Inc. (investment adviser firm, 2015-present); and CLO of Fidelity Management & Research (Hong Kong) Limited (investment adviser firm, 2015-present). He is Senior Vice President and Deputy General Counsel of FMR LLC (diversified financial services company). Previously, Mr. Bryant served as Secretary and Chief Legal Officer of Fidelity Rutland Square Trust II (2010-2014) and Assistant Secretary of Fidelity's Fixed Income and Asset Allocation Funds (2013-2015). Prior to joining Fidelity Investments, Mr. Bryant served as a Senior Vice President and the Head of Global Retail Legal for AllianceBernstein L.P. (2006-2010), and as the General Counsel for ProFund Advisors LLC (2001-2006). |
William C. Coffey (1969) |
Year of Election or Appointment: 2009 Assistant Secretary |
| Mr. Coffey also serves as Assistant Secretary of other funds. He is Senior Vice President and Deputy General Counsel of FMR LLC (diversified financial services company, 2010-present), and is an employee of Fidelity Investments. Previously, Mr. Coffey served as Vice President and Associate General Counsel of FMR LLC (2005-2009). |
Timothy M. Cohen (1969) |
Year of Election or Appointment: 2014 Vice President of certain Equity Funds |
| Mr. Cohen also serves as Vice President of other funds. Mr. Cohen serves as Chief Compliance Officer of FMR Investment Management (U.K.) Limited (investment adviser firm, 2013-present) and is an employee of Fidelity Investments. Previously, Mr. Cohen served as a Director of FMR Investment Management (U.K.) Limited (2013-2015). |
Jonathan Davis (1968) |
Year of Election or Appointment: 2010 Assistant Treasurer |
| Mr. Davis also serves as Assistant Treasurer of other funds, and is an employee of Fidelity Investments. Previously, Mr. Davis served as Vice President and Associate General Counsel of FMR LLC (diversified financial services company, 2003-2010). |
Adrien E. Deberghes (1967) |
Year of Election or Appointment: 2008 Deputy Treasurer |
| Mr. Deberghes also serves as an officer of other funds. He is an employee of Fidelity Investments (2008-present). Prior to joining Fidelity Investments, Mr. Deberghes was Senior Vice President of Mutual Fund Administration at State Street Corporation (2007-2008), Senior Director of Mutual Fund Administration at Investors Bank & Trust (2005-2007), and Director of Finance for Dunkin' Brands (2000-2005). |
Stephanie J. Dorsey (1969) |
Year of Election or Appointment: 2010 Assistant Treasurer |
| Ms. Dorsey also serves as an officer of other funds. She is an employee of Fidelity Investments (2008-present) and has served in other fund officer roles. Prior to joining Fidelity Investments, Ms. Dorsey served as Treasurer (2004-2008) of the JPMorgan Mutual Funds and Vice President (2004-2008) of JPMorgan Chase Bank. |
Howard J. Galligan III (1966) |
Year of Election or Appointment: 2014 Chief Financial Officer |
| Mr. Galligan also serves as Chief Financial Officer of other funds. Mr. Galligan serves as President of Fidelity Pricing and Cash Management Services (FPCMS) (2014-present) and as a Director of Strategic Advisers, Inc. (investment adviser firm, 2008-present). Previously, Mr. Galligan served as Chief Administrative Officer of Asset Management (2011-2014) and Chief Operating Officer and Senior Vice President of Investment Support for Strategic Advisers, Inc. (2003-2011). |
Scott C. Goebel (1968) |
Year of Election or Appointment: 2015 Vice President |
| Mr. Goebel serves as Vice President of other funds and is an employee of Fidelity Investments (2001-present). Previously, Mr. Goebel served as Secretary of Fidelity SelectCo, LLC (investment adviser firm, 2013-2015), Fidelity Investments Money Management, Inc. (FIMM) (investment adviser firm, 2010-2015), and Fidelity Research and Analysis Company (FRAC) (investment adviser firm, 2010-2015); General Counsel, Secretary, and Senior Vice President of Fidelity Management & Research Company (investment adviser firm, 2008-2015) and FMR Co., Inc. (investment adviser firm, 2008-2015); Assistant Secretary of Fidelity Management & Research (Japan) Limited (investment adviser firm, 2008-2015) and FMR Investment Management (U.K.) Limited (investment adviser firm, 2008-2015); Chief Legal Officer (CLO) of Fidelity Management & Research (Hong Kong) Limited (investment adviser firm, 2008-2015); Secretary and CLO of certain Fidelity funds (2008-2015); Assistant Secretary of FIMM (2008-2010), FRAC (2008-2010), and certain funds (2007-2008); and as Vice President and Secretary of Fidelity Distributors Corporation (FDC) (2005-2007). |
Brian B. Hogan (1964) |
Year of Election or Appointment: 2009 Vice President |
| Mr. Hogan also serves as Trustee or Vice President of other funds. Mr. Hogan serves as a Director of Fidelity SelectCo, LLC (investment adviser firm, 2014-present) and President of the Equity Division of FMR (investment adviser firm, 2009-present). Previously, Mr. Hogan served as Senior Vice President, Equity Research of FMR (2006-2009) and as a portfolio manager. |
Chris Maher (1972) |
Year of Election or Appointment: 2013 Assistant Treasurer |
| Mr. Maher serves as Assistant Treasurer of other funds. Mr. Maher is Vice President of Valuation Oversight and is an employee of Fidelity Investments. Previously, Mr. Maher served as Vice President of Asset Management Compliance (2013), Vice President of the Program Management Group of FMR (investment adviser firm, 2010-2013), and Vice President of Valuation Oversight (2008-2010). |
Kenneth B. Robins (1969) |
Year of Election or Appointment: 2008 President and Treasurer |
| Mr. Robins also serves as an officer of other funds. Mr. Robins serves as Executive Vice President of Fidelity Investments Money Management, Inc. (FIMM) (investment adviser firm, 2013-present) and is an employee of Fidelity Investments (2004-present). Previously, Mr. Robins served in other fund officer roles. |
Stacie M. Smith (1974) |
Year of Election or Appointment: 2013 Deputy Treasurer |
| Ms. Smith also serves as an officer of other funds. She is an employee of Fidelity Investments (2009-present) and has served in other fund officer roles. Prior to joining Fidelity Investments, Ms. Smith served as Senior Audit Manager of Ernst & Young LLP (1996-2009). |
Renee Stagnone (1975) |
Year of Election or Appointment: 2013 Deputy Treasurer |
| Ms. Stagnone also serves as Deputy Treasurer of other funds. Ms. Stagnone is an employee of Fidelity Investments (1997-present). |
Linda J. Wondrack (1964) |
Year of Election or Appointment: 2014 Chief Compliance Officer |
| Ms. Wondrack also serves as Chief Compliance Officer of other funds. Ms. Wondrack is Executive Vice President and head of the Ethics Office and Asset Management Compliance for Fidelity Investments (2012-present). Ms. Wondrack also serves as Chief Compliance Officer of Fidelity SelectCo, LLC (investment adviser firm, 2014-present); Chief Compliance Officer of Impresa Management LLC (2013-present); and Chief Compliance Officer of FMR Co., Inc. (investment adviser firm), Fidelity Investments Money Management, Inc. (investment adviser firm), Fidelity Management & Research (Japan) Limited (investment adviser firm), FMR Investment Management (U.K.) Limited (investment adviser firm), Fidelity Management & Research (Hong Kong) (investment adviser firm), Fidelity Management & Research Company (investment adviser firm), FIAM LLC (investment adviser firm), and Strategic Advisers, Inc. (investment adviser firm), Ballyrock Investment Advisors LLC, and Northern Neck Investors LLC (2012-present). Previously, Ms. Wondrack served as Senior Vice President and Chief Compliance Officer for Columbia Management Investment Advisers, LLC (2005-2012); Chief Compliance Officer for certain funds within the Columbia Family of Funds (2007-2012); and Senior Vice President of Compliance Risk Management at Bank of America (2005-2010). |
Joseph F. Zambello (1957) |
Year of Election or Appointment: 2011 Deputy Treasurer |
| Mr. Zambello also serves as Deputy Treasurer of other funds. Mr. Zambello is an employee of Fidelity Investments (1991-present). Previously, Mr. Zambello served as Vice President of the Program Management Group of FMR (investment adviser firm, 2009-2011) and Vice President of the Transfer Agent Oversight Group (2005-2009). |
Annual Report
The Board of Trustees of Fidelity Japan Fund voted to pay to shareholders of record at the opening of business on record date, the following distributions per share derived from capital gains realized from sales of portfolio securities, and dividends derived from net investment income:
| Pay Date | Record Date | Dividends | Capital Gains |
Class A | 12/07/15 | 12/04/15 | $0.049 | $0.006 |
Class T | 12/07/15 | 12/04/15 | $0.002 | $0.006 |
Class B | 12/07/15 | 12/04/15 | $0.000 | $0.000 |
Class C | 12/07/15 | 12/04/15 | $0.000 | $0.000 |
Class A designates 100%, Class T designates 0%, Class B designates 0%, and Class C designates 0% of the dividends distributed during the fiscal year as amounts which may be taken into account as a dividend for purposes of the maximum rate under section 1(h)(11) of the Internal Revenue Code.
The amounts per share which represent income derived from sources within, and taxes paid to, foreign countries or possessions of the United States are as follows:
| Pay Date | Income | Taxes |
Class A | 12/08/14 | $0.0733 | $0.0263 |
Class T | 12/08/14 | $0.0000 | $0.0000 |
Class B | 12/08/14 | $0.0000 | $0.0000 |
Class C | 12/08/14 | $0.0000 | $0.0000 |
The fund will notify shareholders in January 2016 of amounts for use in preparing 2015 income tax returns.
Annual Report
Fidelity Japan Fund
Each year, the Board of Trustees, including the Independent Trustees (together, the Board), votes on the renewal of the management contract with Fidelity Management & Research Company (FMR) and the sub-advisory agreements (together, the Advisory Contracts) for the fund. The Board, assisted by the advice of fund counsel and Independent Trustees' counsel, requests and considers a broad range of information relevant to the renewal of the Advisory Contracts throughout the year.
The Board meets regularly and, at each of its meetings, covers an extensive agenda of topics and materials and considers factors that are relevant to its annual consideration of the renewal of the fund's Advisory Contracts, including the services and support provided to the fund and its shareholders. The Board has established various standing committees (Committees), each composed of and chaired by Independent Trustees with varying backgrounds, to which the Board has assigned specific subject matter responsibilities in order to enhance effective decision-making by the Board. The Board, acting directly and through its Committees, requests and receives information concerning the annual consideration of the renewal of the fund's Advisory Contracts. The Board also meets as needed to consider matters specifically related to the Board's annual consideration of the renewal of the Advisory Contracts. Members of the Board may also meet with trustees of other Fidelity funds through ad hoc joint committees to discuss certain matters relevant to all of the Fidelity funds.
At its July 2015 meeting, the Board unanimously determined to renew the fund's Advisory Contracts. In reaching its determination, the Board considered all factors it believed relevant, including (i) the nature, extent, and quality of the services to be provided to the fund and its shareholders (including the investment performance of the fund); (ii) the competitiveness of the fund's management fee and total expense ratio relative to peer funds; (iii) the total costs of the services to be provided by and the profits to be realized by Fidelity from its relationship with the fund; and (iv) the extent to which (if any) economies of scale exist and would be realized as the fund grows, and whether any economies of scale are appropriately shared with fund shareholders.
In considering whether to renew the Advisory Contracts for the fund, the Board reached a determination, with the assistance of fund counsel and Independent Trustees' counsel and through the exercise of its business judgment, that the renewal of the Advisory Contracts was in the best interests of the fund and its shareholders and that the compensation payable under the Advisory Contracts was fair and reasonable. The Board's decision to renew the Advisory Contracts was not based on any single factor, but rather was based on a comprehensive consideration of all the information provided to the Board at its meetings throughout the year. The Board, in reaching its determination to renew the Advisory Contracts, was aware that shareholders of the fund have a broad range of investment choices available to them, including a wide choice among funds offered by Fidelity's competitors, and that the fund's shareholders, who have the opportunity to review and weigh the disclosure provided by the fund in its prospectus and other public disclosures, have chosen to invest in this fund, which is part of the Fidelity family of funds.
Nature, Extent, and Quality of Services Provided. The Board considered Fidelity's staffing as it relates to the fund, including the backgrounds of investment personnel of Fidelity, and also considered the fund's investment objective, strategies, and related investment philosophy. The Independent Trustees also had discussions with senior management of Fidelity's investment operations and investment groups. The Board considered the structure of the portfolio manager compensation program and whether this structure provides appropriate incentives to act in the best interests of the fund. Additionally, the Board considered the portfolio managers' investments, if any, in the funds that they manage.
Resources Dedicated to Investment Management and Support Services. The Board and the Fund Oversight and Research Committees reviewed the general qualifications and capabilities of Fidelity's investment staff, including its size, education, experience, and resources, as well as Fidelity's approach to recruiting, training, managing, and compensating investment personnel. The Board noted that Fidelity has continued to increase the resources devoted to non-U.S. offices, including expansion of Fidelity's global investment organization. The Board also noted that Fidelity's analysts have extensive resources, tools and capabilities that allow them to conduct sophisticated quantitative and fundamental analysis, as well as credit analysis of issuers, counterparties and guarantors. Further, the Board considered that Fidelity's investment professionals have sufficient access to global information and data so as to provide competitive investment results over time, and that those professionals also have access to sophisticated tools that permit them to assess portfolio construction and risk and performance attribution characteristics continuously, as well as to transmit new information and research conclusions rapidly around the world. Additionally, in its deliberations, the Board considered Fidelity's trading, risk management, and compliance capabilities and resources, which are integral parts of the investment management process.
Shareholder and Administrative Services. The Board considered (i) the nature, extent, quality, and cost of advisory, administrative, and shareholder services performed by FMR, the sub-advisers (together with FMR, the Investment Advisers), and their affiliates under the Advisory Contracts and under separate agreements covering transfer agency, pricing and bookkeeping, and securities lending services for the fund; (ii) the nature and extent of the supervision of third party service providers, principally custodians and subcustodians; and (iii) the resources devoted to, and the record of compliance with, the fund's compliance policies and procedures. The Board also reviewed the allocation of fund brokerage, including allocations to brokers affiliated with the Investment Advisers, the use of brokerage commissions to pay fund expenses, and the use of "soft" commission dollars to pay for research services.
Annual Report
Board Approval of Investment Advisory Contracts and Management Fees - continued
The Board noted that the growth of fund assets over time across the complex allows Fidelity to reinvest in the development of services designed to enhance the value or convenience of the Fidelity funds as investment vehicles. These services include 24-hour access to account information and market information through telephone representatives and over the Internet, investor education materials and asset allocation tools, and the expanded availability of Fidelity Investor Centers.
In 2014, the Board formed an ad hoc Committee on Transfer Agency Fees to review the variety of transfer agency fee structures throughout the industry and Fidelity's competitive positioning with respect to industry participants.
Investment in a Large Fund Family. The Board considered the benefits to shareholders of investing in a Fidelity fund, including the benefits of investing in a fund that is part of a large family of funds offering a variety of investment disciplines and providing a large variety of mutual fund investor services. The Board noted that Fidelity had taken, or had made recommendations that resulted in the Fidelity funds taking, a number of actions over the previous year that benefited particular funds, including (i) continuing to dedicate additional resources to investment research and to the support of the senior management team that oversees asset management; (ii) continuing efforts to enhance Fidelity's global research capabilities; (iii) launching new funds and making other enhancements to meet client needs; (iv) reducing management fees and total expenses for certain index funds and diversified international funds; (v) continuing to launch dedicated lower cost underlying funds to meet portfolio construction needs related to expanding underlying fund options for Fidelity funds of funds, specifically for the Freedom Fund product lines; (vi) rationalizing product lines and gaining increased efficiencies through fund mergers; (vii) launching active fixed-income exchange-traded funds; (viii) continuing to develop, acquire and implement systems and technology to improve services to the funds and information security and to increase efficiency; (ix) implementing investment enhancements to further strengthen Fidelity's target date product line to increase investors' probability of success in achieving their goals; (x) modifying the eligibility criteria for certain share classes to accommodate roll-over assets from employer-sponsored retirement plans; (xi) launching a new Class W of the Freedom Index Funds to attract and retain Fidelity record-kept retirement plan assets; and (xii) implementing changes to Fidelity's money market product line in response to recent money market regulatory reforms.
Investment Performance. The Board considered whether the fund has operated in accordance with its investment objective, as well as its record of compliance with its investment restrictions and its performance history. The Board noted that there was a portfolio management change for the fund in March 2014.
The Board took into account discussions with representatives of the Investment Advisers about fund investment performance that occur at Board meetings throughout the year. In this regard the Board noted that as part of regularly scheduled fund reviews and other reports to the Board on fund performance, the Board considers annualized return information for the fund, for different time periods, measured against a securities market index ("benchmark index") and a peer group of funds with similar objectives ("peer group"), if any. In its evaluation of fund investment performance, the Board gave particular attention to information indicating changes in performance of certain Fidelity funds for specific time periods and discussed with the Investment Advisers the reasons for any overperformance or underperformance.
In addition to reviewing absolute and relative fund performance, the Independent Trustees periodically consider the appropriateness of fund performance metrics in evaluating the results achieved. In general, the Independent Trustees believe that fund performance should be evaluated based on net performance (after fees and expenses) of both the highest performing and lowest performing fund share classes, where applicable, compared to appropriate benchmark indices, over appropriate time periods that may include full market cycles, and compared to peer groups, as applicable, over the same periods, taking into account relevant factors including the following: general market conditions; issuer-specific information; and fund cash flows and other factors.
The Independent Trustees recognize that shareholders evaluate performance on a net basis over their own holding periods, for which one-, three-, and five-year periods are often used as a proxy. For this reason, the performance information reviewed by the Board also included net cumulative calendar year total return information for the fund and an appropriate benchmark index and peer group for the most recent one-, three-, and five-year periods, as shown below. Returns are shown compared to the 25th percentile (top of box, 75% beaten) and 75th percentile (bottom of box, 25% beaten) of the peer universe.
Annual Report
Fidelity Japan Fund

The Board has discussed the fund's underperformance with FMR and has engaged with FMR to consider what steps might be taken to remediate the fund's underperformance.
The Board also considered that the fund's management fee is subject to upward or downward adjustment depending upon whether, and to what extent, the fund's investment performance for the performance period exceeds, or is exceeded by, a securities index, thus leading to a performance adjustment for the same period. The Board noted that the performance adjustment provides FMR with a strong economic incentive to seek to achieve superior performance for the fund's shareholders and helps to more closely align the interests of FMR and the shareholders of the fund.
Based on its review, the Board concluded that the nature, extent, and quality of services provided to the fund under the Advisory Contracts should benefit the shareholders of the fund.
Competitiveness of Management Fee and Total Expense Ratio. The Board considered the fund's management fee and total expense ratio compared to "mapped groups" of competitive funds and classes created for the purpose of facilitating the Trustees' competitive analysis of management fees and total expenses. Fidelity creates "mapped groups" by combining similar Lipper investment objective categories that have comparable investment mandates. Combining Lipper investment objective categories aids the Board's management fee and total expense ratio comparisons by broadening the competitive group used for comparison.
Management Fee. The Board considered two proprietary management fee comparisons for the 12-month periods shown in basis points (BP) in the chart below. The group of Lipper funds used by the Board for management fee comparisons is referred to below as the "Total Mapped Group." The Total Mapped Group is broader than the Lipper peer group used by the Board for performance comparisons because the Total Mapped Group combines several Lipper investment objective categories while the Lipper peer group does not. The Total Mapped Group comparison focuses on a fund's standing in terms of gross management fees before expense reimbursements or caps, and without giving effect to the fund's performance adjustment, relative to the total universe of funds with comparable investment mandates, regardless of whether their management fee structures also are comparable. Funds with comparable investment mandates offer exposure to similar types of securities. Funds with comparable management fee structures have similar management fee contractual arrangements (e.g., flat rate charged for advisory services, all-inclusive fee rate, etc.). "TMG %" represents the percentage of funds in the Total Mapped Group that had management fees that were lower than the fund's. For example, a hypothetical TMG % of 20% would mean that 80% of the funds in the Total Mapped Group had higher, and 20% had lower, management fees than the fund. The fund's actual TMG %s and the number of funds in the Total Mapped Group are in the chart below. The "Asset-Size Peer Group" (ASPG) comparison focuses on a fund's standing relative to a subset of non-Fidelity funds within the Total Mapped Group that are similar in size and management fee structure without taking into account performance adjustments, if any. For example, if a fund is in the first quartile of the ASPG, the fund's management fee ranks in the least expensive or lowest 25% of funds in the ASPG. The ASPG represents at least 15% of the funds in the Total Mapped Group with comparable asset size and management fee structures, subject to a minimum of 50 funds (or all funds in the Total Mapped Group if fewer than 50). Additional information, such as the ASPG quartile in which the fund's management fee rate ranked and the impact of the fund's performance adjustment, is also included in the chart and considered by the Board.
Annual Report
Board Approval of Investment Advisory Contracts and Management Fees - continued
Fidelity Japan Fund

The Board noted that the fund's management fee rate ranked below the median of its Total Mapped Group and below the median of its ASPG for 2014. The Board also noted the effect of the fund's performance adjustment, if any, on the fund's management fee ranking.
The Board noted that, in 2014, the ad hoc Committee on Group Fee was formed by it and other Fidelity fund boards to conduct an in-depth review of the "group fee" component of the management fee of funds with such management fee structures. Committee focus included the mechanics of the group fee, the competitive landscape of group fee structures, Fidelity funds with no group fee component and investment products not included in group fee assets. The Board also considered that, for funds subject to the group fee, FMR agreed to voluntarily waive fees over a specified period of time in amounts designed to account for assets converted from certain funds to certain collective investment trusts.
The Board also noted that, in 2013, the ad hoc Committee on Management Fees was formed to conduct an in-depth review of the management fee rates of Fidelity's active equity mutual funds. The Committee focused on the following areas: (i) standard fee structures; (ii) research consumption and trading evolution; (iii) management fee competitiveness/profitability by category; and (iv) factors that drive institutional pricing.
Based on its review, the Board concluded that the fund's management fee is fair and reasonable in light of the services that the fund receives and the other factors considered.
Total Expense Ratio. In its review of each class's total expense ratio, the Board considered the fund's management fee as well as other fund or class expenses, as applicable, such as transfer agent fees, pricing and bookkeeping fees, fund-paid 12b-1 fees, and custodial, legal, and audit fees. The Board noted the impact of the fund's performance adjustment. The Board also noted that Fidelity may agree to waive fees and expenses from time to time, and the extent to which, if any, it has done so for the fund. As part of its review, the Board also considered the current and historical total expense ratios of each class of the fund compared to competitive fund median expenses. Each class of the fund is compared to those funds and classes in the Total Mapped Group (used by the Board for management fee comparisons) that have a similar sales load structure.
The Board noted that the total expense ratio of each of Class A, Class B, Class C, Class I, and the retail class ranked below its competitive median for 2014 and the total expense ratio of Class T ranked above its competitive median for 2014. The Board considered that, in general, various factors can affect total expense ratios. The Board noted that the total expense ratio of Class T was above the competitive median primarily because of higher 12b-1 fees on Class T as compared to most competitor funds. Class T has a higher 12b-1 fee, but a lower front-end sales charge, than traditionally priced front-end sales charge classes. The Board considered that Class T is primarily sold load-waived in the retirement plan market where its 0.50% 12b-1 fee is comparable to competing no-load, higher 12b-1 fee classes designed specifically for retirement plans. The Board noted that the fund offers multiple classes, each of which has a different sales load and 12b-1 fee structure, and that the multiple structures are intended to offer a range of pricing options for the intermediary market. The Board also noted that the total expense ratios of the classes vary primarily by the level of their 12b-1 fees, although differences in transfer agent fees may also cause expenses to vary from class to class.
Fees Charged to Other Fidelity Clients. The Board also considered Fidelity fee structures and other information with respect to clients of Fidelity, such as other funds advised or subadvised by Fidelity, pension plan clients, and other institutional clients with similar mandates. The Board noted the findings of the 2013 ad hoc joint committee (created with the board of other Fidelity funds), which reviewed and compared Fidelity's institutional investment advisory business with its business of providing services to the Fidelity funds, including the differences in services provided, fees charged, and costs incurred, as well as competition in their respective marketplaces.
Annual Report
Based on its review of total expense ratios and fees charged to other Fidelity clients, the Board concluded that, although Class T was above the median of the universe presented for comparison, the total expense ratio of each class of the fund was reasonable in light of the services that the fund and its shareholders receive and the other factors considered.
Costs of the Services and Profitability. The Board considered the revenues earned and the expenses incurred by Fidelity in conducting the business of developing, marketing, distributing, managing, administering and servicing the fund and servicing the fund's shareholders. The Board also considered the level of Fidelity's profits in respect of all the Fidelity funds.
On an annual basis, Fidelity presents to the Board information about the profitability of its relationship with the fund. Fidelity calculates profitability information for each fund, as well as aggregate profitability information for groups of Fidelity funds and all Fidelity funds, using a series of detailed revenue and cost allocation methodologies which originate with the books and records of Fidelity on which Fidelity's audited financial statements are based. The Audit Committee of the Board reviews any significant changes from the prior year's methodologies.
PricewaterhouseCoopers LLP (PwC), independent registered public accounting firm and auditor to Fidelity and certain Fidelity funds, has been engaged annually by the Board as part of the Board's assessment of Fidelity's profitability analysis. PwC's engagement includes the review and assessment of the methodologies used by Fidelity in determining the revenues and expenses attributable to Fidelity's mutual fund business, and completion of agreed-upon procedures in respect of the mathematical accuracy of fund profitability and its conformity to established allocation methodologies. After considering PwC's reports issued under the engagement and information provided by Fidelity, the Board concluded that while other allocation methods may also be reasonable, Fidelity's profitability methodologies are reasonable in all material respects.
The Board also reviewed Fidelity's non-fund businesses and fall-out benefits related to the mutual fund business as well as cases where Fidelity's affiliates may benefit from or be related to the fund's business.
The Board considered the costs of the services provided by and the profits realized by Fidelity in connection with the operation of the fund and was satisfied that the profitability was not excessive.
Economies of Scale. The Board considered whether there have been economies of scale in respect of the management of the Fidelity funds, whether the Fidelity funds (including the fund) have appropriately benefited from any such economies of scale, and whether there is potential for realization of any further economies of scale. The Board considered the extent to which the fund will benefit from economies of scale as assets grow through increased services to the fund, through waivers or reimbursements, or through fee or expense ratio reductions. The Board also noted that in 2013, it and the boards of other Fidelity funds created an ad hoc committee (the Economies of Scale Committee) to analyze whether Fidelity attains economies of scale in respect of the management and servicing of the Fidelity funds, whether the Fidelity funds have appropriately benefited from such economies of scale, and whether there is potential for realization of any further economies of scale.
The Board recognized that the fund's management contract incorporates a "group fee" structure, which provides for lower group fee rates as total group assets increase, and for higher group fee rates as total group assets decrease (with "group assets" defined to include fund assets under FMR's management plus sector fund assets previously under FMR's management and currently managed by Fidelity SelectCo, LLC). FMR calculates the group fee rates based on a tiered asset "breakpoint" schedule that varies based on asset class. The Board considered that the group fee is designed to deliver the benefits of economies of scale to fund shareholders when total Fidelity fund assets increase, even if assets of any particular fund are unchanged or have declined, because some portion of Fidelity's costs are attributable to services provided to all Fidelity funds, and all funds benefit if those costs can be allocated among more assets. The Board concluded that, given the group fee structure, fund shareholders will benefit from lower management fees as group assets increase at the fund complex level, regardless of whether Fidelity achieves any such economies of scale.
The Board concluded, taking into account the analysis of the Economies of Scale Committee, that economies of scale, if any, are being appropriately shared between fund shareholders and Fidelity.
Additional Information Requested by the Board. In order to develop fully the factual basis for consideration of the Fidelity funds' Advisory Contracts, the Board requested and received additional information on certain topics, including: (i) fund performance trends and Fidelity's long-term strategies for certain funds; (ii) the various share classes employed by Fidelity and the attributes of each class, together with similar information on the distribution and servicing payments made by Fidelity or the funds to third-party participants in the distribution channels; (iii) fund profitability, and fund performance in relation to fund profitability; (iv) the methodology with respect to evaluating competitive fund data and peer group classifications and fee comparisons; (v) annual fund profitability margins, with particular focus on certain funds with negative margins; (vi) the realization of fall-out benefits in certain Fidelity business units; (vii) economies of scale and the way in which they are shared with fund shareholders; (viii) Fidelity's group fee structures, including the group fee schedule of breakpoints; (ix) the impact of cost containment measures on the funds; and (x) the transfer agent fee structure.
Based on its evaluation of all of the conclusions noted above, and after considering all factors it believed relevant, the Board concluded that the advisory fee structures are fair and reasonable, and that the fund's Advisory Contracts should be renewed.
Annual Report
Investment Adviser
Fidelity Management & Research Company
Boston, MA
Investment Sub-Advisers
FMR Co., Inc.
FMR Investment Management
(U.K.) Limited
Fidelity Management & Research
(Hong Kong) Limited
Fidelity Management & Research
(Japan) Limited
FIL Investment Advisors
FIL Investments (Japan) Limited
FIL Investment Advisors (UK) Limited
General Distributor
Fidelity Distributors Corporation
Smithfield, RI
Transfer and Service Agents
Fidelity Investments Institutional Operations Company, Inc.
Boston, MA
Fidelity Service Company, Inc.
Boston, MA
Custodian
JPMorgan Chase Bank
New York, NY
(Fidelity Investment logo)(registered trademark)
AJPNA-UANN-1215
1.917388.104
Fidelity Advisor®
Japan Fund -
Class I
(formerly Institutional Class)
Annual Report
October 31, 2015
(Fidelity Cover Art)
Class I is a class of
Fidelity® Japan Fund
Contents
Performance | (Click Here) | How the fund has done over time. |
Management's Discussion of Fund Performance | (Click Here) | The Portfolio Manager's review of fund performance and strategy. |
Shareholder Expense Example | (Click Here) | An example of shareholder expenses. |
Investment Changes | (Click Here) | A summary of major shifts in the fund's investments over the past six months. |
Investments | (Click Here) | A complete list of the fund's investments with their market values. |
Financial Statements | (Click Here) | Statements of assets and liabilities, operations, and changes in net assets, as well as financial highlights. |
Notes | (Click Here) | Notes to the financial statements. |
Report of Independent Registered Public Accounting Firm | (Click Here) | |
Trustees and Officers | (Click Here) | |
Distributions | (Click Here) | |
Board Approval of Investment Advisory Contracts and Management Fees | (Click Here) | |
To view a fund's proxy voting guidelines and proxy voting record for the 12-month period ended June 30, visit http://www.fidelity.com/proxyvotingresults or visit the Securities and Exchange Commission's (SEC) web site at http://www.sec.gov. You may also call 1-877-208-0098 to request a free copy of the proxy voting guidelines.
Standard & Poor's, S&P and S&P 500 are registered service marks of The McGraw-Hill Companies, Inc. and have been licensed for use by Fidelity Distributors Corporation.
Other third-party marks appearing herein are the property of their respective owners.
All other marks appearing herein are registered or unregistered trademarks or service marks of FMR LLC or an affiliated company. © 2015 FMR LLC. All rights reserved.
This report and the financial statements contained herein are submitted for the general information of the shareholders of the fund. This report is not authorized for distribution to prospective investors in the fund unless preceded or accompanied by an effective prospectus.
A fund files its complete schedule of portfolio holdings with the SEC for the first and third quarters of each fiscal year on Form N-Q. Forms N-Q are available on the SEC's web site at http://www.sec.gov. A fund's Forms N-Q may be reviewed and copied at the SEC's Public Reference Room in Washington, DC. Information regarding the operation of the SEC's Public Reference Room may be obtained by calling 1-800-SEC-0330. For a complete list of a fund's portfolio holdings, view the most recent holdings listing, semiannual report, or annual report on Fidelity's web site at http://www.fidelity.com, http://www.advisor.fidelity.com, or http://www.401k.com, as applicable.
NOT FDIC INSURED • MAY LOSE VALUE • NO BANK GUARANTEE
Neither the fund nor Fidelity Distributors Corporation is a bank.
Annual Report
Average annual total return reflects the change in the value of an investment, assuming reinvestment of the class' distributions from dividend income and capital gains (the profits earned upon the sale of securities that have grown in value, if any) and assuming a constant rate of performance each year. The $10,000 table and the fund's returns do not reflect the deduction of taxes that a shareholder would pay on fund distributions or the redemption of fund shares. During periods of reimbursement by Fidelity, a fund's total return will be greater than it would be had the reimbursement not occurred. How a fund did yesterday is no guarantee of how it will do tomorrow.
Average Annual Total Returns
Periods ended October 31, 2015 | Past 1
year | Past 5
years | Past 10
years |
Class I A | 2.72% | 4.54% | 0.68% |
A The initial offering of Class I shares took place on December 14, 2010. Returns prior to December 14, 2010, are those of Fidelity® Japan Fund, the original class of the fund.
$10,000 Over 10 Years
Let's say hypothetically that $10,000 was invested in Fidelity Advisor® Japan Fund - Class I on October 31, 2005. The chart shows how the value of your investment would have changed, and also shows how the Tokyo Stock Price Index (TOPIX) performed over the same period. See footnote A above for additional information regarding the performance of Class I.
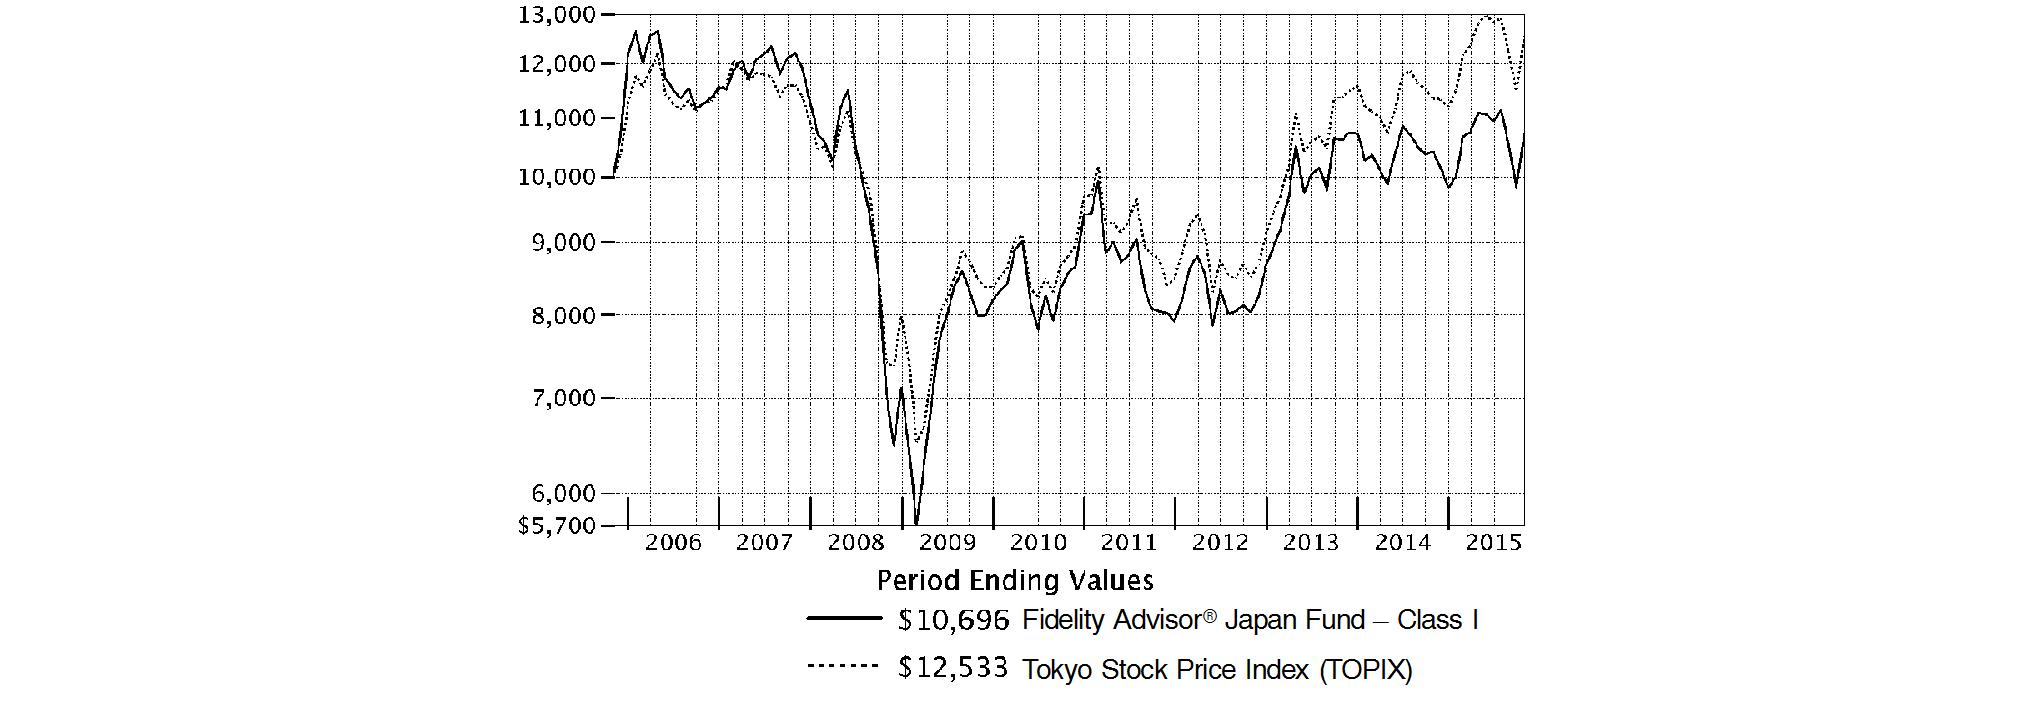
-
Annual Report
Fidelity Japan Fund
Market Recap: International equities suffered a moderate setback for the 12 months ending October 31, 2015, held back by a collapse in commodities prices that hurt resources-related sectors and geographies. The MSCI ACWI (All Country World Index) ex USA Index returned -4.55% for the period, affected also by concerns about global economic growth. Commodity producers remained under pressure for much of the past year, largely related to economic deceleration in China (-1%), the world's second-largest economy and a leading consumer of raw materials. This effect was exacerbated by U.S. dollar strength relative to global currencies, which weighed on commodities priced in dollars and acutely impacted equity returns within regions most exposed to resources prices. The emerging-markets group, for example, returned about -15% this period. Canada, a significant energy producer, returned roughly -17%. Net energy consumer Japan (+9%) was the best-performing region by far. Only about a quarter of the nearly 50 index countries managed a gain this period: Ireland (+19%) - the EU's fastest-growing economy - and Israel (+17%) proved top performers; Greece (-56%) and Brazil (-46%), among the worst. As for sectors, energy (-25%) and materials (-16%) declined sharply, whereas the two consumer sectors each gained about 6%.
Comments from Portfolio Manager Kirk Neureiter: For the year, the fund's share classes (excluding sales charges, if applicable) posted modest single-digit gains but fell considerably short of the 10.61% gain of the benchmark Tokyo Stock Price Index (TOPIX). A downward fair-value adjustment significantly detracted from performance versus the benchmark. Stock selection in health care, information technology, consumer staples and industrials were other meaningful negatives. At the stock level, a large overweighting in Hitachi was the fund's largest relative detractor. This large industrial electronics firm was undergoing a restructuring that I thought was going well, but exposure to a slowing Chinese economy hurt its Hitachi Construction Machinery segment. Other noteworthy detractors included Japan Tobacco; Sanken Electric, a supplier of the power-related integrated circuits for the consumer electronics and auto industries; and drug stock Astellas Pharma, the fund's largest holding at period end. Conversely, stock picking in consumer discretionary and financials lifted relative performance. E-commerce giant Rakuten was the fund's top contributor. As the share price of Rakuten increased, I sold most of our position, although we still ended the period with an overweighting. Other contributors were Shimadzu, a maker of measuring equipment, medical equipment, space equipment and industrial machinery; and East Japan Railway, the fund's second-largest position at period end.
The views expressed above reflect those of the portfolio manager(s) only through the end of the period as stated on the cover of this report and do not necessarily represent the views of Fidelity or any other person in the Fidelity organization. Any such views are subject to change at any time based upon market or other conditions and Fidelity disclaims any responsibility to update such views. These views may not be relied on as investment advice and, because investment decisions for a Fidelity fund are based on numerous factors, may not be relied on as an indication of trading intent on behalf of any Fidelity fund.
Annual Report
Fidelity Japan Fund
As a shareholder of the Fund, you incur two types of costs: (1) transaction costs, including sales charges (loads) on purchase payments or redemption proceeds, redemption fees and (2) ongoing costs, including management fees, distribution and/or service (12b-1) fees and other Fund expenses. This Example is intended to help you understand your ongoing costs (in dollars) of investing in the Fund and to compare these costs with the ongoing costs of investing in other mutual funds.
The Example is based on an investment of $1,000 invested at the beginning of the period and held for the entire period (May 1, 2015 to October 31, 2015).
Actual Expenses
The first line of the accompanying table for each class of the Fund provides information about actual account values and actual expenses. You may use the information in this line, together with the amount you invested, to estimate the expenses that you paid over the period. Simply divide your account value by $1,000.00 (for example, an $8,600 account value divided by $1,000.00 = 8.6), then multiply the result by the number in the first line for a class of the Fund under the heading entitled "Expenses Paid During Period" to estimate the expenses you paid on your account during this period. A small balance maintenance fee of $12.00 that is charged once a year may apply for certain accounts with a value of less than $2,000. This fee is not included in the table below. If it was, the estimate of expenses you paid during the period would be higher, and your ending account value lower, by this amount. In addition, the Fund, as a shareholder in the underlying Fidelity Central Funds, will indirectly bear its pro-rata share of the fees and expenses incurred by the underlying Fidelity Central Funds. These fees and expenses are not included in the Fund's annualized expense ratio used to calculate the expense estimate in the table below.
Hypothetical Example for Comparison Purposes
The second line of the accompanying table for each class of the Fund provides information about hypothetical account values and hypothetical expenses based on a Class' actual expense ratio and an assumed rate of return of 5% per year before expenses, which is not the Class' actual return. The hypothetical account values and expenses may not be used to estimate the actual ending account balance or expenses you paid for the period. You may use this information to compare the ongoing costs of investing in the Fund and other funds. To do so, compare this 5% hypothetical example with the 5% hypothetical examples that appear in the shareholder reports of the other funds. A small balance maintenance fee of $12.00 that is charged once a year may apply for certain accounts with a value of less than $2,000. This fee is not included in the table below. If it was, the estimate of expenses you paid during the period would be higher, and your ending account value lower, by this amount. In addition, the Fund, as a shareholder in the underlying Fidelity Central Funds, will indirectly bear its pro-rata share of the fees and expenses incurred by the underlying Fidelity Central Funds. These fees and expenses are not included in the Fund's annualized expense ratio used to calculate the expense estimate in the table below.
Please note that the expenses shown in the table are meant to highlight your ongoing costs only and do not reflect any transaction costs. Therefore, the second line of the table is useful in comparing ongoing costs only, and will not help you determine the relative total costs of owning different funds. In addition, if these transactional costs were included, your costs would have been higher.
| Annualized
Expense RatioB | Beginning
Account Value
May 1, 2015 | Ending
Account Value
October 31, 2015 | Expenses Paid
During PeriodC
May 1, 2015
to October 31, 2015 |
Class A | 1.09% | | | |
Actual | | $ 1,000.00 | $ 962.70 | $ 5.39 |
HypotheticalA | | $ 1,000.00 | $ 1,019.71 | $ 5.55 |
Class T | 1.42% | | | |
Actual | | $ 1,000.00 | $ 961.10 | $ 7.02 |
HypotheticalA | | $ 1,000.00 | $ 1,018.05 | $ 7.22 |
Class B | 1.90% | | | |
Actual | | $ 1,000.00 | $ 958.60 | $ 9.38 |
HypotheticalA | | $ 1,000.00 | $ 1,015.63 | $ 9.65 |
Class C | 1.80% | | | |
Actual | | $ 1,000.00 | $ 959.30 | $ 8.89 |
HypotheticalA | | $ 1,000.00 | $ 1,016.13 | $ 9.15 |
Japan | .79% | | | |
Actual | | $ 1,000.00 | $ 964.40 | $ 3.91 |
HypotheticalA | | $ 1,000.00 | $ 1,021.22 | $ 4.02 |
Class I | .80% | | | |
Actual | | $ 1,000.00 | $ 965.10 | $ 3.96 |
HypotheticalA | | $ 1,000.00 | $ 1,021.17 | $ 4.08 |
A 5% return per year before expenses
B Annualized expense ratio reflects expenses net of applicable fee waivers.
C Expenses are equal to each Class' annualized expense ratio, multiplied by the average account value over the period, multiplied by 184/365 (to reflect the one-half year period).
Annual Report
Fidelity Japan Fund
Investment Changes (Unaudited)
Asset Allocation as of October 31, 2015 |
| % of fund's
net assets | % of fund's net assets
6 months ago |
Stocks | 98.6 | 92.5 |
Short-Term Investments and Net Other Assets (Liabilities) | 1.4 | 7.5 |
Top Ten Stocks as of October 31, 2015 |
| % of fund's
net assets | % of fund's net assets
6 months ago |
Astellas Pharma, Inc. (Pharmaceuticals) | 4.9 | 4.7 |
East Japan Railway Co. (Road & Rail) | 4.2 | 4.1 |
Mitsubishi UFJ Financial Group, Inc. (Banks) | 4.0 | 4.1 |
KDDI Corp. (Wireless Telecommunication Services) | 3.3 | 3.4 |
Hoya Corp. (Health Care Equipment & Supplies) | 3.3 | 3.2 |
ORIX Corp. (Diversified Financial Services) | 3.0 | 3.1 |
Honda Motor Co. Ltd. (Automobiles) | 3.0 | 3.2 |
Mitsui Fudosan Co. Ltd. (Real Estate Management & Development) | 2.9 | 2.9 |
SoftBank Corp. (Wireless Telecommunication Services) | 2.8 | 3.1 |
Sony Corp. (Household Durables) | 2.6 | 1.4 |
| 34.0 | |
Market Sectors as of October 31, 2015 |
| % of fund's
net assets | % of fund's net assets
6 months ago |
Consumer Discretionary | 19.3 | 20.0 |
Financials | 19.0 | 19.2 |
Information Technology | 13.8 | 16.8 |
Industrials | 13.8 | 12.1 |
Health Care | 13.3 | 10.0 |
Telecommunication Services | 7.2 | 7.5 |
Consumer Staples | 7.0 | 3.8 |
Materials | 5.2 | 3.1 |
Annual Report
Fidelity Japan Fund
Investments October 31, 2015
Showing Percentage of Net Assets
Common Stocks - 98.6% |
| Shares | | Value |
CONSUMER DISCRETIONARY - 19.3% |
Auto Components - 3.3% |
Bridgestone Corp. | 236,400 | | $ 8,669,005 |
NGK Spark Plug Co. Ltd. | 195,200 | | 4,763,862 |
Sumitomo Electric Industries Ltd. | 351,900 | | 4,802,717 |
| | 18,235,584 |
Automobiles - 9.2% |
Fuji Heavy Industries Ltd. | 57,600 | | 2,227,601 |
Honda Motor Co. Ltd. | 495,700 | | 16,397,977 |
Isuzu Motors Ltd. | 306,800 | | 3,583,277 |
Mazda Motor Corp. | 276,900 | | 5,435,348 |
Suzuki Motor Corp. | 314,900 | | 10,310,916 |
Toyota Motor Corp. | 200,700 | | 12,295,772 |
| | 50,250,891 |
Hotels, Restaurants & Leisure - 0.6% |
Skylark Co. Ltd. | 250,300 | | 3,255,648 |
Household Durables - 4.0% |
Casio Computer Co. Ltd. (d) | 205,400 | | 3,869,605 |
Rinnai Corp. | 49,700 | | 3,940,019 |
Sony Corp. | 496,700 | | 14,118,910 |
| | 21,928,534 |
Internet & Catalog Retail - 0.5% |
Rakuten, Inc. | 177,700 | | 2,461,712 |
Media - 0.4% |
Proto Corp. | 174,000 | | 2,257,590 |
Multiline Retail - 0.4% |
Don Quijote Holdings Co. Ltd. | 55,000 | | 2,020,379 |
Specialty Retail - 0.9% |
United Arrows Ltd. | 119,700 | | 5,156,785 |
TOTAL CONSUMER DISCRETIONARY | | 105,567,123 |
CONSUMER STAPLES - 7.0% |
Beverages - 1.2% |
Asahi Group Holdings | 193,100 | | 5,956,400 |
Coca-Cola Central Japan Co. Ltd. | 32,500 | | 456,767 |
| | 6,413,167 |
Food & Staples Retailing - 4.0% |
Ain Holdings, Inc. | 38,100 | | 1,803,608 |
San-A Co. Ltd. | 47,900 | | 2,034,107 |
Seven & i Holdings Co. Ltd. | 208,600 | | 9,475,617 |
Sundrug Co. Ltd. | 56,600 | | 2,981,659 |
Tsuruha Holdings, Inc. | 24,800 | | 1,964,757 |
Welcia Holdings Co. Ltd. | 78,500 | | 3,868,891 |
| | 22,128,639 |
Tobacco - 1.8% |
Japan Tobacco, Inc. | 276,100 | | 9,556,315 |
TOTAL CONSUMER STAPLES | | 38,098,121 |
|
| Shares | | Value |
FINANCIALS - 19.0% |
Banks - 8.0% |
Mitsubishi UFJ Financial Group, Inc. | 3,380,400 | | $ 21,862,854 |
Seven Bank Ltd. | 1,358,900 | | 6,191,903 |
Shinsei Bank Ltd. | 3,139,000 | | 6,581,771 |
Sumitomo Mitsui Financial Group, Inc. | 232,500 | | 9,275,278 |
| | 43,911,806 |
Capital Markets - 0.8% |
Monex Group, Inc. | 1,462,000 | | 4,109,708 |
Diversified Financial Services - 3.0% |
ORIX Corp. | 1,141,000 | | 16,662,914 |
Insurance - 2.2% |
Tokio Marine Holdings, Inc. | 310,700 | | 11,971,797 |
Real Estate Investment Trusts - 1.3% |
Invincible Investment Corp. | 2,648 | | 1,570,091 |
Nippon Prologis REIT, Inc. | 942 | | 1,656,583 |
Parkway Life REIT | 1,347,000 | | 2,217,993 |
Sekisui House (REIT), Inc. | 1,502 | | 1,548,369 |
| | 6,993,036 |
Real Estate Management & Development - 3.7% |
AEON MALL Co. Ltd. | 252,100 | | 4,217,058 |
Mitsui Fudosan Co. Ltd. | 590,000 | | 16,056,055 |
| | 20,273,113 |
TOTAL FINANCIALS | | 103,922,374 |
HEALTH CARE - 13.3% |
Health Care Equipment & Supplies - 4.9% |
Hoya Corp. | 430,200 | | 17,752,968 |
Olympus Corp. | 259,400 | | 8,749,907 |
| | 26,502,875 |
Health Care Providers & Services - 3.5% |
Message Co. Ltd. (d) | 243,700 | | 6,006,654 |
Miraca Holdings, Inc. | 104,100 | | 4,633,000 |
Ship Healthcare Holdings, Inc. | 357,400 | | 8,657,380 |
| | 19,297,034 |
Pharmaceuticals - 4.9% |
Astellas Pharma, Inc. | 1,852,400 | | 26,886,627 |
TOTAL HEALTH CARE | | 72,686,536 |
INDUSTRIALS - 13.8% |
Airlines - 0.8% |
Japan Airlines Co. Ltd. | 120,600 | | 4,543,380 |
Building Products - 1.3% |
Daikin Industries Ltd. | 72,800 | | 4,677,471 |
LIXIL Group Corp. | 107,700 | | 2,305,862 |
| | 6,983,333 |
Construction & Engineering - 1.0% |
Toshiba Plant Systems & Services Corp. | 508,800 | | 5,449,983 |
Common Stocks - continued |
| Shares | | Value |
INDUSTRIALS - continued |
Electrical Equipment - 2.6% |
Mitsubishi Electric Corp. | 641,000 | | $ 6,675,849 |
Nidec Corp. | 99,000 | | 7,460,255 |
| | 14,136,104 |
Machinery - 2.7% |
IHI Corp. | 1,110,000 | | 3,131,774 |
Kubota Corp. | 334,000 | | 5,177,488 |
Makita Corp. | 117,000 | | 6,410,761 |
| | 14,720,023 |
Professional Services - 0.4% |
Funai Soken Holdings, Inc. | 145,800 | | 2,236,793 |
Road & Rail - 4.2% |
East Japan Railway Co. | 240,300 | | 22,846,664 |
Trading Companies & Distributors - 0.8% |
Misumi Group, Inc. | 349,200 | | 4,547,318 |
TOTAL INDUSTRIALS | | 75,463,598 |
INFORMATION TECHNOLOGY - 13.8% |
Electronic Equipment & Components - 6.8% |
Azbil Corp. | 207,200 | | 5,227,489 |
Hitachi Ltd. | 2,128,000 | | 12,275,993 |
OMRON Corp. | 123,900 | | 4,102,684 |
Shimadzu Corp. | 792,000 | | 12,285,888 |
TDK Corp. | 54,800 | | 3,490,565 |
| | 37,382,619 |
Internet Software & Services - 4.0% |
Alibaba Group Holding Ltd. sponsored ADR (a) | 46,900 | | 3,931,627 |
DeNA Co. Ltd. | 250,900 | | 4,025,511 |
Kakaku.com, Inc. (d) | 500,500 | | 9,336,956 |
NAVER Corp. | 8,563 | | 4,499,855 |
| | 21,793,949 |
Semiconductors & Semiconductor Equipment - 1.3% |
Sanken Electric Co. Ltd. | 750,000 | | 2,606,671 |
Sumco Corp. | 442,800 | | 4,463,736 |
| | 7,070,407 |
Software - 0.2% |
COLOPL, Inc. (d) | 81,000 | | 1,323,234 |
Technology Hardware, Storage & Peripherals - 1.5% |
NEC Corp. | 1,043,000 | | 3,217,637 |
Samsung Electronics Co. Ltd. | 4,206 | | 5,054,111 |
| | 8,271,748 |
TOTAL INFORMATION TECHNOLOGY | | 75,841,957 |
MATERIALS - 5.2% |
Chemicals - 4.9% |
Daicel Chemical Industries Ltd. | 261,500 | | 3,455,563 |
|
| Shares | | Value |
Hitachi Chemical Co. Ltd. | 155,500 | | $ 2,458,082 |
JSR Corp. | 289,800 | | 4,576,898 |
Kansai Paint Co. Ltd. | 232,000 | | 3,536,560 |
Shin-Etsu Chemical Co. Ltd. | 132,600 | | 7,885,613 |
Toray Industries, Inc. | 584,000 | | 5,094,934 |
| | 27,007,650 |
Metals & Mining - 0.3% |
Yamato Kogyo Co. Ltd. | 58,400 | | 1,555,608 |
TOTAL MATERIALS | | 28,563,258 |
TELECOMMUNICATION SERVICES - 7.2% |
Diversified Telecommunication Services - 1.1% |
Nippon Telegraph & Telephone Corp. | 162,200 | | 5,946,479 |
Wireless Telecommunication Services - 6.1% |
KDDI Corp. | 738,000 | | 17,858,371 |
SoftBank Corp. | 277,200 | | 15,530,937 |
| | 33,389,308 |
TOTAL TELECOMMUNICATION SERVICES | | 39,335,787 |
TOTAL COMMON STOCKS (Cost $530,190,692) |
539,478,754
|
Money Market Funds - 3.3% |
| | | |
Fidelity Cash Central Fund, 0.18% (b) | 5,556,318 | | 5,556,318 |
Fidelity Securities Lending Cash Central Fund, 0.19% (b)(c) | 12,649,386 | | 12,649,386 |
TOTAL MONEY MARKET FUNDS (Cost $18,205,704) |
18,205,704
|
TOTAL INVESTMENT
PORTFOLIO - 101.9% (Cost $548,396,396) | | 557,684,458 |
NET OTHER ASSETS (LIABILITIES) - (1.9)% | | (10,360,116) |
NET ASSETS - 100% | $ 547,324,342 |
Legend |
(a) Non-income producing |
(b) Affiliated fund that is generally available only to investment companies and other accounts managed by Fidelity Investments. The rate quoted is the annualized seven-day yield of the fund at period end. A complete unaudited listing of the fund's holdings as of its most recent quarter end is available upon request. In addition, each Fidelity Central Fund's financial statements, which are not covered by the Fund's Report of Independent Registered Public Accounting Firm, are available on the SEC's website or upon request. |
(c) Investment made with cash collateral received from securities on loan. |
(d) Security or a portion of the security is on loan at period end. |
Affiliated Central Funds |
Information regarding fiscal year to date income earned by the Fund from investments in Fidelity Central Funds is as follows: |
Fund | Income earned |
Fidelity Cash Central Fund | $ 20,597 |
Fidelity Securities Lending Cash Central Fund | 71,632 |
Total | $ 92,229 |
Other Information |
The following is a summary of the inputs used, as of October 31, 2015, involving the Fund's assets and liabilities carried at fair value. The inputs or methodology used for valuing securities may not be an indication of the risk associated with investing in those securities. For more information on valuation inputs, and their aggregation into the levels used in the table below, please refer to the Investment Valuation section in the accompanying Notes to Financial Statements. |
Valuation Inputs at Reporting Date: |
Description | Total | Level 1 | Level 2 | Level 3 |
Investments in Securities: | | | | |
Equities: | | | | |
Consumer Discretionary | $ 105,567,123 | $ - | $ 105,567,123 | $ - |
Consumer Staples | 38,098,121 | - | 38,098,121 | - |
Financials | 103,922,374 | - | 103,922,374 | - |
Health Care | 72,686,536 | - | 72,686,536 | - |
Industrials | 75,463,598 | - | 75,463,598 | - |
Information Technology | 75,841,957 | 13,485,593 | 62,356,364 | - |
Materials | 28,563,258 | - | 28,563,258 | - |
Telecommunication Services | 39,335,787 | - | 39,335,787 | - |
Money Market Funds | 18,205,704 | 18,205,704 | - | - |
Total Investments in Securities: | $ 557,684,458 | $ 31,691,297 | $ 525,993,161 | $ - |
See accompanying notes which are an integral part of the financial statements.
Annual Report
Fidelity Japan Fund
Statement of Assets and Liabilities
| | October 31, 2015 |
| | |
Assets | | |
Investment in securities, at value (including securities loaned of $12,036,815) - See accompanying schedule: Unaffiliated issuers (cost $530,190,692) | $ 539,478,754 | |
Fidelity Central Funds (cost $18,205,704) | 18,205,704 | |
Total Investments (cost $548,396,396) | | $ 557,684,458 |
Receivable for investments sold | | 574,282 |
Receivable for fund shares sold | | 516,884 |
Dividends receivable | | 3,045,252 |
Distributions receivable from Fidelity Central Funds | | 8,242 |
Prepaid expenses | | 1,495 |
Other receivables | | 1,228 |
Total assets | | 561,831,841 |
| | |
Liabilities | | |
Payable for investments purchased | $ 1,066,235 | |
Payable for fund shares redeemed | 356,790 | |
Accrued management fee | 229,677 | |
Distribution and service plan fees payable | 21,782 | |
Other affiliated payables | 106,395 | |
Other payables and accrued expenses | 77,234 | |
Collateral on securities loaned, at value | 12,649,386 | |
Total liabilities | | 14,507,499 |
| | |
Net Assets | | $ 547,324,342 |
Net Assets consist of: | | |
Paid in capital | | $ 717,255,617 |
Undistributed net investment income | | 3,017,018 |
Accumulated undistributed net realized gain (loss) on investments and foreign currency transactions | | (182,218,023) |
Net unrealized appreciation (depreciation) on investments and assets and liabilities in foreign currencies | | 9,269,730 |
Net Assets | | $ 547,324,342 |
Statement of Assets and Liabilities - continued
| | October 31, 2015 |
| | |
Calculation of Maximum Offering Price | | |
Class A:
Net Asset Value and redemption price per share ($23,917,721 ÷ 2,014,446 shares) | | $ 11.87 |
| | |
Maximum offering price per share (100/94.25 of $11.87) | | $ 12.59 |
Class T:
Net Asset Value and redemption price per share ($4,808,761 ÷ 405,871 shares) | | $ 11.85 |
| | |
Maximum offering price per share (100/96.50 of $11.85) | | $ 12.28 |
Class B:
Net Asset Value and offering price per share ($347,681 ÷ 29,411 shares)A | | $ 11.82 |
| | |
Class C:
Net Asset Value and offering price per share ($18,490,533 ÷ 1,571,218 shares)A | | $ 11.77 |
| | |
Japan:
Net Asset Value, offering price and redemption price per share ($485,803,076 ÷ 40,792,237 shares) | | $ 11.91 |
| | |
Class I:
Net Asset Value, offering price and redemption price per share ($13,956,570 ÷ 1,174,263 shares) | | $ 11.89 |
A Redemption price per share is equal to net asset value less any applicable contingent deferred sales charge.
See accompanying notes which are an integral part of the financial statements.
Annual Report
Fidelity Japan Fund
Financial Statements - continued
Statement of Operations
| Year ended October 31, 2015 |
| | |
Investment Income | | |
Dividends | | $ 8,050,801 |
Income from Fidelity Central Funds | | 92,229 |
Income before foreign taxes withheld | | 8,143,030 |
Less foreign taxes withheld | | (808,062) |
Total income | | 7,334,968 |
| | |
Expenses | | |
Management fee | | |
Basic fee | $ 3,498,174 | |
Performance adjustment | (907,813) | |
Transfer agent fees | 962,727 | |
Distribution and service plan fees | 222,835 | |
Accounting and security lending fees | 260,372 | |
Custodian fees and expenses | 52,192 | |
Independent trustees' compensation | 2,143 | |
Registration fees | 82,981 | |
Audit | 73,136 | |
Legal | 1,206 | |
Miscellaneous | 3,718 | |
Total expenses before reductions | 4,251,671 | |
Expense reductions | (28,886) | 4,222,785 |
Net investment income (loss) | | 3,112,183 |
Realized and Unrealized Gain (Loss) | | |
Net realized gain (loss) on: | | |
Investment securities: | | |
Unaffiliated issuers | (27,164) | |
Foreign currency transactions | (365,218) | |
Total net realized gain (loss) | | (392,382) |
Change in net unrealized appreciation (depreciation) on: Investment securities | 1,912,886 | |
Assets and liabilities in foreign currencies | 24,355 | |
Total change in net unrealized appreciation (depreciation) | | 1,937,241 |
Net gain (loss) | | 1,544,859 |
Net increase (decrease) in net assets resulting from operations | | $ 4,657,042 |
Statement of Changes in Net Assets
| Year ended
October 31,
2015 | Year ended
October 31,
2014 |
Increase (Decrease) in Net Assets | | |
Operations | | |
Net investment income (loss) | $ 3,112,183 | $ 3,447,815 |
Net realized gain (loss) | (392,382) | (3,239,373) |
Change in net unrealized appreciation (depreciation) | 1,937,241 | (11,748,802) |
Net increase (decrease) in net assets resulting from operations | 4,657,042 | (11,540,360) |
Distributions to shareholders from net investment income | (3,310,432) | (4,561,447) |
Distributions to shareholders from net realized gain | - | (402,380) |
Total distributions | (3,310,432) | (4,963,827) |
Share transactions - net increase (decrease) | 70,904,089 | (48,052,746) |
Redemption fees | 139,156 | 110,748 |
Total increase (decrease) in net assets | 72,389,855 | (64,446,185) |
| | |
Net Assets | | |
Beginning of period | 474,934,487 | 539,380,672 |
End of period (including undistributed net investment income of $3,017,018 and undistributed net investment income of $3,240,458, respectively) | $ 547,324,342 | $ 474,934,487 |
See accompanying notes which are an integral part of the financial statements.
Annual Report
Financial Highlights - Fidelity Japan Fund Class A
Years ended October 31, | 2015 | 2014 | 2013 | 2012 | 2011 H |
Selected Per-Share Data | | | | | |
Net asset value, beginning of period | $ 11.65 | $ 12.00 | $ 9.30 | $ 9.54 | $ 10.83 |
Income from Investment Operations | | | | | |
Net investment income (loss) E | .04 | .05 | .08 | .09 | .09 |
Net realized and unrealized gain (loss) | .23 | (.31) | 2.80 | (.15) | (1.39) |
Total from investment operations | .27 | (.26) | 2.88 | (.06) | (1.30) |
Distributions from net investment income | (.05) | (.08) | (.11) | (.13) | - |
Distributions from net realized gain | - | (.01) | (.08) | (.05) | - |
Total distributions | (.05) | (.09) | (.19) | (.18) | - |
Redemption fees added to paid in capitalE | -K | -K | .01 | -K | .01 |
Net asset value, end of period | $ 11.87 | $ 11.65 | $ 12.00 | $ 9.30 | $ 9.54 |
Total ReturnB, C, D | 2.31% | (2.18)% | 31.58% | (.64)% | (11.91)% |
Ratios to Average Net AssetsF, I | | | | | |
Expenses before reductions | 1.10% | 1.23% | 1.26% | 1.42% | 1.20%A |
Expenses net of fee waivers, if any | 1.10% | 1.23% | 1.26% | 1.38% | 1.20%A |
Expenses net of all reductions | 1.09% | 1.23% | 1.25% | 1.36% | 1.16%A |
Net investment income (loss) | .37% | .41% | .75% | .94% | 1.02%A |
Supplemental Data | | | | | |
Net assets, end of period (000 omitted) | $ 23,918 | $ 21,352 | $ 20,520 | $ 9,495 | $ 13,208 |
Portfolio turnover rateG | 35% | 112% | 68% | 52% | 134%J |
AAnnualized BTotal returns for periods of less than one year are not annualized. CTotal returns would have been lower if certain expenses had not been reduced during the applicable periods shown. DTotal returns do not include the effect of the sales charges. ECalculated based on average shares outstanding during the period. FFees and expenses of any underlying Fidelity Central Funds are not included in the Fund's expense ratio. The Fund indirectly bears its proportionate share of the expenses of any underlying Fidelity Central Funds. GAmount does not include the portfolio activity of any underlying Fidelity Central Funds. HFor the period December 14, 2010 (commencement of sale of shares) to October 31, 2011. IExpense ratios reflect operating expenses of the class. Expenses before reductions do not reflect amounts reimbursed by the investment adviser or reductions from brokerage service arrangements or reductions from other expense offset arrangements and do not represent the amount paid by the class during periods when reimbursements or reductions occur. Expenses net of fee waivers reflect expenses after reimbursement by the investment adviser but prior to reductions from brokerage service arrangements or other expense offset arrangements. Expenses net of all reductions represent the net expenses paid by the class. JThe portfolio turnover rate does not include the assets acquired in the merger. KAmount represents less than $.005 per share. |
Financial Highlights - Fidelity Japan Fund Class T
Years ended October 31, | 2015 | 2014 | 2013 | 2012 | 2011 H |
Selected Per-Share Data | | | | | |
Net asset value, beginning of period | $ 11.62 | $ 11.96 | $ 9.28 | $ 9.51 | $ 10.83 |
Income from Investment Operations | | | | | |
Net investment income (loss) E | -K | .01 | .05 | .06 | .07 |
Net realized and unrealized gain (loss) | .23 | (.30) | 2.78 | (.13) | (1.40) |
Total from investment operations | .23 | (.29) | 2.83 | (.07) | (1.33) |
Distributions from net investment income | - | (.04) | (.08) | (.11) | - |
Distributions from net realized gain | - | (.01) | (.08) | (.05) | - |
Total distributions | - | (.05) | (.16) | (.16) | - |
Redemption fees added to paid in capitalE | -K | -K | .01 | -K | .01 |
Net asset value, end of period | $ 11.85 | $ 11.62 | $ 11.96 | $ 9.28 | $ 9.51 |
Total ReturnB, C, D | 1.98% | (2.42)% | 31.04% | (.75)% | (12.19)% |
Ratios to Average Net AssetsF, I | | | | | |
Expenses before reductions | 1.43% | 1.54% | 1.55% | 1.70% | 1.48%A |
Expenses net of fee waivers, if any | 1.43% | 1.54% | 1.55% | 1.66% | 1.48%A |
Expenses net of all reductions | 1.42% | 1.54% | 1.53% | 1.64% | 1.44%A |
Net investment income (loss) | .04% | .10% | .46% | .66% | .74%A |
Supplemental Data | | | | | |
Net assets, end of period (000 omitted) | $ 4,809 | $ 4,104 | $ 5,357 | $ 3,934 | $ 4,643 |
Portfolio turnover rateG | 35% | 112% | 68% | 52% | 134%J |
AAnnualized BTotal returns for periods of less than one year are not annualized. CTotal returns would have been lower if certain expenses had not been reduced during the applicable periods shown. DTotal returns do not include the effect of the sales charges. ECalculated based on average shares outstanding during the period. FFees and expenses of any underlying Fidelity Central Funds are not included in the Fund's expense ratio. The Fund indirectly bears its proportionate share of the expenses of any underlying Fidelity Central Funds. GAmount does not include the portfolio activity of any underlying Fidelity Central Funds. HFor the period December 14, 2010 (commencement of sale of shares) to October 31, 2011. IExpense ratios reflect operating expenses of the class. Expenses before reductions do not reflect amounts reimbursed by the investment adviser or reductions from brokerage service arrangements or reductions from other expense offset arrangements and do not represent the amount paid by the class during periods when reimbursements or reductions occur. Expenses net of fee waivers reflect expenses after reimbursement by the investment adviser but prior to reductions from brokerage service arrangements or other expense offset arrangements. Expenses net of all reductions represent the net expenses paid by the class. JThe portfolio turnover rate does not include the assets acquired in the merger. KAmount represents less than $.005 per share. |
See accompanying notes which are an integral part of the financial statements.
Annual Report
Financial Highlights - Fidelity Japan Fund Class B
Years ended October 31, | 2015 | 2014 | 2013 | 2012 | 2011 H |
Selected Per-Share Data | | | | | |
Net asset value, beginning of period | $ 11.65 | $ 12.00 | $ 9.26 | $ 9.47 | $ 10.83 |
Income from Investment Operations | | | | | |
Net investment income (loss) E | (.05) | (.04) | -K | .02 | .02 |
Net realized and unrealized gain (loss) | .22 | (.31) | 2.80 | (.14) | (1.39) |
Total from investment operations | .17 | (.35) | 2.80 | (.12) | (1.37) |
Distributions from net investment income | - | - | - | (.04) | - |
Distributions from net realized gain | - | - | (.07) | (.05) | - |
Total distributions | - | - | (.07) | (.09) | - |
Redemption fees added to paid in capitalE | -K | -K | .01 | -K | .01 |
Net asset value, end of period | $ 11.82 | $ 11.65 | $ 12.00 | $ 9.26 | $ 9.47 |
Total ReturnB, C, D | 1.46% | (2.92)% | 30.52% | (1.24)% | (12.56)% |
Ratios to Average Net AssetsF, I | | | | | |
Expenses before reductions | 1.91% | 2.02% | 2.02% | 2.17% | 1.95%A |
Expenses net of fee waivers, if any | 1.91% | 2.02% | 2.02% | 2.13% | 1.95%A |
Expenses net of all reductions | 1.91% | 2.02% | 2.01% | 2.11% | 1.91%A |
Net investment income (loss) | (.45)% | (.37)% | (.02)% | .19% | .27%A |
Supplemental Data | | | | | |
Net assets, end of period (000 omitted) | $ 348 | $ 452 | $ 874 | $ 1,012 | $ 1,458 |
Portfolio turnover rateG | 35% | 112% | 68% | 52% | 134%J |
AAnnualized BTotal returns for periods of less than one year are not annualized. CTotal returns would have been lower if certain expenses had not been reduced during the applicable periods shown. DTotal returns do not include the effect of the contingent deferred sales charge. ECalculated based on average shares outstanding during the period. FFees and expenses of any underlying Fidelity Central Funds are not included in the Fund's expense ratio. The Fund indirectly bears its proportionate share of the expenses of any underlying Fidelity Central Funds. GAmount does not include the portfolio activity of any underlying Fidelity Central Funds. HFor the period December 14, 2010 (commencement of sale of shares) to October 31, 2011. IExpense ratios reflect operating expenses of the class. Expenses before reductions do not reflect amounts reimbursed by the investment adviser or reductions from brokerage service arrangements or reductions from other expense offset arrangements and do not represent the amount paid by the class during periods when reimbursements or reductions occur. Expenses net of fee waivers reflect expenses after reimbursement by the investment adviser but prior to reductions from brokerage service arrangements or other expense offset arrangements. Expenses net of all reductions represent the net expenses paid by the class. JThe portfolio turnover rate does not include the assets acquired in the merger. KAmount represents less than $.005 per share. |
Financial Highlights - Fidelity Japan Fund Class C
Years ended October 31, | 2015 | 2014 | 2013 | 2012 | 2011 H |
Selected Per-Share Data | | | | | |
Net asset value, beginning of period | $ 11.58 | $ 11.96 | $ 9.25 | $ 9.48 | $ 10.83 |
Income from Investment Operations | | | | | |
Net investment income (loss) E | (.04) | (.03) | -K | .02 | .03 |
Net realized and unrealized gain (loss) | .23 | (.32) | 2.79 | (.14) | (1.39) |
Total from investment operations | .19 | (.35) | 2.79 | (.12) | (1.36) |
Distributions from net investment income | - | (.03) | (.01) | (.06) | - |
Distributions from net realized gain | - | (.01) | (.08) | (.05) | - |
Total distributions | - | (.03) L | (.09) | (.11) | - |
Redemption fees added to paid in capitalE | -K | -K | .01 | -K | .01 |
Net asset value, end of period | $ 11.77 | $ 11.58 | $ 11.96 | $ 9.25 | $ 9.48 |
Total ReturnB, C, D | 1.64% | (2.90)% | 30.55% | (1.27)% | (12.47)% |
Ratios to Average Net AssetsF, I | | | | | |
Expenses before reductions | 1.81% | 1.93% | 1.97% | 2.15% | 1.92%A |
Expenses net of fee waivers, if any | 1.81% | 1.93% | 1.97% | 2.11% | 1.92%A |
Expenses net of all reductions | 1.80% | 1.93% | 1.95% | 2.09% | 1.88%A |
Net investment income (loss) | (.34)% | (.29)% | .04% | .21% | .30%A |
Supplemental Data | | | | | |
Net assets, end of period (000 omitted) | $ 18,491 | $ 13,162 | $ 11,824 | $ 7,015 | $ 8,750 |
Portfolio turnover rateG | 35% | 112% | 68% | 52% | 134%J |
AAnnualized BTotal returns for periods of less than one year are not annualized. CTotal returns would have been lower if certain expenses had not been reduced during the applicable periods shown. DTotal returns do not include the effect of the contingent deferred sales charge. ECalculated based on average shares outstanding during the period. FFees and expenses of any underlying Fidelity Central Funds are not included in the Fund's expense ratio. The Fund indirectly bears its proportionate share of the expenses of any underlying Fidelity Central Funds. GAmount does not include the portfolio activity of any underlying Fidelity Central Funds. HFor the period December 14, 2010 (commencement of sale of shares) to October 31, 2011. IExpense ratios reflect operating expenses of the class. Expenses before reductions do not reflect amounts reimbursed by the investment adviser or reductions from brokerage service arrangements or reductions from other expense offset arrangements and do not represent the amount paid by the class during periods when reimbursements or reductions occur. Expenses net of fee waivers reflect expenses after reimbursement by the investment adviser but prior to reductions from brokerage service arrangements or other expense offset arrangements. Expenses net of all reductions represent the net expenses paid by the class. JThe portfolio turnover rate does not include the assets acquired in the merger. KAmount represents less than $.005 per share. LTotal distributions of $.03 per share is comprised of distributions from net investment income of $.025 and distributions from net realized gain of $.009 per share. |
See accompanying notes which are an integral part of the financial statements.
Annual Report
Financial Highlights - Fidelity Japan Fund
Years ended October 31, | 2015 | 2014 | 2013 | 2012 | 2011 |
Selected Per-Share Data | | | | | |
Net asset value, beginning of period | $ 11.69 | $ 12.03 | $ 9.34 | $ 9.57 | $ 10.57 |
Income from Investment Operations | | | | | |
Net investment income (loss) B | .08 | .09 | .12 | .12 | .15 |
Net realized and unrealized gain (loss) | .23 | (.32) | 2.79 | (.14) | (.75) |
Total from investment operations | .31 | (.23) | 2.91 | (.02) | (.60) |
Distributions from net investment income | (.09) | (.11) | (.15) | (.16) | (.20) |
Distributions from net realized gain | - | (.01) | (.08) | (.05) | (.21) |
Total distributions | (.09) | (.11) H | (.23) | (.21) | (.41) |
Redemption fees added to paid in capitalB | -G | -G | .01 | -G | .01 |
Net asset value, end of period | $ 11.91 | $ 11.69 | $ 12.03 | $ 9.34 | $ 9.57 |
Total Return A | 2.66% | (1.90)% | 31.92% | (.19)% | (6.00)% |
Ratios to Average Net AssetsC, E | | | | | |
Expenses before reductions | .80% | .90% | .93% | 1.09% | .86% |
Expenses net of fee waivers, if any | .80% | .90% | .93% | 1.06% | .84% |
Expenses net of all reductions | .79% | .90% | .91% | 1.04% | .80% |
Net investment income (loss) | .67% | .74% | 1.08% | 1.26% | 1.38% |
Supplemental Data | | | | | |
Net assets, end of period (000 omitted) | $ 485,803 | $ 415,612 | $ 480,773 | $ 353,550 | $ 450,417 |
Portfolio turnover rateD | 35% | 112% | 68% | 52% | 134%F |
ATotal returns would have been lower if certain expenses had not been reduced during the applicable periods shown. BCalculated based on average shares outstanding during the period. CFees and expenses of any underlying Fidelity Central Funds are not included in the Fund's expense ratio. The Fund indirectly bears its proportionate share of the expenses of any underlying Fidelity Central Funds. DAmount does not include the portfolio activity of any underlying Fidelity Central Funds. EExpense ratios reflect operating expenses of the class. Expenses before reductions do not reflect amounts reimbursed by the investment adviser or reductions from brokerage service arrangements or reductions from other expense offset arrangements and do not represent the amount paid by the class during periods when reimbursements or reductions occur. Expenses net of fee waivers reflect expenses after reimbursement by the investment adviser but prior to reductions from brokerage service arrangements or other expense offset arrangements. Expenses net of all reductions represent the net expenses paid by the class. FThe portfolio turnover rate does not include the assets acquired in the merger. GAmount represents less than $.005 per share. HTotal distributions of $.11 per share is comprised of distributions from net investment income of $.105 and distributions from net realized gain of $.009 per share. |
Financial Highlights - Fidelity Japan Fund Class I
Years ended October 31, | 2015 | 2014 | 2013 | 2012 | 2011 G |
Selected Per-Share Data | | | | | |
Net asset value, beginning of period | $ 11.67 | $ 12.02 | $ 9.33 | $ 9.57 | $ 10.83 |
Income from Investment Operations | | | | | |
Net investment income (loss) D | .08 | .09 | .13 | .12 | .13 |
Net realized and unrealized gain (loss) | .23 | (.32) | 2.78 | (.14) | (1.40) |
Total from investment operations | .31 | (.23) | 2.91 | (.02) | (1.27) |
Distributions from net investment income | (.09) | (.12) | (.15) | (.17) | - |
Distributions from net realized gain | - | (.01) | (.08) | (.05) | - |
Total distributions | (.09) | (.12) K | (.23) | (.22) | - |
Redemption fees added to paid in capitalD | -J | -J | .01 | -J | .01 |
Net asset value, end of period | $ 11.89 | $ 11.67 | $ 12.02 | $ 9.33 | $ 9.57 |
Total ReturnB, C | 2.72% | (1.90)% | 32.04% | (.18)% | (11.63)% |
Ratios to Average Net AssetsE, H | | | | | |
Expenses before reductions | .80% | .89% | .90% | 1.03% | .79%A |
Expenses net of fee waivers, if any | .80% | .89% | .90% | 1.01% | .79%A |
Expenses net of all reductions | .79% | .89% | .88% | .99% | .75%A |
Net investment income (loss) | .67% | .76% | 1.11% | 1.31% | 1.43%A |
Supplemental Data | | | | | |
Net assets, end of period (000 omitted) | $ 13,957 | $ 20,253 | $ 20,033 | $ 1,488 | $ 2,715 |
Portfolio turnover rateF | 35% | 112% | 68% | 52% | 134%I |
AAnnualized BTotal returns for periods of less than one year are not annualized. CTotal returns would have been lower if certain expenses had not been reduced during the applicable periods shown. DCalculated based on average shares outstanding during the period. EFees and expenses of any underlying Fidelity Central Funds are not included in the Fund's expense ratio. The Fund indirectly bears its proportionate share of the expenses of any underlying Fidelity Central Funds. FAmount does not include the portfolio activity of any underlying Fidelity Central Funds. GFor the period December 14, 2010 (commencement of sale of shares) to October 31, 2011. HExpense ratios reflect operating expenses of the class. Expenses before reductions do not reflect amounts reimbursed by the investment adviser or reductions from brokerage service arrangements or reductions from other expense offset arrangements and do not represent the amount paid by the class during periods when reimbursements or reductions occur. Expenses net of fee waivers reflect expenses after reimbursement by the investment adviser but prior to reductions from brokerage service arrangements or other expense offset arrangements. Expenses net of all reductions represent the net expenses paid by the class. IThe portfolio turnover rate does not include the assets acquired in the merger. JAmount represents less than $.005 per share. KTotal distributions of $.12 per share is comprised of distributions from net investment income of $.115 and distributions from net realized gain of $.009 per share. |
See accompanying notes which are an integral part of the financial statements.
Annual Report
For the period ended October 31, 2015
1. Organization.
Fidelity Japan Fund (the Fund) is a fund of Fidelity Investment Trust (the Trust) and is authorized to issue an unlimited number of shares. The Trust is registered under the Investment Company Act of 1940, as amended (the 1940 Act), as an open-end management investment company organized as a Massachusetts business trust. The Fund offers Class A, Class T, Class C, Japan and Class I (formerly Institutional Class) shares, each of which, along with Class B shares, has equal rights as to assets and voting privileges. Class B shares are closed to new accounts and additional purchases, except for exchanges and reinvestments. Each class has exclusive voting rights with respect to matters that affect that class. Class B shares will automatically convert to Class A shares after a holding period of seven years from the initial date of purchase.
2. Investments in Fidelity Central Funds.
The Fund invests in Fidelity Central Funds, which are open-end investment companies generally available only to other investment companies and accounts managed by the investment adviser and its affiliates. The Fund's Schedule of Investments lists each of the Fidelity Central Funds held as of period end, if any, as an investment of the Fund, but does not include the underlying holdings of each Fidelity Central Fund. As an Investing Fund, the Fund indirectly bears its proportionate share of the expenses of the underlying Fidelity Central Funds.
The Money Market Central Funds seek preservation of capital and current income and are managed by Fidelity Investments Money Management, Inc. (FIMM), an affiliate of the investment adviser. Annualized expenses of the Money Market Central Funds as of their most recent shareholder report date are less than .005%.
A complete unaudited list of holdings for each Fidelity Central Fund is available upon request or at the Securities and Exchange Commission (the SEC) website at www.sec.gov. In addition, the financial statements of the Fidelity Central Funds, which are not covered by the Fund's Report of Independent Registered Public Accounting Firm, are available on the SEC website or upon request.
3. Significant Accounting Policies.
The financial statements have been prepared in conformity with accounting principles generally accepted in the United States of America (GAAP), which require management to make certain estimates and assumptions at the date of the financial statements. Actual results could differ from those estimates. Subsequent events, if any, through the date that the financial statements were issued have been evaluated in the preparation of the financial statements. The following summarizes the significant accounting policies of the Fund:
Investment Valuation. Investments are valued as of 4:00 p.m. Eastern time on the last calendar day of the period. The Board of Trustees (the Board) has delegated the day to day responsibility for the valuation of the Fund's investments to the Fidelity Management & Research Company (FMR) Fair Value Committee (the Committee). In accordance with valuation policies and procedures approved by the Board, the Fund attempts to obtain prices from one or more third party pricing vendors or brokers to value its investments. When current market prices, quotations or currency exchange rates are not readily available or reliable, investments will be fair valued in good faith by the Committee, in accordance with procedures adopted by the Board. Factors used in determining fair value vary by investment type and may include market or investment specific events. The frequency with which these procedures are used cannot be predicted and they may be utilized to a significant extent. The Committee oversees the Fund's valuation policies and procedures and reports to the Board on the Committee's activities and fair value determinations. The Board monitors the appropriateness of the procedures used in valuing the Fund's investments and ratifies the fair value determinations of the Committee.
The Fund categorizes the inputs to valuation techniques used to value its investments into a disclosure hierarchy consisting of three levels as shown below:
Level 1 - quoted prices in active markets for identical investments
Level 2 - other significant observable inputs (including quoted prices for similar investments, interest rates, prepayment speeds, etc.)
Level 3 - unobservable inputs (including the Fund's own assumptions based on the best information available)
Valuation techniques used to value the Fund's investments by major category are as follows:
Equity securities, including restricted securities, for which market quotations are readily available, are valued at the last reported sale price or official closing price as reported by a third party pricing vendor on the primary market or exchange on which they are traded and are categorized as Level 1 in the hierarchy. In the event there were no sales during the day or closing prices are not available, securities are valued at the last quoted bid price or may be valued using the last available price and are generally categorized as Level 2 in the hierarchy. For foreign equity securities, when market or security specific events arise, comparisons to the valuation of American Depositary Receipts (ADRs), futures contracts, Exchange-Traded Funds (ETFs) and certain indexes as well as quoted prices for similar securities may be used and would be categorized as Level 2 in the hierarchy. Utilizing these techniques may result in transfers between Level 1 and Level 2. For equity securities, including restricted securities, where observable inputs are limited, assumptions about market activity and risk are used and these securities may be categorized as Level 3 in the hierarchy.
Annual Report
3. Significant Accounting Policies - continued
Investment Valuation - continued
Investments in open-end mutual funds, including the Fidelity Central Funds, are valued at their closing net asset value (NAV) each business day and are categorized as Level 1 in the hierarchy.
Changes in valuation techniques may result in transfers in or out of an assigned level within the disclosure hierarchy. The aggregate value of investments by input level as of October 31, 2015 is included at the end of the Fund's Schedule of Investments.
Foreign Currency. The Fund may use foreign currency contracts to facilitate transactions in foreign-denominated securities. Gains and losses from these transactions may arise from changes in the value of the foreign currency or if the counterparties do not perform under the contracts' terms.
Foreign-denominated assets, including investment securities, and liabilities are translated into U.S. dollars at the exchange rates at period end. Purchases and sales of investment securities, income and dividends received and expenses denominated in foreign currencies are translated into U.S. dollars at the exchange rate in effect on the transaction date.
The effects of exchange rate fluctuations on investments are included with the net realized and unrealized gain (loss) on investment securities. Other foreign currency transactions resulting in realized and unrealized gain (loss) are disclosed separately.
Investment Transactions and Income. For financial reporting purposes, the Fund's investment holdings and NAV include trades executed through the end of the last business day of the period. The NAV per share for processing shareholder transactions is calculated as of the close of business of the New York Stock Exchange (NYSE), normally 4:00 p.m. Eastern time and includes trades executed through the end of the prior business day. Gains and losses on securities sold are determined on the basis of identified cost. Dividend income is recorded on the ex-dividend date, except for certain dividends from foreign securities where the ex-dividend date may have passed, which are recorded as soon as the Fund is informed of the ex-dividend date. Non-cash dividends included in dividend income, if any, are recorded at the fair market value of the securities received. Income and capital gain distributions from Fidelity Central Funds, if any, are recorded on the ex-dividend date. Investment income is recorded net of foreign taxes withheld where recovery of such taxes is uncertain.
Class Allocations and Expenses. Investment income, realized and unrealized capital gains and losses, common expenses of the Fund, and certain fund-level expense reductions, if any, are allocated daily on a pro-rata basis to each class based on the relative net assets of each class to the total net assets of the Fund. Each class differs with respect to transfer agent and distribution and service plan fees incurred. Certain expense reductions may also differ by class. For the reporting period, the allocated portion of income and expenses to each class as a percent of its average net assets may vary due to the timing of recording these transactions in relation to fluctuating net assets of the classes. Expenses directly attributable to a fund are charged to that fund. Expenses attributable to more than one fund are allocated among the respective funds on the basis of relative net assets or other appropriate methods. Expense estimates are accrued in the period to which they relate and adjustments are made when actual amounts are known.
Income Tax Information and Distributions to Shareholders. Each year, the Fund intends to qualify as a regulated investment company under Subchapter M of the Internal Revenue Code, including distributing substantially all of its taxable income and realized gains. As a result, no provision for U.S. Federal income taxes is required. As of October 31, 2015, the Fund did not have any unrecognized tax benefits in the financial statements; nor is the Fund aware of any tax positions for which it is reasonably possible that the total amounts of unrecognized tax benefits will significantly change in the next twelve months. The Fund files a U.S. federal tax return, in addition to state and local tax returns as required. The Fund's federal income tax returns are subject to examination by the Internal Revenue Service (IRS) for a period of three fiscal years after they are filed. State and local tax returns may be subject to examination for an additional fiscal year depending on the jurisdiction. Foreign taxes are provided for based on the Fund's understanding of the tax rules and rates that exist in the foreign markets in which it invests.
Distributions are declared and recorded on the ex-dividend date. Income dividends and capital gain distributions are declared separately for each class. Income and capital gain distributions are determined in accordance with income tax regulations, which may differ from GAAP.
Capital accounts within the financial statements are adjusted for permanent book-tax differences. These adjustments have no impact on net assets or the results of operations. Capital accounts are not adjusted for temporary book-tax differences which will reverse in a subsequent period.
Book-tax differences are primarily due to foreign currency transactions, passive-foreign investment companies (PFIC), expiring capital loss carryforwards, deferred trustees compensation, capital loss carryforwards and losses deferred due to wash sales.
The federal tax cost of investment securities and unrealized appreciation (depreciation) as of period end were as follows:
Gross unrealized appreciation | $ 49,425,970 |
Gross unrealized depreciation | (44,535,187) |
Net unrealized appreciation (depreciation) on securities | $ 4,890,783 |
Tax Cost | $ 552,793,675 |
Annual Report
Notes to Financial Statements - continued
3. Significant Accounting Policies - continued
Income Tax Information and Distributions to Shareholders - continued
The tax-based components of distributable earnings as of period end were as follows:
Undistributed ordinary income | $ 3,215,209 |
Capital loss carryforward | $ (178,019,200) |
Net unrealized appreciation (depreciation) on securities and other investments | $ 4,872,858 |
Capital loss carryforwards are only available to offset future capital gains of the Fund to the extent provided by regulations and may be limited. Under the Regulated Investment Company Modernization Act of 2010 (the Act), the Fund is permitted to carry forward capital losses incurred in taxable years beginning after December 22, 2010 for an unlimited period and such capital losses are required to be used prior to any losses that expire. The capital loss carryforward information presented below, including any applicable limitation, is estimated as of fiscal period end and is subject to adjustment.
Fiscal year of expiration | |
2016 | $ (3,870,588) |
2017 | (41,604,070) |
2018 | (26,887,863) |
2019 | (98,806,037) |
Total with expiration | (171,168,558) |
No expiration | |
Short-term | (6,850,642) |
Total capital loss carryforward | $ (178,019,200) |
The tax character of distributions paid was as follows:
| October 31, 2015 | October 31, 2014 |
Ordinary Income | $ 3,310,432 | $ 4,963,827 |
Due to large redemptions in a prior period, $141,955,883 of capital losses that will be available to offset future capital gains of the Fund will be limited to approximately $18,885,324 per year.
The Fund acquired $5,487,891 of its capital loss carryforward as part of a merger in a prior period. The losses acquired that will be available to offset future capital gains of the Fund will be limited to approximately $1,371,973 per year.
Short-Term Trading (Redemption) Fees. Shares held by investors in the Fund less than 90 days may have been subject to a redemption fee equal to 1.50% of the NAV of shares redeemed. All redemption fees, which reduce the proceeds of the shareholder redemption, are retained by the Fund and accounted for as an addition to paid in capital.
4. Purchases and Sales of Investments.
Purchases and sales of securities, other than short-term securities, aggregated $242,746,871 and $168,418,077, respectively.
5. Fees and Other Transactions with Affiliates.
Management Fee. Fidelity Management & Research Company (the investment adviser) and its affiliates provide the Fund with investment management related services for which the Fund pays a monthly management fee. The management fee is the sum of an individual fund fee rate that is based on an annual rate of .45% of the Fund's average net assets and an annualized group fee rate that averaged .25% during the period. The group fee rate is based upon the average net assets of all the mutual funds advised by the investment adviser, including any mutual funds previously advised by the investment adviser that are currently advised by Fidelity SelectCo, LLC, an affiliate of the investment adviser. The group fee rate decreases as assets under management increase and increases as assets under management decrease. In addition, the management fee is subject to a performance adjustment (up to a maximum of ± .20% of the Fund's average net assets over a 36 month performance period). The upward or downward adjustment to the management fee is based on the relative investment performance of Japan as compared to its benchmark index, the TOPIX, over the same 36 month performance period. For the reporting period, the total annual management fee rate, including the performance adjustment, was .52% of the Fund's average net assets. The performance adjustment included in the management fee rate may be higher or lower than the maximum performance adjustment rate due to the difference between the average net assets for the reporting and performance periods.
Annual Report
5. Fees and Other Transactions with Affiliates - continued
Distribution and Service Plan Fees. In accordance with Rule 12b-1 of the 1940 Act, the Fund has adopted separate Distribution and Service Plans for each class of shares. Certain classes pay Fidelity Distributors Corporation (FDC), an affiliate of the investment adviser, separate Distribution and Service Fees, each of which is based on an annual percentage of each class' average net assets. In addition, FDC may pay financial intermediaries for selling shares of the Fund and providing shareholder support services. For the period, the Distribution and Service Fee rates, total fees and amounts retained by FDC were as follows:
| Distribution
Fee | Service
Fee | Total Fees | Retained
by FDC |
Class A | -% | .25% | $ 50,273 | $ 1,164 |
Class T | .25% | .25% | 21,808 | 36 |
Class B | .75% | .25% | 4,103 | 3,078 |
Class C | .75% | .25% | 146,651 | 44,718 |
| | | $ 222,835 | $ 48,996 |
Sales Load. FDC may receive a front-end sales charge of up to 5.75% for selling Class A shares and 3.50% for selling Class T shares, some of which is paid to financial intermediaries for selling shares of the Fund. Depending on the holding period, FDC may receive contingent deferred sales charges levied on Class A, Class T, Class B, and Class C redemptions. The deferred sales charges range from 5.00% to 1.00% for Class B shares, 1.00% for Class C shares, 1.00% for certain purchases of Class A shares and .25% for certain purchases of Class T shares.
For the period, sales charge amounts retained by FDC were as follows:
| Retained
by FDC |
Class A | $ 45,946 |
Class T | 1,710 |
Class B A | 8 |
Class C A | 4,518 |
| $ 52,182 |
A When Class B and Class C shares are initially sold, FDC pays commissions from its own resources to financial intermediaries through which the sales are made.
Transfer Agent Fees. Fidelity Investments Institutional Operations Company, Inc., (FIIOC), an affiliate of the investment adviser, is the transfer, dividend disbursing and shareholder servicing agent for each class of the Fund. FIIOC receives account fees and asset-based fees that vary according to the account size and type of account of the shareholders of the respective classes of the Fund. FIIOC pays for typesetting, printing and mailing of shareholder reports, except proxy statements.
For the period, transfer agent fees for each class were as follows:
| Amount | % of
Class-Level Average
Net Assets |
Class A | $ 47,937 | .24 |
Class T | 13,899 | .32 |
Class B | 1,223 | .30 |
Class C | 29,557 | .20 |
Japan | 841,695 | .19 |
Class I | 28,416 | .19 |
| $ 962,727 | |
Accounting and Security Lending Fees. Fidelity Service Company, Inc. (FSC), an affiliate of the investment adviser, maintains the Fund's accounting records. The accounting fee is based on the level of average net assets for each month. Under a separate contract, FSC administers the security lending program. The security lending fee is based on the number and duration of lending transactions.
Annual Report
Notes to Financial Statements - continued
6. Committed Line of Credit.
The Fund participates with other funds managed by the investment adviser or an affiliate in a $4.25 billion credit facility (the "line of credit") to be utilized for temporary or emergency purposes to fund shareholder redemptions or for other short-term liquidity purposes. The Fund has agreed to pay commitment fees on its pro-rata portion of the line of credit, which amounted to $704 and is reflected in Miscellaneous expenses on the Statement of Operations. During the period, the Fund did not borrow on this line of credit.
7. Security Lending.
The Fund lends portfolio securities through a lending agent from time to time in order to earn additional income. For equity securities, a lending agent is used and may loan securities to certain qualified borrowers, including Fidelity Capital Markets (FCM), a broker-dealer affiliated with the Fund. On the settlement date of the loan, the Fund receives collateral (in the form of U.S. Treasury obligations, letters of credit and/or cash) against the loaned securities and maintains collateral in an amount not less than 100% of the market value of the loaned securities during the period of the loan. The market value of the loaned securities is determined at the close of business of the Fund and any additional required collateral is delivered to the Fund on the next business day. The Fund or borrower may terminate the loan at any time, and if the borrower defaults on its obligation to return the securities loaned because of insolvency or other reasons, the Fund may apply collateral received from the borrower against the obligation. The Fund may experience delays and costs in recovering the securities loaned. Any cash collateral received is invested in the Fidelity Securities Lending Cash Central Fund. The value of loaned securities and cash collateral at period end are disclosed on the Fund's Statement of Assets and Liabilities. Security lending income represents the income earned on investing cash collateral, less rebates paid to borrowers and any lending agent fees associated with the loan, plus any premium payments received for lending certain types of securities. Security lending income is presented in the Statement of Operations as a component of income from Fidelity Central Funds. Total security lending income during the period amounted to $71,632. During the period, there were no securities loaned to FCM.
8. Expense Reductions.
Commissions paid to certain brokers with whom the investment adviser, or its affiliates, places trades on behalf of the Fund include an amount in addition to trade execution, which may be rebated back to the Fund to offset certain expenses. This amount totaled $14,341 for the period.
In addition, during the period the investment adviser reimbursed and/or waived a portion of fund-level operating expenses in the amount of $2,192 and a portion of class-level operating expenses as follows:
| Amount |
Class A | $ 400 |
Class T | 8 |
Class B | 1 |
Class C | 278 |
Japan | 11,320 |
Class I | 346 |
| $ 12,353 |
9. Distributions to Shareholders.
Distributions to shareholders of each class were as follows:
Years ended October 31, | 2015 | 2014 |
From net investment income | | |
Class A | $ 79,823 | $ 141,802 |
Class T | - | 19,055 |
Class C | - | 25,435 |
Japan | 3,066,127 | 4,169,355 |
Class I | 164,482 | 205,800 |
Total | $ 3,310,432 | $ 4,561,447 |
From net realized gain | | |
Class A | $ - | $ 15,756 |
Class T | - | 3,988 |
Class C | - | 9,157 |
Japan | - | 357,373 |
Class I | - | 16,106 |
Total | $ - | $ 402,380 |
Annual Report
10. Share Transactions.
Share transactions for each class were as follows and may contain automatic conversions between classes or exchanges between funds:
| Shares | Dollars |
Years ended October 31, | 2015 | 2014 | 2015 | 2014 |
Class A | | | | |
Shares sold | 1,104,408 | 952,008 | $ 13,420,485 | $ 11,244,440 |
Reinvestment of distributions | 6,565 | 11,439 | 74,452 | 136,237 |
Shares redeemed | (929,216) | (840,548) | (10,724,499) | (9,766,930) |
Net increase (decrease) | 181,757 | 122,899 | $ 2,770,438 | $ 1,613,747 |
Class T | | | | |
Shares sold | 180,232 | 64,476 | $ 2,170,519 | $ 752,702 |
Reinvestment of distributions | - | 1,875 | - | 22,328 |
Shares redeemed | (127,640) | (160,810) | (1,490,023) | (1,872,832) |
Net increase (decrease) | 52,592 | (94,459) | $ 680,496 | $ (1,097,802) |
Class B | | | | |
Shares sold | 711 | 818 | $ 8,779 | $ 10,000 |
Shares redeemed | (10,106) | (34,849) | (116,253) | (406,096) |
Net increase (decrease) | (9,395) | (34,031) | $ (107,474) | $ (396,096) |
Class C | | | | |
Shares sold | 747,753 | 496,705 | $ 8,932,993 | $ 5,806,151 |
Reinvestment of distributions | - | 2,168 | - | 25,821 |
Shares redeemed | (312,924) | (351,222) | (3,580,602) | (4,038,883) |
Net increase (decrease) | 434,829 | 147,651 | $ 5,352,391 | $ 1,793,089 |
Japan | | | | |
Shares sold | 18,408,352 | 4,922,211 | $ 225,875,166 | $ 57,652,164 |
Reinvestment of distributions | 262,630 | 370,099 | 2,980,854 | 4,407,882 |
Shares redeemed | (13,426,033) | (9,716,469) | (161,325,584) | (112,632,153) |
Net increase (decrease) | 5,244,949 | (4,424,159) | $ 67,530,436 | $ (50,572,107) |
Class I | | | | |
Shares sold | 1,688,546 | 916,937 | $ 20,578,143 | $ 10,668,831 |
Reinvestment of distributions | 14,222 | 13,570 | 161,134 | 161,488 |
Shares redeemed | (2,263,385) | (862,451) | (26,061,475) | (10,223,896) |
Net increase (decrease) | (560,617) | 68,056 | $ (5,322,198) | $ 606,423 |
11. Other.
The Fund's organizational documents provide former and current trustees and officers with a limited indemnification against liabilities arising in connection with the performance of their duties to the Fund. In the normal course of business, the Fund may also enter into contracts that provide general indemnifications. The Fund's maximum exposure under these arrangements is unknown as this would be dependent on future claims that may be made against the Fund. The risk of material loss from such claims is considered remote.
At the end of the period, Strategic Advisers International Fund was the owner of record of approximately 23% of the total outstanding shares of the Fund. Mutual Funds managed by the investment adviser or its affiliates were the owners of record, in the aggregate, of approximately 53% of the total outstanding shares of the Fund.
Annual Report
To the Trustees of Fidelity Investment Trust and the Shareholders of Fidelity Japan Fund:
In our opinion, the accompanying statement of assets and liabilities, including the schedule of investments, and the related statements of operations and of changes in net assets and the financial highlights present fairly, in all material respects, the financial position of Fidelity Japan Fund (a fund of Fidelity Investment Trust) at October 31, 2015, the results of its operations for the year then ended, the changes in its net assets for each of the two years in the period then ended and the financial highlights for each of the periods indicated, in conformity with accounting principles generally accepted in the United States of America. These financial statements and financial highlights (hereafter referred to as "financial statements") are the responsibility of the Fidelity Japan Fund's management. Our responsibility is to express an opinion on these financial statements based on our audits. We conducted our audits of these financial statements in accordance with the standards of the Public Company Accounting Oversight Board (United States). Those standards require that we plan and perform the audit to obtain reasonable assurance about whether the financial statements are free of material misstatement. An audit includes examining, on a test basis, evidence supporting the amounts and disclosures in the financial statements, assessing the accounting principles used and significant estimates made by management, and evaluating the overall financial statement presentation. We believe that our audits, which included confirmation of securities at October 31, 2015 by correspondence with the custodian and brokers, provide a reasonable basis for our opinion.
PricewaterhouseCoopers LLP
Boston, Massachusetts
December 22, 2015
Annual Report
The Trustees, Member of the Advisory Board, and officers of the trust and fund, as applicable, are listed below. The Board of Trustees governs the fund and is responsible for protecting the interests of shareholders. The Trustees are experienced executives who meet periodically throughout the year to oversee the fund's activities, review contractual arrangements with companies that provide services to the fund, oversee management of the risks associated with such activities and contractual arrangements, and review the fund's performance. Each of the Trustees oversees 170 funds.
The Trustees hold office without limit in time except that (a) any Trustee may resign; (b) any Trustee may be removed by written instrument, signed by at least two-thirds of the number of Trustees prior to such removal; (c) any Trustee who requests to be retired or who has become incapacitated by illness or injury may be retired by written instrument signed by a majority of the other Trustees; and (d) any Trustee may be removed at any special meeting of shareholders by a two-thirds vote of the outstanding voting securities of the trust. Each Trustee who is not an interested person (as defined in the 1940 Act) of the trust and the fund (Independent Trustee), shall retire not later than the last day of the calendar year in which his or her 75th birthday occurs. The Independent Trustees may waive this mandatory retirement age policy with respect to individual Trustees. The officers and Advisory Board Member hold office without limit in time, except that any officer and Advisory Board Member may resign or may be removed by a vote of a majority of the Trustees at any regular meeting or any special meeting of the Trustees. Except as indicated, each individual has held the office shown or other offices in the same company for the past five years.
Experience, Skills, Attributes, and Qualifications of the Fund's Trustees. The Governance and Nominating Committee has adopted a statement of policy that describes the experience, qualifications, attributes, and skills that are necessary and desirable for potential Independent Trustee candidates (Statement of Policy). The Board believes that each Trustee satisfied at the time he or she was initially elected or appointed a Trustee, and continues to satisfy, the standards contemplated by the Statement of Policy. The Governance and Nominating Committee also engages professional search firms to help identify potential Independent Trustee candidates who have the experience, qualifications, attributes, and skills consistent with the Statement of Policy. From time to time, additional criteria based on the composition and skills of the current Independent Trustees, as well as experience or skills that may be appropriate in light of future changes to board composition, business conditions, and regulatory or other developments, have also been considered by the professional search firms and the Governance and Nominating Committee. In addition, the Board takes into account the Trustees' commitment and participation in Board and committee meetings, as well as their leadership of standing and ad hoc committees throughout their tenure.
In determining that a particular Trustee was and continues to be qualified to serve as a Trustee, the Board has considered a variety of criteria, none of which, in isolation, was controlling. The Board believes that, collectively, the Trustees have balanced and diverse experience, qualifications, attributes, and skills, which allow the Board to operate effectively in governing the fund and protecting the interests of shareholders. Information about the specific experience, skills, attributes, and qualifications of each Trustee, which in each case led to the Board's conclusion that the Trustee should serve (or continue to serve) as a trustee of the fund, is provided below.
Board Structure and Oversight Function. James C. Curvey is an interested person (as defined in the 1940 Act) and currently serves as Chairman. The Trustees have determined that an interested Chairman is appropriate and benefits shareholders because an interested Chairman has a personal and professional stake in the quality and continuity of services provided to the fund. Independent Trustees exercise their informed business judgment to appoint an individual of their choosing to serve as Chairman, regardless of whether the Trustee happens to be independent or a member of management. The Independent Trustees have determined that they can act independently and effectively without having an Independent Trustee serve as Chairman and that a key structural component for assuring that they are in a position to do so is for the Independent Trustees to constitute a substantial majority for the Board. The Independent Trustees also regularly meet in executive session. Ned C. Lautenbach serves as Chairman of the Independent Trustees and as such (i) acts as a liaison between the Independent Trustees and management with respect to matters important to the Independent Trustees and (ii) with management prepares agendas for Board meetings.
Fidelity funds are overseen by different Boards of Trustees. The fund's Board oversees Fidelity's high income and certain equity funds, and other Boards oversee Fidelity's investment-grade bond, money market, asset allocation, and sector funds. The asset allocation funds may invest in Fidelity funds overseen by the fund's Board. The use of separate Boards, each with its own committee structure, allows the Trustees of each group of Fidelity funds to focus on the unique issues of the funds they oversee, including common research, investment, and operational issues. On occasion, the separate Boards establish joint committees to address issues of overlapping consequences for the Fidelity funds overseen by each Board.
The Trustees operate using a system of committees to facilitate the timely and efficient consideration of all matters of importance to the Trustees, the fund, and fund shareholders and to facilitate compliance with legal and regulatory requirements and oversight of the fund's activities and associated risks. The Board, acting through its committees, has charged FMR and its affiliates with (i) identifying events or circumstances the occurrence of which could have demonstrably adverse effects on the fund's business and/or reputation; (ii) implementing processes and controls to lessen the possibility that such events or circumstances occur or to mitigate the effects of such events or circumstances if they do occur; and (iii) creating and maintaining a system designed to evaluate continuously business and market conditions in order to facilitate the identification and implementation processes described in (i) and (ii) above. Because the day-to-day operations and activities of the fund are carried out by or through FMR, its affiliates and other service providers, the fund's exposure to risks is mitigated but not eliminated by the processes overseen by the Trustees. While each of the Board's committees has responsibility for overseeing different aspects of the fund's activities, oversight is exercised primarily through the Operations, Audit, and Compliance Committees. In addition, the Independent Trustees have worked with FMR to enhance the Board's oversight of investment and financial risks, legal and regulatory risks, technology risks, and operational risks, including the development of additional risk reporting to the Board. For example, a working group comprised of Independent Trustees and FMR has worked and continues to work to review the Fidelity funds' valuation-related activities, reporting and risk management. Appropriate personnel, including but not limited to the fund's Chief Compliance Officer (CCO), FMR's internal auditor, the independent accountants, the fund's Treasurer and portfolio management personnel, make periodic reports to the Board's committees, as appropriate, including an annual review of Fidelity's risk management program for the Fidelity funds. The responsibilities of each standing committee, including their oversight responsibilities, are described further under "Standing Committees of the Fund's Trustees."
Annual Report
Trustees and Officers - continued
The fund's Statement of Additional Information (SAI) includes more information about the Trustees. To request a free copy, call Fidelity at 1-877-208-0098.
Interested Trustees*:
Correspondence intended for each Trustee who is an interested person may be sent to Fidelity Investments, 245 Summer Street, Boston, Massachusetts 02210.
Name, Year of Birth; Principal Occupations and Other Relevant Experience+ |
James C. Curvey (1935) |
Year of Election or Appointment: 2007 Trustee Chairman of the Board of Trustees |
| Mr. Curvey also serves as Trustee of other Fidelity funds. Mr. Curvey is a Director of Fidelity Research & Analysis Co. (investment adviser firm, 2009-present), and Vice Chairman (2007-present) and Director of FMR LLC (diversified financial services company). In addition, Mr. Curvey serves as an Overseer for the Boston Symphony Orchestra and a member of the board of Artis-Naples, Naples, Florida, and as a Trustee for Brewster Academy, Wolfeboro, New Hampshire. Previously, Mr. Curvey served as a Director of Fidelity Investments Money Management, Inc. (investment adviser firm, 2009-2014) and a Director of FMR and FMR Co., Inc. (investment adviser firms, 2007-2014). |
Charles S. Morrison (1960) |
Year of Election or Appointment: 2014 Trustee |
| Mr. Morrison also serves as Trustee of other funds. He serves as a Director of Fidelity Investments Money Management, Inc. (FIMM) (investment adviser firm, 2014-present), Director of Fidelity SelectCo, LLC (investment adviser firm, 2014-present), President, Asset Management (2014-present), and is an employee of Fidelity Investments. Previously, Mr. Morrison served as Vice President of Fidelity's Fixed Income and Asset Allocation Funds (2012-2014), President, Fixed Income (2011-2014), Vice President of Fidelity's Money Market Funds (2005-2009), President, Money Market Group Leader of FMR (investment adviser firm, 2009), and Senior Vice President, Money Market Group of FMR (2004-2009). Mr. Morrison also served as Vice President of Fidelity's Bond Funds (2002-2005), certain Balanced Funds (2002-2005), and certain Asset Allocation Funds (2002-2007), and as Senior Vice President (2002-2005) of Fidelity's Bond Division. |
* Trustees have been determined to be "Interested Trustees" by virtue of, among other things, their affiliation with the trust or various entities under common control with FMR.
+ The information above includes each Trustee's principal occupation during the last five years and other information relating to the experience, attributes, and skills relevant to each Trustee's qualifications to serve as a Trustee, which led to the conclusion that each Trustee should serve as a Trustee for the fund.
Annual Report
Independent Trustees:
Correspondence intended for each Independent Trustee (that is, the Trustees other than the Interested Trustees) may be sent to Fidelity Investments, P.O. Box 55235, Boston, Massachusetts 02205-5235.
Name, Year of Birth; Principal Occupations and Other Relevant Experience+ |
Dennis J. Dirks (1948) |
Year of Election or Appointment: 2005 Trustee |
| Mr. Dirks also serves as Trustee of other Fidelity funds. Prior to his retirement in May 2003, Mr. Dirks was Chief Operating Officer and a member of the Board of The Depository Trust & Clearing Corporation (DTCC). He also served as President, Chief Operating Officer, and Board member of The Depository Trust Company (DTC) and President and Board member of the National Securities Clearing Corporation (NSCC). In addition, Mr. Dirks served as Chief Executive Officer and Board member of the Government Securities Clearing Corporation, Chief Executive Officer and Board member of the Mortgage-Backed Securities Clearing Corporation, as a Trustee and a member of the Finance Committee of Manhattan College (2005-2008), as a Trustee and a member of the Finance Committee of AHRC of Nassau County (2006-2008), and as a member of the Independent Directors Council (IDC) Governing Council (2010-2015). Mr. Dirks is a member of the Board of Directors for The Brookville Center for Children's Services, Inc. (2009-present). |
Alan J. Lacy (1953) |
Year of Election or Appointment: 2008 Trustee |
| Mr. Lacy also serves as Trustee of other Fidelity funds. Mr. Lacy serves as a member of the Board of Directors of Dave & Buster's Entertainment, Inc. (restaurant and entertainment complexes, 2010-present) and Bristol-Myers Squibb Company (global pharmaceuticals, 2008-present). In addition, Mr. Lacy served as Senior Adviser (2007-2014) of Oak Hill Capital Partners, L.P. (private equity) and also served as Chief Executive Officer (2000-2005) and Vice Chairman (2005-2006) of Sears Holdings Corporation and Sears, Roebuck and Co. (retail). Mr. Lacy is a member of the Board of Trustees of The National Parks Conservation Association (2006-present). Previously, Mr. Lacy served as Chairman of the Board of Trustees of the National Parks Conservation Association (2008-2011) and as a member of the Board of Directors for The Western Union Company (global money transfer, 2006-2011), The Hillman Companies, Inc. (hardware wholesalers, 2010-2014), and Earth Fare, Inc. (retail grocery, 2010-2014). |
Ned C. Lautenbach (1944) |
Year of Election or Appointment: 2000 Trustee Chairman of the Independent Trustees |
| Mr. Lautenbach also serves as Trustee of other Fidelity funds. Mr. Lautenbach currently serves as the Lead Director of the Eaton Corporation Board of Directors (diversified industrial, 1997-present). Mr. Lautenbach is Chairman of the Board of Directors of Artis-Naples in Naples, Florida (2012-present), a member of the Council on Foreign Relations (1994-present), and a member of the Board of Governors, State University System of Florida (2013-present). Previously, Mr. Lautenbach was a Partner/Advisory Partner at Clayton, Dubilier & Rice, LLC (private equity investment, 1998-2010), as well as a Director of Sony Corporation (2006-2007). |
Joseph Mauriello (1944) |
Year of Election or Appointment: 2008 Trustee |
| Mr. Mauriello also serves as Trustee of other Fidelity funds. Prior to his retirement in January 2006, Mr. Mauriello served in numerous senior management positions including Deputy Chairman and Chief Operating Officer (2004-2005), and Vice Chairman of Financial Services (2002-2004) of KPMG LLP US (professional services, 1965-2005). Mr. Mauriello currently serves as a member of the Board of Directors of XL Group plc. (global insurance and re-insurance, 2006-present) and the Independent Directors Council (IDC) Governing Council (2015-present). Previously, Mr. Mauriello served as a Director of the Hamilton Funds of the Bank of New York (2006-2007) and of Arcadia Resources Inc. (health care services and products, 2007-2012). |
Robert W. Selander (1950) |
Year of Election or Appointment: 2011 Trustee |
| Mr. Selander also serves as Trustee of other Fidelity funds. Mr. Selander serves as a Director of The Western Union Company (global money transfer, 2014-present). Previously, Mr. Selander served as a Member of the Advisory Board of other Fidelity funds (2011), and Executive Vice Chairman (2010), Chief Executive Officer (2009-2010), and President and Chief Executive Officer (1997-2009) of Mastercard, Inc. |
Cornelia M. Small (1944) |
Year of Election or Appointment: 2005 Trustee |
| Ms. Small also serves as Trustee of other Fidelity funds. Ms. Small is a member of the Board of Directors (2009-present) and Chair of the Investment Committee (2010-present) of the Teagle Foundation. Ms. Small also serves on the Investment Committee of the Berkshire Taconic Community Foundation (2008-present). Previously, Ms. Small served as Chairperson (2002-2008) and a member of the Investment Committee and Chairperson (2008-2012) and a member of the Board of Trustees of Smith College. In addition, Ms. Small served as Chief Investment Officer, Director of Global Equity Investments, and a member of the Board of Directors of Scudder, Stevens & Clark and Scudder Kemper Investments. |
William S. Stavropoulos (1939) |
Year of Election or Appointment: 2001 Trustee Vice Chairman of the Independent Trustees |
| Mr. Stavropoulos also serves as Trustee of other Fidelity funds. Mr. Stavropoulos serves as President and Founder of the Michigan Baseball Foundation, the Great Lakes Loons (2007-present). Mr. Stavropoulos is Chairman Emeritus of the Board of Directors of The Dow Chemical Company, where he previously served in numerous senior management positions, including President, CEO (1995-2000; 2002-2004), Chairman of the Executive Committee (2000-2006), and as a member of the Board of Directors (1990-2006). Currently, Mr. Stavropoulos is Chairman of the Board of Directors of Univar Inc. (global distributor of commodity and specialty chemicals), a Director of Teradata Corporation (data warehousing and technology solutions), and Maersk Inc. (industrial conglomerate), and a member of the Advisory Board for Metalmark Capital LLC (private equity investment, 2005-present). Mr. Stavropoulos is an operating advisor to Clayton, Dubilier & Rice, LLC (private equity investment). In addition, Mr. Stavropoulos is a member of the University of Notre Dame Advisory Council for the College of Science, a Trustee of the Rollin L. Gerstacker Foundation, and a Director of the Naples Philharmonic Center for the Arts. Previously, Mr. Stavropoulos served as a Director of Chemical Financial Corporation (bank holding company, 1993-2012) and Tyco International, Ltd. (multinational manufacturing and services, 2007-2012). |
David M. Thomas (1949) |
Year of Election or Appointment: 2008 Trustee |
| Mr. Thomas also serves as Trustee of other Fidelity funds. Mr. Thomas serves as Non-Executive Chairman of the Board of Directors of Fortune Brands Home and Security (home and security products, 2011-present), as a member of the Board of Directors (2004-present) and Presiding Director (2013-present) of Interpublic Group of Companies, Inc. (marketing communication), and as a member of the Board of Trustees of the University of Florida (2013-present). Previously, Mr. Thomas served as Executive Chairman (2005-2006) and Chairman and Chief Executive Officer (2000-2005) of IMS Health, Inc. (pharmaceutical and healthcare information solutions), and a Director of Fortune Brands, Inc. (consumer products, 2000-2011). |
+ The information above includes each Trustee's principal occupation during the last five years and other information relating to the experience, attributes, and skills relevant to each Trustee's qualifications to serve as a Trustee, which led to the conclusion that each Trustee should serve as a Trustee for the fund.
Advisory Board Member and Officers:
Correspondence intended for each officer and Peter S. Lynch may be sent to Fidelity Investments, 245 Summer Street, Boston, Massachusetts 02210. Officers appear below in alphabetical order.
Name, Year of Birth; Principal Occupation |
Peter S. Lynch (1944) |
Year of Election or Appointment: 2003 Member of the Advisory Board |
| Mr. Lynch also serves as Member of the Advisory Board of other Fidelity funds. Mr. Lynch is Vice Chairman and a Director of FMR (investment adviser firm) and FMR Co., Inc. (investment adviser firm). In addition, Mr. Lynch serves as a Trustee of Boston College and as the Chairman of the Inner-City Scholarship Fund. Previously, Mr. Lynch served on the Special Olympics International Board of Directors (1997-2006). |
Elizabeth Paige Baumann (1968) |
Year of Election or Appointment: 2012 Anti-Money Laundering (AML) Officer |
| Ms. Baumann also serves as AML Officer of other funds. She is Chief AML Officer of FMR LLC (diversified financial services company, 2012-present) and is an employee of Fidelity Investments. Previously, Ms. Baumann served as Vice President and Deputy Anti-Money Laundering Officer (2007-2012). |
Marc R. Bryant (1966) |
Year of Election or Appointment: 2015 Secretary and Chief Legal Officer (CLO) |
| Mr. Bryant also serves as Secretary and CLO of other funds. Mr. Bryant serves as CLO, Secretary, and Senior Vice President of Fidelity Management & Research Company (investment adviser firm, 2015-present) and FMR Co., Inc. (investment adviser firm, 2015-present); Secretary of Fidelity SelectCo, LLC (investment adviser firm, 2015-present) and Fidelity Investments Money Management, Inc. (investment adviser firm, 2015-present); and CLO of Fidelity Management & Research (Hong Kong) Limited (investment adviser firm, 2015-present). He is Senior Vice President and Deputy General Counsel of FMR LLC (diversified financial services company). Previously, Mr. Bryant served as Secretary and Chief Legal Officer of Fidelity Rutland Square Trust II (2010-2014) and Assistant Secretary of Fidelity's Fixed Income and Asset Allocation Funds (2013-2015). Prior to joining Fidelity Investments, Mr. Bryant served as a Senior Vice President and the Head of Global Retail Legal for AllianceBernstein L.P. (2006-2010), and as the General Counsel for ProFund Advisors LLC (2001-2006). |
William C. Coffey (1969) |
Year of Election or Appointment: 2009 Assistant Secretary |
| Mr. Coffey also serves as Assistant Secretary of other funds. He is Senior Vice President and Deputy General Counsel of FMR LLC (diversified financial services company, 2010-present), and is an employee of Fidelity Investments. Previously, Mr. Coffey served as Vice President and Associate General Counsel of FMR LLC (2005-2009). |
Timothy M. Cohen (1969) |
Year of Election or Appointment: 2014 Vice President of certain Equity Funds |
| Mr. Cohen also serves as Vice President of other funds. Mr. Cohen serves as Chief Compliance Officer of FMR Investment Management (U.K.) Limited (investment adviser firm, 2013-present) and is an employee of Fidelity Investments. Previously, Mr. Cohen served as a Director of FMR Investment Management (U.K.) Limited (2013-2015). |
Jonathan Davis (1968) |
Year of Election or Appointment: 2010 Assistant Treasurer |
| Mr. Davis also serves as Assistant Treasurer of other funds, and is an employee of Fidelity Investments. Previously, Mr. Davis served as Vice President and Associate General Counsel of FMR LLC (diversified financial services company, 2003-2010). |
Adrien E. Deberghes (1967) |
Year of Election or Appointment: 2008 Deputy Treasurer |
| Mr. Deberghes also serves as an officer of other funds. He is an employee of Fidelity Investments (2008-present). Prior to joining Fidelity Investments, Mr. Deberghes was Senior Vice President of Mutual Fund Administration at State Street Corporation (2007-2008), Senior Director of Mutual Fund Administration at Investors Bank & Trust (2005-2007), and Director of Finance for Dunkin' Brands (2000-2005). |
Stephanie J. Dorsey (1969) |
Year of Election or Appointment: 2010 Assistant Treasurer |
| Ms. Dorsey also serves as an officer of other funds. She is an employee of Fidelity Investments (2008-present) and has served in other fund officer roles. Prior to joining Fidelity Investments, Ms. Dorsey served as Treasurer (2004-2008) of the JPMorgan Mutual Funds and Vice President (2004-2008) of JPMorgan Chase Bank. |
Howard J. Galligan III (1966) |
Year of Election or Appointment: 2014 Chief Financial Officer |
| Mr. Galligan also serves as Chief Financial Officer of other funds. Mr. Galligan serves as President of Fidelity Pricing and Cash Management Services (FPCMS) (2014-present) and as a Director of Strategic Advisers, Inc. (investment adviser firm, 2008-present). Previously, Mr. Galligan served as Chief Administrative Officer of Asset Management (2011-2014) and Chief Operating Officer and Senior Vice President of Investment Support for Strategic Advisers, Inc. (2003-2011). |
Scott C. Goebel (1968) |
Year of Election or Appointment: 2015 Vice President |
| Mr. Goebel serves as Vice President of other funds and is an employee of Fidelity Investments (2001-present). Previously, Mr. Goebel served as Secretary of Fidelity SelectCo, LLC (investment adviser firm, 2013-2015), Fidelity Investments Money Management, Inc. (FIMM) (investment adviser firm, 2010-2015), and Fidelity Research and Analysis Company (FRAC) (investment adviser firm, 2010-2015); General Counsel, Secretary, and Senior Vice President of Fidelity Management & Research Company (investment adviser firm, 2008-2015) and FMR Co., Inc. (investment adviser firm, 2008-2015); Assistant Secretary of Fidelity Management & Research (Japan) Limited (investment adviser firm, 2008-2015) and FMR Investment Management (U.K.) Limited (investment adviser firm, 2008-2015); Chief Legal Officer (CLO) of Fidelity Management & Research (Hong Kong) Limited (investment adviser firm, 2008-2015); Secretary and CLO of certain Fidelity funds (2008-2015); Assistant Secretary of FIMM (2008-2010), FRAC (2008-2010), and certain funds (2007-2008); and as Vice President and Secretary of Fidelity Distributors Corporation (FDC) (2005-2007). |
Brian B. Hogan (1964) |
Year of Election or Appointment: 2009 Vice President |
| Mr. Hogan also serves as Trustee or Vice President of other funds. Mr. Hogan serves as a Director of Fidelity SelectCo, LLC (investment adviser firm, 2014-present) and President of the Equity Division of FMR (investment adviser firm, 2009-present). Previously, Mr. Hogan served as Senior Vice President, Equity Research of FMR (2006-2009) and as a portfolio manager. |
Chris Maher (1972) |
Year of Election or Appointment: 2013 Assistant Treasurer |
| Mr. Maher serves as Assistant Treasurer of other funds. Mr. Maher is Vice President of Valuation Oversight and is an employee of Fidelity Investments. Previously, Mr. Maher served as Vice President of Asset Management Compliance (2013), Vice President of the Program Management Group of FMR (investment adviser firm, 2010-2013), and Vice President of Valuation Oversight (2008-2010). |
Kenneth B. Robins (1969) |
Year of Election or Appointment: 2008 President and Treasurer |
| Mr. Robins also serves as an officer of other funds. Mr. Robins serves as Executive Vice President of Fidelity Investments Money Management, Inc. (FIMM) (investment adviser firm, 2013-present) and is an employee of Fidelity Investments (2004-present). Previously, Mr. Robins served in other fund officer roles. |
Stacie M. Smith (1974) |
Year of Election or Appointment: 2013 Deputy Treasurer |
| Ms. Smith also serves as an officer of other funds. She is an employee of Fidelity Investments (2009-present) and has served in other fund officer roles. Prior to joining Fidelity Investments, Ms. Smith served as Senior Audit Manager of Ernst & Young LLP (1996-2009). |
Renee Stagnone (1975) |
Year of Election or Appointment: 2013 Deputy Treasurer |
| Ms. Stagnone also serves as Deputy Treasurer of other funds. Ms. Stagnone is an employee of Fidelity Investments (1997-present). |
Linda J. Wondrack (1964) |
Year of Election or Appointment: 2014 Chief Compliance Officer |
| Ms. Wondrack also serves as Chief Compliance Officer of other funds. Ms. Wondrack is Executive Vice President and head of the Ethics Office and Asset Management Compliance for Fidelity Investments (2012-present). Ms. Wondrack also serves as Chief Compliance Officer of Fidelity SelectCo, LLC (investment adviser firm, 2014-present); Chief Compliance Officer of Impresa Management LLC (2013-present); and Chief Compliance Officer of FMR Co., Inc. (investment adviser firm), Fidelity Investments Money Management, Inc. (investment adviser firm), Fidelity Management & Research (Japan) Limited (investment adviser firm), FMR Investment Management (U.K.) Limited (investment adviser firm), Fidelity Management & Research (Hong Kong) (investment adviser firm), Fidelity Management & Research Company (investment adviser firm), FIAM LLC (investment adviser firm), and Strategic Advisers, Inc. (investment adviser firm), Ballyrock Investment Advisors LLC, and Northern Neck Investors LLC (2012-present). Previously, Ms. Wondrack served as Senior Vice President and Chief Compliance Officer for Columbia Management Investment Advisers, LLC (2005-2012); Chief Compliance Officer for certain funds within the Columbia Family of Funds (2007-2012); and Senior Vice President of Compliance Risk Management at Bank of America (2005-2010). |
Joseph F. Zambello (1957) |
Year of Election or Appointment: 2011 Deputy Treasurer |
| Mr. Zambello also serves as Deputy Treasurer of other funds. Mr. Zambello is an employee of Fidelity Investments (1991-present). Previously, Mr. Zambello served as Vice President of the Program Management Group of FMR (investment adviser firm, 2009-2011) and Vice President of the Transfer Agent Oversight Group (2005-2009). |
Annual Report
The Board of Trustees of Fidelity Japan Fund voted to pay to shareholders of record at the opening of business on record date, the following distributions per share derived from capital gains realized from sales of portfolio securities, and dividends derived from net investment income:
| Pay Date | Record Date | Dividends | Capital Gains |
Class I | 12/07/15 | 12/04/15 | $0.065 | $0.006 |
Class I designates 100% of the dividends distributed during the fiscal year as amounts which may be taken into account as a dividend for the purposes of the maximum rate under section 1(h)(11) of the Internal Revenue Code.
The amounts per share which represent income derived from sources within, and taxes paid to, foreign countries or possessions of the United States are as follows:
| Pay Date | Income | Taxes |
Class I | 12/08/14 | $0.1193 | $0.0263 |
The fund will notify shareholders in January 2016 of amounts for use in preparing 2015 income tax returns.
Annual Report
Fidelity Japan Fund
Each year, the Board of Trustees, including the Independent Trustees (together, the Board), votes on the renewal of the management contract with Fidelity Management & Research Company (FMR) and the sub-advisory agreements (together, the Advisory Contracts) for the fund. The Board, assisted by the advice of fund counsel and Independent Trustees' counsel, requests and considers a broad range of information relevant to the renewal of the Advisory Contracts throughout the year.
The Board meets regularly and, at each of its meetings, covers an extensive agenda of topics and materials and considers factors that are relevant to its annual consideration of the renewal of the fund's Advisory Contracts, including the services and support provided to the fund and its shareholders. The Board has established various standing committees (Committees), each composed of and chaired by Independent Trustees with varying backgrounds, to which the Board has assigned specific subject matter responsibilities in order to enhance effective decision-making by the Board. The Board, acting directly and through its Committees, requests and receives information concerning the annual consideration of the renewal of the fund's Advisory Contracts. The Board also meets as needed to consider matters specifically related to the Board's annual consideration of the renewal of the Advisory Contracts. Members of the Board may also meet with trustees of other Fidelity funds through ad hoc joint committees to discuss certain matters relevant to all of the Fidelity funds.
At its July 2015 meeting, the Board unanimously determined to renew the fund's Advisory Contracts. In reaching its determination, the Board considered all factors it believed relevant, including (i) the nature, extent, and quality of the services to be provided to the fund and its shareholders (including the investment performance of the fund); (ii) the competitiveness of the fund's management fee and total expense ratio relative to peer funds; (iii) the total costs of the services to be provided by and the profits to be realized by Fidelity from its relationship with the fund; and (iv) the extent to which (if any) economies of scale exist and would be realized as the fund grows, and whether any economies of scale are appropriately shared with fund shareholders.
In considering whether to renew the Advisory Contracts for the fund, the Board reached a determination, with the assistance of fund counsel and Independent Trustees' counsel and through the exercise of its business judgment, that the renewal of the Advisory Contracts was in the best interests of the fund and its shareholders and that the compensation payable under the Advisory Contracts was fair and reasonable. The Board's decision to renew the Advisory Contracts was not based on any single factor, but rather was based on a comprehensive consideration of all the information provided to the Board at its meetings throughout the year. The Board, in reaching its determination to renew the Advisory Contracts, was aware that shareholders of the fund have a broad range of investment choices available to them, including a wide choice among funds offered by Fidelity's competitors, and that the fund's shareholders, who have the opportunity to review and weigh the disclosure provided by the fund in its prospectus and other public disclosures, have chosen to invest in this fund, which is part of the Fidelity family of funds.
Nature, Extent, and Quality of Services Provided. The Board considered Fidelity's staffing as it relates to the fund, including the backgrounds of investment personnel of Fidelity, and also considered the fund's investment objective, strategies, and related investment philosophy. The Independent Trustees also had discussions with senior management of Fidelity's investment operations and investment groups. The Board considered the structure of the portfolio manager compensation program and whether this structure provides appropriate incentives to act in the best interests of the fund. Additionally, the Board considered the portfolio managers' investments, if any, in the funds that they manage.
Resources Dedicated to Investment Management and Support Services. The Board and the Fund Oversight and Research Committees reviewed the general qualifications and capabilities of Fidelity's investment staff, including its size, education, experience, and resources, as well as Fidelity's approach to recruiting, training, managing, and compensating investment personnel. The Board noted that Fidelity has continued to increase the resources devoted to non-U.S. offices, including expansion of Fidelity's global investment organization. The Board also noted that Fidelity's analysts have extensive resources, tools and capabilities that allow them to conduct sophisticated quantitative and fundamental analysis, as well as credit analysis of issuers, counterparties and guarantors. Further, the Board considered that Fidelity's investment professionals have sufficient access to global information and data so as to provide competitive investment results over time, and that those professionals also have access to sophisticated tools that permit them to assess portfolio construction and risk and performance attribution characteristics continuously, as well as to transmit new information and research conclusions rapidly around the world. Additionally, in its deliberations, the Board considered Fidelity's trading, risk management, and compliance capabilities and resources, which are integral parts of the investment management process.
Shareholder and Administrative Services. The Board considered (i) the nature, extent, quality, and cost of advisory, administrative, and shareholder services performed by FMR, the sub-advisers (together with FMR, the Investment Advisers), and their affiliates under the Advisory Contracts and under separate agreements covering transfer agency, pricing and bookkeeping, and securities lending services for the fund; (ii) the nature and extent of the supervision of third party service providers, principally custodians and subcustodians; and (iii) the resources devoted to, and the record of compliance with, the fund's compliance policies and procedures. The Board also reviewed the allocation of fund brokerage, including allocations to brokers affiliated with the Investment Advisers, the use of brokerage commissions to pay fund expenses, and the use of "soft" commission dollars to pay for research services.
Annual Report
Board Approval of Investment Advisory Contracts and Management Fees - continued
The Board noted that the growth of fund assets over time across the complex allows Fidelity to reinvest in the development of services designed to enhance the value or convenience of the Fidelity funds as investment vehicles. These services include 24-hour access to account information and market information through telephone representatives and over the Internet, investor education materials and asset allocation tools, and the expanded availability of Fidelity Investor Centers.
In 2014, the Board formed an ad hoc Committee on Transfer Agency Fees to review the variety of transfer agency fee structures throughout the industry and Fidelity's competitive positioning with respect to industry participants.
Investment in a Large Fund Family. The Board considered the benefits to shareholders of investing in a Fidelity fund, including the benefits of investing in a fund that is part of a large family of funds offering a variety of investment disciplines and providing a large variety of mutual fund investor services. The Board noted that Fidelity had taken, or had made recommendations that resulted in the Fidelity funds taking, a number of actions over the previous year that benefited particular funds, including (i) continuing to dedicate additional resources to investment research and to the support of the senior management team that oversees asset management; (ii) continuing efforts to enhance Fidelity's global research capabilities; (iii) launching new funds and making other enhancements to meet client needs; (iv) reducing management fees and total expenses for certain index funds and diversified international funds; (v) continuing to launch dedicated lower cost underlying funds to meet portfolio construction needs related to expanding underlying fund options for Fidelity funds of funds, specifically for the Freedom Fund product lines; (vi) rationalizing product lines and gaining increased efficiencies through fund mergers; (vii) launching active fixed-income exchange-traded funds; (viii) continuing to develop, acquire and implement systems and technology to improve services to the funds and information security and to increase efficiency; (ix) implementing investment enhancements to further strengthen Fidelity's target date product line to increase investors' probability of success in achieving their goals; (x) modifying the eligibility criteria for certain share classes to accommodate roll-over assets from employer-sponsored retirement plans; (xi) launching a new Class W of the Freedom Index Funds to attract and retain Fidelity record-kept retirement plan assets; and (xii) implementing changes to Fidelity's money market product line in response to recent money market regulatory reforms.
Investment Performance. The Board considered whether the fund has operated in accordance with its investment objective, as well as its record of compliance with its investment restrictions and its performance history. The Board noted that there was a portfolio management change for the fund in March 2014.
The Board took into account discussions with representatives of the Investment Advisers about fund investment performance that occur at Board meetings throughout the year. In this regard the Board noted that as part of regularly scheduled fund reviews and other reports to the Board on fund performance, the Board considers annualized return information for the fund, for different time periods, measured against a securities market index ("benchmark index") and a peer group of funds with similar objectives ("peer group"), if any. In its evaluation of fund investment performance, the Board gave particular attention to information indicating changes in performance of certain Fidelity funds for specific time periods and discussed with the Investment Advisers the reasons for any overperformance or underperformance.
In addition to reviewing absolute and relative fund performance, the Independent Trustees periodically consider the appropriateness of fund performance metrics in evaluating the results achieved. In general, the Independent Trustees believe that fund performance should be evaluated based on net performance (after fees and expenses) of both the highest performing and lowest performing fund share classes, where applicable, compared to appropriate benchmark indices, over appropriate time periods that may include full market cycles, and compared to peer groups, as applicable, over the same periods, taking into account relevant factors including the following: general market conditions; issuer-specific information; and fund cash flows and other factors.
The Independent Trustees recognize that shareholders evaluate performance on a net basis over their own holding periods, for which one-, three-, and five-year periods are often used as a proxy. For this reason, the performance information reviewed by the Board also included net cumulative calendar year total return information for the fund and an appropriate benchmark index and peer group for the most recent one-, three-, and five-year periods, as shown below. Returns are shown compared to the 25th percentile (top of box, 75% beaten) and 75th percentile (bottom of box, 25% beaten) of the peer universe.
Annual Report
Fidelity Japan Fund
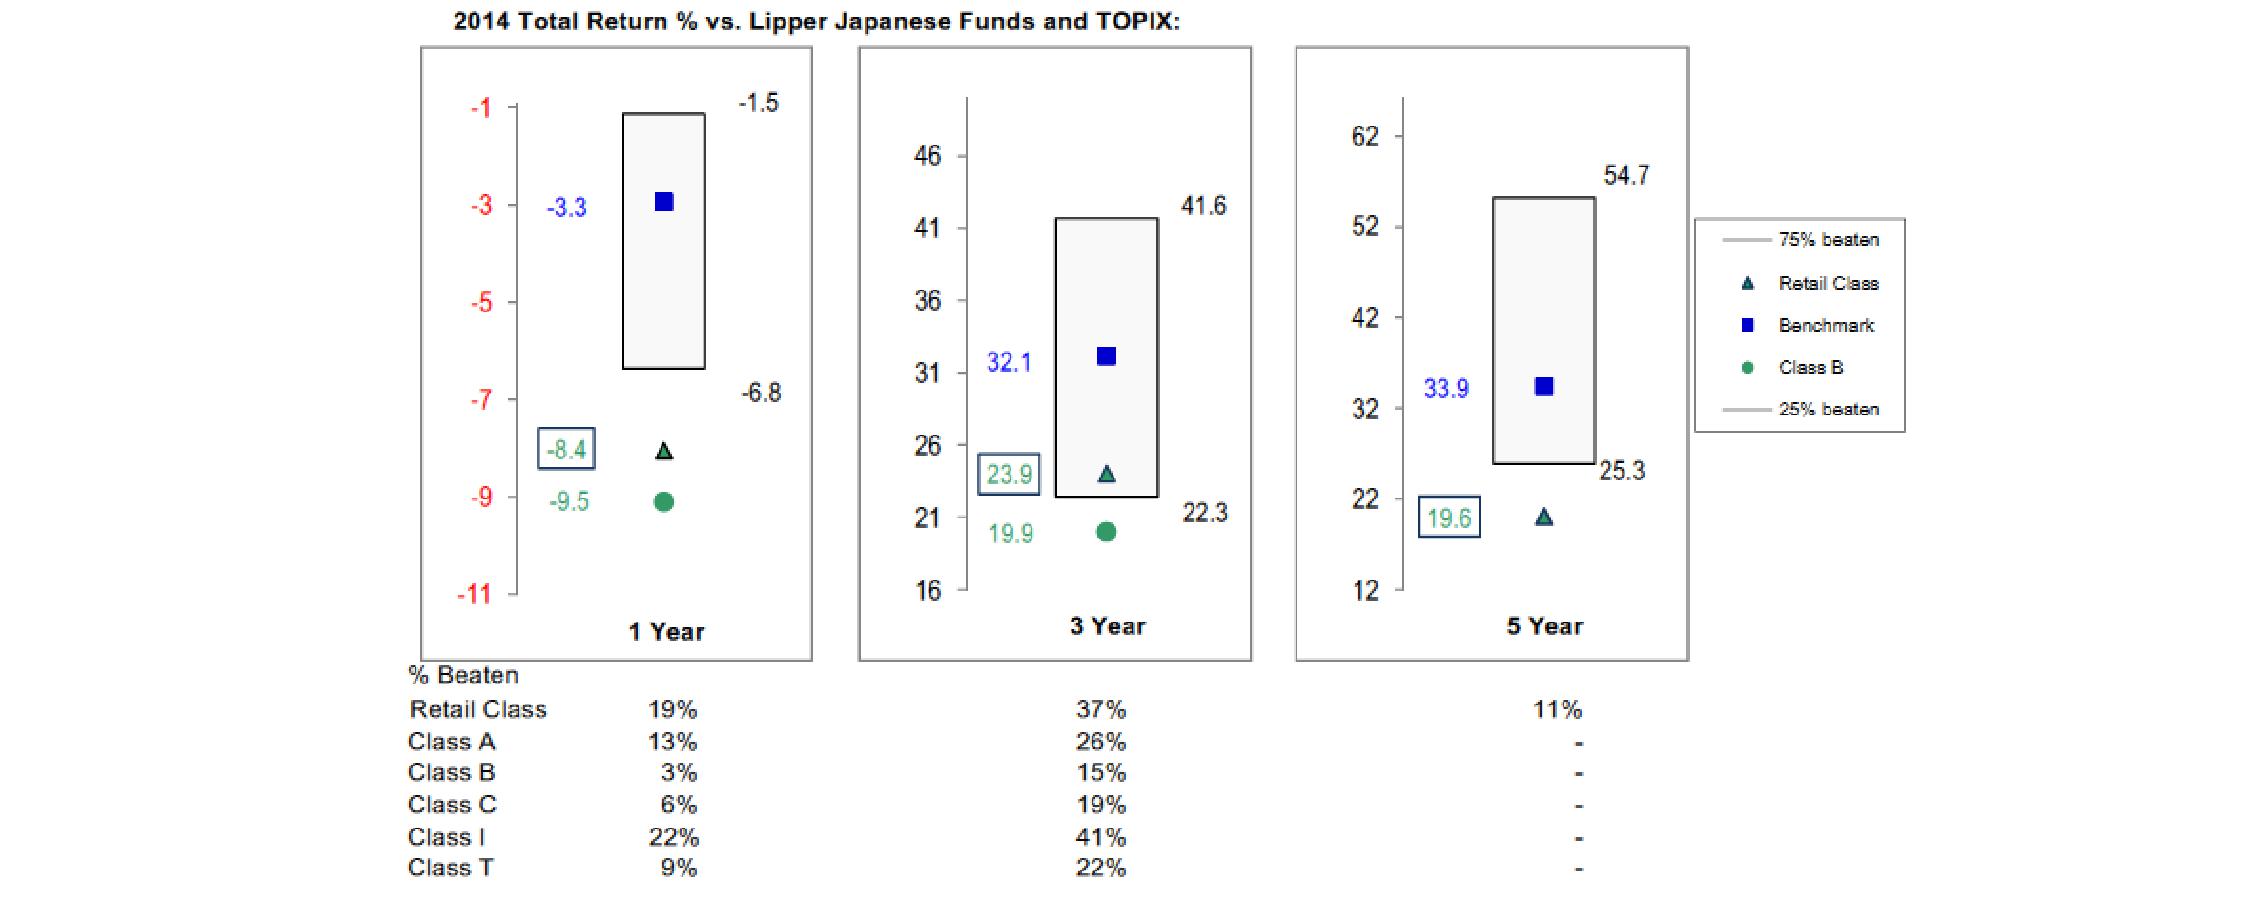
The Board has discussed the fund's underperformance with FMR and has engaged with FMR to consider what steps might be taken to remediate the fund's underperformance.
The Board also considered that the fund's management fee is subject to upward or downward adjustment depending upon whether, and to what extent, the fund's investment performance for the performance period exceeds, or is exceeded by, a securities index, thus leading to a performance adjustment for the same period. The Board noted that the performance adjustment provides FMR with a strong economic incentive to seek to achieve superior performance for the fund's shareholders and helps to more closely align the interests of FMR and the shareholders of the fund.
Based on its review, the Board concluded that the nature, extent, and quality of services provided to the fund under the Advisory Contracts should benefit the shareholders of the fund.
Competitiveness of Management Fee and Total Expense Ratio. The Board considered the fund's management fee and total expense ratio compared to "mapped groups" of competitive funds and classes created for the purpose of facilitating the Trustees' competitive analysis of management fees and total expenses. Fidelity creates "mapped groups" by combining similar Lipper investment objective categories that have comparable investment mandates. Combining Lipper investment objective categories aids the Board's management fee and total expense ratio comparisons by broadening the competitive group used for comparison.
Management Fee. The Board considered two proprietary management fee comparisons for the 12-month periods shown in basis points (BP) in the chart below. The group of Lipper funds used by the Board for management fee comparisons is referred to below as the "Total Mapped Group." The Total Mapped Group is broader than the Lipper peer group used by the Board for performance comparisons because the Total Mapped Group combines several Lipper investment objective categories while the Lipper peer group does not. The Total Mapped Group comparison focuses on a fund's standing in terms of gross management fees before expense reimbursements or caps, and without giving effect to the fund's performance adjustment, relative to the total universe of funds with comparable investment mandates, regardless of whether their management fee structures also are comparable. Funds with comparable investment mandates offer exposure to similar types of securities. Funds with comparable management fee structures have similar management fee contractual arrangements (e.g., flat rate charged for advisory services, all-inclusive fee rate, etc.). "TMG %" represents the percentage of funds in the Total Mapped Group that had management fees that were lower than the fund's. For example, a hypothetical TMG % of 20% would mean that 80% of the funds in the Total Mapped Group had higher, and 20% had lower, management fees than the fund. The fund's actual TMG %s and the number of funds in the Total Mapped Group are in the chart below. The "Asset-Size Peer Group" (ASPG) comparison focuses on a fund's standing relative to a subset of non-Fidelity funds within the Total Mapped Group that are similar in size and management fee structure without taking into account performance adjustments, if any. For example, if a fund is in the first quartile of the ASPG, the fund's management fee ranks in the least expensive or lowest 25% of funds in the ASPG. The ASPG represents at least 15% of the funds in the Total Mapped Group with comparable asset size and management fee structures, subject to a minimum of 50 funds (or all funds in the Total Mapped Group if fewer than 50). Additional information, such as the ASPG quartile in which the fund's management fee rate ranked and the impact of the fund's performance adjustment, is also included in the chart and considered by the Board.
Annual Report
Board Approval of Investment Advisory Contracts and Management Fees - continued
Fidelity Japan Fund

The Board noted that the fund's management fee rate ranked below the median of its Total Mapped Group and below the median of its ASPG for 2014. The Board also noted the effect of the fund's performance adjustment, if any, on the fund's management fee ranking.
The Board noted that, in 2014, the ad hoc Committee on Group Fee was formed by it and other Fidelity fund boards to conduct an in-depth review of the "group fee" component of the management fee of funds with such management fee structures. Committee focus included the mechanics of the group fee, the competitive landscape of group fee structures, Fidelity funds with no group fee component and investment products not included in group fee assets. The Board also considered that, for funds subject to the group fee, FMR agreed to voluntarily waive fees over a specified period of time in amounts designed to account for assets converted from certain funds to certain collective investment trusts.
The Board also noted that, in 2013, the ad hoc Committee on Management Fees was formed to conduct an in-depth review of the management fee rates of Fidelity's active equity mutual funds. The Committee focused on the following areas: (i) standard fee structures; (ii) research consumption and trading evolution; (iii) management fee competitiveness/profitability by category; and (iv) factors that drive institutional pricing.
Based on its review, the Board concluded that the fund's management fee is fair and reasonable in light of the services that the fund receives and the other factors considered.
Total Expense Ratio. In its review of each class's total expense ratio, the Board considered the fund's management fee as well as other fund or class expenses, as applicable, such as transfer agent fees, pricing and bookkeeping fees, fund-paid 12b-1 fees, and custodial, legal, and audit fees. The Board noted the impact of the fund's performance adjustment. The Board also noted that Fidelity may agree to waive fees and expenses from time to time, and the extent to which, if any, it has done so for the fund. As part of its review, the Board also considered the current and historical total expense ratios of each class of the fund compared to competitive fund median expenses. Each class of the fund is compared to those funds and classes in the Total Mapped Group (used by the Board for management fee comparisons) that have a similar sales load structure.
The Board noted that the total expense ratio of each of Class A, Class B, Class C, Class I, and the retail class ranked below its competitive median for 2014 and the total expense ratio of Class T ranked above its competitive median for 2014. The Board considered that, in general, various factors can affect total expense ratios. The Board noted that the total expense ratio of Class T was above the competitive median primarily because of higher 12b-1 fees on Class T as compared to most competitor funds. Class T has a higher 12b-1 fee, but a lower front-end sales charge, than traditionally priced front-end sales charge classes. The Board considered that Class T is primarily sold load-waived in the retirement plan market where its 0.50% 12b-1 fee is comparable to competing no-load, higher 12b-1 fee classes designed specifically for retirement plans. The Board noted that the fund offers multiple classes, each of which has a different sales load and 12b-1 fee structure, and that the multiple structures are intended to offer a range of pricing options for the intermediary market. The Board also noted that the total expense ratios of the classes vary primarily by the level of their 12b-1 fees, although differences in transfer agent fees may also cause expenses to vary from class to class.
Fees Charged to Other Fidelity Clients. The Board also considered Fidelity fee structures and other information with respect to clients of Fidelity, such as other funds advised or subadvised by Fidelity, pension plan clients, and other institutional clients with similar mandates. The Board noted the findings of the 2013 ad hoc joint committee (created with the board of other Fidelity funds), which reviewed and compared Fidelity's institutional investment advisory business with its business of providing services to the Fidelity funds, including the differences in services provided, fees charged, and costs incurred, as well as competition in their respective marketplaces.
Annual Report
Based on its review of total expense ratios and fees charged to other Fidelity clients, the Board concluded that, although Class T was above the median of the universe presented for comparison, the total expense ratio of each class of the fund was reasonable in light of the services that the fund and its shareholders receive and the other factors considered.
Costs of the Services and Profitability. The Board considered the revenues earned and the expenses incurred by Fidelity in conducting the business of developing, marketing, distributing, managing, administering and servicing the fund and servicing the fund's shareholders. The Board also considered the level of Fidelity's profits in respect of all the Fidelity funds.
On an annual basis, Fidelity presents to the Board information about the profitability of its relationship with the fund. Fidelity calculates profitability information for each fund, as well as aggregate profitability information for groups of Fidelity funds and all Fidelity funds, using a series of detailed revenue and cost allocation methodologies which originate with the books and records of Fidelity on which Fidelity's audited financial statements are based. The Audit Committee of the Board reviews any significant changes from the prior year's methodologies.
PricewaterhouseCoopers LLP (PwC), independent registered public accounting firm and auditor to Fidelity and certain Fidelity funds, has been engaged annually by the Board as part of the Board's assessment of Fidelity's profitability analysis. PwC's engagement includes the review and assessment of the methodologies used by Fidelity in determining the revenues and expenses attributable to Fidelity's mutual fund business, and completion of agreed-upon procedures in respect of the mathematical accuracy of fund profitability and its conformity to established allocation methodologies. After considering PwC's reports issued under the engagement and information provided by Fidelity, the Board concluded that while other allocation methods may also be reasonable, Fidelity's profitability methodologies are reasonable in all material respects.
The Board also reviewed Fidelity's non-fund businesses and fall-out benefits related to the mutual fund business as well as cases where Fidelity's affiliates may benefit from or be related to the fund's business.
The Board considered the costs of the services provided by and the profits realized by Fidelity in connection with the operation of the fund and was satisfied that the profitability was not excessive.
Economies of Scale. The Board considered whether there have been economies of scale in respect of the management of the Fidelity funds, whether the Fidelity funds (including the fund) have appropriately benefited from any such economies of scale, and whether there is potential for realization of any further economies of scale. The Board considered the extent to which the fund will benefit from economies of scale as assets grow through increased services to the fund, through waivers or reimbursements, or through fee or expense ratio reductions. The Board also noted that in 2013, it and the boards of other Fidelity funds created an ad hoc committee (the Economies of Scale Committee) to analyze whether Fidelity attains economies of scale in respect of the management and servicing of the Fidelity funds, whether the Fidelity funds have appropriately benefited from such economies of scale, and whether there is potential for realization of any further economies of scale.
The Board recognized that the fund's management contract incorporates a "group fee" structure, which provides for lower group fee rates as total group assets increase, and for higher group fee rates as total group assets decrease (with "group assets" defined to include fund assets under FMR's management plus sector fund assets previously under FMR's management and currently managed by Fidelity SelectCo, LLC). FMR calculates the group fee rates based on a tiered asset "breakpoint" schedule that varies based on asset class. The Board considered that the group fee is designed to deliver the benefits of economies of scale to fund shareholders when total Fidelity fund assets increase, even if assets of any particular fund are unchanged or have declined, because some portion of Fidelity's costs are attributable to services provided to all Fidelity funds, and all funds benefit if those costs can be allocated among more assets. The Board concluded that, given the group fee structure, fund shareholders will benefit from lower management fees as group assets increase at the fund complex level, regardless of whether Fidelity achieves any such economies of scale.
The Board concluded, taking into account the analysis of the Economies of Scale Committee, that economies of scale, if any, are being appropriately shared between fund shareholders and Fidelity.
Additional Information Requested by the Board. In order to develop fully the factual basis for consideration of the Fidelity funds' Advisory Contracts, the Board requested and received additional information on certain topics, including: (i) fund performance trends and Fidelity's long-term strategies for certain funds; (ii) the various share classes employed by Fidelity and the attributes of each class, together with similar information on the distribution and servicing payments made by Fidelity or the funds to third-party participants in the distribution channels; (iii) fund profitability, and fund performance in relation to fund profitability; (iv) the methodology with respect to evaluating competitive fund data and peer group classifications and fee comparisons; (v) annual fund profitability margins, with particular focus on certain funds with negative margins; (vi) the realization of fall-out benefits in certain Fidelity business units; (vii) economies of scale and the way in which they are shared with fund shareholders; (viii) Fidelity's group fee structures, including the group fee schedule of breakpoints; (ix) the impact of cost containment measures on the funds; and (x) the transfer agent fee structure.
Based on its evaluation of all of the conclusions noted above, and after considering all factors it believed relevant, the Board concluded that the advisory fee structures are fair and reasonable, and that the fund's Advisory Contracts should be renewed.
Annual Report
Investment Adviser
Fidelity Management & Research Company
Boston, MA
Investment Sub-Advisers
FMR Co., Inc.
FMR Investment Management
(U.K.) Limited
Fidelity Management & Research
(Hong Kong) Limited
Fidelity Management & Research
(Japan) Limited
FIL Investment Advisors
FIL Investments (Japan) Limited
FIL Investment Advisors (UK) Limited
General Distributor
Fidelity Distributors Corporation
Smithfield, RI
Transfer and Service Agents
Fidelity Investments Institutional Operations Company, Inc.
Boston, MA
Fidelity Service Company, Inc.
Boston, MA
Custodian
JPMorgan Chase Bank
New York, NY
(Fidelity Investment logo)(registered trademark)
AJPNI-UANN-1215
1.917380.104
ContentsPerformance: The Bottom LineManagement's Discussion of Fund PerformanceShareholder Expense ExampleInvestment Changes (Unaudited)Investments October 31, 2015Financial StatementsNotes to Financial StatementsReport of Independent Registered Public Accounting FirmTrustees and OfficersDistributions (Unaudited)Board Approval of Investment Advisory Contracts and Management FeesContentsPerformance: The Bottom LineManagement's Discussion of Fund PerformanceShareholder Expense ExampleInvestment Changes (Unaudited)Investments October 31, 2015Financial StatementsNotes to Financial StatementsReport of Independent Registered Public Accounting FirmTrustees and OfficersDistributions (Unaudited)Board Approval of Investment Advisory Contracts and Management Fees
Fidelity Advisor®
Latin America Fund -
Class A, Class T, Class B, and Class C
Annual Report
October 31, 2015
(Fidelity Cover Art)
Class A, Class T, Class B, and Class C are
classes of Fidelity® Latin America Fund
Contents
Performance | 3 | How the fund has done over time. |
Management's Discussion of Fund Performance | 3 | The Portfolio Manager's review of fund performance and strategy. |
Shareholder Expense Example | 3 | An example of shareholder expenses. |
Investment Changes | 4 | A summary of major shifts in the fund's investments over the past six months. |
Investments | 5 | A complete list of the fund's investments with their market values. |
Financial Statements | 9 | Statements of assets and liabilities, operations, and changes in net assets, as well as financial highlights. |
Notes | 19 | Notes to the financial statements. |
Report of Independent Registered Public Accounting Firm | 26 | |
Trustees and Officers | 26 | |
Distributions | 33 | |
Board Approval of Investment Advisory Contracts and Management Fees | 33 | |
To view a fund's proxy voting guidelines and proxy voting record for the 12-month period ended June 30, visit http://www.fidelity.com/proxyvotingresults or visit the Securities and Exchange Commission's (SEC) web site at http://www.sec.gov. You may also call 1-877-208-0098 to request a free copy of the proxy voting guidelines.
Standard & Poor's, S&P and S&P 500 are registered service marks of The McGraw-Hill Companies, Inc. and have been licensed for use by Fidelity Distributors Corporation.
Other third-party marks appearing herein are the property of their respective owners.
All other marks appearing herein are registered or unregistered trademarks or service marks of FMR LLC or an affiliated company. © 2015 FMR LLC. All rights reserved.
This report and the financial statements contained herein are submitted for the general information of the shareholders of the fund. This report is not authorized for distribution to prospective investors in the fund unless preceded or accompanied by an effective prospectus.
A fund files its complete schedule of portfolio holdings with the SEC for the first and third quarters of each fiscal year on Form N-Q. Forms N-Q are available on the SEC's web site at http://www.sec.gov. A fund's Forms N-Q may be reviewed and copied at the SEC's Public Reference Room in Washington, DC. Information regarding the operation of the SEC's Public Reference Room may be obtained by calling 1-800-SEC-0330. For a complete list of a fund's portfolio holdings, view the most recent holdings listing, semiannual report, or annual report on Fidelity's web site at http://www.fidelity.com, http://www.advisor.fidelity.com, or http://www.401k.com, as applicable.
NOT FDIC INSURED • MAY LOSE VALUE • NO BANK GUARANTEE
Neither the fund nor Fidelity Distributors Corporation is a bank.
Annual Report
Performance: The Bottom Line
Average annual total return reflects the change in the value of an investment, assuming reinvestment of the class' distributions from dividend income and capital gains (the profits earned upon the sale of securities that have grown in value, if any) and assuming a constant rate of performance each year. The $10,000 table and the fund's returns do not reflect the deduction of taxes that a shareholder would pay on fund distributions or the redemption of fund shares. During periods of reimbursement by Fidelity, a fund's total return will be greater than it would be had the reimbursement not occurred. How a fund did yesterday is no guarantee of how it will do tomorrow.
Average Annual Total Returns
Periods ended October 31, 2015 | Past 1
year | Past 5
years | Past 10
years |
Class A (incl. 5.75% sales charge ) A | -38.36% | -15.00% | 0.05% |
Class T (incl. 3.50% sales charge) B | -37.07% | -14.82% | 0.15% |
Class B (incl. contingent deferred sales charge) C | -38.09% | -14.87% | 0.26% |
Class C (incl. contingent deferred sales charge) D | -35.68% | -14.62% | 0.26% |
A Class A shares bear a 0.25% 12b-1 fee. The initial offering of Class A shares took place on September 28, 2010. Returns prior to September 28, 2010 are those of Fidelity® Latin America Fund, the original class of the fund, which has no 12b-1 fee. Had Class A's 12b-1 fee been reflected, returns prior to September 28, 2010, would have been lower.
B Class T shares bear a 0.50% 12b-1 fee. The initial offering of Class T shares took place on September 28, 2010. Returns prior to September 28, 2010 are those of Fidelity® Latin America Fund, the original class of the fund, which has no 12b-1 fee. Had Class T's 12b-1 fee been reflected, returns prior to September 28, 2010, would have been lower.
C Class B shares bear a 1.00% 12b-1 fee. The initial offering of Class B shares took place on September 28, 2010. Returns prior to September 28, 2010 are those of Fidelity Latin America Fund, the original class of the fund, which has no 12b-1 fee. Had Class B's 12b-1 fee been reflected, returns prior to September 28, 2010, would have been lower. Class B shares' contingent deferred sales charges included in the past one year, past five years, and past ten years total return figures are 5%, 2%, and 0%, respectively.
D Class C shares bear a 1.00% 12b-1 fee. The initial offering of Class C shares took place on September 28, 2010. Returns prior to September 28, 2010 are those of Fidelity Latin America Fund, the original class of the fund, which has no 12b-1 fee. Had Class C's 12b-1 fee been reflected, returns prior to September 28, 2010, would have been lower. Class C shares' contingent deferred sales charges included in the past one year, past five years, and past ten years total return figures are 1%, 0%, and 0%, respectively.
$10,000 Over 10 Years
Let's say hypothetically that $10,000 was invested in Fidelity Advisor® Latin America Fund - Class A on October 31, 2005, and the current 5.75% sales charge was paid. The chart shows how the value of your investment would have changed, and also shows how the MSCI EM (Emerging Markets) Latin America Index performed over the same period. See footnote A above for additional information regarding the performance ofClass A.
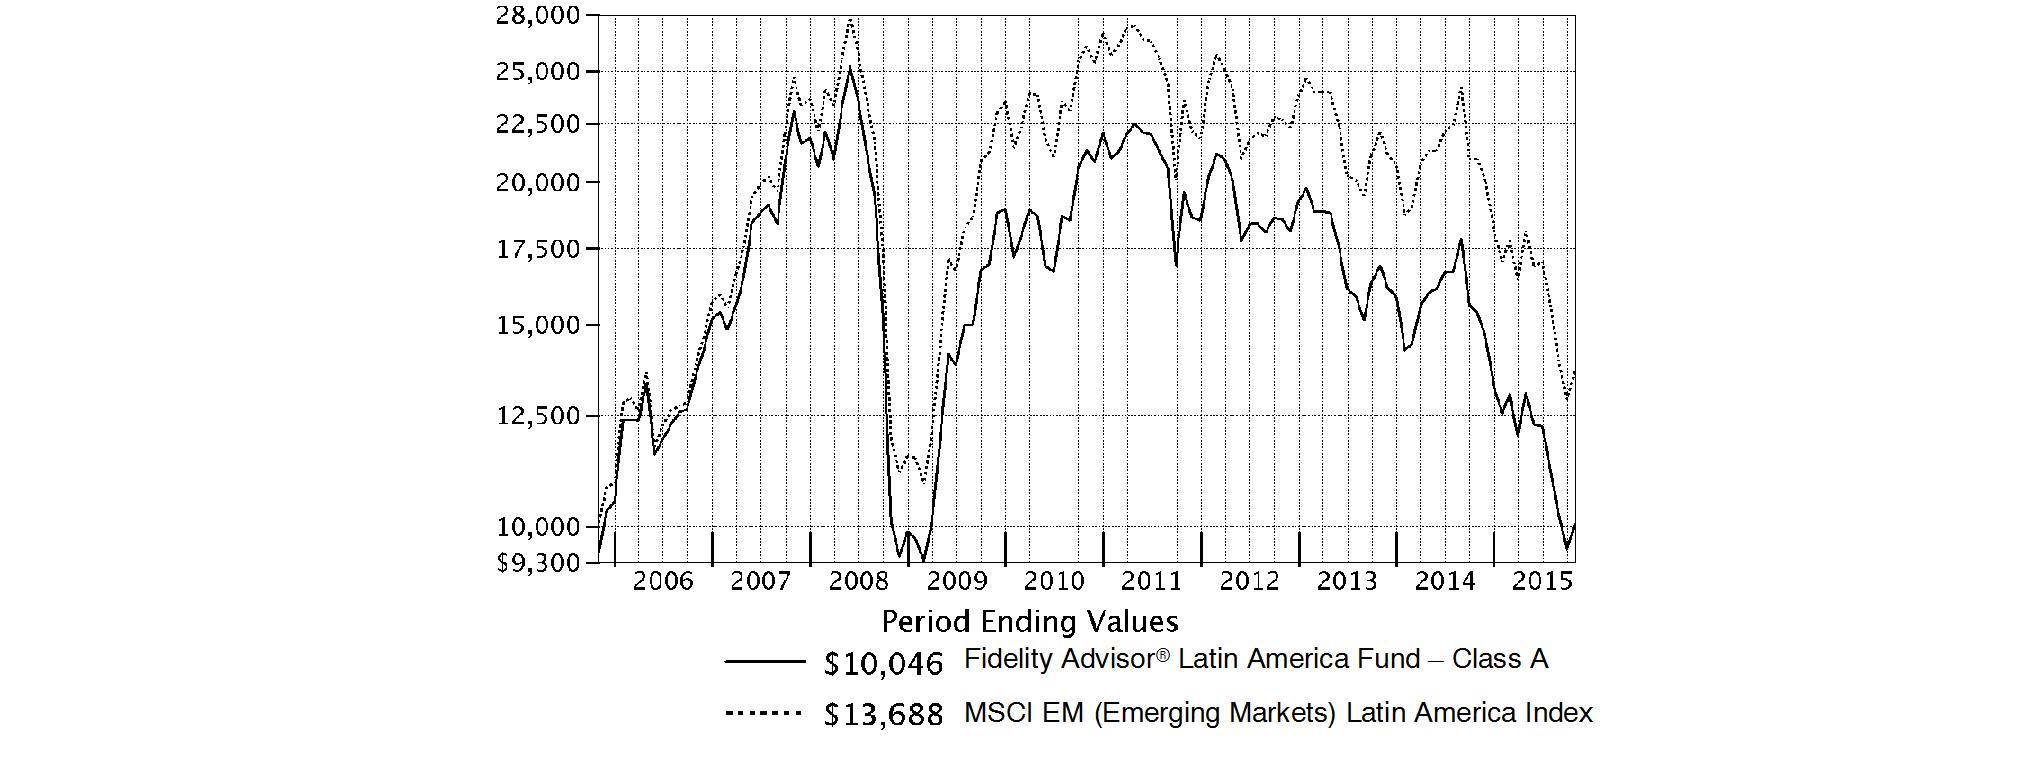
Annual Report
Fidelity Latin America Fund
Management's Discussion of Fund Performance
Market Recap: International equities suffered a moderate setback for the 12 months ending October 31, 2015, held back by a collapse in commodities prices that hurt resources-related sectors and geographies. The MSCI ACWI (All Country World Index) ex USA Index returned -4.55% for the period, affected also by concerns about global economic growth. Commodity producers remained under pressure for much of the past year, largely related to economic deceleration in China (-1%), the world's second-largest economy and a leading consumer of raw materials. This effect was exacerbated by U.S. dollar strength relative to global currencies, which weighed on commodities priced in dollars and acutely impacted equity returns within regions most exposed to resources prices. The emerging-markets group, for example, returned about -15% this period. Canada, a significant energy producer, returned roughly -17%. Net energy consumer Japan (+9%) was the best-performing region by far. Only about a quarter of the nearly 50 index countries managed a gain this period: Ireland (+19%) - the EU's fastest-growing economy - and Israel (+17%) proved top performers; Greece (-56%) and Brazil (-46%), among the worst. As for sectors, energy (-25%) and materials (-16%) declined sharply, whereas the two consumer sectors each gained about 6%.
Comments from Lead Portfolio Manager Adam Kutas: For the year, the fund's share classes (excluding sales charges, if applicable) posted double-digit negative results, roughly in line with the -34.64% return of the benchmark MSCI EM (Emerging Markets) Latin America Index. Lower commodity prices weighed heavily on the region's oil-rich countries, including Mexico, Columbia and Brazil. The fund's top individual contributor versus the benchmark was Chile-based beverage producer Compania Cervecerias Unidas. A sizable stake in one of the fastest-growing convenience store chains, Fomento Economico Mexicano, was another notable contributor. I viewed it as a good defensive company that could grow even in a tough economic environment, which was exactly what happened. On the downside, the biggest detractor was Companhia Brasileira de Distri (CBD), a Brazilian company with exposure to supermarkets and a stake in a consumer technology retail chain. Avoiding Grupo Financiero Banorte, one of Mexico's largest banks and a benchmark component, also proved detrimental.
Note to shareholders: Will Pruett was named Co-Portfolio Manager of the fund, effective October 1, 2015, joining Lead Portfolio Manager Adam Kutas.
The views expressed above reflect those of the portfolio manager(s) only through the end of the period as stated on the cover of this report and do not necessarily represent the views of Fidelity or any other person in the Fidelity organization. Any such views are subject to change at any time based upon market or other conditions and Fidelity disclaims any responsibility to update such views. These views may not be relied on as investment advice and, because investment decisions for a Fidelity fund are based on numerous factors, may not be relied on as an indication of trading intent on behalf of any Fidelity fund.
Annual Report
Fidelity Latin America Fund
Shareholder Expense Example
As a shareholder of the Fund, you incur two types of costs: (1) transaction costs, including sales charges (loads) on purchase payments or redemption proceeds, redemption fees and (2) ongoing costs, including management fees, distribution and/or service (12b-1) fees and other Fund expenses. This Example is intended to help you understand your ongoing costs (in dollars) of investing in the Fund and to compare these costs with the ongoing costs of investing in other mutual funds.
The Example is based on an investment of $1,000 invested at the beginning of the period and held for the entire period (May 1, 2015 to October 31, 2015).
Actual Expenses
The first line of the accompanying table for each class of the Fund provides information about actual account values and actual expenses. You may use the information in this line, together with the amount you invested, to estimate the expenses that you paid over the period. Simply divide your account value by $1,000.00 (for example, an $8,600 account value divided by $1,000.00 = 8.6), then multiply the result by the number in the first line for a class of the Fund under the heading entitled "Expenses Paid During Period" to estimate the expenses you paid on your account during this period. A small balance maintenance fee of $12.00 that is charged once a year may apply for certain accounts with a value of less than $2,000. This fee is not included in the table below. If it was, the estimate of expenses you paid during the period would be higher, and your ending account value lower, by this amount. In addition, the Fund, as a shareholder in the underlying Fidelity Central Funds, will indirectly bear its pro-rata share of the fees and expenses incurred by the underlying Fidelity Central Funds. These fees and expenses are not included in the Fund's annualized expense ratio used to calculate the expense estimate in the table below.
Hypothetical Example for Comparison Purposes
The second line of the accompanying table for each class of the Fund provides information about hypothetical account values and hypothetical expenses based on a Class' actual expense ratio and an assumed rate of return of 5% per year before expenses, which is not the Class' actual return. The hypothetical account values and expenses may not be used to estimate the actual ending account balance or expenses you paid for the period. You may use this information to compare the ongoing costs of investing in the Fund and other funds. To do so, compare this 5% hypothetical example with the 5% hypothetical examples that appear in the shareholder reports of the other funds. A small balance maintenance fee of $12.00 that is charged once a year may apply for certain accounts with a value of less than $2,000. This fee is not included in the table below. If it was, the estimate of expenses you paid during the period would be higher, and your ending account value lower, by this amount. In addition, the Fund, as a shareholder in the underlying Fidelity Central Funds, will indirectly bear its pro-rata share of the fees and expenses incurred by the underlying Fidelity Central Funds. These fees and expenses are not included in the Fund's annualized expense ratio used to calculate the expense estimate in the table below.
Please note that the expenses shown in the table are meant to highlight your ongoing costs only and do not reflect any transaction costs. Therefore, the second line of the table is useful in comparing ongoing costs only, and will not help you determine the relative total costs of owning different funds. In addition, if these transactional costs were included, your costs would have been higher.
| Annualized
Expense Ratio B | Beginning
Account Value
May 1, 2015 | Ending
Account Value
October 31, 2015 | Expenses Paid
During Period C
May 1, 2015
to October 31, 2015 |
Class A | 1.40% | | | |
Actual | | $ 1,000.00 | $ 768.50 | $ 6.24 |
HypotheticalA | | $ 1,000.00 | $ 1,018.15 | $ 7.12 |
Class T | 1.67% | | | |
Actual | | $ 1,000.00 | $ 767.40 | $ 7.44 |
HypotheticalA | | $ 1,000.00 | $ 1,016.79 | $ 8.49 |
Class B | 2.14% | | | |
Actual | | $ 1,000.00 | $ 765.40 | $ 9.52 |
HypotheticalA | | $ 1,000.00 | $ 1,014.42 | $ 10.87 |
Class C | 2.15% | | | |
Actual | | $ 1,000.00 | $ 765.50 | $ 9.57 |
HypotheticalA | | $ 1,000.00 | $ 1,014.37 | $ 10.92 |
Latin America | 1.13% | | | |
Actual | | $ 1,000.00 | $ 769.00 | $ 5.04 |
HypotheticalA | | $ 1,000.00 | $ 1,019.51 | $ 5.75 |
Class I | 1.07% | | | |
Actual | | $ 1,000.00 | $ 769.40 | $ 4.77 |
HypotheticalA | | $ 1,000.00 | $ 1,019.81 | $ 5.45 |
A 5% return per year before expenses
B Annualized expense ratio reflects expenses net of applicable fee waivers.
C Expenses are equal to each Class' annualized expense ratio, multiplied by the average account value over the period, multiplied by 184/365 (to reflect the one-half year period).
Annual Report
Fidelity Latin America Fund
Investment Changes (Unaudited)
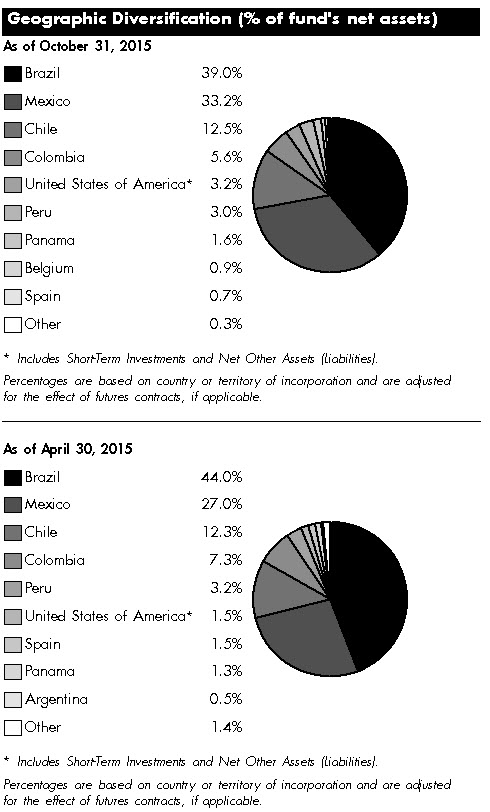
Asset Allocation as of October 31, 2015 |
| % of fund's
net assets | % of fund's net assets
6 months ago |
Stocks | 97.2 | 99.1 |
Short-Term Investments and Net Other Assets (Liabilities) | 2.8 | 0.9 |
Top Ten Stocks as of October 31, 2015 |
| % of fund's
net assets | % of fund's net assets
6 months ago |
America Movil S.A.B. de CV Series L (Mexico, Wireless Telecommunication Services) | 6.4 | 6.6 |
Ambev SA sponsored ADR (Brazil, Beverages) | 6.1 | 6.1 |
Fomento Economico Mexicano S.A.B. de CV (Mexico, Beverages) | 5.5 | 4.1 |
Itau Unibanco Holding SA (Brazil, Banks) | 4.7 | 6.5 |
Wal-Mart de Mexico SA de CV Series V (Mexico, Food & Staples Retailing) | 4.4 | 2.7 |
Grupo Financiero Inbursa S.A.B. de CV Series O (Mexico, Banks) | 2.8 | 2.3 |
Grupo de Inversiones Suramerica SA (Colombia, Diversified Financial Services) | 2.3 | 2.5 |
Banco Bradesco SA (PN) (Brazil, Banks) | 2.0 | 3.1 |
Grupo Televisa SA de CV (Mexico, Media) | 1.9 | 1.6 |
Petroleo Brasileiro SA - Petrobras (PN) (non-vtg.) (Brazil, Oil, Gas & Consumable Fuels) | 1.8 | 3.3 |
| 37.9 | |
Market Sectors as of October 31, 2015 |
| % of fund's
net assets | % of fund's net assets
6 months ago |
Consumer Staples | 28.0 | 23.8 |
Financials | 26.9 | 30.3 |
Telecommunication Services | 8.5 | 9.9 |
Consumer Discretionary | 8.1 | 7.7 |
Materials | 7.8 | 7.4 |
Industrials | 5.8 | 6.7 |
Energy | 5.0 | 7.3 |
Utilities | 4.6 | 3.4 |
Health Care | 1.4 | 0.7 |
Information Technology | 1.1 | 1.9 |
Market Sectors may include more than one industry category. |
The fund may invest up to 35% of its total assets in any industry that represents more than 20% of the Latin American market. As of October 31, 2015, the fund did not have more than 25% of its total assets invested in any one industry. |
Annual Report
Fidelity Latin America Fund
Investments October 31, 2015
Showing Percentage of Net Assets
Common Stocks - 77.6% |
| Shares | | Value |
Belgium - 0.9% |
Euronav NV | 226,900 | | $ 3,352,175 |
Euronav NV | 80,600 | | 1,205,776 |
TOTAL BELGIUM | | 4,557,951 |
Brazil - 20.5% |
Banco Bradesco SA | 185,580 | | 1,127,950 |
BB Seguridade Participacoes SA | 772,600 | | 5,328,898 |
BM&F BOVESPA SA | 2,767,900 | | 8,181,940 |
Brasil Brokers Participacoes SA | 2,701,800 | | 1,050,862 |
Brasil Foods SA | 156,300 | | 2,435,760 |
CCR SA | 2,052,300 | | 6,449,774 |
Cielo SA | 577,440 | | 5,481,604 |
Companhia de Saneamento Basico do Estado de Sao Paulo (SABESP) | 1,700,000 | | 7,379,134 |
Cyrela Brazil Realty SA | 287,300 | | 667,490 |
Equatorial Energia SA | 566,900 | | 5,055,215 |
Fibria Celulose SA | 578,700 | | 7,898,969 |
FPC Par Corretora de Seguros | 1,272,700 | | 3,560,808 |
Hypermarcas SA (a) | 1,021,400 | | 4,634,842 |
Industrias Romi SA | 3,235,900 | | 1,485,147 |
Itausa-Investimentos Itau SA | 7 | | 14 |
M. Dias Branco SA | 515,600 | | 9,345,254 |
MAHLE Metal Leve SA | 424,300 | | 2,575,583 |
Multiplus SA | 778,100 | | 6,928,460 |
Ouro Fino Saude Animal LTDA | 176,200 | | 1,576,253 |
Petroleo Brasileiro SA - Petrobras (ON) (a) | 3,237,328 | | 7,873,912 |
Porto Seguro SA | 365,400 | | 3,063,199 |
QGEP Participacoes SA (a) | 2,477,700 | | 3,829,094 |
TIM Participacoes SA | 1,707,595 | | 3,741,473 |
Vale SA | 1,064,100 | | 4,707,198 |
TOTAL BRAZIL | | 104,378,833 |
Canada - 0.3% |
Tahoe Resources, Inc. | 209,434 | | 1,749,021 |
Chile - 11.7% |
Aguas Andinas SA | 9,955,798 | | 5,208,025 |
Banco de Chile | 76,030,132 | | 8,037,832 |
Banmedica SA | 1,523,867 | | 2,490,015 |
Colbun SA | 21,984,938 | | 5,849,510 |
Compania Cervecerias Unidas SA | 782,126 | | 9,357,351 |
CorpBanca SA | 630,371,201 | | 5,783,682 |
Empresa Nacional de Telecomunicaciones SA (ENTEL) | 297,791 | | 2,755,886 |
Forus SA | 705,249 | | 2,039,618 |
Inversiones La Construccion SA | 753,300 | | 8,561,836 |
S.A.C.I. Falabella | 576,071 | | 3,873,516 |
Sociedad Matriz SAAM SA | 60,278,930 | | 3,928,525 |
Vina San Pedro SA | 238,206,744 | | 1,877,960 |
TOTAL CHILE | | 59,763,756 |
|
| Shares | | Value |
Colombia - 5.3% |
Bolsa de Valores de Colombia | 334,500,111 | | $ 1,905,161 |
Cemex Latam Holdings SA (a) | 852,530 | | 2,966,345 |
Empresa de Telecomunicaciones de Bogota | 22,051,614 | | 4,529,068 |
Grupo de Inversiones Suramerica SA | 953,406 | | 12,104,340 |
Inversiones Argos SA | 924,188 | | 5,678,476 |
TOTAL COLOMBIA | | 27,183,390 |
Mexico - 33.2% |
America Movil S.A.B. de CV: | | | |
Series L | 7,165,300 | | 6,398,441 |
Series L sponsored ADR (d) | 1,476,073 | | 26,288,860 |
Banregio Grupo Financiero S.A.B. de CV | 339,814 | | 1,833,224 |
Consorcio ARA S.A.B. de CV (a) | 20,756,305 | | 7,778,368 |
Controladora Commercial Mexicana S.A.B. de CV unit | 1,308,500 | | 3,832,546 |
Fomento Economico Mexicano S.A.B. de CV: | | | |
unit | 95,200 | | 940,427 |
sponsored ADR | 275,305 | | 27,279,972 |
Gruma S.A.B. de CV Series B | 358,009 | | 5,524,737 |
Grupo Aeroportuario del Pacifico SA de CV: | | | |
Series B | 43,100 | | 388,187 |
sponsored ADR | 33,400 | | 3,041,738 |
Grupo Aeroportuario del Sureste SA de CV Series B | 254,820 | | 3,946,534 |
Grupo Carso SA de CV Series A1 | 1,414,100 | | 6,304,370 |
Grupo Financiero Inbursa S.A.B. de CV Series O | 7,110,519 | | 14,296,113 |
Grupo Financiero Santander Mexico S.A.B. de CV | 2,505,855 | | 4,604,287 |
Grupo Televisa SA de CV | 199,400 | | 1,160,223 |
Grupo Televisa SA de CV (CPO) sponsored ADR | 293,300 | | 8,546,762 |
Industrias Penoles SA de CV | 277,923 | | 3,694,916 |
Kimberly-Clark de Mexico SA de CV Series A | 2,382,100 | | 5,748,375 |
Medica Sur SA de CV | 1,038,334 | | 3,143,076 |
Megacable Holdings S.A.B. de CV unit | 1,954,829 | | 7,449,932 |
Qualitas Controladora S.A.B. de CV (a) | 2,877,400 | | 3,585,035 |
Unifin Financiera SAPI de CV (a) | 308,300 | | 935,849 |
Wal-Mart de Mexico SA de CV Series V | 8,591,848 | | 22,668,439 |
TOTAL MEXICO | | 169,390,411 |
Panama - 1.6% |
Banco Latinoamericano de Comercio Exterior SA Series E | 303,070 | | 8,191,982 |
Peru - 3.0% |
Alicorp SA Class C (a) | 4,973,812 | | 8,451,240 |
Compania de Minas Buenaventura SA sponsored ADR | 1,073,736 | | 6,882,648 |
TOTAL PERU | | 15,333,888 |
Common Stocks - continued |
| Shares | | Value |
Spain - 0.7% |
Prosegur Compania de Seguridad SA (Reg.) | 789,254 | | $ 3,515,008 |
United States of America - 0.4% |
First Cash Financial Services, Inc. (a) | 52,766 | | 2,013,023 |
TOTAL COMMON STOCKS (Cost $443,903,418) |
396,077,263
|
Nonconvertible Preferred Stocks - 19.6% |
| | | |
Brazil - 18.5% |
Ambev SA sponsored ADR | 6,385,447 | | 31,097,125 |
Banco Bradesco SA (PN) | 1,909,460 | | 10,397,547 |
Companhia Brasileira de Distribuicao Grupo Pao de Acucar (PN) | 413,125 | | 5,435,418 |
Companhia de Saneamento Basico do Estado de Sao Paulo (SABESP) sponsored ADR | 62,800 | | 275,692 |
Itau Unibanco Holding SA | 3,462,695 | | 23,766,718 |
Itausa-Investimentos Itau SA (PN) | 4,034,325 | | 7,531,898 |
Petroleo Brasileiro SA - Petrobras (PN) (non-vtg.) (a) | 4,687,871 | | 9,371,974 |
Vale SA (PN-A) | 1,859,800 | | 6,765,890 |
TOTAL BRAZIL | | 94,642,262 |
Chile - 0.8% |
Embotelladora Andina SA Class A | 1,355,910 | | 3,980,186 |
Colombia - 0.3% |
Grupo de Inversiones Suramerica SA | 105,961 | | 1,329,907 |
TOTAL NONCONVERTIBLE PREFERRED STOCKS (Cost $90,870,783) |
99,952,355
|
Money Market Funds - 3.2% |
| Shares | | Value |
Fidelity Cash Central Fund, 0.18% (b) | 14,023,624 | | $ 14,023,624 |
Fidelity Securities Lending Cash Central Fund, 0.19% (b)(c) | 2,529,375 | | 2,529,375 |
TOTAL MONEY MARKET FUNDS (Cost $16,552,999) |
16,552,999
|
TOTAL INVESTMENT
PORTFOLIO - 100.4% (Cost $551,327,200) | | 512,582,617 |
NET OTHER ASSETS (LIABILITIES) - (0.4)% | | (2,020,347) |
NET ASSETS - 100% | $ 510,562,270 |
Legend |
(a) Non-income producing |
(b) Affiliated fund that is generally available only to investment companies and other accounts managed by Fidelity Investments. The rate quoted is the annualized seven-day yield of the fund at period end. A complete unaudited listing of the fund's holdings as of its most recent quarter end is available upon request. In addition, each Fidelity Central Fund's financial statements, which are not covered by the Fund's Report of Independent Registered Public Accounting Firm, are available on the SEC's website or upon request. |
(c) Investment made with cash collateral received from securities on loan. |
(d) Security or a portion of the security is on loan at period end. |
Affiliated Central Funds |
Information regarding fiscal year to date income earned by the Fund from investments in Fidelity Central Funds is as follows: |
Fund | Income earned |
Fidelity Cash Central Fund | $ 15,272 |
Fidelity Securities Lending Cash Central Fund | 36,119 |
Total | $ 51,391 |
Other Information |
Categorizations in the Schedule of Investments are based on country or territory of incorporation. |
All investments are categorized as Level 1 under the Fair Value Hierarchy. The inputs or methodology used for valuing securities may not be an indication of the risk associated with investing in those securities. For more information on valuation inputs, please refer to the Investment Valuation section in the accompanying Notes to Financial Statements. |
See accompanying notes which are an integral part of the financial statements.
Annual Report
Fidelity Latin America Fund
Financial Statements
Statement of Assets and Liabilities
| | October 31, 2015 |
| | |
Assets | | |
Investment in securities, at value (including securities loaned of $2,537,925) - See accompanying schedule: Unaffiliated issuers (cost $534,774,201) | $ 496,029,618 | |
Fidelity Central Funds (cost $16,552,999) | 16,552,999 | |
Total Investments (cost $551,327,200) | | $ 512,582,617 |
Foreign currency held at value (cost $517,954) | | 518,167 |
Receivable for investments sold | | 793,751 |
Receivable for fund shares sold | | 321,934 |
Dividends receivable | | 393,206 |
Distributions receivable from Fidelity Central Funds | | 3,558 |
Prepaid expenses | | 1,769 |
Other receivables | | 2,262 |
Total assets | | 514,617,264 |
| | |
Liabilities | | |
Payable for investments purchased | $ 110,516 | |
Payable for fund shares redeemed | 837,033 | |
Accrued management fee | 301,708 | |
Distribution and service plan fees payable | 10,860 | |
Other affiliated payables | 148,116 | |
Other payables and accrued expenses | 117,386 | |
Collateral on securities loaned, at value | 2,529,375 | |
Total liabilities | | 4,054,994 |
| | |
Net Assets | | $ 510,562,270 |
Net Assets consist of: | | |
Paid in capital | | $ 630,184,258 |
Undistributed net investment income | | 7,012,875 |
Accumulated undistributed net realized gain (loss) on investments and foreign currency transactions | | (87,850,607) |
Net unrealized appreciation (depreciation) on investments and assets and liabilities in foreign currencies | | (38,784,256) |
Net Assets | | $ 510,562,270 |
Statement of Assets and Liabilities - continued
| | October 31, 2015 |
| | |
Calculation of Maximum Offering Price | |
Class A:
Net Asset Value and redemption price per share ($16,424,313 ÷ 908,008 shares) | | $ 18.09 |
| | |
Maximum offering price per share (100/94.25 of $18.09) | | $ 19.19 |
Class T:
Net Asset Value and redemption price per share ($5,283,521 ÷ 291,781 shares) | | $ 18.11 |
| | |
Maximum offering price per share (100/96.50 of $18.11) | | $ 18.77 |
Class B:
Net Asset Value and offering price per share ($627,760 ÷ 34,367 shares)A | | $ 18.27 |
| | |
Class C:
Net Asset Value and offering price per share ($5,393,798 ÷ 296,770 shares)A | | $ 18.18 |
| | |
Latin America:
Net Asset Value, offering price and redemption price per share ($481,004,802 ÷ 26,598,317 shares) | | $ 18.08 |
| | |
Class I:
Net Asset Value, offering price and redemption price per share ($1,828,076 ÷ 101,089 shares) | | $ 18.08 |
A Redemption price per share is equal to net asset value less any applicable contingent deferred sales charge.
See accompanying notes which are an integral part of the financial statements.
Annual Report
Statement of Operations
| Year ended October 31, 2015 |
| | |
Investment Income | | |
Dividends | | $ 19,692,387 |
Interest | | 12,841 |
Income from Fidelity Central Funds | | 51,391 |
Income before foreign taxes withheld | | 19,756,619 |
Less foreign taxes withheld | | (1,513,669) |
Total income | | 18,242,950 |
Expenses | | |
Management fee | $ 4,826,856 | |
Transfer agent fees | 1,963,217 | |
Distribution and service plan fees | 183,965 | |
Accounting and security lending fees | 339,670 | |
Custodian fees and expenses | 490,458 | |
Independent trustees' compensation | 2,918 | |
Registration fees | 81,216 | |
Audit | 72,583 | |
Legal | 2,191 | |
Interest | 444 | |
Miscellaneous | 4,345 | |
Total expenses before reductions | 7,967,863 | |
Expense reductions | (66,025) | 7,901,838 |
Net investment income (loss) | | 10,341,112 |
Realized and Unrealized Gain (Loss) | | |
Net realized gain (loss) on: | | |
Investment securities: | | |
Unaffiliated issuers | (86,779,565) | |
Foreign currency transactions | (639,828) | |
Total net realized gain (loss) | | (87,419,393) |
Change in net unrealized appreciation (depreciation) on: Investment securities (net of decrease in deferred foreign taxes of $64,167) | (231,007,007) | |
Assets and liabilities in foreign currencies | (35,988) | |
Total change in net unrealized appreciation (depreciation) | | (231,042,995) |
Net gain (loss) | | (318,462,388) |
Net increase (decrease) in net assets resulting from operations | | $ (308,121,276) |
Statement of Changes in Net Assets
| Year ended
October 31,
2015 | Year ended
October 31,
2014 |
Increase (Decrease) in Net Assets | | |
Operations | | |
Net investment income (loss) | $ 10,341,112 | $ 20,578,749 |
Net realized gain (loss) | (87,419,393) | 80,758,455 |
Change in net unrealized appreciation (depreciation) | (231,042,995) | (221,687,609) |
Net increase (decrease) in net assets resulting from operations | (308,121,276) | (120,350,405) |
Distributions to shareholders from net investment income | (12,592,762) | (23,599,176) |
Distributions to shareholders from net realized gain | (66,395,306) | (209,492,273) |
Total distributions | (78,988,068) | (233,091,449) |
Share transactions - net increase (decrease) | (98,503,600) | (61,704,730) |
Redemption fees | 127,133 | 197,877 |
Total increase (decrease) in net assets | (485,485,811) | (414,948,707) |
| | |
Net Assets | | |
Beginning of period | 996,048,081 | 1,410,996,788 |
End of period (including undistributed net investment income of $7,012,875 and undistributed net investment income of $11,771,382, respectively) | $ 510,562,270 | $ 996,048,081 |
See accompanying notes which are an integral part of the financial statements.
Annual Report
Financial Highlights - Fidelity Latin America Fund Class A
Years ended October 31, | 2015 | 2014 | 2013 | 2012 | 2011 |
Selected Per-Share Data | | | | | |
Net asset value, beginning of period | $ 30.31 | $ 40.71 | $ 48.95 | $ 52.38 | $ 57.48 |
Income from Investment Operations | | | | | |
Net investment income (loss) C | .28 | .49 | .72 | .92 | 1.15 |
Net realized and unrealized gain (loss) | (10.11) | (4.08) | (4.73) | (3.66) | (5.87) |
Total from investment operations | (9.83) | (3.59) | (4.01) | (2.74) | (4.72) |
Distributions from net investment income | (.31) | (.57) | (.79) | (.70) | (.19) |
Distributions from net realized gain | (2.08) | (6.25) | (3.45) | - | (.20) |
Total distributions | (2.39) | (6.82) | (4.24) | (.70) | (.39) |
Redemption fees added to paid in capitalC | -G | .01 | .01 | .01 | .01 |
Net asset value, end of period | $ 18.09 | $ 30.31 | $ 40.71 | $ 48.95 | $ 52.38 |
Total ReturnA, B | (34.60)% | (9.06)% | (8.93)% | (5.23)% | (8.26)% |
Ratios to Average Net AssetsD, F | | | | | |
Expenses before reductions | 1.40% | 1.38% | 1.37% | 1.35% | 1.34% |
Expenses net of fee waivers, if any | 1.40% | 1.38% | 1.37% | 1.35% | 1.34% |
Expenses net of all reductions | 1.39% | 1.38% | 1.35% | 1.35% | 1.34% |
Net investment income (loss) | 1.26% | 1.52% | 1.66% | 1.80% | 2.05% |
Supplemental Data | | | | | |
Net assets, end of period (000 omitted) | $ 16,424 | $ 34,898 | $ 48,464 | $ 69,654 | $ 91,407 |
Portfolio turnover rateE | 30% | 30% | 23% | 23% | 11% |
A Total returns would have been lower if certain expenses had not been reduced during the applicable periods shown. B Total returns do not include the effect of the sales charges. C Calculated based on average shares outstanding during the period. D Fees and expenses of any underlying Fidelity Central Funds are not included in the Fund's expense ratio. The Fund indirectly bears its proportionate share of the expenses of any underlying Fidelity Central Funds. E Amount does not include the portfolio activity of any underlying Fidelity Central Funds. F Expense ratios reflect operating expenses of the class. Expenses before reductions do not reflect amounts reimbursed by the investment adviser or reductions from brokerage service arrangements or reductions from other expense offset arrangements and do not represent the amount paid by the class during periods when reimbursements or reductions occur. Expenses net of fee waivers reflect expenses after reimbursement by the investment adviser but prior to reductions from brokerage service arrangements or other expense offset arrangements. Expenses net of all reductions represent the net expenses paid by the class. G Amount represents less than $.005 per share. |
Financial Highlights - Fidelity Latin America Fund Class T
Years ended October 31, | 2015 | 2014 | 2013 | 2012 | 2011 |
Selected Per-Share Data | | | | | |
Net asset value, beginning of period | $ 30.33 | $ 40.68 | $ 48.88 | $ 52.27 | $ 57.47 |
Income from Investment Operations | | | | | |
Net investment income (loss) C | .22 | .40 | .61 | .78 | .99 |
Net realized and unrealized gain (loss) | (10.13) | (4.08) | (4.74) | (3.65) | (5.85) |
Total from investment operations | (9.91) | (3.68) | (4.13) | (2.87) | (4.86) |
Distributions from net investment income | (.23) | (.43) | (.63) | (.53) | (.15) |
Distributions from net realized gain | (2.08) | (6.25) | (3.45) | - | (.20) |
Total distributions | (2.31) | (6.68) | (4.08) | (.53) | (.35) |
Redemption fees added to paid in capitalC | -G | .01 | .01 | .01 | .01 |
Net asset value, end of period | $ 18.11 | $ 30.33 | $ 40.68 | $ 48.88 | $ 52.27 |
Total ReturnA, B | (34.78)% | (9.30)% | (9.17)% | (5.49)% | (8.50)% |
Ratios to Average Net AssetsD, F | | | | | |
Expenses before reductions | 1.67% | 1.65% | 1.63% | 1.61% | 1.61% |
Expenses net of fee waivers, if any | 1.67% | 1.65% | 1.63% | 1.61% | 1.61% |
Expenses net of all reductions | 1.66% | 1.65% | 1.61% | 1.61% | 1.61% |
Net investment income (loss) | .99% | 1.25% | 1.40% | 1.54% | 1.78% |
Supplemental Data | | | | | |
Net assets, end of period (000 omitted) | $ 5,284 | $ 9,761 | $ 12,705 | $ 19,334 | $ 26,020 |
Portfolio turnover rateE | 30% | 30% | 23% | 23% | 11% |
A Total returns would have been lower if certain expenses had not been reduced during the applicable periods shown. B Total returns do not include the effect of the sales charges. C Calculated based on average shares outstanding during the period. D Fees and expenses of any underlying Fidelity Central Funds are not included in the Fund's expense ratio. The Fund indirectly bears its proportionate share of the expenses of any underlying Fidelity Central Funds. E Amount does not include the portfolio activity of any underlying Fidelity Central Funds. F Expense ratios reflect operating expenses of the class. Expenses before reductions do not reflect amounts reimbursed by the investment adviser or reductions from brokerage service arrangements or reductions from other expense offset arrangements and do not represent the amount paid by the class during periods when reimbursements or reductions occur. Expenses net of fee waivers reflect expenses after reimbursement by the investment adviser but prior to reductions from brokerage service arrangements or other expense offset arrangements. Expenses net of all reductions represent the net expenses paid by the class. G Amount represents less than $.005 per share. |
See accompanying notes which are an integral part of the financial statements.
Annual Report
Financial Highlights - Fidelity Latin America Fund Class B
Years ended October 31, | 2015 | 2014 | 2013 | 2012 | 2011 |
Selected Per-Share Data | | | | | |
Net asset value, beginning of period | $ 30.46 | $ 40.63 | $ 48.72 | $ 52.06 | $ 57.44 |
Income from Investment Operations | | | | | |
Net investment income (loss) C | .12 | .25 | .40 | .53 | .72 |
Net realized and unrealized gain (loss) | (10.23) | (4.08) | (4.74) | (3.63) | (5.84) |
Total from investment operations | (10.11) | (3.83) | (4.34) | (3.10) | (5.12) |
Distributions from net investment income | - | (.10) | (.31) | (.25) | (.07) |
Distributions from net realized gain | (2.08) | (6.25) | (3.45) | - | (.20) |
Total distributions | (2.08) | (6.35) | (3.76) | (.25) | (.27) |
Redemption fees added to paid in capitalC | -G | .01 | .01 | .01 | .01 |
Net asset value, end of period | $ 18.27 | $ 30.46 | $ 40.63 | $ 48.72 | $ 52.06 |
Total ReturnA, B | (35.09)% | (9.73)% | (9.60)% | (5.95)% | (8.94)% |
Ratios to Average Net AssetsD, F | | | | | |
Expenses before reductions | 2.16% | 2.14% | 2.12% | 2.10% | 2.10% |
Expenses net of fee waivers, if any | 2.15% | 2.14% | 2.12% | 2.10% | 2.10% |
Expenses net of all reductions | 2.15% | 2.13% | 2.10% | 2.10% | 2.10% |
Net investment income (loss) | .50% | .76% | .91% | 1.05% | 1.29% |
Supplemental Data | | | | | |
Net assets, end of period (000 omitted) | $ 628 | $ 2,211 | $ 4,764 | $ 9,492 | $ 14,114 |
Portfolio turnover rateE | 30% | 30% | 23% | 23% | 11% |
A Total returns would have been lower if certain expenses had not been reduced during the applicable periods shown. B Total returns do not include the effect of the contingent deferred sales charge. C Calculated based on average shares outstanding during the period. D Fees and expenses of any underlying Fidelity Central Funds are not included in the Fund's expense ratio. The Fund indirectly bears its proportionate share of the expenses of any underlying Fidelity Central Funds. E Amount does not include the portfolio activity of any underlying Fidelity Central Funds. F Expense ratios reflect operating expenses of the class. Expenses before reductions do not reflect amounts reimbursed by the investment adviser or reductions from brokerage service arrangements or reductions from other expense offset arrangements and do not represent the amount paid by the class during periods when reimbursements or reductions occur. Expenses net of fee waivers reflect expenses after reimbursement by the investment adviser but prior to reductions from brokerage service arrangements or other expense offset arrangements. Expenses net of all reductions represent the net expenses paid by the class. G Amount represents less than $.005 per share. |
Financial Highlights - Fidelity Latin America Fund Class C
Years ended October 31, | 2015 | 2014 | 2013 | 2012 | 2011 |
Selected Per-Share Data | | | | | |
Net asset value, beginning of period | $ 30.37 | $ 40.59 | $ 48.73 | $ 52.05 | $ 57.44 |
Income from Investment Operations | | | | | |
Net investment income (loss) C | .11 | .25 | .40 | .54 | .73 |
Net realized and unrealized gain (loss) | (10.17) | (4.07) | (4.74) | (3.64) | (5.84) |
Total from investment operations | (10.06) | (3.82) | (4.34) | (3.10) | (5.11) |
Distributions from net investment income | (.05) | (.16) | (.36) | (.23) | (.09) |
Distributions from net realized gain | (2.08) | (6.25) | (3.45) | - | (.20) |
Total distributions | (2.13) | (6.41) | (3.81) | (.23) | (.29) |
Redemption fees added to paid in capitalC | -G | .01 | .01 | .01 | .01 |
Net asset value, end of period | $ 18.18 | $ 30.37 | $ 40.59 | $ 48.73 | $ 52.05 |
Total ReturnA, B | (35.08)% | (9.74)% | (9.62)% | (5.94)% | (8.93)% |
Ratios to Average Net AssetsD, F | | | | | |
Expenses before reductions | 2.15% | 2.13% | 2.12% | 2.10% | 2.08% |
Expenses net of fee waivers, if any | 2.15% | 2.13% | 2.12% | 2.10% | 2.08% |
Expenses net of all reductions | 2.15% | 2.13% | 2.10% | 2.10% | 2.08% |
Net investment income (loss) | .51% | .77% | .91% | 1.06% | 1.31% |
Supplemental Data | | | | | |
Net assets, end of period (000 omitted) | $ 5,394 | $ 11,349 | $ 15,185 | $ 27,405 | $ 35,203 |
Portfolio turnover rateE | 30% | 30% | 23% | 23% | 11% |
A Total returns would have been lower if certain expenses had not been reduced during the applicable periods shown. B Total returns do not include the effect of the contingent deferred sales charge. C Calculated based on average shares outstanding during the period. D Fees and expenses of any underlying Fidelity Central Funds are not included in the Fund's expense ratio. The Fund indirectly bears its proportionate share of the expenses of any underlying Fidelity Central Funds. E Amount does not include the portfolio activity of any underlying Fidelity Central Funds. F Expense ratios reflect operating expenses of the class. Expenses before reductions do not reflect amounts reimbursed by the investment adviser or reductions from brokerage service arrangements or reductions from other expense offset arrangements and do not represent the amount paid by the class during periods when reimbursements or reductions occur. Expenses net of fee waivers reflect expenses after reimbursement by the investment adviser but prior to reductions from brokerage service arrangements or other expense offset arrangements. Expenses net of all reductions represent the net expenses paid by the class. G Amount represents less than $.005 per share. |
See accompanying notes which are an integral part of the financial statements.
Annual Report
Financial Highlights - Fidelity Latin America Fund
Years ended October 31, | 2015 | 2014 | 2013 | 2012 | 2011 |
Selected Per-Share Data | | | | | |
Net asset value, beginning of period | $ 30.34 | $ 40.80 | $ 49.09 | $ 52.48 | $ 57.50 |
Income from Investment Operations | | | | | |
Net investment income (loss) B | .34 | .59 | .87 | 1.09 | 1.34 |
Net realized and unrealized gain (loss) | (10.11) | (4.10) | (4.74) | (3.67) | (5.88) |
Total from investment operations | (9.77) | (3.51) | (3.87) | (2.58) | (4.54) |
Distributions from net investment income | (.41) | (.71) | (.98) | (.82) | (.29) |
Distributions from net realized gain | (2.08) | (6.25) | (3.45) | - | (.20) |
Total distributions | (2.49) | (6.96) | (4.43) | (.82) | (.49) |
Redemption fees added to paid in capitalB | - F | .01 | .01 | .01 | .01 |
Net asset value, end of period | $ 18.08 | $ 30.34 | $ 40.80 | $ 49.09 | $ 52.48 |
Total ReturnA | (34.45)% | (8.79)% | (8.63)% | (4.91)% | (7.96)% |
Ratios to Average Net AssetsC, E | | | | | |
Expenses before reductions | 1.13% | 1.08% | 1.04% | 1.02% | 1.00% |
Expenses net of fee waivers, if any | 1.12% | 1.08% | 1.04% | 1.02% | 1.00% |
Expenses net of all reductions | 1.12% | 1.07% | 1.03% | 1.02% | 1.00% |
Net investment income (loss) | 1.53% | 1.83% | 1.99% | 2.14% | 2.39% |
Supplemental Data | | | | | |
Net assets, end of period (000 omitted) | $ 481,005 | $ 933,298 | $ 1,324,748 | $ 2,274,601 | $ 2,884,301 |
Portfolio turnover rateD | 30% | 30% | 23% | 23% | 11% |
A Total returns would have been lower if certain expenses had not been reduced during the applicable periods shown. B Calculated based on average shares outstanding during the period. C Fees and expenses of any underlying Fidelity Central Funds are not included in the Fund's expense ratio. The Fund indirectly bears its proportionate share of the expenses of any underlying Fidelity Central Funds. D Amount does not include the portfolio activity of any underlying Fidelity Central Funds. E Expense ratios reflect operating expenses of the class. Expenses before reductions do not reflect amounts reimbursed by the investment adviser or reductions from brokerage service arrangements or reductions from other expense offset arrangements and do not represent the amount paid by the class during periods when reimbursements or reductions occur. Expenses net of fee waivers reflect expenses after reimbursement by the investment adviser but prior to reductions from brokerage service arrangements or other expense offset arrangements. Expenses net of all reductions represent the net expenses paid by the class. F Amount represents less than $.005 per share. |
Financial Highlights - Fidelity Latin America Fund Class I
Years ended October 31, | 2015 | 2014 | 2013 | 2012 | 2011 |
Selected Per-Share Data | | | | | |
Net asset value, beginning of period | $ 30.35 | $ 40.79 | $ 49.07 | $ 52.51 | $ 57.49 |
Income from Investment Operations | | | | | |
Net investment income (loss) B | .36 | .60 | .87 | 1.08 | 1.32 |
Net realized and unrealized gain (loss) | (10.13) | (4.07) | (4.74) | (3.67) | (5.88) |
Total from investment operations | (9.77) | (3.47) | (3.87) | (2.59) | (4.56) |
Distributions from net investment income | (.42) | (.73) | (.97) | (.86) | (.23) |
Distributions from net realized gain | (2.08) | (6.25) | (3.45) | - | (.20) |
Total distributions | (2.50) | (6.98) | (4.42) | (.86) | (.43) |
Redemption fees added to paid in capitalB | - F | .01 | .01 | .01 | .01 |
Net asset value, end of period | $ 18.08 | $ 30.35 | $ 40.79 | $ 49.07 | $ 52.51 |
Total ReturnA | (34.42)% | (8.69)% | (8.63)% | (4.93)% | (7.98)% |
Ratios to Average Net AssetsC, E | | | | | |
Expenses before reductions | 1.06% | 1.04% | 1.03% | 1.04% | 1.04% |
Expenses net of fee waivers, if any | 1.06% | 1.04% | 1.03% | 1.04% | 1.04% |
Expenses net of all reductions | 1.05% | 1.04% | 1.01% | 1.04% | 1.04% |
Net investment income (loss) | 1.60% | 1.86% | 2.00% | 2.12% | 2.35% |
Supplemental Data | | | | | |
Net assets, end of period (000 omitted) | $ 1,828 | $ 4,531 | $ 5,131 | $ 7,928 | $ 9,603 |
Portfolio turnover rateD | 30% | 30% | 23% | 23% | 11% |
A Total returns would have been lower if certain expenses had not been reduced during the applicable periods shown. B Calculated based on average shares outstanding during the period. C Fees and expenses of any underlying Fidelity Central Funds are not included in the Fund's expense ratio. The Fund indirectly bears its proportionate share of the expenses of any underlying Fidelity Central Funds. D Amount does not include the portfolio activity of any underlying Fidelity Central Funds. E Expense ratios reflect operating expenses of the class. Expenses before reductions do not reflect amounts reimbursed by the investment adviser or reductions from brokerage service arrangements or reductions from other expense offset arrangements and do not represent the amount paid by the class during periods when reimbursements or reductions occur. Expenses net of fee waivers reflect expenses after reimbursement by the investment adviser but prior to reductions from brokerage service arrangements or other expense offset arrangements. Expenses net of all reductions represent the net expenses paid by the class. F Amount represents less than $.005 per share. |
See accompanying notes which are an integral part of the financial statements.
Annual Report
Notes to Financial Statements
For the period ended October 31, 2015
1. Organization.
Fidelity Latin America Fund (the Fund) is a non-diversified fund of Fidelity Investment Trust (the Trust) and is authorized to issue an unlimited number of shares. The Trust is registered under the Investment Company Act of 1940, as amended (the 1940 Act), as an open-end management investment company organized as a Massachusetts business trust. The Fund offers Class A, Class T, Class C, Latin America and Class I (formerly Institutional Class) shares, each of which, along with Class B shares, has equal rights as to assets and voting privileges. Class B shares are closed to new accounts and additional purchases, except for exchanges and reinvestments. Each class has exclusive voting rights with respect to matters that affect that class. Class B shares will automatically convert to Class A shares after a holding period of seven years from the initial date of purchase. The Fund's investments in emerging markets can be subject to social, economic, regulatory, and political uncertainties and can be extremely volatile.
2. Investments in Fidelity Central Funds.
The Fund invests in Fidelity Central Funds, which are open-end investment companies generally available only to other investment companies and accounts managed by the investment adviser and its affiliates. The Fund's Schedule of Investments lists each of the Fidelity Central Funds held as of period end, if any, as an investment of the Fund, but does not include the underlying holdings of each Fidelity Central Fund. As an Investing Fund, the Fund indirectly bears its proportionate share of the expenses of the underlying Fidelity Central Funds.
The Money Market Central Funds seek preservation of capital and current income and are managed by Fidelity Investments Money Management, Inc. (FIMM), an affiliate of the investment adviser. Annualized expenses of the Money Market Central Funds as of their most recent shareholder report date are less than .005%.
A complete unaudited list of holdings for each Fidelity Central Fund is available upon request or at the Securities and Exchange Commission (the SEC) website at www.sec.gov. In addition, the financial statements of the Fidelity Central Funds, which are not covered by the Fund's Report of Independent Registered Public Accounting Firm, are available on the SEC website or upon request.
3. Significant Accounting Policies.
The financial statements have been prepared in conformity with accounting principles generally accepted in the United States of America (GAAP), which require management to make certain estimates and assumptions at the date of the financial statements. Actual results could differ from those estimates. Subsequent events, if any, through the date that the financial statements were issued have been evaluated in the preparation of the financial statements. The following summarizes the significant accounting policies of the Fund:
Investment Valuation. Investments are valued as of 4:00 p.m. Eastern time on the last calendar day of the period. The Board of Trustees (the Board) has delegated the day to day responsibility for the valuation of the Fund's investments to the Fidelity Management & Research Company (FMR) Fair Value Committee (the Committee). In accordance with valuation policies and procedures approved by the Board, the Fund attempts to obtain prices from one or more third party pricing vendors or brokers to value its investments. When current market prices, quotations or currency exchange rates are not readily available or reliable, investments will be fair valued in good faith by the Committee, in accordance with procedures adopted by the Board. Factors used in determining fair value vary by investment type and may include market or investment specific events. The frequency with which these procedures are used cannot be predicted and they may be utilized to a significant extent. The Committee oversees the Fund's valuation policies and procedures and reports to the Board on the Committee's activities and fair value determinations. The Board monitors the appropriateness of the procedures used in valuing the Fund's investments and ratifies the fair value determinations of the Committee.
The Fund categorizes the inputs to valuation techniques used to value its investments into a disclosure hierarchy consisting of three levels as shown below:
Level 1 - quoted prices in active markets for identical investments
Level 2 - other significant observable inputs (including quoted prices for similar investments, interest rates, prepayment speeds, etc.)
Level 3 - unobservable inputs (including the Fund's own assumptions based on the best information available)
Valuation techniques used to value the Fund's investments by major category are as follows:
Equity securities, including restricted securities, for which market quotations are readily available, are valued at the last reported sale price or official closing price as reported by a third party pricing vendor on the primary market or exchange on which they are traded and are categorized as Level 1 in the hierarchy. In the event there were no sales during the day or closing prices are not available, securities are valued at the last quoted bid price or may be valued using the last available price and are generally categorized as Level 2 in the hierarchy. For foreign equity securities, when market or security specific events arise, comparisons to the valuation of American Depositary Receipts (ADRs), futures contracts, Exchange-Traded Funds (ETFs) and certain indexes as well as quoted prices for similar securities may be used and would be categorized as Level 2 in the hierarchy. Utilizing
Annual Report
Notes to Financial Statements - continued
3. Significant Accounting Policies - continued
Investment Valuation - continued
these techniques may result in transfers between Level 1 and Level 2. For equity securities, including restricted securities, where observable inputs are limited, assumptions about market activity and risk are used and these securities may be categorized as Level 3 in the hierarchy.
Investments in open-end mutual funds, including the Fidelity Central Funds, are valued at their closing net asset value (NAV) each business day and are categorized as Level 1 in the hierarchy.
Changes in valuation techniques may result in transfers in or out of an assigned level within the disclosure hierarchy.
Foreign Currency. The Fund may use foreign currency contracts to facilitate transactions in foreign-denominated securities. Gains and losses from these transactions may arise from changes in the value of the foreign currency or if the counterparties do not perform under the contracts' terms.
Foreign-denominated assets, including investment securities, and liabilities are translated into U.S. dollars at the exchange rates at period end. Purchases and sales of investment securities, income and dividends received and expenses denominated in foreign currencies are translated into U.S. dollars at the exchange rate in effect on the transaction date.
The effects of exchange rate fluctuations on investments are included with the net realized and unrealized gain (loss) on investment securities. Other foreign currency transactions resulting in realized and unrealized gain (loss) are disclosed separately.
Investment Transactions and Income. For financial reporting purposes, the Fund's investment holdings and NAV include trades executed through the end of the last business day of the period. The NAV per share for processing shareholder transactions is calculated as of the close of business of the New York Stock Exchange (NYSE), normally 4:00 p.m. Eastern time and includes trades executed through the end of the prior business day. Gains and losses on securities sold are determined on the basis of identified cost. Dividend income is recorded on the ex-dividend date, except for certain dividends from foreign securities where the ex-dividend date may have passed, which are recorded as soon as the Fund is informed of the ex-dividend date. Non-cash dividends included in dividend income, if any, are recorded at the fair market value of the securities received. Income and capital gain distributions from Fidelity Central Funds, if any, are recorded on the ex-dividend date. Distributions received on securities that represent a return of capital or capital gain are recorded as a reduction of cost of investments and/or as a realized gain. Subsequent to ex-dividend date the Fund determines the components of these distributions, based upon receipt of tax filings or other correspondence relating to the underlying investment. Interest income is accrued as earned and includes coupon interest and amortization of premium and accretion of discount on debt securities as applicable. Investment income is recorded net of foreign taxes withheld where recovery of such taxes is uncertain.
Class Allocations and Expenses. Investment income, realized and unrealized capital gains and losses, common expenses of the Fund, and certain fund-level expense reductions, if any, are allocated daily on a pro-rata basis to each class based on the relative net assets of each class to the total net assets of the Fund. Each class differs with respect to transfer agent and distribution and service plan fees incurred. Certain expense reductions may also differ by class. For the reporting period, the allocated portion of income and expenses to each class as a percent of its average net assets may vary due to the timing of recording these transactions in relation to fluctuating net assets of the classes. Expenses directly attributable to a fund are charged to that fund. Expenses attributable to more than one fund are allocated among the respective funds on the basis of relative net assets or other appropriate methods. Expense estimates are accrued in the period to which they relate and adjustments are made when actual amounts are known.
Income Tax Information and Distributions to Shareholders. Each year, the Fund intends to qualify as a regulated investment company under Subchapter M of the Internal Revenue Code, including distributing substantially all of its taxable income and realized gains. As a result, no provision for U.S. Federal income taxes is required. As of October 31, 2015, the Fund did not have any unrecognized tax benefits in the financial statements; nor is the Fund aware of any tax positions for which it is reasonably possible that the total amounts of unrecognized tax benefits will significantly change in the next twelve months. The Fund files a U.S. federal tax return, in addition to state and local tax returns as required. The Fund's federal income tax returns are subject to examination by the Internal Revenue Service (IRS) for a period of three fiscal years after they are filed. State and local tax returns may be subject to examination for an additional fiscal year depending on the jurisdiction. Foreign taxes are provided for based on the Fund's understanding of the tax rules and rates that exist in the foreign markets in which it invests.
Distributions are declared and recorded on the ex-dividend date. Income dividends and capital gain distributions are declared separately for each class. Income and capital gain distributions are determined in accordance with income tax regulations, which may differ from GAAP. In addition, the Fund claimed a portion of the payment made to redeeming shareholders as a distribution for income tax purposes.
Capital accounts within the financial statements are adjusted for permanent book-tax differences. These adjustments have no impact on net assets or the results of operations. Capital accounts are not adjusted for temporary book-tax differences which will reverse in a subsequent period.
Book-tax differences are primarily due to foreign currency transactions, capital loss carryforwards, passive foreign investment companies (PFIC), deferred trustees compensation, and losses deferred due to wash sales.
Annual Report
3. Significant Accounting Policies - continued
Income Tax Information and Distributions to Shareholders - continued
The federal tax cost of investment securities and unrealized appreciation (depreciation) as of period end were as follows:
Gross unrealized appreciation | $ 111,202,419 |
Gross unrealized depreciation | (153,035,114) |
Net unrealized appreciation (depreciation) on securities | $ (41,832,695) |
Tax Cost | $ 554,415,312 |
The tax-based components of distributable earnings as of period end were as follows:
Undistributed ordinary income | $ 7,013,225 |
Capital loss carryforward | $ (84,762,495) |
Net unrealized appreciation (depreciation) on securities and other investments | $ (41,872,368) |
Capital loss carryforwards are only available to offset future capital gains of the Fund to the extent provided by regulations and may be limited. Under the Regulated Investment Company Modernization Act of 2010 (the Act), the Fund is permitted to carry forward capital losses incurred in taxable years beginning after December 22, 2010 for an unlimited period and such capital losses are required to be used prior to any losses that expire. The capital loss carryforward information presented below, including any applicable limitation, is estimated as of fiscal period end and is subject to adjustment.
No expiration | |
Short-term | $ (34,655,095) |
Long-term | (50,107,400) |
Total capital loss carryforward | $ (84,762,495) |
The tax character of distributions paid was as follows:
| October 31, 2015 | October 31, 2014 |
Ordinary Income | $ 13,610,992 | $ 23,599,177 |
Long-term Capital Gains | 65,377,076 | 209,492,272 |
Total | $ 78,988,068 | $ 233,091,449 |
Short-Term Trading (Redemption) Fees. Shares held by investors in the Fund less than 90 days may have been subject to a redemption fee equal to 1.50% of the NAV of shares redeemed. All redemption fees, which reduce the proceeds of the shareholder redemption, are retained by the Fund and accounted for as an addition to paid in capital.
4. Purchases and Sales of Investments.
Purchases and sales of securities, other than short-term securities, aggregated $206,464,209 and $379,227,247, respectively.
5. Fees and Other Transactions with Affiliates.
Management Fee. Fidelity Management & Research Company (the investment adviser) and its affiliates provide the Fund with investment management related services for which the Fund pays a monthly management fee. The management fee is the sum of an individual fund fee rate that is based on an annual rate of .45% of the Fund's average net assets and an annualized group fee rate that averaged .25% during the period. The group fee rate is based upon the average net assets of all the mutual funds advised by the investment adviser, including any mutual funds previously advised by the investment adviser that are currently advised by Fidelity SelectCo, LLC, an affiliate of the investment adviser. The group fee rate decreases as assets under management increase and increases as assets under management decrease. For the reporting period, the total annual management fee rate was .70% of the Fund's average net assets.
Distribution and Service Plan Fees. In accordance with Rule 12b-1 of the 1940 Act, the Fund has adopted separate Distribution and Service Plans for each class of shares. Certain classes pay Fidelity Distributors Corporation (FDC), an affiliate of the investment adviser, separate Distribution and Service Fees, each of which is based on an annual percentage of each class' average net assets. In addition, FDC may pay financial intermediaries for
Annual Report
Notes to Financial Statements - continued
5. Fees and Other Transactions with Affiliates - continued
Distribution and Service Plan Fees - continued
selling shares of the Fund and providing shareholder support services. For the period, the Distribution and Service Fee rates, total fees and amounts retained by FDC were as follows:
| Distribution
Fee | Service
Fee | Total Fees | Retained
by FDC |
Class A | -% | .25% | $ 59,273 | $ 647 |
Class T | .25% | .25% | 34,910 | 81 |
Class B | .75% | .25% | 12,707 | 9,534 |
Class C | .75% | .25% | 77,075 | 10,716 |
| | | $ 183,965 | $ 20,978 |
Sales Load. FDC may receive a front-end sales charge of up to 5.75% for selling Class A shares and 3.50% for selling Class T shares, some of which is paid to financial intermediaries for selling shares of the Fund. Depending on the holding period, FDC may receive contingent deferred sales charges levied on Class A, Class T, Class B, and Class C redemptions. The deferred sales charges range from 5.00% to 1.00% for Class B shares, 1.00% for Class C shares, 1.00% for certain purchases of Class A shares and .25% for certain purchases of Class T shares.
For the period, sales charge amounts retained by FDC were as follows:
| Retained
by FDC |
Class A | $ 8,285 |
Class T | 1,542 |
Class BA | 1,183 |
Class CA | 1,816 |
| $ 12,826 |
A When Class B and Class C shares are initially sold, FDC pays commissions from its own resources to financial intermediaries through which the sales are made.
Transfer Agent Fees. Fidelity Investments Institutional Operations Company, Inc., (FIIOC), an affiliate of the investment adviser, is the transfer, dividend disbursing and shareholder servicing agent for each class of the Fund. FIIOC receives account fees and asset-based fees that vary according to the account size and type of account of the shareholders of the respective classes of the Fund. FIIOC pays for typesetting, printing and mailing of shareholder reports, except proxy statements.
For the period, transfer agent fees for each class were as follows:
| Amount | % of
Class-Level Average
Net Assets |
Class A | $ 70,425 | .30 |
Class T | 22,003 | .32 |
Class B | 3,759 | .30 |
Class C | 22,931 | .30 |
Latin America | 1,838,665 | .28 |
Class I | 5,434 | .21 |
| $ 1,963,217 | |
Accounting and Security Lending Fees. Fidelity Service Company, Inc. (FSC), an affiliate of the investment adviser, maintains the Fund's accounting records. The accounting fee is based on the level of average net assets for each month. Under a separate contract, FSC administers the security lending program. The security lending fee is based on the number and duration of lending transactions.
Brokerage Commissions. The Fund placed a portion of its portfolio transactions with brokerage firms which are affiliates of the investment adviser. Brokerage commissions are included in net realized gain (loss) and change in net unrealized appreciation (depreciation) in the Statement of Operations. The commissions paid to these affiliated firms were $3,354 for the period.
Interfund Lending Program. Pursuant to an Exemptive Order issued by the SEC, the Fund, along with other registered investment companies having management contracts with FMR or other affiliated entities of FMR, may participate in an interfund lending program. This program provides an
Annual Report
5. Fees and Other Transactions with Affiliates - continued
Interfund Lending Program - continued
alternative credit facility allowing the funds to borrow from, or lend money to, other participating affiliated funds. At period end, there were no interfund loans outstanding. The Fund's activity in this program during the period for which loans were outstanding was as follows:
Borrower or Lender | Average Loan Balance | Weighted Average
Interest Rate | Interest Expense |
Borrower | $ 5,893,750 | .34% | $ 444 |
6. Committed Line of Credit.
The Fund participates with other funds managed by the investment adviser or an affiliate in a $4.25 billion credit facility (the "line of credit") to be utilized for temporary or emergency purposes to fund shareholder redemptions or for other short-term liquidity purposes. The Fund has agreed to pay commitment fees on its pro-rata portion of the line of credit, which amounted to $1,072 and is reflected in Miscellaneous expenses on the Statement of Operations. During the period, the Fund did not borrow on this line of credit.
7. Security Lending.
The Fund lends portfolio securities through a lending agent from time to time in order to earn additional income. For equity securities, a lending agent is used and may loan securities to certain qualified borrowers, including Fidelity Capital Markets (FCM), a broker-dealer affiliated with the Fund. On the settlement date of the loan, the Fund receives collateral (in the form of U.S. Treasury obligations, letters of credit and/or cash) against the loaned securities and maintains collateral in an amount not less than 100% of the market value of the loaned securities during the period of the loan. The market value of the loaned securities is determined at the close of business of the Fund and any additional required collateral is delivered to the Fund on the next business day. The Fund or borrower may terminate the loan at any time, and if the borrower defaults on its obligation to return the securities loaned because of insolvency or other reasons, the Fund may apply collateral received from the borrower against the obligation. The Fund may experience delays and costs in recovering the securities loaned. Any cash collateral received is invested in the Fidelity Securities Lending Cash Central Fund. The value of loaned securities and cash collateral at period end are disclosed on the Fund's Statement of Assets and Liabilities. At period end, there were no security loans outstanding with FCM. Security lending income represents the income earned on investing cash collateral, less rebates paid to borrowers and any lending agent fees associated with the loan, plus any premium payments received for lending certain types of securities. Security lending income is presented in the Statement of Operations as a component of income from Fidelity Central Funds. Total security lending income during the period amounted to $36,119, including $28 from securities loaned to FCM.
8. Expense Reductions.
Commissions paid to certain brokers with whom the investment adviser, or its affiliates, places trades on behalf of the Fund include an amount in addition to trade execution, which may be rebated back to the Fund to offset certain expenses. This amount totaled $19,806 for the period. In addition, through arrangements with the Fund's custodian, credits realized as a result of certain uninvested cash balances were used to reduce the Fund's expenses. During the period, these credits reduced the Fund's custody expenses by $36.
In addition, during the period the investment adviser reimbursed and/or waived a portion of fund-level operating expenses in the amount of $2,673 and a portion of class-level operating expenses as follows:
| Amount |
Class A | $ 60 |
Class T | 14 |
Class B | 2 |
Class C | 40 |
Latin America | 43,294 |
Class I | 100 |
| $ 43,510 |
9. Distributions to Shareholders.
Distributions to shareholders of each class were as follows:
Years ended October 31, | 2015 | 2014 |
From net investment income | | |
Class A | $ 341,444 | $ 667,095 |
Class T | 71,167 | 136,327 |
Class B | - | 12,098 |
Annual Report
Notes to Financial Statements - continued
9. Distributions to Shareholders - continued
Years ended October 31, | 2015 | 2014 |
From net investment income | | |
Class C | $ 18,114 | $ 60,991 |
Latin America | 12,109,807 | 22,631,305 |
Class I | 52,230 | 91,360 |
Total | $ 12,592,762 | $ 23,599,176 |
From net realized gain | | |
Class A | $ 2,330,553 | $ 7,249,224 |
Class T | 658,521 | 1,918,455 |
Class B | 144,042 | 684,975 |
Class C | 754,025 | 2,282,110 |
Latin America | 62,251,897 | 196,577,505 |
Class I | 256,268 | 780,004 |
Total | $ 66,395,306 | $ 209,492,273 |
10. Share Transactions.
Share transactions for each class were as follows and may contain automatic conversions between classes or exchanges between funds:
| Shares | Dollars |
Years ended October 31, | 2015 | 2014 | 2015 | 2014 |
Class A | | | | |
Shares sold | 218,330 | 256,161 | $ 4,910,163 | $ 8,113,294 |
Reinvestment of distributions | 103,775 | 229,379 | 2,587,573 | 7,071,806 |
Shares redeemed | (565,352) | (524,684) | (12,518,797) | (16,539,013) |
Net increase (decrease) | (243,247) | (39,144) | $ (5,021,061) | $ (1,353,913) |
Class T | | | | |
Shares sold | 29,946 | 47,965 | $ 658,518 | $ 1,548,211 |
Reinvestment of distributions | 28,508 | 65,609 | 713,357 | 2,028,652 |
Shares redeemed | (88,493) | (104,082) | (1,990,592) | (3,252,264) |
Net increase (decrease) | (30,039) | 9,492 | $ (618,717) | $ 324,599 |
Class B | | | | |
Shares sold | 116 | 1,044 | $ 2,989 | $ 32,892 |
Reinvestment of distributions | 5,261 | 18,939 | 133,376 | 590,702 |
Shares redeemed | (43,584) | (64,672) | (982,322) | (2,061,800) |
Net increase (decrease) | (38,207) | (44,689) | $ (845,957) | $ (1,438,206) |
Class C | | | | |
Shares sold | 48,350 | 91,764 | $ 1,099,271 | $ 2,901,440 |
Reinvestment of distributions | 25,875 | 69,412 | 652,617 | 2,158,720 |
Shares redeemed | (151,109) | (161,581) | (3,411,105) | (5,151,621) |
Net increase (decrease) | (76,884) | (405) | $ (1,659,217) | $ (91,461) |
Latin America | | | | |
Shares sold | 2,736,036 | 4,529,614 | $ 60,647,605 | $ 143,961,705 |
Reinvestment of distributions | 2,862,287 | 6,820,938 | 71,197,829 | 209,950,213 |
Shares redeemed | (9,758,242) | (13,065,128) | (221,025,945) | (413,931,096) |
Net increase (decrease) | (4,159,919) | (1,714,576) | $ (89,180,511) | $ (60,019,178) |
Class I | | | | |
Shares sold | 41,136 | 125,962 | $ 906,993 | $ 4,086,454 |
Reinvestment of distributions | 11,139 | 21,472 | 276,862 | 660,492 |
Shares redeemed | (100,491) | (123,906) | (2,361,992) | (3,873,517) |
Net increase (decrease) | (48,216) | 23,528 | $ (1,178,137) | $ 873,429 |
11. Other.
The Fund's organizational documents provide former and current trustees and officers with a limited indemnification against liabilities arising in connection with the performance of their duties to the Fund. In the normal course of business, the Fund may also enter into contracts that provide general indemnifications. The Fund's maximum exposure under these arrangements is unknown as this would be dependent on future claims that may be made against the Fund. The risk of material loss from such claims is considered remote.
Annual Report
Report of Independent Registered Public Accounting Firm
To the Trustees of Fidelity Investment Trust and the Shareholders of Fidelity Latin America Fund:
In our opinion, the accompanying statement of assets and liabilities, including the schedule of investments, and the related statements of operations and of changes in net assets and the financial highlights present fairly, in all material respects, the financial position of Fidelity Latin America Fund (a fund of Fidelity Investment Trust) at October 31, 2015, the results of its operations for the year then ended, the changes in its net assets for each of the two years in the period then ended and the financial highlights for each of the five years in the period then ended, in conformity with accounting principles generally accepted in the United States of America. These financial statements and financial highlights (hereafter referred to as "financial statements") are the responsibility of the Fidelity Latin America Fund's management. Our responsibility is to express an opinion on these financial statements based on our audits. We conducted our audits of these financial statements in accordance with the standards of the Public Company Accounting Oversight Board (United States). Those standards require that we plan and perform the audit to obtain reasonable assurance about whether the financial statements are free of material misstatement. An audit includes examining, on a test basis, evidence supporting the amounts and disclosures in the financial statements, assessing the accounting principles used and significant estimates made by management, and evaluating the overall financial statement presentation. We believe that our audits, which included confirmation of securities at October 31, 2015 by correspondence with the custodian and brokers, provide a reasonable basis for our opinion.
PricewaterhouseCoopers LLP
Boston, Massachusetts
December 22, 2015
Annual Report
Trustees and Officers
The Trustees, Member of the Advisory Board, and officers of the trust and fund, as applicable, are listed below. The Board of Trustees governs the fund and is responsible for protecting the interests of shareholders. The Trustees are experienced executives who meet periodically throughout the year to oversee the fund's activities, review contractual arrangements with companies that provide services to the fund, oversee management of the risks associated with such activities and contractual arrangements, and review the fund's performance. Each of the Trustees oversees 170 funds.
The Trustees hold office without limit in time except that (a) any Trustee may resign; (b) any Trustee may be removed by written instrument, signed by at least two-thirds of the number of Trustees prior to such removal; (c) any Trustee who requests to be retired or who has become incapacitated by illness or injury may be retired by written instrument signed by a majority of the other Trustees; and (d) any Trustee may be removed at any special meeting of shareholders by a two-thirds vote of the outstanding voting securities of the trust. Each Trustee who is not an interested person (as defined in the 1940 Act) of the trust and the fund (Independent Trustee), shall retire not later than the last day of the calendar year in which his or her 75th birthday occurs. The Independent Trustees may waive this mandatory retirement age policy with respect to individual Trustees. The officers and Advisory Board Member hold office without limit in time, except that any officer and Advisory Board Member may resign or may be removed by a vote of a majority of the Trustees at any regular meeting or any special meeting of the Trustees. Except as indicated, each individual has held the office shown or other offices in the same company for the past five years.
Experience, Skills, Attributes, and Qualifications of the Fund's Trustees. The Governance and Nominating Committee has adopted a statement of policy that describes the experience, qualifications, attributes, and skills that are necessary and desirable for potential Independent Trustee candidates (Statement of Policy). The Board believes that each Trustee satisfied at the time he or she was initially elected or appointed a Trustee, and continues to satisfy, the standards contemplated by the Statement of Policy. The Governance and Nominating Committee also engages professional search firms to help identify potential Independent Trustee candidates who have the experience, qualifications, attributes, and skills consistent with the Statement of Policy. From time to time, additional criteria based on the composition and skills of the current Independent Trustees, as well as experience or skills that may be appropriate in light of future changes to board composition, business conditions, and regulatory or other developments, have also been considered by the professional search firms and the Governance and Nominating Committee. In addition, the Board takes into account the Trustees' commitment and participation in Board and committee meetings, as well as their leadership of standing and ad hoc committees throughout their tenure.
In determining that a particular Trustee was and continues to be qualified to serve as a Trustee, the Board has considered a variety of criteria, none of which, in isolation, was controlling. The Board believes that, collectively, the Trustees have balanced and diverse experience, qualifications, attributes, and skills, which allow the Board to operate effectively in governing the fund and protecting the interests of shareholders. Information about the specific experience, skills, attributes, and qualifications of each Trustee, which in each case led to the Board's conclusion that the Trustee should serve (or continue to serve) as a trustee of the fund, is provided below.
Board Structure and Oversight Function. James C. Curvey is an interested person (as defined in the 1940 Act) and currently serves as Chairman. The Trustees have determined that an interested Chairman is appropriate and benefits shareholders because an interested Chairman has a personal and professional stake in the quality and continuity of services provided to the fund. Independent Trustees exercise their informed business judgment to appoint an individual of their choosing to serve as Chairman, regardless of whether the Trustee happens to be independent or a member of management. The Independent Trustees have determined that they can act independently and effectively without having an Independent Trustee serve as Chairman and that a key structural component for assuring that they are in a position to do so is for the Independent Trustees to constitute a substantial majority for the Board. The Independent Trustees also regularly meet in executive session. Ned C. Lautenbach serves as Chairman of the Independent Trustees and as such (i) acts as a liaison between the Independent Trustees and management with respect to matters important to the Independent Trustees and (ii) with management prepares agendas for Board meetings.
Fidelity funds are overseen by different Boards of Trustees. The fund's Board oversees Fidelity's high income and certain equity funds, and other Boards oversee Fidelity's investment-grade bond, money market, asset allocation, and sector funds. The asset allocation funds may invest in Fidelity funds overseen by the fund's Board. The use of separate Boards, each with its own committee structure, allows the Trustees of each group of Fidelity funds to focus on the unique issues of the funds they oversee, including common research, investment, and operational issues. On occasion, the separate Boards establish joint committees to address issues of overlapping consequences for the Fidelity funds overseen by each Board.
The Trustees operate using a system of committees to facilitate the timely and efficient consideration of all matters of importance to the Trustees, the fund, and fund shareholders and to facilitate compliance with legal and regulatory requirements and oversight of the fund's activities and associated risks. The Board, acting through its committees, has charged FMR and its affiliates with (i) identifying events or circumstances the occurrence of which could have demonstrably adverse effects on the fund's business and/or reputation; (ii) implementing processes and controls to lessen the possibility that such events or circumstances occur or to mitigate the effects of such events or circumstances if they do occur; and (iii) creating and maintaining a system designed to evaluate continuously business and market conditions in order to facilitate the identification and implementation processes described in (i) and (ii) above. Because the day-to-day operations and activities of the fund are carried out by or through FMR, its affiliates and other service providers, the fund's exposure to risks is mitigated but not eliminated by the processes overseen by the Trustees. While each of the Board's committees has responsibility for overseeing different aspects of the fund's activities, oversight is exercised primarily through the Operations, Audit, and Compliance Committees. In addition, the Independent Trustees have worked with FMR to enhance the Board's oversight of investment and financial risks, legal and regulatory risks, technology risks, and operational risks, including the development of additional risk reporting to the Board. For example, a working group comprised of Independent Trustees and FMR has worked and continues to work to review the Fidelity funds' valuation-related activities, reporting and risk management. Appropriate personnel, including but not limited to the fund's Chief Compliance Officer (CCO), FMR's internal auditor, the independent accountants, the fund's Treasurer and portfolio management personnel, make periodic reports to the Board's committees, as appropriate, including an annual review of Fidelity's risk management program for the Fidelity funds. The responsibilities of each standing committee, including their oversight responsibilities, are described further under "Standing Committees of the Fund's Trustees."
Annual Report
The fund's Statement of Additional Information (SAI) includes more information about the Trustees. To request a free copy, call Fidelity at 1-877-208-0098.
Interested Trustees*:
Correspondence intended for each Trustee who is an interested person may be sent to Fidelity Investments, 245 Summer Street, Boston, Massachusetts 02210.
Name, Year of Birth; Principal Occupations and Other Relevant Experience+ |
James C. Curvey (1935) |
Year of Election or Appointment: 2007 Trustee Chairman of the Board of Trustees |
| Mr. Curvey also serves as Trustee of other Fidelity funds. Mr. Curvey is a Director of Fidelity Research & Analysis Co. (investment adviser firm, 2009-present), and Vice Chairman (2007-present) and Director of FMR LLC (diversified financial services company). In addition, Mr. Curvey serves as an Overseer for the Boston Symphony Orchestra and a member of the board of Artis-Naples, Naples, Florida, and as a Trustee for Brewster Academy, Wolfeboro, New Hampshire. Previously, Mr. Curvey served as a Director of Fidelity Investments Money Management, Inc. (investment adviser firm, 2009-2014) and a Director of FMR and FMR Co., Inc. (investment adviser firms, 2007-2014). |
Charles S. Morrison (1960) |
Year of Election or Appointment: 2014 Trustee |
| Mr. Morrison also serves as Trustee of other funds. He serves as a Director of Fidelity Investments Money Management, Inc. (FIMM) (investment adviser firm, 2014-present), Director of Fidelity SelectCo, LLC (investment adviser firm, 2014-present), President, Asset Management (2014-present), and is an employee of Fidelity Investments. Previously, Mr. Morrison served as Vice President of Fidelity's Fixed Income and Asset Allocation Funds (2012-2014), President, Fixed Income (2011-2014), Vice President of Fidelity's Money Market Funds (2005-2009), President, Money Market Group Leader of FMR (investment adviser firm, 2009), and Senior Vice President, Money Market Group of FMR (2004-2009). Mr. Morrison also served as Vice President of Fidelity's Bond Funds (2002-2005), certain Balanced Funds (2002-2005), and certain Asset Allocation Funds (2002-2007), and as Senior Vice President (2002-2005) of Fidelity's Bond Division. |
* Trustees have been determined to be "Interested Trustees" by virtue of, among other things, their affiliation with the trust or various entities under common control with FMR.
+ The information above includes each Trustee's principal occupation during the last five years and other information relating to the experience, attributes, and skills relevant to each Trustee's qualifications to serve as a Trustee, which led to the conclusion that each Trustee should serve as a Trustee for the fund.
Annual Report
Trustees and Officers - continued
Independent Trustees:
Correspondence intended for each Independent Trustee (that is, the Trustees other than the Interested Trustees) may be sent to Fidelity Investments, P.O. Box 55235, Boston, Massachusetts 02205-5235.
Name, Year of Birth; Principal Occupations and Other Relevant Experience+ |
Dennis J. Dirks (1948) |
Year of Election or Appointment: 2005 Trustee |
| Mr. Dirks also serves as Trustee of other Fidelity funds. Prior to his retirement in May 2003, Mr. Dirks was Chief Operating Officer and a member of the Board of The Depository Trust & Clearing Corporation (DTCC). He also served as President, Chief Operating Officer, and Board member of The Depository Trust Company (DTC) and President and Board member of the National Securities Clearing Corporation (NSCC). In addition, Mr. Dirks served as Chief Executive Officer and Board member of the Government Securities Clearing Corporation, Chief Executive Officer and Board member of the Mortgage-Backed Securities Clearing Corporation, as a Trustee and a member of the Finance Committee of Manhattan College (2005-2008), as a Trustee and a member of the Finance Committee of AHRC of Nassau County (2006-2008), and as a member of the Independent Directors Council (IDC) Governing Council (2010-2015). Mr. Dirks is a member of the Board of Directors for The Brookville Center for Children's Services, Inc. (2009-present). |
Alan J. Lacy (1953) |
Year of Election or Appointment: 2008 Trustee |
| Mr. Lacy also serves as Trustee of other Fidelity funds. Mr. Lacy serves as a member of the Board of Directors of Dave & Buster's Entertainment, Inc. (restaurant and entertainment complexes, 2010-present) and Bristol-Myers Squibb Company (global pharmaceuticals, 2008-present). In addition, Mr. Lacy served as Senior Adviser (2007-2014) of Oak Hill Capital Partners, L.P. (private equity) and also served as Chief Executive Officer (2000-2005) and Vice Chairman (2005-2006) of Sears Holdings Corporation and Sears, Roebuck and Co. (retail). Mr. Lacy is a member of the Board of Trustees of The National Parks Conservation Association (2006-present). Previously, Mr. Lacy served as Chairman of the Board of Trustees of the National Parks Conservation Association (2008-2011) and as a member of the Board of Directors for The Western Union Company (global money transfer, 2006-2011), The Hillman Companies, Inc. (hardware wholesalers, 2010-2014), and Earth Fare, Inc. (retail grocery, 2010-2014). |
Ned C. Lautenbach (1944) |
Year of Election or Appointment: 2000 Trustee Chairman of the Independent Trustees |
| Mr. Lautenbach also serves as Trustee of other Fidelity funds. Mr. Lautenbach currently serves as the Lead Director of the Eaton Corporation Board of Directors (diversified industrial, 1997-present). Mr. Lautenbach is Chairman of the Board of Directors of Artis-Naples in Naples, Florida (2012-present), a member of the Council on Foreign Relations (1994-present), and a member of the Board of Governors, State University System of Florida (2013-present). Previously, Mr. Lautenbach was a Partner/Advisory Partner at Clayton, Dubilier & Rice, LLC (private equity investment, 1998-2010), as well as a Director of Sony Corporation (2006-2007). |
Joseph Mauriello (1944) |
Year of Election or Appointment: 2008 Trustee |
| Mr. Mauriello also serves as Trustee of other Fidelity funds. Prior to his retirement in January 2006, Mr. Mauriello served in numerous senior management positions including Deputy Chairman and Chief Operating Officer (2004-2005), and Vice Chairman of Financial Services (2002-2004) of KPMG LLP US (professional services, 1965-2005). Mr. Mauriello currently serves as a member of the Board of Directors of XL Group plc. (global insurance and re-insurance, 2006-present) and the Independent Directors Council (IDC) Governing Council (2015-present). Previously, Mr. Mauriello served as a Director of the Hamilton Funds of the Bank of New York (2006-2007) and of Arcadia Resources Inc. (health care services and products, 2007-2012). |
Robert W. Selander (1950) |
Year of Election or Appointment: 2011 Trustee |
| Mr. Selander also serves as Trustee of other Fidelity funds. Mr. Selander serves as a Director of The Western Union Company (global money transfer, 2014-present). Previously, Mr. Selander served as a Member of the Advisory Board of other Fidelity funds (2011), and Executive Vice Chairman (2010), Chief Executive Officer (2009-2010), and President and Chief Executive Officer (1997-2009) of Mastercard, Inc. |
Cornelia M. Small (1944) |
Year of Election or Appointment: 2005 Trustee |
| Ms. Small also serves as Trustee of other Fidelity funds. Ms. Small is a member of the Board of Directors (2009-present) and Chair of the Investment Committee (2010-present) of the Teagle Foundation. Ms. Small also serves on the Investment Committee of the Berkshire Taconic Community Foundation (2008-present). Previously, Ms. Small served as Chairperson (2002-2008) and a member of the Investment Committee and Chairperson (2008-2012) and a member of the Board of Trustees of Smith College. In addition, Ms. Small served as Chief Investment Officer, Director of Global Equity Investments, and a member of the Board of Directors of Scudder, Stevens & Clark and Scudder Kemper Investments. |
William S. Stavropoulos (1939) |
Year of Election or Appointment: 2001 Trustee Vice Chairman of the Independent Trustees |
| Mr. Stavropoulos also serves as Trustee of other Fidelity funds. Mr. Stavropoulos serves as President and Founder of the Michigan Baseball Foundation, the Great Lakes Loons (2007-present). Mr. Stavropoulos is Chairman Emeritus of the Board of Directors of The Dow Chemical Company, where he previously served in numerous senior management positions, including President, CEO (1995-2000; 2002-2004), Chairman of the Executive Committee (2000-2006), and as a member of the Board of Directors (1990-2006). Currently, Mr. Stavropoulos is Chairman of the Board of Directors of Univar Inc. (global distributor of commodity and specialty chemicals), a Director of Teradata Corporation (data warehousing and technology solutions), and Maersk Inc. (industrial conglomerate), and a member of the Advisory Board for Metalmark Capital LLC (private equity investment, 2005-present). Mr. Stavropoulos is an operating advisor to Clayton, Dubilier & Rice, LLC (private equity investment). In addition, Mr. Stavropoulos is a member of the University of Notre Dame Advisory Council for the College of Science, a Trustee of the Rollin L. Gerstacker Foundation, and a Director of the Naples Philharmonic Center for the Arts. Previously, Mr. Stavropoulos served as a Director of Chemical Financial Corporation (bank holding company, 1993-2012) and Tyco International, Ltd. (multinational manufacturing and services, 2007-2012). |
David M. Thomas (1949) |
Year of Election or Appointment: 2008 Trustee |
| Mr. Thomas also serves as Trustee of other Fidelity funds. Mr. Thomas serves as Non-Executive Chairman of the Board of Directors of Fortune Brands Home and Security (home and security products, 2011-present), as a member of the Board of Directors (2004-present) and Presiding Director (2013-present) of Interpublic Group of Companies, Inc. (marketing communication), and as a member of the Board of Trustees of the University of Florida (2013-present). Previously, Mr. Thomas served as Executive Chairman (2005-2006) and Chairman and Chief Executive Officer (2000-2005) of IMS Health, Inc. (pharmaceutical and healthcare information solutions), and a Director of Fortune Brands, Inc. (consumer products, 2000-2011). |
+ The information above includes each Trustee's principal occupation during the last five years and other information relating to the experience, attributes, and skills relevant to each Trustee's qualifications to serve as a Trustee, which led to the conclusion that each Trustee should serve as a Trustee for the fund.
Advisory Board Member and Officers:
Correspondence intended for each officer and Peter S. Lynch may be sent to Fidelity Investments, 245 Summer Street, Boston, Massachusetts 02210. Officers appear below in alphabetical order.
Name, Year of Birth; Principal Occupation |
Peter S. Lynch (1944) |
Year of Election or Appointment: 2003 Member of the Advisory Board |
| Mr. Lynch also serves as Member of the Advisory Board of other Fidelity funds. Mr. Lynch is Vice Chairman and a Director of FMR (investment adviser firm) and FMR Co., Inc. (investment adviser firm). In addition, Mr. Lynch serves as a Trustee of Boston College and as the Chairman of the Inner-City Scholarship Fund. Previously, Mr. Lynch served on the Special Olympics International Board of Directors (1997-2006). |
Elizabeth Paige Baumann (1968) |
Year of Election or Appointment: 2012 Anti-Money Laundering (AML) Officer |
| Ms. Baumann also serves as AML Officer of other funds. She is Chief AML Officer of FMR LLC (diversified financial services company, 2012-present) and is an employee of Fidelity Investments. Previously, Ms. Baumann served as Vice President and Deputy Anti-Money Laundering Officer (2007-2012). |
Marc R. Bryant (1966) |
Year of Election or Appointment: 2015 Secretary and Chief Legal Officer (CLO) |
| Mr. Bryant also serves as Secretary and CLO of other funds. Mr. Bryant serves as CLO, Secretary, and Senior Vice President of Fidelity Management & Research Company (investment adviser firm, 2015-present) and FMR Co., Inc. (investment adviser firm, 2015-present); Secretary of Fidelity SelectCo, LLC (investment adviser firm, 2015-present) and Fidelity Investments Money Management, Inc. (investment adviser firm, 2015-present); and CLO of Fidelity Management & Research (Hong Kong) Limited (investment adviser firm, 2015-present). He is Senior Vice President and Deputy General Counsel of FMR LLC (diversified financial services company). Previously, Mr. Bryant served as Secretary and Chief Legal Officer of Fidelity Rutland Square Trust II (2010-2014) and Assistant Secretary of Fidelity's Fixed Income and Asset Allocation Funds (2013-2015). Prior to joining Fidelity Investments, Mr. Bryant served as a Senior Vice President and the Head of Global Retail Legal for AllianceBernstein L.P. (2006-2010), and as the General Counsel for ProFund Advisors LLC (2001-2006). |
William C. Coffey (1969) |
Year of Election or Appointment: 2009 Assistant Secretary |
| Mr. Coffey also serves as Assistant Secretary of other funds. He is Senior Vice President and Deputy General Counsel of FMR LLC (diversified financial services company, 2010-present), and is an employee of Fidelity Investments. Previously, Mr. Coffey served as Vice President and Associate General Counsel of FMR LLC (2005-2009). |
Timothy M. Cohen (1969) |
Year of Election or Appointment: 2014 Vice President of certain Equity Funds |
| Mr. Cohen also serves as Vice President of other funds. Mr. Cohen serves as Chief Compliance Officer of FMR Investment Management (U.K.) Limited (investment adviser firm, 2013-present) and is an employee of Fidelity Investments. Previously, Mr. Cohen served as a Director of FMR Investment Management (U.K.) Limited (2013-2015). |
Jonathan Davis (1968) |
Year of Election or Appointment: 2010 Assistant Treasurer |
| Mr. Davis also serves as Assistant Treasurer of other funds, and is an employee of Fidelity Investments. Previously, Mr. Davis served as Vice President and Associate General Counsel of FMR LLC (diversified financial services company, 2003-2010). |
Adrien E. Deberghes (1967) |
Year of Election or Appointment: 2008 Deputy Treasurer |
| Mr. Deberghes also serves as an officer of other funds. He is an employee of Fidelity Investments (2008-present). Prior to joining Fidelity Investments, Mr. Deberghes was Senior Vice President of Mutual Fund Administration at State Street Corporation (2007-2008), Senior Director of Mutual Fund Administration at Investors Bank & Trust (2005-2007), and Director of Finance for Dunkin' Brands (2000-2005). |
Stephanie J. Dorsey (1969) |
Year of Election or Appointment: 2010 Assistant Treasurer |
| Ms. Dorsey also serves as an officer of other funds. She is an employee of Fidelity Investments (2008-present) and has served in other fund officer roles. Prior to joining Fidelity Investments, Ms. Dorsey served as Treasurer (2004-2008) of the JPMorgan Mutual Funds and Vice President (2004-2008) of JPMorgan Chase Bank. |
Howard J. Galligan III (1966) |
Year of Election or Appointment: 2014 Chief Financial Officer |
| Mr. Galligan also serves as Chief Financial Officer of other funds. Mr. Galligan serves as President of Fidelity Pricing and Cash Management Services (FPCMS) (2014-present) and as a Director of Strategic Advisers, Inc. (investment adviser firm, 2008-present). Previously, Mr. Galligan served as Chief Administrative Officer of Asset Management (2011-2014) and Chief Operating Officer and Senior Vice President of Investment Support for Strategic Advisers, Inc. (2003-2011). |
Scott C. Goebel (1968) |
Year of Election or Appointment: 2015 Vice President |
| Mr. Goebel serves as Vice President of other funds and is an employee of Fidelity Investments (2001-present). Previously, Mr. Goebel served as Secretary of Fidelity SelectCo, LLC (investment adviser firm, 2013-2015), Fidelity Investments Money Management, Inc. (FIMM) (investment adviser firm, 2010-2015), and Fidelity Research and Analysis Company (FRAC) (investment adviser firm, 2010-2015); General Counsel, Secretary, and Senior Vice President of Fidelity Management & Research Company (investment adviser firm, 2008-2015) and FMR Co., Inc. (investment adviser firm, 2008-2015); Assistant Secretary of Fidelity Management & Research (Japan) Limited (investment adviser firm, 2008-2015) and FMR Investment Management (U.K.) Limited (investment adviser firm, 2008-2015); Chief Legal Officer (CLO) of Fidelity Management & Research (Hong Kong) Limited (investment adviser firm, 2008-2015); Secretary and CLO of certain Fidelity funds (2008-2015); Assistant Secretary of FIMM (2008-2010), FRAC (2008-2010), and certain funds (2007-2008); and as Vice President and Secretary of Fidelity Distributors Corporation (FDC) (2005-2007). |
Brian B. Hogan (1964) |
Year of Election or Appointment: 2009 Vice President |
| Mr. Hogan also serves as Trustee or Vice President of other funds. Mr. Hogan serves as a Director of Fidelity SelectCo, LLC (investment adviser firm, 2014-present) and President of the Equity Division of FMR (investment adviser firm, 2009-present). Previously, Mr. Hogan served as Senior Vice President, Equity Research of FMR (2006-2009) and as a portfolio manager. |
Chris Maher (1972) |
Year of Election or Appointment: 2013 Assistant Treasurer |
| Mr. Maher serves as Assistant Treasurer of other funds. Mr. Maher is Vice President of Valuation Oversight and is an employee of Fidelity Investments. Previously, Mr. Maher served as Vice President of Asset Management Compliance (2013), Vice President of the Program Management Group of FMR (investment adviser firm, 2010-2013), and Vice President of Valuation Oversight (2008-2010). |
Kenneth B. Robins (1969) |
Year of Election or Appointment: 2008 President and Treasurer |
| Mr. Robins also serves as an officer of other funds. Mr. Robins serves as Executive Vice President of Fidelity Investments Money Management, Inc. (FIMM) (investment adviser firm, 2013-present) and is an employee of Fidelity Investments (2004-present). Previously, Mr. Robins served in other fund officer roles. |
Stacie M. Smith (1974) |
Year of Election or Appointment: 2013 Deputy Treasurer |
| Ms. Smith also serves as an officer of other funds. She is an employee of Fidelity Investments (2009-present) and has served in other fund officer roles. Prior to joining Fidelity Investments, Ms. Smith served as Senior Audit Manager of Ernst & Young LLP (1996-2009). |
Renee Stagnone (1975) |
Year of Election or Appointment: 2013 Deputy Treasurer |
| Ms. Stagnone also serves as Deputy Treasurer of other funds. Ms. Stagnone is an employee of Fidelity Investments (1997-present). |
Linda J. Wondrack (1964) |
Year of Election or Appointment: 2014 Chief Compliance Officer |
| Ms. Wondrack also serves as Chief Compliance Officer of other funds. Ms. Wondrack is Executive Vice President and head of the Ethics Office and Asset Management Compliance for Fidelity Investments (2012-present). Ms. Wondrack also serves as Chief Compliance Officer of Fidelity SelectCo, LLC (investment adviser firm, 2014-present); Chief Compliance Officer of Impresa Management LLC (2013-present); and Chief Compliance Officer of FMR Co., Inc. (investment adviser firm), Fidelity Investments Money Management, Inc. (investment adviser firm), Fidelity Management & Research (Japan) Limited (investment adviser firm), FMR Investment Management (U.K.) Limited (investment adviser firm), Fidelity Management & Research (Hong Kong) (investment adviser firm), Fidelity Management & Research Company (investment adviser firm), FIAM LLC (investment adviser firm), and Strategic Advisers, Inc. (investment adviser firm), Ballyrock Investment Advisors LLC, and Northern Neck Investors LLC (2012-present). Previously, Ms. Wondrack served as Senior Vice President and Chief Compliance Officer for Columbia Management Investment Advisers, LLC (2005-2012); Chief Compliance Officer for certain funds within the Columbia Family of Funds (2007-2012); and Senior Vice President of Compliance Risk Management at Bank of America (2005-2010). |
Joseph F. Zambello (1957) |
Year of Election or Appointment: 2011 Deputy Treasurer |
| Mr. Zambello also serves as Deputy Treasurer of other funds. Mr. Zambello is an employee of Fidelity Investments (1991-present). Previously, Mr. Zambello served as Vice President of the Program Management Group of FMR (investment adviser firm, 2009-2011) and Vice President of the Transfer Agent Oversight Group (2005-2009). |
Annual Report
Distributions (Unaudited)
A percentage of the dividends distributed during the fiscal year may be taken into account as a dividend for the purposes of the maximum rate under section 1(h)(11) of the Internal Revenue Code.
| 12/05/2014 | 12/26/2014 |
Class A | 66% | 59% |
Class T | 82% | 59% |
Class B | 0% | 59% |
Class C | 100% | 59% |
The amounts per share which represent income derived from sources within, and taxes paid to, foreign countries or possessions of the United States are as follows:
| Pay Date | Income | Taxes |
Class A | 12/08/2014 | $0.3945 | $0.0895 |
Class A | 12/29/2014 | $0.0300 | $0.0000 |
Class T | 12/08/2014 | $0.3145 | $0.0895 |
Class T | 12/29/2014 | $0.0300 | $0.0000 |
Class B | 12/08/2014 | $0.0000 | $0.0000 |
Class B | 12/29/2014 | $0.0300 | $0.0000 |
Class C | 12/08/2014 | $0.1395 | $0.0895 |
Class C | 12/29/2014 | $0.0300 | $0.0000 |
The fund will notify shareholders in January 2016 of amounts for use in preparing 2015 income tax returns.
Annual Report
Board Approval of Investment Advisory Contracts and Management Fees
Fidelity Latin America Fund
Each year, the Board of Trustees, including the Independent Trustees (together, the Board), votes on the renewal of the management contract with Fidelity Management & Research Company (FMR) and the sub-advisory agreements (together, the Advisory Contracts) for the fund. The Board, assisted by the advice of fund counsel and Independent Trustees' counsel, requests and considers a broad range of information relevant to the renewal of the Advisory Contracts throughout the year.
The Board meets regularly and, at each of its meetings, covers an extensive agenda of topics and materials and considers factors that are relevant to its annual consideration of the renewal of the fund's Advisory Contracts, including the services and support provided to the fund and its shareholders. The Board has established various standing committees (Committees), each composed of and chaired by Independent Trustees with varying backgrounds, to which the Board has assigned specific subject matter responsibilities in order to enhance effective decision-making by the Board. The Board, acting directly and through its Committees, requests and receives information concerning the annual consideration of the renewal of the fund's Advisory Contracts. The Board also meets as needed to consider matters specifically related to the Board's annual consideration of the renewal of the Advisory Contracts. Members of the Board may also meet with trustees of other Fidelity funds through ad hoc joint committees to discuss certain matters relevant to all of the Fidelity funds.
At its July 2015 meeting, the Board unanimously determined to renew the fund's Advisory Contracts. In reaching its determination, the Board considered all factors it believed relevant, including (i) the nature, extent, and quality of the services to be provided to the fund and its shareholders (including the investment performance of the fund); (ii) the competitiveness of the fund's management fee and total expense ratio relative to peer funds; (iii) the total costs of the services to be provided by and the profits to be realized by Fidelity from its relationship with the fund; and (iv) the extent to which (if any) economies of scale exist and would be realized as the fund grows, and whether any economies of scale are appropriately shared with fund shareholders.
In considering whether to renew the Advisory Contracts for the fund, the Board reached a determination, with the assistance of fund counsel and Independent Trustees' counsel and through the exercise of its business judgment, that the renewal of the Advisory Contracts was in the best interests of the fund and its shareholders and that the compensation payable under the Advisory Contracts was fair and reasonable. The Board's decision to renew the Advisory Contracts was not based on any single factor, but rather was based on a comprehensive consideration of all the information provided to the Board at its meetings throughout the year. The Board, in reaching its determination to renew the Advisory Contracts, was aware that shareholders of the fund have a broad range of investment choices available to them, including a wide choice among funds offered by Fidelity's competitors, and that the fund's shareholders, who have the opportunity to review and weigh the disclosure provided by the fund in its prospectus and other public disclosures, have chosen to invest in this fund, which is part of the Fidelity family of funds.
Nature, Extent, and Quality of Services Provided. The Board considered Fidelity's staffing as it relates to the fund, including the backgrounds of investment personnel of Fidelity, and also considered the fund's investment objective, strategies, and related investment philosophy. The Independent Trustees also had discussions with senior management of Fidelity's investment operations and investment groups. The Board considered the structure of the portfolio manager compensation program and whether this structure provides appropriate incentives to act in the best interests of the fund. Additionally, the Board considered the portfolio managers' investments, if any, in the funds that they manage.
Resources Dedicated to Investment Management and Support Services. The Board and the Fund Oversight and Research Committees reviewed the general qualifications and capabilities of Fidelity's investment staff, including its size, education, experience, and resources, as well as Fidelity's approach to recruiting, training, managing, and compensating investment personnel. The Board noted that Fidelity has continued to increase the resources devoted to non-U.S. offices, including expansion of Fidelity's global investment organization. The Board also noted that Fidelity's analysts have extensive resources, tools and capabilities that allow them to conduct sophisticated quantitative and fundamental analysis, as well as credit analysis of issuers, counterparties and guarantors. Further, the Board considered that Fidelity's investment professionals have sufficient access to global information and data so as to provide competitive investment results over time, and that those professionals also have access to sophisticated tools that permit them to assess portfolio construction and risk and performance attribution characteristics continuously, as well as to transmit new information and research conclusions rapidly around the world. Additionally, in its deliberations, the Board considered Fidelity's trading, risk management, and compliance capabilities and resources, which are integral parts of the investment management process.
Shareholder and Administrative Services. The Board considered (i) the nature, extent, quality, and cost of advisory, administrative, and shareholder services performed by FMR, the sub-advisers (together with FMR, the Investment Advisers), and their affiliates under the Advisory Contracts and under separate agreements covering transfer agency, pricing and bookkeeping, and securities lending services for the fund; (ii) the nature and extent of the supervision of third party service providers, principally custodians and subcustodians; and (iii) the resources devoted to, and the record of compliance with, the fund's compliance policies and procedures. The Board also reviewed the allocation of fund brokerage, including allocations to brokers affiliated with the Investment Advisers, the use of brokerage commissions to pay fund expenses, and the use of "soft" commission dollars to pay for research services.
Annual Report
The Board noted that the growth of fund assets over time across the complex allows Fidelity to reinvest in the development of services designed to enhance the value or convenience of the Fidelity funds as investment vehicles. These services include 24-hour access to account information and market information through telephone representatives and over the Internet, investor education materials and asset allocation tools, and the expanded availability of Fidelity Investor Centers.
In 2014, the Board formed an ad hoc Committee on Transfer Agency Fees to review the variety of transfer agency fee structures throughout the industry and Fidelity's competitive positioning with respect to industry participants.
Investment in a Large Fund Family. The Board considered the benefits to shareholders of investing in a Fidelity fund, including the benefits of investing in a fund that is part of a large family of funds offering a variety of investment disciplines and providing a large variety of mutual fund investor services. The Board noted that Fidelity had taken, or had made recommendations that resulted in the Fidelity funds taking, a number of actions over the previous year that benefited particular funds, including (i) continuing to dedicate additional resources to investment research and to the support of the senior management team that oversees asset management; (ii) continuing efforts to enhance Fidelity's global research capabilities; (iii) launching new funds and making other enhancements to meet client needs; (iv) reducing management fees and total expenses for certain index funds and diversified international funds; (v) continuing to launch dedicated lower cost underlying funds to meet portfolio construction needs related to expanding underlying fund options for Fidelity funds of funds, specifically for the Freedom Fund product lines; (vi) rationalizing product lines and gaining increased efficiencies through fund mergers; (vii) launching active fixed-income exchange-traded funds; (viii) continuing to develop, acquire and implement systems and technology to improve services to the funds and information security and to increase efficiency; (ix) implementing investment enhancements to further strengthen Fidelity's target date product line to increase investors' probability of success in achieving their goals; (x) modifying the eligibility criteria for certain share classes to accommodate roll-over assets from employer-sponsored retirement plans; (xi) launching a new Class W of the Freedom Index Funds to attract and retain Fidelity record-kept retirement plan assets; and (xii) implementing changes to Fidelity's money market product line in response to recent money market regulatory reforms.
Investment Performance. The Board considered whether the fund has operated in accordance with its investment objective, as well as its record of compliance with its investment restrictions and its performance history.
The Board took into account discussions with representatives of the Investment Advisers about fund investment performance that occur at Board meetings throughout the year. In this regard the Board noted that as part of regularly scheduled fund reviews and other reports to the Board on fund performance, the Board considers annualized return information for the fund, for different time periods, measured against a securities market index ("benchmark index") and a peer group of funds with similar objectives ("peer group"), if any. In its evaluation of fund investment performance, the Board gave particular attention to information indicating changes in performance of certain Fidelity funds for specific time periods and discussed with the Investment Advisers the reasons for any overperformance or underperformance.
In addition to reviewing absolute and relative fund performance, the Independent Trustees periodically consider the appropriateness of fund performance metrics in evaluating the results achieved. In general, the Independent Trustees believe that fund performance should be evaluated based on net performance (after fees and expenses) of both the highest performing and lowest performing fund share classes, where applicable, compared to appropriate benchmark indices, over appropriate time periods that may include full market cycles, and compared to peer groups, as applicable, over the same periods, taking into account relevant factors including the following: general market conditions; issuer-specific information; and fund cash flows and other factors.
The Independent Trustees recognize that shareholders evaluate performance on a net basis over their own holding periods, for which one-, three-, and five-year periods are often used as a proxy. For this reason, the performance information reviewed by the Board also included net cumulative calendar year total return information for the fund and an appropriate benchmark index for the most recent one-, three-, and five-year periods, as shown below. A peer group is not shown below because the fund does not generally utilize a peer group for performance comparison purposes.
Annual Report
Board Approval of Investment Advisory Contracts and Management Fees - continued
Fidelity Latin America Fund

The Board has discussed the fund's underperformance with FMR and has engaged with FMR to consider what steps might be taken to remediate the fund's underperformance.
Based on its review, the Board concluded that the nature, extent, and quality of services provided to the fund under the Advisory Contracts should benefit the shareholders of the fund.
Competitiveness of Management Fee and Total Expense Ratio. The Board considered the fund's management fee and total expense ratio compared to "mapped groups" of competitive funds and classes created for the purpose of facilitating the Trustees' competitive analysis of management fees and total expenses. Fidelity creates "mapped groups" by combining similar Lipper investment objective categories that have comparable investment mandates. Combining Lipper investment objective categories aids the Board's management fee and total expense ratio comparisons by broadening the competitive group used for comparison.
Management Fee. The Board considered two proprietary management fee comparisons for the 12-month periods shown in basis points (BP) in the chart below. The group of Lipper funds used by the Board for management fee comparisons is referred to below as the "Total Mapped Group." The Total Mapped Group comparison focuses on a fund's standing in terms of gross management fees before expense reimbursements or caps relative to the total universe of funds with comparable investment mandates, regardless of whether their management fee structures also are comparable. Funds with comparable investment mandates offer exposure to similar types of securities. Funds with comparable management fee structures have similar management fee contractual arrangements (e.g., flat rate charged for advisory services, all-inclusive fee rate, etc.). "TMG %" represents the percentage of funds in the Total Mapped Group that had management fees that were lower than the fund's. For example, a hypothetical TMG % of 20% would mean that 80% of the funds in the Total Mapped Group had higher, and 20% had lower, management fees than the fund. The fund's actual TMG %s and the number of funds in the Total Mapped Group are in the chart below. The "Asset-Size Peer Group" (ASPG) comparison focuses on a fund's standing relative to a subset of non-Fidelity funds within the Total Mapped Group that are similar in size and management fee structure without taking into account performance adjustments, if any. For example, if a fund is in the first quartile of the ASPG, the fund's management fee ranks in the least expensive or lowest 25% of funds in the ASPG. The ASPG represents at least 15% of the funds in the Total Mapped Group with comparable asset size and management fee structures, subject to a minimum of 50 funds (or all funds in the Total Mapped Group if fewer than 50). Additional information, such as the ASPG quartile in which the fund's management fee rate ranked is also included in the chart and considered by the Board.
Annual Report
Fidelity Latin America Fund

The Board noted that the fund's management fee rate ranked below the median of its Total Mapped Group and below the median of its ASPG for 2014.
The Board noted that, in 2014, the ad hoc Committee on Group Fee was formed by it and other Fidelity fund boards to conduct an in-depth review of the "group fee" component of the management fee of funds with such management fee structures. Committee focus included the mechanics of the group fee, the competitive landscape of group fee structures, Fidelity funds with no group fee component and investment products not included in group fee assets. The Board also considered that, for funds subject to the group fee, FMR agreed to voluntarily waive fees over a specified period of time in amounts designed to account for assets converted from certain funds to certain collective investment trusts.
The Board also noted that, in 2013, the ad hoc Committee on Management Fees was formed to conduct an in-depth review of the management fee rates of Fidelity's active equity mutual funds. The Committee focused on the following areas: (i) standard fee structures; (ii) research consumption and trading evolution; (iii) management fee competitiveness/profitability by category; and (iv) factors that drive institutional pricing.
Based on its review, the Board concluded that the fund's management fee is fair and reasonable in light of the services that the fund receives and the other factors considered.
Total Expense Ratio. In its review of each class's total expense ratio, the Board considered the fund's management fee as well as other fund or class expenses, as applicable, such as transfer agent fees, pricing and bookkeeping fees, fund-paid 12b-1 fees, and custodial, legal, and audit fees. The Board also noted that Fidelity may agree to waive fees and expenses from time to time, and the extent to which, if any, it has done so for the fund. As part of its review, the Board also considered the current and historical total expense ratios of each class of the fund compared to competitive fund median expenses. Each class of the fund is compared to those funds and classes in the Total Mapped Group (used by the Board for management fee comparisons) that have a similar sales load structure.
The Board noted that the total expense ratio of each class ranked below its competitive median for 2014.
Fees Charged to Other Fidelity Clients. The Board also considered Fidelity fee structures and other information with respect to clients of Fidelity, such as other funds advised or subadvised by Fidelity, pension plan clients, and other institutional clients with similar mandates. The Board noted the findings of the 2013 ad hoc joint committee (created with the board of other Fidelity funds), which reviewed and compared Fidelity's institutional investment advisory business with its business of providing services to the Fidelity funds, including the differences in services provided, fees charged, and costs incurred, as well as competition in their respective marketplaces.
Based on its review of total expense ratios and fees charged to other Fidelity clients, the Board concluded that the total expense ratio of each class of the fund was reasonable in light of the services that the fund and its shareholders receive and the other factors considered.
Costs of the Services and Profitability. The Board considered the revenues earned and the expenses incurred by Fidelity in conducting the business of developing, marketing, distributing, managing, administering and servicing the fund and servicing the fund's shareholders. The Board also considered the level of Fidelity's profits in respect of all the Fidelity funds.
On an annual basis, Fidelity presents to the Board information about the profitability of its relationship with the fund. Fidelity calculates profitability information for each fund, as well as aggregate profitability information for groups of Fidelity funds and all Fidelity funds, using a series of detailed revenue and cost allocation methodologies which originate with the books and records of Fidelity on which Fidelity's audited financial statements are based. The Audit Committee of the Board reviews any significant changes from the prior year's methodologies.
Annual Report
Board Approval of Investment Advisory Contracts and Management Fees - continued
PricewaterhouseCoopers LLP (PwC), independent registered public accounting firm and auditor to Fidelity and certain Fidelity funds, has been engaged annually by the Board as part of the Board's assessment of Fidelity's profitability analysis. PwC's engagement includes the review and assessment of the methodologies used by Fidelity in determining the revenues and expenses attributable to Fidelity's mutual fund business, and completion of agreed-upon procedures in respect of the mathematical accuracy of fund profitability and its conformity to established allocation methodologies. After considering PwC's reports issued under the engagement and information provided by Fidelity, the Board concluded that while other allocation methods may also be reasonable, Fidelity's profitability methodologies are reasonable in all material respects.
The Board also reviewed Fidelity's non-fund businesses and fall-out benefits related to the mutual fund business as well as cases where Fidelity's affiliates may benefit from or be related to the fund's business.
The Board considered the costs of the services provided by and the profits realized by Fidelity in connection with the operation of the fund and was satisfied that the profitability was not excessive.
Economies of Scale. The Board considered whether there have been economies of scale in respect of the management of the Fidelity funds, whether the Fidelity funds (including the fund) have appropriately benefited from any such economies of scale, and whether there is potential for realization of any further economies of scale. The Board considered the extent to which the fund will benefit from economies of scale as assets grow through increased services to the fund, through waivers or reimbursements, or through fee or expense ratio reductions. The Board also noted that in 2013, it and the boards of other Fidelity funds created an ad hoc committee (the Economies of Scale Committee) to analyze whether Fidelity attains economies of scale in respect of the management and servicing of the Fidelity funds, whether the Fidelity funds have appropriately benefited from such economies of scale, and whether there is potential for realization of any further economies of scale.
The Board recognized that the fund's management contract incorporates a "group fee" structure, which provides for lower group fee rates as total group assets increase, and for higher group fee rates as total group assets decrease (with "group assets" defined to include fund assets under FMR's management plus sector fund assets previously under FMR's management and currently managed by Fidelity SelectCo, LLC). FMR calculates the group fee rates based on a tiered asset "breakpoint" schedule that varies based on asset class. The Board considered that the group fee is designed to deliver the benefits of economies of scale to fund shareholders when total Fidelity fund assets increase, even if assets of any particular fund are unchanged or have declined, because some portion of Fidelity's costs are attributable to services provided to all Fidelity funds, and all funds benefit if those costs can be allocated among more assets. The Board concluded that, given the group fee structure, fund shareholders will benefit from lower management fees as group assets increase at the fund complex level, regardless of whether Fidelity achieves any such economies of scale.
The Board concluded, taking into account the analysis of the Economies of Scale Committee, that economies of scale, if any, are being appropriately shared between fund shareholders and Fidelity.
Additional Information Requested by the Board. In order to develop fully the factual basis for consideration of the Fidelity funds' Advisory Contracts, the Board requested and received additional information on certain topics, including: (i) fund performance trends and Fidelity's long-term strategies for certain funds; (ii) the various share classes employed by Fidelity and the attributes of each class, together with similar information on the distribution and servicing payments made by Fidelity or the funds to third-party participants in the distribution channels; (iii) fund profitability, and fund performance in relation to fund profitability; (iv) the methodology with respect to evaluating competitive fund data and peer group classifications and fee comparisons; (v) annual fund profitability margins, with particular focus on certain funds with negative margins; (vi) the realization of fall-out benefits in certain Fidelity business units; (vii) economies of scale and the way in which they are shared with fund shareholders; (viii) Fidelity's group fee structures, including the group fee schedule of breakpoints; (ix) the impact of cost containment measures on the funds; and (x) the transfer agent fee structure.
Based on its evaluation of all of the conclusions noted above, and after considering all factors it believed relevant, the Board concluded that the advisory fee structures are fair and reasonable, and that the fund's Advisory Contracts should be renewed.
Annual Report
Investment Adviser
Fidelity Management & Research Company
Boston, MA
Investment Sub-Advisers
FMR Co., Inc.
FMR Investment Management
(U.K.) Limited
Fidelity Management & Research
(Hong Kong) Limited
Fidelity Management & Research
(Japan) Limited
FIL Investment Advisors
FIL Investment Advisors
(UK) Limited
General Distributor
Fidelity Distributors Corporation
Smithfield, RI
Transfer and Service Agents
Fidelity Investments Institutional Operations Company, Inc.
Boston, MA
Fidelity Service Company, Inc.
Boston, MA
Custodian
Brown Brothers Harriman & Co.
Boston, MA
(Fidelity Investment logo)(registered trademark)
Corporate Headquarters
245 Summer St., Boston, MA 02210
www.fidelity.com
FALAA-UANN-1215
1.917416.105
Fidelity Advisor®
Latin America Fund -
Class I
(Fidelity Cover Art)
(formerly Institutional Class)
Annual Report
October 31, 2015
Class I is a class of
Fidelity® Latin America Fund
Contents
Performance | 3 | How the fund has done over time. |
Management's Discussion of Fund Performance | 40 | The Portfolio Manager's review of fund performance and strategy. |
Shareholder Expense Example | 41 | An example of shareholder expenses. |
Investment Changes | 42 | A summary of major shifts in the fund's investments over the past six months. |
Investments | 42 | A complete list of the fund's investments with their market values. |
Financial Statements | 46 | Statements of assets and liabilities, operations, and changes in net assets, as well as financial highlights. |
Notes | 56 | Notes to the financial statements. |
Report of Independent Registered Public Accounting Firm | 63 | |
Trustees and Officers | 63 | |
Distributions | 70 | |
Board Approval of Investment Advisory Contracts and Management Fees | 70 | |
To view a fund's proxy voting guidelines and proxy voting record for the 12-month period ended June 30, visit http://www.fidelity.com/proxyvotingresults or visit the Securities and Exchange Commission's (SEC) web site at http://www.sec.gov. You may also call 1-877-208-0098 to request a free copy of the proxy voting guidelines.
Standard & Poor's, S&P and S&P 500 are registered service marks of The McGraw-Hill Companies, Inc. and have been licensed for use by Fidelity Distributors Corporation.
Other third-party marks appearing herein are the property of their respective owners.
All other marks appearing herein are registered or unregistered trademarks or service marks of FMR LLC or an affiliated company. © 2015 FMR LLC. All rights reserved.
This report and the financial statements contained herein are submitted for the general information of the shareholders of the fund. This report is not authorized for distribution to prospective investors in the fund unless preceded or accompanied by an effective prospectus.
A fund files its complete schedule of portfolio holdings with the SEC for the first and third quarters of each fiscal year on Form N-Q. Forms N-Q are available on the SEC's web site at http://www.sec.gov. A fund's Forms N-Q may be reviewed and copied at the SEC's Public Reference Room in Washington, DC. Information regarding the operation of the SEC's Public Reference Room may be obtained by calling 1-800-SEC-0330. For a complete list of a fund's portfolio holdings, view the most recent holdings listing, semiannual report, or annual report on Fidelity's web site at http://www.fidelity.com, http://www.advisor.fidelity.com, or http://www.401k.com, as applicable.
NOT FDIC INSURED • MAY LOSE VALUE • NO BANK GUARANTEE
Neither the fund nor Fidelity Distributors Corporation is a bank.
Annual Report
Performance: The Bottom Line
Average annual total return reflects the change in the value of an investment, assuming reinvestment of the class' distributions from dividend income and capital gains (the profits earned upon the sale of securities that have grown in value, if any) and assuming a constant rate of performance each year. The $10,000 table and the fund's returns do not reflect the deduction of taxes that a shareholder would pay on fund distributions or the redemption of fund shares. During periods of reimbursement by Fidelity, a fund's total return will be greater than it would be had the reimbursement not occurred. How a fund did yesterday is no guarantee of how it will do tomorrow.
Average Annual Total Returns
Periods ended October 31, 2015 | Past 1
year | Past 5
years | Past 10
years |
Class I A | -34.42% | -13.70% | 0.81% |
A The initial offering of Class I shares took place on September 28, 2010. Returns prior to September 28, 2010 are those of Fidelity® Latin America Fund, the original class of the fund.
$10,000 Over 10 Years
Let's say hypothetically that $10,000 was invested in Fidelity Advisor® Latin America Fund - Class I on October 31, 2005. The chart shows how the value of your investment would have changed, and also shows how the MSCI EM (Emerging Markets) Latin America Index performed over the same period. See footnote A above for additional information regarding the performance of Class I.
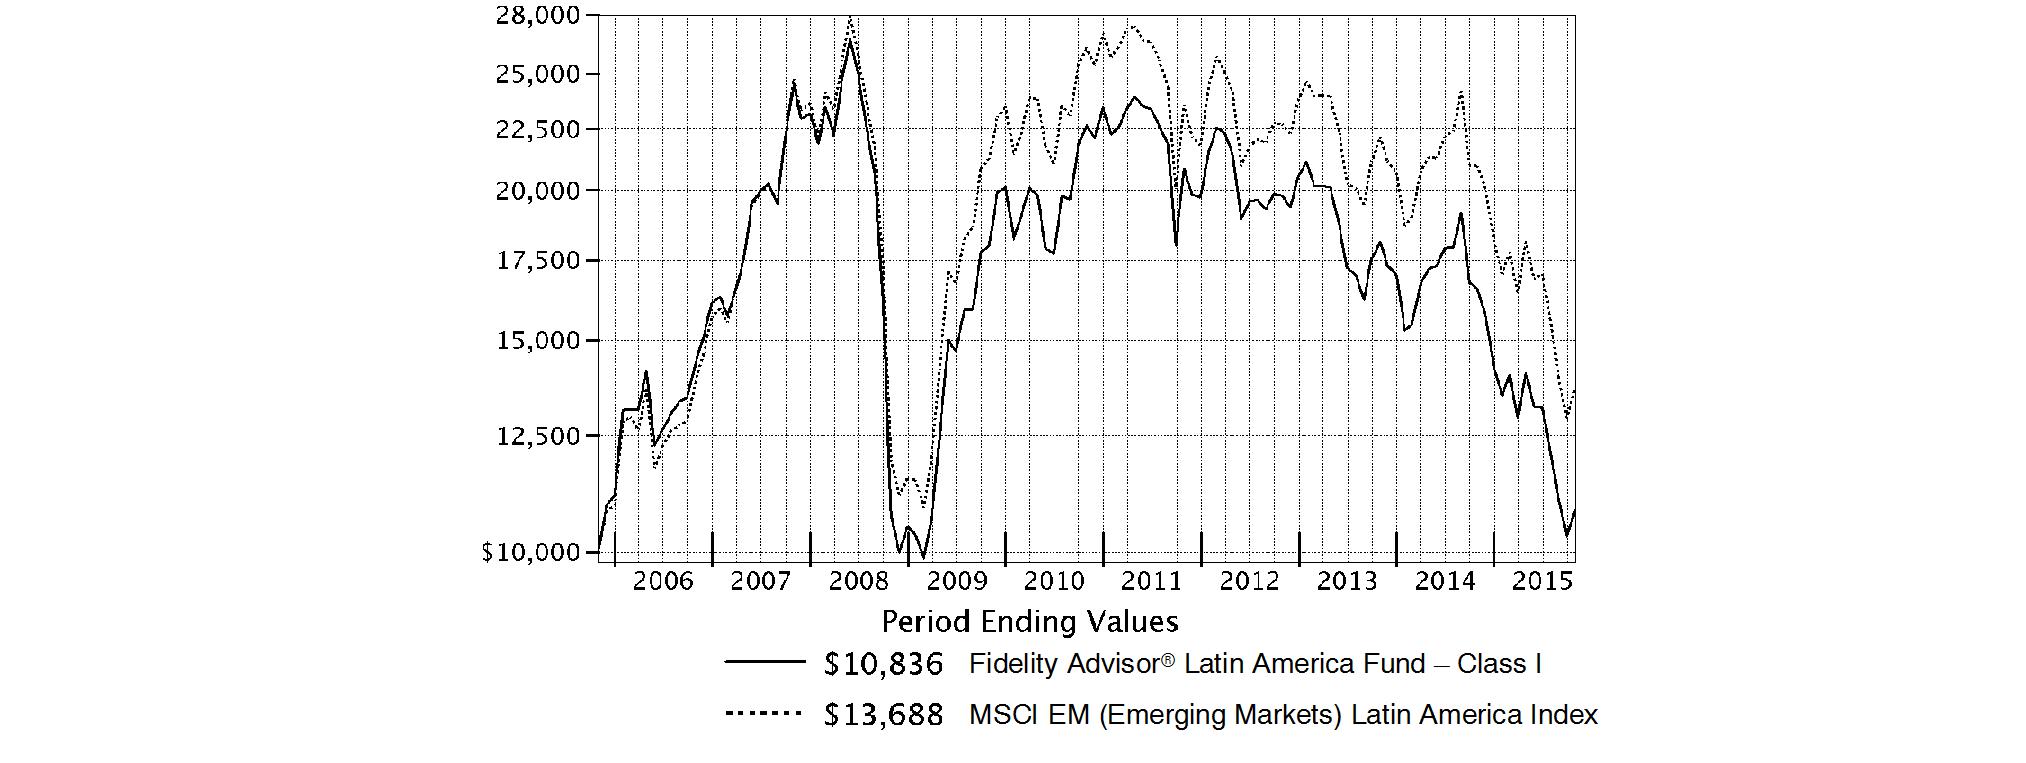
Annual Report
Fidelity Latin America Fund
Management's Discussion of Fund Performance
Market Recap: International equities suffered a moderate setback for the 12 months ending October 31, 2015, held back by a collapse in commodities prices that hurt resources-related sectors and geographies. The MSCI ACWI (All Country World Index) ex USA Index returned -4.55% for the period, affected also by concerns about global economic growth. Commodity producers remained under pressure for much of the past year, largely related to economic deceleration in China (-1%), the world's second-largest economy and a leading consumer of raw materials. This effect was exacerbated by U.S. dollar strength relative to global currencies, which weighed on commodities priced in dollars and acutely impacted equity returns within regions most exposed to resources prices. The emerging-markets group, for example, returned about -15% this period. Canada, a significant energy producer, returned roughly -17%. Net energy consumer Japan (+9%) was the best-performing region by far. Only about a quarter of the nearly 50 index countries managed a gain this period: Ireland (+19%) - the EU's fastest-growing economy - and Israel (+17%) proved top performers; Greece (-56%) and Brazil (-46%), among the worst. As for sectors, energy (-25%) and materials (-16%) declined sharply, whereas the two consumer sectors each gained about 6%.
Comments from Lead Portfolio Manager Adam Kutas: For the year, the fund's share classes (excluding sales charges, if applicable) posted double-digit negative results, roughly in line with the -34.64% return of the benchmark MSCI EM (Emerging Markets) Latin America Index. Lower commodity prices weighed heavily on the region's oil-rich countries, including Mexico, Columbia and Brazil. The fund's top individual contributor versus the benchmark was Chile-based beverage producer Compania Cervecerias Unidas. A sizable stake in one of the fastest-growing convenience store chains, Fomento Economico Mexicano, was another notable contributor. I viewed it as a good defensive company that could grow even in a tough economic environment, which was exactly what happened. On the downside, the biggest detractor was Companhia Brasileira de Distri (CBD), a Brazilian company with exposure to supermarkets and a stake in a consumer technology retail chain. Avoiding Grupo Financiero Banorte, one of Mexico's largest banks and a benchmark component, also proved detrimental.
Note to shareholders: Will Pruett was named Co-Portfolio Manager of the fund, effective October 1, 2015, joining Lead Portfolio Manager Adam Kutas.
The views expressed above reflect those of the portfolio manager(s) only through the end of the period as stated on the cover of this report and do not necessarily represent the views of Fidelity or any other person in the Fidelity organization. Any such views are subject to change at any time based upon market or other conditions and Fidelity disclaims any responsibility to update such views. These views may not be relied on as investment advice and, because investment decisions for a Fidelity fund are based on numerous factors, may not be relied on as an indication of trading intent on behalf of any Fidelity fund.
Annual Report
Fidelity Latin America Fund
Shareholder Expense Example
As a shareholder of the Fund, you incur two types of costs: (1) transaction costs, including sales charges (loads) on purchase payments or redemption proceeds, redemption fees and (2) ongoing costs, including management fees, distribution and/or service (12b-1) fees and other Fund expenses. This Example is intended to help you understand your ongoing costs (in dollars) of investing in the Fund and to compare these costs with the ongoing costs of investing in other mutual funds.
The Example is based on an investment of $1,000 invested at the beginning of the period and held for the entire period (May 1, 2015 to October 31, 2015).
Actual Expenses
The first line of the accompanying table for each class of the Fund provides information about actual account values and actual expenses. You may use the information in this line, together with the amount you invested, to estimate the expenses that you paid over the period. Simply divide your account value by $1,000.00 (for example, an $8,600 account value divided by $1,000.00 = 8.6), then multiply the result by the number in the first line for a class of the Fund under the heading entitled "Expenses Paid During Period" to estimate the expenses you paid on your account during this period. A small balance maintenance fee of $12.00 that is charged once a year may apply for certain accounts with a value of less than $2,000. This fee is not included in the table below. If it was, the estimate of expenses you paid during the period would be higher, and your ending account value lower, by this amount. In addition, the Fund, as a shareholder in the underlying Fidelity Central Funds, will indirectly bear its pro-rata share of the fees and expenses incurred by the underlying Fidelity Central Funds. These fees and expenses are not included in the Fund's annualized expense ratio used to calculate the expense estimate in the table below.
Hypothetical Example for Comparison Purposes
The second line of the accompanying table for each class of the Fund provides information about hypothetical account values and hypothetical expenses based on a Class' actual expense ratio and an assumed rate of return of 5% per year before expenses, which is not the Class' actual return. The hypothetical account values and expenses may not be used to estimate the actual ending account balance or expenses you paid for the period. You may use this information to compare the ongoing costs of investing in the Fund and other funds. To do so, compare this 5% hypothetical example with the 5% hypothetical examples that appear in the shareholder reports of the other funds. A small balance maintenance fee of $12.00 that is charged once a year may apply for certain accounts with a value of less than $2,000. This fee is not included in the table below. If it was, the estimate of expenses you paid during the period would be higher, and your ending account value lower, by this amount. In addition, the Fund, as a shareholder in the underlying Fidelity Central Funds, will indirectly bear its pro-rata share of the fees and expenses incurred by the underlying Fidelity Central Funds. These fees and expenses are not included in the Fund's annualized expense ratio used to calculate the expense estimate in the table below.
Please note that the expenses shown in the table are meant to highlight your ongoing costs only and do not reflect any transaction costs. Therefore, the second line of the table is useful in comparing ongoing costs only, and will not help you determine the relative total costs of owning different funds. In addition, if these transactional costs were included, your costs would have been higher.
| Annualized
Expense Ratio B | Beginning
Account Value
May 1, 2015 | Ending
Account Value
October 31, 2015 | Expenses Paid
During Period C
May 1, 2015
to October 31, 2015 |
Class A | 1.40% | | | |
Actual | | $ 1,000.00 | $ 768.50 | $ 6.24 |
HypotheticalA | | $ 1,000.00 | $ 1,018.15 | $ 7.12 |
Class T | 1.67% | | | |
Actual | | $ 1,000.00 | $ 767.40 | $ 7.44 |
HypotheticalA | | $ 1,000.00 | $ 1,016.79 | $ 8.49 |
Class B | 2.14% | | | |
Actual | | $ 1,000.00 | $ 765.40 | $ 9.52 |
HypotheticalA | | $ 1,000.00 | $ 1,014.42 | $ 10.87 |
Class C | 2.15% | | | |
Actual | | $ 1,000.00 | $ 765.50 | $ 9.57 |
HypotheticalA | | $ 1,000.00 | $ 1,014.37 | $ 10.92 |
Latin America | 1.13% | | | |
Actual | | $ 1,000.00 | $ 769.00 | $ 5.04 |
HypotheticalA | | $ 1,000.00 | $ 1,019.51 | $ 5.75 |
Class I | 1.07% | | | |
Actual | | $ 1,000.00 | $ 769.40 | $ 4.77 |
HypotheticalA | | $ 1,000.00 | $ 1,019.81 | $ 5.45 |
A 5% return per year before expenses
B Annualized expense ratio reflects expenses net of applicable fee waivers.
C Expenses are equal to each Class' annualized expense ratio, multiplied by the average account value over the period, multiplied by 184/365 (to reflect the one-half year period).
Annual Report
Fidelity Latin America Fund
Investment Changes (Unaudited)
Asset Allocation as of October 31, 2015 |
| % of fund's
net assets | % of fund's net assets
6 months ago |
Stocks | 97.2 | 99.1 |
Short-Term Investments and Net Other Assets (Liabilities) | 2.8 | 0.9 |
Top Ten Stocks as of October 31, 2015 |
| % of fund's
net assets | % of fund's net assets
6 months ago |
America Movil S.A.B. de CV Series L (Mexico, Wireless Telecommunication Services) | 6.4 | 6.6 |
Ambev SA sponsored ADR (Brazil, Beverages) | 6.1 | 6.1 |
Fomento Economico Mexicano S.A.B. de CV (Mexico, Beverages) | 5.5 | 4.1 |
Itau Unibanco Holding SA (Brazil, Banks) | 4.7 | 6.5 |
Wal-Mart de Mexico SA de CV Series V (Mexico, Food & Staples Retailing) | 4.4 | 2.7 |
Grupo Financiero Inbursa S.A.B. de CV Series O (Mexico, Banks) | 2.8 | 2.3 |
Grupo de Inversiones Suramerica SA (Colombia, Diversified Financial Services) | 2.3 | 2.5 |
Banco Bradesco SA (PN) (Brazil, Banks) | 2.0 | 3.1 |
Grupo Televisa SA de CV (Mexico, Media) | 1.9 | 1.6 |
Petroleo Brasileiro SA - Petrobras (PN) (non-vtg.) (Brazil, Oil, Gas & Consumable Fuels) | 1.8 | 3.3 |
| 37.9 | |
Market Sectors as of October 31, 2015 |
| % of fund's
net assets | % of fund's net assets
6 months ago |
Consumer Staples | 28.0 | 23.8 |
Financials | 26.9 | 30.3 |
Telecommunication Services | 8.5 | 9.9 |
Consumer Discretionary | 8.1 | 7.7 |
Materials | 7.8 | 7.4 |
Industrials | 5.8 | 6.7 |
Energy | 5.0 | 7.3 |
Utilities | 4.6 | 3.4 |
Health Care | 1.4 | 0.7 |
Information Technology | 1.1 | 1.9 |
Market Sectors may include more than one industry category. |
The fund may invest up to 35% of its total assets in any industry that represents more than 20% of the Latin American market. As of October 31, 2015, the fund did not have more than 25% of its total assets invested in any one industry. |
Annual Report
Fidelity Latin America Fund
Investments October 31, 2015
Showing Percentage of Net Assets
Common Stocks - 77.6% |
| Shares | | Value |
Belgium - 0.9% |
Euronav NV | 226,900 | | $ 3,352,175 |
Euronav NV | 80,600 | | 1,205,776 |
TOTAL BELGIUM | | 4,557,951 |
Brazil - 20.5% |
Banco Bradesco SA | 185,580 | | 1,127,950 |
BB Seguridade Participacoes SA | 772,600 | | 5,328,898 |
BM&F BOVESPA SA | 2,767,900 | | 8,181,940 |
Brasil Brokers Participacoes SA | 2,701,800 | | 1,050,862 |
Brasil Foods SA | 156,300 | | 2,435,760 |
CCR SA | 2,052,300 | | 6,449,774 |
Cielo SA | 577,440 | | 5,481,604 |
Companhia de Saneamento Basico do Estado de Sao Paulo (SABESP) | 1,700,000 | | 7,379,134 |
Cyrela Brazil Realty SA | 287,300 | | 667,490 |
Equatorial Energia SA | 566,900 | | 5,055,215 |
Fibria Celulose SA | 578,700 | | 7,898,969 |
FPC Par Corretora de Seguros | 1,272,700 | | 3,560,808 |
Hypermarcas SA (a) | 1,021,400 | | 4,634,842 |
Industrias Romi SA | 3,235,900 | | 1,485,147 |
Itausa-Investimentos Itau SA | 7 | | 14 |
M. Dias Branco SA | 515,600 | | 9,345,254 |
MAHLE Metal Leve SA | 424,300 | | 2,575,583 |
Multiplus SA | 778,100 | | 6,928,460 |
Ouro Fino Saude Animal LTDA | 176,200 | | 1,576,253 |
Petroleo Brasileiro SA - Petrobras (ON) (a) | 3,237,328 | | 7,873,912 |
Porto Seguro SA | 365,400 | | 3,063,199 |
QGEP Participacoes SA (a) | 2,477,700 | | 3,829,094 |
TIM Participacoes SA | 1,707,595 | | 3,741,473 |
Vale SA | 1,064,100 | | 4,707,198 |
TOTAL BRAZIL | | 104,378,833 |
Canada - 0.3% |
Tahoe Resources, Inc. | 209,434 | | 1,749,021 |
Chile - 11.7% |
Aguas Andinas SA | 9,955,798 | | 5,208,025 |
Banco de Chile | 76,030,132 | | 8,037,832 |
Banmedica SA | 1,523,867 | | 2,490,015 |
Colbun SA | 21,984,938 | | 5,849,510 |
Compania Cervecerias Unidas SA | 782,126 | | 9,357,351 |
CorpBanca SA | 630,371,201 | | 5,783,682 |
Empresa Nacional de Telecomunicaciones SA (ENTEL) | 297,791 | | 2,755,886 |
Forus SA | 705,249 | | 2,039,618 |
Inversiones La Construccion SA | 753,300 | | 8,561,836 |
S.A.C.I. Falabella | 576,071 | | 3,873,516 |
Sociedad Matriz SAAM SA | 60,278,930 | | 3,928,525 |
Vina San Pedro SA | 238,206,744 | | 1,877,960 |
TOTAL CHILE | | 59,763,756 |
|
| Shares | | Value |
Colombia - 5.3% |
Bolsa de Valores de Colombia | 334,500,111 | | $ 1,905,161 |
Cemex Latam Holdings SA (a) | 852,530 | | 2,966,345 |
Empresa de Telecomunicaciones de Bogota | 22,051,614 | | 4,529,068 |
Grupo de Inversiones Suramerica SA | 953,406 | | 12,104,340 |
Inversiones Argos SA | 924,188 | | 5,678,476 |
TOTAL COLOMBIA | | 27,183,390 |
Mexico - 33.2% |
America Movil S.A.B. de CV: | | | |
Series L | 7,165,300 | | 6,398,441 |
Series L sponsored ADR (d) | 1,476,073 | | 26,288,860 |
Banregio Grupo Financiero S.A.B. de CV | 339,814 | | 1,833,224 |
Consorcio ARA S.A.B. de CV (a) | 20,756,305 | | 7,778,368 |
Controladora Commercial Mexicana S.A.B. de CV unit | 1,308,500 | | 3,832,546 |
Fomento Economico Mexicano S.A.B. de CV: | | | |
unit | 95,200 | | 940,427 |
sponsored ADR | 275,305 | | 27,279,972 |
Gruma S.A.B. de CV Series B | 358,009 | | 5,524,737 |
Grupo Aeroportuario del Pacifico SA de CV: | | | |
Series B | 43,100 | | 388,187 |
sponsored ADR | 33,400 | | 3,041,738 |
Grupo Aeroportuario del Sureste SA de CV Series B | 254,820 | | 3,946,534 |
Grupo Carso SA de CV Series A1 | 1,414,100 | | 6,304,370 |
Grupo Financiero Inbursa S.A.B. de CV Series O | 7,110,519 | | 14,296,113 |
Grupo Financiero Santander Mexico S.A.B. de CV | 2,505,855 | | 4,604,287 |
Grupo Televisa SA de CV | 199,400 | | 1,160,223 |
Grupo Televisa SA de CV (CPO) sponsored ADR | 293,300 | | 8,546,762 |
Industrias Penoles SA de CV | 277,923 | | 3,694,916 |
Kimberly-Clark de Mexico SA de CV Series A | 2,382,100 | | 5,748,375 |
Medica Sur SA de CV | 1,038,334 | | 3,143,076 |
Megacable Holdings S.A.B. de CV unit | 1,954,829 | | 7,449,932 |
Qualitas Controladora S.A.B. de CV (a) | 2,877,400 | | 3,585,035 |
Unifin Financiera SAPI de CV (a) | 308,300 | | 935,849 |
Wal-Mart de Mexico SA de CV Series V | 8,591,848 | | 22,668,439 |
TOTAL MEXICO | | 169,390,411 |
Panama - 1.6% |
Banco Latinoamericano de Comercio Exterior SA Series E | 303,070 | | 8,191,982 |
Peru - 3.0% |
Alicorp SA Class C (a) | 4,973,812 | | 8,451,240 |
Compania de Minas Buenaventura SA sponsored ADR | 1,073,736 | | 6,882,648 |
TOTAL PERU | | 15,333,888 |
Common Stocks - continued |
| Shares | | Value |
Spain - 0.7% |
Prosegur Compania de Seguridad SA (Reg.) | 789,254 | | $ 3,515,008 |
United States of America - 0.4% |
First Cash Financial Services, Inc. (a) | 52,766 | | 2,013,023 |
TOTAL COMMON STOCKS (Cost $443,903,418) |
396,077,263
|
Nonconvertible Preferred Stocks - 19.6% |
| | | |
Brazil - 18.5% |
Ambev SA sponsored ADR | 6,385,447 | | 31,097,125 |
Banco Bradesco SA (PN) | 1,909,460 | | 10,397,547 |
Companhia Brasileira de Distribuicao Grupo Pao de Acucar (PN) | 413,125 | | 5,435,418 |
Companhia de Saneamento Basico do Estado de Sao Paulo (SABESP) sponsored ADR | 62,800 | | 275,692 |
Itau Unibanco Holding SA | 3,462,695 | | 23,766,718 |
Itausa-Investimentos Itau SA (PN) | 4,034,325 | | 7,531,898 |
Petroleo Brasileiro SA - Petrobras (PN) (non-vtg.) (a) | 4,687,871 | | 9,371,974 |
Vale SA (PN-A) | 1,859,800 | | 6,765,890 |
TOTAL BRAZIL | | 94,642,262 |
Chile - 0.8% |
Embotelladora Andina SA Class A | 1,355,910 | | 3,980,186 |
Colombia - 0.3% |
Grupo de Inversiones Suramerica SA | 105,961 | | 1,329,907 |
TOTAL NONCONVERTIBLE PREFERRED STOCKS (Cost $90,870,783) |
99,952,355
|
Money Market Funds - 3.2% |
| Shares | | Value |
Fidelity Cash Central Fund, 0.18% (b) | 14,023,624 | | $ 14,023,624 |
Fidelity Securities Lending Cash Central Fund, 0.19% (b)(c) | 2,529,375 | | 2,529,375 |
TOTAL MONEY MARKET FUNDS (Cost $16,552,999) |
16,552,999
|
TOTAL INVESTMENT
PORTFOLIO - 100.4% (Cost $551,327,200) | | 512,582,617 |
NET OTHER ASSETS (LIABILITIES) - (0.4)% | | (2,020,347) |
NET ASSETS - 100% | $ 510,562,270 |
Legend |
(a) Non-income producing |
(b) Affiliated fund that is generally available only to investment companies and other accounts managed by Fidelity Investments. The rate quoted is the annualized seven-day yield of the fund at period end. A complete unaudited listing of the fund's holdings as of its most recent quarter end is available upon request. In addition, each Fidelity Central Fund's financial statements, which are not covered by the Fund's Report of Independent Registered Public Accounting Firm, are available on the SEC's website or upon request. |
(c) Investment made with cash collateral received from securities on loan. |
(d) Security or a portion of the security is on loan at period end. |
Affiliated Central Funds |
Information regarding fiscal year to date income earned by the Fund from investments in Fidelity Central Funds is as follows: |
Fund | Income earned |
Fidelity Cash Central Fund | $ 15,272 |
Fidelity Securities Lending Cash Central Fund | 36,119 |
Total | $ 51,391 |
Other Information |
Categorizations in the Schedule of Investments are based on country or territory of incorporation. |
All investments are categorized as Level 1 under the Fair Value Hierarchy. The inputs or methodology used for valuing securities may not be an indication of the risk associated with investing in those securities. For more information on valuation inputs, please refer to the Investment Valuation section in the accompanying Notes to Financial Statements. |
See accompanying notes which are an integral part of the financial statements.
Annual Report
Fidelity Latin America Fund
Financial Statements
Statement of Assets and Liabilities
| | October 31, 2015 |
| | |
Assets | | |
Investment in securities, at value (including securities loaned of $2,537,925) - See accompanying schedule: Unaffiliated issuers (cost $534,774,201) | $ 496,029,618 | |
Fidelity Central Funds (cost $16,552,999) | 16,552,999 | |
Total Investments (cost $551,327,200) | | $ 512,582,617 |
Foreign currency held at value (cost $517,954) | | 518,167 |
Receivable for investments sold | | 793,751 |
Receivable for fund shares sold | | 321,934 |
Dividends receivable | | 393,206 |
Distributions receivable from Fidelity Central Funds | | 3,558 |
Prepaid expenses | | 1,769 |
Other receivables | | 2,262 |
Total assets | | 514,617,264 |
| | |
Liabilities | | |
Payable for investments purchased | $ 110,516 | |
Payable for fund shares redeemed | 837,033 | |
Accrued management fee | 301,708 | |
Distribution and service plan fees payable | 10,860 | |
Other affiliated payables | 148,116 | |
Other payables and accrued expenses | 117,386 | |
Collateral on securities loaned, at value | 2,529,375 | |
Total liabilities | | 4,054,994 |
| | |
Net Assets | | $ 510,562,270 |
Net Assets consist of: | | |
Paid in capital | | $ 630,184,258 |
Undistributed net investment income | | 7,012,875 |
Accumulated undistributed net realized gain (loss) on investments and foreign currency transactions | | (87,850,607) |
Net unrealized appreciation (depreciation) on investments and assets and liabilities in foreign currencies | | (38,784,256) |
Net Assets | | $ 510,562,270 |
Statement of Assets and Liabilities - continued
| | October 31, 2015 |
| | |
Calculation of Maximum Offering Price | |
Class A:
Net Asset Value and redemption price per share ($16,424,313 ÷ 908,008 shares) | | $ 18.09 |
| | |
Maximum offering price per share (100/94.25 of $18.09) | | $ 19.19 |
Class T:
Net Asset Value and redemption price per share ($5,283,521 ÷ 291,781 shares) | | $ 18.11 |
| | |
Maximum offering price per share (100/96.50 of $18.11) | | $ 18.77 |
Class B:
Net Asset Value and offering price per share ($627,760 ÷ 34,367 shares)A | | $ 18.27 |
| | |
Class C:
Net Asset Value and offering price per share ($5,393,798 ÷ 296,770 shares)A | | $ 18.18 |
| | |
Latin America:
Net Asset Value, offering price and redemption price per share ($481,004,802 ÷ 26,598,317 shares) | | $ 18.08 |
| | |
Class I:
Net Asset Value, offering price and redemption price per share ($1,828,076 ÷ 101,089 shares) | | $ 18.08 |
A Redemption price per share is equal to net asset value less any applicable contingent deferred sales charge.
See accompanying notes which are an integral part of the financial statements.
Annual Report
Fidelity Latin America Fund
Financial Statements - continued
Statement of Operations
| Year ended October 31, 2015 |
| | |
Investment Income | | |
Dividends | | $ 19,692,387 |
Interest | | 12,841 |
Income from Fidelity Central Funds | | 51,391 |
Income before foreign taxes withheld | | 19,756,619 |
Less foreign taxes withheld | | (1,513,669) |
Total income | | 18,242,950 |
Expenses | | |
Management fee | $ 4,826,856 | |
Transfer agent fees | 1,963,217 | |
Distribution and service plan fees | 183,965 | |
Accounting and security lending fees | 339,670 | |
Custodian fees and expenses | 490,458 | |
Independent trustees' compensation | 2,918 | |
Registration fees | 81,216 | |
Audit | 72,583 | |
Legal | 2,191 | |
Interest | 444 | |
Miscellaneous | 4,345 | |
Total expenses before reductions | 7,967,863 | |
Expense reductions | (66,025) | 7,901,838 |
Net investment income (loss) | | 10,341,112 |
Realized and Unrealized Gain (Loss) | | |
Net realized gain (loss) on: | | |
Investment securities: | | |
Unaffiliated issuers | (86,779,565) | |
Foreign currency transactions | (639,828) | |
Total net realized gain (loss) | | (87,419,393) |
Change in net unrealized appreciation (depreciation) on: Investment securities (net of decrease in deferred foreign taxes of $64,167) | (231,007,007) | |
Assets and liabilities in foreign currencies | (35,988) | |
Total change in net unrealized appreciation (depreciation) | | (231,042,995) |
Net gain (loss) | | (318,462,388) |
Net increase (decrease) in net assets resulting from operations | | $ (308,121,276) |
Statement of Changes in Net Assets
| Year ended
October 31,
2015 | Year ended
October 31,
2014 |
Increase (Decrease) in Net Assets | | |
Operations | | |
Net investment income (loss) | $ 10,341,112 | $ 20,578,749 |
Net realized gain (loss) | (87,419,393) | 80,758,455 |
Change in net unrealized appreciation (depreciation) | (231,042,995) | (221,687,609) |
Net increase (decrease) in net assets resulting from operations | (308,121,276) | (120,350,405) |
Distributions to shareholders from net investment income | (12,592,762) | (23,599,176) |
Distributions to shareholders from net realized gain | (66,395,306) | (209,492,273) |
Total distributions | (78,988,068) | (233,091,449) |
Share transactions - net increase (decrease) | (98,503,600) | (61,704,730) |
Redemption fees | 127,133 | 197,877 |
Total increase (decrease) in net assets | (485,485,811) | (414,948,707) |
| | |
Net Assets | | |
Beginning of period | 996,048,081 | 1,410,996,788 |
End of period (including undistributed net investment income of $7,012,875 and undistributed net investment income of $11,771,382, respectively) | $ 510,562,270 | $ 996,048,081 |
See accompanying notes which are an integral part of the financial statements.
Annual Report
Financial Highlights - Fidelity Latin America Fund Class A
Years ended October 31, | 2015 | 2014 | 2013 | 2012 | 2011 |
Selected Per-Share Data | | | | | |
Net asset value, beginning of period | $ 30.31 | $ 40.71 | $ 48.95 | $ 52.38 | $ 57.48 |
Income from Investment Operations | | | | | |
Net investment income (loss) C | .28 | .49 | .72 | .92 | 1.15 |
Net realized and unrealized gain (loss) | (10.11) | (4.08) | (4.73) | (3.66) | (5.87) |
Total from investment operations | (9.83) | (3.59) | (4.01) | (2.74) | (4.72) |
Distributions from net investment income | (.31) | (.57) | (.79) | (.70) | (.19) |
Distributions from net realized gain | (2.08) | (6.25) | (3.45) | - | (.20) |
Total distributions | (2.39) | (6.82) | (4.24) | (.70) | (.39) |
Redemption fees added to paid in capitalC | -G | .01 | .01 | .01 | .01 |
Net asset value, end of period | $ 18.09 | $ 30.31 | $ 40.71 | $ 48.95 | $ 52.38 |
Total ReturnA, B | (34.60)% | (9.06)% | (8.93)% | (5.23)% | (8.26)% |
Ratios to Average Net AssetsD, F | | | | | |
Expenses before reductions | 1.40% | 1.38% | 1.37% | 1.35% | 1.34% |
Expenses net of fee waivers, if any | 1.40% | 1.38% | 1.37% | 1.35% | 1.34% |
Expenses net of all reductions | 1.39% | 1.38% | 1.35% | 1.35% | 1.34% |
Net investment income (loss) | 1.26% | 1.52% | 1.66% | 1.80% | 2.05% |
Supplemental Data | | | | | |
Net assets, end of period (000 omitted) | $ 16,424 | $ 34,898 | $ 48,464 | $ 69,654 | $ 91,407 |
Portfolio turnover rateE | 30% | 30% | 23% | 23% | 11% |
A Total returns would have been lower if certain expenses had not been reduced during the applicable periods shown. B Total returns do not include the effect of the sales charges. C Calculated based on average shares outstanding during the period. D Fees and expenses of any underlying Fidelity Central Funds are not included in the Fund's expense ratio. The Fund indirectly bears its proportionate share of the expenses of any underlying Fidelity Central Funds. E Amount does not include the portfolio activity of any underlying Fidelity Central Funds. F Expense ratios reflect operating expenses of the class. Expenses before reductions do not reflect amounts reimbursed by the investment adviser or reductions from brokerage service arrangements or reductions from other expense offset arrangements and do not represent the amount paid by the class during periods when reimbursements or reductions occur. Expenses net of fee waivers reflect expenses after reimbursement by the investment adviser but prior to reductions from brokerage service arrangements or other expense offset arrangements. Expenses net of all reductions represent the net expenses paid by the class. G Amount represents less than $.005 per share. |
Financial Highlights - Fidelity Latin America Fund Class T
Years ended October 31, | 2015 | 2014 | 2013 | 2012 | 2011 |
Selected Per-Share Data | | | | | |
Net asset value, beginning of period | $ 30.33 | $ 40.68 | $ 48.88 | $ 52.27 | $ 57.47 |
Income from Investment Operations | | | | | |
Net investment income (loss) C | .22 | .40 | .61 | .78 | .99 |
Net realized and unrealized gain (loss) | (10.13) | (4.08) | (4.74) | (3.65) | (5.85) |
Total from investment operations | (9.91) | (3.68) | (4.13) | (2.87) | (4.86) |
Distributions from net investment income | (.23) | (.43) | (.63) | (.53) | (.15) |
Distributions from net realized gain | (2.08) | (6.25) | (3.45) | - | (.20) |
Total distributions | (2.31) | (6.68) | (4.08) | (.53) | (.35) |
Redemption fees added to paid in capitalC | -G | .01 | .01 | .01 | .01 |
Net asset value, end of period | $ 18.11 | $ 30.33 | $ 40.68 | $ 48.88 | $ 52.27 |
Total ReturnA, B | (34.78)% | (9.30)% | (9.17)% | (5.49)% | (8.50)% |
Ratios to Average Net AssetsD, F | | | | | |
Expenses before reductions | 1.67% | 1.65% | 1.63% | 1.61% | 1.61% |
Expenses net of fee waivers, if any | 1.67% | 1.65% | 1.63% | 1.61% | 1.61% |
Expenses net of all reductions | 1.66% | 1.65% | 1.61% | 1.61% | 1.61% |
Net investment income (loss) | .99% | 1.25% | 1.40% | 1.54% | 1.78% |
Supplemental Data | | | | | |
Net assets, end of period (000 omitted) | $ 5,284 | $ 9,761 | $ 12,705 | $ 19,334 | $ 26,020 |
Portfolio turnover rateE | 30% | 30% | 23% | 23% | 11% |
A Total returns would have been lower if certain expenses had not been reduced during the applicable periods shown. B Total returns do not include the effect of the sales charges. C Calculated based on average shares outstanding during the period. D Fees and expenses of any underlying Fidelity Central Funds are not included in the Fund's expense ratio. The Fund indirectly bears its proportionate share of the expenses of any underlying Fidelity Central Funds. E Amount does not include the portfolio activity of any underlying Fidelity Central Funds. F Expense ratios reflect operating expenses of the class. Expenses before reductions do not reflect amounts reimbursed by the investment adviser or reductions from brokerage service arrangements or reductions from other expense offset arrangements and do not represent the amount paid by the class during periods when reimbursements or reductions occur. Expenses net of fee waivers reflect expenses after reimbursement by the investment adviser but prior to reductions from brokerage service arrangements or other expense offset arrangements. Expenses net of all reductions represent the net expenses paid by the class. G Amount represents less than $.005 per share. |
See accompanying notes which are an integral part of the financial statements.
Annual Report
Financial Highlights - Fidelity Latin America Fund Class B
Years ended October 31, | 2015 | 2014 | 2013 | 2012 | 2011 |
Selected Per-Share Data | | | | | |
Net asset value, beginning of period | $ 30.46 | $ 40.63 | $ 48.72 | $ 52.06 | $ 57.44 |
Income from Investment Operations | | | | | |
Net investment income (loss) C | .12 | .25 | .40 | .53 | .72 |
Net realized and unrealized gain (loss) | (10.23) | (4.08) | (4.74) | (3.63) | (5.84) |
Total from investment operations | (10.11) | (3.83) | (4.34) | (3.10) | (5.12) |
Distributions from net investment income | - | (.10) | (.31) | (.25) | (.07) |
Distributions from net realized gain | (2.08) | (6.25) | (3.45) | - | (.20) |
Total distributions | (2.08) | (6.35) | (3.76) | (.25) | (.27) |
Redemption fees added to paid in capitalC | -G | .01 | .01 | .01 | .01 |
Net asset value, end of period | $ 18.27 | $ 30.46 | $ 40.63 | $ 48.72 | $ 52.06 |
Total ReturnA, B | (35.09)% | (9.73)% | (9.60)% | (5.95)% | (8.94)% |
Ratios to Average Net AssetsD, F | | | | | |
Expenses before reductions | 2.16% | 2.14% | 2.12% | 2.10% | 2.10% |
Expenses net of fee waivers, if any | 2.15% | 2.14% | 2.12% | 2.10% | 2.10% |
Expenses net of all reductions | 2.15% | 2.13% | 2.10% | 2.10% | 2.10% |
Net investment income (loss) | .50% | .76% | .91% | 1.05% | 1.29% |
Supplemental Data | | | | | |
Net assets, end of period (000 omitted) | $ 628 | $ 2,211 | $ 4,764 | $ 9,492 | $ 14,114 |
Portfolio turnover rateE | 30% | 30% | 23% | 23% | 11% |
A Total returns would have been lower if certain expenses had not been reduced during the applicable periods shown. B Total returns do not include the effect of the contingent deferred sales charge. C Calculated based on average shares outstanding during the period. D Fees and expenses of any underlying Fidelity Central Funds are not included in the Fund's expense ratio. The Fund indirectly bears its proportionate share of the expenses of any underlying Fidelity Central Funds. E Amount does not include the portfolio activity of any underlying Fidelity Central Funds. F Expense ratios reflect operating expenses of the class. Expenses before reductions do not reflect amounts reimbursed by the investment adviser or reductions from brokerage service arrangements or reductions from other expense offset arrangements and do not represent the amount paid by the class during periods when reimbursements or reductions occur. Expenses net of fee waivers reflect expenses after reimbursement by the investment adviser but prior to reductions from brokerage service arrangements or other expense offset arrangements. Expenses net of all reductions represent the net expenses paid by the class. G Amount represents less than $.005 per share. |
Financial Highlights - Fidelity Latin America Fund Class C
Years ended October 31, | 2015 | 2014 | 2013 | 2012 | 2011 |
Selected Per-Share Data | | | | | |
Net asset value, beginning of period | $ 30.37 | $ 40.59 | $ 48.73 | $ 52.05 | $ 57.44 |
Income from Investment Operations | | | | | |
Net investment income (loss) C | .11 | .25 | .40 | .54 | .73 |
Net realized and unrealized gain (loss) | (10.17) | (4.07) | (4.74) | (3.64) | (5.84) |
Total from investment operations | (10.06) | (3.82) | (4.34) | (3.10) | (5.11) |
Distributions from net investment income | (.05) | (.16) | (.36) | (.23) | (.09) |
Distributions from net realized gain | (2.08) | (6.25) | (3.45) | - | (.20) |
Total distributions | (2.13) | (6.41) | (3.81) | (.23) | (.29) |
Redemption fees added to paid in capitalC | -G | .01 | .01 | .01 | .01 |
Net asset value, end of period | $ 18.18 | $ 30.37 | $ 40.59 | $ 48.73 | $ 52.05 |
Total ReturnA, B | (35.08)% | (9.74)% | (9.62)% | (5.94)% | (8.93)% |
Ratios to Average Net AssetsD, F | | | | | |
Expenses before reductions | 2.15% | 2.13% | 2.12% | 2.10% | 2.08% |
Expenses net of fee waivers, if any | 2.15% | 2.13% | 2.12% | 2.10% | 2.08% |
Expenses net of all reductions | 2.15% | 2.13% | 2.10% | 2.10% | 2.08% |
Net investment income (loss) | .51% | .77% | .91% | 1.06% | 1.31% |
Supplemental Data | | | | | |
Net assets, end of period (000 omitted) | $ 5,394 | $ 11,349 | $ 15,185 | $ 27,405 | $ 35,203 |
Portfolio turnover rateE | 30% | 30% | 23% | 23% | 11% |
A Total returns would have been lower if certain expenses had not been reduced during the applicable periods shown. B Total returns do not include the effect of the contingent deferred sales charge. C Calculated based on average shares outstanding during the period. D Fees and expenses of any underlying Fidelity Central Funds are not included in the Fund's expense ratio. The Fund indirectly bears its proportionate share of the expenses of any underlying Fidelity Central Funds. E Amount does not include the portfolio activity of any underlying Fidelity Central Funds. F Expense ratios reflect operating expenses of the class. Expenses before reductions do not reflect amounts reimbursed by the investment adviser or reductions from brokerage service arrangements or reductions from other expense offset arrangements and do not represent the amount paid by the class during periods when reimbursements or reductions occur. Expenses net of fee waivers reflect expenses after reimbursement by the investment adviser but prior to reductions from brokerage service arrangements or other expense offset arrangements. Expenses net of all reductions represent the net expenses paid by the class. G Amount represents less than $.005 per share. |
See accompanying notes which are an integral part of the financial statements.
Annual Report
Financial Highlights - Fidelity Latin America Fund
Years ended October 31, | 2015 | 2014 | 2013 | 2012 | 2011 |
Selected Per-Share Data | | | | | |
Net asset value, beginning of period | $ 30.34 | $ 40.80 | $ 49.09 | $ 52.48 | $ 57.50 |
Income from Investment Operations | | | | | |
Net investment income (loss) B | .34 | .59 | .87 | 1.09 | 1.34 |
Net realized and unrealized gain (loss) | (10.11) | (4.10) | (4.74) | (3.67) | (5.88) |
Total from investment operations | (9.77) | (3.51) | (3.87) | (2.58) | (4.54) |
Distributions from net investment income | (.41) | (.71) | (.98) | (.82) | (.29) |
Distributions from net realized gain | (2.08) | (6.25) | (3.45) | - | (.20) |
Total distributions | (2.49) | (6.96) | (4.43) | (.82) | (.49) |
Redemption fees added to paid in capitalB | - F | .01 | .01 | .01 | .01 |
Net asset value, end of period | $ 18.08 | $ 30.34 | $ 40.80 | $ 49.09 | $ 52.48 |
Total ReturnA | (34.45)% | (8.79)% | (8.63)% | (4.91)% | (7.96)% |
Ratios to Average Net AssetsC, E | | | | | |
Expenses before reductions | 1.13% | 1.08% | 1.04% | 1.02% | 1.00% |
Expenses net of fee waivers, if any | 1.12% | 1.08% | 1.04% | 1.02% | 1.00% |
Expenses net of all reductions | 1.12% | 1.07% | 1.03% | 1.02% | 1.00% |
Net investment income (loss) | 1.53% | 1.83% | 1.99% | 2.14% | 2.39% |
Supplemental Data | | | | | |
Net assets, end of period (000 omitted) | $ 481,005 | $ 933,298 | $ 1,324,748 | $ 2,274,601 | $ 2,884,301 |
Portfolio turnover rateD | 30% | 30% | 23% | 23% | 11% |
A Total returns would have been lower if certain expenses had not been reduced during the applicable periods shown. B Calculated based on average shares outstanding during the period. C Fees and expenses of any underlying Fidelity Central Funds are not included in the Fund's expense ratio. The Fund indirectly bears its proportionate share of the expenses of any underlying Fidelity Central Funds. D Amount does not include the portfolio activity of any underlying Fidelity Central Funds. E Expense ratios reflect operating expenses of the class. Expenses before reductions do not reflect amounts reimbursed by the investment adviser or reductions from brokerage service arrangements or reductions from other expense offset arrangements and do not represent the amount paid by the class during periods when reimbursements or reductions occur. Expenses net of fee waivers reflect expenses after reimbursement by the investment adviser but prior to reductions from brokerage service arrangements or other expense offset arrangements. Expenses net of all reductions represent the net expenses paid by the class. F Amount represents less than $.005 per share. |
Financial Highlights - Fidelity Latin America Fund Class I
Years ended October 31, | 2015 | 2014 | 2013 | 2012 | 2011 |
Selected Per-Share Data | | | | | |
Net asset value, beginning of period | $ 30.35 | $ 40.79 | $ 49.07 | $ 52.51 | $ 57.49 |
Income from Investment Operations | | | | | |
Net investment income (loss) B | .36 | .60 | .87 | 1.08 | 1.32 |
Net realized and unrealized gain (loss) | (10.13) | (4.07) | (4.74) | (3.67) | (5.88) |
Total from investment operations | (9.77) | (3.47) | (3.87) | (2.59) | (4.56) |
Distributions from net investment income | (.42) | (.73) | (.97) | (.86) | (.23) |
Distributions from net realized gain | (2.08) | (6.25) | (3.45) | - | (.20) |
Total distributions | (2.50) | (6.98) | (4.42) | (.86) | (.43) |
Redemption fees added to paid in capitalB | - F | .01 | .01 | .01 | .01 |
Net asset value, end of period | $ 18.08 | $ 30.35 | $ 40.79 | $ 49.07 | $ 52.51 |
Total ReturnA | (34.42)% | (8.69)% | (8.63)% | (4.93)% | (7.98)% |
Ratios to Average Net AssetsC, E | | | | | |
Expenses before reductions | 1.06% | 1.04% | 1.03% | 1.04% | 1.04% |
Expenses net of fee waivers, if any | 1.06% | 1.04% | 1.03% | 1.04% | 1.04% |
Expenses net of all reductions | 1.05% | 1.04% | 1.01% | 1.04% | 1.04% |
Net investment income (loss) | 1.60% | 1.86% | 2.00% | 2.12% | 2.35% |
Supplemental Data | | | | | |
Net assets, end of period (000 omitted) | $ 1,828 | $ 4,531 | $ 5,131 | $ 7,928 | $ 9,603 |
Portfolio turnover rateD | 30% | 30% | 23% | 23% | 11% |
A Total returns would have been lower if certain expenses had not been reduced during the applicable periods shown. B Calculated based on average shares outstanding during the period. C Fees and expenses of any underlying Fidelity Central Funds are not included in the Fund's expense ratio. The Fund indirectly bears its proportionate share of the expenses of any underlying Fidelity Central Funds. D Amount does not include the portfolio activity of any underlying Fidelity Central Funds. E Expense ratios reflect operating expenses of the class. Expenses before reductions do not reflect amounts reimbursed by the investment adviser or reductions from brokerage service arrangements or reductions from other expense offset arrangements and do not represent the amount paid by the class during periods when reimbursements or reductions occur. Expenses net of fee waivers reflect expenses after reimbursement by the investment adviser but prior to reductions from brokerage service arrangements or other expense offset arrangements. Expenses net of all reductions represent the net expenses paid by the class. F Amount represents less than $.005 per share. |
See accompanying notes which are an integral part of the financial statements.
Annual Report
Notes to Financial Statements
For the period ended October 31, 2015
1. Organization.
Fidelity Latin America Fund (the Fund) is a non-diversified fund of Fidelity Investment Trust (the Trust) and is authorized to issue an unlimited number of shares. The Trust is registered under the Investment Company Act of 1940, as amended (the 1940 Act), as an open-end management investment company organized as a Massachusetts business trust. The Fund offers Class A, Class T, Class C, Latin America and Class I (formerly Institutional Class) shares, each of which, along with Class B shares, has equal rights as to assets and voting privileges. Class B shares are closed to new accounts and additional purchases, except for exchanges and reinvestments. Each class has exclusive voting rights with respect to matters that affect that class. Class B shares will automatically convert to Class A shares after a holding period of seven years from the initial date of purchase. The Fund's investments in emerging markets can be subject to social, economic, regulatory, and political uncertainties and can be extremely volatile.
2. Investments in Fidelity Central Funds.
The Fund invests in Fidelity Central Funds, which are open-end investment companies generally available only to other investment companies and accounts managed by the investment adviser and its affiliates. The Fund's Schedule of Investments lists each of the Fidelity Central Funds held as of period end, if any, as an investment of the Fund, but does not include the underlying holdings of each Fidelity Central Fund. As an Investing Fund, the Fund indirectly bears its proportionate share of the expenses of the underlying Fidelity Central Funds.
The Money Market Central Funds seek preservation of capital and current income and are managed by Fidelity Investments Money Management, Inc. (FIMM), an affiliate of the investment adviser. Annualized expenses of the Money Market Central Funds as of their most recent shareholder report date are less than .005%.
A complete unaudited list of holdings for each Fidelity Central Fund is available upon request or at the Securities and Exchange Commission (the SEC) website at www.sec.gov. In addition, the financial statements of the Fidelity Central Funds, which are not covered by the Fund's Report of Independent Registered Public Accounting Firm, are available on the SEC website or upon request.
3. Significant Accounting Policies.
The financial statements have been prepared in conformity with accounting principles generally accepted in the United States of America (GAAP), which require management to make certain estimates and assumptions at the date of the financial statements. Actual results could differ from those estimates. Subsequent events, if any, through the date that the financial statements were issued have been evaluated in the preparation of the financial statements. The following summarizes the significant accounting policies of the Fund:
Investment Valuation. Investments are valued as of 4:00 p.m. Eastern time on the last calendar day of the period. The Board of Trustees (the Board) has delegated the day to day responsibility for the valuation of the Fund's investments to the Fidelity Management & Research Company (FMR) Fair Value Committee (the Committee). In accordance with valuation policies and procedures approved by the Board, the Fund attempts to obtain prices from one or more third party pricing vendors or brokers to value its investments. When current market prices, quotations or currency exchange rates are not readily available or reliable, investments will be fair valued in good faith by the Committee, in accordance with procedures adopted by the Board. Factors used in determining fair value vary by investment type and may include market or investment specific events. The frequency with which these procedures are used cannot be predicted and they may be utilized to a significant extent. The Committee oversees the Fund's valuation policies and procedures and reports to the Board on the Committee's activities and fair value determinations. The Board monitors the appropriateness of the procedures used in valuing the Fund's investments and ratifies the fair value determinations of the Committee.
The Fund categorizes the inputs to valuation techniques used to value its investments into a disclosure hierarchy consisting of three levels as shown below:
Level 1 - quoted prices in active markets for identical investments
Level 2 - other significant observable inputs (including quoted prices for similar investments, interest rates, prepayment speeds, etc.)
Level 3 - unobservable inputs (including the Fund's own assumptions based on the best information available)
Valuation techniques used to value the Fund's investments by major category are as follows:
Equity securities, including restricted securities, for which market quotations are readily available, are valued at the last reported sale price or official closing price as reported by a third party pricing vendor on the primary market or exchange on which they are traded and are categorized as Level 1 in the hierarchy. In the event there were no sales during the day or closing prices are not available, securities are valued at the last quoted bid price or may be valued using the last available price and are generally categorized as Level 2 in the hierarchy. For foreign equity securities, when market or security specific events arise, comparisons to the valuation of American Depositary Receipts (ADRs), futures contracts, Exchange-Traded Funds (ETFs) and certain indexes as well as quoted prices for similar securities may be used and would be categorized as Level 2 in the hierarchy. Utilizing
Annual Report
Notes to Financial Statements - continued
3. Significant Accounting Policies - continued
Investment Valuation - continued
these techniques may result in transfers between Level 1 and Level 2. For equity securities, including restricted securities, where observable inputs are limited, assumptions about market activity and risk are used and these securities may be categorized as Level 3 in the hierarchy.
Investments in open-end mutual funds, including the Fidelity Central Funds, are valued at their closing net asset value (NAV) each business day and are categorized as Level 1 in the hierarchy.
Changes in valuation techniques may result in transfers in or out of an assigned level within the disclosure hierarchy.
Foreign Currency. The Fund may use foreign currency contracts to facilitate transactions in foreign-denominated securities. Gains and losses from these transactions may arise from changes in the value of the foreign currency or if the counterparties do not perform under the contracts' terms.
Foreign-denominated assets, including investment securities, and liabilities are translated into U.S. dollars at the exchange rates at period end. Purchases and sales of investment securities, income and dividends received and expenses denominated in foreign currencies are translated into U.S. dollars at the exchange rate in effect on the transaction date.
The effects of exchange rate fluctuations on investments are included with the net realized and unrealized gain (loss) on investment securities. Other foreign currency transactions resulting in realized and unrealized gain (loss) are disclosed separately.
Investment Transactions and Income. For financial reporting purposes, the Fund's investment holdings and NAV include trades executed through the end of the last business day of the period. The NAV per share for processing shareholder transactions is calculated as of the close of business of the New York Stock Exchange (NYSE), normally 4:00 p.m. Eastern time and includes trades executed through the end of the prior business day. Gains and losses on securities sold are determined on the basis of identified cost. Dividend income is recorded on the ex-dividend date, except for certain dividends from foreign securities where the ex-dividend date may have passed, which are recorded as soon as the Fund is informed of the ex-dividend date. Non-cash dividends included in dividend income, if any, are recorded at the fair market value of the securities received. Income and capital gain distributions from Fidelity Central Funds, if any, are recorded on the ex-dividend date. Distributions received on securities that represent a return of capital or capital gain are recorded as a reduction of cost of investments and/or as a realized gain. Subsequent to ex-dividend date the Fund determines the components of these distributions, based upon receipt of tax filings or other correspondence relating to the underlying investment. Interest income is accrued as earned and includes coupon interest and amortization of premium and accretion of discount on debt securities as applicable. Investment income is recorded net of foreign taxes withheld where recovery of such taxes is uncertain.
Class Allocations and Expenses. Investment income, realized and unrealized capital gains and losses, common expenses of the Fund, and certain fund-level expense reductions, if any, are allocated daily on a pro-rata basis to each class based on the relative net assets of each class to the total net assets of the Fund. Each class differs with respect to transfer agent and distribution and service plan fees incurred. Certain expense reductions may also differ by class. For the reporting period, the allocated portion of income and expenses to each class as a percent of its average net assets may vary due to the timing of recording these transactions in relation to fluctuating net assets of the classes. Expenses directly attributable to a fund are charged to that fund. Expenses attributable to more than one fund are allocated among the respective funds on the basis of relative net assets or other appropriate methods. Expense estimates are accrued in the period to which they relate and adjustments are made when actual amounts are known.
Income Tax Information and Distributions to Shareholders. Each year, the Fund intends to qualify as a regulated investment company under Subchapter M of the Internal Revenue Code, including distributing substantially all of its taxable income and realized gains. As a result, no provision for U.S. Federal income taxes is required. As of October 31, 2015, the Fund did not have any unrecognized tax benefits in the financial statements; nor is the Fund aware of any tax positions for which it is reasonably possible that the total amounts of unrecognized tax benefits will significantly change in the next twelve months. The Fund files a U.S. federal tax return, in addition to state and local tax returns as required. The Fund's federal income tax returns are subject to examination by the Internal Revenue Service (IRS) for a period of three fiscal years after they are filed. State and local tax returns may be subject to examination for an additional fiscal year depending on the jurisdiction. Foreign taxes are provided for based on the Fund's understanding of the tax rules and rates that exist in the foreign markets in which it invests.
Distributions are declared and recorded on the ex-dividend date. Income dividends and capital gain distributions are declared separately for each class. Income and capital gain distributions are determined in accordance with income tax regulations, which may differ from GAAP. In addition, the Fund claimed a portion of the payment made to redeeming shareholders as a distribution for income tax purposes.
Capital accounts within the financial statements are adjusted for permanent book-tax differences. These adjustments have no impact on net assets or the results of operations. Capital accounts are not adjusted for temporary book-tax differences which will reverse in a subsequent period.
Book-tax differences are primarily due to foreign currency transactions, capital loss carryforwards, passive foreign investment companies (PFIC), deferred trustees compensation, and losses deferred due to wash sales.
Annual Report
3. Significant Accounting Policies - continued
Income Tax Information and Distributions to Shareholders - continued
The federal tax cost of investment securities and unrealized appreciation (depreciation) as of period end were as follows:
Gross unrealized appreciation | $ 111,202,419 |
Gross unrealized depreciation | (153,035,114) |
Net unrealized appreciation (depreciation) on securities | $ (41,832,695) |
Tax Cost | $ 554,415,312 |
The tax-based components of distributable earnings as of period end were as follows:
Undistributed ordinary income | $ 7,013,225 |
Capital loss carryforward | $ (84,762,495) |
Net unrealized appreciation (depreciation) on securities and other investments | $ (41,872,368) |
Capital loss carryforwards are only available to offset future capital gains of the Fund to the extent provided by regulations and may be limited. Under the Regulated Investment Company Modernization Act of 2010 (the Act), the Fund is permitted to carry forward capital losses incurred in taxable years beginning after December 22, 2010 for an unlimited period and such capital losses are required to be used prior to any losses that expire. The capital loss carryforward information presented below, including any applicable limitation, is estimated as of fiscal period end and is subject to adjustment.
No expiration | |
Short-term | $ (34,655,095) |
Long-term | (50,107,400) |
Total capital loss carryforward | $ (84,762,495) |
The tax character of distributions paid was as follows:
| October 31, 2015 | October 31, 2014 |
Ordinary Income | $ 13,610,992 | $ 23,599,177 |
Long-term Capital Gains | 65,377,076 | 209,492,272 |
Total | $ 78,988,068 | $ 233,091,449 |
Short-Term Trading (Redemption) Fees. Shares held by investors in the Fund less than 90 days may have been subject to a redemption fee equal to 1.50% of the NAV of shares redeemed. All redemption fees, which reduce the proceeds of the shareholder redemption, are retained by the Fund and accounted for as an addition to paid in capital.
4. Purchases and Sales of Investments.
Purchases and sales of securities, other than short-term securities, aggregated $206,464,209 and $379,227,247, respectively.
5. Fees and Other Transactions with Affiliates.
Management Fee. Fidelity Management & Research Company (the investment adviser) and its affiliates provide the Fund with investment management related services for which the Fund pays a monthly management fee. The management fee is the sum of an individual fund fee rate that is based on an annual rate of .45% of the Fund's average net assets and an annualized group fee rate that averaged .25% during the period. The group fee rate is based upon the average net assets of all the mutual funds advised by the investment adviser, including any mutual funds previously advised by the investment adviser that are currently advised by Fidelity SelectCo, LLC, an affiliate of the investment adviser. The group fee rate decreases as assets under management increase and increases as assets under management decrease. For the reporting period, the total annual management fee rate was .70% of the Fund's average net assets.
Distribution and Service Plan Fees. In accordance with Rule 12b-1 of the 1940 Act, the Fund has adopted separate Distribution and Service Plans for each class of shares. Certain classes pay Fidelity Distributors Corporation (FDC), an affiliate of the investment adviser, separate Distribution and Service Fees, each of which is based on an annual percentage of each class' average net assets. In addition, FDC may pay financial intermediaries for
Annual Report
Notes to Financial Statements - continued
5. Fees and Other Transactions with Affiliates - continued
Distribution and Service Plan Fees - continued
selling shares of the Fund and providing shareholder support services. For the period, the Distribution and Service Fee rates, total fees and amounts retained by FDC were as follows:
| Distribution
Fee | Service
Fee | Total Fees | Retained
by FDC |
Class A | -% | .25% | $ 59,273 | $ 647 |
Class T | .25% | .25% | 34,910 | 81 |
Class B | .75% | .25% | 12,707 | 9,534 |
Class C | .75% | .25% | 77,075 | 10,716 |
| | | $ 183,965 | $ 20,978 |
Sales Load. FDC may receive a front-end sales charge of up to 5.75% for selling Class A shares and 3.50% for selling Class T shares, some of which is paid to financial intermediaries for selling shares of the Fund. Depending on the holding period, FDC may receive contingent deferred sales charges levied on Class A, Class T, Class B, and Class C redemptions. The deferred sales charges range from 5.00% to 1.00% for Class B shares, 1.00% for Class C shares, 1.00% for certain purchases of Class A shares and .25% for certain purchases of Class T shares.
For the period, sales charge amounts retained by FDC were as follows:
| Retained
by FDC |
Class A | $ 8,285 |
Class T | 1,542 |
Class BA | 1,183 |
Class CA | 1,816 |
| $ 12,826 |
A When Class B and Class C shares are initially sold, FDC pays commissions from its own resources to financial intermediaries through which the sales are made.
Transfer Agent Fees. Fidelity Investments Institutional Operations Company, Inc., (FIIOC), an affiliate of the investment adviser, is the transfer, dividend disbursing and shareholder servicing agent for each class of the Fund. FIIOC receives account fees and asset-based fees that vary according to the account size and type of account of the shareholders of the respective classes of the Fund. FIIOC pays for typesetting, printing and mailing of shareholder reports, except proxy statements.
For the period, transfer agent fees for each class were as follows:
| Amount | % of
Class-Level Average
Net Assets |
Class A | $ 70,425 | .30 |
Class T | 22,003 | .32 |
Class B | 3,759 | .30 |
Class C | 22,931 | .30 |
Latin America | 1,838,665 | .28 |
Class I | 5,434 | .21 |
| $ 1,963,217 | |
Accounting and Security Lending Fees. Fidelity Service Company, Inc. (FSC), an affiliate of the investment adviser, maintains the Fund's accounting records. The accounting fee is based on the level of average net assets for each month. Under a separate contract, FSC administers the security lending program. The security lending fee is based on the number and duration of lending transactions.
Brokerage Commissions. The Fund placed a portion of its portfolio transactions with brokerage firms which are affiliates of the investment adviser. Brokerage commissions are included in net realized gain (loss) and change in net unrealized appreciation (depreciation) in the Statement of Operations. The commissions paid to these affiliated firms were $3,354 for the period.
Interfund Lending Program. Pursuant to an Exemptive Order issued by the SEC, the Fund, along with other registered investment companies having management contracts with FMR or other affiliated entities of FMR, may participate in an interfund lending program. This program provides an
Annual Report
5. Fees and Other Transactions with Affiliates - continued
Interfund Lending Program - continued
alternative credit facility allowing the funds to borrow from, or lend money to, other participating affiliated funds. At period end, there were no interfund loans outstanding. The Fund's activity in this program during the period for which loans were outstanding was as follows:
Borrower or Lender | Average Loan Balance | Weighted Average
Interest Rate | Interest Expense |
Borrower | $ 5,893,750 | .34% | $ 444 |
6. Committed Line of Credit.
The Fund participates with other funds managed by the investment adviser or an affiliate in a $4.25 billion credit facility (the "line of credit") to be utilized for temporary or emergency purposes to fund shareholder redemptions or for other short-term liquidity purposes. The Fund has agreed to pay commitment fees on its pro-rata portion of the line of credit, which amounted to $1,072 and is reflected in Miscellaneous expenses on the Statement of Operations. During the period, the Fund did not borrow on this line of credit.
7. Security Lending.
The Fund lends portfolio securities through a lending agent from time to time in order to earn additional income. For equity securities, a lending agent is used and may loan securities to certain qualified borrowers, including Fidelity Capital Markets (FCM), a broker-dealer affiliated with the Fund. On the settlement date of the loan, the Fund receives collateral (in the form of U.S. Treasury obligations, letters of credit and/or cash) against the loaned securities and maintains collateral in an amount not less than 100% of the market value of the loaned securities during the period of the loan. The market value of the loaned securities is determined at the close of business of the Fund and any additional required collateral is delivered to the Fund on the next business day. The Fund or borrower may terminate the loan at any time, and if the borrower defaults on its obligation to return the securities loaned because of insolvency or other reasons, the Fund may apply collateral received from the borrower against the obligation. The Fund may experience delays and costs in recovering the securities loaned. Any cash collateral received is invested in the Fidelity Securities Lending Cash Central Fund. The value of loaned securities and cash collateral at period end are disclosed on the Fund's Statement of Assets and Liabilities. At period end, there were no security loans outstanding with FCM. Security lending income represents the income earned on investing cash collateral, less rebates paid to borrowers and any lending agent fees associated with the loan, plus any premium payments received for lending certain types of securities. Security lending income is presented in the Statement of Operations as a component of income from Fidelity Central Funds. Total security lending income during the period amounted to $36,119, including $28 from securities loaned to FCM.
8. Expense Reductions.
Commissions paid to certain brokers with whom the investment adviser, or its affiliates, places trades on behalf of the Fund include an amount in addition to trade execution, which may be rebated back to the Fund to offset certain expenses. This amount totaled $19,806 for the period. In addition, through arrangements with the Fund's custodian, credits realized as a result of certain uninvested cash balances were used to reduce the Fund's expenses. During the period, these credits reduced the Fund's custody expenses by $36.
In addition, during the period the investment adviser reimbursed and/or waived a portion of fund-level operating expenses in the amount of $2,673 and a portion of class-level operating expenses as follows:
| Amount |
Class A | $ 60 |
Class T | 14 |
Class B | 2 |
Class C | 40 |
Latin America | 43,294 |
Class I | 100 |
| $ 43,510 |
9. Distributions to Shareholders.
Distributions to shareholders of each class were as follows:
Years ended October 31, | 2015 | 2014 |
From net investment income | | |
Class A | $ 341,444 | $ 667,095 |
Class T | 71,167 | 136,327 |
Class B | - | 12,098 |
Annual Report
Notes to Financial Statements - continued
9. Distributions to Shareholders - continued
Years ended October 31, | 2015 | 2014 |
From net investment income | | |
Class C | $ 18,114 | $ 60,991 |
Latin America | 12,109,807 | 22,631,305 |
Class I | 52,230 | 91,360 |
Total | $ 12,592,762 | $ 23,599,176 |
From net realized gain | | |
Class A | $ 2,330,553 | $ 7,249,224 |
Class T | 658,521 | 1,918,455 |
Class B | 144,042 | 684,975 |
Class C | 754,025 | 2,282,110 |
Latin America | 62,251,897 | 196,577,505 |
Class I | 256,268 | 780,004 |
Total | $ 66,395,306 | $ 209,492,273 |
10. Share Transactions.
Share transactions for each class were as follows and may contain automatic conversions between classes or exchanges between funds:
| Shares | Dollars |
Years ended October 31, | 2015 | 2014 | 2015 | 2014 |
Class A | | | | |
Shares sold | 218,330 | 256,161 | $ 4,910,163 | $ 8,113,294 |
Reinvestment of distributions | 103,775 | 229,379 | 2,587,573 | 7,071,806 |
Shares redeemed | (565,352) | (524,684) | (12,518,797) | (16,539,013) |
Net increase (decrease) | (243,247) | (39,144) | $ (5,021,061) | $ (1,353,913) |
Class T | | | | |
Shares sold | 29,946 | 47,965 | $ 658,518 | $ 1,548,211 |
Reinvestment of distributions | 28,508 | 65,609 | 713,357 | 2,028,652 |
Shares redeemed | (88,493) | (104,082) | (1,990,592) | (3,252,264) |
Net increase (decrease) | (30,039) | 9,492 | $ (618,717) | $ 324,599 |
Class B | | | | |
Shares sold | 116 | 1,044 | $ 2,989 | $ 32,892 |
Reinvestment of distributions | 5,261 | 18,939 | 133,376 | 590,702 |
Shares redeemed | (43,584) | (64,672) | (982,322) | (2,061,800) |
Net increase (decrease) | (38,207) | (44,689) | $ (845,957) | $ (1,438,206) |
Class C | | | | |
Shares sold | 48,350 | 91,764 | $ 1,099,271 | $ 2,901,440 |
Reinvestment of distributions | 25,875 | 69,412 | 652,617 | 2,158,720 |
Shares redeemed | (151,109) | (161,581) | (3,411,105) | (5,151,621) |
Net increase (decrease) | (76,884) | (405) | $ (1,659,217) | $ (91,461) |
Latin America | | | | |
Shares sold | 2,736,036 | 4,529,614 | $ 60,647,605 | $ 143,961,705 |
Reinvestment of distributions | 2,862,287 | 6,820,938 | 71,197,829 | 209,950,213 |
Shares redeemed | (9,758,242) | (13,065,128) | (221,025,945) | (413,931,096) |
Net increase (decrease) | (4,159,919) | (1,714,576) | $ (89,180,511) | $ (60,019,178) |
Class I | | | | |
Shares sold | 41,136 | 125,962 | $ 906,993 | $ 4,086,454 |
Reinvestment of distributions | 11,139 | 21,472 | 276,862 | 660,492 |
Shares redeemed | (100,491) | (123,906) | (2,361,992) | (3,873,517) |
Net increase (decrease) | (48,216) | 23,528 | $ (1,178,137) | $ 873,429 |
11. Other.
The Fund's organizational documents provide former and current trustees and officers with a limited indemnification against liabilities arising in connection with the performance of their duties to the Fund. In the normal course of business, the Fund may also enter into contracts that provide general indemnifications. The Fund's maximum exposure under these arrangements is unknown as this would be dependent on future claims that may be made against the Fund. The risk of material loss from such claims is considered remote.
Annual Report
Report of Independent Registered Public Accounting Firm
To the Trustees of Fidelity Investment Trust and the Shareholders of Fidelity Latin America Fund:
In our opinion, the accompanying statement of assets and liabilities, including the schedule of investments, and the related statements of operations and of changes in net assets and the financial highlights present fairly, in all material respects, the financial position of Fidelity Latin America Fund (a fund of Fidelity Investment Trust) at October 31, 2015, the results of its operations for the year then ended, the changes in its net assets for each of the two years in the period then ended and the financial highlights for each of the five years in the period then ended, in conformity with accounting principles generally accepted in the United States of America. These financial statements and financial highlights (hereafter referred to as "financial statements") are the responsibility of the Fidelity Latin America Fund's management. Our responsibility is to express an opinion on these financial statements based on our audits. We conducted our audits of these financial statements in accordance with the standards of the Public Company Accounting Oversight Board (United States). Those standards require that we plan and perform the audit to obtain reasonable assurance about whether the financial statements are free of material misstatement. An audit includes examining, on a test basis, evidence supporting the amounts and disclosures in the financial statements, assessing the accounting principles used and significant estimates made by management, and evaluating the overall financial statement presentation. We believe that our audits, which included confirmation of securities at October 31, 2015 by correspondence with the custodian and brokers, provide a reasonable basis for our opinion.
PricewaterhouseCoopers LLP
Boston, Massachusetts
December 22, 2015
Annual Report
Trustees and Officers
The Trustees, Member of the Advisory Board, and officers of the trust and fund, as applicable, are listed below. The Board of Trustees governs the fund and is responsible for protecting the interests of shareholders. The Trustees are experienced executives who meet periodically throughout the year to oversee the fund's activities, review contractual arrangements with companies that provide services to the fund, oversee management of the risks associated with such activities and contractual arrangements, and review the fund's performance. Each of the Trustees oversees 170 funds.
The Trustees hold office without limit in time except that (a) any Trustee may resign; (b) any Trustee may be removed by written instrument, signed by at least two-thirds of the number of Trustees prior to such removal; (c) any Trustee who requests to be retired or who has become incapacitated by illness or injury may be retired by written instrument signed by a majority of the other Trustees; and (d) any Trustee may be removed at any special meeting of shareholders by a two-thirds vote of the outstanding voting securities of the trust. Each Trustee who is not an interested person (as defined in the 1940 Act) of the trust and the fund (Independent Trustee), shall retire not later than the last day of the calendar year in which his or her 75th birthday occurs. The Independent Trustees may waive this mandatory retirement age policy with respect to individual Trustees. The officers and Advisory Board Member hold office without limit in time, except that any officer and Advisory Board Member may resign or may be removed by a vote of a majority of the Trustees at any regular meeting or any special meeting of the Trustees. Except as indicated, each individual has held the office shown or other offices in the same company for the past five years.
Experience, Skills, Attributes, and Qualifications of the Fund's Trustees. The Governance and Nominating Committee has adopted a statement of policy that describes the experience, qualifications, attributes, and skills that are necessary and desirable for potential Independent Trustee candidates (Statement of Policy). The Board believes that each Trustee satisfied at the time he or she was initially elected or appointed a Trustee, and continues to satisfy, the standards contemplated by the Statement of Policy. The Governance and Nominating Committee also engages professional search firms to help identify potential Independent Trustee candidates who have the experience, qualifications, attributes, and skills consistent with the Statement of Policy. From time to time, additional criteria based on the composition and skills of the current Independent Trustees, as well as experience or skills that may be appropriate in light of future changes to board composition, business conditions, and regulatory or other developments, have also been considered by the professional search firms and the Governance and Nominating Committee. In addition, the Board takes into account the Trustees' commitment and participation in Board and committee meetings, as well as their leadership of standing and ad hoc committees throughout their tenure.
In determining that a particular Trustee was and continues to be qualified to serve as a Trustee, the Board has considered a variety of criteria, none of which, in isolation, was controlling. The Board believes that, collectively, the Trustees have balanced and diverse experience, qualifications, attributes, and skills, which allow the Board to operate effectively in governing the fund and protecting the interests of shareholders. Information about the specific experience, skills, attributes, and qualifications of each Trustee, which in each case led to the Board's conclusion that the Trustee should serve (or continue to serve) as a trustee of the fund, is provided below.
Board Structure and Oversight Function. James C. Curvey is an interested person (as defined in the 1940 Act) and currently serves as Chairman. The Trustees have determined that an interested Chairman is appropriate and benefits shareholders because an interested Chairman has a personal and professional stake in the quality and continuity of services provided to the fund. Independent Trustees exercise their informed business judgment to appoint an individual of their choosing to serve as Chairman, regardless of whether the Trustee happens to be independent or a member of management. The Independent Trustees have determined that they can act independently and effectively without having an Independent Trustee serve as Chairman and that a key structural component for assuring that they are in a position to do so is for the Independent Trustees to constitute a substantial majority for the Board. The Independent Trustees also regularly meet in executive session. Ned C. Lautenbach serves as Chairman of the Independent Trustees and as such (i) acts as a liaison between the Independent Trustees and management with respect to matters important to the Independent Trustees and (ii) with management prepares agendas for Board meetings.
Fidelity funds are overseen by different Boards of Trustees. The fund's Board oversees Fidelity's high income and certain equity funds, and other Boards oversee Fidelity's investment-grade bond, money market, asset allocation, and sector funds. The asset allocation funds may invest in Fidelity funds overseen by the fund's Board. The use of separate Boards, each with its own committee structure, allows the Trustees of each group of Fidelity funds to focus on the unique issues of the funds they oversee, including common research, investment, and operational issues. On occasion, the separate Boards establish joint committees to address issues of overlapping consequences for the Fidelity funds overseen by each Board.
The Trustees operate using a system of committees to facilitate the timely and efficient consideration of all matters of importance to the Trustees, the fund, and fund shareholders and to facilitate compliance with legal and regulatory requirements and oversight of the fund's activities and associated risks. The Board, acting through its committees, has charged FMR and its affiliates with (i) identifying events or circumstances the occurrence of which could have demonstrably adverse effects on the fund's business and/or reputation; (ii) implementing processes and controls to lessen the possibility that such events or circumstances occur or to mitigate the effects of such events or circumstances if they do occur; and (iii) creating and maintaining a system designed to evaluate continuously business and market conditions in order to facilitate the identification and implementation processes described in (i) and (ii) above. Because the day-to-day operations and activities of the fund are carried out by or through FMR, its affiliates and other service providers, the fund's exposure to risks is mitigated but not eliminated by the processes overseen by the Trustees. While each of the Board's committees has responsibility for overseeing different aspects of the fund's activities, oversight is exercised primarily through the Operations, Audit, and Compliance Committees. In addition, the Independent Trustees have worked with FMR to enhance the Board's oversight of investment and financial risks, legal and regulatory risks, technology risks, and operational risks, including the development of additional risk reporting to the Board. For example, a working group comprised of Independent Trustees and FMR has worked and continues to work to review the Fidelity funds' valuation-related activities, reporting and risk management. Appropriate personnel, including but not limited to the fund's Chief Compliance Officer (CCO), FMR's internal auditor, the independent accountants, the fund's Treasurer and portfolio management personnel, make periodic reports to the Board's committees, as appropriate, including an annual review of Fidelity's risk management program for the Fidelity funds. The responsibilities of each standing committee, including their oversight responsibilities, are described further under "Standing Committees of the Fund's Trustees."
Annual Report
The fund's Statement of Additional Information (SAI) includes more information about the Trustees. To request a free copy, call Fidelity at 1-877-208-0098.
Interested Trustees*:
Correspondence intended for each Trustee who is an interested person may be sent to Fidelity Investments, 245 Summer Street, Boston, Massachusetts 02210.
Name, Year of Birth; Principal Occupations and Other Relevant Experience+ |
James C. Curvey (1935) |
Year of Election or Appointment: 2007 Trustee Chairman of the Board of Trustees |
| Mr. Curvey also serves as Trustee of other Fidelity funds. Mr. Curvey is a Director of Fidelity Research & Analysis Co. (investment adviser firm, 2009-present), and Vice Chairman (2007-present) and Director of FMR LLC (diversified financial services company). In addition, Mr. Curvey serves as an Overseer for the Boston Symphony Orchestra and a member of the board of Artis-Naples, Naples, Florida, and as a Trustee for Brewster Academy, Wolfeboro, New Hampshire. Previously, Mr. Curvey served as a Director of Fidelity Investments Money Management, Inc. (investment adviser firm, 2009-2014) and a Director of FMR and FMR Co., Inc. (investment adviser firms, 2007-2014). |
Charles S. Morrison (1960) |
Year of Election or Appointment: 2014 Trustee |
| Mr. Morrison also serves as Trustee of other funds. He serves as a Director of Fidelity Investments Money Management, Inc. (FIMM) (investment adviser firm, 2014-present), Director of Fidelity SelectCo, LLC (investment adviser firm, 2014-present), President, Asset Management (2014-present), and is an employee of Fidelity Investments. Previously, Mr. Morrison served as Vice President of Fidelity's Fixed Income and Asset Allocation Funds (2012-2014), President, Fixed Income (2011-2014), Vice President of Fidelity's Money Market Funds (2005-2009), President, Money Market Group Leader of FMR (investment adviser firm, 2009), and Senior Vice President, Money Market Group of FMR (2004-2009). Mr. Morrison also served as Vice President of Fidelity's Bond Funds (2002-2005), certain Balanced Funds (2002-2005), and certain Asset Allocation Funds (2002-2007), and as Senior Vice President (2002-2005) of Fidelity's Bond Division. |
* Trustees have been determined to be "Interested Trustees" by virtue of, among other things, their affiliation with the trust or various entities under common control with FMR.
+ The information above includes each Trustee's principal occupation during the last five years and other information relating to the experience, attributes, and skills relevant to each Trustee's qualifications to serve as a Trustee, which led to the conclusion that each Trustee should serve as a Trustee for the fund.
Annual Report
Trustees and Officers - continued
Independent Trustees:
Correspondence intended for each Independent Trustee (that is, the Trustees other than the Interested Trustees) may be sent to Fidelity Investments, P.O. Box 55235, Boston, Massachusetts 02205-5235.
Name, Year of Birth; Principal Occupations and Other Relevant Experience+ |
Dennis J. Dirks (1948) |
Year of Election or Appointment: 2005 Trustee |
| Mr. Dirks also serves as Trustee of other Fidelity funds. Prior to his retirement in May 2003, Mr. Dirks was Chief Operating Officer and a member of the Board of The Depository Trust & Clearing Corporation (DTCC). He also served as President, Chief Operating Officer, and Board member of The Depository Trust Company (DTC) and President and Board member of the National Securities Clearing Corporation (NSCC). In addition, Mr. Dirks served as Chief Executive Officer and Board member of the Government Securities Clearing Corporation, Chief Executive Officer and Board member of the Mortgage-Backed Securities Clearing Corporation, as a Trustee and a member of the Finance Committee of Manhattan College (2005-2008), as a Trustee and a member of the Finance Committee of AHRC of Nassau County (2006-2008), and as a member of the Independent Directors Council (IDC) Governing Council (2010-2015). Mr. Dirks is a member of the Board of Directors for The Brookville Center for Children's Services, Inc. (2009-present). |
Alan J. Lacy (1953) |
Year of Election or Appointment: 2008 Trustee |
| Mr. Lacy also serves as Trustee of other Fidelity funds. Mr. Lacy serves as a member of the Board of Directors of Dave & Buster's Entertainment, Inc. (restaurant and entertainment complexes, 2010-present) and Bristol-Myers Squibb Company (global pharmaceuticals, 2008-present). In addition, Mr. Lacy served as Senior Adviser (2007-2014) of Oak Hill Capital Partners, L.P. (private equity) and also served as Chief Executive Officer (2000-2005) and Vice Chairman (2005-2006) of Sears Holdings Corporation and Sears, Roebuck and Co. (retail). Mr. Lacy is a member of the Board of Trustees of The National Parks Conservation Association (2006-present). Previously, Mr. Lacy served as Chairman of the Board of Trustees of the National Parks Conservation Association (2008-2011) and as a member of the Board of Directors for The Western Union Company (global money transfer, 2006-2011), The Hillman Companies, Inc. (hardware wholesalers, 2010-2014), and Earth Fare, Inc. (retail grocery, 2010-2014). |
Ned C. Lautenbach (1944) |
Year of Election or Appointment: 2000 Trustee Chairman of the Independent Trustees |
| Mr. Lautenbach also serves as Trustee of other Fidelity funds. Mr. Lautenbach currently serves as the Lead Director of the Eaton Corporation Board of Directors (diversified industrial, 1997-present). Mr. Lautenbach is Chairman of the Board of Directors of Artis-Naples in Naples, Florida (2012-present), a member of the Council on Foreign Relations (1994-present), and a member of the Board of Governors, State University System of Florida (2013-present). Previously, Mr. Lautenbach was a Partner/Advisory Partner at Clayton, Dubilier & Rice, LLC (private equity investment, 1998-2010), as well as a Director of Sony Corporation (2006-2007). |
Joseph Mauriello (1944) |
Year of Election or Appointment: 2008 Trustee |
| Mr. Mauriello also serves as Trustee of other Fidelity funds. Prior to his retirement in January 2006, Mr. Mauriello served in numerous senior management positions including Deputy Chairman and Chief Operating Officer (2004-2005), and Vice Chairman of Financial Services (2002-2004) of KPMG LLP US (professional services, 1965-2005). Mr. Mauriello currently serves as a member of the Board of Directors of XL Group plc. (global insurance and re-insurance, 2006-present) and the Independent Directors Council (IDC) Governing Council (2015-present). Previously, Mr. Mauriello served as a Director of the Hamilton Funds of the Bank of New York (2006-2007) and of Arcadia Resources Inc. (health care services and products, 2007-2012). |
Robert W. Selander (1950) |
Year of Election or Appointment: 2011 Trustee |
| Mr. Selander also serves as Trustee of other Fidelity funds. Mr. Selander serves as a Director of The Western Union Company (global money transfer, 2014-present). Previously, Mr. Selander served as a Member of the Advisory Board of other Fidelity funds (2011), and Executive Vice Chairman (2010), Chief Executive Officer (2009-2010), and President and Chief Executive Officer (1997-2009) of Mastercard, Inc. |
Cornelia M. Small (1944) |
Year of Election or Appointment: 2005 Trustee |
| Ms. Small also serves as Trustee of other Fidelity funds. Ms. Small is a member of the Board of Directors (2009-present) and Chair of the Investment Committee (2010-present) of the Teagle Foundation. Ms. Small also serves on the Investment Committee of the Berkshire Taconic Community Foundation (2008-present). Previously, Ms. Small served as Chairperson (2002-2008) and a member of the Investment Committee and Chairperson (2008-2012) and a member of the Board of Trustees of Smith College. In addition, Ms. Small served as Chief Investment Officer, Director of Global Equity Investments, and a member of the Board of Directors of Scudder, Stevens & Clark and Scudder Kemper Investments. |
William S. Stavropoulos (1939) |
Year of Election or Appointment: 2001 Trustee Vice Chairman of the Independent Trustees |
| Mr. Stavropoulos also serves as Trustee of other Fidelity funds. Mr. Stavropoulos serves as President and Founder of the Michigan Baseball Foundation, the Great Lakes Loons (2007-present). Mr. Stavropoulos is Chairman Emeritus of the Board of Directors of The Dow Chemical Company, where he previously served in numerous senior management positions, including President, CEO (1995-2000; 2002-2004), Chairman of the Executive Committee (2000-2006), and as a member of the Board of Directors (1990-2006). Currently, Mr. Stavropoulos is Chairman of the Board of Directors of Univar Inc. (global distributor of commodity and specialty chemicals), a Director of Teradata Corporation (data warehousing and technology solutions), and Maersk Inc. (industrial conglomerate), and a member of the Advisory Board for Metalmark Capital LLC (private equity investment, 2005-present). Mr. Stavropoulos is an operating advisor to Clayton, Dubilier & Rice, LLC (private equity investment). In addition, Mr. Stavropoulos is a member of the University of Notre Dame Advisory Council for the College of Science, a Trustee of the Rollin L. Gerstacker Foundation, and a Director of the Naples Philharmonic Center for the Arts. Previously, Mr. Stavropoulos served as a Director of Chemical Financial Corporation (bank holding company, 1993-2012) and Tyco International, Ltd. (multinational manufacturing and services, 2007-2012). |
David M. Thomas (1949) |
Year of Election or Appointment: 2008 Trustee |
| Mr. Thomas also serves as Trustee of other Fidelity funds. Mr. Thomas serves as Non-Executive Chairman of the Board of Directors of Fortune Brands Home and Security (home and security products, 2011-present), as a member of the Board of Directors (2004-present) and Presiding Director (2013-present) of Interpublic Group of Companies, Inc. (marketing communication), and as a member of the Board of Trustees of the University of Florida (2013-present). Previously, Mr. Thomas served as Executive Chairman (2005-2006) and Chairman and Chief Executive Officer (2000-2005) of IMS Health, Inc. (pharmaceutical and healthcare information solutions), and a Director of Fortune Brands, Inc. (consumer products, 2000-2011). |
+ The information above includes each Trustee's principal occupation during the last five years and other information relating to the experience, attributes, and skills relevant to each Trustee's qualifications to serve as a Trustee, which led to the conclusion that each Trustee should serve as a Trustee for the fund.
Advisory Board Member and Officers:
Correspondence intended for each officer and Peter S. Lynch may be sent to Fidelity Investments, 245 Summer Street, Boston, Massachusetts 02210. Officers appear below in alphabetical order.
Name, Year of Birth; Principal Occupation |
Peter S. Lynch (1944) |
Year of Election or Appointment: 2003 Member of the Advisory Board |
| Mr. Lynch also serves as Member of the Advisory Board of other Fidelity funds. Mr. Lynch is Vice Chairman and a Director of FMR (investment adviser firm) and FMR Co., Inc. (investment adviser firm). In addition, Mr. Lynch serves as a Trustee of Boston College and as the Chairman of the Inner-City Scholarship Fund. Previously, Mr. Lynch served on the Special Olympics International Board of Directors (1997-2006). |
Elizabeth Paige Baumann (1968) |
Year of Election or Appointment: 2012 Anti-Money Laundering (AML) Officer |
| Ms. Baumann also serves as AML Officer of other funds. She is Chief AML Officer of FMR LLC (diversified financial services company, 2012-present) and is an employee of Fidelity Investments. Previously, Ms. Baumann served as Vice President and Deputy Anti-Money Laundering Officer (2007-2012). |
Marc R. Bryant (1966) |
Year of Election or Appointment: 2015 Secretary and Chief Legal Officer (CLO) |
| Mr. Bryant also serves as Secretary and CLO of other funds. Mr. Bryant serves as CLO, Secretary, and Senior Vice President of Fidelity Management & Research Company (investment adviser firm, 2015-present) and FMR Co., Inc. (investment adviser firm, 2015-present); Secretary of Fidelity SelectCo, LLC (investment adviser firm, 2015-present) and Fidelity Investments Money Management, Inc. (investment adviser firm, 2015-present); and CLO of Fidelity Management & Research (Hong Kong) Limited (investment adviser firm, 2015-present). He is Senior Vice President and Deputy General Counsel of FMR LLC (diversified financial services company). Previously, Mr. Bryant served as Secretary and Chief Legal Officer of Fidelity Rutland Square Trust II (2010-2014) and Assistant Secretary of Fidelity's Fixed Income and Asset Allocation Funds (2013-2015). Prior to joining Fidelity Investments, Mr. Bryant served as a Senior Vice President and the Head of Global Retail Legal for AllianceBernstein L.P. (2006-2010), and as the General Counsel for ProFund Advisors LLC (2001-2006). |
William C. Coffey (1969) |
Year of Election or Appointment: 2009 Assistant Secretary |
| Mr. Coffey also serves as Assistant Secretary of other funds. He is Senior Vice President and Deputy General Counsel of FMR LLC (diversified financial services company, 2010-present), and is an employee of Fidelity Investments. Previously, Mr. Coffey served as Vice President and Associate General Counsel of FMR LLC (2005-2009). |
Timothy M. Cohen (1969) |
Year of Election or Appointment: 2014 Vice President of certain Equity Funds |
| Mr. Cohen also serves as Vice President of other funds. Mr. Cohen serves as Chief Compliance Officer of FMR Investment Management (U.K.) Limited (investment adviser firm, 2013-present) and is an employee of Fidelity Investments. Previously, Mr. Cohen served as a Director of FMR Investment Management (U.K.) Limited (2013-2015). |
Jonathan Davis (1968) |
Year of Election or Appointment: 2010 Assistant Treasurer |
| Mr. Davis also serves as Assistant Treasurer of other funds, and is an employee of Fidelity Investments. Previously, Mr. Davis served as Vice President and Associate General Counsel of FMR LLC (diversified financial services company, 2003-2010). |
Adrien E. Deberghes (1967) |
Year of Election or Appointment: 2008 Deputy Treasurer |
| Mr. Deberghes also serves as an officer of other funds. He is an employee of Fidelity Investments (2008-present). Prior to joining Fidelity Investments, Mr. Deberghes was Senior Vice President of Mutual Fund Administration at State Street Corporation (2007-2008), Senior Director of Mutual Fund Administration at Investors Bank & Trust (2005-2007), and Director of Finance for Dunkin' Brands (2000-2005). |
Stephanie J. Dorsey (1969) |
Year of Election or Appointment: 2010 Assistant Treasurer |
| Ms. Dorsey also serves as an officer of other funds. She is an employee of Fidelity Investments (2008-present) and has served in other fund officer roles. Prior to joining Fidelity Investments, Ms. Dorsey served as Treasurer (2004-2008) of the JPMorgan Mutual Funds and Vice President (2004-2008) of JPMorgan Chase Bank. |
Howard J. Galligan III (1966) |
Year of Election or Appointment: 2014 Chief Financial Officer |
| Mr. Galligan also serves as Chief Financial Officer of other funds. Mr. Galligan serves as President of Fidelity Pricing and Cash Management Services (FPCMS) (2014-present) and as a Director of Strategic Advisers, Inc. (investment adviser firm, 2008-present). Previously, Mr. Galligan served as Chief Administrative Officer of Asset Management (2011-2014) and Chief Operating Officer and Senior Vice President of Investment Support for Strategic Advisers, Inc. (2003-2011). |
Scott C. Goebel (1968) |
Year of Election or Appointment: 2015 Vice President |
| Mr. Goebel serves as Vice President of other funds and is an employee of Fidelity Investments (2001-present). Previously, Mr. Goebel served as Secretary of Fidelity SelectCo, LLC (investment adviser firm, 2013-2015), Fidelity Investments Money Management, Inc. (FIMM) (investment adviser firm, 2010-2015), and Fidelity Research and Analysis Company (FRAC) (investment adviser firm, 2010-2015); General Counsel, Secretary, and Senior Vice President of Fidelity Management & Research Company (investment adviser firm, 2008-2015) and FMR Co., Inc. (investment adviser firm, 2008-2015); Assistant Secretary of Fidelity Management & Research (Japan) Limited (investment adviser firm, 2008-2015) and FMR Investment Management (U.K.) Limited (investment adviser firm, 2008-2015); Chief Legal Officer (CLO) of Fidelity Management & Research (Hong Kong) Limited (investment adviser firm, 2008-2015); Secretary and CLO of certain Fidelity funds (2008-2015); Assistant Secretary of FIMM (2008-2010), FRAC (2008-2010), and certain funds (2007-2008); and as Vice President and Secretary of Fidelity Distributors Corporation (FDC) (2005-2007). |
Brian B. Hogan (1964) |
Year of Election or Appointment: 2009 Vice President |
| Mr. Hogan also serves as Trustee or Vice President of other funds. Mr. Hogan serves as a Director of Fidelity SelectCo, LLC (investment adviser firm, 2014-present) and President of the Equity Division of FMR (investment adviser firm, 2009-present). Previously, Mr. Hogan served as Senior Vice President, Equity Research of FMR (2006-2009) and as a portfolio manager. |
Chris Maher (1972) |
Year of Election or Appointment: 2013 Assistant Treasurer |
| Mr. Maher serves as Assistant Treasurer of other funds. Mr. Maher is Vice President of Valuation Oversight and is an employee of Fidelity Investments. Previously, Mr. Maher served as Vice President of Asset Management Compliance (2013), Vice President of the Program Management Group of FMR (investment adviser firm, 2010-2013), and Vice President of Valuation Oversight (2008-2010). |
Kenneth B. Robins (1969) |
Year of Election or Appointment: 2008 President and Treasurer |
| Mr. Robins also serves as an officer of other funds. Mr. Robins serves as Executive Vice President of Fidelity Investments Money Management, Inc. (FIMM) (investment adviser firm, 2013-present) and is an employee of Fidelity Investments (2004-present). Previously, Mr. Robins served in other fund officer roles. |
Stacie M. Smith (1974) |
Year of Election or Appointment: 2013 Deputy Treasurer |
| Ms. Smith also serves as an officer of other funds. She is an employee of Fidelity Investments (2009-present) and has served in other fund officer roles. Prior to joining Fidelity Investments, Ms. Smith served as Senior Audit Manager of Ernst & Young LLP (1996-2009). |
Renee Stagnone (1975) |
Year of Election or Appointment: 2013 Deputy Treasurer |
| Ms. Stagnone also serves as Deputy Treasurer of other funds. Ms. Stagnone is an employee of Fidelity Investments (1997-present). |
Linda J. Wondrack (1964) |
Year of Election or Appointment: 2014 Chief Compliance Officer |
| Ms. Wondrack also serves as Chief Compliance Officer of other funds. Ms. Wondrack is Executive Vice President and head of the Ethics Office and Asset Management Compliance for Fidelity Investments (2012-present). Ms. Wondrack also serves as Chief Compliance Officer of Fidelity SelectCo, LLC (investment adviser firm, 2014-present); Chief Compliance Officer of Impresa Management LLC (2013-present); and Chief Compliance Officer of FMR Co., Inc. (investment adviser firm), Fidelity Investments Money Management, Inc. (investment adviser firm), Fidelity Management & Research (Japan) Limited (investment adviser firm), FMR Investment Management (U.K.) Limited (investment adviser firm), Fidelity Management & Research (Hong Kong) (investment adviser firm), Fidelity Management & Research Company (investment adviser firm), FIAM LLC (investment adviser firm), and Strategic Advisers, Inc. (investment adviser firm), Ballyrock Investment Advisors LLC, and Northern Neck Investors LLC (2012-present). Previously, Ms. Wondrack served as Senior Vice President and Chief Compliance Officer for Columbia Management Investment Advisers, LLC (2005-2012); Chief Compliance Officer for certain funds within the Columbia Family of Funds (2007-2012); and Senior Vice President of Compliance Risk Management at Bank of America (2005-2010). |
Joseph F. Zambello (1957) |
Year of Election or Appointment: 2011 Deputy Treasurer |
| Mr. Zambello also serves as Deputy Treasurer of other funds. Mr. Zambello is an employee of Fidelity Investments (1991-present). Previously, Mr. Zambello served as Vice President of the Program Management Group of FMR (investment adviser firm, 2009-2011) and Vice President of the Transfer Agent Oversight Group (2005-2009). |
Annual Report
Distributions (Unaudited)
A percentage of the dividends distributed during the fiscal year may be taken into account as a dividend for the purposes of the maximum rate under section 1(h)(11) of the Internal Revenue Code
| 12/05/2014 | 12/26/2014 |
Class I | 51% | 59% |
The amounts per share which represent income derived from sources within, and taxes paid to, foreign countries or possessions of the United States are as follows:
| Pay Date | Income | Taxes |
Class I | 12/08/2014 | $0.5135 | $0.0895 |
| 12/29/2014 | $0.0300 | $0.0000 |
The fund will notify shareholders in January 2016 of amounts for use in preparing 2015 income tax returns.
Annual Report
Board Approval of Investment Advisory Contracts and Management Fees
Fidelity Latin America Fund
Each year, the Board of Trustees, including the Independent Trustees (together, the Board), votes on the renewal of the management contract with Fidelity Management & Research Company (FMR) and the sub-advisory agreements (together, the Advisory Contracts) for the fund. The Board, assisted by the advice of fund counsel and Independent Trustees' counsel, requests and considers a broad range of information relevant to the renewal of the Advisory Contracts throughout the year.
The Board meets regularly and, at each of its meetings, covers an extensive agenda of topics and materials and considers factors that are relevant to its annual consideration of the renewal of the fund's Advisory Contracts, including the services and support provided to the fund and its shareholders. The Board has established various standing committees (Committees), each composed of and chaired by Independent Trustees with varying backgrounds, to which the Board has assigned specific subject matter responsibilities in order to enhance effective decision-making by the Board. The Board, acting directly and through its Committees, requests and receives information concerning the annual consideration of the renewal of the fund's Advisory Contracts. The Board also meets as needed to consider matters specifically related to the Board's annual consideration of the renewal of the Advisory Contracts. Members of the Board may also meet with trustees of other Fidelity funds through ad hoc joint committees to discuss certain matters relevant to all of the Fidelity funds.
At its July 2015 meeting, the Board unanimously determined to renew the fund's Advisory Contracts. In reaching its determination, the Board considered all factors it believed relevant, including (i) the nature, extent, and quality of the services to be provided to the fund and its shareholders (including the investment performance of the fund); (ii) the competitiveness of the fund's management fee and total expense ratio relative to peer funds; (iii) the total costs of the services to be provided by and the profits to be realized by Fidelity from its relationship with the fund; and (iv) the extent to which (if any) economies of scale exist and would be realized as the fund grows, and whether any economies of scale are appropriately shared with fund shareholders.
In considering whether to renew the Advisory Contracts for the fund, the Board reached a determination, with the assistance of fund counsel and Independent Trustees' counsel and through the exercise of its business judgment, that the renewal of the Advisory Contracts was in the best interests of the fund and its shareholders and that the compensation payable under the Advisory Contracts was fair and reasonable. The Board's decision to renew the Advisory Contracts was not based on any single factor, but rather was based on a comprehensive consideration of all the information provided to the Board at its meetings throughout the year. The Board, in reaching its determination to renew the Advisory Contracts, was aware that shareholders of the fund have a broad range of investment choices available to them, including a wide choice among funds offered by Fidelity's competitors, and that the fund's shareholders, who have the opportunity to review and weigh the disclosure provided by the fund in its prospectus and other public disclosures, have chosen to invest in this fund, which is part of the Fidelity family of funds.
Nature, Extent, and Quality of Services Provided. The Board considered Fidelity's staffing as it relates to the fund, including the backgrounds of investment personnel of Fidelity, and also considered the fund's investment objective, strategies, and related investment philosophy. The Independent Trustees also had discussions with senior management of Fidelity's investment operations and investment groups. The Board considered the structure of the portfolio manager compensation program and whether this structure provides appropriate incentives to act in the best interests of the fund. Additionally, the Board considered the portfolio managers' investments, if any, in the funds that they manage.
Resources Dedicated to Investment Management and Support Services. The Board and the Fund Oversight and Research Committees reviewed the general qualifications and capabilities of Fidelity's investment staff, including its size, education, experience, and resources, as well as Fidelity's approach to recruiting, training, managing, and compensating investment personnel. The Board noted that Fidelity has continued to increase the resources devoted to non-U.S. offices, including expansion of Fidelity's global investment organization. The Board also noted that Fidelity's analysts have extensive resources, tools and capabilities that allow them to conduct sophisticated quantitative and fundamental analysis, as well as credit analysis of issuers, counterparties and guarantors. Further, the Board considered that Fidelity's investment professionals have sufficient access to global information and data so as to provide competitive investment results over time, and that those professionals also have access to sophisticated tools that permit them to assess portfolio construction and risk and performance attribution characteristics continuously, as well as to transmit new information and research conclusions rapidly around the world. Additionally, in its deliberations, the Board considered Fidelity's trading, risk management, and compliance capabilities and resources, which are integral parts of the investment management process.
Shareholder and Administrative Services. The Board considered (i) the nature, extent, quality, and cost of advisory, administrative, and shareholder services performed by FMR, the sub-advisers (together with FMR, the Investment Advisers), and their affiliates under the Advisory Contracts and under separate agreements covering transfer agency, pricing and bookkeeping, and securities lending services for the fund; (ii) the nature and extent of the supervision of third party service providers, principally custodians and subcustodians; and (iii) the resources devoted to, and the record of compliance with, the fund's compliance policies and procedures. The Board also reviewed the allocation of fund brokerage, including allocations to brokers affiliated with the Investment Advisers, the use of brokerage commissions to pay fund expenses, and the use of "soft" commission dollars to pay for research services.
Annual Report
The Board noted that the growth of fund assets over time across the complex allows Fidelity to reinvest in the development of services designed to enhance the value or convenience of the Fidelity funds as investment vehicles. These services include 24-hour access to account information and market information through telephone representatives and over the Internet, investor education materials and asset allocation tools, and the expanded availability of Fidelity Investor Centers.
In 2014, the Board formed an ad hoc Committee on Transfer Agency Fees to review the variety of transfer agency fee structures throughout the industry and Fidelity's competitive positioning with respect to industry participants.
Investment in a Large Fund Family. The Board considered the benefits to shareholders of investing in a Fidelity fund, including the benefits of investing in a fund that is part of a large family of funds offering a variety of investment disciplines and providing a large variety of mutual fund investor services. The Board noted that Fidelity had taken, or had made recommendations that resulted in the Fidelity funds taking, a number of actions over the previous year that benefited particular funds, including (i) continuing to dedicate additional resources to investment research and to the support of the senior management team that oversees asset management; (ii) continuing efforts to enhance Fidelity's global research capabilities; (iii) launching new funds and making other enhancements to meet client needs; (iv) reducing management fees and total expenses for certain index funds and diversified international funds; (v) continuing to launch dedicated lower cost underlying funds to meet portfolio construction needs related to expanding underlying fund options for Fidelity funds of funds, specifically for the Freedom Fund product lines; (vi) rationalizing product lines and gaining increased efficiencies through fund mergers; (vii) launching active fixed-income exchange-traded funds; (viii) continuing to develop, acquire and implement systems and technology to improve services to the funds and information security and to increase efficiency; (ix) implementing investment enhancements to further strengthen Fidelity's target date product line to increase investors' probability of success in achieving their goals; (x) modifying the eligibility criteria for certain share classes to accommodate roll-over assets from employer-sponsored retirement plans; (xi) launching a new Class W of the Freedom Index Funds to attract and retain Fidelity record-kept retirement plan assets; and (xii) implementing changes to Fidelity's money market product line in response to recent money market regulatory reforms.
Investment Performance. The Board considered whether the fund has operated in accordance with its investment objective, as well as its record of compliance with its investment restrictions and its performance history.
The Board took into account discussions with representatives of the Investment Advisers about fund investment performance that occur at Board meetings throughout the year. In this regard the Board noted that as part of regularly scheduled fund reviews and other reports to the Board on fund performance, the Board considers annualized return information for the fund, for different time periods, measured against a securities market index ("benchmark index") and a peer group of funds with similar objectives ("peer group"), if any. In its evaluation of fund investment performance, the Board gave particular attention to information indicating changes in performance of certain Fidelity funds for specific time periods and discussed with the Investment Advisers the reasons for any overperformance or underperformance.
In addition to reviewing absolute and relative fund performance, the Independent Trustees periodically consider the appropriateness of fund performance metrics in evaluating the results achieved. In general, the Independent Trustees believe that fund performance should be evaluated based on net performance (after fees and expenses) of both the highest performing and lowest performing fund share classes, where applicable, compared to appropriate benchmark indices, over appropriate time periods that may include full market cycles, and compared to peer groups, as applicable, over the same periods, taking into account relevant factors including the following: general market conditions; issuer-specific information; and fund cash flows and other factors.
The Independent Trustees recognize that shareholders evaluate performance on a net basis over their own holding periods, for which one-, three-, and five-year periods are often used as a proxy. For this reason, the performance information reviewed by the Board also included net cumulative calendar year total return information for the fund and an appropriate benchmark index for the most recent one-, three-, and five-year periods, as shown below. A peer group is not shown below because the fund does not generally utilize a peer group for performance comparison purposes.
Annual Report
Board Approval of Investment Advisory Contracts and Management Fees - continued
Fidelity Latin America Fund

The Board has discussed the fund's underperformance with FMR and has engaged with FMR to consider what steps might be taken to remediate the fund's underperformance.
Based on its review, the Board concluded that the nature, extent, and quality of services provided to the fund under the Advisory Contracts should benefit the shareholders of the fund.
Competitiveness of Management Fee and Total Expense Ratio. The Board considered the fund's management fee and total expense ratio compared to "mapped groups" of competitive funds and classes created for the purpose of facilitating the Trustees' competitive analysis of management fees and total expenses. Fidelity creates "mapped groups" by combining similar Lipper investment objective categories that have comparable investment mandates. Combining Lipper investment objective categories aids the Board's management fee and total expense ratio comparisons by broadening the competitive group used for comparison.
Management Fee. The Board considered two proprietary management fee comparisons for the 12-month periods shown in basis points (BP) in the chart below. The group of Lipper funds used by the Board for management fee comparisons is referred to below as the "Total Mapped Group." The Total Mapped Group comparison focuses on a fund's standing in terms of gross management fees before expense reimbursements or caps relative to the total universe of funds with comparable investment mandates, regardless of whether their management fee structures also are comparable. Funds with comparable investment mandates offer exposure to similar types of securities. Funds with comparable management fee structures have similar management fee contractual arrangements (e.g., flat rate charged for advisory services, all-inclusive fee rate, etc.). "TMG %" represents the percentage of funds in the Total Mapped Group that had management fees that were lower than the fund's. For example, a hypothetical TMG % of 20% would mean that 80% of the funds in the Total Mapped Group had higher, and 20% had lower, management fees than the fund. The fund's actual TMG %s and the number of funds in the Total Mapped Group are in the chart below. The "Asset-Size Peer Group" (ASPG) comparison focuses on a fund's standing relative to a subset of non-Fidelity funds within the Total Mapped Group that are similar in size and management fee structure without taking into account performance adjustments, if any. For example, if a fund is in the first quartile of the ASPG, the fund's management fee ranks in the least expensive or lowest 25% of funds in the ASPG. The ASPG represents at least 15% of the funds in the Total Mapped Group with comparable asset size and management fee structures, subject to a minimum of 50 funds (or all funds in the Total Mapped Group if fewer than 50). Additional information, such as the ASPG quartile in which the fund's management fee rate ranked is also included in the chart and considered by the Board.
Annual Report
Fidelity Latin America Fund
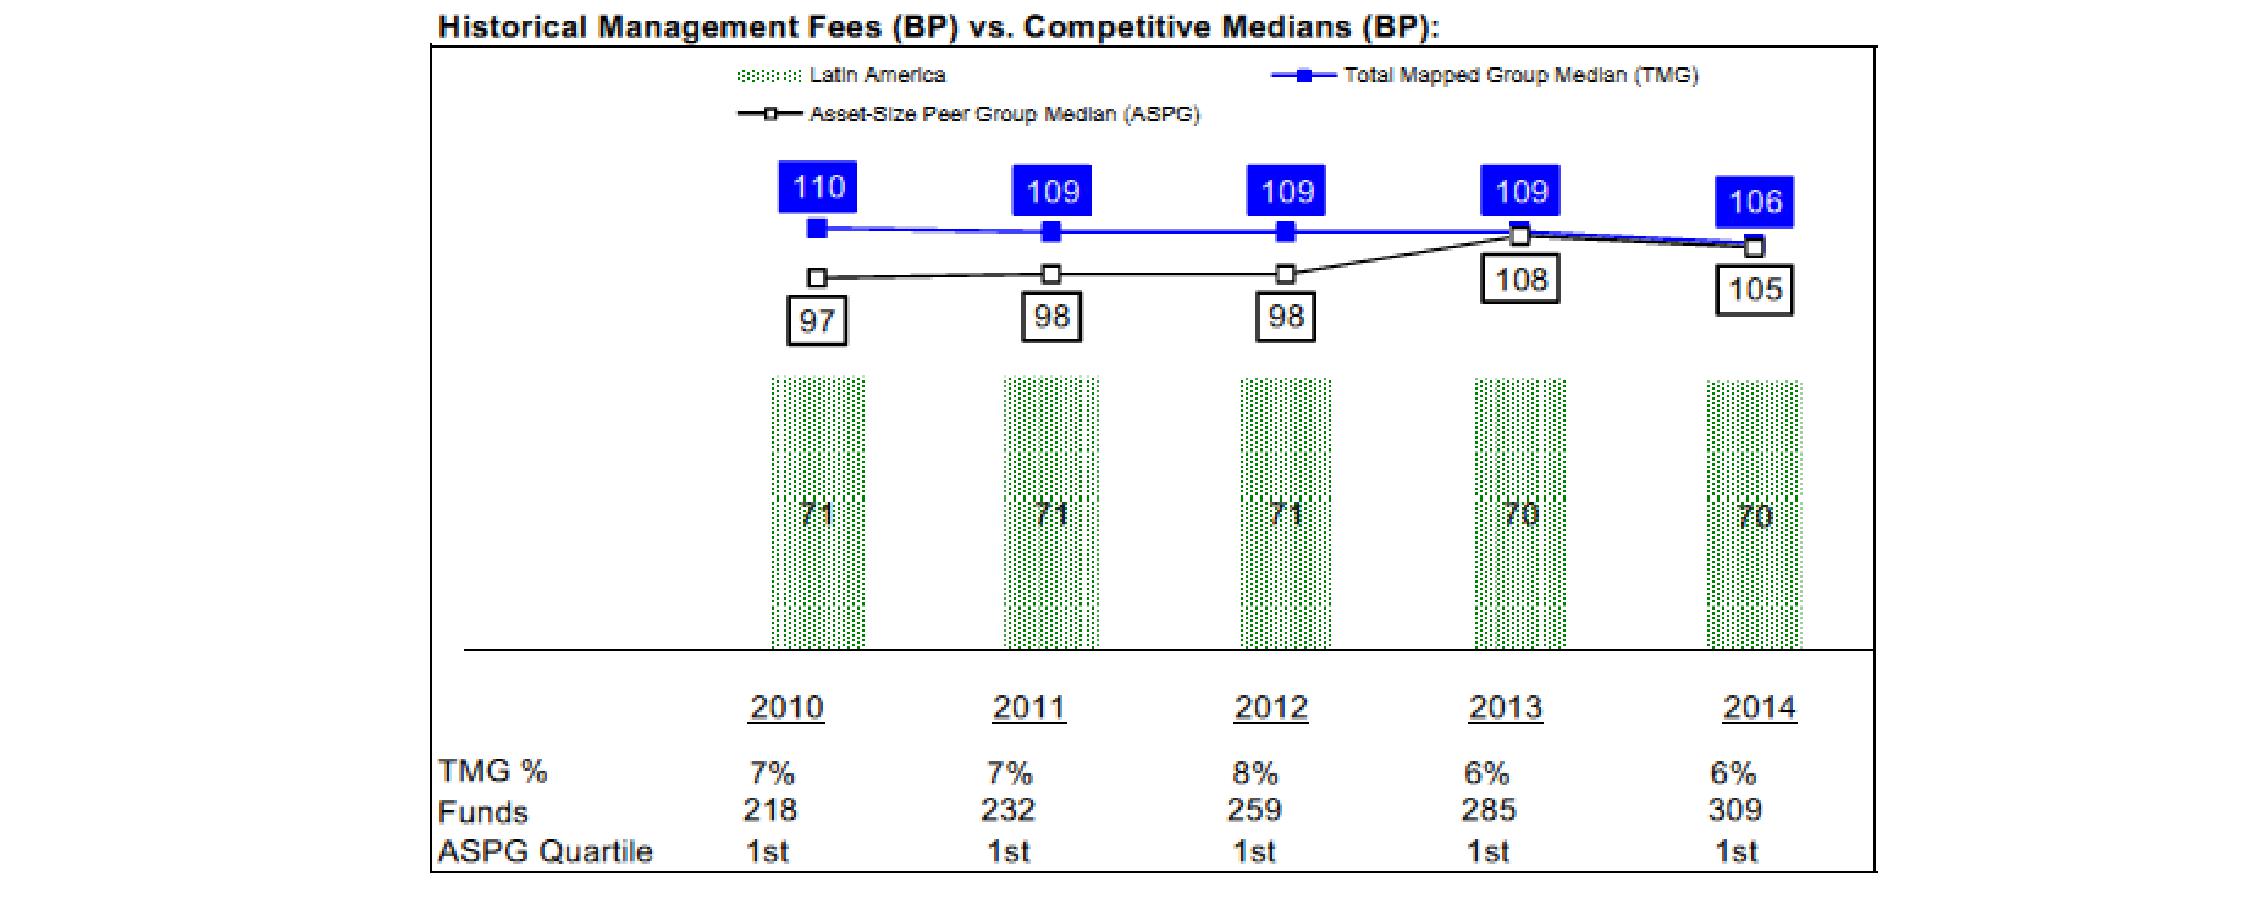
The Board noted that the fund's management fee rate ranked below the median of its Total Mapped Group and below the median of its ASPG for 2014.
The Board noted that, in 2014, the ad hoc Committee on Group Fee was formed by it and other Fidelity fund boards to conduct an in-depth review of the "group fee" component of the management fee of funds with such management fee structures. Committee focus included the mechanics of the group fee, the competitive landscape of group fee structures, Fidelity funds with no group fee component and investment products not included in group fee assets. The Board also considered that, for funds subject to the group fee, FMR agreed to voluntarily waive fees over a specified period of time in amounts designed to account for assets converted from certain funds to certain collective investment trusts.
The Board also noted that, in 2013, the ad hoc Committee on Management Fees was formed to conduct an in-depth review of the management fee rates of Fidelity's active equity mutual funds. The Committee focused on the following areas: (i) standard fee structures; (ii) research consumption and trading evolution; (iii) management fee competitiveness/profitability by category; and (iv) factors that drive institutional pricing.
Based on its review, the Board concluded that the fund's management fee is fair and reasonable in light of the services that the fund receives and the other factors considered.
Total Expense Ratio. In its review of each class's total expense ratio, the Board considered the fund's management fee as well as other fund or class expenses, as applicable, such as transfer agent fees, pricing and bookkeeping fees, fund-paid 12b-1 fees, and custodial, legal, and audit fees. The Board also noted that Fidelity may agree to waive fees and expenses from time to time, and the extent to which, if any, it has done so for the fund. As part of its review, the Board also considered the current and historical total expense ratios of each class of the fund compared to competitive fund median expenses. Each class of the fund is compared to those funds and classes in the Total Mapped Group (used by the Board for management fee comparisons) that have a similar sales load structure.
The Board noted that the total expense ratio of each class ranked below its competitive median for 2014.
Fees Charged to Other Fidelity Clients. The Board also considered Fidelity fee structures and other information with respect to clients of Fidelity, such as other funds advised or subadvised by Fidelity, pension plan clients, and other institutional clients with similar mandates. The Board noted the findings of the 2013 ad hoc joint committee (created with the board of other Fidelity funds), which reviewed and compared Fidelity's institutional investment advisory business with its business of providing services to the Fidelity funds, including the differences in services provided, fees charged, and costs incurred, as well as competition in their respective marketplaces.
Based on its review of total expense ratios and fees charged to other Fidelity clients, the Board concluded that the total expense ratio of each class of the fund was reasonable in light of the services that the fund and its shareholders receive and the other factors considered.
Costs of the Services and Profitability. The Board considered the revenues earned and the expenses incurred by Fidelity in conducting the business of developing, marketing, distributing, managing, administering and servicing the fund and servicing the fund's shareholders. The Board also considered the level of Fidelity's profits in respect of all the Fidelity funds.
On an annual basis, Fidelity presents to the Board information about the profitability of its relationship with the fund. Fidelity calculates profitability information for each fund, as well as aggregate profitability information for groups of Fidelity funds and all Fidelity funds, using a series of detailed revenue and cost allocation methodologies which originate with the books and records of Fidelity on which Fidelity's audited financial statements are based. The Audit Committee of the Board reviews any significant changes from the prior year's methodologies.
Annual Report
Board Approval of Investment Advisory Contracts and Management Fees - continued
PricewaterhouseCoopers LLP (PwC), independent registered public accounting firm and auditor to Fidelity and certain Fidelity funds, has been engaged annually by the Board as part of the Board's assessment of Fidelity's profitability analysis. PwC's engagement includes the review and assessment of the methodologies used by Fidelity in determining the revenues and expenses attributable to Fidelity's mutual fund business, and completion of agreed-upon procedures in respect of the mathematical accuracy of fund profitability and its conformity to established allocation methodologies. After considering PwC's reports issued under the engagement and information provided by Fidelity, the Board concluded that while other allocation methods may also be reasonable, Fidelity's profitability methodologies are reasonable in all material respects.
The Board also reviewed Fidelity's non-fund businesses and fall-out benefits related to the mutual fund business as well as cases where Fidelity's affiliates may benefit from or be related to the fund's business.
The Board considered the costs of the services provided by and the profits realized by Fidelity in connection with the operation of the fund and was satisfied that the profitability was not excessive.
Economies of Scale. The Board considered whether there have been economies of scale in respect of the management of the Fidelity funds, whether the Fidelity funds (including the fund) have appropriately benefited from any such economies of scale, and whether there is potential for realization of any further economies of scale. The Board considered the extent to which the fund will benefit from economies of scale as assets grow through increased services to the fund, through waivers or reimbursements, or through fee or expense ratio reductions. The Board also noted that in 2013, it and the boards of other Fidelity funds created an ad hoc committee (the Economies of Scale Committee) to analyze whether Fidelity attains economies of scale in respect of the management and servicing of the Fidelity funds, whether the Fidelity funds have appropriately benefited from such economies of scale, and whether there is potential for realization of any further economies of scale.
The Board recognized that the fund's management contract incorporates a "group fee" structure, which provides for lower group fee rates as total group assets increase, and for higher group fee rates as total group assets decrease (with "group assets" defined to include fund assets under FMR's management plus sector fund assets previously under FMR's management and currently managed by Fidelity SelectCo, LLC). FMR calculates the group fee rates based on a tiered asset "breakpoint" schedule that varies based on asset class. The Board considered that the group fee is designed to deliver the benefits of economies of scale to fund shareholders when total Fidelity fund assets increase, even if assets of any particular fund are unchanged or have declined, because some portion of Fidelity's costs are attributable to services provided to all Fidelity funds, and all funds benefit if those costs can be allocated among more assets. The Board concluded that, given the group fee structure, fund shareholders will benefit from lower management fees as group assets increase at the fund complex level, regardless of whether Fidelity achieves any such economies of scale.
The Board concluded, taking into account the analysis of the Economies of Scale Committee, that economies of scale, if any, are being appropriately shared between fund shareholders and Fidelity.
Additional Information Requested by the Board. In order to develop fully the factual basis for consideration of the Fidelity funds' Advisory Contracts, the Board requested and received additional information on certain topics, including: (i) fund performance trends and Fidelity's long-term strategies for certain funds; (ii) the various share classes employed by Fidelity and the attributes of each class, together with similar information on the distribution and servicing payments made by Fidelity or the funds to third-party participants in the distribution channels; (iii) fund profitability, and fund performance in relation to fund profitability; (iv) the methodology with respect to evaluating competitive fund data and peer group classifications and fee comparisons; (v) annual fund profitability margins, with particular focus on certain funds with negative margins; (vi) the realization of fall-out benefits in certain Fidelity business units; (vii) economies of scale and the way in which they are shared with fund shareholders; (viii) Fidelity's group fee structures, including the group fee schedule of breakpoints; (ix) the impact of cost containment measures on the funds; and (x) the transfer agent fee structure.
Based on its evaluation of all of the conclusions noted above, and after considering all factors it believed relevant, the Board concluded that the advisory fee structures are fair and reasonable, and that the fund's Advisory Contracts should be renewed.
Annual Report
Investment Adviser
Fidelity Management & Research Company
Boston, MA
Investment Sub-Advisers
FMR Co., Inc.
FMR Investment Management
(U.K.) Limited
Fidelity Management & Research
(Hong Kong) Limited
Fidelity Management & Research
(Japan) Limited
FIL Investment Advisors
FIL Investment Advisors
(UK) Limited
General Distributor
Fidelity Distributors Corporation
Smithfield, RI
Transfer and Service Agents
Fidelity Investments Institutional Operations Company, Inc.
Boston, MA
Fidelity Service Company, Inc.
Boston, MA
Custodian
Brown Brothers Harriman & Co.
Boston, MA
(Fidelity Investment logo)(registered trademark)
Corporate Headquarters
245 Summer St., Boston, MA 02210
www.fidelity.com
FALAI-UANN-1215
1.917407.105
ContentsPerformance: The Bottom LineManagement's Discussion of Fund PerformanceShareholder Expense ExampleInvestment Changes (Unaudited)Investments October 31, 2015Financial StatementsNotes to Financial StatementsPerformance: The Bottom LineManagement's Discussion of Fund PerformanceShareholder Expense ExampleInvestment Changes (Unaudited)Investments October 31, 2015Financial StatementsNotes to Financial StatementsPerformance: The Bottom LineManagement's Discussion of Fund PerformanceShareholder Expense ExampleInvestment Changes (Unaudited)Investments October 31, 2015Financial StatementsNotes to Financial StatementsPerformance: The Bottom LineManagement's Discussion of Fund PerformanceShareholder Expense ExampleInvestment Changes (Unaudited)Investments October 31, 2015Financial StatementsNotes to Financial StatementsPerformance: The Bottom LineManagement's Discussion of Fund PerformanceShareholder Expense ExampleInvestment Changes (Unaudited)Investments October 31, 2015Financial StatementsNotes to Financial StatementsPerformance: The Bottom LineManagement's Discussion of Fund PerformanceShareholder Expense ExampleInvestment Changes (Unaudited)Investments October 31, 2015Financial StatementsNotes to Financial StatementsPerformance: The Bottom LineManagement's Discussion of Fund PerformanceShareholder Expense ExampleInvestment Changes (Unaudited)Investments October 31, 2015Financial StatementsNotes to Financial StatementsPerformance: The Bottom LineManagement's Discussion of Fund PerformanceShareholder Expense ExampleInvestment Changes (Unaudited)Investments October 31, 2015Financial StatementsNotes to Financial StatementsPerformance: The Bottom LineManagement's Discussion of Fund PerformanceShareholder Expense ExampleInvestment Changes (Unaudited)Investments October 31, 2015Financial StatementsNotes to Financial StatementsPerformance: The Bottom LineManagement's Discussion of Fund PerformanceShareholder Expense ExampleInvestment Changes (Unaudited)Investments October 31, 2015Financial StatementsNotes to Financial StatementsReport of Independent Registered Public Accounting FirmTrustees and OfficersDistributions (Unaudited)Board Approval of Investment Advisory Contracts and Management Fees
Fidelity's
Targeted International Equity
Funds®
Fidelity® Canada Fund
Fidelity China Region Fund
Fidelity Emerging Asia Fund
Fidelity Emerging Markets Fund
Fidelity Europe Fund
Fidelity Japan Fund
Fidelity Japan Smaller Companies Fund
Fidelity Latin America Fund
Fidelity Nordic Fund
Fidelity Pacific Basin Fund
Annual Report
October 31, 2015
(Fidelity Cover Art)
Contents
To view a fund's proxy voting guidelines and proxy voting record for the 12-month period ended June 30, visit http://www.fidelity.com/proxyvotingresults or visit the Securities and Exchange Commission's (SEC) web site at http://www.sec.gov. You may also call 1-800-544-8544 to request a free copy of the proxy voting guidelines.
Standard & Poor's, S&P and S&P 500 are registered service marks of The McGraw-Hill Companies, Inc. and have been licensed for use by Fidelity Distributors Corporation.
Other third-party marks appearing herein are the property of their respective owners.
All other marks appearing herein are registered or unregistered trademarks or service marks of FMR LLC or an affiliated company. © 2015 FMR LLC. All rights reserved.
This report and the financial statements contained herein are submitted for the general information of the shareholders of the funds. This report is not authorized for distribution to prospective investors in the funds unless preceded or accompanied by an effective prospectus.
A fund files its complete schedule of portfolio holdings with the SEC for the first and third quarters of each fiscal year on Form N-Q. Forms N-Q are available on the SEC's web site at http://www.sec.gov. A fund's Forms N-Q may be reviewed and copied at the SEC's Public Reference Room in Washington, DC. Information regarding the operation of the SEC's Public Reference Room may be obtained by calling 1-800-SEC-0330. For a complete list of a fund's portfolio holdings, view the most recent holdings listing, semiannual report, or annual report on Fidelity's web site at http://www.fidelity.com, http://www.advisor.fidelity.com, or http://www.401k.com, as applicable.
NOT FDIC INSURED • MAY LOSE VALUE • NO BANK GUARANTEE
Neither the funds nor Fidelity Distributors Corporation is a bank.
Annual Report
Fidelity Canada Fund
Average annual total return reflects the change in the value of an investment, assuming reinvestment of the class' distributions from dividend income and capital gains (the profits earned upon the sale of securities that have grown in value, if any) and assuming a constant rate of performance each year. The $10,000 table and the fund's returns do not reflect the deduction of taxes that a shareholder would pay on fund distributions or the redemption of fund shares. During periods of reimbursement by Fidelity, a fund's total return will be greater than it would be had the reimbursement not occurred. How a fund did yesterday is no guarantee of how it will do tomorrow.
Average Annual Total Returns
Periods ended October 31, 2015 | Past 1
year | Past 5
years | Past 10
years |
Fidelity® Canada Fund | -14.08% | 0.44% | 4.62% |
$10,000 Over 10 Years
Let's say hypothetically that $10,000 was invested in Fidelity® Canada Fund, a class of the fund, on October 31, 2005. The chart shows how the value of your investment would have changed, and also shows how the S&P®/TSX Composite Index performed over the same period.
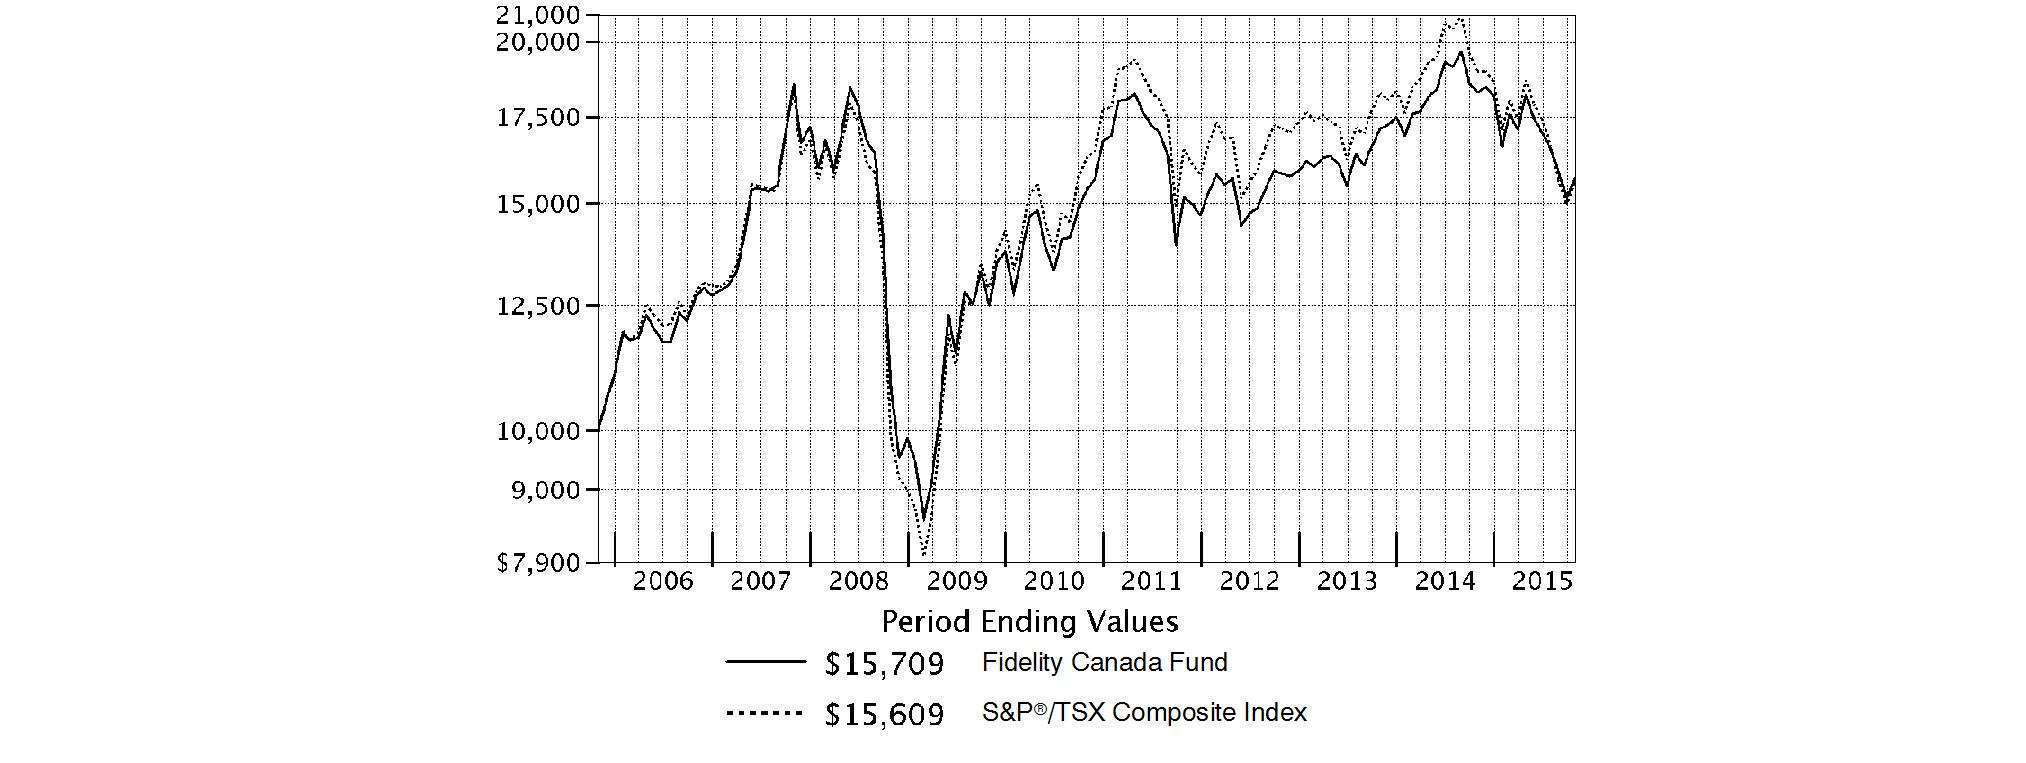
Annual Report
Fidelity Canada Fund
Market Recap: International equities suffered a moderate setback for the 12 months ending October 31, 2015, held back by a collapse in commodities prices that hurt resources-related sectors and geographies. The MSCI ACWI (All Country World Index) ex USA Index returned -4.55% for the period, affected also by concerns about global economic growth. Commodity producers remained under pressure for much of the past year, largely related to economic deceleration in China (-1%), the world's second-largest economy and a leading consumer of raw materials. This effect was exacerbated by U.S. dollar strength relative to global currencies, which weighed on commodities priced in dollars and acutely impacted equity returns within regions most exposed to resources prices. The emerging-markets group, for example, returned about -15% this period. Canada, a significant energy producer, returned roughly -17%. Net energy consumer Japan (+9%) was the best-performing region by far. Only about a quarter of the nearly 50 index countries managed a gain this period: Ireland (+19%) - the EU's fastest-growing economy - and Israel (+17%) proved top performers; Greece (-56%) and Brazil (-46%), among the worst. As for sectors, energy (-25%) and materials (-16%) declined sharply, whereas the two consumer sectors each gained about 6%.
Comments from Portfolio Manager Risteard Hogan: For the year, the fund's share classes (excluding sales charges, if applicable) delivered double-digit negative returns, but solidly outpaced the S&P/TSX Composite Index, which returned -17.81%. Amid a backdrop of weak demand for commodities, mainly due to slowing growth in China, Canada's resource-rich, export-driven market struggled. Strong stock selection in energy and materials drove the fund's outperformance versus the index. In energy, avoiding poor-performing index components Encana, Crescent Point Energy and Baytex Energy was beneficial. A position in telecommunications company Rogers Communications was the fund's No. 1 relative contributor and one of its largest holdings at period end. The company benefited from a recent government decision not to add additional competitors to the market. On the downside, avoiding asset manager and index component Brookfield Asset Management proved detrimental. I felt the stock's valuation was high, so I looked elsewhere for better growth opportunities. However, the company continued to execute well, which buoyed its stock price.
The views expressed above reflect those of the portfolio manager(s) only through the end of the period as stated on the cover of this report and do not necessarily represent the views of Fidelity or any other person in the Fidelity organization. Any such views are subject to change at any time based upon market or other conditions and Fidelity disclaims any responsibility to update such views. These views may not be relied on as investment advice and, because investment decisions for a Fidelity fund are based on numerous factors, may not be relied on as an indication of trading intent on behalf of any Fidelity fund.
Annual Report
Fidelity Canada Fund
As a shareholder of the Fund, you incur two types of costs: (1) transaction costs, including sales charges (loads) on purchase payments or redemption proceeds, redemption fees and (2) ongoing costs, including management fees, distribution and/or service (12b-1) fees and other Fund expenses. This Example is intended to help you understand your ongoing costs (in dollars) of investing in the Fund and to compare these costs with the ongoing costs of investing in other mutual funds.
The Example is based on an investment of $1,000 invested at the beginning of the period and held for the entire period (May 1, 2015 to October 31, 2015).
Actual Expenses
The first line of the accompanying table for each class of the Fund provides information about actual account values and actual expenses. You may use the information in this line, together with the amount you invested, to estimate the expenses that you paid over the period. Simply divide your account value by $1,000.00 (for example, an $8,600 account value divided by $1,000.00 = 8.6), then multiply the result by the number in the first line for a class of the Fund under the heading entitled "Expenses Paid During Period" to estimate the expenses you paid on your account during this period. A small balance maintenance fee of $12.00 that is charged once a year may apply for certain accounts with a value of less than $2,000. This fee is not included in the table below. If it was, the estimate of expenses you paid during the period would be higher, and your ending account value lower, by this amount. In addition, the Fund, as a shareholder in the underlying Fidelity Central Funds, will indirectly bear its pro-rata share of the fees and expenses incurred by the underlying Fidelity Central Funds. These fees and expenses are not included in the Fund's annualized expense ratio used to calculate the expense estimate in the table below.
Hypothetical Example for Comparison Purposes
The second line of the accompanying table for each class of the Fund provides information about hypothetical account values and hypothetical expenses based on a Class' actual expense ratio and an assumed rate of return of 5% per year before expenses, which is not the Class' actual return. The hypothetical account values and expenses may not be used to estimate the actual ending account balance or expenses you paid for the period. You may use this information to compare the ongoing costs of investing in the Fund and other funds. To do so, compare this 5% hypothetical example with the 5% hypothetical examples that appear in the shareholder reports of the other funds. A small balance maintenance fee of $12.00 that is charged once a year may apply for certain accounts with a value of less than $2,000. This fee is not included in the table below. If it was, the estimate of expenses you paid during the period would be higher, and your ending account value lower, by this amount. In addition, the Fund, as a shareholder in the underlying Fidelity Central Funds, will indirectly bear its pro-rata share of the fees and expenses incurred by the underlying Fidelity Central Funds. These fees and expenses are not included in the Fund's annualized expense ratio used to calculate the expense estimate in the table below.
Please note that the expenses shown in the table are meant to highlight your ongoing costs only and do not reflect any transaction costs. Therefore, the second line of the table is useful in comparing ongoing costs only, and will not help you determine the relative total costs of owning different funds. In addition, if these transactional costs were included, your costs would have been higher.
| Annualized
Expense RatioB | Beginning
Account Value
May 1, 2015 | Ending
Account Value
October 31, 2015 | Expenses Paid
During PeriodC
May 1, 2015
to October 31, 2015 |
Class A | 1.45% | | | |
Actual | | $ 1,000.00 | $ 862.20 | $ 6.81 |
HypotheticalA | | $ 1,000.00 | $ 1,017.90 | $ 7.38 |
Class T | 1.76% | | | |
Actual | | $ 1,000.00 | $ 860.90 | $ 8.26 |
HypotheticalA | | $ 1,000.00 | $ 1,016.33 | $ 8.94 |
Class B | 2.24% | | | |
Actual | | $ 1,000.00 | $ 858.80 | $ 10.49 |
HypotheticalA | | $ 1,000.00 | $ 1,013.91 | $ 11.37 |
Class C | 2.19% | | | |
Actual | | $ 1,000.00 | $ 858.90 | $ 10.26 |
HypotheticalA | | $ 1,000.00 | $ 1,014.17 | $ 11.12 |
Canada | 1.16% | | | |
Actual | | $ 1,000.00 | $ 863.30 | $ 5.45 |
HypotheticalA | | $ 1,000.00 | $ 1,019.36 | $ 5.90 |
Class I | 1.13% | | | |
Actual | | $ 1,000.00 | $ 863.50 | $ 5.31 |
HypotheticalA | | $ 1,000.00 | $ 1,019.51 | $ 5.75 |
A 5% return per year before expenses
B Annualized expense ratio reflects expenses net of applicable fee waivers.
C Expenses are equal to each Class' annualized expense ratio, multiplied by the average account value over the period, multiplied by 184/365 (to reflect the one-half year period).
Annual Report
Fidelity Canada Fund
Investment Changes (Unaudited)
Asset Allocation as of October 31, 2015 |
| % of fund's
net assets | % of fund's net assets
6 months ago |
Stocks | 97.8 | 97.9 |
Short-Term Investments and Net Other Assets (Liabilities) | 2.2 | 2.1 |
Top Ten Stocks as of October 31, 2015 |
| % of fund's
net assets | % of fund's net assets
6 months ago |
Royal Bank of Canada (Banks) | 8.9 | 8.3 |
The Toronto-Dominion Bank (Banks) | 8.3 | 7.7 |
Canadian National Railway Co. (Road & Rail) | 6.1 | 5.4 |
Suncor Energy, Inc. (Oil, Gas & Consumable Fuels) | 5.7 | 5.2 |
Enbridge, Inc. (Oil, Gas & Consumable Fuels) | 4.4 | 4.8 |
Sun Life Financial, Inc. (Insurance) | 4.1 | 2.8 |
TELUS Corp. (Diversified Telecommunication Services) | 3.9 | 3.0 |
Rogers Communications, Inc. Class B (non-vtg.) (Wireless Telecommunication Services) | 3.8 | 2.6 |
Intact Financial Corp. (Insurance) | 2.3 | 2.3 |
Imperial Oil Ltd. (Oil, Gas & Consumable Fuels) | 2.3 | 2.8 |
| 48.5 | |
Market Sectors as of October 31, 2015 |
| % of fund's
net assets | % of fund's net assets
6 months ago |
Financials | 33.1 | 30.7 |
Energy | 20.7 | 23.1 |
Materials | 10.2 | 10.8 |
Consumer Staples | 8.7 | 7.4 |
Industrials | 8.2 | 7.5 |
Telecommunication Services | 7.7 | 5.6 |
Information Technology | 3.3 | 4.6 |
Health Care | 3.0 | 4.9 |
Consumer Discretionary | 2.6 | 3.3 |
Utilities | 0.3 | 0.0 |
Market Sectors may include more than one industry category. The fund may invest up to 35% of its total assets in any industry that represents more than 20% of the Canadian market. As of October 31, 2015, the fund did not have more than 25% of its assets invested in any one industry. Percentages shown as 0.0% may reflect amounts less than 0.05%. |
Annual Report
Fidelity Canada Fund
Investments October 31, 2015
Showing Percentage of Net Assets
Common Stocks - 97.8% |
| Shares | | Value |
CONSUMER DISCRETIONARY - 2.6% |
Household Durables - 0.1% |
Cairn Homes PLC (a) | 1,401,800 | | $ 1,556,904 |
Media - 0.6% |
Quebecor, Inc. Class B (sub. vtg.) | 371,700 | | 8,752,404 |
Specialty Retail - 0.9% |
AutoCanada, Inc. (d) | 152,900 | | 3,704,399 |
RONA, Inc. | 888,200 | | 9,271,895 |
| | 12,976,294 |
Textiles, Apparel & Luxury Goods - 1.0% |
Gildan Activewear, Inc. | 465,690 | | 13,387,341 |
TOTAL CONSUMER DISCRETIONARY | | 36,672,943 |
CONSUMER STAPLES - 8.7% |
Food & Staples Retailing - 7.4% |
Alimentation Couche-Tard, Inc. Class B (sub. vtg.) | 709,200 | | 30,508,183 |
George Weston Ltd. | 349,500 | | 29,433,267 |
Jean Coutu Group, Inc. Class A (sub. vtg.) | 943,500 | | 14,380,510 |
Metro, Inc. Class A (sub. vtg.) | 545,995 | | 15,612,384 |
North West Co., Inc. | 557,700 | | 12,368,691 |
| | 102,303,035 |
Food Products - 0.7% |
AGT Food & Ingredients, Inc. | 152,500 | | 3,408,974 |
Mead Johnson Nutrition Co. Class A | 71,900 | | 5,895,800 |
| | 9,304,774 |
Tobacco - 0.6% |
British American Tobacco PLC (United Kingdom) | 151,200 | | 8,982,735 |
TOTAL CONSUMER STAPLES | | 120,590,544 |
ENERGY - 20.7% |
Energy Equipment & Services - 1.0% |
Pason Systems, Inc. | 545,300 | | 8,023,533 |
ZCL Composites, Inc. | 1,272,800 | | 6,034,995 |
| | 14,058,528 |
Oil, Gas & Consumable Fuels - 19.7% |
ARC Resources Ltd. (d) | 1,075,300 | | 15,854,836 |
Black Stone Minerals LP | 330,700 | | 4,540,511 |
Canadian Natural Resources Ltd. | 212,498 | | 4,927,301 |
Cenovus Energy, Inc. | 293,600 | | 4,373,913 |
Enbridge, Inc. | 1,444,400 | | 61,737,164 |
Imperial Oil Ltd. | 942,400 | | 31,358,079 |
Keyera Corp. (d) | 515,904 | | 15,919,797 |
Painted Pony Petroleum Ltd. (a) | 994,400 | | 3,391,728 |
Paramount Resources Ltd. Class A (a) | 462,900 | | 4,683,517 |
Parkland Fuel Corp. | 422,600 | | 7,352,516 |
Peyto Exploration & Development Corp. | 445,400 | | 9,196,849 |
|
| Shares | | Value |
PrairieSky Royalty Ltd. (d) | 450,063 | | $ 8,856,012 |
Raging River Exploration, Inc. (a) | 914,200 | | 5,802,891 |
Spartan Energy Corp. (a) | 2,992,400 | | 5,469,437 |
Suncor Energy, Inc. | 2,636,400 | | 78,450,844 |
Whitecap Resources, Inc. | 1,263,400 | | 11,217,554 |
| | 273,132,949 |
TOTAL ENERGY | | 287,191,477 |
FINANCIALS - 33.1% |
Banks - 20.6% |
Bank of Nova Scotia | 475,000 | | 22,336,915 |
National Bank of Canada | 731,600 | | 24,231,872 |
Royal Bank of Canada (d) | 2,151,600 | | 123,030,842 |
The Toronto-Dominion Bank | 2,823,900 | | 115,927,617 |
| | 285,527,246 |
Capital Markets - 0.7% |
AGF Management Ltd. Class B (non-vtg.) | 355,200 | | 1,475,020 |
Ashmore Group PLC (d) | 1,044,000 | | 4,345,462 |
CI Financial Corp. | 166,100 | | 3,963,230 |
| | 9,783,712 |
Insurance - 10.2% |
Fairfax Financial Holdings Ltd. (sub. vtg.) | 44,400 | | 21,864,521 |
Intact Financial Corp. | 448,825 | | 32,055,496 |
Power Corp. of Canada (sub. vtg.) | 1,362,700 | | 30,628,444 |
Sun Life Financial, Inc. | 1,704,200 | | 57,475,696 |
| | 142,024,157 |
Real Estate Investment Trusts - 1.6% |
Allied Properties (REIT) | 437,900 | | 12,015,794 |
H&R REIT/H&R Finance Trust | 631,200 | | 10,127,391 |
| | 22,143,185 |
TOTAL FINANCIALS | | 459,478,300 |
HEALTH CARE - 3.0% |
Health Care Equipment & Supplies - 0.4% |
Getinge AB (B Shares) | 159,200 | | 3,985,800 |
Novadaq Technologies, Inc. (a) | 142,687 | | 1,795,003 |
| | 5,780,803 |
Pharmaceuticals - 2.6% |
Teva Pharmaceutical Industries Ltd. sponsored ADR | 80,000 | | 4,735,200 |
Valeant Pharmaceuticals International, Inc. (Canada) (a) | 334,421 | | 31,211,945 |
| | 35,947,145 |
TOTAL HEALTH CARE | | 41,727,948 |
INDUSTRIALS - 8.2% |
Airlines - 0.7% |
WestJet Airlines Ltd. | 510,100 | | 9,440,517 |
Common Stocks - continued |
| Shares | | Value |
INDUSTRIALS - continued |
Professional Services - 0.8% |
Stantec, Inc. | 433,700 | | $ 10,885,618 |
Road & Rail - 6.7% |
Canadian National Railway Co. | 1,393,100 | | 85,092,457 |
TransForce, Inc. | 441,300 | | 8,632,957 |
| | 93,725,414 |
TOTAL INDUSTRIALS | | 114,051,549 |
INFORMATION TECHNOLOGY - 3.3% |
Electronic Equipment & Components - 0.2% |
Avigilon Corp. (a)(d) | 285,700 | | 3,205,276 |
IT Services - 1.0% |
CGI Group, Inc. Class A (sub. vtg.) (a) | 374,500 | | 13,910,573 |
Software - 2.1% |
Constellation Software, Inc. | 36,600 | | 15,814,469 |
Open Text Corp. | 285,414 | | 13,229,537 |
| | 29,044,006 |
TOTAL INFORMATION TECHNOLOGY | | 46,159,855 |
MATERIALS - 10.2% |
Chemicals - 2.4% |
Agrium, Inc. | 209,300 | | 19,471,815 |
Monsanto Co. | 31,900 | | 2,973,718 |
Potash Corp. of Saskatchewan, Inc. | 563,400 | | 11,409,324 |
| | 33,854,857 |
Containers & Packaging - 1.3% |
CCL Industries, Inc. Class B | 90,000 | | 12,750,459 |
Winpak Ltd. | 179,600 | | 5,426,733 |
| | 18,177,192 |
Metals & Mining - 5.2% |
Agnico Eagle Mines Ltd. (Canada) | 434,600 | | 12,284,197 |
Eldorado Gold Corp. | 1,999,600 | | 6,988,507 |
Freeport-McMoRan, Inc. | 276,300 | | 3,252,051 |
Goldcorp, Inc. | 375,000 | | 4,797,912 |
Labrador Iron Ore Royalty Corp. (d) | 292,700 | | 3,404,686 |
Lundin Mining Corp. (a) | 2,301,300 | | 7,761,344 |
Randgold Resources Ltd. | 145,464 | | 9,755,819 |
Silver Wheaton Corp. | 874,700 | | 11,886,983 |
Tahoe Resources, Inc. | 670,700 | | 5,601,135 |
Teck Resources Ltd. Class B (sub. vtg.) | 259,400 | | 1,519,581 |
Torex Gold Resources, Inc. (a) | 5,532,400 | | 5,246,387 |
| | 72,498,602 |
Paper & Forest Products - 1.3% |
Stella-Jones, Inc. | 182,400 | | 6,712,365 |
West Fraser Timber Co. Ltd. | 309,000 | | 10,934,101 |
| | 17,646,466 |
TOTAL MATERIALS | | 142,177,117 |
|
| Shares | | Value |
TELECOMMUNICATION SERVICES - 7.7% |
Diversified Telecommunication Services - 3.9% |
TELUS Corp. | 1,646,200 | | $ 54,940,478 |
Wireless Telecommunication Services - 3.8% |
Rogers Communications, Inc. Class B (non-vtg.) | 1,323,400 | | 52,658,689 |
TOTAL TELECOMMUNICATION SERVICES | | 107,599,167 |
UTILITIES - 0.3% |
Electric Utilities - 0.3% |
Hydro One Ltd. (a) | 221,400 | | 3,471,016 |
TOTAL COMMON STOCKS (Cost $1,209,742,368) |
1,359,119,916
|
Money Market Funds - 4.4% |
| | | |
Fidelity Cash Central Fund, 0.18% (b) | 28,325,905 | | 28,325,905 |
Fidelity Securities Lending Cash Central Fund, 0.19% (b)(c) | 33,251,267 | | 33,251,267 |
TOTAL MONEY MARKET FUNDS (Cost $61,577,172) |
61,577,172
|
TOTAL INVESTMENT PORTFOLIO - 102.2% (Cost $1,271,319,540) | | 1,420,697,088 |
NET OTHER ASSETS (LIABILITIES) - (2.2)% | | (30,969,506) |
NET ASSETS - 100% | $ 1,389,727,582 |
Legend |
(a) Non-income producing |
(b) Affiliated fund that is generally available only to investment companies and other accounts managed by Fidelity Investments. The rate quoted is the annualized seven-day yield of the fund at period end. A complete unaudited listing of the fund's holdings as of its most recent quarter end is available upon request. In addition, each Fidelity Central Fund's financial statements, which are not covered by the Fund's Report of Independent Registered Public Accounting Firm, are available on the SEC's website or upon request. |
(c) Investment made with cash collateral received from securities on loan. |
(d) Security or a portion of the security is on loan at period end. |
Affiliated Central Funds |
Information regarding fiscal year to date income earned by the Fund from investments in Fidelity Central Funds is as follows: |
Fund | Income earned |
Fidelity Cash Central Fund | $ 46,391 |
Fidelity Securities Lending Cash Central Fund | 2,422,196 |
Total | $ 2,468,587 |
Other Information |
Categorizations in the Schedule of Investments are based on country or territory of incorporation. |
The following is a summary of the inputs used, as of October 31, 2015, involving the Fund's assets and liabilities carried at fair value. The inputs or methodology used for valuing securities may not be an indication of the risk associated with investing in those securities. For more information on valuation inputs, and their aggregation into the levels used in the table below, please refer to the Investment Valuation section in the accompanying Notes to Financial Statements. |
Valuation Inputs at Reporting Date: |
Description | Total | Level 1 | Level 2 | Level 3 |
Investments in Securities: | | | | |
Equities: | | | | |
Consumer Discretionary | $ 36,672,943 | $ 36,672,943 | $ - | $ - |
Consumer Staples | 120,590,544 | 111,607,809 | 8,982,735 | - |
Energy | 287,191,477 | 287,191,477 | - | - |
Financials | 459,478,300 | 459,478,300 | - | - |
Health Care | 41,727,948 | 41,727,948 | - | - |
Industrials | 114,051,549 | 114,051,549 | - | - |
Information Technology | 46,159,855 | 46,159,855 | - | - |
Materials | 142,177,117 | 132,421,298 | 9,755,819 | - |
Telecommunication Services | 107,599,167 | 107,599,167 | - | - |
Utilities | 3,471,016 | - | 3,471,016 | - |
Money Market Funds | 61,577,172 | 61,577,172 | - | - |
Total Investments in Securities: | $ 1,420,697,088 | $ 1,398,487,518 | $ 22,209,570 | $ - |
See accompanying notes which are an integral part of the financial statements.
Annual Report
Fidelity Canada Fund
Statement of Assets and Liabilities
| | October 31, 2015 |
| | |
Assets | | |
Investment in securities, at value (including securities loaned of $31,571,540) - See accompanying schedule: Unaffiliated issuers (cost $1,209,742,368) | $ 1,359,119,916 | |
Fidelity Central Funds (cost $61,577,172) | 61,577,172 | |
Total Investments (cost $1,271,319,540) | | $ 1,420,697,088 |
Foreign currency held at value (cost $1,009,637) | | 1,009,637 |
Receivable for investments sold | | 9,236,873 |
Receivable for fund shares sold | | 257,082 |
Dividends receivable | | 1,907,666 |
Distributions receivable from Fidelity Central Funds | | 316,344 |
Prepaid expenses | | 4,446 |
Other receivables | | 3,054 |
Total assets | | 1,433,432,190 |
| | |
Liabilities | | |
Payable for investments purchased | $ 6,691,159 | |
Payable for fund shares redeemed | 2,185,614 | |
Accrued management fee | 1,150,326 | |
Distribution and service plan fees payable | 38,976 | |
Other affiliated payables | 324,021 | |
Other payables and accrued expenses | 63,245 | |
Collateral on securities loaned, at value | 33,251,267 | |
Total liabilities | | 43,704,608 |
| | |
Net Assets | | $ 1,389,727,582 |
Net Assets consist of: | | |
Paid in capital | | $ 1,236,604,194 |
Undistributed net investment income | | 14,473,984 |
Accumulated undistributed net realized gain (loss) on investments and foreign currency transactions | | (10,711,888) |
Net unrealized appreciation (depreciation) on investments and assets and liabilities in foreign currencies | | 149,361,292 |
Net Assets | | $ 1,389,727,582 |
Statement of Assets and Liabilities - continued
| | October 31, 2015 |
| | |
Calculation of Maximum Offering Price Class A:
Net Asset Value and redemption price per share ($58,286,357 ÷ 1,288,166 shares) | | $ 45.25 |
| | |
Maximum offering price per share (100/94.25 of $45.25) | | $ 48.01 |
Class T:
Net Asset Value and redemption price per share ($12,820,215 ÷ 284,977 shares) | | $ 44.99 |
| | |
Maximum offering price per share (100/96.50 of $44.99) | | $ 46.62 |
Class B:
Net Asset Value and offering price per share ($2,677,631 ÷ 60,548 shares)A | | $ 44.22 |
| | |
Class C:
Net Asset Value and offering price per share ($21,609,613 ÷ 490,895 shares)A | | $ 44.02 |
| | |
Canada:
Net Asset Value, offering price and redemption price per share ($1,279,487,995 ÷ 28,086,893 shares) | | $ 45.55 |
| | |
Class I:
Net Asset Value, offering price and redemption price per share ($14,845,771 ÷ 326,722 shares) | | $ 45.44 |
A Redemption price per share is equal to net asset value less any applicable contingent deferred sales charge.
See accompanying notes which are an integral part of the financial statements.
Annual Report
Statement of Operations
| Year ended October 31, 2015 |
| | |
Investment Income | | |
Dividends | | $ 46,076,720 |
Interest | | 774 |
Income from Fidelity Central Funds (including $2,422,196 from security lending) | | 2,468,587 |
Income before foreign taxes withheld | | 48,546,081 |
Less foreign taxes withheld | | (6,671,693) |
Total income | | 41,874,388 |
| | |
Expenses | | |
Management fee | | |
Basic fee | $ 12,628,027 | |
Performance adjustment | 3,229,143 | |
Transfer agent fees | 3,835,510 | |
Distribution and service plan fees | 622,244 | |
Accounting and security lending fees | 823,779 | |
Custodian fees and expenses | 32,498 | |
Independent trustees' compensation | 7,941 | |
Registration fees | 81,078 | |
Audit | 72,385 | |
Legal | 5,911 | |
Miscellaneous | 13,840 | |
Total expenses before reductions | 21,352,356 | |
Expense reductions | (107,309) | 21,245,047 |
Net investment income (loss) | | 20,629,341 |
Realized and Unrealized Gain (Loss) | | |
Net realized gain (loss) on: | | |
Investment securities: | | |
Unaffiliated issuers | (6,519,666) | |
Foreign currency transactions | (476,530) | |
Total net realized gain (loss) | | (6,996,196) |
Change in net unrealized appreciation (depreciation) on: Investment securities | (283,149,563) | |
Assets and liabilities in foreign currencies | (7,842) | |
Total change in net unrealized appreciation (depreciation) | | (283,157,405) |
Net gain (loss) | | (290,153,601) |
Net increase (decrease) in net assets resulting from operations | | $ (269,524,260) |
Statement of Changes in Net Assets
| Year ended
October 31,
2015 | Year ended
October 31,
2014 |
Increase (Decrease) in Net Assets | | |
Operations | | |
Net investment income (loss) | $ 20,629,341 | $ 24,923,588 |
Net realized gain (loss) | (6,996,196) | 290,863,952 |
Change in net unrealized appreciation (depreciation) | (283,157,405) | (164,747,262) |
Net increase (decrease) in net assets resulting from operations | (269,524,260) | 151,040,278 |
Distributions to shareholders from net investment income | (24,029,674) | (9,338,915) |
Distributions to shareholders from net realized gain | (262,730,704) | (13,503,099) |
Total distributions | (286,760,378) | (22,842,014) |
Share transactions - net increase (decrease) | (304,156,881) | (365,686,992) |
Redemption fees | 128,345 | 129,289 |
Total increase (decrease) in net assets | (860,313,174) | (237,359,439) |
| | |
Net Assets | | |
Beginning of period | 2,250,040,756 | 2,487,400,195 |
End of period (including undistributed net investment income of $14,473,984 and undistributed net investment income of $20,538,750, respectively) | $ 1,389,727,582 | $ 2,250,040,756 |
See accompanying notes which are an integral part of the financial statements.
Annual Report
Financial Highlights - Fidelity Canada Fund Class A
Years ended October 31, | 2015 | 2014 | 2013 | 2012 | 2011 |
Selected Per-Share Data | | | | | |
Net asset value, beginning of period | $ 60.56 | $ 57.31 | $ 53.65 | $ 52.20 | $ 53.81 |
Income from Investment Operations | | | | | |
Net investment income (loss) C | .45 | .47 | .60 | .57 | .34 |
Net realized and unrealized gain (loss) | (8.04) | 3.13 | 3.63 | 1.50 | (1.17) |
Total from investment operations | (7.59) | 3.60 | 4.23 | 2.07 | (.83) |
Distributions from net investment income | (.50) | (.03) | (.57) | (.33) | (.35) |
Distributions from net realized gain | (7.22) | (.32) | - | (.29) | (.44) |
Total distributions | (7.72) | (.35) | (.57) | (.62) | (.79) |
Redemption fees added to paid in capitalC | -G | -G | -G | -G | .01 |
Net asset value, end of period | $ 45.25 | $ 60.56 | $ 57.31 | $ 53.65 | $ 52.20 |
Total ReturnA, B | (14.32)% | 6.32% | 7.98% | 4.04% | (1.64)% |
Ratios to Average Net AssetsD, F | | | | | |
Expenses before reductions | 1.43% | 1.29% | 1.19% | 1.08% | 1.12% |
Expenses net of fee waivers, if any | 1.43% | 1.29% | 1.19% | 1.08% | 1.12% |
Expenses net of all reductions | 1.43% | 1.29% | 1.18% | 1.08% | 1.12% |
Net investment income (loss) | .90% | .79% | 1.11% | 1.11% | .59% |
Supplemental Data | | | | | |
Net assets, end of period (000 omitted) | $ 58,286 | $ 95,004 | $ 116,661 | $ 159,597 | $ 215,369 |
Portfolio turnover rateE | 24% | 85% | 64% | 86% | 104% |
A Total returns would have been lower if certain expenses had not been reduced during the applicable periods shown. B Total returns do not include the effect of the sales charges. C Calculated based on average shares outstanding during the period. D Fees and expenses of any underlying Fidelity Central Funds are not included in the Fund's expense ratio. The Fund indirectly bears its proportionate share of the expenses of any underlying Fidelity Central Funds. E Amount does not include the portfolio activity of any underlying Fidelity Central Funds. F Expense ratios reflect operating expenses of the class. Expenses before reductions do not reflect amounts reimbursed by the investment adviser or reductions from brokerage service arrangements or reductions from other expense offset arrangements and do not represent the amount paid by the class during periods when reimbursements or reductions occur. Expenses net of fee waivers reflect expenses after reimbursement by the investment adviser but prior to reductions from brokerage service arrangements or other expense offset arrangements. Expenses net of all reductions represent the net expenses paid by the class. G Amount represents less than $.005 per share. |
Financial Highlights - Fidelity Canada Fund Class T
Years ended October 31, | 2015 | 2014 | 2013 | 2012 | 2011 |
Selected Per-Share Data | | | | | |
Net asset value, beginning of period | $ 60.22 | $ 57.14 | $ 53.48 | $ 52.01 | $ 53.64 |
Income from Investment Operations | | | | | |
Net investment income (loss) C | .29 | .29 | .45 | .43 | .17 |
Net realized and unrealized gain (loss) | (8.00) | 3.11 | 3.63 | 1.49 | (1.16) |
Total from investment operations | (7.71) | 3.40 | 4.08 | 1.92 | (.99) |
Distributions from net investment income | (.30) | - | (.42) | (.16) | (.21) |
Distributions from net realized gain | (7.22) | (.32) | - | (.29) | (.44) |
Total distributions | (7.52) | (.32) | (.42) | (.45) | (.65) |
Redemption fees added to paid in capitalC | -G | -G | -G | -G | .01 |
Net asset value, end of period | $ 44.99 | $ 60.22 | $ 57.14 | $ 53.48 | $ 52.01 |
Total ReturnA, B | (14.58)% | 5.99% | 7.69% | 3.74% | (1.93)% |
Ratios to Average Net AssetsD, F | | | | | |
Expenses before reductions | 1.75% | 1.59% | 1.47% | 1.36% | 1.42% |
Expenses net of fee waivers, if any | 1.75% | 1.59% | 1.47% | 1.36% | 1.42% |
Expenses net of all reductions | 1.75% | 1.59% | 1.46% | 1.36% | 1.42% |
Net investment income (loss) | .58% | .48% | .83% | .83% | .30% |
Supplemental Data | | | | | |
Net assets, end of period (000 omitted) | $ 12,820 | $ 21,989 | $ 23,751 | $ 29,626 | $ 34,323 |
Portfolio turnover rateE | 24% | 85% | 64% | 86% | 104% |
A Total returns would have been lower if certain expenses had not been reduced during the applicable periods shown. B Total returns do not include the effect of the sales charges. C Calculated based on average shares outstanding during the period. D Fees and expenses of any underlying Fidelity Central Funds are not included in the Fund's expense ratio. The Fund indirectly bears its proportionate share of the expenses of any underlying Fidelity Central Funds. E Amount does not include the portfolio activity of any underlying Fidelity Central Funds. F Expense ratios reflect operating expenses of the class. Expenses before reductions do not reflect amounts reimbursed by the investment adviser or reductions from brokerage service arrangements or reductions from other expense offset arrangements and do not represent the amount paid by the class during periods when reimbursements or reductions occur. Expenses net of fee waivers reflect expenses after reimbursement by the investment adviser but prior to reductions from brokerage service arrangements or other expense offset arrangements. Expenses net of all reductions represent the net expenses paid by the class. G Amount represents less than $.005 per share. |
See accompanying notes which are an integral part of the financial statements.
Annual Report
Financial Highlights - Fidelity Canada Fund Class B
Years ended October 31, | 2015 | 2014 | 2013 | 2012 | 2011 |
Selected Per-Share Data | | | | | |
Net asset value, beginning of period | $ 59.27 | $ 56.53 | $ 52.89 | $ 51.37 | $ 53.03 |
Income from Investment Operations | | | | | |
Net investment income (loss) C | .05 | (.01) | .18 | .17 | (.11) |
Net realized and unrealized gain (loss) | (7.88) | 3.07 | 3.60 | 1.49 | (1.14) |
Total from investment operations | (7.83) | 3.06 | 3.78 | 1.66 | (1.25) |
Distributions from net investment income | - | - | (.14) | - | (.01) |
Distributions from net realized gain | (7.22) | (.32) | - | (.14) | (.41) |
Total distributions | (7.22) | (.32) | (.14) | (.14) | (.42) |
Redemption fees added to paid in capitalC | -G | -G | -G | -G | .01 |
Net asset value, end of period | $ 44.22 | $ 59.27 | $ 56.53 | $ 52.89 | $ 51.37 |
Total ReturnA, B | (14.99)% | 5.45% | 7.17% | 3.25% | (2.41)% |
Ratios to Average Net AssetsD, F | | | | | |
Expenses before reductions | 2.22% | 2.09% | 1.96% | 1.85% | 1.91% |
Expenses net of fee waivers, if any | 2.22% | 2.09% | 1.96% | 1.85% | 1.91% |
Expenses net of all reductions | 2.22% | 2.09% | 1.95% | 1.85% | 1.91% |
Net investment income (loss) | .11% | (.01)% | .34% | .34% | (.20)% |
Supplemental Data | | | | | |
Net assets, end of period (000 omitted) | $ 2,678 | $ 6,290 | $ 7,737 | $ 9,804 | $ 11,866 |
Portfolio turnover rateE | 24% | 85% | 64% | 86% | 104% |
A Total returns would have been lower if certain expenses had not been reduced during the applicable periods shown. B Total returns do not include the effect of the contingent deferred sales charge. C Calculated based on average shares outstanding during the period. D Fees and expenses of any underlying Fidelity Central Funds are not included in the Fund's expense ratio. The Fund indirectly bears its proportionate share of the expenses of any underlying Fidelity Central Funds. E Amount does not include the portfolio activity of any underlying Fidelity Central Funds. F Expense ratios reflect operating expenses of the class. Expenses before reductions do not reflect amounts reimbursed by the investment adviser or reductions from brokerage service arrangements or reductions from other expense offset arrangements and do not represent the amount paid by the class during periods when reimbursements or reductions occur. Expenses net of fee waivers reflect expenses after reimbursement by the investment adviser but prior to reductions from brokerage service arrangements or other expense offset arrangements. Expenses net of all reductions represent the net expenses paid by the class. G Amount represents less than $.005 per share. |
Financial Highlights - Fidelity Canada Fund Class C
Years ended October 31, | 2015 | 2014 | 2013 | 2012 | 2011 |
Selected Per-Share Data | | | | | |
Net asset value, beginning of period | $ 59.04 | $ 56.27 | $ 52.61 | $ 51.19 | $ 52.87 |
Income from Investment Operations | | | | | |
Net investment income (loss) C | .07 | .02 | .20 | .19 | (.08) |
Net realized and unrealized gain (loss) | (7.85) | 3.07 | 3.58 | 1.46 | (1.14) |
Total from investment operations | (7.78) | 3.09 | 3.78 | 1.65 | (1.22) |
Distributions from net investment income | (.02) | - | (.12) | - | (.03) |
Distributions from net realized gain | (7.22) | (.32) | - | (.23) | (.44) |
Total distributions | (7.24) | (.32) | (.12) | (.23) | (.47) |
Redemption fees added to paid in capitalC | -G | -G | -G | -G | .01 |
Net asset value, end of period | $ 44.02 | $ 59.04 | $ 56.27 | $ 52.61 | $ 51.19 |
Total ReturnA, B | (14.96)% | 5.53% | 7.21% | 3.26% | (2.36)% |
Ratios to Average Net AssetsD, F | | | | | |
Expenses before reductions | 2.19% | 2.03% | 1.93% | 1.82% | 1.86% |
Expenses net of fee waivers, if any | 2.19% | 2.03% | 1.92% | 1.82% | 1.86% |
Expenses net of all reductions | 2.18% | 2.03% | 1.92% | 1.82% | 1.86% |
Net investment income (loss) | .14% | .04% | .37% | .37% | (.15)% |
Supplemental Data | | | | | |
Net assets, end of period (000 omitted) | $ 21,610 | $ 38,749 | $ 46,040 | $ 66,500 | $ 87,990 |
Portfolio turnover rateE | 24% | 85% | 64% | 86% | 104% |
A Total returns would have been lower if certain expenses had not been reduced during the applicable periods shown. B Total returns do not include the effect of the contingent deferred sales charge. C Calculated based on average shares outstanding during the period. D Fees and expenses of any underlying Fidelity Central Funds are not included in the Fund's expense ratio. The Fund indirectly bears its proportionate share of the expenses of any underlying Fidelity Central Funds. E Amount does not include the portfolio activity of any underlying Fidelity Central Funds. F Expense ratios reflect operating expenses of the class. Expenses before reductions do not reflect amounts reimbursed by the investment adviser or reductions from brokerage service arrangements or reductions from other expense offset arrangements and do not represent the amount paid by the class during periods when reimbursements or reductions occur. Expenses net of fee waivers reflect expenses after reimbursement by the investment adviser but prior to reductions from brokerage service arrangements or other expense offset arrangements. Expenses net of all reductions represent the net expenses paid by the class. G Amount represents less than $.005 per share. |
See accompanying notes which are an integral part of the financial statements.
Annual Report
Financial Highlights - Fidelity Canada Fund
Years ended October 31, | 2015 | 2014 | 2013 | 2012 | 2011 |
Selected Per-Share Data | | | | | |
Net asset value, beginning of period | $ 60.95 | $ 57.72 | $ 54.05 | $ 52.59 | $ 54.14 |
Income from Investment Operations | | | | | |
Net investment income (loss) B | .60 | .66 | .77 | .73 | .52 |
Net realized and unrealized gain (loss) | (8.09) | 3.13 | 3.66 | 1.51 | (1.18) |
Total from investment operations | (7.49) | 3.79 | 4.43 | 2.24 | (.66) |
Distributions from net investment income | (.69) | (.24) | (.76) | (.49) | (.46) |
Distributions from net realized gain | (7.22) | (.32) | - | (.29) | (.44) |
Total distributions | (7.91) | (.56) | (.76) | (.78) | (.90) |
Redemption fees added to paid in capitalB | -F | -F | -F | -F | .01 |
Net asset value, end of period | $ 45.55 | $ 60.95 | $ 57.72 | $ 54.05 | $ 52.59 |
Total ReturnA | (14.08)% | 6.64% | 8.32% | 4.36% | (1.33)% |
Ratios to Average Net AssetsC, E | | | | | |
Expenses before reductions | 1.15% | .98% | .87% | .77% | .82% |
Expenses net of fee waivers, if any | 1.15% | .98% | .87% | .77% | .82% |
Expenses net of all reductions | 1.14% | .98% | .86% | .77% | .82% |
Net investment income (loss) | 1.18% | 1.09% | 1.42% | 1.42% | .90% |
Supplemental Data | | | | | |
Net assets, end of period (000 omitted) | $ 1,279,488 | $ 2,057,843 | $ 2,262,380 | $ 2,992,597 | $ 3,778,765 |
Portfolio turnover rateD | 24% | 85% | 64% | 86% | 104% |
A Total returns would have been lower if certain expenses had not been reduced during the applicable periods shown. B Calculated based on average shares outstanding during the period. C Fees and expenses of any underlying Fidelity Central Funds are not included in the Fund's expense ratio. The Fund indirectly bears its proportionate share of the expenses of any underlying Fidelity Central Funds. D Amount does not include the portfolio activity of any underlying Fidelity Central Funds. E Expense ratios reflect operating expenses of the class. Expenses before reductions do not reflect amounts reimbursed by the investment adviser or reductions from brokerage service arrangements or reductions from other expense offset arrangements and do not represent the amount paid by the class during periods when reimbursements or reductions occur. Expenses net of fee waivers reflect expenses after reimbursement by the investment adviser but prior to reductions from brokerage service arrangements or other expense offset arrangements. Expenses net of all reductions represent the net expenses paid by the class. F Amount represents less than $.005 per share. |
Financial Highlights - Fidelity Canada Fund Class I
Years ended October 31, | 2015 | 2014 | 2013 | 2012 | 2011 |
Selected Per-Share Data | | | | | |
Net asset value, beginning of period | $ 60.80 | $ 57.57 | $ 53.91 | $ 52.44 | $ 54.02 |
Income from Investment Operations | | | | | |
Net investment income (loss) B | .61 | .65 | .78 | .74 | .51 |
Net realized and unrealized gain (loss) | (8.07) | 3.12 | 3.64 | 1.50 | (1.18) |
Total from investment operations | (7.46) | 3.77 | 4.42 | 2.24 | (.67) |
Distributions from net investment income | (.68) | (.22) | (.76) | (.48) | (.48) |
Distributions from net realized gain | (7.22) | (.32) | - | (.29) | (.44) |
Total distributions | (7.90) | (.54) | (.76) | (.77) | (.92) |
Redemption fees added to paid in capitalB | -F | -F | -F | -F | .01 |
Net asset value, end of period | $ 45.44 | $ 60.80 | $ 57.57 | $ 53.91 | $ 52.44 |
Total ReturnA | (14.05)% | 6.62% | 8.34% | 4.38% | (1.35)% |
Ratios to Average Net AssetsC, E | | | | | |
Expenses before reductions | 1.13% | 1.00% | .86% | .76% | .82% |
Expenses net of fee waivers, if any | 1.12% | 1.00% | .86% | .76% | .82% |
Expenses net of all reductions | 1.12% | 1.00% | .85% | .76% | .82% |
Net investment income (loss) | 1.21% | 1.08% | 1.43% | 1.42% | .89% |
Supplemental Data | | | | | |
Net assets, end of period (000 omitted) | $ 14,846 | $ 30,165 | $ 30,831 | $ 59,245 | $ 68,112 |
Portfolio turnover rateD | 24% | 85% | 64% | 86% | 104% |
A Total returns would have been lower if certain expenses had not been reduced during the applicable periods shown. B Calculated based on average shares outstanding during the period. C Fees and expenses of any underlying Fidelity Central Funds are not included in the Fund's expense ratio. The Fund indirectly bears its proportionate share of the expenses of any underlying Fidelity Central Funds. D Amount does not include the portfolio activity of any underlying Fidelity Central Funds. E Expense ratios reflect operating expenses of the class. Expenses before reductions do not reflect amounts reimbursed by the investment adviser or reductions from brokerage service arrangements or reductions from other expense offset arrangements and do not represent the amount paid by the class during periods when reimbursements or reductions occur. Expenses net of fee waivers reflect expenses after reimbursement by the investment adviser but prior to reductions from brokerage service arrangements or other expense offset arrangements. Expenses net of all reductions represent the net expenses paid by the class. F Amount represents less than $.005 per share. |
See accompanying notes which are an integral part of the financial statements.
Annual Report
For the period ended October 31, 2015
1. Organization.
Fidelity Canada Fund (the Fund) is a fund of Fidelity Investment Trust (the Trust) and is authorized to issue an unlimited number of shares. The Trust is registered under the Investment Company Act of 1940, as amended (the 1940 Act), as an open-end management investment company organized as a Massachusetts business trust. The Fund offers Class A, Class T, Class C, Canada and Class I (formerly Institutional Class) shares, each of which, along with Class B shares, has equal rights as to assets and voting privileges. Class B shares are closed to new accounts and additional purchases, except for exchanges and reinvestments. Each class has exclusive voting rights with respect to matters that affect that class. Class B shares will automatically convert to Class A shares after a holding period of seven years from the initial date of purchase.
2. Investments in Fidelity Central Funds.
The Fund invests in Fidelity Central Funds, which are open-end investment companies generally available only to other investment companies and accounts managed by the investment adviser and its affiliates. The Fund's Schedule of Investments lists each of the Fidelity Central Funds held as of period end, if any, as an investment of the Fund, but does not include the underlying holdings of each Fidelity Central Fund. As an Investing Fund, the Fund indirectly bears its proportionate share of the expenses of the underlying Fidelity Central Funds.
The Money Market Central Funds seek preservation of capital and current income and are managed by Fidelity Investments Money Management, Inc. (FIMM), an affiliate of the investment adviser. Annualized expenses of the Money Market Central Funds as of their most recent shareholder report date are less than .005%.
A complete unaudited list of holdings for each Fidelity Central Fund is available upon request or at the Securities and Exchange Commission (the SEC) website at www.sec.gov. In addition, the financial statements of the Fidelity Central Funds, which are not covered by the Fund's Report of Independent Registered Public Accounting Firm, are available on the SEC website or upon request.
3. Significant Accounting Policies.
The financial statements have been prepared in conformity with accounting principles generally accepted in the United States of America (GAAP), which require management to make certain estimates and assumptions at the date of the financial statements. Actual results could differ from those estimates. Subsequent events, if any, through the date that the financial statements were issued have been evaluated in the preparation of the financial statements. The following summarizes the significant accounting policies of the Fund:
Investment Valuation. Investments are valued as of 4:00 p.m. Eastern time on the last calendar day of the period. The Board of Trustees (the Board) has delegated the day to day responsibility for the valuation of the Fund's investments to the Fidelity Management & Research Company (FMR) Fair Value Committee (the Committee). In accordance with valuation policies and procedures approved by the Board, the Fund attempts to obtain prices from one or more third party pricing vendors or brokers to value its investments. When current market prices, quotations or currency exchange rates are not readily available or reliable, investments will be fair valued in good faith by the Committee, in accordance with procedures adopted by the Board. Factors used in determining fair value vary by investment type and may include market or investment specific events. The frequency with which these procedures are used cannot be predicted and they may be utilized to a significant extent. The Committee oversees the Fund's valuation policies and procedures and reports to the Board on the Committee's activities and fair value determinations. The Board monitors the appropriateness of the procedures used in valuing the Fund's investments and ratifies the fair value determinations of the Committee.
The Fund categorizes the inputs to valuation techniques used to value its investments into a disclosure hierarchy consisting of three levels as shown below:
Level 1 - quoted prices in active markets for identical investments
Level 2 - other significant observable inputs (including quoted prices for similar investments, interest rates, prepayment speeds, etc.)
Level 3 - unobservable inputs (including the Fund's own assumptions based on the best information available)
Valuation techniques used to value the Fund's investments by major category are as follows:
Equity securities, including restricted securities, for which market quotations are readily available, are valued at the last reported sale price or official closing price as reported by a third party pricing vendor on the primary market or exchange on which they are traded and are categorized as Level 1 in the hierarchy. In the event there were no sales during the day or closing prices are not available, securities are valued at the last quoted bid price or may be valued using the last available price and are generally categorized as Level 2 in the hierarchy. For foreign equity securities, when market or security specific events arise, comparisons to the valuation of American Depositary Receipts (ADRs), futures contracts, Exchange-Traded Funds (ETFs) and certain indexes as well as quoted prices for similar securities may be used and would be categorized as Level 2 in the hierarchy. Utilizing these techniques may result in transfers between Level 1 and Level 2. For equity securities, including restricted securities, where observable inputs are limited, assumptions about market activity and risk are used and these securities may be categorized as Level 3 in the hierarchy.
Annual Report
3. Significant Accounting Policies - continued
Investment Valuation - continued
Investments in open-end mutual funds, including the Fidelity Central Funds, are valued at their closing net asset value (NAV) each business day and are categorized as Level 1 in the hierarchy.
Changes in valuation techniques may result in transfers in or out of an assigned level within the disclosure hierarchy. The aggregate value of investments by input level as of October 31, 2015 is included at the end of the Fund's Schedule of Investments.
Foreign Currency. The Fund may use foreign currency contracts to facilitate transactions in foreign-denominated securities. Gains and losses from these transactions may arise from changes in the value of the foreign currency or if the counterparties do not perform under the contracts' terms.
Foreign-denominated assets, including investment securities, and liabilities are translated into U.S. dollars at the exchange rates at period end. Purchases and sales of investment securities, income and dividends received and expenses denominated in foreign currencies are translated into U.S. dollars at the exchange rate in effect on the transaction date.
The effects of exchange rate fluctuations on investments are included with the net realized and unrealized gain (loss) on investment securities. Other foreign currency transactions resulting in realized and unrealized gain (loss) are disclosed separately.
Investment Transactions and Income. For financial reporting purposes, the Fund's investment holdings and NAV include trades executed through the end of the last business day of the period. The NAV per share for processing shareholder transactions is calculated as of the close of business of the New York Stock Exchange (NYSE), normally 4:00 p.m. Eastern time and includes trades executed through the end of the prior business day. Gains and losses on securities sold are determined on the basis of identified cost and may include proceeds received from litigation. Dividend income is recorded on the ex-dividend date, except for certain dividends from foreign securities where the ex-dividend date may have passed, which are recorded as soon as the Fund is informed of the ex-dividend date. Non-cash dividends included in dividend income, if any, are recorded at the fair market value of the securities received. Income and capital gain distributions from Fidelity Central Funds, if any, are recorded on the ex-dividend date. Distributions received on securities that represent a return of capital or capital gain are recorded as a reduction of cost of investments and/or as a realized gain. Subsequent to ex-dividend date the Fund determines the components of these distributions, based upon receipt of tax filings or other correspondence relating to the underlying investment. Interest income is accrued as earned and includes coupon interest and amortization of premium and accretion of discount on debt securities as applicable. Investment income is recorded net of foreign taxes withheld where recovery of such taxes is uncertain.
Class Allocations and Expenses. Investment income, realized and unrealized capital gains and losses, common expenses of the Fund, and certain fund-level expense reductions, if any, are allocated daily on a pro-rata basis to each class based on the relative net assets of each class to the total net assets of the Fund. Each class differs with respect to transfer agent and distribution and service plan fees incurred. Certain expense reductions may also differ by class. For the reporting period, the allocated portion of income and expenses to each class as a percent of its average net assets may vary due to the timing of recording these transactions in relation to fluctuating net assets of the classes. Expenses directly attributable to a fund are charged to that fund. Expenses attributable to more than one fund are allocated among the respective funds on the basis of relative net assets or other appropriate methods. Expense estimates are accrued in the period to which they relate and adjustments are made when actual amounts are known.
Income Tax Information and Distributions to Shareholders. Each year, the Fund intends to qualify as a regulated investment company under Subchapter M of the Internal Revenue Code, including distributing substantially all of its taxable income and realized gains. As a result, no provision for U.S. Federal income taxes is required. As of October 31, 2015, the Fund did not have any unrecognized tax benefits in the financial statements; nor is the Fund aware of any tax positions for which it is reasonably possible that the total amounts of unrecognized tax benefits will significantly change in the next twelve months. The Fund files a U.S. federal tax return, in addition to state and local tax returns as required. The Fund's federal income tax returns are subject to examination by the Internal Revenue Service (IRS) for a period of three fiscal years after they are filed. State and local tax returns may be subject to examination for an additional fiscal year depending on the jurisdiction. Foreign taxes are provided for based on the Fund's understanding of the tax rules and rates that exist in the foreign markets in which it invests.
Distributions are declared and recorded on the ex-dividend date. Income dividends and capital gain distributions are declared separately for each class. Income and capital gain distributions are determined in accordance with income tax regulations, which may differ from GAAP. In addition, the Fund claimed a portion of the payment made to redeeming shareholders as a distribution for income tax purposes.
Capital accounts within the financial statements are adjusted for permanent book-tax differences. These adjustments have no impact on net assets or the results of operations. Capital accounts are not adjusted for temporary book-tax differences which will reverse in a subsequent period.
Book-tax differences are primarily due to foreign currency transactions, passive foreign investment companies (PFIC), deferred trustees compensation and losses deferred due to wash sales.
Annual Report
Notes to Financial Statements - continued
3. Significant Accounting Policies - continued
Income Tax Information and Distributions to Shareholders - continued
The federal tax cost of investment securities and unrealized appreciation (depreciation) as of period end were as follows:
Gross unrealized appreciation | $ 287,975,691 |
Gross unrealized depreciation | (151,197,499) |
Net unrealized appreciation (depreciation) on securities | $ 136,778,192 |
Tax Cost | $ 1,283,918,896 |
The tax-based components of distributable earnings as of period end were as follows:
Undistributed ordinary income | $ 14,466,211 |
Undistributed long-term capital gain | $ 1,887,468 |
Net unrealized appreciation (depreciation) on securities and other investments | $ 136,769,940 |
The tax character of distributions paid was as follows:
| October 31, 2015 | October 31, 2014 |
Ordinary Income | $ 24,029,674 | $ 9,338,915 |
Long-term Capital Gains | 262,730,704 | 13,503,099 |
Total | $ 286,760,378 | $ 22,842,014 |
Short-Term Trading (Redemption) Fees. Shares held by investors in the Fund less than 90 days may have been subject to a redemption fee equal to 1.50% of the NAV of shares redeemed. All redemption fees, which reduce the proceeds of the shareholder redemption, are retained by the Fund and accounted for as an addition to paid in capital.
4. Purchases and Sales of Investments.
Purchases and sales of securities, other than short-term securities, aggregated $424,331,275 and $975,977,104, respectively.
5. Fees and Other Transactions with Affiliates.
Management Fee. Fidelity Management & Research Company (the investment adviser) and its affiliates provide the Fund with investment management related services for which the Fund pays a monthly management fee. The management fee is the sum of an individual fund fee rate that is based on an annual rate of .45% of the Fund's average net assets and an annualized group fee rate that averaged .25% during the period. The group fee rate is based upon the average net assets of all the mutual funds advised by the investment adviser, including any mutual funds previously advised by the investment adviser that are currently advised by Fidelity SelectCo, LLC, an affiliate of the investment adviser. The group fee rate decreases as assets under management increase and increases as assets under management decrease. In addition, the management fee is subject to a performance adjustment (up to a maximum of ± .20% of the Fund's average net assets over a 36 month performance period). The upward or downward adjustment to the management fee is based on the relative investment performance of Canada as compared to its benchmark index, the S&P/TSX Composite Index, over the same 36 month performance period. For the reporting period, the total annual management fee rate, including the performance adjustment, was .88% of the Fund's average net assets. The performance adjustment included in the management fee rate may be higher or lower than the maximum performance adjustment rate due to the difference between the average net assets for the reporting and performance periods.
Distribution and Service Plan Fees. In accordance with Rule 12b-1 of the 1940 Act, the Fund has adopted separate Distribution and Service Plans for each class of shares. Certain classes pay Fidelity Distributors Corporation (FDC), an affiliate of the investment adviser, separate Distribution and Service Fees, each of which is based on an annual percentage of each class' average net assets. In addition, FDC may pay financial intermediaries for selling shares of the Fund and providing shareholder support services. For the period, the Distribution and Service Fee rates, total fees and amounts retained by FDC were as follows:
| Distribution
Fee | Service
Fee | Total Fees | Retained
by FDC |
Class A | -% | .25% | $ 191,960 | $ 4,821 |
Class T | .25% | .25% | 83,690 | 504 |
Class B | .75% | .25% | 44,747 | 33,560 |
Class C | .75% | .25% | 301,847 | 11,953 |
| | | $ 622,244 | $ 50,838 |
Annual Report
5. Fees and Other Transactions with Affiliates - continued
Sales Load. FDC may receive a front-end sales charge of up to 5.75% for selling Class A shares and 3.50% for selling Class T shares, some of which is paid to financial intermediaries for selling shares of the Fund. Depending on the holding period, FDC may receive contingent deferred sales charges levied on Class A, Class T, Class B, and Class C redemptions. The deferred sales charges range from 5.00% to 1.00% for Class B shares, 1.00% for Class C shares, 1.00% for certain purchases of Class A shares and .25% for certain purchases of Class T shares.
For the period, sales charge amounts retained by FDC were as follows:
| Retained
by FDC |
Class A | $ 15,562 |
Class T | 3,236 |
Class BA | 7,910 |
Class C A | 1,549 |
| $ 28,257 |
A When Class B and Class C shares are initially sold, FDC pays commissions from its own resources to financial intermediaries through which the sales are made.
Transfer Agent Fees. Fidelity Investments Institutional Operations Company, Inc., (FIIOC), an affiliate of the investment adviser, is the transfer, dividend disbursing and shareholder servicing agent for each class of the Fund. FIIOC receives account fees and asset-based fees that vary according to the account size and type of account of the shareholders of the respective classes of the Fund. FIIOC pays for typesetting, printing and mailing of shareholder reports, except proxy statements.
For the period, transfer agent fees for each class were as follows:
| Amount | % of
Class-Level Average
Net Assets |
Class A | $ 186,677 | .24 |
Class T | 51,332 | .31 |
Class B | 12,380 | .28 |
Class C | 73,747 | .25 |
Canada | 3,470,909 | .21 |
Class I | 40,465 | .19 |
| $ 3,835,510 | |
Accounting and Security Lending Fees. Fidelity Service Company, Inc. (FSC), an affiliate of the investment adviser, maintains the Fund's accounting records. The accounting fee is based on the level of average net assets for each month. Under a separate contract, FSC administers the security lending program. The security lending fee is based on the number and duration of lending transactions.
Brokerage Commissions. The fund placed a portion of its portfolio transactions with brokerage firms which are affiliates of the investment adviser. Brokerage commissions are included in net realized gain (loss) and change in net unrealized appreciation (depreciation) in the Statement of Operations. The commissions paid to these affiliated firms were $680 for the period.
6. Committed Line of Credit.
The Fund participates with other funds managed by the investment adviser or an affiliate in a $4.25 billion credit facility (the "line of credit") to be utilized for temporary or emergency purposes to fund shareholder redemptions or for other short-term liquidity purposes. The Fund has agreed to pay commitment fees on its pro-rata portion of the line of credit, which amounted to $2,735 and is reflected in Miscellaneous expenses on the Statement of Operations. During the period, the Fund did not borrow on this line of credit.
Annual Report
Notes to Financial Statements - continued
7. Security Lending.
The Fund lends portfolio securities through a lending agent from time to time in order to earn additional income. For equity securities, a lending agent is used and may loan securities to certain qualified borrowers, including Fidelity Capital Markets (FCM), a broker-dealer affiliated with the Fund. On the settlement date of the loan, the Fund receives collateral (in the form of U.S. Treasury obligations, letters of credit and/or cash) against the loaned securities and maintains collateral in an amount not less than 100% of the market value of the loaned securities during the period of the loan. The market value of the loaned securities is determined at the close of business of the Fund and any additional required collateral is delivered to the Fund on the next business day. The Fund or borrower may terminate the loan at any time, and if the borrower defaults on its obligation to return the securities loaned because of insolvency or other reasons, the Fund may apply collateral received from the borrower against the obligation. The Fund may experience delays and costs in recovering the securities loaned. Any cash collateral received is invested in the Fidelity Securities Lending Cash Central Fund. The value of loaned securities and cash collateral at period end are disclosed on the Fund's Statement of Assets and Liabilities. The value of securities loaned to FCM at period end was $920,121. Security lending income represents the income earned on investing cash collateral, less rebates paid to borrowers and any lending agent fees associated with the loan, plus any premium payments received for lending certain types of securities. Security lending income is presented in the Statement of Operations as a component of income from Fidelity Central Funds, and includes $33,265 from securities loaned to FCM.
8. Expense Reductions.
Commissions paid to certain brokers with whom the investment adviser, or its affiliates, places trades on behalf of the Fund include an amount in addition to trade execution, which may be rebated back to the Fund to offset certain expenses. This amount totaled $30,896 for the period.
In addition, during the period the investment adviser reimbursed and/or waived a portion of fund-level operating expenses in the amount of $6,891 and a portion of class-level operating expenses as follows:
| Amount |
Class A | $ 2,472 |
Class T | 46 |
Class B | 30 |
Class C | 993 |
Canada | 65,257 |
Class I | 724 |
| $ 69,522 |
9. Distributions to Shareholders.
Distributions to shareholders of each class were as follows:
Years ended October 31, | 2015 | 2014 |
From net investment income | | |
Class A | $ 783,478 | $ 53,142 |
Class T | 106,245 | - |
Class C | 12,920 | - |
Canada | 22,800,214 | 9,173,811 |
Class I | 326,817 | 111,962 |
Total | $ 24,029,674 | $ 9,338,915 |
From net realized gain | | |
Class A | $ 11,358,847 | $ 629,831 |
Class T | 2,548,483 | 130,152 |
Class B | 742,098 | 42,217 |
Class C | 4,664,328 | 256,584 |
Canada | 239,967,215 | 12,282,929 |
Class I | 3,449,733 | 161,386 |
Total | $ 262,730,704 | $ 13,503,099 |
Annual Report
10. Share Transactions.
Share transactions for each class were as follows and may contain automatic conversions between classes or exchanges between funds:
| Shares | Dollars |
Years ended October 31, | 2015 | 2014 | 2015 | 2014 |
Class A | | | | |
Shares sold | 153,407 | 144,381 | $ 8,099,168 | $ 8,740,780 |
Reinvestment of distributions | 200,582 | 9,784 | 10,552,616 | 552,980 |
Shares redeemed | (634,705) | (620,817) | (31,737,294) | (36,791,904) |
Net increase (decrease) | (280,716) | (466,652) | $ (13,085,510) | $ (27,498,144) |
Class T | | | | |
Shares sold | 21,812 | 29,501 | $ 1,102,045 | $ 1,790,320 |
Reinvestment of distributions | 49,518 | 2,264 | 2,597,730 | 127,592 |
Shares redeemed | (151,491) | (82,268) | (7,597,599) | (4,830,983) |
Net increase (decrease) | (80,161) | (50,503) | $ (3,897,824) | $ (2,913,071) |
Class B | | | | |
Shares sold | 1,663 | 547 | $ 85,823 | $ 32,504 |
Reinvestment of distributions | 12,380 | 630 | 641,184 | 35,107 |
Shares redeemed | (59,611) | (31,942) | (2,906,257) | (1,874,606) |
Net increase (decrease) | (45,568) | (30,765) | $ (2,179,250) | $ (1,806,995) |
Class C | | | | |
Shares sold | 42,631 | 50,749 | $ 2,146,853 | $ 2,984,240 |
Reinvestment of distributions | 75,003 | 3,715 | 3,864,885 | 206,074 |
Shares redeemed | (283,087) | (216,291) | (13,692,762) | (12,480,545) |
Net increase (decrease) | (165,453) | (161,827) | $ (7,681,024) | $ (9,290,231) |
Canada | | | | |
Shares sold | 1,250,697 | 1,968,387 | $ 63,450,179 | $ 119,959,708 |
Reinvestment of distributions | 4,716,591 | 358,786 | 249,177,482 | 20,353,959 |
Shares redeemed | (11,643,757) | (7,758,261) | (581,614,067) | (462,389,717) |
Net increase (decrease) | (5,676,469) | (5,431,088) | $ (268,986,406) | $ (322,076,050) |
Class I | | | | |
Shares sold | 66,679 | 331,645 | $ 3,430,310 | $ 20,156,294 |
Reinvestment of distributions | 49,883 | 3,804 | 2,628,352 | 215,319 |
Shares redeemed | (285,976) | (374,817) | (14,385,529) | (22,474,114) |
Net increase (decrease) | (169,414) | (39,368) | $ (8,326,867) | $ (2,102,501) |
11. Other.
The Fund's organizational documents provide former and current trustees and officers with a limited indemnification against liabilities arising in connection with the performance of their duties to the Fund. In the normal course of business, the Fund may also enter into contracts that provide general indemnifications. The Fund's maximum exposure under these arrangements is unknown as this would be dependent on future claims that may be made against the Fund. The risk of material loss from such claims is considered remote.
Annual Report
Fidelity China Region Fund
Average annual total return reflects the change in the value of an investment, assuming reinvestment of the class' distributions from dividend income and capital gains (the profits earned upon the sale of securities that have grown in value, if any) and assuming a constant rate of performance each year. The $10,000 table and the fund's returns do not reflect the deduction of taxes that a shareholder would pay on fund distributions or the redemption of fund shares. During periods of reimbursement by Fidelity, a fund's total return will be greater than it would be had the reimbursement not occurred. How a fund did yesterday is no guarantee of how it will do tomorrow.
Average Annual Total Returns
Periods ended October 31, 2015 | Past 1
year | Past 5
years | Past 10
years |
Fidelity China Region Fund | -1.14% | 4.58% | 10.52% |
$10,000 Over 10 Years
Let's say hypothetically that $10,000 was invested in Fidelity China Region Fund, a class of the fund, on October 31, 2005. The chart shows how the value of your investment would have changed, and also shows how the MSCI Golden Dragon Index performed over the same period.
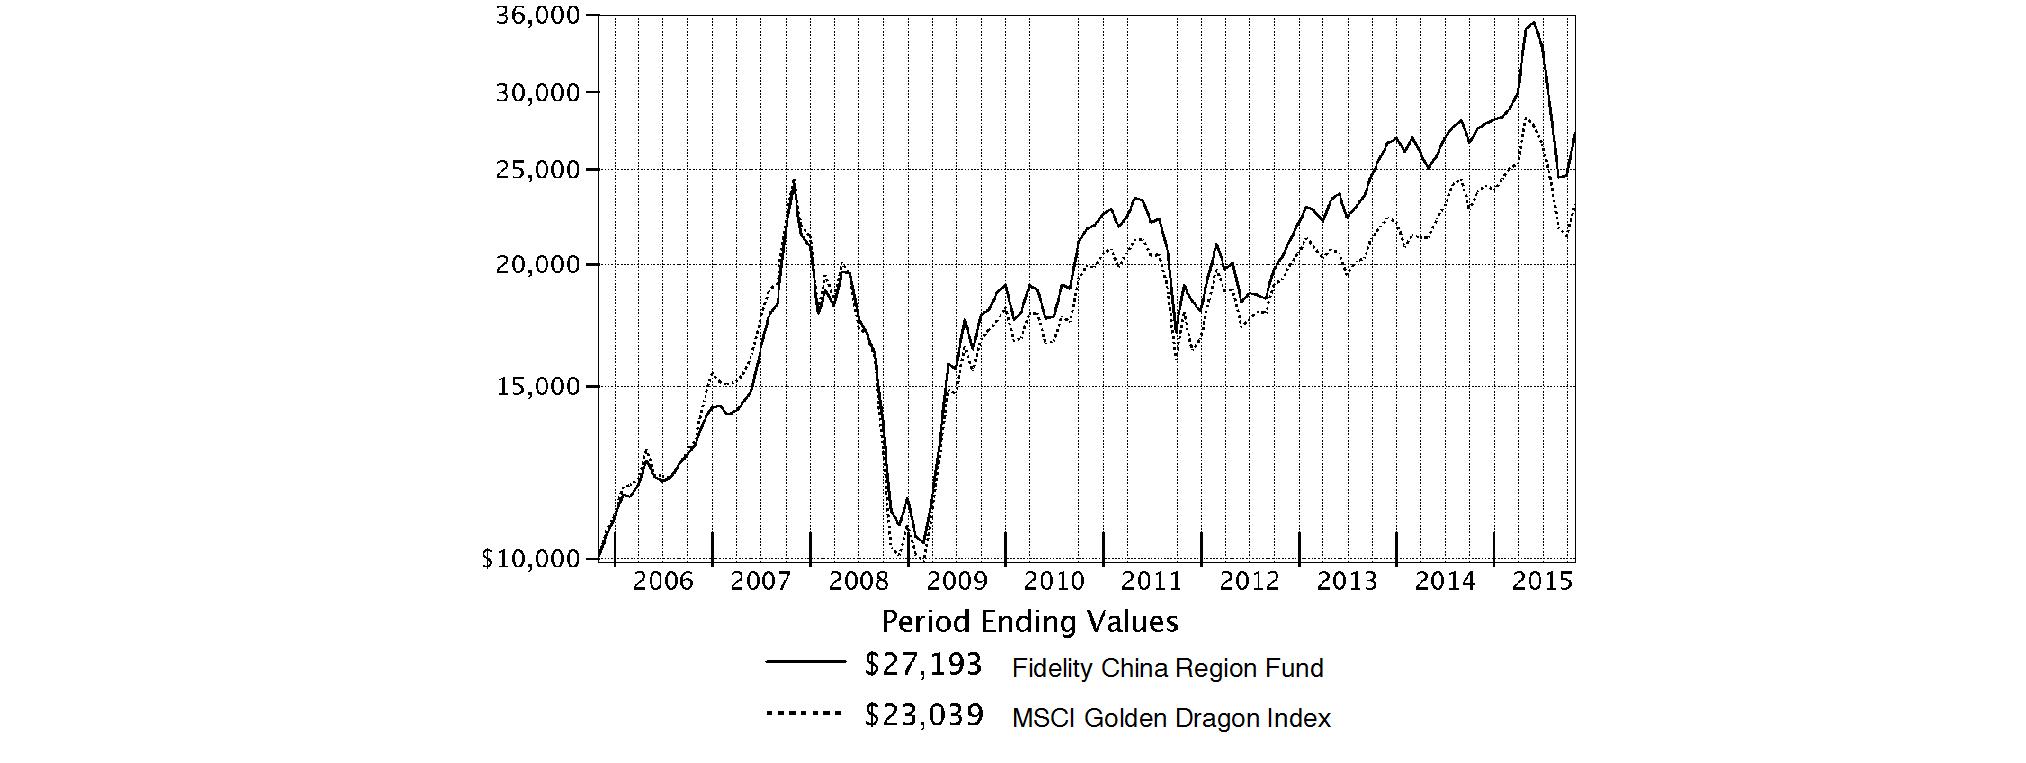
Annual Report
Fidelity China Region Fund
Market Recap: International equities suffered a moderate setback for the 12 months ending October 31, 2015, held back by a collapse in commodities prices that hurt resources-related sectors and geographies. The MSCI ACWI (All Country World Index) ex USA Index returned -4.55% for the period, affected also by concerns about global economic growth. Commodity producers remained under pressure for much of the past year, largely related to economic deceleration in China (-1%), the world's second-largest economy and a leading consumer of raw materials. This effect was exacerbated by U.S. dollar strength relative to global currencies, which weighed on commodities priced in dollars and acutely impacted equity returns within regions most exposed to resources prices. The emerging-markets group, for example, returned about -15% this period. Canada, a significant energy producer, returned roughly -17%. Net energy consumer Japan (+9%) was the best-performing region by far. Only about a quarter of the nearly 50 index countries managed a gain this period: Ireland (+19%) - the EU's fastest-growing economy - and Israel (+17%) proved top performers; Greece (-56%) and Brazil (-46%), among the worst. As for sectors, energy (-25%) and materials (-16%) declined sharply, whereas the two consumer sectors each gained about 6%.
Comments from Portfolio Manager Robert Bao: For the year, the fund's share classes (excluding sales charges, if applicable) posted low single-digit declines but outpaced the -2.99% return of the benchmark MSCI Golden Dragon Index. Stock selection was the primary driver of the fund's relative success, especially in consumer discretionary and health care. Versus the benchmark, performance was lifted by two cement companies in the materials sector, West China Cement - the fund's largest relative contributor - and China Shanshui Cement Group. Other contributors included China Life Insurance, People's Insurance Group of China, China Southern Airlines, which I bought in December, and China-based online classified advertising portal 58.com. Conversely, a large overweighting in consumer discretionary offset much of the benefits of solid stock picking there. Positioning in financials further detracted. At the stock level, moving to a significant underweighting in China-based Internet media firm Tencent Holdings made this index name the fund's biggest relative detractor, in view of its 19% advance. Underweighting and ultimately selling benchmark component CK Hutchison Holdings, which returned roughly 16%, also worked against us. Lastly, I'll mention an underweighting in benchmark heavyweight Taiwan Semiconductor Manufacturing, whose shares posted a modest gain and therefore detracted from our relative result.
The views expressed above reflect those of the portfolio manager(s) only through the end of the period as stated on the cover of this report and do not necessarily represent the views of Fidelity or any other person in the Fidelity organization. Any such views are subject to change at any time based upon market or other conditions and Fidelity disclaims any responsibility to update such views. These views may not be relied on as investment advice and, because investment decisions for a Fidelity fund are based on numerous factors, may not be relied on as an indication of trading intent on behalf of any Fidelity fund.
Annual Report
Fidelity China Region Fund
As a shareholder of the Fund, you incur two types of costs: (1) transaction costs, including sales charges (loads) on purchase payments or redemption proceeds, redemption fees and (2) ongoing costs, including management fees, distribution and/or service (12b-1) fees and other Fund expenses. This Example is intended to help you understand your ongoing costs (in dollars) of investing in the Fund and to compare these costs with the ongoing costs of investing in other mutual funds.
The Example is based on an investment of $1,000 invested at the beginning of the period and held for the entire period (May 1, 2015 to October 31, 2015).
Actual Expenses
The first line of the accompanying table for each class of the Fund provides information about actual account values and actual expenses. You may use the information in this line, together with the amount you invested, to estimate the expenses that you paid over the period. Simply divide your account value by $1,000.00 (for example, an $8,600 account value divided by $1,000.00 = 8.6), then multiply the result by the number in the first line for a class of the Fund under the heading entitled "Expenses Paid During Period" to estimate the expenses you paid on your account during this period. A small balance maintenance fee of $12.00 that is charged once a year may apply for certain accounts with a value of less than $2,000. This fee is not included in the table below. If it was, the estimate of expenses you paid during the period would be higher, and your ending account value lower, by this amount. In addition, the Fund, as a shareholder in the underlying Fidelity Central Funds, will indirectly bear its pro-rata share of the fees and expenses incurred by the underlying Fidelity Central Funds. These fees and expenses are not included in the Fund's annualized expense ratio used to calculate the expense estimate in the table below.
Hypothetical Example for Comparison Purposes
The second line of the accompanying table for each class of the Fund provides information about hypothetical account values and hypothetical expenses based on a Class' actual expense ratio and an assumed rate of return of 5% per year before expenses, which is not the Class' actual return. The hypothetical account values and expenses may not be used to estimate the actual ending account balance or expenses you paid for the period. You may use this information to compare the ongoing costs of investing in the Fund and other funds. To do so, compare this 5% hypothetical example with the 5% hypothetical examples that appear in the shareholder reports of the other funds. A small balance maintenance fee of $12.00 that is charged once a year may apply for certain accounts with a value of less than $2,000. This fee is not included in the table below. If it was, the estimate of expenses you paid during the period would be higher, and your ending account value lower, by this amount. In addition, the Fund, as a shareholder in the underlying Fidelity Central Funds, will indirectly bear its pro-rata share of the fees and expenses incurred by the underlying Fidelity Central Funds. These fees and expenses are not included in the Fund's annualized expense ratio used to calculate the expense estimate in the table below.
Please note that the expenses shown in the table are meant to highlight your ongoing costs only and do not reflect any transaction costs. Therefore, the second line of the table is useful in comparing ongoing costs only, and will not help you determine the relative total costs of owning different funds. In addition, if these transactional costs were included, your costs would have been higher.
| Annualized
Expense RatioB | Beginning
Account Value
May 1, 2015 | Ending
Account Value
October 31, 2015 | Expenses Paid
During PeriodC
May 1, 2015
to October 31, 2015 |
Class A | 1.29% | | | |
Actual | | $ 1,000.00 | $ 779.10 | $ 5.78 |
HypotheticalA | | $ 1,000.00 | $ 1,018.70 | $ 6.56 |
Class T | 1.63% | | | |
Actual | | $ 1,000.00 | $ 777.70 | $ 7.30 |
HypotheticalA | | $ 1,000.00 | $ 1,016.99 | $ 8.29 |
Class B | 2.10% | | | |
Actual | | $ 1,000.00 | $ 776.30 | $ 9.40 |
HypotheticalA | | $ 1,000.00 | $ 1,014.62 | $ 10.66 |
Class C | 2.06% | | | |
Actual | | $ 1,000.00 | $ 776.20 | $ 9.22 |
HypotheticalA | | $ 1,000.00 | $ 1,014.82 | $ 10.46 |
China Region | .99% | | | |
Actual | | $ 1,000.00 | $ 780.50 | $ 4.35 |
HypotheticalA | | $ 1,000.00 | $ 1,020.21 | $ 5.04 |
Class I | .97% | | | |
Actual | | $ 1,000.00 | $ 780.50 | $ 4.35 |
HypotheticalA | | $ 1,000.00 | $ 1,020.32 | $ 4.94 |
A 5% return per year before expenses
B Annualized expense ratio reflects expenses net of applicable fee waivers.
C Expenses are equal to each Class' annualized expense ratio, multiplied by the average account value over the period, multiplied by 184/365 (to reflect the one-half year period).
Annual Report
Fidelity China Region Fund
Investment Changes (Unaudited)
Asset Allocation as of October 31, 2015 |
| % of fund's
net assets | % of fund's net assets
6 months ago |
Stocks | 98.6 | 99.2 |
Short-Term Investments and Net Other Assets (Liabilities) | 1.4 | 0.8 |
Top Ten Stocks as of October 31, 2015 |
| % of fund's
net assets | % of fund's net assets
6 months ago |
Tencent Holdings Ltd. (Internet Software & Services) | 6.0 | 3.2 |
China Construction Bank Corp. (H Shares) (Banks) | 4.9 | 3.6 |
AIA Group Ltd. (Insurance) | 3.3 | 4.4 |
Bank of China Ltd. (H Shares) (Banks) | 3.1 | 3.1 |
Ping An Insurance (Group) Co. of China Ltd. (H Shares) (Insurance) | 2.8 | 2.3 |
China Pacific Insurance (Group) Co. Ltd. (H Shares) (Insurance) | 2.3 | 2.3 |
Industrial & Commercial Bank of China Ltd. (H Shares) (Banks) | 2.3 | 4.1 |
Chongqing Changan Automobile Co. Ltd. (B Shares) (Automobiles) | 2.2 | 1.4 |
Hangzhou Hikvision Digital Technology Co. Ltd. ELS (BNP Paribas Warrant Program) warrants 11/27/17 (Banks) | 2.0 | 0.9 |
China Merchants Bank Co. Ltd. (H Shares) (Banks) | 1.9 | 1.6 |
| 30.8 | |
Market Sectors as of October 31, 2015 |
| % of fund's net assets | % of fund's net assets
6 months ago |
Financials | 37.8 | 40.4 |
Consumer Discretionary | 14.4 | 13.3 |
Information Technology | 14.0 | 16.6 |
Industrials | 12.9 | 12.2 |
Materials | 6.7 | 4.0 |
Health Care | 5.5 | 9.1 |
Telecommunication Services | 2.4 | 1.4 |
Consumer Staples | 2.0 | 1.7 |
Energy | 1.6 | 0.0 |
Utilities | 1.3 | 0.5 |
The fund may invest up to 35% of its total assets in any industry that represents more than 20% of the Hong Kong, Taiwanese and Chinese market. As of October 31, 2015, the fund did not have more than 25% of its total assets invested in any one industry. Percentages shown as 0.0% may reflect amounts less than 0.05%. |
Annual Report
Fidelity China Region Fund
Investments October 31, 2015
Showing Percentage of Net Assets
Common Stocks - 98.0% |
| Shares | | Value |
CONSUMER DISCRETIONARY - 13.8% |
Auto Components - 1.4% |
Weifu High-Technology Co. Ltd. (B Shares) | 4,257,836 | | $ 10,855,699 |
Xingda International Holdings Ltd. | 34,649,000 | | 7,697,062 |
| | 18,552,761 |
Automobiles - 3.3% |
Brilliance China Automotive Holdings Ltd. | 10,008,000 | | 13,877,531 |
Chongqing Changan Automobile Co. Ltd. (B Shares) | 15,733,741 | | 28,957,143 |
Geely Automobile Holdings Ltd. | 3,490,000 | | 1,861,105 |
| | 44,695,779 |
Diversified Consumer Services - 0.2% |
Perfect Shape (PRC) Holdings Ltd. | 10,848,000 | | 2,037,136 |
Hotels, Restaurants & Leisure - 2.2% |
500.com Ltd. sponsored ADR Class A (a)(d) | 300,000 | | 6,090,000 |
Huangshan Tourism Development Co. Ltd. | 5,899,876 | | 10,098,245 |
Tuniu Corp. Class A sponsored ADR (a)(d) | 895,000 | | 13,809,850 |
| | 29,998,095 |
Household Durables - 1.1% |
Haier Electronics Group Co. Ltd. | 5,492,000 | | 10,614,115 |
Qingdao Haier Co. Ltd. | 3,099,822 | | 4,719,036 |
| | 15,333,151 |
Internet & Catalog Retail - 2.7% |
Ctrip.com International Ltd. sponsored ADR (a)(d) | 243,000 | | 22,591,710 |
Qunar Cayman Islands Ltd. sponsored ADR (a)(d) | 285,000 | | 13,833,900 |
| | 36,425,610 |
Media - 0.9% |
Poly Culture Group Corp. Ltd. (H Shares) (d) | 4,978,100 | | 11,968,205 |
Specialty Retail - 0.4% |
China Harmony New Energy Auto | 7,500,000 | | 5,002,429 |
Textiles, Apparel & Luxury Goods - 1.6% |
Best Pacific International Holdings Ltd. | 9,297,000 | | 3,946,589 |
Lao Feng Xiang Co. Ltd. (B Shares) | 2,499,988 | | 10,757,394 |
Toung Loong Textile Manufacturing Co. Ltd. | 2,375,000 | | 7,191,206 |
| | 21,895,189 |
TOTAL CONSUMER DISCRETIONARY | | 185,908,355 |
CONSUMER STAPLES - 2.0% |
Beverages - 1.4% |
Kweichow Moutai Co. Ltd. | 555,952 | | 18,771,044 |
|
| Shares | | Value |
Food & Staples Retailing - 0.6% |
China Resources Beer Holdings Co. Ltd. | 3,942,000 | | $ 7,443,167 |
TOTAL CONSUMER STAPLES | | 26,214,211 |
ENERGY - 1.6% |
Oil, Gas & Consumable Fuels - 1.6% |
China Petroleum & Chemical Corp. (H Shares) | 29,576,000 | | 21,319,684 |
FINANCIALS - 37.8% |
Banks - 17.6% |
Bank Communications Co. Ltd. (H Shares) | 29,071,000 | | 21,442,752 |
Bank of China Ltd. (H Shares) | 89,124,000 | | 42,027,437 |
China Construction Bank Corp. (H Shares) | 90,503,000 | | 65,592,590 |
China Merchants Bank Co. Ltd. (H Shares) | 9,776,000 | | 25,524,331 |
China Minsheng Banking Corp. Ltd. (H Shares) | 10,800,000 | | 10,853,532 |
Hangzhou Hikvision Digital Technology Co. Ltd. ELS (BNP Paribas Warrant Program) warrants 11/27/17 (a)(f) | 4,809,000 | | 26,200,354 |
Industrial & Commercial Bank of China Ltd. (H Shares) | 48,916,000 | | 31,027,702 |
Midea Group Co. Ltd. ELS (BNP Paribas Arbitrage Warrant Program) warrants 2/10/17 (a)(f) | 3,090,600 | | 13,619,332 |
| | 236,288,030 |
Capital Markets - 4.6% |
Beijing Yanjing Brewery Co. Ltd. ELS (UBS Warrant Programme) warrants 7/30/18 (a)(f) | 10,595,900 | | 14,753,023 |
Guotai Junan International Holdings Ltd. | 27,600,000 | | 10,181,009 |
Haitong Securities Co. Ltd. (H Shares) | 5,600,000 | | 9,743,426 |
Huatai Securities Co. Ltd. (a) | 2,727,564 | | 6,189,058 |
Huayi Brothers Media Corp. (UBS Warrant Programme) warrants 5/19/16 ELS (a)(f) | 1,490,000 | | 8,649,929 |
Tai Fook Securities Group Ltd. | 21,756,000 | | 12,022,457 |
Value Partners Group Ltd. | 956,000 | | 1,012,325 |
| | 62,551,227 |
Insurance - 12.0% |
AIA Group Ltd. | 7,498,200 | | 43,964,430 |
China Life Insurance Co. Ltd. (H Shares) | 2,796,200 | | 10,083,333 |
China Pacific Insurance (Group) Co. Ltd. (H Shares) | 7,908,800 | | 31,503,886 |
New China Life Insurance Co. Ltd. (H Shares) | 3,477,000 | | 15,310,621 |
People's Insurance Co. of China Group (H Shares) | 43,065,000 | | 23,047,521 |
Ping An Insurance (Group) Co. of China Ltd. (H Shares) | 6,745,500 | | 37,864,178 |
| | 161,773,969 |
Real Estate Management & Development - 3.6% |
Beijing Capital Land Ltd. (H Shares) | 35,170,000 | | 16,877,281 |
Common Stocks - continued |
| Shares | | Value |
FINANCIALS - continued |
Real Estate Management & Development - continued |
Greenland Hong Kong Holdings Ltd. (a) | 12,000,000 | | $ 5,066,888 |
Greentown China Holdings Ltd. (a)(d) | 15,740,500 | | 13,767,822 |
Shimao Property Holdings Ltd. | 6,908,500 | | 12,099,133 |
| | 47,811,124 |
TOTAL FINANCIALS | | 508,424,350 |
HEALTH CARE - 5.5% |
Health Care Providers & Services - 1.0% |
China National Accord Medicines Corp. Ltd. | 1,256,673 | | 6,282,359 |
Phoenix Healthcare Group Ltd. (d) | 4,576,500 | | 6,930,318 |
| | 13,212,677 |
Life Sciences Tools & Services - 0.7% |
JHL Biotech, Inc. (a) | 4,010,696 | | 8,944,229 |
Pharmaceuticals - 3.8% |
CSPC Pharmaceutical Group Ltd. | 19,732,000 | | 18,371,405 |
Lee's Pharmaceutical Holdings Ltd. | 8,273,500 | | 10,682,214 |
Livzon Pharmaceutical Group, Inc. | 1,690,000 | | 8,087,083 |
Sino Biopharmaceutical Ltd. | 11,404,000 | | 14,171,754 |
| | 51,312,456 |
TOTAL HEALTH CARE | | 73,469,362 |
INDUSTRIALS - 12.9% |
Air Freight & Logistics - 0.5% |
Sinotrans Air Transportation Development Co. Ltd. (A Shares) | 1,599,830 | | 6,628,659 |
Airlines - 3.0% |
Air China Ltd. (H Shares) | 6,648,000 | | 6,403,457 |
China Eastern Airlines Corp. Ltd. (H Shares) (a) | 26,446,000 | | 16,966,898 |
China Southern Airlines Ltd. (H Shares) | 20,194,000 | | 17,162,111 |
| | 40,532,466 |
Construction & Engineering - 1.9% |
Beijing Urban Consolidated & Development Group Ltd. (H Shares) (d) | 20,963,000 | | 12,897,334 |
China Communications Construction Co. Ltd. (H Shares) | 9,859,000 | | 13,607,270 |
| | 26,504,604 |
Electrical Equipment - 1.7% |
Harbin Electric Machinery Co. Ltd. (H Shares) (d) | 21,974,000 | | 13,099,547 |
Jiangnan Group Ltd. | 44,374,000 | | 10,161,406 |
| | 23,260,953 |
Machinery - 2.6% |
HIWIN Technologies Corp. | 1,339,000 | | 7,485,862 |
Lonking Holdings Ltd. | 28,600,000 | | 4,587,050 |
Sinotruk Hong Kong Ltd. | 8,000,000 | | 3,329,894 |
|
| Shares | | Value |
Weichai Power Co. Ltd. (H Shares) | 7,850,000 | | $ 8,323,944 |
Zhengzhou Yutong Bus Co. Ltd. | 3,149,956 | | 10,849,396 |
| | 34,576,146 |
Marine - 1.4% |
China Shipping Development Co. Ltd. (H Shares) (d) | 22,444,000 | | 15,897,809 |
Sinotrans Shipping Ltd. (d) | 12,186,000 | | 2,567,548 |
| | 18,465,357 |
Trading Companies & Distributors - 1.8% |
Summit Ascent Holdings Ltd. (a)(d) | 48,136,000 | | 23,957,754 |
TOTAL INDUSTRIALS | | 173,925,939 |
INFORMATION TECHNOLOGY - 14.0% |
Electronic Equipment & Components - 3.4% |
Largan Precision Co. Ltd. | 159,000 | | 12,415,370 |
Sunny Optical Technology Group Co. Ltd. (d) | 4,500,000 | | 10,463,038 |
Tongda Group Holdings Ltd. | 65,800,000 | | 13,400,975 |
Wasion Group Holdings Ltd. | 8,250,000 | | 9,152,424 |
| | 45,431,807 |
Internet Software & Services - 8.7% |
58.com, Inc. ADR (a)(d) | 254,478 | | 13,357,550 |
Alibaba Group Holding Ltd. sponsored ADR (a) | 95,000 | | 7,963,850 |
Baozun, Inc. sponsored ADR (d) | 382,374 | | 3,303,711 |
NetEase, Inc. sponsored ADR | 30,000 | | 4,335,900 |
SINA Corp. (a) | 150,000 | | 7,146,000 |
Tencent Holdings Ltd. | 4,263,400 | | 80,362,442 |
| | 116,469,453 |
Software - 0.9% |
China City Railway Transportation Technology Holdings Co. Ltd. (a) | 48,540,000 | | 12,889,066 |
Technology Hardware, Storage & Peripherals - 1.0% |
ADLINK Technology, Inc. | 3,488,336 | | 9,412,544 |
Axiomtek Co. Ltd. | 2,000,000 | | 4,281,534 |
| | 13,694,078 |
TOTAL INFORMATION TECHNOLOGY | | 188,484,404 |
MATERIALS - 6.7% |
Construction Materials - 4.7% |
Asia Cement (China) Holdings Corp. | 2,818,000 | | 875,515 |
BBMG Corp. (H Shares) | 34,800,000 | | 24,387,043 |
China Shanshui Cement Group Ltd. (a)(d) | 20,656,000 | | 14,440,021 |
West China Cement Ltd. (d) | 133,122,000 | | 22,887,052 |
| | 62,589,631 |
Metals & Mining - 1.1% |
Angang Steel Co. Ltd. (H Shares) (d) | 16,946,000 | | 7,041,687 |
Common Stocks - continued |
| Shares | | Value |
MATERIALS - continued |
Metals & Mining - continued |
Fushan International Energy Group Ltd. (d) | 30,000,000 | | $ 4,047,633 |
Maanshan Iron & Steel Ltd. (H Shares) (a)(d) | 20,000,000 | | 4,281,653 |
| | 15,370,973 |
Paper & Forest Products - 0.9% |
Lee & Man Paper Manufacturing Ltd. | 9,455,000 | | 5,886,341 |
Nine Dragons Paper (Holdings) Ltd. | 9,000,000 | | 5,938,554 |
| | 11,824,895 |
TOTAL MATERIALS | | 89,785,499 |
TELECOMMUNICATION SERVICES - 2.4% |
Diversified Telecommunication Services - 2.4% |
China Telecom Corp. Ltd. (H Shares) | 13,024,000 | | 6,793,608 |
China Unicom Ltd. | 13,784,000 | | 16,798,406 |
CITIC 1616 Holdings Ltd. | 19,565,000 | | 8,110,882 |
| | 31,702,896 |
UTILITIES - 1.3% |
Independent Power and Renewable Electricity Producers - 1.3% |
Beijing Jingneng Clean Energy Co. Ltd. (H Shares) (d) | 50,462,000 | | 17,460,148 |
TOTAL COMMON STOCKS (Cost $1,406,055,507) |
1,316,694,848
|
Nonconvertible Preferred Stocks - 0.6% |
| | | |
CONSUMER DISCRETIONARY - 0.6% |
Internet & Catalog Retail - 0.6% |
China Internet Plus Holdings Ltd. (e) (Cost $6,268,244) | 1,983,088 | | 7,654,720 |
Money Market Funds - 7.0% |
| Shares | | Value |
Fidelity Cash Central Fund, 0.18% (b) | 20,040,108 | | $ 20,040,108 |
Fidelity Securities Lending Cash Central Fund, 0.19% (b)(c) | 74,180,545 | | 74,180,545 |
TOTAL MONEY MARKET FUNDS (Cost $94,220,653) |
94,220,653
|
TOTAL INVESTMENT
PORTFOLIO - 105.6% (Cost $1,506,544,404) | | 1,418,570,221 |
NET OTHER ASSETS (LIABILITIES) - (5.6)% | | (75,006,869) |
NET ASSETS - 100% | $ 1,343,563,352 |
Security Type Abbreviations |
ELS - Equity-Linked Security |
Legend |
(a) Non-income producing |
(b) Affiliated fund that is generally available only to investment companies and other accounts managed by Fidelity Investments. The rate quoted is the annualized seven-day yield of the fund at period end. A complete unaudited listing of the fund's holdings as of its most recent quarter end is available upon request. In addition, each Fidelity Central Fund's financial statements, which are not covered by the Fund's Report of Independent Registered Public Accounting Firm, are available on the SEC's website or upon request. |
(c) Investment made with cash collateral received from securities on loan. |
(d) Security or a portion of the security is on loan at period end. |
(e) Restricted securities - Investment in securities not registered under the Securities Act of 1933 (excluding 144A issues). At the end of the period, the value of restricted securities (excluding 144A issues) amounted to $7,654,720 or 0.6% of net assets. |
(f) Security exempt from registration under Rule 144A of the Securities Act of 1933. These securities may be resold in transactions exempt from registration, normally to qualified institutional buyers. At the end of the period, the value of these securities amounted to $63,222,638 or 4.7% of net assets. |
Additional information on each restricted holding is as follows: |
Security | Acquisition Date | Acquisition Cost |
China Internet Plus Holdings Ltd. (formerly Meituan Corp. Series D) | 1/26/15 | $ 6,268,244 |
Affiliated Central Funds |
Information regarding fiscal year to date income earned by the Fund from investments in Fidelity Central Funds is as follows: |
Fund | Income earned |
Fidelity Cash Central Fund | $ 41,819 |
Fidelity Securities Lending Cash Central Fund | 1,591,746 |
Total | $ 1,633,565 |
Other Affiliated Issuers |
An affiliated company is a company in which the Fund has ownership of at least 5% of the voting securities. Fiscal year to date transactions with companies which are or were affiliates are as follows: |
Affiliate | Value,
beginning of
period | Purchases | Sales
Proceeds | Dividend
Income | Value,
end of
period |
Jintex Corp. Ltd. | $ 4,548,561 | $ - | $ 3,438,888 | $ 67,797 | $ - |
Perfect Shape (PRC) Holdings Ltd. | 11,817,466 | - | 11,514,825 | 618,242 | - |
Total | $ 16,366,027 | $ - | $ 14,953,713 | $ 686,039 | $ - |
Other Information |
Categorizations in the Schedule of Investments are based on country or territory of incorporation. |
The following is a summary of the inputs used, as of October 31, 2015, involving the Fund's assets and liabilities carried at fair value. The inputs or methodology used for valuing securities may not be an indication of the risk associated with investing in those securities. For more information on valuation inputs, and their aggregation into the levels used in the tables below, please refer to the Investment Valuation section in the accompanying Notes to Financial Statements. |
Valuation Inputs at Reporting Date: |
Description | Total | Level 1 | Level 2 | Level 3 |
Investments in Securities: | | | | |
Equities: | | | | |
Consumer Discretionary | $ 193,563,075 | $ 63,516,666 | $ 117,672,653 | $ 12,373,756 |
Consumer Staples | 26,214,211 | - | 26,214,211 | - |
Energy | 21,319,684 | - | 21,319,684 | - |
Financials | 508,424,350 | - | 508,424,350 | - |
Health Care | 73,469,362 | 8,944,229 | 50,155,691 | 14,369,442 |
Industrials | 173,925,939 | 7,485,862 | 150,542,268 | 15,897,809 |
Information Technology | 188,484,404 | 62,216,459 | 126,267,945 | - |
Materials | 89,785,499 | - | 75,345,478 | 14,440,021 |
Telecommunication Services | 31,702,896 | - | 31,702,896 | - |
Utilities | 17,460,148 | - | 17,460,148 | - |
Money Market Funds | 94,220,653 | 94,220,653 | - | - |
Total Investments in Securities: | $ 1,418,570,221 | $ 236,383,869 | $ 1,125,105,324 | $ 57,081,028 |
Valuation Inputs at Reporting Date: |
The following is a reconciliation of Investments in Securities for which Level 3 inputs were used in determining value: |
Investments in Securities: | |
Equities - Health Care | |
Beginning Balance | $ - |
Net Realized Gain (Loss) on Investment Securities | (1,817,855) |
Net Unrealized Gain (Loss) on Investment Securities | (5,958,733) |
Cost of Purchases | 25,544,803 |
Proceeds of Sales | (3,398,773) |
Amortization/Accretion | - |
Transfers into Level 3 | - |
Transfers out of Level 3 | - |
Ending Balance | $ 14,369,442 |
The change in unrealized gain (loss) for the period attributable to Level 3 securities held at October 31, 2015 | $ (5,958,733) |
Investments in Securities: - continued | |
Equities - Industrials | |
Beginning Balance | $ 28,267,179 |
Net Realized Gain (Loss) on Investment Securities | 26,158,350 |
Net Unrealized Gain (Loss) on Investment Securities | (2,283,451) |
Cost of Purchases | - |
Proceeds of Sales | (56,940,777) |
Amortization/Accretion | - |
Transfers into Level 3 | 20,696,508 |
Transfers out of Level 3 | - |
Ending Balance | $ 15,897,809 |
The change in unrealized gain (loss) for the period attributable to Level 3 securities held at October 31, 2015 | $ 106,019 |
Equities - Materials | |
Beginning Balance | $ - |
Net Realized Gain (Loss) on Investment Securities | 756,975 |
Net Unrealized Gain (Loss) on Investment Securities | 8,418,482 |
Cost of Purchases | 4,180,368 |
Proceeds of Sales | (11,841,958) |
Amortization/Accretion | - |
Transfers into Level 3 | 12,926,154 |
Transfers out of Level 3 | - |
Ending Balance | $ 14,440,021 |
The change in unrealized gain (loss) for the period attributable to Level 3 securities held at October 31, 2015 | $ 8,418,482 |
Other Investments in Securities | |
Beginning Balance | $ - |
Net Realized Gain (Loss) on Investment Securities | - |
Net Unrealized Gain (Loss) on Investment Securities | 1,098,419 |
Cost of Purchases | 11,275,337 |
Proceeds of Sales | - |
Amortization/Accretion | - |
Transfers into Level 3 | - |
Transfers out of Level 3 | - |
Ending Balance | $ 12,373,756 |
The change in unrealized gain (loss) for the period attributable to Level 3 securities held at October 31, 2015 | $ 1,098,419 |
The information used in the above reconciliations represents fiscal year to date activity for any Investments in Securities identified as using Level 3 inputs at either the beginning or the end of the current fiscal period. Transfers into Level 3 were attributable to a lack of observable market data resulting from decreases in market activity, decreases in liquidity, security restructurings or corporate actions. Transfers out of Level 3 were attributable to observable market data becoming available for those securities. Transfers in or out of Level 3 represent the beginning value of any Security or Instrument where a change in the pricing level occurred from the beginning to the end of the period. The cost of purchases and the proceeds of sales may include securities received or delivered through corporate actions or exchanges. Realized and unrealized gains (losses) disclosed in the reconciliations are included in Net Gain (Loss) on the Fund's Statement of Operations. |
See accompanying notes which are an integral part of the financial statements.
Annual Report
Fidelity China Region Fund
Statement of Assets and Liabilities
| | October 31, 2015 |
| | |
Assets | | |
Investment in securities, at value (including securities loaned of $71,336,273) - See accompanying schedule: Unaffiliated issuers (cost $1,412,323,751) | $ 1,324,349,568 | |
Fidelity Central Funds (cost $94,220,653) | 94,220,653 | |
Total Investments (cost $1,506,544,404) | | $ 1,418,570,221 |
Foreign currency held at value (cost $10,322) | | 10,322 |
Receivable for investments sold | | 31,588,752 |
Receivable for fund shares sold | | 744,097 |
Distributions receivable from Fidelity Central Funds | | 146,630 |
Prepaid expenses | | 4,421 |
Other receivables | | 64,001 |
Total assets | | 1,451,128,444 |
| | |
Liabilities | | |
Payable to custodian bank | $ 614,622 | |
Payable for investments purchased | 29,848,266 | |
Payable for fund shares redeemed | 1,720,602 | |
Accrued management fee | 778,922 | |
Distribution and service plan fees payable | 21,873 | |
Other affiliated payables | 279,048 | |
Other payables and accrued expenses | 121,214 | |
Collateral on securities loaned, at value | 74,180,545 | |
Total liabilities | | 107,565,092 |
| | |
Net Assets | | $ 1,343,563,352 |
Net Assets consist of: | | |
Paid in capital | | $ 1,260,547,395 |
Undistributed net investment income | | 15,009,760 |
Accumulated undistributed net realized gain (loss) on investments and foreign currency transactions | | 155,980,478 |
Net unrealized appreciation (depreciation) on investments and assets and liabilities in foreign currencies | | (87,974,281) |
Net Assets | | $ 1,343,563,352 |
Statement of Assets and Liabilities - continued
| | October 31, 2015 |
| | |
Calculation of Maximum Offering Price | | |
Class A:
Net Asset Value and redemption price per share ($32,761,115 ÷ 1,116,422 shares) | | $ 29.34 |
| | |
Maximum offering price per share (100/94.25 of $29.34) | | $ 31.13 |
Class T:
Net Asset Value and redemption price per share ($6,409,433 ÷ 219,622 shares) | | $ 29.18 |
| | |
Maximum offering price per share (100/96.50 of $29.18) | | $ 30.24 |
Class B:
Net Asset Value and offering price per share ($803,297 ÷ 27,731 shares)A | | $ 28.97 |
| | |
Class C:
Net Asset Value and offering price per share ($14,354,928 ÷ 500,466 shares)A | | $ 28.68 |
| | |
China Region:
Net Asset Value, offering price and redemption price per share ($1,262,273,952 ÷ 42,556,989 shares) | | $ 29.66 |
| | |
Class I:
Net Asset Value, offering price and redemption price per share ($26,960,627 ÷ 913,526 shares) | | $ 29.51 |
A Redemption price per share is equal to net asset value less any applicable contingent deferred sales charge.
See accompanying notes which are an integral part of the financial statements.
Annual Report
Statement of Operations
| Year ended October 31, 2015 |
Investment Income | | |
Dividends | | $ 33,758,610 |
Special dividends | | 6,256,295 |
Interest | | 52 |
Income from Fidelity Central Funds | | 1,633,565 |
Income before foreign taxes withheld | | 41,648,522 |
Less foreign taxes withheld | | (2,809,673) |
Total income | | 38,838,849 |
| | |
Expenses | | |
Management fee | $ 10,781,575 | |
Transfer agent fees | 3,034,252 | |
Distribution and service plan fees | 263,655 | |
Accounting and security lending fees | 701,186 | |
Custodian fees and expenses | 496,967 | |
Independent trustees' compensation | 6,577 | |
Registration fees | 169,544 | |
Audit | 76,554 | |
Legal | 3,876 | |
Interest | 8,766 | |
Miscellaneous | 11,466 | |
Total expenses before reductions | 15,554,418 | |
Expense reductions | (386,498) | 15,167,920 |
Net investment income (loss) | | 23,670,929 |
Realized and Unrealized Gain (Loss) | | |
Net realized gain (loss) on: | | |
Investment securities: | | |
Unaffiliated issuers (net of foreign taxes of $22,185) | 238,768,578 | |
Other affiliated issuers | (1,777,152) | |
Foreign currency transactions | (1,517,412) | |
Total net realized gain (loss) | | 235,474,014 |
Change in net unrealized appreciation (depreciation) on: Investment securities | (344,544,479) | |
Assets and liabilities in foreign currencies | 3,269 | |
Total change in net unrealized appreciation (depreciation) | | (344,541,210) |
Net gain (loss) | | (109,067,196) |
Net increase (decrease) in net assets resulting from operations | | $ (85,396,267) |
Statement of Changes in Net Assets
| Year ended
October 31,
2015 | Year ended
October 31,
2014 |
Increase (Decrease) in Net Assets | | |
Operations | | |
Net investment income (loss) | $ 23,670,929 | $ 13,925,917 |
Net realized gain (loss) | 235,474,014 | 191,786,909 |
Change in net unrealized appreciation (depreciation) | (344,541,210) | (115,260,428) |
Net increase (decrease) in net assets resulting from operations | (85,396,267) | 90,452,398 |
Distributions to shareholders from net investment income | (13,114,934) | (15,459,434) |
Distributions to shareholders from net realized gain | (172,413,722) | (136,131,549) |
Total distributions | (185,528,656) | (151,590,983) |
Share transactions - net increase (decrease) | 200,238,928 | 1,574,280 |
Redemption fees | 2,391,591 | 349,352 |
Total increase (decrease) in net assets | (68,294,404) | (59,214,953) |
| | |
Net Assets | | |
Beginning of period | 1,411,857,756 | 1,471,072,709 |
End of period (including undistributed net investment income of $15,009,760 and undistributed net investment income of $12,102,115, respectively) | $ 1,343,563,352 | $ 1,411,857,756 |
See accompanying notes which are an integral part of the financial statements.
Annual Report
Financial Highlights - Fidelity China Region Fund Class A
Years ended October 31, | 2015 | 2014 | 2013 | 2012 | 2011 |
Selected Per-Share Data | | | | | |
Net asset value, beginning of period | $ 34.18 | $ 35.56 | $ 28.53 | $ 27.28 | $ 31.61 |
Income from Investment Operations | | | | | |
Net investment income (loss) C | .40F | .21 | .30 | .36 | .33 |
Net realized and unrealized gain (loss) | (.83) | 2.01 I | 7.06 | 1.42 | (4.33) |
Total from investment operations | (.43) | 2.22 | 7.36 | 1.78 | (4.00) |
Distributions from net investment income | (.22) | (.30) | (.34) | (.19) | (.31) |
Distributions from net realized gain | (4.24) | (3.31) | - | (.34) | (.03) |
Total distributions | (4.46) | (3.61) | (.34) | (.53) | (.34) |
Redemption fees added to paid in capitalC | .05 | .01 | .01 | -H | .01 |
Net asset value, end of period | $ 29.34 | $ 34.18 | $ 35.56 | $ 28.53 | $ 27.28 |
Total ReturnA, B | (1.45)% | 6.45% I | 26.07% | 6.70% | (12.79)% |
Ratios to Average Net AssetsD, G | | | | | |
Expenses before reductions | 1.28% | 1.35% | 1.35% | 1.36% | 1.37% |
Expenses net of fee waivers, if any | 1.28% | 1.35% | 1.35% | 1.36% | 1.37% |
Expenses net of all reductions | 1.26% | 1.35% | 1.31% | 1.29% | 1.31% |
Net investment income (loss) | 1.26%F | .64% | .94% | 1.35% | 1.07% |
Supplemental Data | | | | | |
Net assets, end of period (000 omitted) | $ 32,761 | $ 21,728 | $ 20,623 | $ 13,539 | $ 14,808 |
Portfolio turnover rateE | 151% | 87% | 92% | 107% | 87% |
ATotal returns would have been lower if certain expenses had not been reduced during the applicable periods shown. BTotal returns do not include the effect of the sales charges. CCalculated based on average shares outstanding during the period. DFees and expenses of any underlying Fidelity Central Funds are not included in the Fund's expense ratio. The Fund indirectly bears its proportionate share of the expenses of any underlying Fidelity Central Funds. EAmount does not include the portfolio activity of any underlying Fidelity Central Funds. FInvestment income per share reflects a large, non-recurring dividend which amounted to $.13 per share. Excluding this non-recurring dividend, the ratio of net investment income (loss) to average net assets would have been .85%. GExpense ratios reflect operating expenses of the class. Expenses before reductions do not reflect amounts reimbursed by the investment adviser or reductions from brokerage service arrangements or reductions from other expense offset arrangements and do not represent the amount paid by the class during periods when reimbursements or reductions occur. Expenses net of fee waivers reflect expenses after reimbursement by the investment adviser but prior to reductions from brokerage service arrangements or other expense offset arrangements. Expenses net of all reductions represent the net expenses paid by the class. HAmount represents less than $.005 per share. IAmount includes a reimbursement from the investment adviser for an operational error which amounted to $.01 per share. Excluding this reimbursement, the total return would have been 6.42%. |
Financial Highlights - Fidelity China Region Fund Class T
Years ended October 31, | 2015 | 2014 | 2013 | 2012 | 2011 |
Selected Per-Share Data | | | | | |
Net asset value, beginning of period | $ 34.02 | $ 35.40 | $ 28.40 | $ 27.13 | $ 31.48 |
Income from Investment Operations | | | | | |
Net investment income (loss) C | .30F | .12 | .21 | .29 | .25 |
Net realized and unrealized gain (loss) | (.83) | 1.99 J | 7.04 | 1.40 | (4.32) |
Total from investment operations | (.53) | 2.11 | 7.25 | 1.69 | (4.07) |
Distributions from net investment income | (.12) | (.19) | (.26) | (.08) | (.27) |
Distributions from net realized gain | (4.24) | (3.31) | - | (.34) | (.03) |
Total distributions | (4.36) | (3.50) | (.26) | (.42) | (.29) I |
Redemption fees added to paid in capitalC | .05 | .01 | .01 | -H | .01 |
Net asset value, end of period | $ 29.18 | $ 34.02 | $ 35.40 | $ 28.40 | $ 27.13 |
Total ReturnA, B | (1.79)% | 6.15% J | 25.74% | 6.38% | (13.04)% |
Ratios to Average Net AssetsD, G | | | | | |
Expenses before reductions | 1.62% | 1.65% | 1.64% | 1.64% | 1.63% |
Expenses net of fee waivers, if any | 1.62% | 1.65% | 1.64% | 1.64% | 1.63% |
Expenses net of all reductions | 1.60% | 1.65% | 1.60% | 1.57% | 1.57% |
Net investment income (loss) | .92%F | .35% | .65% | 1.06% | .81% |
Supplemental Data | | | | | |
Net assets, end of period (000 omitted) | $ 6,409 | $ 6,305 | $ 5,965 | $ 4,349 | $ 5,281 |
Portfolio turnover rateE | 151% | 87% | 92% | 107% | 87% |
ATotal returns would have been lower if certain expenses had not been reduced during the applicable periods shown. BTotal returns do not include the effect of the sales charges. CCalculated based on average shares outstanding during the period. DFees and expenses of any underlying Fidelity Central Funds are not included in the Fund's expense ratio. The Fund indirectly bears its proportionate share of the expenses of any underlying Fidelity Central Funds. EAmount does not include the portfolio activity of any underlying Fidelity Central Funds. FInvestment income per share reflects a large, non-recurring dividend which amounted to $.13 per share. Excluding this non-recurring dividend, the ratio of net investment income (loss) to average net assets would have been .51%. GExpense ratios reflect operating expenses of the class. Expenses before reductions do not reflect amounts reimbursed by the investment adviser or reductions from brokerage service arrangements or reductions from other expense offset arrangements and do not represent the amount paid by the class during periods when reimbursements or reductions occur. Expenses net of fee waivers reflect expenses after reimbursement by the investment adviser but prior to reductions from brokerage service arrangements or other expense offset arrangements. Expenses net of all reductions represent the net expenses paid by the class. HAmount represents less than $.005 per share. ITotal distributions of $.29 per share is comprised of distributions from net investment income of $.268 and distributions from net realized gain of $.025 per share. JAmount includes a reimbursement from the investment adviser for an operational error which amounted to $.01 per share. Excluding this reimbursement, the total return would have been 6.12%. |
See accompanying notes which are an integral part of the financial statements.
Annual Report
Financial Highlights - Fidelity China Region Fund Class B
Years ended October 31, | 2015 | 2014 | 2013 | 2012 | 2011 |
Selected Per-Share Data | | | | | |
Net asset value, beginning of period | $ 33.79 | $ 35.12 | $ 28.16 | $ 26.94 | $ 31.23 |
Income from Investment Operations | | | | | |
Net investment income (loss) C | .14F | (.04) | .06 | .16 | .10 |
Net realized and unrealized gain (loss) | (.80) | 1.99 I | 6.99 | 1.40 | (4.29) |
Total from investment operations | (.66) | 1.95 | 7.05 | 1.56 | (4.19) |
Distributions from net investment income | - | - | (.10) | - | (.08) |
Distributions from net realized gain | (4.21) | (3.29) | - | (.34) | (.03) |
Total distributions | (4.21) | (3.29) | (.10) | (.34) | (.11) |
Redemption fees added to paid in capitalC | .05 | .01 | .01 | -H | .01 |
Net asset value, end of period | $ 28.97 | $ 33.79 | $ 35.12 | $ 28.16 | $ 26.94 |
Total ReturnA, B | (2.23)% | 5.68% I | 25.12% | 5.90% | (13.45)% |
Ratios to Average Net AssetsD, G | | | | | |
Expenses before reductions | 2.10% | 2.11% | 2.10% | 2.11% | 2.12% |
Expenses net of fee waivers, if any | 2.10% | 2.11% | 2.10% | 2.11% | 2.12% |
Expenses net of all reductions | 2.07% | 2.11% | 2.07% | 2.04% | 2.06% |
Net investment income (loss) | .44%F | (.12)% | .19% | .59% | .32% |
Supplemental Data | | | | | |
Net assets, end of period (000 omitted) | $ 803 | $ 1,215 | $ 1,494 | $ 1,533 | $ 1,801 |
Portfolio turnover rateE | 151% | 87% | 92% | 107% | 87% |
ATotal returns would have been lower if certain expenses had not been reduced during the applicable periods shown. BTotal returns do not include the effect of the contingent deferred sales charge. CCalculated based on average shares outstanding during the period. DFees and expenses of any underlying Fidelity Central Funds are not included in the Fund's expense ratio. The Fund indirectly bears its proportionate share of the expenses of any underlying Fidelity Central Funds. EAmount does not include the portfolio activity of any underlying Fidelity Central Funds. FInvestment income per share reflects a large, non-recurring dividend which amounted to $.13 per share. Excluding this non-recurring dividend, the ratio of net investment income (loss) to average net assets would have been .04%. GExpense ratios reflect operating expenses of the class. Expenses before reductions do not reflect amounts reimbursed by the investment adviser or reductions from brokerage service arrangements or reductions from other expense offset arrangements and do not represent the amount paid by the class during periods when reimbursements or reductions occur. Expenses net of fee waivers reflect expenses after reimbursement by the investment adviser but prior to reductions from brokerage service arrangements or other expense offset arrangements. Expenses net of all reductions represent the net expenses paid by the class. HAmount represents less than $.005 per share. IAmount includes a reimbursement from the investment adviser for an operational error which amounted to $.01 per share. Excluding this reimbursement, the total return would have been 5.65%. |
Financial Highlights - Fidelity China Region Fund Class C
Years ended October 31, | 2015 | 2014 | 2013 | 2012 | 2011 |
Selected Per-Share Data | | | | | |
Net asset value, beginning of period | $ 33.56 | $ 34.99 | $ 28.07 | $ 26.86 | $ 31.19 |
Income from Investment Operations | | | | | |
Net investment income (loss) C | .15F | (.02) | .06 | .16 | .10 |
Net realized and unrealized gain (loss) | (.80) | 1.97 I | 6.97 | 1.39 | (4.28) |
Total from investment operations | (.65) | 1.95 | 7.03 | 1.55 | (4.18) |
Distributions from net investment income | (.04) | (.08) | (.12) | - | (.13) |
Distributions from net realized gain | (4.24) | (3.31) | - | (.34) | (.03) |
Total distributions | (4.28) | (3.39) | (.12) | (.34) | (.16) |
Redemption fees added to paid in capitalC | .05 | .01 | .01 | -H | .01 |
Net asset value, end of period | $ 28.68 | $ 33.56 | $ 34.99 | $ 28.07 | $ 26.86 |
Total ReturnA, B | (2.21)% | 5.71% I | 25.14% | 5.88% | (13.46)% |
Ratios to Average Net AssetsD, G | | | | | |
Expenses before reductions | 2.05% | 2.07% | 2.10% | 2.11% | 2.12% |
Expenses net of fee waivers, if any | 2.05% | 2.07% | 2.10% | 2.11% | 2.12% |
Expenses net of all reductions | 2.02% | 2.07% | 2.07% | 2.04% | 2.06% |
Net investment income (loss) | .49%F | (.07)% | .19% | .59% | .32% |
Supplemental Data | | | | | |
Net assets, end of period (000 omitted) | $ 14,355 | $ 10,445 | $ 6,957 | $ 4,515 | $ 5,230 |
Portfolio turnover rateE | 151% | 87% | 92% | 107% | 87% |
ATotal returns would have been lower if certain expenses had not been reduced during the applicable periods shown. BTotal returns do not include the effect of the contingent deferred sales charge. CCalculated based on average shares outstanding during the period. DFees and expenses of any underlying Fidelity Central Funds are not included in the Fund's expense ratio. The Fund indirectly bears its proportionate share of the expenses of any underlying Fidelity Central Funds. EAmount does not include the portfolio activity of any underlying Fidelity Central Funds. FInvestment income per share reflects a large, non-recurring dividend which amounted to $.13 per share. Excluding this non-recurring dividend, the ratio of net investment income (loss) to average net assets would have been .09%. GExpense ratios reflect operating expenses of the class. Expenses before reductions do not reflect amounts reimbursed by the investment adviser or reductions from brokerage service arrangements or reductions from other expense offset arrangements and do not represent the amount paid by the class during periods when reimbursements or reductions occur. Expenses net of fee waivers reflect expenses after reimbursement by the investment adviser but prior to reductions from brokerage service arrangements or other expense offset arrangements. Expenses net of all reductions represent the net expenses paid by the class. HAmount represents less than $.005 per share. IAmount includes a reimbursement from the investment adviser for an operational error which amounted to $.01 per share. Excluding this reimbursement, the total return would have been 5.68%. |
See accompanying notes which are an integral part of the financial statements.
Annual Report
Financial Highlights - Fidelity China Region Fund
Years ended October 31, | 2015 | 2014 | 2013 | 2012 | 2011 |
Selected Per-Share Data | | | | | |
Net asset value, beginning of period | $ 34.51 | $ 35.83 | $ 28.73 | $ 27.49 | $ 31.81 |
Income from Investment Operations | | | | | |
Net investment income (loss) B | .51E | .33 | .41 | .45 | .44 |
Net realized and unrealized gain (loss) | (.84) | 2.03 I | 7.11 | 1.42 | (4.37) |
Total from investment operations | (.33) | 2.36 | 7.52 | 1.87 | (3.93) |
Distributions from net investment income | (.33) | (.38) | (.43) | (.29) | (.38) |
Distributions from net realized gain | (4.24) | (3.31) | - | (.34) | (.03) |
Total distributions | (4.57) | (3.69) | (.43) | (.63) | (.40) H |
Redemption fees added to paid in capitalB | .05 | .01 | .01 | -G | .01 |
Net asset value, end of period | $ 29.66 | $ 34.51 | $ 35.83 | $ 28.73 | $ 27.49 |
Total ReturnA | (1.14)% | 6.83% I | 26.51% | 7.01% | (12.52)% |
Ratios to Average Net AssetsC, F | | | | | |
Expenses before reductions | .99% | 1.01% | 1.02% | 1.04% | 1.04% |
Expenses net of fee waivers, if any | .98% | 1.01% | 1.02% | 1.04% | 1.04% |
Expenses net of all reductions | .96% | 1.01% | .98% | .98% | .98% |
Net investment income (loss) | 1.55%E | .99% | 1.27% | 1.66% | 1.40% |
Supplemental Data | | | | | |
Net assets, end of period (000 omitted) | $1,262,274 | $ 1,352,761 | $ 1,425,828 | $ 1,265,488 | $ 1,515,084 |
Portfolio turnover rateD | 151% | 87% | 92% | 107% | 87% |
ATotal returns would have been lower if certain expenses had not been reduced during the applicable periods shown. BCalculated based on average shares outstanding during the period. CFees and expenses of any underlying Fidelity Central Funds are not included in the Fund's expense ratio. The Fund indirectly bears its proportionate share of the expenses of any underlying Fidelity Central Funds. DAmount does not include the portfolio activity of any underlying Fidelity Central Funds. EInvestment income per share reflects a large, non-recurring dividend which amounted to $.13 per share. Excluding this non-recurring dividend, the ratio of net investment income (loss) to average net assets would have been 1.15%. FExpense ratios reflect operating expenses of the class. Expenses before reductions do not reflect amounts reimbursed by the investment adviser or reductions from brokerage service arrangements or reductions from other expense offset arrangements and do not represent the amount paid by the class during periods when reimbursements or reductions occur. Expenses net of fee waivers reflect expenses after reimbursement by the investment adviser but prior to reductions from brokerage service arrangements or other expense offset arrangements. Expenses net of all reductions represent the net expenses paid by the class. GAmount represents less than $.005 per share. HTotal distributions of $.40 per share is comprised of distributions from net investment income of $.376 and distributions from net realized gain of $.025 per share. IAmount includes a reimbursement from the investment adviser for an operational error which amounted to $.01 per share. Excluding this reimbursement, the total return would have been 6.80%. |
Financial Highlights - Fidelity China Region Fund Class I
Years ended October 31, | 2015 | 2014 | 2013 | 2012 | 2011 |
Selected Per-Share Data | | | | | |
Net asset value, beginning of period | $ 34.39 | $ 35.75 | $ 28.68 | $ 27.46 | $ 31.79 |
Income from Investment Operations | | | | | |
Net investment income (loss) B | .51E | .34 | .42 | .45 | .43 |
Net realized and unrealized gain (loss) | (.84) | 2.02 I | 7.10 | 1.42 | (4.37) |
Total from investment operations | (.33) | 2.36 | 7.52 | 1.87 | (3.94) |
Distributions from net investment income | (.36) | (.43) | (.46) | (.31) | (.37) |
Distributions from net realized gain | (4.24) | (3.31) | - | (.34) | (.03) |
Total distributions | (4.60) | (3.73) H | (.46) | (.65) | (.40) |
Redemption fees added to paid in capitalB | .05 | .01 | .01 | -G | .01 |
Net asset value, end of period | $ 29.51 | $ 34.39 | $ 35.75 | $ 28.68 | $ 27.46 |
Total ReturnA | (1.14)% | 6.87% I | 26.58% | 7.02% | (12.56)% |
Ratios to Average Net AssetsC, F | | | | | |
Expenses before reductions | .97% | .98% | .97% | 1.04% | 1.06% |
Expenses net of fee waivers, if any | .97% | .98% | .97% | 1.04% | 1.06% |
Expenses net of all reductions | .95% | .98% | .93% | .98% | 1.01% |
Net investment income (loss) | 1.57%E | 1.01% | 1.32% | 1.66% | 1.38% |
Supplemental Data | | | | | |
Net assets, end of period (000 omitted) | $ 26,961 | $ 19,404 | $ 10,206 | $ 1,958 | $ 2,034 |
Portfolio turnover rateD | 151% | 87% | 92% | 107% | 87% |
ATotal returns would have been lower if certain expenses had not been reduced during the applicable periods shown. BCalculated based on average shares outstanding during the period. CFees and expenses of any underlying Fidelity Central Funds are not included in the Fund's expense ratio. The Fund indirectly bears its proportionate share of the expenses of any underlying Fidelity Central Funds. DAmount does not include the portfolio activity of any underlying Fidelity Central Funds. EInvestment income per share reflects a large, non-recurring dividend which amounted to $.13 per share. Excluding this non-recurring dividend, the ratio of net investment income (loss) to average net assets would have been 1.16%. FExpense ratios reflect operating expenses of the class. Expenses before reductions do not reflect amounts reimbursed by the investment adviser or reductions from brokerage service arrangements or reductions from other expense offset arrangements and do not represent the amount paid by the class during periods when reimbursements or reductions occur. Expenses net of fee waivers reflect expenses after reimbursement by the investment adviser but prior to reductions from brokerage service arrangements or other expense offset arrangements. Expenses net of all reductions represent the net expenses paid by the class. GAmount represents less than $.005 per share. HTotal distributions of $3.73 per share is comprised of distributions from net investment income of $.425 and distributions from net realized gain of $3.306 per share. IAmount includes a reimbursement from the investment adviser for an operational error which amounted to $.01 per share. Excluding this reimbursement, the total return would have been 6.84%. |
See accompanying notes which are an integral part of the financial statements.
Annual Report
For the period ended October 31, 2015
1. Organization.
Fidelity China Region Fund (the Fund) is a fund of Fidelity Investment Trust (the Trust) and is authorized to issue an unlimited number of shares. The Trust is registered under the Investment Company Act of 1940, as amended (the 1940 Act), as an open-end management investment company organized as a Massachusetts business trust. The Fund offers Class A, Class T, Class C, China Region and Class I (formerly Institutional Class) shares, each of which, along with Class B shares, has equal rights as to assets and voting privileges. Class B shares are closed to new accounts and additional purchases, except for exchanges and reinvestments. Each class has exclusive voting rights with respect to matters that affect that class. Class B shares will automatically convert to Class A shares after a holding period of seven years from the initial date of purchase. The Fund's investments in emerging markets can be subject to social, economic, regulatory, and political uncertainties and can be extremely volatile.
2. Investments in Fidelity Central Funds.
The Fund invests in Fidelity Central Funds, which are open-end investment companies generally available only to other investment companies and accounts managed by the investment adviser and its affiliates. The Fund's Schedule of Investments lists each of the Fidelity Central Funds held as of period end, if any, as an investment of the Fund, but does not include the underlying holdings of each Fidelity Central Fund. As an Investing Fund, the Fund indirectly bears its proportionate share of the expenses of the underlying Fidelity Central Funds.
The Money Market Central Funds seek preservation of capital and current income and are managed by Fidelity Investments Money Management, Inc. (FIMM), an affiliate of the investment adviser. Annualized expenses of the Money Market Central Funds as of their most recent shareholder report date are less than .005%.
A complete unaudited list of holdings for each Fidelity Central Fund is available upon request or at the Securities and Exchange Commission (the SEC) website at www.sec.gov. In addition, the financial statements of the Fidelity Central Funds, which are not covered by the Fund's Report of Independent Registered Public Accounting Firm, are available on the SEC website or upon request.
3. Significant Accounting Policies.
The financial statements have been prepared in conformity with accounting principles generally accepted in the United States of America (GAAP), which require management to make certain estimates and assumptions at the date of the financial statements. Actual results could differ from those estimates. Subsequent events, if any, through the date that the financial statements were issued have been evaluated in the preparation of the financial statements. The following summarizes the significant accounting policies of the Fund:
Investment Valuation. Investments are valued as of 4:00 p.m. Eastern time on the last calendar day of the period. The Board of Trustees (the Board) has delegated the day to day responsibility for the valuation of the Fund's investments to the Fidelity Management & Research Company (FMR) Fair Value Committee (the Committee). In accordance with valuation policies and procedures approved by the Board, the Fund attempts to obtain prices from one or more third party pricing vendors or brokers to value its investments. When current market prices, quotations or currency exchange rates are not readily available or reliable, investments will be fair valued in good faith by the Committee, in accordance with procedures adopted by the Board. Factors used in determining fair value vary by investment type and may include market or investment specific events. The frequency with which these procedures are used cannot be predicted and they may be utilized to a significant extent. The Committee oversees the Fund's valuation policies and procedures and reports to the Board on the Committee's activities and fair value determinations. The Board monitors the appropriateness of the procedures used in valuing the Fund's investments and ratifies the fair value determinations of the Committee.
The Fund categorizes the inputs to valuation techniques used to value its investments into a disclosure hierarchy consisting of three levels as shown below:
Level 1 - quoted prices in active markets for identical investments
Level 2 - other significant observable inputs (including quoted prices for similar investments, interest rates, prepayment speeds, etc.)
Level 3 - unobservable inputs (including the Fund's own assumptions based on the best information available)
Valuation techniques used to value the Fund's investments by major category are as follows:
Equity securities, including restricted securities, for which market quotations are readily available, are valued at the last reported sale price or official closing price as reported by a third party pricing vendor on the primary market or exchange on which they are traded and are categorized as Level 1 in the hierarchy. In the event there were no sales during the day or closing prices are not available, securities are valued at the last quoted bid price or may be valued using the last available price and are generally categorized as Level 2 in the hierarchy. For foreign equity securities, when market or security specific events arise, comparisons to the valuation of American Depositary Receipts (ADRs), futures contracts, Exchange-Traded Funds (ETFs) and certain indexes as well as quoted prices for similar securities may be used and would be categorized as Level 2 in the hierarchy. Utilizing
Annual Report
Notes to Financial Statements - continued
3. Significant Accounting Policies - continued
Investment Valuation - continued
these techniques may result in transfers between Level 1 and Level 2. For equity securities, including restricted securities, where observable inputs are limited, assumptions about market activity and risk are used and these securities may be categorized as Level 3 in the hierarchy. Equity securities, including restricted securities, for which observable inputs are not available are valued using alternate valuation approaches, including the market approach and the income approach and are categorized as Level 3 in the hierarchy. The market approach generally consists of using comparable market transactions while the income approach generally consists of using the net present value of estimated future cash flows, adjusted as appropriate for liquidity, credit, market and/or other risk factors.
Investments in open-end mutual funds, including the Fidelity Central Funds, are valued at their closing net asset value (NAV) each business day and are categorized as Level 1 in the hierarchy.
The following provides information on Level 3 securities held by the Fund that were valued at period end based on unobservable inputs. These amounts exclude valuations provided by a broker.
Asset Type | Fair Value at
10/31/15 | Valuation
Technique(s) | Unobservable Input | Amount or Range/
Weighted Average | Impact to Valuation
from an Increase
in InputA |
Equities | $ 57,081,027 | Adjusted transaction price | Proxy movement | 0.0% - 0.1% / 0.1% | Increase |
| | Last transaction price | Transaction price | $ 5.49 | Increase |
| | Proposed transaction price | Transaction price | $ 4.97 | Increase |
A Represents the expected directional change in the fair value of the Level 3 investments that would result from an increase in the corresponding input. A decrease to the unobservable input would have the opposite effect. Significant changes in these inputs could result in significantly higher or lower fair value measurements.
Changes in valuation techniques may result in transfers in or out of an assigned level within the disclosure hierarchy. The aggregate value of investments by input level as of October 31, 2015, as well as a roll forward of Level 3 investments, is included at the end of the Fund's Schedule of Investments.
Foreign Currency. The Fund may use foreign currency contracts to facilitate transactions in foreign-denominated securities. Gains and losses from these transactions may arise from changes in the value of the foreign currency or if the counterparties do not perform under the contracts' terms.
Foreign-denominated assets, including investment securities, and liabilities are translated into U.S. dollars at the exchange rates at period end. Purchases and sales of investment securities, income and dividends received and expenses denominated in foreign currencies are translated into U.S. dollars at the exchange rate in effect on the transaction date.
The effects of exchange rate fluctuations on investments are included with the net realized and unrealized gain (loss) on investment securities. Other foreign currency transactions resulting in realized and unrealized gain (loss) are disclosed separately.
Investment Transactions and Income. For financial reporting purposes, the Fund's investment holdings and NAV include trades executed through the end of the last business day of the period. The NAV per share for processing shareholder transactions is calculated as of the close of business of the New York Stock Exchange (NYSE), normally 4:00 p.m. Eastern time and includes trades executed through the end of the prior business day. Gains and losses on securities sold are determined on the basis of identified cost. Dividend income is recorded on the ex-dividend date, except for certain dividends from foreign securities where the ex-dividend date may have passed, which are recorded as soon as the Fund is informed of the ex-dividend date. Non-cash dividends included in dividend income, if any, are recorded at the fair market value of the securities received. Income and capital gain distributions from Fidelity Central Funds, if any, are recorded on the ex-dividend date. Large, non-recurring dividends recognized by the Fund are presented separately on the Statement of Operations as "Special Dividends" and the impact of these dividends is presented in the Financial Highlights. Interest income is accrued as earned and includes coupon interest and amortization of premium and accretion of discount on debt securities as applicable. Investment income is recorded net of foreign taxes withheld where recovery of such taxes is uncertain.
Class Allocations and Expenses. Investment income, realized and unrealized capital gains and losses, common expenses of the Fund, and certain fund-level expense reductions, if any, are allocated daily on a pro-rata basis to each class based on the relative net assets of each class to the total net assets of the Fund. Each class differs with respect to transfer agent and distribution and service plan fees incurred. Certain expense reductions may also differ by class. For the reporting period, the allocated portion of income and expenses to each class as a percent of its average net assets may vary
Annual Report
3. Significant Accounting Policies - continued
Class Allocations and Expenses - continued
due to the timing of recording these transactions in relation to fluctuating net assets of the classes. Expenses directly attributable to a fund are charged to that fund. Expenses attributable to more than one fund are allocated among the respective funds on the basis of relative net assets or other appropriate methods. Expense estimates are accrued in the period to which they relate and adjustments are made when actual amounts are known.
Income Tax Information and Distributions to Shareholders. Each year, the Fund intends to qualify as a regulated investment company under Subchapter M of the Internal Revenue Code, including distributing substantially all of its taxable income and realized gains. As a result, no provision for U.S. Federal income taxes is required. As of October 31, 2015, the Fund did not have any unrecognized tax benefits in the financial statements; nor is the Fund aware of any tax positions for which it is reasonably possible that the total amounts of unrecognized tax benefits will significantly change in the next twelve months. The Fund files a U.S. federal tax return, in addition to state and local tax returns as required. The Fund's federal income tax returns are subject to examination by the Internal Revenue Service (IRS) for a period of three fiscal years after they are filed. State and local tax returns may be subject to examination for an additional fiscal year depending on the jurisdiction. Foreign taxes are provided for based on the Fund's understanding of the tax rules and rates that exist in the foreign markets in which it invests. The Fund is subject to a tax imposed on capital gains by certain countries in which it invests.
Distributions are declared and recorded on the ex-dividend date. Income dividends and capital gain distributions are declared separately for each class. Income and capital gain distributions are determined in accordance with income tax regulations, which may differ from GAAP. In addition, the Fund claimed a portion of the payment made to redeeming shareholders as a distribution for income tax purposes.
Capital accounts within the financial statements are adjusted for permanent book-tax differences. These adjustments have no impact on net assets or the results of operations. Capital accounts are not adjusted for temporary book-tax differences which will reverse in a subsequent period.
Book-tax differences are primarily due to foreign currency transactions, certain foreign taxes, passive foreign investment companies (PFIC), deferred trustees compensation and losses deferred due to wash sales.
The federal tax cost of investment securities and unrealized appreciation (depreciation) as of period end were as follows:
Gross unrealized appreciation | $ 101,234,198 |
Gross unrealized depreciation | (193,197,636) |
Net unrealized appreciation (depreciation) on securities | $ (91,963,438) |
Tax Cost | $ 1,510,533,659 |
The tax-based components of distributable earnings as of period end were as follows:
Undistributed ordinary income | $ 15,009,766 |
Undistributed long-term capital gain | $ 159,969,732 |
Net unrealized appreciation (depreciation) on securities and other investments | $ (91,963,536) |
The tax character of distributions paid was as follows:
| October 31, 2015 | October 31, 2014 |
Ordinary Income | $ 14,374,708 | $ 31,270,708 |
Long-term Capital Gains | 171,153,948 | 120,320,275 |
Total | $ 185,528,656 | $ 151,590,983 |
Short-Term Trading (Redemption) Fees. Shares held by investors in the Fund less than 90 days may have been subject to a redemption fee equal to 1.50% of the NAV of shares redeemed. All redemption fees, which reduce the proceeds of the shareholder redemption, are retained by the Fund and accounted for as an addition to paid in capital.
Restricted Securities. The Fund may invest in securities that are subject to legal or contractual restrictions on resale. These securities generally may be resold in transactions exempt from registration or to the public if the securities are registered. Disposal of these securities may involve time-consuming negotiations and expense, and prompt sale at an acceptable price may be difficult. Information regarding restricted securities is included at the end of the Fund's Schedule of Investments.
4. Purchases and Sales of Investments.
Purchases and sales of securities, other than short-term securities, aggregated $2,320,693,042 and $2,245,851,175, respectively.
Annual Report
Notes to Financial Statements - continued
5. Fees and Other Transactions with Affiliates.
Management Fee. Fidelity Management & Research Company (the investment adviser) and its affiliates provide the Fund with investment management related services for which the Fund pays a monthly management fee. The management fee is the sum of an individual fund fee rate that is based on an annual rate of .45% of the Fund's average net assets and an annualized group fee rate that averaged .25% during the period. The group fee rate is based upon the average net assets of all the mutual funds advised by the investment adviser, including any mutual funds previously advised by the investment adviser that are currently advised by Fidelity SelectCo, LLC, an affiliate of the investment adviser. The group fee rate decreases as assets under management increase and increases as assets under management decrease. For the reporting period, the total annual management fee rate was .70% of the Fund's average net assets.
Distribution and Service Plan Fees. In accordance with Rule 12b-1 of the 1940 Act, the Fund has adopted separate Distribution and Service Plans for each class of shares. Certain classes pay Fidelity Distributors Corporation (FDC), an affiliate of the investment adviser, separate Distribution and Service Fees, each of which is based on an annual percentage of each class' average net assets. In addition, FDC may pay financial intermediaries for selling shares of the Fund and providing shareholder support services. For the period, the Distribution and Service Fee rates, total fees and amounts retained by FDC were as follows:
| Distribution
Fee | Service
Fee | Total Fees | Retained
by FDC |
Class A | -% | .25% | $ 79,736 | $ 10,281 |
Class T | .25% | .25% | 35,794 | 168 |
Class B | .75% | .25% | 11,489 | 8,617 |
Class C | .75% | .25% | 136,636 | 61,680 |
| | | $ 263,655 | $ 80,746 |
Sales Load. FDC may receive a front-end sales charge of up to 5.75% for selling Class A shares and 3.50% for selling Class T shares, some of which is paid to financial intermediaries for selling shares of the Fund. Depending on the holding period, FDC may receive contingent deferred sales charges levied on Class A, Class T, Class B, and Class C redemptions. The deferred sales charges range from 5.00% to 1.00% for Class B shares, 1.00% for Class C shares, 1.00% for certain purchases of Class A shares and .25% for certain purchases of Class T shares.
For the period, sales charge amounts retained by FDC were as follows:
| Retained
by FDC |
Class A | $ 52,066 |
Class T | 5,399 |
Class B A | 593 |
Class C A | 11,997 |
| $ 70,055 |
A When Class B and Class C shares are initially sold, FDC pays commissions from its own resources to financial intermediaries through which the sales are made.
Transfer Agent Fees. Fidelity Investments Institutional Operations Company, Inc., (FIIOC), an affiliate of the investment adviser, is the transfer, dividend disbursing and shareholder servicing agent for each class of the Fund. FIIOC receives account fees and asset-based fees that vary according to the account size and type of account of the shareholders of the respective classes of the Fund. FIIOC pays for typesetting, printing and mailing of shareholder reports, except proxy statements.
For the period, transfer agent fees for each class were as follows:
| Amount | % of
Class-Level Average
Net Assets |
Class A | $ 76,868 | .24 |
Class T | 23,452 | .33 |
Class B | 3,439 | .30 |
Class C | 35,649 | .26 |
China Region | 2,845,557 | .19 |
Class I | 49,287 | .18 |
| $ 3,034,252 | |
Accounting and Security Lending Fees. Fidelity Service Company, Inc. (FSC), an affiliate of the investment adviser, maintains the Fund's accounting records. The accounting fee is based on the level of average net assets for each month. Under a separate contract, FSC administers the security lending program. The security lending fee is based on the number and duration of lending transactions.
Annual Report
5. Fees and Other Transactions with Affiliates - continued
Brokerage Commissions. The Fund placed a portion of its portfolio transactions with brokerage firms which are affiliates of the investment adviser. Brokerage commissions are included in net realized gain (loss) and change in net unrealized appreciation (depreciation) in the Statement of Operations. The commissions paid to these affiliated firms were $12,235 for the period.
Interfund Lending Program. Pursuant to an Exemptive Order issued by the SEC, the Fund, along with other registered investment companies having management contracts with FMR or other affiliated entities of FMR, may participate in an interfund lending program. This program provides an alternative credit facility allowing the funds to borrow from, or lend money to, other participating affiliated funds. At period end, there were no interfund loans outstanding. The Fund's activity in this program during the period for which loans were outstanding was as follows:
Borrower or Lender | Average Loan Balance | Weighted Average
Interest Rate | Interest Expense |
Borrower | $ 14,713,842 | .36% | $ 5,540 |
Other. During the period, the investment adviser reimbursed the Fund for certain losses in the amount of $25,050.
6. Committed Line of Credit.
The Fund participates with other funds managed by the investment adviseror an affiliate in a $4.25 billion credit facility (the "line of credit") to be utilized for temporary or emergency purposes to fund shareholder redemptions or for other short-term liquidity purposes. The Fund has agreed to pay commitment fees on its pro-rata portion of the line of credit, which amounted to $2,209 and is reflected in Miscellaneous expenses on the Statement of Operations. During the period, the Fund did not borrow on this line of credit.
7. Security Lending.
The Fund lends portfolio securities through a lending agent from time to time in order to earn additional income. For equity securities, a lending agent is used and may loan securities to certain qualified borrowers, including Fidelity Capital Markets (FCM), a broker-dealer affiliated with the Fund. On the settlement date of the loan, the Fund receives collateral (in the form of U.S. Treasury obligations, letters of credit and/or cash) against the loaned securities and maintains collateral in an amount not less than 100% of the market value of the loaned securities during the period of the loan. The market value of the loaned securities is determined at the close of business of the Fund and any additional required collateral is delivered to the Fund on the next business day. The Fund or borrower may terminate the loan at any time, and if the borrower defaults on its obligation to return the securities loaned because of insolvency or other reasons, the Fund may apply collateral received from the borrower against the obligation. The Fund may experience delays and costs in recovering the securities loaned. Any cash collateral received is invested in the Fidelity Securities Lending Cash Central Fund. The value of loaned securities and cash collateral at period end are disclosed on the Fund's Statement of Assets and Liabilities. The value of securities loaned to FCM at period end was $2,320,290. Security lending income represents the income earned on investing cash collateral, less rebates paid to borrowers and any lending agent fees associated with the loan, plus any premium payments received for lending certain types of securities. Security lending income is presented in the Statement of Operations as a component of income from Fidelity Central Funds, and includes $11,395 from securities loaned to FCM.
8. Bank Borrowings.
The Fund is permitted to have bank borrowings for temporary or emergency purposes to fund shareholder redemptions or for other short-term liquidity requirements. The Fund has established borrowing arrangements with certain banks. The interest rate on the borrowings is the bank's base rate, as revised from time to time. The average loan balance during the period for which loans were outstanding amounted to $30,719,500. The weighted average interest rate was .63%. The interest expense amounted to $3,226 under the bank borrowing program. At period end, there were no bank borrowings outstanding.
9. Expense Reductions.
Commissions paid to certain brokers with whom the investment adviser, or its affiliates, places trades on behalf of the Fund include an amount in addition to trade execution, which may be rebated back to the Fund to offset certain expenses. This amount totaled $336,939 for the period.
Through arrangements with the Fund's custodian, credits realized as a result of certain uninvested cash balances were used to reduce the Fund's expenses. During the period, these credits reduced the Fund's custody expenses by $217.
Annual Report
Notes to Financial Statements - continued
9. Expense Reductions - continued
In addition, during the period the investment adviser reimbursed and/or waived a portion of fund-level operating expenses in the amount of $7,986 and a portion of class-level operating expenses as follows:
| Reimbursement |
Class A | $ 320 |
Class T | 14 |
Class B | 3 |
Class C | 160 |
China Region | 40,540 |
Class I | 319 |
| $ 41,356 |
10. Distributions to Shareholders.
Distributions to shareholders of each class were as follows:
Years ended October 31, | 2015 | 2014 |
From net investment income | | |
Class A | $ 147,088 | $ 180,108 |
Class T | 22,529 | 32,344 |
Class C | 12,652 | 17,191 |
China Region | 12,728,622 | 15,122,632 |
Class I | 204,043 | 107,159 |
Total | $ 13,114,934 | $ 15,459,434 |
From net realized gain | | |
Class A | $ 2,783,517 | $ 1,978,191 |
Class T | 789,251 | 554,033 |
Class B | 149,794 | 137,166 |
Class C | 1,276,956 | 701,626 |
China Region | 165,004,911 | 131,926,962 |
Class I | 2,409,293 | 833,571 |
Total | $ 172,413,722 | $ 136,131,549 |
11. Share Transactions.
Share transactions for each class were as follows and may contain automatic conversions between classes or exchanges between funds:
| Shares | Dollars |
Years ended October 31, | 2015 | 2014 | 2015 | 2014 |
Class A | | | | |
Shares sold | 1,058,546 | 299,718 | $ 35,978,665 | $ 10,085,846 |
Reinvestment of distributions | 93,297 | 60,028 | 2,812,898 | 2,013,956 |
Shares redeemed | (671,056) | (304,062) | (22,101,227) | (10,090,492) |
Net increase (decrease) | 480,787 | 55,684 | $ 16,690,336 | $ 2,009,310 |
Class T | | | | |
Shares sold | 151,664 | 59,364 | $ 5,390,399 | $ 1,971,301 |
Reinvestment of distributions | 26,640 | 17,176 | 801,072 | 574,877 |
Shares redeemed | (143,989) | (59,747) | (4,554,275) | (1,983,826) |
Net increase (decrease) | 34,315 | 16,793 | $ 1,637,196 | $ 562,352 |
Class B | | | | |
Shares sold | 2,771 | 1,463 | $ 95,500 | $ 48,104 |
Reinvestment of distributions | 4,834 | 3,586 | 144,877 | 119,685 |
Shares redeemed | (15,827) | (11,640) | (523,534) | (382,157) |
Net increase (decrease) | (8,222) | (6,591) | $ (283,157) | $ (214,368) |
Annual Report
11. Share Transactions - continued
| Shares | Dollars |
Years ended October 31, | 2015 | 2014 | 2015 | 2014 |
Class C | | | | |
Shares sold | 412,366 | 172,291 | $ 14,420,908 | $ 5,779,242 |
Reinvestment of distributions | 38,139 | 18,485 | 1,131,586 | 612,773 |
Shares redeemed | (261,252) | (78,373) | (7,778,046) | (2,559,009) |
Net increase (decrease) | 189,253 | 112,403 | $ 7,774,448 | $ 3,833,006 |
China Region | | | | |
Shares sold | 18,091,274 | 6,962,379 | $ 635,141,274 | $ 236,836,534 |
Reinvestment of distributions | 5,608,420 | 4,157,611 | 170,439,887 | 140,360,927 |
Shares redeemed | (20,336,385) | (11,721,340) | (642,334,138) | (391,493,808) |
Net increase (decrease) | 3,363,309 | (601,350) | $ 163,247,023 | $ (14,296,347) |
Class I | | | | |
Shares sold | 1,017,162 | 632,067 | $ 33,130,120 | $ 21,560,054 |
Reinvestment of distributions | 58,945 | 23,866 | 1,781,897 | 802,629 |
Shares redeemed | (726,796) | (377,199) | (23,738,935) | (12,682,356) |
Net increase (decrease) | 349,311 | 278,734 | $ 11,173,082 | $ 9,680,327 |
12. Other.
The Fund's organizational documents provide former and current trustees and officers with a limited indemnification against liabilities arising in connection with the performance of their duties to the Fund. In the normal course of business, the Fund may also enter into contracts that provide general indemnifications. The Fund's maximum exposure under these arrangements is unknown as this would be dependent on future claims that may be made against the Fund. The risk of material loss from such claims is considered remote.
Annual Report
Fidelity Emerging Asia Fund
Average annual total return reflects the change in the value of an investment, assuming reinvestment of the fund's distributions from dividend income and capital gains (the profits earned upon the sale of securities that have grown in value, if any) and assuming a constant rate of performance each year. The $10,000 table and the fund's returns do not reflect the deduction of taxes that a shareholder would pay on fund distributions or the redemption of fund shares. During periods of reimbursement by Fidelity, a fund's total return will be greater than it would be had the reimbursement not occurred. How a fund did yesterday is no guarantee of how it will do tomorrow.
Average Annual Total Returns
Periods ended October 31, 2015 | Past 1
year | Past 5
years | Past 10
years |
Fidelity Emerging Asia Fund A | -4.69% | 2.59% | 8.31% |
A Prior to December 1, 2010, Fidelity Emerging Asia Fund operated under certain different investment policies and compared its performance to a different index. The fund's historical performance may not represent its current investment policies.
$10,000 Over 10 Years
Let's say hypothetically that $10,000 was invested in Fidelity Emerging Asia Fund on October 31, 2005. The chart shows how the value of your investment would have changed, and also shows how the MSCI AC (All Country) Asia ex Japan Index performed over the same period.
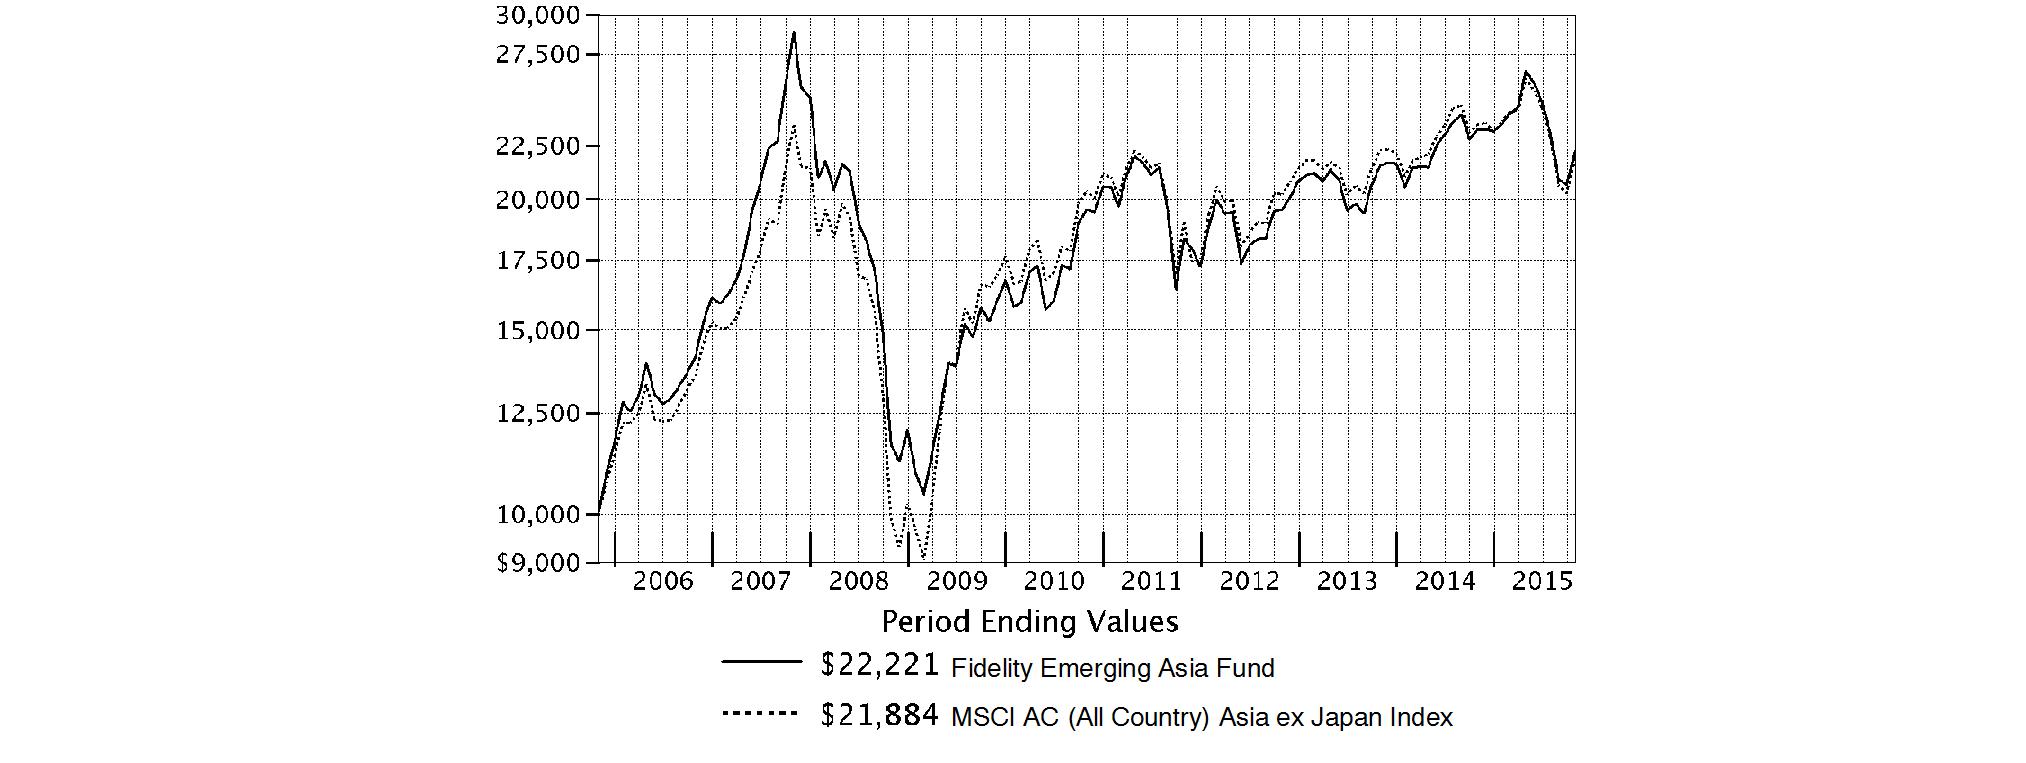
Annual Report
Fidelity Emerging Asia Fund
Market Recap: International equities suffered a moderate setback for the 12 months ending October 31, 2015, held back by a collapse in commodities prices that hurt resources-related sectors and geographies. The MSCI ACWI (All Country World Index) ex USA Index returned -4.55% for the period, affected also by concerns about global economic growth. Commodity producers remained under pressure for much of the past year, largely related to economic deceleration in China (-1%), the world's second-largest economy and a leading consumer of raw materials. This effect was exacerbated by U.S. dollar strength relative to global currencies, which weighed on commodities priced in dollars and acutely impacted equity returns within regions most exposed to resources prices. The emerging-markets group, for example, returned about -15% this period. Canada, a significant energy producer, returned roughly -17%. Net energy consumer Japan (+9%) was the best-performing region by far. Only about a quarter of the nearly 50 index countries managed a gain this period: Ireland (+19%) - the EU's fastest-growing economy - and Israel (+17%) proved top performers; Greece (-56%) and Brazil (-46%), among the worst. As for sectors, energy (-25%) and materials (-16%) declined sharply, whereas the two consumer sectors each gained about 6%.
Comments from Portfolio Manager Colin Chickles: For the year, the fund recorded a mid-single-digit decline, but handily outpaced the -7.22% return of the benchmark MSCI AC (All Country) Asia ex Japan Index. The fund's relative performance was particularly bolstered by stock selection in industrials, consumer staples and information technology. Geographically, our picks in China, South Korea and Hong Kong were beneficial. The three biggest relative contributors were overweighted positions in China Railway Group, CRRC and China Communications Construction, three companies with a strong presence in rail transportation. Given the huge gains in these positions, I sold the first two and considerably reduced our share count in China Communications Construction. Conversely, stock picking in utilities, materials and financials were negatives. From a country perspective, stock selection in Singapore detracted. At the stock level, the biggest relative detractor by a wide margin was Hong Kong Exchanges and Clearing, the company operating the stock exchange in that nation. This was a case of bad timing because the fund didn't own this benchmark stock as it raced higher in April. I bought it in May and sold it for a loss in July. Not owning strong-performing benchmark component CK Hutchison Holdings for most of the period also worked against us.
The views expressed above reflect those of the portfolio manager(s) only through the end of the period as stated on the cover of this report and do not necessarily represent the views of Fidelity or any other person in the Fidelity organization. Any such views are subject to change at any time based upon market or other conditions and Fidelity disclaims any responsibility to update such views. These views may not be relied on as investment advice and, because investment decisions for a Fidelity fund are based on numerous factors, may not be relied on as an indication of trading intent on behalf of any Fidelity fund.
Annual Report
Fidelity Emerging Asia Fund
As a shareholder of the Fund, you incur two types of costs: (1) transaction costs, including redemption fees and (2) ongoing costs, including management fees and other Fund expenses. This Example is intended to help you understand your ongoing costs (in dollars) of investing in the Fund and to compare these costs with the ongoing costs of investing in other mutual funds.
The Example is based on an investment of $1,000 invested at the beginning of the period and held for the entire period (May 1, 2015 to October 31, 2015).
Actual Expenses
The first line of the accompanying table provides information about actual account values and actual expenses. You may use the information in this line, together with the amount you invested, to estimate the expenses that you paid over the period. Simply divide your account value by $1,000.00 (for example, an $8,600 account value divided by $1,000.00 = 8.6), then multiply the result by the number in the first line under the heading entitled "Expenses Paid During Period" to estimate the expenses you paid on your account during this period. A small balance maintenance fee of $12.00 that is charged once a year may apply for certain accounts with a value of less than $2,000. This fee is not included in the table below. If it was, the estimate of expenses you paid during the period would be higher, and your ending account value lower, by this amount. In addition, the Fund, as a shareholder in the underlying Fidelity Central Funds, will indirectly bear its pro-rata share of the fees and expenses incurred by the underlying Fidelity Central Funds. These fees and expenses are not included in the Fund's annualized expense ratio used to calculate the expense estimate in the table below.
Hypothetical Example for Comparison Purposes
The second line of the accompanying table provides information about hypothetical account values and hypothetical expenses based on the Fund's actual expense ratio and an assumed rate of return of 5% per year before expenses, which is not the Fund's actual return. The hypothetical account values and expenses may not be used to estimate the actual ending account balance or expenses you paid for the period. You may use this information to compare the ongoing costs of investing in the Fund and other funds. To do so, compare this 5% hypothetical example with the 5% hypothetical examples that appear in the shareholder reports of the other funds. A small balance maintenance fee of $12.00 that is charged once a year may apply for certain accounts with a value of less than $2,000. This fee is not included in the table below. If it was, the estimate of expenses you paid during the period would be higher, and your ending account value lower, by this amount. In addition, the Fund, as a shareholder in the underlying Fidelity Central Funds, will indirectly bear its pro-rata share of the fees and expenses incurred by the underlying Fidelity Central Funds. These fees and expenses are not included in the Fund's annualized expense ratio used to calculate the expense estimate in the table below.
Please note that the expenses shown in the table are meant to highlight your ongoing costs only and do not reflect any transaction costs. Therefore, the second line of the table is useful in comparing ongoing costs only, and will not help you determine the relative total costs of owning different funds. In addition, if these transactional costs were included, your costs would have been higher.
| Annualized
Expense RatioB | Beginning
Account Value
May 1, 2015 | Ending
Account Value
October 31, 2015 | Expenses Paid
During Period C
May 1, 2015
to October 31, 2015 |
Actual | 1.13% | $ 1,000.00 | $ 838.50 | $ 5.24 |
HypotheticalA | | $ 1,000.00 | $ 1,019.51 | $ 5.75 |
A 5% return per year before expenses
B Annualized expense ratio reflects expenses net of applicable fee waivers.
C Expenses are equal to the Fund's annualized expense ratio, multiplied by the average account value over the period, multiplied by 184/365 (to reflect the one-half year period).
Annual Report
Fidelity Emerging Asia Fund
Investment Changes (Unaudited)
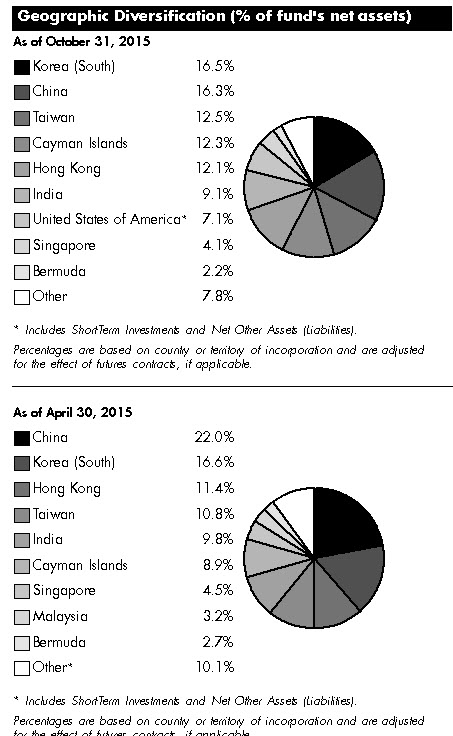
Asset Allocation as of October 31, 2015 |
| % of fund's
net assets | % of fund's net assets
6 months ago |
Stocks | 93.6 | 98.6 |
Bonds | 0.0 | 0.0 |
Short-Term Investments and Net Other Assets (Liabilities) | 6.4 | 1.4 |
Top Ten Stocks as of October 31, 2015 |
| % of fund's
net assets | % of fund's net assets
6 months ago |
Samsung Electronics Co. Ltd. (Korea (South), Technology Hardware, Storage & Peripherals) | 6.0 | 5.6 |
Taiwan Semiconductor Manufacturing Co. Ltd. (Taiwan, Semiconductors & Semiconductor Equipment) | 3.9 | 3.7 |
Tencent Holdings Ltd. (Cayman Islands, Internet Software & Services) | 3.5 | 3.0 |
AIA Group Ltd. (Hong Kong, Insurance) | 2.7 | 2.6 |
China Construction Bank Corp. (H Shares) (China, Banks) | 2.6 | 2.6 |
Industrial & Commercial Bank of China Ltd. (H Shares) (China, Banks) | 1.8 | 2.0 |
Hon Hai Precision Industry Co. Ltd. (Foxconn) (Taiwan, Electronic Equipment & Components) | 1.8 | 1.5 |
Ping An Insurance (Group) Co. of China Ltd. (H Shares) (China, Insurance) | 1.6 | 1.6 |
China Mobile Ltd. (Hong Kong, Wireless Telecommunication Services) | 1.5 | 1.0 |
Bank of China Ltd. (H Shares) (China, Banks) | 1.5 | 1.8 |
| 26.9 | |
Market Sectors as of October 31, 2015 |
| % of fund's
net assets | % of fund's net assets
6 months ago |
Financials | 33.2 | 32.9 |
Information Technology | 20.9 | 20.4 |
Consumer Discretionary | 8.7 | 10.5 |
Telecommunication Services | 6.8 | 6.6 |
Utilities | 6.2 | 5.4 |
Industrials | 5.2 | 5.4 |
Energy | 4.8 | 6.1 |
Consumer Staples | 3.3 | 4.5 |
Materials | 2.9 | 5.3 |
Health Care | 1.6 | 1.5 |
Percentages shown as 0.0% may reflect amounts less than 0.05%. |
Annual Report
Fidelity Emerging Asia Fund
Investments October 31, 2015
Showing Percentage of Net Assets
Common Stocks - 93.6% |
| Shares | | Value |
Australia - 0.1% |
Beacon Lighting Group Ltd. | 438,521 | | $ 561,009 |
Sino Gas & Energy Ltd. (a) | 4,797,856 | | 295,315 |
TOTAL AUSTRALIA | | 856,324 |
Bermuda - 2.2% |
Brilliance China Automotive Holdings Ltd. | 2,294,000 | | 3,180,961 |
BW LPG Ltd. | 33,694 | | 228,810 |
Cheung Kong Infrastructure Holdings Ltd. | 375,000 | | 3,478,867 |
China Foods Ltd. (a) | 2,446,000 | | 1,115,539 |
CSI Properties Ltd. | 31,520,000 | | 1,053,647 |
Digital China Holdings Ltd. (H Shares) | 1,713,000 | | 1,747,671 |
Hongkong Land Holdings Ltd. | 646,600 | | 4,848,332 |
Joy City Property Ltd. | 2,692,000 | | 421,179 |
Kerry Logistics Network Ltd. | 1,607,000 | | 2,390,171 |
PAX Global Technology Ltd. | 788,000 | | 1,030,437 |
Skyworth Digital Holdings Ltd. | 3,879,200 | | 2,870,913 |
TOTAL BERMUDA | | 22,366,527 |
Cayman Islands - 12.3% |
58.com, Inc. ADR (a) | 56,000 | | 2,939,440 |
Alibaba Group Holding Ltd. sponsored ADR (a) | 87,200 | | 7,309,976 |
AMVIG Holdings Ltd. | 1,270,000 | | 581,923 |
Belle International Holdings Ltd. | 2,588,000 | | 2,512,008 |
Changyou.com Ltd. (A Shares) ADR (a) | 45,500 | | 908,180 |
Cheung Kong Property Holdings Ltd. | 1,421,500 | | 9,946,438 |
China Modern Dairy Holdings Ltd. | 7,297,000 | | 2,194,938 |
China Resources Cement Holdings Ltd. | 9,945,706 | | 4,013,486 |
China Sanjiang Fine Chemicals Ltd. (a)(e) | 6,490,000 | | 1,368,069 |
China State Construction International Holdings Ltd. | 1,762,000 | | 2,673,657 |
ChinaCache International Holdings Ltd. sponsored ADR (a) | 44,200 | | 331,942 |
CK Hutchison Holdings Ltd. | 1,016,000 | | 13,912,599 |
Cosmo Lady (China) Holdings Co. Ltd. | 1,369,000 | | 1,359,667 |
Ctrip.com International Ltd. sponsored ADR (a) | 32,700 | | 3,040,119 |
ENN Energy Holdings Ltd. | 742,000 | | 4,250,653 |
Greatview Aseptic Pack Co. Ltd. | 2,407,000 | | 1,129,986 |
iKang Healthcare Group, Inc. sponsored ADR (a) | 32,300 | | 499,358 |
International Housewares Retail Co. Ltd. | 6,982,000 | | 1,457,304 |
Ju Teng International Holdings Ltd. | 2,818,000 | | 1,541,124 |
Lee's Pharmaceutical Holdings Ltd. | 333,500 | | 430,594 |
Longfor Properties Co. Ltd. | 3,694,000 | | 4,949,405 |
MGM China Holdings Ltd. | 1,073,200 | | 1,565,351 |
New Oriental Education & Technology Group, Inc. sponsored ADR | 53,300 | | 1,466,283 |
Pico Far East Holdings Ltd. | 2,384,000 | | 632,839 |
Samson Holding Ltd. | 4,079,000 | | 514,839 |
Sino Biopharmaceutical Ltd. | 4,372,000 | | 5,433,086 |
|
| Shares | | Value |
SITC International Holdings Co. Ltd. | 2,863,000 | | $ 1,469,547 |
Sitoy Group Holdings Ltd. | 1,108,000 | | 529,689 |
SOHO China Ltd. | 2,636,500 | | 1,355,859 |
Stella International Holdings Ltd. | 449,000 | | 1,108,891 |
TCC International Holdings Ltd. | 2,076,000 | | 408,671 |
Tencent Holdings Ltd. | 1,875,500 | | 35,352,010 |
Value Partners Group Ltd. | 943,000 | | 998,559 |
Vipshop Holdings Ltd. ADR (a) | 85,200 | | 1,748,304 |
WuXi PharmaTech Cayman, Inc. sponsored ADR (a) | 47,700 | | 2,132,190 |
Youku Tudou, Inc. ADR (a) | 57,200 | | 1,392,248 |
Zhen Ding Technology Holding Ltd. | 282,000 | | 806,087 |
TOTAL CAYMAN ISLANDS | | 124,265,319 |
China - 16.3% |
Agricultural Bank of China Ltd. (H Shares) | 12,870,000 | | 5,262,680 |
Anhui Conch Cement Co. Ltd. (H Shares) | 918,500 | | 2,802,619 |
Bank of China Ltd. (H Shares) | 32,501,000 | | 15,326,216 |
Beijing Urban Consolidated & Development Group Ltd. (H Shares) | 165,000 | | 101,515 |
China Communications Construction Co. Ltd. (H Shares) | 6,529,000 | | 9,011,245 |
China Construction Bank Corp. (H Shares) | 35,640,000 | | 25,830,303 |
China Life Insurance Co. Ltd. (H Shares) | 1,343,000 | | 4,842,971 |
China National Building Materials Co. Ltd. (H Shares) | 1,556,000 | | 966,771 |
China Pacific Insurance (Group) Co. Ltd. (H Shares) | 2,553,600 | | 10,172,001 |
China Petroleum & Chemical Corp. (H Shares) | 15,912,000 | | 11,470,071 |
China Telecom Corp. Ltd. (H Shares) | 16,808,000 | | 8,767,426 |
China Vanke Co. Ltd. (H Shares) | 2,906,100 | | 6,781,803 |
Chongqing Changan Automobile Co. Ltd. (B Shares) | 867,043 | | 1,595,748 |
Huadian Fuxin Energy Corp. Ltd. (H Shares) | 6,500,000 | | 1,991,400 |
Huadian Power International Corp. Ltd. (H Shares) | 3,846,000 | | 2,812,045 |
Industrial & Commercial Bank of China Ltd. (H Shares) | 29,500,000 | | 18,712,021 |
Jiangling Motors Corp. Ltd. (B Shares) | 252,994 | | 813,591 |
Jiangsu Hengrui Medicine Co. Ltd. | 249,772 | | 2,072,351 |
Kweichow Moutai Co. Ltd. | 102,740 | | 3,468,891 |
PICC Property & Casualty Co. Ltd. (H Shares) | 2,553,120 | | 5,793,209 |
Ping An Insurance (Group) Co. of China Ltd. (H Shares) | 2,894,000 | | 16,244,745 |
SAIC Motor Corp. Ltd. | 608,258 | | 1,713,894 |
Shenzhen Expressway Co. (H Shares) | 1,450,000 | | 1,117,359 |
Tong Ren Tang Technologies Co. Ltd. (H Shares) | 805,000 | | 1,257,371 |
Zhejiang Expressway Co. Ltd. (H Shares) | 3,964,000 | | 4,873,140 |
TOTAL CHINA | | 163,801,386 |
Common Stocks - continued |
| Shares | | Value |
Hong Kong - 12.1% |
AIA Group Ltd. | 4,648,600 | | $ 27,256,282 |
China Everbright Ltd. | 1,244,000 | | 2,927,812 |
China Mobile Ltd. | 1,290,500 | | 15,472,960 |
China Power International Development Ltd. | 5,611,000 | | 3,526,130 |
China Resources Power Holdings Co. Ltd. | 1,846,000 | | 4,175,961 |
CNOOC Ltd. sponsored ADR | 121,400 | | 13,800,752 |
Dah Sing Banking Group Ltd. | 672,400 | | 1,275,915 |
Fosun International Ltd. | 2,140,044 | | 3,896,997 |
Henderson Land Development Co. Ltd. | 689,600 | | 4,404,306 |
HKT Trust/HKT Ltd. unit | 4,935,300 | | 5,880,041 |
Hysan Development Co. Ltd. | 1,181,000 | | 5,238,360 |
Lenovo Group Ltd. | 3,550,000 | | 3,298,436 |
Magnificent Estates Ltd. | 6,930,000 | | 196,315 |
New World Development Co. Ltd. | 5,651,000 | | 6,027,395 |
PCCW Ltd. | 11,763,000 | | 6,333,687 |
Power Assets Holdings Ltd. | 747,000 | | 7,429,969 |
Shun Ho Technology Holdings Ltd. (a) | 114,345 | | 39,037 |
Techtronic Industries Co. Ltd. | 1,191,000 | | 4,353,912 |
Wheelock and Co. Ltd. | 1,403,000 | | 6,539,544 |
TOTAL HONG KONG | | 122,073,811 |
India - 9.1% |
Adani Ports & Special Economic Zone (a) | 287,109 | | 1,296,322 |
Apollo Tyres Ltd. | 1,505,572 | | 3,943,527 |
Axis Bank Ltd. (a) | 253,263 | | 1,834,254 |
Bajaj Finserv Ltd. | 150,557 | | 4,527,138 |
Bharat Petroleum Corp. Ltd. (a) | 296,446 | | 3,940,293 |
Bharti Infratel Ltd. | 338,462 | | 2,010,234 |
Cox & Kings India Ltd. (a) | 849,656 | | 3,506,437 |
Dr. Reddy's Laboratories Ltd. (a) | 78,196 | | 5,080,717 |
Edelweiss Financial Services Ltd. | 1,859,207 | | 1,687,381 |
GAIL India Ltd. | 346,154 | | 1,630,066 |
HCL Technologies Ltd. | 207,262 | | 2,758,706 |
Hexaware Technologies Ltd. | 582,388 | | 2,129,388 |
IL&FS Transportation Networks Ltd. | 478,364 | | 683,830 |
Indian Oil Corp. Ltd. (a) | 798,303 | | 4,865,682 |
JK Tyre & Industries Ltd. (a) | 1,736,660 | | 2,698,727 |
Just Dial Ltd. | 59,523 | | 728,132 |
LIC Housing Finance Ltd. (a) | 264,934 | | 1,934,417 |
Mahindra & Mahindra Ltd. (a) | 184,403 | | 3,329,684 |
Maruti Suzuki India Ltd. (a) | 37,348 | | 2,540,165 |
McLeod Russel India Ltd. (a) | 344,049 | | 902,864 |
NTPC Ltd. | 2,274,698 | | 4,615,229 |
Oil & Natural Gas Corp. Ltd. | 778,463 | | 2,936,714 |
Petronet LNG Ltd. | 1,559,744 | | 4,622,611 |
Power Finance Corp. Ltd. | 515,863 | | 1,882,955 |
Power Grid Corp. of India Ltd. | 477,859 | | 939,364 |
Redington India Ltd. (a) | 691,026 | | 1,255,873 |
Reliance Capital Ltd. (a) | 73,076 | | 469,907 |
Reliance Infrastructure Ltd. (a) | 284,775 | | 1,722,326 |
Shriram City Union Finance Ltd. | 51,853 | | 1,453,373 |
|
| Shares | | Value |
Sun TV Ltd. | 386,314 | | $ 2,340,237 |
Tata Motors Ltd. (a) | 969,869 | | 5,723,974 |
The Jammu & Kashmir Bank Ltd. | 1,080,744 | | 1,371,619 |
UPL Ltd. | 360,637 | | 2,526,343 |
Vakrangee Ltd. | 275,786 | | 551,102 |
VST Industries Ltd. (a) | 42,310 | | 1,035,444 |
Yes Bank Ltd. (a) | 553,210 | | 6,393,619 |
TOTAL INDIA | | 91,868,654 |
Indonesia - 1.4% |
PT ACE Hardware Indonesia Tbk | 12,337,500 | | 600,611 |
PT Bank Rakyat Indonesia Tbk | 11,370,900 | | 8,702,788 |
PT Gudang Garam Tbk | 990,900 | | 3,101,676 |
PT Summarecon Agung Tbk | 12,677,200 | | 1,283,129 |
Sunway Construction Group Bhd (a) | 178,640 | | 53,733 |
TOTAL INDONESIA | | 13,741,937 |
Israel - 0.0% |
Sarine Technologies Ltd. | 342,000 | | 380,141 |
Japan - 1.3% |
Fuji Media Holdings, Inc. | 282,000 | | 3,354,631 |
KDDI Corp. | 207,700 | | 5,025,994 |
NGK Insulators Ltd. | 47,000 | | 1,017,543 |
SoftBank Corp. | 68,800 | | 3,854,720 |
TOTAL JAPAN | | 13,252,888 |
Korea (South) - 16.5% |
AMOREPACIFIC Corp. | 17,507 | | 5,788,287 |
BGFretail Co. Ltd. | 8,244 | | 1,227,463 |
Daewoo International Corp. | 54,417 | | 950,821 |
DGB Financial Group Co. Ltd. | 277,359 | | 2,574,954 |
Dongbu Insurance Co. Ltd. | 144,722 | | 8,669,859 |
Duksan Hi-Metal Co. Ltd. (a) | 69,051 | | 512,846 |
Global & Yuasa Battery Co. Ltd. | 16,340 | | 583,893 |
Hana Financial Group, Inc. | 86,193 | | 2,098,641 |
Hyosung Corp. | 31,512 | | 3,229,113 |
Hyundai Mobis | 21,949 | | 4,613,679 |
Hyundai Motor Co. | 100,415 | | 13,719,698 |
Hyundai Steel Co. | 105,985 | | 4,836,192 |
KB Financial Group, Inc. | 239,936 | | 7,590,053 |
Korea Aerospace Industries Ltd. | 23,342 | | 1,839,933 |
Korea Electric Power Corp. | 149,171 | | 6,706,243 |
Korea Petro Chemical Industries Co. Ltd. | 14,005 | | 2,171,090 |
Korea Zinc Co. Ltd. | 15,172 | | 6,298,579 |
LG Household & Health Care Ltd. | 10,504 | | 8,712,164 |
LOTTE Hi-Mart Co. Ltd. | 19,088 | | 972,982 |
Samsung Card Co. Ltd. | 63,024 | | 2,130,662 |
Samsung Electronics Co. Ltd. | 49,994 | | 60,074,935 |
Shinhan Financial Group Co. Ltd. | 298,241 | | 11,365,302 |
SK Energy Co. Ltd. (a) | 59,523 | | 6,177,668 |
SK Telecom Co. Ltd. | 14,005 | | 2,961,264 |
TOTAL KOREA (SOUTH) | | 165,806,321 |
Common Stocks - continued |
| Shares | | Value |
Malaysia - 2.1% |
AEON Credit Service Bhd | 165,700 | | $ 493,760 |
AMMB Holdings Bhd | 773,000 | | 856,825 |
Cahya Mata Sarawak Bhd | 912,300 | | 1,124,791 |
Eversendai Corp. Bhd | 943,000 | | 170,772 |
Glomac Bhd | 1,592,200 | | 335,244 |
Media Prima Bhd | 3,540,600 | | 1,146,495 |
MISC Bhd | 901,800 | | 1,892,173 |
Sunway Bhd | 1,786,400 | | 1,287,521 |
Tenaga Nasional Bhd | 2,550,100 | | 7,495,470 |
YTL Corp. Bhd | 10,322,700 | | 3,625,083 |
YTL Power International Bhd | 8,024,300 | | 2,818,066 |
TOTAL MALAYSIA | | 21,246,200 |
Philippines - 1.1% |
ABS CBN Broadcasting Corp. (depositary receipt) | 357,700 | | 515,622 |
Globe Telecom, Inc. | 56,020 | | 2,723,128 |
LT Group, Inc. | 1,862,300 | | 496,967 |
Metropolitan Bank & Trust Co. | 2,369,231 | | 4,301,978 |
Robinsons Retail Holdings, Inc. | 322,580 | | 529,633 |
Security Bank Corp. | 827,248 | | 2,506,813 |
TOTAL PHILIPPINES | | 11,074,141 |
Singapore - 4.1% |
Boustead Projects Pte Ltd. (a) | 123,026 | | 74,171 |
Boustead Singapore Ltd. | 630,288 | | 430,872 |
CapitaLand Ltd. | 1,785,700 | | 3,939,099 |
Centurion Corp. Ltd. | 927,500 | | 277,138 |
CWT Ltd. | 422,000 | | 602,410 |
Frasers Centrepoint Ltd. | 438,000 | | 509,315 |
Hyflux Ltd. | 1,645,000 | | 795,613 |
Interplex Holdings Ltd. | 707,000 | | 356,025 |
Mapletree Industrial (REIT) | 5,109,251 | | 5,557,783 |
Sheng Siong Group Ltd. | 2,091,000 | | 1,265,718 |
Singapore Telecommunications Ltd. | 3,118,500 | | 8,860,448 |
Sound Global Ltd. (a) | 1,008,000 | | 892,113 |
United Overseas Bank Ltd. | 818,100 | | 11,879,456 |
UOL Group Ltd. | 602,000 | | 2,809,390 |
Wing Tai Holdings Ltd. | 2,134,000 | | 2,655,602 |
TOTAL SINGAPORE | | 40,905,153 |
Taiwan - 12.5% |
ASUSTeK Computer, Inc. | 484,000 | | 4,338,334 |
Cathay Financial Holding Co. Ltd. | 6,795,000 | | 9,711,628 |
China Life Insurance Co. Ltd. | 2,998,600 | | 2,484,594 |
Chinatrust Financial Holding Co. Ltd. | 11,794,791 | | 6,485,046 |
Delta Electronics, Inc. | 421,000 | | 2,152,657 |
E.SUN Financial Holdings Co. Ltd. | 6,230,312 | | 3,751,813 |
Fubon Financial Holding Co. Ltd. | 6,424,000 | | 10,427,993 |
Hon Hai Precision Industry Co. Ltd. (Foxconn) | 6,754,600 | | 18,017,815 |
Novatek Microelectronics Corp. | 690,000 | | 2,359,156 |
|
| Shares | | Value |
PChome Online, Inc. | 85,053 | | $ 956,240 |
Pegatron Corp. | 3,275,000 | | 8,050,054 |
Pou Chen Corp. | 2,531,000 | | 3,586,201 |
Realtek Semiconductor Corp. | 556,000 | | 1,166,290 |
Richtek Technology Corp. | 203,000 | | 1,184,922 |
Sinopac Holdings Co. | 20,761,341 | | 6,874,616 |
Taiwan Semiconductor Manufacturing Co. Ltd. | 9,325,192 | | 39,291,457 |
Wistron NeWeb Corp. | 849,661 | | 2,245,523 |
Yuanta Financial Holding Co. Ltd. | 7,690,560 | | 3,032,163 |
TOTAL TAIWAN | | 126,116,502 |
Thailand - 1.8% |
Asian Property Development PCL (For. Reg.) | 19,305,200 | | 3,250,166 |
Bangkok Expressway PCL (For.Reg.) | 1,427,400 | | 1,443,404 |
CH. Karnchang PCL | 1,658,600 | | 1,318,405 |
Intouch Holdings PCL NVDR | 2,797,600 | | 5,895,821 |
Preuksa Real Estate PCL (For. Reg.) | 3,115,000 | | 2,451,264 |
Thai Beverage PCL | 8,158,100 | | 3,922,974 |
TOTAL THAILAND | | 18,282,034 |
United States of America - 0.7% |
China Biologic Products, Inc. (a) | 4,700 | | 535,518 |
Cognizant Technology Solutions Corp. Class A (a) | 101,600 | | 6,919,976 |
TOTAL UNITED STATES OF AMERICA | | 7,455,494 |
TOTAL COMMON STOCKS (Cost $964,605,507) |
943,492,832
|
Nonconvertible Bonds - 0.0% |
| Principal Amount (d) | | |
India - 0.0% |
NTPC Ltd. 8.49% 3/25/25
(Cost $449,651) | INR | 2,245,016 | |
437,379
|
Money Market Funds - 2.6% |
| Shares | | Value |
Fidelity Cash Central Fund, 0.18% (b) | 25,946,724 | | $ 25,946,724 |
Fidelity Securities Lending Cash Central Fund, 0.19% (b)(c) | 408,750 | | 408,750 |
TOTAL MONEY MARKET FUNDS (Cost $26,355,474) |
26,355,474
|
TOTAL INVESTMENT
PORTFOLIO - 96.2% (Cost $991,410,632) | | 970,285,685 |
NET OTHER ASSETS (LIABILITIES) - 3.8% | | 37,892,770 |
NET ASSETS - 100% | $ 1,008,178,455 |
Currency Abbreviations |
INR | - | Indian rupee |
Legend |
(a) Non-income producing |
(b) Affiliated fund that is generally available only to investment companies and other accounts managed by Fidelity Investments. The rate quoted is the annualized seven-day yield of the fund at period end. A complete unaudited listing of the fund's holdings as of its most recent quarter end is available upon request. In addition, each Fidelity Central Fund's financial statements, which are not covered by the Fund's Report of Independent Registered Public Accounting Firm, are available on the SEC's website or upon request. |
(c) Investment made with cash collateral received from securities on loan. |
(d) Amount is stated in United States dollars unless otherwise noted. |
(e) Security or a portion of the security is on loan at period end. |
Affiliated Central Funds |
Information regarding fiscal year to date income earned by the Fund from investments in Fidelity Central Funds is as follows: |
Fund | Income earned |
Fidelity Cash Central Fund | $ 31,580 |
Fidelity Securities Lending Cash Central Fund | 29,784 |
Total | $ 61,364 |
Other Information |
Categorizations in the Schedule of Investments are based on country or territory of incorporation. |
The following is a summary of the inputs used, as of October 31, 2015, involving the Fund's assets and liabilities carried at fair value. The inputs or methodology used for valuing securities may not be an indication of the risk associated with investing in those securities. For more information on valuation inputs, and their aggregation into the levels used in the tables below, please refer to the Investment Valuation section in the accompanying Notes to Financial Statements. |
Valuation Inputs at Reporting Date: |
Description | Total | Level 1 | Level 2 | Level 3 |
Investments in Securities: | | | | |
Equities: | | | | |
Consumer Discretionary | $ 84,714,375 | $ 29,731,159 | $ 53,269,322 | $ 1,713,894 |
Consumer Staples | 33,265,591 | 15,727,914 | 17,537,677 | - |
Energy | 48,768,788 | 20,207,230 | 28,561,558 | - |
Financials | 337,781,102 | 58,241,969 | 279,539,133 | - |
Health Care | 17,441,185 | 3,167,066 | 14,274,119 | - |
Industrials | 53,147,671 | 2,790,754 | 50,356,917 | - |
Information Technology | 211,350,957 | 121,666,621 | 89,684,336 | - |
Materials | 30,332,842 | 16,534,974 | 13,797,868 | - |
Telecommunication Services | 67,785,723 | - | 67,785,723 | - |
Utilities | 58,904,598 | - | 58,012,485 | 892,113 |
Corporate Bonds | 437,379 | - | 437,379 | - |
Money Market Funds | 26,355,474 | 26,355,474 | - | - |
Total Investments in Securities: | $ 970,285,685 | $ 294,423,161 | $ 673,256,517 | $ 2,606,007 |
The following is a summary of transfers between Level 1 and Level 2 for the period ended October 31, 2015. Transfers are assumed to have occurred at the beginning of the period, and are primarily attributable to the valuation techniques used for foreign equity securities, as discussed in the accompanying Notes to Financial Statements: |
Transfers | Total |
Level 1 to Level 2 | $ 13,926,206 |
Level 2 to Level 1 | $ 48,102,830 |
Valuation Inputs at Reporting Date: |
The following is a reconciliation of Investments in Securities for which Level 3 inputs were used in determining value: |
Investments in Securities: | |
Equities - Industrials | |
Beginning Balance | $ 10,638,444 |
Net Realized Gain (Loss) on Investment Securities | 7,355,917 |
Net Unrealized Gain (Loss) on Investment Securities | (2,498,797) |
Cost of Purchases | 5,745,191 |
Proceeds of Sales | (21,240,755) |
Amortization/Accretion | - |
Transfers into Level 3 | - |
Transfers out of Level 3 | - |
Ending Balance | $ - |
The change in unrealized gain (loss) for the period attributable to Level 3 securities held at October 31, 2015 | $ - |
Other Investments in Securities | |
Beginning Balance | $ - |
Net Realized Gain (Loss) on Investment Securities | (354,454) |
Net Unrealized Gain (Loss) on Investment Securities | (1,002,451) |
Cost of Purchases | 6,158,278 |
Proceeds of Sales | (2,195,366) |
Amortization/Accretion | - |
Transfers into Level 3 | - |
Transfers out of Level 3 | - |
Ending Balance | $ 2,606,007 |
The change in unrealized gain (loss) for the period attributable to Level 3 securities held at October 31, 2015 | $ (1,002,451) |
The information used in the above reconciliations represents fiscal year to date activity for any Investments in Securities identified as using Level 3 inputs at either the beginning or the end of the current fiscal period. Transfers in or out of Level 3 represent the beginning value of any Security or Instrument where a change in the pricing level occurred from the beginning to the end of the period. The cost of purchases and the proceeds of sales may include securities received or delivered through corporate actions or exchanges. Realized and unrealized gains (losses) disclosed in the reconciliations are included in Net Gain (Loss) on the Fund's Statement of Operations. |
See accompanying notes which are an integral part of the financial statements.
Annual Report
Fidelity Emerging Asia Fund
Statement of Assets and Liabilities
| October 31, 2015 |
| | |
Assets | | |
Investment in securities, at value (including securities loaned of $371,373) - See accompanying schedule: Unaffiliated issuers (cost $965,055,158) | $ 943,930,211 | |
Fidelity Central Funds (cost $26,355,474) | 26,355,474 | |
Total Investments (cost $991,410,632) | | $ 970,285,685 |
Receivable for investments sold | | 38,742,843 |
Receivable for fund shares sold | | 30,153,118 |
Dividends receivable | | 361,878 |
Interest receivable | | 1,760 |
Distributions receivable from Fidelity Central Funds | | 5,827 |
Prepaid expenses | | 3,014 |
Other receivables | | 401,301 |
Total assets | | 1,039,955,426 |
| | |
Liabilities | | |
Payable to custodian bank | $ 12,436 | |
Payable for investments purchased | 29,478,054 | |
Payable for fund shares redeemed | 853,723 | |
Accrued management fee | 678,531 | |
Other affiliated payables | 200,952 | |
Other payables and accrued expenses | 144,525 | |
Collateral on securities loaned, at value | 408,750 | |
Total liabilities | | 31,776,971 |
| | |
Net Assets | | $ 1,008,178,455 |
Net Assets consist of: | | |
Paid in capital | | $ 1,132,927,505 |
Undistributed net investment income | | 2,018,342 |
Accumulated undistributed net realized gain (loss) on investments and foreign currency transactions | | (105,457,602) |
Net unrealized appreciation (depreciation) on investments and assets and liabilities in foreign currencies | | (21,309,790) |
Net Assets, for 32,312,071 shares outstanding | | $ 1,008,178,455 |
Net Asset Value, offering price and redemption price per share ($1,008,178,455 ÷ 32,312,071 shares) | | $ 31.20 |
Statement of Operations
| Year ended October 31, 2015 |
| | |
Investment Income | | |
Dividends | | $ 28,933,142 |
Interest | | 1,786 |
Income from Fidelity Central Funds | | 61,364 |
Income before foreign taxes withheld | | 28,996,292 |
Less foreign taxes withheld | | (2,913,891) |
Total income | | 26,082,401 |
| | |
Expenses | | |
Management fee | | |
Basic fee | $ 7,768,076 | |
Performance adjustment | 952,845 | |
Transfer agent fees | 2,180,284 | |
Accounting and security lending fees | 513,883 | |
Custodian fees and expenses | 590,705 | |
Independent trustees' compensation | 4,749 | |
Registration fees | 29,347 | |
Audit | 102,867 | |
Legal | 2,974 | |
Interest | 1,128 | |
Miscellaneous | 8,097 | |
Total expenses before reductions | 12,154,955 | |
Expense reductions | (93,335) | 12,061,620 |
Net investment income (loss) | | 14,020,781 |
Realized and Unrealized Gain (Loss) | | |
Net realized gain (loss) on: | | |
Investment securities: | | |
Unaffiliated issuers (net of foreign taxes of $1,118,057) | 31,998,977 | |
Foreign currency transactions | (344,272) | |
Total net realized gain (loss) | | 31,654,705 |
Change in net unrealized appreciation (depreciation) on: Investment securities (net of decrease in deferred foreign taxes of $3,122,468) | (108,944,357) | |
Assets and liabilities in foreign currencies | (18,957) | |
Total change in net unrealized appreciation (depreciation) | | (108,963,314) |
Net gain (loss) | | (77,308,609) |
Net increase (decrease) in net assets resulting from operations | | $ (63,287,828) |
See accompanying notes which are an integral part of the financial statements.
Annual Report
Fidelity Emerging Asia Fund
Financial Statements - continued
Statement of Changes in Net Assets
| Year ended
October 31,
2015 | Year ended
October 31,
2014 |
Increase (Decrease) in Net Assets | | |
Operations | | |
Net investment income (loss) | $ 14,020,781 | $ 14,965,203 |
Net realized gain (loss) | 31,654,705 | 65,949,959 |
Change in net unrealized appreciation (depreciation) | (108,963,314) | 72,565 |
Net increase (decrease) in net assets resulting from operations | (63,287,828) | 80,987,727 |
Distributions to shareholders from net investment income | (9,800,314) | (14,440,335) |
Share transactions | | |
Proceeds from sales of shares | 198,826,376 | 110,553,504 |
Reinvestment of distributions | 9,282,114 | 13,734,257 |
Cost of shares redeemed | (238,285,271) | (252,013,027) |
Net increase (decrease) in net assets resulting from share transactions | (30,176,781) | (127,725,266) |
Redemption fees | 166,559 | 106,318 |
Total increase (decrease) in net assets | (103,098,364) | (61,071,556) |
| | |
Net Assets | | |
Beginning of period | 1,111,276,819 | 1,172,348,375 |
End of period (including undistributed net investment income of $2,018,342 and undistributed net investment income of $8,444,054, respectively) | $ 1,008,178,455 | $ 1,111,276,819 |
Other Information Shares | | |
Sold | 5,802,749 | 3,409,047 |
Issued in reinvestment of distributions | 283,510 | 448,392 |
Redeemed | (7,416,166) | (8,143,143) |
Net increase (decrease) | (1,329,907) | (4,285,704) |
Financial Highlights - Fidelity Emerging Asia Fund
Years ended October 31, | 2015 | 2014 | 2013 | 2012 | 2011 |
Selected Per-Share Data | | | | | |
Net asset value, beginning of period | $ 33.03 | $ 30.91 | $ 28.57 | $ 27.32 | $ 29.70 |
Income from Investment Operations | | | | | |
Net investment income (loss) B | .42 | .43 | .39 | .46 | .50 |
Net realized and unrealized gain (loss) | (1.96) | 2.08 | 2.49 | 1.30 | (2.30) |
Total from investment operations | (1.54) | 2.51 | 2.88 | 1.76 | (1.80) |
Distributions from net investment income | (.29) | (.39) | (.46) | (.51) | (.49) |
Distributions from net realized gain | - | - | (.08) | - | (.11) |
Total distributions | (.29) | (.39) | (.54) | (.51) | (.59) G |
Redemption fees added to paid in capitalB | -F | -F | -F | -F | .01 |
Net asset value, end of period | $ 31.20 | $ 33.03 | $ 30.91 | $ 28.57 | $ 27.32 |
Total ReturnA | (4.69)% | 8.21% | 10.19% | 6.60% | (6.20)% |
Ratios to Average Net AssetsC, E | | | | | |
Expenses before reductions | 1.09% | 1.04% | 1.08% | .94% | .82% |
Expenses net of fee waivers, if any | 1.09% | 1.04% | 1.08% | .94% | .82% |
Expenses net of all reductions | 1.09% | 1.04% | 1.05% | .91% | .78% |
Net investment income (loss) | 1.26% | 1.36% | 1.31% | 1.68% | 1.68% |
Supplemental Data | | | | | |
Net assets, end of period (000 omitted) | $ 1,008,178 | $ 1,111,277 | $ 1,172,348 | $ 1,325,208 | $ 1,525,635 |
Portfolio turnover rateD | 68% | 90% | 97% | 94% | 115% |
ATotal returns would have been lower if certain expenses had not been reduced during the applicable periods shown. BCalculated based on average shares outstanding during the period. CFees and expenses of any underlying Fidelity Central Funds are not included in the Fund's expense ratio. The Fund indirectly bears its proportionate share of the expenses of any underlying Fidelity Central Funds. DAmount does not include the portfolio activity of any underlying Fidelity Central Funds. EExpense ratios reflect operating expenses of the Fund. Expenses before reductions do not reflect amounts reimbursed by the investment adviser or reductions from brokerage service arrangements or reductions from other expense offset arrangements and do not represent the amount paid by the Fund during periods when reimbursements or reductions occur. Expenses net of fee waivers reflect expenses after reimbursement by the investment adviser but prior to reductions from brokerage service arrangements or other expense offset arrangements. Expenses net of all reductions represent the net expenses paid by the Fund. FAmount represents less than $.005 per share. GTotal distributions of $.59 per share is comprised of distributions from net investment income of $.485 and distributions from net realized gain of $.105 per share. |
See accompanying notes which are an integral part of the financial statements.
Annual Report
For the period ended October 31, 2015
1. Organization.
Fidelity Emerging Asia Fund (the Fund) is a fund of Fidelity Investment Trust (the Trust) and is authorized to issue an unlimited number of shares. Share transactions on the Statement of Changes in Net Assets may contain exchanges between funds. The Trust is registered under the Investment Company Act of 1940, as amended (the 1940 Act), as an open-end management investment company organized as a Massachusetts business trust. The Fund's investments in emerging markets can be subject to social, economic, regulatory, and political uncertainties and can be extremely volatile.
2. Investments in Fidelity Central Funds.
The Fund invests in Fidelity Central Funds, which are open-end investment companies generally available only to other investment companies and accounts managed by the investment adviser and its affiliates. The Fund's Schedule of Investments lists each of the Fidelity Central Funds held as of period end, if any, as an investment of the Fund, but does not include the underlying holdings of each Fidelity Central Fund. As an Investing Fund, the Fund indirectly bears its proportionate share of the expenses of the underlying Fidelity Central Funds.
The Money Market Central Funds seek preservation of capital and current income and are managed by Fidelity Investments Money Management, Inc. (FIMM), an affiliate of the investment adviser. Annualized expenses of the Money Market Central Funds as of their most recent shareholder report date are less than .005%.
A complete unaudited list of holdings for each Fidelity Central Fund is available upon request or at the Securities and Exchange Commission (the SEC) website at www.sec.gov. In addition, the financial statements of the Fidelity Central Funds, which are not covered by the Fund's Report of Independent Registered Public Accounting Firm, are available on the SEC website or upon request.
3. Significant Accounting Policies.
The financial statements have been prepared in conformity with accounting principles generally accepted in the United States of America (GAAP), which require management to make certain estimates and assumptions at the date of the financial statements. Actual results could differ from those estimates. Subsequent events, if any, through the date that the financial statements were issued have been evaluated in the preparation of the financial statements. The following summarizes the significant accounting policies of the Fund:
Investment Valuation. Investments are valued as of 4:00 p.m. Eastern time on the last calendar day of the period. The Board of Trustees (the Board) has delegated the day to day responsibility for the valuation of the Fund's investments to the Fidelity Management & Research Company (FMR) Fair Value Committee (the Committee). In accordance with valuation policies and procedures approved by the Board, the Fund attempts to obtain prices from one or more third party pricing vendors or brokers to value its investments. When current market prices, quotations or currency exchange rates are not readily available or reliable, investments will be fair valued in good faith by the Committee, in accordance with procedures adopted by the Board. Factors used in determining fair value vary by investment type and may include market or investment specific events, changes in interest rates and credit quality. The frequency with which these procedures are used cannot be predicted and they may be utilized to a significant extent. The Committee oversees the Fund's valuation policies and procedures and reports to the Board on the Committee's activities and fair value determinations. The Board monitors the appropriateness of the procedures used in valuing the Fund's investments and ratifies the fair value determinations of the Committee.
The Fund categorizes the inputs to valuation techniques used to value its investments into a disclosure hierarchy consisting of three levels as shown below:
Level 1 - quoted prices in active markets for identical investments
Level 2 - other significant observable inputs (including quoted prices for similar investments, interest rates, prepayment speeds, etc.)
Level 3 - unobservable inputs (including the Fund's own assumptions based on the best information available)
Valuation techniques used to value the Fund's investments by major category are as follows:
Equity securities, including restricted securities, for which market quotations are readily available, are valued at the last reported sale price or official closing price as reported by a third party pricing vendor on the primary market or exchange on which they are traded and are categorized as Level 1 in the hierarchy. In the event there were no sales during the day or closing prices are not available, securities are valued at the last quoted bid price or may be valued using the last available price and are generally categorized as Level 2 in the hierarchy. For foreign equity securities, when market or security specific events arise, comparisons to the valuation of American Depositary Receipts (ADRs), futures contracts, Exchange-Traded Funds (ETFs) and certain indexes as well as quoted prices for similar securities may be used and would be categorized as Level 2 in the hierarchy. Utilizing these techniques may result in transfers between Level 1 and Level 2. For equity securities, including restricted securities, where observable inputs are limited, assumptions about market activity and risk are used and these securities may be categorized as Level 3 in the hierarchy.
Annual Report
3. Significant Accounting Policies - continued
Investment Valuation - continued
Debt securities, including restricted securities, are valued based on evaluated prices received from third party pricing vendors or from brokers who make markets in such securities. Corporate bonds are valued by pricing vendors who utilize matrix pricing which considers yield or price of bonds of comparable quality, coupon, maturity and type or by broker-supplied prices. When independent prices are unavailable or unreliable, debt securities may be valued utilizing pricing methodologies which consider similar factors that would be used by third party pricing vendors. Debt securities are generally categorized as Level 2 in the hierarchy but may be Level 3 depending on the circumstances.
Investments in open-end mutual funds, including the Fidelity Central Funds, are valued at their closing net asset value (NAV) each business day and are categorized as Level 1 in the hierarchy.
Changes in valuation techniques may result in transfers in or out of an assigned level within the disclosure hierarchy. The aggregate value of investments by input level as of October 31, 2015, including information on transfers between Levels 1 and 2, as well as a roll forward of Level 3 investments, is included at the end of the Fund's Schedule of Investments.
Foreign Currency. The Fund may use foreign currency contracts to facilitate transactions in foreign-denominated securities. Gains and losses from these transactions may arise from changes in the value of the foreign currency or if the counterparties do not perform under the contracts' terms.
Foreign-denominated assets, including investment securities, and liabilities are translated into U.S. dollars at the exchange rates at period end. Purchases and sales of investment securities, income and dividends received and expenses denominated in foreign currencies are translated into U.S. dollars at the exchange rate in effect on the transaction date.
The effects of exchange rate fluctuations on investments are included with the net realized and unrealized gain (loss) on investment securities. Other foreign currency transactions resulting in realized and unrealized gain (loss) are disclosed separately.
Investment Transactions and Income. For financial reporting purposes, the Fund's investment holdings and NAV include trades executed through the end of the last business day of the period. The NAV per share for processing shareholder transactions is calculated as of the close of business of the New York Stock Exchange (NYSE), normally 4:00 p.m. Eastern time and includes trades executed through the end of the prior business day. Gains and losses on securities sold are determined on the basis of identified cost. Dividend income is recorded on the ex-dividend date, except for certain dividends from foreign securities where the ex-dividend date may have passed, which are recorded as soon as the Fund is informed of the ex-dividend date. Non-cash dividends included in dividend income, if any, are recorded at the fair market value of the securities received. Income and capital gain distributions from Fidelity Central Funds, if any, are recorded on the ex-dividend date. Distributions received on securities that represent a return of capital or capital gain are recorded as a reduction of cost of investments and/or as a realized gain. Subsequent to ex-dividend date the Fund determines the components of these distributions, based upon receipt of tax filings or other correspondence relating to the underlying investment. Interest income is accrued as earned and includes coupon interest and amortization of premium and accretion of discount on debt securities as applicable. Investment income is recorded net of foreign taxes withheld where recovery of such taxes is uncertain.
Expenses. Expenses directly attributable to a fund are charged to that fund. Expenses attributable to more than one fund are allocated among the respective funds on the basis of relative net assets or other appropriate methods. Expense estimates are accrued in the period to which they relate and adjustments are made when actual amounts are known.
Income Tax Information and Distributions to Shareholders. Each year, the Fund intends to qualify as a regulated investment company under Subchapter M of the Internal Revenue Code, including distributing substantially all of its taxable income and realized gains. As a result, no provision for U.S. Federal income taxes is required. As of October 31, 2015, the Fund did not have any unrecognized tax benefits in the financial statements; nor is the Fund aware of any tax positions for which it is reasonably possible that the total amounts of unrecognized tax benefits will significantly change in the next twelve months. The Fund files a U.S. federal tax return, in addition to state and local tax returns as required. The Fund's federal income tax returns are subject to examination by the Internal Revenue Service (IRS) for a period of three fiscal years after they are filed. State and local tax returns may be subject to examination for an additional fiscal year depending on the jurisdiction. Foreign taxes are provided for based on the Fund's understanding of the tax rules and rates that exist in the foreign markets in which it invests. The Fund is subject to a tax imposed on capital gains by certain countries in which it invests. An estimated deferred tax liability for net unrealized appreciation on the applicable securities is included in Other payables and accrued expenses on the Statement of Assets & Liabilities.
Distributions are declared and recorded on the ex-dividend date. Income and capital gain distributions are determined in accordance with income tax regulations, which may differ from GAAP. In addition, the Fund claimed a portion of the payment made to redeeming shareholders as a distribution for income tax purposes.
Capital accounts within the financial statements are adjusted for permanent book-tax differences. These adjustments have no impact on net assets or the results of operations. Capital accounts are not adjusted for temporary book-tax differences which will reverse in a subsequent period.
Annual Report
Notes to Financial Statements - continued
3. Significant Accounting Policies - continued
Income Tax Information and Distributions to Shareholders - continued
Book-tax differences are primarily due to foreign currency transactions, certain foreign taxes, passive foreign investment companies (PFIC), deferred trustees compensation, capital loss carryforwards and losses deferred due to wash sales.
The federal tax cost of investment securities and unrealized appreciation (depreciation) as of period end were as follows:
Gross unrealized appreciation | $ 93,493,956 |
Gross unrealized depreciation | (115,220,104) |
Net unrealized appreciation (depreciation) on securities | $ (21,726,148) |
Tax Cost | $ 992,011,833 |
The tax-based components of distributable earnings as of period end were as follows:
Undistributed ordinary income | $ 2,018,754 |
Capital loss carryforward | $ (104,856,402) |
Net unrealized appreciation (depreciation) on securities and other investments | $ (21,909,092) |
Capital loss carryforwards are only available to offset future capital gains of the Fund to the extent provided by regulations and may be limited. Under the Regulated Investment Company Modernization Act of 2010 (the Act), the Fund is permitted to carry forward capital losses incurred in taxable years beginning after December 22, 2010 for an unlimited period and such capital losses are required to be used prior to any losses that expire. The capital loss carryforward information presented below, including any applicable limitation, is estimated as of fiscal period end and is subject to adjustment.
Fiscal year of expiration | |
2017 | $ (104,856,402) |
The tax character of distributions paid was as follows:
| October 31, 2015 | October 31, 2014 |
Ordinary Income | $ 9,800,314 | $ 14,440,335 |
Short-Term Trading (Redemption) Fees. Shares held by investors in the Fund less than 90 days may have been subject to a redemption fee equal to 1.50% of the NAV of shares redeemed. All redemption fees, which reduce the proceeds of the shareholder redemption, are retained by the Fund and accounted for as an addition to paid in capital.
4. Purchases and Sales of Investments.
Purchases and sales of securities, other than short-term securities, aggregated $734,446,028 and $816,658,578, respectively.
5. Fees and Other Transactions with Affiliates.
Management Fee. Fidelity Management & Research Company (the investment adviser) and its affiliates provide the Fund with investment management related services for which the Fund pays a monthly management fee. The management fee is the sum of an individual fund fee rate that is based on an annual rate of .45% of the Fund's average net assets and an annualized group fee rate that averaged .25% during the period. The group fee rate is based upon the average net assets of all the mutual funds advised by the investment adviser, including any mutual funds previously advised by the investment adviser that are currently advised by Fidelity SelectCo, LLC, an affiliate of the investment adviser. The group fee rate decreases as assets under management increase and increases as assets under management decrease. In addition, the management fee is subject to a performance adjustment (up to a maximum of ± .20% of the Fund's average net assets over a 36 month performance period). The upward or downward adjustment to the management fee is based on the Fund's relative investment performance as compared to its benchmark index, the MSCI All Country Asia ex Japan Index, over the same 36 month performance period. For the reporting period, the total annual management fee rate, including the performance adjustment, was .79% of the Fund's average net assets. The performance adjustment included in the management fee rate may be higher or lower than the maximum performance adjustment rate due to the difference between the average net assets for the reporting and performance periods.
Transfer Agent Fees. Fidelity Investments Institutional Operations Company, Inc. (FIIOC), an affiliate of the investment adviser, is the Fund's transfer, dividend disbursing and shareholder servicing agent. FIIOC receives account fees and asset-based fees that vary according to account size and type of account. FIIOC pays for typesetting, printing and mailing of shareholder reports, except proxy statements. For the period, the transfer agent fees were equivalent to an annual rate of .20% of average net assets.
Annual Report
5. Fees and Other Transactions with Affiliates - continued
Accounting and Security Lending Fees. Fidelity Service Company, Inc. (FSC), an affiliate of the investment adviser, maintains the Fund's accounting records. The accounting fee is based on the level of average net assets for each month. Under a separate contract, FSC administers the security lending program. The security lending fee is based on the number and duration of lending transactions.
Brokerage Commissions. The Fund placed a portion of its portfolio transactions with brokerage firms which are affiliates of the investment adviser. Brokerage commissions are included in net realized gain (loss) and change in net unrealized appreciation (depreciation) in the Statement of Operations. The commissions paid to these affiliated firms were $1,180 for the period.
Interfund Lending Program. Pursuant to an Exemptive Order issued by the SEC, the Fund, along with other registered investment companies having management contracts with FMR or other affiliated entities of FMR, may participate in an interfund lending program. This program provides an alternative credit facility allowing the funds to borrow from, or lend money to, other participating affiliated funds. At period end, there were no interfund loans outstanding. The Fund's activity in this program during the period for which loans were outstanding was as follows:
Borrower or Lender | Average Loan Balance | Weighted Average
Interest Rate | Interest Expense |
Borrower | $ 18,799,667 | .36% | $ 1,128 |
6. Committed Line of Credit.
The Fund participates with other funds managed by the investment adviser or an affiliate in a $4.25 billion credit facility (the "line of credit") to be utilized for temporary or emergency purposes to fund shareholder redemptions or for other short-term liquidity purposes. The Fund has agreed to pay commitment fees on its pro-rata portion of the line of credit, which amounted to $1,610 and is reflected in Miscellaneous expenses on the Statement of Operations. During the period, the Fund did not borrow on this line of credit.
7. Security Lending.
The Fund lends portfolio securities through a lending agent from time to time in order to earn additional income. For equity securities, a lending agent is used and may loan securities to certain qualified borrowers, including Fidelity Capital Markets (FCM), a broker-dealer affiliated with the Fund. On the settlement date of the loan, the Fund receives collateral (in the form of U.S. Treasury obligations, letters of credit and/or cash) against the loaned securities and maintains collateral in an amount not less than 100% of the market value of the loaned securities during the period of the loan. The market value of the loaned securities is determined at the close of business of the Fund and any additional required collateral is delivered to the Fund on the next business day. The Fund or borrower may terminate the loan at any time, and if the borrower defaults on its obligation to return the securities loaned because of insolvency or other reasons, the Fund may apply collateral received from the borrower against the obligation. The Fund may experience delays and costs in recovering the securities loaned. Any cash collateral received is invested in the Fidelity Securities Lending Cash Central Fund. The value of loaned securities and cash collateral at period end are disclosed on the Fund's Statement of Assets and Liabilities. Security lending income represents the income earned on investing cash collateral, less rebates paid to borrowers and any lending agent fees associated with the loan, plus any premium payments received for lending certain types of securities. Security lending income is presented in the Statement of Operations as a component of income from Fidelity Central Funds. Total security lending income during the period amounted to $29,784. During the period, there were no securities loaned to FCM.
8. Expense Reductions.
Commissions paid to certain brokers with whom the investment adviser, or its affiliates, places trades on behalf of the Fund include an amount in addition to trade execution, which may be rebated back to the Fund to offset certain expenses. This amount totaled $54,821 for the period.
In addition, during the period the investment adviser reimbursed and/or waived a portion of operating expenses in the amount of $38,514.
9. Other.
The Fund's organizational documents provide former and current trustees and officers with a limited indemnification against liabilities arising in connection with the performance of their duties to the Fund. In the normal course of business, the Fund may also enter into contracts that provide general indemnifications. The Fund's maximum exposure under these arrangements is unknown as this would be dependent on future claims that may be made against the Fund. The risk of material loss from such claims is considered remote.
Annual Report
Fidelity Emerging Markets Fund
Average annual total return reflects the change in the value of an investment, assuming reinvestment of the class' distributions from dividend income and capital gains (the profits earned upon the sale of securities that have grown in value, if any) and assuming a constant rate of performance each year. The $10,000 table and the fund's returns do not reflect the deduction of taxes that a shareholder would pay on fund distributions or the redemption of fund shares. During periods of reimbursement by Fidelity, a fund's total return will be greater than it would be had the reimbursement not occurred. How a fund did yesterday is no guarantee of how it will do tomorrow.
Average Annual Total Returns
Periods ended October 31, 2015 | Past 1
year | Past 5
years | Past 10
years |
Fidelity Emerging Markets Fund | -10.76% | -1.64% | 5.19% |
$10,000 Over 10 Years
Let's say hypothetically that $10,000 was invested in Fidelity Emerging Markets Fund, a class of the fund, on October 31, 2005. The chart shows how the value of your investment would have changed, and also shows how the MSCI Emerging Markets Index performed over the same period.
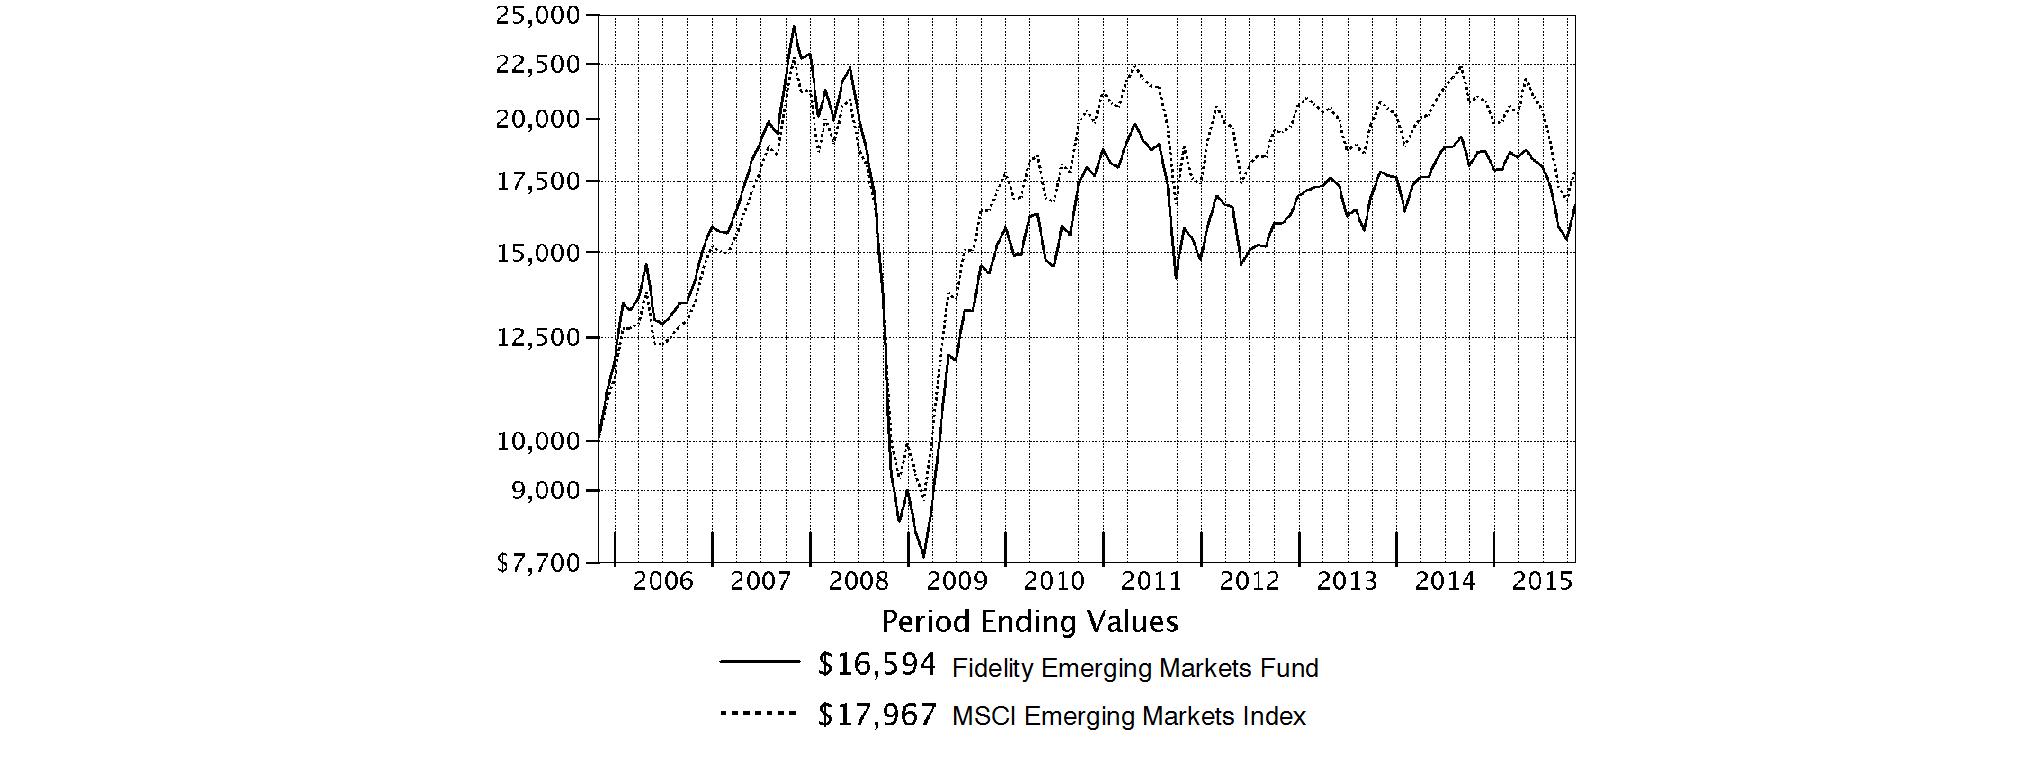
Annual Report
Fidelity Emerging Markets Fund
Market Recap: International equities suffered a moderate setback for the 12 months ending October 31, 2015, held back by a collapse in commodities prices that hurt resources-related sectors and geographies. The MSCI ACWI (All Country World Index) ex USA Index returned -4.55% for the period, affected also by concerns about global economic growth. Commodity producers remained under pressure for much of the past year, largely related to economic deceleration in China (-1%), the world's second-largest economy and a leading consumer of raw materials. This effect was exacerbated by U.S. dollar strength relative to global currencies, which weighed on commodities priced in dollars and acutely impacted equity returns within regions most exposed to resources prices. The emerging-markets group, for example, returned about -15% this period. Canada, a significant energy producer, returned roughly -17%. Net energy consumer Japan (+9%) was the best-performing region by far. Only about a quarter of the nearly 50 index countries managed a gain this period: Ireland (+19%) - the EU's fastest-growing economy - and Israel (+17%) proved top performers; Greece (-56%) and Brazil (-46%), among the worst. As for sectors, energy (-25%) and materials (-16%) declined sharply, whereas the two consumer sectors each gained about 6%.
Comments from Portfolio Manager Sammy Simnegar: For the year, the fund's share classes recorded low-double-digit declines but handily topped the -14.22% return of the benchmark MSCI Emerging Markets Index. Versus the benchmark, sector and industry positioning - especially a sizable underweighting in energy - drove the fund's success, with stock selection also adding value. Geographically, non-benchmark exposure to the U.S. bolstered relative results, as did positioning in India and picks in Mexico. The fund's top relative contributor was Brazil-based oil producer Petroleo Brasileiro. This weak-performing index name helped our relative results because the fund didn't own it, as did Brazilian metals miner Vale, also an index stock. Two other contributors - both out-of-benchmark positions established during the period - were health care holdings China Biologic Products and Jiangsu Hengrui Medicine. Conversely, stock selection in consumer discretionary detracted most. Underweighting China was a negative, along with stock picking in Russia. The fund's first- and fourth-biggest relative detractors were China Life Insurance and Ping An Insurance Group. In both cases, the fund didn't own the stock early on, when China-based stocks were flying higher, but we built positions later.
The views expressed above reflect those of the portfolio manager(s) only through the end of the period as stated on the cover of this report and do not necessarily represent the views of Fidelity or any other person in the Fidelity organization. Any such views are subject to change at any time based upon market or other conditions and Fidelity disclaims any responsibility to update such views. These views may not be relied on as investment advice and, because investment decisions for a Fidelity fund are based on numerous factors, may not be relied on as an indication of trading intent on behalf of any Fidelity fund.
Annual Report
Fidelity Emerging Markets Fund
As a shareholder of the Fund, you incur two types of costs: (1) transaction costs, including redemption fees and (2) ongoing costs, including management fees and other Fund expenses. This Example is intended to help you understand your ongoing costs (in dollars) of investing in the Fund and to compare these costs with the ongoing costs of investing in other mutual funds.
The Example is based on an investment of $1,000 invested at the beginning of the period and held for the entire period (May 1, 2015 to October 31, 2015).
Actual Expenses
The first line of the accompanying table for each class of the Fund provides information about actual account values and actual expenses. You may use the information in this line, together with the amount you invested, to estimate the expenses that you paid over the period. Simply divide your account value by $1,000.00 (for example, an $8,600 account value divided by $1,000.00 = 8.6), then multiply the result by the number in the first line for a class of the Fund under the heading entitled "Expenses Paid During Period" to estimate the expenses you paid on your account during this period. A small balance maintenance fee of $12.00 that is charged once a year may apply for certain accounts with a value of less than $2,000. This fee is not included in the table below. If it was, the estimate of expenses you paid during the period would be higher, and your ending account value lower, by this amount. In addition, the Fund, as a shareholder in the underlying Fidelity Central Funds, will indirectly bear its pro-rata share of the fees and expenses incurred by the underlying Fidelity Central Funds. These fees and expenses are not included in the Fund's annualized expense ratio used to calculate the expense estimate in the table below.
Hypothetical Example for Comparison Purposes
The second line of the accompanying table for each class of the Fund provides information about hypothetical account values and hypothetical expenses based on a Class' actual expense ratio and an assumed rate of return of 5% per year before expenses, which is not the Class' actual return. The hypothetical account values and expenses may not be used to estimate the actual ending account balance or expenses you paid for the period. You may use this information to compare the ongoing costs of investing in the Fund and other funds. To do so, compare this 5% hypothetical example with the 5% hypothetical examples that appear in the shareholder reports of the other funds. A small balance maintenance fee of $12.00 that is charged once a year may apply for certain accounts with a value of less than $2,000. This fee is not included in the table below. If it was, the estimate of expenses you paid during the period would be higher, and your ending account value lower, by this amount. In addition, the Fund, as a shareholder in the underlying Fidelity Central Funds, will indirectly bear its pro-rata share of the fees and expenses incurred by the underlying Fidelity Central Funds. These fees and expenses are not included in the Fund's annualized expense ratio used to calculate the expense estimate in the table below.
Please note that the expenses shown in the table are meant to highlight your ongoing costs only and do not reflect any transaction costs. Therefore, the second line of the table is useful in comparing ongoing costs only, and will not help you determine the relative total costs of owning different funds. In addition, if these transactional costs were included, your costs would have been higher.
| Annualized
Expense RatioB | Beginning
Account Value
May 1, 2015 | Ending
Account Value
October 31, 2015 | Expenses Paid
During PeriodC
May 1, 2015
to October 31, 2015 |
Emerging Markets | 1.04% | | | |
Actual | | $ 1,000.00 | $ 887.10 | $ 4.95 |
HypotheticalA | | $ 1,000.00 | $ 1,019.96 | $ 5.30 |
Class K | .84% | | | |
Actual | | $ 1,000.00 | $ 887.60 | $ 4.00 |
HypotheticalA | | $ 1,000.00 | $ 1,020.97 | $ 4.28 |
A 5% return per year before expenses
B Annualized expense ratio reflects expenses net of applicable fee waivers.
C Expenses are equal to each Class' annualized expense ratio, multiplied by the average account value over the period, multiplied by 184/365 (to reflect the one-half year period).
Annual Report
Fidelity Emerging Markets Fund
Investment Changes (Unaudited)
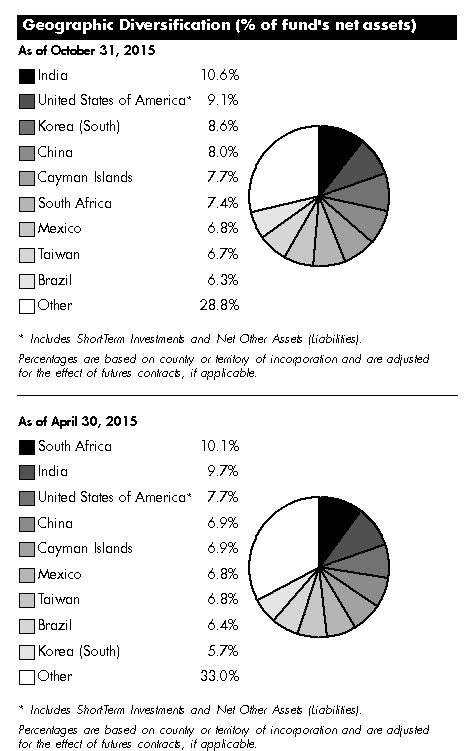
Asset Allocation as of October 31, 2015 |
| % of fund's
net assets | % of fund's net assets
6 months ago |
Stocks | 99.3 | 99.1 |
Short-Term Investments and Net Other Assets (Liabilities) | 0.7 | 0.9 |
Top Ten Stocks as of October 31, 2015 |
| % of fund's
net assets | % of fund's net assets
6 months ago |
Samsung Electronics Co. Ltd. (Korea (South), Technology Hardware, Storage & Peripherals) | 4.5 | 4.4 |
Taiwan Semiconductor Manufacturing Co. Ltd. (Taiwan, Semiconductors & Semiconductor Equipment) | 3.4 | 3.4 |
Tencent Holdings Ltd. (Cayman Islands, Internet Software & Services) | 3.2 | 3.0 |
Naspers Ltd. Class N (South Africa, Media) | 2.2 | 2.0 |
Ping An Insurance (Group) Co. of China Ltd. (H Shares) (China, Insurance) | 1.4 | 0.0 |
Housing Development Finance Corp. Ltd. (India, Thrifts & Mortgage Finance) | 1.3 | 1.1 |
Ambev SA sponsored ADR (Brazil, Beverages) | 1.0 | 1.1 |
Tata Consultancy Services Ltd. (India, IT Services) | 1.0 | 0.8 |
Fomento Economico Mexicano S.A.B. de CV unit (Mexico, Beverages) | 0.9 | 0.8 |
Grupo Financiero Banorte S.A.B. de CV Series O (Mexico, Banks) | 0.9 | 0.8 |
| 19.8 | |
Market Sectors as of October 31, 2015 |
| % of fund's
net assets | % of fund's net assets
6 months ago |
Information Technology | 23.1 | 22.3 |
Financials | 19.8 | 23.3 |
Consumer Discretionary | 18.5 | 16.6 |
Industrials | 11.3 | 11.5 |
Consumer Staples | 8.5 | 7.3 |
Health Care | 8.4 | 7.5 |
Materials | 4.7 | 5.2 |
Utilities | 2.5 | 2.0 |
Telecommunication Services | 1.4 | 2.3 |
Energy | 1.1 | 1.1 |
Percentages shown as 0.0% may reflect amounts less than 0.05%. |
Annual Report
Fidelity Emerging Markets Fund
Investments October 31, 2015
Showing Percentage of Net Assets
Common Stocks - 98.3% |
| Shares | | Value |
Australia - 0.9% |
Amcor Ltd. | 1,413,962 | | $ 13,657,192 |
Sydney Airport unit | 3,533,823 | | 16,149,952 |
TOTAL AUSTRALIA | | 29,807,144 |
Bailiwick of Jersey - 0.4% |
Integrated Diagnostics Holdings PLC (a) | 2,557,969 | | 14,094,409 |
Bermuda - 2.2% |
China Gas Holdings Ltd. | 10,812,000 | | 17,207,484 |
China Resource Gas Group Ltd. | 5,532,000 | | 15,174,528 |
Credicorp Ltd. (United States) | 196,932 | | 22,288,764 |
PAX Global Technology Ltd. | 13,512,000 | | 17,669,120 |
TOTAL BERMUDA | | 72,339,896 |
Brazil - 5.3% |
BB Seguridade Participacoes SA | 2,871,620 | | 19,806,587 |
Brasil Foods SA | 1,631,400 | | 25,423,537 |
Cetip SA - Mercados Organizado | 1,794,600 | | 15,868,032 |
Cielo SA | 2,273,412 | | 21,581,365 |
FPC Par Corretora de Seguros | 1,420,100 | | 3,973,209 |
Kroton Educacional SA | 7,962,460 | | 20,357,536 |
Qualicorp SA | 4,405,800 | | 18,507,205 |
Smiles SA | 1,781,800 | | 13,906,777 |
Ultrapar Participacoes SA | 1,134,400 | | 19,707,977 |
Weg SA | 4,121,390 | | 15,388,888 |
TOTAL BRAZIL | | 174,521,113 |
British Virgin Islands - 0.5% |
Mail.Ru Group Ltd. GDR (Reg. S) (a) | 827,800 | | 16,142,100 |
Cayman Islands - 7.7% |
Alibaba Group Holding Ltd. sponsored ADR (a) | 255,200 | | 21,393,416 |
ENN Energy Holdings Ltd. | 3,380,000 | | 19,362,815 |
Fu Shou Yuan International Group Ltd. (d) | 21,161,000 | | 14,428,296 |
Hengan International Group Co. Ltd. | 2,147,000 | | 23,184,227 |
Shenzhou International Group Holdings Ltd. | 3,500,000 | | 17,247,902 |
Sino Biopharmaceutical Ltd. | 14,108,000 | | 17,532,016 |
TAL Education Group ADR (a) | 447,600 | | 17,210,220 |
Tencent Holdings Ltd. | 5,606,000 | | 105,669,618 |
Vipshop Holdings Ltd. ADR (a)(d) | 819,500 | | 16,816,140 |
TOTAL CAYMAN ISLANDS | | 252,844,650 |
China - 8.0% |
Beijing Capital International Airport Co. Ltd. (H Shares) | 16,734,000 | | 17,911,220 |
China Life Insurance Co. Ltd. (H Shares) | 5,307,000 | | 19,137,490 |
China Pacific Insurance (Group) Co. Ltd. (H Shares) | 7,045,600 | | 28,065,418 |
Fuyao Glass Industries Group Co. Ltd. (a) | 6,752,000 | | 14,434,559 |
Inner Mongoli Yili Industries Co. Ltd. | 6,148,408 | | 15,465,595 |
Jiangsu Hengrui Medicine Co. Ltd. | 2,121,471 | | 17,601,786 |
Kweichow Moutai Co. Ltd. | 523,692 | | 17,681,825 |
|
| Shares | | Value |
PICC Property & Casualty Co. Ltd. (H Shares) | 9,962,783 | | $ 22,606,257 |
Ping An Insurance (Group) Co. of China Ltd. (H Shares) | 8,063,000 | | 45,259,635 |
Shanghai International Airport Co. Ltd. | 3,738,100 | | 17,832,199 |
Weifu High-Technology Co. Ltd. (B Shares) | 4,781,169 | | 12,189,979 |
Zhengzhou Yutong Bus Co. Ltd. | 4,986,250 | | 17,174,145 |
Zhuzhou CSR Times Electric Co. Ltd. (H Shares) | 2,733,000 | | 17,691,920 |
TOTAL CHINA | | 263,052,028 |
Denmark - 0.5% |
Novo Nordisk A/S Series B sponsored ADR | 288,300 | | 15,331,794 |
Egypt - 0.6% |
Commercial International Bank SAE sponsored GDR | 3,192,800 | | 18,677,880 |
France - 0.9% |
LVMH Moet Hennessy - Louis Vuitton SA | 84,820 | | 15,790,891 |
Safran SA | 194,500 | | 14,773,065 |
TOTAL FRANCE | | 30,563,956 |
Germany - 1.0% |
Bayer AG | 111,600 | | 14,892,186 |
Wirecard AG (d) | 321,863 | | 16,636,792 |
TOTAL GERMANY | | 31,528,978 |
Hong Kong - 2.0% |
AIA Group Ltd. | 2,766,800 | | 16,222,665 |
CSPC Pharmaceutical Group Ltd. | 18,282,000 | | 17,021,388 |
Guangdong Investment Ltd. | 12,007,000 | | 16,886,181 |
Techtronic Industries Co. Ltd. | 4,338,000 | | 15,858,329 |
TOTAL HONG KONG | | 65,988,563 |
India - 10.6% |
Adani Ports & Special Economic Zone (a) | 3,790,935 | | 17,116,405 |
Amara Raja Batteries Ltd. (a) | 1,033,523 | | 14,248,543 |
Asian Paints India Ltd. | 1,407,300 | | 17,834,797 |
Axis Bank Ltd. (a) | 1,917,184 | | 13,885,181 |
Bharti Infratel Ltd. | 2,849,419 | | 16,923,611 |
Colgate-Palmolive (India) | 956,144 | | 13,938,522 |
Exide Industries Ltd. (a) | 6,028,470 | | 13,752,893 |
HCL Technologies Ltd. | 1,794,539 | | 23,885,735 |
HDFC Bank Ltd. (a) | 905,707 | | 18,165,469 |
Housing Development Finance Corp. Ltd. | 2,205,895 | | 42,254,117 |
IndusInd Bank Ltd. | 1,062,557 | | 14,783,992 |
LIC Housing Finance Ltd. (a) | 2,204,392 | | 16,095,379 |
Lupin Ltd. | 671,367 | | 19,767,324 |
Maruti Suzuki India Ltd. (a) | 221,498 | | 15,064,835 |
Sun Pharmaceutical Industries Ltd. | 2,018,117 | | 27,424,412 |
Tata Consultancy Services Ltd. | 857,789 | | 32,681,725 |
Common Stocks - continued |
| Shares | | Value |
India - continued |
Titan Co. Ltd. (a) | 2,900,773 | | $ 15,736,582 |
Zee Entertainment Enterprises Ltd. | 2,611,321 | | 16,273,826 |
TOTAL INDIA | | 349,833,348 |
Indonesia - 4.0% |
PT ACE Hardware Indonesia Tbk | 344,934,400 | | 16,791,994 |
PT Bank Central Asia Tbk | 28,257,400 | | 26,545,771 |
PT Bank Rakyat Indonesia Tbk | 32,333,500 | | 24,746,641 |
PT Matahari Department Store Tbk | 14,434,800 | | 17,379,323 |
PT Media Nusantara Citra Tbk | 115,858,500 | | 15,032,785 |
PT Surya Citra Media Tbk | 74,100,300 | | 15,757,718 |
PT Tower Bersama Infrastructure Tbk (a) | 31,912,000 | | 16,620,076 |
TOTAL INDONESIA | | 132,874,308 |
Isle of Man - 0.5% |
Playtech Ltd. | 1,262,213 | | 16,656,284 |
Israel - 0.9% |
Check Point Software Technologies Ltd. (a) | 181,500 | | 15,416,610 |
Teva Pharmaceutical Industries Ltd. sponsored ADR | 243,200 | | 14,395,008 |
TOTAL ISRAEL | | 29,811,618 |
Kenya - 0.4% |
Safaricom Ltd. | 105,631,300 | | 14,853,593 |
Korea (South) - 8.6% |
AMOREPACIFIC Corp. | 78,534 | | 25,965,462 |
Coway Co. Ltd. | 225,406 | | 16,820,017 |
KEPCO Plant Service & Engineering Co. Ltd. | 171,480 | | 15,619,538 |
LG Chemical Ltd. | 100,788 | | 26,879,272 |
LG Household & Health Care Ltd. | 27,486 | | 22,797,273 |
NAVER Corp. | 53,154 | | 27,932,421 |
Samsung Electronics Co. Ltd. | 122,494 | | 147,194,067 |
TOTAL KOREA (SOUTH) | | 283,208,050 |
Luxembourg - 0.9% |
Eurofins Scientific SA | 44,300 | | 16,039,247 |
Samsonite International SA | 4,980,900 | | 14,709,780 |
TOTAL LUXEMBOURG | | 30,749,027 |
Mexico - 6.8% |
Banregio Grupo Financiero S.A.B. de CV | 2,397,993 | | 12,936,660 |
Fomento Economico Mexicano S.A.B. de CV unit | 2,963,767 | | 29,277,377 |
Gruma S.A.B. de CV Series B | 1,188,600 | | 18,342,282 |
Grupo Aeroportuario del Pacifico SA de CV Series B | 1,923,857 | | 17,327,502 |
Grupo Aeroportuario del Sureste SA de CV Series B | 1,163,120 | | 18,013,861 |
|
| Shares | | Value |
Grupo Aeroportuario Norte S.A.B. de CV | 2,958,700 | | $ 15,218,198 |
Grupo Financiero Banorte S.A.B. de CV Series O | 5,314,500 | | 28,619,112 |
Grupo GICSA SA de CV (a)(d) | 15,490,617 | | 15,098,798 |
Infraestructura Energetica Nova S.A.B. de CV | 3,104,000 | | 14,967,708 |
Megacable Holdings S.A.B. de CV unit | 4,248,052 | | 16,189,497 |
Promotora y Operadora de Infraestructura S.A.B. de CV (a) | 1,510,600 | | 18,940,801 |
Tenedora Nemak SA de CV (a) | 12,221,200 | | 17,675,748 |
TOTAL MEXICO | | 222,607,544 |
Netherlands - 0.4% |
Hangzhou Hikvision Digital Technology Co. Ltd. ELS (BNP Paribas Arbitrage Warrant Program) warrants 10/21/16 (a) | 2,723,000 | | 14,832,508 |
Philippines - 4.1% |
Ayala Corp. | 1,041,090 | | 17,338,254 |
GT Capital Holdings, Inc. | 566,585 | | 15,899,709 |
International Container Terminal Services, Inc. | 9,583,880 | | 16,897,010 |
Jollibee Food Corp. | 3,667,160 | | 16,117,554 |
Robinsons Land Corp. | 24,039,500 | | 15,714,689 |
SM Investments Corp. | 912,552 | | 17,036,552 |
SM Prime Holdings, Inc. | 38,634,500 | | 17,789,293 |
Universal Robina Corp. | 4,102,270 | | 17,578,020 |
TOTAL PHILIPPINES | | 134,371,081 |
Russia - 0.7% |
Magnit OJSC (a) | 141,707 | | 24,719,783 |
South Africa - 7.4% |
Aspen Pharmacare Holdings Ltd. | 932,390 | | 20,940,540 |
Bidvest Group Ltd. | 803,398 | | 20,550,827 |
Discovery Ltd. | 1,685,585 | | 18,026,344 |
FirstRand Ltd. | 7,028,500 | | 25,795,037 |
Mr Price Group Ltd. | 1,162,288 | | 17,847,113 |
Naspers Ltd. Class N | 481,612 | | 70,541,768 |
Sanlam Ltd. | 4,931,200 | | 22,277,825 |
Steinhoff International Holdings Ltd. | 4,253,900 | | 26,038,577 |
Woolworths Holdings Ltd. | 2,762,400 | | 20,463,997 |
TOTAL SOUTH AFRICA | | 242,482,028 |
Spain - 0.5% |
Amadeus IT Holding SA Class A | 364,000 | | 15,514,566 |
Switzerland - 0.9% |
Compagnie Financiere Richemont SA Series A | 183,508 | | 15,735,365 |
Sika AG (Bearer) | 3,880 | | 12,733,795 |
TOTAL SWITZERLAND | | 28,469,160 |
Taiwan - 6.7% |
Advantech Co. Ltd. | 2,277,000 | | 16,377,006 |
Catcher Technology Co. Ltd. | 2,015,000 | | 19,861,389 |
Common Stocks - continued |
| Shares | | Value |
Taiwan - continued |
ECLAT Textile Co. Ltd. | 1,153,000 | | $ 17,011,767 |
Giant Manufacturing Co. Ltd. | 2,042,000 | | 15,441,583 |
Largan Precision Co. Ltd. | 317,000 | | 24,752,657 |
Merida Industry Co. Ltd. | 2,759,600 | | 16,192,940 |
Taiwan Semiconductor Manufacturing Co. Ltd. | 26,570,000 | | 111,952,013 |
TOTAL TAIWAN | | 221,589,355 |
Thailand - 1.5% |
Airports of Thailand PCL (For. Reg.) | 2,259,200 | | 18,884,754 |
Bangkok Dusit Medical Services PCL (For. Reg.) | 28,040,800 | | 14,951,533 |
Thai Beverage PCL | 29,426,500 | | 14,150,280 |
TOTAL THAILAND | | 47,986,567 |
Turkey - 2.1% |
Koc Holding A/S | 4,087,000 | | 18,458,439 |
TAV Havalimanlari Holding A/S | 2,192,000 | | 17,217,809 |
Tofas Turk Otomobil Fabrikasi A/S | 2,303,731 | | 15,211,231 |
Tupras Turkiye Petrol Rafinelleri A/S (a) | 653,000 | | 17,246,690 |
TOTAL TURKEY | | 68,134,169 |
United Arab Emirates - 1.0% |
DP World Ltd. | 875,334 | | 17,690,500 |
First Gulf Bank PJSC | 4,610,350 | | 15,501,721 |
TOTAL UNITED ARAB EMIRATES | | 33,192,221 |
United Kingdom - 1.9% |
Al Noor Hospitals Group PLC | 75,025 | | 1,360,144 |
InterContinental Hotel Group PLC | 383,700 | | 15,332,443 |
Mondi PLC | 811,600 | | 18,817,485 |
NMC Health PLC | 1,092,200 | | 12,830,065 |
Prudential PLC | 671,258 | | 15,678,234 |
TOTAL UNITED KINGDOM | | 64,018,371 |
United States of America - 8.4% |
A.O. Smith Corp. | 220,400 | | 16,931,128 |
Alphabet, Inc. Class C | 24,105 | | 17,134,075 |
Apple, Inc. | 143,300 | | 17,124,350 |
China Biologic Products, Inc. (a) | 167,478 | | 19,082,443 |
Cognizant Technology Solutions Corp. Class A (a) | 229,600 | | 15,638,056 |
Ecolab, Inc. | 131,700 | | 15,850,095 |
Facebook, Inc. Class A (a) | 140,600 | | 14,336,982 |
International Flavors & Fragrances, Inc. | 133,410 | | 15,483,565 |
MasterCard, Inc. Class A | 158,500 | | 15,689,915 |
McGraw Hill Financial, Inc. | 172,200 | | 15,952,608 |
MercadoLibre, Inc. (d) | 160,600 | | 15,798,222 |
Mettler-Toledo International, Inc. (a) | 53,200 | | 16,544,668 |
Moody's Corp. | 164,500 | | 15,818,320 |
NIKE, Inc. Class B | 111,800 | | 14,649,154 |
PPG Industries, Inc. | 157,056 | | 16,374,659 |
|
| Shares | | Value |
Sherwin-Williams Co. | 64,400 | | $ 17,183,852 |
Visa, Inc. Class A | 207,300 | | 16,082,334 |
TOTAL UNITED STATES OF AMERICA | | 275,674,426 |
TOTAL COMMON STOCKS (Cost $3,038,534,777) |
3,236,470,518
|
Nonconvertible Preferred Stocks - 1.0% |
| | | |
Brazil - 1.0% |
Ambev SA sponsored ADR
(Cost $51,333,349) | 7,027,680 | |
34,224,802
|
Money Market Funds - 1.9% |
| | | |
Fidelity Cash Central Fund, 0.18% (b) | 20,235,573 | | 20,235,573 |
Fidelity Securities Lending Cash Central Fund, 0.19% (b)(c) | 41,335,000 | | 41,335,000 |
TOTAL MONEY MARKET FUNDS (Cost $61,570,573) |
61,570,573
|
TOTAL INVESTMENT
PORTFOLIO - 101.2% (Cost $3,151,438,699) | | 3,332,265,893 |
NET OTHER ASSETS (LIABILITIES) - (1.2)% | | (39,291,465) |
NET ASSETS - 100% | $ 3,292,974,428 |
Security Type Abbreviations |
ELS | - | Equity-Linked Security |
Legend |
(a) Non-income producing |
(b) Affiliated fund that is generally available only to investment companies and other accounts managed by Fidelity Investments. The rate quoted is the annualized seven-day yield of the fund at period end. A complete unaudited listing of the fund's holdings as of its most recent quarter end is available upon request. In addition, each Fidelity Central Fund's financial statements, which are not covered by the Fund's Report of Independent Registered Public Accounting Firm, are available on the SEC's website or upon request. |
(c) Investment made with cash collateral received from securities on loan. |
(d) Security or a portion of the security is on loan at period end. |
Affiliated Central Funds |
Information regarding fiscal year to date income earned by the Fund from investments in Fidelity Central Funds is as follows: |
Fund | Income earned |
Fidelity Cash Central Fund | $ 60,957 |
Fidelity Securities Lending Cash Central Fund | 314,677 |
Total | $ 375,634 |
Other Information |
Categorizations in the Schedule of Investments are based on country or territory of incorporation. |
The following is a summary of the inputs used, as of October 31, 2015, involving the Fund's assets and liabilities carried at fair value. The inputs or methodology used for valuing securities may not be an indication of the risk associated with investing in those securities. For more information on valuation inputs, and their aggregation into the levels used in the tables below, please refer to the Investment Valuation section in the accompanying Notes to Financial Statements. |
Valuation Inputs at Reporting Date: |
Description | Total | Level 1 | Level 2 | Level 3 |
Investments in Securities: | | | | |
Equities: | | | | |
Consumer Discretionary | $ 610,009,119 | $ 332,374,065 | $ 277,635,054 | $ - |
Consumer Staples | 282,748,985 | 180,750,516 | 101,998,469 | - |
Energy | 36,954,667 | 36,954,667 | - | - |
Financials | 635,661,599 | 228,363,072 | 407,298,527 | - |
Health Care | 278,316,168 | 164,017,709 | 114,298,459 | - |
Industrials | 377,073,256 | 172,899,052 | 204,174,204 | - |
Information Technology | 763,120,818 | 471,262,607 | 291,858,211 | - |
Materials | 154,814,712 | 123,322,723 | 31,491,989 | - |
Telecommunication Services | 48,397,280 | 14,853,593 | 33,543,687 | - |
Utilities | 83,598,716 | 14,967,708 | 68,631,008 | - |
Money Market Funds | 61,570,573 | 61,570,573 | - | - |
Total Investments in Securities: | $ 3,332,265,893 | $ 1,801,336,285 | $ 1,530,929,608 | $ - |
The following is a summary of transfers between Level 1 and Level 2 for the period ended October 31, 2015. Transfers are assumed to have occurred at the beginning of the period, and are primarily attributable to the valuation techniques used for foreign equity securities, as discussed in the accompanying Notes to Financial Statements: |
Transfers | Total |
Level 1 to Level 2 | $ 59,835,425 |
Level 2 to Level 1 | $ 26,402,509 |
See accompanying notes which are an integral part of the financial statements.
Annual Report
Fidelity Emerging Markets Fund
Statement of Assets and Liabilities
| | October 31, 2015 |
| | |
Assets | | |
Investment in securities, at value (including securities loaned of $40,686,767) - See accompanying schedule: Unaffiliated issuers (cost $3,089,868,126) | $ 3,270,695,320 | |
Fidelity Central Funds (cost $61,570,573) | 61,570,573 | |
Total Investments (cost $3,151,438,699) | | $ 3,332,265,893 |
Cash | | 1,673,531 |
Foreign currency held at value (cost $11,224,220) | | 11,217,793 |
Receivable for investments sold | | 23,933,070 |
Receivable for fund shares sold | | 22,530,197 |
Dividends receivable | | 2,169,756 |
Distributions receivable from Fidelity Central Funds | | 12,992 |
Prepaid expenses | | 9,184 |
Other receivables | | 1,901,903 |
Total assets | | 3,395,714,319 |
| | |
Liabilities | | |
Payable for investments purchased | $ 50,795,978 | |
Payable for fund shares redeemed | 6,937,787 | |
Accrued management fee | 1,882,234 | |
Other affiliated payables | 666,377 | |
Other payables and accrued expenses | 1,122,515 | |
Collateral on securities loaned, at value | 41,335,000 | |
Total liabilities | | 102,739,891 |
| | |
Net Assets | | $ 3,292,974,428 |
Net Assets consist of: | | |
Paid in capital | | $ 3,359,240,649 |
Undistributed net investment income | | 15,496,040 |
Accumulated undistributed net realized gain (loss) on investments and foreign currency transactions | | (261,563,810) |
Net unrealized appreciation (depreciation) on investments and assets and liabilities in foreign currencies | | 179,801,549 |
Net Assets | | $ 3,292,974,428 |
| | |
Emerging Markets:
Net Asset Value, offering price and redemption price per share ($2,738,933,655 ÷ 121,470,383 shares) | | $ 22.55 |
| | |
Class K:
Net Asset Value, offering price and redemption price per share ($554,040,773 ÷ 24,533,490 shares) | | $ 22.58 |
Statement of Operations
| Year ended October 31, 2015 |
| | |
Investment Income | | |
Dividends | | $ 63,932,125 |
Interest | | 147 |
Income from Fidelity Central Funds | | 375,634 |
Income before foreign taxes withheld | | 64,307,906 |
Less foreign taxes withheld | | (6,043,871) |
Total income | | 58,264,035 |
| | |
Expenses | | |
Management fee | $ 22,451,101 | |
Transfer agent fees | 6,767,826 | |
Accounting and security lending fees | 1,376,420 | |
Custodian fees and expenses | 1,736,316 | |
Independent trustees' compensation | 13,489 | |
Registration fees | 95,824 | |
Audit | 119,135 | |
Legal | 7,815 | |
Interest | 4,273 | |
Miscellaneous | 23,203 | |
Total expenses before reductions | 32,595,402 | |
Expense reductions | (574,024) | 32,021,378 |
Net investment income (loss) | | 26,242,657 |
Realized and Unrealized Gain (Loss) | | |
Net realized gain (loss) on: | | |
Investment securities: | | |
Unaffiliated issuers (net of foreign taxes of $2,309,017) | (229,416,969) | |
Foreign currency transactions | (2,322,602) | |
Total net realized gain (loss) | | (231,739,571) |
Change in net unrealized appreciation (depreciation) on: Investment securities (net of decrease in deferred foreign taxes of $3,167,103) | (191,854,165) | |
Assets and liabilities in foreign currencies | (90,515) | |
Total change in net unrealized appreciation (depreciation) | | (191,944,680) |
Net gain (loss) | | (423,684,251) |
Net increase (decrease) in net assets resulting from operations | | $ (397,441,594) |
See accompanying notes which are an integral part of the financial statements.
Annual Report
Fidelity Emerging Markets Fund
Financial Statements - continued
Statement of Changes in Net Assets
| Year ended
October 31,
2015 | Year ended
October 31,
2014 |
Increase (Decrease) in Net Assets | | |
Operations | | |
Net investment income (loss) | $ 26,242,657 | $ 21,069,375 |
Net realized gain (loss) | (231,739,571) | 19,330,340 |
Change in net unrealized appreciation (depreciation) | (191,944,680) | 67,110,574 |
Net increase (decrease) in net assets resulting from operations | (397,441,594) | 107,510,289 |
Distributions to shareholders from net investment income | (18,114,621) | (2,412,320) |
Distributions to shareholders from net realized gain | (2,942,055) | - |
Total distributions | (21,056,676) | (2,412,320) |
Share transactions - net increase (decrease) | 716,596,433 | 100,101,946 |
Redemption fees | 519,430 | 450,436 |
Total increase (decrease) in net assets | 298,617,593 | 205,650,351 |
| | |
Net Assets | | |
Beginning of period | 2,994,356,835 | 2,788,706,484 |
End of period (including undistributed net investment income of $15,496,040 and undistributed net investment income of $16,555,118, respectively) | $ 3,292,974,428 | $ 2,994,356,835 |
Financial Highlights - Fidelity Emerging Markets Fund
Years ended October 31, | 2015 | 2014 | 2013 | 2012 | 2011 |
Selected Per-Share Data | | | | | |
Net asset value, beginning of period | $ 25.44 | $ 24.43 | $ 22.15 | $ 22.23 | $ 25.72 |
Income from Investment Operations | | | | | |
Net investment income (loss) B | .19 | .17 | .20 | .33 | .35 |
Net realized and unrealized gain (loss) | (2.91) | .86 | 2.38 | (.11) | (3.48) |
Total from investment operations | (2.72) | 1.03 | 2.58 | .22 | (3.13) |
Distributions from net investment income | (.14) | (.02) | (.30) | (.30) | (.24) |
Distributions from net realized gain | (.03) | - | - | - | (.13) |
Total distributions | (.17) | (.02) | (.30) | (.30) | (.37) |
Redemption fees added to paid in capitalB | - F | - F | - F | - F | .01 |
Net asset value, end of period | $ 22.55 | $ 25.44 | $ 24.43 | $ 22.15 | $ 22.23 |
Total ReturnA | (10.76)% | 4.22% | 11.78% | 1.03% | (12.33)% |
Ratios to Average Net AssetsC, E | | | | | |
Expenses before reductions | 1.05% | 1.07% | 1.08% | 1.09% | 1.07% |
Expenses net of fee waivers, if any | 1.05% | 1.07% | 1.08% | 1.09% | 1.07% |
Expenses net of all reductions | 1.03% | 1.07% | 1.03% | 1.03% | 1.01% |
Net investment income (loss) | .78% | .71% | .85% | 1.50% | 1.38% |
Supplemental Data | | | | | |
Net assets, end of period (000 omitted) | $ 2,738,934 | $ 2,370,927 | $ 2,241,338 | $ 2,203,756 | $ 2,907,884 |
Portfolio turnover rateD | 107% | 94% | 119% | 176% | 122% |
ATotal returns would have been lower if certain expenses had not been reduced during the applicable periods shown. BCalculated based on average shares outstanding during the period. CFees and expenses of any underlying Fidelity Central Funds are not included in the Fund's expense ratio. The Fund indirectly bears its proportionate share of the expenses of any underlying Fidelity Central Funds. DAmount does not include the portfolio activity of any underlying Fidelity Central Funds. EExpense ratios reflect operating expenses of the class. Expenses before reductions do not reflect amounts reimbursed by the investment adviser or reductions from brokerage service arrangements or reductions from other expense offset arrangements and do not represent the amount paid by the class during periods when reimbursements or reductions occur. Expenses net of fee waivers reflect expenses after reimbursement by the investment adviser but prior to reductions from brokerage service arrangements or other expense offset arrangements. Expenses net of all reductions represent the net expenses paid by the class. FAmount represents less than $.005 per share. |
See accompanying notes which are an integral part of the financial statements.
Annual Report
Financial Highlights - Fidelity Emerging Markets Fund Class K
Years ended October 31, | 2015 | 2014 | 2013 | 2012 | 2011 |
Selected Per-Share Data | | | | | |
Net asset value, beginning of period | $ 25.48 | $ 24.42 | $ 22.15 | $ 22.23 | $ 25.75 |
Income from Investment Operations | | | | | |
Net investment income (loss) B | .24 | .23 | .25 | .37 | .40 |
Net realized and unrealized gain (loss) | (2.92) | .86 | 2.38 | (.10) | (3.48) |
Total from investment operations | (2.68) | 1.09 | 2.63 | .27 | (3.08) |
Distributions from net investment income | (.20) | (.03) | (.36) | (.35) | (.32) |
Distributions from net realized gain | (.03) | - | - | - | (.13) |
Total distributions | (.22) G | (.03) | (.36) | (.35) | (.45) |
Redemption fees added to paid in capitalB | - F | - F | - F | - F | .01 |
Net asset value, end of period | $ 22.58 | $ 25.48 | $ 24.42 | $ 22.15 | $ 22.23 |
Total ReturnA | (10.60)% | 4.47% | 12.01% | 1.25% | (12.17)% |
Ratios to Average Net AssetsC, E | | | | | |
Expenses before reductions | .85% | .86% | .87% | .87% | .87% |
Expenses net of fee waivers, if any | .85% | .85% | .87% | .87% | .87% |
Expenses net of all reductions | .83% | .85% | .82% | .81% | .80% |
Net investment income (loss) | .98% | .92% | 1.07% | 1.72% | 1.58% |
Supplemental Data | | | | | |
Net assets, end of period (000 omitted) | $ 554,041 | $ 623,430 | $ 547,369 | $ 607,919 | $ 497,821 |
Portfolio turnover rateD | 107% | 94% | 119% | 176% | 122% |
ATotal returns would have been lower if certain expenses had not been reduced during the applicable periods shown. BCalculated based on average shares outstanding during the period. CFees and expenses of any underlying Fidelity Central Funds are not included in the Fund's expense ratio. The Fund indirectly bears its proportionate share of the expenses of any underlying Fidelity Central Funds. DAmount does not include the portfolio activity of any underlying Fidelity Central Funds. EExpense ratios reflect operating expenses of the class. Expenses before reductions do not reflect amounts reimbursed by the investment adviser or reductions from brokerage service arrangements or reductions from other expense offset arrangements and do not represent the amount paid by the class during periods when reimbursements or reductions occur. Expenses net of fee waivers reflect expenses after reimbursement by the investment adviser but prior to reductions from brokerage service arrangements or other expense offset arrangements. Expenses net of all reductions represent the net expenses paid by the class. FAmount represents less than $.005 per share. GTotal distributions of $.22 per share is comprised of distributions from net investment income of $.195 and distributions from net realized gain of $.025 per share. |
See accompanying notes which are an integral part of the financial statements.
Annual Report
For the period ended October 31, 2015
1. Organization.
Fidelity Emerging Markets Fund (the Fund) is a fund of Fidelity Investment Trust (the Trust) and is authorized to issue an unlimited number of shares. The Trust is registered under the Investment Company Act of 1940, as amended (the 1940 Act), as an open-end management investment company organized as a Massachusetts business trust. The Fund offers Emerging Markets and Class K shares, each of which has equal rights as to assets and voting privileges. Each class has exclusive voting rights with respect to matters that affect that class. The Fund's investments in emerging markets can be subject to social, economic, regulatory, and political uncertainties and can be extremely volatile.
2. Investments in Fidelity Central Funds.
The Fund invests in Fidelity Central Funds, which are open-end investment companies generally available only to other investment companies and accounts managed by the investment adviser and its affiliates. The Fund's Schedule of Investments lists each of the Fidelity Central Funds held as of period end, if any, as an investment of the Fund, but does not include the underlying holdings of each Fidelity Central Fund. As an Investing Fund, the Fund indirectly bears its proportionate share of the expenses of the underlying Fidelity Central Funds.
The Money Market Central Funds seek preservation of capital and current income and are managed by Fidelity Investments Money Management, Inc. (FIMM), an affiliate of the investment adviser. Annualized expenses of the Money Market Central Funds as of their most recent shareholder report date are less than .005%.
A complete unaudited list of holdings for each Fidelity Central Fund is available upon request or at the Securities and Exchange Commission (the SEC) website at www.sec.gov. In addition, the financial statements of the Fidelity Central Funds, which are not covered by the Fund's Report of Independent Registered Public Accounting Firm, are available on the SEC website or upon request.
3. Significant Accounting Policies.
The financial statements have been prepared in conformity with accounting principles generally accepted in the United States of America (GAAP), which require management to make certain estimates and assumptions at the date of the financial statements. Actual results could differ from those estimates. Subsequent events, if any, through the date that the financial statements were issued have been evaluated in the preparation of the financial statements. The following summarizes the significant accounting policies of the Fund:
Investment Valuation. Investments are valued as of 4:00 p.m. Eastern time on the last calendar day of the period. The Board of Trustees (the Board) has delegated the day to day responsibility for the valuation of the Fund's investments to the Fidelity Management & Research Company (FMR) Fair Value Committee (the Committee). In accordance with valuation policies and procedures approved by the Board, the Fund attempts to obtain prices from one or more third party pricing vendors or brokers to value its investments. When current market prices, quotations or currency exchange rates are not readily available or reliable, investments will be fair valued in good faith by the Committee, in accordance with procedures adopted by the Board. Factors used in determining fair value vary by investment type and may include market or investment specific events. The frequency with which these procedures are used cannot be predicted and they may be utilized to a significant extent. The Committee oversees the Fund's valuation policies and procedures and reports to the Board on the Committee's activities and fair value determinations. The Board monitors the appropriateness of the procedures used in valuing the Fund's investments and ratifies the fair value determinations of the Committee.
The Fund categorizes the inputs to valuation techniques used to value its investments into a disclosure hierarchy consisting of three levels as shown below:
Level 1 - quoted prices in active markets for identical investments
Level 2 - other significant observable inputs (including quoted prices for similar investments, interest rates, prepayment speeds, etc.)
Level 3 - unobservable inputs (including the Fund's own assumptions based on the best information available)
Valuation techniques used to value the Fund's investments by major category are as follows:
Equity securities, including restricted securities, for which market quotations are readily available, are valued at the last reported sale price or official closing price as reported by a third party pricing vendor on the primary market or exchange on which they are traded and are categorized as Level 1 in the hierarchy. In the event there were no sales during the day or closing prices are not available, securities are valued at the last quoted bid price or may be valued using the last available price and are generally categorized as Level 2 in the hierarchy. For foreign equity securities, when market or security specific events arise, comparisons to the valuation of American Depositary Receipts (ADRs), futures contracts, Exchange-Traded Funds (ETFs) and certain indexes as well as quoted prices for similar securities may be used and would be categorized as Level 2 in the hierarchy. Utilizing these techniques may result in transfers between Level 1 and Level 2. For equity securities, including restricted securities, where observable inputs are limited, assumptions about market activity and risk are used and these securities may be categorized as Level 3 in the hierarchy.
Annual Report
Notes to Financial Statements - continued
3. Significant Accounting Policies - continued
Investment Valuation - continued
Investments in open-end mutual funds, including the Fidelity Central Funds, are valued at their closing net asset value (NAV) each business day and are categorized as Level 1 in the hierarchy.
Changes in valuation techniques may result in transfers in or out of an assigned level within the disclosure hierarchy. The aggregate value of investments by input level as of October 31, 2015, including information on transfers between Levels 1 and 2, is included at the end of the Fund's Schedule of Investments.
Foreign Currency. The Fund may use foreign currency contracts to facilitate transactions in foreign-denominated securities. Gains and losses from these transactions may arise from changes in the value of the foreign currency or if the counterparties do not perform under the contracts' terms.
Foreign-denominated assets, including investment securities, and liabilities are translated into U.S. dollars at the exchange rates at period end. Purchases and sales of investment securities, income and dividends received and expenses denominated in foreign currencies are translated into U.S. dollars at the exchange rate in effect on the transaction date.
The effects of exchange rate fluctuations on investments are included with the net realized and unrealized gain (loss) on investment securities. Other foreign currency transactions resulting in realized and unrealized gain (loss) are disclosed separately.
Investment Transactions and Income. For financial reporting purposes, the Fund's investment holdings and NAV include trades executed through the end of the last business day of the period. The NAV per share for processing shareholder transactions is calculated as of the close of business of the New York Stock Exchange (NYSE), normally 4:00 p.m. Eastern time and includes trades executed through the end of the prior business day. Gains and losses on securities sold are determined on the basis of identified cost and may include proceeds received from litigation. Dividend income is recorded on the ex-dividend date, except for certain dividends from foreign securities where the ex-dividend date may have passed, which are recorded as soon as the Fund is informed of the ex-dividend date. Non-cash dividends included in dividend income, if any, are recorded at the fair market value of the securities received. Income and capital gain distributions from Fidelity Central Funds, if any, are recorded on the ex-dividend date. Interest income is accrued as earned and includes coupon interest and amortization of premium and accretion of discount on debt securities as applicable. Investment income is recorded net of foreign taxes withheld where recovery of such taxes is uncertain.
Class Allocations and Expenses. Investment income, realized and unrealized capital gains and losses, common expenses of the Fund, and certain fund-level expense reductions, if any, are allocated daily on a pro-rata basis to each class based on the relative net assets of each class to the total net assets of the Fund. Each class differs with respect to transfer agent fees incurred. Certain expense reductions may also differ by class. For the reporting period, the allocated portion of income and expenses to each class as a percent of its average net assets may vary due to the timing of recording these transactions in relation to fluctuating net assets of the classes. Expenses directly attributable to a fund are charged to that fund. Expenses attributable to more than one fund are allocated among the respective funds on the basis of relative net assets or other appropriate methods. Expense estimates are accrued in the period to which they relate and adjustments are made when actual amounts are known.
Income Tax Information and Distributions to Shareholders. Each year, the Fund intends to qualify as a regulated investment company under Subchapter M of the Internal Revenue Code, including distributing substantially all of its taxable income and realized gains. As a result, no provision for U.S. Federal income taxes is required. As of October 31, 2015, the Fund did not have any unrecognized tax benefits in the financial statements; nor is the Fund aware of any tax positions for which it is reasonably possible that the total amounts of unrecognized tax benefits will significantly change in the next twelve months. The Fund files a U.S. federal tax return, in addition to state and local tax returns as required. The Fund's federal income tax returns are subject to examination by the Internal Revenue Service (IRS) for a period of three fiscal years after they are filed. State and local tax returns may be subject to examination for an additional fiscal year depending on the jurisdiction. Foreign taxes are provided for based on the Fund's understanding of the tax rules and rates that exist in the foreign markets in which it invests. The Fund is subject to a tax imposed on capital gains by certain countries in which it invests. An estimated deferred tax liability for net unrealized appreciation on the applicable securities is included in Other payables and accrued expenses on the Statement of Assets & Liabilities.
Distributions are declared and recorded on the ex-dividend date. Income dividends and capital gain distributions are declared separately for each class. Income and capital gain distributions are determined in accordance with income tax regulations, which may differ from GAAP. In addition, the Fund claimed a portion of the payment made to redeeming shareholders as a distribution for income tax purposes.
Capital accounts within the financial statements are adjusted for permanent book-tax differences. These adjustments have no impact on net assets or the results of operations. Capital accounts are not adjusted for temporary book-tax differences which will reverse in a subsequent period.
Book-tax differences are primarily due to foreign currency transactions, certain foreign taxes, passive foreign investment companies (PFIC), deferred trustees compensation, capital loss carryforwards and losses deferred due to wash sales.
Annual Report
3. Significant Accounting Policies - continued
Income Tax Information and Distributions to Shareholders - continued
The federal tax cost of investment securities and unrealized appreciation (depreciation) as of period end were as follows:
Gross unrealized appreciation | $ 378,134,375 |
Gross unrealized depreciation | (220,237,005) |
Net unrealized appreciation (depreciation) on securities | $ 157,897,370 |
Tax Cost | $ 3,174,368,523 |
The tax-based components of distributable earnings as of period end were as follows:
Undistributed ordinary income | $ 15,537,050 |
Capital loss carryforward | $ (238,633,987) |
Net unrealized appreciation (depreciation) on securities and other investments | $ 157,194,348 |
Capital loss carryforwards are only available to offset future capital gains of the Fund to the extent provided by regulations and may be limited. Under the Regulated Investment Company Modernization Act of 2010 (the Act), the Fund is permitted to carry forward capital losses incurred in taxable years beginning after December 22, 2010 for an unlimited period and such capital losses are required to be used prior to any losses that expire. The capital loss carryforward information presented below, including any applicable limitation, is estimated as of fiscal period end and is subject to adjustment.
Fiscal year of expiration | |
2017 | $ (24,838,920) |
No expiration | |
Short-term | (189,293,193) |
Long-term | (24,501,874) |
Total no expiration | (213,795,067) |
Total capital loss carryforward | $ (238,633,987) |
The tax character of distributions paid was as follows:
| October 31, 2015 | October 31, 2014 |
Ordinary Income | $ 21,056,676 | $ 2,412,320 |
Short-Term Trading (Redemption) Fees. Shares held by investors in the Fund less than 90 days may have been subject to a redemption fee equal to 1.50% of the NAV of shares redeemed. All redemption fees, which reduce the proceeds of the shareholder redemption, are retained by the Fund and accounted for as an addition to paid in capital.
4. Purchases and Sales of Investments.
Purchases and sales of securities, other than short-term securities, aggregated $4,100,863,386 and $3,362,222,832, respectively.
5. Fees and Other Transactions with Affiliates.
Management Fee. Fidelity Management & Research Company (the investment adviser) and its affiliates provide the Fund with investment management related services for which the Fund pays a monthly management fee. The management fee is the sum of an individual fund fee rate that is based on an annual rate of .45% of the Fund's average net assets and an annualized group fee rate that averaged .25% during the period. The group fee rate is based upon the average net assets of all the mutual funds advised by the investment adviser, including any mutual funds previously advised by the investment adviser that are currently advised by Fidelity SelectCo, LLC, an affiliate of the investment adviser. The group fee rate decreases as assets under management increase and increases as assets under management decrease. For the reporting period, the total annual management fee rate was .70% of the Fund's average net assets.
Transfer Agent Fees. Fidelity Investments Institutional Operations Company, Inc., (FIIOC), an affiliate of the investment adviser, is the transfer, dividend disbursing and shareholder servicing agent for each class of the Fund. FIIOC receives account fees and asset-based fees that vary according to the account size and type of account of the shareholders of Emerging Markets. FIIOC receives an asset-based fee of Class K's average net assets. FIIOC pays for typesetting, printing and mailing of shareholder reports, except proxy statements.
Annual Report
Notes to Financial Statements - continued
5. Fees and Other Transactions with Affiliates - continued
Transfer Agent Fees - continued
For the period, transfer agent fees for each class were as follows:
| Amount | % of
Class-Level Average
Net Assets |
Emerging Markets | $ 6,491,538 | .25 |
Class K | 276,288 | .05 |
| $ 6,767,826 | |
Accounting and Security Lending Fees. Fidelity Service Company, Inc. (FSC), an affiliate of the investment adviser, maintains the Fund's accounting records. The accounting fee is based on the level of average net assets for each month. Under a separate contract, FSC administers the security lending program. The security lending fee is based on the number and duration of lending transactions.
Brokerage Commissions. The Fund placed a portion of its portfolio transactions with brokerage firms which are affiliates of the investment adviser. Brokerage commissions are included in net realized gain (loss) and change in net unrealized appreciation (depreciation) in the Statement of Operations. The commissions paid to these affiliated firms were $12,868 for the period.
Interfund Lending Program. Pursuant to an Exemptive Order issued by the SEC, the Fund, along with other registered investment companies having management contracts with FMR or other affiliated entities of FMR, may participate in an interfund lending program. This program provides an alternative credit facility allowing the funds to borrow from, or lend money to, other participating affiliated funds. At period end, there were no interfund loans outstanding. The Fund's activity in this program during the period for which loans were outstanding was as follows:
Borrower or Lender | Average Loan Balance | Weighted Average
Interest Rate | Interest Expense |
Borrower | $ 14,684,552 | .36% | $ 4,273 |
6. Committed Line of Credit.
The Fund participates with other funds managed by the investment adviser or an affiliate in a $4.25 billion credit facility (the "line of credit") to be utilized for temporary or emergency purposes to fund shareholder redemptions or for other short-term liquidity purposes. The Fund has agreed to pay commitment fees on its pro-rata portion of the line of credit, which amounted to $4,547 and is reflected in Miscellaneous expenses on the Statement of Operations. During the period, the Fund did not borrow on this line of credit.
7. Security Lending.
The Fund lends portfolio securities through a lending agent from time to time in order to earn additional income. For equity securities, a lending agent is used and may loan securities to certain qualified borrowers, including Fidelity Capital Markets (FCM), a broker-dealer affiliated with the Fund. On the settlement date of the loan, the Fund receives collateral (in the form of U.S. Treasury obligations, letters of credit and/or cash) against the loaned securities and maintains collateral in an amount not less than 100% of the market value of the loaned securities during the period of the loan. The market value of the loaned securities is determined at the close of business of the Fund and any additional required collateral is delivered to the Fund on the next business day. The Fund or borrower may terminate the loan at any time, and if the borrower defaults on its obligation to return the securities loaned because of insolvency or other reasons, the Fund may apply collateral received from the borrower against the obligation. The Fund may experience delays and costs in recovering the securities loaned. Any cash collateral received is invested in the Fidelity Securities Lending Cash Central Fund. The value of loaned securities and cash collateral at period end are disclosed on the Fund's Statement of Assets and Liabilities. At period end, there were no security loans outstanding with FCM. Security lending income represents the income earned on investing cash collateral, less rebates paid to borrowers and any lending agent fees associated with the loan, plus any premium payments received for lending certain types of securities. Security lending income is presented in the Statement of Operations as a component of income from Fidelity Central Funds. Total security lending income during the period amounted to $314,677, including $2,907 from securities loaned to FCM.
8. Expense Reductions.
Commissions paid to certain brokers with whom the investment adviser, or its affiliates, places trades on behalf of the Fund include an amount in addition to trade execution, which may be rebated back to the Fund to offset certain expenses. This amount totaled $498,851 for the period. In addition, through arrangements with the Fund's custodian, credits realized as a result of certain uninvested cash balances were used to reduce the Fund's expenses. During the period, these credits reduced the Fund's custody expenses by $662.
Annual Report
8. Expense Reductions - continued
In addition, during the period the investment adviser reimbursed and/or waived a portion of fund-level operating expenses in the amount of $14,121 and a portion of class-level operating expenses as follows:
| Amount |
Emerging Markets | $ 60,390 |
9. Distributions to Shareholders.
Distributions to shareholders of each class were as follows:
Years ended October 31, | 2015 | 2014 |
From net investment income | | |
Emerging Markets | $ 13,346,829 | $ 1,743,046 |
Class K | 4,767,792 | 669,274 |
Total | $ 18,114,621 | $ 2,412,320 |
From net realized gain | | |
Emerging Markets | $ 2,332,143 | $ - |
Class K | 609,912 | - |
Total | $ 2,942,055 | $ - |
10. Share Transactions.
Share transactions for each class were as follows and may contain automatic conversions between classes or exchanges between funds:
| Shares | Dollars |
Years ended October 31, | 2015 | 2014 | 2015 | 2014 |
Emerging Markets | | | | |
Shares sold | 55,410,811 | 21,791,321 | $ 1,332,719,199 | $ 537,287,996 |
Reinvestment of distributions | 546,115 | 57,233 | 13,577,228 | 1,363,124 |
Shares redeemed | (27,685,404) | (20,408,773) | (631,200,476) | (492,243,181) |
Net increase (decrease) | 28,271,522 | 1,439,781 | $ 715,095,951 | $ 46,407,939 |
Class K | | | | |
Shares sold | 8,915,876 | 8,911,150 | $ 215,741,410 | $ 221,271,615 |
Reinvestment of distributions | 216,324 | 28,071 | 5,377,704 | 669,274 |
Shares redeemed | (9,064,709) | (6,884,435) | (219,618,632) | (168,246,882) |
Net increase (decrease) | 67,491 | 2,054,786 | $ 1,500,482 | $ 53,694,007 |
11. Other.
The Fund's organizational documents provide former and current trustees and officers with a limited indemnification against liabilities arising in connection with the performance of their duties to the Fund. In the normal course of business, the Fund may also enter into contracts that provide general indemnifications. The Fund's maximum exposure under these arrangements is unknown as this would be dependent on future claims that may be made against the Fund. The risk of material loss from such claims is considered remote.
At the end of the period, Strategic Advisers Emerging Markets Fund was the owner of record of approximately 14% of the total outstanding shares of the Fund.
Annual Report
Fidelity Europe Fund
Average annual total return reflects the change in the value of an investment, assuming reinvestment of the class' distributions from dividend income and capital gains (the profits earned upon the sale of securities that have grown in value, if any) and assuming a constant rate of performance each year. The $10,000 table and the fund's returns do not reflect the deduction of taxes that a shareholder would pay on fund distributions or the redemption of fund shares. During periods of reimbursement by Fidelity, a fund's total return will be greater than it would be had the reimbursement not occurred. How a fund did yesterday is no guarantee of how it will do tomorrow.
Average Annual Total Returns
Periods ended October 31, 2015 | Past 1
year | Past 5
years | Past 10
years |
Fidelity Europe Fund | 4.97% | 6.07% | 5.03% |
$10,000 Over 10 Years
Let's say hypothetically that $10,000 was invested in Fidelity Europe Fund, a class of the fund, on October 31, 2005. The chart shows how the value of your investment would have changed, and also shows how the MSCI Europe Index performed over the same period.

Annual Report
Fidelity Europe Fund
Market Recap: International equities suffered a moderate setback for the 12 months ending October 31, 2015, held back by a collapse in commodities prices that hurt resources-related sectors and geographies. The MSCI ACWI (All Country World Index) ex USA Index returned -4.55% for the period, affected also by concerns about global economic growth. Commodity producers remained under pressure for much of the past year, largely related to economic deceleration in China (-1%), the world's second-largest economy and a leading consumer of raw materials. This effect was exacerbated by U.S. dollar strength relative to global currencies, which weighed on commodities priced in dollars and acutely impacted equity returns within regions most exposed to resources prices. The emerging-markets group, for example, returned about -15% this period. Canada, a significant energy producer, returned roughly -17%. Net energy consumer Japan (+9%) was the best-performing region by far. Only about a quarter of the nearly 50 index countries managed a gain this period: Ireland (+19%) - the EU's fastest-growing economy - and Israel (+17%) proved top performers; Greece (-56%) and Brazil (-46%), among the worst. As for sectors, energy (-25%) and materials (-16%) declined sharply, whereas the two consumer sectors each gained about 6%.
Comments from Portfolio Manager Stefan Lindblad: For the year, the fund's share classes (excluding sales charges, if applicable) delivered mid-single-digit gains, handily outpacing the 0.04% return of the MSCI Europe Index. It was a volatile period for European stocks, partly stoked by European Central Bank intervention and weakness in commodities. Stock selection by far drove the fund's performance relative to the MSCI index, led by choices in health care, energy and financials. Avoiding poor-performing index component U.K.-based oil and gas company Royal Dutch Shell provided the fund's top individual contributor. Underweighting U.K.-based HSBC and avoiding Spanish bank Banco Santander also proved additive. On the downside, choices in the food, beverage & tobacco industry group hurt, as was positioning in telecommunication services. The most significant individual detractor was U.K.-based international bank Standard Chartered. I underestimated the company's balance sheet issues, and I did not foresee the slowdown in emerging markets, which weighed heavily on the stock's price. Encouraged by the company's management changes, I increased the fund's stake on weakness by period end.
The views expressed above reflect those of the portfolio manager(s) only through the end of the period as stated on the cover of this report and do not necessarily represent the views of Fidelity or any other person in the Fidelity organization. Any such views are subject to change at any time based upon market or other conditions and Fidelity disclaims any responsibility to update such views. These views may not be relied on as investment advice and, because investment decisions for a Fidelity fund are based on numerous factors, may not be relied on as an indication of trading intent on behalf of any Fidelity fund.
Annual Report
Fidelity Europe Fund
As a shareholder of the Fund, you incur two types of costs: (1) transaction costs, including sales charges (loads) on purchase payments or redemption proceeds, redemption fees and (2) ongoing costs, including management fees, distribution and/or service (12b-1) fees and other Fund expenses. This Example is intended to help you understand your ongoing costs (in dollars) of investing in the Fund and to compare these costs with the ongoing costs of investing in other mutual funds.
The Example is based on an investment of $1,000 invested at the beginning of the period and held for the entire period (May 1, 2015 to October 31, 2015).
Actual Expenses
The first line of the accompanying table for each class of the Fund provides information about actual account values and actual expenses. You may use the information in this line, together with the amount you invested, to estimate the expenses that you paid over the period. Simply divide your account value by $1,000.00 (for example, an $8,600 account value divided by $1,000.00 = 8.6), then multiply the result by the number in the first line for a class of the Fund under the heading entitled "Expenses Paid During Period" to estimate the expenses you paid on your account during this period. A small balance maintenance fee of $12.00 that is charged once a year may apply for certain accounts with a value of less than $2,000. This fee is not included in the table below. If it was, the estimate of expenses you paid during the period would be higher, and your ending account value lower, by this amount. In addition, the Fund, as a shareholder in the underlying Fidelity Central Funds, will indirectly bear its pro-rata share of the fees and expenses incurred by the underlying Fidelity Central Funds. These fees and expenses are not included in the Fund's annualized expense ratio used to calculate the expense estimate in the table below.
Hypothetical Example for Comparison Purposes
The second line of the accompanying table for each class of the Fund provides information about hypothetical account values and hypothetical expenses based on a Class' actual expense ratio and an assumed rate of return of 5% per year before expenses, which is not the Class' actual return. The hypothetical account values and expenses may not be used to estimate the actual ending account balance or expenses you paid for the period. You may use this information to compare the ongoing costs of investing in the Fund and other funds. To do so, compare this 5% hypothetical example with the 5% hypothetical examples that appear in the shareholder reports of the other funds. A small balance maintenance fee of $12.00 that is charged once a year may apply for certain accounts with a value of less than $2,000. This fee is not included in the table below. If it was, the estimate of expenses you paid during the period would be higher, and your ending account value lower, by this amount. In addition, the Fund, as a shareholder in the underlying Fidelity Central Funds, will indirectly bear its pro-rata share of the fees and expenses incurred by the underlying Fidelity Central Funds. These fees and expenses are not included in the Fund's annualized expense ratio used to calculate the expense estimate in the table below.
Please note that the expenses shown in the table are meant to highlight your ongoing costs only and do not reflect any transaction costs. Therefore, the second line of the table is useful in comparing ongoing costs only, and will not help you determine the relative total costs of owning different funds. In addition, if these transactional costs were included, your costs would have been higher.
| Annualized
Expense RatioB | Beginning
Account Value
May 1, 2015 | Ending
Account Value
October 31, 2015 | Expenses Paid
During PeriodC
May 1, 2015
to October 31, 2015 |
Class A | 1.33% | | | |
Actual | | $ 1,000.00 | $ 952.70 | $ 6.55 |
HypotheticalA | | $ 1,000.00 | $ 1,018.50 | $ 6.77 |
Class T | 1.61% | | | |
Actual | | $ 1,000.00 | $ 951.60 | $ 7.92 |
HypotheticalA | | $ 1,000.00 | $ 1,017.09 | $ 8.19 |
Class B | 2.14% | | | |
Actual | | $ 1,000.00 | $ 948.90 | $ 10.51 |
HypotheticalA | | $ 1,000.00 | $ 1,014.42 | $ 10.87 |
Class C | 2.15% | | | |
Actual | | $ 1,000.00 | $ 949.00 | $ 10.56 |
HypotheticalA | | $ 1,000.00 | $ 1,014.37 | $ 10.92 |
Europe | 1.03% | | | |
Actual | | $ 1,000.00 | $ 954.30 | $ 5.07 |
HypotheticalA | | $ 1,000.00 | $ 1,020.01 | $ 5.24 |
Class I | .97% | | | |
Actual | | $ 1,000.00 | $ 954.60 | $ 4.78 |
HypotheticalA | | $ 1,000.00 | $ 1,020.32 | $ 4.94 |
A 5% return per year before expenses
B Annualized expense ratio reflects expenses net of applicable fee waivers.
C Expenses are equal to each Class' annualized expense ratio, multiplied by the average account value over the period, multiplied by 184/365 (to reflect the one-half year period).
Annual Report
Fidelity Europe Fund
Investment Changes (Unaudited)
Asset Allocation as of October 31, 2015 |
| % of fund's
net assets | % of fund's net assets
6 months ago |
Stocks | 99.7 | 96.0 |
Short-Term Investments and Net Other Assets (Liabilities) | 0.3 | 4.0 |
Top Ten Stocks as of October 31, 2015 |
| % of fund's
net assets | % of fund's net assets
6 months ago |
Shire PLC (Bailiwick of Jersey, Pharmaceuticals) | 3.2 | 2.5 |
Getinge AB (B Shares) (Sweden, Health Care Equipment & Supplies) | 2.9 | 2.7 |
Standard Chartered PLC (United Kingdom) (United Kingdom, Banks) | 2.9 | 2.5 |
Sanofi SA (France, Pharmaceuticals) | 2.7 | 0.0 |
Bayer AG (Germany, Pharmaceuticals) | 2.4 | 2.1 |
Novozymes A/S Series B (Denmark, Chemicals) | 2.2 | 0.0 |
William Hill PLC (United Kingdom, Hotels, Restaurants & Leisure) | 2.0 | 1.1 |
William Demant Holding A/S (Denmark, Health Care Equipment & Supplies) | 1.8 | 1.0 |
Prudential PLC (United Kingdom, Insurance) | 1.8 | 1.7 |
H&M Hennes & Mauritz AB (B Shares) (Sweden, Specialty Retail) | 1.8 | 0.0 |
| 23.7 | |
Market Sectors as of October 31, 2015 |
| % of fund's
net assets | % of fund's net assets
6 months ago |
Financials | 31.6 | 26.0 |
Health Care | 19.8 | 21.0 |
Industrials | 17.5 | 20.1 |
Consumer Discretionary | 16.8 | 13.1 |
Information Technology | 5.4 | 3.7 |
Materials | 4.3 | 2.0 |
Consumer Staples | 3.0 | 7.7 |
Utilities | 1.3 | 1.1 |
Energy | 0.0 | 1.3 |
Percentages shown as 0.0% may reflect amounts less than 0.05%. |
Annual Report
Fidelity Europe Fund
Investments October 31, 2015
Showing Percentage of Net Assets
Common Stocks - 99.7% |
| Shares | | Value |
Austria - 1.9% |
Andritz AG | 276,800 | | $ 13,940,747 |
Erste Group Bank AG (a) | 483,000 | | 14,165,262 |
TOTAL AUSTRIA | | 28,106,009 |
Bailiwick of Jersey - 5.4% |
Shire PLC | 611,200 | | 46,286,714 |
Wolseley PLC | 264,819 | | 15,547,875 |
WPP PLC | 681,400 | | 15,274,830 |
TOTAL BAILIWICK OF JERSEY | | 77,109,419 |
Bermuda - 1.7% |
Vostok Emerging Finance Ltd. (depository receipt) (a) | 6,042,107 | | 1,697,310 |
Vostok New Ventures Ltd. SDR (a) | 3,662,236 | | 23,361,701 |
TOTAL BERMUDA | | 25,059,011 |
Denmark - 6.6% |
Carlsberg A/S Series B | 245,400 | | 20,117,275 |
DSV de Sammensluttede Vognmaend A/S | 414,000 | | 16,786,217 |
Novozymes A/S Series B | 685,500 | | 31,786,881 |
William Demant Holding A/S (a) | 308,800 | | 26,817,136 |
TOTAL DENMARK | | 95,507,509 |
Finland - 2.7% |
Amer Group PLC (A Shares) | 496,800 | | 13,941,732 |
Huhtamaki Oyj | 367,765 | | 12,981,650 |
Valmet Corp. | 1,119,700 | | 11,807,957 |
TOTAL FINLAND | | 38,731,339 |
France - 10.5% |
Bollore Group | 3,447,549 | | 17,067,520 |
Christian Dior SA | 116,895 | | 23,022,156 |
Eurazeo SA | 207,255 | | 14,604,342 |
Havas SA | 2,906,500 | | 25,217,487 |
Publicis Groupe SA | 230,946 | | 14,998,864 |
Sanofi SA | 387,964 | | 39,136,203 |
Wendel SA | 134,300 | | 16,119,599 |
TOTAL FRANCE | | 150,166,171 |
Germany - 9.4% |
adidas AG | 210,600 | | 18,873,652 |
Bayer AG | 258,700 | | 34,521,582 |
Brenntag AG | 343,400 | | 20,750,209 |
CompuGroup Medical AG | 259,600 | | 7,650,573 |
Fresenius SE & Co. KGaA | 244,797 | | 17,988,270 |
GEA Group AG | 337,429 | | 13,530,477 |
LEG Immobilien AG | 265,057 | | 21,146,143 |
TOTAL GERMANY | | 134,460,906 |
Ireland - 2.4% |
DCC PLC (United Kingdom) | 149,700 | | 12,011,970 |
|
| Shares | | Value |
Ryanair Holdings PLC sponsored ADR | 137,767 | | $ 10,772,002 |
United Drug PLC (United Kingdom) | 1,554,241 | | 11,385,877 |
TOTAL IRELAND | | 34,169,849 |
Isle of Man - 3.1% |
Optimal Payments PLC (a) | 4,443,710 | | 20,825,287 |
Playtech Ltd. | 1,767,361 | | 23,322,265 |
TOTAL ISLE OF MAN | | 44,147,552 |
Israel - 1.0% |
Teva Pharmaceutical Industries Ltd. sponsored ADR | 243,500 | | 14,412,765 |
Italy - 1.3% |
Mediolanum SpA | 2,236,635 | | 18,237,309 |
Mediolanum SpA rights | 2,236,635 | | 137 |
TOTAL ITALY | | 18,237,446 |
Netherlands - 1.4% |
RELX NV | 1,181,199 | | 20,197,980 |
Spain - 2.8% |
Amadeus IT Holding SA Class A | 496,600 | | 21,166,301 |
Red Electrica Corporacion SA | 210,300 | | 18,546,763 |
TOTAL SPAIN | | 39,713,064 |
Sweden - 16.5% |
Elekta AB (B Shares) (d) | 2,935,902 | | 22,697,395 |
Getinge AB (B Shares) | 1,679,200 | | 42,041,175 |
H&M Hennes & Mauritz AB (B Shares) | 663,852 | | 25,820,417 |
Hemfosa Fastigheter AB | 1,312,500 | | 14,248,688 |
Indutrade AB | 367,400 | | 17,545,306 |
Kungsleden AB | 1,996,700 | | 14,957,342 |
Lundbergfoeretagen AB | 94,092 | | 4,798,460 |
Nordea Bank AB | 1,897,200 | | 20,984,883 |
Pandox AB (a) | 1,087,500 | | 17,795,003 |
Sandvik AB | 2,359,600 | | 22,067,178 |
Svenska Cellulosa AB (SCA) (B Shares) | 789,200 | | 23,245,081 |
Svenska Handelsbanken AB (A Shares) | 809,700 | | 10,996,924 |
TOTAL SWEDEN | | 237,197,852 |
Switzerland - 2.1% |
Credit Suisse Group AG (e)(f) | 478,733 | | 11,018,439 |
Julius Baer Group Ltd. | 399,440 | | 19,805,238 |
TOTAL SWITZERLAND | | 30,823,677 |
United Kingdom - 30.9% |
Aberdeen Asset Management PLC | 3,164,057 | | 16,911,022 |
Aldermore Group PLC | 2,775,037 | | 11,285,356 |
Ashmore Group PLC (d) | 1,759,300 | | 7,322,770 |
Babcock International Group PLC | 1,323,700 | | 19,671,537 |
Big Yellow Group PLC | 1,465,300 | | 16,941,799 |
Bunzl PLC | 683,458 | | 19,586,774 |
Compass Group PLC | 1,270,417 | | 21,839,618 |
Dechra Pharmaceuticals PLC | 781,752 | | 11,683,918 |
Diploma PLC | 1,297,100 | | 12,827,494 |
Common Stocks - continued |
| Shares | | Value |
United Kingdom - continued |
Essentra PLC | 1,355,136 | | $ 17,590,034 |
International Personal Finance PLC | 3,944,403 | | 22,504,640 |
ITV PLC | 3,587,700 | | 13,959,735 |
LivaNova PLC (a) | 170,566 | | 11,305,114 |
Lloyds Banking Group PLC | 22,279,800 | | 25,287,845 |
London Stock Exchange Group PLC | 405,300 | | 15,901,427 |
Micro Focus International PLC | 595,700 | | 11,534,239 |
Prudential PLC | 1,142,519 | | 26,685,240 |
Rolls-Royce Group PLC | 1,501,292 | | 15,875,437 |
Schroders PLC | 359,422 | | 16,528,354 |
Senior Engineering Group PLC | 3,385,600 | | 11,837,238 |
Shawbrook Group Ltd. | 2,398,200 | | 12,544,142 |
St. James's Place Capital PLC | 577,862 | | 8,592,075 |
Standard Chartered PLC (United Kingdom) | 3,773,966 | | 41,970,662 |
Unite Group PLC | 1,670,087 | | 17,121,131 |
Virgin Money Holdings Uk PLC | 1,163,048 | | 6,953,079 |
William Hill PLC | 5,883,073 | | 28,705,132 |
TOTAL UNITED KINGDOM | | 442,965,812 |
TOTAL COMMON STOCKS (Cost $1,369,293,912) |
1,431,006,361
|
Nonconvertible Preferred Stocks - 0.0% |
| | | |
United Kingdom - 0.0% |
Rolls-Royce Group PLC
(Cost $214,231) | 139,169,768 | |
214,544
|
Money Market Funds - 2.1% |
| Shares | | Value |
Fidelity Cash Central Fund, 0.18% (b) | 14,053,296 | | $ 14,053,296 |
Fidelity Securities Lending Cash Central Fund, 0.19% (b)(c) | 15,283,267 | | 15,283,267 |
TOTAL MONEY MARKET FUNDS (Cost $29,336,563) |
29,336,563
|
TOTAL INVESTMENT
PORTFOLIO - 101.8% (Cost $1,398,844,706) | | 1,460,557,468 |
NET OTHER ASSETS (LIABILITIES) - (1.8)% | | (25,176,509) |
NET ASSETS - 100% | $ 1,435,380,959 |
Legend |
(a) Non-income producing |
(b) Affiliated fund that is generally available only to investment companies and other accounts managed by Fidelity Investments. The rate quoted is the annualized seven-day yield of the fund at period end. A complete unaudited listing of the fund's holdings as of its most recent quarter end is available upon request. In addition, each Fidelity Central Fund's financial statements, which are not covered by the Fund's Report of Independent Registered Public Accounting Firm, are available on the SEC's website or upon request. |
(c) Investment made with cash collateral received from securities on loan. |
(d) Security or a portion of the security is on loan at period end. |
(e) Security or a portion of the security purchased on a delayed delivery or when-issued basis. |
(f) Restricted securities - Investment in securities not registered under the Securities Act of 1933 (excluding 144A issues). At the end of the period, the value of restricted securities (excluding 144A issues) amounted to $11,018,439 or 0.8% of net assets. |
Additional information on each restricted holding is as follows: |
Security | Acquisition Date | Acquisition Cost |
Credit Suisse Group AG | 10/21/15 | $ 11,351,478 |
Affiliated Central Funds |
Information regarding fiscal year to date income earned by the Fund from investments in Fidelity Central Funds is as follows: |
Fund | Income earned |
Fidelity Cash Central Fund | $ 58,484 |
Fidelity Securities Lending Cash Central Fund | 924,214 |
Total | $ 982,698 |
Other Information |
Categorizations in the Schedule of Investments are based on country or territory of incorporation. |
The following is a summary of the inputs used, as of October 31, 2015, involving the Fund's assets and liabilities carried at fair value. The inputs or methodology used for valuing securities may not be an indication of the risk associated with investing in those securities. For more information on valuation inputs, and their aggregation into the levels used in the tables below, please refer to the Investment Valuation section in the accompanying Notes to Financial Statements. |
Valuation Inputs at Reporting Date: |
Description | Total | Level 1 | Level 2 | Level 3 |
Investments in Securities: | | | | |
Equities: | | | | |
Consumer Discretionary | $ 239,646,606 | $ 154,953,374 | $ 84,693,232 | $ - |
Consumer Staples | 43,362,356 | 20,117,275 | 23,245,081 | - |
Financials | 452,691,319 | 358,897,496 | 93,793,823 | - |
Health Care | 285,926,722 | 182,515,535 | 103,411,187 | - |
Industrials | 251,840,482 | 220,417,170 | 31,423,312 | - |
Information Technology | 76,848,092 | 76,848,092 | - | - |
Materials | 62,358,565 | 62,358,565 | - | - |
Utilities | 18,546,763 | 18,546,763 | - | - |
Money Market Funds | 29,336,563 | 29,336,563 | - | - |
Total Investments in Securities: | $ 1,460,557,468 | $ 1,123,990,833 | $ 336,566,635 | $ - |
The following is a summary of transfers between Level 1 and Level 2 for the period ended October 31, 2015. Transfers are assumed to have occurred at the beginning of the period, and are primarily attributable to the valuation techniques used for foreign equity securities, as discussed in the accompanying Notes to Financial Statements: |
Transfers | Total |
Level 1 to Level 2 | $ 86,522,583 |
Level 2 to Level 1 | $ 0 |
See accompanying notes which are an integral part of the financial statements.
Annual Report
Fidelity Europe Fund
Statement of Assets and Liabilities
| | October 31, 2015 |
| | |
Assets | | |
Investment in securities, at value (including securities loaned of $14,512,421) - See accompanying schedule: Unaffiliated issuers (cost $1,369,508,143) | $ 1,431,220,905 | |
Fidelity Central Funds (cost $29,336,563) | 29,336,563 | |
Total Investments (cost $1,398,844,706) | | $ 1,460,557,468 |
Foreign currency held at value (cost $131,652) | | 131,612 |
Receivable for investments sold | | 5,679,719 |
Receivable for fund shares sold | | 444,635 |
Dividends receivable | | 3,187,421 |
Distributions receivable from Fidelity Central Funds | | 20,249 |
Prepaid expenses | | 4,115 |
Other receivables | | 470,045 |
Total assets | | 1,470,495,264 |
| | |
Liabilities | | |
Payable for investments purchased | | |
Regular delivery | $ 6,076,814 | |
Delayed delivery | 11,018,439 | |
Payable for fund shares redeemed | 1,416,898 | |
Accrued management fee | 933,754 | |
Distribution and service plan fees payable | 18,340 | |
Other affiliated payables | 283,034 | |
Other payables and accrued expenses | 83,759 | |
Collateral on securities loaned, at value | 15,283,267 | |
Total liabilities | | 35,114,305 |
| | |
Net Assets | | $ 1,435,380,959 |
Net Assets consist of: | | |
Paid in capital | | $ 1,586,026,086 |
Undistributed net investment income | | 15,983,003 |
Accumulated undistributed net realized gain (loss) on investments and foreign currency transactions | | (228,558,075) |
Net unrealized appreciation (depreciation) on investments and assets and liabilities in foreign currencies | | 61,929,945 |
Net Assets | | $ 1,435,380,959 |
Statement of Assets and Liabilities - continued
| | October 31, 2015 |
| | |
Calculation of Maximum Offering Price | | |
Class A:
Net Asset Value and redemption price per share ($23,381,485 ÷ 630,873 shares) | | $ 37.06 |
| | |
Maximum offering price per share (100/94.25 of $37.06) | | $ 39.32 |
Class T:
Net Asset Value and redemption price per share ($9,631,696 ÷ 260,751 shares) | | $ 36.94 |
| | |
Maximum offering price per share (100/96.50 of $36.94) | | $ 38.28 |
Class B:
Net Asset Value and offering price per share ($530,359 ÷ 14,424 shares)A | | $ 36.77 |
| | |
Class C:
Net Asset Value and offering price per share ($11,151,092 ÷ 302,926 shares)A | | $ 36.81 |
| | |
Europe:
Net Asset Value, offering price and redemption price per share ($1,384,134,439 ÷ 37,219,706 shares) | | $ 37.19 |
| | |
Class I:
Net Asset Value, offering price and redemption price per share ($6,551,888 ÷ 176,075 shares) | | $ 37.21 |
A Redemption price per share is equal to net asset value less any applicable contingent deferred sales charge.
See accompanying notes which are an integral part of the financial statements.
Annual Report
Statement of Operations
| Year ended October 31, 2015 |
| | |
Investment Income | | |
Dividends | | $ 34,182,184 |
Interest | | 1,295 |
Income from Fidelity Central Funds | | 982,698 |
Income before foreign taxes withheld | | 35,166,177 |
Less foreign taxes withheld | | (2,877,247) |
Total income | | 32,288,930 |
| | |
Expenses | | |
Management fee | | |
Basic fee | $ 9,840,222 | |
Performance adjustment | 1,149,586 | |
Transfer agent fees | 2,655,538 | |
Distribution and service plan fees | 230,307 | |
Accounting and security lending fees | 642,501 | |
Custodian fees and expenses | 135,244 | |
Independent trustees' compensation | 6,071 | |
Registration fees | 81,226 | |
Audit | 92,356 | |
Legal | 8,636 | |
Interest | 963 | |
Miscellaneous | 13,056 | |
Total expenses before reductions | 14,855,706 | |
Expense reductions | (309,471) | 14,546,235 |
Net investment income (loss) | | 17,742,695 |
Realized and Unrealized Gain (Loss) | | |
Net realized gain (loss) on: | | |
Investment securities: | | |
Unaffiliated issuers | 56,522,314 | |
Foreign currency transactions | 333,984 | |
Total net realized gain (loss) | | 56,856,298 |
Change in net unrealized appreciation (depreciation) on: Investment securities | (21,707,177) | |
Assets and liabilities in foreign currencies | 330,244 | |
Total change in net unrealized appreciation (depreciation) | | (21,376,933) |
Net gain (loss) | | 35,479,365 |
Net increase (decrease) in net assets resulting from operations | | $ 53,222,060 |
Statement of Changes in Net Assets
| Year ended
October 31,
2015 | Year ended
October 31,
2014 |
Increase (Decrease) in Net Assets | | |
Operations | | |
Net investment income (loss) | $ 17,742,695 | $ 31,583,880 |
Net realized gain (loss) | 56,856,298 | 61,093,776 |
Change in net unrealized appreciation (depreciation) | (21,376,933) | (149,418,761) |
Net increase (decrease) in net assets resulting from operations | 53,222,060 | (56,741,105) |
Distributions to shareholders from net investment income | (31,603,696) | (13,272,490) |
Distributions to shareholders from net realized gain | - | (612,576) |
Total distributions | (31,603,696) | (13,885,066) |
Share transactions - net increase (decrease) | 125,806,049 | 401,467,296 |
Redemption fees | 48,244 | 18,788 |
Total increase (decrease) in net assets | 147,472,657 | 330,859,913 |
| | |
Net Assets | | |
Beginning of period | 1,287,908,302 | 957,048,389 |
End of period (including undistributed net investment income of $15,983,003 and undistributed net investment income of $29,844,004, respectively) | $ 1,435,380,959 | $ 1,287,908,302 |
See accompanying notes which are an integral part of the financial statements.
Annual Report
Financial Highlights - Fidelity Europe Fund Class A
Years ended October 31, | 2015 | 2014 H |
Selected Per-Share Data | | |
Net asset value, beginning of period | $ 36.24 | $ 39.45 |
Income from Investment Operations | | |
Net investment income (loss) E | .37 | .47 |
Net realized and unrealized gain (loss) | 1.29 | (3.68) |
Total from investment operations | 1.66 | (3.21) |
Distributions from net investment income | (.84) | - |
Redemption fees added to paid in capitalE, K | - | - |
Net asset value, end of period | $ 37.06 | $ 36.24 |
Total ReturnB, C, D | 4.63% | (8.14)% |
Ratios to Average Net AssetsF, I | | |
Expenses before reductions | 1.33% | 1.35%A |
Expenses net of fee waivers, if any | 1.33% | 1.35%A |
Expenses net of all reductions | 1.31% | 1.35%A |
Net investment income (loss) | .98% | 1.94%A |
Supplemental Data | | |
Net assets, end of period (000 omitted) | $ 23,381 | $ 23,633 |
Portfolio turnover rateG | 87% | 80%J |
AAnnualized BTotal returns for periods of less than one year are not annualized. CTotal returns would have been lower if certain expenses had not been reduced during the applicable periods shown. DTotal returns do not include the effect of the sales charges. ECalculated based on average shares outstanding during the period. FFees and expenses of any underlying Fidelity Central Funds are not included in the Fund's expense ratio. The Fund indirectly bears its proportionate share of the expenses of any underlying Fidelity Central Funds. GAmount does not include the portfolio activity of any underlying Fidelity Central Funds. HFor the period March 18, 2014 (commencement of sale of shares) to October 31, 2014. IExpense ratios reflect operating expenses of the class. Expenses before reductions do not reflect amounts reimbursed by the investment adviser or reductions from brokerage service arrangements or reductions from other expense offset arrangements and do not represent the amount paid by the class during periods when reimbursements or reductions occur. Expenses net of fee waivers reflect expenses after reimbursement by the investment adviser but prior to reductions from brokerage service arrangements or other expense offset arrangements. Expenses net of all reductions represent the net expenses paid by the class. JThe portfolio turnover rate does not include the assets acquired in the merger. KAmount represents less than $.005 per share. |
Financial Highlights - Fidelity Europe Fund Class T
Years ended October 31, | 2015 | 2014 H |
Selected Per-Share Data | | |
Net asset value, beginning of period | $ 36.18 | $ 39.45 |
Income from Investment Operations | | |
Net investment income (loss) E | .26 | .40 |
Net realized and unrealized gain (loss) | 1.29 | (3.67) |
Total from investment operations | 1.55 | (3.27) |
Distributions from net investment income | (.79) | - |
Redemption fees added to paid in capitalE, K | - | - |
Net asset value, end of period | $ 36.94 | $ 36.18 |
Total ReturnB, C, D | 4.33% | (8.29)% |
Ratios to Average Net AssetsF, I | | |
Expenses before reductions | 1.61% | 1.62%A |
Expenses net of fee waivers, if any | 1.61% | 1.61%A |
Expenses net of all reductions | 1.59% | 1.61%A |
Net investment income (loss) | .70% | 1.68%A |
Supplemental Data | | |
Net assets, end of period (000 omitted) | $ 9,632 | $ 13,679 |
Portfolio turnover rateG | 87% | 80%J |
AAnnualized BTotal returns for periods of less than one year are not annualized. CTotal returns would have been lower if certain expenses had not been reduced during the applicable periods shown. DTotal returns do not include the effect of the sales charges. ECalculated based on average shares outstanding during the period. FFees and expenses of any underlying Fidelity Central Funds are not included in the Fund's expense ratio. The Fund indirectly bears its proportionate share of the expenses of any underlying Fidelity Central Funds. GAmount does not include the portfolio activity of any underlying Fidelity Central Funds. HFor the period March 18, 2014 (commencement of sale of shares) to October 31, 2014. IExpense ratios reflect operating expenses of the class. Expenses before reductions do not reflect amounts reimbursed by the investment adviser or reductions from brokerage service arrangements or reductions from other expense offset arrangements and do not represent the amount paid by the class during periods when reimbursements or reductions occur. Expenses net of fee waivers reflect expenses after reimbursement by the investment adviser but prior to reductions from brokerage service arrangements or other expense offset arrangements. Expenses net of all reductions represent the net expenses paid by the class. JThe portfolio turnover rate does not include the assets acquired in the merger. KAmount represents less than $.005 per share. |
See accompanying notes which are an integral part of the financial statements.
Annual Report
Financial Highlights - Fidelity Europe Fund Class B
Years ended October 31, | 2015 | 2014 H |
Selected Per-Share Data | | |
Net asset value, beginning of period | $ 36.07 | $ 39.45 |
Income from Investment Operations | | |
Net investment income (loss) E | .06 | .28 |
Net realized and unrealized gain (loss) | 1.29 | (3.66) |
Total from investment operations | 1.35 | (3.38) |
Distributions from net investment income | (.65) | - |
Redemption fees added to paid in capitalE, K | - | - |
Net asset value, end of period | $ 36.77 | $ 36.07 |
Total ReturnB, C, D | 3.78% | (8.57)% |
Ratios to Average Net AssetsF, I | | |
Expenses before reductions | 2.15% | 2.11%A |
Expenses net of fee waivers, if any | 2.15% | 2.11%A |
Expenses net of all reductions | 2.13% | 2.11%A |
Net investment income (loss) | .16% | 1.19%A |
Supplemental Data | | |
Net assets, end of period (000 omitted) | $ 530 | $ 1,065 |
Portfolio turnover rateG | 87% | 80%J |
AAnnualized BTotal returns for periods of less than one year are not annualized. CTotal returns would have been lower if certain expenses had not been reduced during the applicable periods shown. DTotal returns do not include the effect of the contingent deferred sales charge. ECalculated based on average shares outstanding during the period. FFees and expenses of any underlying Fidelity Central Funds are not included in the Fund's expense ratio. The Fund indirectly bears its proportionate share of the expenses of any underlying Fidelity Central Funds. GAmount does not include the portfolio activity of any underlying Fidelity Central Funds. HFor the period March 18, 2014 (commencement of sale of shares) to October 31, 2014. IExpense ratios reflect operating expenses of the class. Expenses before reductions do not reflect amounts reimbursed by the investment adviser or reductions from brokerage service arrangements or reductions from other expense offset arrangements and do not represent the amount paid by the class during periods when reimbursements or reductions occur. Expenses net of fee waivers reflect expenses after reimbursement by the investment adviser but prior to reductions from brokerage service arrangements or other expense offset arrangements. Expenses net of all reductions represent the net expenses paid by the class. JThe portfolio turnover rate does not include the assets acquired in the merger. KAmount represents less than $.005 per share. |
Financial Highlights - Fidelity Europe Fund Class C
Years ended October 31, | 2015 | 2014 H |
Selected Per-Share Data | | |
Net asset value, beginning of period | $ 36.07 | $ 39.45 |
Income from Investment Operations | | |
Net investment income (loss) E | .07 | .29 |
Net realized and unrealized gain (loss) | 1.29 | (3.67) |
Total from investment operations | 1.36 | (3.38) |
Distributions from net investment income | (.62) | - |
Redemption fees added to paid in capitalE, K | - | - |
Net asset value, end of period | $ 36.81 | $ 36.07 |
Total ReturnB, C, D | 3.79% | (8.57)% |
Ratios to Average Net AssetsF, I | | |
Expenses before reductions | 2.13% | 2.10%A |
Expenses net of fee waivers, if any | 2.13% | 2.10%A |
Expenses net of all reductions | 2.11% | 2.10%A |
Net investment income (loss) | .18% | 1.19%A |
Supplemental Data | | |
Net assets, end of period (000 omitted) | $ 11,151 | $ 6,818 |
Portfolio turnover rateG | 87% | 80%J |
AAnnualized BTotal returns for periods of less than one year are not annualized. CTotal returns would have been lower if certain expenses had not been reduced during the applicable periods shown. DTotal returns do not include the effect of the contingent deferred sales charge. ECalculated based on average shares outstanding during the period. FFees and expenses of any underlying Fidelity Central Funds are not included in the Fund's expense ratio. The Fund indirectly bears its proportionate share of the expenses of any underlying Fidelity Central Funds. GAmount does not include the portfolio activity of any underlying Fidelity Central Funds. HFor the period March 18, 2014 (commencement of sale of shares) to October 31, 2014. IExpense ratios reflect operating expenses of the class. Expenses before reductions do not reflect amounts reimbursed by the investment adviser or reductions from brokerage service arrangements or reductions from other expense offset arrangements and do not represent the amount paid by the class during periods when reimbursements or reductions occur. Expenses net of fee waivers reflect expenses after reimbursement by the investment adviser but prior to reductions from brokerage service arrangements or other expense offset arrangements. Expenses net of all reductions represent the net expenses paid by the class. JThe portfolio turnover rate does not include the assets acquired in the merger. KAmount represents less than $.005 per share. |
See accompanying notes which are an integral part of the financial statements.
Annual Report
Financial Highlights - Fidelity Europe Fund
Years ended October 31, | 2015 | 2014 | 2013 | 2012 | 2011 |
Selected Per-Share Data | | | | | |
Net asset value, beginning of period | $ 36.32 | $ 37.92 | $ 30.15 | $ 27.67 | $ 30.83 |
Income from Investment Operations | | | | | |
Net investment income (loss) B | .48 | .94E | .61 | .64 | .48 |
Net realized and unrealized gain (loss) | 1.30 | (2.00) | 7.87 | 2.45 | (2.97) |
Total from investment operations | 1.78 | (1.06) | 8.48 | 3.09 | (2.49) |
Distributions from net investment income | (.91) | (.52) | (.70) | (.60) | (.67) |
Distributions from net realized gain | - | (.02) | (.01) | (.02) | - |
Total distributions | (.91) | (.54) | (.71) | (.61) I | (.67) |
Redemption fees added to paid in capitalB, H | - | - | - | - | - |
Net asset value, end of period | $ 37.19 | $ 36.32 | $ 37.92 | $ 30.15 | $ 27.67 |
Total Return A | 4.97% | (2.82)% | 28.71% | 11.53% | (8.32)% |
Ratios to Average Net AssetsC, F | | | | | |
Expenses before reductions | 1.03% | .97% | 1.06% | .83% | 1.10% |
Expenses net of fee waivers, if any | 1.03% | .97% | 1.05% | .83% | 1.10% |
Expenses net of all reductions | 1.01% | .96% | 1.02% | .80% | 1.06% |
Net investment income (loss) | 1.28% | 2.43%E | 1.82% | 2.33% | 1.56% |
Supplemental Data | | | | | |
Net assets, end of period (000 omitted) | $ 1,384,134 | $ 1,237,047 | $ 957,048 | $ 602,520 | $ 621,778 |
Portfolio turnover rateD | 87% | 80%G | 59% | 127% | 117% |
ATotal returns would have been lower if certain expenses had not been reduced during the applicable periods shown. BCalculated based on average shares outstanding during the period. CFees and expenses of any underlying Fidelity Central Funds are not included in the Fund's expense ratio. The Fund indirectly bears its proportionate share of the expenses of any underlying Fidelity Central Funds. DAmount does not include the portfolio activity of any underlying Fidelity Central Funds. EInvestment income per share reflects a large, non-recurring dividend which amounted to $.19 per share. Excluding this non-recurring dividend, the ratio of net investment income (loss) to average net assets would have been 1.93%. FExpense ratios reflect operating expenses of the class. Expenses before reductions do not reflect amounts reimbursed by the investment adviser or reductions from brokerage service arrangements or reductions from other expense offset arrangements and do not represent the amount paid by the class during periods when reimbursements or reductions occur. Expenses net of fee waivers reflect expenses after reimbursement by the investment adviser but prior to reductions from brokerage service arrangements or other expense offset arrangements. Expenses net of all reductions represent the net expenses paid by the class. GThe portfolio turnover rate does not include the assets acquired in the merger. HAmount represents less than $.005 per share. ITotal distributions of $.61 per share is comprised of distributions from net investment income of $.595 and distributions from net realized gain of $.017 per share. |
Financial Highlights - Fidelity Europe Fund Class I
Years ended October 31, | 2015 | 2014 G |
Selected Per-Share Data | | |
Net asset value, beginning of period | $ 36.32 | $ 39.45 |
Income from Investment Operations | | |
Net investment income (loss) D | .50 | .56 |
Net realized and unrealized gain (loss) | 1.30 | (3.69) |
Total from investment operations | 1.80 | (3.13) |
Distributions from net investment income | (.91) | - |
Redemption fees added to paid in capitalD, J | - | - |
Net asset value, end of period | $ 37.21 | $ 36.32 |
Total ReturnB, C | 5.02% | (7.93)% |
Ratios to Average Net AssetsE, H | | |
Expenses before reductions | .98% | .97%A |
Expenses net of fee waivers, if any | .98% | .97%A |
Expenses net of all reductions | .96% | .96%A |
Net investment income (loss) | 1.33% | 2.33%A |
Supplemental Data | | |
Net assets, end of period (000 omitted) | $ 6,552 | $ 5,666 |
Portfolio turnover rateF | 87% | 80%I |
AAnnualized BTotal returns for periods of less than one year are not annualized. CTotal returns would have been lower if certain expenses had not been reduced during the applicable periods shown. DCalculated based on average shares outstanding during the period. EFees and expenses of any underlying Fidelity Central Funds are not included in the Fund's expense ratio. The Fund indirectly bears its proportionate share of the expenses of any underlying Fidelity Central Funds. FAmount does not include the portfolio activity of any underlying Fidelity Central Funds. GFor the period March 18, 2014 (commencement of sale of shares) to October 31, 2014. HExpense ratios reflect operating expenses of the class. Expenses before reductions do not reflect amounts reimbursed by the investment adviser or reductions from brokerage service arrangements or reductions from other expense offset arrangements and do not represent the amount paid by the class during periods when reimbursements or reductions occur. Expenses net of fee waivers reflect expenses after reimbursement by the investment adviser but prior to reductions from brokerage service arrangements or other expense offset arrangements. Expenses net of all reductions represent the net expenses paid by the class. IThe portfolio turnover rate does not include the assets acquired in the merger. JAmount represents less than $.005 per share. |
See accompanying notes which are an integral part of the financial statements.
Annual Report
For the period ended October 31, 2015
1. Organization.
Fidelity Europe Fund (the Fund) is a fund of Fidelity Investment Trust (the Trust) and is authorized to issue an unlimited number of shares. The Trust is registered under the Investment Company Act of 1940, as amended (the 1940 Act), as an open-end management investment company organized as a Massachusetts business trust. The Fund offers Class A, Class T, Class C, Europe and Class I (formerly Institutional Class) shares, each of which, along with Class B shares, has equal rights as to assets and voting privileges. Class B shares are closed to new accounts and additional purchases, except for exchanges and reinvestments. Each class has exclusive voting rights with respect to matters that affect that class. Class B shares will automatically convert to class A shares after a holding period of seven years from the initial date of purchase.
2. Investments in Fidelity Central Funds.
The Fund invests in Fidelity Central Funds, which are open-end investment companies generally available only to other investment companies and accounts managed by the investment adviser and its affiliates. The Fund's Schedule of Investments lists each of the Fidelity Central Funds held as of period end, if any, as an investment of the Fund, but does not include the underlying holdings of each Fidelity Central Fund. As an Investing Fund, the Fund indirectly bears its proportionate share of the expenses of the underlying Fidelity Central Funds.
The Money Market Central Funds seek preservation of capital and current income and are managed by Fidelity Investments Money Management, Inc. (FIMM), an affiliate of the investment adviser. Annualized expenses of the Money Market Central Funds as of their most recent shareholder report date are less than .005%.
A complete unaudited list of holdings for each Fidelity Central Fund is available upon request or at the Securities and Exchange Commission (the SEC) website at www.sec.gov. In addition, the financial statements of the Fidelity Central Funds, which are not covered by the Fund's Report of Independent Registered Public Accounting Firm, are available on the SEC website or upon request.
3. Significant Accounting Policies.
The financial statements have been prepared in conformity with accounting principles generally accepted in the United States of America (GAAP), which require management to make certain estimates and assumptions at the date of the financial statements. Actual results could differ from those estimates. Subsequent events, if any, through the date that the financial statements were issued have been evaluated in the preparation of the financial statements. The following summarizes the significant accounting policies of the Fund:
Investment Valuation. Investments are valued as of 4:00 p.m. Eastern time on the last calendar day of the period. The Board of Trustees (the Board) has delegated the day to day responsibility for the valuation of the Fund's investments to the Fidelity Management & Research Company (FMR) Fair Value Committee (the Committee). In accordance with valuation policies and procedures approved by the Board, the Fund attempts to obtain prices from one or more third party pricing vendors or brokers to value its investments. When current market prices, quotations or currency exchange rates are not readily available or reliable, investments will be fair valued in good faith by the Committee, in accordance with procedures adopted by the Board. Factors used in determining fair value vary by investment type and may include market or investment specific events. The frequency with which these procedures are used cannot be predicted and they may be utilized to a significant extent. The Committee oversees the Fund's valuation policies and procedures and reports to the Board on the Committee's activities and fair value determinations. The Board monitors the appropriateness of the procedures used in valuing the Fund's investments and ratifies the fair value determinations of the Committee.
The Fund categorizes the inputs to valuation techniques used to value its investments into a disclosure hierarchy consisting of three levels as shown below:
Level 1 - quoted prices in active markets for identical investments
Level 2 - other significant observable inputs (including quoted prices for similar investments, interest rates, prepayment speeds, etc.)
Level 3 - unobservable inputs (including the Fund's own assumptions based on the best information available)
Valuation techniques used to value the Fund's investments by major category are as follows:
Equity securities, including restricted securities, for which market quotations are readily available, are valued at the last reported sale price or official closing price as reported by a third party pricing vendor on the primary market or exchange on which they are traded and are categorized as Level 1 in the hierarchy. In the event there were no sales during the day or closing prices are not available, securities are valued at the last quoted bid price or may be valued using the last available price and are generally categorized as Level 2 in the hierarchy. For foreign equity securities, when market or security specific events arise, comparisons to the valuation of American Depositary Receipts (ADRs), futures contracts, Exchange-Traded Funds (ETFs) and certain indexes as well as quoted prices for similar securities may be used and would be categorized as Level 2 in the hierarchy. Utilizing these techniques may result in transfers between Level 1 and Level 2. For equity securities, including restricted securities, where observable inputs are limited, assumptions about market activity and risk are used and these securities may be categorized as Level 3 in the hierarchy.
Annual Report
Notes to Financial Statements - continued
3. Significant Accounting Policies - continued
Investment Valuation - continued
Investments in open-end mutual funds, including the Fidelity Central Funds, are valued at their closing net asset value (NAV) each business day and are categorized as Level 1 in the hierarchy.
Changes in valuation techniques may result in transfers in or out of an assigned level within the disclosure hierarchy. The aggregate value of investments by input level as of October 31, 2015, including information on transfers between Levels 1 and 2, is included at the end of the Fund's Schedule of Investments.
Foreign Currency. The Fund may use foreign currency contracts to facilitate transactions in foreign-denominated securities. Gains and losses from these transactions may arise from changes in the value of the foreign currency or if the counterparties do not perform under the contracts' terms.
Foreign-denominated assets, including investment securities, and liabilities are translated into U.S. dollars at the exchange rates at period end. Purchases and sales of investment securities, income and dividends received and expenses denominated in foreign currencies are translated into U.S. dollars at the exchange rate in effect on the transaction date.
The effects of exchange rate fluctuations on investments are included with the net realized and unrealized gain (loss) on investment securities. Other foreign currency transactions resulting in realized and unrealized gain (loss) are disclosed separately.
Investment Transactions and Income. For financial reporting purposes, the Fund's investment holdings and NAV include trades executed through the end of the last business day of the period. The NAV per share for processing shareholder transactions is calculated as of the close of business of the New York Stock Exchange (NYSE), normally 4:00 p.m. Eastern time and includes trades executed through the end of the prior business day. Gains and losses on securities sold are determined on the basis of identified cost and may include proceeds received from litigation. Dividend income is recorded on the ex-dividend date, except for certain dividends from foreign securities where the ex-dividend date may have passed, which are recorded as soon as the Fund is informed of the ex-dividend date. Non-cash dividends included in dividend income, if any, are recorded at the fair market value of the securities received. Income and capital gain distributions from Fidelity Central Funds, if any, are recorded on the ex-dividend date. Interest income is accrued as earned and includes coupon interest and amortization of premium and accretion of discount on debt securities as applicable. Investment income is recorded net of foreign taxes withheld where recovery of such taxes is uncertain.
Class Allocations and Expenses. Investment income, realized and unrealized capital gains and losses, common expenses of the Fund, and certain fund-level expense reductions, if any, are allocated daily on a pro-rata basis to each class based on the relative net assets of each class to the total net assets of the Fund. Each class differs with respect to transfer agent and distribution and service plan fees incurred. Certain expense reductions may also differ by class. For the reporting period, the allocated portion of income and expenses to each class as a percent of its average net assets may vary due to the timing of recording these transactions in relation to fluctuating net assets of the classes. Expenses directly attributable to a fund are charged to that fund. Expenses attributable to more than one fund are allocated among the respective funds on the basis of relative net assets or other appropriate methods. Expense estimates are accrued in the period to which they relate and adjustments are made when actual amounts are known.
Income Tax Information and Distributions to Shareholders. Each year, the Fund intends to qualify as a regulated investment company under Subchapter M of the Internal Revenue Code, including distributing substantially all of its taxable income and realized gains. As a result, no provision for U.S. Federal income taxes is required. As of October 31, 2015, the Fund did not have any unrecognized tax benefits in the financial statements; nor is the Fund aware of any tax positions for which it is reasonably possible that the total amounts of unrecognized tax benefits will significantly change in the next twelve months. The Fund files a U.S. federal tax return, in addition to state and local tax returns as required. The Fund's federal income tax returns are subject to examination by the Internal Revenue Service (IRS) for a period of three fiscal years after they are filed. State and local tax returns may be subject to examination for an additional fiscal year depending on the jurisdiction. Foreign taxes are provided for based on the Fund's understanding of the tax rules and rates that exist in the foreign markets in which it invests.
Distributions are declared and recorded on the ex-dividend date. Income dividends and capital gain distributions are declared separately for each class. Income and capital gain distributions are determined in accordance with income tax regulations, which may differ from GAAP.
Capital accounts within the financial statements are adjusted for permanent book-tax differences. These adjustments have no impact on net assets or the results of operations. Capital accounts are not adjusted for temporary book-tax differences which will reverse in a subsequent period.
Book-tax differences are primarily due to foreign currency transactions, passive foreign investment companies (PFIC), deferred trustees compensation, expiring capital loss carryforwards, capital loss carryforwards and losses deferred due to wash sales.
Annual Report
3. Significant Accounting Policies - continued
Income Tax Information and Distributions to Shareholders - continued
The federal tax cost of investment securities and unrealized appreciation (depreciation) as of period end were as follows:
Gross unrealized appreciation | $ 138,842,139 |
Gross unrealized depreciation | (83,135,977) |
Net unrealized appreciation (depreciation) on securities | $ 55,706,162 |
Tax Cost | $ 1,404,851,306 |
The tax-based components of distributable earnings as of period end were as follows:
Undistributed ordinary income | $ 21,804,337 |
Capital loss carryforward | $ (228,371,583) |
Net unrealized appreciation (depreciation) on securities and other investments | $ 55,923,345 |
Capital loss carryforwards are only available to offset future capital gains of the Fund to the extent provided by regulations and may be limited. Under the Regulated Investment Company Modernization Act of 2010 (the Act), the Fund is permitted to carry forward capital losses incurred in taxable years beginning after December 22, 2010 for an unlimited period and such capital losses are required to be used prior to any losses that expire. The capital loss carryforward information presented below, including any applicable limitation, is estimated as of fiscal period end and is subject to adjustment.
Fiscal year of expiration | |
2016 | $ (29,326,707) |
2017 | (199,044,876) |
Total capital loss carryforward | $ (228,371,583) |
The Fund acquired $27,783,139 of its capital loss carryforward as part of a merger in a prior period. The losses acquired that will be available to offset future capital gains of the Fund will be limited to approximately $13,187,073 per year.
In addition, due to large redemptions in a prior period, $199,044,876 of capital losses that existed in the Fund prior to the mergers will be limited to approximately $32,029,274 per year.
The tax character of distributions paid was as follows:
| October 31, 2015 | October 31, 2014 |
Ordinary Income | $ 31,603,696 | $ 13,885,066 |
Short-Term Trading (Redemption) Fees. Shares held by investors in the Fund less than 30 days may have been subject to a redemption fee equal to 1.00% of the NAV of shares redeemed. All redemption fees, which reduce the proceeds of the shareholder redemption, are retained by the Fund and accounted for as an addition to paid in capital.
Delayed Delivery Transactions and When-Issued Securities. During the period, the Fund transacted in securities on a delayed delivery or when-issued basis. Payment and delivery may take place after the customary settlement period for that security. The price of the underlying securities and the date when the securities will be delivered and paid for are fixed at the time the transaction is negotiated. The securities purchased on a delayed delivery or when-issued basis are identified as such in the Fund's Schedule of Investments. With respect to purchase commitments, the Fund identifies securities as segregated in its records with a value at least equal to the amount of the commitment. Losses may arise due to changes in the value of the underlying securities or if the counterparty does not perform under the contract's terms, or if the issuer does not issue the securities due to political, economic, or other factors.
Restricted Securities. The Fund may invest in securities that are subject to legal or contractual restrictions on resale. These securities generally may be resold in transactions exempt from registration or to the public if the securities are registered. Disposal of these securities may involve time-consuming negotiations and expense, and prompt sale at an acceptable price may be difficult. Information regarding restricted securities is included at the end of the Fund's Schedule of Investments.
4. Purchases and Sales of Investments.
Purchases and sales of securities, other than short-term securities, aggregated $1,313,859,833 and $1,189,248,991, respectively.
Annual Report
Notes to Financial Statements - continued
5. Fees and Other Transactions with Affiliates.
Management Fee. Fidelity Management & Research Company (the investment adviser) and its affiliates provide the Fund with investment management related services for which the Fund pays a monthly management fee. The management fee is the sum of an individual fund fee rate that is based on an annual rate of .45% of the Fund's average net assets and an annualized group fee rate that averaged .25% during the period. The group fee rate is based upon the average net assets of all the mutual funds advised by the investment adviser, including any mutual funds previously advised by the investment adviser that are currently advised by Fidelity SelectCo, LLC, an affiliate of the investment adviser. The group fee rate decreases as assets under management increase and increases as assets under management decrease. In addition, the management fee is subject to a performance adjustment (up to a maximum of ± .20% of the Fund's average net assets over a 36 month performance period). The upward or downward adjustment to the management fee is based on the relative investment performance of Europe as compared to its benchmark index, the MSCI Europe Index, over the same 36 month performance period. For the reporting period, the total annual management fee rate, including the performance adjustment, was .78% of the Fund's average net assets. The performance adjustment included in the management fee rate may be higher or lower than the maximum performance adjustment rate due to the difference between the average net assets for the reporting and performance periods.
Distribution and Service Plan Fees. In accordance with Rule 12b-1 of the 1940 Act, the Fund has adopted separate Distribution and Service Plans for each class of shares. Certain classes pay Fidelity Distributors Corporation (FDC), an affiliate of the investment adviser, separate Distribution and Service Fees, each of which is based on an annual percentage of each class' average net assets. In addition, FDC may pay financial intermediaries for selling shares of the Fund and providing shareholder support services. For the period, the Distribution and Service Fee rates, total fees and amounts retained by FDC were as follows:
| Distribution
Fee | Service
Fee | Total Fees | Retained
by FDC |
Class A | -% | .25% | $ 66,329 | $ 2,913 |
Class T | .25% | .25% | 66,616 | 328 |
Class B | .75% | .25% | 8,617 | 6,637 |
Class C | .75% | .25% | 88,745 | 29,623 |
| | | $ 230,307 | $ 39,501 |
Sales Load. FDC may receive a front-end sales charge of up to 5.75% for selling Class A shares and 3.50% for selling Class T shares, some of which is paid to financial intermediaries for selling shares of the Fund. Depending on the holding period, FDC may receive contingent deferred sales charges levied on Class A, Class T, Class B, and Class C redemptions. The deferred sales charges range from 5.00% to 1.00% for Class B shares, 1.00% for Class C shares, 1.00% for certain purchases of Class A shares and .25% for certain purchases of Class T shares.
For the period, sales charge amounts retained by FDC were as follows:
| Retained
by FDC |
Class A | $ 23,090 |
Class T | 5,193 |
Class BA | 281 |
Class C A | 6,136 |
| $ 34,700 |
A When Class B and Class C shares are initially sold, FDC pays commissions from its own resources to financial intermediaries through which the sales are made.
Transfer Agent Fees. Fidelity Investments Institutional Operations Company, Inc., (FIIOC), an affiliate of the investment adviser, is the transfer, dividend disbursing and shareholder servicing agent for each class of the Fund. FIIOC receives account fees and asset-based fees that vary according to the account size and type of account of the shareholders of the respective classes of the Fund. FIIOC pays for typesetting, printing and mailing of shareholder reports, except proxy statements.
For the period, transfer agent fees for each class were as follows:
| Amount | % of
Class-Level Average
Net Assets |
Class A | $ 60,801 | .23 |
Class T | 35,189 | .26 |
Class B | 2,566 | .30 |
Class C | 25,900 | .29 |
Europe | 2,522,706 | .19 |
Class I | 8,376 | .13 |
| $ 2,655,538 | |
Annual Report
5. Fees and Other Transactions with Affiliates - continued
Accounting and Security Lending Fees. Fidelity Service Company, Inc. (FSC), an affiliate of the investment adviser, maintains the Fund's accounting records. The accounting fee is based on the level of average net assets for each month. Under a separate contract, FSC administers the security lending program. The security lending fee is based on the number and duration of lending transactions.
Brokerage Commissions. The Fund placed a portion of its portfolio transactions with brokerage firms which are affiliates of the investment adviser. Brokerage commissions are included in net realized gain (loss) and change in net unrealized appreciation (depreciation) in the Statement of Operations. The commissions paid to these affiliated firms were $36 for the period.
Interfund Lending Program. Pursuant to an Exemptive Order issued by the SEC, the Fund, along with other registered investment companies having management contracts with FMR or other affiliated entities of FMR, may participate in an interfund lending program. This program provides an alternative credit facility allowing the funds to borrow from, or lend money to, other participating affiliated funds. At period end, there were no interfund loans outstanding. The Fund's activity in this program during the period for which loans were outstanding was as follows:
Borrower or Lender | Average Loan
Balance | Weighted Average
Interest Rate | Interest Expense |
Borrower | $ 8,546,818 | .37% | $ 963 |
6. Committed Line of Credit.
The Fund participates with other funds managed by the investment adviser or an affiliate in a $4.25 billion credit facility (the "line of credit") to be utilized for temporary or emergency purposes to fund shareholder redemptions or for other short-term liquidity purposes. The Fund has agreed to pay commitment fees on its pro-rata portion of the line of credit, which amounted to $1,988 and is reflected in Miscellaneous expenses on the Statement of Operations. During the period, the Fund did not borrow on this line of credit.
7. Security Lending.
The Fund lends portfolio securities through a lending agent from time to time in order to earn additional income. For equity securities, a lending agent is used and may loan securities to certain qualified borrowers, including Fidelity Capital Markets (FCM), a broker-dealer affiliated with the Fund. On the settlement date of the loan, the Fund receives collateral (in the form of U.S. Treasury obligations, letters of credit and/or cash) against the loaned securities and maintains collateral in an amount not less than 100% of the market value of the loaned securities during the period of the loan. The market value of the loaned securities is determined at the close of business of the Fund and any additional required collateral is delivered to the Fund on the next business day. The Fund or borrower may terminate the loan at any time, and if the borrower defaults on its obligation to return the securities loaned because of insolvency or other reasons, the Fund may apply collateral received from the borrower against the obligation. The Fund may experience delays and costs in recovering the securities loaned. Any cash collateral received is invested in the Fidelity Securities Lending Cash Central Fund. The value of loaned securities and cash collateral at period end are disclosed on the Fund's Statement of Assets and Liabilities. Security lending income represents the income earned on investing cash collateral, less rebates paid to borrowers and any lending agent fees associated with the loan, plus any premium payments received for lending certain types of securities. Security lending income is presented in the Statement of Operations as a component of income from Fidelity Central Funds. Total security lending income during the period amounted to $924,214. During the period, there were no securities loaned to FCM.
8. Expense Reductions.
Commissions paid to certain brokers with whom the investment adviser, or its affiliates, places trades on behalf of the Fund include an amount in addition to trade execution, which may be rebated back to the Fund to offset certain expenses. This amount totaled $274,757 for the period.
In addition, during the period the investment adviser reimbursed and/or waived a portion of fund-level operating expenses in the amount of $6,201 and a portion of class-level operating expenses as follows:
| Amount |
Class A | $ 87 |
Class T | 44 |
Class B | 2 |
Class C | 30 |
Europe | 28,324 |
Class I | 26 |
| $ 28,513 |
Annual Report
Notes to Financial Statements - continued
9. Distributions to Shareholders.
Distributions to shareholders of each class were as follows:
Years ended October 31, | 2015 | 2014 |
From net investment income | | |
Class A | $ 549,660 | $ - |
Class T | 299,142 | - |
Class B | 18,443 | - |
Class C | 108,670 | - |
Europe | 30,497,764 | 13,272,490 |
Class I | 130,017 | - |
Total | $ 31,603,696 | $ 13,272,490 |
From net realized gain | | |
Europe | $ - | $ 612,576 |
10. Share Transactions.
Share transactions for each class were as follows and may contain automatic conversions between classes or exchanges between funds:
| Shares | Dollars |
Years ended October 31, | 2015 | 2014A | 2015 | 2014A |
Class A | | | | |
Shares sold | 402,890 | 302,227 | $ 15,313,815 | $ 12,108,972 |
Issued in exchange for shares of Fidelity Advisor Europe Capital Appreciation Fund | - | 483,084 | - | 18,719,498 |
Reinvestment of distributions | 14,493 | - | 527,143 | - |
Shares redeemed | (438,670) | (133,151) | (16,388,542) | (5,066,903) |
Net increase (decrease) | (21,287) | 652,160 | $ (547,584) | $ 25,761,567 |
Class T | | | | |
Shares sold | 101,998 | 196,712 | $ 3,848,880 | $ 7,929,579 |
Issued in exchange for shares of Fidelity Advisor Europe Capital Appreciation Fund | - | 218,383 | - | 8,462,341 |
Reinvestment of distributions | 8,153 | - | 296,280 | - |
Shares redeemed | (227,511) | (36,984) | (8,571,443) | (1,400,101) |
Net increase (decrease) | (117,360) | 378,111 | $ (4,426,283) | $ 14,991,819 |
Class B | | | | |
Shares sold | 7,973 | 16,454 | $ 306,370 | $ 662,209 |
Issued in exchange for shares of Fidelity Advisor Europe Capital Appreciation Fund | - | 19,997 | - | 774,699 |
Reinvestment of distributions | 481 | - | 17,468 | - |
Shares redeemed | (23,568) | (6,913) | (877,823) | (266,573) |
Net increase (decrease) | (15,114) | 29,538 | $ (553,985) | $ 1,170,335 |
Class C | | | | |
Shares sold | 197,774 | 43,185 | $ 7,494,390 | $ 1,703,471 |
Issued in exchange for shares of Fidelity Advisor Europe Capital Appreciation Fund | - | 183,082 | - | 7,092,587 |
Reinvestment of distributions | 2,632 | - | 95,708 | - |
Shares redeemed | (86,511) | (37,236) | (3,194,278) | (1,401,102) |
Net increase (decrease) | 113,895 | 189,031 | $ 4,395,820 | $ 7,394,956 |
Europe | | | | |
Shares sold | 10,168,406 | 8,548,440 | $ 387,319,779 | $ 332,957,735 |
Issued in exchange for shares of Fidelity Europe Capital Appreciation Fund | - | 9,559,313 | - | 370,423,391 |
Reinvestment of distributions | 803,462 | 358,728 | 29,241,922 | 13,351,865 |
Shares redeemed | (7,807,853) | (9,647,960) | (290,372,067) | (370,706,278) |
Net increase (decrease) | 3,164,015 | 8,818,521 | $ 126,189,634 | $ 346,026,713 |
Class I | | | | |
Shares sold | 130,676 | 33,328 | $ 4,946,083 | $ 1,310,054 |
Issued in exchange for shares of Fidelity Advisor Europe Capital Appreciation Fund | - | 214,439 | - | 8,309,529 |
Reinvestment of distributions | 2,526 | - | 91,940 | - |
Shares redeemed | (113,122) | (91,772) | (4,289,576) | (3,497,677) |
Net increase (decrease) | 20,080 | 155,995 | $ 748,447 | $ 6,121,906 |
A Share transactions for Class A, Class T, Class B, Class C and Class I are for the period March 18, 2014 (commencement of sale of shares) to October 31, 2014.
Annual Report
11. Prior Fiscal Year Merger Information.
On March 21, 2014, the Fund acquired all of the assets and assumed all of the liabilities of Fidelity Europe Capital Appreciation Fund and Fidelity Advisor Europe Capital Appreciation Fund ("Target Funds") pursuant to Agreements and Plans of Reorganization approved by the Board of Trustees ("The Board") on September 18, 2013. The acquisition was accomplished by an exchange of shares of each class of the Fund for corresponding shares then outstanding of the Target Funds at their net asset value on the acquisition date. In addition, the Board approved the creation of additional classes of shares that commenced sale of shares on March 18, 2014. The reorganization provides shareholders of the Target Funds access to a larger portfolio with a similar investment objective and lower expenses. The reorganization qualified as a tax-free reorganization for federal income tax purposes with no gain or loss recognized to the funds or their shareholders. The Target Funds' net assets of $370,423,391, including securities of $369,430,411 and unrealized appreciation of $56,486,181 for Fidelity Europe Capital Appreciation Fund; and net assets of $43,358,654, including securities of $43,267,919 and unrealized appreciation of $4,301,890 for Fidelity Advisor Europe Capital Appreciation Fund; were combined with the Fund's net assets of $1,103,858,646 for total net assets after the acquisition of $1,517,640,691.
Pro forma results of operations of the combined entity for the entire period ended October 31, 2014, as though the acquisition had occurred as of the beginning of the year (rather than on the actual acquisition dates), are as follows:
Net Investment income (loss) | $ 36,003,400 |
Total net realized gain (loss) | 70,453,821 |
Total change in net unrealized appreciation (depreciation) | (148,729,606) |
Net increase (decrease) in net assets resulting from operations | $ (42,272,385) |
Because the combined investment portfolios have been managed as a single portfolio since the acquisitions were completed, it is not practicable to separate the amounts of revenue and earnings of the acquired funds that have been included in the Fund's accompanying Statement of Operations since March 21, 2014.
12. Other.
The Fund's organizational documents provide former and current trustees and officers with a limited indemnification against liabilities arising in connection with the performance of their duties to the Fund. In the normal course of business, the Fund may also enter into contracts that provide general indemnifications. The Fund's maximum exposure under these arrangements is unknown as this would be dependent on future claims that may be made against the Fund. The risk of material loss from such claims is considered remote.
Annual Report
Fidelity Japan Fund
Average annual total return reflects the change in the value of an investment, assuming reinvestment of the class' distributions from dividend income and capital gains (the profits earned upon the sale of securities that have grown in value, if any) and assuming a constant rate of performance each year. The $10,000 table and the fund's returns do not reflect the deduction of taxes that a shareholder would pay on fund distributions or the redemption of fund shares. During periods of reimbursement by Fidelity, a fund's total return will be greater than it would be had the reimbursement not occurred. How a fund did yesterday is no guarantee of how it will do tomorrow.
Average Annual Total Returns
Periods ended October 31, 2015 | Past 1
year | Past 5
years | Past 10
years |
Fidelity Japan Fund | 2.66% | 4.51% | 0.66% |
$10,000 Over 10 Years
Let's say hypothetically that $10,000 was invested in Fidelity Japan Fund, a class of the fund, on October 31, 2005. The chart shows how the value of your investment would have changed, and also shows how the Tokyo Stock Price Index (TOPIX) performed over the same period.
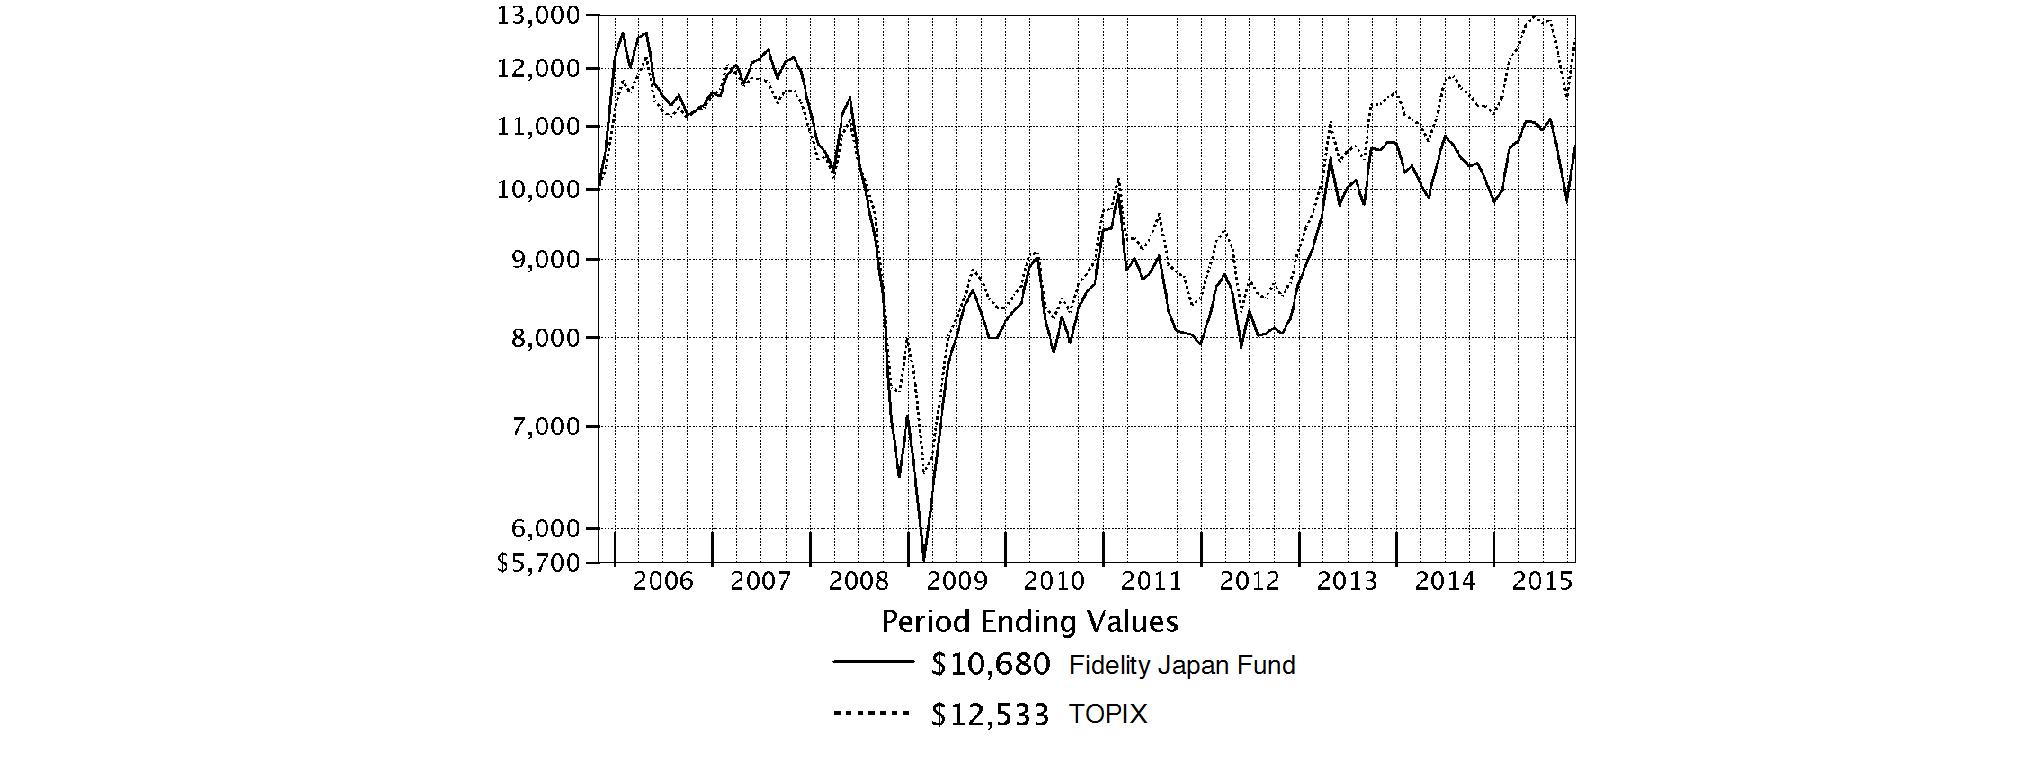
Annual Report
Fidelity Japan Fund
Market Recap: International equities suffered a moderate setback for the 12 months ending October 31, 2015, held back by a collapse in commodities prices that hurt resources-related sectors and geographies. The MSCI ACWI (All Country World Index) ex USA Index returned -4.55% for the period, affected also by concerns about global economic growth. Commodity producers remained under pressure for much of the past year, largely related to economic deceleration in China (-1%), the world's second-largest economy and a leading consumer of raw materials. This effect was exacerbated by U.S. dollar strength relative to global currencies, which weighed on commodities priced in dollars and acutely impacted equity returns within regions most exposed to resources prices. The emerging-markets group, for example, returned about -15% this period. Canada, a significant energy producer, returned roughly -17%. Net energy consumer Japan (+9%) was the best-performing region by far. Only about a quarter of the nearly 50 index countries managed a gain this period: Ireland (+19%) - the EU's fastest-growing economy - and Israel (+17%) proved top performers; Greece (-56%) and Brazil (-46%), among the worst. As for sectors, energy (-25%) and materials (-16%) declined sharply, whereas the two consumer sectors each gained about 6%.
Comments from Portfolio Manager Kirk Neureiter: For the year, the fund's share classes (excluding sales charges, if applicable) posted modest single-digit gains but fell considerably short of the 10.61% gain of the benchmark Tokyo Stock Price Index (TOPIX). A downward fair-value adjustment significantly detracted from performance versus the benchmark. Stock selection in health care, information technology, consumer staples and industrials were other meaningful negatives. At the stock level, a large overweighting in Hitachi was the fund's largest relative detractor. This large industrial electronics firm was undergoing a restructuring that I thought was going well, but exposure to a slowing Chinese economy hurt its Hitachi Construction Machinery segment. Other noteworthy detractors included Japan Tobacco; Sanken Electric, a supplier of the power-related integrated circuits for the consumer electronics and auto industries; and drug stock Astellas Pharma, the fund's largest holding at period end. Conversely, stock picking in consumer discretionary and financials lifted relative performance. E-commerce giant Rakuten was the fund's top contributor. As the share price of Rakuten increased, I sold most of our position, although we still ended the period with an overweighting. Other contributors were Shimadzu, a maker of measuring equipment, medical equipment, space equipment and industrial machinery; and East Japan Railway, the fund's second-largest position at period end.
The views expressed above reflect those of the portfolio manager(s) only through the end of the period as stated on the cover of this report and do not necessarily represent the views of Fidelity or any other person in the Fidelity organization. Any such views are subject to change at any time based upon market or other conditions and Fidelity disclaims any responsibility to update such views. These views may not be relied on as investment advice and, because investment decisions for a Fidelity fund are based on numerous factors, may not be relied on as an indication of trading intent on behalf of any Fidelity fund.
Annual Report
Fidelity Japan Fund
As a shareholder of the Fund, you incur two types of costs: (1) transaction costs, including sales charges (loads) on purchase payments or redemption proceeds, redemption fees and (2) ongoing costs, including management fees, distribution and/or service (12b-1) fees and other Fund expenses. This Example is intended to help you understand your ongoing costs (in dollars) of investing in the Fund and to compare these costs with the ongoing costs of investing in other mutual funds.
The Example is based on an investment of $1,000 invested at the beginning of the period and held for the entire period (May 1, 2015 to October 31, 2015).
Actual Expenses
The first line of the accompanying table for each class of the Fund provides information about actual account values and actual expenses. You may use the information in this line, together with the amount you invested, to estimate the expenses that you paid over the period. Simply divide your account value by $1,000.00 (for example, an $8,600 account value divided by $1,000.00 = 8.6), then multiply the result by the number in the first line for a class of the Fund under the heading entitled "Expenses Paid During Period" to estimate the expenses you paid on your account during this period. A small balance maintenance fee of $12.00 that is charged once a year may apply for certain accounts with a value of less than $2,000. This fee is not included in the table below. If it was, the estimate of expenses you paid during the period would be higher, and your ending account value lower, by this amount. In addition, the Fund, as a shareholder in the underlying Fidelity Central Funds, will indirectly bear its pro-rata share of the fees and expenses incurred by the underlying Fidelity Central Funds. These fees and expenses are not included in the Fund's annualized expense ratio used to calculate the expense estimate in the table below.
Hypothetical Example for Comparison Purposes
The second line of the accompanying table for each class of the Fund provides information about hypothetical account values and hypothetical expenses based on a Class' actual expense ratio and an assumed rate of return of 5% per year before expenses, which is not the Class' actual return. The hypothetical account values and expenses may not be used to estimate the actual ending account balance or expenses you paid for the period. You may use this information to compare the ongoing costs of investing in the Fund and other funds. To do so, compare this 5% hypothetical example with the 5% hypothetical examples that appear in the shareholder reports of the other funds. A small balance maintenance fee of $12.00 that is charged once a year may apply for certain accounts with a value of less than $2,000. This fee is not included in the table below. If it was, the estimate of expenses you paid during the period would be higher, and your ending account value lower, by this amount. In addition, the Fund, as a shareholder in the underlying Fidelity Central Funds, will indirectly bear its pro-rata share of the fees and expenses incurred by the underlying Fidelity Central Funds. These fees and expenses are not included in the Fund's annualized expense ratio used to calculate the expense estimate in the table below.
Please note that the expenses shown in the table are meant to highlight your ongoing costs only and do not reflect any transaction costs. Therefore, the second line of the table is useful in comparing ongoing costs only, and will not help you determine the relative total costs of owning different funds. In addition, if these transactional costs were included, your costs would have been higher.
| Annualized
Expense RatioB | Beginning
Account Value
May 1, 2015 | Ending
Account Value
October 31, 2015 | Expenses Paid
During PeriodC
May 1, 2015
to October 31, 2015 |
Class A | 1.09% | | | |
Actual | | $ 1,000.00 | $ 962.70 | $ 5.39 |
HypotheticalA | | $ 1,000.00 | $ 1,019.71 | $ 5.55 |
Class T | 1.42% | | | |
Actual | | $ 1,000.00 | $ 961.10 | $ 7.02 |
HypotheticalA | | $ 1,000.00 | $ 1,018.05 | $ 7.22 |
Class B | 1.90% | | | |
Actual | | $ 1,000.00 | $ 958.60 | $ 9.38 |
HypotheticalA | | $ 1,000.00 | $ 1,015.63 | $ 9.65 |
Class C | 1.80% | | | |
Actual | | $ 1,000.00 | $ 959.30 | $ 8.89 |
HypotheticalA | | $ 1,000.00 | $ 1,016.13 | $ 9.15 |
Japan | .79% | | | |
Actual | | $ 1,000.00 | $ 964.40 | $ 3.91 |
HypotheticalA | | $ 1,000.00 | $ 1,021.22 | $ 4.02 |
Class I | .80% | | | |
Actual | | $ 1,000.00 | $ 965.10 | $ 3.96 |
HypotheticalA | | $ 1,000.00 | $ 1,021.17 | $ 4.08 |
A 5% return per year before expenses
B Annualized expense ratio reflects expenses net of applicable fee waivers.
C Expenses are equal to each Class' annualized expense ratio, multiplied by the average account value over the period, multiplied by 184/365 (to reflect the one-half year period).
Annual Report
Fidelity Japan Fund
Investment Changes (Unaudited)
Asset Allocation as of October 31, 2015 |
| % of fund's
net assets | % of fund's net assets
6 months ago |
Stocks | 98.6 | 92.5 |
Short-Term Investments and Net Other Assets (Liabilities)p | 1.4 | 7.5 |
Top Ten Stocks as of October 31, 2015 |
| % of fund's
net assets | % of fund's net assets
6 months ago |
Astellas Pharma, Inc. (Pharmaceuticals) | 4.9 | 4.7 |
East Japan Railway Co. (Road & Rail) | 4.2 | 4.1 |
Mitsubishi UFJ Financial Group, Inc. (Banks) | 4.0 | 4.1 |
KDDI Corp. (Wireless Telecommunication Services) | 3.3 | 3.4 |
Hoya Corp. (Health Care Equipment & Supplies) | 3.3 | 3.2 |
ORIX Corp. (Diversified Financial Services) | 3.0 | 3.1 |
Honda Motor Co. Ltd. (Automobiles) | 3.0 | 3.2 |
Mitsui Fudosan Co. Ltd. (Real Estate Management & Development) | 2.9 | 2.9 |
SoftBank Corp. (Wireless Telecommunication Services) | 2.8 | 3.1 |
Sony Corp. (Household Durables) | 2.6 | 1.4 |
| 34.0 | |
Market Sectors as of October 31, 2015 |
| % of fund's
net assets | % of fund's net assets
6 months ago |
Consumer Discretionary | 19.3 | 20.0 |
Financials | 19.0 | 19.2 |
Information Technology | 13.8 | 16.8 |
Industrials | 13.8 | 12.1 |
Health Care | 13.3 | 10.0 |
Telecommunication Services | 7.2 | 7.5 |
Consumer Staples | 7.0 | 3.8 |
Materials | 5.2 | 3.1 |
Annual Report
Fidelity Japan Fund
Investments October 31, 2015
Showing Percentage of Net Assets
Common Stocks - 98.6% |
| Shares | | Value |
CONSUMER DISCRETIONARY - 19.3% |
Auto Components - 3.3% |
Bridgestone Corp. | 236,400 | | $ 8,669,005 |
NGK Spark Plug Co. Ltd. | 195,200 | | 4,763,862 |
Sumitomo Electric Industries Ltd. | 351,900 | | 4,802,717 |
| | 18,235,584 |
Automobiles - 9.2% |
Fuji Heavy Industries Ltd. | 57,600 | | 2,227,601 |
Honda Motor Co. Ltd. | 495,700 | | 16,397,977 |
Isuzu Motors Ltd. | 306,800 | | 3,583,277 |
Mazda Motor Corp. | 276,900 | | 5,435,348 |
Suzuki Motor Corp. | 314,900 | | 10,310,916 |
Toyota Motor Corp. | 200,700 | | 12,295,772 |
| | 50,250,891 |
Hotels, Restaurants & Leisure - 0.6% |
Skylark Co. Ltd. | 250,300 | | 3,255,648 |
Household Durables - 4.0% |
Casio Computer Co. Ltd. (d) | 205,400 | | 3,869,605 |
Rinnai Corp. | 49,700 | | 3,940,019 |
Sony Corp. | 496,700 | | 14,118,910 |
| | 21,928,534 |
Internet & Catalog Retail - 0.5% |
Rakuten, Inc. | 177,700 | | 2,461,712 |
Media - 0.4% |
Proto Corp. | 174,000 | | 2,257,590 |
Multiline Retail - 0.4% |
Don Quijote Holdings Co. Ltd. | 55,000 | | 2,020,379 |
Specialty Retail - 0.9% |
United Arrows Ltd. | 119,700 | | 5,156,785 |
TOTAL CONSUMER DISCRETIONARY | | 105,567,123 |
CONSUMER STAPLES - 7.0% |
Beverages - 1.2% |
Asahi Group Holdings | 193,100 | | 5,956,400 |
Coca-Cola Central Japan Co. Ltd. | 32,500 | | 456,767 |
| | 6,413,167 |
Food & Staples Retailing - 4.0% |
Ain Holdings, Inc. | 38,100 | | 1,803,608 |
San-A Co. Ltd. | 47,900 | | 2,034,107 |
Seven & i Holdings Co. Ltd. | 208,600 | | 9,475,617 |
Sundrug Co. Ltd. | 56,600 | | 2,981,659 |
Tsuruha Holdings, Inc. | 24,800 | | 1,964,757 |
Welcia Holdings Co. Ltd. | 78,500 | | 3,868,891 |
| | 22,128,639 |
Tobacco - 1.8% |
Japan Tobacco, Inc. | 276,100 | | 9,556,315 |
TOTAL CONSUMER STAPLES | | 38,098,121 |
|
| Shares | | Value |
FINANCIALS - 19.0% |
Banks - 8.0% |
Mitsubishi UFJ Financial Group, Inc. | 3,380,400 | | $ 21,862,854 |
Seven Bank Ltd. | 1,358,900 | | 6,191,903 |
Shinsei Bank Ltd. | 3,139,000 | | 6,581,771 |
Sumitomo Mitsui Financial Group, Inc. | 232,500 | | 9,275,278 |
| | 43,911,806 |
Capital Markets - 0.8% |
Monex Group, Inc. | 1,462,000 | | 4,109,708 |
Diversified Financial Services - 3.0% |
ORIX Corp. | 1,141,000 | | 16,662,914 |
Insurance - 2.2% |
Tokio Marine Holdings, Inc. | 310,700 | | 11,971,797 |
Real Estate Investment Trusts - 1.3% |
Invincible Investment Corp. | 2,648 | | 1,570,091 |
Nippon Prologis REIT, Inc. | 942 | | 1,656,583 |
Parkway Life REIT | 1,347,000 | | 2,217,993 |
Sekisui House (REIT), Inc. | 1,502 | | 1,548,369 |
| | 6,993,036 |
Real Estate Management & Development - 3.7% |
AEON MALL Co. Ltd. | 252,100 | | 4,217,058 |
Mitsui Fudosan Co. Ltd. | 590,000 | | 16,056,055 |
| | 20,273,113 |
TOTAL FINANCIALS | | 103,922,374 |
HEALTH CARE - 13.3% |
Health Care Equipment & Supplies - 4.9% |
Hoya Corp. | 430,200 | | 17,752,968 |
Olympus Corp. | 259,400 | | 8,749,907 |
| | 26,502,875 |
Health Care Providers & Services - 3.5% |
Message Co. Ltd. (d) | 243,700 | | 6,006,654 |
Miraca Holdings, Inc. | 104,100 | | 4,633,000 |
Ship Healthcare Holdings, Inc. | 357,400 | | 8,657,380 |
| | 19,297,034 |
Pharmaceuticals - 4.9% |
Astellas Pharma, Inc. | 1,852,400 | | 26,886,627 |
TOTAL HEALTH CARE | | 72,686,536 |
INDUSTRIALS - 13.8% |
Airlines - 0.8% |
Japan Airlines Co. Ltd. | 120,600 | | 4,543,380 |
Building Products - 1.3% |
Daikin Industries Ltd. | 72,800 | | 4,677,471 |
LIXIL Group Corp. | 107,700 | | 2,305,862 |
| | 6,983,333 |
Construction & Engineering - 1.0% |
Toshiba Plant Systems & Services Corp. | 508,800 | | 5,449,983 |
Common Stocks - continued |
| Shares | | Value |
INDUSTRIALS - continued |
Electrical Equipment - 2.6% |
Mitsubishi Electric Corp. | 641,000 | | $ 6,675,849 |
Nidec Corp. | 99,000 | | 7,460,255 |
| | 14,136,104 |
Machinery - 2.7% |
IHI Corp. | 1,110,000 | | 3,131,774 |
Kubota Corp. | 334,000 | | 5,177,488 |
Makita Corp. | 117,000 | | 6,410,761 |
| | 14,720,023 |
Professional Services - 0.4% |
Funai Soken Holdings, Inc. | 145,800 | | 2,236,793 |
Road & Rail - 4.2% |
East Japan Railway Co. | 240,300 | | 22,846,664 |
Trading Companies & Distributors - 0.8% |
Misumi Group, Inc. | 349,200 | | 4,547,318 |
TOTAL INDUSTRIALS | | 75,463,598 |
INFORMATION TECHNOLOGY - 13.8% |
Electronic Equipment & Components - 6.8% |
Azbil Corp. | 207,200 | | 5,227,489 |
Hitachi Ltd. | 2,128,000 | | 12,275,993 |
OMRON Corp. | 123,900 | | 4,102,684 |
Shimadzu Corp. | 792,000 | | 12,285,888 |
TDK Corp. | 54,800 | | 3,490,565 |
| | 37,382,619 |
Internet Software & Services - 4.0% |
Alibaba Group Holding Ltd. sponsored ADR (a) | 46,900 | | 3,931,627 |
DeNA Co. Ltd. | 250,900 | | 4,025,511 |
Kakaku.com, Inc. (d) | 500,500 | | 9,336,956 |
NAVER Corp. | 8,563 | | 4,499,855 |
| | 21,793,949 |
Semiconductors & Semiconductor Equipment - 1.3% |
Sanken Electric Co. Ltd. | 750,000 | | 2,606,671 |
Sumco Corp. | 442,800 | | 4,463,736 |
| | 7,070,407 |
Software - 0.2% |
COLOPL, Inc. (d) | 81,000 | | 1,323,234 |
Technology Hardware, Storage & Peripherals - 1.5% |
NEC Corp. | 1,043,000 | | 3,217,637 |
Samsung Electronics Co. Ltd. | 4,206 | | 5,054,111 |
| | 8,271,748 |
TOTAL INFORMATION TECHNOLOGY | | 75,841,957 |
MATERIALS - 5.2% |
Chemicals - 4.9% |
Daicel Chemical Industries Ltd. | 261,500 | | 3,455,563 |
|
| Shares | | Value |
Hitachi Chemical Co. Ltd. | 155,500 | | $ 2,458,082 |
JSR Corp. | 289,800 | | 4,576,898 |
Kansai Paint Co. Ltd. | 232,000 | | 3,536,560 |
Shin-Etsu Chemical Co. Ltd. | 132,600 | | 7,885,613 |
Toray Industries, Inc. | 584,000 | | 5,094,934 |
| | 27,007,650 |
Metals & Mining - 0.3% |
Yamato Kogyo Co. Ltd. | 58,400 | | 1,555,608 |
TOTAL MATERIALS | | 28,563,258 |
TELECOMMUNICATION SERVICES - 7.2% |
Diversified Telecommunication Services - 1.1% |
Nippon Telegraph & Telephone Corp. | 162,200 | | 5,946,479 |
Wireless Telecommunication Services - 6.1% |
KDDI Corp. | 738,000 | | 17,858,371 |
SoftBank Corp. | 277,200 | | 15,530,937 |
| | 33,389,308 |
TOTAL TELECOMMUNICATION SERVICES | | 39,335,787 |
TOTAL COMMON STOCKS (Cost $530,190,692) |
539,478,754
|
Money Market Funds - 3.3% |
| | | |
Fidelity Cash Central Fund, 0.18% (b) | 5,556,318 | | 5,556,318 |
Fidelity Securities Lending Cash Central Fund, 0.19% (b)(c) | 12,649,386 | | 12,649,386 |
TOTAL MONEY MARKET FUNDS (Cost $18,205,704) |
18,205,704
|
TOTAL INVESTMENT
PORTFOLIO - 101.9% (Cost $548,396,396) | | 557,684,458 |
NET OTHER ASSETS (LIABILITIES) - (1.9)% | | (10,360,116) |
NET ASSETS - 100% | $ 547,324,342 |
Legend |
(a) Non-income producing |
(b) Affiliated fund that is generally available only to investment companies and other accounts managed by Fidelity Investments. The rate quoted is the annualized seven-day yield of the fund at period end. A complete unaudited listing of the fund's holdings as of its most recent quarter end is available upon request. In addition, each Fidelity Central Fund's financial statements, which are not covered by the Fund's Report of Independent Registered Public Accounting Firm, are available on the SEC's website or upon request. |
(c) Investment made with cash collateral received from securities on loan. |
(d) Security or a portion of the security is on loan at period end. |
Affiliated Central Funds |
Information regarding fiscal year to date income earned by the Fund from investments in Fidelity Central Funds is as follows: |
Fund | Income earned |
Fidelity Cash Central Fund | $ 20,597 |
Fidelity Securities Lending Cash Central Fund | 71,632 |
Total | $ 92,229 |
Other Information |
The following is a summary of the inputs used, as of October 31, 2015, involving the Fund's assets and liabilities carried at fair value. The inputs or methodology used for valuing securities may not be an indication of the risk associated with investing in those securities. For more information on valuation inputs, and their aggregation into the levels used in the table below, please refer to the Investment Valuation section in the accompanying Notes to Financial Statements. |
Valuation Inputs at Reporting Date: |
Description | Total | Level 1 | Level 2 | Level 3 |
Investments in Securities: | | | | |
Equities: | | | | |
Consumer Discretionary | $ 105,567,123 | $ - | $ 105,567,123 | $ - |
Consumer Staples | 38,098,121 | - | 38,098,121 | - |
Financials | 103,922,374 | - | 103,922,374 | - |
Health Care | 72,686,536 | - | 72,686,536 | - |
Industrials | 75,463,598 | - | 75,463,598 | - |
Information Technology | 75,841,957 | 13,485,593 | 62,356,364 | - |
Materials | 28,563,258 | - | 28,563,258 | - |
Telecommunication Services | 39,335,787 | - | 39,335,787 | - |
Money Market Funds | 18,205,704 | 18,205,704 | - | - |
Total Investments in Securities: | $ 557,684,458 | $ 31,691,297 | $ 525,993,161 | $ - |
See accompanying notes which are an integral part of the financial statements.
Annual Report
Fidelity Japan Fund
Statement of Assets and Liabilities
| | October 31, 2015 |
| | |
Assets | | |
Investment in securities, at value (including securities loaned of $12,036,815) - See accompanying schedule: Unaffiliated issuers (cost $530,190,692) | $ 539,478,754 | |
Fidelity Central Funds (cost $18,205,704) | 18,205,704 | |
Total Investments (cost $548,396,396) | | $ 557,684,458 |
Receivable for investments sold | | 574,282 |
Receivable for fund shares sold | | 516,884 |
Dividends receivable | | 3,045,252 |
Distributions receivable from Fidelity Central Funds | | 8,242 |
Prepaid expenses | | 1,495 |
Other receivables | | 1,228 |
Total assets | | 561,831,841 |
| | |
Liabilities | | |
Payable for investments purchased | $ 1,066,235 | |
Payable for fund shares redeemed | 356,790 | |
Accrued management fee | 229,677 | |
Distribution and service plan fees payable | 21,782 | |
Other affiliated payables | 106,395 | |
Other payables and accrued expenses | 77,234 | |
Collateral on securities loaned, at value | 12,649,386 | |
Total liabilities | | 14,507,499 |
| | |
Net Assets | | $ 547,324,342 |
Net Assets consist of: | | |
Paid in capital | | $ 717,255,617 |
Undistributed net investment income | | 3,017,018 |
Accumulated undistributed net realized gain (loss) on investments and foreign currency transactions | | (182,218,023) |
Net unrealized appreciation (depreciation) on investments and assets and liabilities in foreign currencies | | 9,269,730 |
Net Assets | | $ 547,324,342 |
Statement of Assets and Liabilities - continued
| | October 31, 2015 |
| | |
Calculation of Maximum Offering Price | | |
Class A:
Net Asset Value and redemption price per share ($23,917,721 ÷ 2,014,446 shares) | | $ 11.87 |
| | |
Maximum offering price per share (100/94.25 of $11.87) | | $ 12.59 |
Class T:
Net Asset Value and redemption price per share ($4,808,761 ÷ 405,871 shares) | | $ 11.85 |
| | |
Maximum offering price per share (100/96.50 of $11.85) | | $ 12.28 |
Class B:
Net Asset Value and offering price per share ($347,681 ÷ 29,411 shares)A | | $ 11.82 |
| | |
Class C:
Net Asset Value and offering price per share ($18,490,533 ÷ 1,571,218 shares)A | | $ 11.77 |
| | |
Japan:
Net Asset Value, offering price and redemption price per share ($485,803,076 ÷ 40,792,237 shares) | | $ 11.91 |
| | |
Class I:
Net Asset Value, offering price and redemption price per share ($13,956,570 ÷ 1,174,263 shares) | | $ 11.89 |
A Redemption price per share is equal to net asset value less any applicable contingent deferred sales charge.
See accompanying notes which are an integral part of the financial statements.
Annual Report
Statement of Operations
| Year ended October 31, 2015 |
| | |
Investment Income | | |
Dividends | | $ 8,050,801 |
Income from Fidelity Central Funds | | 92,229 |
Income before foreign taxes withheld | | 8,143,030 |
Less foreign taxes withheld | | (808,062) |
Total income | | 7,334,968 |
| | |
Expenses | | |
Management fee | | |
Basic fee | $ 3,498,174 | |
Performance adjustment | (907,813) | |
Transfer agent fees | 962,727 | |
Distribution and service plan fees | 222,835 | |
Accounting and security lending fees | 260,372 | |
Custodian fees and expenses | 52,192 | |
Independent trustees' compensation | 2,143 | |
Registration fees | 82,981 | |
Audit | 73,136 | |
Legal | 1,206 | |
Miscellaneous | 3,718 | |
Total expenses before reductions | 4,251,671 | |
Expense reductions | (28,886) | 4,222,785 |
Net investment income (loss) | | 3,112,183 |
Realized and Unrealized Gain (Loss) | | |
Net realized gain (loss) on: | | |
Investment securities: | | |
Unaffiliated issuers | (27,164) | |
Foreign currency transactions | (365,218) | |
Total net realized gain (loss) | | (392,382) |
Change in net unrealized appreciation (depreciation) on: Investment securities | 1,912,886 | |
Assets and liabilities in foreign currencies | 24,355 | |
Total change in net unrealized appreciation (depreciation) | | 1,937,241 |
Net gain (loss) | | 1,544,859 |
Net increase (decrease) in net assets resulting from operations | | $ 4,657,042 |
Statement of Changes in Net Assets
| Year ended
October 31,
2015 | Year ended
October 31,
2014 |
Increase (Decrease) in Net Assets | | |
Operations | | |
Net investment income (loss) | $ 3,112,183 | $ 3,447,815 |
Net realized gain (loss) | (392,382) | (3,239,373) |
Change in net unrealized appreciation (depreciation) | 1,937,241 | (11,748,802) |
Net increase (decrease) in net assets resulting from operations | 4,657,042 | (11,540,360) |
Distributions to shareholders from net investment income | (3,310,432) | (4,561,447) |
Distributions to shareholders from net realized gain | - | (402,380) |
Total distributions | (3,310,432) | (4,963,827) |
Share transactions - net increase (decrease) | 70,904,089 | (48,052,746) |
Redemption fees | 139,156 | 110,748 |
Total increase (decrease) in net assets | 72,389,855 | (64,446,185) |
| | |
Net Assets | | |
Beginning of period | 474,934,487 | 539,380,672 |
End of period (including undistributed net investment income of $3,017,018 and undistributed net investment income of $3,240,458, respectively) | $ 547,324,342 | $ 474,934,487 |
See accompanying notes which are an integral part of the financial statements.
Annual Report
Financial Highlights - Fidelity Japan Fund Class A
Years ended October 31, | 2015 | 2014 | 2013 | 2012 | 2011 H |
Selected Per-Share Data | | | | | |
Net asset value, beginning of period | $ 11.65 | $ 12.00 | $ 9.30 | $ 9.54 | $ 10.83 |
Income from Investment Operations | | | | | |
Net investment income (loss) E | .04 | .05 | .08 | .09 | .09 |
Net realized and unrealized gain (loss) | .23 | (.31) | 2.80 | (.15) | (1.39) |
Total from investment operations | .27 | (.26) | 2.88 | (.06) | (1.30) |
Distributions from net investment income | (.05) | (.08) | (.11) | (.13) | - |
Distributions from net realized gain | - | (.01) | (.08) | (.05) | - |
Total distributions | (.05) | (.09) | (.19) | (.18) | - |
Redemption fees added to paid in capitalE | -K | -K | .01 | -K | .01 |
Net asset value, end of period | $ 11.87 | $ 11.65 | $ 12.00 | $ 9.30 | $ 9.54 |
Total ReturnB, C, D | 2.31% | (2.18)% | 31.58% | (.64)% | (11.91)% |
Ratios to Average Net AssetsF, I | | | | | |
Expenses before reductions | 1.10% | 1.23% | 1.26% | 1.42% | 1.20%A |
Expenses net of fee waivers, if any | 1.10% | 1.23% | 1.26% | 1.38% | 1.20%A |
Expenses net of all reductions | 1.09% | 1.23% | 1.25% | 1.36% | 1.16%A |
Net investment income (loss) | .37% | .41% | .75% | .94% | 1.02%A |
Supplemental Data | | | | | |
Net assets, end of period (000 omitted) | $ 23,918 | $ 21,352 | $ 20,520 | $ 9,495 | $ 13,208 |
Portfolio turnover rateG | 35% | 112% | 68% | 52% | 134%J |
AAnnualized BTotal returns for periods of less than one year are not annualized. CTotal returns would have been lower if certain expenses had not been reduced during the applicable periods shown. DTotal returns do not include the effect of the sales charges. ECalculated based on average shares outstanding during the period. FFees and expenses of any underlying Fidelity Central Funds are not included in the Fund's expense ratio. The Fund indirectly bears its proportionate share of the expenses of any underlying Fidelity Central Funds. GAmount does not include the portfolio activity of any underlying Fidelity Central Funds. HFor the period December 14, 2010 (commencement of sale of shares) to October 31, 2011. IExpense ratios reflect operating expenses of the class. Expenses before reductions do not reflect amounts reimbursed by the investment adviser or reductions from brokerage service arrangements or reductions from other expense offset arrangements and do not represent the amount paid by the class during periods when reimbursements or reductions occur. Expenses net of fee waivers reflect expenses after reimbursement by the investment adviser but prior to reductions from brokerage service arrangements or other expense offset arrangements. Expenses net of all reductions represent the net expenses paid by the class. JThe portfolio turnover rate does not include the assets acquired in the merger. KAmount represents less than $.005 per share. |
Financial Highlights - Fidelity Japan Fund Class T
Years ended October 31, | 2015 | 2014 | 2013 | 2012 | 2011 H |
Selected Per-Share Data | | | | | |
Net asset value, beginning of period | $ 11.62 | $ 11.96 | $ 9.28 | $ 9.51 | $ 10.83 |
Income from Investment Operations | | | | | |
Net investment income (loss) E | -K | .01 | .05 | .06 | .07 |
Net realized and unrealized gain (loss) | .23 | (.30) | 2.78 | (.13) | (1.40) |
Total from investment operations | .23 | (.29) | 2.83 | (.07) | (1.33) |
Distributions from net investment income | - | (.04) | (.08) | (.11) | - |
Distributions from net realized gain | - | (.01) | (.08) | (.05) | - |
Total distributions | - | (.05) | (.16) | (.16) | - |
Redemption fees added to paid in capitalE | -K | -K | .01 | -K | .01 |
Net asset value, end of period | $ 11.85 | $ 11.62 | $ 11.96 | $ 9.28 | $ 9.51 |
Total ReturnB, C, D | 1.98% | (2.42)% | 31.04% | (.75)% | (12.19)% |
Ratios to Average Net AssetsF, I | | | | | |
Expenses before reductions | 1.43% | 1.54% | 1.55% | 1.70% | 1.48%A |
Expenses net of fee waivers, if any | 1.43% | 1.54% | 1.55% | 1.66% | 1.48%A |
Expenses net of all reductions | 1.42% | 1.54% | 1.53% | 1.64% | 1.44%A |
Net investment income (loss) | .04% | .10% | .46% | .66% | .74%A |
Supplemental Data | | | | | |
Net assets, end of period (000 omitted) | $ 4,809 | $ 4,104 | $ 5,357 | $ 3,934 | $ 4,643 |
Portfolio turnover rateG | 35% | 112% | 68% | 52% | 134%J |
AAnnualized BTotal returns for periods of less than one year are not annualized. CTotal returns would have been lower if certain expenses had not been reduced during the applicable periods shown. DTotal returns do not include the effect of the sales charges. ECalculated based on average shares outstanding during the period. FFees and expenses of any underlying Fidelity Central Funds are not included in the Fund's expense ratio. The Fund indirectly bears its proportionate share of the expenses of any underlying Fidelity Central Funds. GAmount does not include the portfolio activity of any underlying Fidelity Central Funds. HFor the period December 14, 2010 (commencement of sale of shares) to October 31, 2011. IExpense ratios reflect operating expenses of the class. Expenses before reductions do not reflect amounts reimbursed by the investment adviser or reductions from brokerage service arrangements or reductions from other expense offset arrangements and do not represent the amount paid by the class during periods when reimbursements or reductions occur. Expenses net of fee waivers reflect expenses after reimbursement by the investment adviser but prior to reductions from brokerage service arrangements or other expense offset arrangements. Expenses net of all reductions represent the net expenses paid by the class. JThe portfolio turnover rate does not include the assets acquired in the merger. KAmount represents less than $.005 per share. |
See accompanying notes which are an integral part of the financial statements.
Annual Report
Financial Highlights - Fidelity Japan Fund Class B
Years ended October 31, | 2015 | 2014 | 2013 | 2012 | 2011 H |
Selected Per-Share Data | | | | | |
Net asset value, beginning of period | $ 11.65 | $ 12.00 | $ 9.26 | $ 9.47 | $ 10.83 |
Income from Investment Operations | | | | | |
Net investment income (loss) E | (.05) | (.04) | -K | .02 | .02 |
Net realized and unrealized gain (loss) | .22 | (.31) | 2.80 | (.14) | (1.39) |
Total from investment operations | .17 | (.35) | 2.80 | (.12) | (1.37) |
Distributions from net investment income | - | - | - | (.04) | - |
Distributions from net realized gain | - | - | (.07) | (.05) | - |
Total distributions | - | - | (.07) | (.09) | - |
Redemption fees added to paid in capitalE | -K | -K | .01 | -K | .01 |
Net asset value, end of period | $ 11.82 | $ 11.65 | $ 12.00 | $ 9.26 | $ 9.47 |
Total ReturnB, C, D | 1.46% | (2.92)% | 30.52% | (1.24)% | (12.56)% |
Ratios to Average Net AssetsF, I | | | | | |
Expenses before reductions | 1.91% | 2.02% | 2.02% | 2.17% | 1.95%A |
Expenses net of fee waivers, if any | 1.91% | 2.02% | 2.02% | 2.13% | 1.95%A |
Expenses net of all reductions | 1.91% | 2.02% | 2.01% | 2.11% | 1.91%A |
Net investment income (loss) | (.45)% | (.37)% | (.02)% | .19% | .27%A |
Supplemental Data | | | | | |
Net assets, end of period (000 omitted) | $ 348 | $ 452 | $ 874 | $ 1,012 | $ 1,458 |
Portfolio turnover rateG | 35% | 112% | 68% | 52% | 134%J |
AAnnualized BTotal returns for periods of less than one year are not annualized. CTotal returns would have been lower if certain expenses had not been reduced during the applicable periods shown. DTotal returns do not include the effect of the contingent deferred sales charge. ECalculated based on average shares outstanding during the period. FFees and expenses of any underlying Fidelity Central Funds are not included in the Fund's expense ratio. The Fund indirectly bears its proportionate share of the expenses of any underlying Fidelity Central Funds. GAmount does not include the portfolio activity of any underlying Fidelity Central Funds. HFor the period December 14, 2010 (commencement of sale of shares) to October 31, 2011. IExpense ratios reflect operating expenses of the class. Expenses before reductions do not reflect amounts reimbursed by the investment adviser or reductions from brokerage service arrangements or reductions from other expense offset arrangements and do not represent the amount paid by the class during periods when reimbursements or reductions occur. Expenses net of fee waivers reflect expenses after reimbursement by the investment adviser but prior to reductions from brokerage service arrangements or other expense offset arrangements. Expenses net of all reductions represent the net expenses paid by the class. JThe portfolio turnover rate does not include the assets acquired in the merger. KAmount represents less than $.005 per share. |
Financial Highlights - Fidelity Japan Fund Class C
Years ended October 31, | 2015 | 2014 | 2013 | 2012 | 2011 H |
Selected Per-Share Data | | | | | |
Net asset value, beginning of period | $ 11.58 | $ 11.96 | $ 9.25 | $ 9.48 | $ 10.83 |
Income from Investment Operations | | | | | |
Net investment income (loss) E | (.04) | (.03) | -K | .02 | .03 |
Net realized and unrealized gain (loss) | .23 | (.32) | 2.79 | (.14) | (1.39) |
Total from investment operations | .19 | (.35) | 2.79 | (.12) | (1.36) |
Distributions from net investment income | - | (.03) | (.01) | (.06) | - |
Distributions from net realized gain | - | (.01) | (.08) | (.05) | - |
Total distributions | - | (.03) L | (.09) | (.11) | - |
Redemption fees added to paid in capitalE | -K | -K | .01 | -K | .01 |
Net asset value, end of period | $ 11.77 | $ 11.58 | $ 11.96 | $ 9.25 | $ 9.48 |
Total ReturnB, C, D | 1.64% | (2.90)% | 30.55% | (1.27)% | (12.47)% |
Ratios to Average Net AssetsF, I | | | | | |
Expenses before reductions | 1.81% | 1.93% | 1.97% | 2.15% | 1.92%A |
Expenses net of fee waivers, if any | 1.81% | 1.93% | 1.97% | 2.11% | 1.92%A |
Expenses net of all reductions | 1.80% | 1.93% | 1.95% | 2.09% | 1.88%A |
Net investment income (loss) | (.34)% | (.29)% | .04% | .21% | .30%A |
Supplemental Data | | | | | |
Net assets, end of period (000 omitted) | $ 18,491 | $ 13,162 | $ 11,824 | $ 7,015 | $ 8,750 |
Portfolio turnover rateG | 35% | 112% | 68% | 52% | 134%J |
AAnnualized BTotal returns for periods of less than one year are not annualized. CTotal returns would have been lower if certain expenses had not been reduced during the applicable periods shown. DTotal returns do not include the effect of the contingent deferred sales charge. ECalculated based on average shares outstanding during the period. FFees and expenses of any underlying Fidelity Central Funds are not included in the Fund's expense ratio. The Fund indirectly bears its proportionate share of the expenses of any underlying Fidelity Central Funds. GAmount does not include the portfolio activity of any underlying Fidelity Central Funds. HFor the period December 14, 2010 (commencement of sale of shares) to October 31, 2011. IExpense ratios reflect operating expenses of the class. Expenses before reductions do not reflect amounts reimbursed by the investment adviser or reductions from brokerage service arrangements or reductions from other expense offset arrangements and do not represent the amount paid by the class during periods when reimbursements or reductions occur. Expenses net of fee waivers reflect expenses after reimbursement by the investment adviser but prior to reductions from brokerage service arrangements or other expense offset arrangements. Expenses net of all reductions represent the net expenses paid by the class. JThe portfolio turnover rate does not include the assets acquired in the merger. KAmount represents less than $.005 per share. LTotal distributions of $.03 per share is comprised of distributions from net investment income of $.025 and distributions from net realized gain of $.009 per share. |
See accompanying notes which are an integral part of the financial statements.
Annual Report
Financial Highlights - Fidelity Japan Fund
Years ended October 31, | 2015 | 2014 | 2013 | 2012 | 2011 |
Selected Per-Share Data | | | | | |
Net asset value, beginning of period | $ 11.69 | $ 12.03 | $ 9.34 | $ 9.57 | $ 10.57 |
Income from Investment Operations | | | | | |
Net investment income (loss) B | .08 | .09 | .12 | .12 | .15 |
Net realized and unrealized gain (loss) | .23 | (.32) | 2.79 | (.14) | (.75) |
Total from investment operations | .31 | (.23) | 2.91 | (.02) | (.60) |
Distributions from net investment income | (.09) | (.11) | (.15) | (.16) | (.20) |
Distributions from net realized gain | - | (.01) | (.08) | (.05) | (.21) |
Total distributions | (.09) | (.11) H | (.23) | (.21) | (.41) |
Redemption fees added to paid in capitalB | -G | -G | .01 | -G | .01 |
Net asset value, end of period | $ 11.91 | $ 11.69 | $ 12.03 | $ 9.34 | $ 9.57 |
Total Return A | 2.66% | (1.90)% | 31.92% | (.19)% | (6.00)% |
Ratios to Average Net AssetsC, E | | | | | |
Expenses before reductions | .80% | .90% | .93% | 1.09% | .86% |
Expenses net of fee waivers, if any | .80% | .90% | .93% | 1.06% | .84% |
Expenses net of all reductions | .79% | .90% | .91% | 1.04% | .80% |
Net investment income (loss) | .67% | .74% | 1.08% | 1.26% | 1.38% |
Supplemental Data | | | | | |
Net assets, end of period (000 omitted) | $ 485,803 | $ 415,612 | $ 480,773 | $ 353,550 | $ 450,417 |
Portfolio turnover rateD | 35% | 112% | 68% | 52% | 134%F |
ATotal returns would have been lower if certain expenses had not been reduced during the applicable periods shown. BCalculated based on average shares outstanding during the period. CFees and expenses of any underlying Fidelity Central Funds are not included in the Fund's expense ratio. The Fund indirectly bears its proportionate share of the expenses of any underlying Fidelity Central Funds. DAmount does not include the portfolio activity of any underlying Fidelity Central Funds. EExpense ratios reflect operating expenses of the class. Expenses before reductions do not reflect amounts reimbursed by the investment adviser or reductions from brokerage service arrangements or reductions from other expense offset arrangements and do not represent the amount paid by the class during periods when reimbursements or reductions occur. Expenses net of fee waivers reflect expenses after reimbursement by the investment adviser but prior to reductions from brokerage service arrangements or other expense offset arrangements. Expenses net of all reductions represent the net expenses paid by the class. FThe portfolio turnover rate does not include the assets acquired in the merger. GAmount represents less than $.005 per share. HTotal distributions of $.11 per share is comprised of distributions from net investment income of $.105 and distributions from net realized gain of $.009 per share. |
Financial Highlights - Fidelity Japan Fund Class I
Years ended October 31, | 2015 | 2014 | 2013 | 2012 | 2011 G |
Selected Per-Share Data | | | | | |
Net asset value, beginning of period | $ 11.67 | $ 12.02 | $ 9.33 | $ 9.57 | $ 10.83 |
Income from Investment Operations | | | | | |
Net investment income (loss) D | .08 | .09 | .13 | .12 | .13 |
Net realized and unrealized gain (loss) | .23 | (.32) | 2.78 | (.14) | (1.40) |
Total from investment operations | .31 | (.23) | 2.91 | (.02) | (1.27) |
Distributions from net investment income | (.09) | (.12) | (.15) | (.17) | - |
Distributions from net realized gain | - | (.01) | (.08) | (.05) | - |
Total distributions | (.09) | (.12) K | (.23) | (.22) | - |
Redemption fees added to paid in capitalD | -J | -J | .01 | -J | .01 |
Net asset value, end of period | $ 11.89 | $ 11.67 | $ 12.02 | $ 9.33 | $ 9.57 |
Total ReturnB, C | 2.72% | (1.90)% | 32.04% | (.18)% | (11.63)% |
Ratios to Average Net AssetsE, H | | | | | |
Expenses before reductions | .80% | .89% | .90% | 1.03% | .79%A |
Expenses net of fee waivers, if any | .80% | .89% | .90% | 1.01% | .79%A |
Expenses net of all reductions | .79% | .89% | .88% | .99% | .75%A |
Net investment income (loss) | .67% | .76% | 1.11% | 1.31% | 1.43%A |
Supplemental Data | | | | | |
Net assets, end of period (000 omitted) | $ 13,957 | $ 20,253 | $ 20,033 | $ 1,488 | $ 2,715 |
Portfolio turnover rateF | 35% | 112% | 68% | 52% | 134%I |
AAnnualized BTotal returns for periods of less than one year are not annualized. CTotal returns would have been lower if certain expenses had not been reduced during the applicable periods shown. DCalculated based on average shares outstanding during the period. EFees and expenses of any underlying Fidelity Central Funds are not included in the Fund's expense ratio. The Fund indirectly bears its proportionate share of the expenses of any underlying Fidelity Central Funds. FAmount does not include the portfolio activity of any underlying Fidelity Central Funds. GFor the period December 14, 2010 (commencement of sale of shares) to October 31, 2011. HExpense ratios reflect operating expenses of the class. Expenses before reductions do not reflect amounts reimbursed by the investment adviser or reductions from brokerage service arrangements or reductions from other expense offset arrangements and do not represent the amount paid by the class during periods when reimbursements or reductions occur. Expenses net of fee waivers reflect expenses after reimbursement by the investment adviser but prior to reductions from brokerage service arrangements or other expense offset arrangements. Expenses net of all reductions represent the net expenses paid by the class. IThe portfolio turnover rate does not include the assets acquired in the merger. JAmount represents less than $.005 per share. KTotal distributions of $.12 per share is comprised of distributions from net investment income of $.115 and distributions from net realized gain of $.009 per share. |
See accompanying notes which are an integral part of the financial statements.
Annual Report
For the period ended October 31, 2015
1. Organization.
Fidelity Japan Fund (the Fund) is a fund of Fidelity Investment Trust (the Trust) and is authorized to issue an unlimited number of shares. The Trust is registered under the Investment Company Act of 1940, as amended (the 1940 Act), as an open-end management investment company organized as a Massachusetts business trust. The Fund offers Class A, Class T, Class C, Japan and Class I (formerly Institutional Class) shares, each of which, along with Class B shares, has equal rights as to assets and voting privileges. Class B shares are closed to new accounts and additional purchases, except for exchanges and reinvestments. Each class has exclusive voting rights with respect to matters that affect that class. Class B shares will automatically convert to Class A shares after a holding period of seven years from the initial date of purchase.
2. Investments in Fidelity Central Funds.
The Fund invests in Fidelity Central Funds, which are open-end investment companies generally available only to other investment companies and accounts managed by the investment adviser and its affiliates. The Fund's Schedule of Investments lists each of the Fidelity Central Funds held as of period end, if any, as an investment of the Fund, but does not include the underlying holdings of each Fidelity Central Fund. As an Investing Fund, the Fund indirectly bears its proportionate share of the expenses of the underlying Fidelity Central Funds.
The Money Market Central Funds seek preservation of capital and current income and are managed by Fidelity Investments Money Management, Inc. (FIMM), an affiliate of the investment adviser. Annualized expenses of the Money Market Central Funds as of their most recent shareholder report date are less than .005%.
A complete unaudited list of holdings for each Fidelity Central Fund is available upon request or at the Securities and Exchange Commission (the SEC) website at www.sec.gov. In addition, the financial statements of the Fidelity Central Funds, which are not covered by the Fund's Report of Independent Registered Public Accounting Firm, are available on the SEC website or upon request.
3. Significant Accounting Policies.
The financial statements have been prepared in conformity with accounting principles generally accepted in the United States of America (GAAP), which require management to make certain estimates and assumptions at the date of the financial statements. Actual results could differ from those estimates. Subsequent events, if any, through the date that the financial statements were issued have been evaluated in the preparation of the financial statements. The following summarizes the significant accounting policies of the Fund:
Investment Valuation. Investments are valued as of 4:00 p.m. Eastern time on the last calendar day of the period. The Board of Trustees (the Board) has delegated the day to day responsibility for the valuation of the Fund's investments to the Fidelity Management & Research Company (FMR) Fair Value Committee (the Committee). In accordance with valuation policies and procedures approved by the Board, the Fund attempts to obtain prices from one or more third party pricing vendors or brokers to value its investments. When current market prices, quotations or currency exchange rates are not readily available or reliable, investments will be fair valued in good faith by the Committee, in accordance with procedures adopted by the Board. Factors used in determining fair value vary by investment type and may include market or investment specific events. The frequency with which these procedures are used cannot be predicted and they may be utilized to a significant extent. The Committee oversees the Fund's valuation policies and procedures and reports to the Board on the Committee's activities and fair value determinations. The Board monitors the appropriateness of the procedures used in valuing the Fund's investments and ratifies the fair value determinations of the Committee.
The Fund categorizes the inputs to valuation techniques used to value its investments into a disclosure hierarchy consisting of three levels as shown below:
Level 1 - quoted prices in active markets for identical investments
Level 2 - other significant observable inputs (including quoted prices for similar investments, interest rates, prepayment speeds, etc.)
Level 3 - unobservable inputs (including the Fund's own assumptions based on the best information available)
Valuation techniques used to value the Fund's investments by major category are as follows:
Equity securities, including restricted securities, for which market quotations are readily available, are valued at the last reported sale price or official closing price as reported by a third party pricing vendor on the primary market or exchange on which they are traded and are categorized as Level 1 in the hierarchy. In the event there were no sales during the day or closing prices are not available, securities are valued at the last quoted bid price or may be valued using the last available price and are generally categorized as Level 2 in the hierarchy. For foreign equity securities, when market or security specific events arise, comparisons to the valuation of American Depositary Receipts (ADRs), futures contracts, Exchange-Traded Funds (ETFs) and certain indexes as well as quoted prices for similar securities may be used and would be categorized as Level 2 in the hierarchy. Utilizing these techniques may result in transfers between Level 1 and Level 2. For equity securities, including restricted securities, where observable inputs are limited, assumptions about market activity and risk are used and these securities may be categorized as Level 3 in the hierarchy.
Annual Report
Notes to Financial Statements - continued
3. Significant Accounting Policies - continued
Investment Valuation - continued
Investments in open-end mutual funds, including the Fidelity Central Funds, are valued at their closing net asset value (NAV) each business day and are categorized as Level 1 in the hierarchy.
Changes in valuation techniques may result in transfers in or out of an assigned level within the disclosure hierarchy. The aggregate value of investments by input level as of October 31, 2015 is included at the end of the Fund's Schedule of Investments.
Foreign Currency. The Fund may use foreign currency contracts to facilitate transactions in foreign-denominated securities. Gains and losses from these transactions may arise from changes in the value of the foreign currency or if the counterparties do not perform under the contracts' terms.
Foreign-denominated assets, including investment securities, and liabilities are translated into U.S. dollars at the exchange rates at period end. Purchases and sales of investment securities, income and dividends received and expenses denominated in foreign currencies are translated into U.S. dollars at the exchange rate in effect on the transaction date.
The effects of exchange rate fluctuations on investments are included with the net realized and unrealized gain (loss) on investment securities. Other foreign currency transactions resulting in realized and unrealized gain (loss) are disclosed separately.
Investment Transactions and Income. For financial reporting purposes, the Fund's investment holdings and NAV include trades executed through the end of the last business day of the period. The NAV per share for processing shareholder transactions is calculated as of the close of business of the New York Stock Exchange (NYSE), normally 4:00 p.m. Eastern time and includes trades executed through the end of the prior business day. Gains and losses on securities sold are determined on the basis of identified cost. Dividend income is recorded on the ex-dividend date, except for certain dividends from foreign securities where the ex-dividend date may have passed, which are recorded as soon as the Fund is informed of the ex-dividend date. Non-cash dividends included in dividend income, if any, are recorded at the fair market value of the securities received. Income and capital gain distributions from Fidelity Central Funds, if any, are recorded on the ex-dividend date. Investment income is recorded net of foreign taxes withheld where recovery of such taxes is uncertain.
Class Allocations and Expenses. Investment income, realized and unrealized capital gains and losses, common expenses of the Fund, and certain fund-level expense reductions, if any, are allocated daily on a pro-rata basis to each class based on the relative net assets of each class to the total net assets of the Fund. Each class differs with respect to transfer agent and distribution and service plan fees incurred. Certain expense reductions may also differ by class. For the reporting period, the allocated portion of income and expenses to each class as a percent of its average net assets may vary due to the timing of recording these transactions in relation to fluctuating net assets of the classes. Expenses directly attributable to a fund are charged to that fund. Expenses attributable to more than one fund are allocated among the respective funds on the basis of relative net assets or other appropriate methods. Expense estimates are accrued in the period to which they relate and adjustments are made when actual amounts are known.
Income Tax Information and Distributions to Shareholders. Each year, the Fund intends to qualify as a regulated investment company under Subchapter M of the Internal Revenue Code, including distributing substantially all of its taxable income and realized gains. As a result, no provision for U.S. Federal income taxes is required. As of October 31, 2015, the Fund did not have any unrecognized tax benefits in the financial statements; nor is the Fund aware of any tax positions for which it is reasonably possible that the total amounts of unrecognized tax benefits will significantly change in the next twelve months. The Fund files a U.S. federal tax return, in addition to state and local tax returns as required. The Fund's federal income tax returns are subject to examination by the Internal Revenue Service (IRS) for a period of three fiscal years after they are filed. State and local tax returns may be subject to examination for an additional fiscal year depending on the jurisdiction. Foreign taxes are provided for based on the Fund's understanding of the tax rules and rates that exist in the foreign markets in which it invests.
Distributions are declared and recorded on the ex-dividend date. Income dividends and capital gain distributions are declared separately for each class. Income and capital gain distributions are determined in accordance with income tax regulations, which may differ from GAAP.
Capital accounts within the financial statements are adjusted for permanent book-tax differences. These adjustments have no impact on net assets or the results of operations. Capital accounts are not adjusted for temporary book-tax differences which will reverse in a subsequent period.
Book-tax differences are primarily due to foreign currency transactions, passive-foreign investment companies (PFIC), expiring capital loss carryforwards, deferred trustees compensation, capital loss carryforwards and losses deferred due to wash sales.
The federal tax cost of investment securities and unrealized appreciation (depreciation) as of period end were as follows:
Gross unrealized appreciation | $ 49,425,970 |
Gross unrealized depreciation | (44,535,187) |
Net unrealized appreciation (depreciation) on securities | $ 4,890,783 |
Tax Cost | $ 552,793,675 |
Annual Report
3. Significant Accounting Policies - continued
Income Tax Information and Distributions to Shareholders - continued
The tax-based components of distributable earnings as of period end were as follows:
Undistributed ordinary income | $ 3,215,209 |
Capital loss carryforward | $ (178,019,200) |
Net unrealized appreciation (depreciation) on securities and other investments | $ 4,872,858 |
Capital loss carryforwards are only available to offset future capital gains of the Fund to the extent provided by regulations and may be limited. Under the Regulated Investment Company Modernization Act of 2010 (the Act), the Fund is permitted to carry forward capital losses incurred in taxable years beginning after December 22, 2010 for an unlimited period and such capital losses are required to be used prior to any losses that expire. The capital loss carryforward information presented below, including any applicable limitation, is estimated as of fiscal period end and is subject to adjustment.
Fiscal year of expiration | |
2016 | $ (3,870,588) |
2017 | (41,604,070) |
2018 | (26,887,863) |
2019 | (98,806,037) |
Total with expiration | (171,168,558) |
No expiration | |
Short-term | (6,850,642) |
Total capital loss carryforward | $ (178,019,200) |
The tax character of distributions paid was as follows:
| October 31, 2015 | October 31, 2014 |
Ordinary Income | $ 3,310,432 | $ 4,963,827 |
Due to large redemptions in a prior period, $141,955,883 of capital losses that will be available to offset future capital gains of the Fund will be limited to approximately $18,885,324 per year.
The Fund acquired $5,487,891 of its capital loss carryforward as part of a merger in a prior period. The losses acquired that will be available to offset future capital gains of the Fund will be limited to approximately $1,371,973 per year.
Short-Term Trading (Redemption) Fees. Shares held by investors in the Fund less than 90 days may have been subject to a redemption fee equal to 1.50% of the NAV of shares redeemed. All redemption fees, which reduce the proceeds of the shareholder redemption, are retained by the Fund and accounted for as an addition to paid in capital.
4. Purchases and Sales of Investments.
Purchases and sales of securities, other than short-term securities, aggregated $242,746,871 and $168,418,077, respectively.
5. Fees and Other Transactions with Affiliates.
Management Fee. Fidelity Management & Research Company (the investment adviser) and its affiliates provide the Fund with investment management related services for which the Fund pays a monthly management fee. The management fee is the sum of an individual fund fee rate that is based on an annual rate of .45% of the Fund's average net assets and an annualized group fee rate that averaged .25% during the period. The group fee rate is based upon the average net assets of all the mutual funds advised by the investment adviser, including any mutual funds previously advised by the investment adviser that are currently advised by Fidelity SelectCo, LLC, an affiliate of the investment adviser. The group fee rate decreases as assets under management increase and increases as assets under management decrease. In addition, the management fee is subject to a performance adjustment (up to a maximum of ± .20% of the Fund's average net assets over a 36 month performance period). The upward or downward adjustment to the management fee is based on the relative investment performance of Japan as compared to its benchmark index, the TOPIX, over the same 36 month performance period. For the reporting period, the total annual management fee rate, including the performance adjustment, was .52% of the Fund's average net assets. The performance adjustment included in the management fee rate may be higher or lower than the maximum performance adjustment rate due to the difference between the average net assets for the reporting and performance periods.
Annual Report
Notes to Financial Statements - continued
5. Fees and Other Transactions with Affiliates - continued
Distribution and Service Plan Fees. In accordance with Rule 12b-1 of the 1940 Act, the Fund has adopted separate Distribution and Service Plans for each class of shares. Certain classes pay Fidelity Distributors Corporation (FDC), an affiliate of the investment adviser, separate Distribution and Service Fees, each of which is based on an annual percentage of each class' average net assets. In addition, FDC may pay financial intermediaries for selling shares of the Fund and providing shareholder support services. For the period, the Distribution and Service Fee rates, total fees and amounts retained by FDC were as follows:
| Distribution
Fee | Service
Fee | Total Fees | Retained
by FDC |
Class A | -% | .25% | $ 50,273 | $ 1,164 |
Class T | .25% | .25% | 21,808 | 36 |
Class B | .75% | .25% | 4,103 | 3,078 |
Class C | .75% | .25% | 146,651 | 44,718 |
| | | $ 222,835 | $ 48,996 |
Sales Load. FDC may receive a front-end sales charge of up to 5.75% for selling Class A shares and 3.50% for selling Class T shares, some of which is paid to financial intermediaries for selling shares of the Fund. Depending on the holding period, FDC may receive contingent deferred sales charges levied on Class A, Class T, Class B, and Class C redemptions. The deferred sales charges range from 5.00% to 1.00% for Class B shares, 1.00% for Class C shares, 1.00% for certain purchases of Class A shares and .25% for certain purchases of Class T shares.
For the period, sales charge amounts retained by FDC were as follows:
| Retained
by FDC |
Class A | $ 45,946 |
Class T | 1,710 |
Class B A | 8 |
Class C A | 4,518 |
| $ 52,182 |
A When Class B and Class C shares are initially sold, FDC pays commissions from its own resources to financial intermediaries through which the sales are made.
Transfer Agent Fees. Fidelity Investments Institutional Operations Company, Inc., (FIIOC), an affiliate of the investment adviser, is the transfer, dividend disbursing and shareholder servicing agent for each class of the Fund. FIIOC receives account fees and asset-based fees that vary according to the account size and type of account of the shareholders of the respective classes of the Fund. FIIOC pays for typesetting, printing and mailing of shareholder reports, except proxy statements.
For the period, transfer agent fees for each class were as follows:
| Amount | % of
Class-Level Average
Net Assets |
Class A | $ 47,937 | .24 |
Class T | 13,899 | .32 |
Class B | 1,223 | .30 |
Class C | 29,557 | .20 |
Japan | 841,695 | .19 |
Class I | 28,416 | .19 |
| $ 962,727 | |
Accounting and Security Lending Fees. Fidelity Service Company, Inc. (FSC), an affiliate of the investment adviser, maintains the Fund's accounting records. The accounting fee is based on the level of average net assets for each month. Under a separate contract, FSC administers the security lending program. The security lending fee is based on the number and duration of lending transactions.
Annual Report
6. Committed Line of Credit.
The Fund participates with other funds managed by the investment adviser or an affiliate in a $4.25 billion credit facility (the "line of credit") to be utilized for temporary or emergency purposes to fund shareholder redemptions or for other short-term liquidity purposes. The Fund has agreed to pay commitment fees on its pro-rata portion of the line of credit, which amounted to $704 and is reflected in Miscellaneous expenses on the Statement of Operations. During the period, the Fund did not borrow on this line of credit.
7. Security Lending.
The Fund lends portfolio securities through a lending agent from time to time in order to earn additional income. For equity securities, a lending agent is used and may loan securities to certain qualified borrowers, including Fidelity Capital Markets (FCM), a broker-dealer affiliated with the Fund. On the settlement date of the loan, the Fund receives collateral (in the form of U.S. Treasury obligations, letters of credit and/or cash) against the loaned securities and maintains collateral in an amount not less than 100% of the market value of the loaned securities during the period of the loan. The market value of the loaned securities is determined at the close of business of the Fund and any additional required collateral is delivered to the Fund on the next business day. The Fund or borrower may terminate the loan at any time, and if the borrower defaults on its obligation to return the securities loaned because of insolvency or other reasons, the Fund may apply collateral received from the borrower against the obligation. The Fund may experience delays and costs in recovering the securities loaned. Any cash collateral received is invested in the Fidelity Securities Lending Cash Central Fund. The value of loaned securities and cash collateral at period end are disclosed on the Fund's Statement of Assets and Liabilities. Security lending income represents the income earned on investing cash collateral, less rebates paid to borrowers and any lending agent fees associated with the loan, plus any premium payments received for lending certain types of securities. Security lending income is presented in the Statement of Operations as a component of income from Fidelity Central Funds. Total security lending income during the period amounted to $71,632. During the period, there were no securities loaned to FCM.
8. Expense Reductions.
Commissions paid to certain brokers with whom the investment adviser, or its affiliates, places trades on behalf of the Fund include an amount in addition to trade execution, which may be rebated back to the Fund to offset certain expenses. This amount totaled $14,341 for the period.
In addition, during the period the investment adviser reimbursed and/or waived a portion of fund-level operating expenses in the amount of $2,192 and a portion of class-level operating expenses as follows:
| Amount |
Class A | $ 400 |
Class T | 8 |
Class B | 1 |
Class C | 278 |
Japan | 11,320 |
Class I | 346 |
| $ 12,353 |
9. Distributions to Shareholders.
Distributions to shareholders of each class were as follows:
Years ended October 31, | 2015 | 2014 |
From net investment income | | |
Class A | $ 79,823 | $ 141,802 |
Class T | - | 19,055 |
Class C | - | 25,435 |
Japan | 3,066,127 | 4,169,355 |
Class I | 164,482 | 205,800 |
Total | $ 3,310,432 | $ 4,561,447 |
From net realized gain | | |
Class A | $ - | $ 15,756 |
Class T | - | 3,988 |
Class C | - | 9,157 |
Japan | - | 357,373 |
Class I | - | 16,106 |
Total | $ - | $ 402,380 |
Annual Report
Notes to Financial Statements - continued
10. Share Transactions.
Share transactions for each class were as follows and may contain automatic conversions between classes or exchanges between funds:
| Shares | Dollars |
Years ended October 31, | 2015 | 2014 | 2015 | 2014 |
Class A | | | | |
Shares sold | 1,104,408 | 952,008 | $ 13,420,485 | $ 11,244,440 |
Reinvestment of distributions | 6,565 | 11,439 | 74,452 | 136,237 |
Shares redeemed | (929,216) | (840,548) | (10,724,499) | (9,766,930) |
Net increase (decrease) | 181,757 | 122,899 | $ 2,770,438 | $ 1,613,747 |
Class T | | | | |
Shares sold | 180,232 | 64,476 | $ 2,170,519 | $ 752,702 |
Reinvestment of distributions | - | 1,875 | - | 22,328 |
Shares redeemed | (127,640) | (160,810) | (1,490,023) | (1,872,832) |
Net increase (decrease) | 52,592 | (94,459) | $ 680,496 | $ (1,097,802) |
Class B | | | | |
Shares sold | 711 | 818 | $ 8,779 | $ 10,000 |
Shares redeemed | (10,106) | (34,849) | (116,253) | (406,096) |
Net increase (decrease) | (9,395) | (34,031) | $ (107,474) | $ (396,096) |
Class C | | | | |
Shares sold | 747,753 | 496,705 | $ 8,932,993 | $ 5,806,151 |
Reinvestment of distributions | - | 2,168 | - | 25,821 |
Shares redeemed | (312,924) | (351,222) | (3,580,602) | (4,038,883) |
Net increase (decrease) | 434,829 | 147,651 | $ 5,352,391 | $ 1,793,089 |
Japan | | | | |
Shares sold | 18,408,352 | 4,922,211 | $ 225,875,166 | $ 57,652,164 |
Reinvestment of distributions | 262,630 | 370,099 | 2,980,854 | 4,407,882 |
Shares redeemed | (13,426,033) | (9,716,469) | (161,325,584) | (112,632,153) |
Net increase (decrease) | 5,244,949 | (4,424,159) | $ 67,530,436 | $ (50,572,107) |
Class I | | | | |
Shares sold | 1,688,546 | 916,937 | $ 20,578,143 | $ 10,668,831 |
Reinvestment of distributions | 14,222 | 13,570 | 161,134 | 161,488 |
Shares redeemed | (2,263,385) | (862,451) | (26,061,475) | (10,223,896) |
Net increase (decrease) | (560,617) | 68,056 | $ (5,322,198) | $ 606,423 |
11. Other.
The Fund's organizational documents provide former and current trustees and officers with a limited indemnification against liabilities arising in connection with the performance of their duties to the Fund. In the normal course of business, the Fund may also enter into contracts that provide general indemnifications. The Fund's maximum exposure under these arrangements is unknown as this would be dependent on future claims that may be made against the Fund. The risk of material loss from such claims is considered remote.
At the end of the period, Strategic Advisers International Fund was the owner of record of approximately 23% of the total outstanding shares of the Fund. Mutual Funds managed by the investment adviser or its affiliates were the owners of record, in the aggregate, of approximately 53% of the total outstanding shares of the Fund.
Annual Report
Fidelity Japan Smaller Companies Fund
Average annual total return reflects the change in the value of an investment, assuming reinvestment of the fund's distributions from dividend income and capital gains (the profits earned upon the sale of securities that have grown in value, if any) and assuming a constant rate of performance each year. The $10,000 table and the fund's returns do not reflect the deduction of taxes that a shareholder would pay on fund distributions or the redemption of fund shares. During periods of reimbursement by Fidelity, a fund's total return will be greater than it would be had the reimbursement not occurred. How a fund did yesterday is no guarantee of how it will do tomorrow.
Average Annual Total Returns
Periods ended October 31, 2015 | Past 1
year | Past 5
years | Past 10
years |
Fidelity Japan Smaller Companies Fund | 6.93% | 12.97% | 1.91% |
$10,000 Over 10 years
Let's say hypothetically that $10,000 was invested in Fidelity Japan Smaller Companies Fund on October 31, 2005. The chart shows how the value of your investment would have changed, and also shows how the Russell/Nomura Mid-Small CapTM Index performed over the same period.
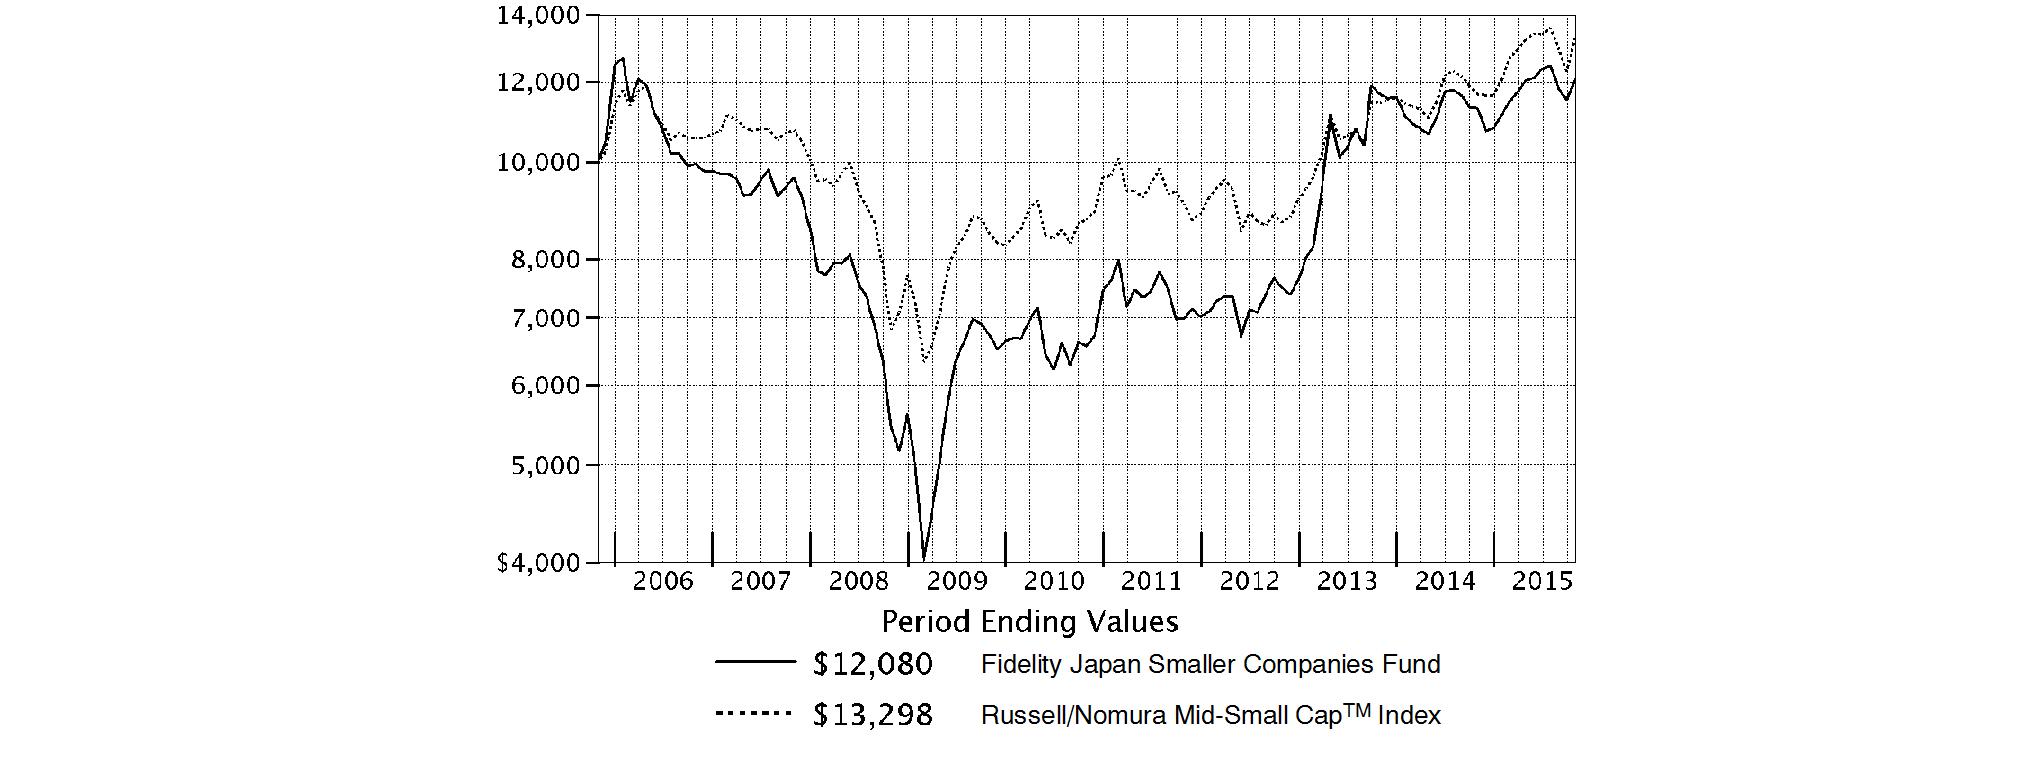
Annual Report
Fidelity Japan Smaller Companies Fund
Market Recap: International equities suffered a moderate setback for the 12 months ending October 31, 2015, held back by a collapse in commodities prices that hurt resources-related sectors and geographies. The MSCI ACWI (All Country World Index) ex USA Index returned -4.55% for the period, affected also by concerns about global economic growth. Commodity producers remained under pressure for much of the past year, largely related to economic deceleration in China (-1%), the world's second-largest economy and a leading consumer of raw materials. This effect was exacerbated by U.S. dollar strength relative to global currencies, which weighed on commodities priced in dollars and acutely impacted equity returns within regions most exposed to resources prices. The emerging-markets group, for example, returned about -15% this period. Canada, a significant energy producer, returned roughly -17%. Net energy consumer Japan (+9%) was the best-performing region by far. Only about a quarter of the nearly 50 index countries managed a gain this period: Ireland (+19%) - the EU's fastest-growing economy - and Israel (+17%) proved top performers; Greece (-56%) and Brazil (-46%), among the worst. As for sectors, energy (-25%) and materials (-16%) declined sharply, whereas the two consumer sectors each gained about 6%.
Comments from Portfolio Manager David Jenkins: For the year, the fund lagged the 13.83% return of the benchmark Russell/Nomura Mid Small Cap Index by a sizable margin. Most of the underperformance came in the first half of the period when the higher-quality and smaller-cap companies favored by the fund lagged the more speculative and larger-cap securities that led the index. Security selection, particularly in the industrials and health care sectors, and a small cash position detracted from relative performance, as did a downward fair-value pricing adjustment of 2.40 percentage points. Individual disappointments included Toshiba Plant Systems & Services, a comprehensive engineering company pressured by an accounting scandal at its parent company. An investment in large-cap capital goods company Komatsu declined as the economic slowdown in China pressured demand for mining, construction and farming equipment. Shares of ERI Holdings, which provides building-inspection services, declined as Japan's slower-than-expected real estate recovery hindered earnings. Komatsu and ERI were out-of-index investments that were not in the portfolio at period end. By contrast, stock picks in six out of 10 sectors aided relative performance, with the biggest gains coming from consumer discretionary, consumer staples and information technology. Standouts included Kotobuki Spirits, a confections company and top holding, and VT Holdings, which operates car dealerships.
The views expressed above reflect those of the portfolio manager(s) only through the end of the period as stated on the cover of this report and do not necessarily represent the views of Fidelity or any other person in the Fidelity organization. Any such views are subject to change at any time based upon market or other conditions and Fidelity disclaims any responsibility to update such views. These views may not be relied on as investment advice and, because investment decisions for a Fidelity fund are based on numerous factors, may not be relied on as an indication of trading intent on behalf of any Fidelity fund.
Annual Report
Fidelity Japan Smaller Companies Fund
As a shareholder of the Fund, you incur two types of costs: (1) transaction costs, including redemption fees and (2) ongoing costs, including management fees and other Fund expenses. This Example is intended to help you understand your ongoing costs (in dollars) of investing in the Fund and to compare these costs with the ongoing costs of investing in other mutual funds.
The Example is based on an investment of $1,000 invested at the beginning of the period and held for the entire period (May 1, 2015 to October 31, 2015).
Actual Expenses
The first line of the accompanying table provides information about actual account values and actual expenses. You may use the information in this line, together with the amount you invested, to estimate the expenses that you paid over the period. Simply divide your account value by $1,000.00 (for example, an $8,600 account value divided by $1,000.00 = 8.6), then multiply the result by the number in the first line under the heading entitled "Expenses Paid During Period" to estimate the expenses you paid on your account during this period. A small balance maintenance fee of $12.00 that is charged once a year may apply for certain accounts with a value of less than $2,000. This fee is not included in the table below. If it was, the estimate of expenses you paid during the period would be higher, and your ending account value lower, by this amount. In addition, the Fund, as a shareholder in the underlying Fidelity Central Funds, will indirectly bear its pro-rata share of the fees and expenses incurred by the underlying Fidelity Central Funds. These fees and expenses are not included in the Fund's annualized expense ratio used to calculate the expense estimate in the table below.
Hypothetical Example for Comparison Purposes
The second line of the accompanying table provides information about hypothetical account values and hypothetical expenses based on the Fund's actual expense ratio and an assumed rate of return of 5% per year before expenses, which is not the Fund's actual return. The hypothetical account values and expenses may not be used to estimate the actual ending account balance or expenses you paid for the period. You may use this information to compare the ongoing costs of investing in the Fund and other funds. To do so, compare this 5% hypothetical example with the 5% hypothetical examples that appear in the shareholder reports of the other funds. A small balance maintenance fee of $12.00 that is charged once a year may apply for certain accounts with a value of less than $2,000. This fee is not included in the table below. If it was, the estimate of expenses you paid during the period would be higher, and your ending account value lower, by this amount. In addition, the Fund, as a shareholder in the underlying Fidelity Central Funds, will indirectly bear its pro-rata share of the fees and expenses incurred by the underlying Fidelity Central Funds. These fees and expenses are not included in the Fund's annualized expense ratio used to calculate the expense estimate in the table below.
Please note that the expenses shown in the table are meant to highlight your ongoing costs only and do not reflect any transaction costs. Therefore, the second line of the table is useful in comparing ongoing costs only, and will not help you determine the relative total costs of owning different funds. In addition, if these transactional costs were included, your costs would have been higher.
| Annualized
Expense RatioB | Beginning
Account Value
May 1, 2015 | Ending
Account Value
October 31, 2015 | Expenses Paid
During PeriodC
May 1, 2015
to October 31, 2015 |
Actual | .97% | $ 1,000.00 | $ 1,002.20 | $ 4.90 |
HypotheticalA | | $ 1,000.00 | $ 1,020.32 | $ 4.94 |
A 5% return per year before expenses
B Annualized expense ratio reflects expenses net of applicable fee waivers.
C Expenses are equal to the Fund's annualized expense ratio, multiplied by the average account value over the period, multiplied by 184/365 (to reflect the one-half year period).
Annual Report
Fidelity Japan Smaller Companies Fund
Investment Changes (Unaudited)
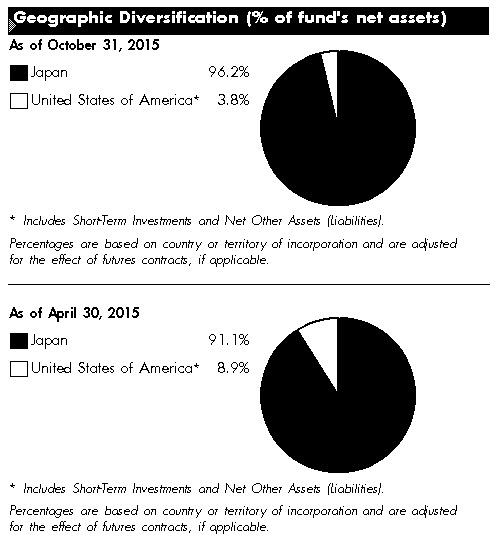
Asset Allocation as of October 31, 2015 |
| % of fund's
net assets | % of fund's net assets
6 months ago |
Stocks | 96.2 | 91.1 |
Investment Companies | 0.0 | 3.9 |
Short-Term Investments and Net Other Assets (Liabilities) | 3.8 | 5.0 |
Top Ten Stocks as of October 31, 2015 |
| % of fund's
net assets | % of fund's net assets
6 months ago |
Shinsei Bank Ltd. (Banks) | 1.8 | 1.5 |
Tokyo Gas Co. Ltd. (Gas Utilities) | 1.7 | 1.5 |
Lintec Corp. (Chemicals) | 1.7 | 1.6 |
Kotobuki Spirits Co. Ltd. (Food Products) | 1.6 | 1.0 |
Amano Corp. (Electronic Equipment & Components) | 1.6 | 1.5 |
SRA Holdings, Inc. (Software) | 1.6 | 1.1 |
Daiichikosho Co. Ltd. (Media) | 1.5 | 1.6 |
Kuraray Co. Ltd. (Chemicals) | 1.5 | 1.5 |
ORIX Corp. (Diversified Financial Services) | 1.5 | 0.7 |
Daito Trust Construction Co. Ltd. (Real Estate Management & Development) | 1.5 | 1.5 |
| 16.0 | |
Market Sectors as of October 31, 2015 |
| % of fund's
net assets | % of fund's net assets
6 months ago |
Industrials | 21.4 | 22.7 |
Consumer Discretionary | 17.6 | 20.2 |
Financials | 12.0 | 10.6 |
Information Technology | 11.6 | 11.1 |
Consumer Staples | 10.2 | 6.7 |
Materials | 9.2 | 8.3 |
Health Care | 7.1 | 5.5 |
Utilities | 3.8 | 3.6 |
Energy | 2.1 | 1.7 |
Telecommunication Services | 1.2 | 0.7 |
Percentages shown as 0.0% may reflect amounts less than 0.05%. |
Annual Report
Fidelity Japan Smaller Companies Fund
Investments October 31, 2015
Showing Percentage of Net Assets
Common Stocks - 96.2% |
| Shares | | Value |
CONSUMER DISCRETIONARY - 17.6% |
Auto Components - 3.2% |
Bridgestone Corp. | 148,300 | | $ 5,438,297 |
Hi-Lex Corp. | 100,000 | | 3,064,495 |
Kinugawa Rubber Industrial Co. Ltd. | 1,319,000 | | 7,357,486 |
| | 15,860,278 |
Distributors - 2.0% |
Central Automotive Products Ltd. | 695,000 | | 5,059,916 |
Chori Co. Ltd. | 353,700 | | 4,984,929 |
| | 10,044,845 |
Diversified Consumer Services - 1.2% |
Asante, Inc. | 492,000 | | 6,138,208 |
Hotels, Restaurants & Leisure - 1.9% |
Koshidaka Holdings Co. Ltd. (d) | 286,600 | | 5,188,297 |
St. Marc Holdings Co. Ltd. | 152,300 | | 4,527,389 |
| | 9,715,686 |
Media - 2.4% |
Daiichikosho Co. Ltd. | 230,900 | | 7,700,987 |
Proto Corp. | 345,400 | | 4,481,446 |
| | 12,182,433 |
Specialty Retail - 6.2% |
Arc Land Sakamoto Co. Ltd. | 262,300 | | 5,741,846 |
Asahi Co. Ltd. | 668,800 | | 6,569,085 |
Fuji Corp. | 224,200 | | 4,223,247 |
Nitori Holdings Co. Ltd. | 91,600 | | 7,142,870 |
VT Holdings Co. Ltd. | 1,176,600 | | 7,276,130 |
| | 30,953,178 |
Textiles, Apparel & Luxury Goods - 0.7% |
Hagihara Industries, Inc. | 197,400 | | 3,435,852 |
TOTAL CONSUMER DISCRETIONARY | | 88,330,480 |
CONSUMER STAPLES - 10.2% |
Food & Staples Retailing - 5.4% |
Kato Sangyo | 251,300 | | 6,116,128 |
Mitsubishi Shokuhin Co. Ltd. | 275,000 | | 6,994,971 |
San-A Co. Ltd. | 158,900 | | 6,747,800 |
Sogo Medical Co. Ltd. | 191,200 | | 7,086,120 |
| | 26,945,019 |
Food Products - 4.1% |
Kotobuki Spirits Co. Ltd. (d) | 228,000 | | 7,954,095 |
Rokko Butter Co. Ltd. | 229,100 | | 3,185,539 |
S Foods, Inc. (d) | 244,000 | | 4,241,385 |
Toyo Suisan Kaisha Ltd. | 136,000 | | 5,011,298 |
| | 20,392,317 |
Tobacco - 0.7% |
Japan Tobacco, Inc. | 108,800 | | 3,765,763 |
TOTAL CONSUMER STAPLES | | 51,103,099 |
|
| Shares | | Value |
ENERGY - 2.1% |
Energy Equipment & Services - 1.0% |
Shinko Plantech Co. Ltd. | 619,000 | | $ 4,974,947 |
Oil, Gas & Consumable Fuels - 1.1% |
San-Ai Oil Co. Ltd. | 716,000 | | 5,468,864 |
TOTAL ENERGY | | 10,443,811 |
FINANCIALS - 12.0% |
Banks - 4.0% |
Fukuoka Financial Group, Inc. | 1,178,000 | | 6,198,813 |
Shinsei Bank Ltd. | 4,262,000 | | 8,936,449 |
Sumitomo Mitsui Financial Group, Inc. | 131,900 | | 5,261,975 |
| | 20,397,237 |
Consumer Finance - 1.2% |
ACOM Co. Ltd. (a)(d) | 1,084,700 | | 5,938,505 |
Diversified Financial Services - 2.8% |
Fuyo General Lease Co. Ltd. | 147,900 | | 6,630,745 |
ORIX Corp. | 513,300 | | 7,496,121 |
| | 14,126,866 |
Insurance - 1.4% |
Tokio Marine Holdings, Inc. | 184,900 | | 7,124,510 |
Real Estate Management & Development - 2.6% |
Daito Trust Construction Co. Ltd. | 68,500 | | 7,414,874 |
Leopalace21 Corp. (a) | 1,060,600 | | 5,650,797 |
| | 13,065,671 |
TOTAL FINANCIALS | | 60,652,789 |
HEALTH CARE - 7.1% |
Health Care Equipment & Supplies - 3.3% |
Fukuda Denshi Co. Ltd. | 106,800 | | 5,211,374 |
Medikit Co. Ltd. | 183,800 | | 5,480,523 |
Paramount Bed Holdings Co. Ltd. | 184,600 | | 5,921,074 |
| | 16,612,971 |
Health Care Providers & Services - 2.7% |
A/S One Corp. | 192,500 | | 6,833,116 |
Miraca Holdings, Inc. | 155,100 | | 6,902,769 |
| | 13,735,885 |
Pharmaceuticals - 1.1% |
Astellas Pharma, Inc. | 376,500 | | 5,464,702 |
TOTAL HEALTH CARE | | 35,813,558 |
INDUSTRIALS - 21.4% |
Building Products - 3.3% |
Bunka Shutter Co. Ltd. | 614,400 | | 4,769,700 |
Sekisui Jushi Corp. | 471,600 | | 6,318,715 |
Sinko Industries Ltd. | 509,800 | | 5,408,461 |
| | 16,496,876 |
Common Stocks - continued |
| Shares | | Value |
INDUSTRIALS - continued |
Commercial Services & Supplies - 2.3% |
Aeon Delight Co. Ltd. | 222,800 | | $ 6,418,478 |
Asia Securities Printing Co. Ltd. | 710,000 | | 5,233,043 |
| | 11,651,521 |
Construction & Engineering - 2.1% |
Hokuriku Electrical Construction Co. Ltd. | 587,000 | | 5,074,395 |
Toshiba Plant Systems & Services Corp. | 519,200 | | 5,561,382 |
| | 10,635,777 |
Electrical Equipment - 1.1% |
Aichi Electric Co. Ltd. | 699,000 | | 2,082,679 |
Denyo Co. Ltd. | 225,200 | | 3,652,132 |
| | 5,734,811 |
Machinery - 2.5% |
Daiwa Industries Ltd. | 566,100 | | 3,745,133 |
Kokusai Co. Ltd. (d) | 232,500 | | 2,866,871 |
Oiles Corp. | 357,280 | | 5,680,154 |
| | 12,292,158 |
Professional Services - 3.7% |
Funai Soken Holdings, Inc. | 270,500 | | 4,149,880 |
Meitec Corp. | 71,900 | | 2,611,241 |
Weathernews, Inc. | 205,100 | | 6,600,669 |
Yamada Consulting Group Co. Ltd. (d) | 179,200 | | 5,245,052 |
| | 18,606,842 |
Trading Companies & Distributors - 5.2% |
Daiichi Jitsugyo Co. Ltd. | 679,000 | | 2,896,994 |
Inaba Denki Sangyo Co. Ltd. | 110,500 | | 3,447,934 |
Maruka Machinery Co. Ltd. | 195,300 | | 2,857,850 |
Mitani Shoji Co. Ltd. | 269,200 | | 6,668,575 |
Yamazen Co. Ltd. | 727,600 | | 6,497,693 |
Yuasa Trading Co. Ltd. | 164,400 | | 3,832,198 |
| | 26,201,244 |
Transportation Infrastructure - 1.2% |
Kamigumi Co. Ltd. | 712,000 | | 6,117,260 |
TOTAL INDUSTRIALS | | 107,736,489 |
INFORMATION TECHNOLOGY - 11.6% |
Electronic Equipment & Components - 5.3% |
Amano Corp. | 602,400 | | 7,824,379 |
Japan Aviation Electronics Industry Ltd. | 162,000 | | 2,869,684 |
Macnica Fuji Electronics Holdings, Inc. | 467,200 | | 6,285,417 |
OMRON Corp. | 134,900 | | 4,466,925 |
Siix Corp. (d) | 188,900 | | 5,316,101 |
| | 26,762,506 |
IT Services - 1.0% |
TKC Corp. | 204,900 | | 4,829,803 |
Software - 3.1% |
Broadleaf Co. Ltd. | 321,500 | | 3,682,651 |
|
| Shares | | Value |
Oracle Corp. Japan | 87,100 | | $ 3,961,377 |
SRA Holdings, Inc. | 378,200 | | 7,767,872 |
| | 15,411,900 |
Technology Hardware, Storage & Peripherals - 2.2% |
Elecom Co. Ltd. | 600,600 | | 7,284,191 |
Hitachi Maxell Ltd. | 225,400 | | 3,865,606 |
| | 11,149,797 |
TOTAL INFORMATION TECHNOLOGY | | 58,154,006 |
MATERIALS - 9.2% |
Chemicals - 9.2% |
C. Uyemura & Co. Ltd. | 113,400 | | 5,909,342 |
JSR Corp. | 403,700 | | 6,375,755 |
Kuraray Co. Ltd. | 623,000 | | 7,684,004 |
Lintec Corp. | 361,200 | | 8,461,124 |
Sakata INX Corp. | 618,300 | | 5,639,673 |
SK Kaken Co. Ltd. | 67,000 | | 6,525,468 |
Tokyo Ohka Kogyo Co. Ltd. | 183,500 | | 5,864,877 |
| | 46,460,243 |
TELECOMMUNICATION SERVICES - 1.2% |
Wireless Telecommunication Services - 1.2% |
KDDI Corp. | 249,800 | | 6,044,744 |
UTILITIES - 3.8% |
Electric Utilities - 2.1% |
Hokuriku Electric Power Co., Inc. | 331,900 | | 4,950,571 |
The Okinawa Electric Power Co., Inc. | 230,750 | | 5,664,445 |
| | 10,615,016 |
Gas Utilities - 1.7% |
Tokyo Gas Co. Ltd. | 1,710,000 | | 8,462,551 |
TOTAL UTILITIES | | 19,077,567 |
TOTAL COMMON STOCKS (Cost $433,699,437) |
483,816,786
|
Money Market Funds - 5.0% |
| Shares | | Value |
Fidelity Cash Central Fund, 0.18% (b) | 15,805,705 | | $ 15,805,705 |
Fidelity Securities Lending Cash Central Fund, 0.19% (b)(c) | 9,114,456 | | 9,114,456 |
TOTAL MONEY MARKET FUNDS (Cost $24,920,161) |
24,920,161
|
TOTAL INVESTMENT
PORTFOLIO - 101.2% (Cost $458,619,598) | | 508,736,947 |
NET OTHER ASSETS (LIABILITIES) - (1.2)% | | (5,895,233) |
NET ASSETS - 100% | $ 502,841,714 |
Legend |
(a) Non-income producing |
(b) Affiliated fund that is generally available only to investment companies and other accounts managed by Fidelity Investments. The rate quoted is the annualized seven-day yield of the fund at period end. A complete unaudited listing of the fund's holdings as of its most recent quarter end is available upon request. In addition, each Fidelity Central Fund's financial statements, which are not covered by the Fund's Report of Independent Registered Public Accounting Firm, are available on the SEC's website or upon request. |
(c) Investment made with cash collateral received from securities on loan. |
(d) Security or a portion of the security is on loan at period end. |
Affiliated Central Funds |
Information regarding fiscal year to date income earned by the Fund from investments in Fidelity Central Funds is as follows: |
Fund | Income earned |
Fidelity Cash Central Fund | $ 22,781 |
Fidelity Securities Lending Cash Central Fund | 46,909 |
Total | $ 69,690 |
Other Affiliated Issuers |
An affiliated company is a company in which the Fund has ownership of at least 5% of the voting securities. Fiscal year to date transactions with companies which are or were affiliates are as follows: |
Affiliate | Value,
beginning of
period | Purchases | Sales
Proceeds | Dividend
Income | Value,
end of
period |
Eri Holdings Co. Ltd. | $ 4,702,074 | $ - | $ 2,982,350 | $ 101,535 | $ - |
Other Information |
Categorizations in the Schedule of Investments are based on country or territory of incorporation. |
The following is a summary of the inputs used, as of October 31, 2015, involving the Fund's assets and liabilities carried at fair value. The inputs or methodology used for valuing securities may not be an indication of the risk associated with investing in those securities. For more information on valuation inputs, and their aggregation into the levels used in the table below, please refer to the Investment Valuation section in the accompanying Notes to Financial Statements. |
Valuation Inputs at Reporting Date: |
Description | Total | Level 1 | Level 2 | Level 3 |
Investments in Securities: | | | | |
Equities: | | | | |
Consumer Discretionary | $ 88,330,480 | $ - | $ 88,330,480 | $ - |
Consumer Staples | 51,103,099 | - | 51,103,099 | - |
Energy | 10,443,811 | - | 10,443,811 | - |
Financials | 60,652,789 | - | 60,652,789 | - |
Health Care | 35,813,558 | - | 35,813,558 | - |
Industrials | 107,736,489 | - | 107,736,489 | - |
Information Technology | 58,154,006 | - | 58,154,006 | - |
Materials | 46,460,243 | - | 46,460,243 | - |
Telecommunication Services | 6,044,744 | - | 6,044,744 | - |
Utilities | 19,077,567 | - | 19,077,567 | - |
Money Market Funds | 24,920,161 | 24,920,161 | - | - |
Total Investments in Securities: | $ 508,736,947 | $ 24,920,161 | $ 483,816,786 | $ - |
See accompanying notes which are an integral part of the financial statements.
Annual Report
Fidelity Japan Smaller Companies Fund
Statement of Assets and Liabilities
| | October 31, 2015 |
| | |
Assets | | |
Investment in securities, at value (including securities loaned of $8,655,070) - See accompanying schedule: Unaffiliated issuers (cost $433,699,437) | $ 483,816,786 | |
Fidelity Central Funds (cost $24,920,161) | 24,920,161 | |
Total Investments (cost $458,619,598) | | $ 508,736,947 |
Foreign currency held at value (cost $29,117) | | 29,117 |
Receivable for investments sold | | 816,517 |
Receivable for fund shares sold | | 628,359 |
Dividends receivable | | 3,099,133 |
Distributions receivable from Fidelity Central Funds | | 9,963 |
Prepaid expenses | | 1,351 |
Other receivables | | 4,191 |
Total assets | | 513,325,578 |
| | |
Liabilities | | |
Payable for investments purchased | $ 821,503 | |
Payable for fund shares redeemed | 101,520 | |
Accrued management fee | 286,761 | |
Other affiliated payables | 96,310 | |
Other payables and accrued expenses | 63,314 | |
Collateral on securities loaned, at value | 9,114,456 | |
Total liabilities | | 10,483,864 |
| | |
Net Assets | | $ 502,841,714 |
Net Assets consist of: | | |
Paid in capital | | $ 466,405,346 |
Undistributed net investment income | | 3,344,679 |
Accumulated undistributed net realized gain (loss) on investments and foreign currency transactions | | (17,008,272) |
Net unrealized appreciation (depreciation) on investments and assets and liabilities in foreign currencies | | 50,099,961 |
Net Assets, for 36,551,222 shares outstanding | | $ 502,841,714 |
Net Asset Value, offering price and redemption price per share ($502,841,714 ÷ 36,551,222 shares) | | $ 13.76 |
Statement of Operations
| Year ended October 31, 2015 |
| | |
Investment Income | | |
Dividends | | $ 8,472,122 |
Income from Fidelity Central Funds | | 69,690 |
Income before foreign taxes withheld | | 8,541,812 |
Less foreign taxes withheld | | (847,212) |
Total income | | 7,694,600 |
| | |
Expenses | | |
Management fee | $ 3,081,911 | |
Transfer agent fees | 831,110 | |
Accounting and security lending fees | 228,934 | |
Custodian fees and expenses | 89,705 | |
Independent trustees' compensation | 1,929 | |
Registration fees | 28,967 | |
Audit | 60,361 | |
Legal | 1,070 | |
Miscellaneous | 3,677 | |
Total expenses before reductions | 4,327,664 | |
Expense reductions | (39,803) | 4,287,861 |
Net investment income (loss) | | 3,406,739 |
Realized and Unrealized Gain (Loss) | | |
Net realized gain (loss) on: | | |
Investment securities: | | |
Unaffiliated issuers | (12,633,706) | |
Foreign currency transactions | (650,766) | |
Total net realized gain (loss) | | (13,284,472) |
Change in net unrealized appreciation (depreciation) on: Investment securities | 34,189,892 | |
Assets and liabilities in foreign currencies | 60,129 | |
Total change in net unrealized appreciation (depreciation) | | 34,250,021 |
Net gain (loss) | | 20,965,549 |
Net increase (decrease) in net assets resulting from operations | | $ 24,372,288 |
See accompanying notes which are an integral part of the financial statements.
Annual Report
Fidelity Japan Smaller Companies Fund
Financial Statements - continued
Statement of Changes in Net Assets
| Year ended
October 31,
2015 | Year ended
October 31,
2014 |
Increase (Decrease) in Net Assets | | |
Operations | | |
Net investment income (loss) | $ 3,406,739 | $ 3,540,086 |
Net realized gain (loss) | (13,284,472) | 83,877,484 |
Change in net unrealized appreciation (depreciation) | 34,250,021 | (114,800,346) |
Net increase (decrease) in net assets resulting from operations | 24,372,288 | (27,382,776) |
Distributions to shareholders from net investment income | (991,819) | (796,313) |
Distributions to shareholders from net realized gain | (5,888,929) | (14,582,161) |
Total distributions | (6,880,748) | (15,378,474) |
Share transactions | | |
Proceeds from sales of shares | 181,245,784 | 122,963,906 |
Reinvestment of distributions | 6,645,506 | 14,883,766 |
Cost of shares redeemed | (118,682,976) | (340,912,183) |
Net increase (decrease) in net assets resulting from share transactions | 69,208,314 | (203,064,511) |
Redemption fees | 90,331 | 432,103 |
Total increase (decrease) in net assets | 86,790,185 | (245,393,658) |
| | |
Net Assets | | |
Beginning of period | 416,051,529 | 661,445,187 |
End of period (including undistributed net investment income of $3,344,679 and undistributed net investment income of $979,566, respectively) | $ 502,841,714 | $ 416,051,529 |
Other Information Shares | | |
Sold | 13,218,734 | 9,257,514 |
Issued in reinvestment of distributions | 539,846 | 1,115,725 |
Redeemed | (8,966,998) | (26,335,365) |
Net increase (decrease) | 4,791,582 | (15,962,126) |
Financial Highlights - Fidelity Japan Smaller Companies Fund
Years ended October 31, | 2015 | 2014 | 2013 | 2012 | 2011 |
Selected Per-Share Data | | | | | |
Net asset value, beginning of period | $ 13.10 | $ 13.86 | $ 9.12 | $ 8.62 | $ 8.23 |
Income from Investment Operations | | | | | |
Net investment income (loss) B | .10 | .09 | .02 | .06 | .08 |
Net realized and unrealized gain (loss) | .78 | (.53) | 4.91 | .55 | .45 |
Total from investment operations | .88 | (.44) | 4.93 | .61 | .53 |
Distributions from net investment income | (.03) | (.02) | (.07) | (.08) | (.05) |
Distributions from net realized gain | (.19) | (.31) | (.15) | (.03) | (.10) |
Total distributions | (.22) | (.33) | (.22) | (.11) | (.14) G |
Redemption fees added to paid in capitalB | -F | .01 | .03 | -F | -F |
Net asset value, end of period | $ 13.76 | $ 13.10 | $ 13.86 | $ 9.12 | $ 8.62 |
Total ReturnA | 6.93% | (3.16)% | 55.79% | 7.13% | 6.44% |
Ratios to Average Net AssetsC, E | | | | | |
Expenses before reductions | .98% | 1.00% | 1.01% | 1.05% | 1.05% |
Expenses net of fee waivers, if any | .98% | 1.00% | 1.01% | 1.05% | 1.05% |
Expenses net of all reductions | .97% | 1.00% | .98% | 1.02% | 1.01% |
Net investment income (loss) | .77% | .70% | .18% | .67% | .88% |
Supplemental Data | | | | | |
Net assets, end of period (000 omitted) | $ 502,842 | $ 416,052 | $ 661,445 | $ 237,893 | $ 303,619 |
Portfolio turnover rateD | 41% | 112% | 91% | 86% | 133% |
ATotal returns would have been lower if certain expenses had not been reduced during the applicable periods shown. BCalculated based on average shares outstanding during the period. CFees and expenses of any underlying Fidelity Central Funds are not included in the Fund's expense ratio. The Fund indirectly bears its proportionate share of the expenses of any underlying Fidelity Central Funds. DAmount does not include the portfolio activity of any underlying Fidelity Central Funds. EExpense ratios reflect operating expenses of the Fund. Expenses before reductions do not reflect amounts reimbursed by the investment adviser or reductions from brokerage service arrangements or reductions from other expense offset arrangements and do not represent the amount paid by the Fund during periods when reimbursements or reductions occur. Expenses net of fee waivers reflect expenses after reimbursement by the investment adviser but prior to reductions from brokerage service arrangements or other expense offset arrangements. Expenses net of all reductions represent the net expenses paid by the Fund. FAmount represents less than $.005 per share. GTotal distributions of $.14 per share is comprised of distributions from net investment income of $.045 and distributions from net realized gain of $.095 per share. |
See accompanying notes which are an integral part of the financial statements.
Annual Report
For the period ended October 31, 2015
1. Organization.
Fidelity Japan Smaller Companies Fund (the Fund) is a fund of Fidelity Investment Trust (the Trust) and is authorized to issue an unlimited number of shares. Share transactions on the Statement of Changes in Net Assets may contain exchanges between funds. The Trust is registered under the Investment Company Act of 1940, as amended (the 1940 Act), as an open-end management investment company organized as a Massachusetts business trust.
2. Investments in Fidelity Central Funds.
The Fund invests in Fidelity Central Funds, which are open-end investment companies generally available only to other investment companies and accounts managed by the investment adviser and its affiliates. The Fund's Schedule of Investments lists each of the Fidelity Central Funds held as of period end, if any, as an investment of the Fund, but does not include the underlying holdings of each Fidelity Central Fund. As an Investing Fund, the Fund indirectly bears its proportionate share of the expenses of the underlying Fidelity Central Funds.
The Money Market Central Funds seek preservation of capital and current income and are managed by Fidelity Investments Money Management, Inc. (FIMM), an affiliate of the investment adviser. Annualized expenses of the Money Market Central Funds as of their most recent shareholder report date are less than .005%.
A complete unaudited list of holdings for each Fidelity Central Fund is available upon request or at the Securities and Exchange Commission (the SEC) website at www.sec.gov. In addition, the financial statements of the Fidelity Central Funds, which are not covered by the Fund's Report of Independent Registered Public Accounting Firm, are available on the SEC website or upon request.
3. Significant Accounting Policies.
The financial statements have been prepared in conformity with accounting principles generally accepted in the United States of America (GAAP), which require management to make certain estimates and assumptions at the date of the financial statements. Actual results could differ from those estimates. Subsequent events, if any, through the date that the financial statements were issued have been evaluated in the preparation of the financial statements. The following summarizes the significant accounting policies of the Fund:
Investment Valuation. Investments are valued as of 4:00 p.m. Eastern time on the last calendar day of the period. The Board of Trustees (the Board) has delegated the day to day responsibility for the valuation of the Fund's investments to the Fidelity Management & Research Company (FMR) Fair Value Committee (the Committee). In accordance with valuation policies and procedures approved by the Board, the Fund attempts to obtain prices from one or more third party pricing vendors or brokers to value its investments. When current market prices, quotations or currency exchange rates are not readily available or reliable, investments will be fair valued in good faith by the Committee, in accordance with procedures adopted by the Board. Factors used in determining fair value vary by investment type and may include market or investment specific events. The frequency with which these procedures are used cannot be predicted and they may be utilized to a significant extent. The Committee oversees the Fund's valuation policies and procedures and reports to the Board on the Committee's activities and fair value determinations. The Board monitors the appropriateness of the procedures used in valuing the Fund's investments and ratifies the fair value determinations of the Committee.
The Fund categorizes the inputs to valuation techniques used to value its investments into a disclosure hierarchy consisting of three levels as shown below:
Level 1 - quoted prices in active markets for identical investments
Level 2 - other significant observable inputs (including quoted prices for similar investments, interest rates, prepayment speeds, etc.)
Level 3 - unobservable inputs (including the Fund's own assumptions based on the best information available)
Valuation techniques used to value the Fund's investments by major category are as follows:
Equity securities, including restricted securities, for which market quotations are readily available, are valued at the last reported sale price or official closing price as reported by a third party pricing vendor on the primary market or exchange on which they are traded and are categorized as Level 1 in the hierarchy. In the event there were no sales during the day or closing prices are not available, securities are valued at the last quoted bid price or may be valued using the last available price and are generally categorized as Level 2 in the hierarchy. For foreign equity securities, when market or security specific events arise, comparisons to the valuation of American Depositary Receipts (ADRs), futures contracts, Exchange-Traded Funds (ETFs) and certain indexes as well as quoted prices for similar securities may be used and would be categorized as Level 2 in the hierarchy. Utilizing these techniques may result in transfers between Level 1 and Level 2. For equity securities, including restricted securities, where observable inputs are limited, assumptions about market activity and risk are used and these securities may be categorized as Level 3 in the hierarchy.
Investments in open-end mutual funds, including the Fidelity Central Funds, are valued at their closing net asset value (NAV) each business day and are categorized as Level 1 in the hierarchy.
Annual Report
3. Significant Accounting Policies - continued
Investment Valuation - continued
Changes in valuation techniques may result in transfers in or out of an assigned level within the disclosure hierarchy. The aggregate value of investments by input level as of October 31, 2015 is included at the end of the Fund's Schedule of Investments.
Foreign Currency. The Fund may use foreign currency contracts to facilitate transactions in foreign-denominated securities. Gains and losses from these transactions may arise from changes in the value of the foreign currency or if the counterparties do not perform under the contracts' terms.
Foreign-denominated assets, including investment securities, and liabilities are translated into U.S. dollars at the exchange rates at period end. Purchases and sales of investment securities, income and dividends received and expenses denominated in foreign currencies are translated into U.S. dollars at the exchange rate in effect on the transaction date.
The effects of exchange rate fluctuations on investments are included with the net realized and unrealized gain (loss) on investment securities. Other foreign currency transactions resulting in realized and unrealized gain (loss) are disclosed separately.
Investment Transactions and Income. For financial reporting purposes, the Fund's investment holdings and NAV include trades executed through the end of the last business day of the period. The NAV per share for processing shareholder transactions is calculated as of the close of business of the New York Stock Exchange (NYSE), normally 4:00 p.m. Eastern time and includes trades executed through the end of the prior business day. Gains and losses on securities sold are determined on the basis of identified cost. Dividend income is recorded on the ex-dividend date, except for certain dividends from foreign securities where the ex-dividend date may have passed, which are recorded as soon as the Fund is informed of the ex-dividend date. Non-cash dividends included in dividend income, if any, are recorded at the fair market value of the securities received. Income and capital gain distributions from Fidelity Central Funds, if any, are recorded on the ex-dividend date. Investment income is recorded net of foreign taxes withheld where recovery of such taxes is uncertain.
Expenses. Expenses directly attributable to a fund are charged to that fund. Expenses attributable to more than one fund are allocated among the respective funds on the basis of relative net assets or other appropriate methods. Expense estimates are accrued in the period to which they relate and adjustments are made when actual amounts are known.
Income Tax Information and Distributions to Shareholders. Each year, the Fund intends to qualify as a regulated investment company under Subchapter M of the Internal Revenue Code, including distributing substantially all of its taxable income and realized gains. As a result, no provision for U.S. Federal income taxes is required. As of October 31, 2015, the Fund did not have any unrecognized tax benefits in the financial statements; nor is the Fund aware of any tax positions for which it is reasonably possible that the total amounts of unrecognized tax benefits will significantly change in the next twelve months. The Fund files a U.S. federal tax return, in addition to state and local tax returns as required. The Fund's federal income tax returns are subject to examination by the Internal Revenue Service (IRS) for a period of three fiscal years after they are filed. State and local tax returns may be subject to examination for an additional fiscal year depending on the jurisdiction. Foreign taxes are provided for based on the Fund's understanding of the tax rules and rates that exist in the foreign markets in which it invests.
Distributions are declared and recorded on the ex-dividend date. Income and capital gain distributions are determined in accordance with income tax regulations, which may differ from GAAP. In addition, the Fund claimed a portion of the payment made to redeeming shareholders as a distribution for income tax purposes.
Capital accounts within the financial statements are adjusted for permanent book-tax differences. These adjustments have no impact on net assets or the results of operations. Capital accounts are not adjusted for temporary book-tax differences which will reverse in a subsequent period.
Book-tax differences are primarily due to foreign currency transactions, passive foreign investment companies (PFIC), deferred trustees compensation and capital losses carryforwards.
The federal tax cost of investment securities and unrealized appreciation (depreciation) as of period end were as follows:
Gross unrealized appreciation | $ 60,631,113 |
Gross unrealized depreciation | (17,665,194) |
Net unrealized appreciation (depreciation) on securities | $ 42,965,919 |
Tax Cost | $ 465,771,028 |
The tax-based components of distributable earnings as of period end were as follows:
Undistributed ordinary income | $ 7,269,366 |
Capital loss carryforward | $ (13,781,708) |
Net unrealized appreciation (depreciation) on securities and other investments | $ 42,948,727 |
Annual Report
Notes to Financial Statements - continued
3. Significant Accounting Policies - continued
Income Tax Information and Distributions to Shareholders - continued
Capital loss carryforwards are only available to offset future capital gains of the Fund to the extent provided by regulations and may be limited. Under the Regulated Investment Company Modernization Act of 2010 (the Act), the Fund is permitted to carry forward capital losses incurred in taxable years beginning after December 22, 2010 for an unlimited period and such capital losses are required to be used prior to any losses that expire. The capital loss carryforward information presented below, including any applicable limitation, is estimated as of fiscal period end and is subject to adjustment.
No expiration | |
Short-term | $ (8,159,164) |
Long-term | (5,622,544) |
Total capital loss carryforward | $ (13,781,708) |
The tax character of distributions paid was as follows:
| October 31, 2015 | October 31, 2014 |
Ordinary Income | $ 991,819 | $ 15,378,474 |
Long-term Capital Gains | 5,888,929 | - |
Total | $ 6,880,748 | $ 15,378,474 |
Short-Term Trading (Redemption) Fees. Shares held by investors in the Fund less than 90 days may have been subject to a redemption fee equal to 1.50% of the NAV of shares redeemed. All redemption fees, which reduce the proceeds of the shareholder redemption, are retained by the Fund and accounted for as an addition to paid in capital.
4. Purchases and Sales of Investments.
Purchases and sales of securities, other than short-term securities, aggregated $227,597,178 and $176,047,292, respectively.
5. Fees and Other Transactions with Affiliates.
Management Fee. Fidelity Management & Research Company (the investment adviser) and its affiliates provide the Fund with investment management related services for which the Fund pays a monthly management fee. The management fee is the sum of an individual fund fee rate that is based on an annual rate of .45% of the Fund's average net assets and an annualized group fee rate that averaged .25% during the period. The group fee rate is based upon the average net assets of all the mutual funds advised by the investment adviser, including any mutual funds previously advised by the investment adviser that are currently advised by Fidelity SelectCo, LLC, an affiliate of the investment adviser. The group fee rate decreases as assets under management increase and increases as assets under management decrease. For the reporting period, the total annual management fee rate was .70% of the Fund's average net assets.
Transfer Agent Fees. Fidelity Investments Institutional Operations Company, Inc. (FIIOC), an affiliate of the investment adviser, is the Fund's transfer, dividend disbursing and shareholder servicing agent. FIIOC receives account fees and asset-based fees that vary according to account size and type of account. FIIOC pays for typesetting, printing and mailing of shareholder reports, except proxy statements. For the period, the transfer agent fees were equivalent to an annual rate of .19% of average net assets.
Accounting and Security Lending Fees. Fidelity Service Company, Inc. (FSC), an affiliate of the investment adviser, maintains the Fund's accounting records. The accounting fee is based on the level of average net assets for each month. Under a separate contract, FSC administers the security lending program. The security lending fee is based on the number and duration of lending transactions.
6. Committed Line of Credit.
The Fund participates with other funds managed by the investment adviser or an affiliate in a $4.25 billion credit facility (the "line of credit") to be utilized for temporary or emergency purposes to fund shareholder redemptions or for other short-term liquidity purposes. The Fund has agreed to pay commitment fees on its pro-rata portion of the line of credit, which amounted to $620 and is reflected in Miscellaneous expenses on the Statement of Operations. During the period, the Fund did not borrow on this line of credit.
7. Security Lending.
The Fund lends portfolio securities through a lending agent from time to time in order to earn additional income. For equity securities, a lending agent is used and may loan securities to certain qualified borrowers, including Fidelity Capital Markets (FCM), a broker-dealer affiliated with the Fund. On the settlement date of the loan, the Fund receives collateral (in the form of U.S. Treasury obligations, letters of credit and/or cash) against the loaned
Annual Report
7. Security Lending - continued
securities and maintains collateral in an amount not less than 100% of the market value of the loaned securities during the period of the loan. The market value of the loaned securities is determined at the close of business of the Fund and any additional required collateral is delivered to the Fund on the next business day. The Fund or borrower may terminate the loan at any time, and if the borrower defaults on its obligation to return the securities loaned because of insolvency or other reasons, the Fund may apply collateral received from the borrower against the obligation. The Fund may experience delays and costs in recovering the securities loaned. Any cash collateral received is invested in the Fidelity Securities Lending Cash Central Fund. The value of loaned securities and cash collateral at period end are disclosed on the Fund's Statement of Assets and Liabilities. Security lending income represents the income earned on investing cash collateral, less rebates paid to borrowers and any lending agent fees associated with the loan, plus any premium payments received for lending certain types of securities. Security lending income is presented in the Statement of Operations as a component of income from Fidelity Central Funds. Total security lending income during the period amounted to $46,909. During the period, there were no securities loaned to FCM.
8. Expense Reductions.
Commissions paid to certain brokers with whom the investment adviser, or its affiliates, places trades on behalf of the Fund include an amount in addition to trade execution, which may be rebated back to the Fund to offset certain expenses. This amount totaled $25,893 for the period.
In addition, during the period the investment adviser reimbursed and/or waived a portion of operating expenses in the amount of $13,910.
9. Other.
The Fund's organizational documents provide former and current trustees and officers with a limited indemnification against liabilities arising in connection with the performance of their duties to the Fund. In the normal course of business, the Fund may also enter into contracts that provide general indemnifications. The Fund's maximum exposure under these arrangements is unknown as this would be dependent on future claims that may be made against the Fund. The risk of material loss from such claims is considered remote.
At the end of the period, Strategic Advisers International Fund was the owner of record of approximately 16% of the total outstanding shares of the Fund. Mutual funds managed by the investment adviser or its affiliates were the owners of record, in the aggregate, of approximately 40% of the total outstanding shares of the Fund.
Annual Report
Fidelity Latin America Fund
Average annual total return reflects the change in the value of an investment, assuming reinvestment of the class' distributions from dividend income and capital gains (the profits earned upon the sale of securities that have grown in value, if any) and assuming a constant rate of performance each year. The $10,000 table and the fund's returns do not reflect the deduction of taxes that a shareholder would pay on fund distributions or the redemption of fund shares. During periods of reimbursement by Fidelity, a fund's total return will be greater than it would be had the reimbursement not occurred. How a fund did yesterday is no guarantee of how it will do tomorrow.
Average Annual Total Returns
Periods ended October 31, 2015 | Past 1
year | Past 5
years | Past 10
years |
Fidelity Latin America Fund | -34.45% | -13.72% | 0.80% |
$10,000 Over 10 Years
Let's say hypothetically that $10,000 was invested in Fidelity Latin America Fund, a class of the fund, on October 31, 2005. The chart shows how the value of your investment would have changed, and also shows how the MSCI EM (Emerging Markets) Latin America Index performed over the same period.
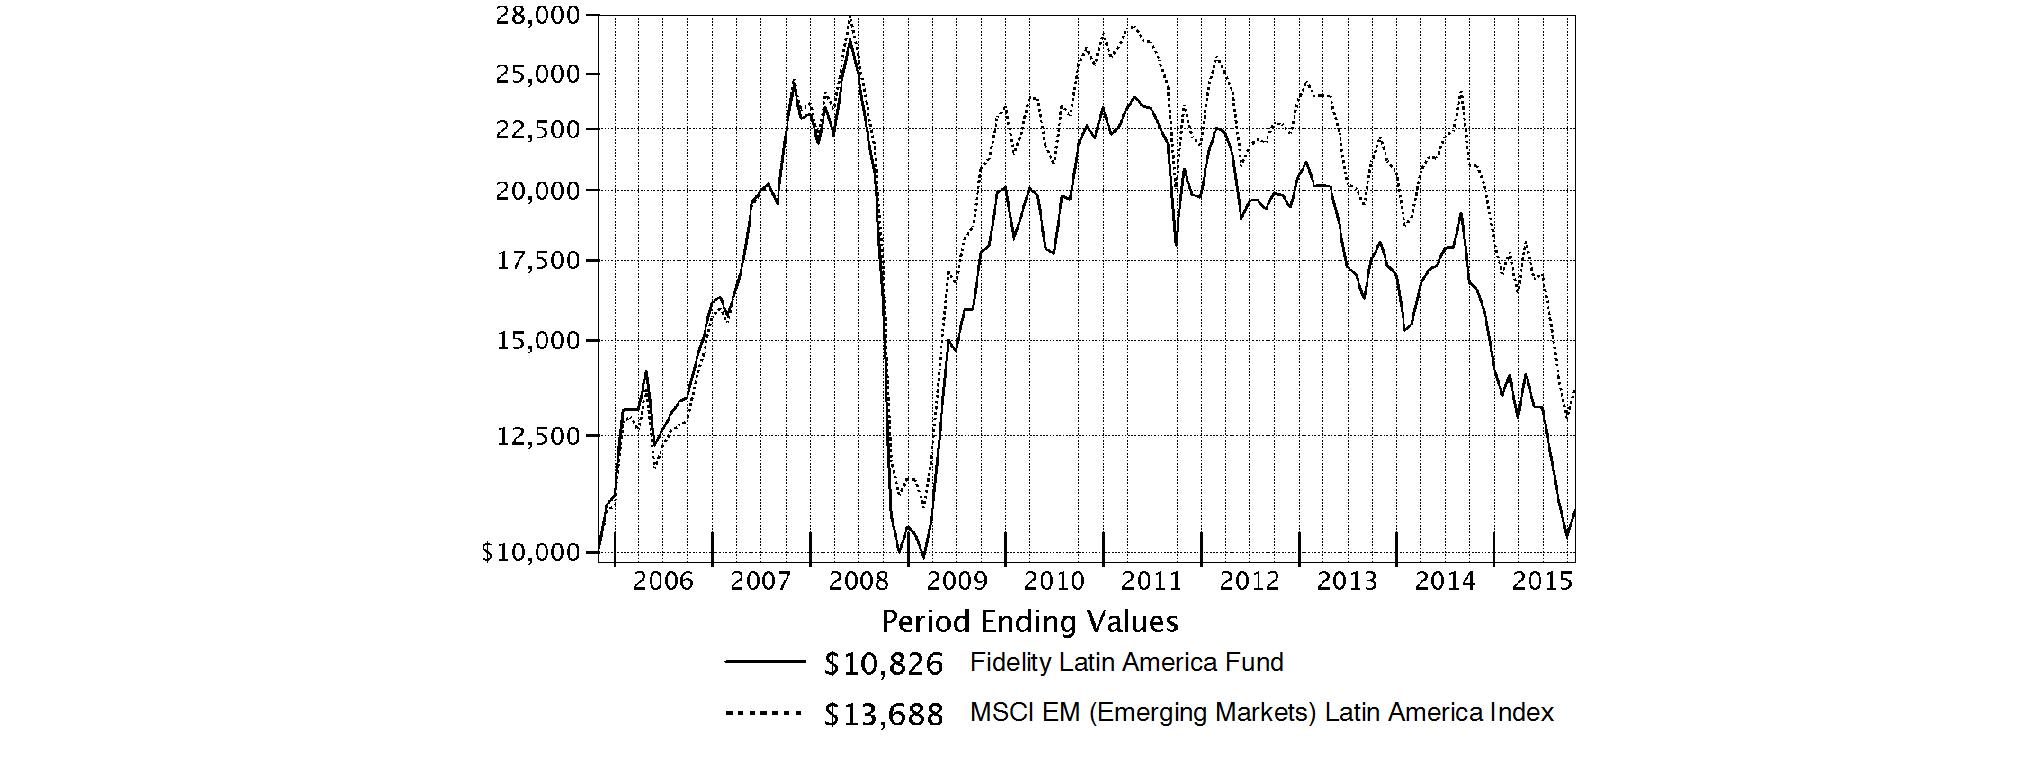
Annual Report
Fidelity Latin America Fund
Market Recap: International equities suffered a moderate setback for the 12 months ending October 31, 2015, held back by a collapse in commodities prices that hurt resources-related sectors and geographies. The MSCI ACWI (All Country World Index) ex USA Index returned -4.55% for the period, affected also by concerns about global economic growth. Commodity producers remained under pressure for much of the past year, largely related to economic deceleration in China (-1%), the world's second-largest economy and a leading consumer of raw materials. This effect was exacerbated by U.S. dollar strength relative to global currencies, which weighed on commodities priced in dollars and acutely impacted equity returns within regions most exposed to resources prices. The emerging-markets group, for example, returned about -15% this period. Canada, a significant energy producer, returned roughly -17%. Net energy consumer Japan (+9%) was the best-performing region by far. Only about a quarter of the nearly 50 index countries managed a gain this period: Ireland (+19%) - the EU's fastest-growing economy - and Israel (+17%) proved top performers; Greece (-56%) and Brazil (-46%), among the worst. As for sectors, energy (-25%) and materials (-16%) declined sharply, whereas the two consumer sectors each gained about 6%.
Comments from Lead Portfolio Manager Adam Kutas: For the year, the fund's share classes (excluding sales charges, if applicable) posted double-digit negative results, roughly in line with the -34.64% return of the benchmark MSCI EM (Emerging Markets) Latin America Index. Lower commodity prices weighed heavily on the region's oil-rich countries, including Mexico, Columbia and Brazil. The fund's top individual contributor versus the benchmark was Chile-based beverage producer Compania Cervecerias Unidas. A sizable stake in one of the fastest-growing convenience store chains, Fomento Economico Mexicano, was another notable contributor. I viewed it as a good defensive company that could grow even in a tough economic environment, which was exactly what happened. On the downside, the biggest detractor was Companhia Brasileira de Distri (CBD), a Brazilian company with exposure to supermarkets and a stake in a consumer technology retail chain. Avoiding Grupo Financiero Banorte, one of Mexico's largest banks and a benchmark component, also proved detrimental.
Note to shareholders: Will Pruett was named Co-Portfolio Manager of the fund, effective October 1, 2015, joining Lead Portfolio Manager Adam Kutas.
The views expressed above reflect those of the portfolio manager(s) only through the end of the period as stated on the cover of this report and do not necessarily represent the views of Fidelity or any other person in the Fidelity organization. Any such views are subject to change at any time based upon market or other conditions and Fidelity disclaims any responsibility to update such views. These views may not be relied on as investment advice and, because investment decisions for a Fidelity fund are based on numerous factors, may not be relied on as an indication of trading intent on behalf of any Fidelity fund.
Annual Report
Fidelity Latin America Fund
As a shareholder of the Fund, you incur two types of costs: (1) transaction costs, including sales charges (loads) on purchase payments or redemption proceeds, redemption fees and (2) ongoing costs, including management fees, distribution and/or service (12b-1) fees and other Fund expenses. This Example is intended to help you understand your ongoing costs (in dollars) of investing in the Fund and to compare these costs with the ongoing costs of investing in other mutual funds.
The Example is based on an investment of $1,000 invested at the beginning of the period and held for the entire period (May 1, 2015 to October 31, 2015).
Actual Expenses
The first line of the accompanying table for each class of the Fund provides information about actual account values and actual expenses. You may use the information in this line, together with the amount you invested, to estimate the expenses that you paid over the period. Simply divide your account value by $1,000.00 (for example, an $8,600 account value divided by $1,000.00 = 8.6), then multiply the result by the number in the first line for a class of the Fund under the heading entitled "Expenses Paid During Period" to estimate the expenses you paid on your account during this period. A small balance maintenance fee of $12.00 that is charged once a year may apply for certain accounts with a value of less than $2,000. This fee is not included in the table below. If it was, the estimate of expenses you paid during the period would be higher, and your ending account value lower, by this amount. In addition, the Fund, as a shareholder in the underlying Fidelity Central Funds, will indirectly bear its pro-rata share of the fees and expenses incurred by the underlying Fidelity Central Funds. These fees and expenses are not included in the Fund's annualized expense ratio used to calculate the expense estimate in the table below.
Hypothetical Example for Comparison Purposes
The second line of the accompanying table for each class of the Fund provides information about hypothetical account values and hypothetical expenses based on a Class' actual expense ratio and an assumed rate of return of 5% per year before expenses, which is not the Class' actual return. The hypothetical account values and expenses may not be used to estimate the actual ending account balance or expenses you paid for the period. You may use this information to compare the ongoing costs of investing in the Fund and other funds. To do so, compare this 5% hypothetical example with the 5% hypothetical examples that appear in the shareholder reports of the other funds. A small balance maintenance fee of $12.00 that is charged once a year may apply for certain accounts with a value of less than $2,000. This fee is not included in the table below. If it was, the estimate of expenses you paid during the period would be higher, and your ending account value lower, by this amount. In addition, the Fund, as a shareholder in the underlying Fidelity Central Funds, will indirectly bear its pro-rata share of the fees and expenses incurred by the underlying Fidelity Central Funds. These fees and expenses are not included in the Fund's annualized expense ratio used to calculate the expense estimate in the table below.
Please note that the expenses shown in the table are meant to highlight your ongoing costs only and do not reflect any transaction costs. Therefore, the second line of the table is useful in comparing ongoing costs only, and will not help you determine the relative total costs of owning different funds. In addition, if these transactional costs were included, your costs would have been higher.
| Annualized
Expense Ratio B | Beginning
Account Value
May 1, 2015 | Ending
Account Value
October 31, 2015 | Expenses Paid
During Period C
May 1, 2015
to October 31, 2015 |
Class A | 1.40% | | | |
Actual | | $ 1,000.00 | $ 768.50 | $ 6.24 |
HypotheticalA | | $ 1,000.00 | $ 1,018.15 | $ 7.12 |
Class T | 1.67% | | | |
Actual | | $ 1,000.00 | $ 767.40 | $ 7.44 |
HypotheticalA | | $ 1,000.00 | $ 1,016.79 | $ 8.49 |
Class B | 2.14% | | | |
Actual | | $ 1,000.00 | $ 765.40 | $ 9.52 |
HypotheticalA | | $ 1,000.00 | $ 1,014.42 | $ 10.87 |
Class C | 2.15% | | | |
Actual | | $ 1,000.00 | $ 765.50 | $ 9.57 |
HypotheticalA | | $ 1,000.00 | $ 1,014.37 | $ 10.92 |
Latin America | 1.13% | | | |
Actual | | $ 1,000.00 | $ 769.00 | $ 5.04 |
HypotheticalA | | $ 1,000.00 | $ 1,019.51 | $ 5.75 |
Class I | 1.07% | | | |
Actual | | $ 1,000.00 | $ 769.40 | $ 4.77 |
HypotheticalA | | $ 1,000.00 | $ 1,019.81 | $ 5.45 |
A 5% return per year before expenses
B Annualized expense ratio reflects expenses net of applicable fee waivers.
C Expenses are equal to each Class' annualized expense ratio, multiplied by the average account value over the period, multiplied by 184/365 (to reflect the one-half year period).
Annual Report
Fidelity Latin America Fund
Investment Changes (Unaudited)
Asset Allocation as of October 31, 2015 |
| % of fund's
net assets | % of fund's net assets
6 months ago |
Stocks | 97.2 | 99.1 |
Short-Term Investments and Net Other Assets (Liabilities) | 2.8 | 0.9 |
Top Ten Stocks as of October 31, 2015 |
| % of fund's
net assets | % of fund's net assets
6 months ago |
America Movil S.A.B. de CV Series L (Mexico, Wireless Telecommunication Services) | 6.4 | 6.6 |
Ambev SA sponsored ADR (Brazil, Beverages) | 6.1 | 6.1 |
Fomento Economico Mexicano S.A.B. de CV (Mexico, Beverages) | 5.5 | 4.1 |
Itau Unibanco Holding SA (Brazil, Banks) | 4.7 | 6.5 |
Wal-Mart de Mexico SA de CV Series V (Mexico, Food & Staples Retailing) | 4.4 | 2.7 |
Grupo Financiero Inbursa S.A.B. de CV Series O (Mexico, Banks) | 2.8 | 2.3 |
Grupo de Inversiones Suramerica SA (Colombia, Diversified Financial Services) | 2.3 | 2.5 |
Banco Bradesco SA (PN) (Brazil, Banks) | 2.0 | 3.1 |
Grupo Televisa SA de CV (Mexico, Media) | 1.9 | 1.6 |
Petroleo Brasileiro SA - Petrobras (PN) (non-vtg.) (Brazil, Oil, Gas & Consumable Fuels) | 1.8 | 3.3 |
| 37.9 | |
Market Sectors as of October 31, 2015 |
| % of fund's
net assets | % of fund's net assets
6 months ago |
Consumer Staples | 28.0 | 23.8 |
Financials | 26.9 | 30.3 |
Telecommunication Services | 8.5 | 9.9 |
Consumer Discretionary | 8.1 | 7.7 |
Materials | 7.8 | 7.4 |
Industrials | 5.8 | 6.7 |
Energy | 5.0 | 7.3 |
Utilities | 4.6 | 3.4 |
Health Care | 1.4 | 0.7 |
Information Technology | 1.1 | 1.9 |
Market Sectors may include more than one industry category. |
The fund may invest up to 35% of its total assets in any industry that represents more than 20% of the Latin American market. As of October 31, 2015, the fund did not have more than 25% of its total assets invested in any one industry. |
Annual Report
Fidelity Latin America Fund
Investments October 31, 2015
Showing Percentage of Net Assets
Common Stocks - 77.6% |
| Shares | | Value |
Belgium - 0.9% |
Euronav NV | 226,900 | | $ 3,352,175 |
Euronav NV | 80,600 | | 1,205,776 |
TOTAL BELGIUM | | 4,557,951 |
Brazil - 20.5% |
Banco Bradesco SA | 185,580 | | 1,127,950 |
BB Seguridade Participacoes SA | 772,600 | | 5,328,898 |
BM&F BOVESPA SA | 2,767,900 | | 8,181,940 |
Brasil Brokers Participacoes SA | 2,701,800 | | 1,050,862 |
Brasil Foods SA | 156,300 | | 2,435,760 |
CCR SA | 2,052,300 | | 6,449,774 |
Cielo SA | 577,440 | | 5,481,604 |
Companhia de Saneamento Basico do Estado de Sao Paulo (SABESP) | 1,700,000 | | 7,379,134 |
Cyrela Brazil Realty SA | 287,300 | | 667,490 |
Equatorial Energia SA | 566,900 | | 5,055,215 |
Fibria Celulose SA | 578,700 | | 7,898,969 |
FPC Par Corretora de Seguros | 1,272,700 | | 3,560,808 |
Hypermarcas SA (a) | 1,021,400 | | 4,634,842 |
Industrias Romi SA | 3,235,900 | | 1,485,147 |
Itausa-Investimentos Itau SA | 7 | | 14 |
M. Dias Branco SA | 515,600 | | 9,345,254 |
MAHLE Metal Leve SA | 424,300 | | 2,575,583 |
Multiplus SA | 778,100 | | 6,928,460 |
Ouro Fino Saude Animal LTDA | 176,200 | | 1,576,253 |
Petroleo Brasileiro SA - Petrobras (ON) (a) | 3,237,328 | | 7,873,912 |
Porto Seguro SA | 365,400 | | 3,063,199 |
QGEP Participacoes SA (a) | 2,477,700 | | 3,829,094 |
TIM Participacoes SA | 1,707,595 | | 3,741,473 |
Vale SA | 1,064,100 | | 4,707,198 |
TOTAL BRAZIL | | 104,378,833 |
Canada - 0.3% |
Tahoe Resources, Inc. | 209,434 | | 1,749,021 |
Chile - 11.7% |
Aguas Andinas SA | 9,955,798 | | 5,208,025 |
Banco de Chile | 76,030,132 | | 8,037,832 |
Banmedica SA | 1,523,867 | | 2,490,015 |
Colbun SA | 21,984,938 | | 5,849,510 |
Compania Cervecerias Unidas SA | 782,126 | | 9,357,351 |
CorpBanca SA | 630,371,201 | | 5,783,682 |
Empresa Nacional de Telecomunicaciones SA (ENTEL) | 297,791 | | 2,755,886 |
Forus SA | 705,249 | | 2,039,618 |
Inversiones La Construccion SA | 753,300 | | 8,561,836 |
S.A.C.I. Falabella | 576,071 | | 3,873,516 |
Sociedad Matriz SAAM SA | 60,278,930 | | 3,928,525 |
Vina San Pedro SA | 238,206,744 | | 1,877,960 |
TOTAL CHILE | | 59,763,756 |
|
| Shares | | Value |
Colombia - 5.3% |
Bolsa de Valores de Colombia | 334,500,111 | | $ 1,905,161 |
Cemex Latam Holdings SA (a) | 852,530 | | 2,966,345 |
Empresa de Telecomunicaciones de Bogota | 22,051,614 | | 4,529,068 |
Grupo de Inversiones Suramerica SA | 953,406 | | 12,104,340 |
Inversiones Argos SA | 924,188 | | 5,678,476 |
TOTAL COLOMBIA | | 27,183,390 |
Mexico - 33.2% |
America Movil S.A.B. de CV: | | | |
Series L | 7,165,300 | | 6,398,441 |
Series L sponsored ADR (d) | 1,476,073 | | 26,288,860 |
Banregio Grupo Financiero S.A.B. de CV | 339,814 | | 1,833,224 |
Consorcio ARA S.A.B. de CV (a) | 20,756,305 | | 7,778,368 |
Controladora Commercial Mexicana S.A.B. de CV unit | 1,308,500 | | 3,832,546 |
Fomento Economico Mexicano S.A.B. de CV: | | | |
unit | 95,200 | | 940,427 |
sponsored ADR | 275,305 | | 27,279,972 |
Gruma S.A.B. de CV Series B | 358,009 | | 5,524,737 |
Grupo Aeroportuario del Pacifico SA de CV: | | | |
Series B | 43,100 | | 388,187 |
sponsored ADR | 33,400 | | 3,041,738 |
Grupo Aeroportuario del Sureste SA de CV Series B | 254,820 | | 3,946,534 |
Grupo Carso SA de CV Series A1 | 1,414,100 | | 6,304,370 |
Grupo Financiero Inbursa S.A.B. de CV Series O | 7,110,519 | | 14,296,113 |
Grupo Financiero Santander Mexico S.A.B. de CV | 2,505,855 | | 4,604,287 |
Grupo Televisa SA de CV | 199,400 | | 1,160,223 |
Grupo Televisa SA de CV (CPO) sponsored ADR | 293,300 | | 8,546,762 |
Industrias Penoles SA de CV | 277,923 | | 3,694,916 |
Kimberly-Clark de Mexico SA de CV Series A | 2,382,100 | | 5,748,375 |
Medica Sur SA de CV | 1,038,334 | | 3,143,076 |
Megacable Holdings S.A.B. de CV unit | 1,954,829 | | 7,449,932 |
Qualitas Controladora S.A.B. de CV (a) | 2,877,400 | | 3,585,035 |
Unifin Financiera SAPI de CV (a) | 308,300 | | 935,849 |
Wal-Mart de Mexico SA de CV Series V | 8,591,848 | | 22,668,439 |
TOTAL MEXICO | | 169,390,411 |
Panama - 1.6% |
Banco Latinoamericano de Comercio Exterior SA Series E | 303,070 | | 8,191,982 |
Peru - 3.0% |
Alicorp SA Class C (a) | 4,973,812 | | 8,451,240 |
Compania de Minas Buenaventura SA sponsored ADR | 1,073,736 | | 6,882,648 |
TOTAL PERU | | 15,333,888 |
Common Stocks - continued |
| Shares | | Value |
Spain - 0.7% |
Prosegur Compania de Seguridad SA (Reg.) | 789,254 | | $ 3,515,008 |
United States of America - 0.4% |
First Cash Financial Services, Inc. (a) | 52,766 | | 2,013,023 |
TOTAL COMMON STOCKS (Cost $443,903,418) |
396,077,263
|
Nonconvertible Preferred Stocks - 19.6% |
| | | |
Brazil - 18.5% |
Ambev SA sponsored ADR | 6,385,447 | | 31,097,125 |
Banco Bradesco SA (PN) | 1,909,460 | | 10,397,547 |
Companhia Brasileira de Distribuicao Grupo Pao de Acucar (PN) | 413,125 | | 5,435,418 |
Companhia de Saneamento Basico do Estado de Sao Paulo (SABESP) sponsored ADR | 62,800 | | 275,692 |
Itau Unibanco Holding SA | 3,462,695 | | 23,766,718 |
Itausa-Investimentos Itau SA (PN) | 4,034,325 | | 7,531,898 |
Petroleo Brasileiro SA - Petrobras (PN) (non-vtg.) (a) | 4,687,871 | | 9,371,974 |
Vale SA (PN-A) | 1,859,800 | | 6,765,890 |
TOTAL BRAZIL | | 94,642,262 |
Chile - 0.8% |
Embotelladora Andina SA Class A | 1,355,910 | | 3,980,186 |
Colombia - 0.3% |
Grupo de Inversiones Suramerica SA | 105,961 | | 1,329,907 |
TOTAL NONCONVERTIBLE PREFERRED STOCKS (Cost $90,870,783) |
99,952,355
|
Money Market Funds - 3.2% |
| Shares | | Value |
Fidelity Cash Central Fund, 0.18% (b) | 14,023,624 | | $ 14,023,624 |
Fidelity Securities Lending Cash Central Fund, 0.19% (b)(c) | 2,529,375 | | 2,529,375 |
TOTAL MONEY MARKET FUNDS (Cost $16,552,999) |
16,552,999
|
TOTAL INVESTMENT
PORTFOLIO - 100.4% (Cost $551,327,200) | | 512,582,617 |
NET OTHER ASSETS (LIABILITIES) - (0.4)% | | (2,020,347) |
NET ASSETS - 100% | $ 510,562,270 |
Legend |
(a) Non-income producing |
(b) Affiliated fund that is generally available only to investment companies and other accounts managed by Fidelity Investments. The rate quoted is the annualized seven-day yield of the fund at period end. A complete unaudited listing of the fund's holdings as of its most recent quarter end is available upon request. In addition, each Fidelity Central Fund's financial statements, which are not covered by the Fund's Report of Independent Registered Public Accounting Firm, are available on the SEC's website or upon request. |
(c) Investment made with cash collateral received from securities on loan. |
(d) Security or a portion of the security is on loan at period end. |
Affiliated Central Funds |
Information regarding fiscal year to date income earned by the Fund from investments in Fidelity Central Funds is as follows: |
Fund | Income earned |
Fidelity Cash Central Fund | $ 15,272 |
Fidelity Securities Lending Cash Central Fund | 36,119 |
Total | $ 51,391 |
Other Information |
Categorizations in the Schedule of Investments are based on country or territory of incorporation. |
All investments are categorized as Level 1 under the Fair Value Hierarchy. The inputs or methodology used for valuing securities may not be an indication of the risk associated with investing in those securities. For more information on valuation inputs, please refer to the Investment Valuation section in the accompanying Notes to Financial Statements. |
See accompanying notes which are an integral part of the financial statements.
Annual Report
Fidelity Latin America Fund
Statement of Assets and Liabilities
| | October 31, 2015 |
| | |
Assets | | |
Investment in securities, at value (including securities loaned of $2,537,925) - See accompanying schedule: Unaffiliated issuers (cost $534,774,201) | $ 496,029,618 | |
Fidelity Central Funds (cost $16,552,999) | 16,552,999 | |
Total Investments (cost $551,327,200) | | $ 512,582,617 |
Foreign currency held at value (cost $517,954) | | 518,167 |
Receivable for investments sold | | 793,751 |
Receivable for fund shares sold | | 321,934 |
Dividends receivable | | 393,206 |
Distributions receivable from Fidelity Central Funds | | 3,558 |
Prepaid expenses | | 1,769 |
Other receivables | | 2,262 |
Total assets | | 514,617,264 |
| | |
Liabilities | | |
Payable for investments purchased | $ 110,516 | |
Payable for fund shares redeemed | 837,033 | |
Accrued management fee | 301,708 | |
Distribution and service plan fees payable | 10,860 | |
Other affiliated payables | 148,116 | |
Other payables and accrued expenses | 117,386 | |
Collateral on securities loaned, at value | 2,529,375 | |
Total liabilities | | 4,054,994 |
| | |
Net Assets | | $ 510,562,270 |
Net Assets consist of: | | |
Paid in capital | | $ 630,184,258 |
Undistributed net investment income | | 7,012,875 |
Accumulated undistributed net realized gain (loss) on investments and foreign currency transactions | | (87,850,607) |
Net unrealized appreciation (depreciation) on investments and assets and liabilities in foreign currencies | | (38,784,256) |
Net Assets | | $ 510,562,270 |
Statement of Assets and Liabilities - continued
| | October 31, 2015 |
| | |
Calculation of Maximum Offering Price | |
Class A:
Net Asset Value and redemption price per share ($16,424,313 ÷ 908,008 shares) | | $ 18.09 |
| | |
Maximum offering price per share (100/94.25 of $18.09) | | $ 19.19 |
Class T:
Net Asset Value and redemption price per share ($5,283,521 ÷ 291,781 shares) | | $ 18.11 |
| | |
Maximum offering price per share (100/96.50 of $18.11) | | $ 18.77 |
Class B:
Net Asset Value and offering price per share ($627,760 ÷ 34,367 shares)A | | $ 18.27 |
| | |
Class C:
Net Asset Value and offering price per share ($5,393,798 ÷ 296,770 shares)A | | $ 18.18 |
| | |
Latin America:
Net Asset Value, offering price and redemption price per share ($481,004,802 ÷ 26,598,317 shares) | | $ 18.08 |
| | |
Class I:
Net Asset Value, offering price and redemption price per share ($1,828,076 ÷ 101,089 shares) | | $ 18.08 |
A Redemption price per share is equal to net asset value less any applicable contingent deferred sales charge.
See accompanying notes which are an integral part of the financial statements.
Annual Report
Fidelity Latin America Fund
Financial Statements - continued
Statement of Operations
| Year ended October 31, 2015 |
| | |
Investment Income | | |
Dividends | | $ 19,692,387 |
Interest | | 12,841 |
Income from Fidelity Central Funds | | 51,391 |
Income before foreign taxes withheld | | 19,756,619 |
Less foreign taxes withheld | | (1,513,669) |
Total income | | 18,242,950 |
Expenses | | |
Management fee | $ 4,826,856 | |
Transfer agent fees | 1,963,217 | |
Distribution and service plan fees | 183,965 | |
Accounting and security lending fees | 339,670 | |
Custodian fees and expenses | 490,458 | |
Independent trustees' compensation | 2,918 | |
Registration fees | 81,216 | |
Audit | 72,583 | |
Legal | 2,191 | |
Interest | 444 | |
Miscellaneous | 4,345 | |
Total expenses before reductions | 7,967,863 | |
Expense reductions | (66,025) | 7,901,838 |
Net investment income (loss) | | 10,341,112 |
Realized and Unrealized Gain (Loss) | | |
Net realized gain (loss) on: | | |
Investment securities: | | |
Unaffiliated issuers | (86,779,565) | |
Foreign currency transactions | (639,828) | |
Total net realized gain (loss) | | (87,419,393) |
Change in net unrealized appreciation (depreciation) on: Investment securities (net of decrease in deferred foreign taxes of $64,167) | (231,007,007) | |
Assets and liabilities in foreign currencies | (35,988) | |
Total change in net unrealized appreciation (depreciation) | | (231,042,995) |
Net gain (loss) | | (318,462,388) |
Net increase (decrease) in net assets resulting from operations | | $ (308,121,276) |
Statement of Changes in Net Assets
| Year ended
October 31,
2015 | Year ended
October 31,
2014 |
Increase (Decrease) in Net Assets | | |
Operations | | |
Net investment income (loss) | $ 10,341,112 | $ 20,578,749 |
Net realized gain (loss) | (87,419,393) | 80,758,455 |
Change in net unrealized appreciation (depreciation) | (231,042,995) | (221,687,609) |
Net increase (decrease) in net assets resulting from operations | (308,121,276) | (120,350,405) |
Distributions to shareholders from net investment income | (12,592,762) | (23,599,176) |
Distributions to shareholders from net realized gain | (66,395,306) | (209,492,273) |
Total distributions | (78,988,068) | (233,091,449) |
Share transactions - net increase (decrease) | (98,503,600) | (61,704,730) |
Redemption fees | 127,133 | 197,877 |
Total increase (decrease) in net assets | (485,485,811) | (414,948,707) |
| | |
Net Assets | | |
Beginning of period | 996,048,081 | 1,410,996,788 |
End of period (including undistributed net investment income of $7,012,875 and undistributed net investment income of $11,771,382, respectively) | $ 510,562,270 | $ 996,048,081 |
See accompanying notes which are an integral part of the financial statements.
Annual Report
Financial Highlights - Fidelity Latin America Fund Class A
Years ended October 31, | 2015 | 2014 | 2013 | 2012 | 2011 |
Selected Per-Share Data | | | | | |
Net asset value, beginning of period | $ 30.31 | $ 40.71 | $ 48.95 | $ 52.38 | $ 57.48 |
Income from Investment Operations | | | | | |
Net investment income (loss) C | .28 | .49 | .72 | .92 | 1.15 |
Net realized and unrealized gain (loss) | (10.11) | (4.08) | (4.73) | (3.66) | (5.87) |
Total from investment operations | (9.83) | (3.59) | (4.01) | (2.74) | (4.72) |
Distributions from net investment income | (.31) | (.57) | (.79) | (.70) | (.19) |
Distributions from net realized gain | (2.08) | (6.25) | (3.45) | - | (.20) |
Total distributions | (2.39) | (6.82) | (4.24) | (.70) | (.39) |
Redemption fees added to paid in capitalC | -G | .01 | .01 | .01 | .01 |
Net asset value, end of period | $ 18.09 | $ 30.31 | $ 40.71 | $ 48.95 | $ 52.38 |
Total ReturnA, B | (34.60)% | (9.06)% | (8.93)% | (5.23)% | (8.26)% |
Ratios to Average Net AssetsD, F | | | | | |
Expenses before reductions | 1.40% | 1.38% | 1.37% | 1.35% | 1.34% |
Expenses net of fee waivers, if any | 1.40% | 1.38% | 1.37% | 1.35% | 1.34% |
Expenses net of all reductions | 1.39% | 1.38% | 1.35% | 1.35% | 1.34% |
Net investment income (loss) | 1.26% | 1.52% | 1.66% | 1.80% | 2.05% |
Supplemental Data | | | | | |
Net assets, end of period (000 omitted) | $ 16,424 | $ 34,898 | $ 48,464 | $ 69,654 | $ 91,407 |
Portfolio turnover rateE | 30% | 30% | 23% | 23% | 11% |
A Total returns would have been lower if certain expenses had not been reduced during the applicable periods shown. B Total returns do not include the effect of the sales charges. C Calculated based on average shares outstanding during the period. D Fees and expenses of any underlying Fidelity Central Funds are not included in the Fund's expense ratio. The Fund indirectly bears its proportionate share of the expenses of any underlying Fidelity Central Funds. E Amount does not include the portfolio activity of any underlying Fidelity Central Funds. F Expense ratios reflect operating expenses of the class. Expenses before reductions do not reflect amounts reimbursed by the investment adviser or reductions from brokerage service arrangements or reductions from other expense offset arrangements and do not represent the amount paid by the class during periods when reimbursements or reductions occur. Expenses net of fee waivers reflect expenses after reimbursement by the investment adviser but prior to reductions from brokerage service arrangements or other expense offset arrangements. Expenses net of all reductions represent the net expenses paid by the class. G Amount represents less than $.005 per share. |
Financial Highlights - Fidelity Latin America Fund Class T
Years ended October 31, | 2015 | 2014 | 2013 | 2012 | 2011 |
Selected Per-Share Data | | | | | |
Net asset value, beginning of period | $ 30.33 | $ 40.68 | $ 48.88 | $ 52.27 | $ 57.47 |
Income from Investment Operations | | | | | |
Net investment income (loss) C | .22 | .40 | .61 | .78 | .99 |
Net realized and unrealized gain (loss) | (10.13) | (4.08) | (4.74) | (3.65) | (5.85) |
Total from investment operations | (9.91) | (3.68) | (4.13) | (2.87) | (4.86) |
Distributions from net investment income | (.23) | (.43) | (.63) | (.53) | (.15) |
Distributions from net realized gain | (2.08) | (6.25) | (3.45) | - | (.20) |
Total distributions | (2.31) | (6.68) | (4.08) | (.53) | (.35) |
Redemption fees added to paid in capitalC | -G | .01 | .01 | .01 | .01 |
Net asset value, end of period | $ 18.11 | $ 30.33 | $ 40.68 | $ 48.88 | $ 52.27 |
Total ReturnA, B | (34.78)% | (9.30)% | (9.17)% | (5.49)% | (8.50)% |
Ratios to Average Net AssetsD, F | | | | | |
Expenses before reductions | 1.67% | 1.65% | 1.63% | 1.61% | 1.61% |
Expenses net of fee waivers, if any | 1.67% | 1.65% | 1.63% | 1.61% | 1.61% |
Expenses net of all reductions | 1.66% | 1.65% | 1.61% | 1.61% | 1.61% |
Net investment income (loss) | .99% | 1.25% | 1.40% | 1.54% | 1.78% |
Supplemental Data | | | | | |
Net assets, end of period (000 omitted) | $ 5,284 | $ 9,761 | $ 12,705 | $ 19,334 | $ 26,020 |
Portfolio turnover rateE | 30% | 30% | 23% | 23% | 11% |
A Total returns would have been lower if certain expenses had not been reduced during the applicable periods shown. B Total returns do not include the effect of the sales charges. C Calculated based on average shares outstanding during the period. D Fees and expenses of any underlying Fidelity Central Funds are not included in the Fund's expense ratio. The Fund indirectly bears its proportionate share of the expenses of any underlying Fidelity Central Funds. E Amount does not include the portfolio activity of any underlying Fidelity Central Funds. F Expense ratios reflect operating expenses of the class. Expenses before reductions do not reflect amounts reimbursed by the investment adviser or reductions from brokerage service arrangements or reductions from other expense offset arrangements and do not represent the amount paid by the class during periods when reimbursements or reductions occur. Expenses net of fee waivers reflect expenses after reimbursement by the investment adviser but prior to reductions from brokerage service arrangements or other expense offset arrangements. Expenses net of all reductions represent the net expenses paid by the class. G Amount represents less than $.005 per share. |
See accompanying notes which are an integral part of the financial statements.
Annual Report
Financial Highlights - Fidelity Latin America Fund Class B
Years ended October 31, | 2015 | 2014 | 2013 | 2012 | 2011 |
Selected Per-Share Data | | | | | |
Net asset value, beginning of period | $ 30.46 | $ 40.63 | $ 48.72 | $ 52.06 | $ 57.44 |
Income from Investment Operations | | | | | |
Net investment income (loss) C | .12 | .25 | .40 | .53 | .72 |
Net realized and unrealized gain (loss) | (10.23) | (4.08) | (4.74) | (3.63) | (5.84) |
Total from investment operations | (10.11) | (3.83) | (4.34) | (3.10) | (5.12) |
Distributions from net investment income | - | (.10) | (.31) | (.25) | (.07) |
Distributions from net realized gain | (2.08) | (6.25) | (3.45) | - | (.20) |
Total distributions | (2.08) | (6.35) | (3.76) | (.25) | (.27) |
Redemption fees added to paid in capitalC | -G | .01 | .01 | .01 | .01 |
Net asset value, end of period | $ 18.27 | $ 30.46 | $ 40.63 | $ 48.72 | $ 52.06 |
Total ReturnA, B | (35.09)% | (9.73)% | (9.60)% | (5.95)% | (8.94)% |
Ratios to Average Net AssetsD, F | | | | | |
Expenses before reductions | 2.16% | 2.14% | 2.12% | 2.10% | 2.10% |
Expenses net of fee waivers, if any | 2.15% | 2.14% | 2.12% | 2.10% | 2.10% |
Expenses net of all reductions | 2.15% | 2.13% | 2.10% | 2.10% | 2.10% |
Net investment income (loss) | .50% | .76% | .91% | 1.05% | 1.29% |
Supplemental Data | | | | | |
Net assets, end of period (000 omitted) | $ 628 | $ 2,211 | $ 4,764 | $ 9,492 | $ 14,114 |
Portfolio turnover rateE | 30% | 30% | 23% | 23% | 11% |
A Total returns would have been lower if certain expenses had not been reduced during the applicable periods shown. B Total returns do not include the effect of the contingent deferred sales charge. C Calculated based on average shares outstanding during the period. D Fees and expenses of any underlying Fidelity Central Funds are not included in the Fund's expense ratio. The Fund indirectly bears its proportionate share of the expenses of any underlying Fidelity Central Funds. E Amount does not include the portfolio activity of any underlying Fidelity Central Funds. F Expense ratios reflect operating expenses of the class. Expenses before reductions do not reflect amounts reimbursed by the investment adviser or reductions from brokerage service arrangements or reductions from other expense offset arrangements and do not represent the amount paid by the class during periods when reimbursements or reductions occur. Expenses net of fee waivers reflect expenses after reimbursement by the investment adviser but prior to reductions from brokerage service arrangements or other expense offset arrangements. Expenses net of all reductions represent the net expenses paid by the class. G Amount represents less than $.005 per share. |
Financial Highlights - Fidelity Latin America Fund Class C
Years ended October 31, | 2015 | 2014 | 2013 | 2012 | 2011 |
Selected Per-Share Data | | | | | |
Net asset value, beginning of period | $ 30.37 | $ 40.59 | $ 48.73 | $ 52.05 | $ 57.44 |
Income from Investment Operations | | | | | |
Net investment income (loss) C | .11 | .25 | .40 | .54 | .73 |
Net realized and unrealized gain (loss) | (10.17) | (4.07) | (4.74) | (3.64) | (5.84) |
Total from investment operations | (10.06) | (3.82) | (4.34) | (3.10) | (5.11) |
Distributions from net investment income | (.05) | (.16) | (.36) | (.23) | (.09) |
Distributions from net realized gain | (2.08) | (6.25) | (3.45) | - | (.20) |
Total distributions | (2.13) | (6.41) | (3.81) | (.23) | (.29) |
Redemption fees added to paid in capitalC | -G | .01 | .01 | .01 | .01 |
Net asset value, end of period | $ 18.18 | $ 30.37 | $ 40.59 | $ 48.73 | $ 52.05 |
Total ReturnA, B | (35.08)% | (9.74)% | (9.62)% | (5.94)% | (8.93)% |
Ratios to Average Net AssetsD, F | | | | | |
Expenses before reductions | 2.15% | 2.13% | 2.12% | 2.10% | 2.08% |
Expenses net of fee waivers, if any | 2.15% | 2.13% | 2.12% | 2.10% | 2.08% |
Expenses net of all reductions | 2.15% | 2.13% | 2.10% | 2.10% | 2.08% |
Net investment income (loss) | .51% | .77% | .91% | 1.06% | 1.31% |
Supplemental Data | | | | | |
Net assets, end of period (000 omitted) | $ 5,394 | $ 11,349 | $ 15,185 | $ 27,405 | $ 35,203 |
Portfolio turnover rateE | 30% | 30% | 23% | 23% | 11% |
A Total returns would have been lower if certain expenses had not been reduced during the applicable periods shown. B Total returns do not include the effect of the contingent deferred sales charge. C Calculated based on average shares outstanding during the period. D Fees and expenses of any underlying Fidelity Central Funds are not included in the Fund's expense ratio. The Fund indirectly bears its proportionate share of the expenses of any underlying Fidelity Central Funds. E Amount does not include the portfolio activity of any underlying Fidelity Central Funds. F Expense ratios reflect operating expenses of the class. Expenses before reductions do not reflect amounts reimbursed by the investment adviser or reductions from brokerage service arrangements or reductions from other expense offset arrangements and do not represent the amount paid by the class during periods when reimbursements or reductions occur. Expenses net of fee waivers reflect expenses after reimbursement by the investment adviser but prior to reductions from brokerage service arrangements or other expense offset arrangements. Expenses net of all reductions represent the net expenses paid by the class. G Amount represents less than $.005 per share. |
See accompanying notes which are an integral part of the financial statements.
Annual Report
Financial Highlights - Fidelity Latin America Fund
Years ended October 31, | 2015 | 2014 | 2013 | 2012 | 2011 |
Selected Per-Share Data | | | | | |
Net asset value, beginning of period | $ 30.34 | $ 40.80 | $ 49.09 | $ 52.48 | $ 57.50 |
Income from Investment Operations | | | | | |
Net investment income (loss) B | .34 | .59 | .87 | 1.09 | 1.34 |
Net realized and unrealized gain (loss) | (10.11) | (4.10) | (4.74) | (3.67) | (5.88) |
Total from investment operations | (9.77) | (3.51) | (3.87) | (2.58) | (4.54) |
Distributions from net investment income | (.41) | (.71) | (.98) | (.82) | (.29) |
Distributions from net realized gain | (2.08) | (6.25) | (3.45) | - | (.20) |
Total distributions | (2.49) | (6.96) | (4.43) | (.82) | (.49) |
Redemption fees added to paid in capitalB | - F | .01 | .01 | .01 | .01 |
Net asset value, end of period | $ 18.08 | $ 30.34 | $ 40.80 | $ 49.09 | $ 52.48 |
Total ReturnA | (34.45)% | (8.79)% | (8.63)% | (4.91)% | (7.96)% |
Ratios to Average Net AssetsC, E | | | | | |
Expenses before reductions | 1.13% | 1.08% | 1.04% | 1.02% | 1.00% |
Expenses net of fee waivers, if any | 1.12% | 1.08% | 1.04% | 1.02% | 1.00% |
Expenses net of all reductions | 1.12% | 1.07% | 1.03% | 1.02% | 1.00% |
Net investment income (loss) | 1.53% | 1.83% | 1.99% | 2.14% | 2.39% |
Supplemental Data | | | | | |
Net assets, end of period (000 omitted) | $ 481,005 | $ 933,298 | $ 1,324,748 | $ 2,274,601 | $ 2,884,301 |
Portfolio turnover rateD | 30% | 30% | 23% | 23% | 11% |
A Total returns would have been lower if certain expenses had not been reduced during the applicable periods shown. B Calculated based on average shares outstanding during the period. C Fees and expenses of any underlying Fidelity Central Funds are not included in the Fund's expense ratio. The Fund indirectly bears its proportionate share of the expenses of any underlying Fidelity Central Funds. D Amount does not include the portfolio activity of any underlying Fidelity Central Funds. E Expense ratios reflect operating expenses of the class. Expenses before reductions do not reflect amounts reimbursed by the investment adviser or reductions from brokerage service arrangements or reductions from other expense offset arrangements and do not represent the amount paid by the class during periods when reimbursements or reductions occur. Expenses net of fee waivers reflect expenses after reimbursement by the investment adviser but prior to reductions from brokerage service arrangements or other expense offset arrangements. Expenses net of all reductions represent the net expenses paid by the class. F Amount represents less than $.005 per share. |
Financial Highlights - Fidelity Latin America Fund Class I
Years ended October 31, | 2015 | 2014 | 2013 | 2012 | 2011 |
Selected Per-Share Data | | | | | |
Net asset value, beginning of period | $ 30.35 | $ 40.79 | $ 49.07 | $ 52.51 | $ 57.49 |
Income from Investment Operations | | | | | |
Net investment income (loss) B | .36 | .60 | .87 | 1.08 | 1.32 |
Net realized and unrealized gain (loss) | (10.13) | (4.07) | (4.74) | (3.67) | (5.88) |
Total from investment operations | (9.77) | (3.47) | (3.87) | (2.59) | (4.56) |
Distributions from net investment income | (.42) | (.73) | (.97) | (.86) | (.23) |
Distributions from net realized gain | (2.08) | (6.25) | (3.45) | - | (.20) |
Total distributions | (2.50) | (6.98) | (4.42) | (.86) | (.43) |
Redemption fees added to paid in capitalB | - F | .01 | .01 | .01 | .01 |
Net asset value, end of period | $ 18.08 | $ 30.35 | $ 40.79 | $ 49.07 | $ 52.51 |
Total ReturnA | (34.42)% | (8.69)% | (8.63)% | (4.93)% | (7.98)% |
Ratios to Average Net AssetsC, E | | | | | |
Expenses before reductions | 1.06% | 1.04% | 1.03% | 1.04% | 1.04% |
Expenses net of fee waivers, if any | 1.06% | 1.04% | 1.03% | 1.04% | 1.04% |
Expenses net of all reductions | 1.05% | 1.04% | 1.01% | 1.04% | 1.04% |
Net investment income (loss) | 1.60% | 1.86% | 2.00% | 2.12% | 2.35% |
Supplemental Data | | | | | |
Net assets, end of period (000 omitted) | $ 1,828 | $ 4,531 | $ 5,131 | $ 7,928 | $ 9,603 |
Portfolio turnover rateD | 30% | 30% | 23% | 23% | 11% |
A Total returns would have been lower if certain expenses had not been reduced during the applicable periods shown. B Calculated based on average shares outstanding during the period. C Fees and expenses of any underlying Fidelity Central Funds are not included in the Fund's expense ratio. The Fund indirectly bears its proportionate share of the expenses of any underlying Fidelity Central Funds. D Amount does not include the portfolio activity of any underlying Fidelity Central Funds. E Expense ratios reflect operating expenses of the class. Expenses before reductions do not reflect amounts reimbursed by the investment adviser or reductions from brokerage service arrangements or reductions from other expense offset arrangements and do not represent the amount paid by the class during periods when reimbursements or reductions occur. Expenses net of fee waivers reflect expenses after reimbursement by the investment adviser but prior to reductions from brokerage service arrangements or other expense offset arrangements. Expenses net of all reductions represent the net expenses paid by the class. F Amount represents less than $.005 per share. |
See accompanying notes which are an integral part of the financial statements.
Annual Report
For the period ended October 31, 2015
1. Organization.
Fidelity Latin America Fund (the Fund) is a non-diversified fund of Fidelity Investment Trust (the Trust) and is authorized to issue an unlimited number of shares. The Trust is registered under the Investment Company Act of 1940, as amended (the 1940 Act), as an open-end management investment company organized as a Massachusetts business trust. The Fund offers Class A, Class T, Class C, Latin America and Class I (formerly Institutional Class) shares, each of which, along with Class B shares, has equal rights as to assets and voting privileges. Class B shares are closed to new accounts and additional purchases, except for exchanges and reinvestments. Each class has exclusive voting rights with respect to matters that affect that class. Class B shares will automatically convert to Class A shares after a holding period of seven years from the initial date of purchase. The Fund's investments in emerging markets can be subject to social, economic, regulatory, and political uncertainties and can be extremely volatile.
2. Investments in Fidelity Central Funds.
The Fund invests in Fidelity Central Funds, which are open-end investment companies generally available only to other investment companies and accounts managed by the investment adviser and its affiliates. The Fund's Schedule of Investments lists each of the Fidelity Central Funds held as of period end, if any, as an investment of the Fund, but does not include the underlying holdings of each Fidelity Central Fund. As an Investing Fund, the Fund indirectly bears its proportionate share of the expenses of the underlying Fidelity Central Funds.
The Money Market Central Funds seek preservation of capital and current income and are managed by Fidelity Investments Money Management, Inc. (FIMM), an affiliate of the investment adviser. Annualized expenses of the Money Market Central Funds as of their most recent shareholder report date are less than .005%.
A complete unaudited list of holdings for each Fidelity Central Fund is available upon request or at the Securities and Exchange Commission (the SEC) website at www.sec.gov. In addition, the financial statements of the Fidelity Central Funds, which are not covered by the Fund's Report of Independent Registered Public Accounting Firm, are available on the SEC website or upon request.
3. Significant Accounting Policies.
The financial statements have been prepared in conformity with accounting principles generally accepted in the United States of America (GAAP), which require management to make certain estimates and assumptions at the date of the financial statements. Actual results could differ from those estimates. Subsequent events, if any, through the date that the financial statements were issued have been evaluated in the preparation of the financial statements. The following summarizes the significant accounting policies of the Fund:
Investment Valuation. Investments are valued as of 4:00 p.m. Eastern time on the last calendar day of the period. The Board of Trustees (the Board) has delegated the day to day responsibility for the valuation of the Fund's investments to the Fidelity Management & Research Company (FMR) Fair Value Committee (the Committee). In accordance with valuation policies and procedures approved by the Board, the Fund attempts to obtain prices from one or more third party pricing vendors or brokers to value its investments. When current market prices, quotations or currency exchange rates are not readily available or reliable, investments will be fair valued in good faith by the Committee, in accordance with procedures adopted by the Board. Factors used in determining fair value vary by investment type and may include market or investment specific events. The frequency with which these procedures are used cannot be predicted and they may be utilized to a significant extent. The Committee oversees the Fund's valuation policies and procedures and reports to the Board on the Committee's activities and fair value determinations. The Board monitors the appropriateness of the procedures used in valuing the Fund's investments and ratifies the fair value determinations of the Committee.
The Fund categorizes the inputs to valuation techniques used to value its investments into a disclosure hierarchy consisting of three levels as shown below:
Level 1 - quoted prices in active markets for identical investments
Level 2 - other significant observable inputs (including quoted prices for similar investments, interest rates, prepayment speeds, etc.)
Level 3 - unobservable inputs (including the Fund's own assumptions based on the best information available)
Valuation techniques used to value the Fund's investments by major category are as follows:
Equity securities, including restricted securities, for which market quotations are readily available, are valued at the last reported sale price or official closing price as reported by a third party pricing vendor on the primary market or exchange on which they are traded and are categorized as Level 1 in the hierarchy. In the event there were no sales during the day or closing prices are not available, securities are valued at the last quoted bid price or may be valued using the last available price and are generally categorized as Level 2 in the hierarchy. For foreign equity securities, when market or security specific events arise, comparisons to the valuation of American Depositary Receipts (ADRs), futures contracts, Exchange-Traded Funds (ETFs) and certain indexes as well as quoted prices for similar securities may be used and would be categorized as Level 2 in the hierarchy. Utilizing
Annual Report
Notes to Financial Statements - continued
3. Significant Accounting Policies - continued
Investment Valuation - continued
these techniques may result in transfers between Level 1 and Level 2. For equity securities, including restricted securities, where observable inputs are limited, assumptions about market activity and risk are used and these securities may be categorized as Level 3 in the hierarchy.
Investments in open-end mutual funds, including the Fidelity Central Funds, are valued at their closing net asset value (NAV) each business day and are categorized as Level 1 in the hierarchy.
Changes in valuation techniques may result in transfers in or out of an assigned level within the disclosure hierarchy.
Foreign Currency. The Fund may use foreign currency contracts to facilitate transactions in foreign-denominated securities. Gains and losses from these transactions may arise from changes in the value of the foreign currency or if the counterparties do not perform under the contracts' terms.
Foreign-denominated assets, including investment securities, and liabilities are translated into U.S. dollars at the exchange rates at period end. Purchases and sales of investment securities, income and dividends received and expenses denominated in foreign currencies are translated into U.S. dollars at the exchange rate in effect on the transaction date.
The effects of exchange rate fluctuations on investments are included with the net realized and unrealized gain (loss) on investment securities. Other foreign currency transactions resulting in realized and unrealized gain (loss) are disclosed separately.
Investment Transactions and Income. For financial reporting purposes, the Fund's investment holdings and NAV include trades executed through the end of the last business day of the period. The NAV per share for processing shareholder transactions is calculated as of the close of business of the New York Stock Exchange (NYSE), normally 4:00 p.m. Eastern time and includes trades executed through the end of the prior business day. Gains and losses on securities sold are determined on the basis of identified cost. Dividend income is recorded on the ex-dividend date, except for certain dividends from foreign securities where the ex-dividend date may have passed, which are recorded as soon as the Fund is informed of the ex-dividend date. Non-cash dividends included in dividend income, if any, are recorded at the fair market value of the securities received. Income and capital gain distributions from Fidelity Central Funds, if any, are recorded on the ex-dividend date. Distributions received on securities that represent a return of capital or capital gain are recorded as a reduction of cost of investments and/or as a realized gain. Subsequent to ex-dividend date the Fund determines the components of these distributions, based upon receipt of tax filings or other correspondence relating to the underlying investment. Interest income is accrued as earned and includes coupon interest and amortization of premium and accretion of discount on debt securities as applicable. Investment income is recorded net of foreign taxes withheld where recovery of such taxes is uncertain.
Class Allocations and Expenses. Investment income, realized and unrealized capital gains and losses, common expenses of the Fund, and certain fund-level expense reductions, if any, are allocated daily on a pro-rata basis to each class based on the relative net assets of each class to the total net assets of the Fund. Each class differs with respect to transfer agent and distribution and service plan fees incurred. Certain expense reductions may also differ by class. For the reporting period, the allocated portion of income and expenses to each class as a percent of its average net assets may vary due to the timing of recording these transactions in relation to fluctuating net assets of the classes. Expenses directly attributable to a fund are charged to that fund. Expenses attributable to more than one fund are allocated among the respective funds on the basis of relative net assets or other appropriate methods. Expense estimates are accrued in the period to which they relate and adjustments are made when actual amounts are known.
Income Tax Information and Distributions to Shareholders. Each year, the Fund intends to qualify as a regulated investment company under Subchapter M of the Internal Revenue Code, including distributing substantially all of its taxable income and realized gains. As a result, no provision for U.S. Federal income taxes is required. As of October 31, 2015, the Fund did not have any unrecognized tax benefits in the financial statements; nor is the Fund aware of any tax positions for which it is reasonably possible that the total amounts of unrecognized tax benefits will significantly change in the next twelve months. The Fund files a U.S. federal tax return, in addition to state and local tax returns as required. The Fund's federal income tax returns are subject to examination by the Internal Revenue Service (IRS) for a period of three fiscal years after they are filed. State and local tax returns may be subject to examination for an additional fiscal year depending on the jurisdiction. Foreign taxes are provided for based on the Fund's understanding of the tax rules and rates that exist in the foreign markets in which it invests.
Distributions are declared and recorded on the ex-dividend date. Income dividends and capital gain distributions are declared separately for each class. Income and capital gain distributions are determined in accordance with income tax regulations, which may differ from GAAP. In addition, the Fund claimed a portion of the payment made to redeeming shareholders as a distribution for income tax purposes.
Capital accounts within the financial statements are adjusted for permanent book-tax differences. These adjustments have no impact on net assets or the results of operations. Capital accounts are not adjusted for temporary book-tax differences which will reverse in a subsequent period.
Book-tax differences are primarily due to foreign currency transactions, capital loss carryforwards, passive foreign investment companies (PFIC), deferred trustees compensation, and losses deferred due to wash sales.
Annual Report
3. Significant Accounting Policies - continued
Income Tax Information and Distributions to Shareholders - continued
The federal tax cost of investment securities and unrealized appreciation (depreciation) as of period end were as follows:
Gross unrealized appreciation | $ 111,202,419 |
Gross unrealized depreciation | (153,035,114) |
Net unrealized appreciation (depreciation) on securities | $ (41,832,695) |
Tax Cost | $ 554,415,312 |
The tax-based components of distributable earnings as of period end were as follows:
Undistributed ordinary income | $ 7,013,225 |
Capital loss carryforward | $ (84,762,495) |
Net unrealized appreciation (depreciation) on securities and other investments | $ (41,872,368) |
Capital loss carryforwards are only available to offset future capital gains of the Fund to the extent provided by regulations and may be limited. Under the Regulated Investment Company Modernization Act of 2010 (the Act), the Fund is permitted to carry forward capital losses incurred in taxable years beginning after December 22, 2010 for an unlimited period and such capital losses are required to be used prior to any losses that expire. The capital loss carryforward information presented below, including any applicable limitation, is estimated as of fiscal period end and is subject to adjustment.
No expiration | |
Short-term | $ (34,655,095) |
Long-term | (50,107,400) |
Total capital loss carryforward | $ (84,762,495) |
The tax character of distributions paid was as follows:
| October 31, 2015 | October 31, 2014 |
Ordinary Income | $ 13,610,992 | $ 23,599,177 |
Long-term Capital Gains | 65,377,076 | 209,492,272 |
Total | $ 78,988,068 | $ 233,091,449 |
Short-Term Trading (Redemption) Fees. Shares held by investors in the Fund less than 90 days may have been subject to a redemption fee equal to 1.50% of the NAV of shares redeemed. All redemption fees, which reduce the proceeds of the shareholder redemption, are retained by the Fund and accounted for as an addition to paid in capital.
4. Purchases and Sales of Investments.
Purchases and sales of securities, other than short-term securities, aggregated $206,464,209 and $379,227,247, respectively.
5. Fees and Other Transactions with Affiliates.
Management Fee. Fidelity Management & Research Company (the investment adviser) and its affiliates provide the Fund with investment management related services for which the Fund pays a monthly management fee. The management fee is the sum of an individual fund fee rate that is based on an annual rate of .45% of the Fund's average net assets and an annualized group fee rate that averaged .25% during the period. The group fee rate is based upon the average net assets of all the mutual funds advised by the investment adviser, including any mutual funds previously advised by the investment adviser that are currently advised by Fidelity SelectCo, LLC, an affiliate of the investment adviser. The group fee rate decreases as assets under management increase and increases as assets under management decrease. For the reporting period, the total annual management fee rate was .70% of the Fund's average net assets.
Distribution and Service Plan Fees. In accordance with Rule 12b-1 of the 1940 Act, the Fund has adopted separate Distribution and Service Plans for each class of shares. Certain classes pay Fidelity Distributors Corporation (FDC), an affiliate of the investment adviser, separate Distribution and Service Fees, each of which is based on an annual percentage of each class' average net assets. In addition, FDC may pay financial intermediaries for
Annual Report
Notes to Financial Statements - continued
5. Fees and Other Transactions with Affiliates - continued
Distribution and Service Plan Fees - continued
selling shares of the Fund and providing shareholder support services. For the period, the Distribution and Service Fee rates, total fees and amounts retained by FDC were as follows:
| Distribution
Fee | Service
Fee | Total Fees | Retained
by FDC |
Class A | -% | .25% | $ 59,273 | $ 647 |
Class T | .25% | .25% | 34,910 | 81 |
Class B | .75% | .25% | 12,707 | 9,534 |
Class C | .75% | .25% | 77,075 | 10,716 |
| | | $ 183,965 | $ 20,978 |
Sales Load. FDC may receive a front-end sales charge of up to 5.75% for selling Class A shares and 3.50% for selling Class T shares, some of which is paid to financial intermediaries for selling shares of the Fund. Depending on the holding period, FDC may receive contingent deferred sales charges levied on Class A, Class T, Class B, and Class C redemptions. The deferred sales charges range from 5.00% to 1.00% for Class B shares, 1.00% for Class C shares, 1.00% for certain purchases of Class A shares and .25% for certain purchases of Class T shares.
For the period, sales charge amounts retained by FDC were as follows:
| Retained
by FDC |
Class A | $ 8,285 |
Class T | 1,542 |
Class BA | 1,183 |
Class CA | 1,816 |
| $ 12,826 |
A When Class B and Class C shares are initially sold, FDC pays commissions from its own resources to financial intermediaries through which the sales are made.
Transfer Agent Fees. Fidelity Investments Institutional Operations Company, Inc., (FIIOC), an affiliate of the investment adviser, is the transfer, dividend disbursing and shareholder servicing agent for each class of the Fund. FIIOC receives account fees and asset-based fees that vary according to the account size and type of account of the shareholders of the respective classes of the Fund. FIIOC pays for typesetting, printing and mailing of shareholder reports, except proxy statements.
For the period, transfer agent fees for each class were as follows:
| Amount | % of
Class-Level Average
Net Assets |
Class A | $ 70,425 | .30 |
Class T | 22,003 | .32 |
Class B | 3,759 | .30 |
Class C | 22,931 | .30 |
Latin America | 1,838,665 | .28 |
Class I | 5,434 | .21 |
| $ 1,963,217 | |
Accounting and Security Lending Fees. Fidelity Service Company, Inc. (FSC), an affiliate of the investment adviser, maintains the Fund's accounting records. The accounting fee is based on the level of average net assets for each month. Under a separate contract, FSC administers the security lending program. The security lending fee is based on the number and duration of lending transactions.
Brokerage Commissions. The Fund placed a portion of its portfolio transactions with brokerage firms which are affiliates of the investment adviser. Brokerage commissions are included in net realized gain (loss) and change in net unrealized appreciation (depreciation) in the Statement of Operations. The commissions paid to these affiliated firms were $3,354 for the period.
Interfund Lending Program. Pursuant to an Exemptive Order issued by the SEC, the Fund, along with other registered investment companies having management contracts with FMR or other affiliated entities of FMR, may participate in an interfund lending program. This program provides an
Annual Report
5. Fees and Other Transactions with Affiliates - continued
Interfund Lending Program - continued
alternative credit facility allowing the funds to borrow from, or lend money to, other participating affiliated funds. At period end, there were no interfund loans outstanding. The Fund's activity in this program during the period for which loans were outstanding was as follows:
Borrower or Lender | Average Loan Balance | Weighted Average
Interest Rate | Interest Expense |
Borrower | $ 5,893,750 | .34% | $ 444 |
6. Committed Line of Credit.
The Fund participates with other funds managed by the investment adviser or an affiliate in a $4.25 billion credit facility (the "line of credit") to be utilized for temporary or emergency purposes to fund shareholder redemptions or for other short-term liquidity purposes. The Fund has agreed to pay commitment fees on its pro-rata portion of the line of credit, which amounted to $1,072 and is reflected in Miscellaneous expenses on the Statement of Operations. During the period, the Fund did not borrow on this line of credit.
7. Security Lending.
The Fund lends portfolio securities through a lending agent from time to time in order to earn additional income. For equity securities, a lending agent is used and may loan securities to certain qualified borrowers, including Fidelity Capital Markets (FCM), a broker-dealer affiliated with the Fund. On the settlement date of the loan, the Fund receives collateral (in the form of U.S. Treasury obligations, letters of credit and/or cash) against the loaned securities and maintains collateral in an amount not less than 100% of the market value of the loaned securities during the period of the loan. The market value of the loaned securities is determined at the close of business of the Fund and any additional required collateral is delivered to the Fund on the next business day. The Fund or borrower may terminate the loan at any time, and if the borrower defaults on its obligation to return the securities loaned because of insolvency or other reasons, the Fund may apply collateral received from the borrower against the obligation. The Fund may experience delays and costs in recovering the securities loaned. Any cash collateral received is invested in the Fidelity Securities Lending Cash Central Fund. The value of loaned securities and cash collateral at period end are disclosed on the Fund's Statement of Assets and Liabilities. At period end, there were no security loans outstanding with FCM. Security lending income represents the income earned on investing cash collateral, less rebates paid to borrowers and any lending agent fees associated with the loan, plus any premium payments received for lending certain types of securities. Security lending income is presented in the Statement of Operations as a component of income from Fidelity Central Funds. Total security lending income during the period amounted to $36,119, including $28 from securities loaned to FCM.
8. Expense Reductions.
Commissions paid to certain brokers with whom the investment adviser, or its affiliates, places trades on behalf of the Fund include an amount in addition to trade execution, which may be rebated back to the Fund to offset certain expenses. This amount totaled $19,806 for the period. In addition, through arrangements with the Fund's custodian, credits realized as a result of certain uninvested cash balances were used to reduce the Fund's expenses. During the period, these credits reduced the Fund's custody expenses by $36.
In addition, during the period the investment adviser reimbursed and/or waived a portion of fund-level operating expenses in the amount of $2,673 and a portion of class-level operating expenses as follows:
| Amount |
Class A | $ 60 |
Class T | 14 |
Class B | 2 |
Class C | 40 |
Latin America | 43,294 |
Class I | 100 |
| $ 43,510 |
9. Distributions to Shareholders.
Distributions to shareholders of each class were as follows:
Years ended October 31, | 2015 | 2014 |
From net investment income | | |
Class A | $ 341,444 | $ 667,095 |
Class T | 71,167 | 136,327 |
Class B | - | 12,098 |
Annual Report
Notes to Financial Statements - continued
9. Distributions to Shareholders - continued
Years ended October 31, | 2015 | 2014 |
From net investment income | | |
Class C | $ 18,114 | $ 60,991 |
Latin America | 12,109,807 | 22,631,305 |
Class I | 52,230 | 91,360 |
Total | $ 12,592,762 | $ 23,599,176 |
From net realized gain | | |
Class A | $ 2,330,553 | $ 7,249,224 |
Class T | 658,521 | 1,918,455 |
Class B | 144,042 | 684,975 |
Class C | 754,025 | 2,282,110 |
Latin America | 62,251,897 | 196,577,505 |
Class I | 256,268 | 780,004 |
Total | $ 66,395,306 | $ 209,492,273 |
10. Share Transactions.
Share transactions for each class were as follows and may contain automatic conversions between classes or exchanges between funds:
| Shares | Dollars |
Years ended October 31, | 2015 | 2014 | 2015 | 2014 |
Class A | | | | |
Shares sold | 218,330 | 256,161 | $ 4,910,163 | $ 8,113,294 |
Reinvestment of distributions | 103,775 | 229,379 | 2,587,573 | 7,071,806 |
Shares redeemed | (565,352) | (524,684) | (12,518,797) | (16,539,013) |
Net increase (decrease) | (243,247) | (39,144) | $ (5,021,061) | $ (1,353,913) |
Class T | | | | |
Shares sold | 29,946 | 47,965 | $ 658,518 | $ 1,548,211 |
Reinvestment of distributions | 28,508 | 65,609 | 713,357 | 2,028,652 |
Shares redeemed | (88,493) | (104,082) | (1,990,592) | (3,252,264) |
Net increase (decrease) | (30,039) | 9,492 | $ (618,717) | $ 324,599 |
Class B | | | | |
Shares sold | 116 | 1,044 | $ 2,989 | $ 32,892 |
Reinvestment of distributions | 5,261 | 18,939 | 133,376 | 590,702 |
Shares redeemed | (43,584) | (64,672) | (982,322) | (2,061,800) |
Net increase (decrease) | (38,207) | (44,689) | $ (845,957) | $ (1,438,206) |
Class C | | | | |
Shares sold | 48,350 | 91,764 | $ 1,099,271 | $ 2,901,440 |
Reinvestment of distributions | 25,875 | 69,412 | 652,617 | 2,158,720 |
Shares redeemed | (151,109) | (161,581) | (3,411,105) | (5,151,621) |
Net increase (decrease) | (76,884) | (405) | $ (1,659,217) | $ (91,461) |
Latin America | | | | |
Shares sold | 2,736,036 | 4,529,614 | $ 60,647,605 | $ 143,961,705 |
Reinvestment of distributions | 2,862,287 | 6,820,938 | 71,197,829 | 209,950,213 |
Shares redeemed | (9,758,242) | (13,065,128) | (221,025,945) | (413,931,096) |
Net increase (decrease) | (4,159,919) | (1,714,576) | $ (89,180,511) | $ (60,019,178) |
Class I | | | | |
Shares sold | 41,136 | 125,962 | $ 906,993 | $ 4,086,454 |
Reinvestment of distributions | 11,139 | 21,472 | 276,862 | 660,492 |
Shares redeemed | (100,491) | (123,906) | (2,361,992) | (3,873,517) |
Net increase (decrease) | (48,216) | 23,528 | $ (1,178,137) | $ 873,429 |
11. Other.
The Fund's organizational documents provide former and current trustees and officers with a limited indemnification against liabilities arising in connection with the performance of their duties to the Fund. In the normal course of business, the Fund may also enter into contracts that provide general indemnifications. The Fund's maximum exposure under these arrangements is unknown as this would be dependent on future claims that may be made against the Fund. The risk of material loss from such claims is considered remote.
Annual Report
Fidelity Nordic Fund
Average annual total return reflects the change in the value of an investment, assuming reinvestment of the fund's distributions from dividend income and capital gains (the profits earned upon the sale of securities that have grown in value, if any) and assuming a constant rate of performance each year. The $10,000 table and the fund's returns do not reflect the deduction of taxes that a shareholder would pay on fund distributions or the redemption of fund shares. During periods of reimbursement by Fidelity, a fund's total return will be greater than it would be had the reimbursement not occurred. How a fund did yesterday is no guarantee of how it will do tomorrow.
Average Annual Total Returns
Periods ended October 31, 2015 | Past 1
year | Past 5
years | Past 10
years |
Fidelity Nordic Fund | 3.76% | 9.27% | 7.84% |
$10,000 Over 10 Years
Let's say hypothetically that $10,000 was invested in Fidelity Nordic Fund on October 31, 2005. The chart shows how the value of your investment would have changed, and also shows how the FTSE® Capped Nordic Index performed over the same period. Returns shown for the FTSE® Capped Nordic Index for periods prior to October 1, 2009 (its inception date) are returns of the uncapped FTSE Nordic Index.
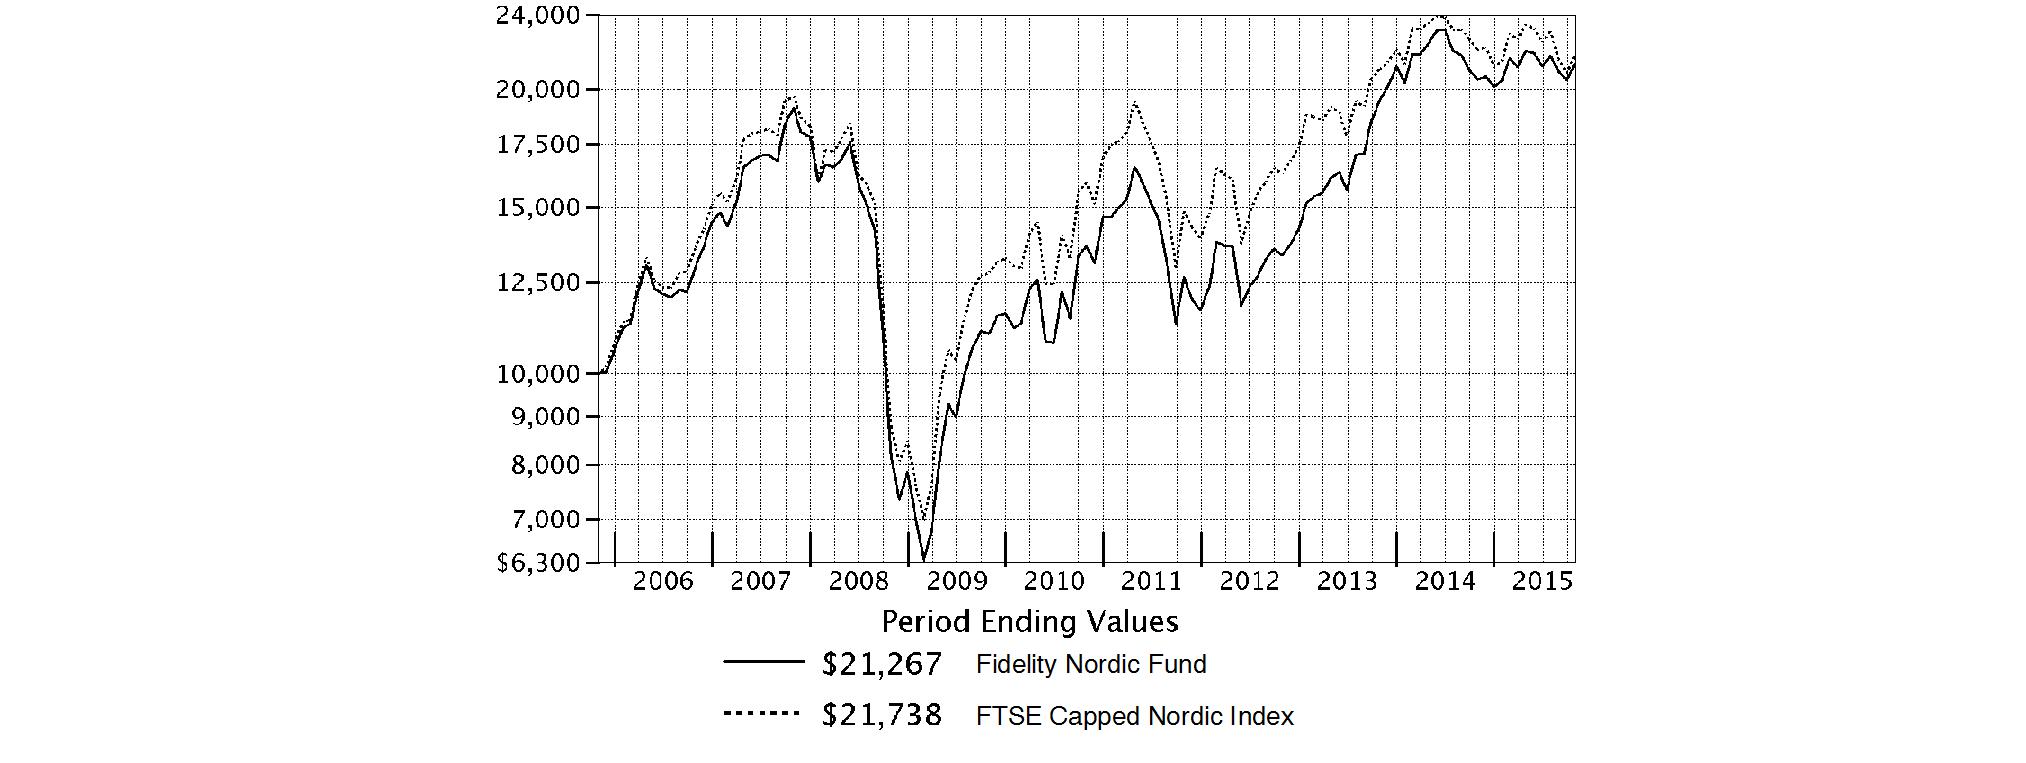
Annual Report
Fidelity Nordic Fund
Market Recap: International equities suffered a moderate setback for the 12 months ending October 31, 2015, held back by a collapse in commodities prices that hurt resources-related sectors and geographies. The MSCI ACWI (All Country World Index) ex USA Index returned -4.55% for the period, affected also by concerns about global economic growth. Commodity producers remained under pressure for much of the past year, largely related to economic deceleration in China (-1%), the world's second-largest economy and a leading consumer of raw materials. This effect was exacerbated by U.S. dollar strength relative to global currencies, which weighed on commodities priced in dollars and acutely impacted equity returns within regions most exposed to resources prices. The emerging-markets group, for example, returned about -15% this period. Canada, a significant energy producer, returned roughly -17%. Net energy consumer Japan (+9%) was the best-performing region by far. Only about a quarter of the nearly 50 index countries managed a gain this period: Ireland (+19%) - the EU's fastest-growing economy - and Israel (+17%) proved top performers; Greece (-56%) and Brazil (-46%), among the worst. As for sectors, energy (-25%) and materials (-16%) declined sharply, whereas the two consumer sectors each gained about 6%.
Comments from Portfolio Manager Stefan Lindblad: For the year, the fund delivered a single-digit gain, handily outpacing the -1.25% return of the FTSE Capped Nordic Index. Amid a volatile investment environment, stock selection in the transportation and capital goods segments of industrials helped drive the fund's performance relative to the benchmark. On an individual basis, an out-of-index stake in Swedish online gambling company Unibet Group was the most beneficial. During the period, the stock benefited from the announcement of several strategic acquisitions. Given my positive outlook for the company's long-term prospects, I added to the fund's stake during the period. Also aiding were positions in freight-forwarding company DSV in Denmark and Sweden-based Eltel, an infrastructure network services supplier that was not in the benchmark. On the downside, stock selection in consumer discretionary's retailing group and the food, beverage & tobacco area of consumer staples was unfavorable. Among individual stocks, an out-of-index position in Kambi Group, a Malta-based company that provides sport betting infrastructure to the gaming industry, was detrimental to the fund's relative result.
The views expressed above reflect those of the portfolio manager(s) only through the end of the period as stated on the cover of this report and do not necessarily represent the views of Fidelity or any other person in the Fidelity organization. Any such views are subject to change at any time based upon market or other conditions and Fidelity disclaims any responsibility to update such views. These views may not be relied on as investment advice and, because investment decisions for a Fidelity fund are based on numerous factors, may not be relied on as an indication of trading intent on behalf of any Fidelity fund.
Annual Report
Fidelity Nordic Fund
As a shareholder of the Fund, you incur two types of costs: (1) transaction costs, including redemption fees and (2) ongoing costs, including management fees and other Fund expenses. This Example is intended to help you understand your ongoing costs (in dollars) of investing in the Fund and to compare these costs with the ongoing costs of investing in other mutual funds.
The Example is based on an investment of $1,000 invested at the beginning of the period and held for the entire period (May 1, 2015 to October 31, 2015).
Actual Expenses
The first line of the accompanying table provides information about actual account values and actual expenses. You may use the information in this line, together with the amount you invested, to estimate the expenses that you paid over the period. Simply divide your account value by $1,000.00 (for example, an $8,600 account value divided by $1,000.00 = 8.6), then multiply the result by the number in the first line under the heading entitled "Expenses Paid During Period" to estimate the expenses you paid on your account during this period. A small balance maintenance fee of $12.00 that is charged once a year may apply for certain accounts with a value of less than $2,000. This fee is not included in the table below. If it was, the estimate of expenses you paid during the period would be higher, and your ending account value lower, by this amount. In addition, the Fund, as a shareholder in the underlying Fidelity Central Funds, will indirectly bear its pro-rata share of the fees and expenses incurred by the underlying Fidelity Central Funds. These fees and expenses are not included in the Fund's annualized expense ratio used to calculate the expense estimate in the table below.
Hypothetical Example for Comparison Purposes
The second line of the accompanying table provides information about hypothetical account values and hypothetical expenses based on the Fund's actual expense ratio and an assumed rate of return of 5% per year before expenses, which is not the Fund's actual return. The hypothetical account values and expenses may not be used to estimate the actual ending account balance or expenses you paid for the period. You may use this information to compare the ongoing costs of investing in the Fund and other funds. To do so, compare this 5% hypothetical example with the 5% hypothetical examples that appear in the shareholder reports of the other funds. A small balance maintenance fee of $12.00 that is charged once a year may apply for certain accounts with a value of less than $2,000. This fee is not included in the table below. If it was, the estimate of expenses you paid during the period would be higher, and your ending account value lower, by this amount. In addition, the Fund, as a shareholder in the underlying Fidelity Central Funds, will indirectly bear its pro-rata share of the fees and expenses incurred by the underlying Fidelity Central Funds. These fees and expenses are not included in the Fund's annualized expense ratio used to calculate the expense estimate in the table below.
Please note that the expenses shown in the table are meant to highlight your ongoing costs only and do not reflect any transaction costs. Therefore, the second line of the table is useful in comparing ongoing costs only, and will not help you determine the relative total costs of owning different funds. In addition, if these transactional costs were included, your costs would have been higher.
| Annualized
Expense RatioB | Beginning
Account Value
May 1, 2015 | Ending
Account Value
October 31, 2015 | Expenses Paid
During PeriodC
May 1, 2015
to October 31, 2015 |
Actual | .99% | $ 1,000.00 | $ 967.50 | $ 4.91 |
HypotheticalA | | $ 1,000.00 | $ 1,020.21 | $ 5.04 |
A 5% return per year before expenses
B Annualized expense ratio reflects expenses net of applicable fee waivers.
C Expenses are equal to the Fund's annualized expense ratio, multiplied by the average account value over the period, multiplied by 184/365 (to reflect the one-half year period).
Annual Report
Fidelity Nordic Fund
Investment Changes (Unaudited)
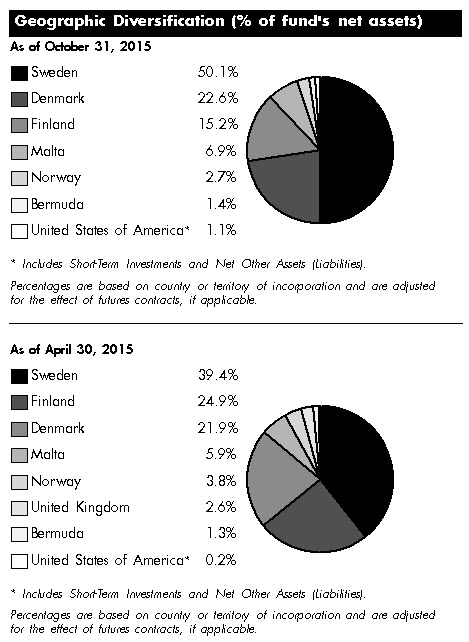
Asset Allocation as of October 31, 2015 |
| % of fund's
net assets | % of fund's net assets
6 months ago |
Stocks | 98.9 | 99.8 |
Short-Term Investments and Net Other Assets (Liabilities) | 1.1 | 0.2 |
Top Ten Stocks as of October 31, 2015 |
| % of fund's
net assets | % of fund's net assets
6 months ago |
Novo Nordisk A/S Series B (Denmark, Pharmaceuticals) | 6.5 | 8.8 |
Svenska Cellulosa AB (SCA) (B Shares) (Sweden, Household Products) | 5.6 | 4.4 |
Carlsberg A/S Series B (Denmark, Beverages) | 4.9 | 3.9 |
Nordea Bank AB (Sweden, Banks) | 4.7 | 2.6 |
Unibet Group PLC unit (Malta, Hotels, Restaurants & Leisure) | 4.6 | 3.0 |
Getinge AB (B Shares) (Sweden, Health Care Equipment & Supplies) | 4.2 | 3.7 |
H&M Hennes & Mauritz AB (B Shares) (Sweden, Specialty Retail) | 4.1 | 0.0 |
DSV de Sammensluttede Vognmaend A/S (Denmark, Road & Rail) | 4.1 | 4.2 |
Sandvik AB (Sweden, Machinery) | 3.8 | 2.2 |
Eltel AB (Sweden, Construction & Engineering) | 3.5 | 3.2 |
| 46.0 | |
Market Sectors as of October 31, 2015 |
| % of fund's
net assets | % of fund's net assets
6 months ago |
Industrials | 25.0 | 30.0 |
Consumer Discretionary | 19.8 | 10.8 |
Health Care | 17.4 | 19.4 |
Financials | 17.0 | 20.8 |
Consumer Staples | 13.8 | 12.8 |
Materials | 4.2 | 2.4 |
Information Technology | 1.7 | 1.5 |
Energy | 0.0 | 2.1 |
Market Sectors may include more than one industry category. |
The fund may invest up to 35% of its total assets in any industry that represents more than 20% of the Nordic market. As of October 31, 2015, the fund did not have more than 25% of its assets invested in any one industry. |
Percentages shown as 0.0% may reflect amounts less than 0.05%. |
Annual Report
Fidelity Nordic Fund
Investments October 31, 2015
Showing Percentage of Net Assets
Common Stocks - 98.9% |
| Shares | | Value |
Bermuda - 1.4% |
Vostok Emerging Finance Ltd. (depository receipt) (a)(d) | 851,779 | | $ 239,276 |
Vostok New Ventures Ltd. SDR (a)(d) | 851,779 | | 5,433,567 |
TOTAL BERMUDA | | 5,672,843 |
Denmark - 22.6% |
Alm. Brand A/S | 1,198,354 | | 6,802,455 |
Carlsberg A/S Series B | 241,400 | | 19,789,365 |
DSV de Sammensluttede Vognmaend A/S | 410,200 | | 16,632,141 |
NNIT A/S | 131,374 | | 3,021,717 |
Novo Nordisk A/S Series B | 493,405 | | 26,201,534 |
Novozymes A/S Series B | 166,400 | | 7,716,028 |
William Demant Holding A/S (a) | 131,500 | | 11,419,862 |
TOTAL DENMARK | | 91,583,102 |
Finland - 15.2% |
Amer Group PLC (A Shares) | 475,100 | | 13,332,764 |
Cramo Oyj (B Shares) | 472,100 | | 8,669,718 |
Huhtamaki Oyj | 257,577 | | 9,092,150 |
Olvi PLC (A Shares) | 323,500 | | 7,843,996 |
Raisio Group PLC (V Shares) | 1,234,000 | | 5,821,393 |
Vaisala Oyj | 250,200 | | 6,682,967 |
Valmet Corp. | 968,885 | | 10,217,516 |
TOTAL FINLAND | | 61,660,504 |
Malta - 6.9% |
Kambi Group PLC (a)(d) | 1,418,983 | | 9,342,462 |
Unibet Group PLC unit | 210,451 | | 18,548,449 |
TOTAL MALTA | | 27,890,911 |
Norway - 2.7% |
Schibsted ASA (B Shares) (a) | 100,000 | | 3,118,840 |
Zalaris ASA (A Shares) (e) | 1,823,800 | | 7,941,931 |
TOTAL NORWAY | | 11,060,771 |
Sweden - 50.1% |
AddTech AB (B Shares) | 631,600 | | 8,982,144 |
Bravida AB | 2,000,000 | | 10,300,168 |
CDON Group AB (a)(d) | 429,543 | | 432,381 |
Coor Service Management Holding AB (a) | 908,700 | | 3,711,997 |
Dustin Group AB (a)(d) | 792,693 | | 5,404,588 |
East Capital Explorer AB (a) | 1,005,000 | | 5,881,630 |
Elekta AB (B Shares) (d) | 1,216,785 | | 9,406,938 |
|
| Shares | | Value |
Eltel AB | 1,286,300 | | $ 14,152,454 |
Getinge AB (B Shares) | 688,200 | | 17,230,072 |
H&M Hennes & Mauritz AB (B Shares) | 430,136 | | 16,730,070 |
Hemfosa Fastigheter AB | 1,293,658 | | 14,044,136 |
Kungsleden AB | 726,300 | | 5,440,736 |
Lifco AB (d) | 156,400 | | 3,474,518 |
Mekonomen AB | 350,400 | | 8,305,213 |
Nordea Bank AB | 1,709,135 | | 18,904,701 |
Pandox AB (a) | 321,600 | | 5,262,412 |
Sandvik AB | 1,636,700 | | 15,306,556 |
Svenska Cellulosa AB (SCA) (B Shares) | 766,800 | | 22,585,312 |
Svenska Handelsbanken AB (A Shares) | 866,800 | | 11,772,427 |
Systemair AB | 456,779 | | 6,108,351 |
TOTAL SWEDEN | | 203,436,804 |
TOTAL COMMON STOCKS (Cost $386,699,823) |
401,304,935
|
Money Market Funds - 3.7% |
| | | |
Fidelity Cash Central Fund, 0.18% (b) | 3,941,433 | | 3,941,433 |
Fidelity Securities Lending Cash Central Fund, 0.19% (b)(c) | 10,869,981 | | 10,869,981 |
TOTAL MONEY MARKET FUNDS (Cost $14,811,414) |
14,811,414
|
TOTAL INVESTMENT PORTFOLIO - 102.6% (Cost $401,511,237) | | 416,116,349 |
NET OTHER ASSETS (LIABILITIES) - (2.6)% | | (10,389,874) |
NET ASSETS - 100% | $ 405,726,475 |
Legend |
(a) Non-income producing |
(b) Affiliated fund that is generally available only to investment companies and other accounts managed by Fidelity Investments. The rate quoted is the annualized seven-day yield of the fund at period end. A complete unaudited listing of the fund's holdings as of its most recent quarter end is available upon request. In addition, each Fidelity Central Fund's financial statements, which are not covered by the Fund's Report of Independent Registered Public Accounting Firm, are available on the SEC's website or upon request. |
(c) Investment made with cash collateral received from securities on loan. |
(d) Security or a portion of the security is on loan at period end. |
(e) Affiliated company |
Affiliated Central Funds |
Information regarding fiscal year to date income earned by the Fund from investments in Fidelity Central Funds is as follows: |
Fund | Income earned |
Fidelity Cash Central Fund | $ 15,029 |
Fidelity Securities Lending Cash Central Fund | 602,202 |
Total | $ 617,231 |
Other Affiliated Issuers |
An affiliated company is a company in which the Fund has ownership of at least 5% of the voting securities. Fiscal year to date transactions with companies which are or were affiliates are as follows: |
Affiliate | Value,
beginning of
period | Purchases | Sales
Proceeds | Dividend
Income | Value,
end of
period |
Kambi Group PLC | $ 14,369,373 | $ - | $ 708,576 | $ - | $ - |
Zalaris ASA (A Shares) | 8,355,202 | - | - | 136,209 | 7,941,931 |
Total | $ 22,724,575 | $ - | $ 708,576 | $ 136,209 | $ 7,941,931 |
Other Information |
Categorizations in the Schedule of Investments are based on country or territory of incorporation. |
The following is a summary of the inputs used, as of October 31, 2015, involving the Fund's assets and liabilities carried at fair value. The inputs or methodology used for valuing securities may not be an indication of the risk associated with investing in those securities. For more information on valuation inputs, and their aggregation into the levels used in the tables below, please refer to the Investment Valuation section in the accompanying Notes to Financial Statements. |
Valuation Inputs at Reporting Date: |
Description | Total | Level 1 | Level 2 | Level 3 |
Investments in Securities: | | | | |
Equities: | | | | |
Consumer Discretionary | $ 80,477,179 | $ 80,477,179 | $ - | $ - |
Consumer Staples | 56,040,066 | 33,454,754 | 22,585,312 | - |
Financials | 68,518,928 | 56,746,501 | 11,772,427 | - |
Health Care | 70,754,641 | 44,553,107 | 26,201,534 | - |
Industrials | 102,022,976 | 102,022,976 | - | - |
Information Technology | 6,682,967 | 6,682,967 | - | - |
Materials | 16,808,178 | 16,808,178 | - | - |
Money Market Funds | 14,811,414 | 14,811,414 | - | - |
Total Investments in Securities: | $ 416,116,349 | $ 355,557,076 | $ 60,559,273 | $ - |
The following is a summary of transfers between Level 1 and Level 2 for the period ended October 31, 2015. Transfers are assumed to have occurred at the beginning of the period, and are primarily attributable to the valuation techniques used for foreign equity securities, as discussed in the accompanying Notes to Financial Statements: |
Transfers | Total |
Level 1 to Level 2 | $ 26,635,843 |
Level 2 to Level 1 | $ 0 |
See accompanying notes which are an integral part of the financial statements.
Annual Report
Fidelity Nordic Fund
Statement of Assets and Liabilities
| | October 31, 2015 |
| | |
Assets | | |
Investment in securities, at value (including securities loaned of $10,361,916) - See accompanying schedule: Unaffiliated issuers (cost $379,679,459) | $ 393,363,004 | |
Fidelity Central Funds (cost $14,811,414) | 14,811,414 | |
Other affiliated issuers (cost $7,020,364) | 7,941,931 | |
Total Investments (cost $401,511,237) | | $ 416,116,349 |
Receivable for investments sold | | 1,558,633 |
Receivable for fund shares sold | | 1,076,215 |
Distributions receivable from Fidelity Central Funds | | 9,215 |
Prepaid expenses | | 1,162 |
Other receivables | | 616 |
Total assets | | 418,762,190 |
| | |
Liabilities | | |
Payable to custodian | $ 191 | |
Payable for investments purchased | 1,482,011 | |
Payable for fund shares redeemed | 300,396 | |
Accrued management fee | 235,437 | |
Other affiliated payables | 85,754 | |
Other payables and accrued expenses | 61,945 | |
Collateral on securities loaned, at value | 10,869,981 | |
Total liabilities | | 13,035,715 |
| | |
Net Assets | | $ 405,726,475 |
Net Assets consist of: | | |
Paid in capital | | $ 413,144,013 |
Undistributed net investment income | | 5,079,232 |
Accumulated undistributed net realized gain (loss) on investments and foreign currency transactions | | (27,098,413) |
Net unrealized appreciation (depreciation) on investments and assets and liabilities in foreign currencies | | 14,601,643 |
Net Assets, for 9,018,168 shares outstanding | | $ 405,726,475 |
Net Asset Value, offering price and redemption price per share ($405,726,475 ÷ 9,018,168 shares) | | $ 44.99 |
Statement of Operations
| Year ended October 31, 2015 |
| | |
Investment Income | | |
Dividends (including $136,209 earned from other affiliated issuers) | | $ 10,628,747 |
Income from Fidelity Central Funds (including $602,202 from security lending) | | 617,231 |
Income before foreign taxes withheld | | 11,245,978 |
Less foreign taxes withheld | | (1,414,501) |
Total income | | 9,831,477 |
| | |
Expenses | | |
Management fee | $ 3,051,393 | |
Transfer agent fees | 876,597 | |
Accounting and security lending fees | 230,304 | |
Custodian fees and expenses | 71,739 | |
Independent trustees' compensation | 1,899 | |
Registration fees | 32,317 | |
Audit | 96,700 | |
Legal | 1,223 | |
Miscellaneous | 4,612 | |
Total expenses before reductions | 4,366,784 | |
Expense reductions | (41,464) | 4,325,320 |
Net investment income (loss) | | 5,506,157 |
Realized and Unrealized Gain (Loss) | | |
Net realized gain (loss) on: | | |
Investment securities: | | |
Unaffiliated issuers | (405,353) | |
Other affiliated issuers | 512,725 | |
Foreign currency transactions | 13,081 | |
Total net realized gain (loss) | | 120,453 |
Change in net unrealized appreciation (depreciation) on: Investment securities | 10,096,284 | |
Assets and liabilities in foreign currencies | (2,381) | |
Total change in net unrealized appreciation (depreciation) | | 10,093,903 |
Net gain (loss) | | 10,214,356 |
Net increase (decrease) in net assets resulting from operations | | $ 15,720,513 |
See accompanying notes which are an integral part of the financial statements.
Annual Report
Fidelity Nordic Fund
Financial Statements - continued
Statement of Changes in Net Assets
| Year ended
October 31,
2015 | Year ended
October 31,
2014 |
Increase (Decrease) in Net Assets | | |
Operations | | |
Net investment income (loss) | $ 5,506,157 | $ 8,686,306 |
Net realized gain (loss) | 120,453 | 97,749,419 |
Change in net unrealized appreciation (depreciation) | 10,093,903 | (88,825,375) |
Net increase (decrease) in net assets resulting from operations | 15,720,513 | 17,610,350 |
Distributions to shareholders from net investment income | - | (8,604,710) |
Distributions to shareholders from net realized gain | - | (18,652,188) |
Total distributions | - | (27,256,898) |
Share transactions | | |
Proceeds from sales of shares | 67,283,706 | 233,249,793 |
Reinvestment of distributions | - | 26,169,902 |
Cost of shares redeemed | (164,909,842) | (201,622,510) |
Net increase (decrease) in net assets resulting from share transactions | (97,626,136) | 57,797,185 |
Redemption fees | 50,450 | 284,341 |
Total increase (decrease) in net assets | (81,855,173) | 48,434,978 |
| | |
Net Assets | | |
Beginning of period | 487,581,648 | 439,146,670 |
End of period (including undistributed net investment income of $5,079,232 and 0, respectively) | $ 405,726,475 | $ 487,581,648 |
Other Information Shares | | |
Sold | 1,529,284 | 5,097,695 |
Issued in reinvestment of distributions | - | 618,820 |
Redeemed | (3,755,142) | (4,474,614) |
Net increase (decrease) | (2,225,858) | 1,241,901 |
Financial Highlights
Years ended October 31, | 2015 | 2014 | 2013 | 2012 | 2011 |
Selected Per-Share Data | | | | | |
Net asset value, beginning of period | $ 43.36 | $ 43.91 | $ 30.60 | $ 29.60 | $ 32.27 |
Income from Investment Operations | | | | | |
Net investment income (loss) B | .56 | .71 | .90 | .70E | .47 |
Net realized and unrealized gain (loss) | 1.06 | 1.35 | 13.04 | .91 | (2.86) |
Total from investment operations | 1.62 | 2.06 | 13.94 | 1.61 | (2.39) |
Distributions from net investment income | - | (.83) | (.63) | (.61) | (.29) |
Distributions from net realized gain | - | (1.80) | - | - | - |
Total distributions | - | (2.63) | (.63) | (.61) | (.29) |
Redemption fees added to paid in capitalB | .01 | .02 | -G | -G | .01 |
Net asset value, end of period | $ 44.99 | $ 43.36 | $ 43.91 | $ 30.60 | $ 29.60 |
Total ReturnA | 3.76% | 4.88% | 46.42% | 5.69% | (7.49)% |
Ratios to Average Net AssetsC, F | | | | | |
Expenses before reductions | 1.00% | .99% | 1.04% | 1.08% | 1.05% |
Expenses net of fee waivers, if any | 1.00% | .99% | 1.04% | 1.08% | 1.05% |
Expenses net of all reductions | .99% | .98% | 1.02% | 1.04% | .99% |
Net investment income (loss) | 1.26% | 1.56% | 2.50% | 2.40%E | 1.40% |
Supplemental Data | | | | | |
Net assets, end of period (000 omitted) | $ 405,726 | $ 487,582 | $ 439,147 | $ 296,951 | $ 360,900 |
Portfolio turnover rateD | 80% | 103% | 61% | 193% | 265% |
A Total returns would have been lower if certain expenses had not been reduced during the applicable periods shown. B Calculated based on average shares outstanding during the period. C Fees and expenses of any underlying Fidelity Central Funds are not included in the Fund's expense ratio. The Fund indirectly bears its proportionate share of the expenses of any underlying Fidelity Central Funds. D Amount does not include the portfolio activity of any underlying Fidelity Central Funds. E Investment income per share reflects a large, non-recurring dividend which amounted to $.17 per share. Excluding this non-recurring dividend, the ratio of net investment income (loss) to average net assets would have been 1.83%. F Expense ratios reflect operating expenses of the Fund. Expenses before reductions do not reflect amounts reimbursed by the investment adviser or reductions from brokerage service arrangements or reductions from other expense offset arrangements and do not represent the amount paid by the Fund during periods when reimbursements or reductions occur. Expenses net of fee waivers reflect expenses after reimbursement by the investment adviser but prior to reductions from brokerage service arrangements or other expense offset arrangements. Expenses net of all reductions represent the net expenses paid by the Fund. G Amount represents less than $.005 per share. |
See accompanying notes which are an integral part of the financial statements.
Annual Report
For the period ended October 31, 2015
1. Organization.
Fidelity Nordic Fund (the Fund) is a fund of Fidelity Investment Trust (the Trust) and is authorized to issue an unlimited number of shares. Share transactions on the Statement of Changes in Net Assets may contain exchanges between funds. The Trust is registered under the Investment Company Act of 1940, as amended (the 1940 Act), as an open-end management investment company organized as a Massachusetts business trust.
2. Investments in Fidelity Central Funds.
The Fund invests in Fidelity Central Funds, which are open-end investment companies generally available only to other investment companies and accounts managed by the investment adviser and its affiliates. The Fund's Schedule of Investments lists each of the Fidelity Central Funds held as of period end, if any, as an investment of the Fund, but does not include the underlying holdings of each Fidelity Central Fund. As an Investing Fund, the Fund indirectly bears its proportionate share of the expenses of the underlying Fidelity Central Funds.
The Money Market Central Funds seek preservation of capital and current income and are managed by Fidelity Investments Money Management, Inc. (FIMM), an affiliate of the investment adviser. Annualized expenses of the Money Market Central Funds as of their most recent shareholder report date are less than .005%.
A complete unaudited list of holdings for each Fidelity Central Fund is available upon request or at the Securities and Exchange Commission (the SEC) website at www.sec.gov. In addition, the financial statements of the Fidelity Central Funds, which are not covered by the Fund's Report of Independent Registered Public Accounting Firm, are available on the SEC website or upon request.
3. Significant Accounting Policies.
The financial statements have been prepared in conformity with accounting principles generally accepted in the United States of America (GAAP), which require management to make certain estimates and assumptions at the date of the financial statements. Actual results could differ from those estimates. Subsequent events, if any, through the date that the financial statements were issued have been evaluated in the preparation of the financial statements. The following summarizes the significant accounting policies of the Fund:
Investment Valuation. Investments are valued as of 4:00 p.m. Eastern time on the last calendar day of the period. The Board of Trustees (the Board) has delegated the day to day responsibility for the valuation of the Fund's investments to the Fidelity Management & Research Company (FMR) Fair Value Committee (the Committee). In accordance with valuation policies and procedures approved by the Board, the Fund attempts to obtain prices from one or more third party pricing vendors or brokers to value its investments. When current market prices, quotations or currency exchange rates are not readily available or reliable, investments will be fair valued in good faith by the Committee, in accordance with procedures adopted by the Board. Factors used in determining fair value vary by investment type and may include market or investment specific events. The frequency with which these procedures are used cannot be predicted and they may be utilized to a significant extent. The Committee oversees the Fund's valuation policies and procedures and reports to the Board on the Committee's activities and fair value determinations. The Board monitors the appropriateness of the procedures used in valuing the Fund's investments and ratifies the fair value determinations of the Committee.
The Fund categorizes the inputs to valuation techniques used to value its investments into a disclosure hierarchy consisting of three levels as shown below:
Level 1 - quoted prices in active markets for identical investments
Level 2 - other significant observable inputs (including quoted prices for similar investments, interest rates, prepayment speeds, etc.)
Level 3 - unobservable inputs (including the Fund's own assumptions based on the best information available)
Valuation techniques used to value the Fund's investments by major category are as follows:
Equity securities, including restricted securities, for which market quotations are readily available, are valued at the last reported sale price or official closing price as reported by a third party pricing vendor on the primary market or exchange on which they are traded and are categorized as Level 1 in the hierarchy. In the event there were no sales during the day or closing prices are not available, securities are valued at the last quoted bid price or may be valued using the last available price and are generally categorized as Level 2 in the hierarchy. For foreign equity securities, when market or security specific events arise, comparisons to the valuation of American Depositary Receipts (ADRs), futures contracts, Exchange-Traded Funds (ETFs) and certain indexes as well as quoted prices for similar securities may be used and would be categorized as Level 2 in the hierarchy. Utilizing these techniques may result in transfers between Level 1 and Level 2. For equity securities, including restricted securities, where observable inputs are limited, assumptions about market activity and risk are used and these securities may be categorized as Level 3 in the hierarchy.
Investments in open-end mutual funds, including the Fidelity Central Funds, are valued at their closing net asset value (NAV) each business day and are categorized as Level 1 in the hierarchy.
Annual Report
Notes to Financial Statements - continued
3. Significant Accounting Policies - continued
Investment Valuation - continued
Changes in valuation techniques may result in transfers in or out of an assigned level within the disclosure hierarchy. The aggregate value of investments by input level as of October 31, 2015, including information on transfers between Levels 1 and 2, is included at the end of the Fund's Schedule of Investments.
Foreign Currency. The Fund may use foreign currency contracts to facilitate transactions in foreign-denominated securities. Gains and losses from these transactions may arise from changes in the value of the foreign currency or if the counterparties do not perform under the contracts' terms.
Foreign-denominated assets, including investment securities, and liabilities are translated into U.S. dollars at the exchange rates at period end. Purchases and sales of investment securities, income and dividends received and expenses denominated in foreign currencies are translated into U.S. dollars at the exchange rate in effect on the transaction date.
The effects of exchange rate fluctuations on investments are included with the net realized and unrealized gain (loss) on investment securities. Other foreign currency transactions resulting in realized and unrealized gain (loss) are disclosed separately.
Investment Transactions and Income. For financial reporting purposes, the Fund's investment holdings and NAV include trades executed through the end of the last business day of the period. The NAV per share for processing shareholder transactions is calculated as of the close of business of the New York Stock Exchange (NYSE), normally 4:00 p.m. Eastern time and includes trades executed through the end of the prior business day. Gains and losses on securities sold are determined on the basis of identified cost. Dividend income is recorded on the ex-dividend date, except for certain dividends from foreign securities where the ex-dividend date may have passed, which are recorded as soon as the Fund is informed of the ex-dividend date. Non-cash dividends included in dividend income, if any, are recorded at the fair market value of the securities received. Income and capital gain distributions from Fidelity Central Funds, if any, are recorded on the ex-dividend date. Investment income is recorded net of foreign taxes withheld where recovery of such taxes is uncertain.
Expenses. Expenses directly attributable to a fund are charged to that fund. Expenses attributable to more than one fund are allocated among the respective funds on the basis of relative net assets or other appropriate methods. Expense estimates are accrued in the period to which they relate and adjustments are made when actual amounts are known.
Income Tax Information and Distributions to Shareholders. Each year, the Fund intends to qualify as a regulated investment company under Subchapter M of the Internal Revenue Code, including distributing substantially all of its taxable income and realized gains. As a result, no provision for U.S. Federal income taxes is required. As of October 31, 2015, the Fund did not have any unrecognized tax benefits in the financial statements; nor is the Fund aware of any tax positions for which it is reasonably possible that the total amounts of unrecognized tax benefits will significantly change in the next twelve months. The Fund files a U.S. federal tax return, in addition to state and local tax returns as required. The Fund's federal income tax returns are subject to examination by the Internal Revenue Service (IRS) for a period of three fiscal years after they are filed. State and local tax returns may be subject to examination for an additional fiscal year depending on the jurisdiction. Foreign taxes are provided for based on the Fund's understanding of the tax rules and rates that exist in the foreign markets in which it invests.
Distributions are declared and recorded on the ex-dividend date. Income and capital gain distributions are determined in accordance with income tax regulations, which may differ from GAAP. In addition, the Fund claimed a portion of the payment made to redeeming shareholders as a distribution for income tax purposes.
Capital accounts within the financial statements are adjusted for permanent book-tax differences. These adjustments have no impact on net assets or the results of operations. Capital accounts are not adjusted for temporary book-tax differences which will reverse in a subsequent period.
Book-tax differences are primarily due to foreign currency transactions, passive foreign investment companies (PFIC), deferred trustees compensation, capital loss carryforwards and losses deferred due to wash sales.
The federal tax cost of investment securities and unrealized appreciation (depreciation) as of period end were as follows:
Gross unrealized appreciation | $ 41,082,807 |
Gross unrealized depreciation | (29,666,176) |
Net unrealized appreciation (depreciation) on securities | $ 11,416,631 |
Tax Cost | $ 404,699,718 |
Annual Report
3. Significant Accounting Policies - continued
Income Tax Information and Distributions to Shareholders - continued
The tax-based components of distributable earnings as of period end were as follows:
Undistributed ordinary income | $ 5,543,816 |
Capital loss carryforward | $ (24,374,515) |
Net unrealized appreciation (depreciation) on securities and other investments | $ 11,413,162 |
Capital loss carryforwards are only available to offset future capital gains of the Fund to the extent provided by regulations and may be limited. Under the Regulated Investment Company Modernization Act of 2010 (the Act), the Fund is permitted to carry forward capital losses incurred in taxable years beginning after December 22, 2010 for an unlimited period and such capital losses are required to be used prior to any losses that expire. The capital loss carryforward information presented below, including any applicable limitation, is estimated as of fiscal period end and is subject to adjustment.
Fiscal year of expiration | |
2017 | $ (24,086,581) |
No expiration | |
Short-term | (287,934) |
Total capital loss carryforward | $ (24,374,515) |
The tax character of distributions paid was as follows:
| October 31, 2015 | October 31, 2014 |
Ordinary Income | $ - | $ 27,256,898 |
Short-Term Trading (Redemption) Fees. Shares held by investors in the Fund less than 90 days may have been subject to a redemption fee equal to 1.50% of the NAV of shares redeemed. All redemption fees, which reduce the proceeds of the shareholder redemption, are retained by the Fund and accounted for as an addition to paid in capital.
4. Purchases and Sales of Investments.
Purchases and sales of securities, other than short-term securities, aggregated $339,704,041 and $431,172,628, respectively.
5. Fees and Other Transactions with Affiliates.
Management Fee. Fidelity Management & Research Company (the investment adviser) and its affiliates provide the Fund with investment management related services for which the Fund pays a monthly management fee. The management fee is the sum of an individual fund fee rate that is based on an annual rate of .45% of the Fund's average net assets and an annualized group fee rate that averaged .25% during the period. The group fee rate is based upon the average net assets of all the mutual funds advised by the investment adviser, including any mutual funds previously advised by the investment adviser that are currently advised by Fidelity SelectCo, LLC, an affiliate of the investment adviser. The group fee rate decreases as assets under management increase and increases as assets under management decrease. For the reporting period, the total annual management fee rate was .70% of the Fund's average net assets.
Transfer Agent Fees. Fidelity Investments Institutional Operations Company, Inc. (FIIOC), an affiliate of the investment adviser, is the Fund's transfer, dividend disbursing and shareholder servicing agent. FIIOC receives account fees and asset-based fees that vary according to account size and type of account. FIIOC pays for typesetting, printing and mailing of shareholder reports, except proxy statements. For the period, the transfer agent fees were equivalent to an annual rate of .20% of average net assets.
Accounting and Security Lending Fees. Fidelity Service Company, Inc. (FSC), an affiliate of the investment adviser, maintains the Fund's accounting records. The accounting fee is based on the level of average net assets for each month. Under a separate contract, FSC administers the security lending program. The security lending fee is based on the number and duration of lending transactions.
Other. During the period, the investment adviser reimbursed the Fund for certain losses in the amount of $2,789.
Annual Report
Notes to Financial Statements - continued
6. Committed Line of Credit.
The Fund participates with other funds managed by the investment adviser or an affiliate in a $4.25 billion credit facility (the "line of credit") to be utilized for temporary or emergency purposes to fund shareholder redemptions or for other short-term liquidity purposes. The Fund has agreed to pay commitment fees on its pro-rata portion of the line of credit, which amounted to $642 and is reflected in Miscellaneous expenses on the Statement of Operations. During the period, the Fund did not borrow on this line of credit.
7. Security Lending.
The Fund lends portfolio securities through a lending agent from time to time in order to earn additional income. For equity securities, a lending agent is used and may loan securities to certain qualified borrowers, including Fidelity Capital Markets (FCM), a broker-dealer affiliated with the Fund. On the settlement date of the loan, the Fund receives collateral (in the form of U.S. Treasury obligations, letters of credit and/or cash) against the loaned securities and maintains collateral in an amount not less than 100% of the market value of the loaned securities during the period of the loan. The market value of the loaned securities is determined at the close of business of the Fund and any additional required collateral is delivered to the Fund on the next business day. The Fund or borrower may terminate the loan at any time, and if the borrower defaults on its obligation to return the securities loaned because of insolvency or other reasons, the Fund may apply collateral received from the borrower against the obligation. The Fund may experience delays and costs in recovering the securities loaned. Any cash collateral received is invested in the Fidelity Securities Lending Cash Central Fund. The value of loaned securities and cash collateral at period end are disclosed on the Fund's Statement of Assets and Liabilities. The value of securities loaned to FCM at period end was $6,560. Security lending income represents the income earned on investing cash collateral, less rebates paid to borrowers and any lending agent fees associated with the loan, plus any premium payments received for lending certain types of securities. Security lending income is presented in the Statement of Operations as a component of income from Fidelity Central Funds, and includes $2,413 from securities loaned to FCM.
8. Expense Reductions.
Commissions paid to certain brokers with whom the investment adviser, or its affiliates, places trades on behalf of the Fund include an amount in addition to trade execution, which may be rebated back to the Fund to offset certain expenses. This amount totaled $26,766 for the period.
In addition, during the period the investment adviser reimbursed and/or waived a portion of operating expenses in the amount of $14,698.
9. Other.
The Fund's organizational documents provide former and current trustees and officers with a limited indemnification against liabilities arising in connection with the performance of their duties to the Fund. In the normal course of business, the Fund may also enter into contracts that provide general indemnifications. The Fund's maximum exposure under these arrangements is unknown as this would be dependent on future claims that may be made against the Fund. The risk of material loss from such claims is considered remote.
Annual Report
Fidelity Pacific Basin Fund
Average annual total return reflects the change in the value of an investment, assuming reinvestment of the fund's distributions from dividend income and capital gains (the profits earned upon the sale of securities that have grown in value, if any) and assuming a constant rate of performance each year. The $10,000 table and the fund's returns do not reflect the deduction of taxes that a shareholder would pay on fund distributions or the redemption of fund shares. During periods of reimbursement by Fidelity, a fund's total return will be greater than it would be had the reimbursement not occurred. How a fund did yesterday is no guarantee of how it will do tomorrow.
Average Annual Total Returns
Periods ended October 31, 2015 | Past 1
year | Past 5
years | Past 10
years |
Fidelity Pacific Basin Fund | -0.29% | 7.28% | 7.73% |
$10,000 Over 10 Years
Let's say hypothetically that $10,000 was invested in Fidelity Pacific Basin Fund on October 31, 2005. The chart shows how the value of your investment would have changed, and also shows how the MSCI AC (All Country) Pacific Index performed over the same period.
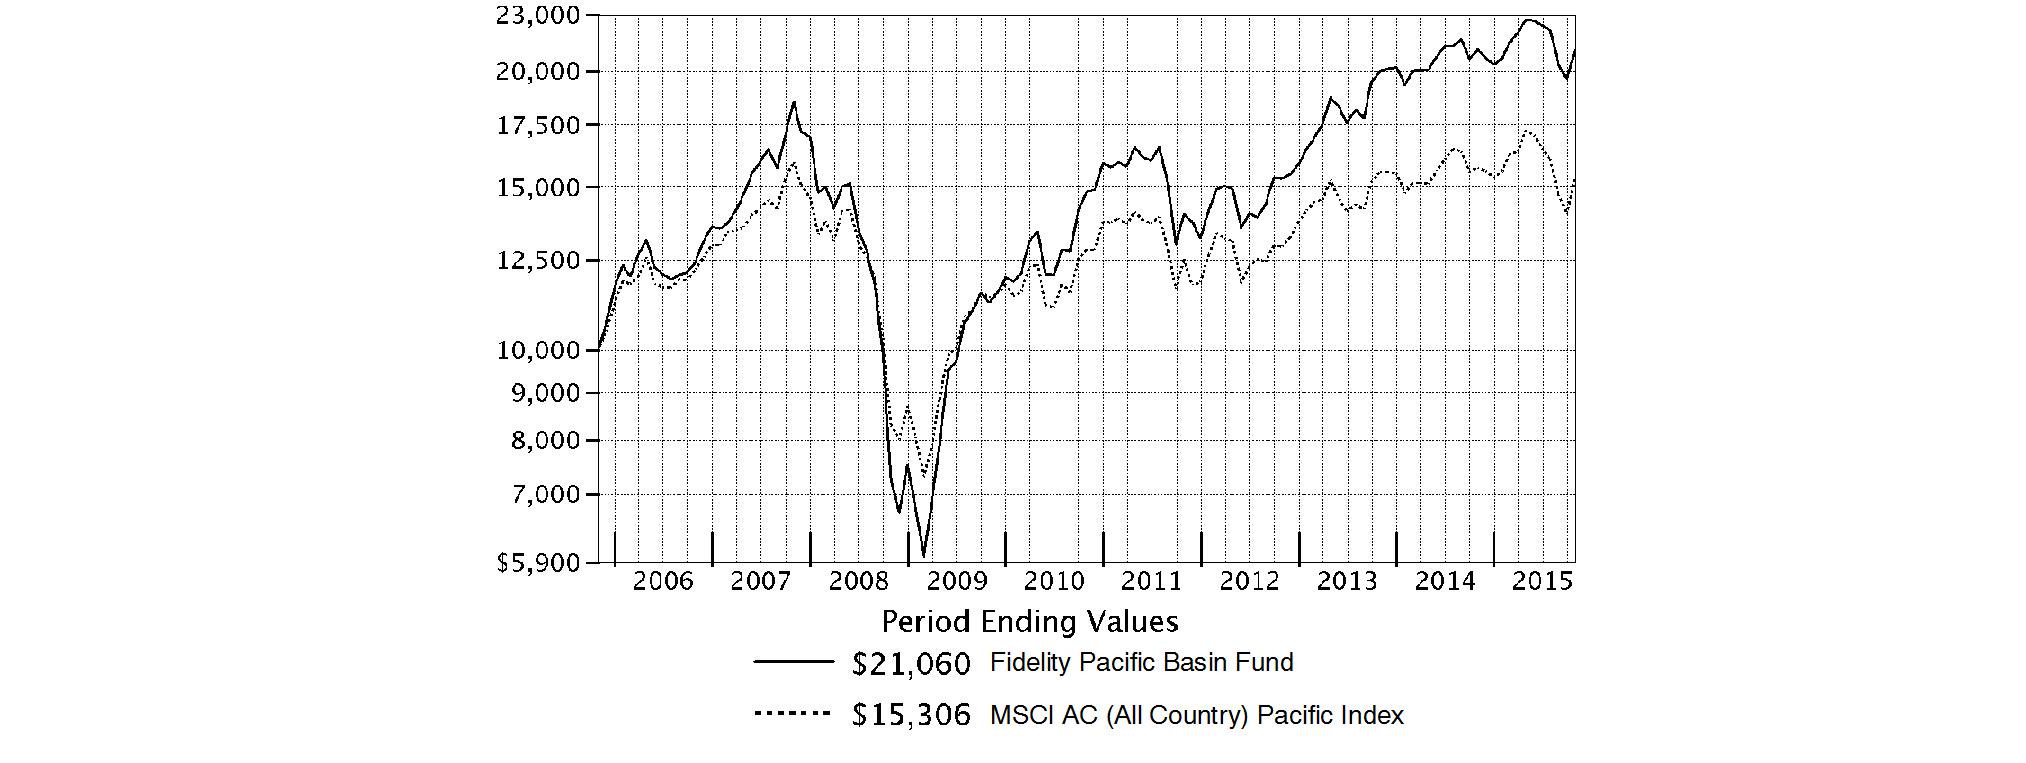
Annual Report
Fidelity Pacific Basin Fund
Market Recap: International equities suffered a moderate setback for the 12 months ending October 31, 2015, held back by a collapse in commodities prices that hurt resources-related sectors and geographies. The MSCI ACWI (All Country World Index) ex USA Index returned -4.55% for the period, affected also by concerns about global economic growth. Commodity producers remained under pressure for much of the past year, largely related to economic deceleration in China (-1%), the world's second-largest economy and a leading consumer of raw materials. This effect was exacerbated by U.S. dollar strength relative to global currencies, which weighed on commodities priced in dollars and acutely impacted equity returns within regions most exposed to resources prices. The emerging-markets group, for example, returned about -15% this period. Canada, a significant energy producer, returned roughly -17%. Net energy consumer Japan (+9%) was the best-performing region by far. Only about a quarter of the nearly 50 index countries managed a gain this period: Ireland (+19%) - the EU's fastest-growing economy - and Israel (+17%) proved top performers; Greece (-56%) and Brazil (-46%), among the worst. As for sectors, energy (-25%) and materials (-16%) declined sharply, whereas the two consumer sectors each gained about 6%.
Comments from Portfolio Manager John Dance: For the year, the fund finished just below break-even but considerably outpaced the -2.72% return of its benchmark, the MSCI AC (All Country) Pacific Index. Versus the benchmark, the fund's performance was bolstered in roughly equal measures by stock selection and sector/industry positioning. Geographically, our picks in Japan, India and Australia were noteworthy positives. The fund's top relative contributor was India-based Britannia Industries, a purveyor of cookies and related food products. Our non-index position in this stock - which almost doubled during the period - was a play on the growth of India's middle class and its increasing disposable income. Also lifting our relative results were China-based pharmaceutical firm Jiangsu Hengrui Medical, which I bought in the first half of the period; Medy-Tox, a South Korea-based maker of biopharmaceutical products; and not owning metals and energy miner BHP Billiton, an index component hurt by slowing economic activity in China and weakening demand for iron ore. Conversely, a downward fair-value adjustment of 1.37 percentage points detracted from performance versus the benchmark. Among individual holdings, South Korea's Samsung Electronics was the largest relative detractor, mostly because of unfortunate timing on my part. Israel-based Sarine Technologies - a manufacturer of processing equipment for diamonds and gemstones - also detracted.
The views expressed above reflect those of the portfolio manager(s) only through the end of the period as stated on the cover of this report and do not necessarily represent the views of Fidelity or any other person in the Fidelity organization. Any such views are subject to change at any time based upon market or other conditions and Fidelity disclaims any responsibility to update such views. These views may not be relied on as investment advice and, because investment decisions for a Fidelity fund are based on numerous factors, may not be relied on as an indication of trading intent on behalf of any Fidelity fund.
Annual Report
Fidelity Pacific Basin Fund
As a shareholder of the Fund, you incur two types of costs: (1) transaction costs, including redemption fees and (2) ongoing costs, including management fees and other Fund expenses. This Example is intended to help you understand your ongoing costs (in dollars) of investing in the Fund and to compare these costs with the ongoing costs of investing in other mutual funds.
The Example is based on an investment of $1,000 invested at the beginning of the period and held for the entire period (May 1, 2015 to October 31, 2015).
Actual Expenses
The first line of the accompanying table provides information about actual account values and actual expenses. You may use the information in this line, together with the amount you invested, to estimate the expenses that you paid over the period. Simply divide your account value by $1,000.00 (for example, an $8,600 account value divided by $1,000.00 = 8.6), then multiply the result by the number in the first line under the heading entitled "Expenses Paid During Period" to estimate the expenses you paid on your account during this period. A small balance maintenance fee of $12.00 that is charged once a year may apply for certain accounts with a value of less than $2,000. This fee is not included in the table below. If it was, the estimate of expenses you paid during the period would be higher, and your ending account value lower, by this amount. In addition, the Fund, as a shareholder in the underlying Fidelity Central Funds, will indirectly bear its pro-rata share of the fees and expenses incurred by the underlying Fidelity Central Funds. These fees and expenses are not included in the Fund's annualized expense ratio used to calculate the expense estimate in the table below.
Hypothetical Example for Comparison Purposes
The second line of the accompanying table provides information about hypothetical account values and hypothetical expenses based on the Fund's actual expense ratio and an assumed rate of return of 5% per year before expenses, which is not the Fund's actual return. The hypothetical account values and expenses may not be used to estimate the actual ending account balance or expenses you paid for the period. You may use this information to compare the ongoing costs of investing in the Fund and other funds. To do so, compare this 5% hypothetical example with the 5% hypothetical examples that appear in the shareholder reports of the other funds. A small balance maintenance fee of $12.00 that is charged once a year may apply for certain accounts with a value of less than $2,000. This fee is not included in the table below. If it was, the estimate of expenses you paid during the period would be higher, and your ending account value lower, by this amount. In addition, the Fund, as a shareholder in the underlying Fidelity Central Funds, will indirectly bear its pro-rata share of the fees and expenses incurred by the underlying Fidelity Central Funds. These fees and expenses are not included in the Fund's annualized expense ratio used to calculate the expense estimate in the table below.
Please note that the expenses shown in the table are meant to highlight your ongoing costs only and do not reflect any transaction costs. Therefore, the second line of the table is useful in comparing ongoing costs only, and will not help you determine the relative total costs of owning different funds. In addition, if these transactional costs were included, your costs would have been higher.
| Annualized
Expense RatioB | Beginning
Account Value
May 1, 2015 | Ending
Account Value
October 31, 2015 | Expenses Paid
During PeriodC
May 1, 2015
to October 31, 2015 |
Actual | 1.17% | $ 1,000.00 | $ 926.90 | $ 5.68 |
HypotheticalA | | $ 1,000.00 | $ 1,019.31 | $ 5.96 |
A 5% return per year before expenses
B Annualized expense ratio reflects expenses net of applicable fee waivers.
C Expenses are equal to the Fund's annualized expense ratio, multiplied by the average account value over the period, multiplied by 184/365 (to reflect the one-half year period).
Annual Report
Fidelity Pacific Basin Fund
Investment Changes (Unaudited)
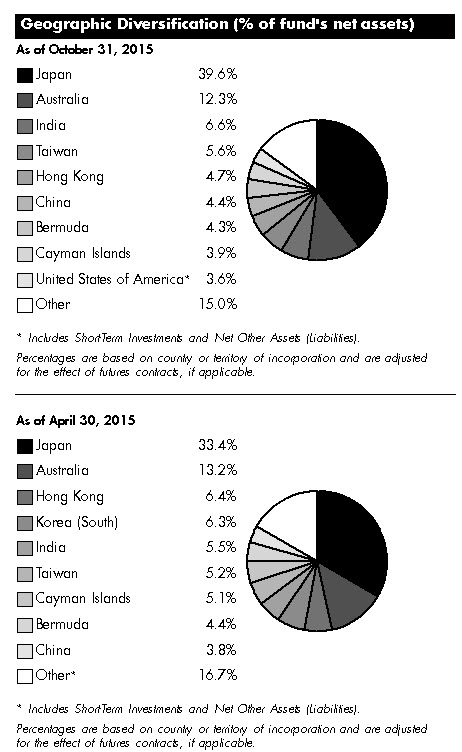
Asset Allocation as of October 31, 2015 |
| % of fund's
net assets | % of fund's net assets
6 months ago |
Stocks | 98.8 | 97.4 |
Short-Term Investments and Net Other Assets (Liabilities) | 1.2 | 2.6 |
Top Ten Stocks as of October 31, 2015 |
| % of fund's
net assets | % of fund's net assets
6 months ago |
Taiwan Semiconductor Manufacturing Co. Ltd. (Taiwan, Semiconductors & Semiconductor Equipment) | 2.6 | 2.5 |
Naspers Ltd. Class N (South Africa, Media) | 2.2 | 1.9 |
AIA Group Ltd. (Hong Kong, Insurance) | 2.1 | 1.8 |
Commonwealth Bank of Australia (Australia, Banks) | 2.0 | 2.2 |
Astellas Pharma, Inc. (Japan, Pharmaceuticals) | 1.9 | 1.6 |
Cheung Kong Infrastructure Holdings Ltd. (Bermuda, Electric Utilities) | 1.7 | 1.4 |
Fuji Heavy Industries Ltd. (Japan, Automobiles) | 1.6 | 1.2 |
SoftBank Corp. (Japan, Wireless Telecommunication Services) | 1.6 | 1.5 |
Japan Tobacco, Inc. (Japan, Tobacco) | 1.5 | 1.3 |
KDDI Corp. (Japan, Wireless Telecommunication Services) | 1.4 | 1.2 |
| 18.6 | |
Market Sectors as of October 31, 2015 |
| % of fund's
net assets | % of fund's net assets
6 months ago |
Financials | 22.9 | 23.5 |
Consumer Discretionary | 17.5 | 18.3 |
Health Care | 15.7 | 12.8 |
Consumer Staples | 11.7 | 9.1 |
Industrials | 9.4 | 9.1 |
Information Technology | 9.0 | 12.1 |
Telecommunication Services | 4.3 | 3.8 |
Materials | 3.9 | 4.7 |
Utilities | 2.4 | 2.2 |
Energy | 2.0 | 1.8 |
Annual Report
Fidelity Pacific Basin Fund
Investments October 31, 2015
Showing Percentage of Net Assets
Common Stocks - 98.8% |
| Shares | | Value |
Australia - 12.3% |
1-Page Ltd. (a)(d) | 724,045 | | $ 2,435,668 |
Amcor Ltd. | 732,177 | | 7,071,959 |
Ansell Ltd. | 303,164 | | 4,314,017 |
ARB Corp. Ltd. | 289,695 | | 3,036,522 |
Asaleo Care Ltd. | 2,645,270 | | 3,301,061 |
Australia & New Zealand Banking Group Ltd. | 482,778 | | 9,337,074 |
Commonwealth Bank of Australia | 240,378 | | 13,052,042 |
CSL Ltd. | 132,081 | | 8,779,465 |
Invocare Ltd. (d) | 319,066 | | 2,511,611 |
Magellan Financial Group Ltd. | 251,802 | | 4,010,138 |
realestate.com.au Ltd. | 123,597 | | 4,200,551 |
Sydney Airport unit | 1,171,376 | | 5,353,315 |
Transurban Group unit | 961,847 | | 7,127,331 |
Woodside Petroleum Ltd. | 294,064 | | 6,167,393 |
TOTAL AUSTRALIA | | 80,698,147 |
Bermuda - 4.3% |
Brilliance China Automotive Holdings Ltd. | 2,248,000 | | 3,117,175 |
Cheung Kong Infrastructure Holdings Ltd. | 1,211,000 | | 11,234,420 |
Hongkong Land Holdings Ltd. | 982,000 | | 7,363,226 |
PAX Global Technology Ltd. | 4,667,000 | | 6,102,856 |
TOTAL BERMUDA | | 27,817,677 |
Cayman Islands - 3.9% |
Alibaba Group Holding Ltd. sponsored ADR (a) | 55,600 | | 4,660,953 |
China High Precision Automation Group Ltd. (a) | 1,875,000 | | 0 |
China Metal Recycling (Holdings) Ltd. (a) | 2,572,200 | | 0 |
ENN Energy Holdings Ltd. | 778,000 | | 4,456,885 |
International Housewares Retail Co. Ltd. | 17,378,000 | | 3,627,187 |
Sands China Ltd. | 911,600 | | 3,282,631 |
Sino Biopharmaceutical Ltd. | 5,512,000 | | 6,849,764 |
Vipshop Holdings Ltd. ADR (a)(d) | 139,500 | | 2,862,540 |
TOTAL CAYMAN ISLANDS | | 25,739,960 |
China - 4.4% |
Industrial & Commercial Bank of China Ltd. (H Shares) | 14,414,000 | | 9,142,884 |
Jiangsu Hengrui Medicine Co. Ltd. | 882,081 | | 7,318,602 |
Kweichow Moutai Co. Ltd. | 261,750 | | 8,837,671 |
Weifu High-Technology Co. Ltd. (B Shares) | 1,382,213 | | 3,524,065 |
TOTAL CHINA | | 28,823,222 |
Hong Kong - 4.7% |
AIA Group Ltd. | 2,358,600 | | 13,829,253 |
China Resources Beer Holdings Co. Ltd. | 1,528,000 | | 2,885,124 |
Lenovo Group Ltd. | 3,310,000 | | 3,075,443 |
|
| Shares | | Value |
Magnificent Estates Ltd. | 90,048,000 | | $ 2,550,899 |
Techtronic Industries Co. Ltd. | 2,202,000 | | 8,049,802 |
TOTAL HONG KONG | | 30,390,521 |
India - 6.6% |
Asian Paints India Ltd. | 433,057 | | 5,488,157 |
Bharti Infratel Ltd. | 1,443,623 | | 8,574,139 |
Britannia Industries Ltd. | 113,710 | | 5,607,931 |
Housing Development Finance Corp. Ltd. | 229,506 | | 4,396,208 |
Lupin Ltd. | 162,563 | | 4,786,407 |
Page Industries Ltd. | 21,955 | | 4,718,872 |
Petronet LNG Ltd. | 1,866,633 | | 5,532,137 |
Sun Pharmaceutical Industries Ltd. | 295,972 | | 4,021,996 |
TOTAL INDIA | | 43,125,847 |
Indonesia - 3.0% |
PT Bank Central Asia Tbk | 8,610,900 | | 8,089,314 |
PT Bank Rakyat Indonesia Tbk | 8,236,100 | | 6,303,549 |
PT Gudang Garam Tbk | 1,709,800 | | 5,351,948 |
TOTAL INDONESIA | | 19,744,811 |
Israel - 0.5% |
Sarine Technologies Ltd. | 3,174,400 | | 3,528,420 |
Japan - 39.6% |
Arcland Service Co. Ltd. | 128,700 | | 5,135,664 |
Asahi Group Holdings | 186,400 | | 5,749,731 |
Asia Securities Printing Co. Ltd. | 270,900 | | 1,996,664 |
Astellas Pharma, Inc. | 876,300 | | 12,719,039 |
Broadleaf Co. Ltd. | 151,351 | | 1,733,664 |
Calbee, Inc. | 101,100 | | 3,663,033 |
Century Tokyo Leasing Corp. | 91,500 | | 3,103,813 |
Coca-Cola Central Japan Co. Ltd. | 227,400 | | 3,195,965 |
Create SD Holdings Co. Ltd. | 70,600 | | 4,156,958 |
Daito Trust Construction Co. Ltd. | 61,800 | | 6,689,623 |
Dentsu, Inc. | 91,900 | | 5,166,447 |
East Japan Railway Co. | 93,800 | | 8,918,090 |
Fuji Heavy Industries Ltd. | 265,400 | | 10,263,980 |
Hamakyorex Co. Ltd. | 108,800 | | 2,196,842 |
Harmonic Drive Systems, Inc. (d) | 115,100 | | 1,950,248 |
Hoya Corp. | 209,400 | | 8,641,263 |
Japan Exchange Group, Inc. | 222,000 | | 3,572,194 |
Japan Tobacco, Inc. | 290,600 | | 10,058,186 |
KDDI Corp. | 392,100 | | 9,488,167 |
Keyence Corp. | 12,300 | | 6,403,485 |
Miraca Holdings, Inc. | 85,800 | | 3,818,553 |
Misumi Group, Inc. | 300,900 | | 3,918,350 |
Mitsubishi Pencil Co. Ltd. | 107,200 | | 4,799,941 |
Mitsui Fudosan Co. Ltd. | 216,000 | | 5,878,149 |
Nakanishi, Inc. | 138,400 | | 4,718,949 |
NGK Spark Plug Co. Ltd. | 240,700 | | 5,874,291 |
Nihon M&A Center, Inc. | 90,100 | | 3,716,475 |
Nihon Parkerizing Co. Ltd. | 426,800 | | 3,796,500 |
Nitori Holdings Co. Ltd. | 103,700 | | 8,086,415 |
OMRON Corp. | 108,800 | | 3,602,679 |
Common Stocks - continued |
| Shares | | Value |
Japan - continued |
Open House Co. Ltd. | 268,900 | | $ 4,905,363 |
ORIX Corp. | 532,200 | | 7,772,132 |
Pigeon Corp. | 137,600 | | 3,855,398 |
Rakuten, Inc. | 432,400 | | 5,990,120 |
Seven Bank Ltd. | 1,931,900 | | 8,802,810 |
SHIMANO, Inc. | 27,800 | | 4,380,407 |
Shinsei Bank Ltd. | 2,507,000 | | 5,256,611 |
Ship Healthcare Holdings, Inc. | 147,200 | | 3,565,658 |
SK Kaken Co. Ltd. | 51,000 | | 4,967,148 |
SoftBank Corp. | 181,300 | | 10,157,861 |
Sony Financial Holdings, Inc. | 253,700 | | 4,546,961 |
Sosei Group Corp. (d) | 101,800 | | 3,612,875 |
Sundrug Co. Ltd. | 85,500 | | 4,504,096 |
Sysmex Corp. | 99,000 | | 5,658,721 |
The Suruga Bank Ltd. | 223,500 | | 4,400,047 |
Toshiba Plant Systems & Services Corp. | 423,100 | | 4,532,012 |
VT Holdings Co. Ltd. | 572,200 | | 3,538,502 |
Welcia Holdings Co. Ltd. | 105,600 | | 5,204,521 |
TOTAL JAPAN | | 258,664,601 |
Korea (South) - 2.3% |
KEPCO Plant Service & Engineering Co. Ltd. | 73,544 | | 6,698,876 |
LG Household & Health Care Ltd. | 4,670 | | 3,873,363 |
Medy-Tox, Inc. | 10,750 | | 4,584,264 |
TOTAL KOREA (SOUTH) | | 15,156,503 |
Malaysia - 0.4% |
Bursa Malaysia Bhd | 1,145,100 | | 2,259,819 |
Netherlands - 0.5% |
Hangzhou Hikvision Digital Technology Co. Ltd. ELS (BNP Paribas Warrant Program) warrants 11/27/17 (a)(e) | 600,000 | | 3,268,915 |
New Zealand - 2.3% |
EBOS Group Ltd. | 633,901 | | 5,859,209 |
Ryman Healthcare Group Ltd. | 1,695,247 | | 9,057,219 |
TOTAL NEW ZEALAND | | 14,916,428 |
Philippines - 0.6% |
D&L Industries, Inc. | 20,046,200 | | 4,170,124 |
Singapore - 1.9% |
Ezion Holdings Ltd. | 2,670,000 | | 1,329,393 |
Parkway Life REIT | 2,675,000 | | 4,404,701 |
United Overseas Bank Ltd. | 459,700 | | 6,675,206 |
TOTAL SINGAPORE | | 12,409,300 |
South Africa - 2.2% |
Naspers Ltd. Class N | 99,300 | | 14,544,483 |
Taiwan - 5.6% |
Advantech Co. Ltd. | 573,000 | | 4,121,223 |
CTCI Corp. | 1,631,000 | | 2,130,122 |
eMemory Technology, Inc. | 162,000 | | 1,671,646 |
|
| Shares | | Value |
King Slide Works Co. Ltd. | 404,000 | | $ 5,307,439 |
Lung Yen Life Service Co. Ltd. | 1,305,000 | | 2,604,774 |
Merida Industry Co. Ltd. | 674,750 | | 3,959,337 |
Taiwan Semiconductor Manufacturing Co. Ltd. | 4,007,000 | | 16,883,390 |
TOTAL TAIWAN | | 36,677,931 |
Thailand - 0.8% |
Thai Beverage PCL | 11,431,700 | | 5,497,146 |
United Kingdom - 0.5% |
Standard Chartered PLC (Hong Kong) | 282,000 | | 3,099,783 |
United States of America - 2.4% |
China Biologic Products, Inc. (a) | 43,200 | | 4,922,208 |
Cognizant Technology Solutions Corp. Class A (a) | 100,600 | | 6,851,866 |
GI Dynamics, Inc. CDI (a) | 5,561,290 | | 122,401 |
Yum! Brands, Inc. | 51,200 | | 3,630,592 |
TOTAL UNITED STATES OF AMERICA | | 15,527,067 |
TOTAL COMMON STOCKS (Cost $584,667,450) |
646,060,705
|
Money Market Funds - 2.9% |
| | | |
Fidelity Cash Central Fund, 0.18% (b) | 7,590,261 | | 7,590,261 |
Fidelity Securities Lending Cash Central Fund, 0.19% (b)(c) | 11,403,029 | | 11,403,029 |
TOTAL MONEY MARKET FUNDS (Cost $18,993,290) |
18,993,290
|
TOTAL INVESTMENT PORTFOLIO - 101.7% (Cost $603,660,740) | | 665,053,995 |
NET OTHER ASSETS (LIABILITIES) - (1.7)% | | (11,021,735) |
NET ASSETS - 100% | $ 654,032,260 |
Security Type Abbreviations |
ELS | - | Equity-Linked Security |
Legend |
(a) Non-income producing |
(b) Affiliated fund that is generally available only to investment companies and other accounts managed by Fidelity Investments. The rate quoted is the annualized seven-day yield of the fund at period end. A complete unaudited listing of the fund's holdings as of its most recent quarter end is available upon request. In addition, each Fidelity Central Fund's financial statements, which are not covered by the Fund's Report of Independent Registered Public Accounting Firm, are available on the SEC's website or upon request. |
(c) Investment made with cash collateral received from securities on loan. |
(d) Security or a portion of the security is on loan at period end. |
(e) Security exempt from registration under Rule 144A of the Securities Act of 1933. These securities may be resold in transactions exempt from registration, normally to qualified institutional buyers. At the end of the period, the value of these securities amounted to $3,268,915 or 0.5% of net assets. |
Affiliated Central Funds |
Information regarding fiscal year to date income earned by the Fund from investments in Fidelity Central Funds is as follows: |
Fund | Income earned |
Fidelity Cash Central Fund | $ 12,551 |
Fidelity Securities Lending Cash Central Fund | 195,406 |
Total | $ 207,957 |
Other Affiliated Issuers |
An affiliated company is a company in which the Fund has ownership of at least 5% of the voting securities. Fiscal year to date transactions with companies which are or were affiliates are as follows: |
Affiliate | Value,
beginning of
period | Purchases | Sales
Proceeds | Dividend
Income | Value,
end of
period |
GI Dynamics, Inc. CDI | $ 1,385,909 | $ - | $ - | $ - | $ - |
Other Information |
Categorizations in the Schedule of Investments are based on country or territory of incorporation. |
The following is a summary of the inputs used, as of October 31, 2015, involving the Fund's assets and liabilities carried at fair value. The inputs or methodology used for valuing securities may not be an indication of the risk associated with investing in those securities. For more information on valuation inputs, and their aggregation into the levels used in the tables below, please refer to the Investment Valuation section in the accompanying Notes to Financial Statements. |
Valuation Inputs at Reporting Date: |
Description | Total | Level 1 | Level 2 | Level 3 |
Investments in Securities: | | | | |
Equities: | | | | |
Consumer Discretionary | $ 114,656,867 | $ 27,601,726 | $ 87,055,141 | $ - |
Consumer Staples | 75,742,132 | 3,873,363 | 71,868,769 | - |
Energy | 13,028,923 | - | 13,028,923 | - |
Financials | 150,159,815 | - | 150,159,815 | - |
Health Care | 103,350,610 | 24,422,900 | 78,927,710 | - |
Industrials | 62,174,125 | 14,136,437 | 48,037,688 | - |
Information Technology | 57,542,873 | 17,305,688 | 40,237,185 | - |
Materials | 25,493,888 | - | 25,493,888 | - |
Telecommunication Services | 28,220,167 | - | 28,220,167 | - |
Utilities | 15,691,305 | - | 15,691,305 | - |
Money Market Funds | 18,993,290 | 18,993,290 | - | - |
Total Investments in Securities: | $ 665,053,995 | $ 106,333,404 | $ 558,720,591 | $ - |
The following is a summary of transfers between Level 1 and Level 2 for the period ended October 31, 2015. Transfers are assumed to have occurred at the beginning of the period, and are primarily attributable to the valuation techniques used for foreign equity securities, as discussed in the accompanying Notes to Financial Statements: |
Transfers | Total |
Level 1 to Level 2 | $ 0 |
Level 2 to Level 1 | $ 18,614,496 |
See accompanying notes which are an integral part of the financial statements.
Annual Report
Fidelity Pacific Basin Fund
Statement of Assets and Liabilities
| | October 31, 2015 |
| | |
Assets | | |
Investment in securities, at value (including securities loaned of $10,834,103) - See accompanying schedule: Unaffiliated issuers (cost $584,667,450) | $ 646,060,705 | |
Fidelity Central Funds (cost $18,993,290) | 18,993,290 | |
Total Investments (cost $603,660,740) | | $ 665,053,995 |
Foreign currency held at value (cost $674,433) | | 674,434 |
Receivable for investments sold | | 1,337,579 |
Receivable for fund shares sold | | 188,606 |
Dividends receivable | | 1,292,065 |
Distributions receivable from Fidelity Central Funds | | 20,970 |
Prepaid expenses | | 1,977 |
Other receivables | | 29,444 |
Total assets | | 668,599,070 |
| | |
Liabilities | | |
Payable for investments purchased | $ 1,521,782 | |
Payable for fund shares redeemed | 815,979 | |
Accrued management fee | 491,914 | |
Other affiliated payables | 127,929 | |
Other payables and accrued expenses | 206,177 | |
Collateral on securities loaned, at value | 11,403,029 | |
Total liabilities | | 14,566,810 |
| | |
Net Assets | | $ 654,032,260 |
Net Assets consist of: | | |
Paid in capital | | $ 568,802,308 |
Undistributed net investment income | | 7,437,966 |
Accumulated undistributed net realized gain (loss) on investments and foreign currency transactions | | 16,456,122 |
Net unrealized appreciation (depreciation) on investments and assets and liabilities in foreign currencies | | 61,335,864 |
Net Assets, for 24,215,461 shares outstanding | | $ 654,032,260 |
Net Asset Value, offering price and redemption price per share ($654,032,260 ÷ 24,215,461 shares) | | $ 27.01 |
Statement of Operations
| Year ended October 31, 2015 |
| | |
Investment Income | | |
Dividends | | $ 15,804,068 |
Special dividends | | 2,425,068 |
Interest | | 57 |
Income from Fidelity Central Funds | | 207,957 |
Income before foreign taxes withheld | | 18,437,150 |
Less foreign taxes withheld | | (969,920) |
Total income | | 17,467,230 |
| | |
Expenses | | |
Management fee | | |
Basic fee | $ 4,863,077 | |
Performance adjustment | 1,340,612 | |
Transfer agent fees | 1,297,121 | |
Accounting and security lending fees | 343,187 | |
Custodian fees and expenses | 190,461 | |
Independent trustees' compensation | 2,991 | |
Registration fees | 42,289 | |
Audit | 78,355 | |
Legal | 1,944 | |
Miscellaneous | 5,818 | |
Total expenses before reductions | 8,165,855 | |
Expense reductions | (42,269) | 8,123,586 |
Net investment income (loss) | | 9,343,644 |
Realized and Unrealized Gain (Loss) | | |
Net realized gain (loss) on: | | |
Investment securities: | | |
Unaffiliated issuers | 28,312,123 | |
Foreign currency transactions | (276,610) | |
Total net realized gain (loss) | | 28,035,513 |
Change in net unrealized appreciation (depreciation) on: Investment securities (net of decrease in deferred foreign taxes of $524,196) | (45,986,656) | |
Assets and liabilities in foreign currencies | 20,158 | |
Total change in net unrealized appreciation (depreciation) | | (45,966,498) |
Net gain (loss) | | (17,930,985) |
Net increase (decrease) in net assets resulting from operations | | $ (8,587,341) |
See accompanying notes which are an integral part of the financial statements.
Annual Report
Statement of Changes in Net Assets
| Year ended
October 31,
2015 | Year ended
October 31,
2014 |
Increase (Decrease) in Net Assets | | |
Operations | | |
Net investment income (loss) | $ 9,343,644 | $ 7,675,522 |
Net realized gain (loss) | 28,035,513 | 50,734,532 |
Change in net unrealized appreciation (depreciation) | (45,966,498) | (20,718,497) |
Net increase (decrease) in net assets resulting from operations | (8,587,341) | 37,691,557 |
Distributions to shareholders from net investment income | (4,307,962) | (4,153,037) |
Distributions to shareholders from net realized gain | (38,224,213) | (90,299,349) |
Total distributions | (42,532,175) | (94,452,386) |
Share transactions | | |
Proceeds from sales of shares | 132,445,887 | 106,431,054 |
Reinvestment of distributions | 40,866,947 | 90,804,572 |
Cost of shares redeemed | (165,448,385) | (163,049,316) |
Net increase (decrease) in net assets resulting from share transactions | 7,864,449 | 34,186,310 |
Redemption fees | 85,778 | 100,999 |
Total increase (decrease) in net assets | (43,169,289) | (22,473,520) |
| | |
Net Assets | | |
Beginning of period | 697,201,549 | 719,675,069 |
End of period (including undistributed net investment income of $7,437,966 and undistributed net investment income of $3,615,295, respectively) | $ 654,032,260 | $ 697,201,549 |
Other Information Shares | | |
Sold | 4,689,033 | 3,756,614 |
Issued in reinvestment of distributions | 1,545,649 | 3,309,282 |
Redeemed | (6,127,983) | (5,824,547) |
Net increase (decrease) | 106,699 | 1,241,349 |
Financial Highlights
Years ended October 31, | 2015 | 2014 | 2013 | 2012 | 2011 |
Selected Per-Share Data | | | | | |
Net asset value, beginning of period | $ 28.92 | $ 31.47 | $ 24.85 | $ 22.96 | $ 25.11 |
Income from Investment Operations | | | | | |
Net investment income (loss) B | .37E | .31 | .12 | .30 | .21 |
Net realized and unrealized gain (loss) | (.49) | 1.25 | 7.26 | 1.79 | (1.51) |
Total from investment operations | (.12) | 1.56 | 7.38 | 2.09 | (1.30) |
Distributions from net investment income | (.18) | (.18) | (.29) | (.12) | (.20) |
Distributions from net realized gain | (1.61) | (3.93) | (.47) | (.08) | (.66) |
Total distributions | (1.79) | (4.11) | (.76) | (.20) | (.86) |
Redemption fees added to paid in capitalB | -G | -G | -G | -G | .01 |
Net asset value, end of period | $ 27.01 | $ 28.92 | $ 31.47 | $ 24.85 | $ 22.96 |
Total ReturnA | (.29)% | 5.68% | 30.58% | 9.22% | (5.44)% |
Ratios to Average Net AssetsC, F | | | | | |
Expenses before reductions | 1.17% | 1.18% | 1.23% | 1.28% | 1.14% |
Expenses net of fee waivers, if any | 1.17% | 1.18% | 1.22% | 1.28% | 1.13% |
Expenses net of all reductions | 1.17% | 1.18% | 1.21% | 1.26% | 1.10% |
Net investment income (loss) | 1.34%E | 1.09% | .42% | 1.29% | .81% |
Supplemental Data | | | | | |
Net assets, end of period (000 omitted) | $ 654,032 | $ 697,202 | $ 719,675 | $ 581,254 | $ 722,453 |
Portfolio turnover rateD | 36% | 30% | 82% | 26% | 59% |
A Total returns would have been lower if certain expenses had not been reduced during the applicable periods shown. B Calculated based on average shares outstanding during the period. C Fees and expenses of any underlying Fidelity Central Funds are not included in the Fund's expense ratio. The Fund indirectly bears its proportionate share of the expenses of any underlying Fidelity Central Funds. D Amount does not include the portfolio activity of any underlying Fidelity Central Funds. E Investment income per share reflects a large, non-recurring dividend which amounted to $.10 per share. Excluding this non-recurring dividend, the ratio of net investment income (loss) to average net assets would have been .99%. F Expense ratios reflect operating expenses of the Fund. Expenses before reductions do not reflect amounts reimbursed by the investment adviser or reductions from brokerage service arrangements or reductions from other expense offset arrangements and do not represent the amount paid by the Fund during periods when reimbursements or reductions occur. Expenses net of fee waivers reflect expenses after reimbursement by the investment adviser but prior to reductions from brokerage service arrangements or other expense offset arrangements. Expenses net of all reductions represent the net expenses paid by the Fund. G Amount represents less than $.005 per share. |
See accompanying notes which are an integral part of the financial statements.
Annual Report
For the period ended October 31, 2015
1. Organization.
Fidelity Pacific Basin Fund (the Fund) is a fund of Fidelity Investment Trust (the Trust) and is authorized to issue an unlimited number of shares. Share transactions on the Statement of Changes in Net Assets may contain exchanges between funds. The Trust is registered under the Investment Company Act of 1940, as amended (the 1940 Act), as an open-end management investment company organized as a Massachusetts business trust. The Fund's investments in emerging markets can be subject to social, economic, regulatory, and political uncertainties and can be extremely volatile.
2. Investments in Fidelity Central Funds.
The Fund invests in Fidelity Central Funds, which are open-end investment companies generally available only to other investment companies and accounts managed by the investment adviser and its affiliates. The Fund's Schedule of Investments lists each of the Fidelity Central Funds held as of period end, if any, as an investment of the Fund, but does not include the underlying holdings of each Fidelity Central Fund. As an Investing Fund, the Fund indirectly bears its proportionate share of the expenses of the underlying Fidelity Central Funds.
The Money Market Central Funds seek preservation of capital and current income and are managed by Fidelity Investments Money Management, Inc. (FIMM), an affiliate of the investment adviser. Annualized expenses of the Money Market Central Funds as of their most recent shareholder report date are less than .005%.
A complete unaudited list of holdings for each Fidelity Central Fund is available upon request or at the Securities and Exchange Commission (the SEC) website at www.sec.gov. In addition, the financial statements of the Fidelity Central Funds, which are not covered by the Fund's Report of Independent Registered Public Accounting Firm, are available on the SEC website or upon request.
3. Significant Accounting Policies.
The financial statements have been prepared in conformity with accounting principles generally accepted in the United States of America (GAAP), which require management to make certain estimates and assumptions at the date of the financial statements. Actual results could differ from those estimates. Subsequent events, if any, through the date that the financial statements were issued have been evaluated in the preparation of the financial statements. The following summarizes the significant accounting policies of the Fund:
Investment Valuation. Investments are valued as of 4:00 p.m. Eastern time on the last calendar day of the period. The Board of Trustees (the Board) has delegated the day to day responsibility for the valuation of the Fund's investments to the Fidelity Management & Research Company (FMR) Fair Value Committee (the Committee). In accordance with valuation policies and procedures approved by the Board, the Fund attempts to obtain prices from one or more third party pricing vendors or brokers to value its investments. When current market prices, quotations or currency exchange rates are not readily available or reliable, investments will be fair valued in good faith by the Committee, in accordance with procedures adopted by the Board. Factors used in determining fair value vary by investment type and may include market or investment specific events. The frequency with which these procedures are used cannot be predicted and they may be utilized to a significant extent. The Committee oversees the Fund's valuation policies and procedures and reports to the Board on the Committee's activities and fair value determinations. The Board monitors the appropriateness of the procedures used in valuing the Fund's investments and ratifies the fair value determinations of the Committee.
The Fund categorizes the inputs to valuation techniques used to value its investments into a disclosure hierarchy consisting of three levels as shown below:
Level 1 - quoted prices in active markets for identical investments
Level 2 - other significant observable inputs (including quoted prices for similar investments, interest rates, prepayment speeds, etc.)
Level 3 - unobservable inputs (including the Fund's own assumptions based on the best information available)
Valuation techniques used to value the Fund's investments by major category are as follows:
Equity securities, including restricted securities, for which market quotations are readily available, are valued at the last reported sale price or official closing price as reported by a third party pricing vendor on the primary market or exchange on which they are traded and are categorized as Level 1 in the hierarchy. In the event there were no sales during the day or closing prices are not available, securities are valued at the last quoted bid price or may be valued using the last available price and are generally categorized as Level 2 in the hierarchy. For foreign equity securities, when market or security specific events arise, comparisons to the valuation of American Depositary Receipts (ADRs), futures contracts, Exchange-Traded Funds (ETFs) and certain indexes as well as quoted prices for similar securities may be used and would be categorized as Level 2 in the hierarchy. Utilizing these techniques may result in transfers between Level 1 and Level 2. For equity securities, including restricted securities, where observable inputs are limited, assumptions about market activity and risk are used and these securities may be categorized as Level 3 in the hierarchy.
Investments in open-end mutual funds, including the Fidelity Central Funds, are valued at their closing net asset value (NAV) each business day and are categorized as Level 1 in the hierarchy.
Annual Report
3. Significant Accounting Policies - continued
Investment Valuation - continued
Changes in valuation techniques may result in transfers in or out of an assigned level within the disclosure hierarchy. The aggregate value of investments by input level as of October 31, 2015, including information on transfers between Levels 1 and 2 is included at the end of the Fund's Schedule of Investments.
Foreign Currency. The Fund may use foreign currency contracts to facilitate transactions in foreign-denominated securities. Gains and losses from these transactions may arise from changes in the value of the foreign currency or if the counterparties do not perform under the contracts' terms.
Foreign-denominated assets, including investment securities, and liabilities are translated into U.S. dollars at the exchange rates at period end. Purchases and sales of investment securities, income and dividends received and expenses denominated in foreign currencies are translated into U.S. dollars at the exchange rate in effect on the transaction date.
The effects of exchange rate fluctuations on investments are included with the net realized and unrealized gain (loss) on investment securities. Other foreign currency transactions resulting in realized and unrealized gain (loss) are disclosed separately.
Investment Transactions and Income. For financial reporting purposes, the Fund's investment holdings and NAV include trades executed through the end of the last business day of the period. The NAV per share for processing shareholder transactions is calculated as of the close of business of the New York Stock Exchange (NYSE), normally 4:00 p.m. Eastern time and includes trades executed through the end of the prior business day. Gains and losses on securities sold are determined on the basis of identified cost and may include proceeds received from litigation. Dividend income is recorded on the ex-dividend date, except for certain dividends from foreign securities where the ex-dividend date may have passed, which are recorded as soon as the Fund is informed of the ex-dividend date. Non-cash dividends included in dividend income, if any, are recorded at the fair market value of the securities received. Income and capital gain distributions from Fidelity Central Funds, if any, are recorded on the ex-dividend date. Large, non-recurring dividends recognized by the Fund are presented separately on the Statement of Operations as "Special Dividends" and the impact of these dividends is presented in the Financial Highlights. Interest income is accrued as earned and includes coupon interest and amortization of premium and accretion of discount on debt securities as applicable. Investment income is recorded net of foreign taxes withheld where recovery of such taxes is uncertain.
Expenses. Expenses directly attributable to a fund are charged to that fund. Expenses attributable to more than one fund are allocated among the respective funds on the basis of relative net assets or other appropriate methods. Expense estimates are accrued in the period to which they relate and adjustments are made when actual amounts are known.
Income Tax Information and Distributions to Shareholders. Each year, the Fund intends to qualify as a regulated investment company under Subchapter M of the Internal Revenue Code, including distributing substantially all of its taxable income and realized gains. As a result, no provision for U.S. Federal income taxes is required. As of October 31, 2015, the Fund did not have any unrecognized tax benefits in the financial statements; nor is the Fund aware of any tax positions for which it is reasonably possible that the total amounts of unrecognized tax benefits will significantly change in the next twelve months. The Fund files a U.S. federal tax return, in addition to state and local tax returns as required. The Fund's federal income tax returns are subject to examination by the Internal Revenue Service (IRS) for a period of three fiscal years after they are filed. State and local tax returns may be subject to examination for an additional fiscal year depending on the jurisdiction. Foreign taxes are provided for based on the Fund's understanding of the tax rules and rates that exist in the foreign markets in which it invests. The Fund is subject to a tax imposed on capital gains by certain countries in which it invests. An estimated deferred tax liability for net unrealized appreciation on the applicable securities is included in Other payables and accrued expenses on the Statement of Assets & Liabilities.
Distributions are declared and recorded on the ex-dividend date. Income and capital gain distributions are determined in accordance with income tax regulations, which may differ from GAAP. In addition, the Fund claimed a portion of the payment made to redeeming shareholders as a distribution for income tax purposes.
Capital accounts within the financial statements are adjusted for permanent book-tax differences. These adjustments have no impact on net assets or the results of operations. Capital accounts are not adjusted for temporary book-tax differences which will reverse in a subsequent period.
Book-tax differences are primarily due to foreign currency transactions, passive foreign investment companies (PFIC), deferred trustees compensation and losses deferred due to wash sales.
The federal tax cost of investment securities and unrealized appreciation (depreciation) as of period end were as follows:
Gross unrealized appreciation | $ 118,681,238 |
Gross unrealized depreciation | (63,708,001) |
Net unrealized appreciation (depreciation) on securities | $ 54,973,237 |
Tax Cost | $ 610,080,758 |
Annual Report
Notes to Financial Statements - continued
3. Significant Accounting Policies - continued
Income Tax Information and Distributions to Shareholders - continued
The tax-based components of distributable earnings as of period end were as follows:
Undistributed ordinary income | $ 7,439,981 |
Undistributed long-term capital gain | $ 22,876,141 |
Net unrealized appreciation (depreciation) on securities and other investments | $ 54,994,788 |
The tax character of distributions paid was as follows:
| October 31, 2015 | October 31, 2014 |
Ordinary Income | $ 8,734,926 | $ 25,206,814 |
Long-term Capital Gains | 33,797,249 | 69,245,572 |
Total | $ 42,532,175 | $ 94,452,386 |
Short-Term Trading (Redemption) Fees. Shares held by investors in the Fund less than 90 days may have been subject to a redemption fee equal to 1.50% of the NAV of shares redeemed. All redemption fees, which reduce the proceeds of the shareholder redemption, are retained by the Fund and accounted for as an addition to paid in capital.
Restricted Securities. The Fund may invest in securities that are subject to legal or contractual restrictions on resale. These securities generally may be resold in transactions exempt from registration or to the public if the securities are registered. Disposal of these securities may involve time-consuming negotiations and expense, and prompt sale at an acceptable price may be difficult. Information regarding restricted securities is included at the end of the Fund's Schedule of Investments.
4. Purchases and Sales of Investments.
Purchases and sales of securities, other than short-term securities, aggregated $249,302,013 and $270,519,318, respectively.
5. Fees and Other Transactions with Affiliates.
Management Fee. Fidelity Management & Research Company (the investment adviser) and its affiliates provide the Fund with investment management related services for which the Fund pays a monthly management fee. The management fee is the sum of an individual fund fee rate that is based on an annual rate of .45% of the Fund's average net assets and an annualized group fee rate that averaged .25% during the period. The group fee rate is based upon the average net assets of all the mutual funds advised by the investment adviser, including any mutual funds previously advised by the investment adviser that are currently advised by Fidelity SelectCo, LLC, an affiliate of the investment adviser. The group fee rate decreases as assets under management increase and increases as assets under management decrease. In addition, the management fee is subject to a performance adjustment (up to a maximum of ± .20% of the Fund's average net assets over a 36 month performance period). The upward or downward adjustment to the management fee is based on the Fund's relative investment performance as compared to its benchmark index, the MSCI All Country Pacific Index, over the same 36 month performance period. For the reporting period, the total annual management fee rate, including the performance adjustment, was .89% of the Fund's average net assets. The performance adjustment included in the management fee rate may be higher or lower than the maximum performance adjustment rate due to the difference between the average net assets for the reporting and performance periods.
Transfer Agent Fees. Fidelity Investments Institutional Operations Company, Inc. (FIIOC), an affiliate of the investment adviser, is the Fund's transfer, dividend disbursing and shareholder servicing agent. FIIOC receives account fees and asset-based fees that vary according to account size and type of account. FIIOC pays for typesetting, printing and mailing of shareholder reports, except proxy statements. For the period, the transfer agent fees were equivalent to an annual rate of .19% of average net assets.
Accounting and Security Lending Fees. Fidelity Service Company, Inc. (FSC), an affiliate of the investment adviser, maintains the Fund's accounting records. The accounting fee is based on the level of average net assets for each month. Under a separate contract, FSC administers the security lending program. The security lending fee is based on the number and duration of lending transactions.
Brokerage Commissions. The Fund placed a portion of its portfolio transactions with brokerage firms which are affiliates of the investment adviser. Brokerage commissions are included in net realized gain (loss) and change in net unrealized appreciation (depreciation) in the Statement of Operations. The commissions paid to these affiliated firms were $617 for the period.
Annual Report
6. Committed Line of Credit.
The Fund participates with other funds managed by the investment adviser or an affiliate in a $4.25 billion credit facility (the "line of credit") to be utilized for temporary or emergency purposes to fund shareholder redemptions or for other short-term liquidity purposes. The Fund has agreed to pay commitment fees on its pro-rata portion of the line of credit, which amounted to $1,000 and is reflected in Miscellaneous expenses on the Statement of Operations. During the period, the Fund did not borrow on this line of credit.
7. Security Lending.
The Fund lends portfolio securities through a lending agent from time to time in order to earn additional income. For equity securities, a lending agent is used and may loan securities to certain qualified borrowers, including Fidelity Capital Markets (FCM), a broker-dealer affiliated with the Fund. On the settlement date of the loan, the Fund receives collateral (in the form of U.S. Treasury obligations, letters of credit and/or cash) against the loaned securities and maintains collateral in an amount not less than 100% of the market value of the loaned securities during the period of the loan. The market value of the loaned securities is determined at the close of business of the Fund and any additional required collateral is delivered to the Fund on the next business day. The Fund or borrower may terminate the loan at any time, and if the borrower defaults on its obligation to return the securities loaned because of insolvency or other reasons, the Fund may apply collateral received from the borrower against the obligation. The Fund may experience delays and costs in recovering the securities loaned. Any cash collateral received is invested in the Fidelity Securities Lending Cash Central Fund. The value of loaned securities and cash collateral at period end are disclosed on the Fund's Statement of Assets and Liabilities. At period end, there were no security loans outstanding with FCM. Security lending income represents the income earned on investing cash collateral, less rebates paid to borrowers and any lending agent fees associated with the loan, plus any premium payments received for lending certain types of securities. Security lending income is presented in the Statement of Operations as a component of income from Fidelity Central Funds. Total security lending income during the period amounted to $195,406, including $2,826 from securities loaned to FCM.
8. Expense Reductions.
Commissions paid to certain brokers with whom the investment adviser, or its affiliates, places trades on behalf of the Fund include an amount in addition to trade execution, which may be rebated back to the Fund to offset certain expenses. This amount totaled $21,409 for the period. In addition, through arrangements with the Fund's custodian, credits realized as a result of certain uninvested cash balances were used to reduce the Fund's expenses. During the period, these credits reduced the Fund's custody expenses by $12.
In addition, during the period the investment adviser reimbursed and/or waived a portion of operating expenses in the amount of $20,848.
9. Other.
The Fund's organizational documents provide former and current trustees and officers with a limited indemnification against liabilities arising in connection with the performance of their duties to the Fund. In the normal course of business, the Fund may also enter into contracts that provide general indemnifications. The Fund's maximum exposure under these arrangements is unknown as this would be dependent on future claims that may be made against the Fund. The risk of material loss from such claims is considered remote.
Annual Report
To the Trustees of Fidelity Investment Trust and the Shareholders of Fidelity Canada Fund, Fidelity China Region Fund, Fidelity Emerging Asia Fund, Fidelity Emerging Markets Fund, Fidelity Europe Fund, Fidelity Japan Fund, Fidelity Japan Smaller Companies Fund, Fidelity Latin America Fund, Fidelity Nordic Fund and Fidelity Pacific Basin Fund:
In our opinion, the accompanying statements of assets and liabilities, including the schedules of investments, and the related statements of operations and of changes in net assets and the financial highlights present fairly, in all material respects, the financial position of Fidelity Canada Fund, Fidelity China Region Fund, Fidelity Emerging Asia Fund, Fidelity Emerging Markets Fund, Fidelity Europe Fund, Fidelity Japan Fund, Fidelity Japan Smaller Companies Fund, Fidelity Latin America Fund, Fidelity Nordic Fund and Fidelity Pacific Basin Fund (each a fund of Fidelity Investment Trust) at October 31, 2015, the results of its operations for the year then ended, the changes in its net assets for each of the two years in the period then ended and the financial highlights for each of the periods indicated, in conformity with accounting principles generally accepted in the United States of America. These financial statements and financial highlights (hereafter referred to as "financial statements") are the responsibility of the Fidelity Investment Trust's management. Our responsibility is to express an opinion on these financial statements based on our audits. We conducted our audits of these financial statements in accordance with the standards of the Public Company Accounting Oversight Board (United States). Those standards require that we plan and perform the audit to obtain reasonable assurance about whether the financial statements are free of material misstatement. An audit includes examining, on a test basis, evidence supporting the amounts and disclosures in the financial statements, assessing the accounting principles used and significant estimates made by management, and evaluating the overall financial statement presentation. We believe that our audits, which included confirmation of securities at October 31, 2015 by correspondence with the custodian and brokers, provide a reasonable basis for our opinion.
PricewaterhouseCoopers LLP
Boston, Massachusetts
December 22, 2015
Annual Report
The Trustees, Member of the Advisory Board, and officers of the trust and funds, as applicable, are listed below. The Board of Trustees governs each fund and is responsible for protecting the interests of shareholders. The Trustees are experienced executives who meet periodically throughout the year to oversee each fund's activities, review contractual arrangements with companies that provide services to each fund, oversee management of the risks associated with such activities and contractual arrangements, and review each fund's performance. Each of the Trustees oversees 170 funds.
The Trustees hold office without limit in time except that (a) any Trustee may resign; (b) any Trustee may be removed by written instrument, signed by at least two-thirds of the number of Trustees prior to such removal; (c) any Trustee who requests to be retired or who has become incapacitated by illness or injury may be retired by written instrument signed by a majority of the other Trustees; and (d) any Trustee may be removed at any special meeting of shareholders by a two-thirds vote of the outstanding voting securities of the trust. Each Trustee who is not an interested person (as defined in the 1940 Act) of the trust and the funds (Independent Trustee), shall retire not later than the last day of the calendar year in which his or her 75th birthday occurs. The Independent Trustees may waive this mandatory retirement age policy with respect to individual Trustees. The officers and Advisory Board Member hold office without limit in time, except that any officer and Advisory Board Member may resign or may be removed by a vote of a majority of the Trustees at any regular meeting or any special meeting of the Trustees. Except as indicated, each individual has held the office shown or other offices in the same company for the past five years.
Experience, Skills, Attributes, and Qualifications of the Funds' Trustees. The Governance and Nominating Committee has adopted a statement of policy that describes the experience, qualifications, attributes, and skills that are necessary and desirable for potential Independent Trustee candidates (Statement of Policy). The Board believes that each Trustee satisfied at the time he or she was initially elected or appointed a Trustee, and continues to satisfy, the standards contemplated by the Statement of Policy. The Governance and Nominating Committee also engages professional search firms to help identify potential Independent Trustee candidates who have the experience, qualifications, attributes, and skills consistent with the Statement of Policy. From time to time, additional criteria based on the composition and skills of the current Independent Trustees, as well as experience or skills that may be appropriate in light of future changes to board composition, business conditions, and regulatory or other developments, have also been considered by the professional search firms and the Governance and Nominating Committee. In addition, the Board takes into account the Trustees' commitment and participation in Board and committee meetings, as well as their leadership of standing and ad hoc committees throughout their tenure.
In determining that a particular Trustee was and continues to be qualified to serve as a Trustee, the Board has considered a variety of criteria, none of which, in isolation, was controlling. The Board believes that, collectively, the Trustees have balanced and diverse experience, qualifications, attributes, and skills, which allow the Board to operate effectively in governing each fund and protecting the interests of shareholders. Information about the specific experience, skills, attributes, and qualifications of each Trustee, which in each case led to the Board's conclusion that the Trustee should serve (or continue to serve) as a trustee of the funds, is provided below.
Board Structure and Oversight Function. James C. Curvey is an interested person (as defined in the 1940 Act) and currently serves as Chairman. The Trustees have determined that an interested Chairman is appropriate and benefits shareholders because an interested Chairman has a personal and professional stake in the quality and continuity of services provided to the funds. Independent Trustees exercise their informed business judgment to appoint an individual of their choosing to serve as Chairman, regardless of whether the Trustee happens to be independent or a member of management. The Independent Trustees have determined that they can act independently and effectively without having an Independent Trustee serve as Chairman and that a key structural component for assuring that they are in a position to do so is for the Independent Trustees to constitute a substantial majority for the Board. The Independent Trustees also regularly meet in executive session. Ned C. Lautenbach serves as Chairman of the Independent Trustees and as such (i) acts as a liaison between the Independent Trustees and management with respect to matters important to the Independent Trustees and (ii) with management prepares agendas for Board meetings.
Fidelity funds are overseen by different Boards of Trustees. The funds' Board oversees Fidelity's high income and certain equity funds, and other Boards oversee Fidelity's investment-grade bond, money market, asset allocation, and sector funds. The asset allocation funds may invest in Fidelity funds overseen by the funds' Board. The use of separate Boards, each with its own committee structure, allows the Trustees of each group of Fidelity funds to focus on the unique issues of the funds they oversee, including common research, investment, and operational issues. On occasion, the separate Boards establish joint committees to address issues of overlapping consequences for the Fidelity funds overseen by each Board.
The Trustees operate using a system of committees to facilitate the timely and efficient consideration of all matters of importance to the Trustees, each fund, and fund shareholders and to facilitate compliance with legal and regulatory requirements and oversight of the funds' activities and associated risks. The Board, acting through its committees, has charged FMR and its affiliates with (i) identifying events or circumstances the occurrence of which could have demonstrably adverse effects on the funds' business and/or reputation; (ii) implementing processes and controls to lessen the possibility that such events or circumstances occur or to mitigate the effects of such events or circumstances if they do occur; and (iii) creating and maintaining a system designed to evaluate continuously business and market conditions in order to facilitate the identification and implementation processes described in (i) and (ii) above. Because the day-to-day operations and activities of the funds are carried out by or through FMR, its affiliates and other service providers, the funds' exposure to risks is mitigated but not eliminated by the processes overseen by the Trustees. While each of the Board's committees has responsibility for overseeing different aspects of the funds' activities, oversight is exercised primarily through the Operations, Audit, and Compliance Committees. In addition, the Independent Trustees have worked with FMR to enhance the Board's oversight of investment and financial risks, legal and regulatory risks, technology risks, and operational risks, including the development of additional risk reporting to the Board. For example, a working group comprised of Independent Trustees and FMR has worked and continues to work to review the Fidelity funds' valuation-related activities, reporting and risk management. Appropriate personnel, including but not limited to the funds' Chief Compliance Officer (CCO), FMR's internal auditor, the independent accountants, the funds' Treasurer and portfolio management personnel, make periodic reports to the Board's committees, as appropriate, including an annual review of Fidelity's risk management program for the Fidelity funds. The responsibilities of each standing committee, including their oversight responsibilities, are described further under "Standing Committees of the Funds' Trustees."
Annual Report
Trustees and Officers - continued
The funds' Statement of Additional Information (SAI) includes more information about the Trustees. To request a free copy, call Fidelity at 1-800-544-8544.
Interested Trustees*:
Correspondence intended for each Trustee who is an interested person may be sent to Fidelity Investments, 245 Summer Street, Boston, Massachusetts 02210.
Name, Year of Birth; Principal Occupations and Other Relevant Experience+ |
James C. Curvey (1935) |
Year of Election or Appointment: 2007 Trustee Chairman of the Board of Trustees |
| Mr. Curvey also serves as Trustee of other Fidelity funds. Mr. Curvey is a Director of Fidelity Research & Analysis Co. (investment adviser firm, 2009-present), and Vice Chairman (2007-present) and Director of FMR LLC (diversified financial services company). In addition, Mr. Curvey serves as an Overseer for the Boston Symphony Orchestra and a member of the board of Artis-Naples, Naples, Florida, and as a Trustee for Brewster Academy, Wolfeboro, New Hampshire. Previously, Mr. Curvey served as a Director of Fidelity Investments Money Management, Inc. (investment adviser firm, 2009-2014) and a Director of FMR and FMR Co., Inc. (investment adviser firms, 2007-2014). |
Charles S. Morrison (1960) |
Year of Election or Appointment: 2014 Trustee |
| Mr. Morrison also serves as Trustee of other funds. He serves as a Director of Fidelity Investments Money Management, Inc. (FIMM) (investment adviser firm, 2014-present), Director of Fidelity SelectCo, LLC (investment adviser firm, 2014-present), President, Asset Management (2014-present), and is an employee of Fidelity Investments. Previously, Mr. Morrison served as Vice President of Fidelity's Fixed Income and Asset Allocation Funds (2012-2014), President, Fixed Income (2011-2014), Vice President of Fidelity's Money Market Funds (2005-2009), President, Money Market Group Leader of FMR (investment adviser firm, 2009), and Senior Vice President, Money Market Group of FMR (2004-2009). Mr. Morrison also served as Vice President of Fidelity's Bond Funds (2002-2005), certain Balanced Funds (2002-2005), and certain Asset Allocation Funds (2002-2007), and as Senior Vice President (2002-2005) of Fidelity's Bond Division. |
* Trustees have been determined to be "Interested Trustees" by virtue of, among other things, their affiliation with the trust or various entities under common control with FMR.
+ The information above includes each Trustee's principal occupation during the last five years and other information relating to the experience, attributes, and skills relevant to each Trustee's qualifications to serve as a Trustee, which led to the conclusion that each Trustee should serve as a Trustee for each fund.
Annual Report
Independent Trustees:
Correspondence intended for each Independent Trustee (that is, the Trustees other than the Interested Trustees) may be sent to Fidelity Investments, P.O. Box 55235, Boston, Massachusetts 02205-5235.
Name, Year of Birth; Principal Occupations and Other Relevant Experience+ |
Dennis J. Dirks (1948) |
Year of Election or Appointment: 2005 Trustee |
| Mr. Dirks also serves as Trustee of other Fidelity funds. Prior to his retirement in May 2003, Mr. Dirks was Chief Operating Officer and a member of the Board of The Depository Trust & Clearing Corporation (DTCC). He also served as President, Chief Operating Officer, and Board member of The Depository Trust Company (DTC) and President and Board member of the National Securities Clearing Corporation (NSCC). In addition, Mr. Dirks served as Chief Executive Officer and Board member of the Government Securities Clearing Corporation, Chief Executive Officer and Board member of the Mortgage-Backed Securities Clearing Corporation, as a Trustee and a member of the Finance Committee of Manhattan College (2005-2008), as a Trustee and a member of the Finance Committee of AHRC of Nassau County (2006-2008), and as a member of the Independent Directors Council (IDC) Governing Council (2010-2015). Mr. Dirks is a member of the Board of Directors for The Brookville Center for Children's Services, Inc. (2009-present). |
Alan J. Lacy (1953) |
Year of Election or Appointment: 2008 Trustee |
| Mr. Lacy also serves as Trustee of other Fidelity funds. Mr. Lacy serves as a member of the Board of Directors of Dave & Buster's Entertainment, Inc. (restaurant and entertainment complexes, 2010-present) and Bristol-Myers Squibb Company (global pharmaceuticals, 2008-present). In addition, Mr. Lacy served as Senior Adviser (2007-2014) of Oak Hill Capital Partners, L.P. (private equity) and also served as Chief Executive Officer (2000-2005) and Vice Chairman (2005-2006) of Sears Holdings Corporation and Sears, Roebuck and Co. (retail). Mr. Lacy is a member of the Board of Trustees of The National Parks Conservation Association (2006-present). Previously, Mr. Lacy served as Chairman of the Board of Trustees of the National Parks Conservation Association (2008-2011) and as a member of the Board of Directors for The Western Union Company (global money transfer, 2006-2011), The Hillman Companies, Inc. (hardware wholesalers, 2010-2014), and Earth Fare, Inc. (retail grocery, 2010-2014). |
Ned C. Lautenbach (1944) |
Year of Election or Appointment: 2000 Trustee Chairman of the Independent Trustees |
| Mr. Lautenbach also serves as Trustee of other Fidelity funds. Mr. Lautenbach currently serves as the Lead Director of the Eaton Corporation Board of Directors (diversified industrial, 1997-present). Mr. Lautenbach is Chairman of the Board of Directors of Artis-Naples in Naples, Florida (2012-present), a member of the Council on Foreign Relations (1994-present), and a member of the Board of Governors, State University System of Florida (2013-present). Previously, Mr. Lautenbach was a Partner/Advisory Partner at Clayton, Dubilier & Rice, LLC (private equity investment, 1998-2010), as well as a Director of Sony Corporation (2006-2007). |
Joseph Mauriello (1944) |
Year of Election or Appointment: 2008 Trustee |
| Mr. Mauriello also serves as Trustee of other Fidelity funds. Prior to his retirement in January 2006, Mr. Mauriello served in numerous senior management positions including Deputy Chairman and Chief Operating Officer (2004-2005), and Vice Chairman of Financial Services (2002-2004) of KPMG LLP US (professional services, 1965-2005). Mr. Mauriello currently serves as a member of the Board of Directors of XL Group plc. (global insurance and re-insurance, 2006-present) and the Independent Directors Council (IDC) Governing Council (2015-present). Previously, Mr. Mauriello served as a Director of the Hamilton Funds of the Bank of New York (2006-2007) and of Arcadia Resources Inc. (health care services and products, 2007-2012). |
Robert W. Selander (1950) |
Year of Election or Appointment: 2011 Trustee |
| Mr. Selander also serves as Trustee of other Fidelity funds. Mr. Selander serves as a Director of The Western Union Company (global money transfer, 2014-present). Previously, Mr. Selander served as a Member of the Advisory Board of other Fidelity funds (2011), and Executive Vice Chairman (2010), Chief Executive Officer (2009-2010), and President and Chief Executive Officer (1997-2009) of Mastercard, Inc. |
Cornelia M. Small (1944) |
Year of Election or Appointment: 2005 Trustee |
| Ms. Small also serves as Trustee of other Fidelity funds. Ms. Small is a member of the Board of Directors (2009-present) and Chair of the Investment Committee (2010-present) of the Teagle Foundation. Ms. Small also serves on the Investment Committee of the Berkshire Taconic Community Foundation (2008-present). Previously, Ms. Small served as Chairperson (2002-2008) and a member of the Investment Committee and Chairperson (2008-2012) and a member of the Board of Trustees of Smith College. In addition, Ms. Small served as Chief Investment Officer, Director of Global Equity Investments, and a member of the Board of Directors of Scudder, Stevens & Clark and Scudder Kemper Investments. |
William S. Stavropoulos (1939) |
Year of Election or Appointment: 2001 Trustee Vice Chairman of the Independent Trustees |
| Mr. Stavropoulos also serves as Trustee of other Fidelity funds. Mr. Stavropoulos serves as President and Founder of the Michigan Baseball Foundation, the Great Lakes Loons (2007-present). Mr. Stavropoulos is Chairman Emeritus of the Board of Directors of The Dow Chemical Company, where he previously served in numerous senior management positions, including President, CEO (1995-2000; 2002-2004), Chairman of the Executive Committee (2000-2006), and as a member of the Board of Directors (1990-2006). Currently, Mr. Stavropoulos is Chairman of the Board of Directors of Univar Inc. (global distributor of commodity and specialty chemicals), a Director of Teradata Corporation (data warehousing and technology solutions), and Maersk Inc. (industrial conglomerate), and a member of the Advisory Board for Metalmark Capital LLC (private equity investment, 2005-present). Mr. Stavropoulos is an operating advisor to Clayton, Dubilier & Rice, LLC (private equity investment). In addition, Mr. Stavropoulos is a member of the University of Notre Dame Advisory Council for the College of Science, a Trustee of the Rollin L. Gerstacker Foundation, and a Director of the Naples Philharmonic Center for the Arts. Previously, Mr. Stavropoulos served as a Director of Chemical Financial Corporation (bank holding company, 1993-2012) and Tyco International, Ltd. (multinational manufacturing and services, 2007-2012). |
David M. Thomas (1949) |
Year of Election or Appointment: 2008 Trustee |
| Mr. Thomas also serves as Trustee of other Fidelity funds. Mr. Thomas serves as Non-Executive Chairman of the Board of Directors of Fortune Brands Home and Security (home and security products, 2011-present), as a member of the Board of Directors (2004-present) and Presiding Director (2013-present) of Interpublic Group of Companies, Inc. (marketing communication), and as a member of the Board of Trustees of the University of Florida (2013-present). Previously, Mr. Thomas served as Executive Chairman (2005-2006) and Chairman and Chief Executive Officer (2000-2005) of IMS Health, Inc. (pharmaceutical and healthcare information solutions), and a Director of Fortune Brands, Inc. (consumer products, 2000-2011). |
+ The information above includes each Trustee's principal occupation during the last five years and other information relating to the experience, attributes, and skills relevant to each Trustee's qualifications to serve as a Trustee, which led to the conclusion that each Trustee should serve as a Trustee for each fund.
Advisory Board Member and Officers:
Correspondence intended for each officer and Peter S. Lynch may be sent to Fidelity Investments, 245 Summer Street, Boston, Massachusetts 02210. Officers appear below in alphabetical order.
Name, Year of Birth; Principal Occupation |
Peter S. Lynch (1944) |
Year of Election or Appointment: 2003 Member of the Advisory Board |
| Mr. Lynch also serves as Member of the Advisory Board of other Fidelity funds. Mr. Lynch is Vice Chairman and a Director of FMR (investment adviser firm) and FMR Co., Inc. (investment adviser firm). In addition, Mr. Lynch serves as a Trustee of Boston College and as the Chairman of the Inner-City Scholarship Fund. Previously, Mr. Lynch served on the Special Olympics International Board of Directors (1997-2006). |
Elizabeth Paige Baumann (1968) |
Year of Election or Appointment: 2012 Anti-Money Laundering (AML) Officer |
| Ms. Baumann also serves as AML Officer of other funds. She is Chief AML Officer of FMR LLC (diversified financial services company, 2012-present) and is an employee of Fidelity Investments. Previously, Ms. Baumann served as Vice President and Deputy Anti-Money Laundering Officer (2007-2012). |
Marc R. Bryant (1966) |
Year of Election or Appointment: 2015 Secretary and Chief Legal Officer (CLO) |
| Mr. Bryant also serves as Secretary and CLO of other funds. Mr. Bryant serves as CLO, Secretary, and Senior Vice President of Fidelity Management & Research Company (investment adviser firm, 2015-present) and FMR Co., Inc. (investment adviser firm, 2015-present); Secretary of Fidelity SelectCo, LLC (investment adviser firm, 2015-present) and Fidelity Investments Money Management, Inc. (investment adviser firm, 2015-present); and CLO of Fidelity Management & Research (Hong Kong) Limited (investment adviser firm, 2015-present). He is Senior Vice President and Deputy General Counsel of FMR LLC (diversified financial services company). Previously, Mr. Bryant served as Secretary and Chief Legal Officer of Fidelity Rutland Square Trust II (2010-2014) and Assistant Secretary of Fidelity's Fixed Income and Asset Allocation Funds (2013-2015). Prior to joining Fidelity Investments, Mr. Bryant served as a Senior Vice President and the Head of Global Retail Legal for AllianceBernstein L.P. (2006-2010), and as the General Counsel for ProFund Advisors LLC (2001-2006). |
William C. Coffey (1969) |
Year of Election or Appointment: 2009 Assistant Secretary |
| Mr. Coffey also serves as Assistant Secretary of other funds. He is Senior Vice President and Deputy General Counsel of FMR LLC (diversified financial services company, 2010-present), and is an employee of Fidelity Investments. Previously, Mr. Coffey served as Vice President and Associate General Counsel of FMR LLC (2005-2009). |
Timothy M. Cohen (1969) |
Year of Election or Appointment: 2014 Vice President of certain Equity Funds |
| Mr. Cohen also serves as Vice President of other funds. Mr. Cohen serves as Chief Compliance Officer of FMR Investment Management (U.K.) Limited (investment adviser firm, 2013-present) and is an employee of Fidelity Investments. Previously, Mr. Cohen served as a Director of FMR Investment Management (U.K.) Limited (2013-2015). |
Jonathan Davis (1968) |
Year of Election or Appointment: 2010 Assistant Treasurer |
| Mr. Davis also serves as Assistant Treasurer of other funds, and is an employee of Fidelity Investments. Previously, Mr. Davis served as Vice President and Associate General Counsel of FMR LLC (diversified financial services company, 2003-2010). |
Adrien E. Deberghes (1967) |
Year of Election or Appointment: 2008 Deputy Treasurer |
| Mr. Deberghes also serves as an officer of other funds. He is an employee of Fidelity Investments (2008-present). Prior to joining Fidelity Investments, Mr. Deberghes was Senior Vice President of Mutual Fund Administration at State Street Corporation (2007-2008), Senior Director of Mutual Fund Administration at Investors Bank & Trust (2005-2007), and Director of Finance for Dunkin' Brands (2000-2005). |
Stephanie J. Dorsey (1969) |
Year of Election or Appointment: 2010 Assistant Treasurer |
| Ms. Dorsey also serves as an officer of other funds. She is an employee of Fidelity Investments (2008-present) and has served in other fund officer roles. Prior to joining Fidelity Investments, Ms. Dorsey served as Treasurer (2004-2008) of the JPMorgan Mutual Funds and Vice President (2004-2008) of JPMorgan Chase Bank. |
Howard J. Galligan III (1966) |
Year of Election or Appointment: 2014 Chief Financial Officer |
| Mr. Galligan also serves as Chief Financial Officer of other funds. Mr. Galligan serves as President of Fidelity Pricing and Cash Management Services (FPCMS) (2014-present) and as a Director of Strategic Advisers, Inc. (investment adviser firm, 2008-present). Previously, Mr. Galligan served as Chief Administrative Officer of Asset Management (2011-2014) and Chief Operating Officer and Senior Vice President of Investment Support for Strategic Advisers, Inc. (2003-2011). |
Scott C. Goebel (1968) |
Year of Election or Appointment: 2015 Vice President |
| Mr. Goebel serves as Vice President of other funds and is an employee of Fidelity Investments (2001-present). Previously, Mr. Goebel served as Secretary of Fidelity SelectCo, LLC (investment adviser firm, 2013-2015), Fidelity Investments Money Management, Inc. (FIMM) (investment adviser firm, 2010-2015), and Fidelity Research and Analysis Company (FRAC) (investment adviser firm, 2010-2015); General Counsel, Secretary, and Senior Vice President of Fidelity Management & Research Company (investment adviser firm, 2008-2015) and FMR Co., Inc. (investment adviser firm, 2008-2015); Assistant Secretary of Fidelity Management & Research (Japan) Limited (investment adviser firm, 2008-2015) and FMR Investment Management (U.K.) Limited (investment adviser firm, 2008-2015); Chief Legal Officer (CLO) of Fidelity Management & Research (Hong Kong) Limited (investment adviser firm, 2008-2015); Secretary and CLO of certain Fidelity funds (2008-2015); Assistant Secretary of FIMM (2008-2010), FRAC (2008-2010), and certain funds (2007-2008); and as Vice President and Secretary of Fidelity Distributors Corporation (FDC) (2005-2007). |
Brian B. Hogan (1964) |
Year of Election or Appointment: 2009 Vice President |
| Mr. Hogan also serves as Trustee or Vice President of other funds. Mr. Hogan serves as a Director of Fidelity SelectCo, LLC (investment adviser firm, 2014-present) and President of the Equity Division of FMR (investment adviser firm, 2009-present). Previously, Mr. Hogan served as Senior Vice President, Equity Research of FMR (2006-2009) and as a portfolio manager. |
Chris Maher (1972) |
Year of Election or Appointment: 2013 Assistant Treasurer |
| Mr. Maher serves as Assistant Treasurer of other funds. Mr. Maher is Vice President of Valuation Oversight and is an employee of Fidelity Investments. Previously, Mr. Maher served as Vice President of Asset Management Compliance (2013), Vice President of the Program Management Group of FMR (investment adviser firm, 2010-2013), and Vice President of Valuation Oversight (2008-2010). |
Kenneth B. Robins (1969) |
Year of Election or Appointment: 2008 President and Treasurer |
| Mr. Robins also serves as an officer of other funds. Mr. Robins serves as Executive Vice President of Fidelity Investments Money Management, Inc. (FIMM) (investment adviser firm, 2013-present) and is an employee of Fidelity Investments (2004-present). Previously, Mr. Robins served in other fund officer roles. |
Stacie M. Smith (1974) |
Year of Election or Appointment: 2013 Deputy Treasurer |
| Ms. Smith also serves as an officer of other funds. She is an employee of Fidelity Investments (2009-present) and has served in other fund officer roles. Prior to joining Fidelity Investments, Ms. Smith served as Senior Audit Manager of Ernst & Young LLP (1996-2009). |
Renee Stagnone (1975) |
Year of Election or Appointment: 2013 Deputy Treasurer |
| Ms. Stagnone also serves as Deputy Treasurer of other funds. Ms. Stagnone is an employee of Fidelity Investments (1997-present). |
Linda J. Wondrack (1964) |
Year of Election or Appointment: 2014 Chief Compliance Officer |
| Ms. Wondrack also serves as Chief Compliance Officer of other funds. Ms. Wondrack is Executive Vice President and head of the Ethics Office and Asset Management Compliance for Fidelity Investments (2012-present). Ms. Wondrack also serves as Chief Compliance Officer of Fidelity SelectCo, LLC (investment adviser firm, 2014-present); Chief Compliance Officer of Impresa Management LLC (2013-present); and Chief Compliance Officer of FMR Co., Inc. (investment adviser firm), Fidelity Investments Money Management, Inc. (investment adviser firm), Fidelity Management & Research (Japan) Limited (investment adviser firm), FMR Investment Management (U.K.) Limited (investment adviser firm), Fidelity Management & Research (Hong Kong) (investment adviser firm), Fidelity Management & Research Company (investment adviser firm), FIAM LLC (investment adviser firm), and Strategic Advisers, Inc. (investment adviser firm), Ballyrock Investment Advisors LLC, and Northern Neck Investors LLC (2012-present). Previously, Ms. Wondrack served as Senior Vice President and Chief Compliance Officer for Columbia Management Investment Advisers, LLC (2005-2012); Chief Compliance Officer for certain funds within the Columbia Family of Funds (2007-2012); and Senior Vice President of Compliance Risk Management at Bank of America (2005-2010). |
Joseph F. Zambello (1957) |
Year of Election or Appointment: 2011 Deputy Treasurer |
| Mr. Zambello also serves as Deputy Treasurer of other funds. Mr. Zambello is an employee of Fidelity Investments (1991-present). Previously, Mr. Zambello served as Vice President of the Program Management Group of FMR (investment adviser firm, 2009-2011) and Vice President of the Transfer Agent Oversight Group (2005-2009). |
Annual Report
The Board of Trustees of each fund voted to pay to shareholders of record at the opening of business on record date, the following distributions per share derived from capital gains realized from sales of portfolio securities, and dividends derived from net investment income:
| Pay Date | Record Date | Dividends | Capital Gains |
Fidelity Canada Fund | 12/07/15 | 12/04/15 | $0.613 | $0.060 |
Fidelity China Region Fund | 12/07/15 | 12/04/15 | $0.345 | $3.588 |
Fidelity Emerging Markets Fund | 12/07/15 | 12/04/15 | $0.110 | $0.000 |
Fidelity Europe Fund | 12/07/15 | 12/04/15 | $0.425 | $0.154 |
Fidelity Japan Fund | 12/07/15 | 12/04/15 | $0.069 | $0.006 |
Fidelity Japan Smaller Companies Fund | 12/07/15 | 12/04/15 | $0.091 | $0.107 |
Fidelity Latin America Fund | 12/07/15 | 12/04/15 | $0.347 | $0.000 |
Fidelity Nordic Fund | 12/07/15 | 12/04/15 | $0.565 | $0.052 |
Fidelity Pacific Basin Fund | 12/07/15 | 12/04/15 | $0.362 | $0.951 |
Fidelity Emerging Asia Fund | 12/07/15 | 12/04/15 | $0.132 | $0.000 |
The funds hereby designate as capital gain dividend the amounts noted below for the taxable year ended October 31, 2015, or, if subsequently determined to be different, the net capital gain of such year.
Fidelity Canada Fund | $2,181,885 |
Fidelity China Region Fund | $202,354,150 |
Fidelity Pacific Basin Fund | $25,531,429 |
A percentage of the dividends distributed during the fiscal year for the following funds may be taken into account as a dividend for purposes of the maximum rate under section 1(h)(11) of the Internal Revenue Code.
| December 5, 2014 | December 26, 2014 |
Fidelity Canada Fund | 100% | - |
Fidelity China Region Fund | 71% | - |
Fidelity Emerging Markets Fund | 100% | 100% |
Fidelity Europe Fund | 100% | 100% |
Fidelity Japan Fund | 100% | - |
Fidelity Japan Smaller Companies Fund | 100% | - |
Fidelity Latin America Fund | 53% | 59% |
Fidelity Nordic Fund | - | - |
Fidelity Pacific Basin Fund | 95% | - |
Fidelity Emerging Asia Fund | 100% | - |
A percentage of the dividends distributed during the fiscal year for the following funds qualifies for the dividends-received deduction for corporate shareholders:
Fund | December 5, 2014 | December 26, 2014 |
Fidelity Canada Fund | 3% | - |
Fidelity China Region Fund | - | - |
Fidelity Emerging Markets Fund | 5% | 19% |
Fidelity Europe Fund | 1% | - |
Fidelity Japan Fund | - | - |
Fidelity Japan Smaller Companies Fund | - | - |
Fidelity Latin America Fund | - | - |
Fidelity Nordic Fund | - | - |
Fidelity Pacific Basin Fund | - | - |
Fidelity Emerging Asia Fund | 1% | - |
The amounts per share which represent income derived from sources within, and taxes paid to, foreign countries or possessions of the United States are as follows:
Fund | Pay Date | Income | Taxes |
Fidelity Canada Fund | 12/08/2014 | $0.8223 | $0.1363 |
Fidelity China Region Fund | 12/08/2014 | $0.4188 | $0.0608 |
Fidelity Emerging Markets Fund | 12/08/2014 | $0.2058 | $0.0478 |
Fidelity Emerging Markets Fund | 12/29/2014 | $0.0100 | $0.0000 |
Fidelity Europe Fund | 12/08/2014 | $0.9375 | $0.0715 |
Fidelity Europe Fund | 12/29/2014 | $0.0480 | $0.0000 |
Fidelity Japan Fund | 12/08/2014 | $0.1133 | $0.0263 |
Fidelity Japan Smaller Companies Fund | 12/08/2014 | $0.0652 | $0.0332 |
Fidelity Latin America Fund | 12/08/2014 | $0.4945 | $0.0895 |
Fidelity Latin America Fund | 12/29/2014 | $0.0300 | $0.0000 |
Fidelity Pacific Basin Fund | 12/08/2014 | $0.4094 | $0.0424 |
Fidelity Emerging Asia Fund | 12/08/2014 | $0.4379 | $0.1439 |
The fund will notify shareholders in January 2016 of amounts for use in preparing 2015 income tax returns.
Annual Report
Targeted International Equity Funds
Each year, the Board of Trustees, including the Independent Trustees (together, the Board), votes on the renewal of the management contract with Fidelity Management & Research Company (FMR) and the sub-advisory agreements (together, the Advisory Contracts) for each fund. The Board, assisted by the advice of fund counsel and Independent Trustees' counsel, requests and considers a broad range of information relevant to the renewal of the Advisory Contracts throughout the year.
The Board meets regularly and, at each of its meetings, covers an extensive agenda of topics and materials and considers factors that are relevant to its annual consideration of the renewal of each fund's Advisory Contracts, including the services and support provided to each fund and its shareholders. The Board has established various standing committees (Committees), each composed of and chaired by Independent Trustees with varying backgrounds, to which the Board has assigned specific subject matter responsibilities in order to enhance effective decision-making by the Board. The Board, acting directly and through its Committees, requests and receives information concerning the annual consideration of the renewal of each fund's Advisory Contracts. The Board also meets as needed to consider matters specifically related to the Board's annual consideration of the renewal of the Advisory Contracts. Members of the Board may also meet with trustees of other Fidelity funds through ad hoc joint committees to discuss certain matters relevant to all of the Fidelity funds.
At its July 2015 meeting, the Board unanimously determined to renew each fund's Advisory Contracts. In reaching its determination, the Board considered all factors it believed relevant, including (i) the nature, extent, and quality of the services to be provided to each fund and its shareholders (including the investment performance of each fund); (ii) the competitiveness of each fund's management fee and total expense ratio relative to peer funds; (iii) the total costs of the services to be provided by and the profits to be realized by Fidelity from its relationship with each fund; and (iv) the extent to which (if any) economies of scale exist and would be realized as each fund grows, and whether any economies of scale are appropriately shared with fund shareholders.
In considering whether to renew the Advisory Contracts for each fund, the Board reached a determination, with the assistance of fund counsel and Independent Trustees' counsel and through the exercise of its business judgment, that the renewal of the Advisory Contracts was in the best interests of each fund and its shareholders and that the compensation payable under the Advisory Contracts was fair and reasonable. The Board's decision to renew the Advisory Contracts was not based on any single factor, but rather was based on a comprehensive consideration of all the information provided to the Board at its meetings throughout the year. The Board, in reaching its determination to renew the Advisory Contracts, was aware that shareholders of each fund have a broad range of investment choices available to them, including a wide choice among funds offered by Fidelity's competitors, and that each fund's shareholders, who have the opportunity to review and weigh the disclosure provided by the fund in its prospectus and other public disclosures, have chosen to invest in that fund, which is part of the Fidelity family of funds.
Nature, Extent, and Quality of Services Provided. The Board considered Fidelity's staffing as it relates to the funds, including the backgrounds of investment personnel of Fidelity, and also considered the funds' investment objectives, strategies, and related investment philosophies. The Independent Trustees also had discussions with senior management of Fidelity's investment operations and investment groups. The Board considered the structure of the portfolio manager compensation program and whether this structure provides appropriate incentives to act in the best interests of each fund. Additionally, the Board considered the portfolio managers' investments, if any, in the funds that they manage.
Resources Dedicated to Investment Management and Support Services. The Board and the Fund Oversight and Research Committees reviewed the general qualifications and capabilities of Fidelity's investment staff, including its size, education, experience, and resources, as well as Fidelity's approach to recruiting, training, managing, and compensating investment personnel. The Board noted that Fidelity has continued to increase the resources devoted to non-U.S. offices, including expansion of Fidelity's global investment organization. The Board also noted that Fidelity's analysts have extensive resources, tools and capabilities that allow them to conduct sophisticated quantitative and fundamental analysis, as well as credit analysis of issuers, counterparties and guarantors. Further, the Board considered that Fidelity's investment professionals have sufficient access to global information and data so as to provide competitive investment results over time, and that those professionals also have access to sophisticated tools that permit them to assess portfolio construction and risk and performance attribution characteristics continuously, as well as to transmit new information and research conclusions rapidly around the world. Additionally, in its deliberations, the Board considered Fidelity's trading, risk management, and compliance capabilities and resources, which are integral parts of the investment management process.
Shareholder and Administrative Services. The Board considered (i) the nature, extent, quality, and cost of advisory, administrative, and shareholder services performed by FMR, the sub-advisers (together with FMR, the Investment Advisers), and their affiliates under the Advisory Contracts and under separate agreements covering transfer agency, pricing and bookkeeping, and securities lending services for each fund; (ii) the nature and extent of the supervision of third party service providers, principally custodians and subcustodians; and (iii) the resources devoted to, and the record of compliance with, each fund's compliance policies and procedures. The Board also reviewed the allocation of fund brokerage, including allocations to brokers affiliated with the Investment Advisers, the use of brokerage commissions to pay fund expenses, and the use of "soft" commission dollars to pay for research services.
Annual Report
The Board noted that the growth of fund assets over time across the complex allows Fidelity to reinvest in the development of services designed to enhance the value or convenience of the Fidelity funds as investment vehicles. These services include 24-hour access to account information and market information through telephone representatives and over the Internet, investor education materials and asset allocation tools, and the expanded availability of Fidelity Investor Centers.
In 2014, the Board formed an ad hoc Committee on Transfer Agency Fees to review the variety of transfer agency fee structures throughout the industry and Fidelity's competitive positioning with respect to industry participants.
Investment in a Large Fund Family. The Board considered the benefits to shareholders of investing in a Fidelity fund, including the benefits of investing in a fund that is part of a large family of funds offering a variety of investment disciplines and providing a large variety of mutual fund investor services. The Board noted that Fidelity had taken, or had made recommendations that resulted in the Fidelity funds taking, a number of actions over the previous year that benefited particular funds, including (i) continuing to dedicate additional resources to investment research and to the support of the senior management team that oversees asset management; (ii) continuing efforts to enhance Fidelity's global research capabilities; (iii) launching new funds and making other enhancements to meet client needs; (iv) reducing management fees and total expenses for certain index funds and diversified international funds; (v) continuing to launch dedicated lower cost underlying funds to meet portfolio construction needs related to expanding underlying fund options for Fidelity funds of funds, specifically for the Freedom Fund product lines; (vi) rationalizing product lines and gaining increased efficiencies through fund mergers; (vii) launching active fixed-income exchange-traded funds; (viii) continuing to develop, acquire and implement systems and technology to improve services to the funds and information security and to increase efficiency; (ix) implementing investment enhancements to further strengthen Fidelity's target date product line to increase investors' probability of success in achieving their goals; (x) modifying the eligibility criteria for certain share classes to accommodate roll-over assets from employer-sponsored retirement plans; (xi) launching a new Class W of the Freedom Index Funds to attract and retain Fidelity record-kept retirement plan assets; and (xii) implementing changes to Fidelity's money market product line in response to recent money market regulatory reforms.
Investment Performance. The Board considered whether each fund has operated in accordance with its investment objective, as well as its record of compliance with its investment restrictions and its performance history. The Board noted that there were portfolio management changes for Fidelity Canada Fund in January 2014 and September 2014, for Fidelity Emerging Markets Fund in October 2012, for Fidelity Europe Fund in December 2013 and September 2014, for Fidelity Japan Fund in March 2014, for Fidelity Japan Smaller Companies Fund in March 2014, for Fidelity Nordic Fund in September 2014, and for Fidelity Pacific Basin Fund in October 2013.
The Board took into account discussions with representatives of the Investment Advisers about fund investment performance that occur at Board meetings throughout the year. In this regard the Board noted that as part of regularly scheduled fund reviews and other reports to the Board on fund performance, the Board considers annualized return information for each fund, for different time periods, measured against a securities market index ("benchmark index") and a peer group of funds with similar objectives ("peer group"), if any. In its evaluation of fund investment performance, the Board gave particular attention to information indicating changes in performance of certain Fidelity funds for specific time periods and discussed with the Investment Advisers the reasons for any overperformance or underperformance.
In addition to reviewing absolute and relative fund performance, the Independent Trustees periodically consider the appropriateness of fund performance metrics in evaluating the results achieved. In general, the Independent Trustees believe that fund performance should be evaluated based on net performance (after fees and expenses) of both the highest performing and lowest performing fund share classes, where applicable, compared to appropriate benchmark indices, over appropriate time periods that may include full market cycles, and compared to peer groups, as applicable, over the same periods, taking into account relevant factors including the following: general market conditions; issuer-specific information; and fund cash flows and other factors.
The Independent Trustees recognize that shareholders evaluate performance on a net basis over their own holding periods, for which one-, three-, and five-year periods are often used as a proxy. For this reason, the performance information reviewed by the Board also included net cumulative calendar year total return information for each fund and an appropriate benchmark index and peer group for the most recent one-, three-, and five-year periods, as shown below. For Fidelity Emerging Markets Fund, Fidelity Europe Fund, and Fidelity Japan Fund, returns are shown compared to the 25th percentile (top of box, 75% beaten) and 75th percentile (bottom of box, 25% beaten) of the peer universe. For Fidelity Canada Fund, Fidelity China Region Fund, Fidelity Emerging Asia Fund, Fidelity Japan Smaller Companies Fund, Fidelity Latin America Fund, Fidelity Nordic Fund, and Fidelity Pacific Basin Fund, a peer group is not shown below because the funds do not generally utilize a peer group for performance comparison purposes. For Fidelity Emerging Asia Fund, Fidelity Europe Fund, and Fidelity Pacific Basin Fund, returns of the benchmark index are "net MA," i.e., adjusted for tax withholding rates applicable to U.S.-based funds organized as Massachusetts business trusts.
Annual Report
Board Approval of Investment Advisory Contracts and Management Fees - continued
Fidelity Canada Fund

Fidelity China Region Fund

Annual Report
Fidelity Emerging Asia Fund
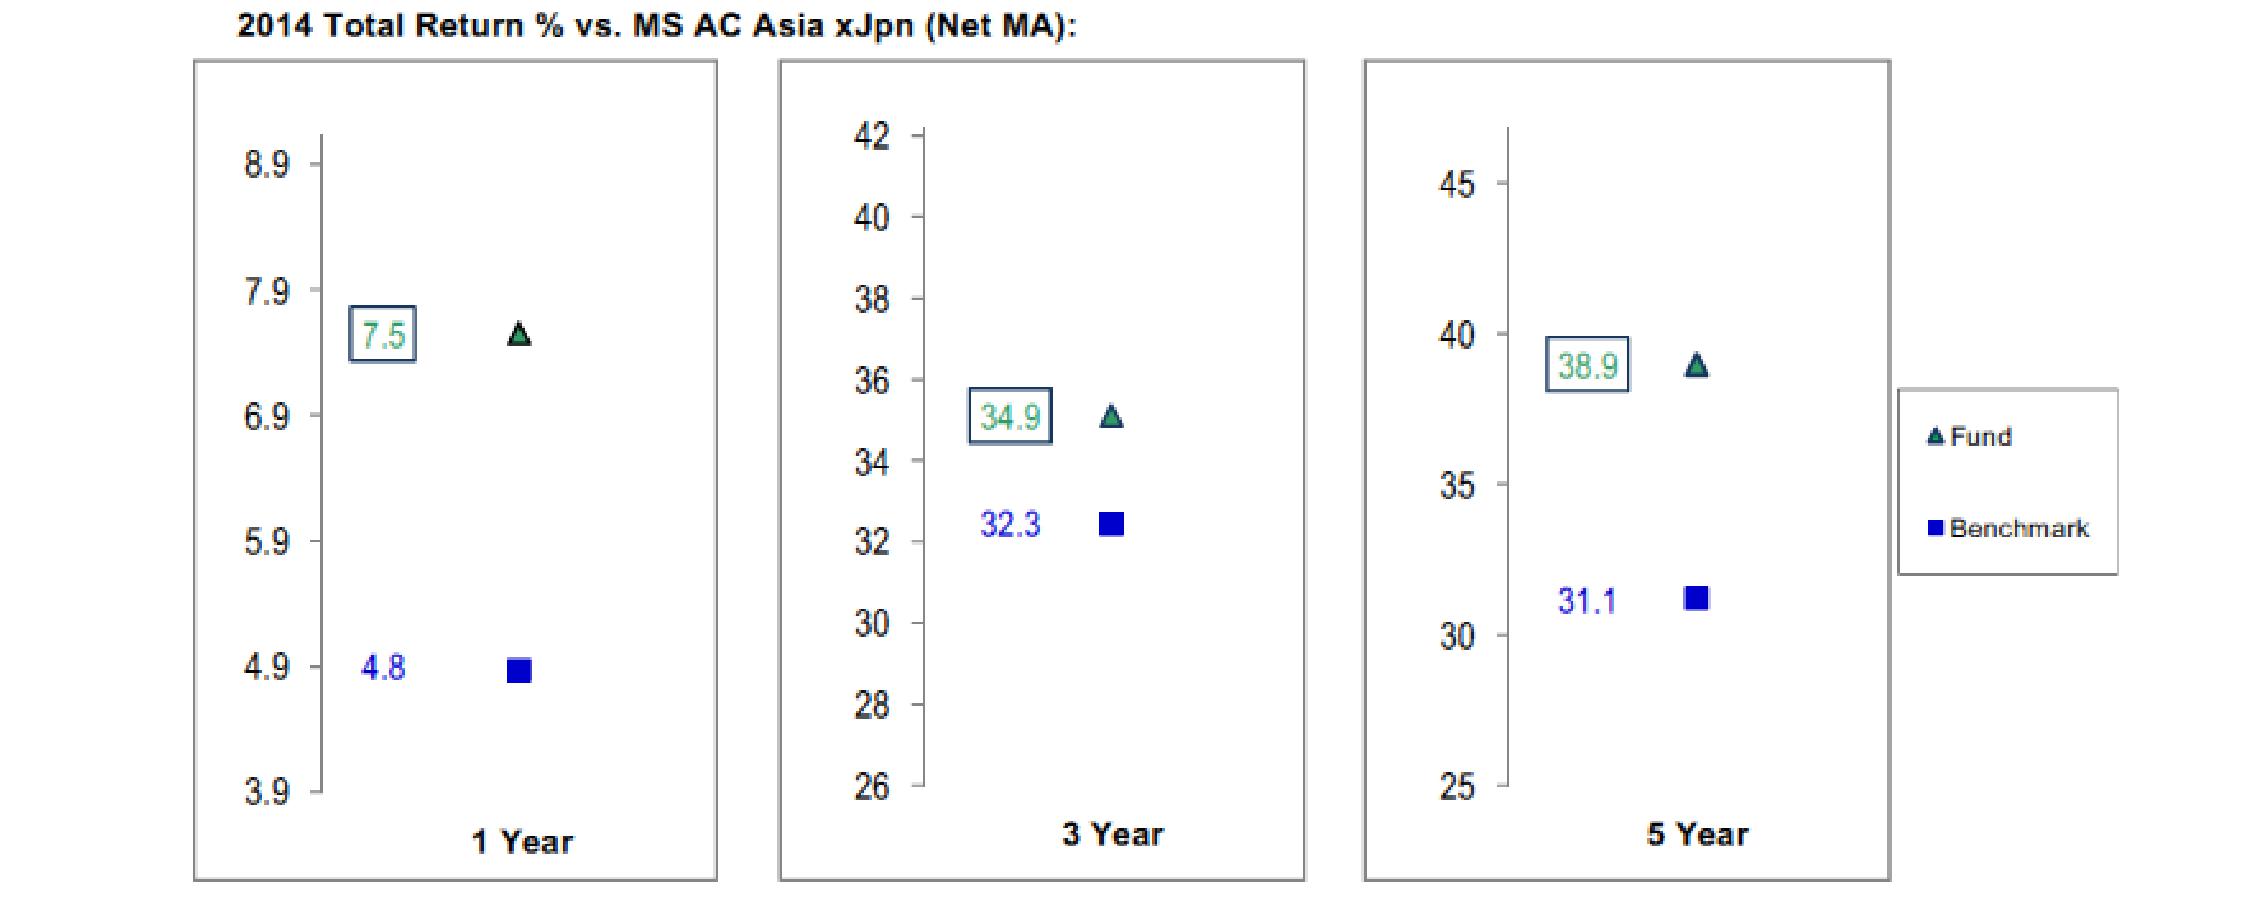
Fidelity Emerging Markets Fund
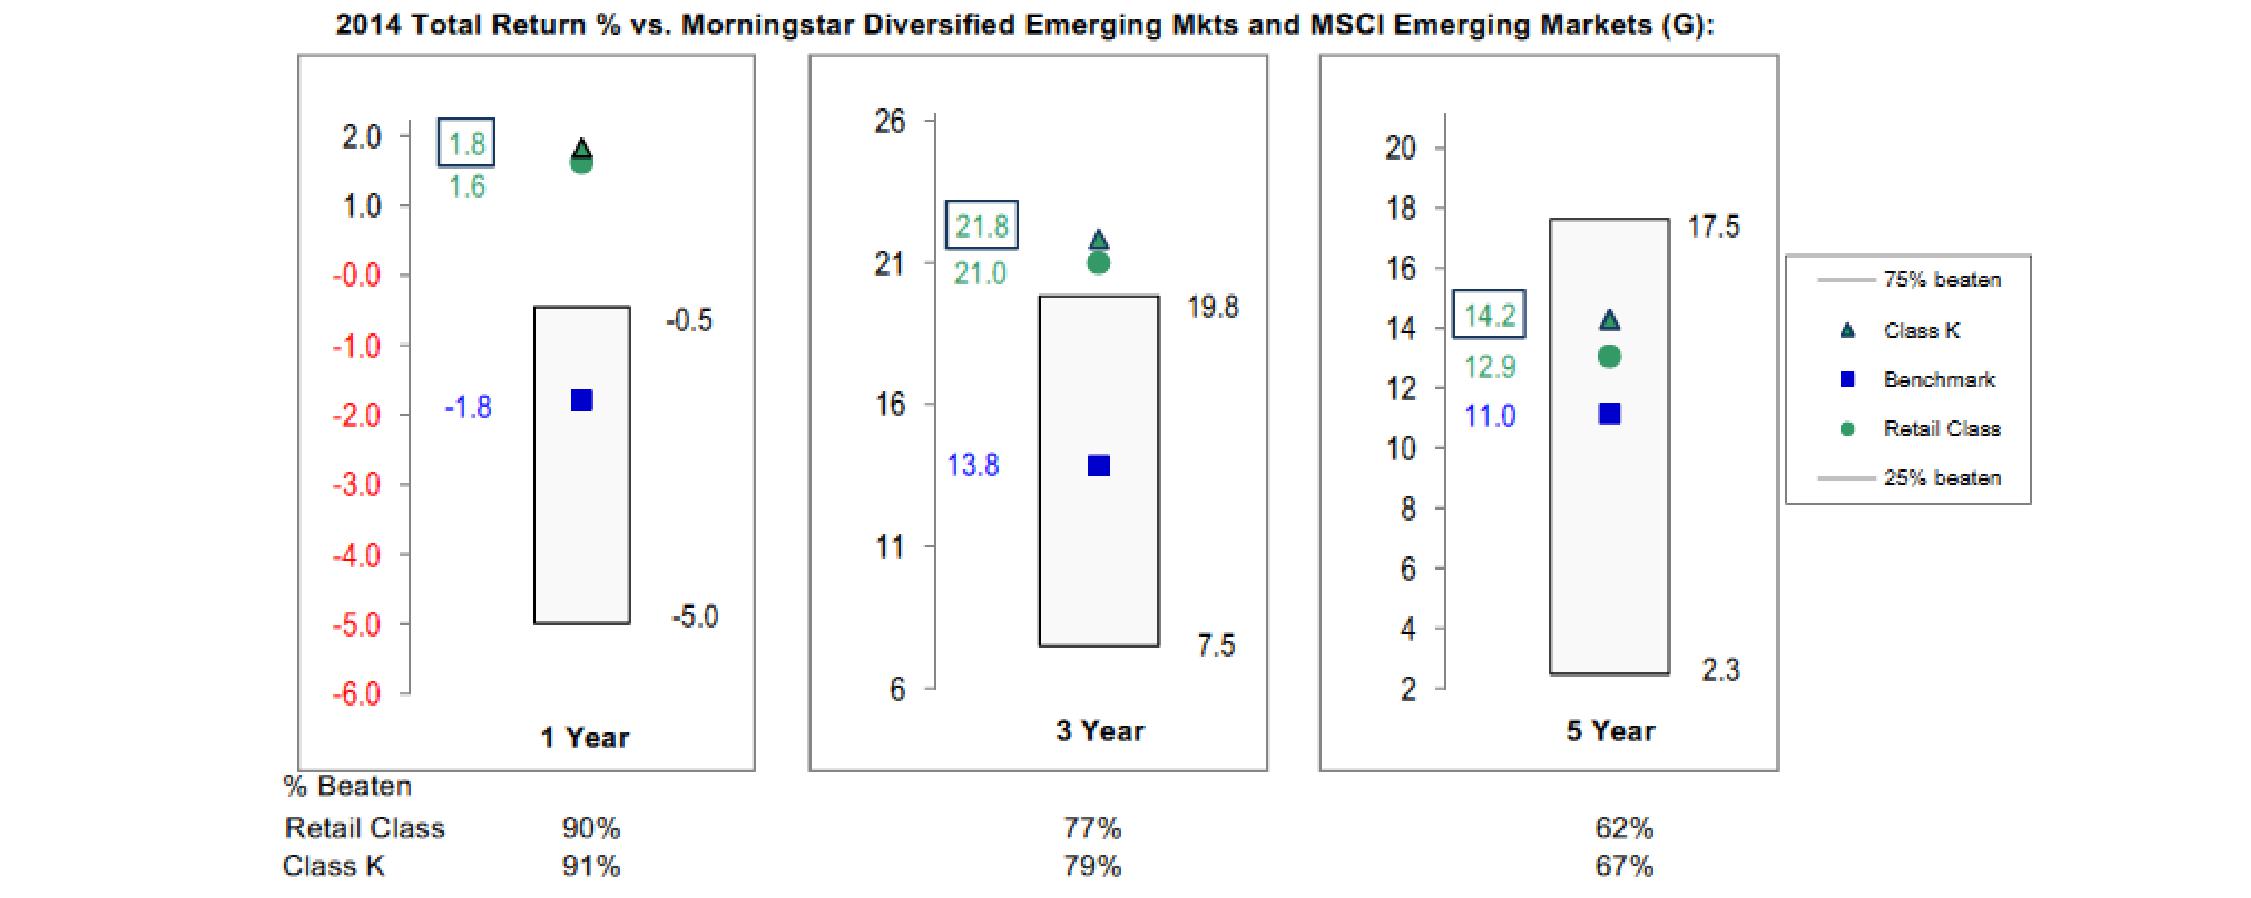
Annual Report
Board Approval of Investment Advisory Contracts and Management Fees - continued
Fidelity Europe Fund

Fidelity Japan Fund

Annual Report
Fidelity Japan Smaller Companies Fund
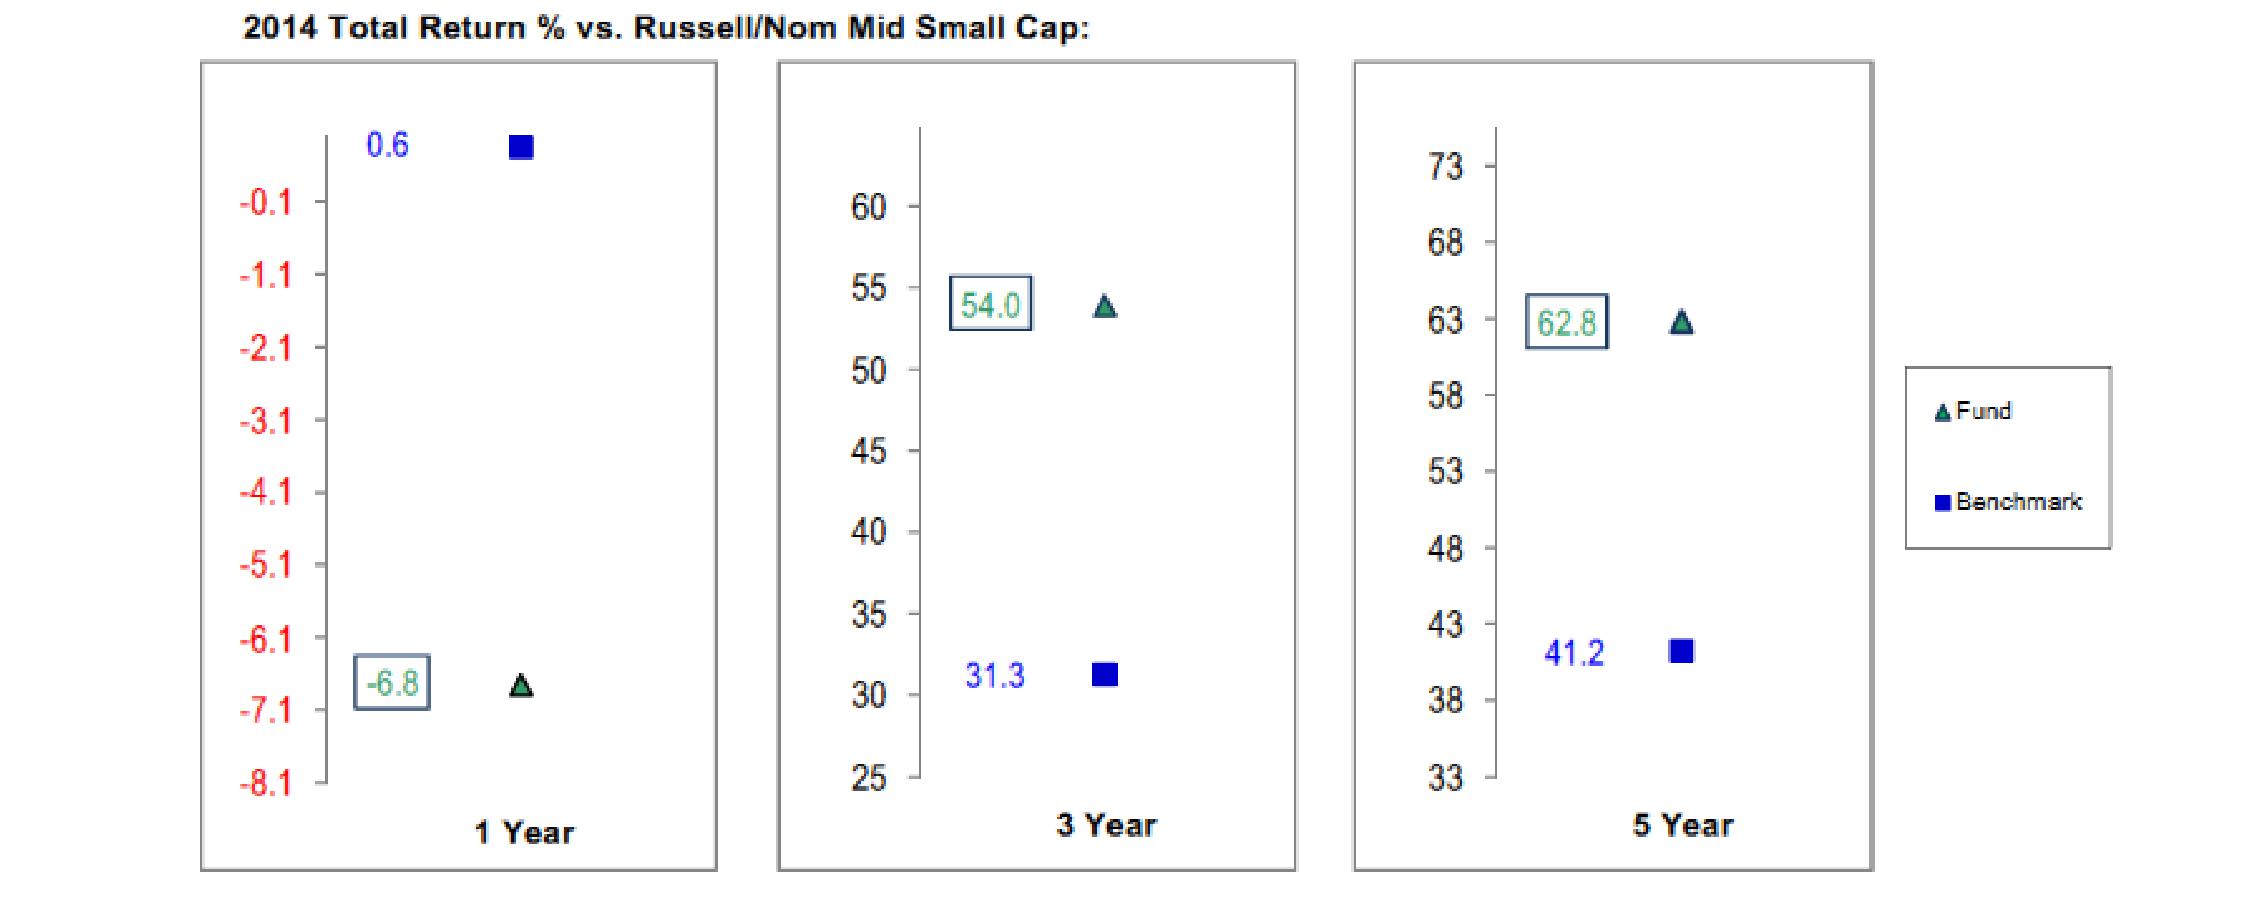
Fidelity Latin America Fund
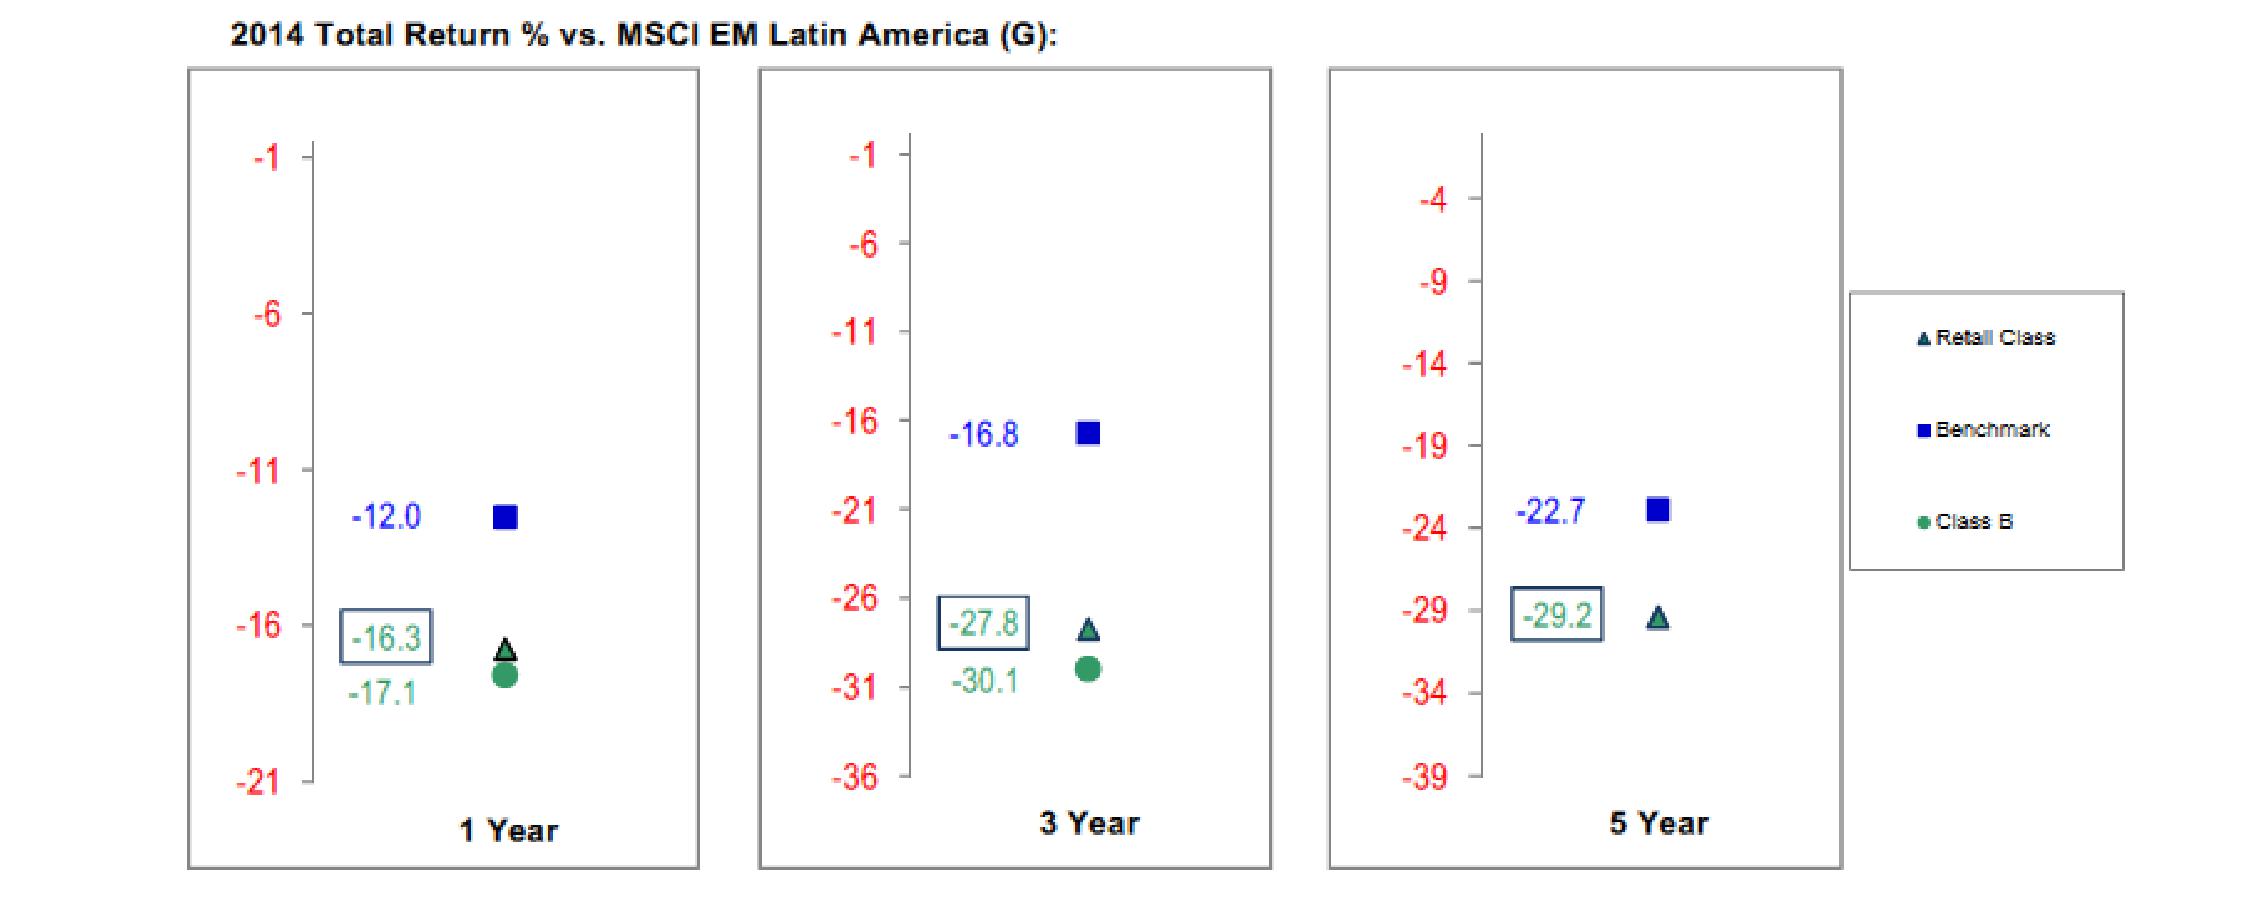
Annual Report
Board Approval of Investment Advisory Contracts and Management Fees - continued
Fidelity Nordic Fund
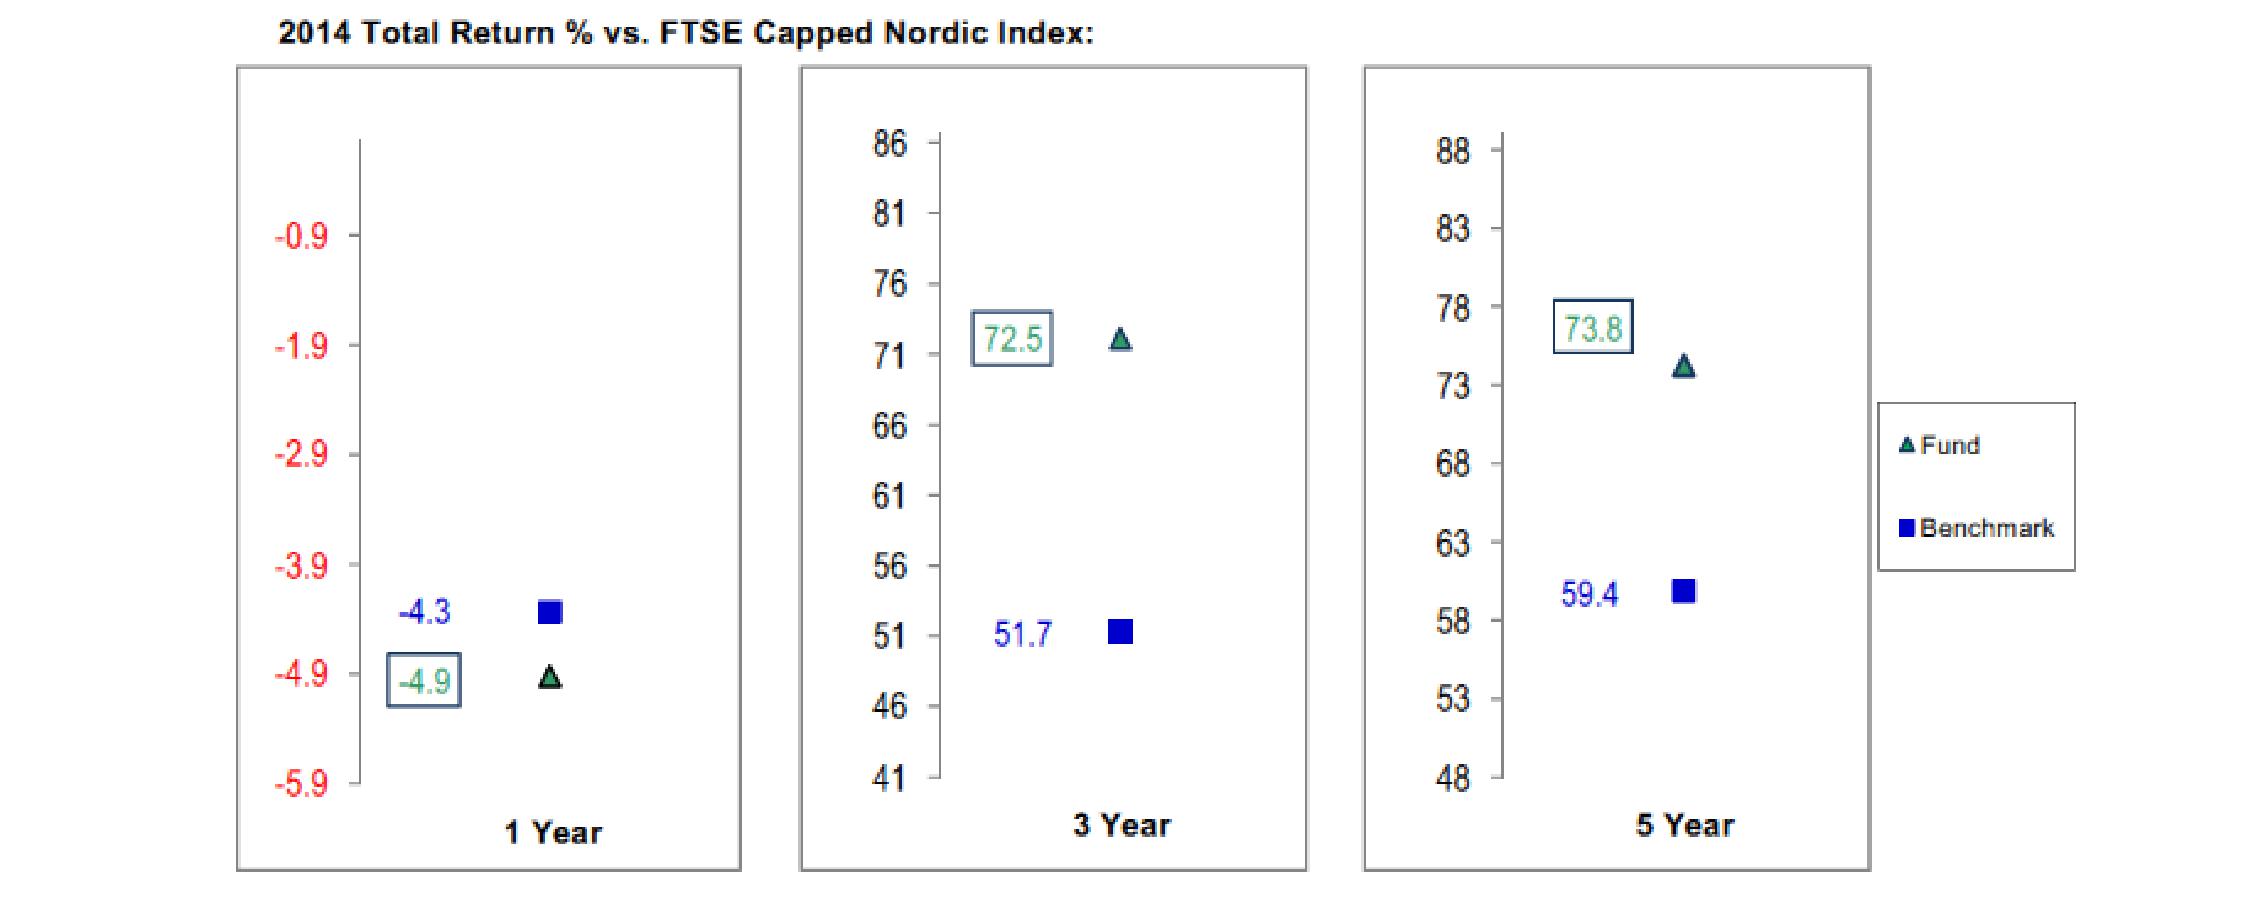
Fidelity Pacific Basin Fund
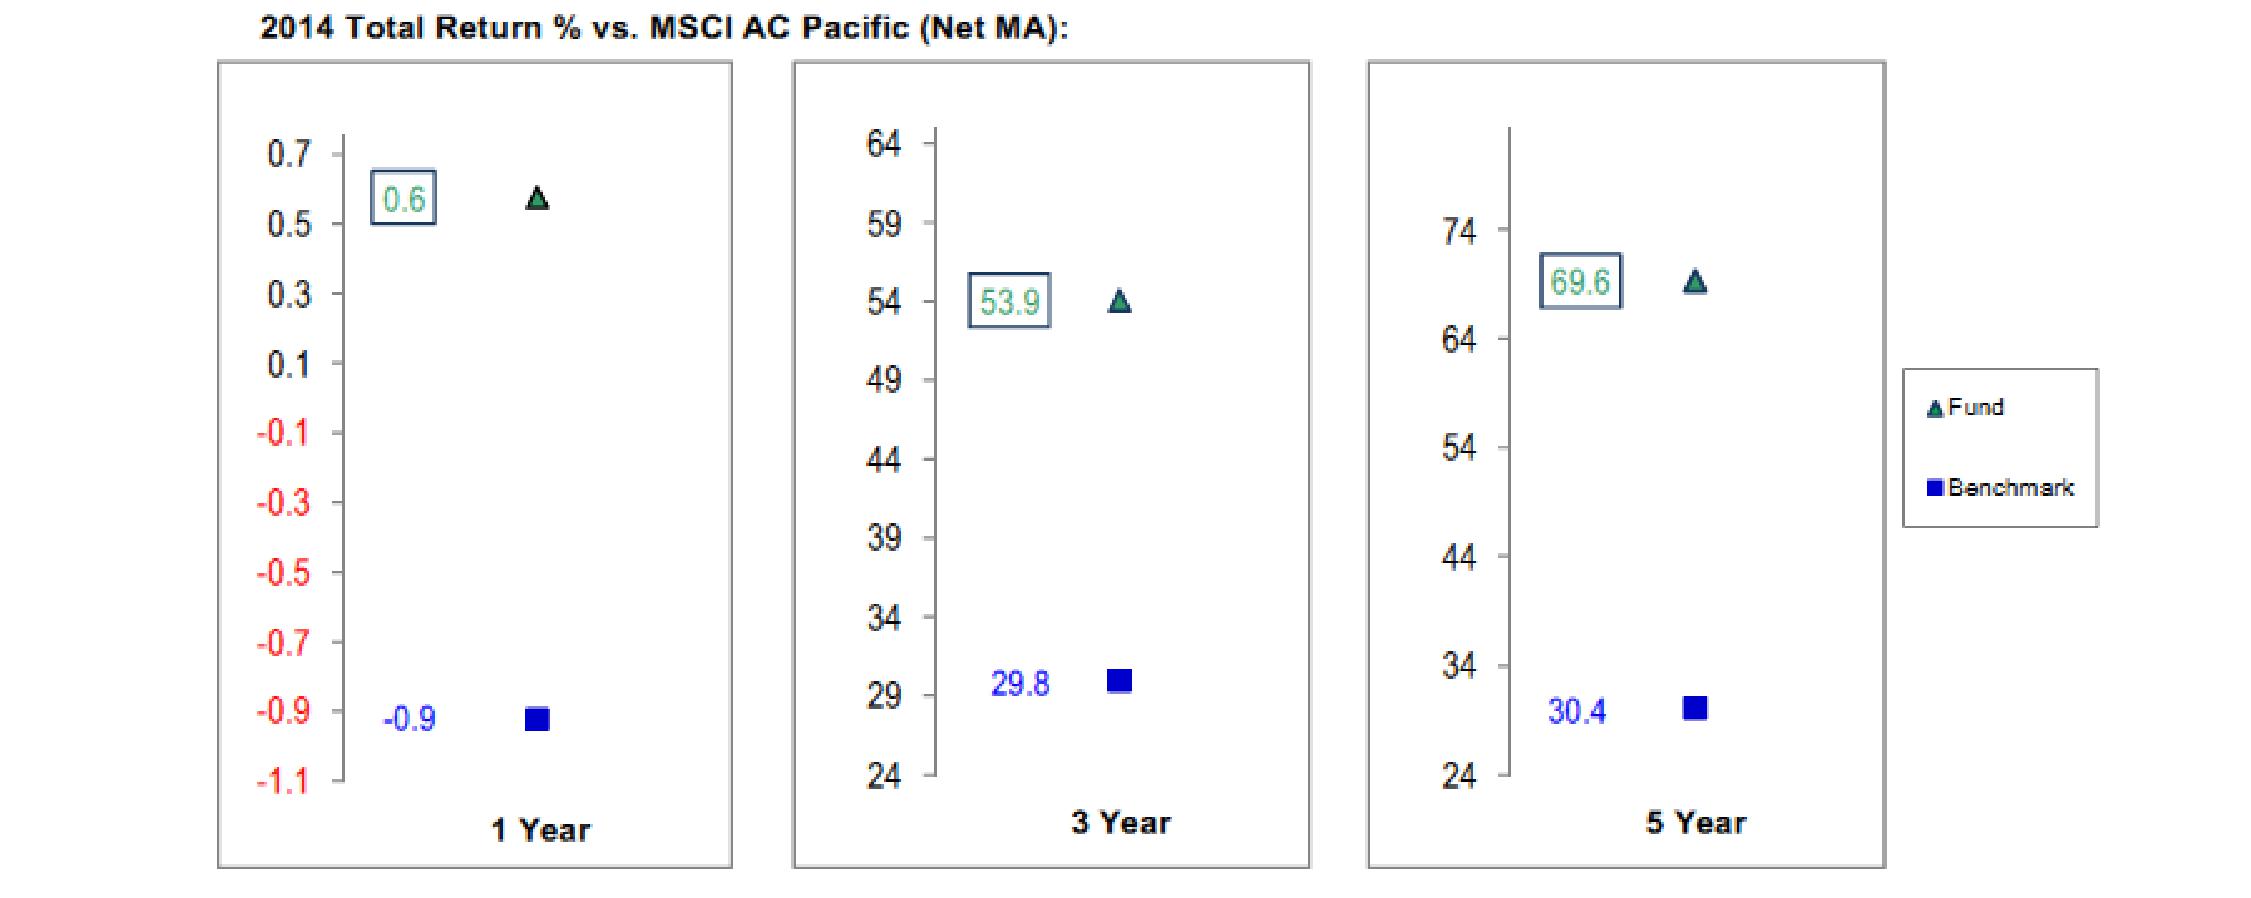
The Board has discussed each of Fidelity Japan Fund's and Fidelity Latin America Fund's underperformance with FMR and has engaged with FMR to consider what steps might be taken to remediate these funds' underperformance.
The Board also considered that each of Fidelity Canada Fund's, Fidelity Emerging Asia Fund's, Fidelity Europe Fund's, Fidelity Japan Fund's, and Fidelity Pacific Basin Fund's management fee is subject to upward or downward adjustment depending upon whether, and to what extent, the fund's investment performance for the performance period exceeds, or is exceeded by, a securities index, thus leading to a performance adjustment for the same period. The Board noted that the performance adjustment provides FMR with a strong economic incentive to seek to achieve superior performance for each fund's shareholders and helps to more closely align the interests of FMR and the shareholders of each fund.
Based on its review, the Board concluded that the nature, extent, and quality of services provided to each fund under the Advisory Contracts should benefit the shareholders of each fund.
Competitiveness of Management Fee and Total Expense Ratio. The Board considered each fund's management fee and total expense ratio compared to "mapped groups" of competitive funds and classes created for the purpose of facilitating the Trustees' competitive analysis of management fees and total expenses. Fidelity creates "mapped groups" by combining similar Lipper investment objective categories that have comparable investment mandates. Combining Lipper investment objective categories aids the Board's management fee and total expense ratio comparisons by broadening the competitive group used for comparison.
Annual Report
Management Fee. The Board considered two proprietary management fee comparisons for the 12-month periods shown in basis points (BP) in the charts below. The group of Lipper funds used by the Board for management fee comparisons is referred to below as the "Total Mapped Group." For Fidelity Japan Fund, the Total Mapped Group is broader than the Lipper peer group used by the Board for performance comparisons because the Total Mapped Group combines several Lipper investment objective categories while the Lipper peer group does not. The Total Mapped Group comparison focuses on a fund's standing in terms of gross management fees before expense reimbursements or caps, and without giving effect to the fund's performance adjustment (if applicable), relative to the total universe of funds with comparable investment mandates, regardless of whether their management fee structures also are comparable. Funds with comparable investment mandates offer exposure to similar types of securities. Funds with comparable management fee structures have similar management fee contractual arrangements (e.g., flat rate charged for advisory services, all-inclusive fee rate, etc.). "TMG %" represents the percentage of funds in the Total Mapped Group that had management fees that were lower than a fund's. For example, a hypothetical TMG % of 20% would mean that 80% of the funds in the Total Mapped Group had higher, and 20% had lower, management fees than a fund. The funds' actual TMG %s and the number of funds in the Total Mapped Group are in the charts below. The "Asset-Size Peer Group" (ASPG) comparison focuses on a fund's standing relative to a subset of non-Fidelity funds within the Total Mapped Group that are similar in size and management fee structure without taking into account performance adjustments, if any. For example, if a fund is in the first quartile of the ASPG, the fund's management fee ranks in the least expensive or lowest 25% of funds in the ASPG. The ASPG represents at least 15% of the funds in the Total Mapped Group with comparable asset size and management fee structures, subject to a minimum of 50 funds (or all funds in the Total Mapped Group if fewer than 50). Additional information, such as the ASPG quartile in which a fund's management fee rate ranked and the impact of a fund's performance adjustment (if applicable), is also included in the charts and considered by the Board.
Fidelity Canada Fund
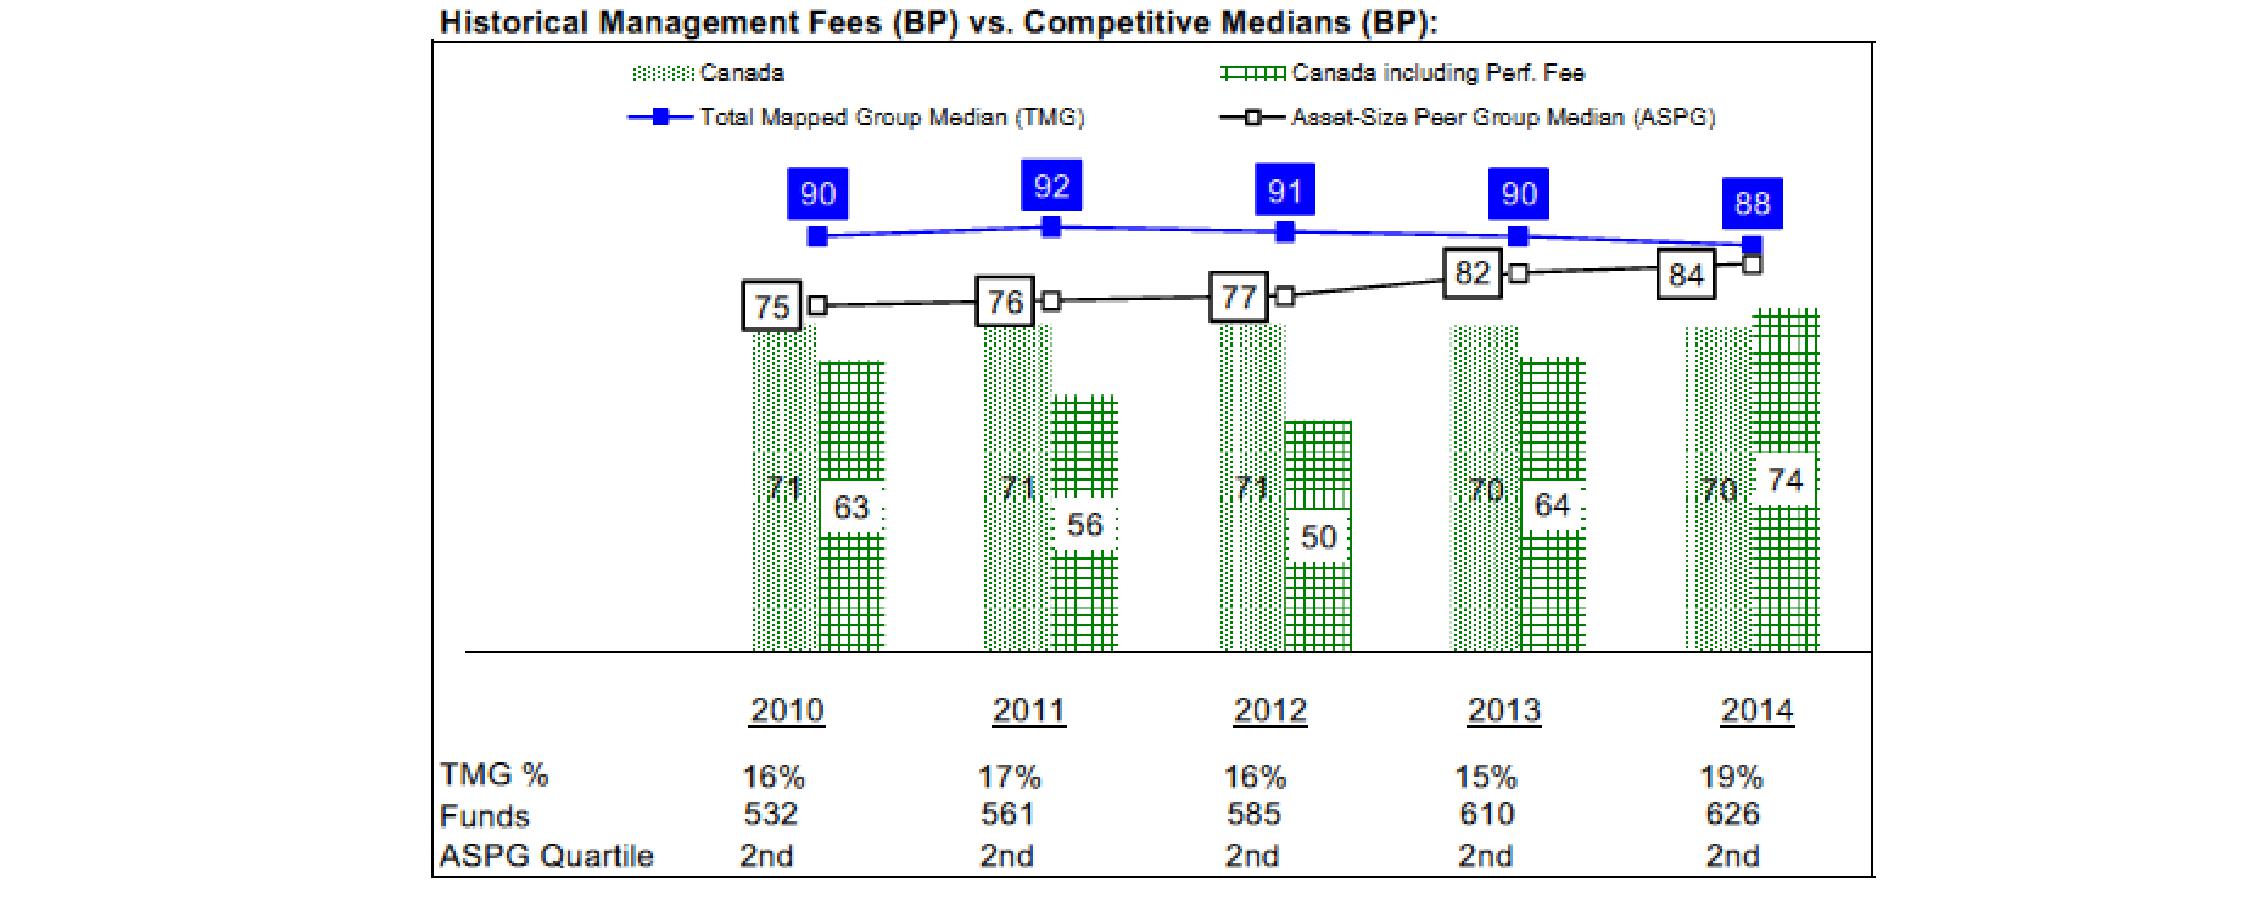
The Board noted that the fund's management fee rate ranked below the median of its Total Mapped Group and below the median of its ASPG for 2014. The Board also noted the effect of the fund's performance adjustment, if any, on the fund's management fee ranking.
Annual Report
Board Approval of Investment Advisory Contracts and Management Fees - continued
Fidelity China Region Fund

The Board noted that the fund's management fee rate ranked below the median of its Total Mapped Group and below the median of its ASPG for 2014.
Fidelity Emerging Asia Fund
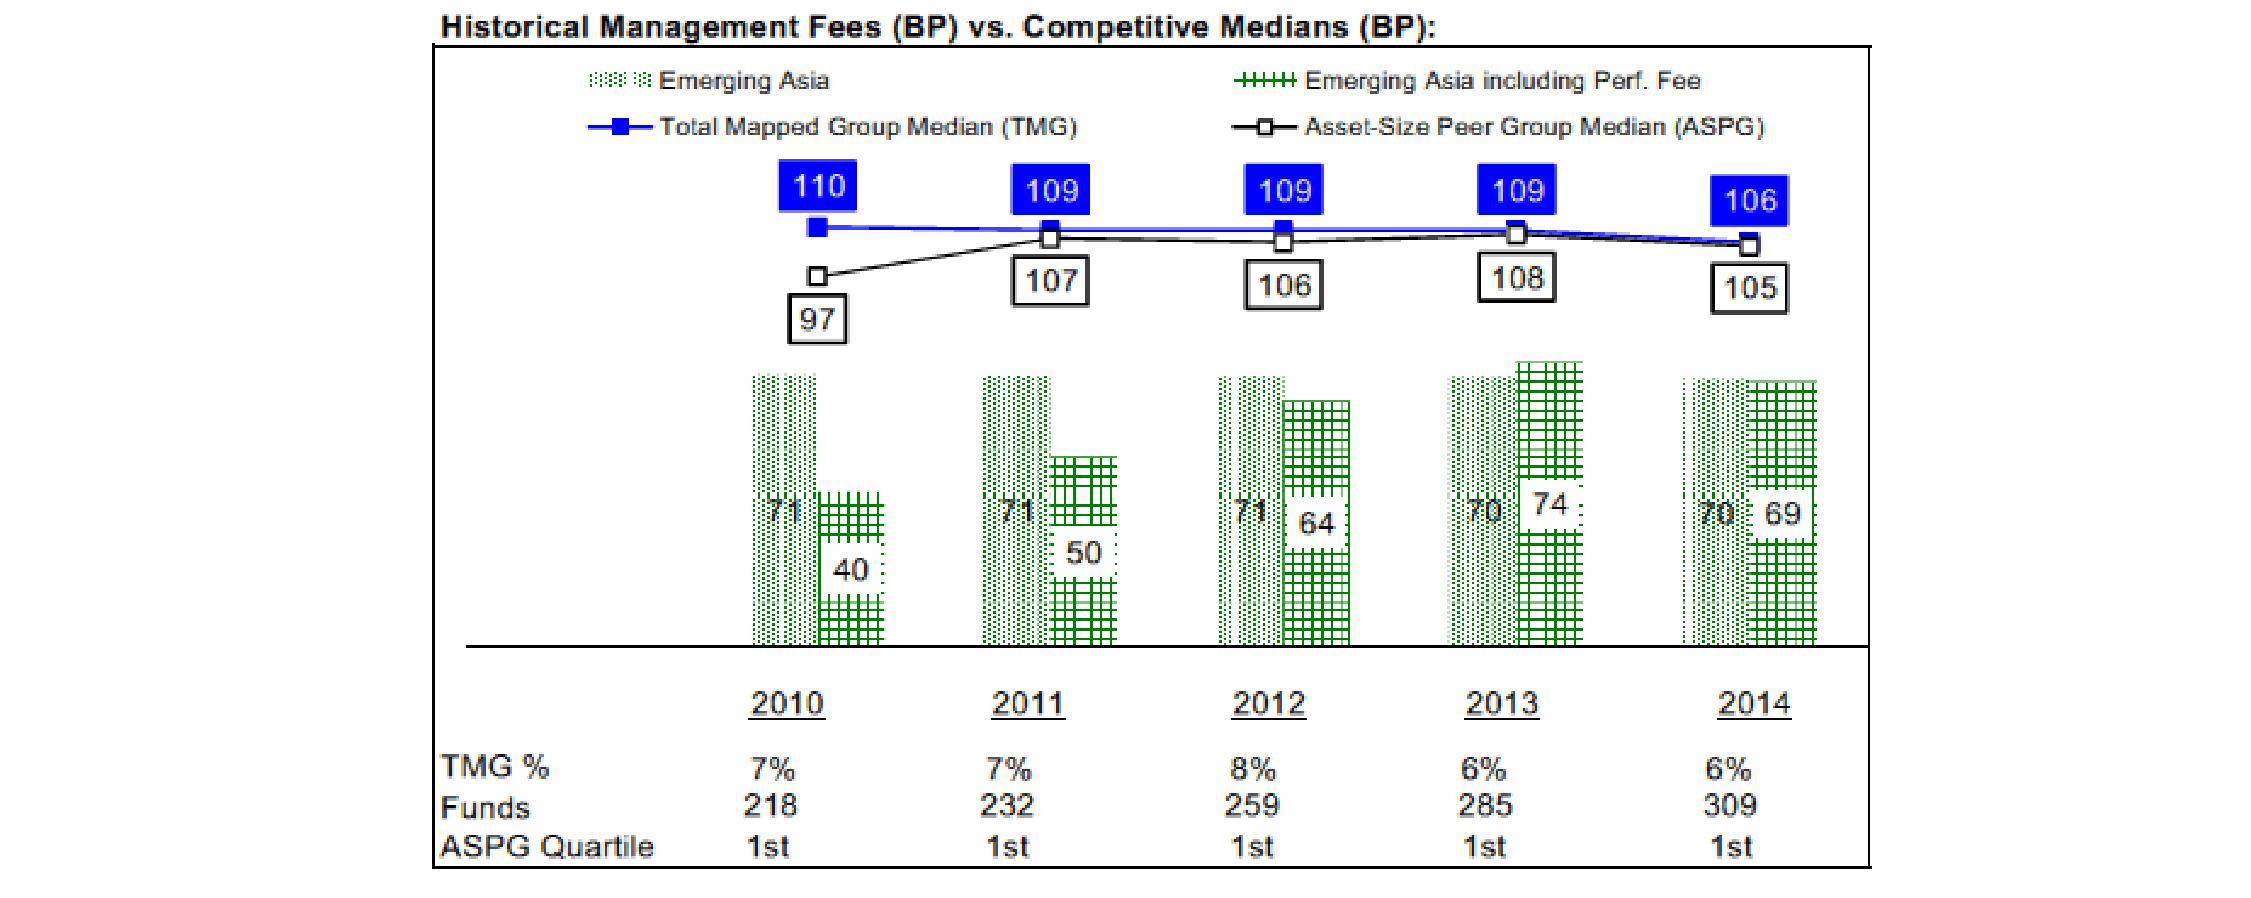
The Board noted that the fund's management fee rate ranked below the median of its Total Mapped Group and below the median of its ASPG for 2014. The Board also noted the effect of the fund's performance adjustment, if any, on the fund's management fee ranking.
Furthermore, the Board considered that shareholders of Fidelity Emerging Asia Fund approved a change in the index used to calculate the fund's performance adjustment, beginning December 1, 2010. The Board also considered that, because the performance adjustment is based on a rolling 36-month measurement period, during a transition period the fund's performance is compared to a blended index return that reflects the performance of the former index for the portion of the measurement period prior to December 1, 2010 and the performance of the current index for the remainder of the measurement period. The Board noted that the fund's performance adjustments for 2010 through 2013 shown in the chart above reflect the effect of using the blended index return to calculate the fund's performance adjustment.
Annual Report
Fidelity Emerging Markets Fund

The Board noted that the fund's management fee rate ranked below the median of its Total Mapped Group and below the median of its ASPG for 2014.
Fidelity Europe Fund

The Board noted that the fund's management fee rate ranked below the median of its Total Mapped Group and below the median of its ASPG for 2014. The Board also noted the effect of the fund's performance adjustment, if any, on the fund's management fee ranking.
Annual Report
Board Approval of Investment Advisory Contracts and Management Fees - continued
Fidelity Japan Fund
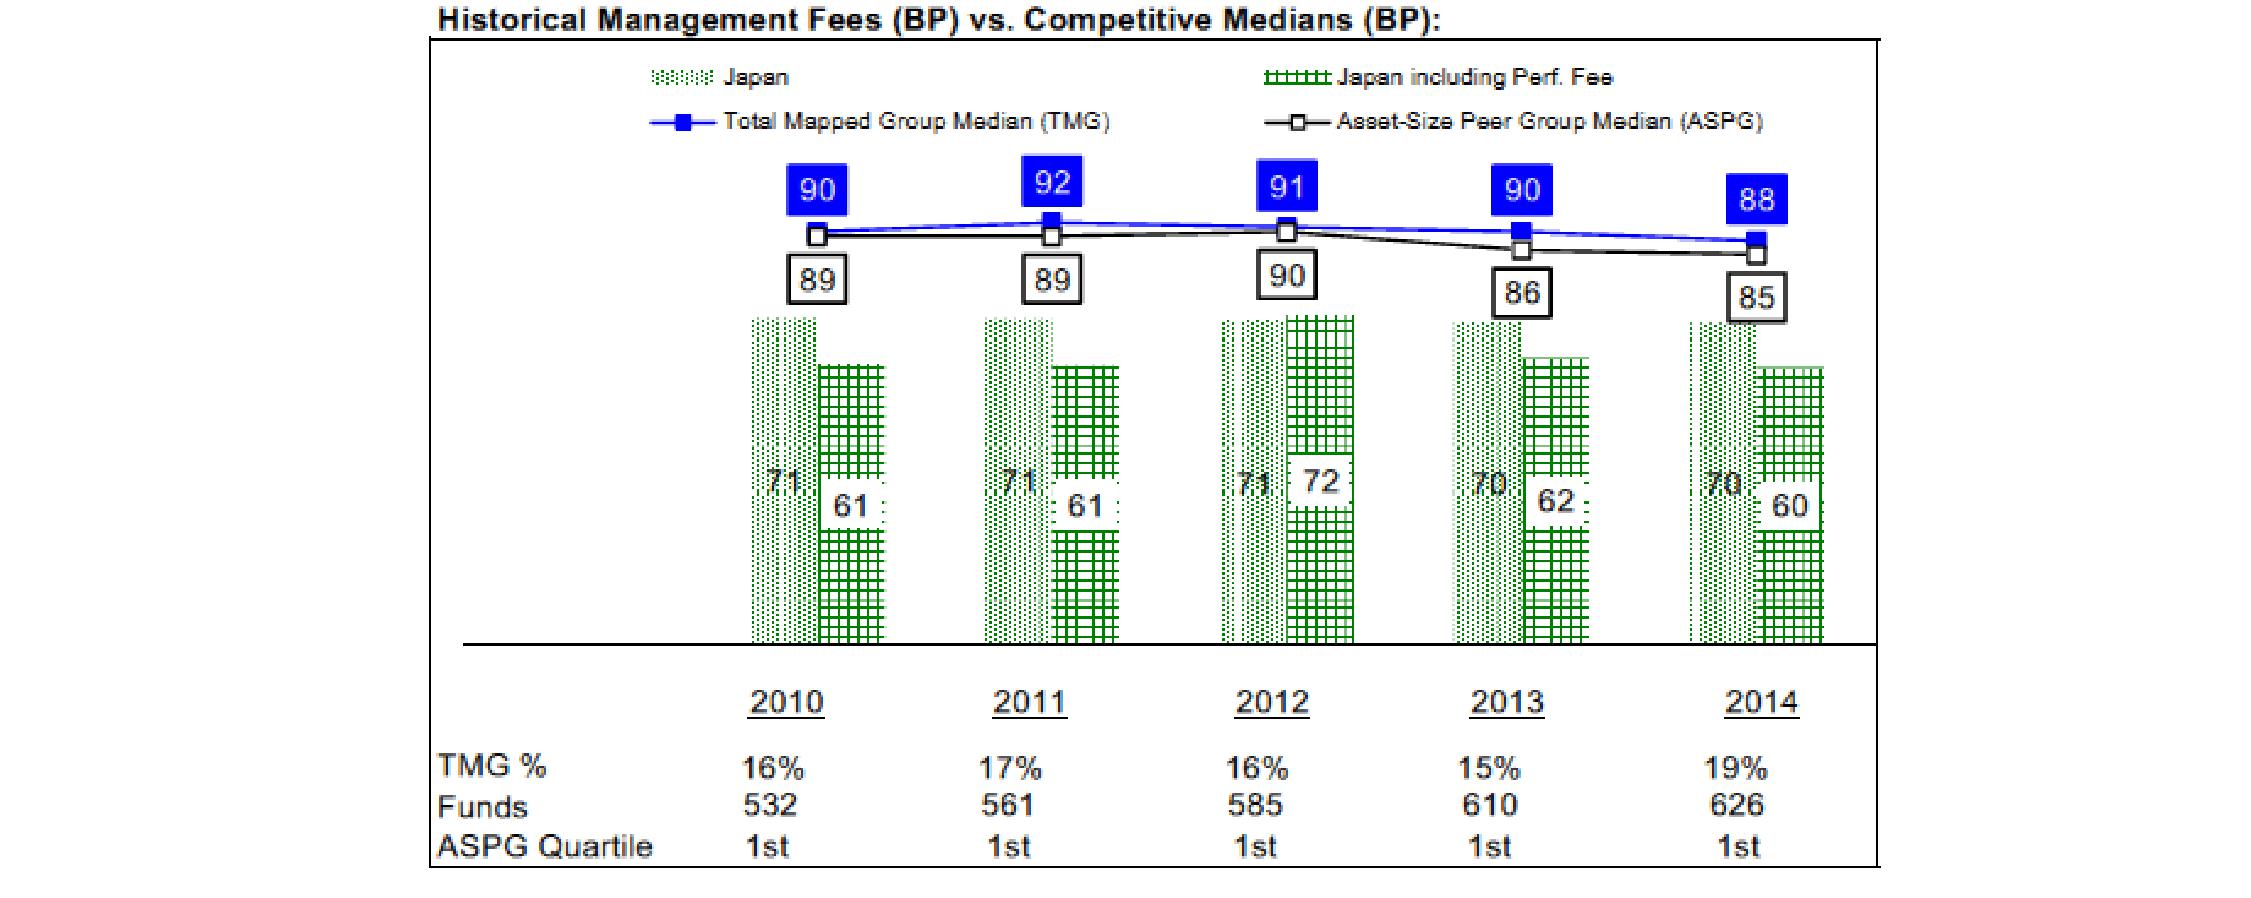
The Board noted that the fund's management fee rate ranked below the median of its Total Mapped Group and below the median of its ASPG for 2014. The Board also noted the effect of the fund's performance adjustment, if any, on the fund's management fee ranking.
Fidelity Japan Smaller Companies Fund
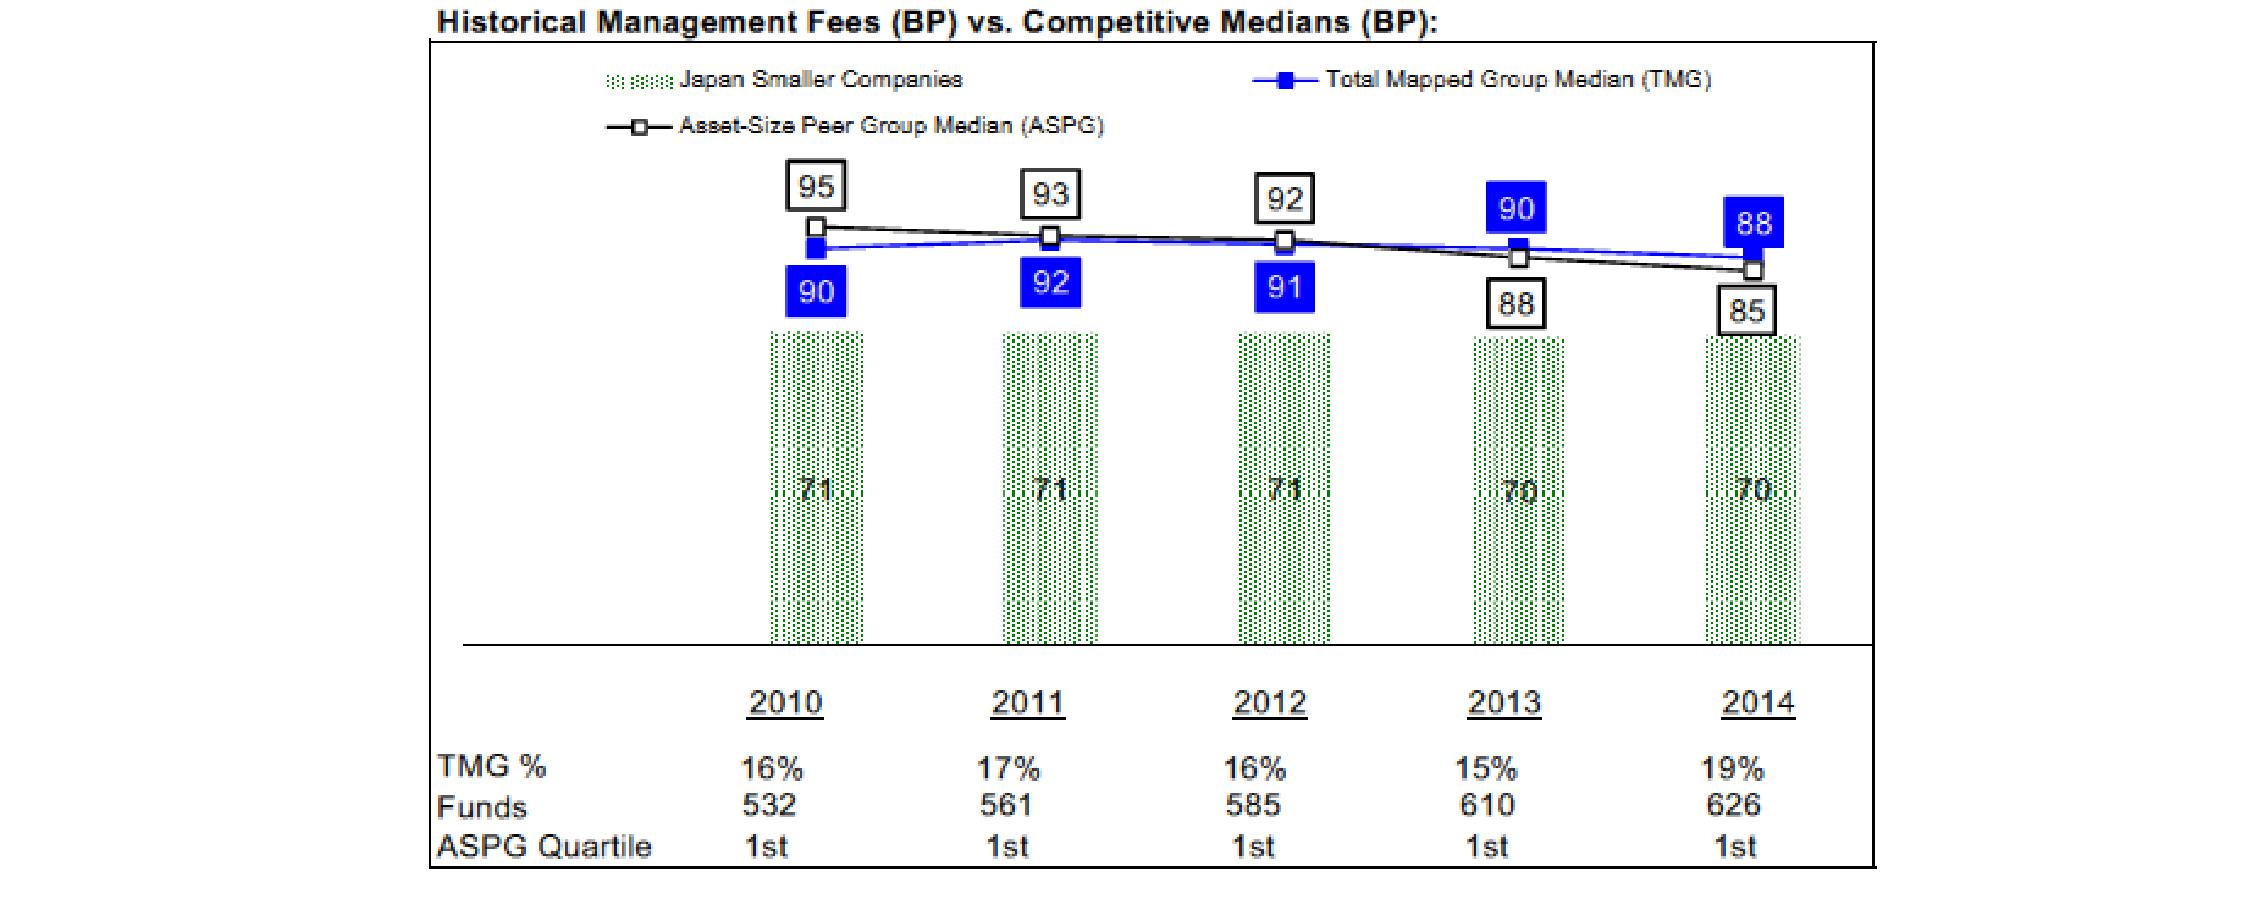
The Board noted that the fund's management fee rate ranked below the median of its Total Mapped Group and below the median of its ASPG for 2014.
Annual Report
Fidelity Latin America Fund

The Board noted that the fund's management fee rate ranked below the median of its Total Mapped Group and below the median of its ASPG for 2014.
Fidelity Nordic Fund
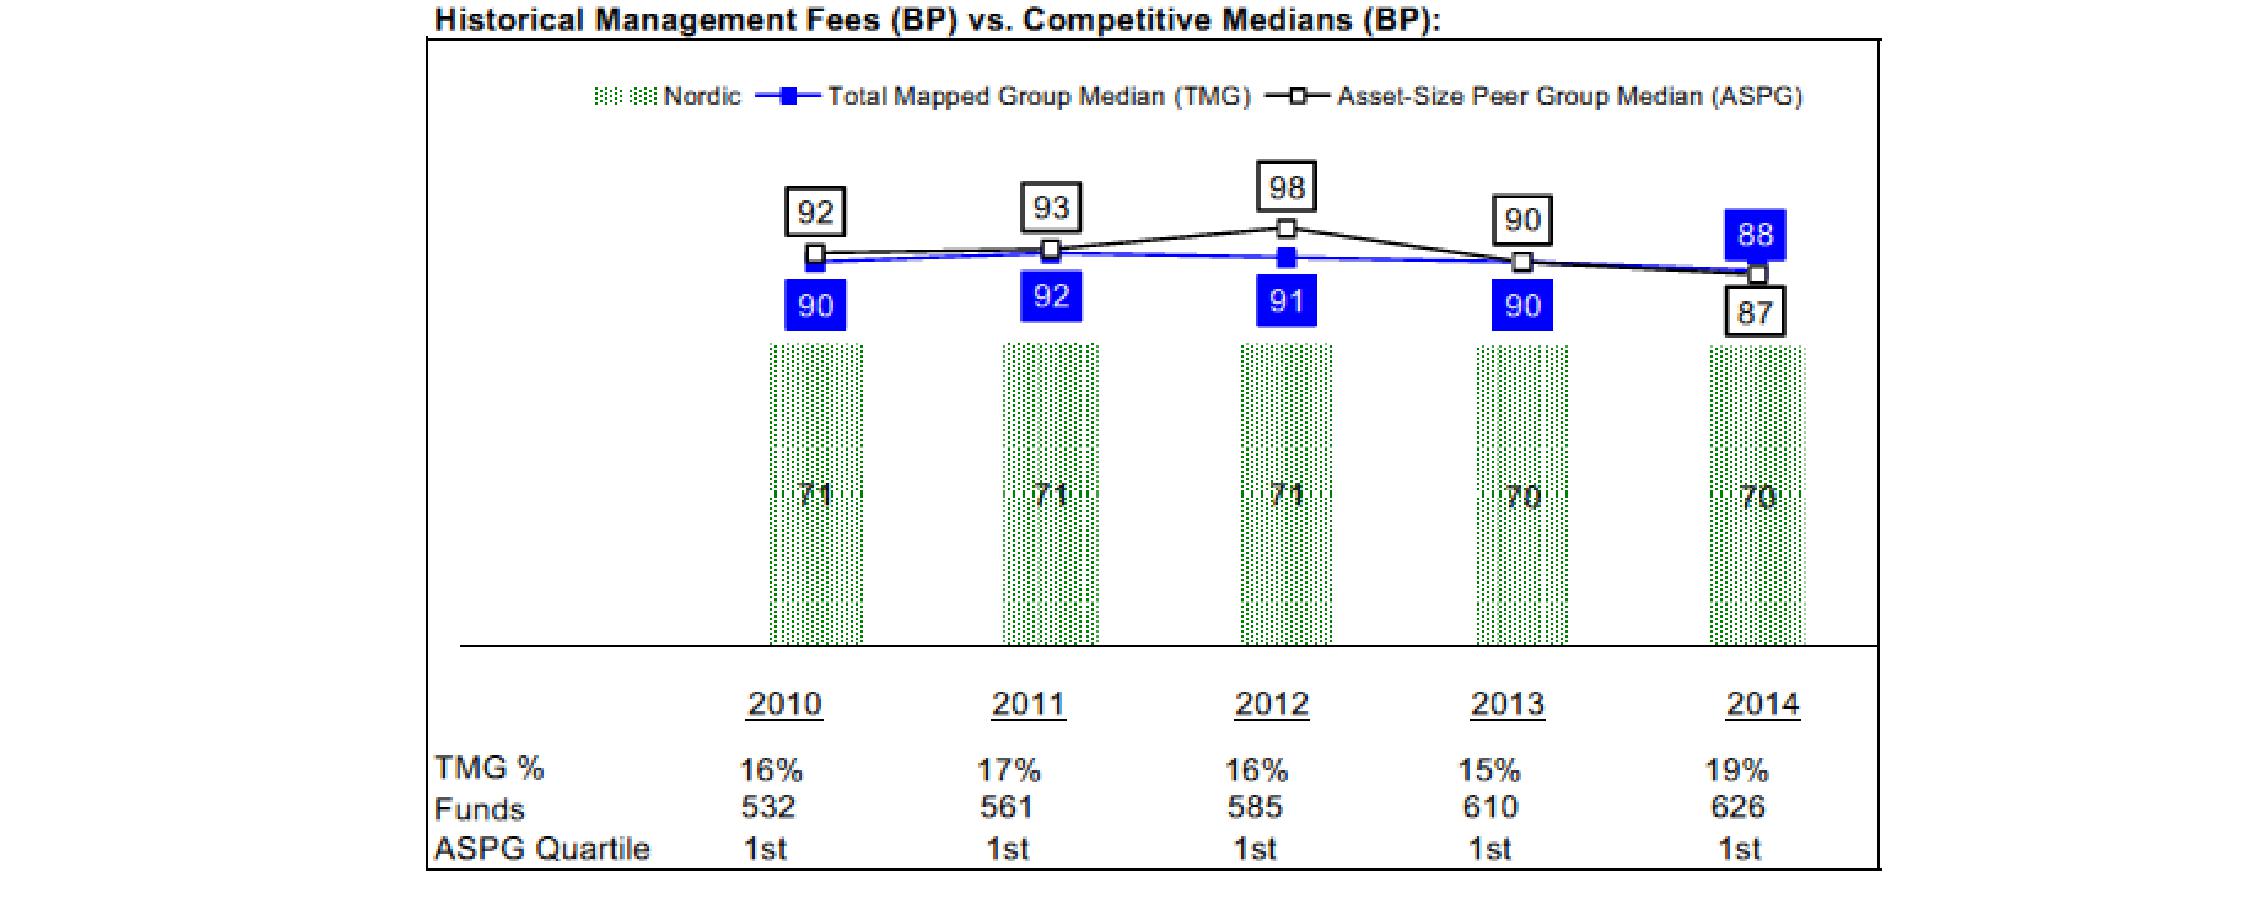
The Board noted that the fund's management fee rate ranked below the median of its Total Mapped Group and below the median of its ASPG for 2014.
Annual Report
Board Approval of Investment Advisory Contracts and Management Fees - continued
Fidelity Pacific Basin Fund
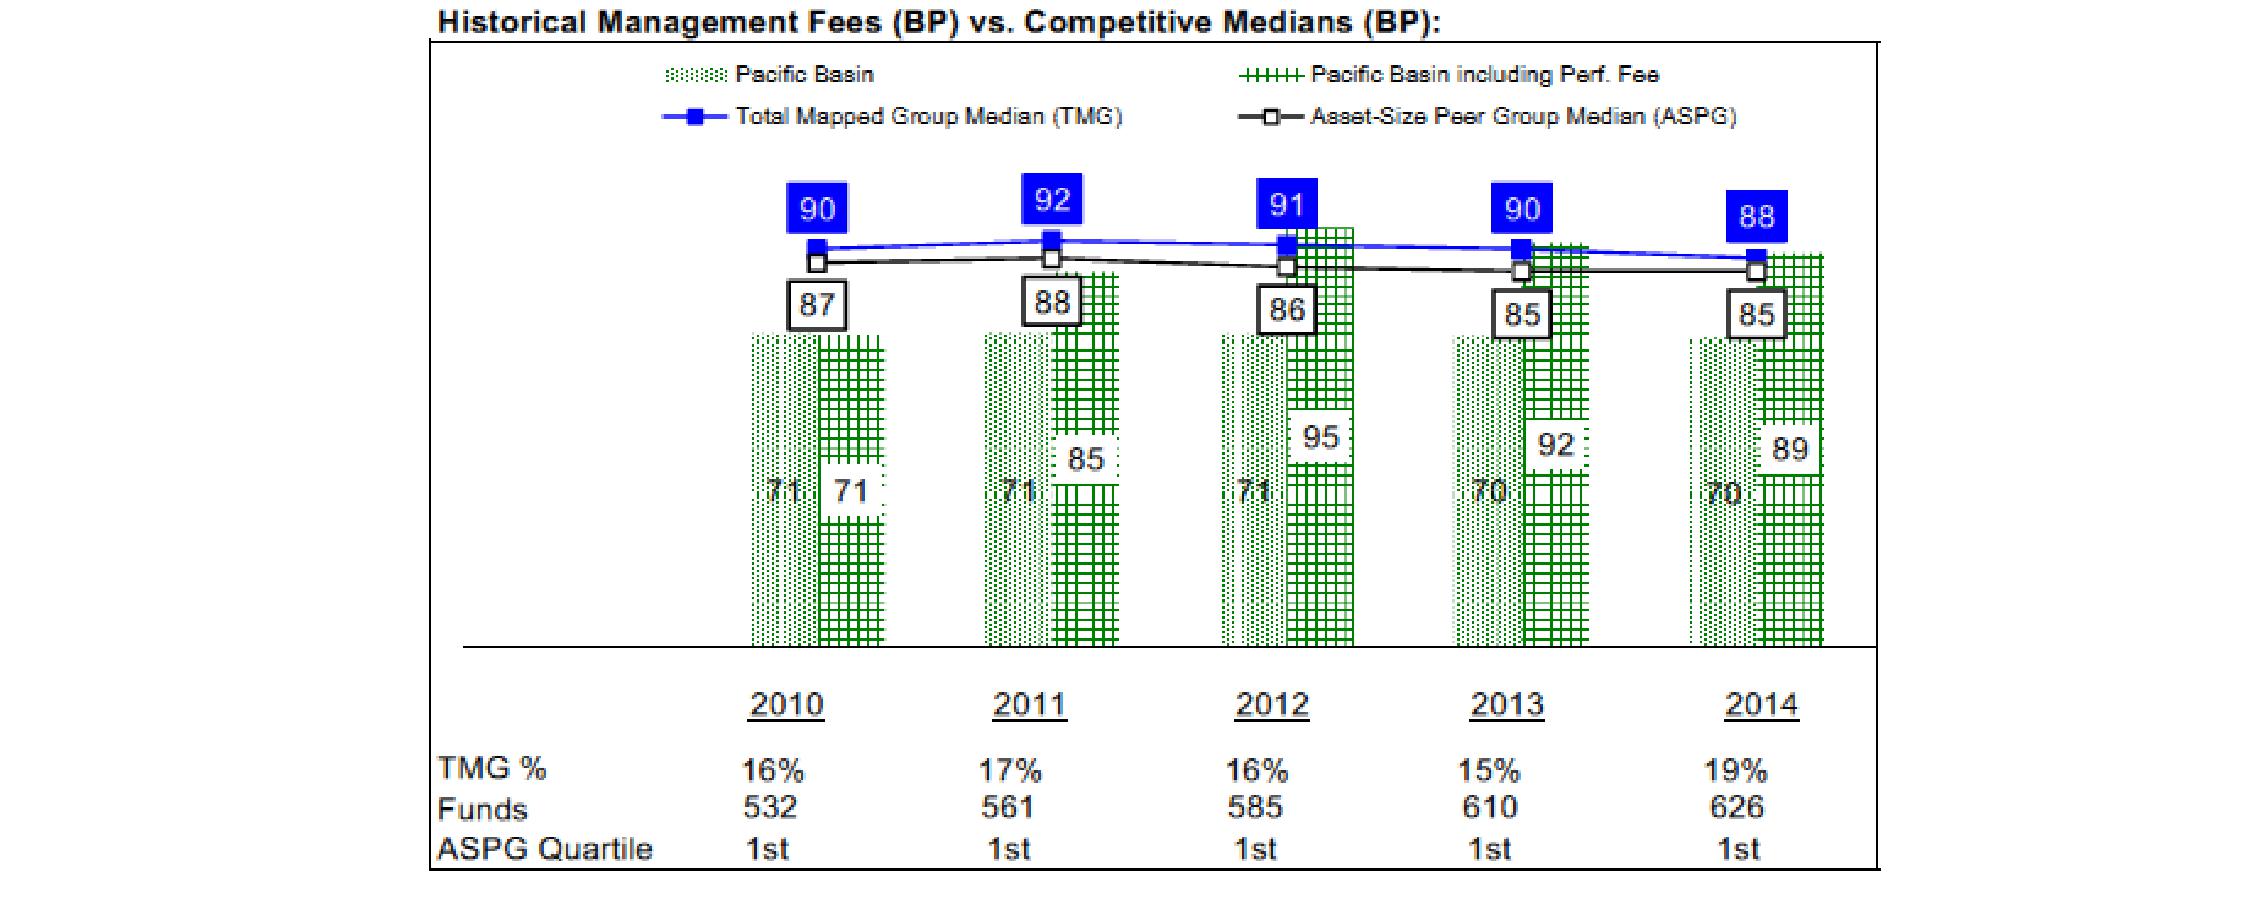
The Board noted that the fund's management fee rate ranked below the median of its Total Mapped Group and below the median of its ASPG for 2014. The Board also noted the effect of the fund's performance adjustment, if any, on the fund's management fee ranking.
The Board noted that, in 2014, the ad hoc Committee on Group Fee was formed by it and other Fidelity fund boards to conduct an in-depth review of the "group fee" component of the management fee of funds with such management fee structures. Committee focus included the mechanics of the group fee, the competitive landscape of group fee structures, Fidelity funds with no group fee component and investment products not included in group fee assets. The Board also considered that, for funds subject to the group fee, FMR agreed to voluntarily waive fees over a specified period of time in amounts designed to account for assets converted from certain funds to certain collective investment trusts.
The Board also noted that, in 2013, the ad hoc Committee on Management Fees was formed to conduct an in-depth review of the management fee rates of Fidelity's active equity mutual funds. The Committee focused on the following areas: (i) standard fee structures; (ii) research consumption and trading evolution; (iii) management fee competitiveness/profitability by category; and (iv) factors that drive institutional pricing.
Based on its review, the Board concluded that each fund's management fee is fair and reasonable in light of the services that the fund receives and the other factors considered.
Total Expense Ratio (for Fidelity Canada Fund, Fidelity China Region Fund, Fidelity Emerging Markets Fund, Fidelity Europe Fund, Fidelity Japan Fund, and Fidelity Latin America Fund). In its review of the total expense ratio of each class of each fund, the Board considered the fund's management fee as well as other fund or class expenses, as applicable, such as transfer agent fees, pricing and bookkeeping fees, fund-paid 12b-1 fees, and custodial, legal, and audit fees. The Board noted the impact of Fidelity Canada Fund's, Fidelity Europe Fund's, and Fidelity Japan Fund's performance adjustment. The Board also noted that Fidelity may agree to waive fees and expenses from time to time, and the extent to which, if any, it has done so for the funds. As part of its review, the Board also considered the current and historical total expense ratios of each class of each fund compared to competitive fund median expenses. Each class of each fund is compared to those funds and classes in the Total Mapped Group (used by the Board for management fee comparisons) that have a similar sales load structure.
For each of Fidelity Canada Fund and Fidelity Japan Fund, the Board noted that the total expense ratio of each of Class A, Class B, Class C, Class I, and the retail class of the funds ranked below its competitive median for 2014 and the total expense ratio of Class T ranked above its competitive median for 2014. For Fidelity Europe Fund, the Board noted that the total expense ratio of each of Class A, Class B, Class I, and the retail class ranked below its competitive median for 2014 and the total expense ratio of each of Class T and Class C ranked above its competitive median for 2014. The Board considered that, in general, various factors can affect total expense ratios. The Board noted that the total expense ratio of Class T was above the competitive median primarily because of higher 12b-1 fees on Class T as compared to most competitor funds. Class T has a higher 12b-1 fee, but a lower front-end sales charge, than traditionally priced front-end sales charge classes. The Board considered that Class T is primarily sold load-waived in the retirement plan market where its 0.50% 12b-1 fee is comparable to competing no-load, higher 12b-1 fee classes designed specifically for retirement plans. The Board noted that the funds offer multiple classes, each of which has a different sales load and 12b-1 fee structure, and that the multiple structures are intended to offer a range of pricing options for the intermediary market. The Board also noted that the total expense ratios of the classes vary primarily by the level of their 12b-1 fees, although differences in transfer agent fees may also cause expenses to vary from class to class.
Annual Report
The Board noted that the total expense ratio of each class of Fidelity China Region Fund, Fidelity Emerging Markets Fund, and Fidelity Latin America Fund ranked below its competitive median for 2014.
Total Expense Ratio (for Fidelity Emerging Asia Fund, Fidelity Japan Smaller Companies Fund, Fidelity Nordic Fund, and Fidelity Pacific Basin Fund). In its review of each fund's total expense ratio, the Board considered the fund's management fee as well as other fund expenses, such as transfer agent fees, pricing and bookkeeping fees, and custodial, legal, and audit fees. The Board noted the impact of Fidelity Emerging Asia Fund's and Fidelity Pacific Basin Fund's performance adjustment. The Board also noted that Fidelity may agree to waive fees and expenses from time to time, and the extent to which, if any, it has done so for the funds. As part of its review, the Board also considered the current and historical total expense ratios of each fund compared to competitive fund median expenses. Each fund is compared to those funds and classes in the Total Mapped Group (used by the Board for management fee comparisons) that have a similar sales load structure.
The Board noted that the total expense ratio of each of Fidelity Emerging Asia Fund, Fidelity Japan Smaller Companies Fund, Fidelity Nordic Fund, and Fidelity Pacific Basin Fund ranked below its competitive median for 2014.
Fees Charged to Other Fidelity Clients. The Board also considered Fidelity fee structures and other information with respect to clients of Fidelity, such as other funds advised or subadvised by Fidelity, pension plan clients, and other institutional clients with similar mandates. The Board noted the findings of the 2013 ad hoc joint committee (created with the board of other Fidelity funds), which reviewed and compared Fidelity's institutional investment advisory business with its business of providing services to the Fidelity funds, including the differences in services provided, fees charged, and costs incurred, as well as competition in their respective marketplaces.
Based on its review of total expense ratios and fees charged to other Fidelity clients, the Board concluded that, although Class T of each of Fidelity Canada Fund, Fidelity Europe Fund, and Fidelity Japan Fund and Class C of Fidelity Europe Fund were above the median of the universe presented for comparison, the total expense ratio of each fund or each class of each fund, as applicable, was reasonable in light of the services that the fund and its shareholders receive and the other factors considered.
Costs of the Services and Profitability. The Board considered the revenues earned and the expenses incurred by Fidelity in conducting the business of developing, marketing, distributing, managing, administering and servicing each fund and servicing each fund's shareholders. The Board also considered the level of Fidelity's profits in respect of all the Fidelity funds.
On an annual basis, Fidelity presents to the Board information about the profitability of its relationship with each fund. Fidelity calculates profitability information for each fund, as well as aggregate profitability information for groups of Fidelity funds and all Fidelity funds, using a series of detailed revenue and cost allocation methodologies which originate with the books and records of Fidelity on which Fidelity's audited financial statements are based. The Audit Committee of the Board reviews any significant changes from the prior year's methodologies.
PricewaterhouseCoopers LLP (PwC), independent registered public accounting firm and auditor to Fidelity and certain Fidelity funds, has been engaged annually by the Board as part of the Board's assessment of Fidelity's profitability analysis. PwC's engagement includes the review and assessment of the methodologies used by Fidelity in determining the revenues and expenses attributable to Fidelity's mutual fund business, and completion of agreed-upon procedures in respect of the mathematical accuracy of fund profitability and its conformity to established allocation methodologies. After considering PwC's reports issued under the engagement and information provided by Fidelity, the Board concluded that while other allocation methods may also be reasonable, Fidelity's profitability methodologies are reasonable in all material respects.
The Board also reviewed Fidelity's non-fund businesses and fall-out benefits related to the mutual fund business as well as cases where Fidelity's affiliates may benefit from or be related to the funds' business.
The Board considered the costs of the services provided by and the profits realized by Fidelity in connection with the operation of each fund and was satisfied that the profitability was not excessive.
Economies of Scale. The Board considered whether there have been economies of scale in respect of the management of the Fidelity funds, whether the Fidelity funds (including each fund) have appropriately benefited from any such economies of scale, and whether there is potential for realization of any further economies of scale. The Board considered the extent to which each fund will benefit from economies of scale as assets grow through increased services to the fund, through waivers or reimbursements, or through fee or expense ratio reductions. The Board also noted that in 2013, it and the boards of other Fidelity funds created an ad hoc committee (the Economies of Scale Committee) to analyze whether Fidelity attains economies of scale in respect of the management and servicing of the Fidelity funds, whether the Fidelity funds have appropriately benefited from such economies of scale, and whether there is potential for realization of any further economies of scale.
The Board recognized that each fund's management contract incorporates a "group fee" structure, which provides for lower group fee rates as total group assets increase, and for higher group fee rates as total group assets decrease (with "group assets" defined to include fund assets under FMR's management plus sector fund assets previously under FMR's management and currently managed by Fidelity SelectCo, LLC). FMR calculates the group fee rates based on a tiered asset "breakpoint" schedule that varies based on asset class. The Board considered that the group fee is designed to deliver the benefits of economies of scale to fund shareholders when total Fidelity fund assets increase, even if assets of any particular fund are unchanged or have declined, because some portion of Fidelity's costs are attributable to services provided to all Fidelity funds, and all funds benefit if those costs can be allocated among more assets. The Board concluded that, given the group fee structure, fund shareholders will benefit from lower management fees as group assets increase at the fund complex level, regardless of whether Fidelity achieves any such economies of scale.
Annual Report
Board Approval of Investment Advisory Contracts and Management Fees - continued
The Board concluded, taking into account the analysis of the Economies of Scale Committee, that economies of scale, if any, are being appropriately shared between fund shareholders and Fidelity.
Additional Information Requested by the Board. In order to develop fully the factual basis for consideration of the Fidelity funds' Advisory Contracts, the Board requested and received additional information on certain topics, including: (i) fund performance trends and Fidelity's long-term strategies for certain funds; (ii) the various share classes employed by Fidelity and the attributes of each class, together with similar information on the distribution and servicing payments made by Fidelity or the funds to third-party participants in the distribution channels; (iii) fund profitability, and fund performance in relation to fund profitability; (iv) the methodology with respect to evaluating competitive fund data and peer group classifications and fee comparisons; (v) annual fund profitability margins, with particular focus on certain funds with negative margins; (vi) the realization of fall-out benefits in certain Fidelity business units; (vii) economies of scale and the way in which they are shared with fund shareholders; (viii) Fidelity's group fee structures, including the group fee schedule of breakpoints; (ix) the impact of cost containment measures on the funds; and (x) the transfer agent fee structure.
Based on its evaluation of all of the conclusions noted above, and after considering all factors it believed relevant, the Board concluded that the advisory fee structures are fair and reasonable, and that each fund's Advisory Contracts should be renewed.
Annual Report
Investment Adviser
Fidelity Management & Research Company
Boston, MA
Investment Sub-Advisers
FMR Co., Inc.
FMR Investment Management
(U.K.) Limited
Fidelity Management & Research
(Hong Kong) Limited
Fidelity Management & Research
(Japan) Limited
FIL Investment Advisors
FIL Investment Advisors
(UK) Limited
FIL Investments (Japan) Limited
Fidelity China Region Fund, Fidelity Emerging Asia Fund,
Fidelity Emerging Markets Fund, Fidelity Japan Fund, Fidelity Japan Smaller Companies Fund, Fidelity Pacific Basin Fund
General Distributor
Fidelity Distributors Corporation
Smithfield, RI
Transfer and Service Agents
Fidelity Investments Institutional
Operations Company, Inc.
Boston, MA
Fidelity Service Company, Inc.
Boston, MA
Custodians
JPMorgan Chase Bank
New York, NY
Fidelity Emerging Markets Fund, Fidelity Japan Fund,
Fidelity Pacific Basin Fund
Brown Brothers Harriman & Co.
Boston, MA
Fidelity China Region Fund, Fidelity Latin America Fund,
Fidelity Nordic Fund
State Street Bank and Trust Company
Quincy, MA
Fidelity Canada Fund, Fidelity Europe Fund
The Northern Trust Company
Chicago, IL
Fidelity Emerging Asia Fund,
Fidelity Japan Smaller Companies Fund
Fidelity's International Equity Funds
Fidelity Canada Fund
Fidelity China Region Fund
Fidelity Diversified International Fund
Fidelity Emerging Asia Fund
Fidelity Emerging Europe, Middle East, Africa (EMEA) Fund
Fidelity Emerging Markets Discovery Fund
Fidelity Emerging Markets Fund
Fidelity Europe Fund
Fidelity Global Balanced Fund
Fidelity Global Commodity Stock Fund
Fidelity Global Equity Income Fund
Fidelity Global Strategies Fund
Fidelity International Capital Appreciation Fund
Fidelity International Discovery Fund
Fidelity International Growth Fund
Fidelity International Small Cap Fund
Fidelity International Small Cap Opportunities Fund
Fidelity International Value Fund
Fidelity Japan Fund
Fidelity Japan Smaller Companies Fund
Fidelity Latin America Fund
Fidelity Nordic Fund
Fidelity Overseas Fund
Fidelity Pacific Basin Fund
Fidelity Total Emerging Markets Fund
Fidelity Total International Equity Fund
Fidelity Worldwide Fund
Corporate Headquarters
245 Summer St.,
Boston, MA 02210
www.fidelity.com
The Fidelity Telephone Connection
Mutual Fund 24-Hour Service
Exchanges/Redemptions
and Account Assistance 1-800-544-6666
Product Information 1-800-544-6666
Retirement Accounts 1-800-544-4774
(8 a.m. - 9 p.m.)
TDD Service 1-800-544-0118
for the deaf and hearing impaired
(9 a.m. - 9 p.m. Eastern time)
Fidelity Automated Service
Telephone (FAST®)
1-800-544-5555

Automated line for quickest service
TIF-UANNPRO-1215
1.784781.112
ContentsPerformance: The Bottom LineManagement's Discussion of Fund PerformanceShareholder Expense ExampleInvestment Changes (Unaudited)Investments October 31, 2015Financial StatementsNotes to Financial StatementsReport of Independent Registered Public Accounting FirmTrustees and OfficersDistributions (Unaudited)Board Approval of Investment Advisory Contracts and Management Fees
Fidelity®
Emerging Markets
Fund -
Class K
Annual Report
October 31, 2015
(Fidelity Cover Art)
Contents
Performance | (Click Here) | How the fund has done over time. |
Management's Discussion of Fund Performance | (Click Here) | The Portfolio Manager's review of fund performance and strategy. |
Shareholder Expense Example | (Click Here) | An example of shareholder expenses. |
Investment Changes | (Click Here) | A summary of major shifts in the fund's investments over the past six months. |
Investments | (Click Here) | A complete list of the fund's investments with their market values. |
Financial Statements | (Click Here) | Statements of assets and liabilities, operations, and changes in net assets, as well as financial highlights. |
Notes | (Click Here) | Notes to the financial statements. |
Report of Independent Registered Public Accounting Firm | (Click Here) | |
Trustees and Officers | (Click Here) | |
Distributions | (Click Here) | |
Board Approval of Investment Advisory Contracts and Management Fees | (Click Here) | |
To view a fund's proxy voting guidelines and proxy voting record for the 12-month period ended June 30, visit http://www.fidelity.com/proxyvotingresults or visit the Securities and Exchange Commission's (SEC) web site at http://www.sec.gov. You may also call 1-800-835-5092 to request a free copy of the proxy voting guidelines.
Standard & Poor's, S&P and S&P 500 are registered service marks of The McGraw-Hill Companies, Inc. and have been licensed for use by Fidelity Distributors Corporation.
Other third-party marks appearing herein are the property of their respective owners.
All other marks appearing herein are registered or unregistered trademarks or service marks of FMR LLC or an affiliated company. © 2015 FMR LLC. All rights reserved.
This report and the financial statements contained herein are submitted for the general information of the shareholders of the fund. This report is not authorized for distribution to prospective investors in the fund unless preceded or accompanied by an effective prospectus.
A fund files its complete schedule of portfolio holdings with the SEC for the first and third quarters of each fiscal year on Form N-Q. Forms N-Q are available on the SEC's web site at http://www.sec.gov. A fund's Forms N-Q may be reviewed and copied at the SEC's Public Reference Room in Washington, DC. Information regarding the operation of the SEC's Public Reference Room may be obtained by calling 1-800-SEC-0330. For a complete list of a fund's portfolio holdings, view the most recent holdings listing, semiannual report, or annual report on Fidelity's web site at http://www.fidelity.com, http://www.advisor.fidelity.com, or http://www.401k.com, as applicable.
NOT FDIC INSURED • MAY LOSE VALUE • NO BANK GUARANTEE
Neither the fund nor Fidelity Distributors Corporation is a bank.
Annual Report
Average annual total return reflects the change in the value of an investment, assuming reinvestment of the class' distributions from dividend income and capital gains (the profits earned upon the sale of securities that have grown in value, if any) and assuming a constant rate of performance each year. The $10,000 table and the fund's returns do not reflect the deduction of taxes that a shareholder would pay on fund distributions or the redemption of fund shares. During periods of reimbursement by Fidelity, a fund's total return will be greater than it would be had the reimbursement not occurred. How a fund did yesterday is no guarantee of how it will do tomorrow.
Average Annual Total Returns
Periods ended October 31, 2015 | Past 1
year | Past 5
years | Past 10
years |
Class K A | -10.60% | -1.43% | 5.37% |
A The initial offering of Class K shares took place on May 9, 2008. Returns prior to May 9, 2008, are those of Fidelity® Emerging Markets Fund, the original class of the fund.
$10,000 Over 10 Years
Let's say hypothetically that $10,000 was invested in Fidelity® Emerging Markets Fund - Class K on October 31, 2005. The chart shows how the value of your investment would have changed, and also shows how the MSCI Emerging Markets Index performed over the same period. See footnote A above for additional information regarding the performance of Class K.
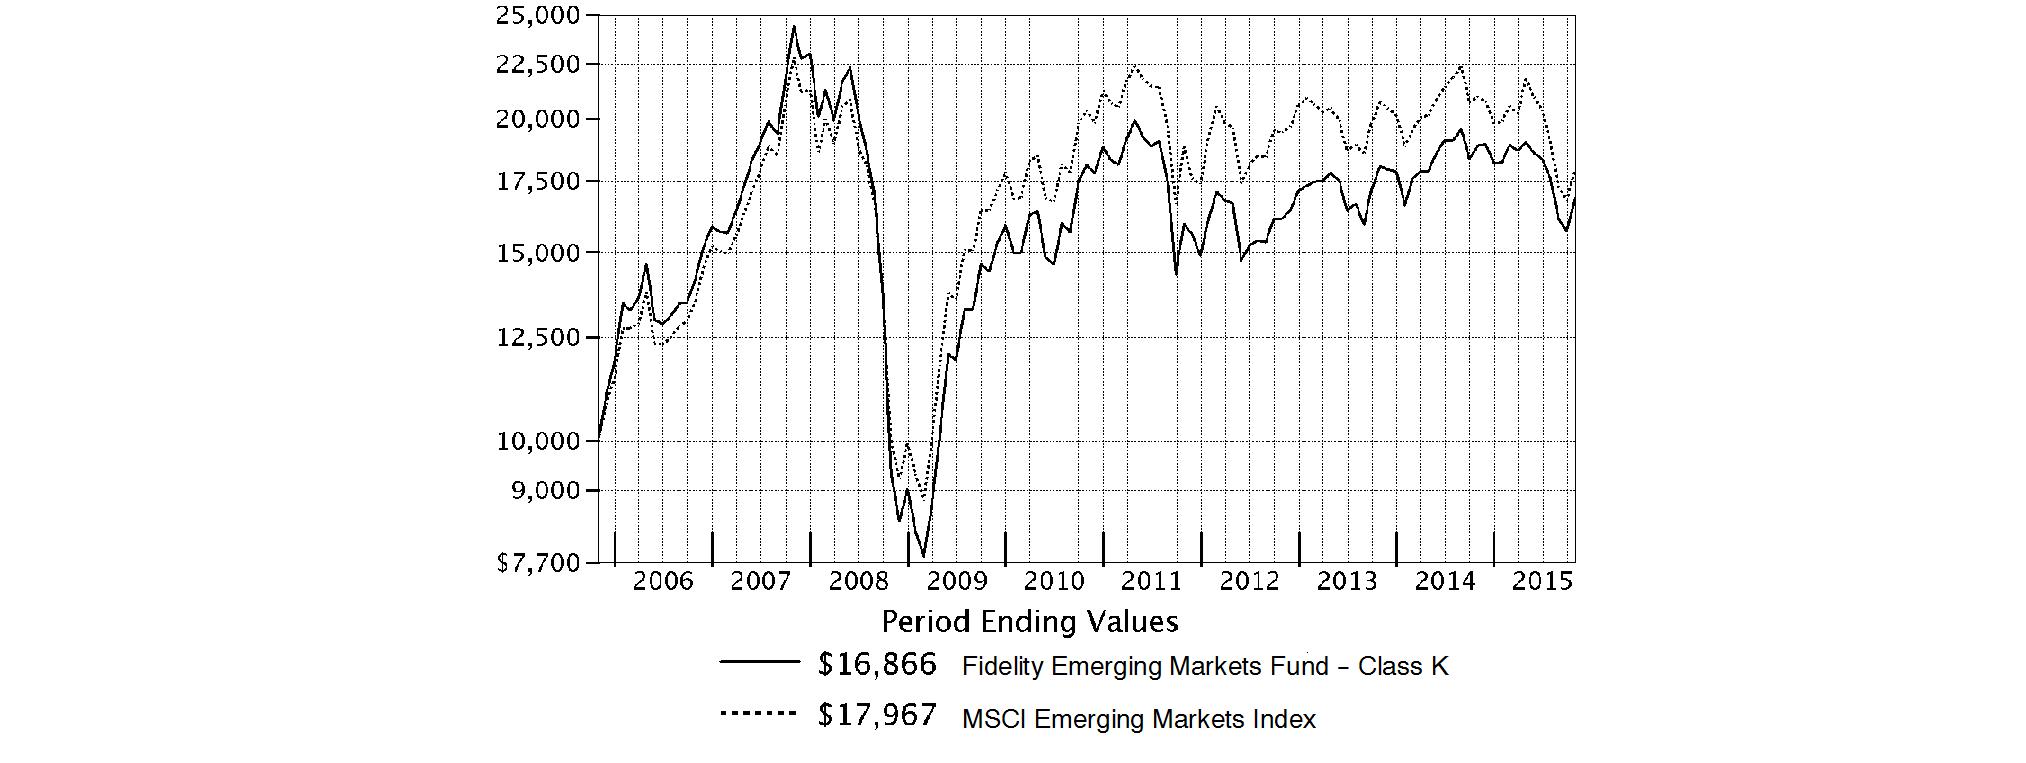
Annual Report
Market Recap: International equities suffered a moderate setback for the 12 months ending October 31, 2015, held back by a collapse in commodities prices that hurt resources-related sectors and geographies. The MSCI ACWI (All Country World Index) ex USA Index returned -4.55% for the period, affected also by concerns about global economic growth. Commodity producers remained under pressure for much of the past year, largely related to economic deceleration in China (-1%), the world's second-largest economy and a leading consumer of raw materials. This effect was exacerbated by U.S. dollar strength relative to global currencies, which weighed on commodities priced in dollars and acutely impacted equity returns within regions most exposed to resources prices. The emerging-markets group, for example, returned about -15% this period. Canada, a significant energy producer, returned roughly -17%. Net energy consumer Japan (+9%) was the best-performing region by far. Only about a quarter of the nearly 50 index countries managed a gain this period: Ireland (+19%) - the EU's fastest-growing economy - and Israel (+17%) proved top performers; Greece (-56%) and Brazil (-46%), among the worst. As for sectors, energy (-25%) and materials (-16%) declined sharply, whereas the two consumer sectors each gained about 6%.
Comments from Portfolio Manager Sammy Simnegar: For the year, the fund's share classes recorded low-double-digit declines but handily topped the -14.22% return of the benchmark MSCI Emerging Markets Index. Versus the benchmark, sector and industry positioning - especially a sizable underweighting in energy - drove the fund's success, with stock selection also adding value. Geographically, non-benchmark exposure to the U.S. bolstered relative results, as did positioning in India and picks in Mexico. The fund's top relative contributor was Brazil-based oil producer Petroleo Brasileiro. This weak-performing index name helped our relative results because the fund didn't own it, as did Brazilian metals miner Vale, also an index stock. Two other contributors - both out-of-benchmark positions established during the period - were health care holdings China Biologic Products and Jiangsu Hengrui Medicine. Conversely, stock selection in consumer discretionary detracted most. Underweighting China was a negative, along with stock picking in Russia. The fund's first- and fourth-biggest relative detractors were China Life Insurance and Ping An Insurance Group. In both cases, the fund didn't own the stock early on, when China-based stocks were flying higher, but we built positions later.
The views expressed above reflect those of the portfolio manager(s) only through the end of the period as stated on the cover of this report and do not necessarily represent the views of Fidelity or any other person in the Fidelity organization. Any such views are subject to change at any time based upon market or other conditions and Fidelity disclaims any responsibility to update such views. These views may not be relied on as investment advice and, because investment decisions for a Fidelity fund are based on numerous factors, may not be relied on as an indication of trading intent on behalf of any Fidelity fund.
Annual Report
Fidelity Emerging Markets Fund
As a shareholder of the Fund, you incur two types of costs: (1) transaction costs, including redemption fees and (2) ongoing costs, including management fees and other Fund expenses. This Example is intended to help you understand your ongoing costs (in dollars) of investing in the Fund and to compare these costs with the ongoing costs of investing in other mutual funds.
The Example is based on an investment of $1,000 invested at the beginning of the period and held for the entire period (May 1, 2015 to October 31, 2015).
Actual Expenses
The first line of the accompanying table for each class of the Fund provides information about actual account values and actual expenses. You may use the information in this line, together with the amount you invested, to estimate the expenses that you paid over the period. Simply divide your account value by $1,000.00 (for example, an $8,600 account value divided by $1,000.00 = 8.6), then multiply the result by the number in the first line for a class of the Fund under the heading entitled "Expenses Paid During Period" to estimate the expenses you paid on your account during this period. A small balance maintenance fee of $12.00 that is charged once a year may apply for certain accounts with a value of less than $2,000. This fee is not included in the table below. If it was, the estimate of expenses you paid during the period would be higher, and your ending account value lower, by this amount. In addition, the Fund, as a shareholder in the underlying Fidelity Central Funds, will indirectly bear its pro-rata share of the fees and expenses incurred by the underlying Fidelity Central Funds. These fees and expenses are not included in the Fund's annualized expense ratio used to calculate the expense estimate in the table below.
Hypothetical Example for Comparison Purposes
The second line of the accompanying table for each class of the Fund provides information about hypothetical account values and hypothetical expenses based on a Class' actual expense ratio and an assumed rate of return of 5% per year before expenses, which is not the Class' actual return. The hypothetical account values and expenses may not be used to estimate the actual ending account balance or expenses you paid for the period. You may use this information to compare the ongoing costs of investing in the Fund and other funds. To do so, compare this 5% hypothetical example with the 5% hypothetical examples that appear in the shareholder reports of the other funds. A small balance maintenance fee of $12.00 that is charged once a year may apply for certain accounts with a value of less than $2,000. This fee is not included in the table below. If it was, the estimate of expenses you paid during the period would be higher, and your ending account value lower, by this amount. In addition, the Fund, as a shareholder in the underlying Fidelity Central Funds, will indirectly bear its pro-rata share of the fees and expenses incurred by the underlying Fidelity Central Funds. These fees and expenses are not included in the Fund's annualized expense ratio used to calculate the expense estimate in the table below.
Please note that the expenses shown in the table are meant to highlight your ongoing costs only and do not reflect any transaction costs. Therefore, the second line of the table is useful in comparing ongoing costs only, and will not help you determine the relative total costs of owning different funds. In addition, if these transactional costs were included, your costs would have been higher.
| Annualized
Expense RatioB | Beginning
Account Value
May 1, 2015 | Ending
Account Value
October 31, 2015 | Expenses Paid
During PeriodC
May 1, 2015
to October 31, 2015 |
Emerging Markets | 1.04% | | | |
Actual | | $ 1,000.00 | $ 887.10 | $ 4.95 |
HypotheticalA | | $ 1,000.00 | $ 1,019.96 | $ 5.30 |
Class K | .84% | | | |
Actual | | $ 1,000.00 | $ 887.60 | $ 4.00 |
HypotheticalA | | $ 1,000.00 | $ 1,020.97 | $ 4.28 |
A 5% return per year before expenses
B Annualized expense ratio reflects expenses net of applicable fee waivers.
C Expenses are equal to each Class' annualized expense ratio, multiplied by the average account value over the period, multiplied by 184/365 (to reflect the one-half year period).
Annual Report
Fidelity Emerging Markets Fund
Investment Changes (Unaudited)
Asset Allocation as of October 31, 2015 |
| % of fund's
net assets | % of fund's net assets
6 months ago |
Stocks | 99.3 | 99.1 |
Short-Term Investments and Net Other Assets (Liabilities) | 0.7 | 0.9 |
Top Ten Stocks as of October 31, 2015 |
| % of fund's
net assets | % of fund's net assets
6 months ago |
Samsung Electronics Co. Ltd. (Korea (South), Technology Hardware, Storage & Peripherals) | 4.5 | 4.4 |
Taiwan Semiconductor Manufacturing Co. Ltd. (Taiwan, Semiconductors & Semiconductor Equipment) | 3.4 | 3.4 |
Tencent Holdings Ltd. (Cayman Islands, Internet Software & Services) | 3.2 | 3.0 |
Naspers Ltd. Class N (South Africa, Media) | 2.2 | 2.0 |
Ping An Insurance (Group) Co. of China Ltd. (H Shares) (China, Insurance) | 1.4 | 0.0 |
Housing Development Finance Corp. Ltd. (India, Thrifts & Mortgage Finance) | 1.3 | 1.1 |
Ambev SA sponsored ADR (Brazil, Beverages) | 1.0 | 1.1 |
Tata Consultancy Services Ltd. (India, IT Services) | 1.0 | 0.8 |
Fomento Economico Mexicano S.A.B. de CV unit (Mexico, Beverages) | 0.9 | 0.8 |
Grupo Financiero Banorte S.A.B. de CV Series O (Mexico, Banks) | 0.9 | 0.8 |
| 19.8 | |
Market Sectors as of October 31, 2015 |
| % of fund's
net assets | % of fund's net assets
6 months ago |
Information Technology | 23.1 | 22.3 |
Financials | 19.8 | 23.3 |
Consumer Discretionary | 18.5 | 16.6 |
Industrials | 11.3 | 11.5 |
Consumer Staples | 8.5 | 7.3 |
Health Care | 8.4 | 7.5 |
Materials | 4.7 | 5.2 |
Utilities | 2.5 | 2.0 |
Telecommunication Services | 1.4 | 2.3 |
Energy | 1.1 | 1.1 |
Percentages shown as 0.0% may reflect amounts less than 0.05%. |
Annual Report
Fidelity Emerging Markets Fund
Investments October 31, 2015
Showing Percentage of Net Assets
Common Stocks - 98.3% |
| Shares | | Value |
Australia - 0.9% |
Amcor Ltd. | 1,413,962 | | $ 13,657,192 |
Sydney Airport unit | 3,533,823 | | 16,149,952 |
TOTAL AUSTRALIA | | 29,807,144 |
Bailiwick of Jersey - 0.4% |
Integrated Diagnostics Holdings PLC (a) | 2,557,969 | | 14,094,409 |
Bermuda - 2.2% |
China Gas Holdings Ltd. | 10,812,000 | | 17,207,484 |
China Resource Gas Group Ltd. | 5,532,000 | | 15,174,528 |
Credicorp Ltd. (United States) | 196,932 | | 22,288,764 |
PAX Global Technology Ltd. | 13,512,000 | | 17,669,120 |
TOTAL BERMUDA | | 72,339,896 |
Brazil - 5.3% |
BB Seguridade Participacoes SA | 2,871,620 | | 19,806,587 |
Brasil Foods SA | 1,631,400 | | 25,423,537 |
Cetip SA - Mercados Organizado | 1,794,600 | | 15,868,032 |
Cielo SA | 2,273,412 | | 21,581,365 |
FPC Par Corretora de Seguros | 1,420,100 | | 3,973,209 |
Kroton Educacional SA | 7,962,460 | | 20,357,536 |
Qualicorp SA | 4,405,800 | | 18,507,205 |
Smiles SA | 1,781,800 | | 13,906,777 |
Ultrapar Participacoes SA | 1,134,400 | | 19,707,977 |
Weg SA | 4,121,390 | | 15,388,888 |
TOTAL BRAZIL | | 174,521,113 |
British Virgin Islands - 0.5% |
Mail.Ru Group Ltd. GDR (Reg. S) (a) | 827,800 | | 16,142,100 |
Cayman Islands - 7.7% |
Alibaba Group Holding Ltd. sponsored ADR (a) | 255,200 | | 21,393,416 |
ENN Energy Holdings Ltd. | 3,380,000 | | 19,362,815 |
Fu Shou Yuan International Group Ltd. (d) | 21,161,000 | | 14,428,296 |
Hengan International Group Co. Ltd. | 2,147,000 | | 23,184,227 |
Shenzhou International Group Holdings Ltd. | 3,500,000 | | 17,247,902 |
Sino Biopharmaceutical Ltd. | 14,108,000 | | 17,532,016 |
TAL Education Group ADR (a) | 447,600 | | 17,210,220 |
Tencent Holdings Ltd. | 5,606,000 | | 105,669,618 |
Vipshop Holdings Ltd. ADR (a)(d) | 819,500 | | 16,816,140 |
TOTAL CAYMAN ISLANDS | | 252,844,650 |
China - 8.0% |
Beijing Capital International Airport Co. Ltd. (H Shares) | 16,734,000 | | 17,911,220 |
China Life Insurance Co. Ltd. (H Shares) | 5,307,000 | | 19,137,490 |
China Pacific Insurance (Group) Co. Ltd. (H Shares) | 7,045,600 | | 28,065,418 |
Fuyao Glass Industries Group Co. Ltd. (a) | 6,752,000 | | 14,434,559 |
Inner Mongoli Yili Industries Co. Ltd. | 6,148,408 | | 15,465,595 |
Jiangsu Hengrui Medicine Co. Ltd. | 2,121,471 | | 17,601,786 |
Kweichow Moutai Co. Ltd. | 523,692 | | 17,681,825 |
|
| Shares | | Value |
PICC Property & Casualty Co. Ltd. (H Shares) | 9,962,783 | | $ 22,606,257 |
Ping An Insurance (Group) Co. of China Ltd. (H Shares) | 8,063,000 | | 45,259,635 |
Shanghai International Airport Co. Ltd. | 3,738,100 | | 17,832,199 |
Weifu High-Technology Co. Ltd. (B Shares) | 4,781,169 | | 12,189,979 |
Zhengzhou Yutong Bus Co. Ltd. | 4,986,250 | | 17,174,145 |
Zhuzhou CSR Times Electric Co. Ltd. (H Shares) | 2,733,000 | | 17,691,920 |
TOTAL CHINA | | 263,052,028 |
Denmark - 0.5% |
Novo Nordisk A/S Series B sponsored ADR | 288,300 | | 15,331,794 |
Egypt - 0.6% |
Commercial International Bank SAE sponsored GDR | 3,192,800 | | 18,677,880 |
France - 0.9% |
LVMH Moet Hennessy - Louis Vuitton SA | 84,820 | | 15,790,891 |
Safran SA | 194,500 | | 14,773,065 |
TOTAL FRANCE | | 30,563,956 |
Germany - 1.0% |
Bayer AG | 111,600 | | 14,892,186 |
Wirecard AG (d) | 321,863 | | 16,636,792 |
TOTAL GERMANY | | 31,528,978 |
Hong Kong - 2.0% |
AIA Group Ltd. | 2,766,800 | | 16,222,665 |
CSPC Pharmaceutical Group Ltd. | 18,282,000 | | 17,021,388 |
Guangdong Investment Ltd. | 12,007,000 | | 16,886,181 |
Techtronic Industries Co. Ltd. | 4,338,000 | | 15,858,329 |
TOTAL HONG KONG | | 65,988,563 |
India - 10.6% |
Adani Ports & Special Economic Zone (a) | 3,790,935 | | 17,116,405 |
Amara Raja Batteries Ltd. (a) | 1,033,523 | | 14,248,543 |
Asian Paints India Ltd. | 1,407,300 | | 17,834,797 |
Axis Bank Ltd. (a) | 1,917,184 | | 13,885,181 |
Bharti Infratel Ltd. | 2,849,419 | | 16,923,611 |
Colgate-Palmolive (India) | 956,144 | | 13,938,522 |
Exide Industries Ltd. (a) | 6,028,470 | | 13,752,893 |
HCL Technologies Ltd. | 1,794,539 | | 23,885,735 |
HDFC Bank Ltd. (a) | 905,707 | | 18,165,469 |
Housing Development Finance Corp. Ltd. | 2,205,895 | | 42,254,117 |
IndusInd Bank Ltd. | 1,062,557 | | 14,783,992 |
LIC Housing Finance Ltd. (a) | 2,204,392 | | 16,095,379 |
Lupin Ltd. | 671,367 | | 19,767,324 |
Maruti Suzuki India Ltd. (a) | 221,498 | | 15,064,835 |
Sun Pharmaceutical Industries Ltd. | 2,018,117 | | 27,424,412 |
Tata Consultancy Services Ltd. | 857,789 | | 32,681,725 |
Common Stocks - continued |
| Shares | | Value |
India - continued |
Titan Co. Ltd. (a) | 2,900,773 | | $ 15,736,582 |
Zee Entertainment Enterprises Ltd. | 2,611,321 | | 16,273,826 |
TOTAL INDIA | | 349,833,348 |
Indonesia - 4.0% |
PT ACE Hardware Indonesia Tbk | 344,934,400 | | 16,791,994 |
PT Bank Central Asia Tbk | 28,257,400 | | 26,545,771 |
PT Bank Rakyat Indonesia Tbk | 32,333,500 | | 24,746,641 |
PT Matahari Department Store Tbk | 14,434,800 | | 17,379,323 |
PT Media Nusantara Citra Tbk | 115,858,500 | | 15,032,785 |
PT Surya Citra Media Tbk | 74,100,300 | | 15,757,718 |
PT Tower Bersama Infrastructure Tbk (a) | 31,912,000 | | 16,620,076 |
TOTAL INDONESIA | | 132,874,308 |
Isle of Man - 0.5% |
Playtech Ltd. | 1,262,213 | | 16,656,284 |
Israel - 0.9% |
Check Point Software Technologies Ltd. (a) | 181,500 | | 15,416,610 |
Teva Pharmaceutical Industries Ltd. sponsored ADR | 243,200 | | 14,395,008 |
TOTAL ISRAEL | | 29,811,618 |
Kenya - 0.4% |
Safaricom Ltd. | 105,631,300 | | 14,853,593 |
Korea (South) - 8.6% |
AMOREPACIFIC Corp. | 78,534 | | 25,965,462 |
Coway Co. Ltd. | 225,406 | | 16,820,017 |
KEPCO Plant Service & Engineering Co. Ltd. | 171,480 | | 15,619,538 |
LG Chemical Ltd. | 100,788 | | 26,879,272 |
LG Household & Health Care Ltd. | 27,486 | | 22,797,273 |
NAVER Corp. | 53,154 | | 27,932,421 |
Samsung Electronics Co. Ltd. | 122,494 | | 147,194,067 |
TOTAL KOREA (SOUTH) | | 283,208,050 |
Luxembourg - 0.9% |
Eurofins Scientific SA | 44,300 | | 16,039,247 |
Samsonite International SA | 4,980,900 | | 14,709,780 |
TOTAL LUXEMBOURG | | 30,749,027 |
Mexico - 6.8% |
Banregio Grupo Financiero S.A.B. de CV | 2,397,993 | | 12,936,660 |
Fomento Economico Mexicano S.A.B. de CV unit | 2,963,767 | | 29,277,377 |
Gruma S.A.B. de CV Series B | 1,188,600 | | 18,342,282 |
Grupo Aeroportuario del Pacifico SA de CV Series B | 1,923,857 | | 17,327,502 |
Grupo Aeroportuario del Sureste SA de CV Series B | 1,163,120 | | 18,013,861 |
|
| Shares | | Value |
Grupo Aeroportuario Norte S.A.B. de CV | 2,958,700 | | $ 15,218,198 |
Grupo Financiero Banorte S.A.B. de CV Series O | 5,314,500 | | 28,619,112 |
Grupo GICSA SA de CV (a)(d) | 15,490,617 | | 15,098,798 |
Infraestructura Energetica Nova S.A.B. de CV | 3,104,000 | | 14,967,708 |
Megacable Holdings S.A.B. de CV unit | 4,248,052 | | 16,189,497 |
Promotora y Operadora de Infraestructura S.A.B. de CV (a) | 1,510,600 | | 18,940,801 |
Tenedora Nemak SA de CV (a) | 12,221,200 | | 17,675,748 |
TOTAL MEXICO | | 222,607,544 |
Netherlands - 0.4% |
Hangzhou Hikvision Digital Technology Co. Ltd. ELS (BNP Paribas Arbitrage Warrant Program) warrants 10/21/16 (a) | 2,723,000 | | 14,832,508 |
Philippines - 4.1% |
Ayala Corp. | 1,041,090 | | 17,338,254 |
GT Capital Holdings, Inc. | 566,585 | | 15,899,709 |
International Container Terminal Services, Inc. | 9,583,880 | | 16,897,010 |
Jollibee Food Corp. | 3,667,160 | | 16,117,554 |
Robinsons Land Corp. | 24,039,500 | | 15,714,689 |
SM Investments Corp. | 912,552 | | 17,036,552 |
SM Prime Holdings, Inc. | 38,634,500 | | 17,789,293 |
Universal Robina Corp. | 4,102,270 | | 17,578,020 |
TOTAL PHILIPPINES | | 134,371,081 |
Russia - 0.7% |
Magnit OJSC (a) | 141,707 | | 24,719,783 |
South Africa - 7.4% |
Aspen Pharmacare Holdings Ltd. | 932,390 | | 20,940,540 |
Bidvest Group Ltd. | 803,398 | | 20,550,827 |
Discovery Ltd. | 1,685,585 | | 18,026,344 |
FirstRand Ltd. | 7,028,500 | | 25,795,037 |
Mr Price Group Ltd. | 1,162,288 | | 17,847,113 |
Naspers Ltd. Class N | 481,612 | | 70,541,768 |
Sanlam Ltd. | 4,931,200 | | 22,277,825 |
Steinhoff International Holdings Ltd. | 4,253,900 | | 26,038,577 |
Woolworths Holdings Ltd. | 2,762,400 | | 20,463,997 |
TOTAL SOUTH AFRICA | | 242,482,028 |
Spain - 0.5% |
Amadeus IT Holding SA Class A | 364,000 | | 15,514,566 |
Switzerland - 0.9% |
Compagnie Financiere Richemont SA Series A | 183,508 | | 15,735,365 |
Sika AG (Bearer) | 3,880 | | 12,733,795 |
TOTAL SWITZERLAND | | 28,469,160 |
Taiwan - 6.7% |
Advantech Co. Ltd. | 2,277,000 | | 16,377,006 |
Catcher Technology Co. Ltd. | 2,015,000 | | 19,861,389 |
Common Stocks - continued |
| Shares | | Value |
Taiwan - continued |
ECLAT Textile Co. Ltd. | 1,153,000 | | $ 17,011,767 |
Giant Manufacturing Co. Ltd. | 2,042,000 | | 15,441,583 |
Largan Precision Co. Ltd. | 317,000 | | 24,752,657 |
Merida Industry Co. Ltd. | 2,759,600 | | 16,192,940 |
Taiwan Semiconductor Manufacturing Co. Ltd. | 26,570,000 | | 111,952,013 |
TOTAL TAIWAN | | 221,589,355 |
Thailand - 1.5% |
Airports of Thailand PCL (For. Reg.) | 2,259,200 | | 18,884,754 |
Bangkok Dusit Medical Services PCL (For. Reg.) | 28,040,800 | | 14,951,533 |
Thai Beverage PCL | 29,426,500 | | 14,150,280 |
TOTAL THAILAND | | 47,986,567 |
Turkey - 2.1% |
Koc Holding A/S | 4,087,000 | | 18,458,439 |
TAV Havalimanlari Holding A/S | 2,192,000 | | 17,217,809 |
Tofas Turk Otomobil Fabrikasi A/S | 2,303,731 | | 15,211,231 |
Tupras Turkiye Petrol Rafinelleri A/S (a) | 653,000 | | 17,246,690 |
TOTAL TURKEY | | 68,134,169 |
United Arab Emirates - 1.0% |
DP World Ltd. | 875,334 | | 17,690,500 |
First Gulf Bank PJSC | 4,610,350 | | 15,501,721 |
TOTAL UNITED ARAB EMIRATES | | 33,192,221 |
United Kingdom - 1.9% |
Al Noor Hospitals Group PLC | 75,025 | | 1,360,144 |
InterContinental Hotel Group PLC | 383,700 | | 15,332,443 |
Mondi PLC | 811,600 | | 18,817,485 |
NMC Health PLC | 1,092,200 | | 12,830,065 |
Prudential PLC | 671,258 | | 15,678,234 |
TOTAL UNITED KINGDOM | | 64,018,371 |
United States of America - 8.4% |
A.O. Smith Corp. | 220,400 | | 16,931,128 |
Alphabet, Inc. Class C | 24,105 | | 17,134,075 |
Apple, Inc. | 143,300 | | 17,124,350 |
China Biologic Products, Inc. (a) | 167,478 | | 19,082,443 |
Cognizant Technology Solutions Corp. Class A (a) | 229,600 | | 15,638,056 |
Ecolab, Inc. | 131,700 | | 15,850,095 |
Facebook, Inc. Class A (a) | 140,600 | | 14,336,982 |
International Flavors & Fragrances, Inc. | 133,410 | | 15,483,565 |
MasterCard, Inc. Class A | 158,500 | | 15,689,915 |
McGraw Hill Financial, Inc. | 172,200 | | 15,952,608 |
MercadoLibre, Inc. (d) | 160,600 | | 15,798,222 |
Mettler-Toledo International, Inc. (a) | 53,200 | | 16,544,668 |
Moody's Corp. | 164,500 | | 15,818,320 |
NIKE, Inc. Class B | 111,800 | | 14,649,154 |
PPG Industries, Inc. | 157,056 | | 16,374,659 |
|
| Shares | | Value |
Sherwin-Williams Co. | 64,400 | | $ 17,183,852 |
Visa, Inc. Class A | 207,300 | | 16,082,334 |
TOTAL UNITED STATES OF AMERICA | | 275,674,426 |
TOTAL COMMON STOCKS (Cost $3,038,534,777) |
3,236,470,518
|
Nonconvertible Preferred Stocks - 1.0% |
| | | |
Brazil - 1.0% |
Ambev SA sponsored ADR
(Cost $51,333,349) | 7,027,680 | |
34,224,802
|
Money Market Funds - 1.9% |
| | | |
Fidelity Cash Central Fund, 0.18% (b) | 20,235,573 | | 20,235,573 |
Fidelity Securities Lending Cash Central Fund, 0.19% (b)(c) | 41,335,000 | | 41,335,000 |
TOTAL MONEY MARKET FUNDS (Cost $61,570,573) |
61,570,573
|
TOTAL INVESTMENT
PORTFOLIO - 101.2% (Cost $3,151,438,699) | | 3,332,265,893 |
NET OTHER ASSETS (LIABILITIES) - (1.2)% | | (39,291,465) |
NET ASSETS - 100% | $ 3,292,974,428 |
Security Type Abbreviations |
ELS | - | Equity-Linked Security |
Legend |
(a) Non-income producing |
(b) Affiliated fund that is generally available only to investment companies and other accounts managed by Fidelity Investments. The rate quoted is the annualized seven-day yield of the fund at period end. A complete unaudited listing of the fund's holdings as of its most recent quarter end is available upon request. In addition, each Fidelity Central Fund's financial statements, which are not covered by the Fund's Report of Independent Registered Public Accounting Firm, are available on the SEC's website or upon request. |
(c) Investment made with cash collateral received from securities on loan. |
(d) Security or a portion of the security is on loan at period end. |
Affiliated Central Funds |
Information regarding fiscal year to date income earned by the Fund from investments in Fidelity Central Funds is as follows: |
Fund | Income earned |
Fidelity Cash Central Fund | $ 60,957 |
Fidelity Securities Lending Cash Central Fund | 314,677 |
Total | $ 375,634 |
Other Information |
Categorizations in the Schedule of Investments are based on country or territory of incorporation. |
The following is a summary of the inputs used, as of October 31, 2015, involving the Fund's assets and liabilities carried at fair value. The inputs or methodology used for valuing securities may not be an indication of the risk associated with investing in those securities. For more information on valuation inputs, and their aggregation into the levels used in the tables below, please refer to the Investment Valuation section in the accompanying Notes to Financial Statements. |
Valuation Inputs at Reporting Date: |
Description | Total | Level 1 | Level 2 | Level 3 |
Investments in Securities: | | | | |
Equities: | | | | |
Consumer Discretionary | $ 610,009,119 | $ 332,374,065 | $ 277,635,054 | $ - |
Consumer Staples | 282,748,985 | 180,750,516 | 101,998,469 | - |
Energy | 36,954,667 | 36,954,667 | - | - |
Financials | 635,661,599 | 228,363,072 | 407,298,527 | - |
Health Care | 278,316,168 | 164,017,709 | 114,298,459 | - |
Industrials | 377,073,256 | 172,899,052 | 204,174,204 | - |
Information Technology | 763,120,818 | 471,262,607 | 291,858,211 | - |
Materials | 154,814,712 | 123,322,723 | 31,491,989 | - |
Telecommunication Services | 48,397,280 | 14,853,593 | 33,543,687 | - |
Utilities | 83,598,716 | 14,967,708 | 68,631,008 | - |
Money Market Funds | 61,570,573 | 61,570,573 | - | - |
Total Investments in Securities: | $ 3,332,265,893 | $ 1,801,336,285 | $ 1,530,929,608 | $ - |
The following is a summary of transfers between Level 1 and Level 2 for the period ended October 31, 2015. Transfers are assumed to have occurred at the beginning of the period, and are primarily attributable to the valuation techniques used for foreign equity securities, as discussed in the accompanying Notes to Financial Statements: |
Transfers | Total |
Level 1 to Level 2 | $ 59,835,425 |
Level 2 to Level 1 | $ 26,402,509 |
See accompanying notes which are an integral part of the financial statements.
Annual Report
Fidelity Emerging Markets Fund
Statement of Assets and Liabilities
| | October 31, 2015 |
| | |
Assets | | |
Investment in securities, at value (including securities loaned of $40,686,767) - See accompanying schedule: Unaffiliated issuers (cost $3,089,868,126) | $ 3,270,695,320 | |
Fidelity Central Funds (cost $61,570,573) | 61,570,573 | |
Total Investments (cost $3,151,438,699) | | $ 3,332,265,893 |
Cash | | 1,673,531 |
Foreign currency held at value (cost $11,224,220) | | 11,217,793 |
Receivable for investments sold | | 23,933,070 |
Receivable for fund shares sold | | 22,530,197 |
Dividends receivable | | 2,169,756 |
Distributions receivable from Fidelity Central Funds | | 12,992 |
Prepaid expenses | | 9,184 |
Other receivables | | 1,901,903 |
Total assets | | 3,395,714,319 |
| | |
Liabilities | | |
Payable for investments purchased | $ 50,795,978 | |
Payable for fund shares redeemed | 6,937,787 | |
Accrued management fee | 1,882,234 | |
Other affiliated payables | 666,377 | |
Other payables and accrued expenses | 1,122,515 | |
Collateral on securities loaned, at value | 41,335,000 | |
Total liabilities | | 102,739,891 |
| | |
Net Assets | | $ 3,292,974,428 |
Net Assets consist of: | | |
Paid in capital | | $ 3,359,240,649 |
Undistributed net investment income | | 15,496,040 |
Accumulated undistributed net realized gain (loss) on investments and foreign currency transactions | | (261,563,810) |
Net unrealized appreciation (depreciation) on investments and assets and liabilities in foreign currencies | | 179,801,549 |
Net Assets | | $ 3,292,974,428 |
| | |
Emerging Markets:
Net Asset Value, offering price and redemption price per share ($2,738,933,655 ÷ 121,470,383 shares) | | $ 22.55 |
| | |
Class K:
Net Asset Value, offering price and redemption price per share ($554,040,773 ÷ 24,533,490 shares) | | $ 22.58 |
Statement of Operations
| Year ended October 31, 2015 |
| | |
Investment Income | | |
Dividends | | $ 63,932,125 |
Interest | | 147 |
Income from Fidelity Central Funds | | 375,634 |
Income before foreign taxes withheld | | 64,307,906 |
Less foreign taxes withheld | | (6,043,871) |
Total income | | 58,264,035 |
| | |
Expenses | | |
Management fee | $ 22,451,101 | |
Transfer agent fees | 6,767,826 | |
Accounting and security lending fees | 1,376,420 | |
Custodian fees and expenses | 1,736,316 | |
Independent trustees' compensation | 13,489 | |
Registration fees | 95,824 | |
Audit | 119,135 | |
Legal | 7,815 | |
Interest | 4,273 | |
Miscellaneous | 23,203 | |
Total expenses before reductions | 32,595,402 | |
Expense reductions | (574,024) | 32,021,378 |
Net investment income (loss) | | 26,242,657 |
Realized and Unrealized Gain (Loss) | | |
Net realized gain (loss) on: | | |
Investment securities: | | |
Unaffiliated issuers (net of foreign taxes of $2,309,017) | (229,416,969) | |
Foreign currency transactions | (2,322,602) | |
Total net realized gain (loss) | | (231,739,571) |
Change in net unrealized appreciation (depreciation) on: Investment securities (net of decrease in deferred foreign taxes of $3,167,103) | (191,854,165) | |
Assets and liabilities in foreign currencies | (90,515) | |
Total change in net unrealized appreciation (depreciation) | | (191,944,680) |
Net gain (loss) | | (423,684,251) |
Net increase (decrease) in net assets resulting from operations | | $ (397,441,594) |
See accompanying notes which are an integral part of the financial statements.
Annual Report
Fidelity Emerging Markets Fund
Financial Statements - continued
Statement of Changes in Net Assets
�� | Year ended
October 31,
2015 | Year ended
October 31,
2014 |
Increase (Decrease) in Net Assets | | |
Operations | | |
Net investment income (loss) | $ 26,242,657 | $ 21,069,375 |
Net realized gain (loss) | (231,739,571) | 19,330,340 |
Change in net unrealized appreciation (depreciation) | (191,944,680) | 67,110,574 |
Net increase (decrease) in net assets resulting from operations | (397,441,594) | 107,510,289 |
Distributions to shareholders from net investment income | (18,114,621) | (2,412,320) |
Distributions to shareholders from net realized gain | (2,942,055) | - |
Total distributions | (21,056,676) | (2,412,320) |
Share transactions - net increase (decrease) | 716,596,433 | 100,101,946 |
Redemption fees | 519,430 | 450,436 |
Total increase (decrease) in net assets | 298,617,593 | 205,650,351 |
| | |
Net Assets | | |
Beginning of period | 2,994,356,835 | 2,788,706,484 |
End of period (including undistributed net investment income of $15,496,040 and undistributed net investment income of $16,555,118, respectively) | $ 3,292,974,428 | $ 2,994,356,835 |
Financial Highlights - Fidelity Emerging Markets Fund
Years ended October 31, | 2015 | 2014 | 2013 | 2012 | 2011 |
Selected Per-Share Data | | | | | |
Net asset value, beginning of period | $ 25.44 | $ 24.43 | $ 22.15 | $ 22.23 | $ 25.72 |
Income from Investment Operations | | | | | |
Net investment income (loss) B | .19 | .17 | .20 | .33 | .35 |
Net realized and unrealized gain (loss) | (2.91) | .86 | 2.38 | (.11) | (3.48) |
Total from investment operations | (2.72) | 1.03 | 2.58 | .22 | (3.13) |
Distributions from net investment income | (.14) | (.02) | (.30) | (.30) | (.24) |
Distributions from net realized gain | (.03) | - | - | - | (.13) |
Total distributions | (.17) | (.02) | (.30) | (.30) | (.37) |
Redemption fees added to paid in capitalB | - F | - F | - F | - F | .01 |
Net asset value, end of period | $ 22.55 | $ 25.44 | $ 24.43 | $ 22.15 | $ 22.23 |
Total ReturnA | (10.76)% | 4.22% | 11.78% | 1.03% | (12.33)% |
Ratios to Average Net AssetsC, E | | | | | |
Expenses before reductions | 1.05% | 1.07% | 1.08% | 1.09% | 1.07% |
Expenses net of fee waivers, if any | 1.05% | 1.07% | 1.08% | 1.09% | 1.07% |
Expenses net of all reductions | 1.03% | 1.07% | 1.03% | 1.03% | 1.01% |
Net investment income (loss) | .78% | .71% | .85% | 1.50% | 1.38% |
Supplemental Data | | | | | |
Net assets, end of period (000 omitted) | $ 2,738,934 | $ 2,370,927 | $ 2,241,338 | $ 2,203,756 | $ 2,907,884 |
Portfolio turnover rateD | 107% | 94% | 119% | 176% | 122% |
ATotal returns would have been lower if certain expenses had not been reduced during the applicable periods shown. BCalculated based on average shares outstanding during the period. CFees and expenses of any underlying Fidelity Central Funds are not included in the Fund's expense ratio. The Fund indirectly bears its proportionate share of the expenses of any underlying Fidelity Central Funds. DAmount does not include the portfolio activity of any underlying Fidelity Central Funds. EExpense ratios reflect operating expenses of the class. Expenses before reductions do not reflect amounts reimbursed by the investment adviser or reductions from brokerage service arrangements or reductions from other expense offset arrangements and do not represent the amount paid by the class during periods when reimbursements or reductions occur. Expenses net of fee waivers reflect expenses after reimbursement by the investment adviser but prior to reductions from brokerage service arrangements or other expense offset arrangements. Expenses net of all reductions represent the net expenses paid by the class. FAmount represents less than $.005 per share. |
See accompanying notes which are an integral part of the financial statements.
Annual Report
Financial Highlights - Fidelity Emerging Markets Fund Class K
Years ended October 31, | 2015 | 2014 | 2013 | 2012 | 2011 |
Selected Per-Share Data | | | | | |
Net asset value, beginning of period | $ 25.48 | $ 24.42 | $ 22.15 | $ 22.23 | $ 25.75 |
Income from Investment Operations | | | | | |
Net investment income (loss) B | .24 | .23 | .25 | .37 | .40 |
Net realized and unrealized gain (loss) | (2.92) | .86 | 2.38 | (.10) | (3.48) |
Total from investment operations | (2.68) | 1.09 | 2.63 | .27 | (3.08) |
Distributions from net investment income | (.20) | (.03) | (.36) | (.35) | (.32) |
Distributions from net realized gain | (.03) | - | - | - | (.13) |
Total distributions | (.22) G | (.03) | (.36) | (.35) | (.45) |
Redemption fees added to paid in capitalB | - F | - F | - F | - F | .01 |
Net asset value, end of period | $ 22.58 | $ 25.48 | $ 24.42 | $ 22.15 | $ 22.23 |
Total ReturnA | (10.60)% | 4.47% | 12.01% | 1.25% | (12.17)% |
Ratios to Average Net AssetsC, E | | | | | |
Expenses before reductions | .85% | .86% | .87% | .87% | .87% |
Expenses net of fee waivers, if any | .85% | .85% | .87% | .87% | .87% |
Expenses net of all reductions | .83% | .85% | .82% | .81% | .80% |
Net investment income (loss) | .98% | .92% | 1.07% | 1.72% | 1.58% |
Supplemental Data | | | | | |
Net assets, end of period (000 omitted) | $ 554,041 | $ 623,430 | $ 547,369 | $ 607,919 | $ 497,821 |
Portfolio turnover rateD | 107% | 94% | 119% | 176% | 122% |
ATotal returns would have been lower if certain expenses had not been reduced during the applicable periods shown. BCalculated based on average shares outstanding during the period. CFees and expenses of any underlying Fidelity Central Funds are not included in the Fund's expense ratio. The Fund indirectly bears its proportionate share of the expenses of any underlying Fidelity Central Funds. DAmount does not include the portfolio activity of any underlying Fidelity Central Funds. EExpense ratios reflect operating expenses of the class. Expenses before reductions do not reflect amounts reimbursed by the investment adviser or reductions from brokerage service arrangements or reductions from other expense offset arrangements and do not represent the amount paid by the class during periods when reimbursements or reductions occur. Expenses net of fee waivers reflect expenses after reimbursement by the investment adviser but prior to reductions from brokerage service arrangements or other expense offset arrangements. Expenses net of all reductions represent the net expenses paid by the class. FAmount represents less than $.005 per share. GTotal distributions of $.22 per share is comprised of distributions from net investment income of $.195 and distributions from net realized gain of $.025 per share. |
See accompanying notes which are an integral part of the financial statements.
Annual Report
For the period ended October 31, 2015
1. Organization.
Fidelity Emerging Markets Fund (the Fund) is a fund of Fidelity Investment Trust (the Trust) and is authorized to issue an unlimited number of shares. The Trust is registered under the Investment Company Act of 1940, as amended (the 1940 Act), as an open-end management investment company organized as a Massachusetts business trust. The Fund offers Emerging Markets and Class K shares, each of which has equal rights as to assets and voting privileges. Each class has exclusive voting rights with respect to matters that affect that class. The Fund's investments in emerging markets can be subject to social, economic, regulatory, and political uncertainties and can be extremely volatile.
2. Investments in Fidelity Central Funds.
The Fund invests in Fidelity Central Funds, which are open-end investment companies generally available only to other investment companies and accounts managed by the investment adviser and its affiliates. The Fund's Schedule of Investments lists each of the Fidelity Central Funds held as of period end, if any, as an investment of the Fund, but does not include the underlying holdings of each Fidelity Central Fund. As an Investing Fund, the Fund indirectly bears its proportionate share of the expenses of the underlying Fidelity Central Funds.
The Money Market Central Funds seek preservation of capital and current income and are managed by Fidelity Investments Money Management, Inc. (FIMM), an affiliate of the investment adviser. Annualized expenses of the Money Market Central Funds as of their most recent shareholder report date are less than .005%.
A complete unaudited list of holdings for each Fidelity Central Fund is available upon request or at the Securities and Exchange Commission (the SEC) website at www.sec.gov. In addition, the financial statements of the Fidelity Central Funds, which are not covered by the Fund's Report of Independent Registered Public Accounting Firm, are available on the SEC website or upon request.
3. Significant Accounting Policies.
The financial statements have been prepared in conformity with accounting principles generally accepted in the United States of America (GAAP), which require management to make certain estimates and assumptions at the date of the financial statements. Actual results could differ from those estimates. Subsequent events, if any, through the date that the financial statements were issued have been evaluated in the preparation of the financial statements. The following summarizes the significant accounting policies of the Fund:
Investment Valuation. Investments are valued as of 4:00 p.m. Eastern time on the last calendar day of the period. The Board of Trustees (the Board) has delegated the day to day responsibility for the valuation of the Fund's investments to the Fidelity Management & Research Company (FMR) Fair Value Committee (the Committee). In accordance with valuation policies and procedures approved by the Board, the Fund attempts to obtain prices from one or more third party pricing vendors or brokers to value its investments. When current market prices, quotations or currency exchange rates are not readily available or reliable, investments will be fair valued in good faith by the Committee, in accordance with procedures adopted by the Board. Factors used in determining fair value vary by investment type and may include market or investment specific events. The frequency with which these procedures are used cannot be predicted and they may be utilized to a significant extent. The Committee oversees the Fund's valuation policies and procedures and reports to the Board on the Committee's activities and fair value determinations. The Board monitors the appropriateness of the procedures used in valuing the Fund's investments and ratifies the fair value determinations of the Committee.
The Fund categorizes the inputs to valuation techniques used to value its investments into a disclosure hierarchy consisting of three levels as shown below:
Level 1 - quoted prices in active markets for identical investments
Level 2 - other significant observable inputs (including quoted prices for similar investments, interest rates, prepayment speeds, etc.)
Level 3 - unobservable inputs (including the Fund's own assumptions based on the best information available)
Valuation techniques used to value the Fund's investments by major category are as follows:
Equity securities, including restricted securities, for which market quotations are readily available, are valued at the last reported sale price or official closing price as reported by a third party pricing vendor on the primary market or exchange on which they are traded and are categorized as Level 1 in the hierarchy. In the event there were no sales during the day or closing prices are not available, securities are valued at the last quoted bid price or may be valued using the last available price and are generally categorized as Level 2 in the hierarchy. For foreign equity securities, when market or security specific events arise, comparisons to the valuation of American Depositary Receipts (ADRs), futures contracts, Exchange-Traded Funds (ETFs) and certain indexes as well as quoted prices for similar securities may be used and would be categorized as Level 2 in the hierarchy. Utilizing these techniques may result in transfers between Level 1 and Level 2. For equity securities, including restricted securities, where observable inputs are limited, assumptions about market activity and risk are used and these securities may be categorized as Level 3 in the hierarchy.
Annual Report
Notes to Financial Statements - continued
3. Significant Accounting Policies - continued
Investment Valuation - continued
Investments in open-end mutual funds, including the Fidelity Central Funds, are valued at their closing net asset value (NAV) each business day and are categorized as Level 1 in the hierarchy.
Changes in valuation techniques may result in transfers in or out of an assigned level within the disclosure hierarchy. The aggregate value of investments by input level as of October 31, 2015, including information on transfers between Levels 1 and 2, is included at the end of the Fund's Schedule of Investments.
Foreign Currency. The Fund may use foreign currency contracts to facilitate transactions in foreign-denominated securities. Gains and losses from these transactions may arise from changes in the value of the foreign currency or if the counterparties do not perform under the contracts' terms.
Foreign-denominated assets, including investment securities, and liabilities are translated into U.S. dollars at the exchange rates at period end. Purchases and sales of investment securities, income and dividends received and expenses denominated in foreign currencies are translated into U.S. dollars at the exchange rate in effect on the transaction date.
The effects of exchange rate fluctuations on investments are included with the net realized and unrealized gain (loss) on investment securities. Other foreign currency transactions resulting in realized and unrealized gain (loss) are disclosed separately.
Investment Transactions and Income. For financial reporting purposes, the Fund's investment holdings and NAV include trades executed through the end of the last business day of the period. The NAV per share for processing shareholder transactions is calculated as of the close of business of the New York Stock Exchange (NYSE), normally 4:00 p.m. Eastern time and includes trades executed through the end of the prior business day. Gains and losses on securities sold are determined on the basis of identified cost and may include proceeds received from litigation. Dividend income is recorded on the ex-dividend date, except for certain dividends from foreign securities where the ex-dividend date may have passed, which are recorded as soon as the Fund is informed of the ex-dividend date. Non-cash dividends included in dividend income, if any, are recorded at the fair market value of the securities received. Income and capital gain distributions from Fidelity Central Funds, if any, are recorded on the ex-dividend date. Interest income is accrued as earned and includes coupon interest and amortization of premium and accretion of discount on debt securities as applicable. Investment income is recorded net of foreign taxes withheld where recovery of such taxes is uncertain.
Class Allocations and Expenses. Investment income, realized and unrealized capital gains and losses, common expenses of the Fund, and certain fund-level expense reductions, if any, are allocated daily on a pro-rata basis to each class based on the relative net assets of each class to the total net assets of the Fund. Each class differs with respect to transfer agent fees incurred. Certain expense reductions may also differ by class. For the reporting period, the allocated portion of income and expenses to each class as a percent of its average net assets may vary due to the timing of recording these transactions in relation to fluctuating net assets of the classes. Expenses directly attributable to a fund are charged to that fund. Expenses attributable to more than one fund are allocated among the respective funds on the basis of relative net assets or other appropriate methods. Expense estimates are accrued in the period to which they relate and adjustments are made when actual amounts are known.
Income Tax Information and Distributions to Shareholders. Each year, the Fund intends to qualify as a regulated investment company under Subchapter M of the Internal Revenue Code, including distributing substantially all of its taxable income and realized gains. As a result, no provision for U.S. Federal income taxes is required. As of October 31, 2015, the Fund did not have any unrecognized tax benefits in the financial statements; nor is the Fund aware of any tax positions for which it is reasonably possible that the total amounts of unrecognized tax benefits will significantly change in the next twelve months. The Fund files a U.S. federal tax return, in addition to state and local tax returns as required. The Fund's federal income tax returns are subject to examination by the Internal Revenue Service (IRS) for a period of three fiscal years after they are filed. State and local tax returns may be subject to examination for an additional fiscal year depending on the jurisdiction. Foreign taxes are provided for based on the Fund's understanding of the tax rules and rates that exist in the foreign markets in which it invests. The Fund is subject to a tax imposed on capital gains by certain countries in which it invests. An estimated deferred tax liability for net unrealized appreciation on the applicable securities is included in Other payables and accrued expenses on the Statement of Assets & Liabilities.
Distributions are declared and recorded on the ex-dividend date. Income dividends and capital gain distributions are declared separately for each class. Income and capital gain distributions are determined in accordance with income tax regulations, which may differ from GAAP. In addition, the Fund claimed a portion of the payment made to redeeming shareholders as a distribution for income tax purposes.
Capital accounts within the financial statements are adjusted for permanent book-tax differences. These adjustments have no impact on net assets or the results of operations. Capital accounts are not adjusted for temporary book-tax differences which will reverse in a subsequent period.
Book-tax differences are primarily due to foreign currency transactions, certain foreign taxes, passive foreign investment companies (PFIC), deferred trustees compensation, capital loss carryforwards and losses deferred due to wash sales.
Annual Report
3. Significant Accounting Policies - continued
Income Tax Information and Distributions to Shareholders - continued
The federal tax cost of investment securities and unrealized appreciation (depreciation) as of period end were as follows:
Gross unrealized appreciation | $ 378,134,375 |
Gross unrealized depreciation | (220,237,005) |
Net unrealized appreciation (depreciation) on securities | $ 157,897,370 |
Tax Cost | $ 3,174,368,523 |
The tax-based components of distributable earnings as of period end were as follows:
Undistributed ordinary income | $ 15,537,050 |
Capital loss carryforward | $ (238,633,987) |
Net unrealized appreciation (depreciation) on securities and other investments | $ 157,194,348 |
Capital loss carryforwards are only available to offset future capital gains of the Fund to the extent provided by regulations and may be limited. Under the Regulated Investment Company Modernization Act of 2010 (the Act), the Fund is permitted to carry forward capital losses incurred in taxable years beginning after December 22, 2010 for an unlimited period and such capital losses are required to be used prior to any losses that expire. The capital loss carryforward information presented below, including any applicable limitation, is estimated as of fiscal period end and is subject to adjustment.
Fiscal year of expiration | |
2017 | $ (24,838,920) |
No expiration | |
Short-term | (189,293,193) |
Long-term | (24,501,874) |
Total no expiration | (213,795,067) |
Total capital loss carryforward | $ (238,633,987) |
The tax character of distributions paid was as follows:
| October 31, 2015 | October 31, 2014 |
Ordinary Income | $ 21,056,676 | $ 2,412,320 |
Short-Term Trading (Redemption) Fees. Shares held by investors in the Fund less than 90 days may have been subject to a redemption fee equal to 1.50% of the NAV of shares redeemed. All redemption fees, which reduce the proceeds of the shareholder redemption, are retained by the Fund and accounted for as an addition to paid in capital.
4. Purchases and Sales of Investments.
Purchases and sales of securities, other than short-term securities, aggregated $4,100,863,386 and $3,362,222,832, respectively.
5. Fees and Other Transactions with Affiliates.
Management Fee. Fidelity Management & Research Company (the investment adviser) and its affiliates provide the Fund with investment management related services for which the Fund pays a monthly management fee. The management fee is the sum of an individual fund fee rate that is based on an annual rate of .45% of the Fund's average net assets and an annualized group fee rate that averaged .25% during the period. The group fee rate is based upon the average net assets of all the mutual funds advised by the investment adviser, including any mutual funds previously advised by the investment adviser that are currently advised by Fidelity SelectCo, LLC, an affiliate of the investment adviser. The group fee rate decreases as assets under management increase and increases as assets under management decrease. For the reporting period, the total annual management fee rate was .70% of the Fund's average net assets.
Transfer Agent Fees. Fidelity Investments Institutional Operations Company, Inc., (FIIOC), an affiliate of the investment adviser, is the transfer, dividend disbursing and shareholder servicing agent for each class of the Fund. FIIOC receives account fees and asset-based fees that vary according to the account size and type of account of the shareholders of Emerging Markets. FIIOC receives an asset-based fee of Class K's average net assets. FIIOC pays for typesetting, printing and mailing of shareholder reports, except proxy statements.
Annual Report
Notes to Financial Statements - continued
5. Fees and Other Transactions with Affiliates - continued
Transfer Agent Fees - continued
For the period, transfer agent fees for each class were as follows:
| Amount | % of
Class-Level Average
Net Assets |
Emerging Markets | $ 6,491,538 | .25 |
Class K | 276,288 | .05 |
| $ 6,767,826 | |
Accounting and Security Lending Fees. Fidelity Service Company, Inc. (FSC), an affiliate of the investment adviser, maintains the Fund's accounting records. The accounting fee is based on the level of average net assets for each month. Under a separate contract, FSC administers the security lending program. The security lending fee is based on the number and duration of lending transactions.
Brokerage Commissions. The Fund placed a portion of its portfolio transactions with brokerage firms which are affiliates of the investment adviser. Brokerage commissions are included in net realized gain (loss) and change in net unrealized appreciation (depreciation) in the Statement of Operations. The commissions paid to these affiliated firms were $12,868 for the period.
Interfund Lending Program. Pursuant to an Exemptive Order issued by the SEC, the Fund, along with other registered investment companies having management contracts with FMR or other affiliated entities of FMR, may participate in an interfund lending program. This program provides an alternative credit facility allowing the funds to borrow from, or lend money to, other participating affiliated funds. At period end, there were no interfund loans outstanding. The Fund's activity in this program during the period for which loans were outstanding was as follows:
Borrower or Lender | Average Loan Balance | Weighted Average
Interest Rate | Interest Expense |
Borrower | $ 14,684,552 | .36% | $ 4,273 |
6. Committed Line of Credit.
The Fund participates with other funds managed by the investment adviser or an affiliate in a $4.25 billion credit facility (the "line of credit") to be utilized for temporary or emergency purposes to fund shareholder redemptions or for other short-term liquidity purposes. The Fund has agreed to pay commitment fees on its pro-rata portion of the line of credit, which amounted to $4,547 and is reflected in Miscellaneous expenses on the Statement of Operations. During the period, the Fund did not borrow on this line of credit.
7. Security Lending.
The Fund lends portfolio securities through a lending agent from time to time in order to earn additional income. For equity securities, a lending agent is used and may loan securities to certain qualified borrowers, including Fidelity Capital Markets (FCM), a broker-dealer affiliated with the Fund. On the settlement date of the loan, the Fund receives collateral (in the form of U.S. Treasury obligations, letters of credit and/or cash) against the loaned securities and maintains collateral in an amount not less than 100% of the market value of the loaned securities during the period of the loan. The market value of the loaned securities is determined at the close of business of the Fund and any additional required collateral is delivered to the Fund on the next business day. The Fund or borrower may terminate the loan at any time, and if the borrower defaults on its obligation to return the securities loaned because of insolvency or other reasons, the Fund may apply collateral received from the borrower against the obligation. The Fund may experience delays and costs in recovering the securities loaned. Any cash collateral received is invested in the Fidelity Securities Lending Cash Central Fund. The value of loaned securities and cash collateral at period end are disclosed on the Fund's Statement of Assets and Liabilities. At period end, there were no security loans outstanding with FCM. Security lending income represents the income earned on investing cash collateral, less rebates paid to borrowers and any lending agent fees associated with the loan, plus any premium payments received for lending certain types of securities. Security lending income is presented in the Statement of Operations as a component of income from Fidelity Central Funds. Total security lending income during the period amounted to $314,677, including $2,907 from securities loaned to FCM.
8. Expense Reductions.
Commissions paid to certain brokers with whom the investment adviser, or its affiliates, places trades on behalf of the Fund include an amount in addition to trade execution, which may be rebated back to the Fund to offset certain expenses. This amount totaled $498,851 for the period. In addition, through arrangements with the Fund's custodian, credits realized as a result of certain uninvested cash balances were used to reduce the Fund's expenses. During the period, these credits reduced the Fund's custody expenses by $662.
Annual Report
8. Expense Reductions - continued
In addition, during the period the investment adviser reimbursed and/or waived a portion of fund-level operating expenses in the amount of $14,121 and a portion of class-level operating expenses as follows:
| Amount |
Emerging Markets | $ 60,390 |
9. Distributions to Shareholders.
Distributions to shareholders of each class were as follows:
Years ended October 31, | 2015 | 2014 |
From net investment income | | |
Emerging Markets | $ 13,346,829 | $ 1,743,046 |
Class K | 4,767,792 | 669,274 |
Total | $ 18,114,621 | $ 2,412,320 |
From net realized gain | | |
Emerging Markets | $ 2,332,143 | $ - |
Class K | 609,912 | - |
Total | $ 2,942,055 | $ - |
10. Share Transactions.
Share transactions for each class were as follows and may contain automatic conversions between classes or exchanges between funds:
| Shares | Dollars |
Years ended October 31, | 2015 | 2014 | 2015 | 2014 |
Emerging Markets | | | | |
Shares sold | 55,410,811 | 21,791,321 | $ 1,332,719,199 | $ 537,287,996 |
Reinvestment of distributions | 546,115 | 57,233 | 13,577,228 | 1,363,124 |
Shares redeemed | (27,685,404) | (20,408,773) | (631,200,476) | (492,243,181) |
Net increase (decrease) | 28,271,522 | 1,439,781 | $ 715,095,951 | $ 46,407,939 |
Class K | | | | |
Shares sold | 8,915,876 | 8,911,150 | $ 215,741,410 | $ 221,271,615 |
Reinvestment of distributions | 216,324 | 28,071 | 5,377,704 | 669,274 |
Shares redeemed | (9,064,709) | (6,884,435) | (219,618,632) | (168,246,882) |
Net increase (decrease) | 67,491 | 2,054,786 | $ 1,500,482 | $ 53,694,007 |
11. Other.
The Fund's organizational documents provide former and current trustees and officers with a limited indemnification against liabilities arising in connection with the performance of their duties to the Fund. In the normal course of business, the Fund may also enter into contracts that provide general indemnifications. The Fund's maximum exposure under these arrangements is unknown as this would be dependent on future claims that may be made against the Fund. The risk of material loss from such claims is considered remote.
At the end of the period, Strategic Advisers Emerging Markets Fund was the owner of record of approximately 14% of the total outstanding shares of the Fund.
Annual Report
To the Trustees of Fidelity Investment Trust and the Shareholders of Fidelity Emerging Markets Fund:
In our opinion, the accompanying statement of assets and liabilities, including the schedule of investments, and the related statements of operations and of changes in net assets and the financial highlights present fairly, in all material respects, the financial position of Fidelity Emerging Markets Fund (a fund of Fidelity Investment Trust) at October 31, 2015, the results of its operations for the year then ended, the changes in its net assets for each of the two years in the period then ended and the financial highlights for each of the five years in the period then ended, in conformity with accounting principles generally accepted in the United States of America. These financial statements and financial highlights (hereafter referred to as "financial statements") are the responsibility of the Fidelity Emerging Markets Fund's management. Our responsibility is to express an opinion on these financial statements based on our audits. We conducted our audits of these financial statements in accordance with the standards of the Public Company Accounting Oversight Board (United States). Those standards require that we plan and perform the audit to obtain reasonable assurance about whether the financial statements are free of material misstatement. An audit includes examining, on a test basis, evidence supporting the amounts and disclosures in the financial statements, assessing the accounting principles used and significant estimates made by management, and evaluating the overall financial statement presentation. We believe that our audits, which included confirmation of securities at October 31, 2015 by correspondence with the custodian and brokers, provide a reasonable basis for our opinion.
PricewaterhouseCoopers LLP
Boston, Massachusetts
December 22, 2015
Annual Report
The Trustees, Member of the Advisory Board, and officers of the trust and fund, as applicable, are listed below. The Board of Trustees governs the fund and is responsible for protecting the interests of shareholders. The Trustees are experienced executives who meet periodically throughout the year to oversee the fund's activities, review contractual arrangements with companies that provide services to the fund, oversee management of the risks associated with such activities and contractual arrangements, and review the fund's performance. Each of the Trustees oversees 170 funds.
The Trustees hold office without limit in time except that (a) any Trustee may resign; (b) any Trustee may be removed by written instrument, signed by at least two-thirds of the number of Trustees prior to such removal; (c) any Trustee who requests to be retired or who has become incapacitated by illness or injury may be retired by written instrument signed by a majority of the other Trustees; and (d) any Trustee may be removed at any special meeting of shareholders by a two-thirds vote of the outstanding voting securities of the trust. Each Trustee who is not an interested person (as defined in the 1940 Act) of the trust and the fund (Independent Trustee), shall retire not later than the last day of the calendar year in which his or her 75th birthday occurs. The Independent Trustees may waive this mandatory retirement age policy with respect to individual Trustees. The officers and Advisory Board Member hold office without limit in time, except that any officer and Advisory Board Member may resign or may be removed by a vote of a majority of the Trustees at any regular meeting or any special meeting of the Trustees. Except as indicated, each individual has held the office shown or other offices in the same company for the past five years.
Experience, Skills, Attributes, and Qualifications of the Fund's Trustees. The Governance and Nominating Committee has adopted a statement of policy that describes the experience, qualifications, attributes, and skills that are necessary and desirable for potential Independent Trustee candidates (Statement of Policy). The Board believes that each Trustee satisfied at the time he or she was initially elected or appointed a Trustee, and continues to satisfy, the standards contemplated by the Statement of Policy. The Governance and Nominating Committee also engages professional search firms to help identify potential Independent Trustee candidates who have the experience, qualifications, attributes, and skills consistent with the Statement of Policy. From time to time, additional criteria based on the composition and skills of the current Independent Trustees, as well as experience or skills that may be appropriate in light of future changes to board composition, business conditions, and regulatory or other developments, have also been considered by the professional search firms and the Governance and Nominating Committee. In addition, the Board takes into account the Trustees' commitment and participation in Board and committee meetings, as well as their leadership of standing and ad hoc committees throughout their tenure.
In determining that a particular Trustee was and continues to be qualified to serve as a Trustee, the Board has considered a variety of criteria, none of which, in isolation, was controlling. The Board believes that, collectively, the Trustees have balanced and diverse experience, qualifications, attributes, and skills, which allow the Board to operate effectively in governing the fund and protecting the interests of shareholders. Information about the specific experience, skills, attributes, and qualifications of each Trustee, which in each case led to the Board's conclusion that the Trustee should serve (or continue to serve) as a trustee of the fund, is provided below.
Board Structure and Oversight Function. James C. Curvey is an interested person (as defined in the 1940 Act) and currently serves as Chairman. The Trustees have determined that an interested Chairman is appropriate and benefits shareholders because an interested Chairman has a personal and professional stake in the quality and continuity of services provided to the fund. Independent Trustees exercise their informed business judgment to appoint an individual of their choosing to serve as Chairman, regardless of whether the Trustee happens to be independent or a member of management. The Independent Trustees have determined that they can act independently and effectively without having an Independent Trustee serve as Chairman and that a key structural component for assuring that they are in a position to do so is for the Independent Trustees to constitute a substantial majority for the Board. The Independent Trustees also regularly meet in executive session. Ned C. Lautenbach serves as Chairman of the Independent Trustees and as such (i) acts as a liaison between the Independent Trustees and management with respect to matters important to the Independent Trustees and (ii) with management prepares agendas for Board meetings.
Fidelity funds are overseen by different Boards of Trustees. The fund's Board oversees Fidelity's high income and certain equity funds, and other Boards oversee Fidelity's investment-grade bond, money market, asset allocation, and sector funds. The asset allocation funds may invest in Fidelity funds overseen by the fund's Board. The use of separate Boards, each with its own committee structure, allows the Trustees of each group of Fidelity funds to focus on the unique issues of the funds they oversee, including common research, investment, and operational issues. On occasion, the separate Boards establish joint committees to address issues of overlapping consequences for the Fidelity funds overseen by each Board.
The Trustees operate using a system of committees to facilitate the timely and efficient consideration of all matters of importance to the Trustees, the fund, and fund shareholders and to facilitate compliance with legal and regulatory requirements and oversight of the fund's activities and associated risks. The Board, acting through its committees, has charged FMR and its affiliates with (i) identifying events or circumstances the occurrence of which could have demonstrably adverse effects on the fund's business and/or reputation; (ii) implementing processes and controls to lessen the possibility that such events or circumstances occur or to mitigate the effects of such events or circumstances if they do occur; and (iii) creating and maintaining a system designed to evaluate continuously business and market conditions in order to facilitate the identification and implementation processes described in (i) and (ii) above. Because the day-to-day operations and activities of the fund are carried out by or through FMR, its affiliates and other service providers, the fund's exposure to risks is mitigated but not eliminated by the processes overseen by the Trustees. While each of the Board's committees has responsibility for overseeing different aspects of the fund's activities, oversight is exercised primarily through the Operations, Audit, and Compliance Committees. In addition, the Independent Trustees have worked with FMR to enhance the Board's oversight of investment and financial risks, legal and regulatory risks, technology risks, and operational risks, including the development of additional risk reporting to the Board. For example, a working group comprised of Independent Trustees and FMR has worked and continues to work to review the Fidelity funds' valuation-related activities, reporting and risk management. Appropriate personnel, including but not limited to the fund's Chief Compliance Officer (CCO), FMR's internal auditor, the independent accountants, the fund's Treasurer and portfolio management personnel, make periodic reports to the Board's committees, as appropriate, including an annual review of Fidelity's risk management program for the Fidelity funds. The responsibilities of each standing committee, including their oversight responsibilities, are described further under "Standing Committees of the Fund's Trustees."
Annual Report
Trustees and Officers - continued
The fund's Statement of Additional Information (SAI) includes more information about the Trustees. To request a free copy, call Fidelity at 1-800-835-5092.
Interested Trustees*:
Correspondence intended for each Trustee who is an interested person may be sent to Fidelity Investments, 245 Summer Street, Boston, Massachusetts 02210.
Name, Year of Birth; Principal Occupations and Other Relevant Experience+ |
James C. Curvey (1935) |
Year of Election or Appointment: 2007 Trustee Chairman of the Board of Trustees |
| Mr. Curvey also serves as Trustee of other Fidelity funds. Mr. Curvey is a Director of Fidelity Research & Analysis Co. (investment adviser firm, 2009-present), and Vice Chairman (2007-present) and Director of FMR LLC (diversified financial services company). In addition, Mr. Curvey serves as an Overseer for the Boston Symphony Orchestra and a member of the board of Artis-Naples, Naples, Florida, and as a Trustee for Brewster Academy, Wolfeboro, New Hampshire. Previously, Mr. Curvey served as a Director of Fidelity Investments Money Management, Inc. (investment adviser firm, 2009-2014) and a Director of FMR and FMR Co., Inc. (investment adviser firms, 2007-2014). |
Charles S. Morrison (1960) |
Year of Election or Appointment: 2014 Trustee |
| Mr. Morrison also serves as Trustee of other funds. He serves as a Director of Fidelity Investments Money Management, Inc. (FIMM) (investment adviser firm, 2014-present), Director of Fidelity SelectCo, LLC (investment adviser firm, 2014-present), President, Asset Management (2014-present), and is an employee of Fidelity Investments. Previously, Mr. Morrison served as Vice President of Fidelity's Fixed Income and Asset Allocation Funds (2012-2014), President, Fixed Income (2011-2014), Vice President of Fidelity's Money Market Funds (2005-2009), President, Money Market Group Leader of FMR (investment adviser firm, 2009), and Senior Vice President, Money Market Group of FMR (2004-2009). Mr. Morrison also served as Vice President of Fidelity's Bond Funds (2002-2005), certain Balanced Funds (2002-2005), and certain Asset Allocation Funds (2002-2007), and as Senior Vice President (2002-2005) of Fidelity's Bond Division. |
* Trustees have been determined to be "Interested Trustees" by virtue of, among other things, their affiliation with the trust or various entities under common control with FMR.
+ The information above includes each Trustee's principal occupation during the last five years and other information relating to the experience, attributes, and skills relevant to each Trustee's qualifications to serve as a Trustee, which led to the conclusion that each Trustee should serve as a Trustee for the fund.
Annual Report
Independent Trustees:
Correspondence intended for each Independent Trustee (that is, the Trustees other than the Interested Trustees) may be sent to Fidelity Investments, P.O. Box 55235, Boston, Massachusetts 02205-5235.
Name, Year of Birth; Principal Occupations and Other Relevant Experience+ |
Dennis J. Dirks (1948) |
Year of Election or Appointment: 2005 Trustee |
| Mr. Dirks also serves as Trustee of other Fidelity funds. Prior to his retirement in May 2003, Mr. Dirks was Chief Operating Officer and a member of the Board of The Depository Trust & Clearing Corporation (DTCC). He also served as President, Chief Operating Officer, and Board member of The Depository Trust Company (DTC) and President and Board member of the National Securities Clearing Corporation (NSCC). In addition, Mr. Dirks served as Chief Executive Officer and Board member of the Government Securities Clearing Corporation, Chief Executive Officer and Board member of the Mortgage-Backed Securities Clearing Corporation, as a Trustee and a member of the Finance Committee of Manhattan College (2005-2008), as a Trustee and a member of the Finance Committee of AHRC of Nassau County (2006-2008), and as a member of the Independent Directors Council (IDC) Governing Council (2010-2015). Mr. Dirks is a member of the Board of Directors for The Brookville Center for Children's Services, Inc. (2009-present). |
Alan J. Lacy (1953) |
Year of Election or Appointment: 2008 Trustee |
| Mr. Lacy also serves as Trustee of other Fidelity funds. Mr. Lacy serves as a member of the Board of Directors of Dave & Buster's Entertainment, Inc. (restaurant and entertainment complexes, 2010-present) and Bristol-Myers Squibb Company (global pharmaceuticals, 2008-present). In addition, Mr. Lacy served as Senior Adviser (2007-2014) of Oak Hill Capital Partners, L.P. (private equity) and also served as Chief Executive Officer (2000-2005) and Vice Chairman (2005-2006) of Sears Holdings Corporation and Sears, Roebuck and Co. (retail). Mr. Lacy is a member of the Board of Trustees of The National Parks Conservation Association (2006-present). Previously, Mr. Lacy served as Chairman of the Board of Trustees of the National Parks Conservation Association (2008-2011) and as a member of the Board of Directors for The Western Union Company (global money transfer, 2006-2011), The Hillman Companies, Inc. (hardware wholesalers, 2010-2014), and Earth Fare, Inc. (retail grocery, 2010-2014). |
Ned C. Lautenbach (1944) |
Year of Election or Appointment: 2000 Trustee Chairman of the Independent Trustees |
| Mr. Lautenbach also serves as Trustee of other Fidelity funds. Mr. Lautenbach currently serves as the Lead Director of the Eaton Corporation Board of Directors (diversified industrial, 1997-present). Mr. Lautenbach is Chairman of the Board of Directors of Artis-Naples in Naples, Florida (2012-present), a member of the Council on Foreign Relations (1994-present), and a member of the Board of Governors, State University System of Florida (2013-present). Previously, Mr. Lautenbach was a Partner/Advisory Partner at Clayton, Dubilier & Rice, LLC (private equity investment, 1998-2010), as well as a Director of Sony Corporation (2006-2007). |
Joseph Mauriello (1944) |
Year of Election or Appointment: 2008 Trustee |
| Mr. Mauriello also serves as Trustee of other Fidelity funds. Prior to his retirement in January 2006, Mr. Mauriello served in numerous senior management positions including Deputy Chairman and Chief Operating Officer (2004-2005), and Vice Chairman of Financial Services (2002-2004) of KPMG LLP US (professional services, 1965-2005). Mr. Mauriello currently serves as a member of the Board of Directors of XL Group plc. (global insurance and re-insurance, 2006-present) and the Independent Directors Council (IDC) Governing Council (2015-present). Previously, Mr. Mauriello served as a Director of the Hamilton Funds of the Bank of New York (2006-2007) and of Arcadia Resources Inc. (health care services and products, 2007-2012). |
Robert W. Selander (1950) |
Year of Election or Appointment: 2011 Trustee |
| Mr. Selander also serves as Trustee of other Fidelity funds. Mr. Selander serves as a Director of The Western Union Company (global money transfer, 2014-present). Previously, Mr. Selander served as a Member of the Advisory Board of other Fidelity funds (2011), and Executive Vice Chairman (2010), Chief Executive Officer (2009-2010), and President and Chief Executive Officer (1997-2009) of Mastercard, Inc. |
Cornelia M. Small (1944) |
Year of Election or Appointment: 2005 Trustee |
| Ms. Small also serves as Trustee of other Fidelity funds. Ms. Small is a member of the Board of Directors (2009-present) and Chair of the Investment Committee (2010-present) of the Teagle Foundation. Ms. Small also serves on the Investment Committee of the Berkshire Taconic Community Foundation (2008-present). Previously, Ms. Small served as Chairperson (2002-2008) and a member of the Investment Committee and Chairperson (2008-2012) and a member of the Board of Trustees of Smith College. In addition, Ms. Small served as Chief Investment Officer, Director of Global Equity Investments, and a member of the Board of Directors of Scudder, Stevens & Clark and Scudder Kemper Investments. |
William S. Stavropoulos (1939) |
Year of Election or Appointment: 2001 Trustee Vice Chairman of the Independent Trustees |
| Mr. Stavropoulos also serves as Trustee of other Fidelity funds. Mr. Stavropoulos serves as President and Founder of the Michigan Baseball Foundation, the Great Lakes Loons (2007-present). Mr. Stavropoulos is Chairman Emeritus of the Board of Directors of The Dow Chemical Company, where he previously served in numerous senior management positions, including President, CEO (1995-2000; 2002-2004), Chairman of the Executive Committee (2000-2006), and as a member of the Board of Directors (1990-2006). Currently, Mr. Stavropoulos is Chairman of the Board of Directors of Univar Inc. (global distributor of commodity and specialty chemicals), a Director of Teradata Corporation (data warehousing and technology solutions), and Maersk Inc. (industrial conglomerate), and a member of the Advisory Board for Metalmark Capital LLC (private equity investment, 2005-present). Mr. Stavropoulos is an operating advisor to Clayton, Dubilier & Rice, LLC (private equity investment). In addition, Mr. Stavropoulos is a member of the University of Notre Dame Advisory Council for the College of Science, a Trustee of the Rollin L. Gerstacker Foundation, and a Director of the Naples Philharmonic Center for the Arts. Previously, Mr. Stavropoulos served as a Director of Chemical Financial Corporation (bank holding company, 1993-2012) and Tyco International, Ltd. (multinational manufacturing and services, 2007-2012). |
David M. Thomas (1949) |
Year of Election or Appointment: 2008 Trustee |
| Mr. Thomas also serves as Trustee of other Fidelity funds. Mr. Thomas serves as Non-Executive Chairman of the Board of Directors of Fortune Brands Home and Security (home and security products, 2011-present), as a member of the Board of Directors (2004-present) and Presiding Director (2013-present) of Interpublic Group of Companies, Inc. (marketing communication), and as a member of the Board of Trustees of the University of Florida (2013-present). Previously, Mr. Thomas served as Executive Chairman (2005-2006) and Chairman and Chief Executive Officer (2000-2005) of IMS Health, Inc. (pharmaceutical and healthcare information solutions), and a Director of Fortune Brands, Inc. (consumer products, 2000-2011). |
+ The information above includes each Trustee's principal occupation during the last five years and other information relating to the experience, attributes, and skills relevant to each Trustee's qualifications to serve as a Trustee, which led to the conclusion that each Trustee should serve as a Trustee for the fund.
Advisory Board Member and Officers:
Correspondence intended for each officer and Peter S. Lynch may be sent to Fidelity Investments, 245 Summer Street, Boston, Massachusetts 02210. Officers appear below in alphabetical order.
Name, Year of Birth; Principal Occupation |
Peter S. Lynch (1944) |
Year of Election or Appointment: 2003 Member of the Advisory Board |
| Mr. Lynch also serves as Member of the Advisory Board of other Fidelity funds. Mr. Lynch is Vice Chairman and a Director of FMR (investment adviser firm) and FMR Co., Inc. (investment adviser firm). In addition, Mr. Lynch serves as a Trustee of Boston College and as the Chairman of the Inner-City Scholarship Fund. Previously, Mr. Lynch served on the Special Olympics International Board of Directors (1997-2006). |
Elizabeth Paige Baumann (1968) |
Year of Election or Appointment: 2012 Anti-Money Laundering (AML) Officer |
| Ms. Baumann also serves as AML Officer of other funds. She is Chief AML Officer of FMR LLC (diversified financial services company, 2012-present) and is an employee of Fidelity Investments. Previously, Ms. Baumann served as Vice President and Deputy Anti-Money Laundering Officer (2007-2012). |
Marc R. Bryant (1966) |
Year of Election or Appointment: 2015 Secretary and Chief Legal Officer (CLO) |
| Mr. Bryant also serves as Secretary and CLO of other funds. Mr. Bryant serves as CLO, Secretary, and Senior Vice President of Fidelity Management & Research Company (investment adviser firm, 2015-present) and FMR Co., Inc. (investment adviser firm, 2015-present); Secretary of Fidelity SelectCo, LLC (investment adviser firm, 2015-present) and Fidelity Investments Money Management, Inc. (investment adviser firm, 2015-present); and CLO of Fidelity Management & Research (Hong Kong) Limited (investment adviser firm, 2015-present). He is Senior Vice President and Deputy General Counsel of FMR LLC (diversified financial services company). Previously, Mr. Bryant served as Secretary and Chief Legal Officer of Fidelity Rutland Square Trust II (2010-2014) and Assistant Secretary of Fidelity's Fixed Income and Asset Allocation Funds (2013-2015). Prior to joining Fidelity Investments, Mr. Bryant served as a Senior Vice President and the Head of Global Retail Legal for AllianceBernstein L.P. (2006-2010), and as the General Counsel for ProFund Advisors LLC (2001-2006). |
William C. Coffey (1969) |
Year of Election or Appointment: 2009 Assistant Secretary |
| Mr. Coffey also serves as Assistant Secretary of other funds. He is Senior Vice President and Deputy General Counsel of FMR LLC (diversified financial services company, 2010-present), and is an employee of Fidelity Investments. Previously, Mr. Coffey served as Vice President and Associate General Counsel of FMR LLC (2005-2009). |
Timothy M. Cohen (1969) |
Year of Election or Appointment: 2014 Vice President of certain Equity Funds |
| Mr. Cohen also serves as Vice President of other funds. Mr. Cohen serves as Chief Compliance Officer of FMR Investment Management (U.K.) Limited (investment adviser firm, 2013-present) and is an employee of Fidelity Investments. Previously, Mr. Cohen served as a Director of FMR Investment Management (U.K.) Limited (2013-2015). |
Jonathan Davis (1968) |
Year of Election or Appointment: 2010 Assistant Treasurer |
| Mr. Davis also serves as Assistant Treasurer of other funds, and is an employee of Fidelity Investments. Previously, Mr. Davis served as Vice President and Associate General Counsel of FMR LLC (diversified financial services company, 2003-2010). |
Adrien E. Deberghes (1967) |
Year of Election or Appointment: 2008 Deputy Treasurer |
| Mr. Deberghes also serves as an officer of other funds. He is an employee of Fidelity Investments (2008-present). Prior to joining Fidelity Investments, Mr. Deberghes was Senior Vice President of Mutual Fund Administration at State Street Corporation (2007-2008), Senior Director of Mutual Fund Administration at Investors Bank & Trust (2005-2007), and Director of Finance for Dunkin' Brands (2000-2005). |
Stephanie J. Dorsey (1969) |
Year of Election or Appointment: 2010 Assistant Treasurer |
| Ms. Dorsey also serves as an officer of other funds. She is an employee of Fidelity Investments (2008-present) and has served in other fund officer roles. Prior to joining Fidelity Investments, Ms. Dorsey served as Treasurer (2004-2008) of the JPMorgan Mutual Funds and Vice President (2004-2008) of JPMorgan Chase Bank. |
Howard J. Galligan III (1966) |
Year of Election or Appointment: 2014 Chief Financial Officer |
| Mr. Galligan also serves as Chief Financial Officer of other funds. Mr. Galligan serves as President of Fidelity Pricing and Cash Management Services (FPCMS) (2014-present) and as a Director of Strategic Advisers, Inc. (investment adviser firm, 2008-present). Previously, Mr. Galligan served as Chief Administrative Officer of Asset Management (2011-2014) and Chief Operating Officer and Senior Vice President of Investment Support for Strategic Advisers, Inc. (2003-2011). |
Scott C. Goebel (1968) |
Year of Election or Appointment: 2015 Vice President |
| Mr. Goebel serves as Vice President of other funds and is an employee of Fidelity Investments (2001-present). Previously, Mr. Goebel served as Secretary of Fidelity SelectCo, LLC (investment adviser firm, 2013-2015), Fidelity Investments Money Management, Inc. (FIMM) (investment adviser firm, 2010-2015), and Fidelity Research and Analysis Company (FRAC) (investment adviser firm, 2010-2015); General Counsel, Secretary, and Senior Vice President of Fidelity Management & Research Company (investment adviser firm, 2008-2015) and FMR Co., Inc. (investment adviser firm, 2008-2015); Assistant Secretary of Fidelity Management & Research (Japan) Limited (investment adviser firm, 2008-2015) and FMR Investment Management (U.K.) Limited (investment adviser firm, 2008-2015); Chief Legal Officer (CLO) of Fidelity Management & Research (Hong Kong) Limited (investment adviser firm, 2008-2015); Secretary and CLO of certain Fidelity funds (2008-2015); Assistant Secretary of FIMM (2008-2010), FRAC (2008-2010), and certain funds (2007-2008); and as Vice President and Secretary of Fidelity Distributors Corporation (FDC) (2005-2007). |
Brian B. Hogan (1964) |
Year of Election or Appointment: 2009 Vice President |
| Mr. Hogan also serves as Trustee or Vice President of other funds. Mr. Hogan serves as a Director of Fidelity SelectCo, LLC (investment adviser firm, 2014-present) and President of the Equity Division of FMR (investment adviser firm, 2009-present). Previously, Mr. Hogan served as Senior Vice President, Equity Research of FMR (2006-2009) and as a portfolio manager. |
Chris Maher (1972) |
Year of Election or Appointment: 2013 Assistant Treasurer |
| Mr. Maher serves as Assistant Treasurer of other funds. Mr. Maher is Vice President of Valuation Oversight and is an employee of Fidelity Investments. Previously, Mr. Maher served as Vice President of Asset Management Compliance (2013), Vice President of the Program Management Group of FMR (investment adviser firm, 2010-2013), and Vice President of Valuation Oversight (2008-2010). |
Kenneth B. Robins (1969) |
Year of Election or Appointment: 2008 President and Treasurer |
| Mr. Robins also serves as an officer of other funds. Mr. Robins serves as Executive Vice President of Fidelity Investments Money Management, Inc. (FIMM) (investment adviser firm, 2013-present) and is an employee of Fidelity Investments (2004-present). Previously, Mr. Robins served in other fund officer roles. |
Stacie M. Smith (1974) |
Year of Election or Appointment: 2013 Deputy Treasurer |
| Ms. Smith also serves as an officer of other funds. She is an employee of Fidelity Investments (2009-present) and has served in other fund officer roles. Prior to joining Fidelity Investments, Ms. Smith served as Senior Audit Manager of Ernst & Young LLP (1996-2009). |
Renee Stagnone (1975) |
Year of Election or Appointment: 2013 Deputy Treasurer |
| Ms. Stagnone also serves as Deputy Treasurer of other funds. Ms. Stagnone is an employee of Fidelity Investments (1997-present). |
Linda J. Wondrack (1964) |
Year of Election or Appointment: 2014 Chief Compliance Officer |
| Ms. Wondrack also serves as Chief Compliance Officer of other funds. Ms. Wondrack is Executive Vice President and head of the Ethics Office and Asset Management Compliance for Fidelity Investments (2012-present). Ms. Wondrack also serves as Chief Compliance Officer of Fidelity SelectCo, LLC (investment adviser firm, 2014-present); Chief Compliance Officer of Impresa Management LLC (2013-present); and Chief Compliance Officer of FMR Co., Inc. (investment adviser firm), Fidelity Investments Money Management, Inc. (investment adviser firm), Fidelity Management & Research (Japan) Limited (investment adviser firm), FMR Investment Management (U.K.) Limited (investment adviser firm), Fidelity Management & Research (Hong Kong) (investment adviser firm), Fidelity Management & Research Company (investment adviser firm), FIAM LLC (investment adviser firm), and Strategic Advisers, Inc. (investment adviser firm), Ballyrock Investment Advisors LLC, and Northern Neck Investors LLC (2012-present). Previously, Ms. Wondrack served as Senior Vice President and Chief Compliance Officer for Columbia Management Investment Advisers, LLC (2005-2012); Chief Compliance Officer for certain funds within the Columbia Family of Funds (2007-2012); and Senior Vice President of Compliance Risk Management at Bank of America (2005-2010). |
Joseph F. Zambello (1957) |
Year of Election or Appointment: 2011 Deputy Treasurer |
| Mr. Zambello also serves as Deputy Treasurer of other funds. Mr. Zambello is an employee of Fidelity Investments (1991-present). Previously, Mr. Zambello served as Vice President of the Program Management Group of FMR (investment adviser firm, 2009-2011) and Vice President of the Transfer Agent Oversight Group (2005-2009). |
Annual Report
A percentage of the dividends distributed during the fiscal year qualify for the dividends-received deduction for corporate shareholders:
| December 5, 2014 | December 26, 2014 |
Class K | 4% | 19% |
A percentage the dividends distributed during the fiscal year may be taken into account as a dividend for the purposes of the maximum rate under section 1(h)(11) of the Internal Revenue Code:
| December 5, 2014 | December 26, 2014 |
Class K | 100% | 100% |
The amounts per share which represent income derived from sources within, and taxes paid to, foreign countries or possessions of the United
States are as follows:
| Pay Date | Income | Taxes |
Class K | 12/08/2014 | $0.2578 | $0.0478 |
| 12/29/2014 | $0.0100 | $0.0000 |
The fund will notify shareholders in January 2016 of amounts for use in preparing 2015 income tax returns.
Annual Report
Fidelity Emerging Markets Fund
Each year, the Board of Trustees, including the Independent Trustees (together, the Board), votes on the renewal of the management contract with Fidelity Management & Research Company (FMR) and the sub-advisory agreements (together, the Advisory Contracts) for the fund. The Board, assisted by the advice of fund counsel and Independent Trustees' counsel, requests and considers a broad range of information relevant to the renewal of the Advisory Contracts throughout the year.
The Board meets regularly and, at each of its meetings, covers an extensive agenda of topics and materials and considers factors that are relevant to its annual consideration of the renewal of the fund's Advisory Contracts, including the services and support provided to the fund and its shareholders. The Board has established various standing committees (Committees), each composed of and chaired by Independent Trustees with varying backgrounds, to which the Board has assigned specific subject matter responsibilities in order to enhance effective decision-making by the Board. The Board, acting directly and through its Committees, requests and receives information concerning the annual consideration of the renewal of the fund's Advisory Contracts. The Board also meets as needed to consider matters specifically related to the Board's annual consideration of the renewal of the Advisory Contracts. Members of the Board may also meet with trustees of other Fidelity funds through ad hoc joint committees to discuss certain matters relevant to all of the Fidelity funds.
At its July 2015 meeting, the Board unanimously determined to renew the fund's Advisory Contracts. In reaching its determination, the Board considered all factors it believed relevant, including (i) the nature, extent, and quality of the services to be provided to the fund and its shareholders (including the investment performance of the fund); (ii) the competitiveness of the fund's management fee and total expense ratio relative to peer funds; (iii) the total costs of the services to be provided by and the profits to be realized by Fidelity from its relationship with the fund; and (iv) the extent to which (if any) economies of scale exist and would be realized as the fund grows, and whether any economies of scale are appropriately shared with fund shareholders.
In considering whether to renew the Advisory Contracts for the fund, the Board reached a determination, with the assistance of fund counsel and Independent Trustees' counsel and through the exercise of its business judgment, that the renewal of the Advisory Contracts was in the best interests of the fund and its shareholders and that the compensation payable under the Advisory Contracts was fair and reasonable. The Board's decision to renew the Advisory Contracts was not based on any single factor, but rather was based on a comprehensive consideration of all the information provided to the Board at its meetings throughout the year. The Board, in reaching its determination to renew the Advisory Contracts, was aware that shareholders of the fund have a broad range of investment choices available to them, including a wide choice among funds offered by Fidelity's competitors, and that the fund's shareholders, who have the opportunity to review and weigh the disclosure provided by the fund in its prospectus and other public disclosures, have chosen to invest in this fund, which is part of the Fidelity family of funds.
Nature, Extent, and Quality of Services Provided. The Board considered Fidelity's staffing as it relates to the fund, including the backgrounds of investment personnel of Fidelity and also considered the fund's investment objective, strategies, and related investment philosophy. The Independent Trustees also had discussions with senior management of Fidelity's investment operations and investment groups. The Board considered the structure of the portfolio manager compensation program and whether this structure provides appropriate incentives to act in the best interests of the fund. Additionally, the Board considered the portfolio managers' investments, if any, in the funds that they manage.
Resources Dedicated to Investment Management and Support Services. The Board and the Fund Oversight and Research Committees reviewed the general qualifications and capabilities of Fidelity's investment staff, including its size, education, experience, and resources, as well as Fidelity's approach to recruiting, training, managing, and compensating investment personnel. The Board noted that Fidelity has continued to increase the resources devoted to non-U.S. offices, including expansion of Fidelity's global investment organization. The Board also noted that Fidelity's analysts have extensive resources, tools and capabilities that allow them to conduct sophisticated quantitative and fundamental analysis, as well as credit analysis of issuers, counterparties and guarantors. Further, the Board considered that Fidelity's investment professionals have sufficient access to global information and data so as to provide competitive investment results over time, and that those professionals also have access to sophisticated tools that permit them to assess portfolio construction and risk and performance attribution characteristics continuously, as well as to transmit new information and research conclusions rapidly around the world. Additionally, in its deliberations, the Board considered Fidelity's trading, risk management, and compliance capabilities and resources, which are integral parts of the investment management process.
Shareholder and Administrative Services. The Board considered (i) the nature, extent, quality, and cost of advisory, administrative, and shareholder services performed by FMR, the sub-advisers (together with FMR, the Investment Advisers), and their affiliates under the Advisory Contracts and under separate agreements covering transfer agency, pricing and bookkeeping, and securities lending services for the fund; (ii) the nature and extent of the supervision of third party service providers, principally custodians and subcustodians; and (iii) the resources devoted to, and the record of compliance with, the fund's compliance policies and procedures. The Board also reviewed the allocation of fund brokerage, including allocations to brokers affiliated with the Investment Advisers, the use of brokerage commissions to pay fund expenses, and the use of "soft" commission dollars to pay for research services.
Annual Report
The Board noted that the growth of fund assets over time across the complex allows Fidelity to reinvest in the development of services designed to enhance the value or convenience of the Fidelity funds as investment vehicles. These services include 24-hour access to account information and market information through telephone representatives and over the Internet, investor education materials and asset allocation tools, and the expanded availability of Fidelity Investor Centers.
In 2014, the Board formed an ad hoc Committee on Transfer Agency Fees to review the variety of transfer agency fee structures throughout the industry and Fidelity's competitive positioning with respect to industry participants.
Investment in a Large Fund Family. The Board considered the benefits to shareholders of investing in a Fidelity fund, including the benefits of investing in a fund that is part of a large family of funds offering a variety of investment disciplines and providing a large variety of mutual fund investor services. The Board noted that Fidelity had taken, or had made recommendations that resulted in the Fidelity funds taking, a number of actions over the previous year that benefited particular funds, including (i) continuing to dedicate additional resources to investment research and to the support of the senior management team that oversees asset management; (ii) continuing efforts to enhance Fidelity's global research capabilities; (iii) launching new funds and making other enhancements to meet client needs; (iv) reducing management fees and total expenses for certain index funds and diversified international funds; (v) continuing to launch dedicated lower cost underlying funds to meet portfolio construction needs related to expanding underlying fund options for Fidelity funds of funds, specifically for the Freedom Fund product lines; (vi) rationalizing product lines and gaining increased efficiencies through fund mergers; (vii) launching active fixed-income exchange-traded funds; (viii) continuing to develop, acquire and implement systems and technology to improve services to the funds and information security and to increase efficiency; (ix) implementing investment enhancements to further strengthen Fidelity's target date product line to increase investors' probability of success in achieving their goals; (x) modifying the eligibility criteria for certain share classes to accommodate roll-over assets from employer-sponsored retirement plans; (xi) launching a new Class W of the Freedom Index Funds to attract and retain Fidelity record-kept retirement plan assets; and (xii) implementing changes to Fidelity's money market product line in response to recent money market regulatory reforms.
Investment Performance. The Board considered whether the fund has operated in accordance with its investment objective, as well as its record of compliance with its investment restrictions and its performance history. The Board noted that there was a portfolio management change for the fund in October 2012.
The Board took into account discussions with representatives of the Investment Advisers about fund investment performance that occur at Board meetings throughout the year. In this regard the Board noted that as part of regularly scheduled fund reviews and other reports to the Board on fund performance, the Board considers annualized return information for the fund, for different time periods, measured against a securities market index ("benchmark index") and a peer group of funds with similar objectives ("peer group"), if any. In its evaluation of fund investment performance, the Board gave particular attention to information indicating changes in performance of certain Fidelity funds for specific time periods and discussed with the Investment Advisers the reasons for any overperformance or underperformance.
In addition to reviewing absolute and relative fund performance, the Independent Trustees periodically consider the appropriateness of fund performance metrics in evaluating the results achieved. In general, the Independent Trustees believe that fund performance should be evaluated based on net performance (after fees and expenses) of both the highest performing and lowest performing fund share classes, where applicable, compared to appropriate benchmark indices, over appropriate time periods that may include full market cycles, and compared to peer groups, as applicable, over the same periods, taking into account relevant factors including the following: general market conditions; issuer-specific information; and fund cash flows and other factors.
The Independent Trustees recognize that shareholders evaluate performance on a net basis over their own holding periods, for which one-, three-, and five-year periods are often used as a proxy. For this reason, the performance information reviewed by the Board also included net cumulative calendar year total return information for the fund and an appropriate benchmark index and peer group for the most recent one-, three-, and five-year periods, as shown below. Returns are shown compared to the 25th percentile (top of box, 75% beaten) and 75th percentile (bottom of box, 25% beaten) of the peer universe.
Annual Report
Board Approval of Investment Advisory Contracts and Management Fees - continued
Fidelity Emerging Markets Fund

Based on its review, the Board concluded that the nature, extent, and quality of services provided to the fund under the Advisory Contracts should benefit the shareholders of the fund.
Competitiveness of Management Fee and Total Expense Ratio. The Board considered the fund's management fee and total expense ratio compared to "mapped groups" of competitive funds and classes created for the purpose of facilitating the Trustees' competitive analysis of management fees and total expenses. Fidelity creates "mapped groups" by combining similar Lipper investment objective categories that have comparable investment mandates. Combining Lipper investment objective categories aids the Board's management fee and total expense ratio comparisons by broadening the competitive group used for comparison.
Management Fee. The Board considered two proprietary management fee comparisons for the 12-month periods shown in basis points (BP) in the chart below. The group of Lipper funds used by the Board for management fee comparisons is referred to below as the "Total Mapped Group." The Total Mapped Group comparison focuses on a fund's standing in terms of gross management fees before expense reimbursements or caps, and without giving effect to the fund's performance adjustment, relative to the total universe of funds with comparable investment mandates, regardless of whether their management fee structures also are comparable. Funds with comparable investment mandates offer exposure to similar types of securities. Funds with comparable management fee structures have similar management fee contractual arrangements (e.g., flat rate charged for advisory services, all-inclusive fee rate, etc.). "TMG %" represents the percentage of funds in the Total Mapped Group that had management fees that were lower than the fund's. For example, a hypothetical TMG % of 20% would mean that 80% of the funds in the Total Mapped Group had higher, and 20% had lower, management fees than the fund. The fund's actual TMG %s and the number of funds in the Total Mapped Group are in the chart below. The "Asset-Size Peer Group" (ASPG) comparison focuses on a fund's standing relative to a subset of non-Fidelity funds within the Total Mapped Group that are similar in size and management fee structure without taking into account performance adjustments, if any. For example, if a fund is in the first quartile of the ASPG, the fund's management fee ranks in the least expensive or lowest 25% of funds in the ASPG. The ASPG represents at least 15% of the funds in the Total Mapped Group with comparable asset size and management fee structures, subject to a minimum of 50 funds (or all funds in the Total Mapped Group if fewer than 50). Additional information, such as the ASPG quartile in which the fund's management fee rate ranked and the impact of the fund's performance adjustment, is also included in the chart and considered by the Board.
Annual Report
Fidelity Emerging Markets Fund

The Board noted that the fund's management fee rate ranked below the median of its Total Mapped Group and below the median of its ASPG for 2014.
The Board noted that, in 2014, the ad hoc Committee on Group Fee was formed by it and other Fidelity fund boards to conduct an in-depth review of the "group fee" component of the management fee of funds with such management fee structures. Committee focus included the mechanics of the group fee, the competitive landscape of group fee structures, Fidelity funds with no group fee component and investment products not included in group fee assets. The Board also considered that, for funds subject to the group fee, FMR agreed to voluntarily waive fees over a specified period of time in amounts designed to account for assets converted from certain funds to certain collective investment trusts.
The Board also noted that, in 2013, the ad hoc Committee on Management Fees was formed to conduct an in-depth review of the management fee rates of Fidelity's active equity mutual funds. The Committee focused on the following areas: (i) standard fee structures; (ii) research consumption and trading evolution; (iii) management fee competitiveness/profitability by category; and (iv) factors that drive institutional pricing.
Based on its review, the Board concluded that the fund's management fee is fair and reasonable in light of the services that the fund receives and the other factors considered.
Total Expense Ratio. In its review of each class's total expense ratio, the Board considered the fund's management fee as well as other fund or class expenses, as applicable, such as transfer agent fees, pricing and bookkeeping fees, and custodial, legal, and audit fees. The Board also noted that Fidelity may agree to waive fees and expenses from time to time, and the extent to which, if any, it has done so for the fund. As part of its review, the Board also considered the current and historical total expense ratios of each class of the fund compared to competitive fund median expenses. Each class of the fund is compared to those funds and classes in the Total Mapped Group (used by the Board for management fee comparisons) that have a similar sales load structure.
The Board noted that the total expense ratio of each class ranked below its competitive median for 2014.
Fees Charged to Other Fidelity Clients. The Board also considered Fidelity fee structures and other information with respect to clients of Fidelity, such as other funds advised or subadvised by Fidelity, pension plan clients, and other institutional clients with similar mandates. The Board noted the findings of the 2013 ad hoc joint committee (created with the board of other Fidelity funds), which reviewed and compared Fidelity's institutional investment advisory business with its business of providing services to the Fidelity funds, including the differences in services provided, fees charged, and costs incurred, as well as competition in their respective marketplaces.
Based on its review of total expense ratios and fees charged to other Fidelity clients, the Board concluded that the total expense ratio of each class of the fund was reasonable in light of the services that the fund and its shareholders receive and the other factors considered.
Costs of the Services and Profitability. The Board considered the revenues earned and the expenses incurred by Fidelity in conducting the business of developing, marketing, distributing, managing, administering and servicing the fund and servicing the fund's shareholders. The Board also considered the level of Fidelity's profits in respect of all the Fidelity funds.
On an annual basis, Fidelity presents to the Board information about the profitability of its relationship with the fund. Fidelity calculates profitability information for each fund, as well as aggregate profitability information for groups of Fidelity funds and all Fidelity funds, using a series of detailed revenue and cost allocation methodologies which originate with the books and records of Fidelity on which Fidelity's audited financial statements are based. The Audit Committee of the Board reviews any significant changes from the prior year's methodologies.
Annual Report
Board Approval of Investment Advisory Contracts and Management Fees - continued
PricewaterhouseCoopers LLP (PwC), independent registered public accounting firm and auditor to Fidelity and certain Fidelity funds, has been engaged annually by the Board as part of the Board's assessment of Fidelity's profitability analysis. PwC's engagement includes the review and assessment of the methodologies used by Fidelity in determining the revenues and expenses attributable to Fidelity's mutual fund business, and completion of agreed-upon procedures in respect of the mathematical accuracy of fund profitability and its conformity to established allocation methodologies. After considering PwC's reports issued under the engagement and information provided by Fidelity, the Board concluded that while other allocation methods may also be reasonable, Fidelity's profitability methodologies are reasonable in all material respects.
The Board also reviewed Fidelity's non-fund businesses and fall-out benefits related to the mutual fund business as well as cases where Fidelity's affiliates may benefit from or be related to the fund's business.
The Board considered the costs of the services provided by and the profits realized by Fidelity in connection with the operation of the fund and was satisfied that the profitability was not excessive.
Economies of Scale. The Board considered whether there have been economies of scale in respect of the management of the Fidelity funds, whether the Fidelity funds (including the fund) have appropriately benefited from any such economies of scale, and whether there is potential for realization of any further economies of scale. The Board considered the extent to which the fund will benefit from economies of scale as assets grow through increased services to the fund, through waivers or reimbursements, or through fee or expense ratio reductions. The Board also noted that in 2013, it and the boards of other Fidelity funds created an ad hoc committee (the Economies of Scale Committee) to analyze whether Fidelity attains economies of scale in respect of the management and servicing of the Fidelity funds, whether the Fidelity funds have appropriately benefited from such economies of scale, and whether there is potential for realization of any further economies of scale.
The Board recognized that the fund's management contract incorporates a "group fee" structure, which provides for lower group fee rates as total group assets increase, and for higher group fee rates as total group assets decrease (with "group assets" defined to include fund assets under FMR's management plus sector fund assets previously under FMR's management and currently managed by Fidelity SelectCo, LLC). FMR calculates the group fee rates based on a tiered asset "breakpoint" schedule that varies based on asset class. The Board considered that the group fee is designed to deliver the benefits of economies of scale to fund shareholders when total Fidelity fund assets increase, even if assets of any particular fund are unchanged or have declined, because some portion of Fidelity's costs are attributable to services provided to all Fidelity funds, and all funds benefit if those costs can be allocated among more assets. The Board concluded that, given the group fee structure, fund shareholders will benefit from lower management fees as group assets increase at the fund complex level, regardless of whether Fidelity achieves any such economies of scale.
The Board concluded, taking into account the analysis of the Economies of Scale Committee, that economies of scale, if any, are being appropriately shared between fund shareholders and Fidelity.
Additional Information Requested by the Board. In order to develop fully the factual basis for consideration of the Fidelity funds' Advisory Contracts, the Board requested and received additional information on certain topics, including: (i) fund performance trends and Fidelity's long-term strategies for certain funds; (ii) the various share classes employed by Fidelity and the attributes of each class, together with similar information on the distribution and servicing payments made by Fidelity or the funds to third-party participants in the distribution channels; (iii) fund profitability, and fund performance in relation to fund profitability; (iv) the methodology with respect to evaluating competitive fund data and peer group classifications and fee comparisons; (v) annual fund profitability margins, with particular focus on certain funds with negative margins; (vi) the realization of fall-out benefits in certain Fidelity business units; (vii) economies of scale and the way in which they are shared with fund shareholders; (viii) Fidelity's group fee structures, including the group fee schedule of breakpoints; (ix) the impact of cost containment measures on the funds; and (x) the transfer agent fee structure.
Based on its evaluation of all of the conclusions noted above, and after considering all factors it believed relevant, the Board concluded that the advisory fee structures are fair and reasonable, and that the fund's Advisory Contracts should be renewed.
Annual Report
Investment Adviser
Fidelity Management & Research Company
Boston, MA
Investment Sub-Advisers
FMR Co., Inc.
FMR Investment Management (U.K.) Limited
FIL Investments (Japan) Limited
FIL Investment Advisors
FIL Investment Advisors
(UK) Limited
Fidelity Management & Research
(Hong Kong) Limited
Fidelity Management & Research
(Japan) Limited
General Distributor
Fidelity Distributors Corporation
Smithfield, RI
Transfer and Service Agents
Fidelity Investments Institutional
Operations Company, Inc.
Boston, MA
Fidelity Service Company, Inc.
Boston, MA
Custodians
JPMorgan Chase Bank
New York, NY
Fidelity's International Equity Funds
Fidelity Canada Fund
Fidelity China Region Fund
Fidelity Diversified International Fund
Fidelity Emerging Asia Fund
Fidelity Emerging Europe, Middle East, Africa (EMEA) Fund
Fidelity Emerging Markets Discovery Fund
Fidelity Emerging Markets Fund
Fidelity Europe Fund
Fidelity Global Balanced Fund
Fidelity Global Commodity Stock Fund
Fidelity Global Equity Income Fund
Fidelity Global Strategies Fund
Fidelity International Capital Appreciation Fund
Fidelity International Discovery Fund
Fidelity International Growth Fund
Fidelity International Small Cap Fund
Fidelity International Small Cap Opportunities Fund
Fidelity International Value Fund
Fidelity Japan Fund
Fidelity Japan Smaller Companies Fund
Fidelity Latin America Fund
Fidelity Nordic Fund
Fidelity Overseas Fund
Fidelity Pacific Basin Fund
Fidelity Total Emerging Markets Fund
Fidelity Total International Equity Fund
Fidelity Worldwide Fund
Corporate Headquarters
245 Summer St.,
Boston, MA 02210
www.fidelity.com
(Fidelity Investment logo)(registered trademark)
Corporate Headquarters
245 Summer St., Boston, MA 02210
www.fidelity.com
EMF-K-UANN-1215
1.863014.107
Item 2. Code of Ethics
As of the end of the period, October 31, 2015, Fidelity Investment Trust (the trust) has adopted a code of ethics, as defined in Item 2 of Form N-CSR, that applies to its President and Treasurer and its Chief Financial Officer. A copy of the code of ethics is filed as an exhibit to this Form N-CSR.
Item 3. Audit Committee Financial Expert
The Board of Trustees of the trust has determined that Joseph Mauriello is an audit committee financial expert, as defined in Item 3 of Form N-CSR. Mr. Mauriello is independent for purposes of Item 3 of Form N-CSR.
Item 4. Principal Accountant Fees and Services
Fees and Services
The following table presents fees billed by PricewaterhouseCoopers LLP ("PwC") in each of the last two fiscal years for services rendered to Fidelity Canada Fund, Fidelity China Region Fund, Fidelity Emerging Asia Fund, Fidelity Emerging Markets Fund, Fidelity Europe Fund, Fidelity Japan Fund, Fidelity Japan Smaller Companies Fund, Fidelity Latin America Fund, Fidelity Nordic Fund and Fidelity Pacific Basin Fund (the "Funds"):
Services Billed by PwC
October 31, 2015 FeesA
| Audit Fees | Audit-Related Fees | Tax Fees | All Other Fees |
Fidelity Canada Fund | $65,000 | $- | $5,200 | $2,400 |
Fidelity China Region Fund | $63,000 | $- | $5,200 | $2,300 |
Fidelity Emerging Asia Fund | $65,000 | $- | $5,200 | $2,100 |
Fidelity Emerging Markets Fund | $81,000 | $- | $5,900 | $2,900 |
Fidelity Europe Fund | $70,000 | $- | $15,400 | $2,200 |
Fidelity Japan Fund | $64,000 | $- | $7,600 | $1,900 |
Fidelity Japan Smaller Companies Fund | $54,000 | $- | $5,200 | $1,900 |
Fidelity Latin America Fund | $64,000 | $- | $5,200 | $2,000 |
Fidelity Nordic Fund | $54,000 | $- | $37,600 | $1,900 |
Fidelity Pacific Basin Fund | $65,000 | $- | $5,400 | $2,000 |
October 31, 2014 FeesA
| Audit Fees | Audit-Related Fees | Tax Fees | All Other Fees |
Fidelity Canada Fund | $63,000 | $- | $5,300 | $2,500 |
Fidelity China Region Fund | $61,000 | $- | $5,300 | $2,200 |
Fidelity Emerging Asia Fund | $62,000 | $- | $5,300 | $2,000 |
Fidelity Emerging Markets Fund | $78,000 | $- | $5,500 | $2,600 |
Fidelity Europe Fund | $64,000 | $- | $6,400 | $2,100 |
Fidelity Japan Fund | $62,000 | $- | $5,300 | $1,800 |
Fidelity Japan Smaller Companies Fund | $52,000 | $- | $5,300 | $1,800 |
Fidelity Latin America Fund | $63,000 | $- | $5,300 | $2,100 |
Fidelity Nordic Fund | $51,000 | $- | $10,300 | $1,800 |
Fidelity Pacific Basin Fund | $62,000 | $- | $5,500 | $1,900 |
A Amounts may reflect rounding.
The following table presents fees billed by PwC that were required to be approved by the Audit Committee for services that relate directly to the operations and financial reporting of the Funds and that are rendered on behalf of Fidelity Management & Research Company ("FMR") and entities controlling, controlled by, or under common control with FMR (not including any sub-adviser whose role is primarily portfolio management and is subcontracted with or overseen by another investment adviser) that provide ongoing services to the Funds ("Fund Service Providers"):
Services Billed by PwC
| October 31, 2015A | October 31, 2014A |
Audit-Related Fees | $3,465,000 | $4,430,000 |
Tax Fees | $- | $- |
All Other Fees | $- | $- |
A Amounts may reflect rounding.
"Audit-Related Fees" represent fees billed for assurance and related services that are reasonably related to the performance of the fund audit or the review of the fund's financial statements and that are not reported under Audit Fees.
"Tax Fees" represent fees billed for tax compliance, tax advice or tax planning that relate directly to the operations and financial reporting of the fund.
"All Other Fees" represent fees billed for services provided to the fund or Fund Service Provider, a significant portion of which are assurance related, that relate directly to the operations and financial reporting of the fund, excluding those services that are reported under Audit Fees, Audit-Related Fees or Tax Fees.
Assurance services must be performed by an independent public accountant.
* * *
The aggregate non-audit fees billed by PwC for services rendered to the Funds, FMR (not including any sub-adviser whose role is primarily portfolio management and is subcontracted with or overseen by another investment adviser), and any Fund Service Provider for each of the last two fiscal years of the Funds are as follows:
Billed By | October 31, 2015 A | October 31, 2014 A |
PwC | $4,885,000 | $5,720,000 |
A Amounts may reflect rounding.
The trust's Audit Committee has considered non-audit services that were not pre-approved that were provided by PwC to Fund Service Providers to be compatible with maintaining the independence of PwC in its audit of the Funds, taking into account representations from PwC, in accordance with Public Company Accounting Oversight Board rules, regarding its independence from the Funds and its related entities and FMR's review of the appropriateness and permissibility under applicable law of such non-audit services prior to their provision to the Fund Service Providers.
Audit Committee Pre-Approval Policies and Procedures
The trust's Audit Committee must pre-approve all audit and non-audit services provided by a fund's independent registered public accounting firm relating to the operations or financial reporting of the fund. Prior to the commencement of any audit or non-audit services to a fund, the Audit Committee reviews the services to determine whether they are appropriate and permissible under applicable law.
The Audit Committee has adopted policies and procedures to, among other purposes, provide a framework for the Committee's consideration of non-audit services by the audit firms that audit the Fidelity funds. The policies and procedures require that any non-audit service provided by a fund audit firm to a Fidelity fund and any non-audit service provided by a fund auditor to a Fund Service Provider that relates directly to the operations and financial reporting of a Fidelity fund ("Covered Service") are subject to approval by the Audit Committee before such service is provided.
All Covered Services must be approved in advance of provision of the service either: (i) by formal resolution of the Audit Committee, or (ii) by oral or written approval of the service by the Chair of the Audit Committee (or if the Chair is unavailable, such other member of the Audit Committee as may be designated by the Chair to act in the Chair's absence). The approval contemplated by (ii) above is permitted where the Treasurer determines that action on such an engagement is necessary before the next meeting of the Audit Committee.
Non-audit services provided by a fund audit firm to a Fund Service Provider that do not relate directly to the operations and financial reporting of a Fidelity fund are reported to the Audit Committee on a periodic basis.
Non-Audit Services Approved Pursuant to Rule 2-01(c)(7)(i)(C) and (ii) of Regulation S-X ("De Minimis Exception")
There were no non-audit services approved or required to be approved by the Audit Committee pursuant to the De Minimis Exception during the Funds' last two fiscal years relating to services provided to (i) the Funds or (ii) any Fund Service Provider that relate directly to the operations and financial reporting of the Funds.
Item 5. Audit Committee of Listed Registrants
Not applicable.
Item 6. Investments
(a) Not applicable.
(b) Not applicable
Item 7. Disclosure of Proxy Voting Policies and Procedures for Closed-End Management Investment Companies
Not applicable.
Item 8. Portfolio Managers of Closed-End Management Investment Companies
Not applicable.
Item 9. Purchase of Equity Securities by Closed-End Management Investment Company and Affiliated Purchasers
Not applicable.
Item 10. Submission of Matters to a Vote of Security Holders
There were no material changes to the procedures by which shareholders may recommend nominees to the trust's Board of Trustees.
Item 11. Controls and Procedures
(a)(i) The President and Treasurer and the Chief Financial Officer have concluded that the trust's disclosure controls and procedures (as defined in Rule 30a-3(c) under the Investment Company Act) provide reasonable assurances that material information relating to the trust is made known to them by the appropriate persons, based on their evaluation of these controls and procedures as of a date within 90 days of the filing date of this report.
(a)(ii) There was no change in the trust's internal control over financial reporting (as defined in Rule 30a-3(d) under the Investment Company Act) that occurred during the second fiscal quarter of the period covered by this report that has materially affected, or is reasonably likely to materially affect, the trust's internal control over financial reporting.
Item 12. Exhibits
(a) | (1) | Code of Ethics pursuant to Item 2 of Form N-CSR is filed and attached hereto as EX-99.CODE ETH. |
(a) | (2) | Certification pursuant to Rule 30a-2(a) under the Investment Company Act of 1940 (17 CFR 270.30a-2(a)) is filed and attached hereto as Exhibit 99.CERT. |
(a) | (3) | Not applicable. |
(b) | | Certification pursuant to Rule 30a-2(b) under the Investment Company Act of 1940 (17 CFR 270.30a-2(b)) is furnished and attached hereto as Exhibit 99.906CERT. |
SIGNATURES
Pursuant to the requirements of the Securities Exchange Act of 1934 and the Investment Company Act of 1940, the registrant has duly caused this report to be signed on its behalf by the undersigned, thereunto duly authorized.
Fidelity Investment Trust
By: | /s/Kenneth B. Robins |
| Kenneth B. Robins |
| President and Treasurer |
| |
Date: | December 28, 2015 |
Pursuant to the requirements of the Securities Exchange Act of 1934 and the Investment Company Act of 1940, this report has been signed below by the following persons on behalf of the registrant and in the capacities and on the dates indicated.
By: | /s/Kenneth B. Robins |
| Kenneth B. Robins |
| President and Treasurer |
| |
Date: | December 28, 2015 |
By: | /s/Howard J. Galligan III |
| Howard J. Galligan III |
| Chief Financial Officer |
| |
Date: | December 28, 2015 |